Williams Lake & Area Community Wildfire Protection Plan
101
0
-
Upload
khangminh22 -
Category
Documents
-
view
2 -
download
0
Transcript of Williams Lake & Area Community Wildfire Protection Plan

0

Williams Lake & Area Community Wildfire Protection Plan – October 21, 2019
1
Acknowledgments
This plan was prepared by Ken Day, RPF, KDay Forestry Ltd., and Mike Simpson, RPF, Fraser Basin Council. Steve Capling, RPF, DWB Consulting Services Ltd. provided technical expertise, and Lisa McCargar, RPF did the maps and analysis. Erin Robinson, Regional Manager, Fraser Basin Council provided overall direction and coordination.
The authors of this report would like to thank and acknowledge the following people for their assistance and participation in preparing the Williams Lake and Area Community Wildfire Protection Plan.
City of Williams Lake Mayor and Council
Rob Warnock, Deputy Fire Chief, and Erick Peterson, Fire Chief, Williams Lake Fire Department
Bev Atkins and Rory Colwell, Fuel Management Specialists BC Wildfire Service
John MacLean, Chief Administrative Officer, Cariboo Regional District
Stephanie Masun, Manager of Protective Services, Cariboo Regional District
Electoral Area Directors Sorley, Delainey and Forseth, Cariboo Regional District
Volunteer Fire Departments (Wildwood, 150 Mile, Big Lake, Miocene, Chimney-Felker Lake, Horsefly)
The Cariboo Chilcotin Beetle Action Coalition
Union of BC Municipalities Strategic Wildfire Initiative’s Program
Harold Stolar, District Manager and staff at MFLNRORD, Cariboo-Chilcotin District
The BC Wildfire Service Staff
SWPI Staff and Committee
List of Acronyms and Terminology, Names Used
AOI – Area of interest
BCWS – British Columbia Wildfire Service
CFDRS - Canadian Forest Fire Danger Rating System
CRI Program – Community Resiliency Investment Program
CWPP – Community Wildfire Protection Plan
EOC - Emergency Operations Centre
FBC – Fraser Basin Council
FBP – Fire Behaviour Prediction

Williams Lake & Area Community Wildfire Protection Plan – October 21, 2019
2
FESBC - Forest Enhancement Society of British Columbia
FFT – Forests for Tomorrow
FRPA –Forest and Range Practices Act and its regulations
FTU – fuel treatment unit
GIS - Geographic Information System
IDF – Interior Douglas-fir Biogeoclimatic Zone
IFB – interface fuel break
IFT – interface fuel treatment
MFLNRORD – Ministry of Forests, Lands, Natural Resource Operations and Rural Development
NDT - Natural Disturbance Type
OGMA - Old Growth Management Areas
PFB – primary fuel break
PSTA - Provincial Strategic Threat Analysis
SBPS - Sub-Boreal Pine Spruce Biogeoclimatic Zone
SBS – Sub-Boreal Spruce Biogeoclimatic Zone
SUP – special use permit
SWPI – Strategic Wildfire Prevention Initiative
T’exelc – Williams Lake Indian Band
UWR – Ungulate Winter Range
VAR – Values at risk
VFD – Volunteer fire department
WHA – Wildlife habitat area
WLIFP – Williams Lake and Area Interface Fire Plan (completed 2005)
WUI - Wildland Urban Interface
Xat’sull – Soda Creek Indian Band

Williams Lake & Area Community Wildfire Protection Plan – October 21, 2019
3
Executive Summary Summary of CWPP Recommendations
Table 1: Summary of CWPP Recommendations
Section No. Recommendation Responsibility/
Funding Source
Section 4: Wildfire Threat
1 Increase the pace of grassland restoration treatments in the Area of Interest.
Cariboo-Chilcotin Ecosystem Restoration Steering Committee, which includes Cariboo Fire Centre
2 Document the location of pre-commercial thinning treatments that have been accomplished in the past, and increase the area treated annually within the AOI, particularly when coupled with surface fuel reduction.
Cariboo-Chilcotin Resource District/FFT
3 Fuels Typing and fire behaviour estimation should extend to privately owned lands, as they present a significant part of the fire risk in the Wildland Urban Interface and represent about 1/3 of the land in the AOI.
MFLNRORD Inventory Branch and/or BCWS
4 Private land owners should recognize that their lands present a threat of forest fires. Landowners should consider undertaking works to reduce the risk to the community associated with that threat through the use of FireSmart initiatives and actions.
Private landowners
5 Fuel treatments should aim to achieve Head Fire Intensity less than 2000 kW/m within 100m of structures, and less than 4000 kW/m between 100m to 300m from structures through surface fuel reduction.
Implementing professionals/ FESBC
6 Harmonize strategies for fuel breaks with salvage logging and regeneration strategies.
Cariboo Region, BCTS & Licensees
7 Fuel types within the fires of 2017 have been substantially altered by fire and salvage logging continues. Fuel typing within these complex disturbances is beyond the capacity and scope of this project, but is important to fire management going forward. Fuel typing within the AOI (and the Cariboo-Chilcotin more generally) is required.
BCWS
8 This plan assigns a higher risk (and priority for treatment) to areas within 2 km of more than 25 structures/km2.
Implementers
9 This plan assigns a higher risk to property and safety (and priority for treatments) for fuels located to the NE, N, NW, W, and SW (i.e. upwind) of values based on BCWS data.
Implementers

Williams Lake & Area Community Wildfire Protection Plan – October 21, 2019
4
Section No. Recommendation Responsibility/
Funding Source
Section 5: Risk Management and Mitigation Factors
10 Cariboo Fire Centre should create map coverage of all previously treated fuel breaks, and annually update that coverage to serve in tactical planning for fire-fighting. This map coverage should be transmitted to the local fire halls through the City of Williams Lake and the Cariboo Regional District.
Cariboo Fire Centre / UBCM
11 Fuel treatments should result in sufficient change in stand structure such that the treatments are apparent from the ground and from the air.
Implementers and prescribing foresters
12 Completed fuel treatments must be reported to RESULTS, and should be known to Licensees and Government for the purpose of Cutting Permit development and approvals. Areas that have been treated previously must be entered into RESULTS immediately by the District Manager.
Implementers, MFLNRORD
13 Fuel breaks and fuel treatments proposed under this plan should be known to Licensees and Government for the purpose of Cutting Permit development and approvals. District Manager should ensure that proposed fuel treatments are available on the Land and Resource Data Warehouse or otherwise made known to harvest planners.
MFLNRORD, forest licensees and BCTS
14 Point Values should be treated to FireSmart standards (i.e. Zone 1) at the time of installation, and maintained in a FireSmart condition by the owner/utility responsible for their upkeep.
Utility companies
15 Linear Features should be treated to FireSmart standards (i.e. Zone 1) at the time of installation. Where linear features are designated as fuel breaks, their maintenance schedule should ensure that they function appropriately as fuel breaks and maintained in a FireSmart condition by the owner/utility responsible for their upkeep.
Utility companies / FESBC
16 Fuel management specialists, project proponents and project funders need to agree on a common set of objectives. District Manager Cariboo-Chilcotin RD should convene a working group to debate and resolve the obvious tension that exists between treatment cost ($/ha), target fuel loading and amount of area treated. Treatment of fine fuels requires intensive hand-work to pick and pile fuels, and intensive fuel treatment implies less area treated within limited budgets.
District Manager & Fire Centre Manager
17 It may be that fuel treatment objectives cannot be achieved in a single entry, and proponents should be encouraged to achieve objectives incrementally, particularly where prescribed fire can reduce treatment costs and improve outcomes.
Fire Centre Manager
Williams Lake & Area Community Wildfire Protection Plan – October 21, 2019
5
Section No. Recommendation Responsibility/
Funding Source
18 Fuel hazard assessment and abatement guidance (Province of BC, 2012) sets unrealistic targets for surface fuel loading and must be reviewed to provide effective guidance. In High and Extreme Risk Class (which dominate the AOI) the guidance from Appendix 1 suggests an un-achievable level of fuel abatement that still fails to satisfy the risk rating. Regional Director Resource Management (Cariboo Region) should send this issue up for resolution.
Cariboo Region Director
19 Operating licensees, FLNRORD and BCWS should delegate the Silviculture Subcommittee of the TSA Committee to develop model stocking standards for fire management, including for intermediate cutting and for clearcutting, which should be amended into Forest Stewardship Plans and Woodlot Plans within the Area of Interest.
District Manager
20 Experience in commercial thinning and completing fuel reduction is limited, and technical training and mentoring will be important components of increasing activity rates and reducing costs. Training and extension should be an annual activity supported by external funding.
UBC Forestry / FESBC
21 Fuel reduction costs imposed by this plan significantly increase costs of operations, and should be accomplished with either external funding in collaboration with primary harvesting, or changes to the appraisal and stumpage system. Government should not hold stumpage fixed and increase operating costs. The stumpage appraisal system should reflect changing expectations and increased costs.
FESBC / MFLNRORD
22 Establish a Central Cariboo fuel management secretariat or working group and appoint a responsible individual to undertake the work necessary to implement this plan
City/ CRD Grant in Aid
23 Develop a labour pool of qualified contractors who can perform FireSmart activities for community members. The current United Way program is a good start.
United Way
24 Ensure tipping fees do not apply to FireSmart biomass delivered to the Waste Transfer Stations.
CRD / CRI Program
25 FireSmart property assessments should be made available to communities, neighbourhoods, homeowners and businesses. Develop external funding to support qualified assessors to assess neighbourhoods and visit properties on invitation.
City/ CRD /CRI Program
Section 6: Wildfire Response
26 Maintain or expand mutual aid agreements between fire departments covering the area of interest
City / CRD / T’exelc / Xat’sull / independent volunteer fire departments

Williams Lake & Area Community Wildfire Protection Plan – October 21, 2019
6
Section No. Recommendation Responsibility/
Funding Source
27 Maintain or expand levels of training and equipment for structural and wildfire response
City / CRD / T’exelc / Xat’sull / independent volunteer fire departments

Williams Lake & Area Community Wildfire Protection Plan – October 21, 2019
7
Contents
Acknowledgments ................................................................................................................................................................... 1
List of Acronyms and Terminology, Names Used ...................................................................................................... 1
Executive Summary ................................................................................................................................................................ 3
Summary of CWPP Recommendations ........................................................................................................................... 3
SECTION 1: Introduction .................................................................................................................................................... 12
1.1 Purpose .......................................................................................................................................................................... 12
1.2 CWPP Planning Process .......................................................................................................................................... 12
SECTION 2: Local Area Description ............................................................................................................................... 13
2.1 CWPP Area of Interest ............................................................................................................................................. 13
2.2 Community Description .......................................................................................................................................... 14
2.3 Past Wildfires, Evacuations and Impacts......................................................................................................... 15
2.4 Current Community Engagement ....................................................................................................................... 16
2.5 Linkages to Other Plans and Polices .................................................................................................................. 17
2.5.1 Local Authority Emergency Plan ................................................................................................................ 17
2.5.2 Affiliated CWPPs................................................................................................................................................ 18
2.5.3 Local Government and First Nation Plans and Policies .................................................................... 18
2.5.4 Higher Level Plans and Relevant Legislation ........................................................................................ 18
2.5.5 Ministry or Industry Plans ............................................................................................................................ 20
SECTION 3: Values at Risk ................................................................................................................................................. 21
3.1 Human Life and Safety ............................................................................................................................................ 21
3.2 Critical Infrastructure .............................................................................................................................................. 21
3.2.1 Electrical Power ................................................................................................................................................ 22
3.2.2 Communications, Pipelines, Health Facilities and Municipal Buildings..................................... 22
3.2.3 Water and Sewage ............................................................................................................................................ 22
3.3 High Environmental and Cultural Values ........................................................................................................ 23
3.3.1 Drinking Water Supply Area and Community Watersheds ............................................................. 23
3.3.2 Cultural Values ................................................................................................................................................... 23
3.3.3 High Environmental Values .......................................................................................................................... 23
3.4 Other Resource Values ............................................................................................................................................ 23
3.5 Hazardous Values ...................................................................................................................................................... 24
SECTION 4. Wildfire Threat and Risk ....................................................................................................................... 25
4.1 Fire Regime, Fire Danger Days and Climate Change ............................................................................ 25
4.1.1 Fire Regime (Map 3) ................................................................................................................................ 25

Williams Lake & Area Community Wildfire Protection Plan – October 21, 2019
8
4.1.2 Fire Weather Rating ................................................................................................................................ 28
4.1.3 Climate Change .......................................................................................................................................... 28
4.2 Provincial Strategic Threat Analysis (PSTA) .......................................................................................... 30
4.2.1 PSTA Wildfire Threat Rating (Map 4A) ........................................................................................... 31
4.2.2 Spotting Impact (Map 4B) ..................................................................................................................... 31
4.2.3 Head Fire Intensity (Map 4C) .............................................................................................................. 32
4.2.4 Fire Density (Map 4D) ............................................................................................................................ 33
4.3 Fire History (Map 5) ......................................................................................................................................... 34
4.4 Local Wildfire Risk Assessment ................................................................................................................... 34
4.4.1 Fuel Type Verification............................................................................................................................. 35
4.4.2 Proximity of Fuel to the Community ................................................................................................ 36
4.4.3 Fire Spread Patterns (i.e. ISI Roses) .................................................................................................. 37
4.4.4 Topography ................................................................................................................................................. 38
4.4.5 Local Wildfire Risk Classification (Map 7B) .................................................................................. 39
4.4.6 Summary of Fire Risk Classes .............................................................................................................. 40
4.5 Summary of Recommendations presented in Section 4 .................................................................... 42
SECTION 5. Risk Management and Mitigation ...................................................................................................... 43
5.1 Fuel Management ............................................................................................................................................... 43
5.1.1 Land Management Context ................................................................................................................... 43
5.1.2 Planning Approach ................................................................................................................................... 46
5.1.3 Fuel Treatments ........................................................................................................................................ 48
Fuel treatments By Zone ........................................................................................................................................... 49
5.1.4 Setting Treatment Priority.................................................................................................................... 54
5.1.5 Treatment Methods ................................................................................................................................. 55
5.1.6 Proposed Fuel Treatments ................................................................................................................... 58
5.2 FireSmart Planning & Activities ................................................................................................................... 66
5.2.1 Lessons We Should / Have Learned ................................................................................................. 66
5.2.2 FireSmart Goals & Objectives .............................................................................................................. 70
5.2.3 Developing Momentum for FireSmart ............................................................................................. 70
5.2.4 Barriers to Participation – Cost, Time, Effort ................................................................................ 72
5.2.5 Identify Priority Areas within the Area of Interest for FireSmart ........................................ 72
5.3 Community Engagement ................................................................................................................................. 76
5.4 Other Prevention and Mitigation Measures ............................................................................................ 77
5.5 Summary of Recommendations in Section 5 .......................................................................................... 78

Williams Lake & Area Community Wildfire Protection Plan – October 21, 2019
9
SECTION 6: Wildfire Response Resources .................................................................................................................. 81
6.1 Local Government and First Nation Firefighting Resources ................................................................... 81
6.1.1 Fire Departments and Equipment ............................................................................................................. 81
6.1.2 Water Availability for Wildfire Suppression ......................................................................................... 82
6.1.3 Access and Evacuation .................................................................................................................................... 82
6.1.4. Training ................................................................................................................................................................ 83
6.2 Structure Protection................................................................................................................................................. 83
6.3 Summary of Recommendations in Section 6. ................................................................................................ 83
References ................................................................................................................................................................................ 84
Appendix One: Maps............................................................................................................................................................. 85
Appendix Two: Wildfire Threat Assessment – FBP Fuel Type Change Rationale ..................................... 99
Appendix Three: Wildfire Threat Assessment Worksheets and Photos...................................................... 100
List of Tables
Table 1: Summary of CWPP Recommendations ......................................................................................................... 3
Table 2: Land area by land status within the Area of Interest of the Williams Lake and Area CWPP. ....................................................................................................................................................................................................... 14
Table 3: Objectives for Wildlife, Environmental and Social Values .................................................................. 19
Table 4: Average observed high and extreme Fire Weather days for the Knife Creek fire weather station is increasing through time (after Daniels et al. (2015)). ........................................................................ 28
Table 5: Head Fire Intensity classes and associated fire behaviour. ................................................................ 33
Table 6: Fuel Type Categories and Crown Fire Spot Potential ........................................................................... 36
Table 7: Proximity to the Interface and structure density guide the assessment of risk, with higher structure density increasing the risk class. ................................................................................................................ 36
Table 8: Slope Percentage and Fire Behaviour Implications ............................................................................... 38
Table 9: Slope Position of Value and Fire Behaviour Implications ................................................................... 39
Table 10: Local Wildfire Risk Classes are assigned based upon the PSTA classes (modified to reflect steep slopes and probable spread direction) compared to proximity to the community and structure density. Mapped polygons (see Map 7B) will support strategic decision-making for treatment placement and priority. ................................................................................................................................. 40
Table 11: Land Ownership and Tenure Rights within the Area of Interest affect responsibilities for treatment planning and implementation .................................................................................................................... 45
Table 12: Treatment priority matrix for the Area of Interest depends upon local risk class developed in section 4.4 (Map 7B) and proximity to values (Zones described in section 5.1.2.1.1). The highest priority for treatment will be within 100 m of values (FireSmart Treatments), and on crown land within 100 m of the property line in areas of extreme and high local wildfire risk class. ....................................................................................................................................................................................................... 55

Williams Lake & Area Community Wildfire Protection Plan – October 21, 2019
10
Map 8 and Table 13 present a list of proposed fuel breaks and fuel treatments encompassing 5,400 ha of crown land or public land within the AOI. Sixty-seven percent of the total proposed area is high priority as determined in Section 5.1.4. The remaining area is in Primary Fuel Breaks more than 2 km away from values. There is a substantial amount of work involved in moving ahead on the proposed treatments. There will need to be a point person and a planning table to undertake the projects necessary. In 2007 to 2012, Fraser Basin Council worked with the Cariboo Regional District, the City of Williams Lake, MFLNRORD, BCWS, forest licensees, BC Timber Sales, VFDs, T’exelc and Xat’sull and others to develop an action plan, secure funding, and manage the contract work to set prescriptions and implement projects. This will be a necessary step in moving into operational treatments. ...................................................................................................................................................... 58
Table 14: Fuel treatment summary table for fuel treatments shown on Map 8. Fuel Treatment Unit (FTU) and Stratum are designated as Interface Fuel Break (IFB), Interface Fuel Treatment (IFT) or Primary Fuel Break (PFB). Values and Constraints include fixed-area tenures upon which planned treatments infringe. .............................................................................................................................................................. 60
Table 15: FireSmart activities and opportunities for Communities. ................................................................ 70
Table 16: Summary of FireSmart priority neighbourhoods and communities. .......................................... 75
Table 17 Fire Departments and Equipment ............................................................................................................... 81
List of Figures
Figure 1: July 7, 2017 at T'exelc (Sugarcane). .......................................................................................................... 34
Figure 2: Classification of Local Wildfire Risk depends upon numerous factors. Stratification of the AOI into Risk Classes considered all of these factors and resulted in a strategic-level planning tool to guide the placement and priority of treatments discussed in Section 5.1.3. ................................................ 35
Figure 3A: Monthly ISI-Roses for Knife station (1996-2015) reveal that May, July and August have the highest values for ISI and wind direction is relatively uniformly distributed between NE through North, West to Southwest. However, Figure 3B demonstrates that significant winds can come from any point on the compass throughout a 24-hour period. ..................................................................................... 37
Figure 4: Five zones based upon distance from structures inform both treatment priority and the nature of treatments. ........................................................................................................................................................... 47
Figure 5: Measured fuel transect showing 21.6 T/ha fine fuel (<7.6 cm diameter). Photo courtesy WL Community Forest L.P. ................................................................................................................................................ 50
Figure 6: Gingrich Stocking Chart modified from Day (1997). Residual stands comprised of high-quality overstory trees should be retained at stocking rates falling between the “Upper” and “Lower limit” in order to keep the growing space occupied by a high canopy of trees (i.e. a “shaded fuel break”. High, Moderate and. Low BDq refer to the stand structures described in by Province of BC (2007) in MDWR General Wildlife Measures for the Shallow and Moderate Snow Pack Zones of the Cariboo-Chilcotin. .................................................................................................................................................................. 52
Figure 7: Measured fuel transect showing 31.9 T/ha fine fuel (<7.6 cm diameter). Photo courtesy WL Community Forest L.P. ................................................................................................................................................ 53
Figure 8: Phases of fuel treatment and timber harvest, WL Community Forest cutblock 106. Falling and sorting was followed by forwarding logs and biomass for delivery to purchasing mills. Timber harvest was combined with debris piling for forwarding, and eventual removal to Atlantic Power. 57
Figure 9: Burning debris piles after commercial thinning, UBC Alex Fraser Research Forest. ............ 58

Williams Lake & Area Community Wildfire Protection Plan – October 21, 2019
11
Figure 10: The Wildland/Urban Interface disaster sequence (copied from Westhaver, 2017) shows that extreme fuel conditions and extreme weather can lead to fire behaviour that rapidly moves from the wildland to the urban fuels and overwhelms firefighting resources. Reducing the number of highly ignitable homes (top right box) can break the disaster sequence. ................................................ 67
Figure 11: Wind-driven embers cause more than 50% and up to 90% of ignitions in homes destroyed by wildfire. Screen capture from YouTube webinar (https://www.youtube.com/watch?v=aiJfU6QqDaw&t=3s) credit Alan Westhaver. .............................. 68

Williams Lake & Area Community Wildfire Protection Plan – October 21, 2019
12
SECTION 1: Introduction
The intent of this section is to introduce the purpose of a CWPP and outline the CWPP planning process.
1.1 Purpose
The purpose of this CWPP is to identify the wildfire risks within the Area of Interest (AOI), to describe the potential threat to human life, property, and critical infrastructure, and recommend treatment options to reduce the wildfire risk. This plan will need to be renewed as the land, resources, and communities’ needs within the AOI change, after approximately 5 years. This plan provides an accurate assessment of the risk areas within the AOI that need fuel treatments as well as an overview of different forest fuel modifications that can be utilised.
The CWPP planning process has provided a detailed framework to inform the implementation of specific actions that will ultimately result in:
• reduced likelihood of a wildfire entering the community
• reduced impacts and losses to property and critical infrastructure
• reduced negative economic and social impacts to the community
• reduced impacts on the local forest values
1.2 CWPP Planning Process
The Williams Lake and Area CWPP was created by Ken Day, RPF and the Fraser Basin Council (FBC), in collaboration with the City of Williams Lake, the Cariboo Regional District, T’exelc (Williams Lake Indian Band) and Xat’sull (Soda Creek Indian Band). Fraser Basin Council staff consulted with Bev Atkins, RFT and Rory Colwell, RFT, Fuel Management Specialists, and Steve Capling, RPF, DWB Consulting Services Ltd. for technical expertise.
In addition to the above, the following other organizations were engaged through the process and invited to attend the initial planning meeting on May 29, 2018 in Williams Lake:
• BC Ministry of Forests, Lands and Natural Resource Operations and Rural Development – including Cariboo-Chilcotin Natural Resource District, Cariboo Region, Recreation Sites and Trails BC, BC Timber Sales and BC Wildfire Service
In addition, the following parties with a vested interest were also invited to attend:
• Tolko
• West Fraser
• Williams Lake Community Forest
• Cariboo Woodlot Association
• UBC Alex Fraser Research Forest
• Ministry of Transportation and Infrastructure
• BC Hydro
• CN Rail
• Atlantic Power

Williams Lake & Area Community Wildfire Protection Plan – October 21, 2019
13
• Pinnacle Pellet
• Shaw
• Enbridge
• Interior Health Authority
• Cariboo Cattlemens’ Association
• Volunteer Fire Departments (Wildwood, 150 Mile House)
• Cariboo Chilcotin Conservation Society
• Williams Lake Field Naturalists
• Williams Lake Mountain Bike Club/Puddle Bike
• Alkali Resource Management
• RCMP
Those present at the May 29, 2018 meeting were asked to fill out a worksheet seeking input on plans, policies, values at risk, FireSmart activities, communication initiatives, firefighting resources, water availability, ingress and egress, and structure protection. Those not present at the meeting were asked by email to provide this information.
All of the above were informed and engaged in the development of the plan, with updates posted to the website www.williamslake.ca as well as personal communications with various parties as needed on an ad hoc basis. All information received was incorporated in the plan.
Fieldwork took place between August 8 and 30, 2018, with the completion of fuel threat assessment worksheet plots in nine polygons. Fuel threat assessments undertaken for a FESBC funded project with the Cariboo Woodlot Association were shared, as were fuel threat assessments from the Williams Lake Community Forest. See section 4.3 Local Wildfire Threat Assessment for further details.
The final plan was presented to Williams Lake City Council Committee of the Whole, with CRD, T’exelc, Xat’sull representatives invited to attend on November 27, 2018, in conjunction with a public open house just before the presentation. The Mayor and Council endorsed the plan by resolution 450/18 at their council meeting on December 4, 2018.
SECTION 2: Local Area Description
This section outlines the relationship of the community to its surrounding environment, and what that means in terms of the wildfire hazard, threat and risk of loss, to help the community plan for mitigation activities and respond to wildfire events.
2.1 CWPP Area of Interest
The AOI is defined by the wildland-urban interface (WUI) and logical community boundaries, and aligns with a Wildfire Risk Management Plan being developed by Esketemc with Alkali Resource Management to the south. It extends from Xat’sull’s Soda Creek reserve in the northwest, follows the Fraser River south to English Road/Pablo Creek, where Highway 20 crosses the Fraser River, to Knife Creek in the southeast, and to Miocene and Rose Lake in the northeast. The AOI is larger than the 2005 Williams Lake and Area Interface Fire Plan. It was drawn with the purpose of including as much of the populated areas, neighborhoods and communities surrounding Williams Lake as

Williams Lake & Area Community Wildfire Protection Plan – October 21, 2019
14
possible to enable future funding opportunities for treatments. The land status of the AOI is described in Table 2. Eighty-two percent of the AOI is within two kilometres of six or more structures per square kilometer.
Table 2: Land area by land status within the Area of Interest of the Williams Lake and Area CWPP.
Jurisdiction Gross Area (ha) Percent of AOI area (%) Comments
City of Williams Lake 3586 2.9 Most is private land
Indian Reserve 3972 3.2
Williams Lake Community Forest
8126 6.6
Woodlot Licence (Schedule B)
11 762 9.5
UBC Research Forest 1740 1.4 Portion of Knife Creek block
Private land 33 602 27.2
Crown land 55 537 45.0 Asserted First Nations territory
Water bodies 5223 4.2
TOTAL 123 548 100.0
Note that there are no provincial parks within the AOI.
MAP 1: Area of Interest (AOI)
CWPP AOI Land ownership and administrative boundaries (private, local government, federal Crown
and provincial Crown land.) Relevant tenures such as range, woodlots, community forests and/or Tree Farm License
areas Firefighting jurisdictions Proposed and completed fuel treatments Other, such as FireSmart areas or Wildfire Hazard Development Permit Areas
2.2 Community Description
The communities included within the AOI are as follows:
Williams Lake – main centre of business, government and health services within the CWPP. Population of 11 418 (2017 BC Stats Population Estimate); and 10 753 (2016 Census).
Within Electoral Area D, Cariboo Regional District, are the unincorporated communities of Wildwood, Fox Mountain and Commodore Heights/Pine Valley/168 Mile Road (acreage

Williams Lake & Area Community Wildfire Protection Plan – October 21, 2019
15
properties, some agricultural). Population of the entire electoral area is 2929 (2016 Census); note that the entire electoral area is not within the AOI.
Within Electoral Area E, Cariboo Regional District, are the unincorporated communities of Esler, Dog Creek Road, Chimney Valley, and Pablo Creek/English Road. Population of the entire electoral area is 4064 (2016 Census); note that the entire electoral area is not within the AOI.
Within Electoral Area F, Cariboo Regional District, are the unincorporated communities of 150 Mile House/Borland Valley (acreage properties), Miocene, Spokin Lake and Rose Lake (all acreage properties or agricultural land). Population of the entire electoral area is 4554 (2016 Census); note that the entire electoral area is not within the AOI.
Within all rural outlying areas are a number of ranches, with a significant amount of agricultural land, much of which is irrigated.
Xat’sull has two reserves – Soda Creek and Deep Creek, total population 140 on reserve. T’exelc has seven reserves – main reserve with residents is Sugarcane, total population 232
on reserve. Total estimated population within the AOI is approximately 20 000 people; between 22 672
and 23 337 which includes the total population within electoral areas D, E and F (some areas of those electoral areas are outside of the AOI).
Firefighting jurisdiction within the AOI is as follows, noting jurisdiction of each fire department. While most populated areas have firefighting coverage, 83 104 ha or 67% of the gross AOI is not within the jurisdiction of a fire department:
Williams Lake Fire Department – within the City of Williams Lake and adjacent areas of the CRD.
Wildwood VFD (CRD) Miocene VFD (CRD) 150 Mile VFD (CRD) Horsefly VFD (independent) Chimney/Felker Lake VFD (independent) Big Lake Volunteer Fire/Rescue (independent) T’exelc does not have a fire department, but has a mutual aid agreement with 150 Mile VFD Xat’sull does not have a fire department, but has a mutual aid agreement with Wildwood
VFD
2.3 Past Wildfires, Evacuations and Impacts
The intent of this sub-section is to describe past significant wildfires and the impact on the community.
The most significant past wildfire season was in 2017. Numerous wildfires burned in the AOI in 2017, with the closest one to communities having started on July 7, 2017 as a result of lightning strikes, and expanded rapidly due to strong winds. The City of Williams Lake evacuation alert was initially issued July 10, and rescinded Aug 15. On July 15, the City of Williams Lake issued an evacuation order to its residents. The evacuation order stayed in place until July 26. The CRD declared a state of local emergency on July 6, 2017, which lasted until Sept 20, 2017, and a variety of evacuation alerts and orders during summer 2017. T’exelc and Xat’sull declared their own evacuations, and worked in cooperation with CRD officials.
Williams Lake & Area Community Wildfire Protection Plan – October 21, 2019
16
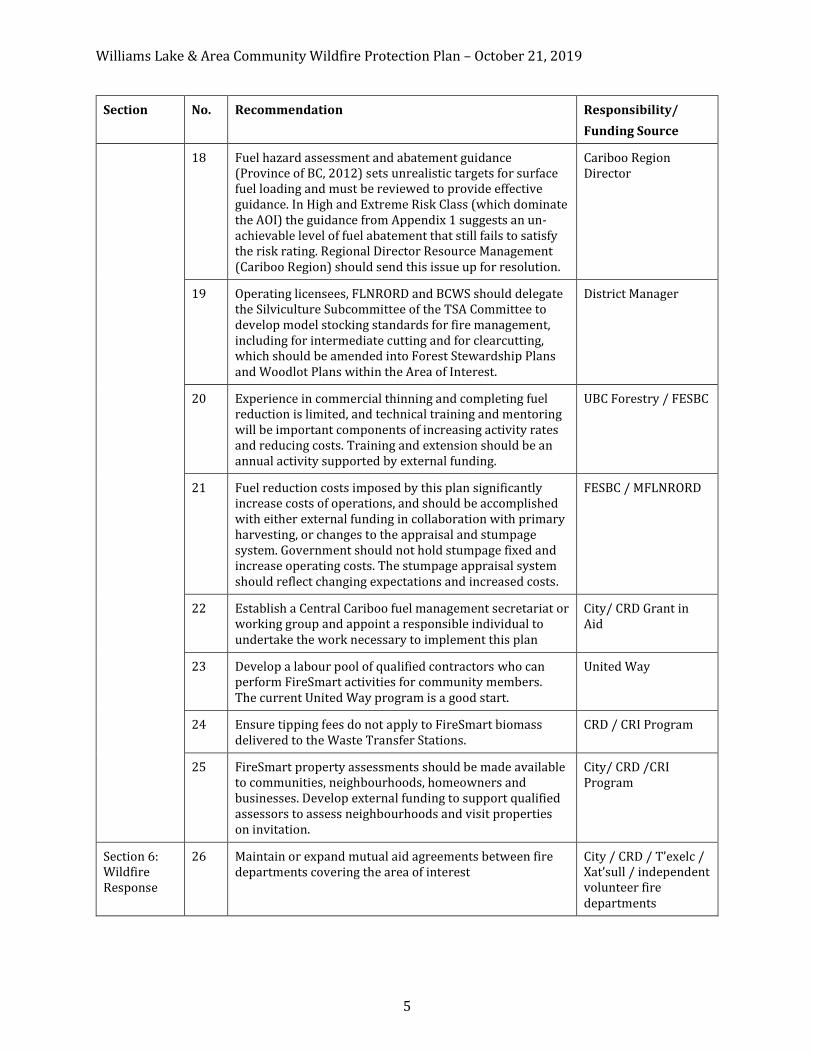
In total, there were dozens of evacuation alerts and orders for various portions of the AOI, lasting for 77 days and impacting an estimated 25 000 people within the AOI and other areas1. Evacuation orders commenced on July 7, 2017 for Miocene, Wildwood, 150 Mile House; on July 8 were expanded in 150 Mile House, and added for Lexington; on July 9 orders were added for Fox Mountain, North Lakeside, and Moore Mountain/Frizzi Road. Evacuation alerts were issued for a large area to the west and south of Williams Lake on July 10, and this was upgraded to an evacuation order on July 15, in addition to an evacuation order issued that day for the eastern portion of the AOI. On July 27, most of the evacuation orders were downgraded to alerts. Within the AOI, 26 homes and 81 other structures were lost for a total of 107 structures lost; these were in 150 Mile House, Soda Creek, Spokin Lake, Miocene, Sugarcane and Wildwood. No structures were lost within the City of Williams Lake. Within the AOI, 17 698 ha was burned, or 14%.
Economic impacts on the communities within the AOI, and the entire Cariboo-Chilcotin region were significant for 2017 and beyond, and included all sectors from the forest industry, to tourism and services. Economic impacts are not fully quantified, but anticipated to be in the tens of millions of dollars (author speculation, no firm numbers from talking to wildfire recovery coordinators and Community Futures). Almost 200 small businesses in the Williams Lake area alone filed claims of $8M in losses; reports are that up to 30% of the labour market moved away. The Cariboo Chilcotin Coast Tourism Association reports that “estimated direct revenue loss to tourism-related businesses in the CCCTA region due to the 2017 wildfires: $55 million; Additional Economic Impact estimates: $101 million in total economic impact (losses) – including direct, indirect, and induced economic impacts; and $63 million in lost GDP”2.
Social impacts on citizens were significant, ranging from trauma, post-traumatic stress disorder, to acute health impacts due to smoke and stress, and likely chronic or long-term impacts that are still being understood. Air quality for 2017 was significantly impacted, with annual average PM2.5 values of 19.9 µg/m3, which is well above the annual objectives of 8 µg/m3 for BC Air Quality Objectives, and 10 µg/m3for Canadian Ambient Air Quality Objectives. In 2017, there were 162 hours with very high AQHI levels (>10) and 609 hours with high AQHI levels (7 to 10); the worst previous year was 2010 with 65 and 239, respectively. (All data from Ralph Adams, unpublished report, received July 24, 2018.)
Both the City of Williams Lake and CRD initiated wildfire recovery processes; CRD led extensive consultations across the region about key learnings. The province initiated a flood and wildfire review led by George Abbott and Chief Maureen Chapman, with a report submitted to government in April 2018.
Before 2017, previous wildfires within the AOI were relatively small, and are noted on Map 3 as occurring in a wide range of years from 1921 to 2013. Evacuations associated with those smaller fires were assumed to be isolated and small-scale. Williams Lake has often served as an evacuation centre for people from the Chilcotin and surrounding areas; significant wildfires in the Chilcotin occurred in 2003, 2009 and 2010.
2.4 Current Community Engagement
Following the wildfires of 2003 predominantly in the Okanagan and Barriere areas, local community leaders initiated the Williams Lake and Area Interface Fire Plan, which was finalized in
1 https://www.cariboord.bc.ca/services/emergency-and-protective-services/EOC/eocarchive
2 http://industry.landwithoutlimits.com/about-ccc/legal-docs/

Williams Lake & Area Community Wildfire Protection Plan – October 21, 2019
17
August 2005. A multiparty secretariat, supported by the Fraser Basin Council, coordinated regular meetings to implement the plan, with the involvement of the City of Williams Lake, CRD, T’exelc, Xat’sull, volunteer fire departments, West Fraser, Tolko, and BC Wildfire Service. Numerous activities were implemented from approximately 2007 to 2012, including: communication and outreach (signage, distribution of paid advertisements and FireSmart brochures in local papers, field tours with local elected officials, door-to-door campaigns by VFDs); fuel management treatments in key areas (approximately 300 ha of area had forest fuel management treatments implemented on various jurisdictions); and tracking of WLIFP activities and two public meetings to seek new ideas and input.
Following the 2017 wildfires, a significant amount of activity has been undertaken on wildfire recovery, but also to engage residents on future wildfire prevention activities. Wildfire recovery staff have been hired in both the City of Williams Lake and CRD. Information is available for residents on the City’s website at http://williamslake.ca/705/Latest-Updates A Wildfire Expo was held May 30, 2018 in Williams Lake to provide additional resources and information.
Williams Lake Fire Department are communicating with the public via social media, radio, the City page in the local newspaper, and the City website. They have also done door-to-door awareness raising of FireSmart in Fox Mountain, South Lakeside, White Road and Lexington subdivisions.
T’exelc are communicating with members about FireSmart at community meetings, notices on local radio, messages on their website, and through their Law Officer via in-person communications.
CRD communicates with residents through the website, social media, community meetings, newspaper advertisements, and their VFDs (150 Mile, Miocene, Wildwood) provide FireSmart education at public events.
The Williams Lake Community Forest (a partnership of the City of Williams Lake and the T’exelc) has been asked to pilot the development of a Primary Fuel Break on the west flank of the City of Williams Lake. Work is underway with financial support from FESBC.
2.5 Linkages to Other Plans and Polices
Following is a discussion of the sources and linkages to other plans and procedures already in place within the AOI that are relevant to the CWPP planning process.
2.5.1 Local Authority Emergency Plan
Under the Emergency Program Act, local governments must prepare local emergency plans that include preparation for, response to, and recovery from, emergencies and disasters. The plan must cover all potential emergencies and disasters that could affect all or any part of the local government, (including wildfire) and may contain essential information for the CWPP.
City of Williams Lake has a local emergency plan. The evacuation map is online.3
CRD emergency plans and procedures for their emergency operations centre are online.4
T’exelc, Xat’sull each have their own emergency plans. Coordination has been discussed.
3 https://www.williamslake.ca/253/Evacuation-Map
4 https://cariboord.ca/services/emergency-and-protective-services/emergency

Williams Lake & Area Community Wildfire Protection Plan – October 21, 2019
18
2.5.2 Affiliated CWPPs
The Cariboo Regional District developed a CWPP in 2006 that covered the entire regional district. It is understood that the CRD’s CWPP will be updated in the near future. Duplication will be avoided as any joint projects within the AOI within CRD jurisdiction will need to be coordinated through that office. The plan can be downloaded from the lower right-hand side of the following website https://www.cariboord.ca/services/emergency-and-protective-services/emergency
Both T’exelc and Xat’sull have CWPPs done in 2010/11.
Alkali Resource Management is leading the development of a landscape level plan with wildfire objectives to the south of this AOI in 2018. This plan and their plan were developed collaboratively, with formal and informal participation.
2.5.3 Local Government and First Nation Plans and Policies
Official Community Plans (OCPs) exist for the following:
City of Williams Lake5 o A Wildfire Interface Development Permit Areas exist for the purpose of protecting
developments from hazardous conditions o Note that development fees are being collected for a road exiting Westridge
subdivision over Williams Creek to downtown 150 Mile House6
o Wildfire hazard assessments are required for development areas o Note that Appendix E Wildfire Probability map, created in 2010, is likely less
accurate than the content of this CWPP Williams Lake Fringe7
o Wildfire hazard assessments are required for development areas o Note that Appendix F Wildfire Probability map, created in 2013 with 2005 data, is
likely less accurate than the content of this CWPP T’exelc has a comprehensive community plan in place T’exelc operates under a Land Code, which enables the T’exelc government to take over all
Indian Act land management provisions (approximately 25%) which were previously managed by Indigenous Services Canada
Xat’sull – it is uncertain whether there is a comprehensive community plan in place
Note that the AOI of this CWPP is larger than the three OCPs; there are geographic gaps within the AOI not covered by an OCP, notably the east, north and western portions.
2.5.4 Higher Level Plans and Relevant Legislation
The higher level plan that encompasses the AOI is the Cariboo-Chilcotin Land Use Plan, approved in 1996. The AOI is within Enhanced Resource Development Zones E-5 Beaver Valley and E-6 Williams Lake.
5 https://www.williamslake.ca/310/Official-Community-Plan-OCP
6 https://www.cariboord.ca/services/planning/ocp-s/150-mile-house-ocp
7 https://www.cariboord.ca/services/planning/ocp-s/williams-lake-fringe-ocp

Williams Lake & Area Community Wildfire Protection Plan – October 21, 2019
19
Multiple objectives for wildlife, environmental and social values exist through a variety of mechanisms, generally through MFLNRORD and legislation under that ministry. This information is summarized in Table 3 below.
Table 3: Objectives for Wildlife, Environmental and Social Values
Objectives/item or constraint
Purpose Establishment mechanism
Forest Fuel Management opportunities
Old growth management areas – 13 321 ha of AOI
Set aside areas of old growth for maintenance of biodiversity, old forest attributes, connectivity
Land Act s.93.4 July 2018 Land Use Order amendment defines different types of forest fuel management treatments. See Section 4, Other Forest Values
Visual quality objectives To maintain scenic areas or visual sensitivity classes
Forest Planning and Practices Regulation, FRPA
May be limited; understory options may be able to proceed. See Section 4, Other Forest Values
Mule deer (ungulate) winter range – 57 277 ha of AOI
Provide suitable winter cover and food sources for maintenance of mule deer populations
Government Actions Regulation General Wildlife Measures, Forest and Range Practices Act
Fuel management is contemplated within the context of harvesting in Mule Deer Winter Range, although General Wildlife Measures affect the treatment opportunities.
Wildlife Habitat Areas (WHA)
Government Actions Regulation, FRPA
May be limited; to be further explored.
Designated mountain bike trails
Authorized recreation trails have legal status and significant public support.
FRPA Sec 56 Activities under this plan will need to consult about and accommodate designated trails; opportunity exists to include bike trails in fuel treatments.
Cultural heritage Numerous known and unknown archaeological sites impact treatment opportunities
Heritage Conservation Act
Land-altering activities cannot be undertaken without an impact assessment.

Williams Lake & Area Community Wildfire Protection Plan – October 21, 2019
20
2.5.5 Ministry or Industry Plans
BC Wildfire Service commissioned a Fuel Management Opportunities study, by BA Blackwell and Associates in 2016. It was considered during the development of this plan. Primary fuel breaks identified in that plan are on Map 8.
A Type 4 Silviculture Strategy8 for the Williams Lake TSA was created in 2013. The objectives of the Type 4 Silviculture Strategy are to mitigate impacts of pests and wildfires on mid-term timber supply and habitat supply. The strategy makes recommendations around silviculture activities in section 3.6 that align with reducing wildfire risk near values, communities and homes that are consistent with the recommendations in this plan. The Type 4 Silviculture strategy also set out a silviculture strategy for the IDF (Day and Williams, 2013) which integrates well with the treatment strategies outlined in Section 5 of this plan.
Cariboo-Chilcotin Region of MFLNRORD has a forest health strategy, and the District office has forest health plans as well. Cariboo-Chilcotin Resource District has recently appointed senior forester Kerri Howse, RPF, as a landscape planner, which will combine responsibilities for forest resilience to wildfires and pests. The region’s integrated investment plan could also inform activities under the CWPP. BC Wildfire Service, Cariboo Fire Centre has a Regional Fire Management Plan.
Each forest licensee operating within the AOI (West Fraser, Tolko, Williams Lake Community Forest), and BC Timber Sales, has a forest stewardship plan. Each woodlot licensee in the area, of which there are 14 partially or wholly in the AOI, has a woodlot license plan. The Alex Fraser Research Forest is in part within the AOI, and it has a Management and Working Plan. While each of these are only obligated to abate forest fire hazards that accumulate through their harvesting activities, additional forest fuel management activities may be undertaken at their own discretion. The Cariboo Woodlot Association received funding in 2017/18 to complete wildfire threat assessments and develop prescriptions for PSTA classes 7 to 10 within the WUI where values were identified; this was done in conjunction with this plan, and data from that project within the AOI was shared. The Williams Lake Community Forest has applied for funding to carry out treatments under SWPI within the AOI, and data gathered in support of that application has been shared.
8 https://www2.gov.bc.ca/assets/gov/farming-natural-resources-and-industry/forestry/silviculture/silviculture-strategies/wlt4_silviculture_strategy_20131004.pdf

Williams Lake & Area Community Wildfire Protection Plan – October 21, 2019
21
SECTION 3: Values at Risk
The intent of this section is to introduce the extent to which wildfire has the potential to impact values within a community.
MAP 2: Values at Risk
CWPP boundary with updated WUI Updated structure density and Wildland Urban Interface (WUI) Values at risk (critical infrastructure, as outlined in 3.2 below) High environmental and cultural values (as outlined in 3.3) Hazardous values at risk (as outlined in 3.5) Optional: other resource values
3.1 Human Life and Safety
The intent of this sub-section is to clearly identify and understand where people and structures are located within the AOI in order to effectively determine the wildfire risk and identify mitigation activities.
As noted in section 2.2, there are approximately 20 000 people living within the AOI as follows:
City of Williams Lake approximately 11 000 people CRD Electoral Area D approximately 2500 people, with concentrations in Wildwood, Fox
Mountain, Commodore Heights/Pine Valley/168 Mile Road CRD Electoral Area E approximately 3000 people, with concentrations in Esler, Dog Creek
Road, Chimney Valley, and Pablo Creek/English Road. CRD Electoral Area F approximately 3500 people, with concentrations in 150 Mile
House/Borland Valley, Miocene, Spokin Lake and Rose Lake Xat’sull total population 140 on reserve T’exelc total population 232 on reserve
During fire season, campgrounds in the AOI that may have seasonal residents and tourists include:
Wildwood campsite and trailer park (Wildwood) Williams Lake Stampede grounds campground Chief Will-Yum campsite (T’exelc Sugarcane Reserve #1) Whispering Willows campground (Deep Creek) Recreation Sites and Trails BC campgrounds at Dugan Lake (NE of 150 Mile House), Dewar
Lake (Miocene) Xat’sull Heritage Village.
3.2 Critical Infrastructure
The intent of this sub-section is to clearly identify and understand where critical infrastructure is located within the WUI in order to effectively determine the wildfire risk and identify mitigation activities.

Williams Lake & Area Community Wildfire Protection Plan – October 21, 2019
22
3.2.1 Electrical Power
The major north-south transmission line in the province is within the western portion of the AOI, with three 500kV transmission lines and one 230kV transmission line. Another 230kV transmission line runs northwest-southeast in the eastern portion of the AOI. Substations exist within the City of Williams Lake. To the best of the authors’ knowledge, the 500kV transmission lines are metal, and the 230kV transmission lines are wood.
3.2.2 Communications, Pipelines, Health Facilities and Municipal Buildings
City of Williams Lake municipal office and City Hall is at 450 Mart Street, Williams Lake.
City of Williams Lake Fire Department is at 230 Hodgson Road, Williams Lake.
Cariboo Regional District office and Emergency Operations Centre is at Suite D, 180 Third Ave. N., Williams Lake.
Xat’sull government offices are located at Deep Creek reserve.
T’exelc government offices are located at Sugarcane reserve and at 301-172 Second Ave. N., Williams Lake.
Cariboo Memorial Hospital, 517 North 6th Ave, Williams Lake
Provincial court house, 540 Borland Street, Williams Lake
CRD VFDs are located at 3038 Pigeon Road, 150 Mile House (150 Mile); 3386 Spokin Lake Road (Miocene); and 4253 Wildwood Road (Wildwood).
Williams Lake Airport, and the BCWS Cariboo Fire Centre are located east off Highway 97, north of the City and south of Wildwood.
Cellular towers in the AOI are located at Sugarcane east of T’exelc IR1, immediately west of the City of Williams Lake on the WL Community Forest, Fox Mountain South of Williams Lake Airport, and Woodlot 593 west of Xatsu’ll Deep Creek Reserve., Repeater towers are at located at Bull Mountain, North of Wildwood, and Potato Mountain north of Miocene. Numerous other radio towers and reflectors are noted in the layer of critical infrastructure.
Community halls within the AOI are the Miocene Hall (CRD) just past Bunting Lake Road, 150 Mile Community Hall at the 150 Mile VFD, and community halls at T’exelc and Xat’sull.
West Coast gas pipeline bisects the AOI approximately north to south.
3.2.3 Water and Sewage
The City of Williams Lake, and CRD unincorporated areas of Russet Bluff (end of South Lakeside Drive) are served by municipal water systems, based on groundwater wells. City of Williams Lake water intake is at Scout Island; wastewater treatment plant is in the River Valley.
T’exelc water system is based on groundwater wells, and they have a community sewer system. Xat’sull did not respond to requests about their water and sewer system.
Most other areas in the AOI have water sourced from individual wells and sewage is treated in septic systems or lagoons.
See section 3.3.1 for areas with surface water sources.

Williams Lake & Area Community Wildfire Protection Plan – October 21, 2019
23
3.3 High Environmental and Cultural Values
The intent of this sub-section is to clearly identify and understand where high environmental and cultural values are located within the WUI in order to effectively determine wildfire risk and identify mitigation activities.
3.3.1 Drinking Water Supply Area and Community Watersheds
The following have their water supply from surface water sources:
The Weetman Community Watershed is the only designated community watershed in the AOI, in the Dog Creek Road neighbourhood within CRD Electoral Area E, south of the City of Williams Lake.
Lexington subdivision is on a surface water system, established through an Improvement District, serving 29 parcels of land
Granberg water utility near Bond Lake (off Hwy 20 in Esler) serves 22 parcels of land South Lakeside is a water user community sourcing surface water for 7 users
3.3.2 Cultural Values
Indigenous cultural heritage resources include archaeological sites, traditional use sites, historic buildings and artifacts, and heritage trails, or any other objects or places of “historical, cultural or archaeological significance to British Columbia, a community or an aboriginal people9".
Archaeological sites in British Columbia that date to 1846 or earlier are protected from alteration of any kind by the Heritage Conservation Act (HCA) (1996). The provisions of the HCA apply to archaeological sites located on both public and private land, known and unknown, and are binding on government. The Archaeology Branch of the Ministry of Forests, Lands and Natural Resource Operations administers the provisions of the HCA and are responsible for making final decisions concerning the management of archaeological resources. Day-to-day planning, research and fieldwork are conducted by professional consulting archaeologists.
Non-archaeological cultural heritage in BC is generally not protected by statute, but the use of and access to these resources is enshrined as a constitutionally-protected Aboriginal right. Locally identified cultural heritage values that may be impacted by wildfire or suppression efforts can be included, if agreed to by the local First Nation.
3.3.3 High Environmental Values
None noted; see other resource values below and land designations in Table 3.
3.4 Other Resource Values
The intent of this sub-section is to describe significant additional resource values (such as timber, water or high-value wildlife habitat, etc.) that are present within the AOI and/or values that may constrain fuel treatment opportunities.
9 Archer, CRM. 2009. Cultural Heritage Resource Identification and Management in Forestry Developments: A Supplement to the FREP Protocol. Ministry of Forest Lands and Natural Resource Operations.

Williams Lake & Area Community Wildfire Protection Plan – October 21, 2019
24
Numerous mountain bike trails are established throughout the AOI; these are established trails under s.57 of FRPA and are an important recreation resource for the local community and for tourism and economic values.
Numerous cattle ranches are within the AOI, both private land and Crown grazing permits and Grazing Leases. Range improvements and natural barriers to cattle movement are numerous within the AOI. During fire season, thousands of cattle could be on the range, and hay crops lost. Improvements such as fences, barns and other infrastructure is at risk.
West Fraser, Tolko and other forest products manufacturers provide employment for hundreds of people in the area, and have significant financial values invested in manufacturing plants, log inventory and finished products.
Area-based forest tenures with individual timber supply values include 14 woodlot licences (entirely or portions of), a portion of UBC’s Alex Fraser Research Forest (Knife Creek block), and the NeSextsine (Flat Rock) block of the Williams Lake Community Forest.
Other tenures that exist within the AOI include but are not limited to guide outfitting licenses, traplines, and various special use permits for a variety of activities.
3.5 Hazardous Values
This sub-section identifies hazardous values that pose a safety hazard to emergency responders.
The following are known sites with hazardous values. Operators of each of these sites or facilities have emergency plans in place:
Railway yards Gas stations and bulk plants Cattle ranches may have large quantities of fuel, oil and fertilizer CRD Wildwood Wood Waste Yard CRD Frost Creek Wood Waste Yard CRD landfill at 150 Mile House Williams Lake Transfer Station, wood waste and composting site Spectra Energy station at 150 Mile House Sawmills within Williams Lake and elsewhere in the AOI
o Tolko Lakeview o Tolko Soda Creek o West Fraser Lumber o West Fraser Plywood o Sigurdson Bros. o Pal Lumber o Chimney Valley Lumber
Timber Framing yards and sawmills o Pioneer Log Homes, Sugarcane, Deep Creek and 153 Mile sites o OT Timber Frames Miocene o Pius Marty east of 150 Mile House o Durfeld Log and Timber, Wildwood
Biomass plants o Atlantic Power Williams Lake o Pinnacle Pellet Williams Lake o Timberland Transport – surge pile at Frizzi Road

Williams Lake & Area Community Wildfire Protection Plan – October 21, 2019
25
SECTION 4. Wildfire Threat and Risk
Fire seasons in 2010, 2017 and 2018 have clearly demonstrated that wildfire threatens communities in the Central Cariboo. In 2010 a fire complex in the Meldrum Creek area threatened to cross the Fraser River, and local governments were preparing evacuation plans for Williams Lake and area. In July 2017, four catastrophic fires started in or entered the Area of Interest, resulting in loss of property, timber, and ecosystem services that citizens depend upon. The tireless efforts of wildland fire fighters and volunteer fire departments minimized the losses, but the impacts of the fires and the resulting evacuations had a severe and lasting effect upon businesses and citizens. In 2018 the relentless smoke and extremely dry conditions were a daily reminder of what happened just one year before, and what British Columbians were suffering in other communities. Two back-to-back record-setting fire seasons in 2017 and 2018 are strong evidence that wildfire presents an ongoing and increasing threat to us, and our communities continue to be at risk.
This section of the CWPP describes the functional basis of wildfire threat assessment (the likelihood of a fire), and develops a local risk analysis based upon the threat and the consequences of a fire in the Area of Interest.
4.1 Fire Regime, Fire Danger Days and Climate Change
4.1.1 Fire Regime (Map 3)
Fire is a natural agent of disturbance on the landscapes of the Central Cariboo, where ecosystems have a generally recognized pattern of fire, driven by the climatic envelope as described by the Biogeoclimatic classification, and by the historic aboriginal use of fire.
The Area of Interest for the Williams Lake and Area CWPP rises from 400 m elevation at the Fraser River in the west to 1000 m at Miocene in the east. The general weather patterns push air masses from west to east, and as the air approaches the Cariboo Mountains precipitation increases. As a result of this general weather pattern there is a complex of ecosystems within the Area of Interest, which are generally described as Biogeoclimatic Ecosystem Classification (BEC). Each of the BEC classes have an associated Natural Disturbance Type.
The Area of Interest is predominantly in the Interior Douglas-fir (IDF) Biogeoclimatic Zone (IDFxm and IDFdk3). As such, the Natural Disturbance Type is defined as NDT4 – frequent stand maintaining fires. A smaller portion of the Area of Interest (Spokin Lake to Mountain House and east) Sub Boreal Spruce zone (SBSdw2, dw1) and Sub-Boreal Pine Spruce zone (SBPSmk) and here the Natural Disturbance Type is NDT3 – frequent stand replacing fires.
Numerous studies in the AOI have shown that fires burned frequently in the IDF. For example, Brookes (in progress) found a mean fire interval of 15 years with a range of 7-32 years between fires on the Knife Creek Block of the Alex Fraser Research Forest. Daniels (2004) showed a mean fire interval ranging between 13 and 22 years depending upon location in the IDFdk3. Daniels (2004) described a mixed-severity fire regime that saw regional fires burning at higher severity at less frequent interval – i.e. periodic high severity fires burned in La Niña periods. Daniels (2004) found that the time since the last fire on all her plots has now exceeded the mean fire interval, and on seven out of nine plots the time since the last fire is now greater than the maximum interval in the historical record.

Williams Lake & Area Community Wildfire Protection Plan – October 21, 2019
26
Daniels (2004) draws on evidence from southwestern US to conclude that long fire-free intervals that allow fuels to accumulate allow high-severity fires to burn. Decreased fire frequency may alter forest composition and structure resulting in higher understory and canopy densities and increased surface fuels.
Douglas-fir bark beetles are currently epidemic in the AOI, and are forecast to increase in 2019 and beyond, in response to the wildfires of 2017. Douglas-fir bark beetle is a secondary beetle, in that it prefers to attack recently killed or weakened trees. It expands to epidemic populations when disturbances allow it to build populations. It will successfully attack and kill live trees that are weakened by drought or other stress agents. Trees killed by bark beetles retain their dead needles for one year and are extremely flammable. As the trees gradually decay and shed branches and boles over a period of years, surface fuels accumulate and fire severity rises.
Spruce budworm is an insect that defoliates Douglas-fir trees. It can kill the tops of large trees and then descend onto small trees in the understory, causing mortality in those layers. This insect is cyclical and responds well to warm summers and abundant understory trees. Populations are rising in the IDFxm outside the AOI, and will likely increase in the AOI over the next year or two. When understory trees die, they can fall and accumulate surface fuel, or they can remain standing as ladder fuels for many years. Spruce budworm may therefore increase fire severity and the likelihood of crown fire.
Mountain pine bark beetles erupted into an epidemic in the mid-1990s which ended in about 2006 in the AOI. While most of the pine stands killed by bark beetles in the AOI have been logged, stands with a minor component of pine, and young stands that were not merchantable, have not yet been cut. The pine is decaying and much of it is now on the ground. Spruce regeneration coming up in these dead pine stands contributes to the fire intensity in these regenerating stands. Fires burning in dead pine burn at high intensity and have severe fire effects. In the AOI, pine distribution was restricted to the IDFdk3, SBSdw and SBPSmk.
Settlement in the AOI started in the mid-1800s following the Cariboo Gold Rush. By 1913 “nearly all the best land has been taken up” (McDougall, 1913). As a result the AOI is approximately 35% private land, and a large portion of that has been cleared for hay production. Most of the hay fields are irrigated, much of it by flood irrigation.
… the findings … indicate that large
increases in biomass at landscape scales was a
common significant contributing factor in fueling the mega-fire
threat. The observation was
particularly pronounced in drier forest types where
long-term fire exclusion, limited fuel
reduction work, and slow rates of
decomposition, have combined to result in steady fuel build-ups. Mega-fire risks were also elevated where vegetative mosaics
have diminished and melded into more continuous high
hazard landscapes.
Jerry Williams, 2013

Williams Lake & Area Community Wildfire Protection Plan – October 21, 2019
27
Day (1998) described the logging history of the local area which started in the settlement days, increased somewhat in the time of the PGE railway construction, and then started into industrial production after World War 2. There are distinct historical stages of logging that have created the different forest conditions we see today.
1940-60 – Bush mills and horse logging left forests mostly intact – the majority of trees cut were mid-sized and good stocking remained in the logged stands
1960-80 – Diameter limit cutting removed all the larger trees unless they were poor quality, and left stands mostly stocked in small trees. Densities of these smaller trees has increased and these stands are now at a very high density and in poor condition.
1965+ -- Clearcut lodgepole pine and retain understory fir, or plant
1980+ – Faller’s selection which sought to leave trees of all sizes with room to grow
1998-2010 – Salvage mountain pine beetle-killed stands
Fire exclusion has resulted in the encroachment of forests onto historical grasslands, and also the ingrowth of Douglas-fir into the understory of open stands. Ecosystem restoration of grassland benchmark areas10 (removing trees to restore a grassland community) is underway in the Cariboo, but many hectares remain to be treated. Pre-Commercial Thinning of stands logged between 1960 and 1980 has been underway to reduce the density of understory trees, but record-keeping of those treatments has been poor. Pre-commercial thinning has a beneficial impact on fire behaviour once accumulated fuels have decayed (10-20 years after treatment).
Recommendation 1. Increase the pace of grassland restoration treatments in the Area of Interest.
Recommendation 2. Document the location of pre-commercial thinning treatments that have been accomplished in the past, and increase the area treated annually within the AOI, particularly when coupled with surface fuel reduction.
10 Grassland Benchmarks are defined in the CCLUP Grassland Strategy as areas that were classified as Open Range in the first forest inventory, circa 1960s.
“Nearly all the best land…has been taken up years ago, the cultivated
portions produce excellent crops. The timber is
distributed in belts along the sides of the main valley and behind those belts lies the burned country, which
is covered with a patchy Black Pine stand from ten to
fifty years old. The persistence of the old stands in positions so
exposed to fire must be due to the former periodical removal of undergrowth
and litter by light burning… Away from those influences, the forest would come into
an extremely flammable condition, and when, at
longer intervals, fire did reach them, the result
would be total destruction.”
E.G. McDougall, 2013

Williams Lake & Area Community Wildfire Protection Plan – October 21, 2019
28
4.1.2 Fire Weather Rating
Wildfire threat is a combination of the fuels, topography, and weather. During the fire season, weather stations throughout the province report data that is compiled to report on Fire Weather Index (FWI) for those weather stations, and we see the daily reports of those values on signs at Fire Halls and along the highways of our province.
Increasing FWI means easier ignition, faster rates of spread, greater fire intensity, and more severe fire effects. Fires that burn during days with greater FWI values are likely to be harder to suppress, burn more aggressively, and grow larger.
Daniels et al. (2015) examined the historical data for the Knife Creek Weather Station, and reported that the average number of days with high or extreme FWI ratings has increased since the 1990s (Table 4). On average, we can expect 31 days each summer when fires will burn aggressively and will be difficult to control given the general fuel conditions we have presently in the Area of Interest. If those fuels are burning within 2 km of values, there is a substantial risk to the values through ember transport and spot fires, and that risk increases as the FWI increases.
Table 4: Average observed high and extreme Fire Weather days for the Knife Creek fire weather station is increasing through time (after Daniels et al. (2015)).
Decades By Weather Station
Average Annual Days Per Fire Season
Extreme High Total Extreme + High
Knife
1990s 2.3 16.3 18.5 2000s 7.3 16.7 24.0 2010s 10.3 24.2 34.6
Williams Lake
1980s 0.4 9.4 9.8 1990s 0.2 9.2 9.4 2000s 3.4 12.4 15.8 2010s 4.6 12.2 16.8
To manage the hazard of fires, FWI is combined with the Build-Up Index (a rating of the amount of fuel available for combustion due to seasonal drying) to create Danger Classes. Danger Classes are used as a legal measure to restrict industrial activity and thereby limit industrial caused ignitions.
4.1.3 Climate Change
Climate change is upon us. Extended droughts, heavy snowpack, and increased lightning all seem to be part of the change we are now experiencing. Table 4 above shows that high and extreme Fire Weather days are increasing through time. Forest ecologists are drawing linkages between climate change and record-setting fire numbers and area burned and extreme fire behaviour. Daniels (2015) reported that in the Williams Lake and 100 Mile Fire Zones, 84% of the area burned between 1950 and 2012 burned in 2009 and 2010.

Williams Lake & Area Community Wildfire Protection Plan – October 21, 2019
29
Using the Plan2Adapt tool11, Pacific Climate Impacts Consortium suggests that for the Cariboo Regional District, comparing with the base period from 1961-1990:
In the current period (2010-2029)
Mean Annual Temperature will increase by 1.0 °C Mean Annual Precipitation will increase by 4% Mean Summer Precipitation will decrease by 3%
In the 2050s (2040-2069 compared to the base period)
Mean Annual Temperature will increase by 1.8 °C Mean Annual Precipitation will increase by 6% Mean Summer Precipitation will decrease by 7%
Daniels et al. (2015) report that near Williams Lake, mean annual temperature is projected to rise from 4.5°C to ~7°C. July and August mean temperatures will increase from about 17 to 20°C, with maximums increasing from 23 to 26.5°C. Although mean annual precipitation is projected to increase from 426 to 466mm per year, precipitation in July is projected to decrease causing greater summer climatic moisture deficits.
Nelson et al. (2011) suggest that fire impacts could double over the next 100 years, based upon modelling in the Kamloops area. In addition to the implied risk to life and property, they found that forests in the landscape would be strongly skewed to stands younger than 60 years of age. They suggest this will cause a significant reduction in timber flows, and threats to species that rely on larger or old trees or stands as habitats. They also point to concerns for visual quality and water quality.
Daniels (2004) points out that climate controls fire in ways that cannot be controlled. She demonstrated a link between decadal climate events (El Niño Southern Oscillation), precipitation and fire in the Cariboo. She suggests we can anticipate more fires in La Niña periods.
Wetter winters, coupled with hotter and dryer summers (described above), suggest more spring vegetation (grass) which cures in the dry weather. Hotter summers with less precipitation suggest we may lose our June rains, and historically years with little rain in June are bad fire years (e.g. 2010, 2017).
If more lightning will occur in the future, as some suggest, then more ignitions will occur, resulting in more fires. Drought and temperature anomalies are contributing to increased insect outbreaks (bark beetles and defoliators) meaning more fuel loading in the future. Hotter and dryer summers and falls will result in longer and more intense fire seasons. Hotter and dryer weather will result in more days of extreme fire danger. As a result, some existing forests have an increased probability of more frequent and intense wildfires that are more difficult to control and more likely to result in increased tree mortality, detrimental impacts to soils and hydrology, and increased threat to the community and interface areas.
Fires will burn under extreme weather conditions, and the extremes of weather are forecast to be more extreme given climate change. We should prepare ourselves for a future where fires cover more area and fuels burn with greater intensity due to increased prevalence of extreme fire
11 Pacific Climate Impacts Consortium http://www.plan2adapt.ca/tools/planners?pr=4&ts=7&toy=14&oldregion=4&oldvar=0&oldres=0&oldexpt=11&oldts=7&oldpr=0&dpoint=&seltab=0&fringe_size=0&view_x=1072200&view_y=1033200&th=0.1&zoom=0

Williams Lake & Area Community Wildfire Protection Plan – October 21, 2019
30
weather. We are used to considering the 90th percentile of fire weather as a standard of fire behaviour. But we are concerned that the 100th percentile frame of reference is moving. This means that as a community we need to adapt the fuels and their arrangement to a new climate reality, as fuel is the only part of fire behaviour we can affect.
MAP(s) 3: Fire Regime, Ecology and Climate Change
CWPP boundary with updated WUI NDT TYPE Forest Health (e.g. MPB) Major harvesting patterns, completed fuel treatments or ecological projects Historical Fire Perimeters Climate Change scenarios relevant to the community (Future BEC zones)
4.2 Provincial Strategic Threat Analysis (PSTA)
The Provincial Strategic Threat12 Analysis (PSTA) is a high level analysis of fuels, topography, probability of ignition, and produces estimates of fire behaviour. It is based upon an inventory of fuel types and fire behaviour prediction that is standard across Canada. The Fuel Type classification system does not completely reflect the range and nature of the fuel types extant in the Area of Interest. However, PSTA is a useful starting point to assess relative wildfire threat. It utilizes provincial fuel type mapping, historical fire occurrence data, topography, and historic weather station data; and interprets this data. The PSTA includes information and maps that describe fuel types, historical fire density, and the potential for embers to land in an area (spotting impact), head fire intensity, and the overall wildfire threat. Note that the PSTA is conducted at the provincial level and has been provided to the planning team by B.C. Wildfire Service (BCWS).
Note that the PSTA analysis does not include privately owned land. Given that 35% of the Area of Interest is privately owned, this significantly reduces the value of PSTA as a planning tool.
Recommendation 3. Fuels Typing and fire behaviour estimation should extend to privately owned lands, as they present a significant part of the fire risk in the Wildland Urban Interface and represent about 1/3 of the land in the AOI.
Recommendation 4. Private land owners should recognize that their lands present a threat of forest fires. Landowners should consider undertaking works to reduce the risk to the community associated with that threat through the use of FireSmart initiatives and actions.
Wildfire threat is directly related to the likelihood of hazardous fuel igniting and fire spreading into the community either directly or through ember transport. The PSTA provides information to help evaluate the three conditions necessary for a wildfire to threaten a community:
1. an ignition occurs (Fire History) 2. the resulting fire generates sufficient intensity (Head Fire Intensity) and spreads rapidly, and 3. the fire spreads into and/or transports embers into the community (Spotting Impact)
12 https://www2.gov.bc.ca/gov/content/safety/wildfire-status/prevention/fire-fuel-management/psta

Williams Lake & Area Community Wildfire Protection Plan – October 21, 2019
31
The PSTA information is supplemented with a local wildfire threat analysis that considers steep slopes upwind of community to support the creation of a Local Wildfire Risk Assessment (see Section 4.4).
Please refer to maps 4A to 4D attached. They show the layers of information used to create the threat assessment as provided by BCWS, which are described below.
MAP(s) 4: Provincial Strategic Threat Analysis
Threat Rating Spotting Impact Head Fire Intensity Historical Fire Density
Fire History is shown on Map 5.
4.2.1 PSTA Wildfire Threat Rating (Map 4A)
PSTA data were provided by BCWS to the planning team. Provided documentation describes the data as follows:
To determine the overall PSTA Threat Rating, fire density, head fire intensity (HFI) and spotting impact were combined using a weighted averaging process. Weights were assigned as 30% fire density, 60% HFI (90th percentile) and 10% spotting impact. These weighted values were added together to produce a final fire threat rating and assigned to 10 classes to produce a detailed map of fire threat rating throughout British Columbia.
The 10 Fire Threat Classes represent increasing levels of overall fire threat (i.e. the higher the number, the higher the threat). PSTA Threat Class 7 is considered to be a threshold and the most severe overall threat classes are Class 7 and higher. Areas of the province that fall into these higher classes are most in need of mitigation.
Areas rated as Class 7 or higher are locations where the fire intensity, frequency and spotting can be severe enough to potentially cause catastrophic losses in any given wildfire season, where those ratings overlap with significant values at risk.
Due to the variability in the data sources within BC, areas rated as Class 6 should be reviewed for mitigation potential. These areas are considered to be particularly prone to wildfires (fire density equates to approximately 30 or more escaped fires since 1950), are susceptible to crown fires (head fire intensity greater than 10 000 kW/m), and are most likely to be affected by spotting impacts.
In general, the threat rating within the Area of Interest is moderate to extreme, with small areas of low threat rating. Threat ratings are generally higher in the western part of the AOI (in the multi-storied dry Douglas-fir forest of the Interior Douglas-fir zone), and drop as we look eastwards to the single-storied mixed Douglas-fir, pine and spruce forests of the Sub-Boreal Spruce zone.
4.2.2 Spotting Impact (Map 4B)
Spotting Impact data were provided by BCWS to the planning team. Documentation describes the provided data as follows:

Williams Lake & Area Community Wildfire Protection Plan – October 21, 2019
32
Research shows that a high percentage of structure losses are from embers being transported to and igniting structures and subsequent structure-to-structure ignitions13. The Spotting Impact Layer estimates the threat of embers impacting a given point on the landscape from the fuel types surrounding it. Describe the spotting impact in relation to fuel and structures within the AOI and potential impacts to the community.
In general, the spotting impact within the Area of Interest is high to moderate, with very little low or extreme spotting impact. Spotting impacts are generally higher in the western part of the AOI (in the multi-storied dry Douglas-fir forest of the Interior Douglas-fir zone), and drop as we look eastwards to the single-storied mixed Douglas-fir, pine and spruce forests of the Sub-Boreal Spruce zone.
4.2.3 Head Fire Intensity (Map 4C)
Head Fire Intensity (HFI) is “the predicted intensity, or energy output, at the front or head of the fire.
It has become one of the standard gauges by which fire managers estimate the difficulty of controlling
a fire and select appropriate suppression methods.”14 It is expressed in kilowatts per metre of fire
growth, and this is a prime determinant of flame length and difficulty of suppression (see Table 5).
Head Fire Intensity is also an important determinant of fire impacts.
Map 4C shows Head Fire Intensity low and moderate classes predominating in the western part of the AOI, with increasing moderate and extreme areas in the eastern part of the AOI. This suggests that, given the same weather, fires in the east can burn at higher intensity, making them more difficult to control.
Flame length is an important factor in managing fuels. Heavier fuel beds imply higher potential fire intensity, and therefore greater flame length. Longer flames can reach higher into the crowns of standing trees, and therefore increase the likelihood of a crown fire, if the separation between surface fuels and the base of the crowns is insufficient. This relationship is considered when arriving at the recommendations for surface fuel treatments (see section Recommendation 13)
According to Blackwell and Assoc. (2016), head fire intensity above 4000 kW/m cannot be attacked at the head of the fire and is very difficult to control. HFI > 10 000 kW/m leads to active crown fire and cannot be attacked directly. Fuel conditions and fuel types that will support head fire intensity above those thresholds are a higher risk and priority for treatment.
Recommendation 5. Fuel treatments should aim to achieve Head Fire Intensity less than 2000 kW/m within 100m of structures, and less than 4000 kW/m between 100m to 300m from structures through surface fuel reduction.
13 Partners in Protection. 2003. FireSmart: Protecting Your Community from Wildfire. Second edition. Partners in Protection. Edmonton, AB.
14 http://cwfis.cfs.nrcan.gc.ca/maps/fb

Williams Lake & Area Community Wildfire Protection Plan – October 21, 2019
33
Table 5: Head Fire Intensity classes and associated fire behaviour.
PSTA - HFI Class
Fire Intensity kW/m
Fire Intensity Class15
Flame Length (meters)16
Likely Fire Behaviour17
1 0.01 – 1000 2 < 1.8 Smouldering surface fire
2 1000.01 – 2000 3 1.8 to 2.5 Moderate vigour surface fire
3 2000.01 – 4000 4 2.5-3.5 Vigorous surface fire
4 4000.01 – 6000 5 3.5 to 4.2 Vigorous surface fire with occasional torching
5 6000.01 – 10 000 5 4.2 to 5.3 Vigorous surface fire with intermittent crowning
6 10 000.01 – 18 000 6 12.3 to 18.2 Highly vigorous surface fire with torching and/or continuous crown fire
7 18 000.01 – 30 000 6 18.2 to 25.6 Extremely vigorous surface fire and continuous crown fire
8 30 000.01 – 60 000 6 >25.618 Extremely vigorous surface fire and continuous crown fire, and aggressive fire behaviour
9 60 000.01 – 100 000 6 >25.6 Blowup or conflagration, extreme and aggressive fire behaviour
10 ≥ 100 000 6 >25.6 Blowup or conflagration, extreme and aggressive fire behaviour
NB: The descriptions in this table will vary by fuel type and should only be used as guidance for expected fire behaviour.
4.2.4 Fire Density (Map 4D)
The final part of the PSTA mapping is the density of historic fires. Past fires since 1950 that grew to > 4 ha contribute to fire density, whether lightning or human-caused. Large project fires count for more than smaller fires. Map 4D represents an estimate since 1950 of the number of fires >4 ha within 10 km of a given point, and therefore provides a fire probability function to the PSTA framework.
15 Head fire intensity should be classified by intensity class not fire rank. Fire rank is a visual description of conifer fires for air operations.
16 For calculating Flame Length, Bryam (1959) was used for surface fire (<10 000 kW/m) and Thomas (1963) was used for crown fire situations (>10 000 kW/m).
17 These characteristics will be different in open and closed forest fuel.
18 With HFI over 30 000 kW/m the function of the equation are stretched beyond the expectation of the equation, fire is under the influence of too many other factors.

Williams Lake & Area Community Wildfire Protection Plan – October 21, 2019
34
4.3 Fire History (Map 5)
BCWS has provided data of lightning and human caused fires and fire starts within the AOI, dating back to the 1920s. It is impressive to see the number of fires on the landscape of the AOI, and it points out the effectiveness of fire suppression over time, since most of the fires recorded did not grow beyond the 4 ha size to differentiate them from a “start” to a defined fire boundary. This map also points out the preponderance of human caused fires, particularly near communities.
On July 7, 2017 four fires started in or later moved into the Area of Interest, causing loss of property and evacuations of all the communities within the Area of Interest. Three of those fires were lightning caused, and one was person caused. In total, those fires have burned about 15% of the AOI. The fires of 2017 are very much out of character compared to the rest of the fires in the AOI. The largest was 12,700 ha, and in aggregate they burned more than 15,000 ha within the AOI. Prior to 2017, the largest fires in the AOI were about 1300 ha, and they occurred early in the fire record.
We cannot assume that once a fire has burned the threat is gone. BCWS staff are experiencing re-burning of fires a decade later, when grass and regeneration are well established in the burned stands. As an example, parts of the Okanagan Mountain fire from 2003 burned again in 2018. Fire intensity in re-burns depends upon the accumulation of surface fuels as the dead trees fall to the ground.
Salvage logging has been underway on the 2017 fires within the Area of Interest, and has reduced the area of severely burned stands. Logged areas will presumably be regenerated, and areas within Mule Deer Winter Range are being treated with consideration for regenerating Douglas-fir. One of the strategies for Douglas-fir regeneration is to provide shelter from growing-season frost by retaining slash on site. In places this practise is in conflict with the strategies promoted in this plan to reduce surface fuels and provide fuel breaks.
Recommendation 6. Harmonize strategies for fuel breaks with salvage logging and regeneration strategies.
MAP 5: Fire History
CWPP boundary with updated WUI PSTA Human and Lightening Fire starts maps with fire perimeters Include local fire incident history if relevant Other Relevant info such as WUI, structures, or Values At Risk
4.4 Local Wildfire Risk Assessment
A Local Wildfire Risk Assessment (Figure 2) has been prepared to guide strategic decisions about location and timing of treatments to reduce the impact of wildfire on the community. Tactical considerations of treatment method and intensity are guided by field work gathered at the time of prescription-setting. Local risk assessment polygons are therefore larger than the inventory polygons provided by the PSTA data.
Figure 1: July 7, 2017 at T'exelc (Sugarcane).

Williams Lake & Area Community Wildfire Protection Plan – October 21, 2019
35
While the approach employed does not strictly follow the standard methods outlined by the SWPI Guidelines, it has been considered and accepted by a fire behavior specialist in BCWS19. This approach considers:
Local fuel types from PSTA data Topographical features, particularly steep slopes in valley systems Proximity to community (WUI 2km), Density of structures within the community Probable fire spread patterns
These factors allow us to stratify the Area of Interest into areas of equal relative wildfire risk at a strategic level, which lead to proposed activities to reduce the threat and mitigate risks (see Section 5).
Figure 2: Classification of Local Wildfire Risk depends upon numerous factors. Stratification of the AOI into Risk Classes considered all of these factors and resulted in a strategic-level planning tool to guide the placement and priority of treatments discussed in Section 5.1.3.
4.4.1 Fuel Type Verification
PSTA Fuel Types have been verified by 94 Wildfire Threat Assessment Plots within the AOI. We gratefully acknowledge the sharing of plot data from the Cariboo Woodlot Association (FESBC funded project) and WL Community Forest L.P. (gathered in support of SWPI application). Nine of the 94 plots were gathered under this project funding.
Threat Assessment plots were also used in a quality control step to verify a local risk mapping exercise (see Section 4.4 above). Modifications to PSTA fuel typing (see Map 6) were only completed within logged areas in the fires of 201720. Areas that burned at high severity and were scheduled for logging in 2017 or 2018 have been modified to S2 fuel type (refer to Table 6) and threat class goes to moderate. All other fuel type modifications will require new VRI data.
19 Dana Hicks and Bev Atkins conference call, November 8, 2018.
20 The impacts of fires on the PSTA covers more than 15 000 ha within the AOI. The impact on fuel type is highly variable and poorly described in methodology. Changes of this magnitude to fuel types are beyond the scope of this project and require modifications to the VRI data. This approach was discussed with Rory Colwell and Dana Hicks by email.
Local Wildfire Risk Score
Local Threat Score
Proximity and Density of Values
Fire Spread Patterns (ISI
Roses )
Slope Position (Value)
Slope %

Williams Lake & Area Community Wildfire Protection Plan – October 21, 2019
36
Recommendation 7. Fuel types within the fires of 2017 have been substantially altered by fire and salvage logging continues. Fuel typing within these complex disturbances is beyond the capacity and scope of this project, but is important to fire management going forward. Fuel typing within the AOI (and the Cariboo-Chilcotin more generally) is required.
Table 6: Fuel Type Categories and Crown Fire Spot Potential
Fuel Type Categories Fuel Type - Crown Fire/ Spot Potential
1: C1, C2, C4, M3-M421 (>50% C/DF) High
2: C3, C7, M3-M4 (<50% C/DF) M1-M2 >50% Conifer Moderate
3: C5, C6, O1a/b, S1- S31 M1-M2 (26-49% Conifer) Low
4: D1, D2, M1-M2 (<26% Conifer) Very Low
MAP(s) 6: Updated Fuel Type
CWPP boundary with updated WUI Corrected fuel type with hectares Verification fuel type lot locations and labels WUI Zones Field Verified Overview of fuel typing plot locations and hectares of each fuel type If significantly different, show original PSTA fuel type map
4.4.2 Proximity of Fuel to the Community
Fuels closest to the community present the greatest risk to property and safety. Fuels close to higher structure densities present greater risks to the community. Risk to property and safety are considered the highest priority guiding fire and fuels management. Blackwell and Assoc. (2016) point out that the Cariboo has large areas defined as interface with very low structure density. BC Wildfire Service has provided mapping that assigns structure density to five classes shown in Table 7.
Recommendation 8. This plan assigns a higher risk (and priority for treatment) to areas within 2 km of more than 25 structures/km2.
Risk to the community can therefore be described in a matrix shown in Table 7. These concepts are carried forward as planning and treatment zones in the AOI, discussed in Section Recommendation 13.
Table 7: Proximity to the Interface and structure density guide the assessment of risk, with higher structure density increasing the risk class.
> 2 km from
Property
< 2 km from Structure Density
0-6 structures/km2 7-25 structures/km2 26-100
structures/km2 101+ structures/km2
Low Low Moderate High Extreme
21 M-4 fuel type is a mixture of deciduous and coniferous trees, with more than 50% conifer or dead conifer

Williams Lake & Area Community Wildfire Protection Plan – October 21, 2019
37
4.4.3 Fire Spread Patterns (i.e. ISI Roses)
Initial Spread Index (ISI) is “a numeric rating of the expected rate of fire spread. It combines the effects of wind and the [moisture content of fine fuels] on rate of spread without the influence of variable quantities of fuel.”22 Each location has somewhat predictable wind directions that can be deduced from weather records. The Knife fire weather station is located within the AOI at Knife Creek and provides weather records for the fire season stretching back over three decades. Figure 3A shows that ISI is highest from May through September, and the direction of spread is most frequently driven by winds from the NE through north, NW, west or SW in approximately even proportions. This suggests that fuel treatments on NE through W to SW quarters of the interface area should be higher priority than treatments on the south and east quarters.
However, examination of Hourly ISI values in July (Figure 3B) and August shows that significant winds can come from any point on the compass throughout the day, so fire growth can come from any direction. This suggests that fuel treatments on the S to E quarters have substantial value and should not be disregarded.
Recommendation 9. This plan assigns a higher risk to property and safety (and priority for treatments) for fuels located to the NE, N, NW, W, and SW (i.e. upwind) of values based on BCWS data.
A B
Figure 3A: Monthly ISI-Roses for Knife station (1996-2015) reveal that May, July and August have the highest values for ISI and wind direction is relatively uniformly distributed between NE through North, West to Southwest. However, Figure 3B demonstrates that significant winds can come from any point on the compass throughout a 24-hour period.
22 http://cwfis.cfs.nrcan.gc.ca/background/summary/fwi

Williams Lake & Area Community Wildfire Protection Plan – October 21, 2019
38
4.4.4 Topography
Topography has a strong influence on fire behaviour and on risk to values. Topography also interacts with wind to increase wind speeds. Slope class and location of values relative to slope are discussed below.
Slope Class
Across the AOI there are several deep valleys transecting a relatively high plateau. The Fraser River, San Jose Valley including Williams Lake, Williams Lake River Valley, Chimney Creek and Deep Creek Valley all have steep valley sidewalls that can contribute to fire behavior, particularly where those slopes are upwind of values, or below values.
Considering Table 8, we prepared a map of slopes >20% (see Map 7A) and within those slopes we upgraded the threat rating by one class – e.g. from moderate to high, or from high to extreme.
Table 8: Slope Percentage and Fire Behaviour Implications
Slope Percent Class Fire Behaviour Implications
<20% Very little flame and fuel interaction caused by slope, normal rate of spread.
21-30% Flame tilt begins to preheat fuel, increase rate of spread.
31-45% Flame tilt preheats fuel and begins to bathe flames into fuel, high rate of spread.
46-60% Flame tilt preheats fuel and bathes flames into fuel, very high rate of spread.
>60% Flame tilt preheats fuel and bathes flames into fuel well upslope, extreme rate of spread.
Slope Position of the Value Considering Table 9 and given the nature of the terrain in the AOI, values tend to be either below
slopes (e.g. much of the City of Williams Lake) or above slopes (e.g. Fox Mountain subdivision,
Chilcotin Estates). Values above slopes were considered to be at greater risk in the classification
process.

Williams Lake & Area Community Wildfire Protection Plan – October 21, 2019
39
Table 9: Slope Position of Value and Fire Behaviour Implications
Slope Position of Value
Fire Behaviour Implications
Bottom of Slope/ Valley Bottom
Impacted by normal rates of spread.
Mid Slope - Bench Impacted by increase rates of spread. Position on a bench may reduce the preheating near the value. (Value is offset from the slope).
Mid slope – continuous
Impacted by fast rates of spread. No break in terrain features affected by preheating and flames bathing into the fuel ahead of the fire.
Upper 1/3 of slope Impacted by extreme rates of spread. At risk to large continuous fire run, preheating and flames bathing into the fuel.
Local Conditions
The orientation of valley systems gives rise to additional threat when wind direction is considered. As an example, Williams Lake River Valley rises from the west, eastwards into the City of Williams Lake. Winds from the NW, W, or SW will be funneled up the river valley to the complex of sawmills and other infrastructure on the west end of the City of Williams Lake. This puts the City and adjacent communities at significant risk. The same terrain x wind effect is true of Deep Creek Valley and Chimney Valley.
4.4.5 Local Wildfire Risk Classification (Map 7B)
A local risk map was created by considering all the above information and classifying areas into
four risk categories from Low to Extreme. Following is a summary of the steps to preparing the
Local Wildfire Risk Assessment:
1. Threat Class (Low to Extreme) from PSTA data as provided 2. Modify threat class from PSTA data (see Map 6)
a. Fuel Type Changes 2017 Fires i. If within 2017 fire and within a cutblock scheduled for harvest in 2017 or
2018 (FTA Data) then fuel type changes to S2 (Rory Colwell, RFT, Personal Communications, Oct. 5, 2018) and threat class goes to moderate.
ii. If within 2017 fire and not planned for salvage in 2017 or 2018, fuel type stays unchanged and threat class stays the same.
b. Modify threat class on steep valley slopes (see Map 7A) i. On steep valley slopes we can expect increased headfire intensity. While
topography is included as a factor in the PSTA data, out of an abundance of caution we have increased the threat class by one grouping (i.e. from Moderate to High, or from High to Extreme) in those areas that sit below or upwind from values.
3. Stratify Local Wildfire Risk (see Map 7B) based upon modified threat class, proximity to the community and density of structures, using classification system described in priority. Table.
4. Compare threat plot classifications (see Map 7B) to mapped classifications as a quality control step. Modify risk mapping to reflect threat assessment plots where they indicate the map polygons have been mis-classified.
5. Review the procedures with BCWS staff.

Williams Lake & Area Community Wildfire Protection Plan – October 21, 2019
40
Table 10: Local Wildfire Risk Classes are assigned based upon the PSTA classes (modified to reflect steep slopes and probable spread direction) compared to proximity to the community and structure density. Mapped polygons (see Map 7B) will support strategic decision-making for treatment placement and priority.
Local Wildfire Risk Class, based upon
Proximity to Community
Modified PSTA Threat Class
> 2km < 2km
0-6 structures/km2
< 2km 7-25
structures/km2
< 2km 26-100
structures/km2
< 2km 101+
structures/km2
Low (none in AOI)
Low Low Low Moderate High
Moderate Low Moderate Moderate High Extreme
High Moderate Moderate High Extreme Extreme
Extreme Moderate High Extreme Extreme Extreme
4.4.6 Summary of Fire Risk Classes
Low (Green): The combination of the local fuel hazard, weather influences, topography, distance from the community, fuel position in relation to fire spread patterns, and known local wildfire threat factors make it a low risk to the community. Within the AOI, these classes are all moderate fuel threat more than two kilometres away from six or more structures per hectare.
Moderate (Yellow): The combination of the local fuel hazard, weather influences, topography, proximity to the community, fuel position in relation to fire spread patterns and known local wildfire threat factors make it possible that a wildfire in this area would threaten the community. These stands include high and extreme threat classes more than 2 km from structures; and low to moderate threat class within 2 km of more than 100 structures/km2. Forest stands would have potential to impact values in extreme weather conditions. Spot potential is unlikely to impact values at a long distance (<400m).
High (Orange): The combination of the local fuel hazard, weather influences, topography, proximity to the community, fuel position in relation to fire spread patterns, and known local wildfire threat factors make it likely that a wildfire in this area would threaten the community. This includes stands ranging between extreme threat-class fuels within 2 km of 6 or fewer structures/km2, or low threat class (none in the AOI) within 2 km of 101+ structures/km2. Spot potential is likely to impact values at a long distance (400 -1000m).
Extreme (Red): The combination of the local fuel hazard, weather influences, topography, proximity to the community, fuel position in relation to fire spread patterns, and known local wildfire threat factors make it very likely that a wildfire in this area would threaten the community. This includes stands ranging between extreme threat class within 2 km of more than 7 structures/km2 and moderate threat class within 2 km of more than 101 structures/km2. Spot potential is probable to impact values at a long distance (400 -1000m or greater).

Williams Lake & Area Community Wildfire Protection Plan – October 21, 2019
41
MAP(s) 7: Local Fire Risk
CWPP boundary with updated WUI Risk Polygons labelled by Extreme, High, Moderate, and Low Hectares of polygons on map WUI Zones Assessment plot locations / labelled Critical Infrastructure and other relevant Values At Risk

Williams Lake & Area Community Wildfire Protection Plan – October 21, 2019
42
4.5 Summary of Recommendations presented in Section 4
Recommendations Responsibility/ Funding Source
Next Steps
1 Increase the pace of grassland restoration treatments in the Area of Interest.
Cariboo-Chilcotin Ecosystem Restoration Steering Committee, which includes Cariboo Fire Centre
Training for more Burn Bosses
2 Document the location of pre-commercial thinning treatments that have been accomplished in the past, and increase the area treated annually within the AOI, particularly when coupled with surface fuel reduction.
Cariboo-Chilcotin Resource District/FFT
Interview local retired silviculturists
3 Fuels Typing and fire behaviour estimation should extend to privately owned lands, as they present a significant part of the fire risk in the Wildland Urban Interface and represent about 1/3 of the land in the AOI.
MFLNRORD Inventory Branch and/or BCWS
Policy change
4 Private land owners should recognize that their lands present a threat of forest fires. Landowners should consider undertaking works to reduce the risk to the community associated with that threat through the use of FireSmart initiatives and actions.
Private landowners Work to reduce threat
5 Fuel treatments should aim to achieve Head Fire Intensity less than 2000 kW/m within 100m of structures, and less than 4000 kW/m between 100m to 300m from structures through surface fuel reduction.
Implementing professionals/ FESBC
Develop methods
6 Harmonize strategies for fuel breaks with salvage logging and regeneration strategies.
Cariboo Region, BCTS & Licensees
Review regeneration strategies with a fire lens
7 Fuel types within the fires of 2017 have been substantially altered by fire and salvage logging continues. Fuel typing within these complex disturbances is beyond the capacity and scope of this project, but is important to fire management going forward. Fuel typing within the AOI (and the Cariboo-Chilcotin more generally) is required.
BCWS Improve understanding of post-fire fuel types
8 This plan assigns a higher risk (and priority for treatment) to areas within 2 km of more than 25 structures/km2.
Implementers Implement priority treatments
9 This plan assigns a higher risk to property and safety (and priority for treatments) for fuels located to the NE, N, NW, W, and SW (i.e. upwind) of values based on BCWS data.
Implementers Implement priority treatments

Williams Lake & Area Community Wildfire Protection Plan – October 21, 2019
43
SECTION 5. Risk Management and Mitigation
The intent of this section is to conduct more detailed work on the highest local risk areas of the WUI identified in Section 4.3.7 and design logical treatment units for future prescription development and operational fuel treatments within the highest risk areas.
5.1 Fuel Management
This Community Wildfire Protection Plan sets out a plan for effective treatments to help protect the community from wildfire. Treatments are designed to:
1. Reduce the intensity of a wildfire, breaking the intensity threshold that will support crown fire.
2. Support fire-fighting efforts by strategically locating treatments on the highest risk fuels and locations.
3. Create defensible space where fire-fighters can safely and effectively do their work.
Given the importance of fuel management to fire-fighting tactics, it is critical that completed treatments be known and utilized during fire-fighting. The Cariboo Fire Centre must be able to see treated areas on their tactical maps, and on the ground.
Furthermore, the investment in these treatments is at risk if they are unknown to development planners who are laying out cutblocks for commercial timber harvesting. Timber harvesting withing the AOI should reduce the wildfire threat to communities, and protect and enhance the community investment in wildfire protection.
Recommendation 10. Cariboo Fire Centre should create map coverage of all previously treated fuel breaks, and annually update that coverage to serve in tactical planning for fire-fighting. This map coverage should be transmitted to the local fire halls through the City of Williams Lake and the Cariboo Regional District.
Recommendation 11. Fuel treatments should result in sufficient change in stand structure such that the treatments are apparent from the ground and from the air.
Recommendation 12. Completed fuel treatments must be reported to RESULTS, and should be known to Licensees and Government for the purpose of Cutting Permit development and approvals. Areas that have been treated previously must be entered into RESULTS immediately by the District Manager.
5.1.1 Land Management Context
Fuel Treatments on crown land are overlaid on unceded traditional territories of the T’exelc First Nation (Williams Lake Indian Band), Xat’sull First Nation, Esk’etemc First Nation, Canim Lake Indian Band, Tsilqot’in National Government (Area B), and Lhtako Dene Nation. Treaty negotiations are underway between the members of the Northern Shuswap Tribal Council and, the Province of B.C. and Canada. All fuel treatments contemplated under this plan will be subject to review by affected First Nations and treatment plans will accommodate their interests. Further, this plan seeks the participation of First Nations in the conception and implementation of fuel treatments.

Williams Lake & Area Community Wildfire Protection Plan – October 21, 2019
44
Celebrate Success: Fuel Management at Cariboo Fire Centre
On July 7, 2017, the Cariboo Fire Centre was evacuated as the Wildwood Fire approached from the northwest. Because the surrounding forest had been treated and the brand new Fire Centre was designed and maintained as a FireSmart facility, staff were able to return the next day while fire suppression was still underway.
This was a testament to a good plan that was well executed. In the original Interface Fire Plan (WL Interface Committee, 2005) the Williams Lake Airport was identified as a priority for treatment, particularly in recognition of the BC Wildfire Service facilities.
From 2008 to 2010 the City of Williams Lake accessed funding from Natural Resources Canada to set prescriptions and carry out fuel management. The City contracted the UBC Alex Fraser Research Forest to carry out the work. Local contractors Peter Nilsson, Jeremy LeBourdais, Rolf Schuetze and Dee Gainer removed dead pine trees and understory Douglas-fir by two methods: a harvester and forwarder, and hand falling and skidding with a quad. In both cases the felled trees were removed to central landings where they were ground for the power plant by Pioneer Biomass.
Fuel treatment meant that the fire intensity was reduced. FireSmart construction and landscaping meant that the facilities survived. Fire suppression was effective. This is a true success story!
Untreated Treated
Treated and Burned Treated and Unburned

Williams Lake & Area Community Wildfire Protection Plan – October 21, 2019
45
Other forest management values apply to the crown land within the Area of Interest for this plan. The crown land is subject to the Cariboo-Chilcotin Land Use Plan, the Forest and Range Practices Act, and other federal and provincial statutes. Integration of those values with community wildfire protection is a necessity. Values located within the Area of Interest include (but are not limited to):
Cultural and heritage values Timber harvesting landbase Old Growth Management Areas Mule Deer Winter Range Visual Quality Objectives Lake Management Zones Wildlife Habitat Areas Guide-Outfitter tenures Registered traplines Range permits Special Use Permits Research installations Forest Licences Woodlot Licences Community Forest Agreements Interim Treaty Areas Potable water Recreation
Land Ownership and Tenure Rights
Canada and British Columbia have entered numerous forms of land ownership and tenure agreements with First Nations, Municipalities, corporate bodies and private individuals. Those tenure rights provide the owners with interests in the management of the land, and access to crown resources to support the implementation of fuel management. Table 11 shows the various land rights that may affect responsibilities for treatment planning and implementation. Map 1 shows the distribution of those tenure rights within the Area of Interest.
It is critical to the success of this plan that tenure holders engage in the treatment of fuel breaks described below. Development planning and the Cutting Permit approval process must recognize the location of planned fuel breaks, and take steps towards implementation of the prescribed fuel breaks and fuel treatments described in this plan. Setting harvest and silviculture plans with fuel management as a primary objective will greatly improve the rate of implementation.
Table 11: Land Ownership and Tenure Rights within the Area of Interest affect responsibilities for treatment planning and implementation
Tenure or Ownership Subzones
City of Williams Lake Industrial Light Industrial Residential Commercial
Cariboo Regional District Area D Area E Area F
T’exelc Williams Lake #1, Asahal Lake #2, Carpenter Mountain #15, Chimney Creek #5, Five Mile #3, James Louie #3A,
San Jose #6, Tillion#4
Interim Treaty Areas
Xat’sull First Nation Soda Creek #1 Deep Creek #2 - Interim Treaty
Areas
Esk’etemc First Nation - - - Title Claim Area
Area-Based Tenures WL Community
Forest – K3A
UBC Alex Fraser Research Forest –
SUP 15382
Alkali Resource Management FNWL – N2K
Woodlot #
Volume-Based Tenures Tolko
Forest Licence West Fraser
Forest Licence BC Timber Sales Timber Sale Area
Other Replaceable and Non-Replaceable Forest Licenses

Williams Lake & Area Community Wildfire Protection Plan – October 21, 2019
46
Recommendation 13. Fuel breaks and fuel treatments proposed under this plan should be known to Licensees and Government for the purpose of Cutting Permit development and approvals. District Manager should ensure that proposed fuel treatments are available on the Land and Resource Data Warehouse or otherwise made known to harvest planners.
5.1.2 Planning Approach
This CWPP seeks to strategically identify:
1. A zoning framework, within which logical treatments will support suppression tactics. 2. A project leader based upon land ownership and tenure rights. 3. Priorities for treatments based upon wildfire threat, potential fire behaviour, past
treatments and current fuel conditions. 4. Opportunities to support the allocation of scarce resources.
Blackwell and Assoc. (2016) have recommended a range of treatments based upon landscape-level planning and fire behavior modelling. This CWPP incorporates that work as tactical guidance for fuel management treatments.
Interface Zonation
5.1.2.1.1 Zones of Distance from Values
The Area of Interest is zoned based upon the distance from values23 as described in Figure 4: Five zones based upon distance from structures inform both treatment priority and the nature of treatments. Figure 4 Distance zones are described as:
Zone 1. Private land immediately surrounding structures or values, where land-owners are encouraged to undertake Fire Smart treatments24.
Zone 2. Crown land within approximately 100 m of private property or values. Zone 3. Crown land between approximately 100-300 m away from private property. Zone 4. Crown land between approximately 300 m and 2 km away from private property,
where fuel treatments should focus on thinning to reduce the likelihood of a crown fire. Surface fine fuels should be discontinuous and should not exceed 3.2 kg/m2 (i.e. 32 T/ha). Forest roads should be maintained for summer access and should have at least 15 m cleared rights-of-way.
Zone 5. Area within the Area of Interest but more than 2 km away from structures, where the primary objective of harvesting is to reduce the likelihood of a crown fire and create fire-resilient forests. Fuel treatment beyond obligatory abatement is not expected. Forest roads should be maintained for summer access and should have at least 15 m cleared rights-of-way.
23 Values are defined as 7 or more structures per km2
24 See https://www2.gov.bc.ca/assets/gov/public-safety-and-emergency-services/emergency-preparedness-response-recovery/embc/preparedbc/homeowner-firesmart.pdf

Williams Lake & Area Community Wildfire Protection Plan – October 21, 2019
47
Figure 4: Five zones based upon distance from structures inform both treatment priority and the nature of treatments.
5.1.2.1.2 Point and Linear Values
Point and linear values in the Wildland/Urban Interface affect treatment priority and operations in both positive and negative ways.
1. Point values are critical infrastructure that must survive a wildfire because they are critical to emergency operations. Examples include cell towers, radio repeater sites, water and power supply infrastructure, etc.
Recommendation 14. Point Values should be treated to FireSmart standards (i.e. Zone 1) at the time of installation, and maintained in a FireSmart condition by the owner/utility responsible for their upkeep.
2. Linear values provide emergency access and egress and may be critical to emergency operations.
a. Roads and highways provide access and fuel breaks. Forests that regenerate within the right-of-way become a hazard to egress because they allow burning trees to fall onto the roadway.
b. Hydro rights-of-way may provide fuel breaks and access but are also barriers to fuel treatment and fire-fighting operations. They also carry power that is locally, regionally and provincially critical.
c. Pipeline rights-of-way may provide fuel breaks but are barriers to fuel treatment and fire-fighting operations. They also carry gas and oil that are locally, regionally and provincially critical. Rupture of a pipeline could result in catastrophic fires.
d. CN Rail line may provide fuel breaks but is a barrier to access, fuel treatment and fire-fighting operations. It carries freight that is locally, regionally and provincially critical. During fire shutdowns due to extreme fire danger, railway traffic continues to operate. The rail line is also believed to be a source of wildfire ignitions.

Williams Lake & Area Community Wildfire Protection Plan – October 21, 2019
48
Recommendation 15. Linear Features should be treated to FireSmart standards (i.e. Zone 1) at the time of installation. Where linear features are designated as fuel breaks, their maintenance schedule should ensure that they function appropriately as fuel breaks and maintained in a FireSmart condition by the owner/utility responsible for their upkeep.
Point and Linear features in the Area of Interest are identified on Map 2 Values at Risk.
5.1.2.1.3 Strategic Anchor Locations:
Blackwell and Assoc. (2016) describe strategic anchor locations as existing features where wildfire is less likely to spread and where suppression opportunities can be anchored. Examples might include built features such as roads, transmission lines, pipelines (discussed above) and irrigated fields, or natural features such as lakes, wetlands, rivers and rock. To the greatest extent possible, proposed fuel treatments take advantage of these features to improve their effectiveness and improve Fire Fighter safety.
5.1.3 Fuel Treatments
We treat forest fuels to reduce the intensity of a forest fire when it occurs, by limiting the energy released during combustion (Day et al. 2010). Fuel management is the manipulation of live and dead forest fuels, and it is a critical tool in reducing fire threat, and result in fuel loading that would not support greater than Rank 2 fire behaviour (Day et al. 2010). Fuel treatment manipulates several key variables to reduce fire intensity and break the crown-fire threshold. The variables at play are surface fuel load, Crown Base Height, and Canopy Bulk Density or stand density.
Treatments generally thin the stand to decrease Canopy Bulk Density and reduce ladder fuels, and dispose of pre-existing and new surface fuels. Pruning of residual trees to 3 m increases the Canopy Base Height. Reduction of the surface fuels decreases the fire intensity (energy release) and therefore flame length. Pruning moves the Canopy Base Height up above the flame length, thereby breaking the threshold that allows surface fire to change to transition to crown fire. Thinning also increases the space between trees, meaning that fires burning in the canopy are less likely to move from tree to tree.
In general, the sequence of treatments under this plan will follow these steps:
1. Thin the overstory and understory to reduce Canopy Bulk Density and increase Canopy
Base Height
2. Prune residual trees to increase Canopy Base Height
3. Gather and remove surface fuels, either by piling and burning or by removal to roadside for
grinding.
4. Retain deciduous trees and shrubs
5. Retain up to 50 m3/ha of new coarse woody debris (> 7.5 cm diameter on the small end)
scattered across the area,
6. Retain large soft snags (with appropriate danger tree measures) and coarse woody debris
This plan recommends thinning treatments to reduce Canopy Bulk Density while continuing to support growth of the stand and maintain habitat values. It also recommends variable surface fuel targets based upon Zones distance from values. Target fuel loading by zone is described below.
Fuel Treatments have been described by Blackwell and Assoc. (2016) and the following definitions and tactics are modified from Blackwell and Assoc. (2016) as follows:
Williams Lake & Area Community Wildfire Protection Plan – October 21, 2019
49
Primary Fuel Break:
Primary Fuel Breaks have been defined and located by Blackwell and Assoc. (2016). These are located on Crown Land in strategic locations at or beyond the community/forest interface (Zones 2-5). Primary Fuel Breaks are:
Linking existing fire-resilient natural and man-made features; Surrounding Williams Lake and outlying areas of Esler, Chimney Creek, 150 Mile House and
Deep Creek; Designed to modify fire behaviour and create fire suppression options
o Reduce the risk of a crown fire reaching a community and/or adjacent fuels o Sufficiently wide and appropriately treated to break the crown fire threshold and
reduce fire intensity o Crown fire moves to the ground surface and spread rates are reduced o Take advantage of natural and man-made fire-resilient features and topography to
enhance effectiveness.
Surface fire spreading across and spotting over the fuel break are both concerns, and their success depends upon:
The application of suppression resources - primary fuel breaks become an anchor for suppression tactics during a wildfire; and
Additional fuel treatment work within the area protected by the Primary Fuel Breaks.
Interface Fuel Break
Interface Fuel Breaks have been defined by Blackwell (2016) as fuel treatments at the wildland urban interface. They are designed to modify fire behaviour, create fire suppression options, and improve suppression outcomes. Interface Fuel Breaks are approximately 100 m wide and are intended to break the crown fire threshold to reduce the risk of a crown fire reaching private land and structures. Surface fire spreading across and spotting over the fuel break are both concerns, and their success depends upon:
The application of suppression resources; and Additional fuel treatment work to FireSmart standards on the private land they protect.
Interface Fuel Treatment
Interface Fuel Treatments have been defined by Blackwell (2016) as fuel treatments between the primary fuel break and the wildland urban interface. They are focused on hazardous fuels that could potentially burn at high fire intensity, and are intended to create suppression options and reduces fire spread and spotting within the Area of Interest.
Fuel treatments By Zone
Zone 1: FireSmart Private Property and Point Features
In order to reduce potential fire intensity and damage to values, fuel on private land between the Interface Fuel Break and structures should be treated according to FireSmart vegetation management standards. Point values and structures in interface areas should be constructed or retrofitted to FireSmart design standards. Further discussion of treatments in Zone 1 follows in Section 5.2 below.

Williams Lake & Area Community Wildfire Protection Plan – October 21, 2019
50
Zone 2: Interface Fuel Break
Interface Fuel Breaks on Crown Land are immediately adjacent to private land or other identified values and in close proximity to the wildland/urban interface and/or intermix areas. These are:
Designed to modify fire behaviour, create fire suppression options, and improve suppression outcomes.
Approximately 100 meters wide, with fuel reduction measures that break the crown fire threshold to reduce the risk of a crown fire reaching private lands and structures
Width varies to align with natural and man-made fire resilient features that enhance effectiveness.
Interface Fuel Breaks in Zone 2 should reduce head-fire intensity25 to less than 2000 kW/m in order to maintain Fire Intensity Class 3 or better fire behavior in C7
25 Head Fire Intensity (HFI) is the predicted intensity, or energy output, of the fire at the front or head of the fire. It has become one of the standard gauges by which fire managers estimate the difficulty of controlling a fire and select appropriate suppression methods. It is measured in kilowatts per meter of fire front and is based on the
Figure 5: Measured fuel transect showing 21.6 T/ha fine fuel (<7.6 cm diameter). Photo
courtesy WL Community Forest L.P.

Williams Lake & Area Community Wildfire Protection Plan – October 21, 2019
51
fuel type26. Reduce fuel loading to <2 kg/m2 (i.e. 20 T/ha) on average to achieve that fire behaviour standard in the 90th percentile of fire weather. (See Figure 5 for an example of a measured transect slightly exceeding the prescribed fuel loading.) Thin stands to retain a stocked stand with an overstory comprised of the largest and best growing Douglas-fir, aspen, birch or lodgepole pine (in descending order of preference). Retain overstory density between the upper and lower limits of stocking shown on the Gingrich Stocking Chart shown in Figure 6.
Surface fire can spread across a treated fuel break, and spotting may cross over the fuel break. We therefore rely on suppression actions for fuel breaks to be effective. Additional treatments on crown land outside Zone 2 can increase the effectiveness of the Interface Fuel Break.
Fuel treatments should be tied into existing features where fire is less likely to spread, (e.g., roads, railways, hydro and transmission lines, gas pipelines, wetlands, lakes, irrigated fields, non-fuel areas, etc.) to improve suppression opportunities.
Rate of Spread and the Total Fuel Consumption. (http://cwfis.cfs.nrcan.gc.ca/background/summary/fbp) See also Section 4.2.3.
26 Fuel types are described by the Canadian Wildland Fire Information System for the purpose of predicting forest fire behaviour. Sixteen fuel types are described to represent all Canadian fuel types. Fuel type C7 describes uneven-aged ponderosa pine and Douglas-fir stands. http://cwfis.cfs.nrcan.gc.ca/background/summary/fbp (accessed 2018-06-21).

Williams Lake & Area Community Wildfire Protection Plan – October 21, 2019
52
Recommendation 16. Fuel management specialists, project proponents and project funders need to agree on a common set of objectives. District Manager Cariboo-Chilcotin RD should convene a working group to debate and resolve the obvious tension that exists between treatment cost ($/ha), target fuel loading and amount of area treated. Treatment of fine fuels requires intensive hand-work to pick and pile fuels, and intensive fuel treatment implies less area treated within limited budgets.
Recommendation 17. It may be that fuel treatment objectives cannot be achieved in a single entry, and proponents should be encouraged to achieve objectives incrementally, particularly where prescribed fire can reduce treatment costs and improve outcomes.
Zone 3: Interface Fuel Break
Zone 3 Interface Fuel Breaks are generally adjacent to a Zone 2 Interface Fuel Break, extending from 100 to 300 m away from a private property boundary on crown land. Ideally these fuel treatments are completed at the same time as the Zone 2 treatment to find operational efficiencies. Where feasible, treatments should be designed in a linear configuration and tied into fire resistant features to create additional suppression opportunities.
Figure 6: Gingrich Stocking Chart modified from Day (1997). Residual stands comprised of high-quality overstory trees should be retained at stocking rates falling between the
“Upper” and “Lower limit” in order to keep the growing space occupied by a high canopy of trees (i.e. a “shaded fuel break”. High, Moderate and. Low BDq refer to the stand structures described in by Province of BC (2007) in MDWR General Wildlife Measures for the Shallow
and Moderate Snow Pack Zones of the Cariboo-Chilcotin.

Williams Lake & Area Community Wildfire Protection Plan – October 21, 2019
53
Interface Fuel Breaks in Zone 3 should reduce head-fire intensity to less than 4000 kW/m in order to maintain Fire Intensity Class 4 or better fire behavior in C7 fuel type. Reduce fuel loading to 3.2 kg/m2 (i.e. 32 T/ha) on average (see recommendation 3) to achieve that fire behaviour standard in the 90th percentile of fire weather. (See Figure 7 for an example of a measured transect barely achieving the prescribed fuel loading.) Thin stands to retain a stocked overstory comprised of the largest and best growing Douglas-fir, aspen, birch or lodgepole pine (in descending order of preference). Retain overstory density between the upper and lower limits of stocking shown on the Gingrich Stocking Chart in Figure 6.
Fuel treatments should be tied into existing features where fire is less likely to spread, (e.g., roads, railways, hydro and transmission lines, gas pipelines, wetlands, lakes, irrigated fields, non-fuel areas, etc.) to improve suppression opportunities.
Zone 4: Interface Fuel Treatments
Zone 4 Interface Fuel Treatment is the treatment of patches of hazardous fuels inside the Primary Fuel Break, within 2 km but not closer than 300 m from private property or values. To address the possibility of surface fire spread across, and/or spotting over the Primary Fuel Break, hazardous fuels between the Interface Fuel Break and the Primary Fuel Break should be treated to reduce fire intensity and create suppression options. Hazardous fuel types include C1, C2, C3, C4, C7 (with ingrowth), and M1-M2 fuel types with 50% or more conifer.
Commercial timber harvest within Zone 4 should be completed with fuel treatment as a primary objective. Interface Fuel Treatments in Zone 4 should reduce head-fire intensity to less than 4000 kW/m in order to maintain Fire Intensity Class 4 or better fire behavior in C7 fuel type. Reduce fuel loading to 3.2 kg/m2 (i.e. 32 T/ha) on average to achieve that fire behaviour standard in the 90th percentile of fire weather (see Figure 7). Thin stands to retain a stocked overstory comprised of the largest and best growing Douglas-fir, aspen, birch or lodgepole pine (in descending order of preference). Retain overstory density between the upper and lower limits of stocking shown on the Gingrich Stocking Chart in Figure 6.
Figure 7: Measured fuel transect showing 31.9 T/ha fine fuel (<7.6 cm diameter). Photo courtesy
WL Community Forest L.P.

Williams Lake & Area Community Wildfire Protection Plan – October 21, 2019
54
Interface fuel treatments should be tied into existing features where fire is less likely to spread, (e.g. roads, railways, hydro transmission lines, gas pipelines, wetlands, lakes, irrigated fields, non-fuel areas, etc.) to improve suppression opportunities.
Zone 5: Interface Fuel Treatments
Zone 5 Interface Fuel Treatment is the treatment of patches of hazardous fuels inside the Primary Fuel Break but not closer than 2 km from private property or values. Commercial timber harvest within Zone 5 should emphasize fuel treatment and seek to create fire-resilient stands of timber inside the Primary Fuel Break.
To address the possibility of surface fire spread across, and/or spotting over the Primary Fuel Break, hazardous fuel between the Interface Fuel Break and the Primary Fuel Break should be treated to meet fuel hazard abatement levels, reduce fire intensity and create suppression options where practicable and economically feasible. The current fuel hazard abatement guidance (2012) sets unachievable targets for fuel reduction in the routine timber harvest, and this level of abatement cannot be achieved without external funding. The abatement targets need to be reviewed to make them achievable. Hazardous fuel types include C1, C2, C3, C4, C7 (with ingrowth), and M1-M2 fuel types with 50% or more conifer.
Recommendation 18. Fuel hazard assessment and abatement guidance (Province of BC, 2012) sets unrealistic targets for surface fuel loading and must be reviewed to provide effective guidance. In High and Extreme Risk Class (which dominate the AOI) the guidance from Appendix 1 suggests an un-achievable level of fuel abatement that still fails to satisfy the risk rating. Regional Director Resource Management (Cariboo Region) should send this issue up for resolution..
Fuel treatments should be tied into existing features where fire is less likely to spread, (e.g., roads, railways, hydro and transmission lines, gas pipelines, wetlands, lakes, irrigated fields, non-fuel areas, etc.) to develop potential suppression opportunities.
5.1.4 Setting Treatment Priority
Determining treatment priority requires a risk assessment (see Section 4.4.5 Local Fire Risk Assessment) combined with proximity to values (see Section Recommendation 13 Interface Zonation). Resources should be used first where the combination of risk and proximity is greatest, with the intent of reducing fuels from the values outwards. The following discussion sets out components of a risk matrix that can be resolved to a map coverage to guide treatment plans.
Fuel Treatment Priority Matrix
Taking the preceding discussion together, fuel treatment priority is ranked for the Area of Interest according to the following matrix of treatment priorities described in Table 12.

Williams Lake & Area Community Wildfire Protection Plan – October 21, 2019
55
Table 12: Treatment priority matrix for the Area of Interest depends upon local risk class developed in section 4.4 (Map 7B) and proximity to values (Zones described in section 5.1.2.1.1). The highest priority for treatment will be within 100 m of values (FireSmart Treatments), and on crown land within 100 m of the property line in areas of extreme and high local wildfire risk class.
Zone (see section 5.1.2.1.1)
Local Wildfire Risk Class (Map 7B)
Extreme High Moderate Low
Zone 1 within 100 m (FireSmart)
1 1 1 1
Zone 2 0-100 m from property line
1 1 2 3
Zone 3 100-300 m from property
line
2 2 2 3
Zone 4 300 -2,000 m from property
line
2 2 3 3
Zone 5 > 2 km from property line
3 3 3 3
5.1.5 Treatment Methods
Thinning-from-below to reduce the stocking in the (primarily Douglas-fir) overstory reduces Crown Bulk Density and greatly reduces ladder fuels. Falling activities accomplish pruning of dead branches, greatly increasing Crown Base Height. Retention of a thinned overstory creates a shaded fuel break where direct solar insolation is reduced, thereby lowering temperatures, increasing relative humidity and reducing wind-speed. Understory vegetation in shaded areas converts to more herbaceous and deciduous species, and grass or coniferous understories are diminished. Thinned stands are more resilient than un-thinned stands. Shaded fuel breaks support timber production as residual overstory trees respond well to the thinning.
Clearcutting reduces total fuel load, but generally converts the stand to a grass-dominated forest floor with significant surface fuel loading retained. This yields a fast-burning fuel complex for several decades. However, clearcutting allows for regeneration of aspen and birch, which are more fire resistant than Douglas-fir, lodgepole pine and spruce. Clearcutting within the AOI should be restricted to: salvage situations; and to stands with Head Fire Intensity >10,000 kW/m in Zone 5.
Species selection, stand density, and intermediate entries are silvicultural matters, influenced by the Forest Planning and Practices Regulation, which are critical to fire management success within

Williams Lake & Area Community Wildfire Protection Plan – October 21, 2019
56
the Area of Interest. Guidance from the Chief Forester27 describes the relationship between reforestation and fire management, and “strongly recommends” the collaborative development of Fire Management Stocking Standards.
Recommendation 19. Operating licensees, FLNRORD and BCWS should delegate the Silviculture Subcommittee of the TSA Committee to develop model stocking standards for fire management, including for intermediate cutting and for clearcutting, which should be amended into Forest Stewardship Plans and Woodlot Plans within the Area of Interest.
Timber Harvesting/Mechanical Fuel Management Treatments
Figure 8 depicts the phases of fuel treatment in one block on the Williams Lake Community Forest. In the majority of the Area of Interest, commercial harvesting is a necessary component of fuel treatment. Harvesting is an important step to improve treatment efficacy, improve forest resilience, and deliver timber to local mills. Treatment planning, layout, contract administration and supervision can be supported by the timber value realized.
Commercial thinning from below is a viable approach for fuel treatment, and will form the backbone of fuel management treatments in the Area of Interest. Harvest methods are not yet well developed, but we are collectively gaining experience. Treatments up to this time have relied primarily on single-grip harvester/forwarder combination, but there is a need to investigate other approaches such as small feller buncher/grapple skidder approaches.
Recommendation 20. Experience in commercial thinning and completing fuel reduction is limited, and technical training and mentoring will be important components of increasing activity rates and reducing costs. Training and extension should be an annual activity supported by external funding.
Harvesting for fuel management is significantly different from conventional commercial harvesting. The emphasis on overstory retention requires that the operations emphasize the resulting condition left behind in the forest, not necessarily the timber removed from the site. This can result in additional costs.
In order to encourage that harvesting is carried out in the Area of Interest, it is important not to burden the primary harvesting agreement-holder with additional costs to achieve fuel loading standards.
Recommendation 21. Fuel reduction costs imposed by this plan significantly increase costs of operations, and should be accomplished with either external funding in collaboration with primary harvesting, or changes to the appraisal and stumpage system. Government should not hold stumpage fixed and increase operating costs. The stumpage appraisal system should reflect changing expectations and increased costs.
27 Guidance for stocking standards for fire management. Memo (undated) signed by Acting Chief Forester D. Nicholls and ADM R. Turner. https://www.for.gov.bc.ca/hfp/silviculture/216955%20Fire%20Mgmt%20Stocking%20Standards_Signed%20Memo.pdf (accessed 2018-06-19)

Williams Lake & Area Community Wildfire Protection Plan – October 21, 2019
57
Hand Crew Fuel Treatment
Where commercial harvesting is not an option (e.g. immature, inaccessible, steep, or otherwise sensitive stands), fuel treatments can be completed without timber extraction. Treatments can be carried out by hand, with equipment or a combination of the two. These treatments require external funding for completion. Treatments can vary in cost from $2800 to > $7000 per hectare. Hand crew treatments are effectively an understory treatment where the main canopy stays in place but the suppressed and poorly formed understory conifers are removed, the crown base height is raised through pruning and surface fuels are reduced.
Hand crew treatments are less effective than harvesting treatments and linear treatments need to be wider to provide a similar level of threat reduction.
Hand crew treatments consist of five basic activities.
Danger Tree Removal: Dead and dangerous trees that will add significantly to the future surface fuel loading should be targeted for removal in advance of fuel management activities. Retention of high value wildlife trees must be considered.
Spacing or Pre-Commercial Thinning: Spacing involves the selective cutting and removal of non-commercial stems (including their branches and needles) to increase growing space for remaining trees and reduce Canopy Bulk Density28. Cutting will typically target the unhealthy, dead, and low-vigour trees, and leave healthy, vigorous crop trees. Species selection will favor aspen, birch, Douglas-fir, lodgepole pine and spruce in declining order of preference. Target inter-tree distance is:
a) Layer 1 (12.6 cm to 15 cm DBH): cut non-commercial trees (dead, poorly formed, etc.)
b) Layer 2 (7.6 cm to 12.5 cm DBH): average 3.2 m inter-tree distance (latitude 2.0 m to 3.5 m
c) Layer 3 and 4 (50 cm height to 7.5 cm DBH): average 2.5 m inter-tree distance (latitude 1.5 m to 3.2 m)
Thin from below, retaining healthy vigorous crop trees with open space above. Cut trees under the drip-line of taller trees.
Pruning involves the removal of the lower live and dead branches of coniferous tree species to separate the tree crowns from the surface fuels.
28 Canopy Bulk Density is “the mass of available canopy fuel per unit canopy volume.” Canopy Bulk Density is expressed in kg/m3. http://www.firewords.net/definitions/canopy_bulk_density.htm
Figure 8: Phases of fuel treatment and timber harvest, WL Community Forest cutblock 106. Falling and sorting was
followed by forwarding logs and biomass for delivery to purchasing mills. Timber harvest was combined with debris piling for forwarding, and eventual removal to
Atlantic Power.

Williams Lake & Area Community Wildfire Protection Plan – October 21, 2019
58
By raising the Crown Base Height (CBH)29 within the stand, it will be more difficult for a surface fire to spread upwards into the tree canopy where it will spread quickly, greatly increase the wildfire intensity and create ember showers, or spotting, into adjacent structures or Zones. a) Prune to 3 m or up to half of the green crown of each leave tree.
Surface fuel reduction involves the collection of felled, spaced and pruned material, and sometimes additional downed and dead material that will contribute to wildfire spread. Collection of the fine (small diameter) fuels is the priority as these fuels dry out quickly, ignite easily and are the main contributor to surface fire spread on most sites. Surface fuel treatments are often considered the most important component of any fuel modification activities and the most expensive. Overly aggressive surface fuel treatment can cause serious environmental impacts including erosion, introduction of noxious weeds and loss of wildlife habitat. a) In most cases, retain decayed large diameter coarse woody debris on site. b) Retain up to 40 m3/ha of logs > 15 cm diameter and up to 6 m long, randomly oriented
and not touching each other. Debris removal involves the open burning,
chipping and spreading, or removal of surface fuel from the site. A fuel treatment is not complete until the created debris is removed from the site. Open burning is almost always the least expensive option and necessary on steep sites with poor access, but is complicated by air quality issues and the Open Burning and Smoke Control Regulation. Taking the debris from the site is costly but may create a wood product for sale to the market which may recover some costs. Chipping and spreading debris on site is a viable treatment since it creates a low-flammability fuel bed.
Hand crew techniques should be employed only in Zone 2 and 3 where mechanized operations are not feasible. All prescriptions must be site specific and developed by an experienced individual.
5.1.6 Proposed Fuel Treatments
Map 8 and Table 13 present a list of proposed fuel breaks and fuel treatments encompassing 5,400 ha of crown land or public land within the AOI. Sixty-seven percent of the total proposed area is high priority as determined in Section 5.1.4. The remaining area is in Primary Fuel Breaks more than 2 km away from values. There is a substantial amount of work involved in moving ahead on the proposed treatments. There will need to be a point person and a planning table to undertake the projects necessary. In 2007 to 2012, Fraser Basin Council worked with the Cariboo Regional District, the City of Williams Lake, MFLNRORD, BCWS, forest licensees, BC Timber Sales, VFDs, T’exelc and Xat’sull and others to develop an action plan, secure funding, and manage the contract
29 Crown Base Height is “the lowest height above the ground above which there is sufficient canopy fuel to propagate fire vertically.” Crown Base Height is expressed in metres. http://www.firewords.net/definitions/canopy_base_height.htm
Figure 9: Burning debris piles after commercial thinning, UBC Alex Fraser
Research Forest.

Williams Lake & Area Community Wildfire Protection Plan – October 21, 2019
59
work to set prescriptions and implement projects. This will be a necessary step in moving into operational treatments.
Recommendation 22. Establish a Central Cariboo fuel management secretariat or working group and appoint a responsible individual to undertake the work necessary to implement this plan.
MAP 8: Fuel Treatment
CWPP boundary with updated WUI Land Status and tenure overlaps e.g. range, woodlots, wildlife habitat areas Proposed fuel treatment units (unique identifier, ha, priority (1, 2, 3…..) Previously completed treatments(labelled by year) Hectares of polygons on map

Williams Lake & Area Community Wildfire Protection Plan – October 21, 2019
60
Table 14: Fuel treatment summary table for fuel treatments shown on Map 8. Fuel Treatment Unit (FTU) and Stratum are designated as Interface Fuel Break (IFB), Interface Fuel Treatment (IFT) or Primary Fuel Break (PFB). Values and Constraints include fixed-area tenures upon which planned treatments infringe.
FTU & Stratum
Location Values & Constraints
Treatment Rationale Priority Sum of Total Area
Sum of Extreme/ High
Sum of Mod.
Sum of Low
IFB_01 Airport East (blank) Fuel Management Treatment for Infrastructure Protection
High 43.3 43.3 0.0 0.0
IFB_02 Airport South (blank) Fuel Management Treatment for Infrastructure Protection
High 52.7 52.7 0.0 0.0
IFB_03 Airport West Burnt 2017
Fuel Management Treatment with Salvage Harvest Infrastructure Protection
High 51.6 51.6 0.0 0.0
IFB_04 Chilcotin Estates W0587, MDWR Fuel Management Treatment upwind from structures
High 10.2 10.2 0.0 0.0
IFB_05 Chimney Valley Dog Ck Rd
W5087, MDWR Fuel Management Treatment upwind from structures
High 153.2 153.2 0.0 0.0
IFB_06 Chimney Valley East
MDWR Fuel Management Treatment upwind from structures
High 25.4 25.4 0.0 0.0
IFB_07 Chimney Valley Flett Rd
MDWR, W1805, W1955
Fuel Management Treatment upwind from structures
High 178.7 178.7 0.0 0.0
IFB_08 Chimney Valley SW (blank) Fuel Management Treatment upwind from structures
High 33.0 33.0 0.0 0.0
IFB_09 Dairy Fields Within City Fuel Management Treatment embedded in high structure density
High 7.0 7.0 0.0 0.0

Williams Lake & Area Community Wildfire Protection Plan – October 21, 2019
61
FTU & Stratum
Location Values & Constraints
Treatment Rationale Priority Sum of Total Area
Sum of Extreme/ High
Sum of Mod.
Sum of Low
IFB_10 Eider Drive Recreation, W1694 Fuel Management Treatment upwind from structures
High 16.0 16.0 0.0 0.0
IFB_11 Esler Canyon MDWR, V. Steep, K3A
Fuel Management Treatment - chimney feature adjacent to Shaded Fuel Break
High 51.2 51.2 0.0 0.0
IFB_12 Esler Hwy 20 MDWR Fuel Management Treatment upwind from structures
High 5.9 5.9 0.0 0.0
IFB_13 Fox Mountain West
W1694 Fuel Management Treatment upwind from structures
High 9.8 9.8 0.0 0.0
IFB_14 Ferguson Rd MDWR Fuel Management Treatment upwind from structures
High 46.3 46.3 0.0 0.0
IFB_15 Horsefly Rd Dugan Lk
(blank) Fuel Management Treatment upwind from structures
High 43.3 43.3 0.0 0.0
IFB_16 Huston Rd MDWR, W1696 Fuel Management Treatment upwind from structures
High 21.3 21.3 0.0 0.0
IFB_17 Hwy 20/Buckley MDWR Hwy 20, K3A
Fuel Management Treatment adjacent to community and upslope from Hwy 20
High 52.8 52.8 0.0 0.0
IFB_18 Kengin Rd to Horsefly Rd
IR Lands Fuel Management Treatment upwind from structures
High 76.6 76.6 0.0 0.0

Williams Lake & Area Community Wildfire Protection Plan – October 21, 2019
62
FTU & Stratum
Location Values & Constraints
Treatment Rationale Priority Sum of Total Area
Sum of Extreme/ High
Sum of Mod.
Sum of Low
IFB_19 Missioner Creek Within City, Steep
Fuel Management Treatment in a steep gully below Highway 97 and Douglas Road
High 43.9 43.9 0.0 0.0
IFB_20 Moore Mt East MDWR, K3A, Burnt 2017
Fuel Management Treatment upwind from structures
High 5.3 5.3 0.0 0.0
IFB_21 Moore Mt West MDWR, Steep, Dumping, K3A
Fuel Management Treatment upwind from structures
High 52.8 52.8 0.0 0.0
IFB_22 N Gully MDWR, K3A, Burnt 2017
Fuel Management Treatment - chimney feature adjacent to Shaded Fuel Break
High 10.2 10.2 0.0 0.0
IFB_23 Pheasant Dr W1694 Fuel Management Treatment upwind from structures
High 12.2 12.2 0.0 0.0
IFB_24 Pigeon Rd MDWR Fuel Management Treatment upwind from structures
High 54.6 54.6 0.0 0.0
IFB_24 Pigeon Rd MDWR, W1696 Fuel Management Treatment upwind from structures
High 4.9 4.9 0.0 0.0
IFB_25 Pine Valley W1694 Fuel Management Treatment upwind from structures
High 24.3 24.3 0.0 0.0
IFB_26 River Valley East Within City, Steep, Recreation
Fuel Management Treatment
High 75.2 75.2 0.0 0.0
IFB_27 S. Lakeside, Dog Ck Rd
in City, Recreation, W0587
Fuel Management Treatment upwind from structures
High 162.9 162.9 0.0 0.0
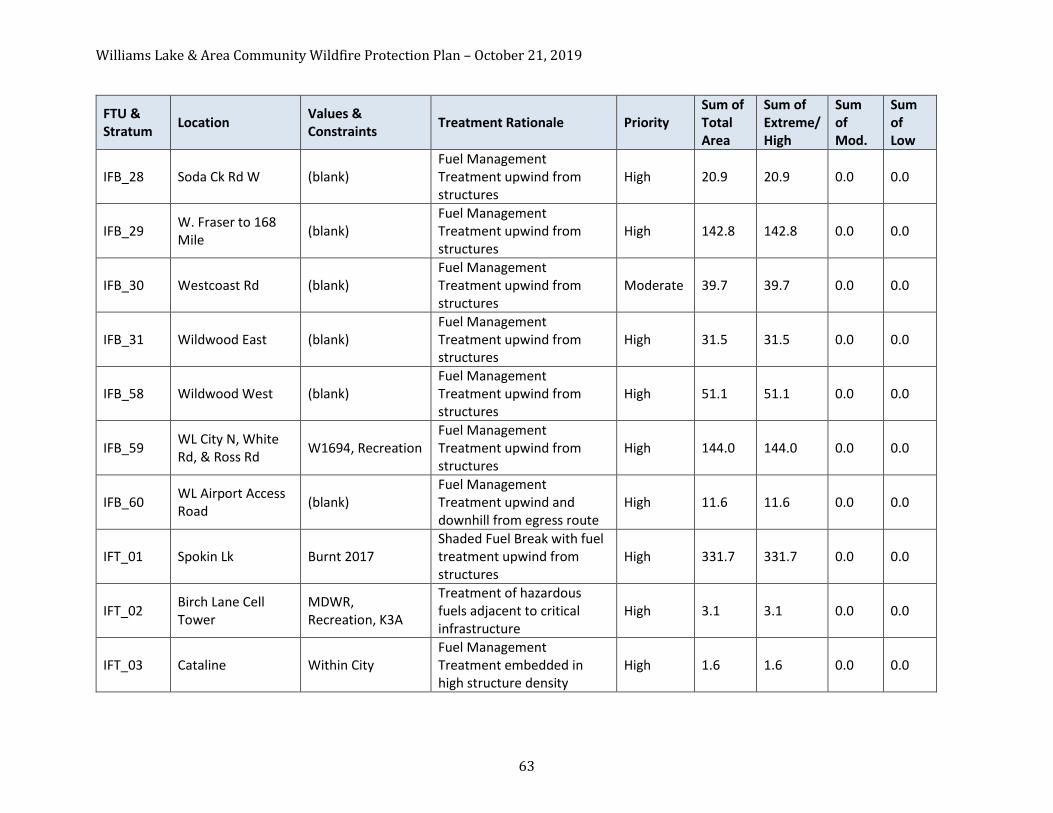
Williams Lake & Area Community Wildfire Protection Plan – October 21, 2019
63
FTU & Stratum
Location Values & Constraints
Treatment Rationale Priority Sum of Total Area
Sum of Extreme/ High
Sum of Mod.
Sum of Low
IFB_28 Soda Ck Rd W (blank) Fuel Management Treatment upwind from structures
High 20.9 20.9 0.0 0.0
IFB_29 W. Fraser to 168 Mile
(blank) Fuel Management Treatment upwind from structures
High 142.8 142.8 0.0 0.0
IFB_30 Westcoast Rd (blank) Fuel Management Treatment upwind from structures
Moderate 39.7 39.7 0.0 0.0
IFB_31 Wildwood East (blank) Fuel Management Treatment upwind from structures
High 31.5 31.5 0.0 0.0
IFB_58 Wildwood West (blank) Fuel Management Treatment upwind from structures
High 51.1 51.1 0.0 0.0
IFB_59 WL City N, White Rd, & Ross Rd
W1694, Recreation Fuel Management Treatment upwind from structures
High 144.0 144.0 0.0 0.0
IFB_60 WL Airport Access Road
(blank) Fuel Management Treatment upwind and downhill from egress route
High 11.6 11.6 0.0 0.0
IFT_01 Spokin Lk Burnt 2017 Shaded Fuel Break with fuel treatment upwind from structures
High 331.7 331.7 0.0 0.0
IFT_02 Birch Lane Cell Tower
MDWR, Recreation, K3A
Treatment of hazardous fuels adjacent to critical infrastructure
High 3.1 3.1 0.0 0.0
IFT_03 Cataline Within City Fuel Management Treatment embedded in high structure density
High 1.6 1.6 0.0 0.0

Williams Lake & Area Community Wildfire Protection Plan – October 21, 2019
64
FTU & Stratum
Location Values & Constraints
Treatment Rationale Priority Sum of Total Area
Sum of Extreme/ High
Sum of Mod.
Sum of Low
IFT_04 Dairy Fields Water tower
Within City Fuel Management Treatment embedded in high structure density
High 2.1 2.1 0.0 0.0
IFT_05 Nesika Within City Fuel Management Treatment embedded in high structure density
High 4.6 4.6 0.0 0.0
IFT_06 Pioneer Cres E (blank) Treatment of hazardous fuels upwind from structures
High 29.2 29.2 0.0 0.0
IFT_07 Pioneer Cres S (blank) Treatment of hazardous fuels upwind from structures
High 39.1 39.1 0.0 0.0
IFT_08 Pioneer Cres W (blank) Treatment of hazardous fuels upwind from structures
High 16.5 16.5 0.0 0.0
IFT_09 Potato Mt Radio Cluster
MDWR, Powerline, K3A
Treatment of hazardous fuels adjacent to critical infrastructure
High 7.5 7.5 0.0 0.0
IFT_10 Sewage Lagoons Within City, Steep Treatment of hazardous fuels adjacent to critical infrastructure
High 41.4 41.4 0.0 0.0
IFT_11 Sugarcane Cell Tower
W0597, IR 1 Treatment of hazardous fuels adjacent to critical infrastructure
High 1.7 1.7 0.0 0.0
IFT_12 Woodland-Country Club
Within City Fuel Management Treatment embedded in high structure density
High 32.0 32.0 0.0 0.0
PFB_01 BC Hydro Distribution Line E Flank
MDWR, W1579, Burnt 2017
Shaded Fuel Break High & Low
1018.6 312.5 578.5 127.6
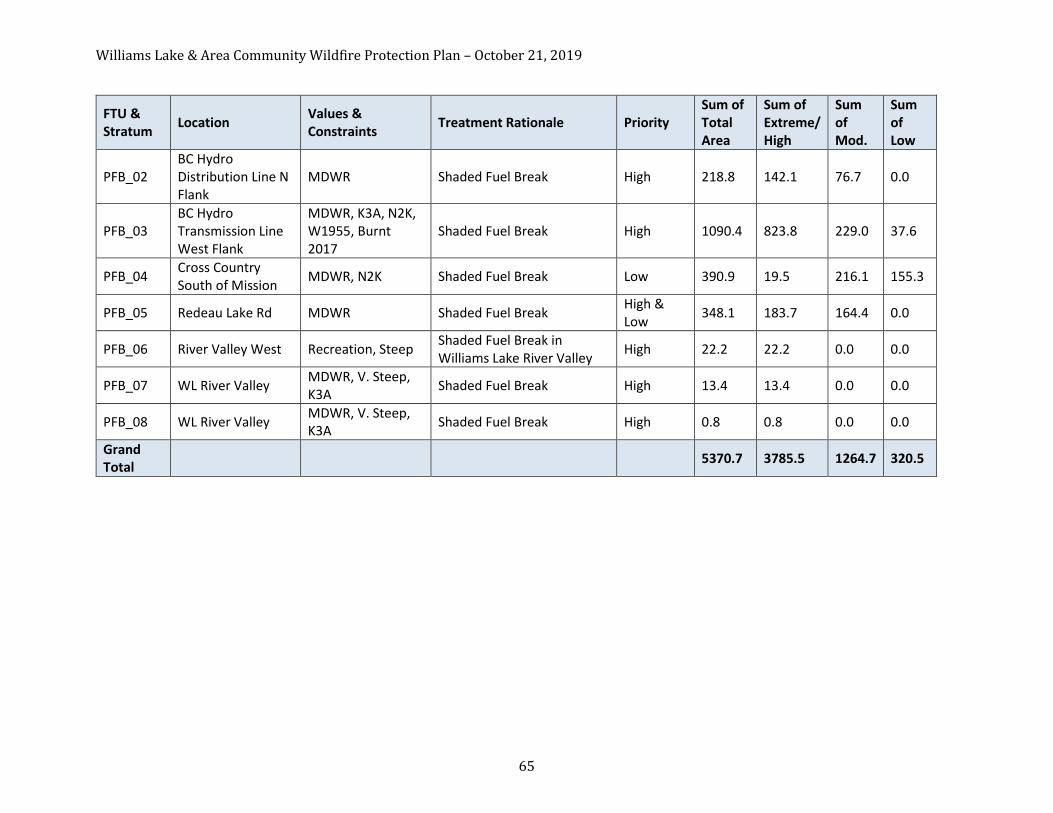
Williams Lake & Area Community Wildfire Protection Plan – October 21, 2019
65
FTU & Stratum
Location Values & Constraints
Treatment Rationale Priority Sum of Total Area
Sum of Extreme/ High
Sum of Mod.
Sum of Low
PFB_02 BC Hydro Distribution Line N Flank
MDWR Shaded Fuel Break High 218.8 142.1 76.7 0.0
PFB_03 BC Hydro Transmission Line West Flank
MDWR, K3A, N2K, W1955, Burnt 2017
Shaded Fuel Break High 1090.4 823.8 229.0 37.6
PFB_04 Cross Country South of Mission
MDWR, N2K Shaded Fuel Break Low 390.9 19.5 216.1 155.3
PFB_05 Redeau Lake Rd MDWR Shaded Fuel Break High & Low
348.1 183.7 164.4 0.0
PFB_06 River Valley West Recreation, Steep Shaded Fuel Break in Williams Lake River Valley
High 22.2 22.2 0.0 0.0
PFB_07 WL River Valley MDWR, V. Steep, K3A
Shaded Fuel Break High 13.4 13.4 0.0 0.0
PFB_08 WL River Valley MDWR, V. Steep, K3A
Shaded Fuel Break High 0.8 0.8 0.0 0.0
Grand Total
5370.7 3785.5 1264.7 320.5

Williams Lake & Area Community Wildfire Protection Plan – October 21, 2019
66
5.2 FireSmart Planning & Activities
FireSmart is “living with and managing for wildfire on our landscape.”30
FireSmart is information and a set of tools prepared by Partners In Protection, an Alberta-based non-profit organization formed in 1990 (Partners in Protection 2003).
FireSmart is ongoing work to prepare our communities and our properties for another wildfire.
FireSmart is a program that recognizes a community or neighbourhood has a plan to become fire resilient and has begun to take steps to that end.
At this time, FireSmart has been undertaken by individuals with little coordinated effort beyond the distribution of brochures and door-to-door campaigns by Fire Department volunteers and BC Wildfire Service Staff. There is much we can do to improve the participation rates and effectiveness of FireSmart treatments in our communities.
5.2.1 Lessons We Should / Have Learned
It seems now that every fire season in Western North America we see news of interface fires accompanied by evacuations and incredible loss of property; sadly lives are lost too. The social dislocation and incredible expense entailed in losing a community to wildfire is now becoming clear. Impacts extend for years afterwards, and costs go far beyond the costs of firefighting and replacing homes.
We recommend a webinar31 published by Fraser Basin Council, in which Alan Westhaver summarizes what he learned about the survival and ignition of homes in the Fort McMurray wildfire. His investigation was sponsored by the Institute for Catastrophic Loss reduction, and is fully reported in Westhaver (2017).
How WUI (Wildland Urban Interface) Fires Overwhelm Us
Westhaver (2017) cites others who have described a pattern of events that has become known as the ‘Wildland/urban interface disaster sequence.’
Conditions of severe fire danger prevail An ignition results in a wildland fire burning with extreme fire behavior Wildfire spreads towards an urban area and multiple vulnerable homes quickly ignite Structure fires spread to adjacent homes Burning clusters of homes “coalesce into a continuous urban conflagration” Urban fire-fighting response capability is rapidly overwhelmed
Disastrous losses can result, followed by rebuilding and recovery, eventually leading to vulnerability to the next wildfire. If, however, we can render our homes less vulnerable, we have an opportunity to break the rapid movement of a fire into the community, and avoid overwhelming
30 https://www.firesmartcanada.ca/what-is-firesmart
31 https://www.youtube.com/watch?v=aiJfU6QqDaw&t=3s
It is critical that we recognize that fire is part of the natural ecosystems
that we are building in, that fire has occurred there in the past, and will occur
again in the future. We can no longer wait and expect that fire departments or
wildfire agencies will simply protect our
communities. This does not mean that we can’t live in or near interface areas. If we plan our communities and build our homes with the threat of wildfire as a key consideration, we can
significantly reduce the risk that wildfire poses.
Rick Arthur, Partners in Protection, 2003

Williams Lake & Area Community Wildfire Protection Plan – October 21, 2019
67
urban fire-fighting response. The sequence of events and their consequences are depicted in Figure 10.
According to Westhaver (2017), wildfire ignitions in urban fuels can result from three sources of heat:
Radiant heat Convective flame Wind-driven embers
Radiant heat and convective flames can be controlled by ensuring there is adequate separation of fuels from structures. Wind-driven embers, however, can travel long distances in the air-column, and when they land on flammable materials they ignite urban fuels (Figure 11).
As a result, a wildfire front approaches an urban setting as numerous growing spot-fires. When the main fire front gets close enough to the city, spot fires begin to break out in structures. Fire then transfers from structure to structure as vulnerabilities become pathways to new urban fuels.
Depriving Wildland Fires of Urban Fuel
Our homes can withstand a wildfire if we carry out some simple tasks to deprive a wildfire of urban fuels, by:
Reducing the fuel available on your property by thinning and pruning your trees and clearing away surface fuels
Moving flammable materials (e.g. coniferous trees, shrubs, firewood) far enough away from homes that radiant heat and flames cannot ignite the homes.
Closing access to the building envelope and maintaining buildings so that wind-driven embers cannot deposit in or on flammable materials.
Figure 10: The Wildland/Urban Interface disaster sequence (copied from Westhaver, 2017) shows that extreme fuel
conditions and extreme weather can lead to fire behaviour that rapidly moves from the wildland to the urban fuels and
overwhelms firefighting resources. Reducing the number of highly ignitable homes (top right box) can break the disaster
sequence.

Williams Lake & Area Community Wildfire Protection Plan – October 21, 2019
68
Home Ignition Zones
Managing urban fuels can be defined in three concentric zones extending out from structures:
The structure itself and the landscaping within 10 m, where direct ignition of the structure can occur by ember deposition, flame contact or radiant heat;
The fuels between 10 and 30 m away from the structure, which could support intense crown fire and radiant heat;
The forest between 30 and 100 m away from the structure that can carry intense wildfire behaviour towards the home.
Figure 11: Wind-driven embers cause more than 50% and up to 90% of ignitions in homes destroyed by wildfire. Screen capture from YouTube webinar
(https://www.youtube.com/watch?v=aiJfU6QqDaw&t=3s) credit Alan Westhaver.

Williams Lake & Area Community Wildfire Protection Plan – October 21, 2019
69
Celebrate Success: Sugar Cane FireSmart 30-100 m
On July 7, 2017, Sugar Cane was evacuated as the 150 Mile fire approached from the north. Because most of the forest that was closer than 100 m from structures had been treated, only one house and several outbuildings were lost. Fuel treatment within the community reduced fire intensity and improved fire suppression outcomes.
This was a testament to a good plan that was well executed. In 2009, the T’exelcmc accessed funding from Natural Resources Canada to set prescriptions and carry out fuel management treatments within 100 m of structures. Band members cut, piled and burned surface fuels and ladder fuels around houses.
Fuel treatment meant that the fire intensity was reduced close to houses, and fire suppression was safer and more effective. This is a true success story!
Treated
Treated and Unburned Treated and Burned
Treated and Burned (Low Intensity)
Untreated and Burned (High Intensity)

Williams Lake & Area Community Wildfire Protection Plan – October 21, 2019
70
5.2.2 FireSmart Goals & Objectives
The FireSmart manual (FireSmart Protecting Your Community from Wildfire) provides detailed guidance about the goals and objectives of FireSmart.
The general goal of FireSmart is to encourage private land holders to adopt and conduct FireSmart practices to reduce the fuel hazard and implement other measures to minimize damage to assets on their property from wildfire:
1. Implement measures to structures and assets that reduce the probability of ignition and loss.
2. Treat fuels adjacent and nearby to structures to reduce the probability of ignition from radiant heat, direct flame contact, and/or ember transport.
3. Reduce the potential for an active crown fire to move through private land.
4. Reduce the potential for ember transport through private land and structures.
5. Create landscape conditions around properties where fire suppression efforts can be effective and safe for responders and resources.
Research has shown that a value that has been treated in accordance with FireSmart principles has a much larger chance of survival in a wildfire situation (e.g. Westhaver (2017) and Partners in Protection (2003)). Treatment of adjacent fuels further enhances survival probability - “Work from the value out to the wildfire threat.”
5.2.3 Developing Momentum for FireSmart
Local Governments
Local Government can support or foster FireSmart activities to enhance current levels of implementation and increasing adoption. There are many different ways that members of the community and stakeholders can provide options to mitigate the risk (FireSmart, 2003).
1. Elected officials approve bylaws that promote FireSmart principles related to infrastructure and safety.
2. Municipal planners design green belt and other open space areas in strategic locations. 3. Developers design and build FireSmart buildings 4. Private land owners and residents modify fuels around their property and buildings and
follow FireSmart principles. 5. Industrial managers and businesses with interface values ensure that facilities are
constructed and maintained following FireSmart guidelines.
Table 13 below summarizes FireSmart practices and activities that could be adopted by a Community.
Table 15: FireSmart activities and opportunities for Communities.
The present Canadian approach to the
wildland/urban interface fire problem requires a
radical and sweeping strategic shift that
brings primary focus onto the root of the problem. That is…
reducing the vulnerability of homes
that are easily ignited by the inevitable showers of
wind-driven embers from wildland fires. This
can only be accomplished by
mitigating known hazard factors at residential
structures, and within ~30 metres of them.
Alan Westhaver 2017
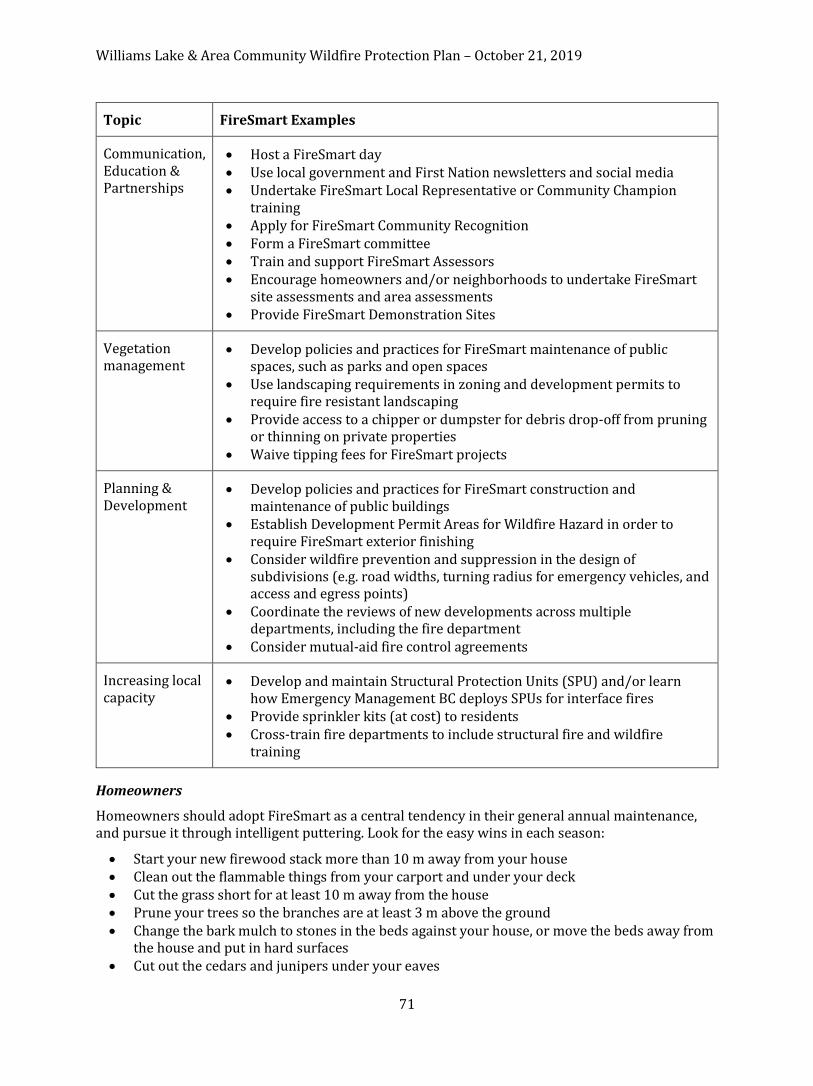
Williams Lake & Area Community Wildfire Protection Plan – October 21, 2019
71
Topic FireSmart Examples
Communication, Education & Partnerships
Host a FireSmart day Use local government and First Nation newsletters and social media Undertake FireSmart Local Representative or Community Champion
training Apply for FireSmart Community Recognition Form a FireSmart committee Train and support FireSmart Assessors Encourage homeowners and/or neighborhoods to undertake FireSmart
site assessments and area assessments Provide FireSmart Demonstration Sites
Vegetation management
Develop policies and practices for FireSmart maintenance of public spaces, such as parks and open spaces
Use landscaping requirements in zoning and development permits to require fire resistant landscaping
Provide access to a chipper or dumpster for debris drop-off from pruning or thinning on private properties
Waive tipping fees for FireSmart projects
Planning & Development
Develop policies and practices for FireSmart construction and maintenance of public buildings
Establish Development Permit Areas for Wildfire Hazard in order to require FireSmart exterior finishing
Consider wildfire prevention and suppression in the design of subdivisions (e.g. road widths, turning radius for emergency vehicles, and access and egress points)
Coordinate the reviews of new developments across multiple departments, including the fire department
Consider mutual-aid fire control agreements
Increasing local capacity
Develop and maintain Structural Protection Units (SPU) and/or learn how Emergency Management BC deploys SPUs for interface fires
Provide sprinkler kits (at cost) to residents Cross-train fire departments to include structural fire and wildfire
training
Homeowners
Homeowners should adopt FireSmart as a central tendency in their general annual maintenance, and pursue it through intelligent puttering. Look for the easy wins in each season:
Start your new firewood stack more than 10 m away from your house Clean out the flammable things from your carport and under your deck Cut the grass short for at least 10 m away from the house Prune your trees so the branches are at least 3 m above the ground Change the bark mulch to stones in the beds against your house, or move the beds away from
the house and put in hard surfaces Cut out the cedars and junipers under your eaves

Williams Lake & Area Community Wildfire Protection Plan – October 21, 2019
72
Clean your eaves-trough and roof valleys in the spring before fire season Sweep out the nooks and crannies where wind-driven sparks could find some dead leaves Disconnect wooden fences from your house walls by putting in a metal gate Replace conifers (particularly cedar hedges) with a deciduous shrubs, particularly hedges
that could lead fire to your house Replace wooden shakes or shingles with duroid or metal roofing when it comes time Make a deal with your neighbours and friends to work together
Rural Private Land
Rural property owners should adopt FireSmart too. All the points above regarding homeowners apply equally or maybe more on rural properties. Some additional things you can do include:
Ensure your address is well marked and your driveway is visible and accessible for fire trucks and crews
Provide a fire-fighting water supply through rainwater, ground water or lake access Own and maintain basic firefighting tools – shovels, pulaskis, hand-tank pumps, even a small
pump and hose kit Thin your forest – get your firewood at home Consider if commercial thinning is an option – generally for properties larger than 10 ha (20
ac) Reduce your surface fuel by piling and burning during the fall and winter Work from the house outwards Make a deal with your neighbours and friends to work together
5.2.4 Barriers to Participation – Cost, Time, Effort
There are several significant barriers to getting your property FireSmart. You will need:
Some tools to cut and vehicles to move the woody vegetation Skills, effort and sweat to use the tools A place to take the material you generate
Accomplishing the work could be challenging for many people who don’t have the equipment, skills or energy to undertake the work. As a community we need ways to ensure those people can undertake FireSmart Activities.
Recommendation 23. Develop a labour pool of qualified contractors who can perform FireSmart activities for community members. The current United Way program is a good start.
FireSmart activities generate a lot of vegetation that needs to be disposed of effectively and inexpensively. The best option for this material is the wood waste piles at the Transfer Stations, where it can be ground and burned at the Atlantic Power generator. Tipping fees should not apply to this material generated from FireSmart activities.
Recommendation 24. Ensure tipping fees do not apply to FireSmart biomass delivered to the Waste Transfer Stations.
5.2.5 Identify Priority Areas within the Area of Interest for FireSmart
FireSmart planning and activities are a high priority in all neighbourhoods and communities in the Area of Interest. Map 4A shows that the threat rating tends to be highest in the Deep Creek to Wildwood Area, and the 150 Mile House area. Risk rating classifies neighbourhoods in the western

Williams Lake & Area Community Wildfire Protection Plan – October 21, 2019
73
part of the AOI at extreme risk. However, given that conifer forests make up the majority of fuel types and the long-range spotting potential of the forest fuels, all our properties and structures are at risk from wildfire.
Structures and neighbourhoods should be a particularly high priority for FireSmart Activities if they are:
Set up-hill from fuels, on the slope or close to the brow of the slope Close to a high-risk point source of threat (e.g. sawmill log yards, chip piles) Outside Fire Protection Areas

Williams Lake & Area Community Wildfire Protection Plan – October 21, 2019
74
Table 16 provides a list of communities or neighbourhoods where the value of FireSmart is particularly high. These areas should be a high priority for assessments and establishment of community alliances where neighbours support each other to carry out FireSmart activities. FireSmart assessments are an important first step that should be provided across the AOI by community resources or program funding.
Recommendation 25. FireSmart property assessments should be made available to communities, neighbourhoods, homeowners and businesses. Develop external funding to support qualified assessors to assess neighbourhoods and visit properties on invitation.

Williams Lake & Area Community Wildfire Protection Plan – October 21, 2019
75
Table 16: Summary of FireSmart priority neighbourhoods and communities.
Area ID Map 7B Wildfire Risk Rating Adjacent
Additional Risk Factors
FireSmart Com-munity
Y/N
FireSmart Recog-nition
Y/N
Recommended FireSmart Activities
Chimney Valley
High Outside Fire Protection Area
N N Neighbourhood and property assessment. Neighbourhood alliance.
Flett Road Extreme Outside Fire Protection Area
N N Neighbourhood and property assessment. Neighbourhood alliance.
Pablo Ck & English Rd
Extreme Outside Fire Protection Area
N N Neighbourhood and property assessment. Neighbourhood alliance.
Moore Mountain
Extreme Outside Fire Protection Area
N N Neighbourhood and property assessment. Neighbourhood alliance.
Hodgson Rd/Esler
Extreme Above Forest fuels
N N Neighbourhood and property assessment. Neighbourhood alliance.
Fox Mountain Sub-division
Extreme Above Forest fuels
N N Neighbourhood and property assessment. Neighbourhood alliance.
168 Mile Rd, Richland Dr
Extreme Near Point Source, on Slopes
N N Egress Route. Neighbourhood and property assessment. Neighbourhood alliance.
White Road Extreme Above Forest fuels
N N Egress Route. Neighbourhood and property assessment. Neighbourhood alliance.
Ross Road Extreme Above Forest fuels
N N Egress Route. Neighbourhood and property assessment. Neighbourhood alliance.
Rose Lake High Mixed perm and seasonal on forested private land
N N Egress Route. Neighbourhood and property assessment. Neighbourhood alliance.
Dog Creek Road
Extreme Above Forest Fuels
N N Neighbourhood and property assessment. Neighbourhood alliance.

Williams Lake & Area Community Wildfire Protection Plan – October 21, 2019
76
5.3 Community Engagement
The CWPP will only be successful if the community is engaged, informed and supportive of the process and the recommendations. Moving from the CWPP to implementation of specific activities requires that the community is well informed of the reasons for, and the benefits of specific mitigation activities; and that a body or bodies take responsibility to develop an action plan and deliver the activities. Community engagement has four critical components:
1. Develop a Central Cariboo FireSmart Steering Committee a. City of Williams Lake b. Cariboo Regional District c. Xat’sull, T’exelc and Esk’etemc First Nations d. Forest tenure holders (forest companies, Woodlots, Community Forest, First
Nations Woodland Licence, UBC Alex Fraser Research Forest) e. Secure resources and hire a contract manager f. Develop a FireSmart communication plan. g. Work with individual tenure holders, BC Wildfire Service, Central Cariboo Resource
District, and funding programs to implement Interface Fuel Treatments on the edge of communities
2. Education and Outreach a. Make this plan widely available online and in print through the City of Williams
Lake; the Cariboo Regional District; Volunteer Fire Departments; First Nations governments; and the public library
b. Develop FireSmart demonstration site(s) with signage and education materials where activities have been planned and undertaken to implement FireSmart principles, e.g. Scout Island Nature Centre
c. Work with the School District and students to ensure schools are FireSmart d. Ask the City of Williams Lake and the Cariboo Regional District to declare April
“FireSmart Month” and promote FireSmart activities as part of spring chores e. Organize a door-to-door campaign to deliver FireSmart brochures f. Ensure residents are aware of Interface Fuel Treatments near them g. Assemble a reading list with the public library
3. Foster the development of neighbourhood alliances and teams. a. Neighbours helping each other to carry out FireSmart activities in their
neighbourhood b. Identify champions and support them c. Provide technical support as necessary
4. Celebrate success a. Join the FireSmart Communities Program b. Recognize hard work and achievements
Williams Lake & Area Community Wildfire Protection Plan – October 21, 2019
77
5.4 Other Prevention and Mitigation Measures
Fire prevention can be achieved through communication and education initiatives, as well as through the development and implementation of policies and regulations, including operational guidelines and restrictions. Fire prevention can be addressed at the community level through various avenues. Danger class rating signs within fire protection zones, public communication, industrial work restrictions and fire bans are examples of public fire prevention measures.
Other activities and opportunities to prevent fires or mitigate fire impacts include:
Locating and designing timber harvest near communities with attention to surface fuel load reduction and fire behaviour modification (e.g. Tolko blocks at Anderson Road and above Russet Bluff)
Efforts to undertake coordinated planning in the Cariboo-Chilcotin Resource District. Salvage harvest of burned stands within the Wildland Urban Interface (assuming sufficient
management of residual slash) Delivery of biomass to Atlantic Power or Pinnacle Pellet from fuel treatments Development of wildfire stocking standards to put more deciduous vegetation on the landbase Develop a permanent road network with maintained rights-of-way at least 15 m wide.
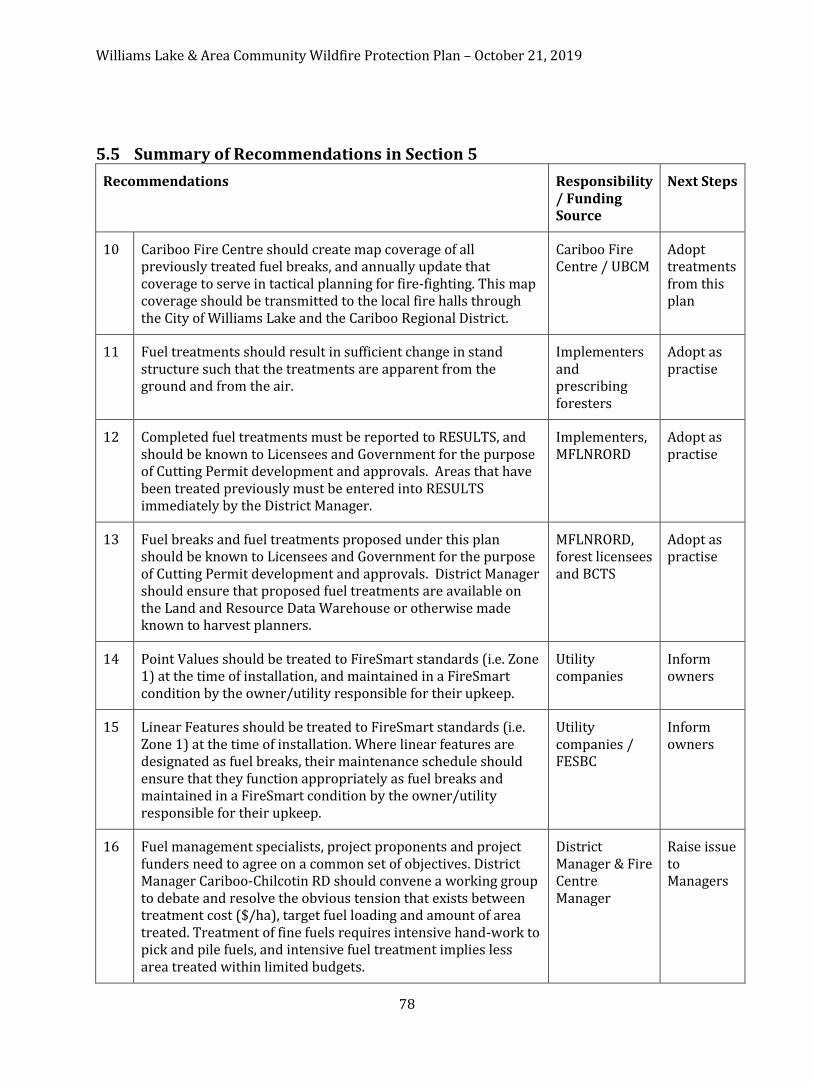
Williams Lake & Area Community Wildfire Protection Plan – October 21, 2019
78
5.5 Summary of Recommendations in Section 5
Recommendations Responsibility/ Funding Source
Next Steps
10 Cariboo Fire Centre should create map coverage of all previously treated fuel breaks, and annually update that coverage to serve in tactical planning for fire-fighting. This map coverage should be transmitted to the local fire halls through the City of Williams Lake and the Cariboo Regional District.
Cariboo Fire Centre / UBCM
Adopt treatments from this plan
11 Fuel treatments should result in sufficient change in stand structure such that the treatments are apparent from the ground and from the air.
Implementers and prescribing foresters
Adopt as practise
12 Completed fuel treatments must be reported to RESULTS, and should be known to Licensees and Government for the purpose of Cutting Permit development and approvals. Areas that have been treated previously must be entered into RESULTS immediately by the District Manager.
Implementers, MFLNRORD
Adopt as practise
13 Fuel breaks and fuel treatments proposed under this plan should be known to Licensees and Government for the purpose of Cutting Permit development and approvals. District Manager should ensure that proposed fuel treatments are available on the Land and Resource Data Warehouse or otherwise made known to harvest planners.
MFLNRORD, forest licensees and BCTS
Adopt as practise
14 Point Values should be treated to FireSmart standards (i.e. Zone 1) at the time of installation, and maintained in a FireSmart condition by the owner/utility responsible for their upkeep.
Utility companies
Inform owners
15 Linear Features should be treated to FireSmart standards (i.e. Zone 1) at the time of installation. Where linear features are designated as fuel breaks, their maintenance schedule should ensure that they function appropriately as fuel breaks and maintained in a FireSmart condition by the owner/utility responsible for their upkeep.
Utility companies / FESBC
Inform owners
16 Fuel management specialists, project proponents and project funders need to agree on a common set of objectives. District Manager Cariboo-Chilcotin RD should convene a working group to debate and resolve the obvious tension that exists between treatment cost ($/ha), target fuel loading and amount of area treated. Treatment of fine fuels requires intensive hand-work to pick and pile fuels, and intensive fuel treatment implies less area treated within limited budgets.
District Manager & Fire Centre Manager
Raise issue to Managers

Williams Lake & Area Community Wildfire Protection Plan – October 21, 2019
79
Recommendations Responsibility/ Funding Source
Next Steps
17 It may be that fuel treatment objectives cannot be achieved in a single entry, and proponents should be encouraged to achieve objectives incrementally, particularly where prescribed fire can reduce treatment costs and improve outcomes.
Fire Centre Manager
Raise issue to Manager
18 Fuel hazard assessment and abatement guidance (Province of BC, 2012) sets unrealistic targets for surface fuel loading and must be reviewed to provide effective guidance. In High and Extreme Risk Class (which dominate the AOI) the guidance from Appendix 1 suggests an un-achievable level of fuel abatement that still fails to satisfy the risk rating. Regional Director Resource Management (Cariboo Region) should send this issue up for resolution.
Cariboo Region Director
Raise issue to Director
19 Operating licensees, FLNRORD and BCWS should delegate the Silviculture Subcommittee of the TSA Committee to develop model stocking standards for fire management, including for intermediate cutting and for clearcutting, which should be amended into Forest Stewardship Plans and Woodlot Plans within the Area of Interest.
District Manager
Raise Issue to Manager
20 Experience in commercial thinning and completing fuel reduction is limited, and technical training and mentoring will be important components of increasing activity rates and reducing costs. Training and extension should be an annual activity supported by external funding.
UBC Forestry / FESBC
Raise Issue with Manager
21 Fuel reduction costs imposed by this plan significantly increase costs of operations, and should be accomplished with either external funding in collaboration with primary harvesting, or changes to the appraisal and stumpage system. Government should not hold stumpage fixed and increase operating costs. The stumpage appraisal system should reflect changing expectations and increased costs.
FESBC / MFLNRORD
Raise Issue to seek clarity
22 Establish a Central Cariboo fuel management secretariat or working group and appoint a responsible individual to undertake the work necessary to implement this plan
City/ CRD Grant in Aid
Raise Issue with CAOs
23 Develop a labour pool of qualified contractors who can perform FireSmart activities for community members. The current United Way program is a good start.
United Way Continue and expand project

Williams Lake & Area Community Wildfire Protection Plan – October 21, 2019
80
Recommendations Responsibility/ Funding Source
Next Steps
24 Ensure tipping fees do not apply to FireSmart biomass delivered to the Waste Transfer Stations.
CRD / CRI Program
Apply for funding Dec 2018
25 FireSmart property assessments should be made available to communities, neighbourhoods, homeowners and businesses. Develop external funding to support qualified assessors to assess neighbourhoods and visit properties on invitation.
City/ CRD /CRI Program
Apply for funding Dec 2018

Williams Lake & Area Community Wildfire Protection Plan – October 21, 2019
81
SECTION 6: Wildfire Response Resources
The intent of this section is to provide a high level overview of the resources that are available to local governments in the case of a wildfire.
6.1 Local Government and First Nation Firefighting Resources
The intent of this sub-section is to identify implications of wildfire that impact firefighting efforts (e.g. loss of electrical power and water pressure and supply), the contingencies that have been put in place, and any recommended measures that would help to make community firefighting more effective.
6.1.1 Fire Departments and Equipment
Table 17 Fire Departments and Equipment
Fire Department Paid staff, certifications
Volunteer staff, certifications Equipment
Williams Lake 3 full time staff, 40 on call paid staff, all with 1001 Structural NFPA and S100 at minimum
None 3 fire engines, 1 ladder truck, 1 tender, 1 hazmat trailer, 1 structural protection unit
Wildwood VFD (CRD) None 21 members, trained to exterior operations and S100
1 fire engine, 3 tenders
Miocene VFD (CRD) None 29 members, trained to exterior operations and S100
1 fire engine, 1 tender
150 Mile VFD (CRD) None 28 members, trained to exterior operations and S100. 11 members have 1001 Structural NFPA certification.
4 fire engines, 2 tenders
Horsefly VFD (independent)
None 20 members, trained to exterior firefighting, S100 and first responder
2 full size pumper engines 750 gallons each, 1 water tender 3000 gallons and pumping capabilities, 1 bush engine truck 500 gallons and pumping capabilities
Chimney/Felker Lake (independent)
None Minimum 12 members, trained to structural firefighting, S100 and level 1 first aid and transportation endorsement
1 triple gallon pumper 750 gallon, 1 4000 gallon tandem axle trailer, 1 wildland attack truck 200 gallon

Williams Lake & Area Community Wildfire Protection Plan – October 21, 2019
82
Fire Department Paid staff, certifications
Volunteer staff, certifications Equipment
Big Lake Volunteer Fire/Rescue (independent)
None 5 trained to exterior firefighting, 11 in various stages of training, all with wildland firefighting
2 engines, 1 tender, 1 rescue vehicle
T’exelc 1 staff member is crew leader for 5 pack wildland firefighter; S100
1 community member is 1001 Structural NFPA certified
1 fire engine, equipment for 5 pack wildland crew
150 Mile VFD has a mutual aid agreement with T’exelc. Wildwood VFD has a mutual aid agreement with Xat’sull.
Other than local governments and First Nations, the following wildland/forest firefighting resources exist:
BC Wildfire Service has crews at the Cariboo Fire Centre Esketemc/Alkali Resource Management has 5 contract wildfire crews Tolko has approximately 20 staff in Williams Lake/Quesnel trained to S100. Many have
significant wildland fire fighting experience including managing logistics, equipment supervision, line location, and other relevant skills.
West Fraser has 15 staff in Williams Lake trained to S100, and other staff that are members of four volunteer fire departments. West Fraser also has 23 pumps, 12 drip torches, hundreds of hoses and other firefighting equipment.
Tolko and West Fraser have access to approximately 15-20 logging and road building contractors with various equipment and expertise.
Numerous forest professionals within the consulting sector have wildland fire fighting skills, experience and certifications.
6.1.2 Water Availability for Wildfire Suppression
Water supplies in the rural areas of the AOI is not anticipated to be of concern. CRD volunteer fire departments (150 Mile, Miocene, Wildwood) all have underground tanks and dry hydrants.
T’exelc has 32 fire hydrants and 6 standpipes located on reserve #1.
City of Williams Lake has numerous fire hydrants, and water supply for the city is a deep well; water availability is not considered an issue. Generators are available at pump houses in the event of power outages. Areas that the Williams Lake Fire Department serves in the CRD jurisdiction use the water tender.
6.1.3 Access and Evacuation
Known areas of access and evacuation issues (i.e., one way in and out) are as follows:
Russet Bluff, at the end of South Lakeside Drive, in the event of an evacuation would have to drive west to Hwy 20. An alternate egress route is north and east, is a rough road for vehicles or ATVs in dry conditions, across T’exelc’s Sugarcane reserve #1. Note also there are some T’exelc community members on the South Lakeside Drive side of the reserve that would have the same egress issues
Entire South Lakeside Drive neighbourhood Fox Mountain/White Road

Williams Lake & Area Community Wildfire Protection Plan – October 21, 2019
83
Ross Road at Fox Mountain Woodland Drive within the City boundaries Borland Valley Bridge is two lane, and the decking surface is wood Williams Lake River Valley Williams Lake Airport 168 Mile Road Westridge subdivision Golf course subdivision
6.1.4. Training
Xat’sull would like to have more trained community members with at least S100 certification, and during 2018 are offering this training to their members. T’exelc has one structural firefighter, a fire truck and a small one bay fire hall, there are challenges in having community members take structural firefighting training.
Training is needed on how to properly operate structure protection units, including how to properly set one up, how to operate it without electricity (i.e., gas pump, generator, gravity feed). The Office of the Fire Commissioner may have resources to assist.
6.2 Structure Protection
The intent of this section is to provide a summary of what is available to the community for Structure Protection, and provide recommendations.
City of Williams Lake has a 16 foot structure protection unit The CRD VFDs have structure protection units that are shared regionally West Fraser has sprinklers to protect the sawmill, plywood plant, log yards and finished
product
6.3 Summary of Recommendations in Section 6.
The intent of this sub-section is to summarize all the recommendations that have been included in this section.
Recommendations Responsibility/Funding Source Next Steps
26 Maintain or expand mutual aid agreements between fire departments covering the area of interest
City / CRD / T’exelc / Xat’sull / independent volunteer fire departments
Maintain communication
27 Maintain or expand levels of training and equipment for structural and wildfire response
City / CRD / T’exelc / Xat’sull / independent volunteer fire departments
Maintain communication

Williams Lake & Area Community Wildfire Protection Plan – October 21, 2019
84
References
B.A. Blackwell and Associates Ltd. 2016. Fuel treatment opportunities for Williams Lake, Rodeo Drive, 140 Mile House, Spokin Lake and Pioneer Crescent on Likely Highway. Contract Report submitted to BCWS Cariboo Fire Centre.
Daniels, L.D., M.A. Leclerc, and W. Brookes. 2015. Fire history in the mixed Douglas-fir and lodgepole pine forests in the Cariboo. Unpublished Note. UBC Forestry.
Daniels, L.D. 2004. Climate and Fire: A Case Study of the Cariboo Forest, British Columbia. Pp. 235-246 in Taylor, L., J. Zelnik, S. Cadwallader and B. Hughes (editors). Proceedings of the Mixed Severity Fire Regimes: Ecology and Management Conference, Washington State University, WA.
Day, K. 1997. Stocking standards for uneven-aged interior Douglas-fir. Unpub. Directed Study Report. UBC Faculty of Forestry. 29 pp.
Day, J.K. 1998. Selection management of Interior Douglas-fir for mule deer winter range. MF Thesis. University of BC.
Day, K., B. Blackwell and S. Wildeman. 2010. Harvesting and thinning uidance for treatments in the Wildland-Urban Interface Areas of TSA 29. Contract Report. FIA Proj. SOTSA299093008. http://afrf-forestry.sites.olt.ubc.ca/files/2012/03/WUITreatmentBMPswAppendix.pdf
Day, K and J. McWilliams. 2013. IDF Strategy for Williams Lake and 100 Mile TSAs. http://afrf-forestry.sites.olt.ubc.ca/files/2015/10/IDFSilvicultureStrategyV8.pdf
Forsite Consultants Ltd. 2013. Williams Lake TSA Type 4 Silviculture Strategy. https://www2.gov.bc.ca/assets/gov/farming-natural-resources-and-industry/forestry/silviculture/silviculture-strategies/wlt4_silviculture_strategy_20131004.pdf
Nelson, H. K. Zielke, B. Bancroft, C. Brown, S. Cohen, R. Davis, M. Gerzon, L. Kremsater, C. Nitschke, D. Perez, B. Seely, and C. Welham. 2011. Validating impacts, exploring vulnerabilities, and developing robust adaptive strategies under the Kamloops Future Forest Strategy. FFESC File 02_Nelson Final Report. https://www2.gov.bc.ca/assets/gov/environment/natural-resource-stewardship/nrs-climate-change/applied-science/nelsonfinalreport.pdf
Partners in Protection. 2003. FireSmart: Protecting your community from wildfire. 2nd Ed. Partners in Protection, Edmonton, AB. https://www.firesmartcanada.ca/images/uploads/resources/FireSmart-Protecting-Your-Community.pdf 183 pp.
Province of B.C. 2007. Amended Order # U-5-001, U-5-002 and U-5-003 – Ungulate winter ranges Cariboo Chilcotin Land Use Plan, Shallow and Moderate Snowpack. BC Min. Env. http://www.env.gov.bc.ca/wld/documents/wha/Amendment_ShallowModerate_Feb07_Ord.pdf (Accessed 2018-04-27)
Province of B.C. 2012. A guide to fuel hazard assessment and abatement in British Columbia. Wildfire Management Branch, Min. FLNRO. https://www2.gov.bc.ca/gov/content/safety/wildfire-status/for-industry-commercial-operators/hazard-assessment-abatement (Accessed 2018-06-18)
Westhaver, A. 2017. Why some homes survived: learning from the Fort McMurray wildland/urban interface fire disaster. ICLR Res. Paper Series #56. Institute for Catastrophic Loss Reduction. Toronto. 81 pp. http://www.iclr.org/wp-content/uploads/PDFS/why-some-homes-survived-learning-from-the-fort-mcmurray-wildland-urban-interface-fire-disaster.pdf
Williams, J. 2013. Exploring the onset of high-impact mega-fires through a forest land management
prism. J. For. Ecol. And Management 294(2013):4-10.

Williams Lake & Area Community Wildfire Protection Plan – October 21, 2019
85
Appendix One: Maps
MAP 1: Area of Interest (AOI) • Land ownership and administrative boundaries • Relevant tenures such as range, woodlots, community forests and/or Tree Farm License areas • Firefighting jurisdictions • Proposed and completed fuel treatments • Other, such as FireSmart areas or Wildfire Hazard Development Permit Areas MAP 2: Values at Risk • CWPP boundary with updated WUI • Updated structure density and Wildland Urban Interface (WUI) • Values at risk (critical infrastructure) • High environmental and cultural values • Hazardous values at risk MAP 3: Fire Regime, Ecology and Climate Change • CWPP boundary with updated WUI • NDT TYPE • Forest Health (e.g. MPB) • Major harvesting patterns, completed fuel treatments or ecological projects • Historical Fire Perimeters • Climate Change scenarios relevant to section (Future BEC zones) MAPs 4: Provincial Strategic Threat Analysis • Threat rating (Map 4A) • Spotting impact (Map 4B) • Head fire intensity (Map 4C) • Historical fire density (Map 4D)
MAP 5: Fire History • CWPP boundary with updated WUI • PSTA human and lightening fire starts with fire perimeters • Include local fire incident history if relevant • Other relevant info such as WUI, structures, or VAR MAP 6: Updated Fuel Type • CWPP boundary with updated WUI • Corrected fuel type with hectares • Verification fuel type plot locations and labels • WUI Zones • Field verified overview of fuel typing plot locations and hectares of each fuel type MAP 7A: Modifications to Local Fuel Hazard MAP 7B: Local Fire Risk • CWPP boundary with updated WUI • Risk polygons labelled by Extreme, High, Moderate, and Low • Hectares of polygons on map • WUI Zones • Assessment plot locations / labelled • Critical infrastructure and other relevant VAR MAP 8: Fuel Treatment • CWPP boundary with updated WUI • Land status and tenure overlaps (e.g. range, woodlots, area-based WHAs) • Proposed fuel treatment units (unique identifier, ha, priority (1, 2, 3…) • Previously completed treatments (labelled by year) • Hectares of polygons on map • Assessment plot locations / labelled
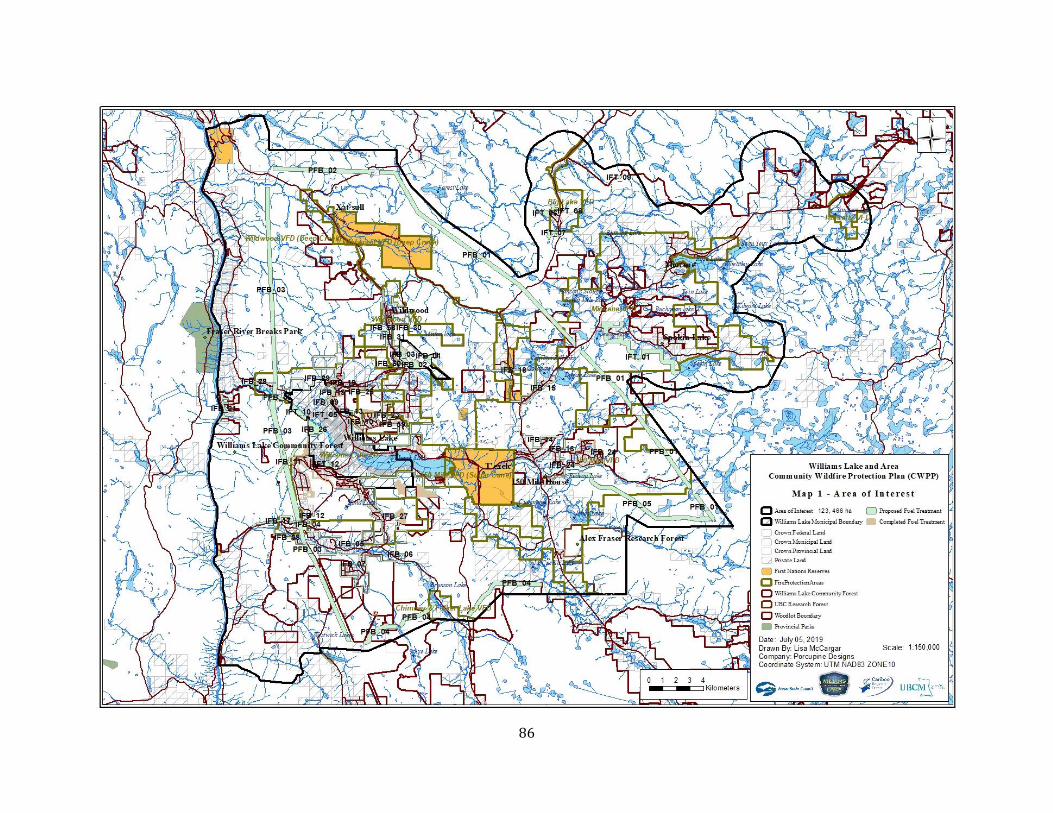
86

Williams Lake & Area Community Wildfire Protection Plan – October 21, 2019
87

Williams Lake & Area Community Wildfire Protection Plan – October 21, 2019
88

Williams Lake & Area Community Wildfire Protection Plan – October 21, 2019
89

Williams Lake & Area Community Wildfire Protection Plan – October 21, 2019
90

Williams Lake & Area Community Wildfire Protection Plan – October 21, 2019
91

Williams Lake & Area Community Wildfire Protection Plan – October 21, 2019
92

Williams Lake & Area Community Wildfire Protection Plan – October 21, 2019
93

Williams Lake & Area Community Wildfire Protection Plan – October 21, 2019
94

Williams Lake & Area Community Wildfire Protection Plan – October 21, 2019
95

Williams Lake & Area Community Wildfire Protection Plan – October 21, 2019
96

Williams Lake & Area Community Wildfire Protection Plan – October 21, 2019
97

Williams Lake & Area Community Wildfire Protection Plan – October 21, 2019
98

99
Appendix Two: Wildfire Threat Assessment – FBP Fuel Type Change Rationale

Williams Lake & Area Community Wildfire Protection Plan – October 21, 2019
100
Appendix Three: Wildfire Threat Assessment Worksheets and Photos