Public health in crisis-affected populations - Humanitarian ...
64
Commissioned and published by the Humanitarian Practice Network at ODI Number 61 December 2007 Network Paper About HPN The Humanitarian Practice Network at the Overseas Development Institute is an independent forum where field workers, managers and policymakers in the humanitarian sector share information, analysis and experience. The views and opinions expressed in HPN’s publications do not necessarily state or reflect those of the Humanitarian Policy Group or the Overseas Development Institute. Overseas Development Institute 111 Westminster Bridge Road London SE1 7JD United Kingdom Tel. +44 (0) 20 7922 0300 Fax. +44 (0) 20 7922 0399 HPN e-mail: [email protected] HPN website: www.odihpn.org Britain’s leading independent think-tank on international development and humanitarian issues HPN Humanitarian Practice Network Managed by Humanitarian Policy Group Francesco Checchi, Michelle Gayer, Rebecca Freeman Grais and Edward J. Mills Public health in crisis- affected populations A practical guide for decision-makers In brief • Never before has it been clearer what interventions must be implemented to mitigate the adverse health consequences of wars and natural disasters, and what standards those interventions must strive to achieve; similarly, the range of interventions at our disposal has never been greater. • Despite these advances, reviews of the global relief system suggest an ongoing failure to deliver. They also highlight the dire lack of credible data to help us understand just how much populations in crisis suffer, and to what extent relief operations are able to relieve that suffering. • Political considerations often obstruct the delivery of appropriate relief. The premise of this paper, however, is that lack of knowledge is also an important limiting factor. This paper argues the need for advocacy for timely and appropriate relief, grounded in clearly outlined, scientifically sound reasoning, focusing discussion on substantive matters and reducing the scope for political manipulation. As such, the paper aims to enable readers to better face up to the political and bureaucratic aspects of the global relief system.
-
Upload
khangminh22 -
Category
Documents
-
view
2 -
download
0
Transcript of Public health in crisis-affected populations - Humanitarian ...

Commissioned and published by the Humanitarian Practice Network at ODI
Number 61December 2007
Network Paper
About HPNThe Humanitarian Practice Network at theOverseas Development Institute is an independent forum where field workers, managers and policymakers in the humanitariansector share information, analysis and experience.The views and opinions expressed in HPN’s publications do not necessarily state or reflectthose of the Humanitarian Policy Group or theOverseas Development Institute.
Overseas Development Institute111 Westminster Bridge RoadLondon SE1 7JDUnited Kingdom
Tel. +44 (0) 20 7922 0300Fax. +44 (0) 20 7922 0399
HPN e-mail: [email protected] website: www.odihpn.org
Britain’s leading independent think-tank on international developmentand humanitarian issues
HPNHumanitarian Practice Network
Managed by
Humanitarian Policy Group
Francesco Checchi, Michelle Gayer,Rebecca Freeman Grais and Edward J. Mills
Public health in crisis-affected populationsA practical guide for decision-makers
In brief• Never before has it been clearer what interventions must be implemented to mitigate the adverse health consequences of wars and natural disasters, and what standards those interventions must strive toachieve; similarly, the range of interventions at our disposal has never been greater.
• Despite these advances, reviews of the global relief system suggest an ongoing failure to deliver. They also highlight the dire lack of credible data to help us understand just how much populations in crisis suffer, and to what extent relief operations are able to relieve that suffering.
• Political considerations often obstruct the delivery of appropriate relief. The premise of this paper, however, is that lack of knowledge is also an important limiting factor. This paperargues the need for advocacy for timely andappropriate relief, grounded in clearly outlined,scientifically sound reasoning, focusing discussion on substantive matters and reducingthe scope for political manipulation. As such, the paper aims to enable readers to better faceup to the political and bureaucratic aspects ofthe global relief system.

Humanitarian Practice Network (HPN)
Overseas Development Institute111 Westminster Bridge RoadLondon, SE1 7JDUnited Kingdom
Tel: +44 (0)20 7922 0331/74Fax: +44 (0)20 7922 0399 Email: [email protected]: www.odihpn.org
Printed and bound in the UK
ISBN: 978 0 85003 855 2
Price per copy: £4.00 (excluding postage and packing).© Overseas Development Institute, London, 2007.
Photocopies of all or part of this publication may be made providing that the source is acknowledged. Requestsfor the commercial reproduction of HPN material should be directed to the ODI as copyright holders. The NetworkCoordinator would appreciate receiving details of the use of any of this material in training, research or programme design, implementation or evaluation.
About the authors
Francesco Checchi is an epidemiologist at the London School of Hygiene and Tropical Medicine, where he is anhonorary lecturer and part-time PhD student. He has worked for Médecins Sans Frontières (MSF), Epicentre andthe World Health Organisation (WHO) in various conflict-affected countries. Most of his work has been on Africansleeping sickness, malaria, health survey methods and epidemiology in crisis-affected populations.
Michelle Gayer is a medical officer at the WHO in Geneva, where she develops standards, guidelines and tools,conducts training and provides field assistance on communicable disease surveillance and control in humanitari-an emergencies. She has provided technical support to national authorities, UN agencies, NGOs and internationalorganisations in numerous conflict and post-conflict settings and after natural disasters. She also serves onWHO’s Ethics Review Committee. Previously she worked in sub-Saharan Africa as a clinician and on various publichealth projects with MSF.
Rebecca Freeman Grais is an epidemiologist at Epicentre in Paris. Her background is in mathematical epidemiolo-gy and its use in informing optimal strategies for disease control. Another of her main research interests is adapt-ing and improving existing methodologies used to conduct field epidemiological studies. She has done researchon various topics including measles, avian influenza, malnutrition and rapid population estimation.
Edward Mills is a clinical epidemiologist with additional training in international human rights law. He has broadinterests in HIV/AIDS, the systematic review of evidence and health and human rights. He currently directs theCentre for International Health and Human Rights Studies at Simon Fraser University, and is a scientist at theBritish Columbia Centre for Excellence in HIV/AIDS.
Acknowledgements
The authors would like to thank the Department of Foreign Affairs and International Trade (DFAIT), government ofCanada, and particularly Valerie Percival, for having generously supported the writing of this paper. We are alsograteful to the Humanitarian Practice Network, particularly Rachel Atkinson, for advice and help with this publica-tion, and Matthew Foley, for editorial work.
The following people contributed to the development of the paper during a meeting in Ottawa, Canada, on 8March 2007: Aranka Anema (British Columbia Centre for Excellence in HIV/AIDS), Chris Beyrer (Johns HopkinsUniversity Bloomberg School of Public Health), Michael Bonser (DFAIT), Rob Chase (University of Manitoba),Stephanie Chong (University of Toronto), Curtis Cooper (Ottawa Hospital), Richard Garfield (Columbia University),P. Gregg Greenough (Harvard Humanitarian Initiative), Colleen Hardy (International Rescue Committee), AndrewMack (Human Security Centre, University of British Columbia), David Meddings (World Health Organization),Alexandra Mihailovic (University of Toronto), James Orbinski (University of Toronto), Stephen Salewicz (CanadianInternational Development Agency), Michael Schull (University of Toronto), Sonal Singh (Wake Forest University),Sumeet Sodhi (Dignitas International), Annie Sparrow (Catholic Relief Services), Paul Spiegel (United Nations HighCommissioner for Refugees), Christine Tapp (Simon Fraser University), Brad Woodruff (US Centers for DiseaseControl and Prevention). Many thanks also to Jacqui Tong for her helpful suggestions.
i
Contents
Chapter 1 Introduction 1
The importance of knowledge in humanitarianism 1
Scope of this paper 1
Chapter 2 A crash course in epidemiology 3
A definition of epidemiology 3
Epidemiological properties of infectious diseases 3
Incubation period, duration of infection, and serial interval 5
Epidemiological properties of non-infectious diseases 13
Notions of risk 14
Causality and confounding 15
Chapter 3 The effects of crises on health 17
A simplified general model of disease in the population 17
Excess morbidity and mortality 18
Notes on specific risk factors 20
Notes on some important direct causes of death 26
HIV, measles and malnutrition: killers by proxy 27
Epidemics versus endemic diseases 29
Mental illness: overlooked but omnipresent 33
Chapter 4 Determining priority health problems and interventions 35
Which health problems? 35
Which interventions? 37
Chapter 5 Maximising impact 41
A framework for interventions 41
Coverage versus effectiveness 44
Monitoring and evaluation 45
Chapter 6 Conclusion 49
Review of key principles 49
Ten common fallacies 49
Glossary 51
NP 61crc 15/5/08 10:42 am Page i

Public health in crisis-affected populations
ii
NP 61crc 15/5/08 10:42 am Page ii

‘The endeavour to understand is the first and only basis
of virtue.’
Baruch de Spinoza, Ethics
The importance of knowledge in humanitarianism
A considerable proportion of humanity is currently living incrisis conditions. As of end-2006, 8 million were refugeesand 25m internally displaced; about one billion lived in 40‘fragile states’. Between 2000 and 2005, a yearly averageof 398 country-level natural disasters was reported,affecting almost 300m people annually.
Never before has it been clearer what interventions must beimplemented to mitigate the adverse health consequencesof wars and natural disasters, and what standards thoseinterventions must strive to achieve; similarly, the range ofinterventions at our disposal has never been greater. Overthe last decade, collective knowledge on the public healthaspects of emergencies has resulted in seminalpublications, including guidelines such as Médecins SansFrontières’ Refugee Health, the World Health Organisation’sCommunicable Disease Control in Emergencies manual, andthe Sphere Guidelines.1 Despite these advances, recentreviews of the global relief system suggest an ongoingfailure to deliver.2 They also highlight the dire lack ofcredible data to help us understand just how muchpopulations in crisis suffer, and to what extent reliefoperations are able to relieve that suffering.
Political considerations often obstruct the delivery ofappropriate relief. Our premise for this paper, however, isthat lack of knowledge is also an important limiting factor.Field practice may often be unsatisfactory because of‘muddling through’, taking the safest decision given theknowledge available, but failing to consider hiddenaspects of the problem from an overarching perspective,using a combination of background knowledge,quantitative analysis, logic and common sense.
We believe in advocacy for timely and appropriate relief,grounded in clearly outlined, scientifically soundreasoning, thus focusing discussion on substantivematters and reducing the scope for political manipulation.In this respect, we hope that this paper will enable readersto better face up to the political and bureaucratic aspectsof the global relief system.
Scope of this paper
This paper attempts to present a bird’s eye view of therisks to health inherent in crises, and the potential forimpact of health interventions, using the language ofepidemiology.
Which crises?
We restrict ourselves to the following five crisis conditions,brought about by war and/or natural disasters:
• Condition 1: Progressive loss of livelihoods anddeterioration of essential services, with entrapment inone’s community due to the ever-present risk ofviolence. Examples of this condition could be theeastern Democratic Republic of Congo (DRC), easternChad, regions of Nepal affected by the Maoistinsurgency, western Côte d’Ivoire and Iraq.
• Condition 2: Mass displacement into regimented orcamp-like settlements of large population size. This isthe classic relief scenario (think of IDP camps in Darfurand northern Uganda, or refugee camps on theThai–Burma border).
• Condition 3: Displacement into neighbouring hostcommunities. Examples include Lebanese IDPs duringthe 2006 Israel–Hezbollah war, and Sri Lankansdisplaced by recent fighting. This displacement may bedirectly due to violence, but could also occur indirectlydue to loss of livelihoods and social pressures: Burmais a prime example of this.
• Condition 4: Sudden loss of livelihoods and rapidenvironmental change (including flooding) due to anatural disaster. Major examples are the Indian Oceantsunami of 2004 and the Pakistan earthquake of 2005.
• Condition 5: Food crises. Examples include Niger in2005–2006 and the famine in the Somali region ofEthiopia in 2000.
The above conditions are not exclusive. Combinations arecommon: the term complex emergency indicates preciselythis. For example, during the 1990s, Bahr el Ghazal, southernSudan, simultaneously experienced militia attacks, campdisplacement, flooding and famine. The acute, post-acuteand post-emergency or recovery phases of a crisis aredifficult to delineate, especially in protracted cases. Here weconsider simply that, as long as people are exposed to anincreased risk of disease and death because of any of theabove conditions, a crisis is occurring, and fits within ourscope.
The paper does not cover the following topics:
• Mass-casualty incidents and their management, e.g.following earthquakes, landslides and terrorist attacks.
• Biological, chemical and nuclear attacks or accidents.• Consequences of armed conflict on combatants
themselves (i.e. military medicine).
Which health issues?
Figure 1 presents a simple framework of the possiblehealth effects of crises. Deaths and injuries sustained inbattle or during a natural disaster are conventionally
1
Chapter 1
Introduction
NP 61crc 15/5/08 10:42 am Page 1

Public health in crisis-affected populations
referred to as direct health effects. Deaths and diseaseresulting from an increase in the risk of infectious and non-infectious diseases (including unintentional injuries)attributable to the presence of a crisis are referred to asindirect effects. With the exception of natural disasters, theindirect effects of crises on population health usually farexceed direct ones.3
Although we will discuss injury and non-infectious diseases,we focus on infectious diseases, for two reasons. First, thevast majority of preventable indirect deaths are related toinfectious rather than non-infectious diseases. Second,crises increase the risk of infectious diseases by directlyinterfering with their transmission, progression and lethality.In short, infectious diseases present more challenges andopportunities for control than non-infectious ones. Oneextremely important exception to this is mental illness, amuch-overlooked aspect of health relief operations, whichwe will briefly discuss. Sexual violence is another extremelyimportant health issue, and one which clearly interacts withboth physical and mental illness. However, we feel that wecannot do justice to this subject here.4
This paper discusses leading causes of morbidity (disease)and mortality (death) in crises, but stops short of chartingevery possible pathway by which crises worsen health.Furthermore, we focus on ‘proximate’ and ‘intermediate’risk factors (defined later), rather than general underlyingissues such as insecurity, ethnic strife, poverty and genderrelations, which are usually beyond the scope of relief.
Intended audience
This paper is meant for a non-technical audience withoutprior training in health or field experience. Whilerecognising the complex interplay of factors that, on aglobal level, results in greater or lesser interest in andallocation of resources for specific crises, in this paper wesituate ourselves at the level of field interventions.Accordingly, the primary target audience consists ofprofessionals from non-governmental organisations,United Nations agencies, donor agencies and hostgovernments involved either in policy-setting, coordinationand financing relief operations at the crisis-wide level, or infield implementation of specific projects. Senior-levelprogramme officers at international level, advocacygroups, students and journalists might also find the papera useful resource.
Structure
After presenting key epidemiological concepts usedthroughout the paper (Chapter 2), we explore aframework linking types of crisis conditions to certain riskfactors, and to a consequent increase in risk of trans-mission of or exposure to disease, disease progressionand death (Chapter 3). In Chapter 4 we discuss theprioritisation of health problems and interventions.Chapter 5 illustrates the main determinants of anintervention’s impact, and discusses monitoring andevaluation. We conclude (Chapter 6) with a summary ofkey points and a reminder of typical epidemiologicalfallacies in relief operations.
2
Figure 1
Schematic of direct and indirect health consequences of crises
Direct health effects
Intentional injuries by combatants
Injuries due to mechanical force of nature during natural disasters
Indirect health effects
Infectious diseases
Non-infectious diseases
Unintentional injuries
Sexual and
gender-based
violence
Rape and otherforms of sexualviolence
Domestic violence
Child abuse
Mental illness
Post-traumaticstress disorder
Depression
NP 61crc 15/5/08 10:42 am Page 2
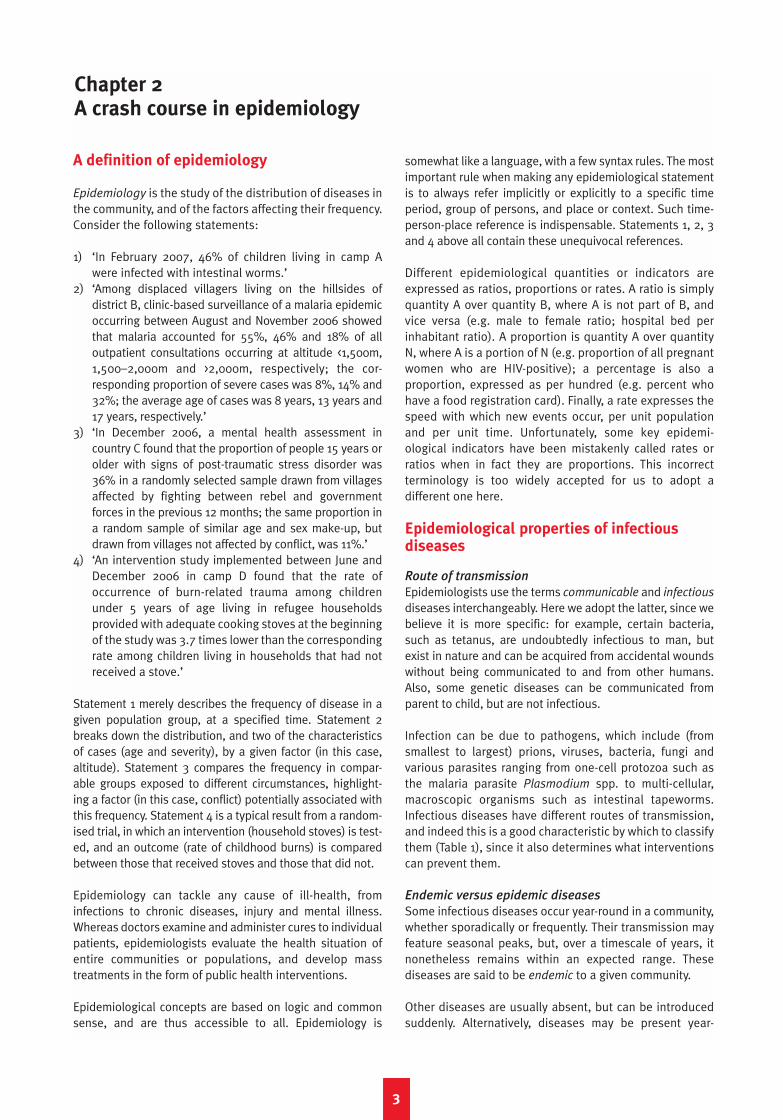
A definition of epidemiology
Epidemiology is the study of the distribution of diseases inthe community, and of the factors affecting their frequency.Consider the following statements:
1) ‘In February 2007, 46% of children living in camp Awere infected with intestinal worms.’
2) ‘Among displaced villagers living on the hillsides ofdistrict B, clinic-based surveillance of a malaria epidemicoccurring between August and November 2006 showedthat malaria accounted for 55%, 46% and 18% of alloutpatient consultations occurring at altitude <1,500m,1,500–2,000m and >2,000m, respectively; the cor-responding proportion of severe cases was 8%, 14% and32%; the average age of cases was 8 years, 13 years and17 years, respectively.’
3) ‘In December 2006, a mental health assessment incountry C found that the proportion of people 15 years orolder with signs of post-traumatic stress disorder was36% in a randomly selected sample drawn from villagesaffected by fighting between rebel and governmentforces in the previous 12 months; the same proportion ina random sample of similar age and sex make-up, butdrawn from villages not affected by conflict, was 11%.’
4) ‘An intervention study implemented between June andDecember 2006 in camp D found that the rate ofoccurrence of burn-related trauma among childrenunder 5 years of age living in refugee householdsprovided with adequate cooking stoves at the beginningof the study was 3.7 times lower than the correspondingrate among children living in households that had notreceived a stove.’
Statement 1 merely describes the frequency of disease in agiven population group, at a specified time. Statement 2breaks down the distribution, and two of the characteristicsof cases (age and severity), by a given factor (in this case,altitude). Statement 3 compares the frequency in compar-able groups exposed to different circumstances, highlight-ing a factor (in this case, conflict) potentially associated withthis frequency. Statement 4 is a typical result from a random-ised trial, in which an intervention (household stoves) is test-ed, and an outcome (rate of childhood burns) is comparedbetween those that received stoves and those that did not.
Epidemiology can tackle any cause of ill-health, frominfections to chronic diseases, injury and mental illness.Whereas doctors examine and administer cures to individualpatients, epidemiologists evaluate the health situation ofentire communities or populations, and develop masstreatments in the form of public health interventions.
Epidemiological concepts are based on logic and commonsense, and are thus accessible to all. Epidemiology is
somewhat like a language, with a few syntax rules. The mostimportant rule when making any epidemiological statementis to always refer implicitly or explicitly to a specific timeperiod, group of persons, and place or context. Such time-person-place reference is indispensable. Statements 1, 2, 3and 4 above all contain these unequivocal references.
Different epidemiological quantities or indicators areexpressed as ratios, proportions or rates. A ratio is simplyquantity A over quantity B, where A is not part of B, andvice versa (e.g. male to female ratio; hospital bed perinhabitant ratio). A proportion is quantity A over quantityN, where A is a portion of N (e.g. proportion of all pregnantwomen who are HIV-positive); a percentage is also aproportion, expressed as per hundred (e.g. percent whohave a food registration card). Finally, a rate expresses thespeed with which new events occur, per unit populationand per unit time. Unfortunately, some key epidemi-ological indicators have been mistakenly called rates orratios when in fact they are proportions. This incorrectterminology is too widely accepted for us to adopt adifferent one here.
Epidemiological properties of infectious diseases
Route of transmission
Epidemiologists use the terms communicable and infectious
diseases interchangeably. Here we adopt the latter, since webelieve it is more specific: for example, certain bacteria,such as tetanus, are undoubtedly infectious to man, butexist in nature and can be acquired from accidental woundswithout being communicated to and from other humans.Also, some genetic diseases can be communicated fromparent to child, but are not infectious.
Infection can be due to pathogens, which include (fromsmallest to largest) prions, viruses, bacteria, fungi andvarious parasites ranging from one-cell protozoa such asthe malaria parasite Plasmodium spp. to multi-cellular,macroscopic organisms such as intestinal tapeworms.Infectious diseases have different routes of transmission,and indeed this is a good characteristic by which to classifythem (Table 1), since it also determines what interventionscan prevent them.
Endemic versus epidemic diseases
Some infectious diseases occur year-round in a community,whether sporadically or frequently. Their transmission mayfeature seasonal peaks, but, over a timescale of years, itnonetheless remains within an expected range. Thesediseases are said to be endemic to a given community.
Other diseases are usually absent, but can be introducedsuddenly. Alternatively, diseases may be present year-
3
Chapter 2A crash course in epidemiology
NP 61crc 15/5/08 10:42 am Page 3
Public health in crisis-affected populations
4
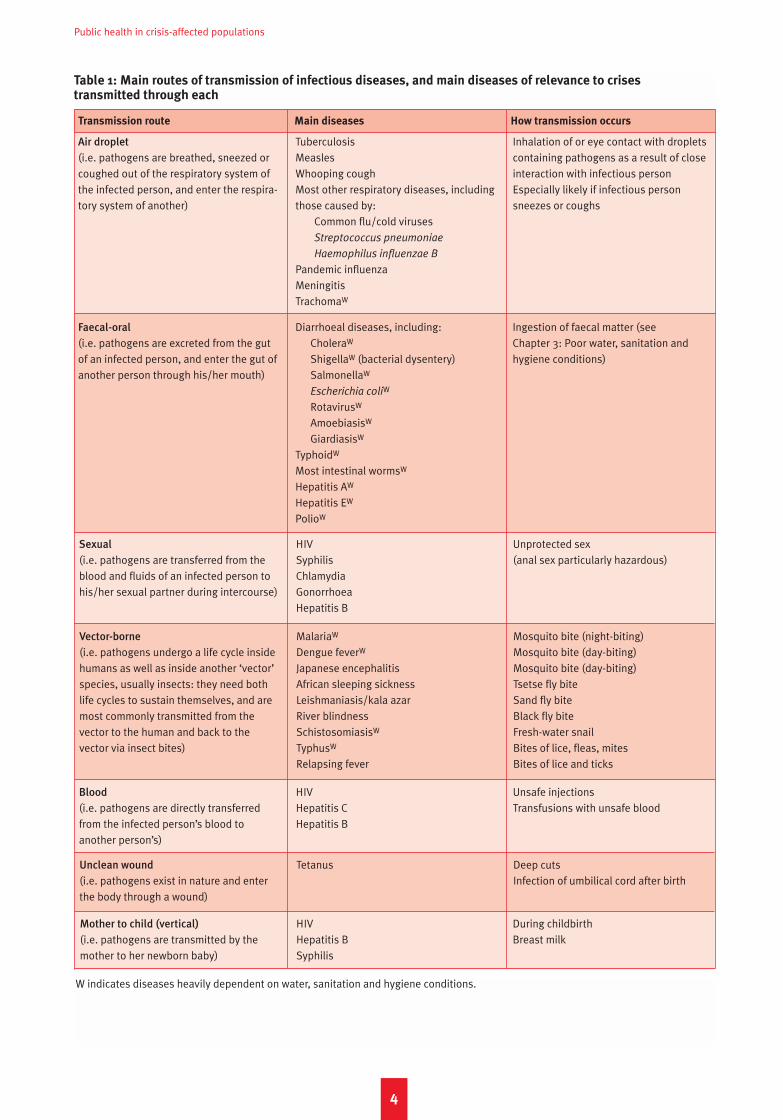
W indicates diseases heavily dependent on water, sanitation and hygiene conditions.
Table 1: Main routes of transmission of infectious diseases, and main diseases of relevance to crises transmitted through each
Transmission route Main diseases How transmission occurs
Air droplet
(i.e. pathogens are breathed, sneezed orcoughed out of the respiratory system ofthe infected person, and enter the respira-tory system of another)
TuberculosisMeaslesWhooping coughMost other respiratory diseases, includingthose caused by:
Common flu/cold virusesStreptococcus pneumoniae
Haemophilus influenzae B
Pandemic influenzaMeningitisTrachomaW
Inhalation of or eye contact with dropletscontaining pathogens as a result of closeinteraction with infectious personEspecially likely if infectious personsneezes or coughs
Faecal-oral
(i.e. pathogens are excreted from the gutof an infected person, and enter the gut ofanother person through his/her mouth)
Diarrhoeal diseases, including:CholeraW
ShigellaW (bacterial dysentery)SalmonellaW
Escherichia coliW
RotavirusW
AmoebiasisW
GiardiasisW
TyphoidW
Most intestinal wormsW
Hepatitis AW
Hepatitis EW
PolioW
Ingestion of faecal matter (see Chapter 3: Poor water, sanitation andhygiene conditions)
Sexual
(i.e. pathogens are transferred from theblood and fluids of an infected person tohis/her sexual partner during intercourse)
HIVSyphilisChlamydiaGonorrhoeaHepatitis B
Unprotected sex(anal sex particularly hazardous)
Vector-borne
(i.e. pathogens undergo a life cycle insidehumans as well as inside another ‘vector’species, usually insects: they need bothlife cycles to sustain themselves, and aremost commonly transmitted from thevector to the human and back to thevector via insect bites)
MalariaW
Dengue feverW
Japanese encephalitisAfrican sleeping sicknessLeishmaniasis/kala azarRiver blindnessSchistosomiasisW
TyphusW
Relapsing fever
Mosquito bite (night-biting)Mosquito bite (day-biting)Mosquito bite (day-biting)Tsetse fly biteSand fly biteBlack fly biteFresh-water snailBites of lice, fleas, mitesBites of lice and ticks
Blood
(i.e. pathogens are directly transferredfrom the infected person’s blood toanother person’s)
HIVHepatitis CHepatitis B
Unsafe injectionsTransfusions with unsafe blood
Unclean wound
(i.e. pathogens exist in nature and enterthe body through a wound)
Tetanus Deep cutsInfection of umbilical cord after birth
Mother to child (vertical)
(i.e. pathogens are transmitted by themother to her newborn baby)
HIVHepatitis BSyphilis
During childbirthBreast milk
NP 61crc 15/5/08 10:42 am Page 4

Incubation period
Infection Start ofinfectiousness
End ofinfectiousness
Transmission fromprimary tosecondary case
End of infection
Onset ofsymptoms in
secondarycase
Onset ofsymptoms in
primary case
Time
Primary case
round, but suddenly reach levels far above the expected.Such situations are known as outbreaks or epidemics (theterm outbreak generally indicates a smaller-size event),and diseases that can bring about such phenomena (not allcan) are considered epidemic-prone. The definition of whatconstitutes an epidemic is often based on an arbitrary andcontext-specific threshold (i.e. a level of diseaseoccurrence which, if exceeded, triggers the declaration ofan epidemic; see Table 2 for some examples) definedbased on research or policy considerations.
The distinction between endemic and epidemic is notalways clear-cut, and some diseases, like malaria, can beboth depending on the context. However, the two terms aremostly useful for control purposes rather than class-ification: for epidemic-prone diseases, the emphasis must
be on preparedness, early warning and surveillance, andoutbreak prevention. For endemic diseases, controlactivities must be maintained on an ongoing basis.
Incubation period, duration of infection, andserial interval
The time elapsing between infection (i.e. when the pathogenestablishes itself in the body) and the appearance of andsymptoms of the disease is known as the incubation period,which can be hours for diarrhoeal diseases, two weeks formalaria, and years for tuberculosis and HIV/AIDS. There isalways individual variability, and for each disease we canspeak of an average incubation period, and of a typical range.Epidemiologists are also interested in the average duration
of infection, i.e. from time of infection to its final outcome,
Chapter 2 A crash course in epidemiology
5
Table 2: Examples of outbreak/epidemic thresholds for selected infectious diseases
Disease Context Outbreak/epidemic threshold
Measles Camp 1 case
Cholera Overcrowded community 1 case
Rural community Significant increase from expected
Meningococcal meningitis Community of <30,000 people 5 cases in 1 week or doubling of cases in3-week period or decision on a case-by-case basis
Community of ≥ 30,000 people 10 cases per 100,000 people per week ifno epidemic in last 3 years and vaccina-tion coverage <80% or alert thresholdcrossed early in dry season; otherwise, 15cases per 100,000 people per week
Figure 2
Illustration of incubation period, duration of infection and serial interval
Secondary case
Duration of infection
Infectious period (d)
Symptoms
Incubation period
Serial interval
Symptoms
NP 61crc 15/5/08 10:42 am Page 5

be it spontaneous cure, successful treatment or death ofthe individual. Some infectious diseases, like herpes, canlead to chronic infections that may last a lifetime.
The infectious period is usually less than the duration ofinfection: an infected person may be infectious (i.e. able totransmit the infection) during part of the incubation periodand part of the symptomatic period.
A related quantity is the serial interval, namely the averageamount of time between a ‘primary’ case and the‘secondary’ cases it causes. For example, a child withmeasles transmits the virus to a second child, and thesecond to a third. The time elapsed between the first child’sonset of symptoms and the second child’s onset ofsymptoms, or that between the second and the third’s, isthe serial interval. Many pathogens are not very infectiousduring the incubation period: thus, the incubation periodheavily influences the serial interval. Epidemic diseaseswith a short serial interval (e.g. measles, diarrhoealdiseases, meningitis) will exhibit a much more explosivegrowth in the community (since it takes less time fortransmissions to occur), thus leaving little time for reaction.Figure 2 represents these quantities graphically. Table 3provides examples for several important epidemic-pronediseases in emergencies.
Disease transmission in quantitative terms: the
reproductive ratio
While a person remains infectious, (s)he is able to transmitthe pathogen and thus cause additional infections. But justhow quickly and extensively will a disease spread in thecommunity? Predicting this is possible if one knows, onaverage, how many additional infections will result from anygiven case. This crucial quantity, known as the reproductive
ratio or reproductive number (R), has wide-rangingimplications for disease control. Consider the following:
1) In an IDP camp previously cholera-free, three choleracases appear. In this first phase of the outbreak, each‘primary’ case of cholera results in ten further‘secondary’ cases (R=10). This situation will lead to anexplosive, exponentially growing epidemic (the firstthree cases will result in 30 more, which will result in300 more, and so on).
2) In a shantytown, tuberculosis is endemic and frequent.Each case leads to about one additional case (R=1). Thedisease will remain at roughly the same levels unlesssomething is done: this is a classic endemic scenario.
3) In a village there are 20 cases of river blindness(onchocerciasis), but a control programme starts treatingall villagers once a year with ivermectin (a drug that clearsthe worms responsible for the disease); thanks to this, onaverage each case only gives rise to 0.5 new cases(R=0.5); thus, out of the 20 cases only ten new cases willarise; if control is sustained, the third generation will onlyconsist of five, and so forth until the disease dies out.
Briefly, if R is around 1, the disease will be endemic andstable. If R > 1, caseload will increase, as at the beginning
of an epidemic; if R < 1, the disease will usually go extinct:interventions to eliminate or eradicate a disease work byreducing R to below 1.
R for the same disease varies widely across communitiesand/or over time. This variation results from the com-ponents that make up R, namely (i) the degree to whichinfectious people come into contact with those who aresusceptible; (ii) the transmissibility of the pathogen, i.e.how easily it passes from one person to the next; and (iii)the amount of time an infectious person has to spread theinfection, before (s)he is treated, dies or has cleared theinfection spontaneously (see Equation 1 and example inFigure 3).
Logically, ‘c’ depends on both context and transmissionroute. In an overcrowded camp where people are living inclose quarters, a flu patient will contact many healthy,susceptible people. In a dispersed rural village, opportunitiesfor contact will be considerably fewer. Similarly, ‘c’ formalaria, a vector-borne disease, depends on the intensity ofmosquito bites (e.g. more near a swamp, less in a grassland);and ‘c’ for sexually transmitted diseases depends onbehaviour (e.g. frequency of unprotected intercourse). Thepresence of susceptible people drives ‘c’. As discussed later,inter-ventions that reduce susceptibility, such as vaccinationor bed nets, dramatically reduce ‘c’, and thus R. In short, ‘c’depends greatly on what people do, how they live and howsusceptible they are.
By contrast, ‘p’ depends mostly on the biology of thepathogen: how contagious it is. Sometimes, it can bebehaviour-related: for example, the ‘p’ of HIV is about fiveout of 1,000 episodes of unprotected intercourse if sex isanal, and one in 1,000 if it is vaginal.
Public health in crisis-affected populations
6
Equation 1
Components of the reproductive ratio of
an infectious disease
R = c x p x d
where:c = average number of susceptible people (i.e. who are
not infected and can contract the infection) aninfectious person comes into contact with, per unittime (e.g. per day)
p = average probability that transmission will take place,per unit contact
d = average duration of infectiousness, or infectiousperiod (e.g. in days)
Note that these symbols do not reflect any standardnotation.
Any increase in c, p or d will result in an increase in R.
NP 61crc 15/5/08 10:42 am Page 6
Chapter 2 A crash course in epidemiology
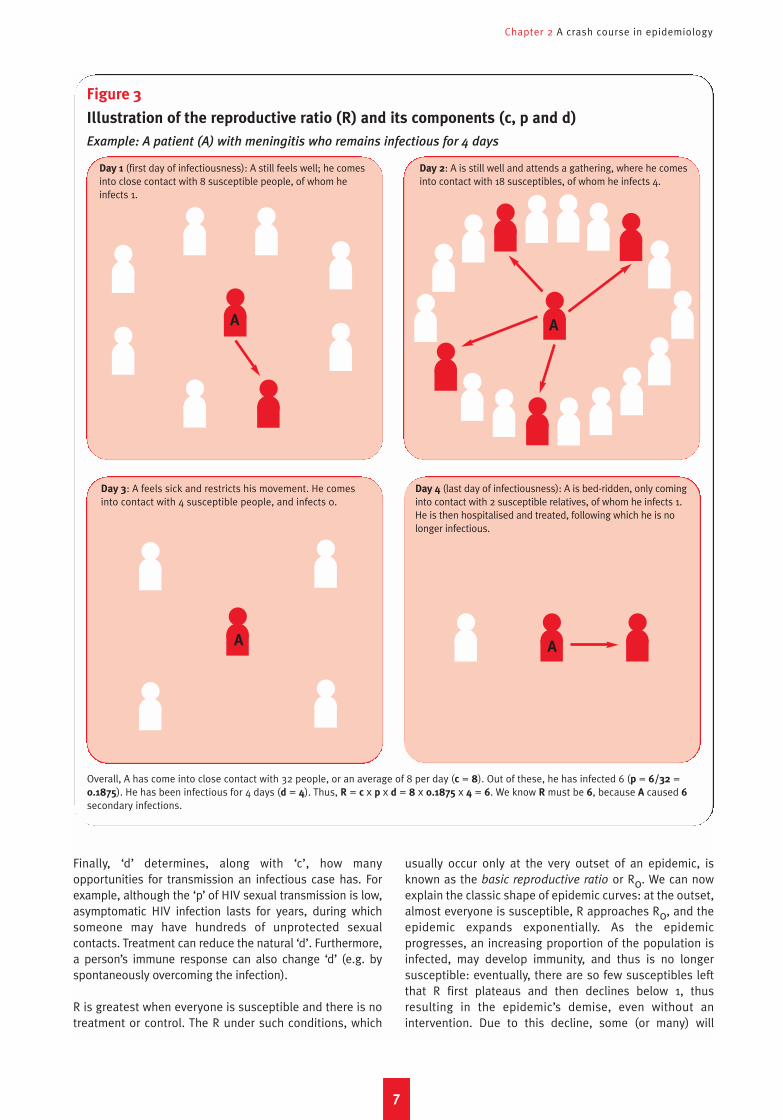
Finally, ‘d’ determines, along with ‘c’, how manyopportunities for transmission an infectious case has. Forexample, although the ‘p’ of HIV sexual transmission is low,asymptomatic HIV infection lasts for years, during whichsomeone may have hundreds of unprotected sexualcontacts. Treatment can reduce the natural ‘d’. Furthermore,a person’s immune response can also change ‘d’ (e.g. byspontaneously overcoming the infection).
R is greatest when everyone is susceptible and there is notreatment or control. The R under such conditions, which
usually occur only at the very outset of an epidemic, isknown as the basic reproductive ratio or R0. We can nowexplain the classic shape of epidemic curves: at the outset,almost everyone is susceptible, R approaches R0, and theepidemic expands exponentially. As the epidemicprogresses, an increasing proportion of the population isinfected, may develop immunity, and thus is no longersusceptible: eventually, there are so few susceptibles leftthat R first plateaus and then declines below 1, thusresulting in the epidemic’s demise, even without anintervention. Due to this decline, some (or many) will
7
Figure 3
Illustration of the reproductive ratio (R) and its components (c, p and d)
Example: A patient (A) with meningitis who remains infectious for 4 days
Overall, A has come into close contact with 32 people, or an average of 8 per day (c = 8). Out of these, he has infected 6 (p = 6/32 =0.1875). He has been infectious for 4 days (d = 4). Thus, R = c x p x d = 8 x 0.1875 x 4 = 6. We know R must be 6, because A caused 6secondary infections.
Day 1 (first day of infectiousness): A still feels well; he comesinto close contact with 8 susceptible people, of whom heinfects 1.
Day 2: A is still well and attends a gathering, where he comesinto contact with 18 susceptibles, of whom he infects 4.
Day 3: A feels sick and restricts his movement. He comesinto contact with 4 susceptible people, and infects 0.
Day 4 (last day of infectiousness): A is bed-ridden, only cominginto contact with 2 susceptible relatives, of whom he infects 1.He is then hospitalised and treated, following which he is nolonger infectious.
A
A A
A
NP 61crc 15/5/08 10:42 am Page 7
Public health in crisis-affected populations
escape infection. Interventions are crucial to minimise orprevent epidemics; however, when implemented late theymay have limited impact: an intervention implementedmid-way through an epidemic may in fact not beresponsible for its decline, although agencies eager todemonstrate their programme’s impact may claim this.
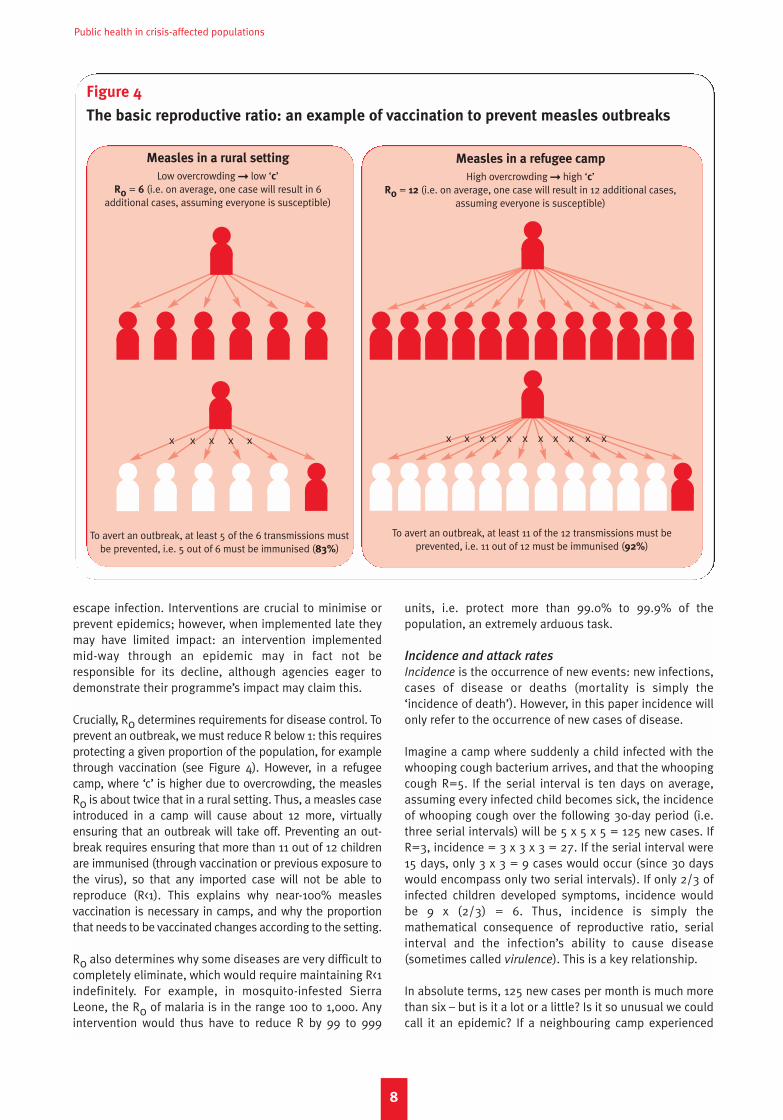
Crucially, R0 determines requirements for disease control. Toprevent an outbreak, we must reduce R below 1: this requiresprotecting a given proportion of the population, for examplethrough vaccination (see Figure 4). However, in a refugeecamp, where ‘c’ is higher due to overcrowding, the measlesR0 is about twice that in a rural setting. Thus, a measles caseintroduced in a camp will cause about 12 more, virtuallyensuring that an outbreak will take off. Preventing an out-break requires ensuring that more than 11 out of 12 childrenare immunised (through vaccination or previous exposure tothe virus), so that any imported case will not be able toreproduce (R<1). This explains why near-100% measlesvaccination is necessary in camps, and why the proportionthat needs to be vaccinated changes according to the setting.
R0 also determines why some diseases are very difficult tocompletely eliminate, which would require maintaining R<1indefinitely. For example, in mosquito-infested SierraLeone, the R0 of malaria is in the range 100 to 1,000. Anyintervention would thus have to reduce R by 99 to 999
units, i.e. protect more than 99.0% to 99.9% of thepopulation, an extremely arduous task.
Incidence and attack rates
Incidence is the occurrence of new events: new infections,cases of disease or deaths (mortality is simply the‘incidence of death’). However, in this paper incidence willonly refer to the occurrence of new cases of disease.
Imagine a camp where suddenly a child infected with thewhooping cough bacterium arrives, and that the whoopingcough R=5. If the serial interval is ten days on average,assuming every infected child becomes sick, the incidenceof whooping cough over the following 30-day period (i.e.three serial intervals) will be 5 x 5 x 5 = 125 new cases. IfR=3, incidence = 3 x 3 x 3 = 27. If the serial interval were15 days, only 3 x 3 = 9 cases would occur (since 30 dayswould encompass only two serial intervals). If only 2/3 ofinfected children developed symptoms, incidence wouldbe 9 x (2/3) = 6. Thus, incidence is simply themathematical consequence of reproductive ratio, serialinterval and the infection’s ability to cause disease(sometimes called virulence). This is a key relationship.
In absolute terms, 125 new cases per month is much morethan six – but is it a lot or a little? Is it so unusual we couldcall it an epidemic? If a neighbouring camp experienced
8
Figure 4
The basic reproductive ratio: an example of vaccination to prevent measles outbreaks
Measles in a rural setting
Low overcrowding � low ‘c’R0 = 6 (i.e. on average, one case will result in 6
additional cases, assuming everyone is susceptible)
To avert an outbreak, at least 5 of the 6 transmissions mustbe prevented, i.e. 5 out of 6 must be immunised (83%)
To avert an outbreak, at least 11 of the 12 transmissions must be prevented, i.e. 11 out of 12 must be immunised (92%)
Measles in a refugee camp
High overcrowding � high ‘c’R0 = 12 (i.e. on average, one case will result in 12 additional cases,
assuming everyone is susceptible)
x x x x x x x x x x xx x x x x
NP 61crc 15/5/08 10:42 am Page 8
Chapter 2 A crash course in epidemiology
250 cases over the same period, could we say the epidemicis spreading less quickly in ours? To answer thesequestions, we must relate incidence to the size of thepopulation, i.e. calculate an incidence rate. This rateexpresses the number of new cases of disease per unitnumber of people (e.g. per person; per 1,000 persons) perunit period of time (e.g. per week; per year). Box 1 showshow to calculate incidence rates.
Incidence rates are ubiquitous in infectious diseaseepidemiology, and the ‘currency’ of disease surveillance.Whenever possible, they are calculated not among thegeneral population, but among the population at risk,which, depending on the disease, may or may not beeveryone (e.g. we might express the incidence rate ofneonatal tetanus as the number of cases per 1,000 childrenunder 30 days old per year).
9
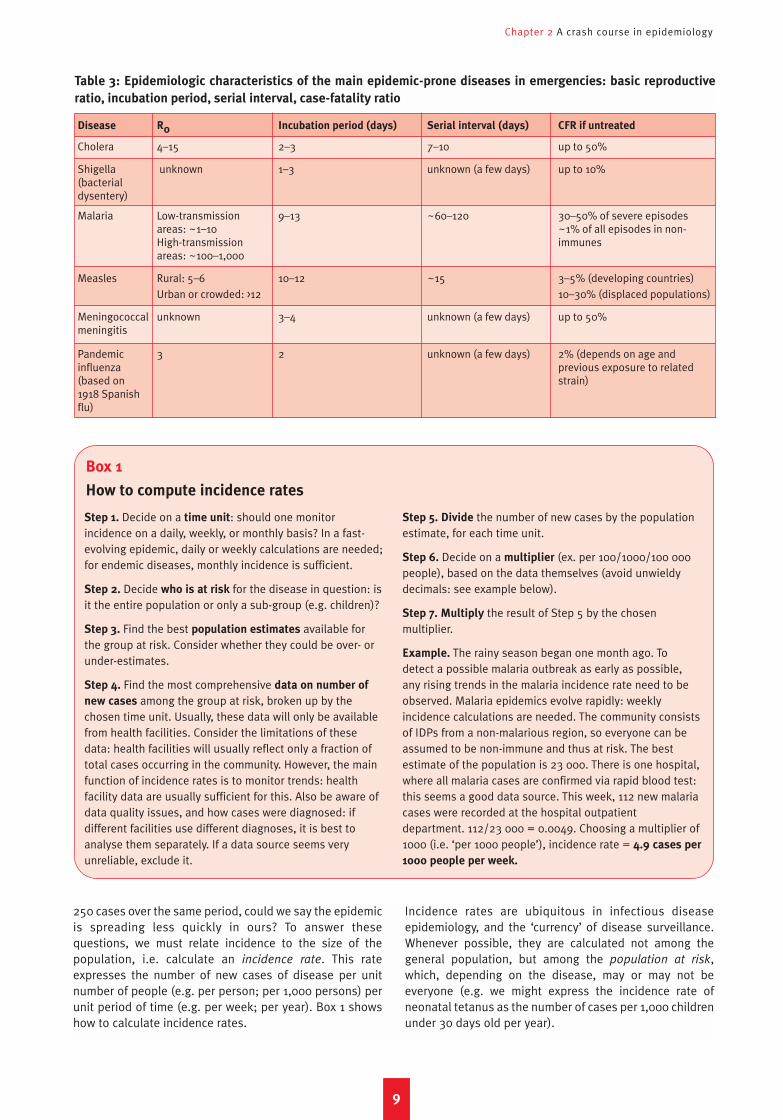
Table 3: Epidemiologic characteristics of the main epidemic-prone diseases in emergencies: basic reproductive
ratio, incubation period, serial interval, case-fatality ratio
Disease R0 Incubation period (days) Serial interval (days) CFR if untreated
Cholera 4–15 2–3 7–10 up to 50%
Shigella unknown 1–3 unknown (a few days) up to 10% (bacterial dysentery)
Malaria Low-transmission 9–13 ~60–120 30–50% of severe episodesareas: ~1–10 ~1% of all episodes in non-High-transmission immunesareas: ~100–1,000
Measles Rural: 5–6 10–12 ~15 3–5% (developing countries)Urban or crowded: >12 10–30% (displaced populations)
Meningococcal unknown 3–4 unknown (a few days) up to 50%meningitis
Pandemic 3 2 unknown (a few days) 2% (depends on age and influenza previous exposure to related (based on strain)1918 Spanish flu)
Step 1. Decide on a time unit: should one monitorincidence on a daily, weekly, or monthly basis? In a fast-evolving epidemic, daily or weekly calculations are needed;for endemic diseases, monthly incidence is sufficient.
Step 2. Decide who is at risk for the disease in question: isit the entire population or only a sub-group (e.g. children)?
Step 3. Find the best population estimates available forthe group at risk. Consider whether they could be over- orunder-estimates.
Step 4. Find the most comprehensive data on number of
new cases among the group at risk, broken up by thechosen time unit. Usually, these data will only be availablefrom health facilities. Consider the limitations of thesedata: health facilities will usually reflect only a fraction oftotal cases occurring in the community. However, the mainfunction of incidence rates is to monitor trends: healthfacility data are usually sufficient for this. Also be aware ofdata quality issues, and how cases were diagnosed: ifdifferent facilities use different diagnoses, it is best toanalyse them separately. If a data source seems veryunreliable, exclude it.
Step 5. Divide the number of new cases by the populationestimate, for each time unit.
Step 6. Decide on a multiplier (ex. per 100/1000/100 000people), based on the data themselves (avoid unwieldydecimals: see example below).
Step 7. Multiply the result of Step 5 by the chosenmultiplier.
Example. The rainy season began one month ago. Todetect a possible malaria outbreak as early as possible,any rising trends in the malaria incidence rate need to beobserved. Malaria epidemics evolve rapidly: weeklyincidence calculations are needed. The community consistsof IDPs from a non-malarious region, so everyone can beassumed to be non-immune and thus at risk. The bestestimate of the population is 23 000. There is one hospital,where all malaria cases are confirmed via rapid blood test:this seems a good data source. This week, 112 new malariacases were recorded at the hospital outpatientdepartment. 112/23 000 = 0.0049. Choosing a multiplier of1000 (i.e. ‘per 1000 people’), incidence rate = 4.9 cases per
1000 people per week.
Box 1
How to compute incidence rates
NP 61crc 15/5/08 10:42 am Page 9

Public health in crisis-affected populations
10
Imagine a group of nomadic settlements experiencing afood crisis. Many families have congregated in thesettlements recently, attracted by food distributions. Threegovernment primary health care centres are operational:they charge user fees and, starting in May, began toexperience drug shortages. In June, a health team from the
capital, responding to a late epidemic alert, wishes to usethese clinics’ data to calculate the incidence rate of bloodydiarrhoea. The team also has population estimates fromfood registrations, as well as population figures providedby community chiefs.
Box 2
Example of incidence rate calculation, and its common pitfalls
The question: has a bloody diarrhoea epidemic been occurring? Available data is below.
Jan Feb Mar Apr May Jun
Bloody diarrhoea cases 121 288 413 598 655 661
Clinic consultations for any cause 4672 5412 5389 5211 2417 1914
Population (food registrations) 25 000 33 000 35 000 38 000 54 000 67 000
Population (community chiefs) 45 000 60 000 105 000
Simply looking at the raw number of cases per month (GraphA), we might conclude there is an epidemic, peaking aboutnow.
Num
ber o
f new
blo
ody
diar
rhoe
a ca
ses
Jan Feb Mar Apr May Jun
Month
Jan Feb Mar Apr May JunMonth
700
600
500
400
300
200
100
0
New
blo
ody
diar
rhoe
a ca
ses
per 1
000
per m
onth
20
18
1614
12
10
8
64
2
0
Jan Feb Mar Apr May Jun
Month
New
blo
ody
diar
rhoe
a ca
ses
per 1
000
per m
onth
New
con
sulta
tions
per
100
0 pe
r mon
th
20
18
16
14
12
10
8
6
4
2
0
200
180
160
140
120
100
80
60
40
20
0
If we compute the incidence rate using the population datafrom registrations (Graph B), the resulting curve suggests theepidemic peak was in April. Note the difference with Graph A,due to changing population size.
But is the epidemic really declining? If we overlay theincidence rate and the clinic consultation rate (calculatedin the same way as incidence; Graph C), we see that clinicattendance slowly declined until April (perhaps due toincreasing inability to afford the fees), and plummeted inMay (probably due to drug shortages).
This observation casts doubt on whether one can safelyassume that the epidemic is declining: if less people areattending the clinic, fewer cases will be reported!
Conclusion. Different analysis of the same data leads todifferent conclusions about disease trends, and potentiallywrong operational decisions.
If we instead use the chiefs’ population data, we get a ratherdifferent picture.
Graph A
Graph B
Incidence rate (registration data)
Incidence rate (chiefs’ data)
Incidence rate
Consultation rate
Graph C
NP 61crc 15/5/08 10:42 am Page 10
Pitfalls to calculating and interpreting incidence rates (Box 2)are due to uncertainty about the population denominatorand data source: data from health facilities is heavily affectedby the degree to which people are utilising health services.
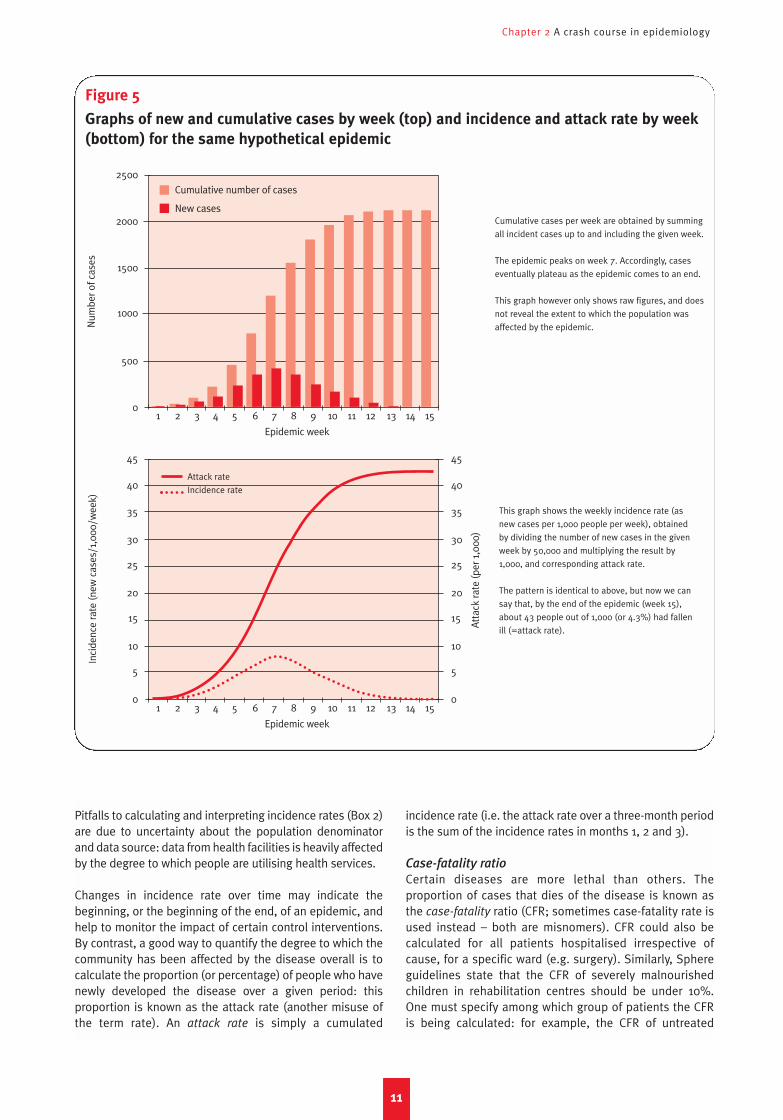
Changes in incidence rate over time may indicate thebeginning, or the beginning of the end, of an epidemic, andhelp to monitor the impact of certain control interventions.By contrast, a good way to quantify the degree to which thecommunity has been affected by the disease overall is tocalculate the proportion (or percentage) of people who havenewly developed the disease over a given period: thisproportion is known as the attack rate (another misuse ofthe term rate). An attack rate is simply a cumulated
incidence rate (i.e. the attack rate over a three-month periodis the sum of the incidence rates in months 1, 2 and 3).
Case-fatality ratio
Certain diseases are more lethal than others. Theproportion of cases that dies of the disease is known asthe case-fatality ratio (CFR; sometimes case-fatality rate isused instead – both are misnomers). CFR could also becalculated for all patients hospitalised irrespective ofcause, for a specific ward (e.g. surgery). Similarly, Sphereguidelines state that the CFR of severely malnourishedchildren in rehabilitation centres should be under 10%.One must specify among which group of patients the CFRis being calculated: for example, the CFR of untreated
Chapter 2 A crash course in epidemiology
11
Figure 5
Graphs of new and cumulative cases by week (top) and incidence and attack rate by week
(bottom) for the same hypothetical epidemic
Num
ber o
f cas
esIn
cide
nce
rate
(new
cas
es/1
,000
/wee
k)
2500
2000
1500
1000
500
0
Cumulative cases per week are obtained by summing
all incident cases up to and including the given week.
The epidemic peaks on week 7. Accordingly, cases
eventually plateau as the epidemic comes to an end.
This graph however only shows raw figures, and does
not reveal the extent to which the population was
affected by the epidemic.
This graph shows the weekly incidence rate (as
new cases per 1,000 people per week), obtained
by dividing the number of new cases in the given
week by 50,000 and multiplying the result by
1,000, and corresponding attack rate.
The pattern is identical to above, but now we can
say that, by the end of the epidemic (week 15),
about 43 people out of 1,000 (or 4.3%) had fallen
ill (=attack rate).
45
40
35
30
25
20
15
10
5
0
45
40
35
30
25
20
15
10
5
0
1 2 3 4 5 6 7 8 9 10 11 12 13 14 15
Epidemic week
1 2 3 4 5 6 7 8 9 10 11 12 13 14 15
Epidemic week
Cumulative number of cases
New cases
Attack rate
Incidence rate
Atta
ck ra
te (p
er 1
,000
)
NP 61crc 15/5/08 10:42 am Page 11

Public health in crisis-affected populations
12
Table 4: Main indicators of mortality
Indicator Basic formula What it quantifies Common applications
Indicators commonly used in emergencies
Crude mortality rate
(CMR, or death rate) Deaths due to any cause, in anyage group/(population at risk xperiod of time)
Rate of occurrence (incidence)of death in the general population
Usually expressed as deaths per10,000 people per day; alwayspresented
Age-specific mortality rate
(or death rate) Deaths in age group/(popula-tion in age group at risk x periodof time for those within the agerange)
Rate of occurrence of death in agiven age group
Most common is under-5mortality rate (U5MR): deathsamong children <5 years per10,000 children <5 years per day
Group-specific mortality rate Deaths among members of agiven sub-group/(populationbelonging to the group at risk xperiod of time)
Rate of occurrence of death in agiven group
Usually calculated for especiallyvulnerable groups, such asIDPs, orphans, etc.
Period-specific mortality rate Deaths during sub-period/(population at risk during sub-period x duration of sub-period)
Rate of occurrence of deathduring a specific sub-periodwithin the crisis
Monthly MR, MR duringepidemic period, MRbefore/after displacement
Cause-specific mortality rate Deaths due to a givencause/(population at risk xperiod of time)
Rate of occurrence of death dueto a given cause in the generalpopulation
MR due to intentional injury;MR due to disease causingepidemic
Proportionate mortality Deaths due to a givencause/total deaths
Proportion of all deaths that areattributable to a given cause
Usually expressed as apercentage; can be calculated inthe general population oramong people dying in a healthfacility
Case-fatality ratio
(or rate) or CFR Deaths due to a given cause(disease)/total cases of givendisease
Probability of dying as a resultof a given disease/cause of illhealth (lethality of a givendisease)
Can be calculated for a givendisease/cause, or when evalu-ating the situation in a wholehospitalisation ward
Excess mortality rate
(and total number of excessdeaths)
Observed MR – expected non-crisis MR (x population at risk x period of time)
Rate of occurrence of deathattributable to crisis conditions(total death toll attributable tothe crisis)
Fundamental and objective indicator of crisis severity
Indicators less commonly used in emergencies, but prominent in long-term development settings
Neonatal mortality ratio
(or rate) Deaths among neonates <28days old/Live births
Probability of dying before age28 days
Infant mortality ratio (or rate) Deaths among children < 1 yearold over one year/Live births
Probability of dying before age 1year
Under 5 mortality ratio
(or rate); also known as Childmortality ratio (or rate)
Deaths among children <5years/Live births
Probability of dying before age5 years
Maternal mortality ratio Deaths while pregnant or within42 days of pregnancy termina-tion, due to pregnancy-relatedcauses/Live births
Probability of dying as a resultof one’s pregnancy
Usually calculated for a givenyear (i.e. on an annual basis),and out of 100,000 live births
Usually calculated for a givenyear (i.e. on an annual basis),and out of 1,000 live births
falciparum malaria is roughly 1–2% among all children whocontract it, but 30–50% among those with cerebral forms.
CFR is one of many indicators of mortality. The terminologyfor mortality indicators is often misused, resulting inconfusion (see Table 4).5
Prevalence
Whereas the incidence rate expresses the number of newcases arising in the population per unit time, prevalence
quantifies the number of cases (or infections) present at agiven time. Point prevalence indicates cases present at avery specific point in time (a snapshot photograph), while
NP 61crc 15/5/08 10:42 am Page 12
Chapter 2 A crash course in epidemiology
13
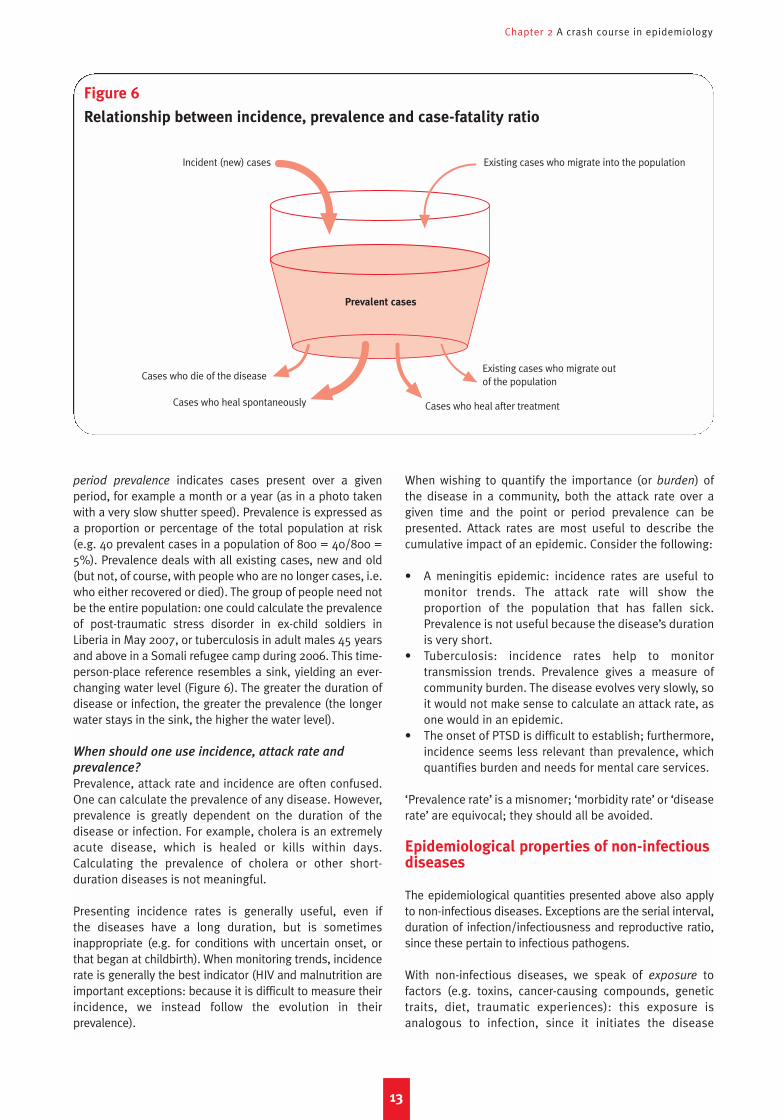
period prevalence indicates cases present over a givenperiod, for example a month or a year (as in a photo takenwith a very slow shutter speed). Prevalence is expressed asa proportion or percentage of the total population at risk(e.g. 40 prevalent cases in a population of 800 = 40/800 =5%). Prevalence deals with all existing cases, new and old(but not, of course, with people who are no longer cases, i.e.who either recovered or died). The group of people need notbe the entire population: one could calculate the prevalenceof post-traumatic stress disorder in ex-child soldiers inLiberia in May 2007, or tuberculosis in adult males 45 yearsand above in a Somali refugee camp during 2006. This time-person-place reference resembles a sink, yielding an ever-changing water level (Figure 6). The greater the duration ofdisease or infection, the greater the prevalence (the longerwater stays in the sink, the higher the water level).
When should one use incidence, attack rate and
prevalence?
Prevalence, attack rate and incidence are often confused.One can calculate the prevalence of any disease. However,prevalence is greatly dependent on the duration of thedisease or infection. For example, cholera is an extremelyacute disease, which is healed or kills within days.Calculating the prevalence of cholera or other short-duration diseases is not meaningful.
Presenting incidence rates is generally useful, even if the diseases have a long duration, but is sometimesinappropriate (e.g. for conditions with uncertain onset, orthat began at childbirth). When monitoring trends, incidencerate is generally the best indicator (HIV and malnutrition areimportant exceptions: because it is difficult to measure theirincidence, we instead follow the evolution in theirprevalence).
When wishing to quantify the importance (or burden) ofthe disease in a community, both the attack rate over agiven time and the point or period prevalence can bepresented. Attack rates are most useful to describe thecumulative impact of an epidemic. Consider the following:
• A meningitis epidemic: incidence rates are useful tomonitor trends. The attack rate will show theproportion of the population that has fallen sick.Prevalence is not useful because the disease’s durationis very short.
• Tuberculosis: incidence rates help to monitortransmission trends. Prevalence gives a measure ofcommunity burden. The disease evolves very slowly, soit would not make sense to calculate an attack rate, asone would in an epidemic.
• The onset of PTSD is difficult to establish; furthermore,incidence seems less relevant than prevalence, whichquantifies burden and needs for mental care services.
‘Prevalence rate’ is a misnomer; ‘morbidity rate’ or ‘diseaserate’ are equivocal; they should all be avoided.
Epidemiological properties of non-infectiousdiseases
The epidemiological quantities presented above also applyto non-infectious diseases. Exceptions are the serial interval,duration of infection/infectiousness and reproductive ratio,since these pertain to infectious pathogens.
With non-infectious diseases, we speak of exposure tofactors (e.g. toxins, cancer-causing compounds, genetictraits, diet, traumatic experiences): this exposure isanalogous to infection, since it initiates the disease
Figure 6
Relationship between incidence, prevalence and case-fatality ratio
Incident (new) cases
Cases who die of the disease
Prevalent cases
Cases who heal spontaneously Cases who heal after treatment
Existing cases who migrate into the population
Existing cases who migrate out of the population
NP 61crc 15/5/08 10:42 am Page 13
Public health in crisis-affected populations
14
process. The interval between exposure and disease onsetis not strictly speaking an ‘incubation’, but the sameconcept holds. In non-infectious disease, the dose(intensity) of exposure is usually paramount: it makesdisease more likely, and accelerates its onset. Becausenon-infectious diseases are mostly chronic, prevalence isthe most useful indicator of their burden.
Notions of risk
Risk and risk factors
Many epidemiological quantities above quantify, on anindividual or population basis, the ‘risk’ of disease, i.e. theamount of disease in the population now (prevalence), itsrate of occurrence (incidence rate) or the probability ofdying from it (CFR); here we mean risk in the broadestpossible sense.
Epidemiology not only describes this disease risk, but alsoexplores causal associations between certain risk factors
and disease. Risk factors (discussed in Chapter 3) canrange from basic underlying issues, such as poverty, toenvironmental conditions, such as poor sanitation, toindividual characteristics such as age, behaviour or genetictraits, situations such as living in a camp or beingorphaned, or time periods, such as ‘after the start ofconflict’, or ‘March 2007’. Protective factors reduce risk(e.g. exclusive breastfeeding protects against infantinfections). Statements about exposure to a risk factormust be unequivocal: thus, ‘low food intake’ or ‘young age’are not acceptable definitions of exposure; ‘average caloricintake <2,100 Kcal/day over the last three months’, or ‘age59 months or less’, is.
The relative risk
By how much does a risk factor increase risk, or aprotective factor decrease it? Compare the risk A in peoplewho are exposed (or more exposed) to the factor to the riskB in those who are not (or less) exposed. A/B is the relative
risk (RR or risk ratio), namely the answer we seek: it tells usby how much the risk is multiplied in the exposed versusthe non-exposed. If A>B, RR >1, i.e. exposure to the factorincreases risk. If A<B, RR <1, i.e. the factor is protective. If A= B, RR = 1, i.e. there is no effect.
The indicator of risk depends on what we are interested inobserving. Thus, incidence rate ratios, prevalence ratios,mortality ratios and so on are all valid expressions ofrelative risk (Box 3). The odds ratio is less intuitive, butoften measured, especially during outbreak investigations,essentially when measuring more straightforward RRexpressions is unfeasible. It compares exposure in cases toexposure in non-cases. If cases have been exposed to afactor more than non-cases, there is probably anassociation between this factor and disease.
Disease itself can be a risk factor for further outcomes (e.g.malaria causes poor pregnancy outcomes), and relative risksare often bi-directional (e.g. see the vicious cycle ofmalnutrition and disease, discussed in Chapter 2).
Why think in terms of relative risk?
There are two main applications of relative risk:
• Identifying risk or protective factors, so as to identifyinterventions that are most likely to help. Varioustypes of studies (e.g. case-control, clinical trials,
cross-sectional, cohort) can compare groups ofpeople exposed to a hypothesized risk factor, or to agiven intervention, to groups that were not exposed,to measure the RR of disease in the exposed group,and thus investigate the causal link between riskfactors and disease, or the effectiveness of inter-ventions.
• Comparing the risk in different population groups,locations or periods, to better target interventions.Here, a baseline group (or category) is delineated toserve as the non-exposed denominator of the RR (e.g.people not displaced; the period before the conflict;the month of April 2007; persons > 15 years of age).
Relief health programmes are informed heavily byexisting evidence about risk or protective factors.Sometimes, the evidence is weak, highlighting the needfor more research. For many factors, however, theevidence is extremely strong: for example, it is well-known that indoor smoke increases the risk ofchildhood pneumonia; and that people who sleep ininsecticide-treated shelters have a lower risk of malaria.Knowledge of relative risks from previous studies issummarised through systematic reviews, and used toformulate guidelines and standards (like Sphere).
Sometimes, RR are calculated during the crisis itself,usually through disease outbreak investigations, andcan have immediate applications. For example:
• During a 1999–2000 epidemic of bloody dysentery inSierra Leone, the RR of dying of the disease (CFR)among children under 5 years was 2.9 compared toolder persons.6
• In West Darfur, investigation of a 2004 outbreak ofhepatitis E in a camp showed that, surprisingly, theodds of having consumed chlorinated surface waterwere 2.2 times higher among cases than amonghealthy people (OR = 2.2).7
• A 2002 survey of mortality among Angolan IDPsfound that the risk of death was 1.4 times higher incamps than before arrival to camps.8
The population-level effect of risk factors
On a population level, we need to consider how high theRR of a given risk factor is, but also what proportion ofthe population is exposed to the factor. Together, thesetwo elements yield the population attributable risk.Compare factor A which increases risk 20-fold, but towhich only 1% of the population is exposed, to factor B,which increases risk only two-fold, but to which 50% ofthe population is exposed: A is more dangerous at theindividual level, but clearly B is a greater priority forpopulation control.
NP 61crc 15/5/08 10:42 am Page 14

Chapter 2 A crash course in epidemiology
Similarly, a powerful protective factor will not have aconsiderable effect unless a considerable proportion of thepopulation benefits from it (e.g. exclusive breastfeedingwill only improve child health on a population level if manymothers adopt it; see Chapter 5).
Causality and confounding
A common mistake in epidemiology is to observecorrelations between any factor and the outcome, andthereby mistake a spurious relationship for true causality.Consider the following:
• Maternal mortality is three times higher in ethnic group1 than in ethnic group 2. The superficial conclusionmight be that ethnicity, i.e. genetics, affects the risk ofdying in pregnancy. However, a much more likelyexplanation is that ethnic group 1 is poorer or has less
access to treatment than group 2. Ethnicity is thus herea confounder of the causal relationship betweenpoverty or health access and maternal mortality.
• Ex-child soldiers who spent time in rehabilitation centreA were evaluated on exit, and 37% were found to havesigns of mental illness. By contrast, children exitingcentre B had a mental illness prevalence of 18%. Wouldit be right to conclude that centre B provided moreeffective rehabilitation? Perhaps not: the observeddifference might actually reflect the proportion ofchildren admitted to each centre who had been directlyexposed to violence during the war (perhaps centre Achildren had been more directly involved in combat).Centre of residence is a possible confounder here.
• Two months into a malaria epidemic, bed nets aredistributed: entomologists find that the mosquitopopulation has fallen two-fold since the start of the bednet programme, and the epidemic starts declining right
15
Box 3
Examples of different expressions of relative risk
Relative risk as a prevalence ratio
Records of a mental health clinic show that theprevalence of Post-Traumatic Stress Disorder (PTSD)was 103 out of 151 (68.2%) bomb survivors screened,and 21 out of 126 (16.7%) people who had not been ina bombing.
The relative risk (RR) of PTSD was thus 4.1 (68.2%/16.7%) in bomb survivors, compared to others.
Thus, bomb survivors were about 4 times more likelythan others to have PTSD.
Relative risk as an incidence rate ratio
An observational study shows that the incidence rateof diarrhoea among children < 5 years was 11 per 1,000per month before the instalment of new boreholes, and6 per 1,000 per month afterwards.
The RR of diarrhoea was thus 0.54 (6/11) after theintervention, compared to before.
After borehole installation, diarrhoea occurred at abouthalf the rate in children as before.
Relative risk as an attack rate ratio
During an earthquake, about 450 severe injuriesoccurred among approximately 7,000 schoolchildren(attack rate 6.7%), whereas among adults the severeinjury attack rate was 540 out of 35,000 (1.5%).
The RR of severe injury in schoolchildren versus adultswas thus 6.7/1.5, or 4.5.
The risk of experiencing a severe injury during theearthquake was 4 to 5 times higher in children than inadults.
Relative risk as an odds ratio
Epidemiologists investigating an outbreak of an unknownfever-causing disease discover that, among 45 cases, 20had drunk cow’s milk in the past two weeks, while 25 hadnot. Among 85 healthy people, 6 had drunk milk, while79 had not. The odds of drinking milk were 20:25 (0.80)among the cases, and 6:79 (0.08) among the non-cases.The odds ratio (OR) of having drunk milk was thus 10.0(0.80/0.08) among cases, compared to non-cases,suggesting milk could be a risk factor for infection.
Cases were 10 times more likely than non-cases tohave drunk milk. Note the upside-down logic behindthe odds ratio.
NP 61crc 15/5/08 10:42 am Page 15

Public health in crisis-affected populations
16
afterwards. The agency in charge believes it has had animpact, but is this justified? While decreasingmosquito population is correlated with increasing bed
net ownership, in reality climate (e.g. end of the rainsand drying of stagnant pools) may be the true reasonfor the falling mosquito numbers.
NP 61crc 15/5/08 10:42 am Page 16

Case-fatality(CFR)
A simplified general model of disease in thepopulation
From healthy state to infection or exposure, disease
and death
Understanding how different crisis conditions result inmorbidity and mortality requires some grasp of thepopulation dynamics of disease, in particular of infections.We can now tie the epidemiological quantities definedabove together into an overall model (or representation) ofdisease (see Figure 7). This simplified model does notaccommodate various nuances specific to individualdiseases, but probably suffices to extract key quantitativerelationships that illustrate the effects of risk factors andprotective factors (interventions).
At any time, a proportion of the population is susceptible,i.e. can contract the infection or be exposed to the disease-causing agent (for non-infectious diseases). For infectiousdiseases, susceptibility will usually be highest if the diseasehas long been absent from the community, and will decreasethe more people have been infected previously, and havedeveloped some immunity. It will also decrease the morepeople are vaccinated (assuming a vaccine exists). However,many diseases do not confer any immunity. Furthermore,some diseases and vaccines do confer immunity, but, withage, the body’s immunological memory wanes and antibodyproduction decreases, so that people once again becomesusceptible. For most diseases there is a back and forth flowbetween ‘fully susceptible’ and ‘fully non-susceptible’, with
many shades in between (e.g. malaria infection never yieldscomplete immunity, but in endemic areas leaves adults witha far lower risk of life-threatening episodes). Thus,susceptible and non-susceptible are grouped into one box:the non-infected/non-exposed.
The greater the proportion of susceptibles, the greater thecontact rate ‘c’ and thus R (only applicable to infectiousdiseases). R divided by the serial interval equals the rate ofnew infections (infection rate or TR), namely the flow fromthe uninfected to the infected boxes (TR is our ownabbreviation). For non-infectious diseases, TR is the rate atwhich people are being exposed (e.g. to a cancer-causingagent or to a PTSD-causing event).
A proportion Pr of those infected develop symptomatic, orclinical, disease. Others remain chronically infected/exposed without any symptoms. The rest clear theirinfection spontaneously or following treatment: if theinfection confers immunity, they return to the non-infected,non-susceptible box; if the infection is non-immunising,they will be susceptible to a new episode.
Out of those who develop symptoms, a proportion diesbecause of the disease (unless the disease is completelybenign): this proportion is simply the CFR. Survivors returnto the susceptible/non-susceptible box, as above. Somediseases, however, neither kill nor heal, but persistchronically (e.g. non-infectious conditions like hypertension,diabetes, asthma and mental disorders).
17
Chapter 3The effects of crises on health
Figure 7
Simplified framework of the dynamics of disease in a population
Dead
(impact)Progression to disease
(Pr)
Chronic diseaseChronic infection/exposure
Immunising diseases
Non-immunising diseases
Reproductiveratio
Serialinterval
Contactrate
Probability oftransmission per
unit contact
Duration ofinfectiousness
Exposure/Infection rate
(TR)
Non-infected/
Non-exposed
Non-susceptible
Somewhat susceptible
Very susceptible
Diseased
(outcome)
x x
Infected/
exposed
but notdiseased
NP 61crc 15/5/08 10:42 am Page 17

Public health in crisis-affected populations
18
Lag time between infection and death in slow-onset
diseases
For short-duration and short serial interval diseases(diarrhoea, measles, meningitis), flow from susceptibilityto death takes days. For slow-onset diseases such as TB,HIV/AIDS or cancer, however, the delay between the TRstep and death can be many years. This has two importantimplications:
• For slow-onset diseases, crises’ effects on TR will mostlymanifest themselves as clinical disease long after theacute emergency is over. For example, if conditions in arefugee camp cause increased TB transmission, theresulting increased caseload might mainly be borne bythe health system of the country of origin years afterrepatriation. Minimising the TR of slow-onset diseases(TB, HIV, sleeping sickness, leishmaniasis) during acrisis is thus justifiable as a forward-looking preventiveaction (note, however, that for HIV there is currently noevidence that conflict increases TR).
• In an emergency, the immediate concern with TB, HIVand non-infectious diseases such as hypertension ismainly not their TR, but rather their Pr and CFR. Asdiscussed later, many risk factors brought about bycrises make Pr faster and more probable, and increaseCFR. Thus, what matters here is the burden of alreadyprevalent cases, which may have been contractedbefore the crisis (in diseases such as diabetes orcardiovascular problems, exposure is often genetic ortakes place early in life). In emergencies, the mainchallenge is to minimise Pr and CFR by ensuringuninterrupted treatment (e.g. TB drugs, antibiotics andantiretrovirals, insulin, heart medication).
Tying it all together
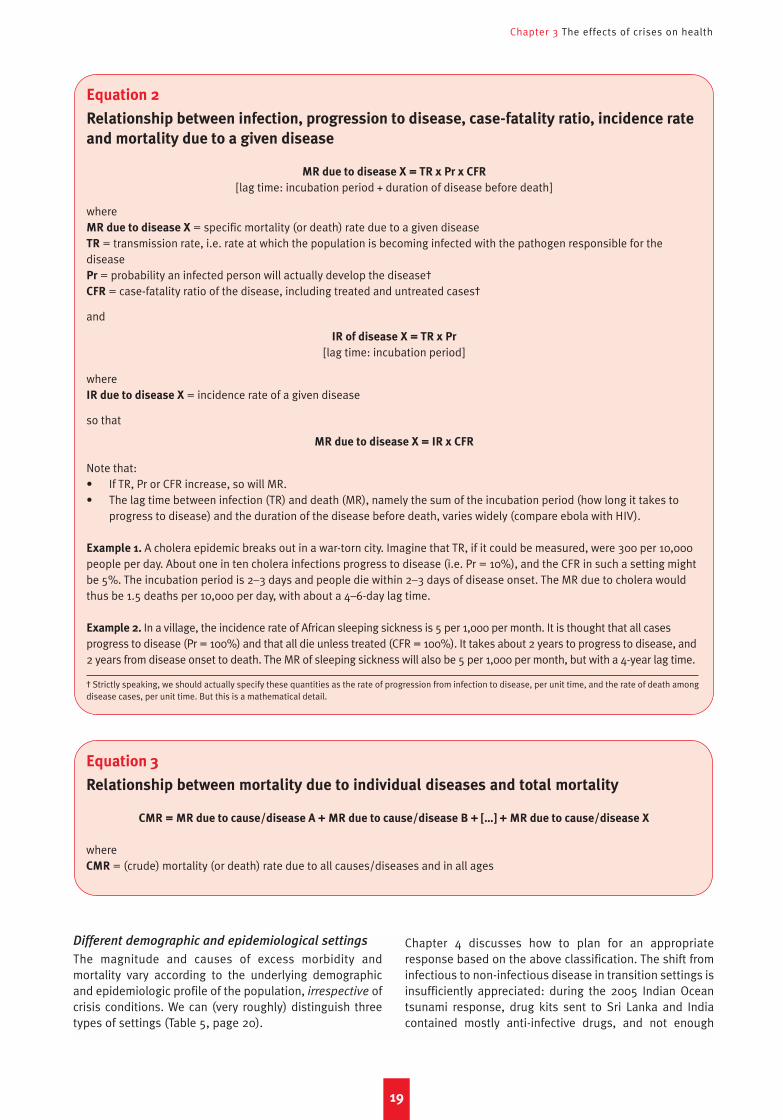
The exposure/infection rate TR, multiplied by Pr, gives theincidence rate (i.e. the rate of new symptomatic cases), orIR (Equation 2). There is a lag time (incubation period)between infection/exposure and incidence. Similarly, IR xCFR = mortality rate (MR), with a further lag time. The sumof all MRs due to individual diseases gives the overall MRfor the entire population (Equation 3; in reality there ismore complexity, since death is often caused by more thanone disease occurring together). These relationships arefundamental to understanding what health interventionscan accomplish.
Excess morbidity and mortality
Definition of excess morbidity and mortality
Morbidity and mortality that occur directly or indirectlybecause of the crisis, i.e. that would not have occurred hadthe crisis not taken place, may be considered in excess ofthe norm. Excess morbidity and mortality due to anydisease occurs if crisis-associated risk factors increase TRand/or Pr and/or CFR beyond their pre-crisis levels (unlessan increase in one of the three is compensated by adecrease in the others – but this is implausible, at least inthe acute emergency phase).
If ‘crisis’ is the exposure, and pre-crisis the baseline, wecan rephrase this in more epidemiological terms: excessmorbidity and/or mortality occur when the relative risk ofTR, Pr and/or CFR in crisis versus pre-crisis exceeds 1.Alternatively, excess morbidity and mortality are thesummation, at the population level, of crisis-attributableexcess risk at the individual level.
Typical scenarios of the evolution of morbidity and
mortality
We have already listed the different crisis conditionscovered in this paper: (1) entrapment due to surroundingviolence, (2) mass displacement into camps, (3)displacement into host communities, (4) natural disaster,and (5) food crisis.
When quantifying mortality, we are interested in itselevation compared to the pre-crisis baseline (excessmortality rate), the number of people experiencing thisexcess mortality rate and the amount of time that thiselevation persists:9 these three elements determine theabsolute number of excess deaths attributable to a givencrisis. The same holds for incidence rate and morbidity.While there is no ‘typical’ blueprint for the chronologicalevolution of morbidity and mortality in crises, consideringthe above conditions helps to delineate rough rules ofthumb.
• Condition 1 (entrapment) may not result in extremelyhigh mortality rates. However, considerable elevationsin mortality do occur over large populations and timeperiods (think of eastern DRC or eastern Burma). Theresult is often unfathomably large death tolls, as in DRC(more than 4 million).10
• Condition 2 (sudden mass displacement into camps) isthe best documented. Generally, a dramatic spike inmortality occurs, and then after a few months deathrates typically decline, eventually reaching pre-crisislevels.
• Condition 3 (displacement in the host community) ispoorly documented, probably because refugees, IDPsand informal migrants disperse into the localcommunity, where they are difficult to identify andtrack. As discussed later, this type of displacementshould theoretically lead to better health outcomes,but this requires confirmation.11
• Condition 4 (natural disasters) usually results in adramatic peak in mortality and injury within the first 72hours. Survival chances after this time are bleak.Evolution in ensuing weeks depends largely on theoccurrence of epidemics, though these have usuallybeen of modest proportions.12
• Condition 5 (food crisis) has an insidious onset, butprogresses rapidly (i.e. a couple of months). It mayresult in very high mortality, especially among children.Mortality is intimately related to the prevalence ofacute malnutrition, but will also be linked to theoccurrence of epidemics favoured by malnutritionitself. Food crises generally accompany both Condition1 and 2.
NP 61crc 15/5/08 10:42 am Page 18
Chapter 3 The effects of crises on health
Different demographic and epidemiological settings
The magnitude and causes of excess morbidity andmortality vary according to the underlying demographicand epidemiologic profile of the population, irrespective ofcrisis conditions. We can (very roughly) distinguish threetypes of settings (Table 5, page 20).
Chapter 4 discusses how to plan for an appropriateresponse based on the above classification. The shift frominfectious to non-infectious disease in transition settings isinsufficiently appreciated: during the 2005 Indian Oceantsunami response, drug kits sent to Sri Lanka and Indiacontained mostly anti-infective drugs, and not enough
19
Equation 2
Relationship between infection, progression to disease, case-fatality ratio, incidence rate
and mortality due to a given disease
MR due to disease X = TR x Pr x CFR
[lag time: incubation period + duration of disease before death]
whereMR due to disease X = specific mortality (or death) rate due to a given diseaseTR = transmission rate, i.e. rate at which the population is becoming infected with the pathogen responsible for thediseasePr = probability an infected person will actually develop the disease†CFR = case-fatality ratio of the disease, including treated and untreated cases†
and
IR of disease X = TR x Pr
[lag time: incubation period]
whereIR due to disease X = incidence rate of a given disease
so that
MR due to disease X = IR x CFR
Note that:• If TR, Pr or CFR increase, so will MR.• The lag time between infection (TR) and death (MR), namely the sum of the incubation period (how long it takes to
progress to disease) and the duration of the disease before death, varies widely (compare ebola with HIV).
Example 1. A cholera epidemic breaks out in a war-torn city. Imagine that TR, if it could be measured, were 300 per 10,000people per day. About one in ten cholera infections progress to disease (i.e. Pr = 10%), and the CFR in such a setting mightbe 5%. The incubation period is 2–3 days and people die within 2–3 days of disease onset. The MR due to cholera wouldthus be 1.5 deaths per 10,000 per day, with about a 4–6-day lag time.
Example 2. In a village, the incidence rate of African sleeping sickness is 5 per 1,000 per month. It is thought that all casesprogress to disease (Pr = 100%) and that all die unless treated (CFR = 100%). It takes about 2 years to progress to disease, and2 years from disease onset to death. The MR of sleeping sickness will also be 5 per 1,000 per month, but with a 4-year lag time.
† Strictly speaking, we should actually specify these quantities as the rate of progression from infection to disease, per unit time, and the rate of death amongdisease cases, per unit time. But this is a mathematical detail.
Equation 3
Relationship between mortality due to individual diseases and total mortality
CMR = MR due to cause/disease A + MR due to cause/disease B + […] + MR due to cause/disease X
whereCMR = (crude) mortality (or death) rate due to all causes/diseases and in all ages
NP 61crc 15/5/08 10:42 am Page 19
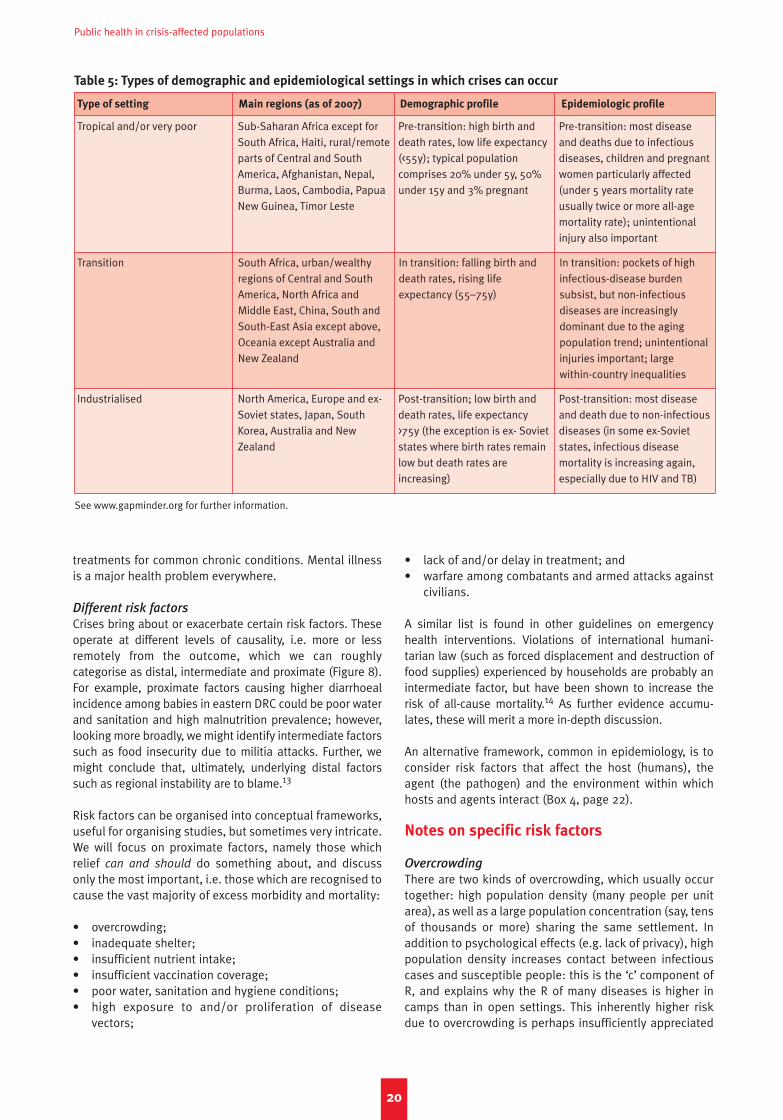
Public health in crisis-affected populations
20
Table 5: Types of demographic and epidemiological settings in which crises can occur
Type of setting Main regions (as of 2007) Demographic profile Epidemiologic profile
Tropical and/or very poor Sub-Saharan Africa except forSouth Africa, Haiti, rural/remoteparts of Central and SouthAmerica, Afghanistan, Nepal,Burma, Laos, Cambodia, PapuaNew Guinea, Timor Leste
Pre-transition: high birth anddeath rates, low life expectancy(<55y); typical populationcomprises 20% under 5y, 50%under 15y and 3% pregnant
Pre-transition: most diseaseand deaths due to infectiousdiseases, children and pregnantwomen particularly affected(under 5 years mortality rateusually twice or more all-agemortality rate); unintentionalinjury also important
Transition South Africa, urban/wealthyregions of Central and SouthAmerica, North Africa andMiddle East, China, South andSouth-East Asia except above,Oceania except Australia andNew Zealand
In transition: falling birth anddeath rates, rising lifeexpectancy (55–75y)
In transition: pockets of highinfectious-disease burdensubsist, but non-infectiousdiseases are increasinglydominant due to the agingpopulation trend; unintentionalinjuries important; large within-country inequalities
Industrialised North America, Europe and ex-Soviet states, Japan, SouthKorea, Australia and NewZealand
Post-transition; low birth anddeath rates, life expectancy>75y (the exception is ex- Sovietstates where birth rates remainlow but death rates areincreasing)
Post-transition: most diseaseand death due to non-infectiousdiseases (in some ex-Sovietstates, infectious diseasemortality is increasing again,especially due to HIV and TB)
treatments for common chronic conditions. Mental illnessis a major health problem everywhere.
Different risk factors
Crises bring about or exacerbate certain risk factors. Theseoperate at different levels of causality, i.e. more or lessremotely from the outcome, which we can roughlycategorise as distal, intermediate and proximate (Figure 8).For example, proximate factors causing higher diarrhoealincidence among babies in eastern DRC could be poor waterand sanitation and high malnutrition prevalence; however,looking more broadly, we might identify intermediate factorssuch as food insecurity due to militia attacks. Further, wemight conclude that, ultimately, underlying distal factorssuch as regional instability are to blame.13
Risk factors can be organised into conceptual frameworks,useful for organising studies, but sometimes very intricate.We will focus on proximate factors, namely those whichrelief can and should do something about, and discussonly the most important, i.e. those which are recognised tocause the vast majority of excess morbidity and mortality:
• overcrowding;• inadequate shelter;• insufficient nutrient intake;• insufficient vaccination coverage;• poor water, sanitation and hygiene conditions;• high exposure to and/or proliferation of disease
vectors;
• lack of and/or delay in treatment; and• warfare among combatants and armed attacks against
civilians.
A similar list is found in other guidelines on emergencyhealth interventions. Violations of international humani-tarian law (such as forced displacement and destruction offood supplies) experienced by households are probably anintermediate factor, but have been shown to increase therisk of all-cause mortality.14 As further evidence accumu-lates, these will merit a more in-depth discussion.
An alternative framework, common in epidemiology, is toconsider risk factors that affect the host (humans), theagent (the pathogen) and the environment within whichhosts and agents interact (Box 4, page 22).
Notes on specific risk factors
Overcrowding
There are two kinds of overcrowding, which usually occurtogether: high population density (many people per unitarea), as well as a large population concentration (say, tensof thousands or more) sharing the same settlement. Inaddition to psychological effects (e.g. lack of privacy), highpopulation density increases contact between infectiouscases and susceptible people: this is the ‘c’ component ofR, and explains why the R of many diseases is higher incamps than in open settings. This inherently higher riskdue to overcrowding is perhaps insufficiently appreciated
See www.gapminder.org for further information.
NP 61crc 15/5/08 10:42 am Page 20
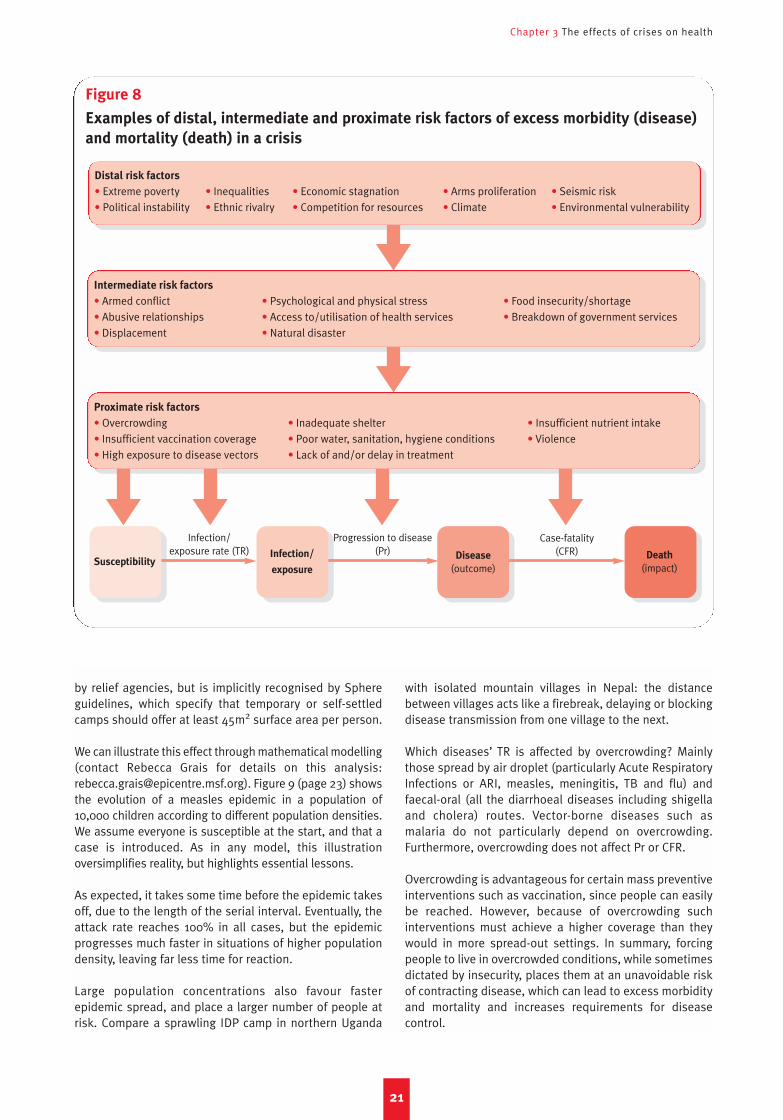
Chapter 3 The effects of crises on health
21
Figure 8
Examples of distal, intermediate and proximate risk factors of excess morbidity (disease)
and mortality (death) in a crisis
Distal risk factors
• Extreme poverty • Inequalities • Economic stagnation • Arms proliferation • Seismic risk• Political instability • Ethnic rivalry • Competition for resources • Climate • Environmental vulnerability
Intermediate risk factors
• Armed conflict • Psychological and physical stress • Food insecurity/shortage• Abusive relationships • Access to/utilisation of health services • Breakdown of government services• Displacement • Natural disaster
Proximate risk factors
• Overcrowding • Inadequate shelter • Insufficient nutrient intake• Insufficient vaccination coverage • Poor water, sanitation, hygiene conditions • Violence• High exposure to disease vectors • Lack of and/or delay in treatment
Infection/
exposure
Disease
(outcome)
Infection/exposure rate (TR)
Progression to disease(Pr)
Case-fatality(CFR) Death
(impact)Susceptibility
by relief agencies, but is implicitly recognised by Sphereguidelines, which specify that temporary or self-settledcamps should offer at least 45m2 surface area per person.
We can illustrate this effect through mathematical modelling(contact Rebecca Grais for details on this analysis:[email protected]). Figure 9 (page 23) showsthe evolution of a measles epidemic in a population of10,000 children according to different population densities.We assume everyone is susceptible at the start, and that acase is introduced. As in any model, this illustrationoversimplifies reality, but highlights essential lessons.
As expected, it takes some time before the epidemic takesoff, due to the length of the serial interval. Eventually, theattack rate reaches 100% in all cases, but the epidemicprogresses much faster in situations of higher populationdensity, leaving far less time for reaction.
Large population concentrations also favour fasterepidemic spread, and place a larger number of people atrisk. Compare a sprawling IDP camp in northern Uganda
with isolated mountain villages in Nepal: the distancebetween villages acts like a firebreak, delaying or blockingdisease transmission from one village to the next.
Which diseases’ TR is affected by overcrowding? Mainlythose spread by air droplet (particularly Acute RespiratoryInfections or ARI, measles, meningitis, TB and flu) andfaecal-oral (all the diarrhoeal diseases including shigellaand cholera) routes. Vector-borne diseases such asmalaria do not particularly depend on overcrowding.Furthermore, overcrowding does not affect Pr or CFR.
Overcrowding is advantageous for certain mass preventiveinterventions such as vaccination, since people can easilybe reached. However, because of overcrowding suchinterventions must achieve a higher coverage than theywould in more spread-out settings. In summary, forcingpeople to live in overcrowded conditions, while sometimesdictated by insecurity, places them at an unavoidable riskof contracting disease, which can lead to excess morbidityand mortality and increases requirements for diseasecontrol.
NP 61crc 15/5/08 10:42 am Page 21
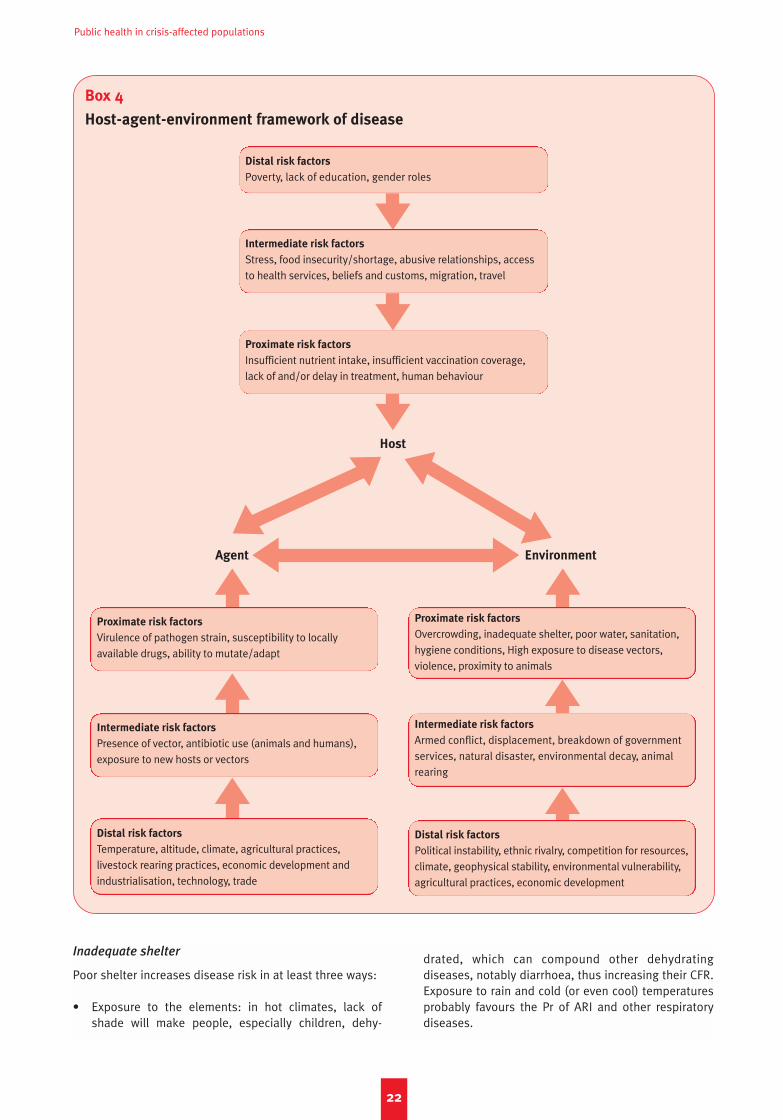
Public health in crisis-affected populations
22
Box 4
Host-agent-environment framework of disease
Distal risk factors
Poverty, lack of education, gender roles
Intermediate risk factors
Stress, food insecurity/shortage, abusive relationships, accessto health services, beliefs and customs, migration, travel
Proximate risk factors
Insufficient nutrient intake, insufficient vaccination coverage,lack of and/or delay in treatment, human behaviour
Proximate risk factors
Virulence of pathogen strain, susceptibility to locally available drugs, ability to mutate/adapt
Intermediate risk factors
Presence of vector, antibiotic use (animals and humans),exposure to new hosts or vectors
Distal risk factors
Temperature, altitude, climate, agricultural practices, livestock rearing practices, economic development andindustrialisation, technology, trade
Proximate risk factors
Overcrowding, inadequate shelter, poor water, sanitation,hygiene conditions, High exposure to disease vectors,violence, proximity to animals
Intermediate risk factors
Armed conflict, displacement, breakdown of governmentservices, natural disaster, environmental decay, animalrearing
Distal risk factors
Political instability, ethnic rivalry, competition for resources,climate, geophysical stability, environmental vulnerability,agricultural practices, economic development
Agent Environment
Host
Inadequate shelter
Poor shelter increases disease risk in at least three ways:
• Exposure to the elements: in hot climates, lack ofshade will make people, especially children, dehy-
drated, which can compound other dehydratingdiseases, notably diarrhoea, thus increasing their CFR.Exposure to rain and cold (or even cool) temperaturesprobably favours the Pr of ARI and other respiratorydiseases.
NP 61crc 15/5/08 10:42 am Page 22
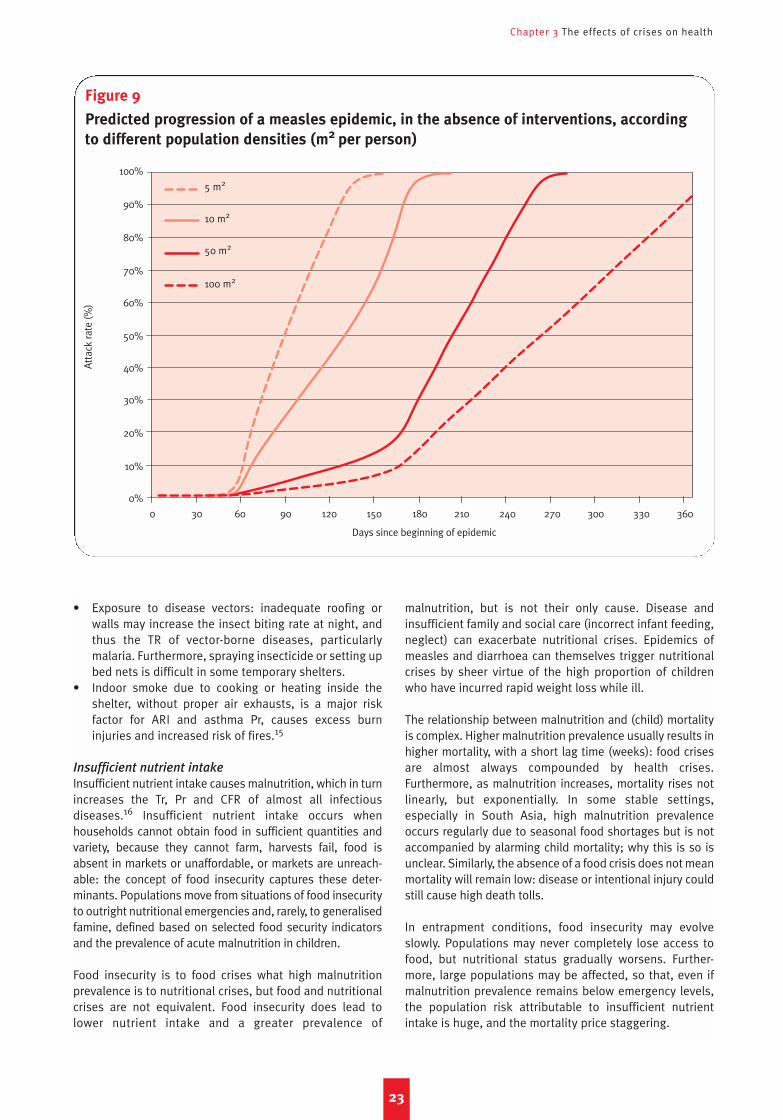
Chapter 3 The effects of crises on health
• Exposure to disease vectors: inadequate roofing orwalls may increase the insect biting rate at night, andthus the TR of vector-borne diseases, particularlymalaria. Furthermore, spraying insecticide or setting upbed nets is difficult in some temporary shelters.
• Indoor smoke due to cooking or heating inside theshelter, without proper air exhausts, is a major riskfactor for ARI and asthma Pr, causes excess burninjuries and increased risk of fires.15
Insufficient nutrient intake
Insufficient nutrient intake causes malnutrition, which in turnincreases the Tr, Pr and CFR of almost all infectiousdiseases.16 Insufficient nutrient intake occurs whenhouseholds cannot obtain food in sufficient quantities andvariety, because they cannot farm, harvests fail, food isabsent in markets or unaffordable, or markets are unreach-able: the concept of food insecurity captures these deter-minants. Populations move from situations of food insecurityto outright nutritional emergencies and, rarely, to generalisedfamine, defined based on selected food security indicatorsand the prevalence of acute malnutrition in children.
Food insecurity is to food crises what high malnutritionprevalence is to nutritional crises, but food and nutritionalcrises are not equivalent. Food insecurity does lead tolower nutrient intake and a greater prevalence of
malnutrition, but is not their only cause. Disease andinsufficient family and social care (incorrect infant feeding,neglect) can exacerbate nutritional crises. Epidemics ofmeasles and diarrhoea can themselves trigger nutritionalcrises by sheer virtue of the high proportion of childrenwho have incurred rapid weight loss while ill.
The relationship between malnutrition and (child) mortalityis complex. Higher malnutrition prevalence usually results inhigher mortality, with a short lag time (weeks): food crisesare almost always compounded by health crises.Furthermore, as malnutrition increases, mortality rises notlinearly, but exponentially. In some stable settings,especially in South Asia, high malnutrition prevalenceoccurs regularly due to seasonal food shortages but is notaccompanied by alarming child mortality; why this is so isunclear. Similarly, the absence of a food crisis does not meanmortality will remain low: disease or intentional injury couldstill cause high death tolls.
In entrapment conditions, food insecurity may evolveslowly. Populations may never completely lose access tofood, but nutritional status gradually worsens. Further-more, large populations may be affected, so that, even ifmalnutrition prevalence remains below emergency levels,the population risk attributable to insufficient nutrientintake is huge, and the mortality price staggering.
23
Figure 9
Predicted progression of a measles epidemic, in the absence of interventions, according
to different population densities (m2 per person)
Atta
ck ra
te (%
)
5 m2
10 m2
50 m2
100 m2
0 30 60 90 120 150 180 210 240 270 300 330 360
Days since beginning of epidemic
100%
90%
80%
70%
60%
50%
40%
30%
20%
10%
0%
NP 61crc 15/5/08 10:42 am Page 23
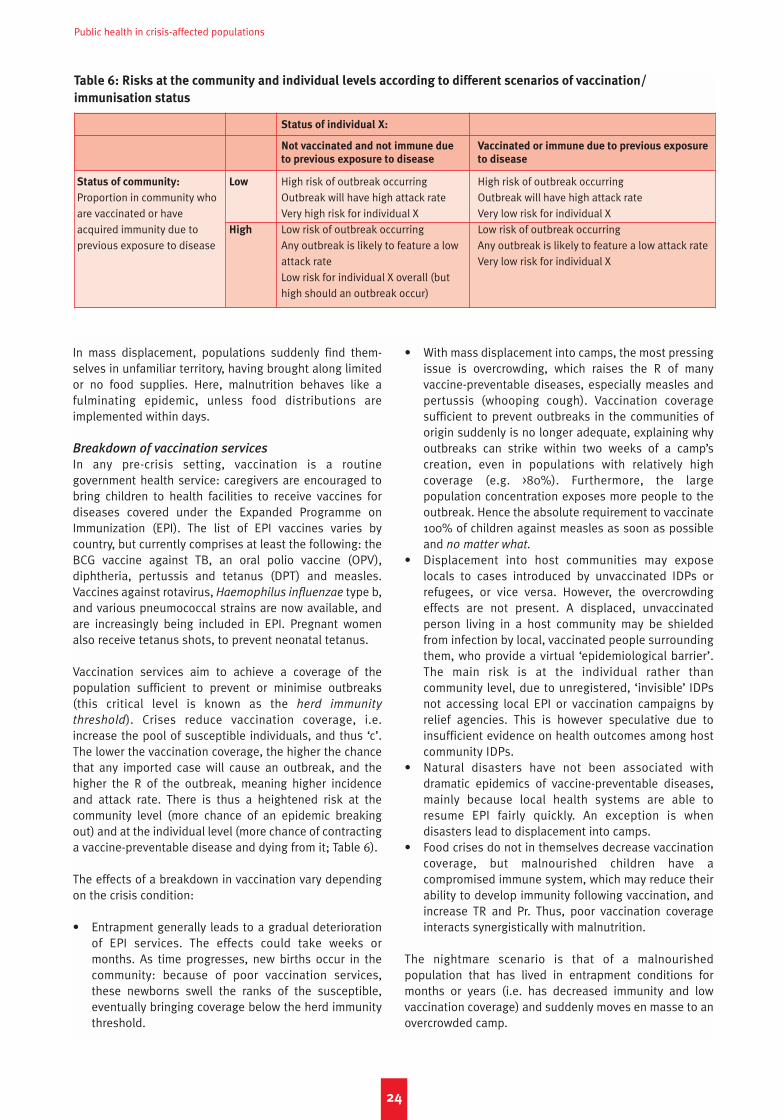
Public health in crisis-affected populations
In mass displacement, populations suddenly find them-selves in unfamiliar territory, having brought along limitedor no food supplies. Here, malnutrition behaves like afulminating epidemic, unless food distributions areimplemented within days.
Breakdown of vaccination services
In any pre-crisis setting, vaccination is a routinegovernment health service: caregivers are encouraged tobring children to health facilities to receive vaccines fordiseases covered under the Expanded Programme onImmunization (EPI). The list of EPI vaccines varies bycountry, but currently comprises at least the following: theBCG vaccine against TB, an oral polio vaccine (OPV),diphtheria, pertussis and tetanus (DPT) and measles.Vaccines against rotavirus, Haemophilus influenzae type b,and various pneumococcal strains are now available, andare increasingly being included in EPI. Pregnant womenalso receive tetanus shots, to prevent neonatal tetanus.
Vaccination services aim to achieve a coverage of thepopulation sufficient to prevent or minimise outbreaks(this critical level is known as the herd immunity
threshold). Crises reduce vaccination coverage, i.e.increase the pool of susceptible individuals, and thus ‘c’.The lower the vaccination coverage, the higher the chancethat any imported case will cause an outbreak, and thehigher the R of the outbreak, meaning higher incidenceand attack rate. There is thus a heightened risk at thecommunity level (more chance of an epidemic breakingout) and at the individual level (more chance of contractinga vaccine-preventable disease and dying from it; Table 6).
The effects of a breakdown in vaccination vary dependingon the crisis condition:
• Entrapment generally leads to a gradual deteriorationof EPI services. The effects could take weeks ormonths. As time progresses, new births occur in thecommunity: because of poor vaccination services,these newborns swell the ranks of the susceptible,eventually bringing coverage below the herd immunitythreshold.
• With mass displacement into camps, the most pressingissue is overcrowding, which raises the R of manyvaccine-preventable diseases, especially measles andpertussis (whooping cough). Vaccination coveragesufficient to prevent outbreaks in the communities oforigin suddenly is no longer adequate, explaining whyoutbreaks can strike within two weeks of a camp’screation, even in populations with relatively highcoverage (e.g. >80%). Furthermore, the largepopulation concentration exposes more people to theoutbreak. Hence the absolute requirement to vaccinate100% of children against measles as soon as possibleand no matter what.
• Displacement into host communities may exposelocals to cases introduced by unvaccinated IDPs orrefugees, or vice versa. However, the overcrowdingeffects are not present. A displaced, unvaccinatedperson living in a host community may be shieldedfrom infection by local, vaccinated people surroundingthem, who provide a virtual ‘epidemiological barrier’.The main risk is at the individual rather thancommunity level, due to unregistered, ‘invisible’ IDPsnot accessing local EPI or vaccination campaigns byrelief agencies. This is however speculative due toinsufficient evidence on health outcomes among hostcommunity IDPs.
• Natural disasters have not been associated withdramatic epidemics of vaccine-preventable diseases,mainly because local health systems are able toresume EPI fairly quickly. An exception is whendisasters lead to displacement into camps.
• Food crises do not in themselves decrease vaccinationcoverage, but malnourished children have acompromised immune system, which may reduce theirability to develop immunity following vaccination, andincrease TR and Pr. Thus, poor vaccination coverageinteracts synergistically with malnutrition.
The nightmare scenario is that of a malnourishedpopulation that has lived in entrapment conditions formonths or years (i.e. has decreased immunity and lowvaccination coverage) and suddenly moves en masse to anovercrowded camp.
24
Table 6: Risks at the community and individual levels according to different scenarios of vaccination/
immunisation status
Status of individual X:
Not vaccinated and not immune due Vaccinated or immune due to previous exposure
to previous exposure to disease to disease
Status of community: Low High risk of outbreak occurring High risk of outbreak occurringProportion in community who Outbreak will have high attack rate Outbreak will have high attack rateare vaccinated or have Very high risk for individual X Very low risk for individual Xacquired immunity due to High Low risk of outbreak occurring Low risk of outbreak occurringprevious exposure to disease Any outbreak is likely to feature a low Any outbreak is likely to feature a low attack rate
attack rate Very low risk for individual XLow risk for individual X overall (but high should an outbreak occur)
NP 61crc 15/5/08 10:42 am Page 24

Chapter 3 The effects of crises on health
Resuming routine EPI-style vaccination is important, butimplementing special ‘catch-up’ vaccination campaigns soas to rapidly restore coverage above the herd immunitythreshold is paramount. Obviously, one-dose vaccines (e.g.measles, meningitis, yellow fever) are more amenable tovaccination campaigns.
Some vaccines confer protection not only against TR, butalso partly against Pr and CFR. For example, measlesvaccination will reduce the number of infections, butalso the proportion of infections that result in severedisease.
Poor water, sanitation and hygiene conditions
Inadequate water, sanitation and hygienic behavioursmainly increase the TR of faecal-oral diseases, byincreasing the likelihood that a faecal pathogen expelledby a person or animal will be ingested by another person,through one of the following routes:
• Water is already contaminated at the point ofcollection:– Surface water (pools, lakes, rivers) contaminated
by excreta from defecation runoff.– Wells, pumping systems or aqueducts con-
taminated by surface water or faeces, which seep inwhen floodwater overwhelms defences; wells areunprotected (meaning surface water can flow intothem, or people must dip hands or containers intothem); and when aqueducts have holes or lowpressure.
– Aqueducts or pumping systems drawing oninsufficiently purified water (through chlorination orother methods). Note that most deep wells/boreholes draw from microbiologically pure ground-water.
• Water is contaminated after collection, e.g. whencontainers cannot be sealed and have a wide neck, orhands are dipped into them.
• Food is contaminated during preparation:– Food is washed with contaminated water.– Market sellers, cooks or consumers handle food
with contaminated hands.– Flies smear themselves with pathogens while
feeding on faeces, and deposit them on food.Proliferation of flies is a telling sign of grosslyinsufficient sanitation.
• Hands are contaminated during visits to unsanitarylatrines or defecation fields, while washing babies orhandling animals, while playing, etc.
Unplanned mass displacement leaves people withoutadequate water and excreta disposal. Water and sanitationalso deteriorate, albeit more slowly, in entrapmentconditions: sources may be inaccessible due to insecurity;aqueducts, pumps and latrines fall into disrepair. Floodsare a hazard for water availability mainly becausecontaminated floodwater can enter aqueducts or wells.Food crises resulting from drought obviously entail waterquantity problems.
Interventions that interrupt transmission routes includehygiene promotion (soap and utensil distribution,education, market improvements); water supply (boreholedrilling, water pumping, etc.); water quality improvementsat the collection point and afterwards (chlorination,provision of appropriate containers and fuel for boilingdrinking water); and sanitation (latrines). Water quantitytakes priority over quality: if water is scarce, people cannotwash, thus facilitating the hands route. Providing latrinesfor each household decreases disease transmissioncompared to latrines shared among many households. Allthese interventions have a considerable impact ondiarrhoeal disease in stable settings, and this effect islikely to be greater in crises.17
Inadequate water, sanitation and hygiene also lead tohigher TR of air droplet (due to poor facial and handhygiene) and vector-borne (due to stagnant water pools)infections.
High exposure to and/or proliferation of disease
vectors
Four properties of vectors influence disease control: howmany there are per human being, how often they bitehumans (‘c’), how efficiently they transmit or acquire theinfection during bites (‘p’) and how long they remain aliveand infectious (‘d’). Increases in all of the above raise the Rand thus TR of vector-borne diseases, such as malaria (byfar the most important), dengue, yellow fever and sleepingsickness.
Because of poor nutrition and treatment, vector-bornedisease will be more severe (higher Pr and CFR) in a crisis-affected population, even if TR does not increase. However,only some crisis conditions could result in proliferation andhigh exposure to vectors:
• Flooding can result in vector proliferation (particularlymosquitoes) in stagnant water. However, floodingcould also wash away insect larvae. Salty floodwater,as after a tsunami, may actually inhibit larval breeding.
• Shelters of people displaced into camps or hostcommunities may be more exposed to vector bites. Itmay also suddenly expose them to a vector-bornedisease that is not endemic to their area of origin, andto which they have no immunity, resulting in severeepidemics, irrespective of whether vector proliferationis unusual.
The main reasons for sudden vector proliferation areunrelated to crises, and have to do with climateabnormalities or changes in the environment, andwhether vectors for a given pathogen can actually survivein the local environment. Vector ecology is very delicateand complex: for example, mosquitoes’ lifespan, larvalcycle and incubation of malaria parasites in the gut alldepend on temperature and humidity. If an increase indisease-carrying vectors is suspected, an evaluation byan experienced entomologist is useful to accuratelyassess risk.
25
NP 61crc 15/5/08 10:42 am Page 25
Public health in crisis-affected populations
Lack of and/or delay in treatment
Treatment primarily decreases the CFR of diseases. Thedifference between a disease’s CFR with and withouttreatment can be dramatic: for example, severe malariaand ARI may kill about 30–50% of those affected, but thisCFR can be <5% with timely treatment. Many diseases arealmost never lethal (e.g. scabies), but some cannonetheless cause disabilities (e.g. limb amputation withfilariasis; blindness with trachoma) that make treatmentimperative. CFR usually increases with delay in treatment.Delayed care-seeking also increases the proportion ofcases requiring inpatient treatment, and thus costs.
Some chronic diseases of great concern in industrialisedand transition settings, such as heart disease anddiabetes, require regular prophylactic (i.e. preventive)treatment: treatment interruptions due to inaccessiblehealth facilities or drug shortages will increase their Pr.
Treating infections can also reduce TR, since it reduces theduration of infectiousness (‘d’), an added benefit of promptcare. However, this TR reduction effect will probably not besubstantial unless a considerable proportion of infectionsaccesses health facilities.
Warfare among combatants and armed attacks
against civilians
Whether deliberately targeted or victims of indiscriminateweapons use, civilians are frequent victims of physical andmental injuries caused by weapons, physical attacks andexposure to traumatic events. The epidemiology of war-related injuries is difficult to describe as data are hard tocollect during active fighting. In International Committee ofthe Red Cross surgical hospitals, at least 19% to 35% ofpatients admitted for war injury were civilians, dependingon injury cause. About 45% of injuries were due to bullets,30% to fragments of shells, bombs and mortars and 25%to mines. These figures do not reflect patterns amongcasualties who never reached a hospital.18
Weaponry can range from knives and swords to small arms(handguns, shotguns) to heavy artillery and aerial bombing.Apart from Iraq, Lebanon and Sri Lanka, current wars aremainly unconventional and low intensity, and small armspredominate, causing perhaps 60–90% of global war injurydeaths (see http://www.smallarms-survey.org). In certainwars, such as Sierra Leone, northern Uganda and Rwanda,amputations and other atrocities have been extremelycommon, leaving a considerable proportion of thepopulation disabled for life. During war, the frequency ofexposure to traumatic events can be shocking andunderappreciated.19 In Freetown, for example, more than80% experienced traumatic events (attacks on villages,crossfire, mine explosions, bombings, burning anddestruction).20 Unfortunately, little information is availablefrom many African crises. Relief workers often arrive whenrelative security has been restored, or assist populationsthat have fled to safety. Because of communicationdifficulties and detachment from beneficiaries’ daily life,they may not perceive the degree to which war trauma has
affected and modified people’s lives. Behaviours displayedby populations traumatised on a mass scale may beexplained in part by their exposure to trauma.
Notes on some important direct causes ofdeath
From a humanitarian standpoint, reducing excess mortalityis the immediate goal. The main focus is thus on diseasesthat are (i) life-threatening and (ii) cause considerableexcess mortality now, or may do so soon if allowed tospread unchecked. Globally, most excess mortality due tocrises occurs in tropical and/or very poor settings, wherethe following list of immediate causes of death usuallyaccounts for the majority of excess avoidable deaths:
1. Acute respiratory infections (ARI).2. Diarrhoeal diseases.3. Maternal and neonatal causes.4. Tuberculosis (somewhat dependent on local TB and
HIV prevalence).5. Other AIDS-defining opportunistic infections (very
dependent on local HIV prevalence).6. Malaria (very dependent on local malaria transmission).7. Intentional injury due to acts of war (dependent on
intensity and patterns of warfare).
We intentionally leave out malnutrition, measles and HIV,and instead discuss these as underlying conditions. Intransition and industrialised settings, heart disease anddiabetes would feature among the top direct causes.
Acute respiratory infections
Acute respiratory infections (ARI), of which pneumonia is themost common life-threatening manifestation, cause moredeaths annually (about 4 million) than any other infectiousdisease; most ARI deaths occur among young children. ARIis certainly among the top causes of death in mostemergencies in tropical and/or poor settings. Variouspathogens can cause ARI, the most important beingStreptococcus pneumoniae and Haemophilus influenzae.21
Despite scarce evidence, it appears that these pathogensinfect children in the first months of life, settling in the noseand throat without necessarily causing illness. However, thepathogens can then invade the lungs, causing pneumonia,as a result of a concurrent infection (for example, with theflu), environmental risk factors or an immunity decline dueto malnutrition, HIV infection or measles.
While preventing infection of the upper airways (the TRstep) is important, probably the most striking effect ofcrises on ARI is at the level of Pr and CFR. Because mostARI is bacterial in origin, it can be treated with antibiotics.If not treated promptly, cases can deteriorate to severe ARIover days, requiring hospitalisation.
Apart from crisis, risk factors for ARI in children includeVitamin A deficiencies (Vitamin A supplements are veryeffective to reduce the risk of ARI among children, as theyaddress one of the key micronutrient deficiencies in
26
NP 61crc 15/5/08 10:42 am Page 26
Chapter 3 The effects of crises on health
children with insufficient nutritional intake), lack of orpartial breastfeeding and exposure to indoor smoke.22
ARI has received far less attention in crisis settings thanother leading diseases. This attitude must urgently bereversed. Specifically, systematic mass vaccination ofinfants with Haemophilus influenzae type B andpneumococcal conjugate vaccines, both available, cheapand highly effective, should be considered.
Diarrhoeal diseases
These can be due to viruses, bacteria or other micro-organisms, but, as with ARI, treatment does not requireidentification of the causative pathogen. Some diarrhoealpathogens cause watery, prolific diarrhoea, others bloodyor mucous excretions. Diarrhoeal deaths are among theeasiest to prevent: death occurs due to dehydration,following rapid fluid loss because of vomiting anddiarrhoea. The primary goal of treatment is not toeliminate the infection, but simply to keep the patienthydrated until their immune system successfully fights offthe infection. Patient evaluation is based on the degree ofdehydration: mild or moderate cases are treatable asoutpatients with oral rehydration salts (ORS), but severecases must be referred, and receive both ORS andintravenous fluids. The greater the delay between onsetand diagnosis, the harder the treatment, and the higherthe CFR. Dehydration can kill within hours, especially in analready weakened individual.
Diarrhoeal diseases are mainly life-threatening for children,but epidemic shigella (bloody dysentery) and cholera alsoaffect adults: the occurrence of severe dehydration deathsamong adults indicates a possible epidemic of eitherpathogen. Shigella is treatable with antibiotics, but bacterialresistance is widespread, and strains must be tested forsusceptibility to various drugs to optimise treatment.Rotavirus and giardia can also cause severe epidemics.
Maternal and neonatal causes
These are grouped together because they stem fromcommon problems, and because outcomes in the motherinfluence the risk in the newborn child. Maternal deaths (i.e.related to pregnancy) have infectious and non-infectiouscauses, including haemorrhage, hypertension, infection,obstructed labour, unsafe abortion and underlying causessuch as HIV infection, malaria and domestic violence orsuicide directly linked to the pregnancy.
Neonatal deaths (deaths in the first 28 days of life)represent about 40% of all mortality under 5 years. Almosthalf are due to infection, chiefly tetanus, ARI anddiarrhoea; the remainder are mainly due to prematurebirth and asphyxia (about one-fourth each).
Most maternal and neonatal deaths occur within the firstfew days after delivery, underscoring the importance ofprompt access to referral hospitals. The medical journalThe Lancet recently hosted reviews of neonatal andmaternal mortality.23
Tuberculosis
About one in three humans is infected with TB bacteria.However, only a small, vulnerable proportion developsactive TB disease, mostly pulmonary. Untreated TBprogresses over months and years but has a CFR of about30–50%. Drug resistance is a major problem: treatmentconsists of combinations of at least three antibiotics, lastsat least six months, and should be observed. TB treatmentprogrammes are vertical. Repatriated refugee cases areoften hard to manage because treatment policies varyacross countries. Interrupting treatment worsens theprognosis, and greatly increases the chances of the TBstrain becoming resistant to more drugs. Chiefly for thisreason, relief agencies have traditionally been reluctant toinitiate TB programmes among unstable or inaccessiblepopulations.24 The evolution of TB infection is greatlyinfluenced by concurrent HIV infection.
Malaria
Transmitted by mosquitoes, malaria is heavily affected byclimate and environmental changes. Epidemics haveoccurred in crisis-affected populations, causing staggeringdeath tolls.25 In malaria-endemic settings, the disease ismainly life-threatening for children, pregnant women andAIDS patients; other groups enjoy partial immunity derivedfrom frequent exposure to the parasite (in much of sub-Saharan Africa, infection prevalence is over 50%). Wheremalaria is sporadic or absent, immunity does not build upwith age and the entire population is susceptible. Thesudden displacement of non-immune populations intomalaria-endemic areas is a major epidemic risk factor. Again,early diagnosis and treatment greatly improves the chanceof survival. Parasite resistance to old-generation drugs is amajor issue: recently developed artemisinin-basedcombination therapies (ACT) are being deployed worldwideand are highly effective, though more expensive.
Intentional injury
Deaths due to intentional injuries are usually clustered inspace and time, corresponding with battles andmassacres. During periods of acute violence, injury deathscan dominate the mortality profile: in West Darfur, up to93% of deaths before IDPs arrived in camps were violent,constituting a 20-fold increase from baseline mortalityrates.26 In industrialised or transition settings such as theformer Yugoslavia, Iraq and Lebanon, most excessmortality has been due to injury. Elsewhere, thecontribution of injury is smaller, although usually higherthan combatants are prepared to admit. The observed ratioof fatal to non-fatal injuries ranges between 2 and 13,though it is typically around 3–4.27
HIV, measles and malnutrition: killers byproxy
HIV infection, measles and malnutrition are three keyunderlying conditions responsible wholly or partly formany other diseases, and act similarly. The HIV virus itselfdoes not kill anyone; the measles virus is very rarely fatal;
27
NP 61crc 15/5/08 10:42 am Page 27

Public health in crisis-affected populations
and malnourished children rarely ‘starve to death’. Allthree conditions, however, deeply compromise victims’immune system. Immunity loss facilitates TR, results infaster and higher Pr and increases CFR. Various infectionsexploit this increased vulnerability (see Figure 10 for themost important relationships).
HIV infection
HIV is a subject of its own, and its role in crises has beenconsidered elsewhere.28 Knowledge and policy onHIV/AIDS are evolving rapidly, but, at the time of writing,the following points can be stressed:
• Individual risk of HIV infection can increase because ofconflict and forced displacement for certain populationgroups (e.g. victims of sexual violence; women whosurvive through commercial sex). However, there ispresently no evidence that conflict per se increases HIVTR at the population level, and the reverse may in factsometimes hold.
• However, preventing HIV infection during crises is anextremely important activity with long-term benefits.
• HIV-positive individuals have a severely compromisedimmune system, and are more at risk of easily treatableinfections such as diarrhoea, ARI and malaria, as wellas certain opportunistic infections (e.g. cryptococcalmeningitis, Pneumocystis carinii pneumonia, toxo-plasmosis) that are almost unheard-of in HIV-negativeindividuals. TB is actually the most important HIVopportunistic infection, and is the leading immediatecause of AIDS death: HIV-positives have a relative riskof 6–7 of developing active TB.
• In crises, prevalent HIV infections will progress evenfaster (Pr) to full-blown AIDS due to risk factors thatfavour the TR of common and opportunistic infections,or the Pr of latent opportunistic pathogens (especiallyTB) which patients are already infected with. The AIDSburden will depend on the HIV infection prevalence inthe crisis-affected population (thus, AIDS is a far moreimportant underlying cause of death in the IDP campsof northern Uganda, where HIV prevalence is about 9%,than in Afghanistan, where it is probably very low).
• Most infections in an HIV-positive individual carry ahigher CFR than in HIV-negatives.
• Many HIV opportunistic infections are difficult to treat,requiring drugs usually not included in standardemergency kits.
• Antiretroviral therapy has a marked reconstitutingeffect on the immune system; patients receiving thesedrugs experience fewer common and opportunisticdiseases and much improved survival. So far,antiretrovirals have mostly not been offered in reliefoperations, for various objective or perceived reasons(need for sophisticated diagnostics and patient follow-up; fear of treatment interruptions). Operationallyfeasible models for delivering antiretrovirals in times ofcrisis need to be developed.
Measles
Measles is usually considered an immediate cause ofdeath: 345,000 child deaths were attributed to measles in2005, despite a cheap, easily administered vaccine (seewww.measlesinitiative.org). The virus unleashes a cascadeof harmful events: many cases develop ARI (about
28
Figure 10
Known important interactions between underlying and immediate causes of disease
and death
: Evidence has recently emerged that malaria may speed up HIV/AIDS progression
Malaria
TB
Measles
Malnutrition
HIV
Diarrhoea
ARI
Note: Direction of arrow indicates cause and effect link. Note that more interactions may be discovered in the future
NP 61crc 15/5/08 10:42 am Page 28

Chapter 3 The effects of crises on health
70–80%) and/or diarrhoea, blindness and/or they becomemalnourished. Malnutrition in turn increases disease risk.
Measles is highly contagious: almost all non-immunechildren become ill if exposed to an infectious contact(high ‘p’, high Pr). Outbreaks thus expand very rapidly,underscoring the need to vaccinate 100% of children(usually six to 59 months, sometimes up to 14 years old)before outbreaks, and maintaining a high vaccinationcoverage thereafter. Main risk factors for outbreaks arediscussed below (see Table 7). At the individual level, apartfrom vaccination itself, malnutrition is the greatest risk,considerably increasing CFR.
Once outbreaks start, reactive mass-vaccinationcampaigns can have considerable impact on transmissionand thus mortality even if conducted late.29 However, eventhe fastest campaigns will take 7–15 days to get underway,which, combined with the usual delay in detecting anoutbreak, plus the time required for those vaccinated todevelop antibodies to the virus (about 15 days), means theepidemic will run unchecked for at least 1.5 months. Pre-emptive vaccination is thus best.
Malnutrition
An in-depth discussion of malnutrition and nutritionalcrises is beyond the scope of this paper, and we referreaders to other sources.30 However, the following pointsshould be emphasised:
• About half of deaths among children under five years ofage worldwide can be attributed to malnutrition, evenin non-crisis conditions. This proportion is similar forthe top diseases (ARI, diarrhoea, malaria).
• Insufficient nutrient intake leads to protein-energymalnutrition. Insufficient intake of certain micronutrients(e.g. Vitamin A, zinc) causes micronutrient deficiencies.Micronutrient deficiencies also increase the risk ofprotein-energy malnutrition, and vice versa.
• Protein-energy malnutrition can be chronic or acute.Chronic malnutrition (stunting) results from insufficientnutrient intake over a protracted period, and entailsnumerous long-term consequences for the child’sdevelopment. Acute malnutrition (wasting) results fromrapid weight loss or failure to gain weight, and is thefocus of nutritional attention in crises.
• There are two manifestations of acute malnutrition:marasmus (fat and muscle depletion; children appearvery thin), and kwashiorkor (fat and muscle depletionplus oedema, i.e. body swelling, due to fluid loss fromtissues). Marasmus is more common, but the two canoccur together. Classifications of acute malnutrition intosevere and moderate are based on the weight/heightratio, oedema, and/or mid-upper arm circumference inchildren, and Body Mass Index in adults.
• Acute malnutrition has a profound, immediate effect onimmunity, far increasing the TR, Pr and CFR of mostinfectious diseases, especially of diarrhoea and ARI.31
Severely malnourished children mostly die because ofcommon infections such as diarrhoea, ARI, and
malaria. In turn, disease causes malnutrition due topoor nutrient intake during illness (Figure 11).
• Acute malnutrition is a ‘prevalent’ disease, i.e. itdevelops over several weeks. The more malnourished achild is, but also the longer a child remainsmalnourished, the higher the disease risk.
• Because of the above, there is usually an associationbetween acute malnutrition prevalence and under-5mortality. Severe acute malnutrition prevalence (SAM)and global (severe + moderate) acute malnutritionprevalence (GAM) are sensitive indicators of anunfolding emergency (GAM prevalence ≥ 15% or 20%depending on agency) before mortality rates rise, andshould be measured often.
• A high SAM and/or GAM already denote a failure ofhumanitarian relief and international protection toforestall the progression from food insecurity tonutritional crisis: preventing malnutrition throughgeneral or targeted food distributions, or otherinterventions, is the sine qua non aim of nutritionalinterventions in crises.
• GAM does not tell the entire story: in nutritional crises,the average nutritional status of all individuals declines– the relative risk of disease and death will increase bya lot for a few very malnourished, but also by some formany more.
• Both severe and moderate malnutrition are treatablethrough nutritional rehabilitation programmes.Community-based therapeutic care is increasingly theconsensus approach, whereby only severely mal-nourished children with serious concomitant infectionsare treated on an inpatient basis; the remainder receivehome-based care.32 Treatment relies on therapeuticfoods and drugs for common infections.
• Next to children, pregnant women, HIV-infectedpersons and the elderly are most vulnerable tomalnutrition. When conditions approach famine,malnutrition impacts on all population groups,reflected in shocking all-age mortality rates. Themanagement of adult malnutrition is less standardised.
• Micronutrient deficiencies are less visible, and hard tomeasure, but they also greatly increase diseasesusceptibility (especially vitamin A and zincdeficiencies). ‘Epidemics’ of micronutrient diseasessuch as scurvy (due to vitamin C deficiency), pellagra(vitamin B3 or niacin), and beri beri (vitamin B1 orthiamine) have occasionally constituted serious publichealth problems in emergencies.
Epidemics versus endemic diseases
Risk factors for epidemics
During periods of crisis, morbidity and mortality may bedriven mainly by epidemics, occasionally so severe that asingle disease accounts for most community deaths.
Table 7 reviews the main epidemic risks as a function ofcrisis conditions, helping to show why entrapment andmass displacement into camps (which featuressimultaneous overcrowding, interruption of services
29
NP 61crc 15/5/08 10:42 am Page 29

Public health in crisis-affected populations
30
Figure 11
Correlation between mortality rate and prevalence of acute malnutrition among children
under 5 years in refugee camps
Dea
ths
per 1
000
child
ren
per m
onth
<5 5–9.9 10–19.9 20–39.9 40+
Prevalence (%) of low weight for height
16
14
12
10
8
6
4
2
0
Reproduced from M. J. Toole and R. M. Malkki, Famine-Affected, Refugee, and Displaced Populations: Recommendations for Public Health
Issues, US Department of Health and Human Services, Public Health Service, Centers for Disease Control, Atlanta, GA, 1992.
Table 7: Known main risk factors for major epidemics in crisis-affected communities
Main risk factor Crisis condition which can
produce risk factor
Main epidemic diseases of
concern
Timing after onset of risk
factor (time window to act)
1 2 3 4 5
Flooding X Malaria At least 1 monthIntense rainy season DengueTemperature abnormalities Rift Valley Fever
Movement of people from X X Malaria At least 1 month non-endemic into disease-endemic region
Dry season Meningitis About 2 weeks
Overcrowding X Measles As little as 2 weeksMeningitis
Insufficient water X X ? Cholera As little as 2 weeksContaminated water X X ? X Shigella (bloody dysentery)
Very poor sanitation X X ? Rotavirus
Poor nutrient intake Measles Starting about 1–2 monthsCholera
X Shigella (bloody dysentery)Rotavirus
Interruption of routine X X ? Measles A few monthsvaccination activities
Note: Much depends on whether the disease can be transmitted in the local environment
Condition 1: Progressive loss of livelihoods and deterioration of essential services, with entrapment in one’s community due to the ever-presentrisk of violence. Condition 2: Mass displacement into a regimented or camp-like settlement of large population size. Condition 3: Displacementinto neighbouring host communities. Condition 4: Sudden loss of livelihoods and rapid environmental change (including flooding) due to anatural disaster. Condition 5: Nutritional crisis.
NP 61crc 15/5/08 10:42 am Page 30

Chapter 3 The effects of crises on health
including vaccination, and insufficient nutrition) are therifest conditions for epidemics.
Box 5 compares the situation in Goma, 1994, with that inAceh, 2004–2005, crises with strikingly different conditionsand occurrence of epidemics.
Recent epidemics in crisis settings have included severalcholera epidemics following floods (Uganda, Mozambique,India, Malawi), influenza in DRC, measles in Afghanistan, DRCand Ethiopia, meningitis in DRC, and malaria in Burundi.33
Contrary to popular belief, natural disasters carry a farlower (though not negligible) risk of epidemics than man-made crises. The list of epidemic-prone diseases thatdisplacement or entrapment can favour is considerablylonger than for natural disasters (Table 7), of whichflooding is the main concern. A particular misconception,which never fails to circulate when a major disasterstrikes, is that dead bodies and animal carcasses entail ahigh disease risk. In fact this risk is small, althoughdisposal of dead bodies is important for mental healthreasons.34
Greater endemic burden
The absence of (detected or detectable) epidemics doesnot mean that there is no health emergency. Many riskfactors will result in an increase in IR, Pr or CFR for a varietyof endemic diseases. For example, insufficient water andsanitation will increase the risk of all faecal-oral diseases.While the increase in the burden of each such infectionmay not constitute an epidemic, altogether they can sumup to a staggering burden (Figure 12) that deserves asmuch attention as a single-disease epidemic, and shouldnot be treated as routine.
Epidemic versus endemic diseases: which should we
fear most?
In 2005, a widely publicised outbreak of Marburghaemorrhagic fever affected Uige province of Angola, killingabout 300 people. The Marburg virus is normally carried byanimals, but rare human outbreaks occur when people comeinto close contact with sick animals. Marburg has a very highCFR (about 80–90%), and there is no cure. At close range, itis extremely contagious, requiring strict isolation. Its R0,however, is probably low like that of Ebola, and cannotsustain widespread transmission in humans. Nevertheless,
31
Box 5
Comparison of Goma (1994) and Aceh (2004–2005) crises
Sudden refugee influx into Goma, Zaire (1994)
About 500,000 to 800,000 Rwandan Hutu refugees entered the North Kivu region of then Zaire in July 1994. About10% died within one month, mainly because of a cholera epidemic in which nearly all were probably infected, and asubsequent bloody diarrhoea (due to Shigella dystenteriae type 1) epidemic with at least 15,000 symptomatic cases.Several risk factors were present: GAM of 18–23%; only 1 L of purified water per person per day being available,most drank from the pathogen-infested Lake Kivu; the soil was volcanic and latrines were difficult to construct;camps were massively overcrowded; health care was vastly insufficient; and the shigellosis strain was resistant tomany antibiotics.
Mortality rates from Goma remain the highest ever recorded: this relief debacle prompted the establishment of theSphere Project.
Tsunami in Aceh, Indonesia (2004–2005)
Over 500,000 people were displaced into temporary shelters or host families across Aceh province, Indonesia,following the tsunami of 26 December 2004.
Small clusters of waterborne diseases (cholera, shigellosis, typhoid, hepatitis A and E), vector-borne diseases(malaria, dengue), measles and meningitis occurred after the disaster. However, apart from several hundred tetanuscases due to unclean wounds, no large epidemic was noted (as in previous tsunamis).
IDP settlements were relatively small (some only 20–30 people), with no major overcrowding. Food, safe water andadequate sanitation, as well as health care through mobile clinics and field hospitals, were provided promptly. Thepopulation was accustomed to hand washing and boiling drinking water, and GAM was low. The salty floodwatersdid not support mosquito proliferation. The disease surveillance/early warning system (EWARN) systemimplemented by WHO and the Provincial Health Office in collaboration with NGOs and other partners detected andrapidly responded to potential outbreaks.
NP 61crc 15/5/08 10:42 am Page 31
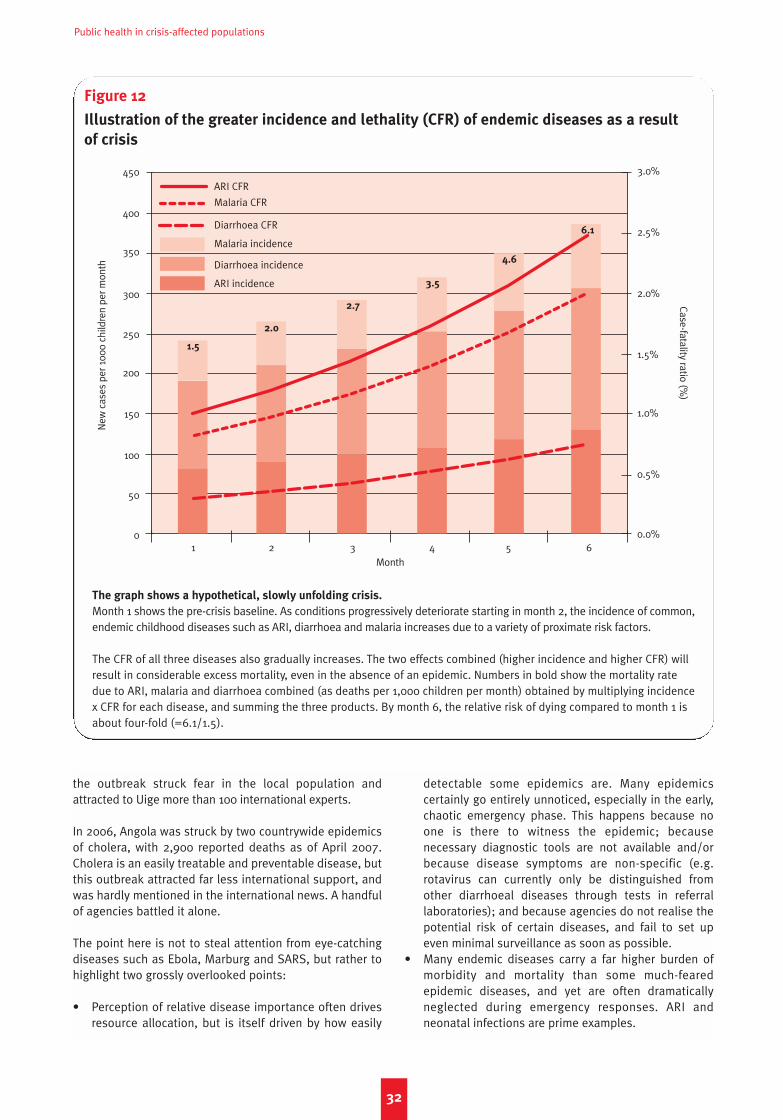
Public health in crisis-affected populations
the outbreak struck fear in the local population andattracted to Uige more than 100 international experts.
In 2006, Angola was struck by two countrywide epidemicsof cholera, with 2,900 reported deaths as of April 2007.Cholera is an easily treatable and preventable disease, butthis outbreak attracted far less international support, andwas hardly mentioned in the international news. A handfulof agencies battled it alone.
The point here is not to steal attention from eye-catchingdiseases such as Ebola, Marburg and SARS, but rather tohighlight two grossly overlooked points:
• Perception of relative disease importance often drivesresource allocation, but is itself driven by how easily
detectable some epidemics are. Many epidemicscertainly go entirely unnoticed, especially in the early,chaotic emergency phase. This happens because noone is there to witness the epidemic; becausenecessary diagnostic tools are not available and/orbecause disease symptoms are non-specific (e.g.rotavirus can currently only be distinguished fromother diarrhoeal diseases through tests in referrallaboratories); and because agencies do not realise thepotential risk of certain diseases, and fail to set upeven minimal surveillance as soon as possible.
• Many endemic diseases carry a far higher burden ofmorbidity and mortality than some much-fearedepidemic diseases, and yet are often dramaticallyneglected during emergency responses. ARI andneonatal infections are prime examples.
32
Figure 12
Illustration of the greater incidence and lethality (CFR) of endemic diseases as a result
of crisis
New
cas
es p
er 1
000
child
ren
per m
onth
Case-fatality ratio (%)
1 2 3 4 5 6Month
450
400
350
300
250
200
150
100
50
0
ARI CFR
Malaria CFR
Diarrhoea CFR
Malaria incidence
Diarrhoea incidence
ARI incidence
1.5
2.0
2.7
3.5
4.6
6.1
3.0%
2.5%
2.0%
1.5%
1.0%
0.5%
0.0%
The graph shows a hypothetical, slowly unfolding crisis.
Month 1 shows the pre-crisis baseline. As conditions progressively deteriorate starting in month 2, the incidence of common,endemic childhood diseases such as ARI, diarrhoea and malaria increases due to a variety of proximate risk factors.
The CFR of all three diseases also gradually increases. The two effects combined (higher incidence and higher CFR) willresult in considerable excess mortality, even in the absence of an epidemic. Numbers in bold show the mortality ratedue to ARI, malaria and diarrhoea combined (as deaths per 1,000 children per month) obtained by multiplying incidencex CFR for each disease, and summing the three products. By month 6, the relative risk of dying compared to month 1 isabout four-fold (=6.1/1.5).
NP 61crc 15/5/08 10:42 am Page 32

Chapter 3 The effects of crises on health
Mental illness: overlooked but omnipresent
Mental illness is a leading cause of disability worldwide,causing a greater disease burden than cancer or heartdisease. Anxiety disorders (including PTSD) are the mostcommon mental illness (global prevalence 2.4% to 18.2%),followed by mood disorders (0.8% to 9.6%), substancedisorders (0.1%–6.4%) and impulse-control disorders(0.0%–6.8%). Nearly 800,000 commit suicide annually,35
and 76.3% to 85.4% of cases in less-developed countriesreceive no care.36
The prevalence of mental illness37 is consistently elevatedin crises, roughly two to four times that in stablesettings.38 In post-war Afghanistan, more than two thirdsshowed signs of depression and other mental illnesses.Prevalence of PTSD alone can range between 20% and30% even years after wars end.39 The more violent traumaindividuals are exposed to, the higher their risk of mentalillness.40 Specific sub-groups may be particularly affected,and feature specific types and severity of conditions.Children, mothers and the elderly may have differentcoping mechanisms and progression of illness than others:mental health assessment within these groups should bean early intervention. The impact of mental illness ongeneral health cannot be overstated. PTSD and depressionmay present as apathy, disregard for family members,suicide and unexplained early death.41
Measuring mental illness within disparate populations ischallenging. Questionnaires specific to developingcountries have yet to be developed; researchers use toolsdeveloped for Western societies (for example, the Harvard
Trauma Questionnaire), but there is little consensus ontheir applicability to non-Western settings.42
Predicting the extent and patterns of mental illness indifferent crisis conditions is difficult. In entrapmentsettings, populations may have suffered more torture orsevere physical or mental injuries, causing long-lastingeffects on mental health.43 But displaced populations maysuffer elevated depression and PTSD due to the squalor ofcamp life or poor expectations of their future. AmongBhutanese refugees in Nepal, camp life increased suiciderisk.44 The association between intensity of trauma andmental illness is not obvious: certain cultures caneffectively deal with mental trauma through copingmechanisms such as religion, meditation and education.45
Victims of sexual violence may have severe mental illness,but these cases often go unrecognised because of stigma.
Interventions to prevent and treat mental illness in criseshave been few and are poorly documented. The evidencebase is slim, especially for crisis settings. Aid agencies mayinitiate immediate debriefing interventions and ad hoccounselling, but there is not yet compelling evidence toprovide these services and some studies suggest they maybe harmful.46
Population-wide interventions such as community-basedcounselling are an area of considerable attention, but also lack evidence. Population-wide interventions or the integration of mental health in other basic healthservices require coordination among agencies and thedevelopment of culturally specific and acceptableinterventions.47
33
NP 61crc 15/5/08 10:42 am Page 33

Public health in crisis-affected populations
34
NP 61crc 15/5/08 10:42 am Page 34

Which health problems?
General points
The process of prioritising health problems to be tackledshould occur systematically. We distinguish between twophases: the onset of a new crisis, necessitating a new reliefresponse; and the monitoring of an evolving crisis afterrelief has arrived.
Following Chapter 3’s framework, questions to ask whenfirst hearing about a new or ongoing crisis could be:
• Which of the three demographic and epidemiologicsettings is the crisis taking place in? Is any health crisisgoing to be driven mainly by infectious or non-infectious diseases?
• Which of the five crisis conditions are present?• Is there any information on the extent to which the
main proximate risk factors are present?• In this setting and these crisis conditions, how will
these risk factors generally affect the TR, Pr and CFR ofthe various classes of infectious and non-infectiousdiseases?
An estimate of the size of the population that is beingtargeted either for exploratory assessment or forintervention is a further necessary starting point. Methodsto estimate population size are reviewed elsewhere.48
The above provides at least a frame of reference for short-listing likely health problems to consider. For example,the 2006 Israel–Hezbollah war in Lebanon took place in asetting with residual infectious disease threats,especially among children, but mainly chronic diseaseproblems, including mental illness due to trauma.Displacement into neighbouring communities or verysmall camps was the main crisis condition, though non-displaced communities in the south experienced short-lived entrapment conditions. The main proximate riskfactors in the immediate term appeared to be lack ofand/or delay in treatment, and warfare itself (especiallybombing), but a food crisis was possible within weeks inthe trapped communities of the south if relief was notallowed through.
The next step is to identify and rank existing healthproblems as well as imminent threats, so as to select andprioritise interventions.
As soon as relief arrives, prospective surveillance becomesa critical tool to identify emergent health problems, and toadjust the relative weight of different interventions toaddress any observed gap.
Onset of a new crisis: epidemiological risk
assessment
A systematic assessment of disease risk (risk assessment)is necessary to guide interventions designed to mitigatethis increased risk (risk management). The riskassessment process reviews available evidence and expertopinion to predict both the likelihood and present orpotential impact of specific diseases. Here we describe, asan established example, the risk assessment approach ofthe WHO Communicable Diseases Working Group onEmergencies (CD-WGE).49
In response to a new crisis, the CD-WGE meets urgently tosystematically review available data (including outbreaknotifications, relevant Ministry of Health data from affectedcountries, published literature, reports and surveys) in orderto better define the risk of infectious diseases and generaterisk profiles for the crisis (see examples at http://www.who.int/diseasecontrol_emergencies/toolkits/en/).
The infectious disease risk assessment consists of threesteps:
1. Event description is the process of systematicallyassessing the type of crisis and the characteristics ofthe population affected. This is analogous toconsidering the crisis conditions present (see above).
2. Threat/vulnerability assessment identifies potentialinteractions between the emergency-affectedpopulation (host factors), likely pathogens (agents)and exposures (environment) that determine thepresence of risk factors for infectious disease. Anassessment of the likely pathogens and vectors iscritical. Both endemic and epidemic-prone diseases, aswell as any disease control programmes operating inthe area, are considered in terms of incidence,prevalence, usual CFR in similar populations,seasonality and history of recent outbreaks.
3. Risk characterisation combines the above informationfor each disease into a matrix grading both thepotential magnitude of the health impact and thelikelihood of the event occurring (Box 6).
The above exercise can apply for any disease, not justinfections. For example, circumstantial evidence couldindicate that intentional injury is an expected majorcause of morbidity and mortality, or that levels ofexposure to violence (for example, reports that manynewly arrived refugees have been raped) are consistentwith a high frequency of PTSD, which would urgentlyneed to be addressed. Risk assessment also enablescrude calculations of drugs and supplies for casemanagement.
35
Chapter 4Determining priority health problems and interventions
NP 61crc 15/5/08 10:42 am Page 35

Public health in crisis-affected populations
Data sources include:
• Evidence about the morbidity profile of similar pastcrises (e.g. other mass displacement crises in tropical orpoor settings).
• Maps of the worldwide distribution of given diseases(e.g. one would not consider dengue fever a risk in theMiddle East since the vector mosquito is absent).
• An online keyword search for academic papers on givendiseases in the country of interest (e.g. through GoogleScholar or PubMed: http://www.ncbi.nlm.nih.gov/sites/entrez?db=pubmed).
• A global dataset of past epidemics provided by Promed(http://www.promedmail.org/pls/promed/).
• Yearly/quarterly epidemiological digests from thesurveillance branch of the local Ministry of Health,going back a number of years.
• WHO databases and archives.• Relief agency situation reports.• Media reports.
The aim at this stage is not to accurately predict theoccurrence of each disease, but to deploy a response thatcombines both preventive and curative interventionsagainst the likely major current and possible threats. A veryin-depth assessment would be too time-consuming andmight not yield a justifiably greater amount of certainty.
After the onset: epidemiological surveillance
Data from health structures serving the affectedpopulation is useful, but not necessarily for setting initialpriorities. Rather, it should become part of a surveillancesystem, to be implemented as soon as possible (i.e. days,not weeks) after a relief operation gets underway.
In crises, the main purpose of surveillance is to detectepidemics with minimum delay. The implementation ofsurveillance systems requires expert coordination and isbeyond our scope. However, all such systems consist of thefollowing components:
• A surveillance network, consisting of actors involved inhealth services delivery (government, NGOs etc.), thatshares information informally and reports morbidity dataregularly: often, all facilities will report (exhaustive
surveillance); sometimes, only a representative sample(sentinel surveillance) will be included in the reportingsystem, so as to lessen workload and enhance quality byconcentrating on a few ‘sentinel’ facilities only.
• A list of diseases that each facility must report on: thisshould be short and essentially determined by the riskassessment; there is usually a breakdown by agegroups and gender, on standardised forms especiallyprovided.
• Standardised case definitions for each disease in thelist (e.g. suspected cholera = acute watery diarrhoea ina person over 14 years old). A balance must be struckbetween definitions that create too many false alerts(i.e. insufficiently specific), and definitions that resultin missed or delayed outbreak detection (i.e.
insufficiently sensitive; see Chapter 5 for definitions ofsensitivity and specificity): generally, false alerts arethe lesser evil. Definitions may vary by type of healthfacility (e.g. in a hospital with a laboratory, the malariadefinition might be ‘malaria symptoms with a positiveblood slide’; in a health post, ‘fever with no otherevident causes of infection’).
• A mode of reporting: active if surveillance staff call onfacilities to obtain the data (this is done routinely forpolio), and passive if facilities send reports withoutprompting; rarely (in dramatic epidemics), surveillancefor a specific disease (e.g. cholera) occurs on a com-munity basis, i.e. community health workers visit house-holds daily, enumerating and triaging possible cases.
• A set frequency of reporting and analysis (daily duringa severe epidemic of an acute disease such as cholera;weekly otherwise).
• A reporting mechanism (e.g. health posts hand-carry tohealth centres which fax to referral hospitals; NGOclinics e-mail to WHO sub-office).
• Alert and epidemic thresholds, which specify not justthe definition of an event (e.g. ‘>3 bloody diarrhoeacases from site X during week Y = suspected cluster ofshigellosis cases’) but also action needed (e.g. ‘if one ormore cases of measles reported from site X during weekY, send a team to investigate, trace contacts, etc.’).
The main outputs of surveillance systems are trends inincidence over time, and ad hoc investigations of alertsand confirmed outbreaks. Mortality excepted, it is almostnever necessary for surveillance to capture all events;rather, what matters is being able to monitor trends overtime. Thus, collecting data from health facilities only(which rarely reflects true incidence, since only some casesaccess health care) is perfectly reasonable. However, datafrom health facilities can be skewed:
• Inpatient structures see more severe conditions, henceeliminating ‘background noise’ due to commondiseases with similar symptoms: a malaria epidemicmight first be detected via rising hospitalisations forsevere malaria; any pandemic influenza epidemicmight first become evident in hospitals (elsewhere thedisease might be indistinguishable from common flu).
• Outpatient structures provide information on the rangeand relative importance (proportionate morbidity) ofdiseases in the community, but only if they are wellattended, and if people seek care for each diseaseproportionately (e.g. communities may prefer trad-itional practitioners for certain conditions); thesebiases are insufficiently appreciated, especially whenrelief workers fail to explore the community.
• Community health workers may capture a morerepresentative breakdown of proportionate morbidity,but their diagnostic capacity is generally limited, andmay skew data (e.g. they may systematically classifymost ARI as malaria).
Aside from surveillance, some ongoing risk assessmentmust be maintained, especially in protracted crises. For
36
NP 61crc 15/5/08 10:42 am Page 36
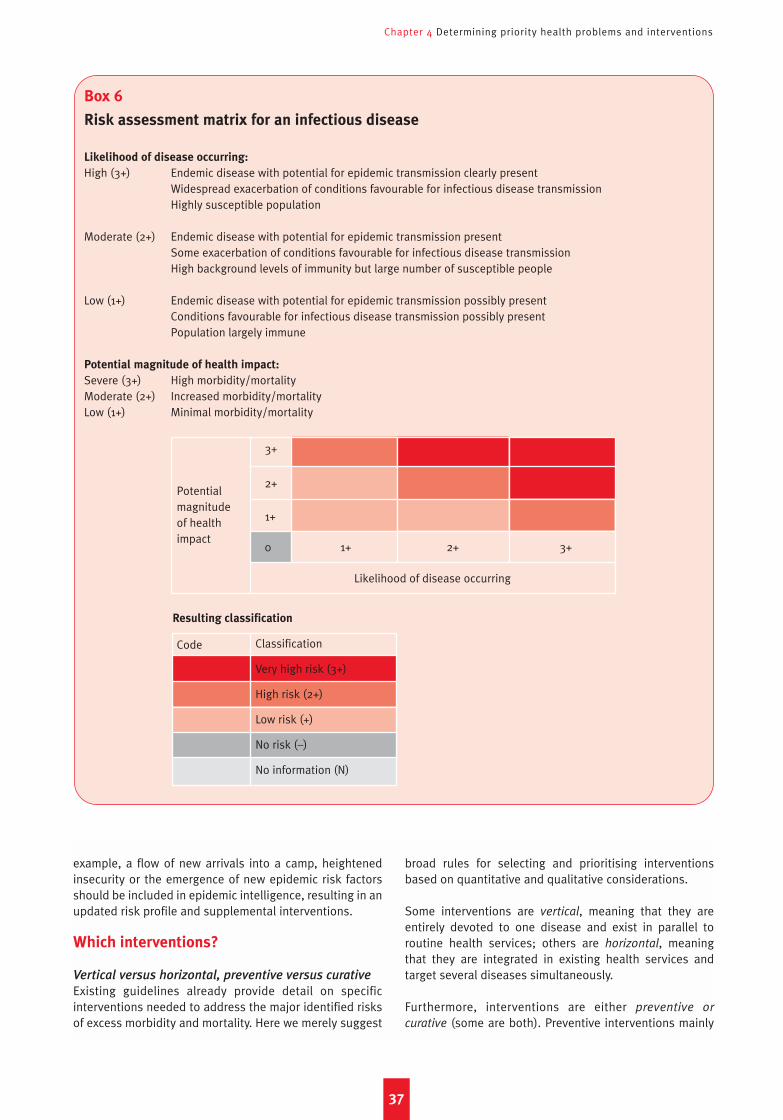
Box 6
Risk assessment matrix for an infectious disease
Likelihood of disease occurring:
High (3+) Endemic disease with potential for epidemic transmission clearly presentWidespread exacerbation of conditions favourable for infectious disease transmissionHighly susceptible population
Moderate (2+) Endemic disease with potential for epidemic transmission presentSome exacerbation of conditions favourable for infectious disease transmissionHigh background levels of immunity but large number of susceptible people
Low (1+) Endemic disease with potential for epidemic transmission possibly presentConditions favourable for infectious disease transmission possibly present Population largely immune
Potential magnitude of health impact:
Severe (3+) High morbidity/mortalityModerate (2+) Increased morbidity/mortalityLow (1+) Minimal morbidity/mortality
Potentialmagnitude of healthimpact
Chapter 4 Determining priority health problems and interventions
example, a flow of new arrivals into a camp, heightenedinsecurity or the emergence of new epidemic risk factorsshould be included in epidemic intelligence, resulting in anupdated risk profile and supplemental interventions.
Which interventions?
Vertical versus horizontal, preventive versus curative
Existing guidelines already provide detail on specificinterventions needed to address the major identified risksof excess morbidity and mortality. Here we merely suggest
broad rules for selecting and prioritising interventionsbased on quantitative and qualitative considerations.
Some interventions are vertical, meaning that they areentirely devoted to one disease and exist in parallel toroutine health services; others are horizontal, meaningthat they are integrated in existing health services andtarget several diseases simultaneously.
Furthermore, interventions are either preventive or
curative (some are both). Preventive interventions mainly
37
Likelihood of disease occurring
Resulting classification
3+
2+
1+
0 1+ 2+ 3+
Code Classification
Very high risk (3+)
High risk (2+)
Low risk (+)
No risk (–)
No information (N)
NP 61crc 15/5/08 10:42 am Page 37

Public health in crisis-affected populations
reduce TR and Pr, i.e. incidence, although they sometimeshave an intended or unintended effect on CFR. Curativeinterventions reduce CFR.
Debates around intervention choices often dichotomisepreventive and curative interventions (e.g. vector controland case management for malaria), but both areindispensable. These dichotomies may arise simplybecause the bar is set too low: in wealthy countries, nogovernment would deny citizens the combined benefits ofprevention and treatment. In poor countries and especiallycrises, health targets are usually underwhelming. Evenwhere Sphere standards are adhered to, it should berecognised that they reflect minimum targets, and thatexceeding these is no waste of resources.
Curative interventions are indispensable as diseasescannot always be prevented. Furthermore, for somediseases the mainstay of intervention is curative (forexample, TB) or effective preventive interventions areunavailable (e.g. the BCG vaccine confers limitedprotection against TB). Curative interventions can alsoreduce TR. Various levels of health care provision exist:
• Community health workers’ functions can includescreening and referring cases, diagnosing a fewdiseases through simple case definitions, andadministering treatment at the household.50
• Primary health care involves outpatient treatment of afew high-burden diseases at basic health posts orcentres, usually diagnosed without laboratory workand based on simple case definitions. Preventiveinterventions such as health education, EPI, andantenatal care also take place. Most patients are seenhere.
• Secondary health care entails inpatient care of severeor other cases that could not be managed elsewhere(e.g. because of insufficient drug range).
• Tertiary health care involves large district or regionalhospitals with specialised services (e.g. orthopaedics,gynaecology, advanced diagnostics, surgery). Fewcases are seen here, but many would die or remaindisabled without this level of care.
Referral facilities being overwhelmed with severe, veryadvanced cases can mean any of the following: (i)insufficient hospitalisation capacity; (ii) a failure tomanage cases promptly at the primary health care level;and (iii) the success of referral procedures.
Preventive interventions tend to be time-bound, requiringregular re-administration (e.g. mass deworming might takeone week and need to be repeated annually). Hence, they areoften cheaper than curative interventions. They also relievepressure on health structures by reducing the diseasecaseload, a key point underscoring their importance.
Criteria for selecting optimal interventions
Diseases may be grouped according to proximate riskfactors (unsafe water or overcrowding, for instance) to
facilitate choosing interventions. General criteria for thischoice are suggested:
• Potential for addressing the main health problems:– Interventions should address diseases identified in
the risk assessment.– Interventions should be prioritised to address the
high risk diseases first.• Feasibility:
– Implementing the intervention should theoreticallybe feasible given local logistics, human resources,security, etc.
• Maximum opportunity benefit:– Interventions should have the potential to target
several diseases at once (e.g. water and sanitation;primary health care).
– Interventions against one disease only (e.g. vectorcontrol against malaria; hepatitis A vaccination)should be prioritised if the disease is classified asvery high risk, but not otherwise.
– Interventions should if possible be synergistic (e.g.safe water + sanitation + hygiene promotion resultin an overall impact that is more than the sum ofeach intervention’s impact).
• Minimum opportunity cost:– Interventions should neither exclude nor delay the
implementation of another priority intervention,and the opportunity cost of doing so should beconsidered.
• Maximum effectiveness:– The intervention with the greatest expected
effectiveness should be selected (e.g. the better oftwo types of latrine).
– When a package of interventions against a diseaseexists (e.g. water + sanitation + hygiene promotion+ early rehydration against diarrhoea), the wholepackage should be implemented, not just onecomponent.
• Maximum cost-effectiveness:– Interventions should entail the lowest cost possible
for the greatest possible outcome/impact.• Timeliness:
– Preventive interventions should be implementedbefore the potential occurrence of an outbreak orincrease in the burden of any disease.
– Interventions against a specific epidemic diseaseshould only be deployed after the onset of anepidemic if they are proven to reduce morbidityand/or mortality even after an epidemic starts.Examples are water and sanitation for diarrhoealdiseases, mass vaccination for meningitis,mosquito control and use of ITNs for yellow fever,and isolation for viral haemorrhagic fevers.
– Other interventions should only occur in the timewindow during which they are likely to have animpact. For example, indoor residual spraying mustbe completed before the malaria season starts if itis to reduce TR. Oral cholera vaccine should not beimplemented once an outbreak has started: theepidemic will usually run its course by the time the
38
NP 61crc 15/5/08 10:42 am Page 38
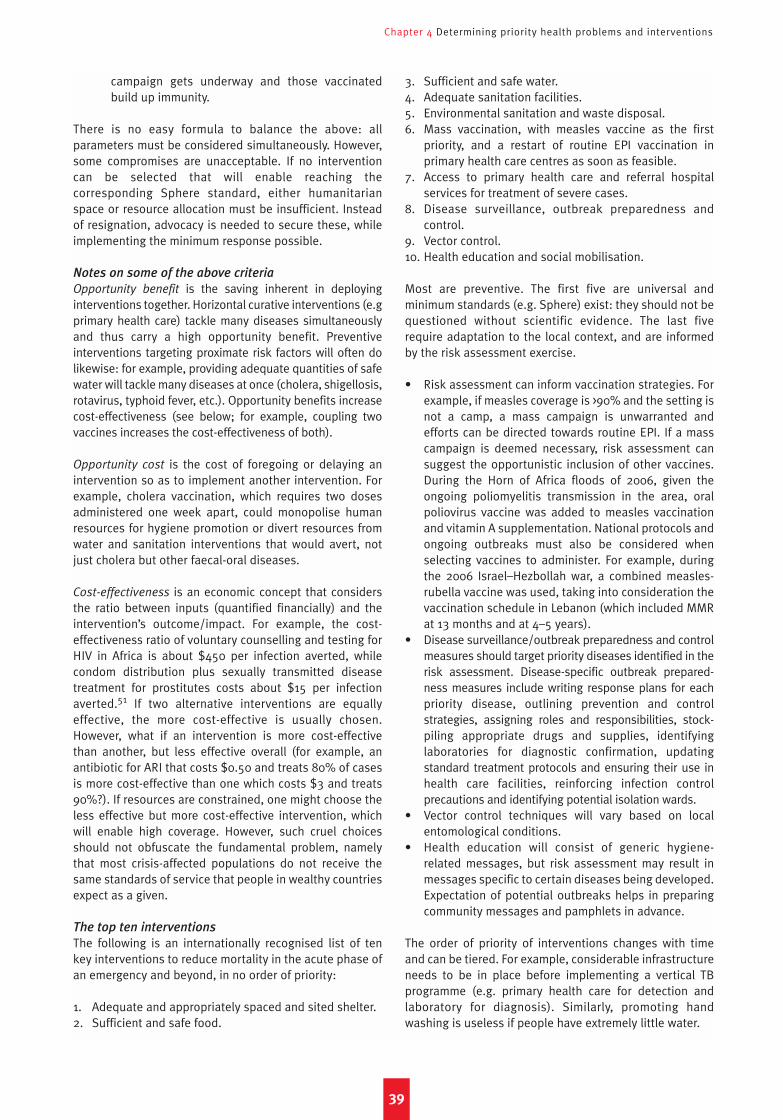
Chapter 4 Determining priority health problems and interventions
campaign gets underway and those vaccinatedbuild up immunity.
There is no easy formula to balance the above: allparameters must be considered simultaneously. However,some compromises are unacceptable. If no interventioncan be selected that will enable reaching thecorresponding Sphere standard, either humanitarianspace or resource allocation must be insufficient. Insteadof resignation, advocacy is needed to secure these, whileimplementing the minimum response possible.
Notes on some of the above criteria
Opportunity benefit is the saving inherent in deployinginterventions together. Horizontal curative interventions (e.gprimary health care) tackle many diseases simultaneouslyand thus carry a high opportunity benefit. Preventiveinterventions targeting proximate risk factors will often dolikewise: for example, providing adequate quantities of safewater will tackle many diseases at once (cholera, shigellosis,rotavirus, typhoid fever, etc.). Opportunity benefits increasecost-effectiveness (see below; for example, coupling twovaccines increases the cost-effectiveness of both).
Opportunity cost is the cost of foregoing or delaying anintervention so as to implement another intervention. Forexample, cholera vaccination, which requires two dosesadministered one week apart, could monopolise humanresources for hygiene promotion or divert resources fromwater and sanitation interventions that would avert, notjust cholera but other faecal-oral diseases.
Cost-effectiveness is an economic concept that considersthe ratio between inputs (quantified financially) and theintervention’s outcome/impact. For example, the cost-effectiveness ratio of voluntary counselling and testing forHIV in Africa is about $450 per infection averted, whilecondom distribution plus sexually transmitted diseasetreatment for prostitutes costs about $15 per infectionaverted.51 If two alternative interventions are equallyeffective, the more cost-effective is usually chosen.However, what if an intervention is more cost-effectivethan another, but less effective overall (for example, anantibiotic for ARI that costs $0.50 and treats 80% of casesis more cost-effective than one which costs $3 and treats90%?). If resources are constrained, one might choose theless effective but more cost-effective intervention, whichwill enable high coverage. However, such cruel choicesshould not obfuscate the fundamental problem, namelythat most crisis-affected populations do not receive thesame standards of service that people in wealthy countriesexpect as a given.
The top ten interventions
The following is an internationally recognised list of tenkey interventions to reduce mortality in the acute phase ofan emergency and beyond, in no order of priority:
1. Adequate and appropriately spaced and sited shelter.2. Sufficient and safe food.
3. Sufficient and safe water. 4. Adequate sanitation facilities.5. Environmental sanitation and waste disposal.6. Mass vaccination, with measles vaccine as the first
priority, and a restart of routine EPI vaccination inprimary health care centres as soon as feasible.
7. Access to primary health care and referral hospitalservices for treatment of severe cases.
8. Disease surveillance, outbreak preparedness andcontrol.
9. Vector control.10. Health education and social mobilisation.
Most are preventive. The first five are universal andminimum standards (e.g. Sphere) exist: they should not bequestioned without scientific evidence. The last fiverequire adaptation to the local context, and are informedby the risk assessment exercise.
• Risk assessment can inform vaccination strategies. Forexample, if measles coverage is >90% and the setting isnot a camp, a mass campaign is unwarranted andefforts can be directed towards routine EPI. If a masscampaign is deemed necessary, risk assessment cansuggest the opportunistic inclusion of other vaccines.During the Horn of Africa floods of 2006, given theongoing poliomyelitis transmission in the area, oralpoliovirus vaccine was added to measles vaccinationand vitamin A supplementation. National protocols andongoing outbreaks must also be considered whenselecting vaccines to administer. For example, duringthe 2006 Israel–Hezbollah war, a combined measles-rubella vaccine was used, taking into consideration thevaccination schedule in Lebanon (which included MMRat 13 months and at 4–5 years).
• Disease surveillance/outbreak preparedness and controlmeasures should target priority diseases identified in therisk assessment. Disease-specific outbreak prepared-ness measures include writing response plans for eachpriority disease, outlining prevention and controlstrategies, assigning roles and responsibilities, stock-piling appropriate drugs and supplies, identifyinglaboratories for diagnostic confirmation, updatingstandard treatment protocols and ensuring their use inhealth care facilities, reinforcing infection controlprecautions and identifying potential isolation wards.
• Vector control techniques will vary based on localentomological conditions.
• Health education will consist of generic hygiene-related messages, but risk assessment may result inmessages specific to certain diseases being developed.Expectation of potential outbreaks helps in preparingcommunity messages and pamphlets in advance.
The order of priority of interventions changes with timeand can be tiered. For example, considerable infrastructureneeds to be in place before implementing a vertical TBprogramme (e.g. primary health care for detection andlaboratory for diagnosis). Similarly, promoting handwashing is useless if people have extremely little water.
39
NP 61crc 15/5/08 10:42 am Page 39

Public health in crisis-affected populations
40
NP 61crc 15/5/08 10:42 am Page 40
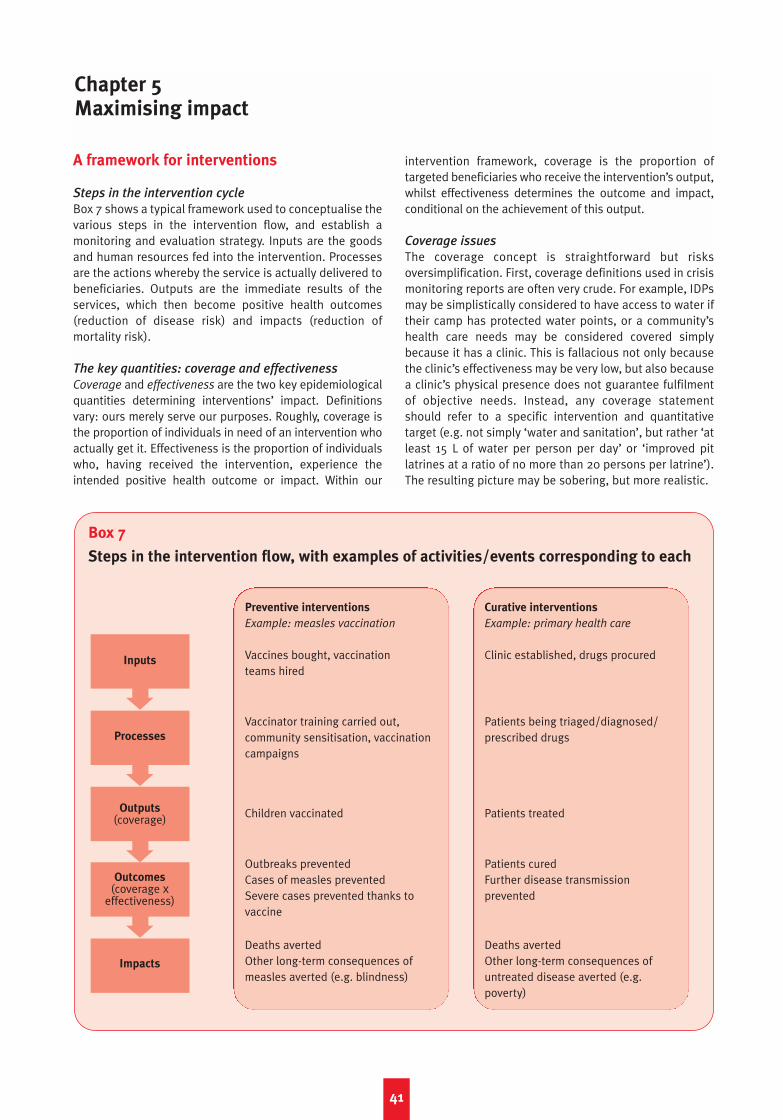
A framework for interventions
Steps in the intervention cycle
Box 7 shows a typical framework used to conceptualise thevarious steps in the intervention flow, and establish amonitoring and evaluation strategy. Inputs are the goodsand human resources fed into the intervention. Processesare the actions whereby the service is actually delivered tobeneficiaries. Outputs are the immediate results of theservices, which then become positive health outcomes(reduction of disease risk) and impacts (reduction ofmortality risk).
The key quantities: coverage and effectiveness
Coverage and effectiveness are the two key epidemiologicalquantities determining interventions’ impact. Definitionsvary: ours merely serve our purposes. Roughly, coverage isthe proportion of individuals in need of an intervention whoactually get it. Effectiveness is the proportion of individualswho, having received the intervention, experience theintended positive health outcome or impact. Within our
intervention framework, coverage is the proportion oftargeted beneficiaries who receive the intervention’s output,whilst effectiveness determines the outcome and impact,conditional on the achievement of this output.
Coverage issues
The coverage concept is straightforward but risksoversimplification. First, coverage definitions used in crisismonitoring reports are often very crude. For example, IDPsmay be simplistically considered to have access to water iftheir camp has protected water points, or a community’shealth care needs may be considered covered simplybecause it has a clinic. This is fallacious not only becausethe clinic’s effectiveness may be very low, but also becausea clinic’s physical presence does not guarantee fulfilmentof objective needs. Instead, any coverage statementshould refer to a specific intervention and quantitativetarget (e.g. not simply ‘water and sanitation’, but rather ‘atleast 15 L of water per person per day’ or ‘improved pitlatrines at a ratio of no more than 20 persons per latrine’).The resulting picture may be sobering, but more realistic.
41
Chapter 5Maximising impact
Box 7
Steps in the intervention flow, with examples of activities/events corresponding to each
Preventive interventions
Example: measles vaccination
Vaccines bought, vaccination teams hired
Vaccinator training carried out,community sensitisation, vaccinationcampaigns
Children vaccinated
Outbreaks preventedCases of measles preventedSevere cases prevented thanks tovaccine
Deaths avertedOther long-term consequences ofmeasles averted (e.g. blindness)
Curative interventions
Example: primary health care
Clinic established, drugs procured
Patients being triaged/diagnosed/prescribed drugs
Patients treated
Patients curedFurther disease transmissionprevented
Deaths avertedOther long-term consequences ofuntreated disease averted (e.g.poverty)
Inputs
Processes
Outputs(coverage)
Outcomes(coverage x
effectiveness)
Impacts
NP 61crc 15/5/08 10:42 am Page 41
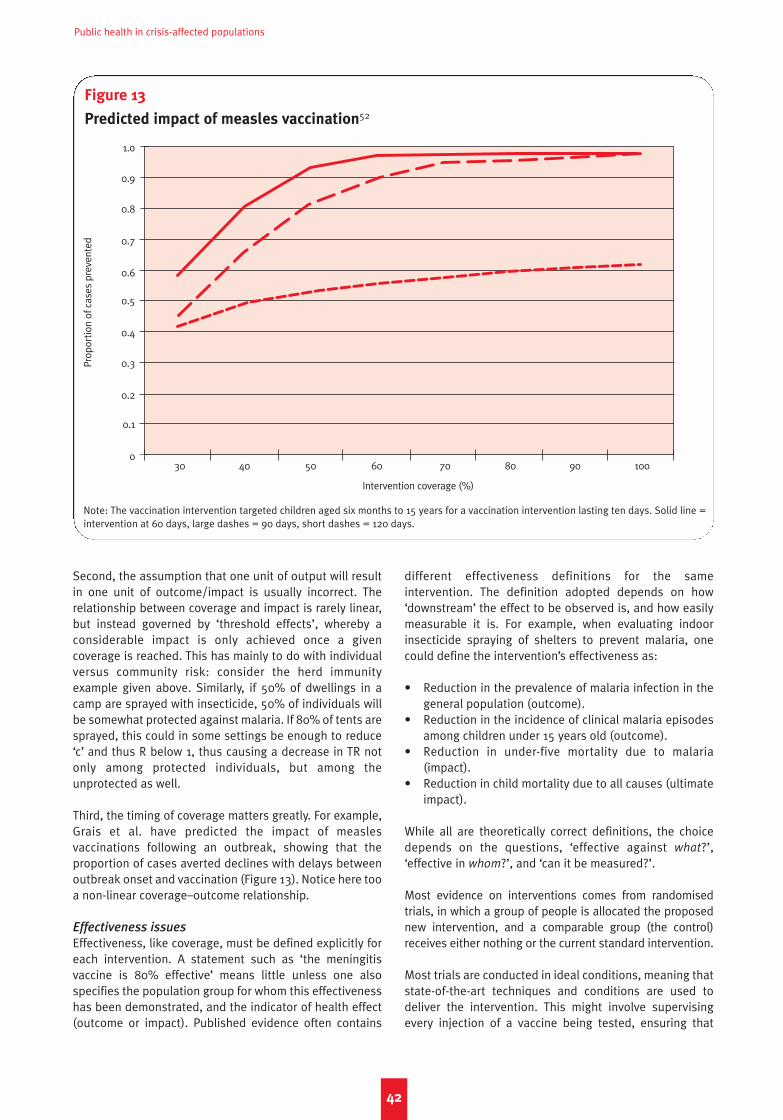
Public health in crisis-affected populations
Second, the assumption that one unit of output will resultin one unit of outcome/impact is usually incorrect. Therelationship between coverage and impact is rarely linear,but instead governed by ‘threshold effects’, whereby aconsiderable impact is only achieved once a givencoverage is reached. This has mainly to do with individualversus community risk: consider the herd immunityexample given above. Similarly, if 50% of dwellings in acamp are sprayed with insecticide, 50% of individuals willbe somewhat protected against malaria. If 80% of tents aresprayed, this could in some settings be enough to reduce‘c’ and thus R below 1, thus causing a decrease in TR notonly among protected individuals, but among theunprotected as well.
Third, the timing of coverage matters greatly. For example,Grais et al. have predicted the impact of measlesvaccinations following an outbreak, showing that theproportion of cases averted declines with delays betweenoutbreak onset and vaccination (Figure 13). Notice here tooa non-linear coverage–outcome relationship.
Effectiveness issues
Effectiveness, like coverage, must be defined explicitly foreach intervention. A statement such as ‘the meningitisvaccine is 80% effective’ means little unless one alsospecifies the population group for whom this effectivenesshas been demonstrated, and the indicator of health effect(outcome or impact). Published evidence often contains
different effectiveness definitions for the sameintervention. The definition adopted depends on how‘downstream’ the effect to be observed is, and how easilymeasurable it is. For example, when evaluating indoorinsecticide spraying of shelters to prevent malaria, onecould define the intervention’s effectiveness as:
• Reduction in the prevalence of malaria infection in thegeneral population (outcome).
• Reduction in the incidence of clinical malaria episodesamong children under 15 years old (outcome).
• Reduction in under-five mortality due to malaria(impact).
• Reduction in child mortality due to all causes (ultimateimpact).
While all are theoretically correct definitions, the choicedepends on the questions, ‘effective against what?’,‘effective in whom?’, and ‘can it be measured?’.
Most evidence on interventions comes from randomisedtrials, in which a group of people is allocated the proposednew intervention, and a comparable group (the control)receives either nothing or the current standard intervention.
Most trials are conducted in ideal conditions, meaning thatstate-of-the-art techniques and conditions are used todeliver the intervention. This might involve supervisingevery injection of a vaccine being tested, ensuring that
42
Figure 13
Predicted impact of measles vaccination52
Prop
ortio
n of
cas
es p
reve
nted
30 40 50 60 70 80 90 100
Intervention coverage (%)
1.o
0.9
0.8
0.7
0.6
0.5
0.4
0.3
0.2
0.1
0
Note: The vaccination intervention targeted children aged six months to 15 years for a vaccination intervention lasting ten days. Solid line =intervention at 60 days, large dashes = 90 days, short dashes = 120 days.
NP 61crc 15/5/08 10:42 am Page 42

Chapter 5 Maximising impact
households know how to use the new type of bed net,diagnosing trial patients with the best available tests andsupervising the treatment to ensure that all doses arecorrectly administered. Such trials produce a measure ofefficacy (or cure rate if treatments are being tested), whichreflects how the intervention will achieve its intendedoutcome/impact in ideal study conditions. Onceinterventions are implemented in real-life conditions, wespeak of effectiveness. Effectiveness in field conditions isalmost always lower than efficacy in studies.
Issues with (i) the field quality of the prevention tool; (ii) itsacceptance, understanding and utilisation by beneficiaries;and (iii) its durability in field conditions contribute toeffectiveness being lower than measured efficacy. Forexample:
• A small break in the cold chain might reduce theeffectiveness of certain vaccines.
• If a certain model of latrine is built for a community thatis not familiar with it, utilisation might be low orinappropriate.
• Routine wear and rats might tear bed nets, allowingmosquitoes to penetrate them.
In general, the efficacy–effectiveness gap will be evengreater in crises. Pre-empting such losses in effectiveness,for example through quality assurance management, isvery important.
Imagine a network of primary health care clinics, acommunity ARI treatment programme, or an emergencyrehydration intervention to minimise CFR during a choleraoutbreak. When designing and monitoring such curativeprojects, it is useful to not consider the treatment alone, butrather the entire ‘package of care’, from when patients enterthe health structure to when they leave, and beyond this tothe days during which they are supposed to take the drugs.Different sub-steps comprise this package of care:
• Diagnosis and assessment of disease severity (whichsometimes includes a triage point at the clinicentrance).
• Prescription of treatment.• Dispensing of the treatment, including an explanation
of how to take it.• Adherence to (or compliance with) the prescription by
patients or caregivers (for outpatients) or by nursingstaff tasked with administering it (for inpatients).
• Outcome of the treatment (cure versus continuedand/or worsened disease).
At each sub-step, opportunities for appropriate care can bemissed. We illustrate this in Figure 14, where wehypothesise that, at each sub-step, 80% of patientsreceive appropriate care.
The diagnosis step merits particular attention. Diagnosticaccuracy will either rely on purely clinical signs andsymptoms, or be aided by a laboratory test. The successionof clinical and/or laboratory tests that determinesdiagnosis is the diagnostic algorithm. Two possiblediagnostic algorithms for malaria are provided in Table 8.Algorithm 1 could be performed by very unskilled healthworkers, and will capture the near-entirety of malariacases, i.e. its sensitivity approaches 100%. However, it willalso diagnose other febrile diseases (e.g. flu, ARI) asmalaria, i.e. its specificity will be poor. Algorithm 2 is moreresource-intensive, and will miss quite a few casesbecause some malaria patients have fever <38.5°C andundetectable parasite levels. This algorithm’s sensitivitywill be <100%. However, its specificity will be fairly high, asother febrile illnesses will seldom be misclassified asmalaria given the criteria (high fever, positive blood test,rule out clinically any other febrile disease).
There is almost always a trade-off between high sensitivityand high specificity. Striking a compromise depends onvarious considerations:
• How deadly is the disease if left untreated? Highsensitivity will minimise cases missed and thus CFR.
• How safe is the treatment? High specificity willminimise the prescription of toxic treatments topatients who do not need them.
• How expensive or complex is the treatment? Specificitywill ensure that treatment is only administered to thosewho need it.
• Does over-treatment favour the development of drugresistance? If this risk is high, specificity should bemaximised.
• How expensive or complex is the diagnostic algorithm?Going for simple tests might reduce sensitivity and/orspecificity, but allow for much larger caseloads to beprocessed.
In field practice, especially in crises, the first considerationunderstandably overrides the others, i.e. sensitivity isgenerally privileged over specificity.
Simple, high-sensitivity case definitions such as ‘fever =malaria’ will lead clinicians to treat all fever cases asmalaria, thus overlooking life-threatening episodes of ARI.
43
Table 8: Two possible diagnostic algorithms for malaria
Diagnostic algorithm Sensitivity Specificity
1) Malaria = fever or history of fever high low
2) Malaria = fever >38.5°C + positive blood test + no sign of other moderate highfebrile infections such as ARI
NP 61crc 15/5/08 10:42 am Page 43
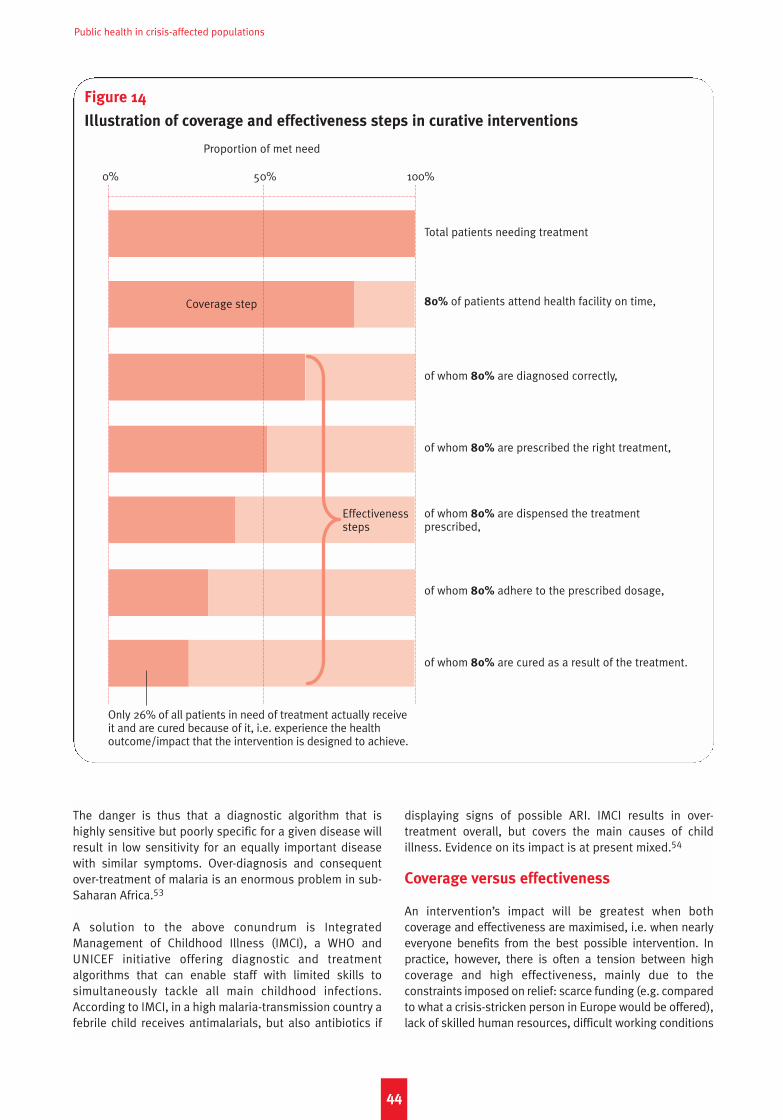
Public health in crisis-affected populations
The danger is thus that a diagnostic algorithm that ishighly sensitive but poorly specific for a given disease willresult in low sensitivity for an equally important diseasewith similar symptoms. Over-diagnosis and consequentover-treatment of malaria is an enormous problem in sub-Saharan Africa.53
A solution to the above conundrum is IntegratedManagement of Childhood Illness (IMCI), a WHO andUNICEF initiative offering diagnostic and treatmentalgorithms that can enable staff with limited skills tosimultaneously tackle all main childhood infections.According to IMCI, in a high malaria-transmission country afebrile child receives antimalarials, but also antibiotics if
displaying signs of possible ARI. IMCI results in over-treatment overall, but covers the main causes of childillness. Evidence on its impact is at present mixed.54
Coverage versus effectiveness
An intervention’s impact will be greatest when bothcoverage and effectiveness are maximised, i.e. when nearlyeveryone benefits from the best possible intervention. Inpractice, however, there is often a tension between highcoverage and high effectiveness, mainly due to theconstraints imposed on relief: scarce funding (e.g. comparedto what a crisis-stricken person in Europe would be offered),lack of skilled human resources, difficult working conditions
44
Figure 14
Illustration of coverage and effectiveness steps in curative interventions
Total patients needing treatment
80% of patients attend health facility on time,
of whom 80% are diagnosed correctly,
of whom 80% are prescribed the right treatment,
of whom 80% are dispensed the treatment prescribed,
of whom 80% adhere to the prescribed dosage,
of whom 80% are cured as a result of the treatment.
0% 50% 100%
Proportion of met need
Coverage step
Only 26% of all patients in need of treatment actually receiveit and are cured because of it, i.e. experience the healthoutcome/impact that the intervention is designed to achieve.
Effectiveness steps
NP 61crc 15/5/08 10:42 am Page 44
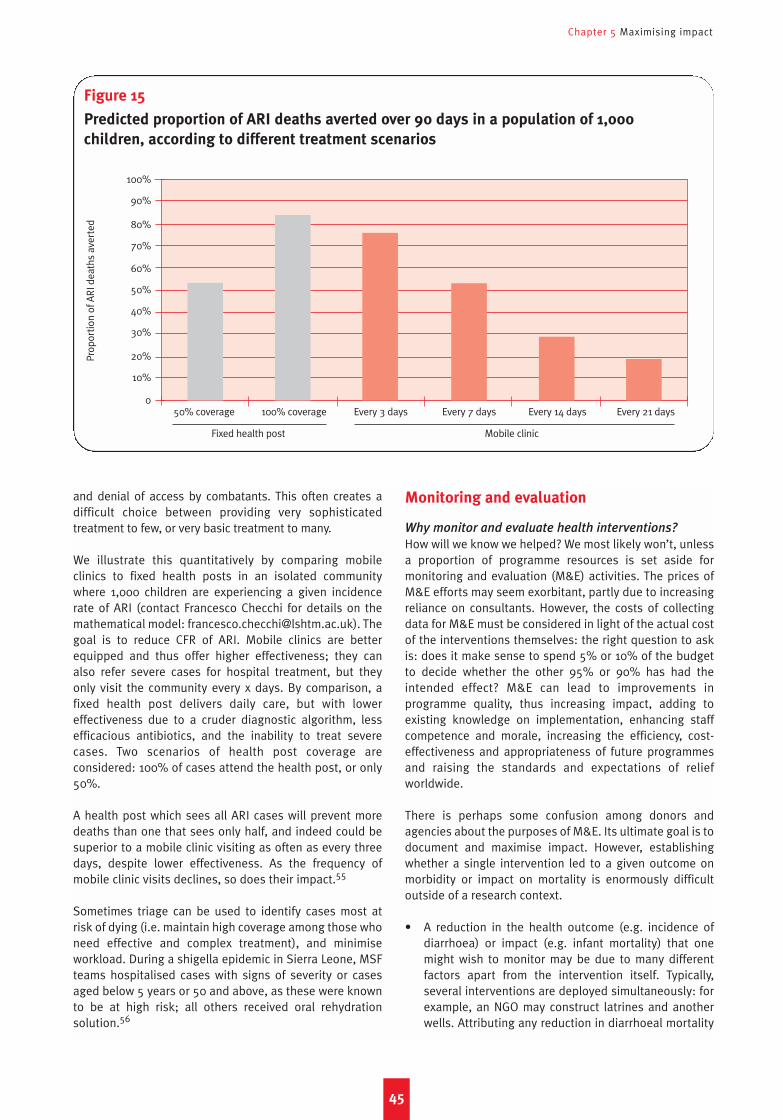
Chapter 5 Maximising impact
and denial of access by combatants. This often creates adifficult choice between providing very sophisticatedtreatment to few, or very basic treatment to many.
We illustrate this quantitatively by comparing mobileclinics to fixed health posts in an isolated communitywhere 1,000 children are experiencing a given incidencerate of ARI (contact Francesco Checchi for details on themathematical model: [email protected]). Thegoal is to reduce CFR of ARI. Mobile clinics are betterequipped and thus offer higher effectiveness; they canalso refer severe cases for hospital treatment, but theyonly visit the community every x days. By comparison, afixed health post delivers daily care, but with lowereffectiveness due to a cruder diagnostic algorithm, lessefficacious antibiotics, and the inability to treat severecases. Two scenarios of health post coverage areconsidered: 100% of cases attend the health post, or only50%.
A health post which sees all ARI cases will prevent moredeaths than one that sees only half, and indeed could besuperior to a mobile clinic visiting as often as every threedays, despite lower effectiveness. As the frequency ofmobile clinic visits declines, so does their impact.55
Sometimes triage can be used to identify cases most atrisk of dying (i.e. maintain high coverage among those whoneed effective and complex treatment), and minimiseworkload. During a shigella epidemic in Sierra Leone, MSFteams hospitalised cases with signs of severity or casesaged below 5 years or 50 and above, as these were knownto be at high risk; all others received oral rehydrationsolution.56
Monitoring and evaluation
Why monitor and evaluate health interventions?
How will we know we helped? We most likely won’t, unlessa proportion of programme resources is set aside formonitoring and evaluation (M&E) activities. The prices ofM&E efforts may seem exorbitant, partly due to increasingreliance on consultants. However, the costs of collectingdata for M&E must be considered in light of the actual costof the interventions themselves: the right question to askis: does it make sense to spend 5% or 10% of the budgetto decide whether the other 95% or 90% has had theintended effect? M&E can lead to improvements inprogramme quality, thus increasing impact, adding toexisting knowledge on implementation, enhancing staffcompetence and morale, increasing the efficiency, cost-effectiveness and appropriateness of future programmesand raising the standards and expectations of reliefworldwide.
There is perhaps some confusion among donors andagencies about the purposes of M&E. Its ultimate goal is todocument and maximise impact. However, establishingwhether a single intervention led to a given outcome onmorbidity or impact on mortality is enormously difficultoutside of a research context.
• A reduction in the health outcome (e.g. incidence ofdiarrhoea) or impact (e.g. infant mortality) that onemight wish to monitor may be due to many differentfactors apart from the intervention itself. Typically,several interventions are deployed simultaneously: forexample, an NGO may construct latrines and anotherwells. Attributing any reduction in diarrhoeal mortality
45
Figure 15
Predicted proportion of ARI deaths averted over 90 days in a population of 1,000
children, according to different treatment scenarios
Prop
ortio
n of
AR
I dea
ths
aver
ted
50% coverage 100% coverage Every 3 days Every 7 days Every 14 days Every 21 days
Fixed health post Mobile clinic
100%
90%
80%
70%
60%
50%
40%
30%
20%
10%
0
NP 61crc 15/5/08 10:42 am Page 45
Public health in crisis-affected populations
to either would require sophisticated research. Aworsening of morbidity/mortality can also occurdespite an intervention having some impact, if theintervention is deployed against a backdrop ofincreasing disease risk.
• Measurement of health outcomes and impacts ofindividual interventions requires measuring disease-specific incidence and mortality in the community(since health facilities only capture a fraction of cases).Current tools to classify causes of disease and death atthe household level are not very accurate and requireexpertise.57 Verbal autopsies, whereby next of kinreport the signs and symptoms of their dead familymember, are the best method, but only work well forsome diseases.58
• Measuring impact (mortality) specifically, whilepreferable because of its ultimate, downstream nature,requires studies with extremely large sample size.
What step of the intervention should one monitor?
Impact of individual interventions is a mirage in mostcircumstances – but is it really necessary to measure it? Webelieve that, for single interventions that have proveneffective in studies, it is not. Which intervention stepshould M&E focus on? We believe that:
• For single preventive interventions (e.g. vaccination,vector control, hygiene promotion), provided thatevidence on their effectiveness is available, it issufficient to demonstrate output (coverage): outcomeand impact (effectiveness) may be assumed. However:– Factors that could reduce effectiveness below that
measured in published studies (e.g. logisticsconditions; beliefs specific to the community, suchas fear of vaccines) should be identified: their roleshould be anticipated in planning, and consideredat least qualitatively during M&E.
– Deviations from standards of implementationshould be appraised. For example, a hand washingpromotion campaign is shown to be effective whenone hygiene promoter is present per 1,000 people,but the agency is only able to field one promoterper 5,000 people.
– Efforts to maximise effectiveness should beincluded among project activities, and must also beevaluated. For example, bed net distributionsshould include community training on netmaintenance.
• For single curative interventions, outcome and impactcannot be assumed, since factors that may modify theireffectiveness are very context-specific. The effect-iveness of care is very difficult to measure withoutfollowing up patients in a research study. Nevertheless,outcome can reasonably be assumed if the followingconditions are met:– The diagnostic algorithm is highly sensitive.
Alternatively, the sensitivity is not very high but isknown, thus allowing some quantification of thelikely outcome, given a certain output.
– The treatment is known or can safely be assumed to
be efficacious in the intervention setting (forexample, drug resistance is very site-specific).
– Routine spot check evaluations at health facilitiesare carried out on a sufficient sample of patientvisits, showing that key steps in the care packageare functioning well.
• The outcomes and impact of sector-wide (e.g. waterand sanitation) or crisis-wide relief operations are alsodifficult to measure, but cautious conclusions can bedrawn based on evidence from past relief operations,and pre- and post-type comparisons within the crisis-affected community (not the ideal epidemiological set-up for establishing causality between relief and impact,but probably the only one available in mostcircumstances). The ultimate impact indicator ismortality (among all age groups and among childrenunder five years). Outcome indicators that relate moreor less to specific relief sectors include acutemalnutrition prevalence, occurrence of diseaseoutbreaks and disease attack rates. If a temporalassociation can be shown between the trend incoverage of essential relief services (outputindicators), and the trend in such outcome or impactindicators, cautious conclusions about the reliefoperation’s impact may be drawn, provided otherfactors not related to relief that could explain theobserved outcome and impact are also appraised.
What about interventions without evidence?
Unless conditions make it the only option, no interventionshould be introduced without first studying itseffectiveness.59 Nevertheless, untested interventions (forexample, some mental and food security interventions) havebeen implemented in crises for perceived humanitarianreasons. From a humanitarian and medical standpoint it isdifficult to abstain from attempting to relieve suffering.
Lack of evidence supporting proposed interventions forhigh-priority health problems should spur urgent research.In the interim, a solution might be to dedicate a greaterpart of the budget for untested interventions to M&E, so asto build some empirical evidence.
Data sources for monitoring and evaluation of
interventions
Table 9 proposes data sources and types of studies neededto monitor each step of the intervention flow. Inputs and pro-cesses can usually be monitored using existing project data,and do not require working with the denominator (targetpopulation). Monitoring output (coverage) can be done:
• Roughly, using project data, assuming that populationsize is known (and it always should be), and a clearcoverage target has been set (e.g. all children 6–59months old to be vaccinated). For example, if the totalpopulation is 50,000, and 17% are in the age group6–59 months, the target population for vaccination is8,500; if 6,300 vaccine doses are administered,coverage should be 6,300/8,500 = 74%.
• More preferably, using household surveys,60 whereby a
46
NP 61crc 15/5/08 10:42 am Page 46
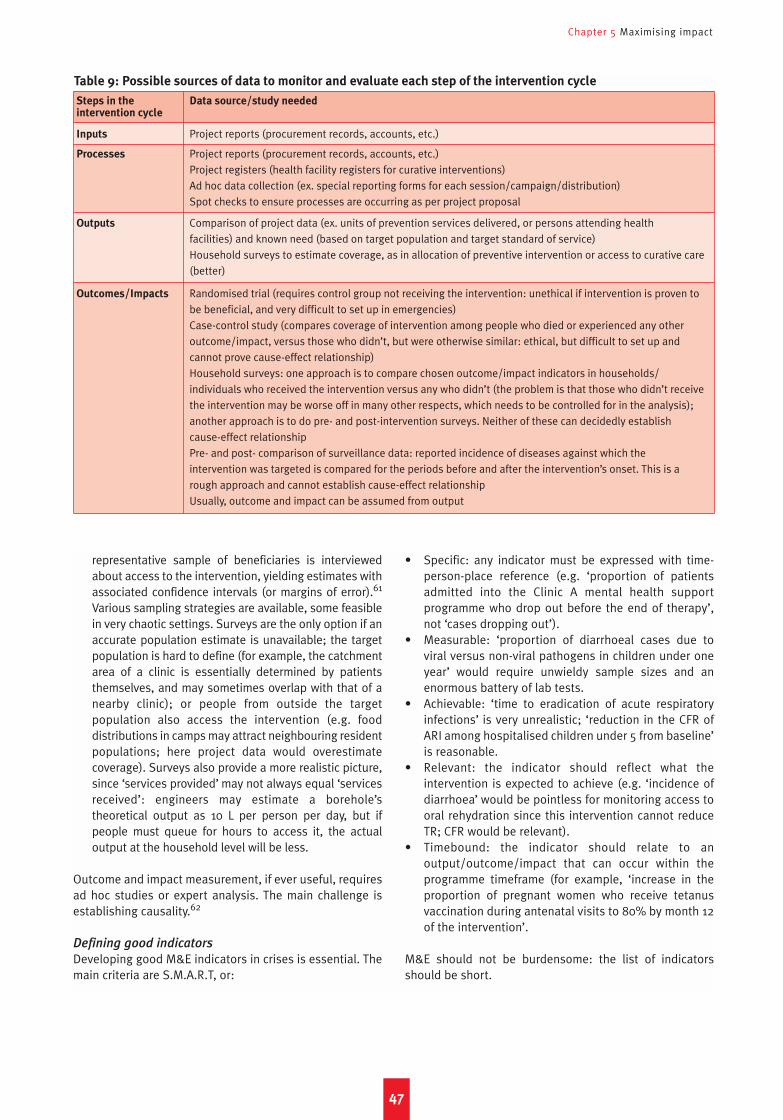
Chapter 5 Maximising impact
representative sample of beneficiaries is interviewedabout access to the intervention, yielding estimates withassociated confidence intervals (or margins of error).61
Various sampling strategies are available, some feasiblein very chaotic settings. Surveys are the only option if anaccurate population estimate is unavailable; the targetpopulation is hard to define (for example, the catchmentarea of a clinic is essentially determined by patientsthemselves, and may sometimes overlap with that of anearby clinic); or people from outside the targetpopulation also access the intervention (e.g. fooddistributions in camps may attract neighbouring residentpopulations; here project data would overestimatecoverage). Surveys also provide a more realistic picture,since ‘services provided’ may not always equal ‘servicesreceived’: engineers may estimate a borehole’stheoretical output as 10 L per person per day, but ifpeople must queue for hours to access it, the actualoutput at the household level will be less.
Outcome and impact measurement, if ever useful, requiresad hoc studies or expert analysis. The main challenge isestablishing causality.62
Defining good indicators
Developing good M&E indicators in crises is essential. Themain criteria are S.M.A.R.T, or:
• Specific: any indicator must be expressed with time-person-place reference (e.g. ‘proportion of patientsadmitted into the Clinic A mental health supportprogramme who drop out before the end of therapy’,not ‘cases dropping out’).
• Measurable: ‘proportion of diarrhoeal cases due toviral versus non-viral pathogens in children under oneyear’ would require unwieldy sample sizes and anenormous battery of lab tests.
• Achievable: ‘time to eradication of acute respiratoryinfections’ is very unrealistic; ‘reduction in the CFR ofARI among hospitalised children under 5 from baseline’is reasonable.
• Relevant: the indicator should reflect what theintervention is expected to achieve (e.g. ‘incidence ofdiarrhoea’ would be pointless for monitoring access tooral rehydration since this intervention cannot reduceTR; CFR would be relevant).
• Timebound: the indicator should relate to anoutput/outcome/impact that can occur within theprogramme timeframe (for example, ‘increase in theproportion of pregnant women who receive tetanusvaccination during antenatal visits to 80% by month 12of the intervention’.
M&E should not be burdensome: the list of indicatorsshould be short.
47
Table 9: Possible sources of data to monitor and evaluate each step of the intervention cycle
Steps in the Data source/study neededintervention cycle
Inputs Project reports (procurement records, accounts, etc.)
Processes Project reports (procurement records, accounts, etc.)Project registers (health facility registers for curative interventions)Ad hoc data collection (ex. special reporting forms for each session/campaign/distribution)Spot checks to ensure processes are occurring as per project proposal
Outputs Comparison of project data (ex. units of prevention services delivered, or persons attending health facilities) and known need (based on target population and target standard of service)Household surveys to estimate coverage, as in allocation of preventive intervention or access to curative care(better)
Outcomes/Impacts Randomised trial (requires control group not receiving the intervention: unethical if intervention is proven tobe beneficial, and very difficult to set up in emergencies)Case-control study (compares coverage of intervention among people who died or experienced any otheroutcome/impact, versus those who didn’t, but were otherwise similar: ethical, but difficult to set up andcannot prove cause-effect relationship)Household surveys: one approach is to compare chosen outcome/impact indicators in households/individuals who received the intervention versus any who didn’t (the problem is that those who didn’t receivethe intervention may be worse off in many other respects, which needs to be controlled for in the analysis);another approach is to do pre- and post-intervention surveys. Neither of these can decidedly establish cause-effect relationshipPre- and post- comparison of surveillance data: reported incidence of diseases against which the intervention was targeted is compared for the periods before and after the intervention’s onset. This is arough approach and cannot establish cause-effect relationshipUsually, outcome and impact can be assumed from output
NP 61crc 15/5/08 10:42 am Page 47

Public health in crisis-affected populations
48
Figure 16
Comparison of hypothetical trends in essential service, outcome (malnutrition) and impact
(mortality) indicators
Num
ber o
f per
sons
per
hea
lth w
orke
r
% c
hild
ren
6–59
mon
ths
vacc
inat
edLa
trin
e w
ater
col
lect
ed/p
erso
n/da
y%
chi
ldre
n 6–
59 m
onth
s m
alno
uris
hed
Num
ber o
f per
sons
sha
ring
1 la
trin
eD
eath
s/10
,000
chi
ldre
n<5
/day
Measles vaccination coverageHealth worker:person ratio
Latrine:person ratioWater availability per person
Under 5 years mortality rateGlobal acute malnutrition
Crude mortality rate, excluding violence
Note that data may be missing for some months, for some indicators. This exercise, however, can only be performed if all crucial crisis indicators arebeing measured on a nearly monthly basis: the trend is very important. Note also that, if surveys are being used, there will always be confidenceintervals (error bounds) around some of the estimates, such as above for crude and under 5 mortality.
Dea
ths/
10,0
00 p
eopl
e/da
y
7000
6000
5000
4000
3000
2000
1000
0500
400
300
200
100
0
12
10
8
6
4
2
03.5
3
2.5
2
1.5
1
0.5
100
80
60
40
20
025
20
15
10
5
0
30
25
20
15
10
5
0
NP 61crc 15/5/08 10:42 am Page 48

Review of key principles
We have tried to present an overarching view of theepidemiology of crises, with a focus on physical health.Figure 17 (page 50) summarises the main concepts:
• Different crisis conditions (entrapment, mass displace-ment into camps, displacement into communities,natural disaster, food crisis) combine with differentdemographic and epidemiological settings (tropicaland/or very poor, transitional, industrialised) to deter-mine risk factors for infectious (either endemic orepidemic) and non-infectious diseases.
• Risk factors result in excess morbidity (outcomes) andmortality (impacts), both directly and indirectlyattributable to the crisis: excess mortality is theultimate indicator of crisis severity.
• Interventions achieve outputs with a given coverage,and the combination of coverage x effectiveness resultsin morbidity and mortality averted.
• Both risk factors and interventions modify the TR, Prand CFR steps of disease progression.
• Risk assessment and disease surveillance, along withevidence, determine priority interventions.
• Interventions result in reduced excess morbidity andmortality: this reduction is the outcome/impact of relief.
Ten common fallacies
Box 8 suggests ten common fallacies in health reliefoperations, which underscore the importance of a widelyshared quantitative, epidemiological grasp of how crisesand interventions affect population health, and encap-sulate key principles that we feel should guide publichealth responses to any crisis.
49
Chapter 6Conclusion
Box 8
Ten common epidemiological fallacies in public health reponses to crises
1. Every crisis affects health in the same way. There are verydifferent types of crisis conditions, which result in differentevolutions of morbidity and mortality. Slow-onset, long-duration situations of ‘entrapment’ due to insecurity mayresult in very large death tolls, even though mortality ratesmay not spike dramatically. Mass displacement intoovercrowded camps is different from displacement intohost communities or small settlements, and probablycarries higher disease risks.
2. Epidemics kill more people than endemic diseases. Thereis no evidence of this, and the inverse is more likely.Although epidemic prevention and control should remain apriority activity in relief operations, common endemicdiseases such as diarrhoea, ARI, malaria and neonatalinfections must not be neglected. A relatively small rise inthe incidence of these diseases, coupled with a modestincrease in their lethality, will lead to large increases inmortality, even if no epidemics occur.
3. Epidemics are very frequent in the aftermath of natural
disasters. Several studies and reviews have shown this notto be the case, at least compared to wars. However, somedisasters (mainly flooding) have resulted in significantepidemics, mainly of diarrhoeal or vector-borne diseases,justifying surveillance and prevention activities.
4. Public health interventions cannot be implemented
without first conducting a detailed situation and needs
assessment. One should not wait for detailed assessmentsto come in before implementing the basic package ofSphere guidelines, which is as much about controllingpresent problems as preventing new ones. Theseguidelines are meant to provide minimum acceptable livingconditions. What makes crises different is the degree towhich certain risk factors will emerge. However, all majorrisk factors for disease need to be pre-empted and
addressed from the earliest stages of the relief operation.
5. Prevention is most important. Preventive interventionshave many advantages over curative ones, but one shouldavoid setting one above the other. Prevention will mainlydecrease the degree of exposure/infection and theprobability of developing disease; it will, however, do littleto reduce case-fatality.
6. Treatment is most important. As above. Treatment alonewill result in health systems being overwhelmed bydisease cases they have not been able to prevent. Bothtreatment and prevention are needed.
7. Numerators are enough for assessment and monitoring.
Numerators (number of cases, cases treated, number ofservices offered, etc.) are never sufficient to meaningfullyassess needs, and monitor/evaluate interventions. Theymust always be compared to the denominator (i.e. thepopulation at risk, or targeted for the intervention). Unlessthis is done, no conclusions about disease trends,coverage and effectiveness can reliably be drawn.
8. Coverage is enough. Achieving and documenting highcoverage is crucial. However, there are many reasons(especially in crises, and for curative care) for effectivenessto be much poorer than expected: poor effectiveness willnegate the effects of high coverage.
9. Effectiveness is enough. Even a very effective interventionwill have little impact unless a considerable proportion ofthe target population is covered by it.
10. Each unit of output results in one unit of impact. Therelationship between coverage and outcome/impact (diseasecured or averted/deaths averted) is rarely linear. More oftenthere are ‘threshold effects’, whereby a certain level ofcoverage needs to be reached for considerable impact to beachieved. Vaccination is a prime example of this.
NP 61crc 15/5/08 10:42 am Page 49
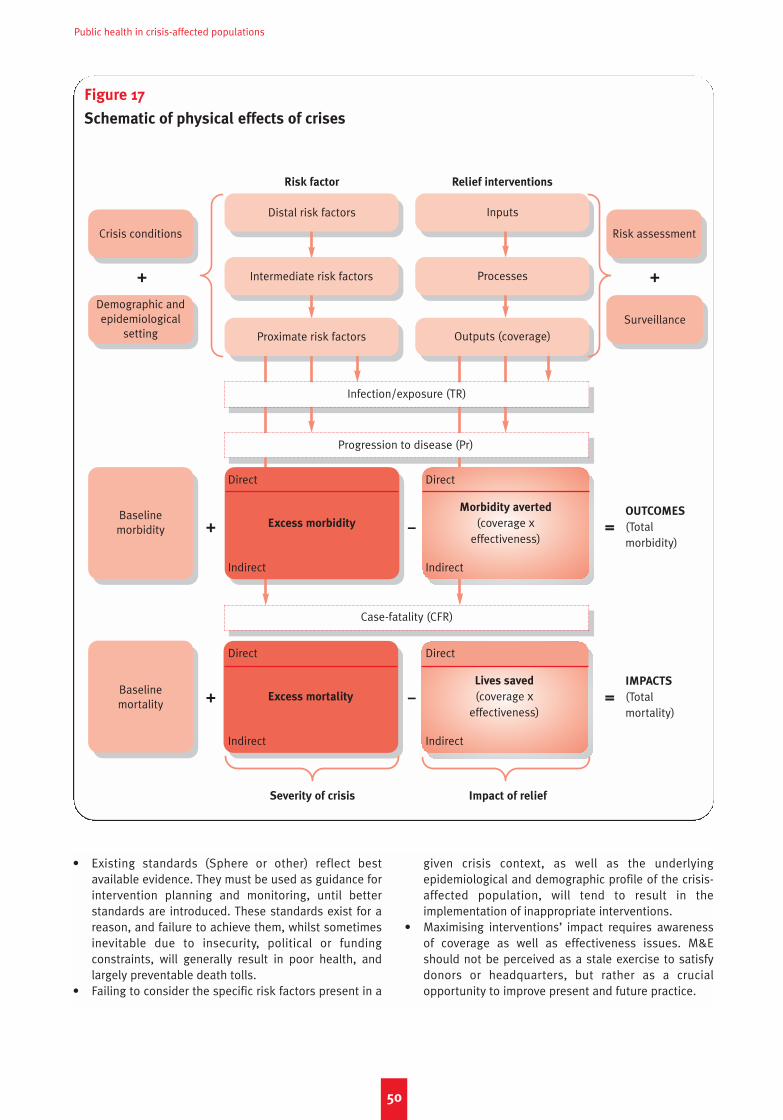
• Existing standards (Sphere or other) reflect bestavailable evidence. They must be used as guidance forintervention planning and monitoring, until betterstandards are introduced. These standards exist for areason, and failure to achieve them, whilst sometimesinevitable due to insecurity, political or fundingconstraints, will generally result in poor health, andlargely preventable death tolls.
• Failing to consider the specific risk factors present in a
given crisis context, as well as the underlyingepidemiological and demographic profile of the crisis-affected population, will tend to result in theimplementation of inappropriate interventions.
• Maximising interventions’ impact requires awarenessof coverage as well as effectiveness issues. M&Eshould not be perceived as a stale exercise to satisfydonors or headquarters, but rather as a crucialopportunity to improve present and future practice.
Public health in crisis-affected populations
50
Figure 17
Schematic of physical effects of crises
Risk factor
Severity of crisis Impact of relief
Crisis conditions Risk assessment
Surveillance
Excess mortality
Lives saved
(coverage xeffectiveness)
IMPACTS
(Total mortality)
OUTCOMES
(Total morbidity)
Direct
Indirect
Direct
Indirect
Demographic andepidemiological
setting
Baseline morbidity
Baseline mortality
=
=
–
–
+
+
+ +
Case-fatality (CFR)
Relief interventions
Distal risk factors
Intermediate risk factors
Infection/exposure (TR)
Inputs
Processes
Outputs (coverage)Proximate risk factors
Progression to disease (Pr)
Excess morbidity
Direct
Indirect
Morbidity averted
(coverage xeffectiveness)
Direct
Indirect
NP 61crc 15/5/08 10:42 am Page 50
Note that other sources may offer different definitions. We
have opted here for ones that seemed to us most
understandable and pragmatic.
Active reporting: mode of reporting of surveillance datawhereby staff contact health facilities to obtain data.
Age-specific mortality rate: mortality rate in a specificage group. See under-5 mortality rate for an example.
Alert threshold: similar to epidemic threshold, but oflesser severity (i.e. level of incidence which ifexceeded may lead to on-site investigations orpreparation for a possible epidemic).
Attack rate: proportion or percentage of the population
at risk (or of the entire population) that experiences anew case of infection or disease during a given timeperiod. Equivalent to the cumulative incidence rate
over this same period. The main application is duringepidemics. Note that an attack rate is not really a rate.
Basic reproductive ratio, often abbreviated as R0: thereproductive ratio in conditions where all individualsare susceptible to the infection, and there is notreatment or control. These conditions often occur atthe very beginning of an epidemic.
Burden (of disease): general term indicating theimportance/severity of a specific disease or conditionin the community. Burden can best be quantified asincidence, attack rate, prevalence, mortality rate,etc., depending on the disease in question.
Case-control study: a type of epidemiological studydesign in which exposure in disease or infection
cases is compared to exposure in a comparable groupof non-cases. A typical output of such a study is odds
ratios.
Case-fatality ratio or rate, often abbreviated as CFR:proportion or percentage of disease cases that die asa result of the disease. Note that CFR is not a ratio orrate, but a proportion.
Case definition: in epidemiology, a standardised list ofvery precise criteria which, if fulfilled, result in a casebeing classified and reported as due to a givendisease.
Causal association: link between a given factor and agiven health event (infection, disease, death, etc.),whereby the factor is the only cause, or one of thepossible causes, of increased risk of the eventoccurring. The Bradford-Hill criteria of causality areoften invoked in epidemiology to decide whether anassociation is indeed causal.
Cause-specific mortality rate: mortality rate due to aspecific disease (e.g. cholera) or exposure (e.g.intentional injury).
Child mortality ratio or rate: see the demographicdefinition of under-5 mortality rate. Ratio is a moreaccurate term than rate in this case.
Chronic disease: disease lasting a long time (e.g. years)relative to the individual’s lifetime, or even one’swhole life. Is sometimes used interchangeably withnon-infectious or non-communicable disease, but infact some chronic diseases can be infectious.
Clinical trial: a type of epidemiological study design inwhich two groups of people, one exposed to anintervention (i.e. protective factor) being tested, andanother not exposed (or given the best currentlyavailable intervention), are observed over time, and therelative risk of the health event the intervention isdesigned to mitigate is measured in the exposed vs.non-exposed group: this relative risk is also a measureof efficacy or effectiveness of the intervention. Morecomplex trial designs exist. Most clinical trials arerandomised, meaning that allocation of theintervention is determined by chance, and that the twogroups are similar to each other in all characteristicsexcept for exposure to the intervention; they can beblinded or double-blinded depending on whetherstudy staff and/or patients are aware of whether theyreceived the intervention (or which).
Cohort study: a type of epidemiological study design inwhich a group of people exposed to a risk orprotective factor and a group of people not exposedare observed over time, and the relative risk of agiven health event in the exposed vs. non-exposedgroup is measured.
Communicable disease: used interchangeably withinfectious disease.
Confounder: factor that appears associated with a givenhealth event, simply because it is correlated with it intime and place, but which actually hides or distractsfrom a true causal association involving another factorwhich causes both the confounder and the healthevent.
Cost-effectiveness: ratio of an intervention’s inputs(quantified financially) to its outcome/impact(quantified epidemiologically through any measure ofburden); for example, US dollars per case averted.
Coverage: proportion or percentage of individuals inneed of (or targeted as intended beneficiaries of ) anintervention, who actually get it.
Cross-sectional study: a type of epidemiological studydesign in which the health event of interest ismeasured in a sample of the population or a givensub-group of interest, at a given point in time. Typicalset-up for measuring point prevalence. See alsohousehold survey.
51
Glossary
NP 61crc 15/5/08 10:42 am Page 51
Public health in crisis-affected populations
Crude mortality rate, often abbreviated as CMR:
mortality rate among all age groups and due to allcauses.
Curative intervention: an intervention whose main benefitconsists of reducing the risk of death or otherdeleterious lasting consequences after the individualcontracts the infection or disease.
Cure rate: efficacy of a treatment (or drug) regimen. It isnot really a rate, but a proportion.
Death rate: see mortality rate.
Diagnostic algorithm: succession of clinical and/orlaboratory examination and tests that results in adecision to diagnose the case as due to a givendisease or not.
Disease: symptoms of illness and/or impairment ofnormal healthy bodily and/or mental functions due toan infectious or non-infectious cause.
Duration of infection: the time period elapsing betweeninfection and the end of infection, which can be due tothe body’s immunological response, treatmentadministered, or death.
Duration of infectiousness: see infectious period.
Effectiveness: proportion or percentage of individualswho receive an intervention who experience theintended health outcome/impact the intervention isdesigned to achieve.
Efficacy: effectiveness in ideal study conditions (i.e.optimal administration of the intervention).
Endemic disease: disease that occurs year-round in thecommunity, with incidence falling within an expectedrange. The distinction between endemic andepidemic-prone diseases is usually applied toinfectious/communicable diseases only. Somediseases can behave as endemic or epidemic-pronedepending on the context
Epidemic [noun]: occurrence of cases of a disease that isusually absent from the community; alternatively, asituation in which the disease is usually present, butsuddenly reaches incidence levels in excess of theexpected range.
Epidemic [adjective]: disease that causes an epidemic.
Epidemic-prone disease: disease that is normally absentfrom a community or present at low to moderatelevels, but which can suddenly cause an epidemic.
Epidemic threshold: critical level of incidence specified apriori, which, if exceeded, triggers the declaration ofan epidemic and/or pre-determined public healthresponses.
Epidemiology: the study of the distribution of diseases inthe community, and of the factors affecting theirfrequency.
Excess morbidity: morbidity that would not haveoccurred if the crisis had not taken place. Can bequantified as excess incidence or using otherindicators.
Excess mortality: mortality that would not have occurredif the crisis had not taken place. Can be quantified asexcess mortality rate or an excess death toll.
Exhaustive surveillance: type of surveillance strategywhereby data is collected from all health facilities.
Exposure: the event and degree of an individual’s cominginto contact with an infectious pathogen or anysubstance/experience/other risk factor that increasesthe risk of a non-infectious disease (or a protective
factor that decreases it).
Group-specific mortality rate: mortality rate in a givengroup (e.g. orphans).
Herd immunity threshold: critical level of immunisation
coverage required to prevent outbreaks of a specificdisease, in a given context.
Horizontal intervention: an intervention usually targetedat many diseases at once, and integrated within theexisting health system.
Household survey: type of epidemiological study in whicha representative sample of households is selected,and provides information on given health events ofinterest. Often analogous to a cross-sectional study.
Incidence: occurrence of new cases of infection or newcases of disease, depending on which event is beinginvestigated. In this paper we have restricted thedefinition of incidence to signify the occurrence of newcases of disease.
Incidence rate: number of incident (i.e. new) cases ofinfection or disease, per unit population at risk and unittime (see also rate): for example, ‘new cases of bloodydiarrhoea per 1,000 children under 5 years per week’.
Incubation period: the time period elapsing betweeninfection and the appearance of signs and symptomsof the disease.
Infant mortality ratio or rate, often abbreviated as IMR:
number of infants below one year old dying out of1,000 live births in a given year. Equivalent to theprobability of dying in the first year of life. Ratio is amore accurate term than rate in this case.
Infection: colonisation of the body by foreign pathogens,including prions, viruses, bacteria, fungi and variousmicro- and macroscopic parasites. Infection does notnecessarily lead to disease, and can even bebeneficial (e.g. certain gut bacteria).
Infectious disease: disease that is caused by theinfection of the body with foreign pathogens.
Infectious period: time period during which an infectedindividual is able to transmit the infection to others,via any transmission route. Also known as duration of
infectiousness. The infectious period is often shorterthan the duration of infection.
Maternal mortality ratio, often abbreviated as MMR:
number of women dying due to pregnancy-relatedcauses while pregnant or within 42 days of pregnancytermination, out of 100,000 live births in a given year.
52
NP 61crc 15/5/08 10:42 am Page 52

Glossary
Morbidity: the occurrence of disease.
Mortality: the occurrence of death.
Mortality rate: number of deaths occurring in a givenpopulation at risk per unit time, over a given timeperiod (e.g. deaths per 10,000 people per day). Alsoknown as death rate.
Neonatal mortality ratio or rate: number of infants below28 days old dying out of 1,000 live births in a givenyear (sometimes ‘below 30 days’ is used instead).Equivalent to the probability of dying in the firstmonth of life. Ratio would be a more accurate termthan rate in this case.
Non-communicable disease: see non-infectious disease.
Non-infectious disease: disease not caused byinfections. May include both physical and mentaldiseases. See also chronic disease.
Odds ratio: common expression of relative risk,indicating the ratio of people exposed to the givenrisk or protective factor to people not exposed,among cases, divided by the same ratio among non-cases (controls). Often used in case-control or cross-
sectional studies and in outbreak investigations.
Opportunity benefit: saving inherent in deploying severalinterventions together.
Opportunity cost: cost of foregoing or delaying anintervention so as to implement another intervention.
Outbreak: equivalent to epidemic, but usually taken torefer to the very first cluster of epidemic cases, or to asmall epidemic.
Passive reporting: mode of reporting of surveillance datawhereby facilities report data without prompting.
Percentage: any proportion multiplied by 100 so as toprovide the number out of 100 that fulfil a givencondition (e.g. number of people out of 100, i.e.percent who are infected with malaria).
Period prevalence: proportion or percentage of thepopulation (or sub-group) that had the infection ordisease during a given period (usually a year).Uncommon.
Point prevalence: proportion or percentage of thepopulation (or sub-group) that has the infection ordisease at a specific point in time (e.g. today). This isthe most common type of prevalence expressed, andthe term prevalence accompanied by a proportion ofpercentage should be assumed to imply pointprevalence.
Population at risk: fraction of the population that issusceptible to a given infection/disease, or to death.If not specified, the entire population is assumed tobe at risk.
Population-attributable risk: proportion of the total risk ofa given health event that the population experiences,which may be attributed to a given risk factor.
Prevalence: number of cases of infection or diseasepresent in the population (or a specific sub-group).
This includes incident (new) as well as existing cases.See point prevalence and period prevalence.
Preventive intervention: an intervention whose mainbenefit consists of reducing the risk of infection,exposure or progression to disease or death before
the individual contracts the infection or disease.
Proportion: quantity A over (i.e. divided by) quantity N,where A is a fraction of N (e.g. proportion of all peoplewith malaria infection: A = malaria-infected people; N= all people).
Proportionate morbidity: proportion or percentage of alldisease cases that is due to a given cause.
Proportionate mortality: proportion or percentage of alldeaths that is due to a given cause.
Protective factor: factor that, when present, decreasesthe epidemiological risk of a given health event. Wespeak of exposure to a protective factor.
Rate: the number of events occurring per unit time (e.g.number of landslides per year). In epidemiology, ratesare usually expressed as events per unit time and perunit people, i.e. as incidence rates (e.g. new cases ofdisease per 1,000 people per month). Other commonuses are mortality rates or birth rates (e.g. births per1,000 people per year).
Ratio: quantity A over (i.e. divided by) quantity B, where Ais not part of B (e.g. male to female ratio; people tolatrines ratio).
Relative risk, often abbreviated as RR: amount by whichrisk is increased (multiplied) or decreased (divided) inpeople exposed to a given risk factor or protective
factor, compared to people not exposed (e.g. RR=3means the risk is three-fold in those exposed to the riskfactor; RR=0.1 means the risk is one tenth in thoseexposed to the protective factor). Also equivalent to therisk in the exposed divided by the risk in theunexposed. RR can be quantified as an incidence rateratio, attack rate ratio, prevalence ratio, odds ratio, etc.
Reproductive number: see reproductive ratio.
Reproductive rate: see reproductive ratio.
Reproductive ratio, often abbreviated as R: the averagenumber of infections that will result from any givencase of infection (i.e. the average number ofsuccessful transmissions arising from each case ofinfection).
Risk: in epidemiology, a general term indicating theprobability, for an individual or a community, that agiven health event (infection, disease, death, etc.) willoccur or is present.
Risk assessment: systematic assessment of disease risk.
Risk factor: factor that, when present, increasesepidemiological risk of a given health event. We speakof exposure to a risk factor.
Risk management: planning and implementation ofinterventions designed to mitigate risk.
Risk ratio: see relative risk.
53
NP 61crc 15/5/08 10:42 am Page 53
Public health in crisis-affected populations
Sensitivity: ability of a case definition or diagnostic
algorithm to correctly classify the true cases as cases,i.e. to capture as many of the real cases as possible.Expressed as a percentage.
Sentinel surveillance: type of surveillance strategywhereby data are collected only by some healthfacilities chosen to be representative of thepopulation under surveillance.
Serial interval: average time elapsed between the onsetof symptoms in the ‘primary’ case, and the onset ofsymptoms in the ‘secondary’ cases it transmits theinfection to. It can also be computed as the timeelapsed between the infection in the primary case andthe infection in the secondary cases.
Specificity: ability of a case definition or diagnostic
algorithm to correctly classify the true non-cases asnon-cases, i.e. to minimise the number of falsepositive diagnoses. Expressed as a percentage.
Surveillance: systematic collection, analysis andinterpretation of data on health events that is then usedfor defining and monitoring policy and interventions tomitigate them. In crises, surveillance efforts mostlyconcern epidemic-prone diseases. See also sentinel
surveillance and exhaustive surveillance, active
reporting and passive reporting, case definition.
Susceptible: able to contract the infection, i.e. at risk oftransmission. Alternatively, one can speak ofsusceptibility to disease, i.e. the ability to fall ill onceone is infected.
Systematic review: attempt to exhaustively search,review and summarise all of the published evidenceon the efficacy or effectiveness of an intervention, orof the effect of a given risk or protective factor. Ameta-analysis often supplements systematic reviews:this is an attempt to combine individual study findingsinto one summary figure.
Transmission: passage of the infection from oneindividual to the next. This can occur through varioustransmission routes.
Transmission route: mechanism through which aninfection is transmitted (e.g. through airborne droplets,via a vector such as mosquitoes, etc.: see Table 1).
Under 5 years mortality ratio: see the demographicdefinition of under-5 mortality rate. Ratio is a moreaccurate term than rate in this case.
Under-5 mortality rate, often abbreviated as U5MR: inemergency epidemiology, this is understood as themortality rate among children under 5 years (e.g.deaths among children under 5 years per 10,000children under 5 years per day). In demography andmore long-term development settings, this refers tothe number of children under 5 years of age dying outof 1,000 live births in a given year, i.e. the probabilityof dying before age 5: this is also known as the child
mortality ratio or rate, as commonly reported inUNICEF State of the World’s Children publications.
Vector: organism (usually insects, more rarely snails orother small animals) that plays a role (usually crucial) inthe transmission of an infectious pathogen from oneindividual to the next. Very often, pathogens can onlysurvive and reproduce by infecting specific vectors (e.g.the female Anopheles spp. mosquito for malaria) andfulfilling part of their life cycle within them.
Vertical intervention: an intervention targeted specificallyto one disease (or closely related group of diseases),and running in parallel to the routine health system.
Virulence: the ability of an infectious pathogen to resultin successful transmission of the infection, disease
and/or death, once a case comes into contact with asusceptible non-case. This property is inherent to thepathogen (e.g. to its ability to reproduce rapidly,secrete harmful compounds, etc.).
54
NP 61crc 15/5/08 10:42 am Page 54
1 Médecins Sans Frontières, Refugee Health: An Approach to
Emergency Situations (London: Macmillan Education Ltd,1997); M. A. Connolly (ed.), Communicable Disease Controlin Emergencies: A Field Manual (Geneva: WHO, 2005);Sphere Project, Sphere Handbook, revised ed., www.sphereproject.org, 2004.
2 United Nations, Humanitarian Response Review (Geneva:UN, 2005). See also the Active Learning Network forAccountability and Performance in Humanitarian Action:http://www.odi.org.uk/ALNAP.
3 Human Security Center, The Human Security Report 2005:
War and Peace in the 21st Century (Boston, MA: OxfordUniversity Press, 2005); H. A. Ghobarah, P. Huth and B.Russett, ‘The Post-war Public Health Effects of CivilConflict’, Soc Sci Med 2004;59(4):869–84.
4 Only a handful of studies have quantified its extent in crises.We refer readers to a review of sexual violence in the 2005Human Security Report, and a guide to sexual violence inhumanitarian settings by the Inter-Agency Standing Com-mittee: Inter-Agency Standing Committee, Guidelines for
Gender-based Violence Interventions in Humanitarian
Settings: Focusing on Prevention of and Response to Sexual
Violence in Emergencies (Geneva: IASC, 2005).
5 F. Checchi and L. Roberts, Interpreting and Using Mortality
Data in Humanitarian Emergencies: A Primer for Non-
epidemiologists, Network Paper 52 (London: HPN, 2005).
6 P. J. Guerin, C. Brasher, E. Baron et al., ‘Case Managementof a Multidrug-resistant Shigella Dysenteriae Serotype 1Outbreak in a Crisis Context in Sierra Leone, 1999–2000’,Trans R Soc Trop Med Hyg 2004;98(11):635-43.
7 J. P. Guthmann, H. Klovstad, D. Boccia et al., ‘A LargeOutbreak of Hepatitis E Among a Displaced Population inDarfur, Sudan, 2004: The Role of Water TreatmentMethods’, Clin Infect Dis 2006;42(12):1685–91.
8 T. Grein, F. Checchi, J.M. Escribà et al., ‘Mortality among dis-placed former UNITA members and their families in Angola:a retrospective cluster survey’, British Medical Journal
2003;327(7416):650–655.
9 Checchi and Roberts, Interpreting and Using Mortality Data
in Humanitarian Emergencies.
10 B. Coghlan, R. J. Brennan, P. Ngoy et al., ‘Mortality in theDemocratic Republic of Congo: A Nationwide Survey’,Lancet 2006;367(9504):44–51.
11 Possibly the best documentation of community-dispersedIDPs comes from Guinea. W. Van Damme, Do RefugeesBelong in Camps? Experiences from Goma and Guinea’,Lancet 1995;346(8971):360–2.
12 J. T. Watson, M. Gayer and M. A. Connolly, ‘Epidemics afternatural disasters’, Emerg Infect Dis 2007;13(1):1–5.
13 F. Stewart, ‘Root Causes of Violent Conflict in DevelopingCountries’, Bmj 2002;324(7333):342–5.
14 L. C. Mullany, A. K. Richards, C. Lee et al., ‘Population-based Survey Methods To Quantify Associations BetweenHuman Rights Violations and Health Outcomes AmongInternally Displaced Persons in Eastern Burma’, J Epi
Community Health 2007;61(10):908–14.
15 World Health Organisation, The Health Effects of Indoor Air
Pollution in Developing Countries (Geneva: WHO, 2002).
16 H. Young, A. Borrel, D. Holland and P. Salama, ‘PublicNutrition in Complex Emergencies’, Lancet 2004; 364
(9448):1899–909; H. Young and S. Jaspars, The Meaning
and Measurement of Acute Malnutrition in Emergencies: A
Primer for Decision-Makers, HPN Network Paper 56(London: HPN, 2006).
17 L. Fewtrell, et al., ‘Water, Sanitation and HygieneInterventions To Reduce Diarrhoea in Less DevelopedCountries: A Systematic Review and Meta-analysis’, Lancet
Infect Dis 2005;5(1):42–52.
18 R. M. Coupland and H. O. Samnegaard, ‘Effect of Type andTransfer of Conventional Weapons on Civilian Injuries:Retrospective Analysis of Prospective Data from Red CrossHospitals’, Bmj 319, 410–412.
19 K. de Jong et al., ‘Psychological Trauma of the Civil War inSri Lanka’, Lancet 2002;359(9316):1517–8; K. de Jong et al.,‘The Trauma of Ongoing Conflict and Displacement inChechnya: Quantitative Assessment of Living Conditions,and Psychosocial and General Health Status among WarDisplaced in Chechnya and Ingushetia’, Confl Health
2007;1:4; B. L. Cardozo, O. O. Bilukha, C. A. Crawford et al.,‘Mental Health, Social Functioning, and Disability inPostwar Afghanistan’, Jama 2004;292(5):575–84.
20 De Jong et al., ‘Psychological Trauma of the Civil War in SriLanka’.
21 UNICEF/WHO, Pneumonia: The Forgotten Killer of Children
(New York: UNICEF, 2006).
22 R. E. Black, S. S. Morris and J. Bryce, ‘Where and Why Are 10Million Children Dying Every Year?’, Lancet 2003;361
(9376):2226-34.
23 J. E. Lawn, S. Cousens and J. Zupan, ‘4 Million NeonatalDeaths: When? Where? Why?’, Lancet 2005;365(9462):891-900; C. Ronsmans and W. J. Graham, ‘Maternal Mortality:Who, When, Where, and Why’, Lancet 2006;368(9542):1189–200.
24 R. Coninx, ‘Tuberculosis in Complex Emergencies’, Bull
World Health Organ 2007;85(8):637–40.
25 F. Checchi, J. Cox, S. Balkan et al., ‘Malaria Epidemics andInterventions, Kenya, Burundi, Southern Sudan, andEthiopia, 1999–2004’, Emerg Infect Dis 2006; 12(10):1477–85.
26 E. Depoortere, F. Checchi and F. Broillet et al., ‘Violence andMortality in West Darfur, Sudan (2003–04):Epidemiological Evidence from Four Surveys’, Lancet
2004;364(9442):1315-20.
27 R. M. Coupland and D. R. Meddings, ‘Mortality Associatedwith Use of Weapons in Armed Conflicts, WartimeAtrocities, and Civilian Mass Shootings: Literature Review’,Bmj 1999;319(7207):407-10.
28 E. J. Mills and J. B. Nachega, ‘HIV Infection as a Weapon ofWar’, Lancet Infect Dis 2006;6(12):752-3; E. J. Mills et al.,‘The Impact of Conflict on HIV/AIDS in Sub-Saharan Africa’,Int J STD AIDS 2006;17(11):713-7; P. B. Spiegel, A. R.Bennedsen, J. Claass et al., ‘Prevalence of HIV Infection in
55
Notes
NP 61crc 15/5/08 10:42 am Page 55

Public health in crisis-affected populations
Conflict-affected and Displaced People in Seven Sub-Saharan African Countries: A Systematic Review’, Lancet
2007;369(9580):2187-95; N. B. Mock, S. Duale, L. F. Brownet al., ‘Conflict and HIV: A Framework for Risk Assessmentto Prevent HIV in Conflict-affected Settings in Africa’, Emerg
Themes Epidemiol 2004;1(1):6.
29 R. F. Grais, A. J. Conlan, M. J. Ferrari et al., ‘Time Is of theEssence: Exploring a Measles Outbreak ResponseVaccination in Niamey, Niger’, J R Soc Interface 2007.
30 H. Young, A. Borrel, D. Holland and P. Salama, ‘PublicNutrition in Complex Emergencies’, Lancet 2004;364(9448):1899-909; Young and Jaspars, The Meaning and Measure-
ment of Acute Malnutrition in Emergencies.
31 U. E. Schaible and S. H. Kaufmann, ‘Malnutrition andInfection: Complex Mechanisms and Global Impacts’, PLoS
Med 2007;4(5):e115.
32 S. Collins et al., ‘Management of Severe Acute Malnutritionin Children’, Lancet 2006;368(9551):1992–2000; EmergencyNutrition Network, Special Supplement: Community-BasedTherapeutic Care (CTC), in T. Khara and S. Collins (eds), ENNSpecial Supplement Series, 2004.
33 L. B. Spiegel, P. Le, M. T. Ververs and P. Salama, ‘Occurrenceand Overlap of Natural Disasters, Complex Emergenciesand Epidemics During the Past Decade (1995–2004)’, Confl
Health 2007;1:2; J. P. Guthmann, M. Bonnet, L. Ahoua et al.,‘Death Rates from Malaria Epidemics, Burundi andEthiopia’, Emerg Infect Dis 2007;13(1):140–3.
34 O. W. Morgan et al., ‘Mass Fatality Management Followingthe South Asian Tsunami Disaster: Case Studies inThailand, Indonesia, and Sri Lanka’, PLoS Med 3, e195,2006.
35 M. Prince, V. Patel, S. Saxena et al., ‘No Health WithoutMental Mealth’, Lancet 2007;370(9590):859–77.
36 K. Demyttenaere, R. Bruffaerts, J. Posada-Villa et al.,‘Prevalence, Severity, and Unmet Need for Treatment ofMental Disorders in the World Health Organization WorldMental Health Surveys’, Jama 2004;291(21):2581–90.
37 It should also be remembered that mental illness, PTSDand depression are medical conditions requiring medicaldiagnosis and treatment, and should be distinguished frompsychosocial activities that many agencies provide inemergency settings, which are preventive and often aimedat reintroducing a sense of normalcy into the lives of affect-ed persons, especially children.
38 K. de Jong et al., ‘Psychological Trauma of the Civil War inSri Lanka’, Lancet 2002;359(9316):1517–8.; de Jong et al.,‘The Trauma of Ongoing Conflict and Displacement inChechnya; K. de Jong, N. Ford and R. Kleber, ‘Mental HealthCare for Refugees from Kosovo: The Experience ofMedecins Sans Frontieres’, Lancet 1999;353(9164):1616–7;de Jong et al., ‘The Trauma of War in Sierra Leone’; K. deJong, S. Prosser and N. Ford, ‘Addressing PsychosocialNeeds in the Aftermath of the Tsunami’, PLoS Med
2005;2(6):e179; W. F. Scholte, M. Olff, P. Ventevogel et al.,‘Mental Health Symptoms Following War and Repression inEastern Afghanistan’, Jama 2004;292(5):585–93.
39 J. T. de Jong, I. H. Komproe, M. Van Ommeren et al.,‘Lifetime Events and Posttraumatic Stress Disorder in 4Postconflict Settings’, Jama 2001;286(5):555–62.
40 R. F. Mollica, K. McInnes, C. Poole and S. Tor, ‘Dose-effectRelationships of Trauma to Symptoms of Depression andPost-traumatic Stress Disorder among Cambodian Survivorsof Mass Violence’, Br J Psychiatry 1998;173:482–8.
41 R. F. Mollica et al., ‘Disability Associated with PsychiatricComorbidity and Health Status in Bosnian Refugees Livingin Croatia’, Jama 1999;282(5):433–9; R. F. Mollica et al.,‘Longitudinal Study of Psychiatric Symptoms, Disability,Mortality, and Emigration among Bosnian Refugees’, Jama
2001;286(5):546-54.
42 D. Silove, V. Manicavasagar, R. Mollica et al., ‘Screening forDepression and PTSD in a Cambodian PopulationUnaffected by War: Comparing the Hopkins SymptomChecklist and Harvard Trauma Questionnaire with theStructured Clinical Interview’, J Nerv Ment Dis 2007;195(2):152–7.
43 De Jong et al., ‘Lifetime Events’; E. J. Mills, S. Singh, T. H.Holtz et al., ‘Prevalence of Mental Disorders and TortureAmong Tibetan Refugees: A Systematic Review’, BMC Int
Health Hum Rights 2005;5:7.
44 S. B. Thapa et al., ‘Psychiatric Disability Among TorturedBhutanese Refugees in Nepal’, Am J Psychiatry 2003;160(11):2032–7.
45 J. T. de Jong ‘Commentary: Deconstructing Critiques on theInternationalization of PTSD’, Cult Med Psychiatry 2005;29(3):361-70; discussion 371–6.
46 B. Raphael and J. P. Wilson (eds), Psychological Debriefing:
Theory, Practice, and Evidence (New York: CambridgeUniversity Press, 2000); S. Rose, J. Bisson, R. Churchill andS. Wessely, ‘Psychological Debriefing for Preventing PostTraumatic Stress Disorder (PTSD)’, Cochrane Database Syst
Rev 2002(2):CD000560.
47 Mollica et al. have proposed a strategy against mental ill-ness in crises. R. F. Mollica, B. L. Cardozo, H. J. Osofsky, B.Raphael, A. Ager and P. Salama, ‘Mental Health in ComplexEmergencies’, Lancet 2004;364(9450):2058–67.
48 R. F. Grais, D. Coulombier, J. Ampuero et al., ‘Are RapidPopulation Estimates Accurate? A Field Trial of Two DifferentAssessment Methods’, Disasters 2006;30(3):364–76.
49 The CD-WGE consists of technical experts drawn from thevarious disease and cross-cutting departments within WHO.
50 A. Haines, D. Sanders, U. Lehmann et al., ‘Achieving ChildSurvival Goals: Potential Contribution of Community HealthWorkers’, Lancet 2007;369(9579):2121–31.
51 A. Creese, K. Floyd, A. Alban and L. Guinness, ‘Cost-effec-tiveness of HIV/AIDS Interventions in Africa: A SystematicReview of the Evidence’, Lancet 2002;359(9318):1635–43.
52 R. F. Grais, A. J. Conlan, M. J. Ferrari, et al., ‘Time Is of theEssence: Exploring a Measles Outbreak ResponseVaccination in Niamey, Niger’, J. R. Soc Interface 2007.
53 H. Reyburn, H. Mbakilwa, R. Mwangi et al., ‘RapidDiagnostic Tests Compared with Malaria Microscopy forGuiding Outpatient Treatment of Febrile Illness in Tanzania:Randomised Trial’, Bmj 2007;334(7590):403.
54 WHO, Handbook – Integrated Management of Childhood
Illness (Geneva: WHO, 2000); J. R. Armstrong et al.,‘Effectiveness and Cost of Facility-based Integrated Manage-ment of Childhood Illness (IMCI) in Tanzania’, Lancet
2004;364(9445):1583–94.
55 For a review of mobile health unit strategies, see S. duMortier and R. Coninx, Mobile Health Units in Emergency
Operations: A Methodological Approach, Network Paper 60(London: HPN, 2007).
56 P. J. Guerin, C. Brasher, E. Baron et al., ‘Case Managementof a Multidrug-resistant Shigella Dysenteriae Serotype 1
56
NP 61crc 15/5/08 10:42 am Page 56
Notes
5577
Outbreak in a Crisis Context in Sierra Leone, 1999–2000’,Trans R Soc Trop Med Hyg 2004;98(11):635–43.
57 V. Brown, F. Checchi, E. Depoortere et al., ‘Wanted: Studieson Mortality Estimation Methods for HumanitarianEmergencies, Suggestions for Future Research’, Emerg
Themes Epidemiol 2007;4(1):9.
58 N. Soleman, D. Chandramohan and K. Shibuya, ‘VerbalAutopsy: Current Practices and Challenges’, Bull World
Health Organ 2006;84(3):239–45.
59 N. Banatvala and A. B. Zwi, ‘Conflict and Health. PublicHealth and Humanitarian Interventions: Developing theEvidence Base’, Bmj 2000;321(7253):101–5.
60 K. Bostoen, O. O. Bilukha, B. Fenn et al., ‘Methods forHealth Surveys in Difficult Settings: Charting Progress,Moving Forward’, Emerg Themes Epidemiol 2007;4:13; P. B.Spiegel, ‘Who Should Be Undertaking Population-basedSurveys in Humanitarian Emergencies?’, Emerg Themes
Epidemiol 2007;4:12.
61 Checchi and Roberts, Interpreting and Using Mortality Data
in Humanitarian Emergencies.
62 L. Roberts and C.-A. Hofmann, ‘Assessing the Impact ofHumanitarian Assistance in the Health Sector’, Emerg
Themes Epidemiol 2004;1(1):3.
NP 61crc 15/5/08 10:42 am Page 57

5588
NP 61crc 15/5/08 10:42 am Page 58
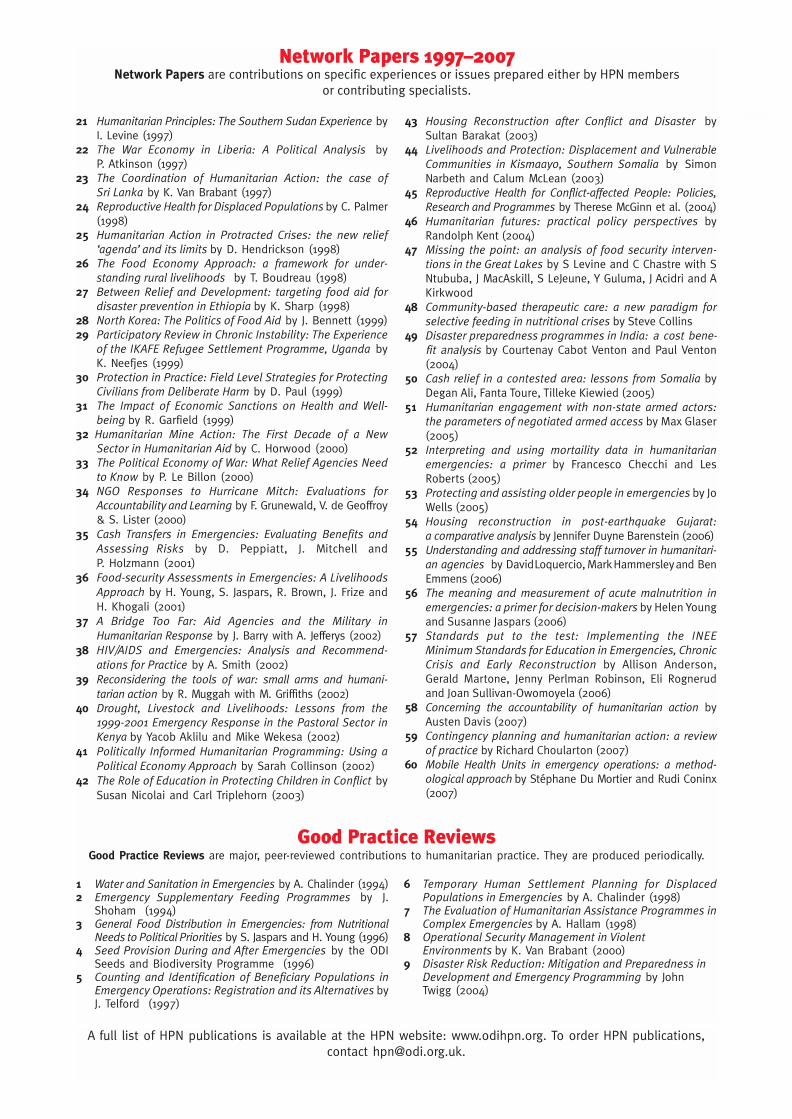
121 Humanitarian Principles: The Southern Sudan Experience byI. Levine (1997)
22 The War Economy in Liberia: A Political Analysis by P. Atkinson (1997)
23 The Coordination of Humanitarian Action: the case of
Sri Lanka by K. Van Brabant (1997)24 Reproductive Health for Displaced Populations by C. Palmer
(1998)25 Humanitarian Action in Protracted Crises: the new relief
‘agenda’ and its limits by D. Hendrickson (1998)26 The Food Economy Approach: a framework for under-
standing rural livelihoods by T. Boudreau (1998)27 Between Relief and Development: targeting food aid for
disaster prevention in Ethiopia by K. Sharp (1998)28 North Korea: The Politics of Food Aid by J. Bennett (1999)29 Participatory Review in Chronic Instability: The Experience
of the IKAFE Refugee Settlement Programme, Uganda byK. Neefjes (1999)
30 Protection in Practice: Field Level Strategies for Protecting
Civilians from Deliberate Harm by D. Paul (1999)31 The Impact of Economic Sanctions on Health and Well-
being by R. Garfield (1999)32 Humanitarian Mine Action: The First Decade of a New
Sector in Humanitarian Aid by C. Horwood (2000)33 The Political Economy of War: What Relief Agencies Need
to Know by P. Le Billon (2000)34 NGO Responses to Hurricane Mitch: Evaluations for
Accountability and Learning by F. Grunewald, V. de Geoffroy& S. Lister (2000)
35 Cash Transfers in Emergencies: Evaluating Benefits and
Assessing Risks by D. Peppiatt, J. Mitchell and P. Holzmann (2001)
36 Food-security Assessments in Emergencies: A Livelihoods
Approach by H. Young, S. Jaspars, R. Brown, J. Frize andH. Khogali (2001)
37 A Bridge Too Far: Aid Agencies and the Military in
Humanitarian Response by J. Barry with A. Jefferys (2002)38 HIV/AIDS and Emergencies: Analysis and Recommend-
ations for Practice by A. Smith (2002)39 Reconsidering the tools of war: small arms and humani-
tarian action by R. Muggah with M. Griffiths (2002)40 Drought, Livestock and Livelihoods: Lessons from the
1999-2001 Emergency Response in the Pastoral Sector in
Kenya by Yacob Aklilu and Mike Wekesa (2002)41 Politically Informed Humanitarian Programming: Using a
Political Economy Approach by Sarah Collinson (2002)42 The Role of Education in Protecting Children in Conflict by
Susan Nicolai and Carl Triplehorn (2003)
43 Housing Reconstruction after Conflict and Disaster bySultan Barakat (2003)
44 Livelihoods and Protection: Displacement and Vulnerable
Communities in Kismaayo, Southern Somalia by SimonNarbeth and Calum McLean (2003)
45 Reproductive Health for Conflict-affected People: Policies,
Research and Programmes by Therese McGinn et al. (2004)46 Humanitarian futures: practical policy perspectives by
Randolph Kent (2004)47 Missing the point: an analysis of food security interven-
tions in the Great Lakes by S Levine and C Chastre with SNtububa, J MacAskill, S LeJeune, Y Guluma, J Acidri and AKirkwood
48 Community-based therapeutic care: a new paradigm for
selective feeding in nutritional crises by Steve Collins49 Disaster preparedness programmes in India: a cost bene-
fit analysis by Courtenay Cabot Venton and Paul Venton(2004)
50 Cash relief in a contested area: lessons from Somalia byDegan Ali, Fanta Toure, Tilleke Kiewied (2005)
51 Humanitarian engagement with non-state armed actors:
the parameters of negotiated armed access by Max Glaser(2005)
52 Interpreting and using mortaility data in humanitarian
emergencies: a primer by Francesco Checchi and LesRoberts (2005)
53 Protecting and assisting older people in emergencies by JoWells (2005)
54 Housing reconstruction in post-earthquake Gujarat:
a comparative analysis by Jennifer Duyne Barenstein (2006)55 Understanding and addressing staff turnover in humanitari-
an agencies by DavidLoquercio, MarkHammersleyand BenEmmens (2006)
56 The meaning and measurement of acute malnutrition in
emergencies: a primer for decision-makers by Helen Youngand Susanne Jaspars (2006)
57 Standards put to the test: Implementing the INEE
Minimum Standards for Education in Emergencies, Chronic
Crisis and Early Reconstruction by Allison Anderson,Gerald Martone, Jenny Perlman Robinson, Eli Rognerudand Joan Sullivan-Owomoyela (2006)
58 Concerning the accountability of humanitarian action byAusten Davis (2007)
59 Contingency planning and humanitarian action: a review
of practice by Richard Choularton (2007)60 Mobile Health Units in emergency operations: a method-
ological approach by Stéphane Du Mortier and Rudi Coninx(2007)
Network Papers 1997–2007Network Papers are contributions on specific experiences or issues prepared either by HPN members
or contributing specialists.
Good Practice ReviewsGood Practice Reviews are major, peer-reviewed contributions to humanitarian practice. They are produced periodically.
1 Water and Sanitation in Emergencies by A. Chalinder (1994)2 Emergency Supplementary Feeding Programmes by J.
Shoham (1994)3 General Food Distribution in Emergencies: from Nutritional
Needs to Political Priorities by S. Jaspars and H. Young (1996)4 Seed Provision During and After Emergencies by the ODI
Seeds and Biodiversity Programme (1996)5 Counting and Identification of Beneficiary Populations in
Emergency Operations: Registration and its Alternatives byJ. Telford (1997)
6 Temporary Human Settlement Planning for DisplacedPopulations in Emergencies by A. Chalinder (1998)
7 The Evaluation of Humanitarian Assistance Programmes inComplex Emergencies by A. Hallam (1998)
8 Operational Security Management in ViolentEnvironments by K. Van Brabant (2000)
9 Disaster Risk Reduction: Mitigation and Preparedness inDevelopment and Emergency Programming by JohnTwigg (2004)
A full list of HPN publications is available at the HPN website: www.odihpn.org. To order HPN publications,contact [email protected].
Humanitarian Practice Network
The Humanitarian Practice Network (HPN) is an independent forum where field workers, managersand policymakers in the humanitarian sector share information, analysis and experience.
HPN’s aim is to improve the performance of humanitarian action by contributing to individual and institutional learning.
HPN’s activities include:
• A series of specialist publications: Good Practice Reviews, Network Papers and Humanitarian
Exchange magazine.• A resource website at www.odihpn.org.• Occasional seminars and workshops to bring together practitioners, policymakers and analysts.
HPN’s members and audience comprise individuals and organisations engaged in humanitarianaction. They are in 80 countries worldwide, working in northern and southern NGOs, the UN andother multilateral agencies, governments and donors, academic institutions and consultancies.HPN’s publications are written by a similarly wide range of contributors.
HPN’s institutional location is the Humanitarian Policy Group (HPG) at the Overseas DevelopmentInstitute (ODI), an independent think tank on humanitarian and development policy. HPN’s publicationsare researched and written by a wide range of individuals and organisations, and are published by HPNin order to encourage and facilitate knowledge-sharing within the sector. The views and opinions
expressed in HPN’s publications do not necessarily state or reflect those of the Humanitarian Policy
Group or the Overseas Development Institute.
Funding support is provided by institutional donors (AusAID, CIDA, DANIDA, DFID, DevelopmentCooperation Ireland, MFA Netherlands, SIDA, USAID), non-governmental organisations (British RedCross, CAFOD, Christian Aid, Concern, International Rescue Committee, MSF, Oxfam, Save the Children(UK), World Vision) and UN agencies (WFP).
To join HPN, complete and submit the form at www.odihpn.org or contact the Membership Administrator at:
Humanitarian Practice Network (HPN)Overseas Development Institute
111 Westminster Bridge RoadLondon, SE1 7JDUnited Kingdom
Tel: +44 (0)20 7922 0331/74Fax: +44 (0)20 7922 0399
Email: [email protected]: www.odihpn.org
© Overseas Development Institute, London, 2007.