Cellular Senescence: Molecular Targets, Biomarkers ... - MDPI
Upload
khangminh22Category
view
2download
0
EBioMedicine 25 (2017) 112–121
Contents lists available at ScienceDirect
EBioMedicine
j ourna l homepage: www.eb iomed ic ine.com
Research Paper
Biomarkers of Tuberculosis Severity and Treatment Effect: A DirectedScreen of 70 Host Markers in a Randomized Clinical Trial
G.B. Sigal a,⁎, M.R. Segal b, A. Mathew a, L. Jarlsberg b, M. Wang a, S. Barbero a, N. Small a, K. Haynesworth a,J.L. Davis c, M. Weiner d, W.C. Whitworth e, J. Jacobs f, J. Schorey g, D.M. Lewinsohn h, P. Nahid b,⁎a Meso Scale Diagnostics, LLC, Rockville, MD, USAb University of California, San Francisco, CA, USAc Yale School of Public Health and Yale School of Medicine, New Haven, CT, USAd San Antonio VA Medical Center, San Antonio, TX, USAe Centers for Disease Control and Prevention, Atlanta, GA, USA.f Pacific Northwest National Laboratory, Richland, WA, USAg University of Notre Dame, Notre Dame, IN, USAh Oregon Health and Science University, Portland, OR, USA
⁎ Corresponding authors.E-mail addresses: [email protected] (G.B. Sigal),
https://doi.org/10.1016/j.ebiom.2017.10.0182352-3964/© 2017 The Authors. Published by Elsevier B.V
a b s t r a c t
a r t i c l e i n f oArticle history:Received 14 September 2017Received in revised form 15 October 2017Accepted 19 October 2017Available online 24 October 2017
More efficacious treatment regimens are needed for tuberculosis, however, drug development is impeded by alack of reliable biomarkers of disease severity and of treatment effect.We conducted a directed screen of host bio-markers in participants enrolled in a tuberculosis clinical trial to address this need. Serum samples from 319 pro-tocol-correct, culture-confirmed pulmonary tuberculosis patients treated under direct observation as part of aninternational, phase 2 trial were screened for 70markers of infection, inflammation, andmetabolism. Biomarkerassays were specifically developed for this study and quantified using a novel, multiplexedelectrochemiluminescence assay. We evaluated the association of biomarkers with baseline characteristics, aswell as with detailed microbiologic data, using Bonferroni-adjusted, linear regression models. Across numerousanalyses, seven proteins, SAA1, PCT, IL-1β, IL-6, CRP, PTX-3 and MMP-8, showed recurring strong associationswith markers of baseline disease severity, smear grade and cavitation; were strongly modulated by tuberculosistreatment; and had responses that were greater for patients who culture-converted at 8 weeks. With treatment,all proteins decreased, except for osteocalcin, MCP-1 andMCP-4, which significantly increased. Several previous-ly reported putative tuberculosis-associated biomarkers (HOMX1, neopterin, and cathelicidin) were not signifi-cantly associated with treatment response. In conclusion, across a geographically diverse and large population oftuberculosis patients enrolled in a clinical trial, several previously reported putative biomarkers were not signif-icantly associatedwith treatment response, however, seven proteins had recurring strong associationswith base-line radiographic and microbiologic measures of disease severity, as well as with early treatment response,deserving additional study.
pnahid@ucs
. This is an o
© 2017 The Authors. Published by Elsevier B.V. This is an open access article under the CC BY license(http://creativecommons.org/licenses/by/4.0/).
Keywords:Host immune responseTuberculosisBiomarkersClinical trials
1. Introduction
The lack of reliable surrogate markers of efficacy has hampered tu-berculosis (TB) drugdevelopment. The current standard for use as a sur-rogate endpoint in phase 2 studies remains focused on cultureconversion and the most studied is the two month culture status,which has low sensitivity and modest specificity for predicting out-comes after treatment completion.(Horne et al., 2010; Phillips et al.,2016; Phillips et al., 2013; Nahid et al., 2011) Additionally, being depen-dent on sputum, culture-based monitoring can be challenging to use inextrapulmonary TB, and in patients with paucibacillary disease such as
f.edu (P. Nahid).
pen access article under
is seen in HIV-coinfected patients and in children.(Wallis et al., 2013;Zumla et al., 2013) Both sputum volume and quality decreases in re-sponse to treatment andmany patients cannot provide sputum samplesfor culture after a fewweeks of treatment. The development of non-spu-tum-based biomarkers of treatment response would represent an ad-vance for individual monitoring of TB patients as well as serving as anintermediate marker for use in TB drug development.
As an alternative to sputum-based monitoring, blood-based bio-markers are appealing for several reasons. Blood is relatively easy to col-lect and, unlike sputum, remains an available source for biomarkermeasures throughout treatment. Blood-based markers of inflammationand infections are also quantitative, and provide an opportunity to im-prove predictive power by combining multiple biomarkers into predic-tive biosignatures. Finally, blood-based markers of treatment response
the CC BY license (http://creativecommons.org/licenses/by/4.0/).

113G.B. Sigal et al. / EBioMedicine 25 (2017) 112–121
could potentially be translated into point of care assays usable in thefield without requiring sophisticated laboratory infrastructure, andbiosignatures that at baseline could determine disease severity wouldalso be valuable to clinical trialists and TB care providers for risk strati-fication purposes, as alternatives to chest radiography, for example. Ef-forts to identify host biomarkers predictive of treatment outcomes haveresulted in the identification of a number of biomarkers that changeduring TB treatment, albeit most are described in observational cohortsor smaller case-control studies.(Andrade et al., 2013; Azzurri et al.,2005; Coussens et al., 2012; Djoba Siawaya et al., 2009; Djoba Siawayaet al., 2008; Huang et al., 2014; Jayakumar et al., 2015; Lee and Chang,2003; Mihret et al., 2013; Ostrowski et al., 2006) Such studies acknowl-edge a variety of limitations including being single center studies, focus-ing on single markers, using convenience samples, having modestsample sizes, or relying on case-control designs.
In the work described herein, serum collected in a standardizedmanner in a rigorously conducted clinical trial sponsored by the CDC-funded TB Trials Consortium,was used to evaluate the efficacy and safe-ty of a rifapentine-based regimen for drug-susceptible TB (Dorman etal., 2012) Study participants received treatment under direct observa-tion, thereby enhancing and carefully measuring adherence; an impor-tant benchmark when assessing biomarkers of treatment effect. Wemeasured the concentration, and change in concentration, of 70 poten-tial biomarkers associated with inflammatory, antimicrobial, T-cell andacute phase responses to bacterial infections, and with tissue remodel-ing at infection sites. These biomarkers were selected because theyhave been published as indicators of TB disease and the clinical trialsamples provided an opportunity to reassess these associations acrossdiverse international sites (Andrade et al., 2013; Azzurri et al., 2005;Coussens et al., 2012; Djoba Siawaya et al., 2009; Djoba Siawaya et al.,2008; Huang et al., 2014; Jayakumar et al., 2015; Lee and Chang,2003). Access to clinical trial-quality data allowed us to account forchanges in biomarker levels across disease phenotypes, regimens, andgeographic regions, in order to identify biomarkers associated withtreatment response.
2. Methods
2.1. Study Design and Population
The parent study was a CDC-sponsored clinical trial, TuberculosisTrials Consortium (TBTC) Study 29 (ClinicalTrials.gov IdentifierNCT00694629). This was a randomized phase 2 trial, comparing the an-timicrobial activity and safety of a standard daily regimen containing ri-fampin, to that of the experimental regimen with daily rifapentine(10 mg/kg), both given with isoniazid, pyrazinamide and ethambutolto adults with smear-positive, culture-confirmed pulmonary TB. All TBtreatmentwas administered 5 days/week anddirectly observed. All par-ticipants underwent HIV testing. Information regarding the design, con-duct, and results of TBTC Study 29 has been published (Dorman et al.,2012). Out of a total of 531 participants in the parent study, 389 consec-utively enrolled protocol-correct participants (rather than themodifiedintention-to-treat population, since adherence may not be optimal inthis population) were included in this biomarker study. Of 389 partici-pants, 319 had paired baseline and week 8 serum samples availablefor biomarker testing. The parent trial excluded patients if they had re-ceived N5 days of TB treatment in the preceding 6 months, however,treatment of b5 days was permissible, and was noted in 60% of studyparticipants; the median number of days of treatment prior to enroll-ment was 2 days, (IQR of 0 to 4 days). Detailed clinical, radiographicand microbiologic data including sputum culture status at 8 weeksand 12 weeks (determined on both liquid and solid media) were col-lected in a standardized manner as part of the parent clinical trial andused in biomarker analyses. Written informed consent was obtainedfrom all study participants for collection of serum for TB-related re-search. In addition, the institutional review board at University of
California, San Francisco (UCSF) approved this ancillary study to assessputative biomarkers of treatment response (approval #12-10360).
2.2. Specimen Collection
Blood was collected at enrollment (baseline), and after 8 weeks ofcombination drug therapy, using Becton Dickinson Serum SeparatorTubes (BD Vacutainer® SST™ Tube, BD Diagnostics, Franklin Lakes, NJ,USA). BD Vacutainer® SST™ Tubes were centrifuged within 2 h of col-lection and processed according to manufacturer recommendations.Collection, processing and storage of sera was conducted according toa standardizedmanual of operating procedures that has been confirmedto provide quality samples free of processing errors (Nahid et al., 2014).Serum was aliquoted on site, frozen at −70 °C, and batch-shipped ondry ice.
2.3. Multiplexed Immunoassays
A total of 70 biomarkers were measured in 14 multiplexed assaypanels using a sandwich immunoassay format (proteins) or a competi-tive immunoassay format (neopterin), using electrochemiluminescence(ECL) detection (Debad et al., 2004). The ECL assays employed consum-ables and instrumentation fromMeso Scale Diagnostics, LLC (MSD). Theassay components for each panel included a MSD MULTI-ARRAY® 96-well plate having an array of capture antibodies in each well, a set of la-beled detection antibodies for each analyte in the panel (labeled withtheMSD SULFO-TAG™ ECL label), a combined calibration standard con-taining amixture of the target analytes, an assay diluent and a detectionantibody diluent. For the neopterin competitive assay, a labeledneopterin analog was used in the place of the labeled detection anti-body. In total, 14 biomarker panel assayswere tested, sixMSD commer-cial kits and eight custom assay panels that were newly developed forthis study (see Supplemental materials on Assay Methods).
2.4. Clinical Sample Tests
MSD received 500 μL of each sample at their core facility (Gaithers-burg, MD)where assays were conducted with investigators and techni-cians blinded to participant data. Each sample was tested in duplicatewith each of the 70 assays. Concentrationswere reported as the averagevalue of the duplicate measurements; values below the LOD wereassigned a concentration equal to the LOD. CVs were determined forthe biomarker levels measured in the control samples run on eachassay plate; themedian control CV (and IQR) across the different assayswas 10% (9%–13%).
2.5. Statistical Methods
Statistical analysis was conducted using the R statistical program-ming language (version 3.2.3). Analysis of biomarkers used log10-trans-formed concentrations. The Student's t-test was used for comparingmeans across groups. Linear regression (using the “lm” function in R)was used to determine the association of biomarker concentrationswith clinical variables and to adjust for potential covariates. The two-sided t-statistic was used to determine the significance of regression co-efficients with a threshold of p b 0.05 taken as statistically significant. Toaccount for multiple testing, we performed a Bonferroni correction forthe number of tests applied in each analysis.
Linear regression was used to identify associations of log10-trans-formedbaseline biomarker levelswith baseline clinical indicators of dis-ease severity at baseline: smear grade (grade = 1 vs. grade ≥ 2), chestradiograph status (no cavities vs cavities; cavities ≤ 4 cm vs cavitiesN4 cm; and extent of lung involvement b 50% vs lung involvementN 50%) and MGIT time-to-detection (≤5 days vs N5 days). Two linearmodels were employed: (i) an unadjusted model and (ii) a model thatadjusted for potential demographic and clinical covariates (gender,

Table 2Association of baseline biomarker levels with baseline chest radiograph characteristics.
[A]
Biomarkers associated with presence of cavities at baseline
Unadjusted model Adjusted (demographics)
Assay Est (95%CI) P value AUC Est (95%CI) P value AUC
SAA1 1.97 (1.71, 2.28) 0.0000 0.65 1.81 (1.58, 2.08) 0.0000 0.65CRP 1.74 (1.55, 1.94) 0.0000 0.65 1.60 (1.44, 1.78) 0.0000 0.64IL-1β 1.56 (1.37, 1.77) 0.0005 0.62 1.42 (1.26, 1.58) 0.0023 0.61MMP-8 1.54 (1.38, 1.71) 0.0001 0.63 1.42 (1.28, 1.57) 0.0006 0.61PTX-3 1.39 (1.27, 1.53) 0.0004 0.61 1.27 (1.17, 1.39) 0.0040 0.61MMP-9 1.37 (1.27, 1.48) 0.0001 0.63 1.31 (1.22, 1.42) 0.0004 0.61sICAM-1 1.17 (1.12, 1.22) 0.0004 0.61 1.12 (1.08, 1.16) 0.0023 0.60[B]
Biomarkers associated with cavities N 4 cm at baseline
Unadjusted model Adjusted (demographics)
114 G.B. Sigal et al. / EBioMedicine 25 (2017) 112–121
age, body mass index, HIV status, study location (African vs. non-Afri-can) and study arm).
For each biomarker, the treatment effect for a given participant wascalculated as C8/C0; the ratio of the biomarker levels at week 8 (C8; con-centration after treatment) relative to week 0 (C0; concentration atbaseline). Linear regression was used to examine the significance ofthe association of the log10-transformed treatment effect with cultureconversion. Three models were used: (i) an unadjusted model; (ii) amodel that adjusted for demographic covariates, and (iii) an adjustedmodel that included indicators of baseline disease severity (as describedabove).
We also investigatedwhether biomarker combinationswere predic-tive of week-8 culture status. The primary methodology employed wasL1 penalized (Lasso) logistic regression (R package glmnet), with ran-dom forests also being deployed (R package random ForestSRC).(Hastie et al., 2009).
Assay Est (95%CI) P value AUC Est (95%CI) P value AUC
SAA1 1.90 (1.65, 2.19) 0.0000 0.65 1.62 (1.41, 1.86) 0.0005 0.62IL-1β 1.77 (1.57, 2.00) 0.0000 0.65 1.48 (1.32, 1.65) 0.0006 0.62CRP 1.67 (1.50, 1.87) 0.0000 0.64 1.45 (1.31, 1.62) 0.0004 0.61IL-6 1.59 (1.41, 1.79) 0.0001 0.62 1.35 (1.20, 1.52) 0.0093 0.60MMP-8 1.55 (1.39, 1.73) 0.0000 0.64 1.35 (1.22, 1.49) 0.0036 0.60PTX-3 1.39 (1.27, 1.52) 0.0003 0.62 1.20 (1.10, 1.31) 0.0306 0.58sICAM-1 1.30 (1.24, 1.35) 0.0000 0.70 1.21 (1.17, 1.25) 0.0000 0.68E-Selectin 1.29 (1.21, 1.37) 0.0001 0.63 1.22 (1.15, 1.30) 0.0017 0.61IL-2R 1.27 (1.20, 1.35) 0.0001 0.64 1.18 (1.12, 1.25) 0.0022 0.61LBP 1.26 (1.18, 1.34) 0.0002 0.63 1.18 (1.11, 1.25) 0.0065 0.61TNF-RI 1.17 (1.12, 1.22) 0.0003 0.62 1.13 (1.08, 1.17) 0.0045 0.61[C]
3. Results
The demographic and clinical characteristics of the 319 protocol-correct trial participants included in biomarker analyses are shown inTable 1. Three patients (1%) remained sputum culture positive at16 weeks and were adjudicated to have failed treatment.
Using multiplexed ECL assays, we quantified the serum levels of 69proteins and one metabolic marker. For a majority of these biomarkers(62 of 70), the level was greater than twice the limit of detection forat least 75% of the samples (Supplemental Table 1).
Table 1Demographic and clinical characteristics of the study population.
No. patients Number with stable sputum conversion onsolid and liquid media
(% of total) (% of category)
Characteristic At 8 weeks At 12 weeks At 16 weeksAll subjects 319 (100%) 209 (66%) 264 (83%) 316 (99.1%)Gender
Female 107 (34%) 86 (80%) 93 (87%) 105 (98.1%)Male 212 (66%) 123 (58%) 171 (81%) 211 (99.5%)
Age0–20 17 (5%) 13 (76%) 16 (94%) 17 (100.0%)21–40 203 (64%) 128 (63%) 169 (83%) 203 (100.0%)41–60 80 (25%) 54 (68%) 63 (79%) 78 (97.5%)61 19 (6%) 14 (74%) 16 (84%) 18 (94.7%)
Body mass indexBMI ≤ 18.5 97 (30%) 56 (58%) 80 (82%) 95 (97.9%)BMI N 18.5 222 (70%) 153 (69%) 184 (83%) 221 (99.5%)
LocationN. America 109 (34%) 85 (78%) 99 (91%) 107 (98.2%)Spain 24 (8%) 17 (71%) 19 (79%) 24 (100.0%)S. Africa 64 (20%) 44 (69%) 54 (84%) 64 (100.0%)Uganda 122 (38%) 63 (52%) 92 (75%) 121 (99.2%)
HIV statusNegative 284 (89%) 189 (67%) 235 (83%) 282 (99.3%)Positive 35 (11%) 20 (57%) 29 (83%) 34 (97.1%)
Baseline smearLow 114 (36%) 91 (80%) 102 (89%) 114 (100.0%)High 205 (64%) 118 (58%) 162 (79%) 202 (98.5%)
Baseline chest x-RayNo cavity 115 (36%) 84 (73%) 98 (85%) 115 (100.0%)Cavity ≤ 4 cm 80 (25%) 54 (68%) 70 (88%) 79 (98.8%)Cavity N 4 cm 124 (39%) 71 (57%) 96 (77%) 122 (98.4%)
Baseline MGIT960TTD b = 5 days 82 (26%) 45 (55%) 64 (78%) 79 (96.3%)TTD N 5 days 237 (74%) 164 (69%) 200 (84%) 237 (100.0%)
Study armRifampin 151 (47%) 93 (62%) 124 (82%) 151 (100.0%)Rifapentine 168 (53%) 116 (69%) 140 (83%) 165 (98.2%)
MGIT960 TTD refers to the time-to-detection for baseline liquid mycobacterium growthindicator tube system (MGIT) 960 cultures. Sputum conversion indicates negative sputumculture on both solid and liquid media at the specified time point.
Biomarkers associated with TB extent of disease on baseline chest radiograph(N50% lung involvement)
Unadjusted model Adjusted (demographics)
Assay Est (95%CI) P value AUC Est (95%CI) P value AUC
IL-1β 2.42 (2.15, 2.72) 0.0000 0.73 2.00 (1.79, 2.23) 0.0000 0.70IL-6 1.89 (1.67, 2.13) 0.0000 0.67 1.56 (1.38, 1.76) 0.0002 0.64SAA1 1.87 (1.62, 2.16) 0.0000 0.65 1.55 (1.34, 1.79) 0.0025 0.62PCT 1.78 (1.57, 2.02) 0.0000 0.65 1.46 (1.28, 1.66) 0.0039 0.61IP-10 1.67 (1.50, 1.87) 0.0000 0.66 1.49 (1.34, 1.67) 0.0003 0.64VEGF 1.66 (1.52, 1.82) 0.0000 0.68 1.49 (1.37, 1.63) 0.0000 0.65IFN-γ 1.63 (1.44, 1.85) 0.0001 0.63 1.42 (1.26, 1.60) 0.0031 0.60CRP 1.62 (1.45, 1.81) 0.0000 0.65 1.33 (1.19, 1.49) 0.0097 0.59I-TAC 1.59 (1.40, 1.80) 0.0002 0.62 1.28 (1.15, 1.42) 0.0245 0.59CXCL9 1.57 (1.44, 1.72) 0.0000 0.66 1.43 (1.31, 1.56) 0.0000 0.64MIP-3α 1.55 (1.38, 1.73) 0.0001 0.63 1.40 (1.26, 1.55) 0.0016 0.62IL-2R 1.52 (1.44, 1.61) 0.0000 0.73 1.36 (1.29, 1.44) 0.0000 0.70MMP-8 1.48 (1.33, 1.65) 0.0003 0.61 1.24 (1.12, 1.38) 0.0421 0.56E-Selectin 1.48 (1.39, 1.57) 0.0000 0.70 1.38 (1.29, 1.47) 0.0000 0.68PTX-3 1.46 (1.33, 1.59) 0.0000 0.64 1.20 (1.10, 1.31) 0.0357 0.58Osteopontin 1.41 (1.33, 1.48) 0.0000 0.71 1.26 (1.20, 1.33) 0.0000 0.67MMP-1 1.36 (1.25, 1.49) 0.0005 0.62 1.19 (1.09, 1.30) 0.0457 0.57uPAR 1.34 (1.28, 1.41) 0.0000 0.69 1.28 (1.22, 1.34) 0.0000 0.67sICAM-1 1.34 (1.29, 1.40) 0.0000 0.73 1.24 (1.20, 1.29) 0.0000 0.71MMP-9 1.32 (1.22, 1.42) 0.0005 0.62 1.18 (1.09, 1.28) 0.0364 0.57Granzyme-B 1.28 (1.20, 1.37) 0.0003 0.63 1.17 (1.10, 1.25) 0.0148 0.60LBP 1.27 (1.19, 1.35) 0.0002 0.63 1.17 (1.10, 1.25) 0.0114 0.60TNF-RII 1.21 (1.15, 1.28) 0.0005 0.62 1.12 (1.06, 1.19) 0.0387 0.58Neopterin 1.20 (1.15, 1.26) 0.0000 0.63 1.20 (1.15, 1.25) 0.0001 0.63TNF-RI 1.19 (1.14, 1.25) 0.0000 0.64 1.12 (1.08, 1.17) 0.0077 0.60LBP 1.27 (1.19, 1.35) 0.0002 0.63 1.17 (1.10, 1.25) 0.0114 0.60
The estimated association (Est) is 10coeff, where coeff is the coefficient of a linearmodel forthe effect of the indicated baseline radiographic characteristics on log10 transformed base-line biomarker levels. The Est value can be interpreted as the expected factor change inbaseline biomarker level for patients with [A] cavities relative to patients with no cavities;[B] cavities N 4 cm relative to patients with cavities b 4 cm; [C] lung involvement N 50% rel-ative to patients with lung involvement b 50%. The tables show values for an unadjustedmodel as well as a model that is adjusted for demographic covariates (gender, age, BMI,HIV status, region (Africa vs. Not-Africa) and study arm).The AUC value for ROC curvesis a non-parametric indicator of effect size, comparing thedistributions of biomarker ratiosfor the two outcome classes (either unadjusted or adjusted for the covariates). Only bio-markers with statistically significant associations (p b 0.05/62 assays = 0.0008) in atleast one of the models are shown.

Table 3Association of baseline biomarker levels with baseline microbiological characteristics.
[A]
Smear grade N 1 at baseline
Unadjusted model Adjusted (demographics)
Assay Est (95%CI) P value AUC Est (95%CI) P value AUC
SAA1 1.68 (1.45, 1.95) 0.0004 0.62 1.52 (1.32, 1.74) 0.0027 0.60IL-1β 1.57 (1.38, 1.78) 0.0004 0.62 1.39 (1.24, 1.56) 0.0033 0.60IL-6 1.52 (1.34, 1.72) 0.0008 0.62 1.37 (1.22, 1.54) 0.0060 0.59PTX-3 1.49 (1.36, 1.63) 0.0000 0.64 1.37 (1.26, 1.48) 0.0002 0.63TNF-RI 1.19 (1.14, 1.24) 0.0001 0.62 1.15 (1.11, 1.20) 0.0006 0.61[B]
MGIT time-to-detection
Unadjusted model Adjusted (demographics)
Assay Est (95%CI) P value AUC Est (95%CI) P value AUC
IFN-γ 1.82 (1.56, 2.12) 0.0001 0.67 1.48 (1.28, 1.70) 0.0062 0.63IL-15 1.27 (1.19, 1.34) 0.0001 0.67 1.19 (1.12, 1.27) 0.0038 0.63
The estimated association (Est) is 10coeff, where coeff is the coefficient of a linearmodel for the effect of the indicated baselinemicrobiological characteristics on log10 transformed baselinebiomarker levels. The Est value can be interpreted as the expected factor change in baseline biomarker level for patients with [A] baseline smear grade N 1 relative to patients with smeargrade b 1; [B] baselineMGIT time-to-detection ≤ 5 days relative to patientswithMGIT time-to-detection N 5 days. The tables show values for an unadjustedmodel aswell as amodel that isadjusted for demographic covariates (gender, age, BMI, HIV status, region (Africa vs. Not-Africa) and study arm). The AUC value for ROC curves is a non-parametric indicator of effect size,comparing the distributions of biomarker ratios for the two outcome classes (either unadjusted or adjusted for the covariates). Only biomarkerswith statistically significant associations (pb 0.05/62 assays = 0.0008) in at least one of the models are shown.
115G.B. Sigal et al. / EBioMedicine 25 (2017) 112–121
A small subset (8 of 70) provided levels above this threshold forb25% of the samples. We excluded these assays – GM-CSF, IL-1α, IL-2,IL-4, IL-12p70, IL-13, IFN-2α and IFNβ – from further analysis.
3.1. Baseline Biomarkers Associated With Baseline Clinical Characteristics
Linear models were used to measure the association of biomarkerlevels with disease severity at baseline, with and without correctionfor demographic covariates. Tables 2 and 3 show the biomarkers thathad a coefficient significantly different than 0 in at least one of themodels. For the unadjusted model, we found biomarkers with signifi-cant associations with each of the indicators. Adjustment for demo-graphic covariates tended to decrease the significance of theassociations. Even after adjustment, however, some biomarkersretained significant associations for all indicators except MGIT time-to-detection. Fig. 1 shows the baseline biomarker levels against diseaseclassification group, for six biomarkers (SAA1, CRP, IL-1β, IL-6, PTX-3andMMP-8) that tended to have themost significant increases in base-line levels with increases in disease severity indicators.
The analysis of baseline biomarker levels was repeated after stratifi-cation for HIV status. Limiting analysis to only HIV negative patients didnot significantly change the identified biomarkers or the strengths ofthe measured associations with baseline clinical characteristics (datanot shown). The study was not sufficiently powered for identifying bio-markers associatedwith baseline clinical characteristics for theHIV pos-itive subjects, however, qualitatively the association of the two acutephase proteins SAA1 and CRP with baseline clinical characteristics ap-peared to be much weaker in the HIV positive subjects relative to theHIV negative subjects. For example, for HIV negative subjects, SAA1was 2.09-fold higher (CI: 1.79 to 2.43) in subjects with cavities at base-line and 1.77-fold higher (CI: 1.51 to 2.07) in subjects with sputumsmear grades of 2 or higher, while for HIV positive subjects the mea-sured increases in SAA1 associated with these two indicators wereonly 1.44-fold (CI: 0.99 to 2.11) and 1.16-fold (0.78 to 1.71),respectively.
3.2. Effect of Treatment on Biomarker Levels
Fig. 2 shows the treatment effect for all biomarkers across all pa-tients. Qualitatively, a large number of biomarkers appear to be influ-enced by treatment and have a preponderance of points with ratios
above or below one. The spread in the effect for different subjects, how-ever, is large and for some assays covers more than a factor of ten. Bio-markers with significant treatment effects were selected based on twocriteria (Supplemental Table 2). First, the geometric average treatmenteffect was significantly different from one. Second, the inter-quartilerange (IQR) did not include the null result (i.e., C8/C0 = 1). Most ofthe selected biomarkers (23 of 26) exhibited, on average, decreases inlevels with treatment; only three biomarkers increased with treatment.Three of the largest average decreases with treatment were observedfor the acute phase proteins SAA1, CRP and LBP,with the largest averagedecrease (~ten-fold) exhibited by SAA1. Large decreases were also ob-served for cytokines associated with host inflammatory response (IL-6, IL-1β and IL-22), and biomarkers of tissue reorganization and repair(MMP-1, MMP-8 and VEGF). The largest increase in biomarker levelswith treatment was observed for osteocalcin (~1.6-fold), a bone-de-rived biomarker with a role in bone synthesis and glucose metabolism.
Stratification by HIV status indicated that the markers showingchanges with treatment and the sizes of themeasured treatment effectswere not significantly different for the HIV positive and negative sub-groups (data not shown). One exception was LAG-3. For the HIV nega-tive subjects, LAG-3 demonstrated a relatively modest 1.18-foldincrease in average biomarker level with treatment (CI: 1.10 to 1.27).However, in the HIV positive group, a significantly larger 1.90-fold in-crease was observed (CI: 1.64 to 2.39).
3.3. Biomarkers Associated With Microbiologic Treatment Response
Fig. 3 shows the ratio of week-8 andweek-0 biomarker levels for thetop 25 biomarkers listed in Supplemental Table 2 across all patients, col-oring the points based on culture conversion status at week 8. Qualita-tively, the change in biomarker levels with treatment tends to begreater for the patients that achieve culture conversion, especially forthe biomarkers that are most affected by treatment. However, there isconsiderable overlap in the distributions.
The associations of biomarker treatment response with week-8 cul-ture status for the six biomarkers with the strongest changes after treat-ment (the top six biomarkers in Supplemental material Table 2) areshown in Supplemental Table 3. Three biomarkers with strong re-sponses to treatment (SAA1, CRP and IL-1β) were the only biomarkersthat also showed an association with week-8 culture status in at leastone of the models that met our criteria for significance. These
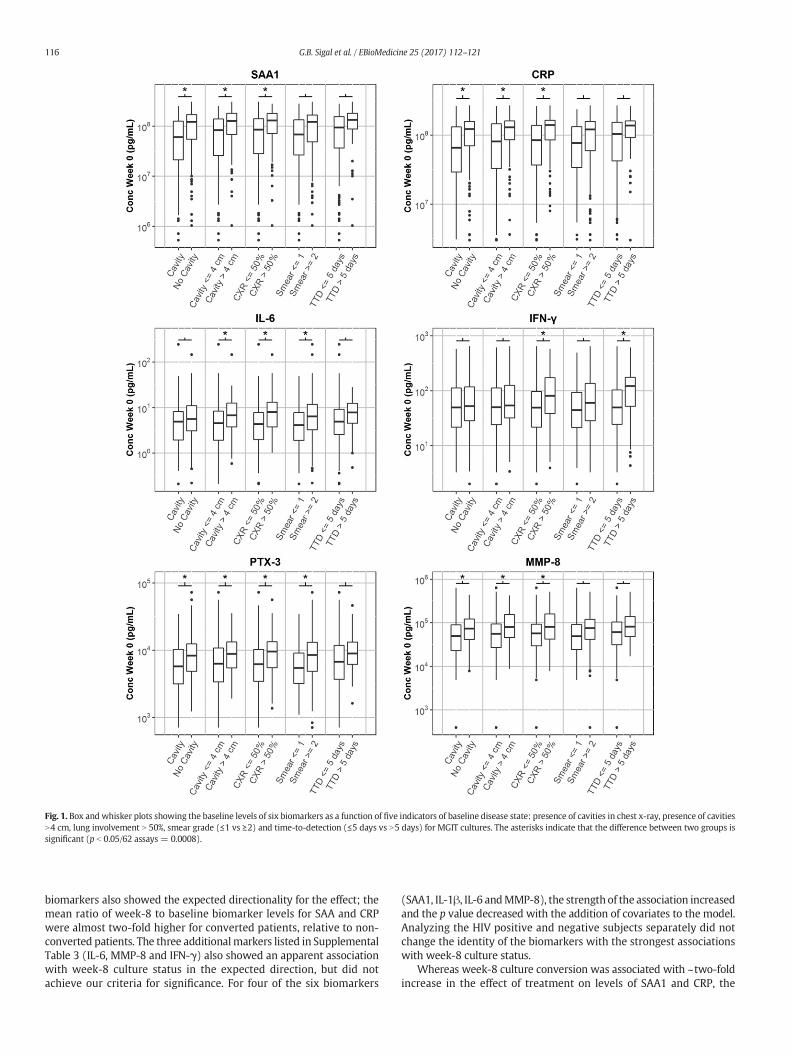
Fig. 1. Box and whisker plots showing the baseline levels of six biomarkers as a function of five indicators of baseline disease state: presence of cavities in chest x-ray, presence of cavitiesN4 cm, lung involvement N 50%, smear grade (≤1 vs ≥2) and time-to-detection (≤5 days vs N5 days) for MGIT cultures. The asterisks indicate that the difference between two groups issignificant (p b 0.05/62 assays = 0.0008).
116 G.B. Sigal et al. / EBioMedicine 25 (2017) 112–121
biomarkers also showed the expected directionality for the effect; themean ratio of week-8 to baseline biomarker levels for SAA and CRPwere almost two-fold higher for converted patients, relative to non-converted patients. The three additionalmarkers listed in SupplementalTable 3 (IL-6, MMP-8 and IFN-γ) also showed an apparent associationwith week-8 culture status in the expected direction, but did notachieve our criteria for significance. For four of the six biomarkers
(SAA1, IL-1β, IL-6 andMMP-8), the strength of the association increasedand the p value decreased with the addition of covariates to the model.Analyzing the HIV positive and negative subjects separately did notchange the identity of the biomarkers with the strongest associationswith week-8 culture status.
Whereas week-8 culture conversion was associated with ~two-foldincrease in the effect of treatment on levels of SAA1 and CRP, the

Fig. 2. Effect of TB treatment on biomarker levels. The plot shows the ratio of post-treatment (week 8) to baseline (week 0) biomarker levels for each biomarker in each study subject. Theassays are ordered based on the magnitude of the treatment effect. Asterisks indicate the effect is statistically significant (p b 0.05/62 assays = 0.0008).
117G.B. Sigal et al. / EBioMedicine 25 (2017) 112–121
biomarkers with the largest effect sizes, the size of this effect was stillsmall relative to the overall variation of the treatment effect withineach group. For this reason, the predictive ability of any individual
Fig. 3. Association of biomarker treatment effect with sputum culture conversion status at weelevels for the 25 biomarkers with the strongest treatment effects (the top 25 assays in Supplstatus at week 8 (blue = converted, red = non-converted). For each biomarker and group, asignificant association with culture status (p b 0.05/62 biomarkers = 0.0008) are marked with
assay for week-8 culture status is likely to be relatively weak. The areaunder curve (AUC) values for receiver operating characteristic (ROC)analysis can be used as a non-parametric indicator of effect size. The
k 8. The plot shows the ratio of post-treatment (week 8) to baseline (week 0) biomarkeremental Table 2). Points are separated and colored based on sputum culture conversionhorizontal line segment indicates the median biomarker value. The biomarkers with aan asterisk.

118 G.B. Sigal et al. / EBioMedicine 25 (2017) 112–121
AUC values for SAA1 and CRP were relatively low, ranging from 0.62 to0.65 depending on the model used.
For the six biomarkers with the strongest response to treatment, wecompared the strength of the association of biomarker response withweek-8 culture status, week-12 culture status andweek-8 cough status(Fig. 4). Analysis of the association of the biomarkers withweek-12 cul-ture status showed trends thatwere similar to those described above for
Fig. 4.Box andwhisker plots showing themagnitude of the treatment effect for six biomarkers (outcome variables: week 8 culture conversion status, week 12 culture conversion status, and prgroups is significant (p b 0.05/62 assays = 0.0008).
week-8 culture status, although the strength of the associations wasweaker and the p values did not meet our criteria for significance. Forexample, the increase in treatment response (unadjusted for covariates)with week-8 culture conversion was 1.7-fold (p= 0.0001) for CRP and1.8-fold (p = 0.0009) for SAA1, but the association with week-12 cul-ture conversion was 1.6-fold (p = 0.040) for CRP and 1.6-fold (p =0.010) for SAA1.
the ratio ofweek 8 andweek 0 biomarker levels) after grouping subjects according to threeesence/absence of cough at 8weeks. The asterisks indicate that the difference between two

119G.B. Sigal et al. / EBioMedicine 25 (2017) 112–121
Association of the biomarker response to treatment with week-8cough status was weak. As with culture status, the largest increases inthe biomarker response to treatment with absence of cough at8 weeks (unadjusted for covariates) were observed for SAA1 (1.2-fold,p = 0.37) and CRP (1.3-fold, p = 0.048).
Use of biomarker combinations as predictors of week-8 culture sta-tus did not reveal any compelling signatures. Themodest AUCvalues re-ported above for individual biomarkers were only incrementallyimproved when signatures were derived using L1 penalized logistic re-gression. For example, using cross-validated AUC as a predictive modelperformancemetric and invoking the “1 SE rule” for determiningmodelsize and restricting analysis to HIV negative subjects yields a set of fourmarkers (CRP, IL_10,MMP_3 and IFN_g). However, the attendant cross-validated AUC is only 0.63. While a 13 marker model was optimal,achieving a value of 0.66, the variability associated with this estimatemake the stability of the corresponding signature questionable. Similar-ly, random forest-based classification did not produce improved predic-tive performance. Analysis of biomarker associations with treatmentfailure was not feasible as only three trial participants (1%) failedtreatment.
4. Discussion
In this study, we identified biomarkers associated with radiographicand microbiologic measures of severity, as well as biomarkers associat-ed with treatment response. Seven baseline biomarkers were signifi-cantly associated with the presence or absence of cavities atenrollment. The strongest effect was observed for the acute phase pro-tein SAA1 (serum amyloid protein A), which showed a two-fold in-crease at baseline in patients with cavities, as compared to patientswithout cavities. The other proteins associated with cavitation includedthe inflammatory cytokine IL-1β, the tissue-remodeling factor MMP-8(matrix metalloproteinase 8) and the cell migration factor sICAM-1(soluble intercellular cell adhesion molecule 1). Interestingly, the num-ber of biomarkers associatedwith baseline TBdisease increasedwith in-creasing disease severity: seven biomarkers were associated with thepresence of any cavities, 11 biomarkers associated with the presenceof cavities larger than 4 cm, and 26 biomarkers associated with ≥50%of lung involvement. The associations between serum biomarkers andseverity of lung injury is plausible given production of these markersin the lung has also been reported. For instance, SAA1 is expressed inthe lung, and has been associatedwith lung injury aswell as lung cancer(Lopez-Campos et al., 2013; Baba et al., 1992). Similarly, the collectinPentraxin 3 can both be produced in lung endothelial cells in responseto IL-1 (Pauwels et al., 2010) or in lung fibroblasts in response to TNF-α (Mantovani et al., 2013) and is associated with pulmonary fibrosis(Pilling et al., 2015). VEGF is expressed by epithelial cells as well as byM. tuberculosis-infected macrophages, and has been implicated in gran-uloma-associated angiogenesis (Polena et al., 2016). Finally, elevatedlevels of alpha-defensin are associated with pulmonary fibrosis(Mukae et al., 2002; Sakamoto et al., 2015a; Sakamoto et al., 2015b).Taken together, these data suggest that selected markers measured inserum reflect both the burden of microbial infection and the degree oflung injury.
Biomarker associations with baseline measures of microbiologicburden, namely smear grade and MGIT time-to-detection, were alsoevaluated. We identified five biomarkers, SAA1, IL-1β, IL-6, PTX-3 andTNF-RI, that had significant associations with smear grade. These bio-markers were also among those that had the strongest associationswith more extensive disease on chest radiograph (described above).Two additional biomarkers, IFN-γ and IL-15, were associated withMGIT time-to-detection, andwere distinct from the fivemarkers associ-ated with smear grade. The identification of serummarkers with strongassociations with baseline bacillary burden raises the possibility forrapid point-of-care tests that could inform decisions at the time of
treatment initiation in terms of regimen composition and duration,allowing for potential individualization of care.
On treatment, themajority of biomarkers declined significantly, sug-gesting aberrant levels at baseline that return to normal as the disease istreated, bacterial burden declines and lung injury resolves. Importantly,we also found that several previously reported putative TB-associatedbiomarkers (HOMX1, neopterin, and cathelicidin)were not significantlyassociated with treatment response. The biomarkers with the strongesttreatment responses were SAA1, CRP, IL-6, MMP-8, and IL-1β, all ofwhichwere also linked to disease severity andmeasures of baseline ba-cillary burden, providing additional evidence that these markers are in-dicators of disease state at time of diagnosis and during the course oftreatment. Treatment also decreased alpha-defensin levels, not previ-ously reported in TB, although predicted by gene expression studies(Maertzdorf et al., 2012). Plasma heme oxygenase-1 (HOMX1) has pre-viously been reported to have a strong response to TB treatment,(Andrade et al., 2013) but we found little change in HOMX1 levelswith treatment. Neopterin has also been reported to decrease signifi-cantly with treatment; (Turgut et al., 2006) in our study we did notsee a large change in neopterin, but this result may be related to differ-ences in timing of sample collection, as prior reports found thatneopterin levels return to baseline levels only after six months of treat-ment. Whereas plasma protein 10 (IP-10)/CXCL10 has previously beenreported to be useful in monitoring patients in smaller studies,(Azzurri et al., 2005; Wergeland et al., 2015; Kabeer et al., 2011) itwas not strongly associated with treatment effect in our analyses, al-though higher levels were noted with greater TB extent of disease onbaseline chest radiograph. Cathelicidin and vitamin D binding protein(VitD-BP) assays were developed for this study given the importantrole of Vitamin D processing in TB disease, (Yamshchikov et al., 2010)but we found little association with treatment response for thesemarkers. The biomarkers that had the strongest associations withweek-8 culture status, SAA1, CRP, IL1β, IL6, MMP-8 and IFN-γ, over-lapped with the biomarkers that had the strongest associations withbaseline disease status, as well as the largest changes with treatment.However, of these six biomarkers only three, SAA1, CRP and IL-1β, hadassociations that met our criteria for significance, yet multivariate re-gression models, employingmultiple biomarkers, did not identify com-binations with high predictive utility for week-8 culture conversion.Moreover, analysis of biomarker associations with treatment failurewas not feasible as only three trial participants (1%) failed treatment.
Three biomarkers showed increasing levels during treatment:osteocalcin, MCP-1 and MCP-4. The increase in MCP-1 with treatmenthas been previously noted (Djoba Siawaya et al., 2009). The reportedrole of MCP-1 and MCP-4 (or monocyte chemoattractant proteins 1and 4) as attractants for monocytes and T cells, cell types involved ingranuloma formation, provides a plausible mechanism by which levelsof these chemokines increase in response to treatment (Saunders andBritton, 2007). The increase in osteocalcin with TB treatment is a newfinding, however, and the mechanism for this relationship is not clear.Osteocalcin is an osteoblast-specific bone matrix protein involved inbone formation, and has been found to be involved in insulin regulation,(Wei and Karsenty, 2015) suggesting that osteocalcinmay play a role inmetabolic control during TB infection. Alternatively, osteocalcin levelsmay be related to pathogen clearance (Das et al., 2013; Garhyan et al.,2015). This is conceivable given reports that M. tuberculosis survivalpost-therapymay involve infection of CD271(+) bonemarrow-mesen-chymal stem cells, which may act as a protective intracellular niche forM. tuberculosis persistence, and given that toll-like receptor stimulationof osteoclast precursors inhibit their differentiation into non-inflamma-tory mature osteoclasts during microbial infection, instead maintainingthe phagocytic activity of the precursor cells (Takami et al., 2002).
Our study has limitations. First, long-term outcomes of interest (re-lapse versus durable cure) were not a component of the parent phase 2trial, and our analyses were focused on biomarker associations withbaseline severity and microbiologic indicators of treatment effect only.

120 G.B. Sigal et al. / EBioMedicine 25 (2017) 112–121
An evaluation of the most promising biomarkers we discovered shouldbe pursued as part of clinical trials with long-term follow-up. Second,we were limited in our ability to explore the dynamics of biomarkerchange given two time points for serum collection. An assessment ofthe best performingmarkers in our study, across additional time pointswould improve our understanding of the predictive performance ofthese biomarkers. Third, the parent trial allowed for TB treatmentprior to the randomization visit when serum was collected and studydrugs initiated. This may have impacted baseline biomarker levels,however, in sensitivity analyses limited to participants with no pre-treatment, the biomarkerswith the strongest associationswith baselineseverity and treatment effect remained the same.
In conclusion, across 70 host biomarkers evaluated in a large and di-verse population of TB patients enrolled in a clinical trial, we found thatseveral previously reported putative TB-associated biomarkers(HOMX1, neopterin, and cathelicidin) were not significantly associatedwith treatment response. However, across numerous analyses we dididentify seven recurring biomarkers that 1) were associated with base-line disease severity, 2) were strongly modulated by TB treatment, and3) had treatment responses thatwere greater for patients thatwere cul-ture-converted at 8 weeks. These recurring biomarkers included acutephase proteins (SAA1, PTX-3, PCT and CRP); inflammatory cytokines(IL-1β and IL-6); and a factor associated with tissue reorganization(MMP-8). These biomarkers may provide blood-based targets both fordeterminingbaselinedisease severity and formonitoringdisease duringtreatment; they warrant examination in patient cohorts with follow-upthat captures long-term outcomes of failure and relapse.
Author Contributions
Conception and design: PN, GBS, AM, and MRS. Data acquisition andmanagement: MRS, LJ, MW, and WCW. Assay development and bio-marker measurements: GBS, AM, MW, SB, NS, KH. Analysis and inter-pretation: PN, GBS, MRS, JLD, MW, JJ, JS, and DL. Drafting themanuscript for important intellectual content: GBS, AM, MRS, DMLand PN.
Disclaimer
References in this manuscript to any specific commercial products,process, service, manufacturer, or company does not constitute its en-dorsement or recommendation by the U.S. Government or CDC. Thefindings and conclusions are those of the authors and do not necessarilyrepresent the views of the Centers for Disease Control and Prevention.
Acknowledgements
We thank Drs. Susan Dorman, Jason Stout, Neil Schluger as protocolco-Chairs and the TBTC Study 29 protocol team for their support of em-bedding biomarker studies into the clinical trial. We thank Drs. KarenDobos and Nicole Kruh-Garcia for input on biomarker interpretations.We thank R. Sivakamasundari, C. Frye, S. Grove, D. Bartlett, M.Navaratnam and M. Engle for assistance in sample handling, testingand data processing. Funding for recruitment, enrollment, and clinicaland laboratory follow-up of TBTC Study 29 participants was providedby the United States Centers for Disease Control and Prevention. Thebiomarker assays and PN were supported by the National Institutes ofHealth through National Institute of Allergy and Infectious Diseasesfunding (1R01AI104589: TB Surrogate Markers for Assessing Responseto Treatment (TB SMART Study)), and by the Centers for Disease Controland Prevention, TB Trials Consortium Contract 200-2009-32597 (P.N.).
Appendix A. Supplementary data
Supplementary data to this article can be found online at https://doi.org/10.1016/j.ebiom.2017.10.018.
References
Andrade, B.B., Pavan Kumar, N., Mayer-Barber, K.D., et al., 2013. Plasma heme oxygenase-1 levels distinguish latent or successfully treated human tuberculosis from active dis-ease. PLoS One 8 (5), e62618.
Azzurri, A., Sow, O.Y., Amedei, A., et al., 2005. IFN-gamma-inducible protein 10 and pen-traxin 3 plasma levels are tools for monitoring inflammation and disease activity inMycobacterium tuberculosis infection. Microbes Infect. 7 (1), 1–8.
Baba, S., Takahashi, T., Kasama, T., Shirasawa, H., 1992. Identification of two novel amyloidA protein subsets coexisting in an individual patient of AA-amyloidosis. Biochim.Biophys. Acta 1180 (2), 195–200.
Coussens, A.K., Wilkinson, R.J., Hanifa, Y., et al., 2012. Vitamin D accelerates resolution ofinflammatory responses during tuberculosis treatment. Proc. Natl. Acad. Sci. U. S. A.109 (38), 15449–15454.
Das, B., Kashino, S.S., Pulu, I., et al., 2013. CD271(+) bone marrow mesenchymal stemcells may provide a niche for dormant Mycobacterium tuberculosis. Sci. Transl. Med.5 (170), 170ra13.
Debad, J.D., Glezer, E.N., Wohlstadter, J.N., Sigal, G.B., 2004. Clinical and biological applica-tions of ECL. Electrogenerated Chemiluminescence. Marcel Dekker.
Djoba Siawaya, J.F., Bapela, N.B., Ronacher, K., et al., 2008. Immune parameters as markersof tuberculosis extent of disease and early prediction of anti-tuberculosis chemother-apy response. J. Inf. Secur. 56 (5), 340–347.
Djoba Siawaya, J.F., Beyers, N., van Helden, P., Walzl, G., 2009. Differential cytokine secre-tion and early treatment response in patients with pulmonary tuberculosis. Clin. Exp.Immunol. 156 (1), 69–77.
Dorman, S.E., Goldberg, S., Stout, J.E., et al., 2012. Substitution of rifapentine for rifampinduring intensive phase treatment of pulmonary tuberculosis: study 29 of the tuber-culosis trials consortium. J Infect Dis 206 (7), 1030–1040.
Garhyan, J., Bhuyan, S., Pulu, I., Kalita, D., Das, B., Bhatnagar, R., 2015. Preclinical and clin-ical evidence of Mycobacterium tuberculosis persistence in the hypoxic niche of bonemarrow mesenchymal stem cells after therapy. Am. J. Pathol. 185 (7), 1924–1934.
Hastie, T., Tibshirani, R., Friedman, J.H., 2009. The Elements of Statistical Learning: DataMining, Inference, and Prediction. 2nd ed. Springer, New York, NY.
Horne, D.J., Royce, S.E., Gooze, L., et al., 2010. Sputum monitoring during tuberculosistreatment for predicting outcome: systematic review and meta-analysis. Lancet In-fect. Dis. 10 (6), 387–394.
Huang, C.T., Lee, L.N., Ho, C.C., et al., 2014. High serum levels of procalcitonin and solubleTREM-1 correlated with poor prognosis in pulmonary tuberculosis. J. Inf. Secur. 68(5), 440–447.
Jayakumar, A., Vittinghoff, E., Segal, M.R., et al., 2015. Serum biomarkers of treatment re-sponse within a randomized clinical trial for pulmonary tuberculosis. Tuberculosis(Edinb) 95 (4), 415–420.
Kabeer, B.S., Raja, A., Raman, B., et al., 2011. IP-10 response to RD1 antigens might be auseful biomarker for monitoring tuberculosis therapy. BMC Infect. Dis. 11, 135.
Lee, J.H., Chang, J.H., 2003. Changes of plasma interleukin-1 receptor antagonist, interleu-kin-8 and other serologic markers during chemotherapy in patients with active pul-monary tuberculosis. Korean J. Intern. Med. 18 (3), 138–145.
Lopez-Campos, J.L., Calero, C., Rojano, B., et al., 2013. C-reactive protein and serum amy-loid a overexpression in lung tissues of chronic obstructive pulmonary disease pa-tients: a case-control study. Int. J. Med. Sci. 10 (8), 938–947.
Maertzdorf, J., Weiner III, J., Mollenkopf, H.J., et al., 2012. Common patterns and disease-related signatures in tuberculosis and sarcoidosis. Proc. Natl. Acad. Sci. U. S. A. 109(20), 7853–7858.
Mantovani, A., Biswas, S.K., Galdiero, M.R., Sica, A., Locati, M., 2013. Macrophage plasticityand polarization in tissue repair and remodelling. J. Pathol. 229 (2), 176–185.
Mihret, A., Bekele, Y., Bobosha, K., et al., 2013. Plasma cytokines and chemokines differen-tiate between active disease and non-active tuberculosis infection. J. Inf. Secur. 66 (4),357–365.
Mukae, H., Iiboshi, H., Nakazato, M., et al., 2002. Raised plasma concentrations ofalpha-defensins in patients with idiopathic pulmonary fibrosis. Thorax 57 (7),623–628.
Nahid, P., Saukkonen, J., Mac Kenzie, W.R., et al., 2011. CDC/NIH workshop. Tuberculosisbiomarker and surrogate endpoint research roadmap. Am. J. Respir. Crit. Care Med.184 (8), 972–979.
Nahid, P., Bliven-Sizemore, E., Jarlsberg, L.G., et al., 2014. Aptamer-based proteomic signa-ture of intensive phase treatment response in pulmonary tuberculosis. Tuberculosis(Edinb) 94 (3), 187–196.
Ostrowski, S.R., Ravn, P., Hoyer-Hansen, G., Ullum, H., Andersen, A.B., 2006. Elevated levelsof soluble urokinase receptor in serum from mycobacteria infected patients: stilllooking for a marker of treatment efficacy. Scand. J. Infect. Dis. 38 (11−12),1028–1032.
Pauwels, N.S., Bracke, K.R., Maes, T., et al., 2010. Cigarette smoke induces PTX3 expressionin pulmonary veins of mice in an IL-1 dependent manner. Respir. Res. 11, 134.
Phillips, P.P., Fielding, K., Nunn, A.J., 2013. An evaluation of culture results during treat-ment for tuberculosis as surrogate endpoints for treatment failure and relapse. PLoSOne 8 (5), e63840.
Phillips, P.P., Mendel, C.M., Burger, D.A., et al., 2016. Limited role of culture conversion fordecision-making in individual patient care and for advancing novel regimens to con-firmatory clinical trials. BMC Med. 14, 19.
Pilling, D., Cox, N., Vakil, V., Verbeek, J.S., Gomer, R.H., 2015. The long pentraxin PTX3 pro-motes fibrocyte differentiation. PLoS One 10 (3), e0119709.
Polena, H., Boudou, F., Tilleul, S., et al., 2016. Mycobacterium tuberculosis exploits the for-mation of new blood vessels for its dissemination. Sci Rep 6, 33162.
Sakamoto, N., Kakugawa, T., Hara, A., et al., 2015a. Association of elevated alpha-defensinlevels with interstitial pneumonia in patients with systemic sclerosis. Respir. Res. 16,148.

121G.B. Sigal et al. / EBioMedicine 25 (2017) 112–121
Sakamoto, N., Ishimatsu, Y., Kakugawa, T., et al., 2015b. Elevated plasma alpha-defensinsin patients with acute exacerbation of fibrotic interstitial pneumonia. Respir. Med.109 (2), 265–271.
Saunders, B.M., Britton, W.J., 2007. Life and death in the granuloma: immunopathology oftuberculosis. Immunol. Cell Biol. 85 (2), 103–111.
Takami, M., Kim, N., Rho, J., Choi, Y., 2002. Stimulation by toll-like receptors inhibits oste-oclast differentiation. J. Immunol. 169 (3), 1516–1523.
Turgut, T., Akbulut, H., Deveci, F., Kacar, C., Muz, M.H., 2006. Serum interleukin-2 andneopterin levels as useful markers for treatment of active pulmonary tuberculosis.Tohoku J. Exp. Med. 209 (4), 321–328.
Wallis, R.S., Kim, P., Cole, S., et al., 2013. Tuberculosis biomarkers discovery: develop-ments, needs, and challenges. Lancet Infect. Dis. 13 (4), 362–372.
Wei, J., Karsenty, G., 2015. An overview of the metabolic functions of osteocalcin. Rev.Endocr. Metab. Disord. 16 (2), 93–98.
Wergeland, I., Pullar, N., Assmus, J., et al., 2015. IP-10 differentiates between active and la-tent tuberculosis irrespective of HIV status and declines during therapy. J. Inf. Secur.70 (4), 381–391.
Yamshchikov, A.V., Kurbatova, E.V., Kumari, M., et al., 2010. Vitamin D status and antimi-crobial peptide cathelicidin (LL-37) concentrations in patients with active pulmonarytuberculosis. Am. J. Clin. Nutr. 92 (3), 603–611.
Zumla, A., Nahid, P., Cole, S.T., 2013. Advances in the development of new tuberculosisdrugs and treatment regimens. Nat. Rev. Drug Discov. 12 (5), 388–404.
Copyright © 2022 FDOKUMEN