BIOLOGY - Сельскохозяйственная биология
177
ISSN 2412-0324 (English ed. Online) ISSN 0131-6397 (Russian ed. Print) ISSN 2313-4836 (Russian ed. Online) Since January, 1966 ANIMAL BIOLOGY Vol. 51, Issue 6 November-December 2016 Moscow BIOLOGY AGRICULTURAL
-
Upload
khangminh22 -
Category
Documents
-
view
2 -
download
0
Transcript of BIOLOGY - Сельскохозяйственная биология
ISSN 2412-0324 (English ed. Online) ISSN 0131-6397 (Russian ed. Print) ISSN 2313-4836 (Russian ed. Online)
Since January, 1966
ANIMAL BIOLOGY
Vol. 51, Issue 6 November-December 2016 Moscow
BIOLOGY AGRICULTURAL
EDITORIAL BOARD
V.I. FISININ (Sergiev Posad, Russia) — Chairman (animal biology)
ALEKSAKHIN R.M. (Obninsk, Russia) BAGIROV V.A. (Moscow, Russia) BORISOVA E.M. (Moscow, Russia) BREM G. (Vienna, Austria) EGOROV I.A. (Sergiev Posad, Russia) FEDOROV Yu.N. (Moscow, Russia) FEDOROVA L.M. (editor-in-chief) (Moscow, Russia) KALNITSKY B.D. (Borovsk, Russia) KOSOLAPOV V.M. (Lobnya, Russia)
LAPTEV G.Yu. (St. Petersburg, Russia) LUSHENG HUANG (China) PANIN A.N. (Moscow, Russia) SAMUILENKO A.Ya. (Shchelkovo, Russia) SKRYABIN K.G. (Moscow, Russia) SMIRNOV A.M. (Moscow, Russia) SURAI P.F. (Ayr, Scotland, UK) SHEVELEV N.S. (Moscow, Russia) ZINOVIEVA N.A. (Dubrovitsy, Russia)
Covered in Scopus, Web of Science (BIOSIS Previews, Biological Abstracts, Russian Science Citation Index), Agris Science editors: E.V. Karaseva, L.M. Fedorova Publisher: Agricultural Biology Editorial Office NPO Address: build. 16/1, office 36, pr. Polesskii, Moscow, 125367 Russia Tel: + 7 (916) 027-09-12 E-mail: [email protected], [email protected] Internet: http://www.agrobiology.ru For citation: Agricultural Biology, Сельскохозяйственная биология, Sel’skokhozyaistvennaya biologiya ISSN 0131-6397 (Russian ed. Print) ISSN 2313-4836 (Russian ed. Online)
© Agricultural Biology Editorial Office (Редакция журнала «Сельскохозяйственная биология»), 2016
ISSN 2412-0324 (English ed. Online)
SEL’SKOKHOZYAISTVENNAYA BIOLOGIYA [AGRICULTURAL BIOLOGY], 2016, Vol. 51, ¹ 6
CONTENTS
REVIEWS Sereda A.D., Imatdinov A.R., Makarov V.V. The haemadsorption at African swine fever
(review) . . . . . . . . . . . . . . . . . . . . . . . . . 763 MARKER-ASSISTED SELECTION, TRANSGENESIS —FUNDAMENTALS Sermyagin A.A., Kovalyk N.V., Ermilov A.N. et al. Associations of BoLA-DRB3 geno-
types with breeding values for milk production traits in Russian dairy cattle population . . . . . . . . . . . . . . . . . . . . . . . . . . 775
Volkova N.A., Fomin I.K., Dotsev A.V. et al. Influence of ovalbumin gene regulatory el-ements on tissue specificity and level of transgene expression . . . . . . . 782
GENOME SCANNING AND BIODIVERSITY Zinovieva N.A., Dotsev A.V., Sermyagin A.A. et al. Study of genetic diversity and popu-
lation structure of five Russian cattle breeds using whole-genome SNP analysis . 788 Deniskova T.E., Selionova M.I., Gladyr’ E.A. et al. Variability of microsatellites in
sheep breeds raced in Russia . . . . . . . . . . . . . . . . . . . 801 Kharzinova V.R., Dotsev A.V., Kramarenko A.S. et al. Study of the allele pool and the
degree of genetic introgression of semi-domesticated and wild populations of rein-deer (Rangifer tarandus L., 1758) using microsatellites . . . . . . . . . . 811
REPRODUCTIVE BIOTECHNOLOGIES Singina G.N., Bagirov V.A., Danch S.S. et al. In vitro production of interspecies hybrid
embryos of cattle (Bos taurus) and wisent (Bison bonasus) . . . . . . . . . 824 Abilov A.I., Eskin G.V., Kombarova N.A. Blood estradiol level in bull sires influences
sperm count and effectiveness of artificial insemination . . . . . . . . . 830 AFRICAN SWINE FEVER: VIRUS PROTEOMICS, DIAGNOSTICS Imatdinov A.R., Sereda A.D., Imatdinov I.R. et al. Expression of recombinant genes en-
coding fragments of the protective important proteins of African swine fever virus in eucaryotic cells . . . . . . . . . . . . . . . . . . . . . . . 837
Strizhakova O.M., Lyska V.M., Malogolovkin A.S. et al. Validation of an ELISA kit for detection of antibodies against ASF virus in blood or spleen of domestic pigs and wild boars . . . . . . . . . . . . . . . . . . . . . . . . 845
VETERINARY VIROLOGY, MICROBIOLOGY, PARASITOLOGY Balashova E.A., Baryshnickova E.I., Lyska V.M. et al. Permissivity of lamb synovial
membrane cell culture for Akabane disease virus . . . . . . . . . . . . 853 Yanzhieva D.V., Sal’nikov N.I., Usadov T.R. et al. Identification and isolation of Orf vi-
rus from sheep in the Republic of Tuva in 2015 . . . . . . . . . . . . 861 Artem’eva O.A., Nikanova D.A., Kotkovskaya E.N. et al. Antibiotic-resistance profile of
Staphylococcus aureus strains isolated from milk of high yield cows in Central Russia 867 Dzhafarov M.Kh., Vasilevich F.I., Kovalev G.I. et al. Derivatives of 16-membered macro-
cyclic lactones: antiparasitic properties and interaction with GABAA receptors . 875 MICROBIOME AND PRODUCTIVITY Fisinin V.I., Laptev G.Yu., Nikonov I.N. et al. Poultry gastrointestinal microbiome
changes during ontogenesis . . . . . . . . . . . . . . . . . . . . 883 Egorova T.A., Lenkova T.N., Il’ina L.A. et al. The Saccharomyces sp. and Bacillus sub-
tilis based probiotics influence on chicken broiler productivity and caecum micro-biome community . . . . . . . . . . . . . . . . . . . . . . . 891
NANOPARTICLES OF METALS: BIOEFFECTS Sizova Е.А., Korolev V.L., Makaev Sh.A. et al. Morphological and biochemical blood
parameters in broilers at correction with dietary copper salts and nanoparticles . 903 Yausheva E.V., Miroshnikov S.A., Kosyan D.B. et al. Nanoparticles in combination with
amino acids change productive and immunological indicators of broiler chicken 912 Miroshnikova Е.P., Kosyan D.B., Arizhanov A.E. et al. Assessment of general toxicity
and prooxidant effects of CeO2 and SiO2 nanoparticles on Danio rerio . . . . 921 Sizova Е.А., Miroshnikov S.A., Kalashnikov V.V. Morphological and biochemical pa-
rameters in Wistar rats influenced by molybdenum and its oxide nanoparticles 929 MYCOTOXICOLOGY: FEEDS, FODDER CROPS Piryazeva E.A., Kononenko G.P., Burkin A.A. Affection of coarse fodders by toxigenic
Fusarium fungi . . . . . . . . . . . . . . . . . . . . . . . . 937 Shcherbakova L.A., Mikityuk O.D., Nazarova T.A. et al. Study of aflatoxin B1-
destroying activity of Gliocladium roseum and Trichoderma viride and their an-tagonism toward toxigenic Aspergillus flavus . . . . . . . . . . . . . 946
Shamsutdinova E.Z. Biology of flowering, diversity of sexual types and seed production in Salsola orientalis S.G. Gmel. . . . . . . . . . . . . . . . . . . 951
763
AGRICULTURAL BIOLOGY, ISSN 2412-0324 (English ed. Online)
2016, V. 51, ¹ 6, pp. 763-774 (SEL’SKOKHOZYAISTVENNAYA BIOLOGIYA) ISSN 0131-6397 (Russian ed. Print)
ISSN 2313-4836 (Russian ed. Online)
Reviews UDC 636.4:619:578.842.1:616-097:57.083.3 doi: 10.15389/agrobiology.2016.6.763rus
doi: 10.15389/agrobiology.2016.6.763eng
THE HAEMADSORPTION AT AFRICAN SWINE FEVER (review)
A.D. SEREDA1, A.R. IMATDINOV1, V.V. MAKAROV2
1All-Russian Institute of Veterinary Virology and Microbiology, Federal Agency of Scientific Organizations, 1, ul. Akademika Bakuleva, pos. Vol’ginskii, Petushinskii Region, Vladimir Province, 601125 Russia, e-mail [email protected]; 2Peoples' Friendship University of Russia, Agro-Technological Institute, 8/2, ul. Miklukho-Maklaya, Moscow, 117198 Russia, e-mail [email protected] Acknowledgements: Supported by Russian Science Foundation (the research project «Design of African swine fever virus candidate vaccine based on chimeric viruses», contract No 16-16-00090) Received August 29, 2016
A b s t r a c t
The capability of causing haemadsorption at African swine fever (ASF) virus (ASFV) re-production in swine bone marrow cell cultures, leukocytes or continuous cells in the presence of swine erythrocytes is characteristic of the majority of the virus isolates (W.A. Malmquist, D. Hay, 1960). This trait is used for ASF diagnosis based on autohaemadsorption in porcine blood, the virus titration in cell culture, and selection of its attenuated variants in vitro (A.D. Sereda et al., 2014). The haemadsorption inhibition assay (HIA) in tandem with the bioassay using the disease-resistant pigs is applied for seroimmunotype-based classification of ASFV isolates (N.I. Mitin et al., 1985). The heterogeneity of an ASFV population for quantitative haemadsorption characteristic (like «dense», «moderate» or «loose») is a phenotypic trait of ASFV isolates, strains and/or variants (V. Makarov et al., 2016). Also, the proportion of the circumference of red blood cells as observed at their contact with infected macrophages serves as another quantifiable feature of haemadsorption. Some quantita-tive differences in HIA activity levels of swine blood sera are determined in the assays carried out using virulent reference variants and their attenuated derivatives, and the obtained results require some interpretation. The loss of ability to induce haemadsorption is not critical for ASFV reproduc-tion and often accompanied by a decrease in the pathogen virulence levels. Hence, as a rule, attenu-ated ASFV variants are prepared through a selection by limiting dilution from populations of virulent isolates of the virus clones that are characterized by a reduced potential to induce haemadsorption (D.V. Kolbasov et al., 2014). In the course of the virus reproduction, haemadsorption precedes the exocytosis. Virions do not play a significant role in the mechanism of haemadsorption, nevertheless, their interaction with erythrocyte membranes promotes the virus dissemination throughout the swine organism and more effective introduction into the gut cells of ticks (L.K. Dixon et al., 2004). ASFV haemadsorbing potentiality is determined by highly glycosylated transmembrane protein CD2v (J.M. Rodríguez et al., 1993). Probably, nonhaemadsorbing avirulent isolates emerge as a result of some shift of the open reading frames for EP402R and EP153R encoding the CD2v and lectin-like pro-teins, respectively (D.A. Chapman et al., 2008). An assumption is made that the haemadsorption phenomenon is due to an interaction between carbohydrate residues of glycoproteins of ASFV oligo-saccharides and lectin-like receptors of swine red blood cells.
Keywords: African swine fever, haemadsorption, non-haemadsorbing isolates
The pathogen of African swine fever is a large DNA-containing virus of Asfarviridae family [1]. Its virulent isolates may cause the disease in domestic swine (Sus scrofa domesticus) and wild boars (Sus scrofa). In Africa, ASF is sup-ported in the transmission cycle between its natural hosts, wart hogs (Phacocho-erus spp.) and bushpigs (Potomochorus porcus), and its transmitters — soft ticks Оrnithodoros [2]. The disease is contagious, and the virus is well adapted to its hosts inducing a sub-clinical chronic or unapparent form of infection.
The interest in haemadsorption in the course of the ASF virus (ASFV) reproduction is driven by several factors. So far, different aspects remained un-
764
clear, particularly, what molecular mechanisms underline ASFV heterogeneity by haemadsorption, why some isolates do not have this feature and how the haemadsorption capacity is related to other phenotypic characteristics of isolates and laboratory variants. In the veterinary practice, haemadsorption is used for ASFV titration (as in most cases, the obtained results coincide with the titration data by the cytopathic effect), in the selection of attenuated variants, and life-time disease diagnosis by the autohaemadsorption of blood leukocytes in the in-fected swine. The haemadsorption inhibition test (HIT) is used, together with the bioassay study of the disease-resistant swine, to classify the ASFV isolates by their immunoserotypes [3-5].
Haemad so rp t ion phenomenon. It is well known that the cell cul-tures, which are infected with the orthomyxo-, paramyxo-, toga-, rhabdo-, and poxviruses capable of shedding viral progeny via budding, can absorb erythro-cytes [6, 7]. Haemadsorption is caused by the inclusion of synthesized virus pro-teins having an affinity to erythrocytes into the cell membrane. In a number of cases it has common mechanisms with haemagglutination and is observed at ear-ly virus reproduction cycle until the development of the cytopathic effect or in its absence or its weak intensity.
Haemadsorption in the course of ASFV reproduction was first identi-fied and described by W.A. Malmquist and D. Hay [3]. By showing that the serа of the swine that had ASF restricted haemadsorption but did not neutralize the cytopathic effect and did not affect the virus reproduction, they assumed that the antigen responsible for haemadsorption is not related to virions. S.S Brees and W.R. Hess [8] ascertained that the integrity of the plasmalemma of the in-fected cells is an essential condition for haemadsorption in the course of ASFV reproduction. Electronic microscopy revealed two key ways of erythrocytes bind-ing with the cell membrane at haemadsorption, i.e. by attaching to cell filaments protruding out of the plasmalemma, and directly to the membrane of the infect-ed cell [8]. The membrane of the infected cell acquires the capacity to absorb erythrocytes before the virions start migration from the cytoplasmic matrices where they mature. In other words, the virus specific modulation of the cell membrane not just precedes the virus exocytosis, but is chronologically ahead of it, and these stages are not synchronized [9, 10].
The majority of researchers think that the virus particles are not neces-sarily located at the site of contact between the erythrocytes and the cell [11, 12]. Visually, at ½400 magnification erythrocytes are seen on the macrophage arranged either in one layer or in several layers. Their number per haemadsorb-ing cell varies from to 80 or more cells. It was shown [13] that the multi-layer appearance in case of the so-called dense haemadsorption results from the changes in the form of erythrocytes and the cytoplasm protuberances of the in-fected macrophage, contacting erythrocyte, that are located at a significant dis-tance from the main part of cell. The absence of hemagglutination in the course of ASF also evidences that virions do not play any role in the haemadsorption phenomenon. When fluorescent antibodies and the monoclonal antibodies to ASFV-specific 13 kDa and 73 kDa polypeptides were used in the study of inter-action between virions and erythrocytes in 30 pigs infected with 17 ASFV iso-lates, the viral antibodies were in vitro and in vivo observed on the surface of swine erythrocytes [14]. By a transmission microscopy, virions were identified in the invaginations of membranes on the surface of erythrocytes [14]. The virus binds to erythrocytes as soon as they interact with the infected cells. Virions at-tach to the surface of the erythrocyte cell membrane, but remain in the mem-brane invaginations without penetrating to the cytoplasm. This mechanism may preserve the virus in blood. The attachment of virions to erythrocytes seems to
765
contribute significantly to the ASFV penetrating through the intestinal walls in ticks due to the erythrocyte phagocytosis by hemocoel cells [15]. It is noted that haemadsorption does not occur in all cells with virus replication or the presence of virus particles [16].
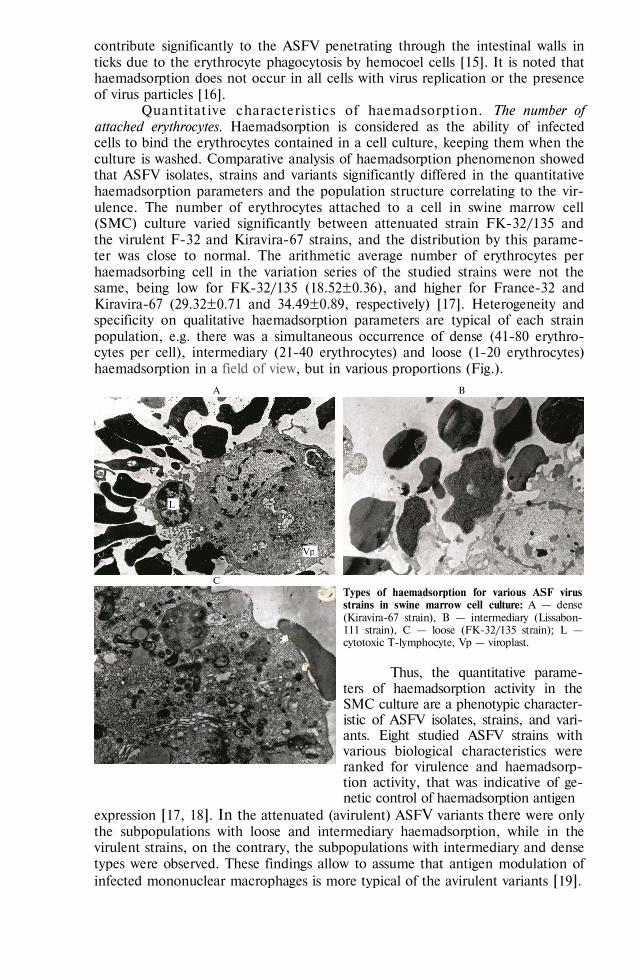
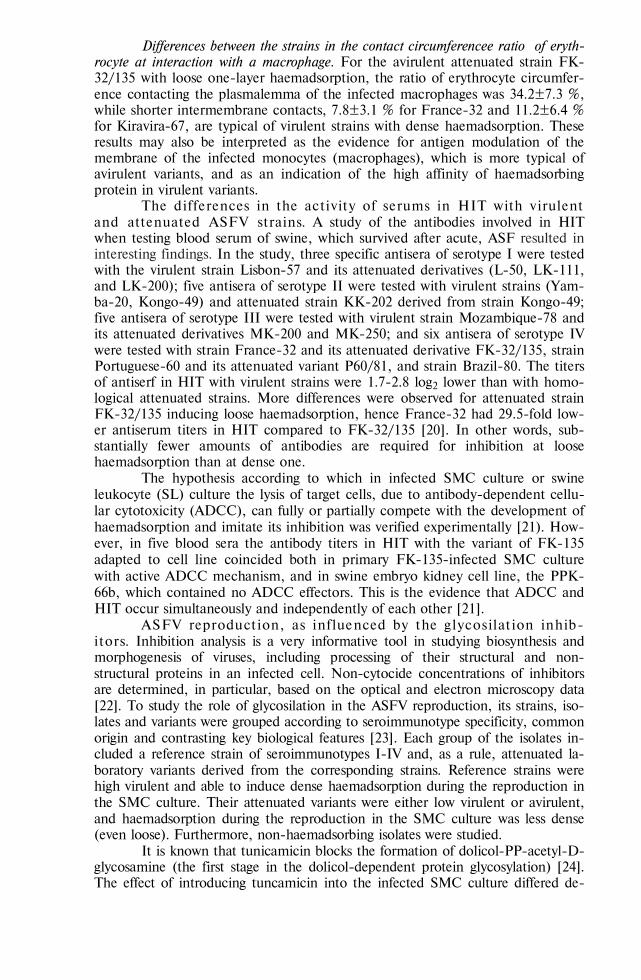
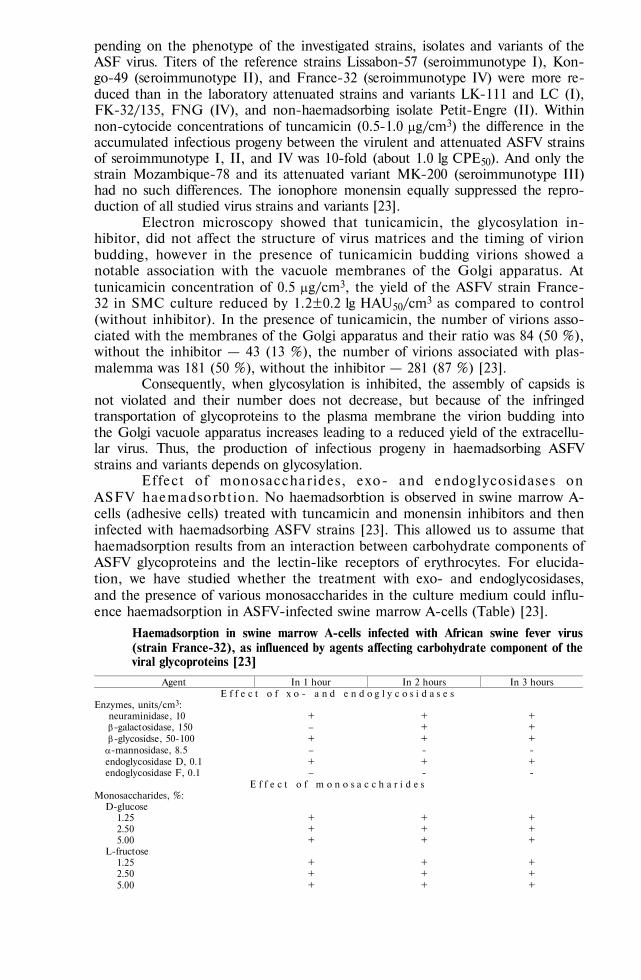
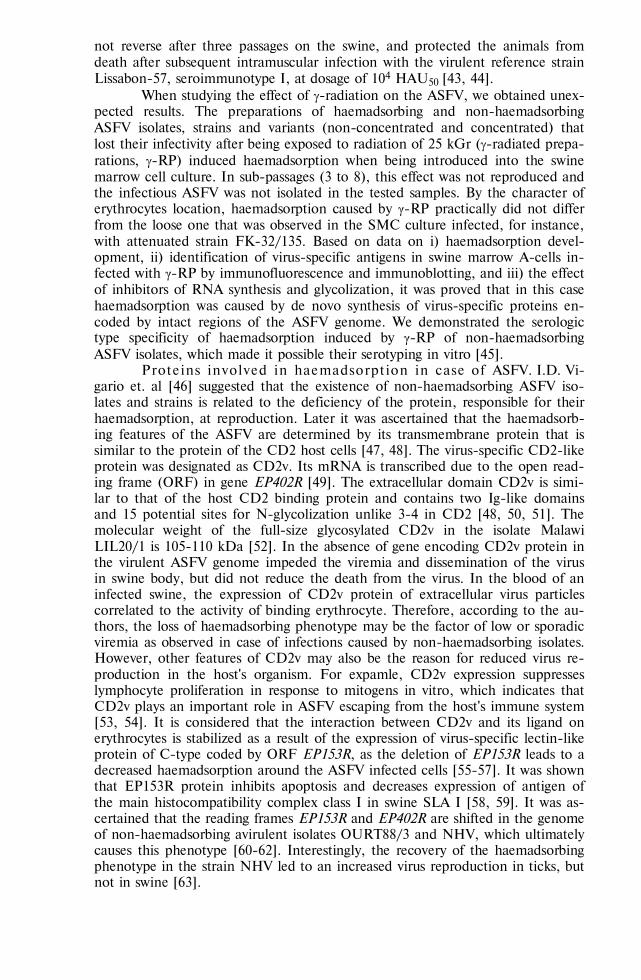
Quantitative characteristics of haemadsorption. The number of attached erythrocytes. Haemadsorption is considered as the ability of infected cells to bind the erythrocytes contained in a cell culture, keeping them when the culture is washed. Comparative analysis of haemadsorption phenomenon showed that ASFV isolates, strains and variants significantly differed in the quantitative haemadsorption parameters and the population structure correlating to the vir-ulence. The number of erythrocytes attached to a cell in swine marrow cell (SMC) culture varied significantly between attenuated strain FK-32/135 and the virulent F-32 and Kiravira-67 strains, and the distribution by this parame-ter was close to normal. The arithmetic average number of erythrocytes per haemadsorbing cell in the variation series of the studied strains were not the same, being low for FK-32/135 (18.52±0.36), and higher for France-32 and Kiravira-67 (29.32±0.71 and 34.49±0.89, respectively) [17]. Heterogeneity and specificity on qualitative haemadsorption parameters are typical of each strain population, e.g. there was a simultaneous occurrence of dense (41-80 erythro-cytes per cell), intermediary (21-40 erythrocytes) and loose (1-20 erythrocytes) haemadsorption in a field of view, but in various proportions (Fig.).
А B
C
Types of haemadsorption for various ASF virus strains in swine marrow cell culture: А — dense (Kiravira-67 strain), B — intermediary (Lissabon-111 strain), C — loose (FK-32/135 strain); L — cytotoxic T-lymphocyte, Vp — viroplast.
Thus, the quantitative parame-ters of haemadsorption activity in the SMC culture are a phenotypic character-istic of ASFV isolates, strains, and vari-ants. Eight studied ASFV strains with various biological characteristics were ranked for virulence and haemadsorp-tion activity, that was indicative of ge-netic control of haemadsorption antigen
expression [17, 18]. In the attenuated (avirulent) ASFV variants there were only the subpopulations with loose and intermediary haemadsorption, while in the virulent strains, on the contrary, the subpopulations with intermediary and dense types were observed. These findings allow to assume that antigen modulation of infected mononuclear macrophages is more typical of the avirulent variants [19].
L
Vp
766
Differences between the strains in the contact circumferencee ratio of eryth-rocyte at interaction with a macrophage. For the avirulent attenuated strain FK-32/135 with loose one-layer haemadsorption, the ratio of erythrocyte circumfer-ence contacting the plasmalemma of the infected macrophages was 34.2±7.3 %, while shorter intermembrane contacts, 7.8±3.1 % for France-32 and 11.2±6.4 % for Kiravira-67, are typical of virulent strains with dense haemadsorption. These results may also be interpreted as the evidence for antigen modulation of the membrane of the infected monocytes (macrophages), which is more typical of avirulent variants, and as an indication of the high affinity of haemadsorbing protein in virulent variants.
The differences in the activity of serums in HIT with virulent and attenuated ASFV strains. A study of the antibodies involved in HIT when testing blood serum of swine, which survived after acute, ASF resulted in interesting findings. In the study, three specific antisera of serotype I were tested with the virulent strain Lisbon-57 and its attenuated derivatives (L-50, LK-111, and LK-200); five antisera of serotype II were tested with virulent strains (Yam-ba-20, Kongo-49) and attenuated strain KK-202 derived from strain Kongo-49; five antisera of serotype III were tested with virulent strain Mozambique-78 and its attenuated derivatives MK-200 and MK-250; and six antisera of serotype IV were tested with strain France-32 and its attenuated derivative FK-32/135, strain Portuguese-60 and its attenuated variant P60/81, and strain Brazil-80. The titers of antiserf in HIT with virulent strains were 1.7-2.8 log2 lower than with homo-logical attenuated strains. More differences were observed for attenuated strain FK-32/135 inducing loose haemadsorption, hence France-32 had 29.5-fold low-er antiserum titers in HIT compared to FK-32/135 [20]. In other words, sub-stantially fewer amounts of antibodies are required for inhibition at loose haemadsorption than at dense one.
The hypothesis according to which in infected SMC culture or swine leukocyte (SL) culture the lysis of target cells, due to antibody-dependent cellu-lar cytotoxicity (ADCC), can fully or partially compete with the development of haemadsorption and imitate its inhibition was verified experimentally [21). How-ever, in five blood sera the antibody titers in HIT with the variant of FK-135 adapted to cell line coincided both in primary FK-135-infected SMC culture with active ADCC mechanism, and in swine embryo kidney cell line, the PPK-66b, which contained no ADCC effectors. This is the evidence that ADCC and HIT occur simultaneously and independently of each other [21].
ASFV reproduction, as inf luenced by the glycosilation inhib-itors. Inhibition analysis is a very informative tool in studying biosynthesis and morphogenesis of viruses, including processing of their structural and non-structural proteins in an infected cell. Non-cytocide concentrations of inhibitors are determined, in particular, based on the optical and electron microscopy data [22]. To study the role of glycosilation in the ASFV reproduction, its strains, iso-lates and variants were grouped according to seroimmunotype specificity, common origin and contrasting key biological features [23]. Each group of the isolates in-cluded a reference strain of seroimmunotypes I-IV and, as a rule, attenuated la-boratory variants derived from the corresponding strains. Reference strains were high virulent and able to induce dense haemadsorption during the reproduction in the SMC culture. Their attenuated variants were either low virulent or avirulent, and haemadsorption during the reproduction in the SMC culture was less dense (even loose). Furthermore, non-haemadsorbing isolates were studied.
It is known that tunicamicin blocks the formation of dolicol-PP-acetyl-D-glycosamine (the first stage in the dolicol-dependent protein glycosylation) [24]. The effect of introducing tuncamicin into the infected SMC culture differed de-
767
pending on the phenotype of the investigated strains, isolates and variants of the ASF virus. Titers of the reference strains Lissabon-57 (seroimmunotype I), Kon-go-49 (seroimmunotype II), and France-32 (seroimmunotype IV) were more re-duced than in the laboratory attenuated strains and variants LK-111 and LC (I), FK-32/135, FNG (IV), and non-haemadsorbing isolate Petit-Engre (II). Within non-cytocide concentrations of tuncamicin (0.5-1.0 g/cm3) the difference in the accumulated infectious progeny between the virulent and attenuated ASFV strains of seroimmunotype I, II, and IV was 10-fold (about 1.0 lg СРЕ50). And only the strain Mozambique-78 and its attenuated variant MK-200 (seroimmunotype III) had no such differences. The ionophore monensin equally suppressed the repro-duction of all studied virus strains and variants [23].
Electron microscopy showed that tunicamicin, the glycosylation in-hibitor, did not affect the structure of virus matrices and the timing of virion budding, however in the presence of tunicamicin budding virions showed a notable association with the vacuole membranes of the Golgi apparatus. At tunicamicin concentration of 0.5 g/cm3, the yield of the ASFV strain France-32 in SMC culture reduced by 1.2±0.2 lg HAU50/cm3 as compared to control (without inhibitor). In the presence of tunicamicin, the number of virions asso-ciated with the membranes of the Golgi apparatus and their ratio was 84 (50 %), without the inhibitor — 43 (13 %), the number of virions associated with plas-malemma was 181 (50 %), without the inhibitor — 281 (87 %) [23].
Consequently, when glycosylation is inhibited, the assembly of capsids is not violated and their number does not decrease, but because of the infringed transportation of glycoproteins to the plasma membrane the virion budding into the Golgi vacuole apparatus increases leading to a reduced yield of the extracellu-lar virus. Thus, the production of infectious progeny in haemadsorbing ASFV strains and variants depends on glycosylation.
Effect of monosaccharides, exo- and endoglycosidases on ASFV haemadsorbtion. No haemadsorbtion is observed in swine marrow A-cells (adhesive cells) treated with tuncamicin and monensin inhibitors and then infected with haemadsorbing ASFV strains [23]. This allowed us to assume that haemadsorption results from an interaction between carbohydrate components of ASFV glycoproteins and the lectin-like receptors of erythrocytes. For elucida-tion, we have studied whether the treatment with exo- and endoglycosidases, and the presence of various monosaccharides in the culture medium could influ-ence haemadsorption in ASFV-infected swine marrow A-cells (Table) [23].
Haemadsorption in swine marrow A-cells infected with African swine fever virus (strain France-32), as influenced by agents affecting carbohydrate component of the viral glycoproteins [23]
Agent In 1 hour In 2 hours In 3 hours E f f e c t o f x o - a n d e n d o g l y c o s i d a s e s
Enzymes, units/cm3: neuraminidase, 10 + + + -galactosidase, 150 + + -glycosidse, 50-100 + + + -mannosidase, 8.5 - - endoglycosidase D, 0.1 + + + endoglycosidase F, 0.1 - -
E f f e c t o f m o n o s a c c h a r i d e s Monosaccharides, %:
D-glucose 1.25 2.50 5.00
+ + +
+ + +
+ + +
L-fructose 1.25 2.50 5.00
+ + +
+ + +
+ + +
768
Table (continued)
D-galactose 1.25 2.50 5.00
+
+ + +
+ + +
methyl--D-mannopyranoside 1.25 2.50 5.00
+ + -
+ + +
N-acetyl-glucosamine 1.25 2.50 5.00
+ + +
+ + +
+ + +
N o t e. Swine marrow A-cells are adhesive swine marrow cells; “+” and “” mean the presence or absence of haemadsorption.
Since exoglycosidases split out only monosaccharide residues, the non-regenerated ends of ASFV oligosaccharides in haemadsorbing protein evidently con-tain -mannose. It is confirmed by haemadsorption inhibition with methyl--D-mannopyranoside, and by its sensitivity to endoglycosidase F, specific to high-mannose glycans [25]. The obtained results evidence that high-mannose oligosac-charides of the ASFV glycoproteins are involved into haemadsorption.
Non-haemadsorbing ASFV isolates, strains, and variants. In Africa, non-haemadsorbing ASFV variants were isolated from chronically infect-ed wild (wart hogs, bushpigs) and domestic, including indigenous, pigs, as well as from ticks Ornitodoros moubata [26-32]. In the course of passaging on domes-tic swine or in primary SMC culture some isolates recovered their haemadsorb-ing activity, while others did not [33]. From 1972 to 1985, 79 ASFV isolates were found in the survey of over 7,000 pigs of European and domestic breeds in the People's Republic of the Congo. It was shown that under natural epizooties and experimental selection the cultural and pathogenic characteristics of ASFV were substantially modified, i.e. ASFV could lose haemadsorbing capacity or reduce virulence up to its complete loss. Among local animals, the ASFV often circulated in a non-haemadsorbing form causing no clinical signs and creating a positive immune profile [34, 35].
In Europe, non-haemadsorbing ASFV strains are generally isolated from chronically ill domestic swine and ticks Ornitodoros erraticus. For example, 206 non-haemadsorbing isolates were collected in Spain from 1965 to 1974 [26]. In Portugal, 10 ASFV isolates derived from the ticks Ornitodoros erraticus, collected from 1988 to 1993, six of which were haemadsorbing and pathogenic, and four were non-haemadsorbing and non-pathogenic [27]. With passages on intact do-mestic swine, the ASFV genome is little subject to modification: its similarity was shown after 20 passages on swine, and after 17-100 passages in swine alveo-lar macrophage culture [36, 37]. At the same time, it was reported that the viru-lent and (or) haemadsorbing capacity were lost after long passaging of haemad-sorbing isolates in primary cell cultures and in cell line cultures [38, 39].
It is considered that the loss of haemadsorbing phenotype does not affect the pathogenicity of the ASFV isolates. Non-haemadsorbing isolates sampled from swine in the centers of disease in South Africa and in Madagascar caused death in 80-90 % of animals [40]. However, many researchers pointed to the low virulence and protective features of non-haemadsorbing natural isolates and the obtained laboratory variants [11, 28, 41, 42]. By direct and selective passages in the swine marrow cell culture from highly reactogenic strain Katanga-105 (sero-immunotype I), causing death in 87 % of domestic pigs, after 44 direct passages in the swine marrow cells, a non-haemadsorbing variant KC-149 was obtained that became avirulent for the swine. It kept its features up to passage 190, did
769
not reverse after three passages on the swine, and protected the animals from death after subsequent intramuscular infection with the virulent reference strain Lissabon-57, seroimmunotype I, at dosage of 104 HAU50 [43, 44].
When studying the effect of -radiation on the ASFV, we obtained unex-pected results. The preparations of haemadsorbing and non-haemadsorbing ASFV isolates, strains and variants (non-concentrated and concentrated) that lost their infectivity after being exposed to radiation of 25 kGr (-radiated prepa-rations, -RP) induced haemadsorption when being introduced into the swine marrow cell culture. In sub-passages (3 to 8), this effect was not reproduced and the infectious ASFV was not isolated in the tested samples. By the character of erythrocytes location, haemadsorption caused by γ-RP practically did not differ from the loose one that was observed in the SMC culture infected, for instance, with attenuated strain FK-32/135. Based on data on i) haemadsorption devel-opment, ii) identification of virus-specific antigens in swine marrow A-cells in-fected with γ-RP by immunofluorescence and immunoblotting, and iii) the effect of inhibitors of RNA synthesis and glycolization, it was proved that in this case haemadsorption was caused by de novo synthesis of virus-specific proteins en-coded by intact regions of the ASFV genome. We demonstrated the serologic type specificity of haemadsorption induced by γ-RP of non-haemadsorbing ASFV isolates, which made it possible their serotyping in vitro [45].
Proteins involved in haemadsorption in case of ASFV. I.D. Vi-gario et. al [46] suggested that the existence of non-haemadsorbing ASFV iso-lates and strains is related to the deficiency of the protein, responsible for their haemadsorption, at reproduction. Later it was ascertained that the haemadsorb-ing features of the ASFV are determined by its transmembrane protein that is similar to the protein of the CD2 host cells [47, 48]. The virus-specific CD2-like protein was designated as CD2v. Its mRNA is transcribed due to the open read-ing frame (ORF) in gene EP402R [49]. The extracellular domain CD2v is simi-lar to that of the host CD2 binding protein and contains two Ig-like domains and 15 potential sites for N-glycolization unlike 3-4 in CD2 [48, 50, 51]. The molecular weight of the full-size glycosylated CD2v in the isolate Malawi LIL20/1 is 105-110 kDa [52]. In the absence of gene encoding CD2v protein in the virulent ASFV genome impeded the viremia and dissemination of the virus in swine body, but did not reduce the death from the virus. In the blood of an infected swine, the expression of CD2v protein of extracellular virus particles correlated to the activity of binding erythrocyte. Therefore, according to the au-thors, the loss of haemadsorbing phenotype may be the factor of low or sporadic viremia as observed in case of infections caused by non-haemadsorbing isolates. However, other features of CD2v may also be the reason for reduced virus re-production in the host's organism. For expamle, CD2v expression suppresses lymphocyte proliferation in response to mitogens in vitro, which indicates that CD2v plays an important role in ASFV escaping from the host's immune system [53, 54]. It is considered that the interaction between CD2v and its ligand on erythrocytes is stabilized as a result of the expression of virus-specific leсtin-like protein of C-type coded by ORF EP153R, as the deletion of EP153R leads to a decreased haemadsorption around the ASFV infected cells [55-57]. It was shown that EP153R protein inhibits apoptosis and decreases expression of antigen of the main histocompatibility complex class I in swine SLA I [58, 59]. It was as-certained that the reading frames EP153R and EP402R are shifted in the genome of non-haemadsorbing avirulent isolates OURT88/3 and NHV, which ultimately causes this phenotype [60-62]. Interestingly, the recovery of the haemadsorbing phenotype in the strain NHV led to an increased virus reproduction in ticks, but not in swine [63].
770
In the swine marrow A-cells infected with haemadsorbing ASFV strains and marked with 3Н-glycosamine a serotype specific 110-140 kDa glycoprotein was identified by radio immunoprecipitation assay with HIT-active homologi-cal antisera [64]. The authors considered this glycoprotein to be involved in haemadsorption due to the fact that this glycoprotein could not be identified when the swine marrow A-cells were infected with non-haemadsorbing isolates and strains, or when using in immunoprecipitation the swine sera non-active in HIT, in particular, those obtained after the animals were infected with attenu-ated ASFV strains [64].
So, haemadsorption at African swine fever (ASF) has quantiative charac-teristics. The loss of capability to induce haemadsorption is followed by a re-duced virulence. The ability of binding membrane of erythrocytes absorbed on macrophages helps the virus to disseminate in swine organism and contributes to more efficient penetration to the intestinal cells in ticks. The haemadsorbing fea-tures of the ASF virus are determined by transmembrane high glycosylated pro-tein CD2v. Based on the inhibition analysis, it can be assumed that haemadsorp-tion is caused by the interaction between the oligosaccharides of ASF virus gly-coproteins and the lectin-like receptor of swine erythrocytes.
R E F E R E N C E S
1. D i x o n L.K., C o s t a J.V., E s c r i b a n o J.M., R o c k D.L., V i n u e l a E., W i l -
k i n s o n P.J. Family Asfarviridae. In: Virus taxonomy: seventh report of the International Com-mittee on Taxonomy of Viruses. M.H.V.V. Regenmortel, C.M. Fauquet, D.H.L. Bishop, E.B. Car-stens, M.K. Estes, S.M. Lemon, J. Maniloff, M.A. Mayo, D.J. McGeoch, C.R. Pringle, R.B. Wickner (eds.). Academic Press, San Diego, CA, 2000: 159-165.
2. S a n c h e z - V i z c a ı n o J.M., M u r L., M a r t ı n e z - L o p e z B. African swine fever: An epidemiological update. Transbound. Emerg. Dis., 2012, 59(1): 27-35 (doi: 10.1111/j.1865-1682.2011.01293).
3. M a l m q u i s t W.A., H a y D. Hemadsorbtion and cytophatic effect produced by African swine fever virus in swine bone marrow and buffy coat culture. Am. J. Vet. Res., 1960, 21: 104-108.
4. M a l o g o l o v k i n A., B u r m a k i n a G., T i t o v I., S e r e d a A., G o g i n A., B a -r y s h n i k o v a E., K o l b a s o v D. Comparative analysis of African swine fever virus geno-types and serogroups. Emerg. Infect. Dis., 2015, 21(2): 312-315 (doi: 10.3201/eid2102.140649).
5. K o l b a s o v D.V., B a l y s h e v V.M., S e r e d a A.D. Veterinariya, 2014, 8: 3-8 (in Russ.). 6. U h l e n d o r f f J., M a t r o s o v i c h T., K l e n k H.D., M a t r o s o v i c h M. Functional
significance of the hemadsorption activity of influenza virus neuraminidase and its alteration in pandemic viruses. Arch. Virol., 2009, 154: 945-957 (doi: 10.1007/s00705-009-0393-x).
7. S a b u r i Y., O k u d a K., T a k h a s h i T. Electron microscopic study of gemadsorbtion on vaccinia virus infected cells. Microbiol. Immunol., 1977, 21(10): 593-600.
8. B r e e s e S.S., H e s s W.R. Electron microscopy of African swine fever virus hemadsorbtion. J. Bacteriol., 1966, 92(1): 272-274.
9. M a k a r o v V., N e d o s e k o v V., S e r e d a A., M a t v i e n k o N. Immunological conception of African swine fever. Zoology and Ecology, 2016, 26(3): 236-243 (doi: 10.1080/21658005.2016.1182822).
10. M a k a r o v V.V. Afrikanskaya chuma svinei [African swine fever]. Moscow, 2011 (in Russ.). 11. C o g g i n s L. Segregation of a non-hemadsorbing African swine fever virus in tissue culture.
The Cornell Veterinarian, 1968, 58(1): 12-20. 12. C o g g i n s L. African swine fever virus. Pathogenesis. Prog. Med. Virol., 1974, 18: 48-65. 13. M a l a k h o v a M.S. Vzaimodeistvie virusa ACHS s immunokompetentnymi kletkami svin'i. Kan-
didatskaya dissertatsiya [ASF virus interaction with immune cells in pigs. PhD Thesis]. Pokrov, 1987 (in Russ.).
14. Q u i n t e r o J.C., W e s l e y R.D., W h y a r d T.C., G r e g g D., M e b u s C.A. In vitro and in vivo association of African swine fever virus with swine erythrocytes. Am. J. Vet. Res., 1986, 47(5): 1125-1131.
15. R o w l a n d s R.J., D u a r t e M.M., B o i n a s F., H u t c h i n g s G., D i x o n L.K. The CD2v protein enhances African swine fever virus replication in the tick vector, Ornithodoros er-raticus. Virology, 2009, 393: 319-328 (doi: 10.1016/j.virol.2009.07.040).
16. S i e r r a j M.A., Go m e z - V i l l a m a n l d C., R a s c o O., F e r n a n d e e z A., J o v e r A. In vivo study of hemadsorption in African swine fever virus infected cells. Vet. Pathol., 1991, 28: 178-181.
771
17. M a k a r o v V.V., V i s h n y a k o v I.F., V l a s o v N.A., S e r o v a A.M. Voprosy virusologii, 1991, 4: 321-324 (in Russ.).
18. M a k a r o v V.V., S u k h a r e v O.I., T s v e t n o v a I.V. Veterinarnaya praktika, 2013, 60(1): 6-16 (in Russ.).
19. M a k a r o v V.V. Veterinarnaya praktika, 2013, 62(3): 7-22 (in Russ.). 20. M i t i n N.I., S h e v c h e n k o A.A., B a l y s h e v V.M., E l i s o v a S.N. Differentsiatsiya
virulentnykh i attenuirovannykh shtammov virusa ACHS v RZGA. Tezisy nauchnoi konferentsii VNIIVViM, posvyashchennoi 40-letiyu Velikoi Pobedy «Voprosy veterinarnoi virusologii, mikrobi-ologii i epizootologii» [Proc. Conf. «Veterinary virology, microbiology and epizootology»]. Pokrov, 1985: 39-41 (in Russ.).
21. S h u b i n a N.G., K o l o n t s o v A.A., M a l a k h o v a M.S., M a k a r o v V.V. Byulleten' eksperimental'noi biologii i meditsiny, 1996, 122(10): 418-424 (in Russ.).
22. Š e r e š M., C h o l u j o v á D., B u b e n č í k o v a T., B r e i e r A., S u l o v á Z. Tunicamycin depresses P-glycoprotein glycosylation without an effect on its membrane localization and drug efflux activity in L1210 cells. Int. J. Mol. Sci., 2011, 12(11): 7772-7784 (doi: 10.3390/ijms12117772).
23. M a k a r o v V.V., S e r e d a A.D., P i r y a A.A., M a l a k h o v a M.S. Voprosy virusologii, 1992, 5-6: 267-270 (in Russ.).
24. R e s z k a N., K r o l E., P a t e l A.H., S z e w c z y k B. Effect of tunicamycin on the biogen-esis of hepatitis C virus glycoproteins. Acta biochimika Polonica, 2010, 57(4): 541-546.
25. S h i X., B r a u b u r g e r K., E l l i o t t R.M. Role of N-linked glycans on bunyamwera virus glycoproteins in intracellular trafficking, protein folding, and virus infectivity. J. Virol., 2005, 79(21): 13725-13734 (doi: 10.1128/jvi.79.21.13725-13734.2005).
26. G o n z a g u e M., R o g e r F., B a s t o s A., B u r g e r C., R a n d r i a m p a r a n y T., S m o n d a c k S., C r u c i e r e C. Isolation of a non-haemadsorbing, non-cytopathic strain of African swine fever virus in Madagascar. Epidemiol. Infect., 2001, 126(3): 453-459 (doi: 10.1017/s0950268801005465).
27. B o i n a s F.S., H u t c h i n g s G.H., D i x o n L.K., W i l k i n s o n P.J. Characterization of pathogenic and non-pathogenic African swine fever virus isolates from Ornithodoros erraticus in-habiting pig premises in Portugal. J. Gen. Virol., 2004, 85: 2177-2187 (doi: 10.1099/vir.0.80058-0).
28. O u r a C.A.L., D e n y e r M.S., T a k a m a t s u H., P a r k h o u s e R.M.E. In vivo depletion of CD8+ T lymphocytes abrogates protective immunity to African swine fever virus. J. Gen. Vi-rol., 2005, 86(9): 2445-2450 (doi: 10.1099/vir.0.81038-0).
29. S o u t o R., M u t o w e m b w a P., v a n H e e r d e n J., F o s g a t e G.T., H e a t h L., V o s l o o W. Vaccine potential of two previously uncharacterized African swine fever virus iso-lates from Southern Africa and heterologous cross protection of an avirulent European isolate. Transbound. Emerg. Dis., 2016, 63: 224-231 (doi: 10.1111/tbed.12250).
30. K o l b a s o v D.V., S e r e d a A.D. Veterinariya, 2013, 1: 19-23 (in Russ.). 31. J o r i F., B a s t o s A.D.S. Role of wild suids in the epidemiology of African swine fever.
EcoHealth, 2009, 6(2): 296-310 (doi: 10.1007/s10393-009-0248-7). 32. R o g e r F., C r u c i è r e C., R a n d r i a m a h e f a N., Z e l l e r H., U i l e n b e r g G., R a -
n d r i a m p a r a n y T., G o n z a g u e M., R o u s s e t D., B e n k i r a n e A., D i a l l o A. African swine fever in Madagascar: epidemiological assessment of the recent epizootic. Proc. 9th Int. Symp. on Veterinary Epidemiology and Economics. Breckenridge, Colorado, USA, 2000.
33. Se r ed a A.D., B a l y s h e v V.M., M o r g u no v Yu.P., K o l b a s o v D.V. Sel'skokhozyaistven-naya biologiya [Agricultural Biology], 2014, 1: 64-69 (doi: 10.15389/agrobiology.2014.4.64rus) (in Russ.).
34. B a d a e v F.A., R u d o b e l ' s k i i E.V., C h e v e l e v S.F., K i s e l e v A.V., N i k i s h - i n I.V., B a d a e v a N.V., B u r l a k o v V.A., B a l a b a n o v V.A., Z a k h a r o v V.M., B a i b i k o v T.Z., B u r d o v A.N. Materialy nauchnoi konferentsii VNIIVViM «Voprosy veteri-narnoi virusologii, mikrobiologii i epizootologii» [Proc. Conf. «Veterinary virology, microbiology and epizootology»]. Pokrov, 1992, 1: 24-27 (in Russ.).
35. B a d a e v F.A., C h e r y a t n i k o v L.L., R u d o b e l ' s k i i E.V., C h e v e l e v S.F., K i s e l e v A.V., B a d a e v a N.V., Z a k h a r o v V.M., B a i b i k o v T.Z. Materialy nauchnoi konferntsii VNIIVViM «Voprosy veterinarnoi virusologii, mikrobiologii i epizootologii» [Proc. Conf. «Veterinary virology, microbiology and epizootology»]. Pokrov, 1992, 1: 44 (in Russ.).
36. R o d r í g u e z J.M., M o r e n o L.T., A l e j o A., L a c a s t a A., R o d r í g u e z F., S a l - a s M.L. Genome sequence of African swine fever virus BA71, the virulent parental strain of the nonpathogenic and tissue-culture adapted BA71V. PLoS ONE, 2015, 10(11): e0142889 (doi: 10.1371/journal.pone.0142889).
37. P o r t u g a l R., C o e l h o J., H o p e r D., L i t t l e N.S., S m i t h s o n C., U p t o n C., M a r t i n s C., L e i t ã o A., K e i l G.M. Related strains of African swine fever virus with different virulence: genome comparison and analysis. J. Gen. Virol., 2015, 96: 408-419 (doi: 10.1099/vir.0.070508-0).
38. M o r g u n o v Yu.P., M a l o g o l o v k i n A.S., M o r g u n o v S.Yu., B u r m a k i - n a G.S., K u s h n i r S.D., Y u r k o v S.G., T s y b a n o v S.Zh., K o l b a s o v D.V. Veterinariya, 2015, 10: 53-57 (in Russ.).
772
39. K r u g P.W., H o l i n k a L.G., O ’ D o n n e l l V., R e e s e B., S a n f o r d B., F e r n a n -d e z - S a i n z I., G l a d u e D.P., A r z t J., R o d r i g u e z L., R i s a t t i G.R., B o r - c a M.V. The progressive adaptation of a Georgian isolate of African swine fever virus to Vero cells leads to a gradual attenuation of virulence in swine corresponding to major modifications of the viral genome. J. Virol., 2015, 89(4): 2324-2332 (doi: 10.1128/JVI.03250-14).
40. N e s e r J.A., P i d l l i p s T., T h o m s o n G.R., G a i n a r u M.D., C o e t z e e T. Afri-can swine fever. I. Morphological changes and virus replication in blood platelets of pigs infect-ed with virulent haemadsorbing and non-haemadsorbing isolates. Onderstepoort J. Vet., 1986, 53: 133-141.
41. R e i s A.L., P a r k h o u s e R.M., P e n e d o s A.R., M a r t i n s C., L e i t ã o A. Systematic analysis of longitudinal serological responses of pigs infected experimentally with African swine fever virus. J. Gen. Virol., 2007, 88(9): 2426-2434 (doi: 10.1099/vir.0.82857-0).
42. Tak ama t s u H.H., De ny e r M.S., L a c a s t a A., S t i r l i n g C.M.A., A r g i l a g u e t J.M., N e t h e r t o n C.L., O u r a C.A.L., M a r t i n s C., R o d r í g u e z F. Cellular immunity in ASFV responses. Virus Res., 2013, 173(1): 110-121 (doi: 10.1016/j.virusres.2012.11.009).
43. B r e d i k h i n a T.T., K o l o s o v V.M., A r k h i p o v a S.N. Tezisy nauchno-teoreticheskoi konferentsii VNIIVViM, posvyashchennoi 60-letiyu obrazovaniya SSSR [Proc. Conf. of AR-RIVV&M]. Pokrov, 1983: 120-123 (in Russ.).
44. B r e d i k h i n a T.G., K o l o s o v V.M. Tezisy nauchno-teoreticheskoi konferentii VNIIVViM, posvyashchennoi 60-letiyu obrazovaniya SSSR [Proc. Conf. of ARRIVV&M]. Pokrov, 1983: 123-124 (in Russ.).
45. S e r e d a A.D. Nauchnyi zhurnal KubGAU, 2010, 62(8). Available http://ej.ku-bagro.ru/2010/08/pdf/23.pdf. No date (in Russ.).
46. V i g a r i o I.D., T e r r i n h a A.M., M o u r a N u n e s J.F. Antigenic relationships among strains of African swine fever virus. Archiv fur die gesamte Virusforschung, 1974, 45(3): 272-277.
47. B o r c a M.V., K u t i s h G.F., A f o n s o C.L., I r u s t a P., C a r r i l l o C., B r u n A., S u s s m a n M., R o c k D.L. An African swine fever virus gene with similarity to the T-lymphocyte surface-antigen Cd2 mediates hemadsorption. Virology, 1994, 199(2): 463-468 (doi: 10.1006/viro.1994.1146).
48. R o d r í g u e z J.M., Y á с e z R.J., A l m a z á n F., V i с u e l a E., R o d r i g u e z J.F. Afri-can swine fever virus encodes a Cd2 homolog responsible for the adhesion of erythrocytes to in-fected-cells. J. Virol., 1993, 67(9): 5312-5320.
49. K a y - J a c k s o n P.C., G o a t l e y L.C., C o x L., M i s k i n J.E., P a r k h o u s e R.M., W i e n a n d s J., D i x o n L.K. The CD2v protein of African swine fever virus interacts with the actin-binding adaptor protein SH3P7. J. Gen. Virol., 2004, 85(1): 119-130 (doi: 10.1099/vir.0.19435-0).
50. M i m a K.A., B u r m a k i n a G.S., T i t o v I.A., M a l o g o l o v k i n A.S. African swine fever virus glycoproteins p54 and CD2v in the context of immune response modulation: bioin-formatic analysis of genetic variability and heterogeneity. Agricultural Biology, 2015, 50(6): 785-793 (doi: 10.15389/agrobiology.2015.6.785eng) (in Engl.).
51. R u i z - G o n z a l v o F., R o d r í g u e z F., E s c r i b a n o J.M. Functional and immunologi-cal properties of the baculovirus-expressed hemagglutinin of African swine fever virus. Virology, 1996, 218(1): 285-289 (doi: 10.1006/viro.1996.0193).
52. G o a t l e y L.C., D i x o n L.K. Processing and localization of the African swine fever virus CD2v transmembrane Protein. J. Virol., 2011, 85(7): 3294-3305 (doi: 10.1128/JVI.01994-10).
53. T u l m a n E.R., D e l h o n G.A., K u B.K., R o c k D.L. African swine fever virus. Curr. Top. Microbiol. Immunol., 2009, 328: 43-87.
54. D i x o n L.K., A b r a m s C.C., B o w i c k G., G o a t l e y L.C., K a y - J a c k s o n P.C., C h a p m a n D., L i v e r a n i E., N i x R., S i l k R., Z h a n g F. African swine fever virus proteins involved in evading host defense systems. Vet. Immunol. Immunopathol., 2004, 100(3-4): 117-134 (doi: 10.1016/j.vetimm.2004.04.002).
55. G a l i n d o I., A l m a z á n F., B u s t o s M.J., V i с u e l a E., C a r r a s c o s a A.L. African swine fever virus EP153R open reading frame encodes a glycoprotein involved in the hemad-sorption of infected cells. Virology, 2000, 266(2): 340-351 (doi: 10.1006/viro.1999.0080).
56. B u r m a k i n a G., M a l o g o l o v k i n A., T u l m a n E.R., Z s a k L., D e l h o n G., D i - e l D.G., S h o b o g o r o v N.M., M o r g u n o v Y.P., M o r g u n o v S.Y., K u t i s h G.F., K o l b a s o v D., R o c k D.L. African swine fever virus serotype-specific proteins are signifi-cant protective antigens for African swine fever. J. Gen. Virol., 2016, 97(7): 1670-1675 (doi: 10.1099/jgv.0.000490).
57. N e i l a n J.G., B o r c a M.V., L u Z., K u t i s h G.F., K l e i b o e k e r S.B., C a r r i l l o C., Z s a k L., R o c k D.L. An African swine fever virus ORF with similarity to C-type lectins is non-essential for growth in swine macrophages in vitro and for virus virulence in domestic swine. J. Gen. Virol., 1999, 80(10): 2693-2697 (doi: 10.1099/0022-1317-80-10-2693).
58. H u r t a d o C., G r a n j a A.G., B u s t o s M.J., N o g a l M.L., B u i t r a g o G.G., Y é -b e n e s V.G., S a l a s M.L., R e v i l l a Y., C a r r a s c o s a A.L. The C-type lectin homo-

773
logue gene (EP153R) of African swine fever virus inhibits apoptosis both in virus infection and in heterologous expression. Virology, 2004, 326(1): 160-170 (doi: 10.1016/j.virol.2004.05.019).
59. H u r t a d o C., B u s t o s M.J., G r a n j a A.G., L e ó n P., S a b i n a P., L ó p e z -V i ñ - a s E., G ó m e z -P u e r t a s P., R e v i l l a Y., C a r r a s c o s a A.L. The African swine fever virus lectin EP153R modulates the surface membrane expression of MHC class I antigens. Arch. Virol., 2011, 156: 219-234 (doi: 10.1007/s00705-010-0846-2).
60. C h a p m a n D.A., T c h e r e p a n o v V., U p t o n C., D i x o n L.K. Comparison of the genome sequences of nonpathogenic and pathogenic African swine fever virus isolates. J. Gen. Virol., 2008, 89: 397-408 (doi: 10.1099/vir.0.83343-0).
61. L e i t ã o A., C a r t a x e i r o C., C o e l h o R., C r u z B., P a r k h o u s e R.M., P o r t u g - a l F., V i g a r i o J.D., M a r t i n s C.L. The non-haemadsorbing African swine fever virus iso-late ASFV/NH/P68 provides a model for defining the protective anti-virus immune response. J. Gen. Virol., 2001, 82(3): 513-523 (doi: 10.1099/0022-1317-82-3-513).
62. M a l o g o l o v k i n A., B u r m a k i n a G., T u l m a n E.R., D e l h o n G., D i e l D.G, S a l n i k o v N., K u t i s h G.F., K o l b a s o v D., R o c k D.L. African swine fever virus CD2v and C-type lectin gene loci mediate serological specificity. J. Gen. Virol., 2015, 96: 866-873 (doi: 10.1099/jgv.0.000024).
63. R o w l a n d s R.J., D u a r t e M.M., B o i n a s F., H u t c h i n g s G., D i x o n L.K. The CD2v protein enhances African swine fever virus replication in the tick vector, Ornithodoros erraticus. Virology, 2009, 393(2): 319-328 (doi: 10.1016/j.virol.2009.07.040).
64. S e r e d a A.D., A n o k h i n a E.G., F u g i n a L.G., M a k a r o v V.V. Veterinariya, 1993, 1: 26-28 (in Russ.).
775
AGRICULTURAL BIOLOGY, ISSN 2412-0324 (English ed. Online)
2016, V. 51, ¹ 6, pp. 775-781 (SEL’SKOKHOZYAISTVENNAYA BIOLOGIYA) ISSN 0131-6397 (Russian ed. Print)
ISSN 2313-4836 (Russian ed. Online)
Marker-assisted selection, transgenesis — fundamentals UDC 636.2.034:636.082:575.162 doi: 10.15389/agrobiology.2016.6.775rus
doi: 10.15389/agrobiology.2016.6.775eng
ASSOCIATIONS OF BoLA-DRB3 GENOTYPES WITH BREEDING VALUES FOR MILK PRODUCTION TRAITS IN RUSSIAN DAIRY
CATTLE POPULATION
A.A. SERMYAGIN1, N.V. KOVALYUK2, A.N. ERMILOV1, I.N. YANCHUKOV1, V.F. SATSUK2, A.V. DOTSEV1, T.E. DENISKOVA1, G. BREM1, 3, N.A. ZINOVIEVA1
1L.K. Ernst All-Russian Research Institute of Animal Husbandry, Federal Agency of Scientific Organizations, 60, pos. Dubrovitsy, Podolsk District, Moscow Province, 142132 Russia, e-mail [email protected]; 2North-Caucasian Institute of Animal Production, Federal Agency of Scientific Organizations, 4, ul. Pervomayskaya, pos. Znamenskii, Krasnodar, 350055 Russia, e-mail [email protected]; 3Institut für Tierzucht und Genetik, University of Veterinary Medicine (VMU), Veterinärplatz, A-1210, Vienna, Aus-tria, e-mail [email protected] Acknowledgements: Supported by Federal Agency of Scientific Organizations and Ministry of Education and Science of the Russian Federation (project ¹ 14.604.21.0062, RFMEFI60414X0062) Received September 14, 2016
A b s t r a c t
Breeding for genetically resistant cattle is an attractive approach to eradicate infectious dis-ease in livestock. Bovine leukaemia is one of the most common infectious diseases of dairy cattle, which causes significant economic losses. Numerous studies have demonstrated that polymorphisms in the DRB3 gene at the bovine leukocyte antigen (BoLA) locus are associated with cow resistance to persistent lymphocytosis (PL), a clinical sign of leukaemia. Alleles associated with PL susceptibility are generally prevalent in dairy cattle populations and may reflect their association with milk produc-tivity. Our objective was to evaluate the associations between genotypes at the BoLA-DRB3 locus and milk production traits in dairy cattle in Russia. In total, 171 Holstein sires were genotyped for DRB3 using the PCR-RFLP technique. Detected BoLA-DRB3 alleles were assigned to three categories ac-cording to their PL susceptibility. The DRB3.2*08, DRB3.2*16, DRB3.2*22 and DRB3.2*24 alleles were defined as susceptible (S), whereas alleles DRB3.2*11, DRB3.2*23 and DRB3.2*28 were identi-fied as resistant (R), and the remaining alleles were denoted as neutral (N). We calculated the es-timated breeding values (EBV) for milk production traits, including milk yield (MY), fat yield (FY) and protein yield (PY), using genotype categories at the BoLA-DRB3 locus as a fixed effect. We detected fifteen alleles, forty-nine genotypes and six genotype categories for the BoLA-DRB3 gene. The PL-susceptibility alleles were prevalent in Russian dairy sires (ranging from 0.0877 for BoLA-DRB3.2*08 to 0.2135 for BoLA-DRB3.2*22), assuming 0.6258. The bulls carrying the SS geno-type category were characterized by significantly higher EBVs for MY and PY compared to the other genotype categories: 89.3 kg for MY (p < 0.001 vs. NN, NR, SN, p < 0.01 vs. SR, p < 0.05 vs. RR), 2.15 kg for FY (p < 0.001 vs. NN, NR, p < 0.05 vs. SN); 4.81 kg for PY (p < 0.001 vs. all other genotype categories). Our findings indicate that high frequencies of PL-susceptibility al-leles in BoLA-DRB3 may be a result of their association with milk production traits in dairy cat-tle in Russia. Therefore, to prevent the development of clinical forms of bovine leukaemia in dairy herds in Russia, the impact of the genotypes at the BoLA-DRB3 gene locus on milk production traits must be considered.
Keywords: BoLA-DRB3 genotypes, BLV susceptible alleles, milk production traits, genet-ically resistant cattle
Breeding to develop a livestock population genetically resistant to infec-tion diseases is very important step toward the eradication of infection disease in farm animals and the sustainable food production. Bovine leukemia is an eco-nomically important infection disease of dairy cattle, which is caused by bovine leukemia virus (BLV). Economic losses due to BLV infection can come from reduced milk production, reduced reproductive efficiency, increased replacement costs, and increased veterinary costs [1]. High degree of BLV prevalence in dairy
776
herds worldwide has been shown [2]. In Russia, despite the combating this dis-ease, its ration in the structure of infectious diseases of cattle is more than 50 % [3]. It has been reported, that highly polymorphic DRB3 locus, which is located in the Bovine leukocyte antigen (BoLA) class II region on BTA23 [4] is involved in susceptibility and resistance to clinical signs of leucosis in the form of persis-tent lymphocytosis (PL). Molecular basis for gene control of the resistance and susceptibility to PL is the presence of the amino acids Glu-Arg at putative Ag binding residues 70 and 71 of the BoLA-DRB3 [5]. It has been demonstrated that carriers of the DRB3.2*11, DRB3.2*23 and DRB3.2*28 alleles containing the Glu-Arg at residues 70-71 are resistant (R), i.e. they are not prone to the tran-sition of leukemia to PL. Conversely, carriers of the DRB3.2*08, DRB3.2*16, DRB3.2*22 and DRB3.2*24 alleles are susceptible (S) to PL, i.e. they are more often affected by hematological diseases than other genotypes. The remaining al-leles are neutral (N), i.e. they are not associated with either resistance or suscep-tibility to PL [5-9].
The intense studies to characterize the genetic variability at BoLA-DRB3 were performed in Holsteins [reviewed by 10] — the most widely used dairy cat-tle breed. Up to 29 alleles were identified in regional Holstein populations and S alleles were the most common in majority of them [11-15]. We hypothesized that prevalence of S alleles of BoLA-DRB3.2 may reflect the effect of the selec-tion pressure for milk production traits. There is experimental evidence that some of the BoLA-DRB3 alleles are associated with milk productivity in cattle, but the associations are in some cases antagonistic [16-19]. No studies were per-formed to evaluate the effect of BoLA-DRB3 genotypes assigned to categories ac-cording to susceptibility to PL on milk production traits.
Our objective was to study the effect of the genotype categories at BoLA-DRB3 locus defined according their susceptibility to PL on estimated breeding values (EBVs) for milk production traits in dairy bulls in Russia.
Technique. The samples were collected from 171 sires having 62096 data records in 77 herds. Genomic DNA was extracted from semen samples, using Diatom Prep 100 kit (Izogen, Russia) according to recommendation by manu-facture. The BoLA-DRB3.2 genotypes were analyzed using PCR-RFLP tech-nique as described by M.J.T. Van-Eijk et al. [20]. Genotype variants were identi-fied by comparing the restriction patterns previously described in literature [20; BoLA nomenclature, ISAG]. Six categories of genotypes (SS, SR, SN, NR, NN, RR) were assigned according the presence of S, R and N alleles, whereas DRB3.2*11, DRB3.2*23 and DRB3.2*28 alleles are resistant (R), DRB3.2*08, DRB3.2*16, DRB3.2*22 and DRB3.2*24 alleles are susceptible (S) and the re-maining alleles are neutral (N).
Association study was conducted using estimated breeding values (EBVs) for milk production traits including milk yield (MY), fat yield (FY) and protein yield (PY). EBVs were calculated by best linear unbiased estimator procedure (BLUP) written in the SAS IML software (SAS Inst., Inc., Cary, NC, USA). The heritability values calculated by ANOVA based on the estimated variance and covariance components were 0.390 for 305-d MY, 0.459 for FY and 0.316 for PY. To evaluate the association between the categories of genotypes (SS, SN, SR, NN, NR, RR) and EBVs for milk production traits the following mixed model was used:
ijkljlllk2kk1kiijkl eSireBoLAαDObAbHYSμY ,
where Yijkl is the dependent variable of production traits (MY, FY, and PY), is the population mean of the analyzed traits, HYSi is the fixed effects of herd-year-season of the parity i (I = 1, …, 2075 subclasses), b1,2 are the linear regres-
777
sion coefficients, Аk and DOk is respectively the age of fist calving and days open of the kth cow, αl is the regression coefficient on the number of copies of the lth BoLA-DRB3.2 allele (0, 1 or 2), BoLAl is the fixed effect of lth BoLA-DRB3 genotype category (l = 1, …, 6 subclasses), Sirej is the random perma-nent sire effect of jth bull assumed being distributed normally and independent-ly with mean 0 and variance Aa
2,where A is the pedigree additive relationship matrix (j = 1, …, 171 sires) and finally eijk is the random residual effect with mean 0 and variance e
2. Results. We identified fifteen BoLA-DRB3 alleles in the investigated bull
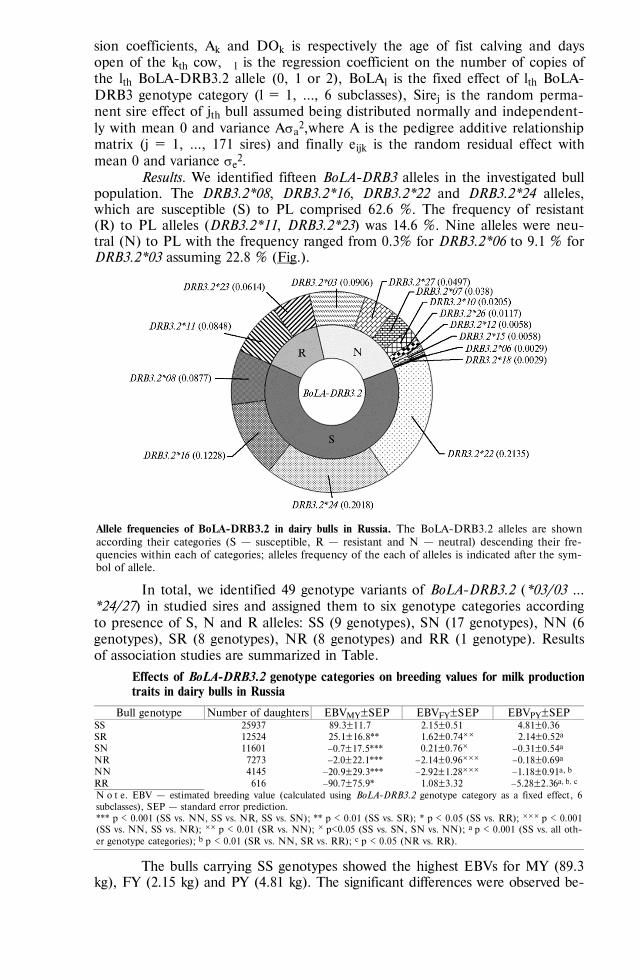
population. The DRB3.2*08, DRB3.2*16, DRB3.2*22 and DRB3.2*24 alleles, which are susceptible (S) to PL comprised 62.6 %. The frequency of resistant (R) to PL alleles (DRB3.2*11, DRB3.2*23) was 14.6 %. Nine alleles were neu-tral (N) to PL with the frequency ranged from 0.3% for DRB3.2*06 to 9.1 % for DRB3.2*03 assuming 22.8 % (Fig.).
Allele frequencies of BoLA-DRB3.2 in dairy bulls in Russia. The BoLA-DRB3.2 alleles are shown according their categories (S — susceptible, R — resistant and N — neutral) descending their fre-quencies within each of categories; alleles frequency of the each of alleles is indicated after the sym-bol of allele.
In total, we identified 49 genotype variants of BoLA-DRB3.2 (*03/03 … *24/27) in studied sires and assigned them to six genotype categories according to presence of S, N and R alleles: SS (9 genotypes), SN (17 genotypes), NN (6 genotypes), SR (8 genotypes), NR (8 genotypes) and RR (1 genotype). Results of association studies are summarized in Table.
Effects of BoLA-DRB3.2 genotype categories on breeding values for milk production traits in dairy bulls in Russia
Bull genotype Number of daughters EBVMY±SEP EBVFY±SEP EBVPY±SEP SS 25937 89.3±11.7 2.15±0.51 4.81±0.36 SR 12524 25.1±16.8** 1.62±0.74½½ 2.14±0.52a
SN 11601 0.7±17.5*** 0.21±0.76½ 0.31±0.54a NR 7273 2.0±22.1*** 2.14±0.96½½½ 0.18±0.69a NN 4145 20.9±29.3*** 2.92±1.28½½½ 1.18±0.91a, b RR 616 90.7±75.9* 1.08±3.32 5.28±2.36a, b, c N o t е. EBV — estimated breeding value (calculated using BoLA-DRB3.2 genotype category as a fixed effect, 6 subclasses), SEP — standard error prediction. *** p < 0.001 (SS vs. NN, SS vs. NR, SS vs. SN); ** p < 0.01 (SS vs. SR); * p < 0.05 (SS vs. RR); ½½½ p < 0.001 (SS vs. NN, SS vs. NR); ½½ p < 0.01 (SR vs. NN); ½ p<0.05 (SS vs. SN, SN vs. NN); a p < 0.001 (SS vs. all oth-er genotype categories); b p < 0.01 (SR vs. NN, SR vs. RR); c p < 0.05 (NR vs. RR).
The bulls carrying SS genotypes showed the highest EBVs for MY (89.3 kg), FY (2.15 kg) and PY (4.81 kg). The significant differences were observed be-
778
tween SS and all other genotype categories for MY (+64.2 kg vs. SR (p < 0.01), +90.0 kg vs. SN (p < 0.001), +91.3 kg vs. NR (p < 0.001), +110.2 kg vs. NN (p < 0.001) and +180.0 kg vs. RR (p<0.05)) and for PY (+2.67 kg vs. SR (p < 0.001), +5.12 kg vs. SN (p < 0.001), +4.99 kg vs. NR (p < 0.001), +5.99 kg vs. NN (p < 0.001) and +10.09 kg vs. RR (p<0.001)). Bulls carrying SS genotype category have significantly higher EBVs for FY comparing to three of the five remaining genotypes: +1.94 kg vs. SN (p < 0.05), +4.29 kg vs. NR (p < 0.001) and +5.07 kg vs. NN (p < 0.001).
The S alleles of BoLA-DRB3 (DRB3.2*08, DRB3.2*16, DRB3.2*22 and DRB3.2*24) have been shown to be prevalent in the majority of the Holstein population. Twenty-seven and fourteen alleles were identified in two studies of Canadian Holstein cows and S alleles were the most frequent assuming 62.2 and 59.3 %, respectively [11, 12]. S alleles were the most common (56.8 %) among sixteen alleles detected in Japanese Holstein cows [21]. Among 28 alleles identi-fied in Iranian Holsteins 48.3 % were S alleles [13]. Twenty-nine DRB3.2 alleles were identified in two herds of Polish Holstein-Frisian cattle and the frequencies of S alleles were 47.3 and 48.0 % [15]. S alleles comprised 44.7 % of all the al-leles of BoLA-DRB3.2 distributed in populations of American Holsteins [6]. The altered patterns of BoLA-DRB3.2 allele distribution was observed in Chinese re-gional populations of Holsteins, that is probably the result of specific breeding strategy [22]. We observed the highest frequencies of S alleles in Russian dairy bulls (62.5 %) among all of the regional Holstein populations analyzed.
Numerous studies have been performed to find the association between BoLA-DRB3 alleles and milk production traits. A significant positive effect of al-lele DRB3.2*11 on MY and PY and negative effect of allele DRB3.2*08 on MY, FY and PY were observed in American dairy cows [16]. In similar study, R. Rupp et al. [18] have also reported a positive effect of allele DRB3.2*11 on MY, FY and PY in a Canadian dairy population. Conversely, S. Sharif et al. [17] re-ported a positive effect of allele DRB3.2*08 and negative effect of DRB3.2*22 on PY in Canadian cow population. Allele DRB3.2*24 has been shown to be associ-ated with increased FY in American dairy cows [16]. Cows of Black-and-White and Red Gorbatov breeds, carrying homozygote genotypes for resistant alleles DRB3.2*11, DRB3.2*23 и DRB3.2*28, were characterized by low milk yield comparing to cows carrying other genotypes [23]. In contrast, M. Pashimi et al. [13] observed a significant association of allele DRB3.2*22 with an increase in PY. Using BoLA-DRB3 genotype as a fixed effect we did not observed significant associations of alleles with EBVs for milk production trait in Russian dairy bulls, probably due the small number of animals carrying the certain genotypes (49 dif-ferent BoLA-DRB3 genotypes were detected in 171 sires) and high variability degree of milk production traits (data not shown). But association studies per-formed for BoLA-DRB3 genotype categories assigned according their suscepti-bility to PL revealed significant association of SS genotypes (carrying ER motif at residues 70-71) with increased breeding values for MY and PY comparing to all other genotypes and for FY comparing to three of the five remaining geno-types. It became evident that the eradication programs for bovine leukemia based on the breeding genetically resistant cattle using BoLA-DRB3 as a marker should be developed for one population of animals and not across populations and breeds, and presumable associations of this genetic marker with milk production traits should be previously evaluated.
Thus, based on our data, we conclude, that high frequencies of BoLA-DRB3 alleles, which are susceptible to clinical signs of leucosis, observed in Rus-sian dairy cattle, may reflect to their association with milk production traits. We detected significant higher breeding values for milk production traits in sires car-
779
rying two alleles of BoLA-DRB3 susceptible to PL comparing to all other geno-type categories for MY and PY and to three of five other genotype categories for PY. Thus, development of eradication programs for bovine leukemia based uti-lizing BoLA-DRB3 locus as a genetic marker has to be taken into account the pleiotropic effects of this gene on milk production traits and has to be based on the balance between these important health- and economically related traits.
R E F E R E N C E S
1. O t t S.L., J o h n s o n R., W e l l s S.J. Association between bovine-leukosis virus seropreva-
lence and herd-level productivity on US dairy farms. Prev. Vet. Med., 2003, 61: 249-262 (doi: 10.1016/j.prevetmed.2003.08.003).
2. N e k o u e i O., V a n L e e u w e n J., S a n c h e z J., K e l t o n D., T i w a r i A., K e e - f e G. Herd-level risk factors for infection with bovine leukemia virus in Canadian dairy herds. Prev. Vet. Med., 2015, 119: 105-113 (doi: 10.1016/j.prevetmed.2015.02.025).
3. I v a n o v O.V., I v a n o v a O.Yu., F e d o t o v V.P., B a l a n d i n a M.V., V e r k h o v s k i i O.A., F e d o r o v Yu.N. Age dynamics in number of antibodies against leucosis virus in calves born from seropositive cows. Agricultural Biology, 2008, 6: 87-90 (in Engl.).
4. S i g u r d a r d o t t i r S., L u n d e n A., A n d e r s s o n L. Restriction fragment length poly-morphism of DQ and DR class II genes of the bovine major histocompatibility complex. Anim. Genet., 1988, 19: 133-150 (doi: 10.1111/j.1365-2052.1988.tb00799.x).
5. X u A.L., V a n e i j k M.J.T., P a r k C., L e w i n H.A. Polymorphism in BoLA-DRB3 exon 2 correlates with resistance to persistent lymphocytosis caused by bovine leukemia virus. J. Immu-nol., 1993, 151: 6977-6985.
6. K e l m S.C., D e i t i l l e u x J.C., F r e e m a n A.E., K e h r l i M.E. Jr., D i e t z A.B., F o x L.K., B u t l e r J.E., K a s c k o v i c s I., K e l l e y D.H. Genetic association between parame-ters of innate immunity and measures of mastitis in preparturient Holstein cattle. J. Dairy Sci., 1997, 80: 1767-1775.
7. L e w i n H.A., R u s s e l l G.C., G l a s s E.J. Comparative organization and function of the major histocompatibility complex of domesticated cattle. Immunol. Rev., 1999, 167: 145-158 (doi: 10.1111/j.1600-065X.1999.tb01388.x).
8. J u l i a r e n a M.A., P o l i M., S a l a L., C e r i a n i C., G u t i e r r e z S., D o l c i n i G., R o d r í g u e z E.M., M a r i ñ o B., R o d r í g u e z - D u b r a C., E s t e b a n E.N. Associa-tion of BLV infection profiles with alleles of the BoLA-DRB3.2 gene. Anim. Genet., 2008, 39(4): 432-438 (doi: 10.1111/j.1365-2052.2008.01750.x).
9. F o r l e t t i A., J u l i a r e n a M.A., C e r i a n i C., A m a d i o A.F., E s t e b a n E., G u t i é r r e z S.E. Identification of cattle carrying alleles associated with resistance and suscep-tibility to the Bovine Leukemia Virus progression by real-time PCR. Res. Vet. Sci., 2013, 95(3): 991-995 (doi: 10.1016/j.rvsc.2013.07.018).
10. B e h l J.D., V e r m a N.K., T y a g i N., M i s h r a P., B e h l R., J o s h i B.K. The major histocompatibility complex in bovines: a review. ISRN Vet. Sci., 2012, Article ID 872710 (doi: 10.5402/2012/872710).
11. S h a r i f S., M a l l a r d B.A., W i l k i e B.N., S a r g e a n t J.M., S c o t t H.M., D e k - k e r s J.C., L e s l i e K.E. Associations of the bovine major histocompatibility complex DRB3 (BoLA-DRB3) alleles with occurrence of disease and milk somatic cell score in Canadian dairy cattle. Anim. Genet., 1998, 29: 157-160.
12. L e d w i d g e S.A., M a l l a r d B.A., G i b s o n J.P., J a n s e n G.B., J i a n g Z.H. Multi-primer target PCR for rapid identification of bovine DRB3 alleles. Anim. Genet., 2001, 32: 219-221.
13. P a s h m i M., Q a n b a r i S., G h o r a s h i S.A., S h a r i f i A.R., S i m i a n e r H. Analysis of relationship between bovine lymphocyte antigen DRB3.2 alleles, somatic cell count and milk traits in Iranian Holstein population. J. Anim. Breed. Genet., 2009, 126: 296-303 (doi: 10.1111/j.1439-0388.2008.00783.x).
14. K o v a l j u k N.V., S a t s u k V.F., M a t v i e t s A.V., M a c h u l s k a j a E.V. Possible causes and consequences of the spread of individual allelic variants of the BoLA–DRB3 locus in groups of Holstein and Ayrshire cattle. Russ. J. Genet., 2010, 46(3): 379-382.
15. O p r z ą d e k J., U r t n o w s k i P., S e n d e r G., P a w l i k A., Ł u k a s z e w i c z M. Fre-quency of BoLA-DRB3 alleles in Polish Holstein-Friesian cattle. Anim. Sci. Paper Rep., 2012, 30(2): 91-101.
16. S t a r k e n b u r g R.J., H a n s e s L.B., K e h r l i Jr.M.E., C h e s t e r - J o n e s H. Frequen-cies and effects of alternative DRB3.2 alleles of bovine lymphocyte antigen for Holsteins in milk selection and control lines. J. Dairy Sci., 1997, 80: 3411-3419 (doi: 10.3168/jds.S0022-0302(97)76316-1).
17. S h a r i f S., M a l l a r d B.A., W i l k i e B.N., S a r g e a n t J.M., S c o t t H.M., D e k -
780
k e r s J.C., L e s l i e K.E. Associations of the bovine major histocompatibility complex DRB3 (BoLA-DRB3) with production traits in Canadian dairy cattle. Anim. Genet., 1998, 30(2): 157-160 (doi: 10.1046/j.1365-2052.1999.00459.x).
18. R u p p R., H e r n a n d e z A., M a l l a r d B.A. Association of bovine leukocyte antigen (Bo-LA) DRB3.2 with immune response, mastitis, and production and type traits in Canadian Hol-stein. J. Dairy Sci., 2007, 90: 1029-1038 (doi: 10.3168/jds.S0022-0302(07)71589-8).
19. D u a n g j i n d a M., B u a y a i D., P a t t a r a j i n d a V., P h a s u k Y., K a t a w a t i n T., V o n g p r a l u b T., C h a i y o t v i t t a y a k u l A. Detection of bovine leukocyte antigen DRB3 alleles as candidate markers for clinical mastitis resistance in Holstein ½ Zebu. J. Anim. Sci., 2009, 87: 469-476 (doi: 10.2527/jas.2007-0789).
20. V a n E i j k M.J.T., S t e w a r t -H a y n e s J.A., L e w i n H.A. Extensive polymorphism of the BoLA-DRB3 gene distinguished by PCR-RFLP. Anim. Genet., 1992, 23: 483-496 (doi: 10.1111/j.1365-2052.1992.tb00168.x).
21. Y o s h i d a T., M u k o y a m a H., F u r u t a H., K o n d o Y., T a k e s h i m a S.N., A i - d a Y., K o s u g i y a m a M., T o m o g a n e H. Association of BoLA-DRB3 alleles identified by a sequence-based typing method with mastitis pathogens in Japanese Holstein cows. Anim. Sci. J., 2009, 80(5): 498-509 (doi: 10.1111/j.1740-0929.2009.00663.x).
22. W u X.X., Y a n g Z.P., W a n g X.L., M a o Y.J., L i S.C., S h i X.K., C h e n Y. Restriction fragment length polymorphism in the exon 2 of the BoLA-DRB3 gene in Chinese Holstein of the south China. J. Biomed. Sci. Eng., 2010, 3: 221-225 (doi: 10.4236/jbise.2010.32030).
23. G l a d y r ' E.A., Z i n o v ' e v a N.A., B y k o v a A.S., V i n o g r a d o v a I.V., E r n s t L.K. Dosti-zheniya nauki i tekhniki APK, 2012, 8: 46-48 (in Russ.).
782
AGRICULTURAL BIOLOGY, ISSN 2412-0324 (English ed. Online)
2016, V. 51, ¹ 6, pp. 782-787 (SEL’SKOKHOZYAISTVENNAYA BIOLOGIYA) ISSN 0131-6397 (Russian ed. Print)
ISSN 2313-4836 (Russian ed. Online) UDC 636.52/.58:573.6.086.83:636.082:577.21 doi: 10.15389/agrobiology.2016.6.782rus
doi: 10.15389/agrobiology.2016.6.782eng
INFLUENCE OF OVALBUMIN GENE REGULATORY ELEMENTS ON TISSUE SPECIFICITY AND LEVEL OF TRANSGENE EXPRESSION
N.A. VOLKOVA, I.K. FOMIN, A.V. DOTSEV, T.E. DENISKOVA, N.A. ZINOVIEVA
L.K. Ernst All-Russian Research Institute of Animal Husbandry, Federal Agency of Scientific Organizations, 60, pos. Dubrovitsy, Podolsk District, Moscow Province, 142132 Russia, e-mail [email protected] Acknowledgements: Supported by Federal Agency of Scientific Organizations Received September 14, 2016
A b s t r a c t
The use of lentiviral vectors for the genetic modification of embryonic chicken cells is re-garded as one of the promising methods for producing transgenic poultry. In this case, it is very im-portant to determine the regulatory elements of the ovalbumin gene, providing tissue-specificity and high transgene expression in cells of chicken oviduct. The aim of this work was to study the effect of the intron sequences and promoter of ovalbumin gene on tissue specificity and level of the transgene expression. For this purpose constructs based on lentiviral vector pWpxl, containing eGFP marker gene under control of the modified ovalbumin gene regulatory elements were obtained. Vector pW2.8 included a chromosomal DNA fragment of 2.8 kb comprising a first exon, intron sequence and part of the second exon of the ovalbumin gene; vector pW1.2 — chromosomal DNA fragment of 1.2 kb comprising a promoter and ovalbumin gene sequence (without the intron and the first exon) to the transcription initiation point; vectors pW131, pW225, pW315 — chromosomal DNA fragment, simi-lar to the fragment of 1.2 kb in pW1.2 vector in which promoter (80 bp) was replaced by highly structured sequence of the birds -actin gene promoter region of 131, 225 or 315 bp respectively. The control vector pWCAGgfp included constitutive hybrid regulatory element comprising human cytomegalovirus early gene enhancer and birds’ -actin gene promoter (CAG). Primary culture cells of chick oviduct and human fibrosarcoma cells 293T (control) were used as target cells for transfection. Viral preparation was added after a monolayer of cells reached concentration of 1-3½107 CFU/ml. eGFP expression was determined by fluorimetry in 72 hours after transfection. Low level of expression of eGFP gene controlled by chromosomal fragment of 2.8 kb leader region of the ovalbumin gene was confirmed in vitro using culture of chicken oviduct cells and 293T cell line: in vector pW2.8 recombinant protein expression level was up to 25 times lower compared to pWCAGgfp vector with a constitutive promoter CAG. Yet the eGFP expression levels for pW1.2 and pW2.8 constructs were identical, indicating the absence of introns’ influence on the expression level of the recombinant DNA using this regulatory element. When the ovalbumin gene promoter was re-placed by highly structured elements of -actin constitutive gene promoter the increase in the ex-pression of eGFP in 2-3 times was observed, as well as the increased expression occurred with lengthening of the promoter region of -actin gene (vectors pW131, pW225, pW315). The achieved levels of expression with the use of exogenous -actin gene promoter were comparable with expres-sion levels controlled by a constitutive promoter CAG, however when the promoter part of the oval-bumin gene was replaced by exogenous promoter (gene -actin), the deregulation of tissue-specific expression of eGFP was observed, indicating that transcription with tissue-specific ovalbumin pro-moter gene can be modulated or activated with exogenous enhancers.
Keywords: transgenesis, chickens, lentiviral vectors, oviduct, ovalbumin gene regulato-ry elements
The use of viral vectors derived from recombinant retroviruses and lenti-viruses for genetic modification of poultry is regarded as one of the promising methods for producing transgenic animals. The high efficacy of these vector sys-tems for poultry transgenesis has been shown [1-6]. One of the main directions in the transgenesis of poultry is the development of effective vector systems, which provide the high expression of recombinant protein in the oviduct cells to produce a transgenic product.
A significant expression of recombinant protein in the oviduct cells (up
783
to several mg per ml) in transgenic animals (G0) was achieved using gene con-structs comprising constitutive promoters/enhancers, in particular the CMV (human cytomegalovirus) immediate-early gene enhancer/promoter and chicken -actin gene promoter [7]. However decreased expression of recombinant pro-teins in oviduct cells in subsequent generations (G1 and G2) was observed. A di-rect correlation between the expression of the recombinant product and a "gene dose" (the number of virus copies per cell genome) has been established, i.e. the intensive production of the transgenic product in organs and tissues of genetical-ly modified animals increases the risk of physiological defects [8-10].
A solution to the problem may be the use of promoters providing tissue-specific expression of recombinant genes as a part of gene constructs. As a promis-ing approach is considered the use of regulatory elements that control egg ovalbu-min synthesis, in particular the 7.5 and 2.8 kbp chromosomal DNA fragments flanking the 5'-end of the ovalbumin gene [11-15]. A stable tissue-specific expres-sion of the recombinant gene in several generations of transgenic birds was ob-served when these DNA fragments were included in the gene constructs. However, the synthesis of the recombinant product was 20-50 times lower compared to the results obtained when using constitutive promoters [16]. It indicates the effect on the ovalbumin synthesis regulation system from several regulatory elements located both inside and next to or outside the structural gene.
We first attempted to investigate the extent of tissue-specific gene ex-pression using various modifications of the 2.8 kbp chromosomal DNA frag-ment that included about 1.2 kbp located upstream of the initiation point of transcription and 1.6 kbp, including the first two exons and an intron of the ovalbumin gene.
The aim of the present work was to study the effect of the intron se-quences and promoter of ovalbumin gene contained in the gene constructs on the tissue specificity and expression of recombinant DNA.
Technique. We used a modified lentiviral vector system of the second generation, which included three plasmids, such as psPAX2 (encodes gag and pol genes, is a classic packer), pLPG (encodes a surface glycoprotein G of vesicular stomatitis virus VVS-G) and pWPXL (contains eGFP gene, the enhanced green fluorescence protein), under the control of a promoter of human RNA polymer-ase II elongation factor-1 hEF1, serves as a self-inactivating lentiviral vector) [17]. The pWCAGgfp, pW2.8, pW1.2, pW131, pW225 and pW315 vectors were constructed based on the pWPXL plasmid, lentiviral vectors are standard molec-ular cloning techniques [18].
To obtain a recombinant virus and determine viral titers, the cell line 293T was used. Cells were cultured in the DMEM medium (Dlbecco's Modified Eagle's Medium), containing fetal calf serum (10 %), L-glutamine (2 mM), pen-icillin (100 U/ml), streptomycin (100 μg/ml) in an atmosphere of 5 % CO2 at a temperature of 37 С. Viral preparations were concentrated, subjecting the culture supernatants to ultracentrifugation (70,000 g, 120 min, +4 С), pellets were resus-pended in the TNE buffer (50 mM Tris-HCl, pH 7.8; 130 mM NaCl; 1 mM Na2-EDTA). The physical titers of viral vectors were determined by a quantita-tive real-time PCR using the MiniOpticonTM analyzer (Bio-Rad, USA), and the biological titre of the virus — according to G. Tiscornia et al. [19]. These viral preparations used for primary culture of chicken oviduct cells infected according to the procedure [20].
The primary culture of chick oviduct cells and human fibrosarcoma cells 293T (control) were used as target cells for transfection. Viral preparation (1-3 CFU/ml) was added after cells reached a monolayer.
eGFP fluorescence was measured using the FACSCanto flow cytometer
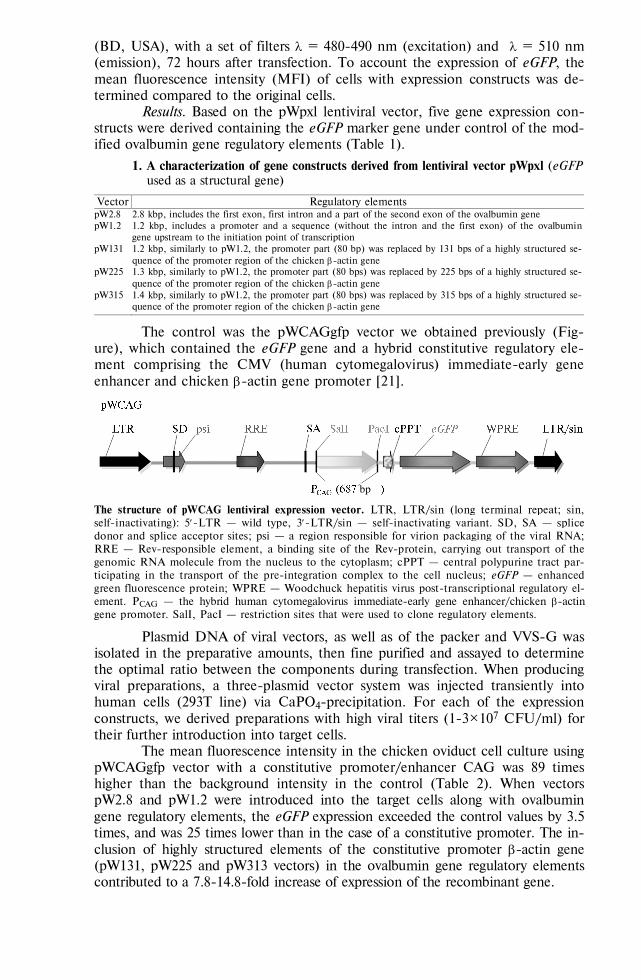
784
(BD, USA), with a set of filters = 480-490 nm (excitation) and = 510 nm (emission), 72 hours after transfection. To account the expression of eGFP, the mean fluorescence intensity (MFI) of cells with expression constructs was de-termined compared to the original cells.
Results. Based on the pWpxl lentiviral vector, five gene expression con-structs were derived containing the eGFP marker gene under control of the mod-ified ovalbumin gene regulatory elements (Table 1).
1. A characterization of gene constructs derived from lentiviral vector pWpxl (eGFP used as a structural gene)
Vector Regulatory elements pW2.8 2.8 kbp, includes the first exon, first intron and a part of the second exon of the ovalbumin gene pW1.2 1.2 kbp, includes a promoter and a sequence (without the intron and the first exon) of the ovalbumin
gene upstream to the initiation point of transcription pW131 1.2 kbp, similarly to pW1.2, the promoter part (80 bp) was replaced by 131 bps of a highly structured se-
quence of the promoter region of the chicken -actin gene pW225 1.3 kbp, similarly to pW1.2, the promoter part (80 bps) was replaced by 225 bps of a highly structured se-
quence of the promoter region of the chicken -actin gene pW315 1.4 kbp, similarly to pW1.2, the promoter part (80 bps) was replaced by 315 bps of a highly structured se-
quence of the promoter region of the chicken -actin gene
The control was the pWCAGgfp vector we obtained previously (Fig-ure), which contained the eGFP gene and a hybrid constitutive regulatory ele-ment comprising the CMV (human cytomegalovirus) immediate-early gene enhancer and chicken -actin gene promoter [21].
The structure of pWCAG lentiviral expression vector. LTR, LTR/sin (long terminal repeat; sin, self-inactivating): 5-LTR — wild type, 3-LTR/sin — self-inactivating variant. SD, SA — splice donor and splice acceptor sites; psi — a region responsible for virion packaging of the viral RNA; RRE — Rev-responsible element, a binding site of the Rev-protein, carrying out transport of the genomic RNA molecule from the nucleus to the cytoplasm; cPPT — central polypurine tract par-ticipating in the transport of the pre-integration complex to the cell nucleus; eGFP — enhanced green fluorescence protein; WPRE — Woodchuck hepatitis virus post-transcriptional regulatory el-ement. PCAG — the hybrid human cytomegalovirus immediate-early gene enhancer/chicken -actin gene promoter. SalI, PacI — restriction sites that were used to clone regulatory elements.
Plasmid DNA of viral vectors, as well as of the packer and VVS-G was isolated in the preparative amounts, then fine purified and assayed to determine the optimal ratio between the components during transfection. When producing viral preparations, a three-plasmid vector system was injected transiently into human cells (293T line) via CaPO4-precipitation. For each of the expression constructs, we derived preparations with high viral titers (1-3½107 CFU/ml) for their further introduction into target cells.
The mean fluorescence intensity in the chicken oviduct cell culture using pWCAGgfp vector with a constitutive promoter/enhancer CAG was 89 times higher than the background intensity in the control (Table 2). When vectors pW2.8 and pW1.2 were introduced into the target cells along with ovalbumin gene regulatory elements, the eGFP expression exceeded the control values by 3.5 times, and was 25 times lower than in the case of a constitutive promoter. The in-clusion of highly structured elements of the constitutive promoter -actin gene (pW131, pW225 and pW313 vectors) in the ovalbumin gene regulatory elements contributed to a 7.8-14.8-fold increase of expression of the recombinant gene.
bp
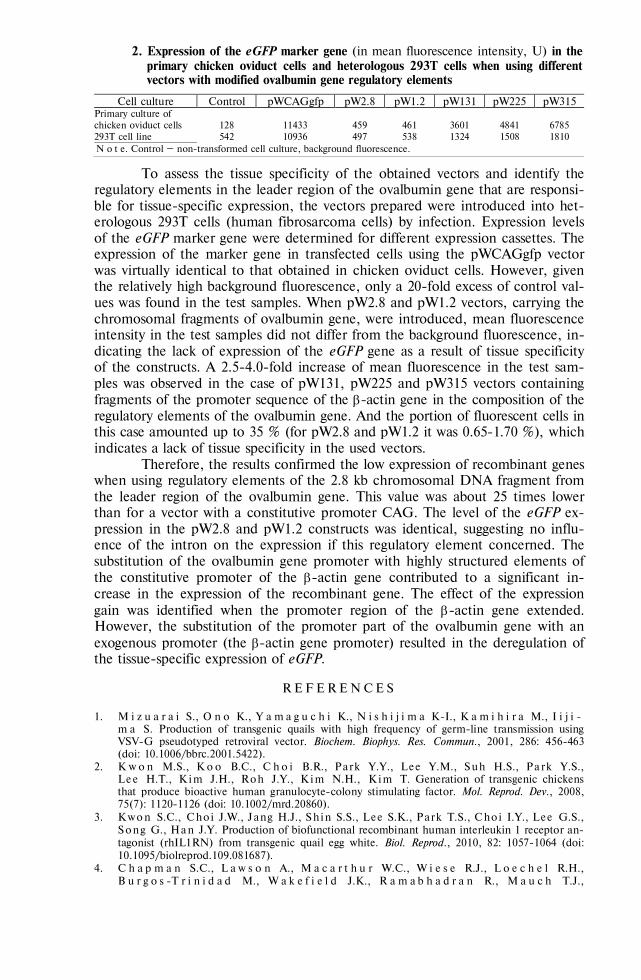
785
2. Expression of the eGFP marker gene (in mean fluorescence intensity, U) in the primary chicken oviduct cells and heterologous 293T cells when using different vectors with modified ovalbumin gene regulatory elements
Cell culture Control pWCAGgfp pW2.8 pW1.2 pW131 pW225 pW315 Primary culture of chicken oviduct cells 128 11433 459 461 3601 4841 6785 293T cell line 542 10936 497 538 1324 1508 1810 N o t e. Control – non-transformed cell culture, background fluorescence.
To assess the tissue specificity of the obtained vectors and identify the regulatory elements in the leader region of the ovalbumin gene that are responsi-ble for tissue-specific expression, the vectors prepared were introduced into het-erologous 293T cells (human fibrosarcoma cells) by infection. Expression levels of the eGFP marker gene were determined for different expression cassettes. The expression of the marker gene in transfected cells using the pWCAGgfp vector was virtually identical to that obtained in chicken oviduct cells. However, given the relatively high background fluorescence, only a 20-fold excess of control val-ues was found in the test samples. When pW2.8 and pW1.2 vectors, carrying the chromosomal fragments of ovalbumin gene, were introduced, mean fluorescence intensity in the test samples did not differ from the background fluorescence, in-dicating the lack of expression of the eGFP gene as a result of tissue specificity of the constructs. A 2.5-4.0-fold increase of mean fluorescence in the test sam-ples was observed in the case of pW131, pW225 and pW315 vectors containing fragments of the promoter sequence of the -actin gene in the composition of the regulatory elements of the ovalbumin gene. And the portion of fluorescent cells in this case amounted up to 35 % (for pW2.8 and pW1.2 it was 0.65-1.70 %), which indicates a lack of tissue specificity in the used vectors.
Therefore, the results confirmed the low expression of recombinant genes when using regulatory elements of the 2.8 kb chromosomal DNA fragment from the leader region of the ovalbumin gene. This value was about 25 times lower than for a vector with a constitutive promoter CAG. The level of the eGFP ex-pression in the pW2.8 and pW1.2 constructs was identical, suggesting no influ-ence of the intron on the expression if this regulatory element concerned. The substitution of the ovalbumin gene promoter with highly structured elements of the constitutive promoter of the -actin gene contributed to a significant in-crease in the expression of the recombinant gene. The effect of the expression gain was identified when the promoter region of the -actin gene extended. However, the substitution of the promoter part of the ovalbumin gene with an exogenous promoter (the -actin gene promoter) resulted in the deregulation of the tissue-specific expression of eGFP.
R E F E R E N C E S
1. M i z u a r a i S., O n o K., Y a m a g u c h i K., N i s h i j i m a K-I., K a m i h i r a M., I i j i -
m a S. Production of transgenic quails with high frequency of germ-line transmission using VSV-G pseudotyped retroviral vector. Biochem. Biophys. Res. Commun., 2001, 286: 456-463 (doi: 10.1006/bbrc.2001.5422).
2. K w o n M.S., K o o B.C., C h o i B.R., Park Y.Y., Lee Y.M., Suh H.S., Pa rk Y.S., Lee H.T., Kim J.H., Roh J.Y., Kim N.H., Kim T. Generation of transgenic chickens that produce bioactive human granulocyte-colony stimulating factor. Mol. Reprod. Dev., 2008, 75(7): 1120-1126 (doi: 10.1002/mrd.20860).
3. Kwon S.C., Cho i J.W., Jang H.J., Shin S.S., Lee S.K., Park T.S., Cho i I.Y., Lee G.S., Song G., Han J.Y. Production of biofunctional recombinant human interleukin 1 receptor an-tagonist (rhIL1RN) from transgenic quail egg white. Biol. Reprod., 2010, 82: 1057-1064 (doi: 10.1095/biolreprod.109.081687).
4. C h a p m a n S.C., L a w s o n A., M a c a r t h u r W.C., W i e s e R.J., L o e c h e l R.H., B u r g o s -T r i n i d a d M., W a k e f i e l d J.K., R a m a b h a d r a n R., M a u c h T.J.,
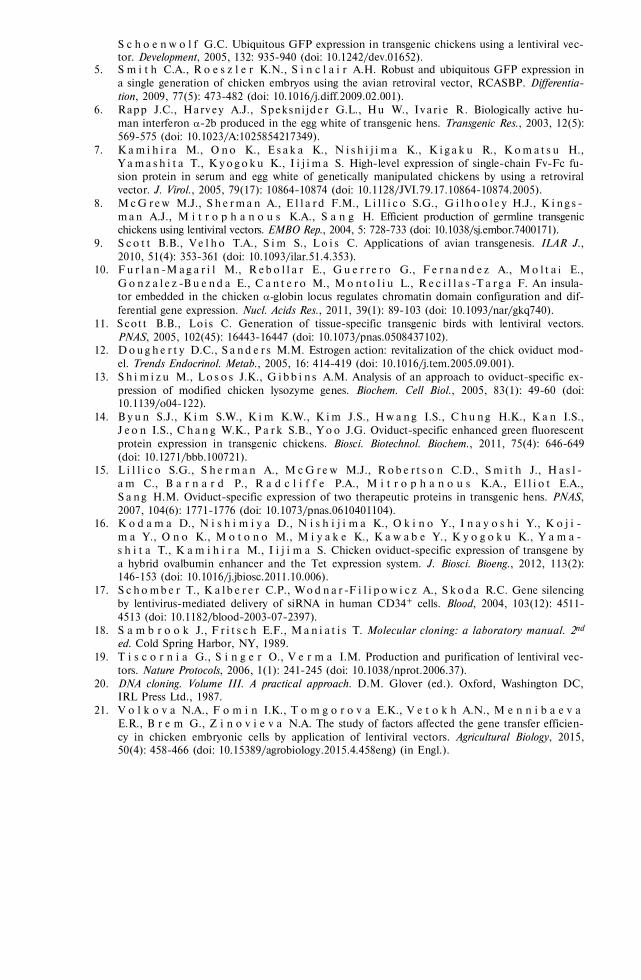
786
S c h o e n w o l f G.C. Ubiquitous GFP expression in transgenic chickens using a lentiviral vec-tor. Development, 2005, 132: 935-940 (doi: 10.1242/dev.01652).
5. S m i t h C.A., R o e s z l e r K.N., S i n c l a i r A.H. Robust and ubiquitous GFP expression in a single generation of chicken embryos using the avian retroviral vector, RCASBP. Differentia-tion, 2009, 77(5): 473-482 (doi: 10.1016/j.diff.2009.02.001).
6. Rapp J.C., Harv ey A.J., Speksni jd e r G.L., Hu W., Iv ar i e R. Biologically active hu-man interferon -2b produced in the egg white of transgenic hens. Transgenic Res., 2003, 12(5): 569-575 (doi: 10.1023/A:1025854217349).
7. K a m i h i r a M., O no K., E s a k a K., N i s h i j i m a K., K i g a k u R., K o m a t s u H., Y a ma s h i t a T., K y o g o k u K., I i j i m a S. High-level expression of single-chain Fv-Fc fu-sion protein in serum and egg white of genetically manipulated chickens by using a retroviral vector. J. Virol., 2005, 79(17): 10864-10874 (doi: 10.1128/JVI.79.17.10864-10874.2005).
8. M cG r e w M.J., S h e rma n A., E l l a r d F.M., L i l l i c o S.G., G i l h o o l e y H.J., K i n g s - m an A.J., M i t r o p h a n o u s K.A., S a n g H. Efficient production of germline transgenic chickens using lentiviral vectors. EMBO Rep., 2004, 5: 728-733 (doi: 10.1038/sj.embor.7400171).
9. S co t t B.B., V e l h o T.A., S i m S., L o i s C. Applications of avian transgenesis. ILAR J., 2010, 51(4): 353-361 (doi: 10.1093/ilar.51.4.353).
10. F u r l a n -M a g a r i l M., R e b o l l a r E., Gu e r r e r o G., F e r n a n d e z A., M o l t a і E., Go n z a l e z -B u e nd a E., C a n t e r o M., M o n t o l i u L., R e c i l l a s -T a r g a F. An insula-tor embedded in the chicken -globin locus regulates chromatin domain configuration and dif-ferential gene expression. Nucl. Acids Res., 2011, 39(1): 89-103 (doi: 10.1093/nar/gkq740).
11. Sco t t B.B., Lo i s C. Generation of tissue-specific transgenic birds with lentiviral vectors. PNAS, 2005, 102(45): 16443-16447 (doi: 10.1073/pnas.0508437102).
12. D o u g h e r t y D.C., S a n d e r s M.M. Estrogen action: revitalization of the chick oviduct mod-el. Trends Endocrinol. Metab., 2005, 16: 414-419 (doi: 10.1016/j.tem.2005.09.001).
13. S h i m i z u M., L o s o s J.K., G i b b i n s A.M. Analysis of an approach to oviduct-specific ex-pression of modified chicken lysozyme genes. Biochem. Cell Biol., 2005, 83(1): 49-60 (doi: 10.1139/o04-122).
14. B y u n S.J., K i m S.W., K i m K.W., K i m J.S., H w a n g I.S., C h u n g H.K., K a n I.S., J e o n I.S., C h a n g W.K., P a r k S.B., Y o o J.G. Oviduct-specific enhanced green fluorescent protein expression in transgenic chickens. Biosci. Biotechnol. Biochem., 2011, 75(4): 646-649 (doi: 10.1271/bbb.100721).
15. L i l l i c o S.G., S h e r m an A., M c G r e w M.J., R o b e r t s o n C.D., S m i t h J., H a s l - a m C., B a r n a r d P., R a d c l i f f e P.A., M i t r o p h a n o u s K.A., E l l i o t E.A., S a n g H.M. Oviduct-specific expression of two therapeutic proteins in transgenic hens. PNAS, 2007, 104(6): 1771-1776 (doi: 10.1073/pnas.0610401104).
16. K o d a m a D., N i s h i m i y a D., N i s h i j i m a K., O k i n o Y., I n a y o s h i Y., K o j i -m a Y., O n o K., M o t o n o M., M i y a k e K., K a w a b e Y., K y o g o k u K., Y a m a -s h i t a T., K a m i h i r a M., I i j i m a S. Chicken oviduct-specific expression of transgene by a hybrid ovalbumin enhancer and the Tet expression system. J. Biosci. Bioeng., 2012, 113(2): 146-153 (doi: 10.1016/j.jbiosc.2011.10.006).
17. S c h o mb e r T., K a l b e r e r C.P., Wo d n a r -F i l i p o w i c z A., S k o d a R.C. Gene silencing by lentivirus-mediated delivery of siRNA in human CD34+ cells. Blood, 2004, 103(12): 4511-4513 (doi: 10.1182/blood-2003-07-2397).
18. S a m b r o o k J., F r i t s c h E.F., M a n i a t i s T. Molecular cloning: a laboratory manual. 2nd
ed. Cold Spring Harbor, NY, 1989. 19. T i s c o r n i a G., S i n g e r O., V e r m a I.M. Production and purification of lentiviral vec-
tors. Nature Protocols, 2006, 1(1): 241-245 (doi: 10.1038/nprot.2006.37). 20. DNA cloning. Volume III. A practical approach. D.M. Glover (ed.). Oxford, Washington DC,
IRL Press Ltd., 1987. 21. V o l k o v a N.A., F o m i n I.K., T o m g o r o v a E.K., V e t o k h A.N., M e n n i b a e v a
E.R., B r e m G., Z i n o v i e v a N.A. The study of factors affected the gene transfer efficien-cy in chicken embryonic cells by application of lentiviral vectors. Agricultural Biology, 2015, 50(4): 458-466 (doi: 10.15389/agrobiology.2015.4.458eng) (in Engl.).
788
AGRICULTURAL BIOLOGY, ISSN 2412-0324 (English ed. Online)
2016, V. 51, ¹ 6, pp. 788-800 (SEL’SKOKHOZYAISTVENNAYA BIOLOGIYA) ISSN 0131-6397 (Russian ed. Print)
ISSN 2313-4836 (Russian ed. Online)
Genome scanning and biodiversity UDC 636.2:575.174:575.2:51-76 doi: 10.15389/agrobiology.2016.6.788rus
doi: 10.15389/agrobiology.2016.6.788eng
STUDY OF GENETIC DIVERSITY AND POPULATION STRUCTURE OF FIVE RUSSIAN CATTLE BREEDS USING WHOLE-
GENOME SNP ANALYSIS
N.A. ZINOVIEVA1, A.V. DOTSEV1, A.A. SERMYAGIN1, K. WIMMERS2, H. REYER2, J. SÖLKNER3, T.E. DENISKOVA1, G. BREM1, 4
1L.K. Ernst All-Russian Research Institute of Animal Husbandry, Federal Agency of Scientific Organizations, 60, pos. Dubrovitsy, Podolsk District, Moscow Province, 142132 Russia, e-mail [email protected], [email protected], [email protected]; 2Institute of Genome Biology, Leibniz Institute for Farm Animal Biology (FBN), Mecklenburg-Vorpommern, 18196 Dummerstorf, Germany, e-mail [email protected], [email protected]; 3Division of Livestock Sciences, University of Natural Resources and Life Sciences, Augasse 2-6, A-1090, Vienna, Aus-tria, e-mail [email protected]; 4Institut für Tierzucht und Genetik, University of Veterinary Medicine (VMU), Veterinärplatz, A-1210, Vienna, Aus-tria, e-mail [email protected] Acknowledgements: We thank Department of Animal Husbandry and Breeding (Ministry of Agriculture of the Russian Federation), Dr V.S. Matyukov (Komi Republic Research Institute of Agriculture) and Dr D.K. Nekrasov (Ivanovo State Academy of Agriculture) for assistance in collecting samples. Supported by Russian Science Foundation, project ¹ 14-36-00039 Received September 26, 2016
A b s t r a c t
With the publication of the complete sequence of a cattle genome, it became possible to trace the history of breed origins and to evaluate genetic relationships between modern breeds, based on the results of genome-wide SNP screening. Whilst numerous studies have been undertaken to characterize the commercial breeds and some local cattle breeds of Europe, North America, Asia and Africa at whole-genome level, little is known about genetic differences, relationships and popula-tion genetic structure of the Russian native cattle breeds. The aim of our work was to study the ge-netic diversity and population structure of five locally-developed Russian cattle breeds, based on ge-nome-wide single nucleotide polymorphisms (SNPs) generated using Illumina Bovine SNP50 BeadChips (Illumina, San Diego, CA, USA). In total, 116 samples (sperm or tissue) collected from five breeds were analyzed, including Bestuzhev (BEST, n = 27), Kholmogor (KHLM, n = 25), Ko-stromsky (KSTR, n = 20), Red Gorbatov (RGBT, n = 23) and Yaroslavl breeds (YRSL, n = 21). Samples of Holstein cattle (HLST, n = 29) were used for comparison. Quality filtering of genetic markers was performed in PLINK v 1.07. Data processing was performed using software PLINK 1.07, HP-Rare 1.1, STRUCTURE, ver. 2.3.4, Phylip, ver. 3.695, FigTree 1.4.2, Arlequin suite, ver. 3.5.2.2 and R pocket. The final set of markers passed through the quality control and selected for further analysis included 35874 SNPs. Average heterozygosity within breeds ranged from 0.378 in BEST to 0.390 in KHLM and was higher comparing to HLST (0.377). Allelic richness was ranging from 1.914±0.001 in KSTR to 1.955±0.001 in BEST. A slight heterozygote excess was detected in all breeds studied (FIS from 0.015 in BEST to 0.054 in KHLM). The multidimensional scaling (MDS) showed the presence of non-overlapping breed specific clusters, whereas the first principal component (PC1) accounted for 5.46 % and the second principal component (PC2) was responsible for 5.05 % of the genotypic variance. Phylogenetic analysis based on parsimony method grouped in-dividuals into six clusters according to their breeds. The STRUCTURE analyses supported the as-sumption that the ancestry of the locally developed Russian cattle breeds is distinct from Holsteins and Holstein-related breeds. The highest ΔK showing the assumed number of populations was ob-served for k = 6. At k = 6, the genetic structure is in agreement with breed origin of individuals: Q1/6 = 0.855±0.018 for BEST, Q2/6 = 0.818±0.029 for KHLM, Q3/6 = 0.923±0.015 for KSTR, Q4/6 = 0.816±0.027 for RGBT, Q5/6 = 0.873±0.031 for YRSL and Q6/6 = 0.935±0.014 for HLST. Analysis of molecular variance (AMOVA) showed highly significant results for genetic differentiation (p < 0.001) in studied breeds. AMOVA revealed that most of the genetic variation in cattle breeds was found within populations (91.2 %), and less among populations (8.8 %). The emerging structure of the phylogenetic tree constructed on the Nei genetic distances, is in full concordance with the his-
789
torical origin of breeds and confirms the MDS and STRUCTURE results. Thus, using the method of genome-wide SNP studies we were able for the first time to study the population structure and gene-alogical relationships among the five Russian cattle breeds. The received information is the first step towards the evaluation of the value of these breeds regarding their conservation and usage in the ag-ricultural production of the future.
Keywords: Russian cattle breeds, whole-genome SNP screening, biodiversity
The development of intensive livestock farming systems based on a lim-ited number of breeds leads to a decrease of the diversity in livestock species [1, 2]. Identification and maintenance of the unique variability of local breeds in terms of growth of anthropogenic load and climate change can become an indis-pensable source of new valuable genotypes for future animal breeding. The cen-turies-old history of the territory of Russia formed cattle populations that are well adapted to the local climatic environment and economic conditions, while foreign cattle breeds were not massively imported to the old Russia in the first quarter of the XVIII century [3]. The chaotic importation of different cattle breeds from the European countries to Russia, with the aim of improving local cattle, began in 1725 with the creation of the Tsarskoe Selo farm. From the eighteenth century to the first quarter or even the half of the nineteenth century, the Holland cattle was the most imported breed. In parallel, with the beginning of the nineteenth century, Tyrolean cattle were imported in large quantities for several decades. From the end of the first half of the XIX century to early XX century (1930s), a large number of Simmental and Brown Swiss cattle were brought to the old Russia [4]. Along with these breeds, which dominated over other imported cattle, a limited number of almost all cattle breeds that were bred in Western Europe were imported to the old Russia [5-7]. The decision on im-port of a particular breed to improve the local cattle was taken independently by each landowner and was often based on fashion for a particular breed in a cer-tain period of time [3]. Based on this unsystematic use of a variety of breeds in the regions of the old Russia very diverse cattle populations occurred. In cases where the local natural and economic conditions were favorable (as, for exam-ple, in Kholmogor district of the Arkhangelsk region), groups of improved and more productive cattle were formed [8]. However, in most areas the importation of foreign cattle had no visible influence and did not affect the development of local livestock farming. In the 20s of the XX century, based on a territorial prin-ciple and phenotypic traits, 12 large arrays of cattle arose in the USSR — the so-called Russian spawn (currently defined as breeds), which acquired consider-able notoriety, has been of a great economic interest and became the subject of breeding. In addition, there were a few small groups of local cattle [3].
In the 20s to 30s of the XX century, the best part of the population be-came the basis for the development of breeds. So, such breeds were officially recognized as Yaroslavl (1925), Red Gorbatov (1926), Kholmogor (1927), and Bestuzhev (1928). In the 30s, after the civil war was over and the agriculture was restored, the breed-zoning plan was developed, which defined the target cattle breeds and regions of their breeding due to economic, naturally historical and zootechnical assumptions. In total, 17 breeds, including twelve indigenous and five foreign, were selected as planned breeds. In the European part of Russia the breeding of 11 local breeds has been recommended including Kholmogor, Tagil, Red German, White-headed Colonist, Yaroslavl, Town Caucasian, Bestuzhev, Red Gorbatov, Kalmyk, Kirghiz, and Grey Ukrainian and 5 foreign: Holland, Simmental, Brown Swiss, Shorthorn and Hereford [4]. In subsequent years, crossbreeding of domestic breeds with foreign ones has been practiced, which led to the extinction of many indigenous breeds and the development of new cross-bred breeds. For example, based on the local cattle of Kostroma region, which
790
was previously slightly improved by crossing with Yaroslavl and Algaus cattle, the new Kostromsky breed was created through intensive crossing with Brown Swiss cattle and received the official recognition in 1944 [9]. Starting in the 80s-90s of last century, due to the lack of economic competitiveness, which was mainly based on low yield and unsuitability to industrial scale, the number of domestic cattle began to decline significantly. For example, from 1990 to 2013, the num-ber of Kholmogor cattle decreased from 2137.0 to 285.8 thousand heads, Yaro-slavl — 746.2 to 62.4 thousand heads, Bestuzhev — 981.9 to 33.1 thousand heads, Kostromsky — 384.0 to 13.0 thousand heads, Red Gorbatov — 38.0 to 1.5 thousand heads [10, 11]. Taking into account a significant contribution of indigenous breeds and regional cattle populations to the genetic diversity of do-mesticated species [12, 13], the reduction of their population size and "dilution" of their allele pool may be one of the main reasons for the decline of the biodi-versity of domesticated species.
It should be noted that the improvement of local cattle breeds occurred mainly by crossbreeding to obtain crosses with different contributions from im-proved breeds [9]. Given the significant impact of environmental conditions on the formation of allele pool, it can be assumed that many alleles, which are specif-ic for aboriginal breeds and associated with the adaptation to local climatic condi-tions, were kept by selection pressure and have survived in modern populations.
Generating new knowledge concerning the structure of animal genome, the improvement of methodical approaches, the development of high-per-formance technologies of genomic analysis, and the creation of the analytical equipment of the new generation has led to the identification and application of different types of genetic markers in studies of animal diversity [14]. Until re-cently, mtDNA polymorphisms and microsatellites were most widely used in studies of domestication investigating the origin and demographic history of cat-tle breeds. Previous studies of the D-loop of mtDNA polymorphisms revealed the strongest evidence for an independent domestication of zebu and taurine cat-tle [15-17] that was later confirmed by microsatellite analysis [18, 19]. Based on microsatellite diversity, the hybrid origin of the Near East cattle breeds was veri-fied [19, 20] and the different histories of Mediterranean and Northern Europe-an cattle populations were proven [21]. Microsatellites were successfully applied to study genetic diversity, genetic structure and diversity of several Russian cattle breeds [22-24). With the publication of the complete sequence of a cattle ge-nome in 2009 [25, 26], it became possible to trace the history of breed origins and to evaluate genetic relationships between modern breeds, based on the re-sults of genome-wide SNP screening [27-31]. Conducting genome-wide studies of the allele pool of the local breeds will contribute to the identification of new polymorphisms and to the understanding of biological mechanisms that allow these breeds to adapt and survive in different local environmental conditions.
In the present work, we were the first to show the uniqueness of the al-lele fund of domestic dairy breeds at genomic level, which allows us to consider these breeds as a reserve of variability for animal husbandry.
The aim of our work was to study the genetic diversity and population structure of five locally-developed Russian cattle breeds, including Bestuzhev, Kholmogor, Kostromsky, Red Gorbatov and Yaroslavl, based on genome-wide single nucleotide polymorphisms (SNP) generated using Illumina Bovine SNP50 BeadChips.
Technique. In total, 116 samples (sperm or tissue) collected from five lo-cally developed Russian cattle breeds were analyzed, including Bestuzhev (BEST, n = 27), Kholmogor (KHLM, n = 25), Kostromsky (KSTR, n = 20), Red Gorbatov (RGBT, n = 23) and Yaroslavl breeds (YRSL, n = 21). The sam-
791
ples of North American and German Holstein cattle (HLST, n = 29) were used for comparison.
Genomic DNA was extracted from biomaterial samples using Nexttec column (Nexttec Biotechnology GmbH, Germany) following the manufacturer's instructions. The DNA concentration was estimated by measuring the absorb-ance at 260 nm and the DNA quality was checked by separation on agarose gels. Whole-genome SNP screening was performed using Bovine SNP50 BeadChip (Illumina, San Diego, CA, USA).
Quality filtering of genetic markers was performed in PLINK 1.07 [32]. During an initial quality check, GenCall (GC) and GenTrain (GT) scores were used to assess the accuracy and efficiency of SNP genotyping. A GC score of 0.5 and GT score of 0.3 cutoff was applied to determine valid genotypes for each SNP [33]. At the next stage, the following filters were used: SNPs with less than 90 % of individuals genotyped (--geno 0.1), MAF less than < 5 % (--maf 0.05), Hardy-Weinberg equilibrium test p < 10(-6) (--hwe 1e-6) and in linkage disequi-librium (--indep-pairwise 50 5 0.5) were pruned. SNPs located on sex chromo-somes as well as SNPs with unknown map positions were also deleted. Individu-als were initially quality controlled in PLINK 1.07: ones with less than 90 % SNPs genotyped (--mind 0.1) were removed.
Observed and expected heterozygosity, test for deviation from Hardy-Weinberg equilibrium were calculated in PLINK 1.07 [32]. Allelic richness (Ar) for each population was calculated using the program HP-Rare 1.1 [34]. In or-der to compare the allelic richness of samples having different sizes the proce-dure of rarefication was applied.
FIS was calculated using formula: FIS = (HEXP HOBS)/HEXP, where HOBS is the observed heterozygosity and HEXP is the expected heterozygosity.
Multidimensional scaling (MDS) based on pairwise identical-by-state (IBS) distance was performed with PLINK 1.07 (--cluster, --mds-plot 4) and visualized with R package 3.2.3 [35].
Population structure was evaluated using admixture model in STRUC-TURE 2.3.4 software [36]. We evaluated k values (the number of assumed popu-lations) from 2 to 9 using a burn-in of 50 000 and 50 000 Markov chain Monte Carlo (MCMC) iterations for each value of K. Ten iterations for each value of K were carried out. Average values of similarity coefficient Q in the i-th cluster for the total number of clusters k (Qi/k) were calculated for each breed.
An unrooted individual phylogenetic tree was constructed using parsi-mony method with the program Dnapars from the Phylip 3.695 package [37] and visualized with FigTree 1.4.2 (38).
Pairwise Nei’s genetic distances [39] were calculated using R package StAMPP [40]. Software Arlequin suite 3.5.2.2 [41] was used to determine pair-wise fixation indices (Fst) [42] and to perform an analysis of molecular variance (AMOVA).
A rooted tree was constructed using neighbor-joining analysis using M. Nei distances [39] in the Neighbour program from the Phylip 3.695 package [37] and visualized with FigTree 1.4.2 [38]. Reindeer whole-genome genotyping data (n = 12) generated applying the same Bead Array were used as an outgroup for the tree.
R version 3.2.3 was used as an instrument for creating input files [35]. Results. After filtering for GT and GC, 1764 SNPs on sex chromosomes
were excluded from the initial set of 54609 SNPs. At the subsequent step of the quality filtering, 4901 SNPs failed missingness test (GENO > 0.1), 9343 SNPs failed frequency test (MAF < 0.05) and 127 markers were excluded based on HWE test (p <= 1e-006). Afterwards 6228 SNPs in linkage disequilibrium were
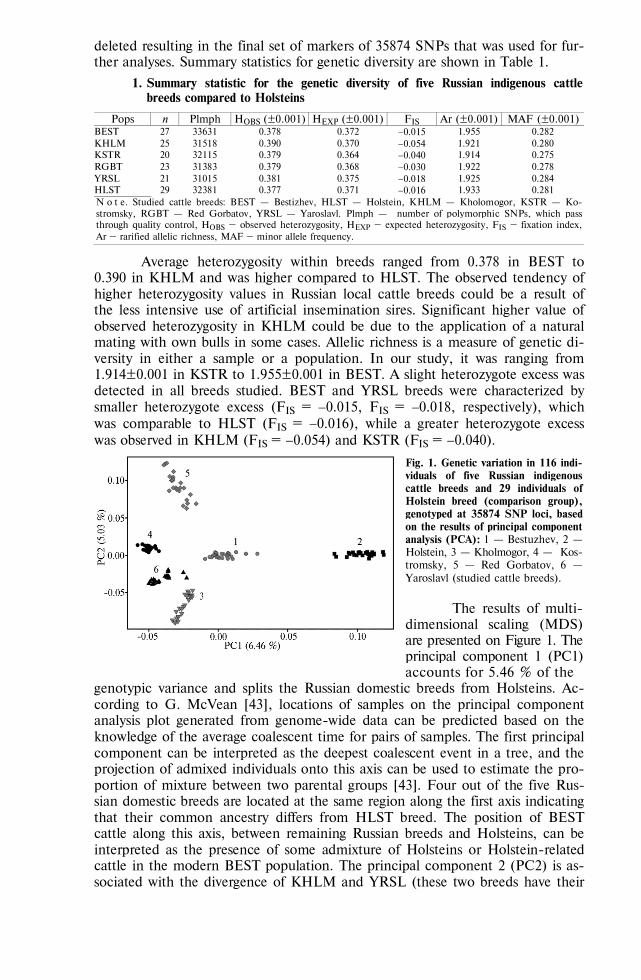
792
deleted resulting in the final set of markers of 35874 SNPs that was used for fur-ther analyses. Summary statistics for genetic diversity are shown in Table 1.
1. Summary statistic for the genetic diversity of five Russian indigenous cattle breeds compared to Holsteins
Pops n Plmph HOBS (±0.001) HEXP (±0.001) FIS Ar (±0.001) MAF (±0.001) BEST 27 33631 0.378 0.372 0.015 1.955 0.282 KHLM 25 31518 0.390 0.370 0.054 1.921 0.280 KSTR 20 32115 0.379 0.364 0.040 1.914 0.275 RGBT 23 31383 0.379 0.368 0.030 1.922 0.278 YRSL 21 31015 0.381 0.375 0.018 1.925 0.284 HLST 29 32381 0.377 0.371 0.016 1.933 0.281 N o t е. Studied cattle breeds: BEST — Bestizhev, HLST — Holstein, KHLM — Kholomogor, KSTR — Ko-stromsky, RGBT — Red Gorbatov, YRSL — Yaroslavl. Plmph — number of polymorphic SNPs, which pass through quality control, HOBS – observed heterozygosity, HEXP – expected heterozygosity, FIS – fixation index, Ar – rarified allelic richness, MAF – minor allele frequency.
Average heterozygosity within breeds ranged from 0.378 in BEST to 0.390 in KHLM and was higher compared to HLST. The observed tendency of higher heterozygosity values in Russian local cattle breeds could be a result of the less intensive use of artificial insemination sires. Significant higher value of observed heterozygosity in KHLM could be due to the application of a natural mating with own bulls in some cases. Allelic richness is a measure of genetic di-versity in either a sample or a population. In our study, it was ranging from 1.914±0.001 in KSTR to 1.955±0.001 in BEST. A slight heterozygote excess was detected in all breeds studied. BEST and YRSL breeds were characterized by smaller heterozygote excess (FIS = 0.015, FIS = 0.018, respectively), which was comparable to HLST (FIS = 0.016), while a greater heterozygote excess was observed in KHLM (FIS = 0.054) and KSTR (FIS = 0.040).
Fig. 1. Genetic variation in 116 indi-viduals of five Russian indigenous cattle breeds and 29 individuals of Holstein breed (comparison group), genotyped at 35874 SNP loci, based on the results of principal component analysis (PCA): 1 — Bestuzhev, 2 — Holstein, 3 — Kholmogor, 4 — Kos-tromsky, 5 — Red Gorbatov, 6 — Yaroslavl (studied cattle breeds).
The results of multi-
dimensional scaling (MDS) are presented on Figure 1. The principal component 1 (PC1) accounts for 5.46 % of the
genotypic variance and splits the Russian domestic breeds from Holsteins. Ac-cording to G. McVean [43], locations of samples on the principal component analysis plot generated from genome-wide data can be predicted based on the knowledge of the average coalescent time for pairs of samples. The first principal component can be interpreted as the deepest coalescent event in a tree, and the projection of admixed individuals onto this axis can be used to estimate the pro-portion of mixture between two parental groups [43]. Four out of the five Rus-sian domestic breeds are located at the same region along the first axis indicating that their common ancestry differs from HLST breed. The position of BEST cattle along this axis, between remaining Russian breeds and Holsteins, can be interpreted as the presence of some admixture of Holsteins or Holstein-related cattle in the modern BEST population. The principal component 2 (PC2) is as-sociated with the divergence of KHLM and YRSL (these two breeds have their
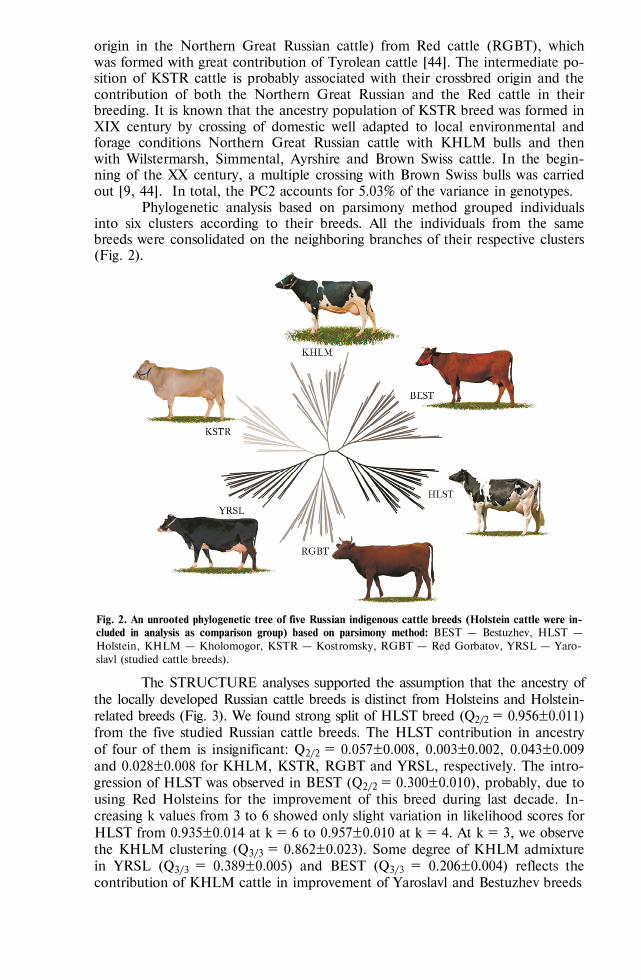
793
origin in the Northern Great Russian cattle) from Red cattle (RGBT), which was formed with great contribution of Tyrolean cattle [44]. The intermediate po-sition of KSTR cattle is probably associated with their crossbred origin and the contribution of both the Northern Great Russian and the Red cattle in their breeding. It is known that the ancestry population of KSTR breed was formed in XIX century by crossing of domestic well adapted to local environmental and forage conditions Northern Great Russian cattle with KHLM bulls and then with Wilstermarsh, Simmental, Ayrshire and Brown Swiss cattle. In the begin-ning of the XX century, a multiple crossing with Brown Swiss bulls was carried out [9, 44]. In total, the PC2 accounts for 5.03% of the variance in genotypes.
Phylogenetic analysis based on parsimony method grouped individuals into six clusters according to their breeds. All the individuals from the same breeds were consolidated on the neighboring branches of their respective clusters (Fig. 2).
Fig. 2. An unrooted phylogenetic tree of five Russian indigenous cattle breeds (Holstein cattle were in-cluded in analysis as comparison group) based on parsimony method: BEST — Bestuzhev, HLST — Holstein, KHLM — Kholomogor, KSTR — Kostromsky, RGBT — Red Gorbatov, YRSL — Yaro-slavl (studied cattle breeds).
The STRUCTURE analyses supported the assumption that the ancestry of the locally developed Russian cattle breeds is distinct from Holsteins and Holstein-related breeds (Fig. 3). We found strong split of HLST breed (Q2/2 = 0.956±0.011) from the five studied Russian cattle breeds. The HLST contribution in ancestry of four of them is insignificant: Q2/2 = 0.057±0.008, 0.003±0.002, 0.043±0.009 and 0.028±0.008 for KHLM, KSTR, RGBT and YRSL, respectively. The intro-gression of HLST was observed in BEST (Q2/2 = 0.300±0.010), probably, due to using Red Holsteins for the improvement of this breed during last decade. In-creasing k values from 3 to 6 showed only slight variation in likelihood scores for HLST from 0.935±0.014 at k = 6 to 0.957±0.010 at k = 4. At k = 3, we observe the KHLM clustering (Q3/3 = 0.862±0.023). Some degree of KHLM admixture in YRSL (Q3/3 = 0.389±0.005) and BEST (Q3/3 = 0.206±0.004) reflects the contribution of KHLM cattle in improvement of Yaroslavl and Bestuzhev breeds
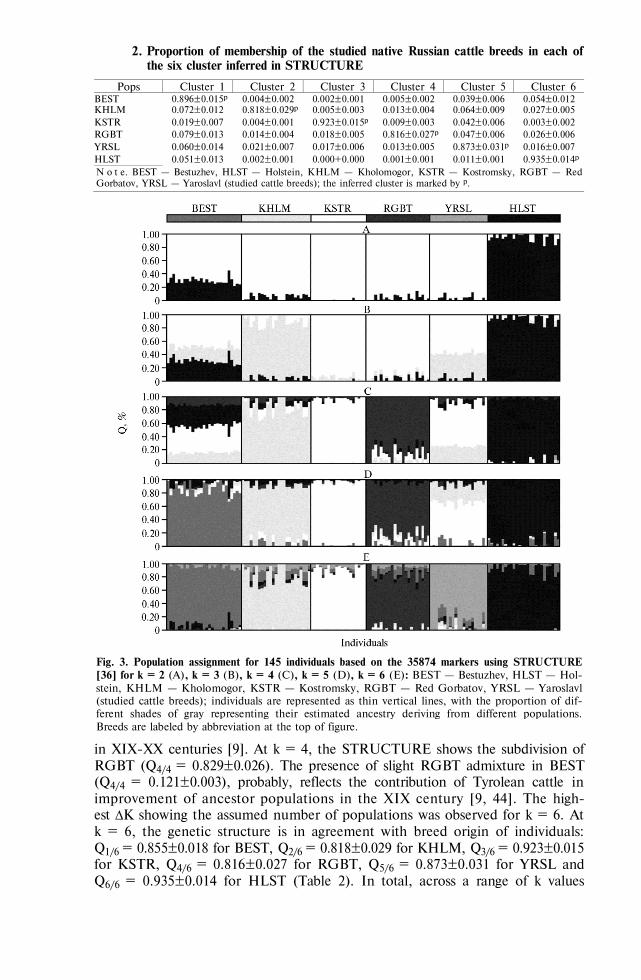
794
2. Proportion of membership of the studied native Russian cattle breeds in each of the six cluster inferred in STRUCTURE
Pops Cluster 1 Cluster 2 Cluster 3 Cluster 4 Cluster 5 Cluster 6 BEST 0.896±0.015p 0.004±0.002 0.002±0.001 0.005±0.002 0.039±0.006 0.054±0.012 KHLM 0.072±0.012 0.818±0.029p 0.005±0.003 0.013±0.004 0.064±0.009 0.027±0.005 KSTR 0.019±0.007 0.004±0.001 0.923±0.015p 0.009±0.003 0.042±0.006 0.003±0.002 RGBT 0.079±0.013 0.014±0.004 0.018±0.005 0.816±0.027p 0.047±0.006 0.026±0.006 YRSL 0.060±0.014 0.021±0.007 0.017±0.006 0.013±0.005 0.873±0.031p 0.016±0.007 HLST 0.051±0.013 0.002±0.001 0.000+0.000 0.001±0.001 0.011±0.001 0.935±0.014p N o t е. BEST — Bestuzhev, HLST — Holstein, KHLM — Kholomogor, KSTR — Kostromsky, RGBT — Red Gorbatov, YRSL — Yaroslavl (studied cattle breeds); the inferred cluster is marked by p.
Fig. 3. Population assignment for 145 individuals based on the 35874 markers using STRUCTURE [36] for k = 2 (А), k = 3 (B), k = 4 (C), k = 5 (D), k = 6 (E): BEST — Bestuzhev, HLST — Hol-stein, KHLM — Kholomogor, KSTR — Kostromsky, RGBT — Red Gorbatov, YRSL — Yaroslavl (studied cattle breeds); individuals are represented as thin vertical lines, with the proportion of dif-ferent shades of gray representing their estimated ancestry deriving from different populations. Breeds are labeled by abbreviation at the top of figure.
in XIX-XX centuries [9]. At k = 4, the STRUCTURE shows the subdivision of RGBT (Q4/4 = 0.829±0.026). The presence of slight RGBT admixture in BEST (Q4/4 = 0.121±0.003), probably, reflects the contribution of Tyrolean cattle in improvement of ancestor populations in the XIX century [9, 44]. The high-est ΔK showing the assumed number of populations was observed for k = 6. At k = 6, the genetic structure is in agreement with breed origin of individuals: Q1/6 = 0.855±0.018 for BEST, Q2/6 = 0.818±0.029 for KHLM, Q3/6 = 0.923±0.015 for KSTR, Q4/6 = 0.816±0.027 for RGBT, Q5/6 = 0.873±0.031 for YRSL and Q6/6 = 0.935±0.014 for HLST (Table 2). In total, across a range of k values
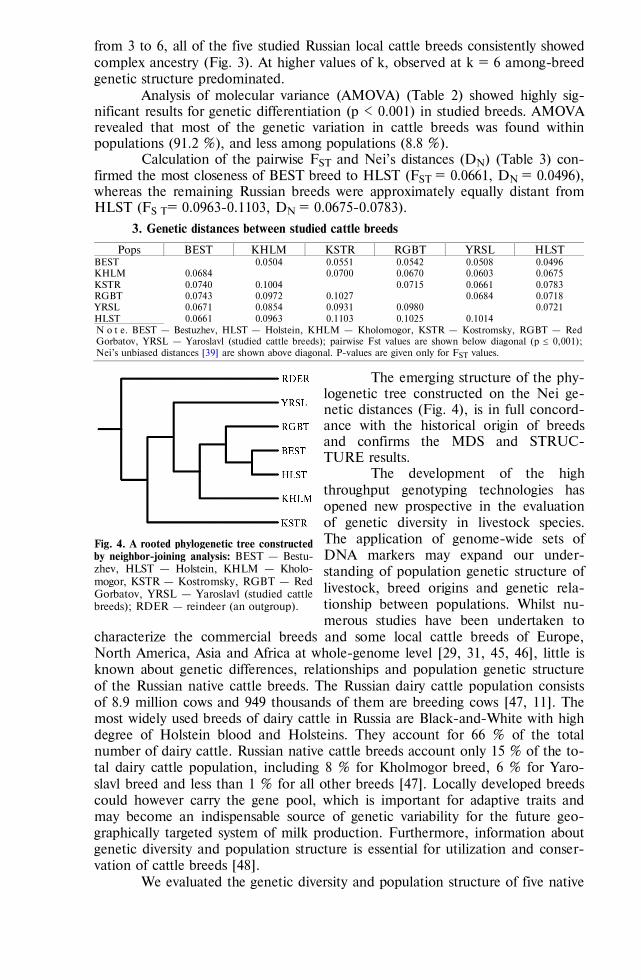
795
from 3 to 6, all of the five studied Russian local cattle breeds consistently showed complex ancestry (Fig. 3). At higher values of k, observed at k = 6 among-breed genetic structure predominated.
Analysis of molecular variance (AMOVA) (Table 2) showed highly sig-nificant results for genetic differentiation (p < 0.001) in studied breeds. AMOVA revealed that most of the genetic variation in cattle breeds was found within populations (91.2 %), and less among populations (8.8 %).
Calculation of the pairwise FST and Nei’s distances (DN) (Table 3) con-firmed the most closeness of BEST breed to HLST (FST = 0.0661, DN = 0.0496), whereas the remaining Russian breeds were approximately equally distant from HLST (FS T= 0.0963-0.1103, DN = 0.0675-0.0783).
3. Genetic distances between studied cattle breeds
Pops BEST KHLM KSTR RGBT YRSL HLST BEST 0.0504 0.0551 0.0542 0.0508 0.0496 KHLM 0.0684 0.0700 0.0670 0.0603 0.0675 KSTR 0.0740 0.1004 0.0715 0.0661 0.0783 RGBT 0.0743 0.0972 0.1027 0.0684 0.0718 YRSL 0.0671 0.0854 0.0931 0.0980 0.0721 HLST 0.0661 0.0963 0.1103 0.1025 0.1014 N o t е. BEST — Bestuzhev, HLST — Holstein, KHLM — Kholomogor, KSTR — Kostromsky, RGBT — Red Gorbatov, YRSL — Yaroslavl (studied cattle breeds); pairwise Fst values are shown below diagonal (p 0,001); Nei’s unbiased distances [39] are shown above diagonal. P-values are given only for FST values.
The emerging structure of the phy-logenetic tree constructed on the Nei ge-netic distances (Fig. 4), is in full concord-ance with the historical origin of breeds and confirms the MDS and STRUC-TURE results.
The development of the high throughput genotyping technologies has opened new prospective in the evaluation of genetic diversity in livestock species. The application of genome-wide sets of DNA markers may expand our under-standing of population genetic structure of livestock, breed origins and genetic rela-tionship between populations. Whilst nu-merous studies have been undertaken to
characterize the commercial breeds and some local cattle breeds of Europe, North America, Asia and Africa at whole-genome level [29, 31, 45, 46], little is known about genetic differences, relationships and population genetic structure of the Russian native cattle breeds. The Russian dairy cattle population consists of 8.9 million cows and 949 thousands of them are breeding cows [47, 11]. The most widely used breeds of dairy cattle in Russia are Black-and-White with high degree of Holstein blood and Holsteins. They account for 66 % of the total number of dairy cattle. Russian native cattle breeds account only 15 % of the to-tal dairy cattle population, including 8 % for Kholmogor breed, 6 % for Yaro-slavl breed and less than 1 % for all other breeds [47]. Locally developed breeds could however carry the gene pool, which is important for adaptive traits and may become an indispensable source of genetic variability for the future geo-graphically targeted system of milk production. Furthermore, information about genetic diversity and population structure is essential for utilization and conser-vation of cattle breeds [48].
We evaluated the genetic diversity and population structure of five native
Fig. 4. A rooted phylogenetic tree constructed by neighbor-joining analysis: BEST — Bestu-zhev, HLST — Holstein, KHLM — Kholo-mogor, KSTR — Kostromsky, RGBT — Red Gorbatov, YRSL — Yaroslavl (studied cattle breeds); RDER — reindeer (an outgroup).
796
Russian cattle breeds using a set of 35874 polymorphic SNPs generated by the Bovine SNP50K BeadChip (Illumina Inc, San-Diego, USA). We clearly distin-guished Russian breeds from each other and from Holstein breed, which was used as comparison. All the investigated cattle breeds revealed a complex origin. Some signals of admixture were observed between several Russian breeds and Holsteins, and between different Russian breeds. The highest contribution of Holsteins or Holstein-related breeds was observed in Bestuzhev breed. Based on PC1 of the MDS analysis the Bestuzhev breed was positioned between other Russian breeds and the Holstein breed showing some degree of membership in the Holstein specific cluster as revealed by STRUCTURE analysis. These two breeds were characterized by lowest pairwise FST values and formed a common branch at the Nei’s phylogenetic tree. The closeness of Bestuzhev breed to Hol-steins is probably due to intensive use of Holstein bulls for improvement of this native cattle breed [49]. We observed some admixture of Holsteins or Holstein-related cattle in Kholmogor and Red Gorbatov cattle. In the Kholmogor breed, it is probably associated with the contribution of Dutch cattle in the develop-ment of the ancestral populations of this breed. It is known that Dutch cows were distributed among the inhabitants of fertile meads in Kholmogor in the 60s of the XVIII century caused by Empress Catherine II [8]. Geographically close regions of origin of the ancestral populations of Bestuzhev and Red Gorbatov cattle and the similar climatic conditions of their breeding on the banks of the Volga River were depicted by some admixture signals based on the STRUC-TURE analysis and the formation of a common branch on the phylogenetic tree. Genetic closeness of Bestuzhev and Red Gorbatov cattle can reflect the contri-bution of Tyrolean cattle in improvement of both breeds in the XIX century. Most likely, this contribution comes from Tux-Zillertaler cattle, which was widespread in Tyrol due to their unpretentiousness and good productive capacity in poor forage resources. At the agricultural exhibition of 1855 in Tyrol, they were presented as a Tyrolean breed [50]. The export of Tux-Zillertaler cattle to Russia is dated to 1848 [51]. Close localization of Kholmogor and Yaroslavl cat-tle at the MDS plot, the presence of admixture, observed at values of k from 3 to 5 on the results of the STRUCTURE analysis and relatively low values of FST and DN may reflect their common historical origin from the Northern Great Russian cattle [3] and the contribution of Kholmogor cattle in the improvement of Yaroslavl cattle in the XIX and XX centuries [9].
Thus, using the method of genome-wide SNP studies we were able for the first time to study the population structure and genealogical relationships among the five Russian cattle breeds. The received information is the first step towards the evaluation of the value of these breeds regarding their conservation and usage in the agricultural production of the future.
R E F E R E N C E S
1. N o t t e r D.R. The importance of genetic diversity in livestock populations of the future. J.
Anim. Sci., 1999, 77(1): 61-69 (doi: 10.2527/1999.77161x). 2. A j m o n e - M a r s a n P., GLOBALDIV Consortium. A global view of livestock biodiversity
and conservation—GLOBALDIV. Anim. Genet., 2010, 41(s1): 1-5 (doi: 10.1111/j.1365-2052.2010.02036.x).
3. L i s k u n E.F. Russkie otrod'ya krupno-rogatogo skota [Landraces of Russian cattle]. Moscow, 1928 (in Russ.).
4. D i o m i d o v A.M., Z h i r k o v i c h E.F. Razvedenie porod krupnogo rogatogo skota [Cattle breeding]. Moscow-Leningrad, 1934 (in Russ.).
5. A r m f e l ' d A.A. Krupnyi rogatyi skot v usloviyakh russkikh khozyaistv [Cattel breeding in Rus-sia]. St. Petersburg, 1904 (in Russ.).
6. L i s k u n E.F. Kratkie spravochnye svedeniya o zhivotnykh nekotorykh russkikh khozyaistv [Brief view of the animals from some farms of Russia]. Petrograd, 1915 (in Russ.).
797
7. P r i d o r o g i n M.I. Krupnyi rogatyi skot. Vazhneishie porody [Cattle: the most important breeds]. Moscow, 1919 (in Russ.).
8. T o o k e W. View of the Russian empire, during the reign of Catharine the second, and to the close of the eighteens century. The Breeding of Sattle, 1800, 3: 85-129.
9. D m i t r i e v N.I. Porody skota po stranam mira [Cattle breeds — a geography]. Leningrad, 1978 (in Russ.).
10. E r n s t L.K., D m i t r i e v N.G., P a r o n y a n I.A. Geneticheskie resursy sel'skokhozyaistven-nykh zhivotnykh v Rossii i sopredel'nykh stranakh [Genetic diversity of farm animals in Russia and neighboring countries]. St. Petersburg, 1994 (in Russ.).
11. Spravochnik porod i tipov sel'skokhozyaistvennykh zhivotnykh, razvodimykh v Rossiiskoi Federatsii /Pod redaktsiei I.M. Dunina, A.G. Dankverta [Breeds and types of farm animals in the Russian Federation: a directory. I.M. Dunin, A.G. Dankvert (eds.)]. Moscow, 2013 (in Russ.).
12. M u i r W.M., W o n g G.K.-S., Z h a n g Y., W a n g J., G r o e n e n M.A.M., C r o - o i j m a n s d R.P.M.A., M e g e n s d H.-J., Z h a n g e H., O k i m o t o f R., V e r e i j k - e n g A., J u n g e r i u s g A., A l b e r s g G.A.A., L aw l e y C.T., D e l a n y M.E., M a c E a c - h e r n S., C h e n g H.H. Genome-wide assessment of worldwide chicken SNP genetic diversity indicates significant absence of rare alleles in commercial breeds. PNAS USA, 2008, 105(45): 17312-17317 (doi: 10.1073/pnas.0806569105).
13. D o l m a t o v a I.Yu., Z i n o v i e v a N.A., G o r e l o v P.V., I l ’ y a s o v A.D., G l a - d y r E.A., T r a s p o v A.A., S e l ’ t s o v V.I. Characteristics of the allele pool of the Bashkiria population of Simmental cattle using microsatellites. Agricultural Biology, 2011, 6: 70-74 (in Engl.).
14. Y a n g W., K a n g X., Y a n g Q., L i n Y., F a n g M. Review on the development of geno-typing methods for assessing farm animal diversity. Journal of Animal Science and Biotechnology, 2013, 4: 2-6 (doi: 10.1186/2049-1891-4-2).
15. L o f t u s R.T., M a c H u g h D.E., B r a d l e y D.G., S h a r p P.M., C u n n i n g h a m E.P. Evidence for two independent domestications of cattle. PNAS USA, 1994, 91(7): 2757-2761 (doi: 10.1073/pnas.91.7.2757).
16. L o f t u s R.T., M a c H u g h D.E., N g e r e L.O., B a l a i n D.S., B a d i A.M., B r a d - l e y D.G., C u n n i n g h a m E.P. Mitochondrial genetic variation in European, African and Indian cattle populations. Anim. Genet., 1994, 25: 265-271 (doi: 10.1111/j.1365-2052.1994.tb00203.x).
17. B r a d l e y D.G., M a c H u g h D.E., C u n n i n g h a m P., L o f t u s R.T. Mitochondrial di-versity and the origins of African and European cattle. PNAS USA, 1996, 93: 5131-5135 (doi: 10.1073/pnas.93.10.5131).
18. M a c H u g h D.E., S h r i v e r M.D., L o f t u s R.T., C u n n i n g h a m P., B r a d l e y D.G. Microsatellite DNA variation and the evolution, domestication and phylogeography of taurine and zebu cattle (Bos taurus and Bos indicus). Genetics, 1997, 146: 1071-1086.
19. L o f t u s R.T., E r t u g r u l O., H a r b a A.H., E l - B a r o d y M.A.A., M a c H u g h D.E. P a r k S.D.E., B r a d l e y D.G. A microsatellite survey of cattle from a centre of origin: the Near East. Mol. Ecol., 1999, 8: 2015-2022 (doi: 10.1046/j.1365-294x.1999.00805.x).
20. E d w a r d s C.J., B a i r d J.F., M a c H u g h D.E. Taurine and zebu admixture in Near East-ern cattle: a comparison of mitochondrial, autosomal and Y-chromosomal data. Anim. Genet., 2007, 38: 520-524 (doi: 10.1111/j.1365-2052.2007.01638.x).
21. C y m b r o n T., F r e e m a n A.R., I s a b e l M a l h e i r o M., V i g n e J.D., B r a d - l e y D.G. Microsatellite diversity suggests different histories for Mediterranean and Northern European cattle populations. Proceedings of the Royal Society B: Biological Sciences, 2005, 272(1574): 1837-1843 (doi: 10.1098/rspb.2005.3138).
22. G o r e l o v P.V., K o l ’ t s o v D.N., Z i n o v i e v a N.A., G l a d y r ’ E.A. The comparative analysis of blood groups and microsatellites in characteristics of new cattle types of brown Swiss and Sychevskaja breeds. Agricultural Biology, 2011, 6: 37-40 (in Engl.).
23. G l a d y r ' E.A., Z i n o v ' e v a N.A., B a g i r o v V.A., A m i r s h o e v F.S., V o l k o v a V.V., K l e n o v i t s k i i P.M., K a r p o v A.P., E r n s t L.K. Dostizheniya nauki i tekhniki APK, 2012, 8: 58-62 (in Russ.).
24. K i s e l e v a T.Yu., K a n t a n e n J., V o r o b y o v N.I., P o d o b a B.E., T e r l e t s k y V.P. Linkage disequilibrium analysis for microsatellite loci in six cattle breeds. Russian Journal of Ge-netics, 2014, 50(4): 406-414 (doi: 10.1134/S1022795414040048).
25. E l s i k C.G., Bovine Genome Sequencing and Analysis Consortium. The genome sequence of taurine cattle: A window to ruminant biology and evolution. Science, 2009, 324(5926): 522-528 (doi: 10.1126/science.1169588).
26. Z i m i n A.V., D e l c h e r A.L., F l o r e a L., K e l l e y D.R., S c h a t z M.C., P u i u D., H a n r a h a n F., P e r t e a G., V a n T a s s e l l C.P., S o n s t e g a r d T.S., M a r ç a i s G., R o b e r t s M., S u b r a m a n i a n P., Y o r k e J.A., S a l z b e r g S.L. A whole-genome as-sembly of the domestic cow, Bos taurus. Genome Biol., 2009, 10(4): R42 (doi: 10.1186/gb-2009-10-4-r42).
27. D e c k e r J.E., P i r e s J.C., C o n t a n t G.C., M c K a y S.D., H e a t o n M.P., C h e n K.,
798
C o o p e r A., V i l k k i J., S e a b u r y C.M., C a e t a n o A.R., J o h n s o n G.S., B r e n -n e m a n R.A., H a n o t t e O., E g g e r t L.S., W i e n e r P., K i m J.-J., K i m K.S., S o n s t e g a r d T.S., V a n T a s s e l l C.P., N e i b e r g s H.L., M c E w a n J.C., B r a - u n i n g R., C o u t i n h o L.L., B a b a r M.E., W i l s o n G.A., M c C l u r e M.C., R o l f M.M., K i m J.W., S c h n a b e l R.D., T a y l o r J.F. Resolving the evolution of extant and extinct ruminants with high-throughput phylogenomics. PNAS USA, 2009, 106(44): 18644-18649 (doi: 10.1073/pnas.0904691106).
28. K u e h n L.A., K e e l e J.W., B e n n e t t G.L., M c D a n e l d T.G., S m i t h T.P., S n e l -l i n g W.M., S o n s t e g a r d T.S., T h a l l m a n R.M. Predicting breed composition using breed frequencies of 50,000 markers from the US Meat Animal Research Center 2,000 Bull Project. J. Anim. Sci., 2011, 89(6): 1742-1750 (doi: 10.2527/jas.2010-3530).
29. M c T a v i s h E.J., D e c k e r J.E., S c h n a b e l R.D., T a y l o r J.F., H i l l i s D.M. New World cattle show ancestry from multiple independent domestication events. PNAS USA, 2013, 110(15): E1398-E1406 (doi: 10.1073/pnas.1303367110).
30. D e c k e r J.E., M c K a y S.D., R o l f M.M., K i m J., M o l i n a A l c a l á A., S o n s t e -g a r d T.S., H a n o t t e O., G ö t h e r s t r ö m A., S e a b u r y C.M., P r a h a r a n i L., B a b a r M.E., R e g i t a n o L.C.A., Y i l d i z M.A., H e a t o n M.P., W a n - S h e n g L., L e i C.-Z., R e e c y J.M., S a i f - U r - R e h m a n M., S c h n a b e l R.D., T a y l o r J.F. Worldwide patterns of ancestry, divergence, and admixture in domesticated cattle. PLoS Genet-ics, 10(3): e1004254 (doi: 10.1371/journal.pgen.1004254).
31. D e c k e r J.E., T a y l o r J.F., K a n t a n e n J., M i l l b r o o k e A., S c h n a b e l R.D., A l e x a n d e r L.J., M a c N e i l M.D. Origins of cattle on Chirikof Island, Alaska, elucidated from genome-wide SNP genotypes. Heredity, 2016, 116(6): 502-505 (doi: 10.1038/hdy.2016.7).
32. P u r c e l l S., N e a l e B., T o d d - B r o w n K., T h o m a s L., F e r r e i r a M.A.R., B e n d e r D., M a l l e r J., S k l a r P., d e B a k k e r P.I., D a l y M.J., S h a m P.C. PLINK: a tool set for whole-genome association and population-based linkage analyses. Am. J. Hum. Genet., 2007, 81: 559-575 (doi: 10.1086/519795).
33. F a n J.B., O l i p h a n t A., S h e n R., K e r m a n i B.G., G a r c i a F., G u n d e r - s o n K.L., H a n s e n M., S t e e m e r s F., B u t l e r S.L., D e l o u k a s P., G a l v e r L., H u n t S., M c B r i d e C., B i b i k o v a M., R u b a n o T., C h e n J., W i c k h a m E., D o u c e t D., C h a n g W., C a m p b e l l D., Z h a n g B., K r u g l y a k S., B e n t l e y D., H a a s J., R i g a u l t P., Z h o u L., S t u e l p n a g e l J., C h e e M.S. Highly parallel SNP genotyping. Cold Spring Harbor Symposia on Quantitative Biology, 2003, 68: 69-78.
34. K a l i n o w s k i S.T. HP RARE 1.0: a computer program for performing rarefaction on measures of allelic richness. Mol. Ecol. Notes, 2005, 5: 187-189 (doi: 10.1111/j.1471-8286.2004.00845.x).
35. R Development Core Team. R: A language and environment for statistical computing. 2009. R Foundation for statistical computing. Vienna, Austria, 2005 (ISBN 3-900051-07-0). Available http://www.Rproject.org. No date.
36. P r i t c h a r d J.K., S t e p h e n s M., D o n n e l l y P. Inference of population structure using multilocus genotype data. Genetics, 2000, 155(2): 945-959.
37. F e l s e n s t e i n J. PHYLIP (Phylogeny Inference Package) version 3.5c. Distributed by the au-thor. Department of Genetics, University of Washington, Seattle, 1993.
38. FigTree. Available http://tree.bio.ed.ac.uk/software/figtree/. No date. 39. N e i M. Genetic distance between populations. Am. Nat., 1972, 106(949): 283-292. 40. P e m b l e t o n L.W., C o g a n N.O.I., F o r s t e r J.W. StAMPP: an R package for calcula-
tion of genetic differentiation and structure of mixed-ploidy level populations. Mol. Ecol. Re-sour., 2013, 13(5): 946-952 (doi: 10.1111/1755-0998.12129).
41. W e i r B.S., C o c k e r h a m C.C. Estimating F-Statistics for the analysis of population struc-ture. Evolution, 1984, 38(6): 1358-1370 (doi: 10.2307/2408641).
42. E x c o f f i e r L., L i s c h e r H.E.L. Arlequin suite ver 3.5: A new series of programs to per-form population genetics analyses under Linux and Windows. Mol. Ecol. Resour., 2010, 10: 564-567 (doi: 10.1111/j.1755-0998.2010.02847.x).
43. M c V e a n G. A genealogical interpretation of principal components analysis. PLoS Genetics, 2009, 5(10): e1000686 (doi: 10.1371/journal.pgen.1000686).
44. L i s k u n E.F. Otechestvennye porody krupnogo rogatogo skota [Cattle — Domestic breeds]. Moscow, 1949 (in Russ.).
45. The Bovine HapMap Consortium. Genome-wide survey of SNP variation uncovers the genetic structure of cattle breeds. Science, 2009, 324: 528-532 (doi: 10.1126/science.1167936).
46. M a k i n a S.O., M u c h a d e y i F.C., M a r l e - K ö s t e r E., M a c N e i l M.D., M a i -w a s h e A. Genetic diversity and population structure among six cattle breeds in South Africa using a whole genome SNP panel. Frontiers in Genetics, 2014, 5: 333 (doi: 10.3389/fgene.2014.00333).
47. Lab i no v V.V. Rezul'taty i osnovnye napravleniya sovershenstvovaniya selektsionno-plemennoi raboty v molochnom skotovodstve Rossiiskoi Federatsii. Ministerstvo sel'skogo khozyaistva RF [The achievements and improvement of cattle breeding in the Russian Federation. Ministry of Agriculture of the Russian Federation. Available http://www.mcx.ru/documents/file_document/v7_show/33370.133.htm. Ac-

799
cessed May 28, 2016. 48. G ro e n e v e l d L.F., L e n s t r a J.A., E d i n g H., T o r o M.A., S c h e r f B., P i l l i n g D.,
N e g r i n i R., F i n l a y E.K., J i a n l i n H., G r o e n e v e l d E., We i g e n d S., The GLO- BALDIV Consortium. Genetic diversity in farm animals — a review. Anim. Genet., 2010, 41: 6-31 (doi: 10.1111/j.1365-2052.2010.02038.x).
49. K a t m a k o v P.S., G a v r i l e n k o V.P., B u s h o v A.V., S t e n ' k i n N.I. Vestnik Ul'yanovskoi GSKHA, 2014, 1(25): 126-132 (in Russ.).
50. M o s e r C., R e i t e r M. Die Rinderrasse der Tux-Zillertaler — Ein Stück Tiroler Kultur. Verlag Edition Tirol, Reith im Alpbachtal, 1996.
51. Tux Zillertaler. Available http://en.zar.at/Cattle_breeding_in_Austria/Cattle_breeds/Additio-nal_Breeds/Tux_Zillertaler.html. No date.
801
AGRICULTURAL BIOLOGY, ISSN 2412-0324 (English ed. Online)
2016, V. 51, ¹ 6, pp. 801-810 (SEL’SKOKHOZYAISTVENNAYA BIOLOGIYA) ISSN 0131-6397 (Russian ed. Print)
ISSN 2313-4836 (Russian ed. Online) UDC 636.32/.38:575.174.015.3:577.2.08:51-76 doi: 10.15389/agrobiology.2016.6.801rus
doi: 10.15389/agrobiology.2016.6.801eng VARIABILITY OF MICROSATELLITES IN SHEEP BREEDS
RACED IN RUSSIA
T.E. DENISKOVA1, M.I. SELIONOVA2, E.A. GLADYR’1, A.V. DOTSEV1, G.T. BOBRYSHOVA2, O.V. KOSTYUNINA1, G. BREM3, N.A. ZINOVIEVA1
1L.K. Ernst All-Russian Research Institute of Animal Husbandry, Federal Agency of Scientific Organizations, pos. Dubrovitsy, Podolsk District, Moscow Province, 142132 Russia, e-mail [email protected]; 2All-Russian Research Institute of Sheep and Goat Breeding, Federal Agency of Scientific Organizations, 15, per. Zo-otechnicheskii, Stavropol, 355017 Russia; 3Institut für Tierzucht und Genetik, University of Veterinary Medicine (VMU), Veterinärplatz, A-1210, Vienna, Aus-tria, e-mail [email protected] Acknowledgements: We thank Dr R.V. Ivanov (Yakut Research Institute of Agriculture) for assistance in collecting samples Supported by Russian Science Foundation (project ¹ 14-36-00039) Received September 26, 2016
A b s t r a c t
At the current stage of biological development is impossible to establish conservation pro-grams and to monitor genetic resources of sheep without a preliminary study by DNA markers. The Russian sheep breeding is represented by wide variety of breeds, including all productivity and wool types. However, until recently only some sheep breeds, which belong to the same breeding zone or productivity type, were investigated by DNA markers including microsatellites. We studied 25 Rus-sian sheep breeds (n = 751), including fine-fleeced — Dagestan Mountain (DAG), Grozny (GRZ), Kulunda (KUL), Manych Merino (MNM), Salskaya (SAL), Stavropol (STA), Soviet Merino (SVM), Volgograd (VOL), Baikal’s fine-fleeced (ZBL); semi fine-fleeced — Altay Mountain (ALT), Kuibyshev (KUI), North Caucasian (NC), Russian long-haired (RLH), Tsigai (TSIG); coarse-wooled — Andean (AND), Buubey (BUB), Edilbai (EDL), Karachaev (KAR), Kuchugur (KCH), Kalmyk (KLM), Karakul (KRK), Lezgin (LEZ), Romanov (ROM), Tushin (TSH), Tuvan short fat-tailed (TUV). The research was conducted using 11 microsatellite loci (OarCP49, INRA063, HSC, OarAE129, MAF214, OarFCB11, INRA005, SPS113, INRA23, MAF65 и McM527). The da-ta were processed using GenAIEx 6.5 and PAST software. In general, the studied breeds were char-acterized by moderately high allelic diversity. The average number of alleles per locus is varied from 7.20±0.98 in KUL and 10.30±0.99 in TSIG. The values of Na≥10.0 were found in TSIG, TUV, BUB and KRK, values of Na≤8.0 were identified in KUL, RLH and SVM. The effective allele num-ber was the highest in the KRK and TUV (Ne≥5.7) and the minimum was detected in KCH, ALT, RLH and NC (Ne≤4.3). The level of the observed heterozygosity in 21 of the 25 studied breeds ranged from 0.489±0.095 in TUV to 0.651±0.050 in ROM and 0.651±0.060 in SVM, and four other breeds (BUB, TSIG, ZBL and TUV) it varied from 0.798±0.023 in BUB up 0.977±0.017 in TUV. There was a substantial deficit of heterozygotes in 21 of the 25 studied breeds (FIS values ranged from 0.13 in ROM to 0.36 in KAR and SAL), in the other four (BUB, TSIG, ZBL and TUV) an excess of heterozygotes (FIS values ranged from 0.04 to 0.22) was detected. The analysis of molec-ular variance (AMOVA) showed that 5.02 % of genetic variation is composed of differences among breeds and 94.98 % is explained by within breeds’ component. Analysis of the structure of the UMPGA phylogenetic tree, based on the matrix of pairwise genetic distances by M. Nei (1972), showed that the nature of the identified relationships is mainly related with the wool type, productiv-ity type and breeding region. Thus, the identified polymorphism of eleven microsatellite loci is quite powerful for differentiating sheep of various breeds. For a better understanding population structure and obtaining new information on the genetic diversity at the genomic level the application of DNA microarrays, based on the multiple SNPs-markers, is required.
Keywords: sheep breeds, microsatellites, genetic diversity
Thanks to advancing DNA-based technology, various genetic markers have been detected and applied, including microsatellites, which became an im-portant source of information about the current status of animal genetic re-sources [1, 2]. Choosing microsatellites as genetic markers is determined by their
802
unique features, such as the widespread and uniform distribution in the genome, allelic diversity, great informative value, codominant Mendelian-type inher-itance, high reproducibility, and ease of analysis automation [3-5]. In the global and domestic practice of sheep rearing, microsatellite analysis is used to assess the genetic diversity of breeds and study phylogenetic relationships between them [6-8], proof of origin [9] and pedigree of animals [10], to investigate the popula-tion structure and genetic drift [11, 12], and establish the level of inbreeding in specific groups and herds [13].
Currently, high-performance genotyping methods are increasingly used, such as genome-wide SNP (single nucleotide polymorphism), scanning using DNA microarrays with different densities [14-17] and genotyping-by-sequencing (GBS) [18]. Despite this, microsatellites remain relevant as highly informative DNA markers in conducting population genetic studies [5]. A microsatellite-based analysis is still an indispensable tool for the routine animal testing on the origin authenticity and the breed. This is primarily due to the fact that the pan-els for origin diagnostics based on highly informative SNP markers are rather expensive, and blood groups are much inferior to the microsatellites in the test-ing accuracy [19].
In Russia, there are 37 sheep breeds, including 13 fine-fleeced, 10 semi-fine-fleeced, 12 coarse-wool and 2 medium-wool breeds [20]. They are also rep-resented by all known types based on productivity (wool, mutton-wool, wool and meat, fur, fat-tailed, mutton-wool and dairy, hair and meat). This diversity is due to the peculiarities of climate, feed and social factors in the regions where the breeds were developed.
In recent years, genetic studies have been performed on some Russian breeds of sheep using the microsatellite markers [21-23]. Within the framework of the genetic diversity study program and the establishment of the population structure of sheep breeds in North Eurasia, the Russian breeds were compared with breeds from Norway, Denmark, Sweden and Estonia [24]. For the genetic classification of semifine-fleeced breeds, the Kuibyshev, Russian long-haired and North Caucasian mutton-wool sheep breeds were involved [25]. However, until now genetic studies of sheep based on the microsatellite markers in Russia have involved only several breed groups, combined by the productivity type or a breeding region.
In this paper, we first studied and compared 25 Russian sheep breeds representing all known types by their microsatellite markers. In general, poly-morphism in 11 microsatellite loci was quite informative for the interbreed dif-ferentiation. Our findings most completely reflect the state of the allele pool and genetic diversity of most of the major sheep breeds, commonly spread in Russia.
The purpose of the research was the study of variability of microsatel-lites, the assessment of diversity and degree of genetic differentiation among dif-ferent sheep breeds, raised in Russia.
Technique. Tissue samples were taken from sheep of 25 Russian breeds, such as fine-fleece, semifine-fleece, coarse-wool, with different types of meat, wool and dairy productivity (n = 751).
To isolate the DNA the Nexttec columns (Nexttec Biotechnologie GmbH, Germany) were used, as well as the DNA Extran test kit (CJSC Syntol, Russia) and the extraction method using sodium perchlorate [26]. For the genet-ic research, we selected 11 microsatellite loci grouped into two multiplex panels including the following loci: OarCP49, INRA063, HSC, OarAE129, MAF214, OarFCB11, INRA005, and SPS113, INRA23, MAF65 and McM527 loci. The reactions were performed in a final volume of 10 l in the PCR buffer contain-ing 2 mM dNTPs, 1.0 mM of MgCl2, 0.5 mM of the primer mixture, 1 unit of
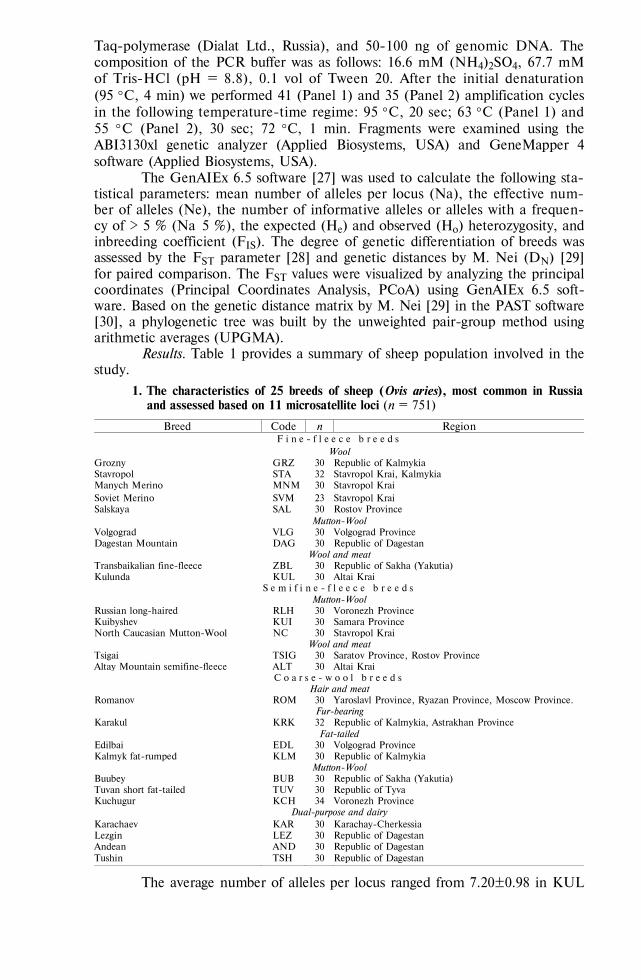
803
Taq-polymerase (Dialat Ltd., Russia), and 50-100 ng of genomic DNA. The composition of the PCR buffer was as follows: 16.6 mМ (NH4)2SO4, 67.7 mМ of Tris-НСl (рН = 8.8), 0.1 vol of Tween 20. After the initial denaturation (95 С, 4 min) we performed 41 (Panel 1) and 35 (Panel 2) amplification cycles in the following temperature-time regime: 95 С, 20 sec; 63 С (Panel 1) and 55 С (Panel 2), 30 sec; 72 С, 1 min. Fragments were examined using the ABI3130xl genetic analyzer (Applied Biosystems, USA) and GeneMapper 4 software (Applied Biosystems, USA).
The GenAIEx 6.5 software [27] was used to calculate the following sta-tistical parameters: mean number of alleles per locus (Na), the effective num-ber of alleles (Ne), the number of informative alleles or alleles with a frequen-cy of > 5 % (Na≥5 %), the expected (He) and observed (Ho) heterozygosity, and inbreeding coefficient (FIS). The degree of genetic differentiation of breeds was assessed by the FST parameter [28] and genetic distances by M. Nei (DN) [29] for paired comparison. The FST values were visualized by analyzing the principal coordinates (Principal Coordinates Analysis, PCoA) using GenAIEx 6.5 soft-ware. Based on the genetic distance matrix by M. Nei [29] in the PAST software [30], a phylogenetic tree was built by the unweighted pair-group method using arithmetic averages (UPGMA).
Results. Table 1 provides a summary of sheep population involved in the study.
1. The characteristics of 25 breeds of sheep (Ovis aries), most common in Russia and assessed based on 11 microsatellite loci (n = 751)
Breed Code n Region F i n e - f l e e c e b r e e d s
Wool Grozny GRZ 30 Republic of Kalmykia Stavropol STA 32 Stavropol Krai, Kalmykia Manych Merino MNM 30 Stavropol Krai Soviet Merino SVM 23 Stavropol Krai Salskaya SAL 30 Rostov Province
Mutton-Wool Volgograd VLG 30 Volgograd Province Dagestan Mountain DAG 30 Republic of Dagestan
Wool and meat Transbaikalian fine-fleece ZBL 30 Republic of Sakha (Yakutia) Kulunda KUL 30 Altai Krai
S e m i f i n e - f l e e c e b r e e d s Mutton-Wool
Russian long-haired RLH 30 Voronezh Province Kuibyshev KUI 30 Samara Province North Caucasian Mutton-Wool NC 30 Stavropol Krai
Wool and meat Tsigai TSIG 30 Saratov Province, Rostov Province Altay Mountain semifine-fleece ALT 30 Altai Krai
C o a r s e - w o o l b r e e d s Hair and meat
Romanov ROM 30 Yaroslavl Province, Ryazan Province, Moscow Province. Fur-bearing
Karakul KRK 32 Republic of Kalmykia, Astrakhan Province Fat-tailed
Edilbai EDL 30 Volgograd Province Kalmyk fat-rumped KLM 30 Republic of Kalmykia
Mutton-Wool Buubey BUB 30 Republic of Sakha (Yakutia) Tuvan short fat-tailed TUV 30 Republic of Tyva Kuchugur KCH 34 Voronezh Province
Dual-purpose and dairy Karachaev KAR 30 Karachay-Cherkessia Lezgin LEZ 30 Republic of Dagestan Andean AND 30 Republic of Dagestan Tushin TSH 30 Republic of Dagestan
The average number of alleles per locus ranged from 7.20±0.98 in KUL
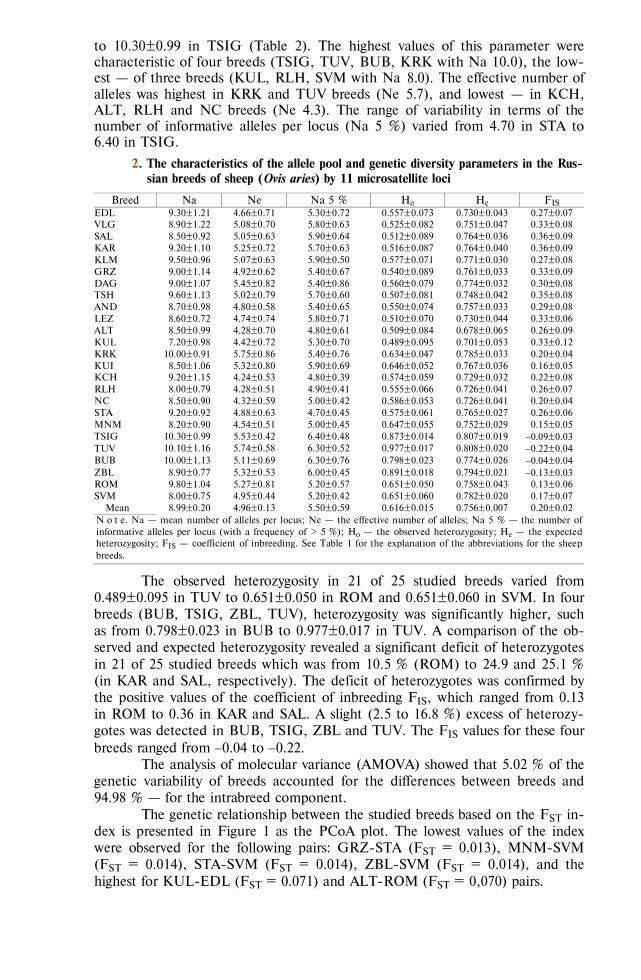
804
to 10.30±0.99 in TSIG (Table 2). The highest values of this parameter were characteristic of four breeds (TSIG, TUV, BUB, KRK with Na 10.0), the low-est — of three breeds (KUL, RLH, SVM with Na≤8.0). The effective number of alleles was highest in KRK and TUV breeds (Ne≥5.7), and lowest — in KCH, ALT, RLH and NC breeds (Ne≤4.3). The range of variability in terms of the number of informative alleles per locus (Na 5 %) varied from 4.70 in STA to 6.40 in TSIG.
2. The characteristics of the allele pool and genetic diversity parameters in the Rus-sian breeds of sheep (Ovis aries) by 11 microsatellite loci
Breed Na Ne Na 5 % Ho He FIS EDL 9.30±1.21 4.66±0.71 5.30±0.72 0.557±0.073 0.730±0.043 0.27±0.07 VLG 8.90±1.22 5.08±0.70 5.80±0.63 0.525±0.082 0.751±0.047 0.33±0.08 SAL 8.50±0.92 5.05±0.63 5.90±0.64 0.512±0.089 0.764±0.036 0.36±0.09 KAR 9.20±1.10 5.25±0.72 5.70±0.63 0.516±0.087 0.764±0.040 0.36±0.09 KLM 9.50±0.96 5.07±0.63 5.90±0.50 0.577±0.071 0.771±0.030 0.27±0.08 GRZ 9.00±1.14 4.92±0.62 5.40±0.67 0.540±0.089 0.761±0.033 0.33±0.09 DAG 9.00±1.07 5.45±0.82 5.40±0.86 0.560±0.079 0.774±0.032 0.30±0.08 TSH 9.60±1.13 5.02±0.79 5.70±0.60 0.507±0.081 0.748±0.042 0.35±0.08 AND 8.70±0.98 4.80±0.58 5.40±0.65 0.550±0.074 0.757±0.033 0.29±0.08 LEZ 8.60±0.72 4.74±0.74 5.80±0.71 0.510±0.070 0.730±0.044 0.33±0.06 ALT 8.50±0.99 4.28±0.70 4.80±0.61 0.509±0.084 0.678±0.065 0.26±0.09 KUL 7.20±0.98 4.42±0.72 5.30±0.70 0.489±0.095 0.701±0.053 0.33±0.12 KRK 10.00±0.91 5.75±0.86 5.40±0.76 0.634±0.047 0.785±0.033 0.20±0.04 KUI 8.50±1.06 5.32±0.80 5.90±0.69 0.646±0.052 0.767±0.036 0.16±0.05 KCH 9.20±1.15 4.24±0.53 4.80±0.39 0.574±0.059 0.729±0.032 0.22±0.08 RLH 8.00±0.79 4.28±0.51 4.90±0.41 0.555±0.066 0.726±0.041 0.26±0.07 NC 8.50±0.90 4.32±0.59 5.00±0.42 0.586±0.053 0.726±0.041 0.20±0.04 STA 9.20±0.92 4.88±0.63 4.70±0.45 0.575±0.061 0.765±0.027 0.26±0.06 MNM 8.20±0.90 4.54±0.51 5.00±0.45 0.647±0.055 0.752±0.029 0.15±0.05 TSIG 10.30±0.99 5.53±0.42 6.40±0.48 0.873±0.014 0.807±0.019 0.09±0.03 TUV 10.10±1.16 5.74±0.58 6.30±0.52 0.977±0.017 0.808±0.020 0.22±0.04 BUB 10.00±1.13 5.11±0.69 6.30±0.76 0.798±0.023 0.774±0.026 0.04±0.04 ZBL 8.90±0.77 5.32±0.53 6.00±0.45 0.891±0.018 0.794±0.021 0.13±0.03 ROM 9.80±1.04 5.27±0.81 5.20±0.57 0.651±0.050 0.758±0.043 0.13±0.06 SVM 8.00±0.75 4.95±0.44 5.20±0.42 0.651±0.060 0.782±0.020 0.17±0.07
Mean 8.99±0.20 4.96±0.13 5.50±0.59 0.616±0.015 0.756±0.007 0.20±0.02 N o t e. Na — mean number of alleles per locus; Ne — the effective number of alleles; Na 5 % — the number of informative alleles per locus (with a frequency of > 5 %); Ho — the observed heterozygosity; He — the expected heterozygosity; FIS — coefficient of inbreeding. See Table 1 for the explanation of the abbreviations for the sheep breeds.
The observed heterozygosity in 21 of 25 studied breeds varied from 0.489±0.095 in TUV to 0.651±0.050 in ROM and 0.651±0.060 in SVM. In four breeds (BUB, TSIG, ZBL, TUV), heterozygosity was significantly higher, such as from 0.798±0.023 in BUB to 0.977±0.017 in TUV. A comparison of the ob-served and expected heterozygosity revealed a significant deficit of heterozygotes in 21 of 25 studied breeds which was from 10.5 % (ROM) to 24.9 and 25.1 % (in KAR and SAL, respectively). The deficit of heterozygotes was confirmed by the positive values of the coefficient of inbreeding FIS, which ranged from 0.13 in ROM to 0.36 in KAR and SAL. A slight (2.5 to 16.8 %) excess of heterozy-gotes was detected in BUB, TSIG, ZBL and TUV. The FIS values for these four breeds ranged from 0.04 to 0.22.
The analysis of molecular variance (AMOVA) showed that 5.02 % of the genetic variability of breeds accounted for the differences between breeds and 94.98 % — for the intrabreed component.
The genetic relationship between the studied breeds based on the FST in-dex is presented in Figure 1 as the PCoA plot. The lowest values of the index were observed for the following pairs: GRZ-STA (FST = 0.013), MNM-SVM (FST = 0.014), STA-SVM (FST = 0.014), ZBL-SVM (FST = 0.014), and the highest for KUL-EDL (FST = 0.071) and ALT-ROM (FST = 0,070) pairs.
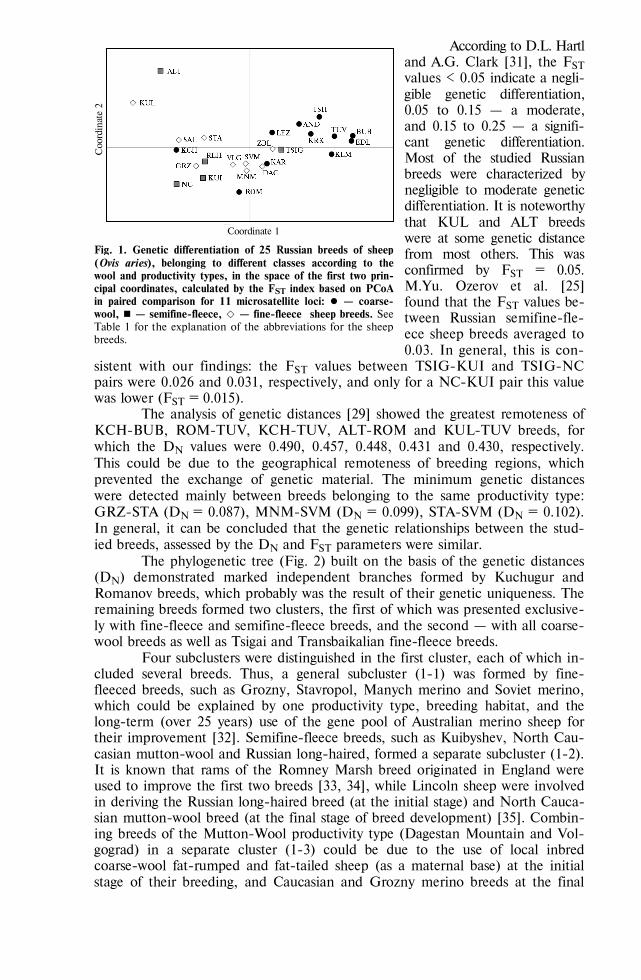
805
According to D.L. Hartl and A.G. Clark [31], the FST values < 0.05 indicate a negli-gible genetic differentiation, 0.05 to 0.15 — a moderate, and 0.15 to 0.25 — a signifi-cant genetic differentiation. Most of the studied Russian breeds were characterized by negligible to moderate genetic differentiation. It is noteworthy that KUL and ALT breeds were at some genetic distance from most others. This was confirmed by FST = 0.05. M.Yu. Ozerov et al. [25] found that the FST values be-tween Russian semifine-fle-ece sheep breeds averaged to 0.03. In general, this is con-
sistent with our findings: the FST values between TSIG-KUI and TSIG-NC pairs were 0.026 and 0.031, respectively, and only for a NC-KUI pair this value was lower (FST = 0.015).
The analysis of genetic distances [29] showed the greatest remoteness of KCH-BUB, ROM-TUV, KCH-TUV, ALT-ROM and KUL-TUV breeds, for which the DN values were 0.490, 0.457, 0.448, 0.431 and 0.430, respectively. This could be due to the geographical remoteness of breeding regions, which prevented the exchange of genetic material. The minimum genetic distances were detected mainly between breeds belonging to the same productivity type: GRZ-STA (DN = 0.087), MNM-SVM (DN = 0.099), STA-SVM (DN = 0.102). In general, it can be concluded that the genetic relationships between the stud-ied breeds, assessed by the DN and FST parameters were similar.
The phylogenetic tree (Fig. 2) built on the basis of the genetic distances (DN) demonstrated marked independent branches formed by Kuchugur and Romanov breeds, which probably was the result of their genetic uniqueness. The remaining breeds formed two clusters, the first of which was presented exclusive-ly with fine-fleece and semifine-fleece breeds, and the second — with all coarse-wool breeds as well as Tsigai and Transbaikalian fine-fleece breeds.
Four subclusters were distinguished in the first cluster, each of which in-cluded several breeds. Thus, a general subcluster (1-1) was formed by fine-fleeced breeds, such as Grozny, Stavropol, Manych merino and Soviet merino, which could be explained by one productivity type, breeding habitat, and the long-term (over 25 years) use of the gene pool of Australian merino sheep for their improvement [32]. Semifine-fleece breeds, such as Kuibyshev, North Cau-casian mutton-wool and Russian long-haired, formed a separate subcluster (1-2). It is known that rams of the Romney Marsh breed originated in England were used to improve the first two breeds [33, 34], while Lincoln sheep were involved in deriving the Russian long-haired breed (at the initial stage) and North Cauca-sian mutton-wool breed (at the final stage of breed development) [35]. Combin-ing breeds of the Mutton-Wool productivity type (Dagestan Mountain and Vol-gograd) in a separate cluster (1-3) could be due to the use of local inbred coarse-wool fat-rumped and fat-tailed sheep (as a maternal base) at the initial stage of their breeding, and Caucasian and Grozny merino breeds at the final
Fig. 1. Genetic differentiation of 25 Russian breeds of sheep (Ovis aries), belonging to different classes according to the wool and productivity types, in the space of the first two prin-cipal coordinates, calculated by the FST index based on PCoA in paired comparison for 11 microsatellite loci: — coarse-wool, — semifine-fleece, — fine-fleece sheep breeds. See Table 1 for the explanation of the abbreviations for the sheep breeds.
Coordinate 1 Coordinate 1
Coo
rdin
ate
2
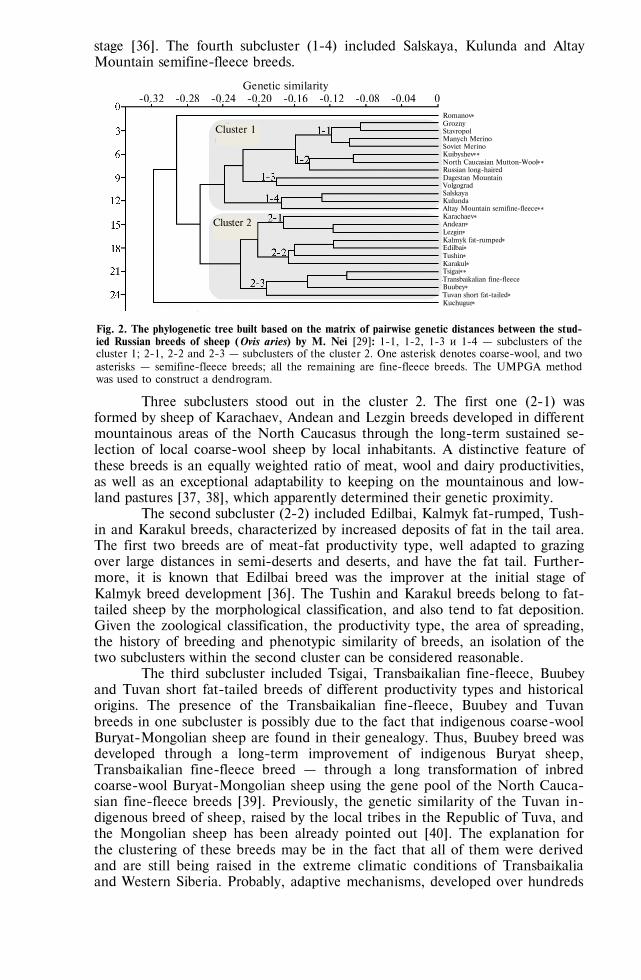
806
stage [36]. The fourth subcluster (1-4) included Salskaya, Kulunda and Altay Mountain semifine-fleece breeds.
Fig. 2. The phylogenetic tree built based on the matrix of pairwise genetic distances between the stud-ied Russian breeds of sheep (Ovis aries) by M. Nei [29]: 1-1, 1-2, 1-3 и 1-4 — subclusters of the cluster 1; 2-1, 2-2 and 2-3 — subclusters of the cluster 2. One asterisk denotes coarse-wool, and two asterisks — semifine-fleece breeds; all the remaining are fine-fleece breeds. The UMPGA method was used to construct a dendrogram.
Three subclusters stood out in the cluster 2. The first one (2-1) was formed by sheep of Karachaev, Andean and Lezgin breeds developed in different mountainous areas of the North Caucasus through the long-term sustained se-lection of local coarse-wool sheep by local inhabitants. A distinctive feature of these breeds is an equally weighted ratio of meat, wool and dairy productivities, as well as an exceptional adaptability to keeping on the mountainous and low-land pastures [37, 38], which apparently determined their genetic proximity.
The second subcluster (2-2) included Edilbai, Kalmyk fat-rumped, Tush-in and Karakul breeds, characterized by increased deposits of fat in the tail area. The first two breeds are of meat-fat productivity type, well adapted to grazing over large distances in semi-deserts and deserts, and have the fat tail. Further-more, it is known that Edilbai breed was the improver at the initial stage of Kalmyk breed development [36]. The Tushin and Karakul breeds belong to fat-tailed sheep by the morphological classification, and also tend to fat deposition. Given the zoological classification, the productivity type, the area of spreading, the history of breeding and phenotypic similarity of breeds, an isolation of the two subclusters within the second cluster can be considered reasonable.
The third subcluster included Tsigai, Transbaikalian fine-fleece, Buubey and Tuvan short fat-tailed breeds of different productivity types and historical origins. The presence of the Transbaikalian fine-fleece, Buubey and Tuvan breeds in one subcluster is possibly due to the fact that indigenous coarse-wool Buryat-Mongolian sheep are found in their genealogy. Thus, Buubey breed was developed through a long-term improvement of indigenous Buryat sheep, Transbaikalian fine-fleece breed — through a long transformation of inbred coarse-wool Buryat-Mongolian sheep using the gene pool of the North Cauca-sian fine-fleece breeds [39]. Previously, the genetic similarity of the Tuvan in-digenous breed of sheep, raised by the local tribes in the Republic of Tuva, and the Mongolian sheep has been already pointed out [40]. The explanation for the clustering of these breeds may be in the fact that all of them were derived and are still being raised in the extreme climatic conditions of Transbaikalia and Western Siberia. Probably, adaptive mechanisms, developed over hundreds
Genetic similarity -0.32 -0.28 -0.24 -0.20 -0.16 -0.12 -0.08 -0.04 0
Cluster 1
Cluster 2
Romanov Grozny Stavropol Manych Merino Soviet Merino Kuibyshev North Caucasian Mutton-Wool Russian long-haired Dagestan Mountain Volgograd Salskaya Kulunda Altay Mountain semifine-fleece Karachaev Andean Lezgin Kalmyk fat-rumped Edilbai Tushin Karakul Tsigai Transbaikalian fine-fleece Buubey Tuvan short fat-tailed Kuchugur
807
of years, affected many loci, including microsatellite ones, and led to the simi-larity of the genetic profile. However, this assumption requires further investi-gation and validation.
Therefore, our findings give the most complete presentation of the state of the allele pool and genetic diversity of the majority of sheep breeds, the most commonly spread in Russia. In general, polymorphism in 11 microsatellite loci was quite informative for the differentiation sheep belonging to different breeds, while the nature of the identified relationships were mainly due to the wool type, productivity type and a breeding region. For a more profound research of the population structure and additional information on the genetic diversity at the genomic level, the investigation of Russian sheep breeds is anticipated with the application of DNA microarrays based on the multiple SNP markers.
R E F E R E N C E S
1. C r i s p i m B., S e n o L., E g i t o A., V a r g a s J u n i o r F., G r i s o l i a A. Application of
microsatellite markers for breeding and genetic conservation of herds of Pantaneiro sheep. Elec-tronic Journal of Biotechnology, 2014, 17: 317-321 (doi: 10.1016/j.ejbt.2014.09.007).
2. S t o l p o v s k i i Yu.A. Concept and principles of genetic monitoring for the purpose of preser-vation in situ of domestic animals kinds. Agricultural Biology, 2010, 6: 3-8. Available http://www.agrobiology.ru/6-2010stolpovskiy-eng.html. No date (in Engl.).
3. T a u t z D., R e n z M. Simple sequences are ubiquitous repetitive components of eukaryotic genomes. Nucl. Acids Res., 1984, 12: 4127-4138.
4. L i t t M., L u t y J.M. A hypervariable microsatellite revealed by in vitro amplification of a dinu-cleotide repeat within the cardiac muscle actin gene. Am. J. Hum. Genet., 1989, 44: 397-401.
5. P u t m a n A.I., C a r b o n e I. Challenges in analysis and interpretation of microsatellite data for population genetic studies. Ecology and Evolution, 2014, 4(22): 4399-4428 (doi: 10.1002/ece3.1305).
6. D a l v i t C., S a c c a E., C a s s a n d r o M., G e r v a s o M., P a s t o r e E., P i a s e n t i - e r E. Genetic diversity and variability in Alpine sheep breeds. Small Ruminant Res., 2008, 80: 45-51 (doi: 10.1016/j.smallrumres.2008.09.005).
7. K u s z a S., D i m o v D., N a g y I., B õ s z e Z., J á v o r A., K u k o v i c s S. Microsatellite analysis to estimate genetic relationships among five bulgarian sheep breeds. Genet. Mol. Biol., 2010, 33(1): 51-56 (doi: 10.1590/S1415-47572010005000003).
8. F e r r a n d o A., G o y a c h e F., P a r é s P.-M., C a r r i ó n C., M i r ó J., J o r d a n a J. Genetic relationships between six eastern Pyrenean sheep breeds assessed using microsatellites. Span-ish Journal of Agricultural Research, 2014, 12(4): 1029-1037 (doi: 10.5424/sjar/2014124-6173).
9. Y i l m a z O. Power of different microsatellite panels for paternity analysis in sheep. Animal Science Papers and Reports, 2016, 34(2): 155-164.
10. B a u m u n g R., C u b r i c - C u r i k V., S c h w e n d K., A c h m a n n R., S ö l k n e r J. Genetic characterization and breed assignment in Austrian sheep breeds using microsatel-lite marker information. J. Anim. Breed. Genet., 2006, 123: 265-271 (doi: 10.1111/j.1439-0388.2006.00583.x).
11. T a p i o I., T a p i o M., G r i s l i s Z., H o l m L-E., J e p p s s o n S., K a n t a n e n J., M i c e i k i e n e I., O l s a k e r I., V i i n a l a s s H., E y t h o r s d o t t i r E. Unfolding of pop-ulation structure in Baltic sheep breeds using microsatellite analysis. Heredity, 2005, 94: 448-456 (doi: 10.1038/sj.hdy.6800640).
12. N e u b a u e r V., V o g l C., S e r e g i J., S á f á r L., B r e m G. Genetic diversity and popu-lation structure of Zackel sheep and other Hungarian sheep breeds. Archives Animal Breeding, 2015, 58: 343-350 (doi: 10.5194/aab-58-343-2015).
13. P a r i s e t L., S a v a r e s e M.C., C a p p u c c i o I., V a l e n t i n i A. Use of microsatellites for genetic variation and inbreeding analysis in Sarda sheep flocks of central Italy. J. Anim. Breed. Genet., 2003, 120(6): 425-432 (doi: 10.1046/j.0931-2668.2003.00411.x).
14. K i j a s J.W., L e n s t r a J.A., H a y e s B., B o i t a r d S., P o r t o N e t o L.R., S a n C r i s t o b a l M., S e r v i n B., M c C u l l o c h R., W h a n V., G i e t z e n K., P a i v a S., B a r e n d s e W., C i a n i E., R a a d s m a H., M c E w a n J., D a l r y m p l e B. Genome wide analysis of the world’s sheep breeds reveals high levels of historic mixture and strong re-cent selection. PLoS ONE, 2012, 10: e1001258 (doi: 10.1371/journal.pbio.1001258).
15. H e a t o n M.P., L e y m a s t e r K.A., K a l b f l e i s c h T.S., K i j a s J.W., C l a r k e S.M., M cE w a n J., M addo x J.F., B a s nay ak e V., P e t r i k D.T., S imp s on B., S m i t h T.P.L., C h i t k o -M c K o w n C.G., the International Sheep Genomics Consortium. SNPs for parent-age testing and traceability in globally diverse breeds of sheep. PLoS ONE, 2014, 9(4): e94851
808
(doi: 10.1371/journal.pone.0094851). 16. C l a r k e S.M., H e n r y H.M., D o d d s K.G., J o w e t t T.W.D., M a n l e y T.R., A n -
d e r s o n R.M., M c E w a n J.C. A high throughput single nucleotide polymorphism multiplex assay for parentage assignment in New Zealand sheep. PLoS ONE, 2014, 9(4): e93392 (doi: 10.1371/journal.pone.0093392).
17. D e n i s k o v a T.E., S e r m y a g i n A.A., B a g i r o v V.A., O k h l o p k o v I.M., G l a d - y r E.A., I v a n o v R.V., B r e m G., Z i n o v i e v a N.A. Comparative analysis of the effec-tiveness of STR and SNP markers for intraspecific and interspecific differentiation of the genus Ovis. Russian Journal of Genetics, 2016, 52(1): 79-84 (doi: 10.1134/S1022795416010026).
18. E l s h i r e R.J., G l a u b i t z J.C., S u n Q., P o l a n d J.A., K a w a m o t o K., B u c k - l e r E.S., M i t c h e l l S.E. A Robust, simple genotyping-by-sequencing (GBS) approach for high diversity species. PLoS ONE, 2011, 6(5): e19379 (doi: 10.1371/journal.pone.0019379).
19. E r n s t L.K., Z i n o v ' e v a N.A. Biologicheskie problemy zhivotnovodstva v XXI veke [Biolog-ical aspects of animal husbandry in the XXI century]. Moscow, 2008 (in Russ.).
20. A m e r k h a n o v Kh.A. Ovtsevodstvo i kozovodstvo Rossiiskoi Federatsii v tsifrakh [Goats and sheep breeding in Russia: statistics]. Stavropol', 2015 (in Russ.).
21. G l a d y r ' E.A., Z i n o v ' e v a N.A., B u r y l o v a S.S., S e l i o n o v a M.I., M o i s e i -k i n a L.G., E r n s t L.K., B r e m G. Dostizheniya nauki i tekhniki APK, 2012, 11: 34-37 (in Russ.).
22. Z i n o v i e v a N.A., S e l i o n o v a M.I., G l a d y r E.A., P e t r o v i c M.P., C a r o P e -t r o v i c V., R u z i c M u s l i c D., P e t r o v i c M.M. Investigation of gene pool and genea-logical links between sheep breeds of southern Russia by blood groups and DNA microsatel-lites. Genetika, 2015, 47(2): 395-404 (doi: 10.2298/GENSR1502395Z).
23. D e n i s k o v a T.E., K a n e v a L.A., G l a d y r ' E.A., S e l i o n o v a M.I., Z i n o v ' e v a N.A. Dostizheniya nauki i tekhniki APK, 2016, 30(8): 75-78 (in Russ.).
24. T a p i o M., O z e r o v M., T a p i o I., K a n t a n e n J., T o r o M.A., M a r z a n o v N., Ć i n k u l o v M., G o n c h a r e n k o G., K i s e l y o v a T., M u r a w s k i M. Microsatellite-based genetic diversity and population structure of domestic sheep in northern Eurasia. BMC Genetics, 2010, 11: 76 (doi: 10.1186/1471-2156-11-76).
25. O z e r o v M.Yu., T a p i o M., K a n t a n e n Yu., M a r z a n o v a S.N., B u z e r o v V.V., A n d r y u k h i n A.P., S h a r l a p a e v B.N., P e t r o v S.N., M a r z a n o v N.S. Problemy biologii produktivnykh zhivotnykh, 2013, 3: 16-24 (in Russ.).
26. Z i n o v ' e v a N.A., P o p o v A.N., E r n s t L.K., M a r z a n o v N.S., B o c h k a - r e v V.V., S t r e k o z o v N.I., B r e m G. Metodicheskie rekomendatsii po ispol'zovaniyu metoda polimeraznoi tsepnoi reaktsii v zhivotnovodstve [PCR analysis in animal husbandry — guidelines]. Dubrovitsy, 1998 (in Russ.).
27. P e a k a l l R., S m o u s e P.E. GenAlEx 6.5: genetic analysis in Excel. Population genetic software for teaching and research-an update. Bioinformatics, 2012, 28(19): 2537-2539 (doi: 10.1093/bioinformatics/bts460).
28. W e i r B.S., C o c k e r h a m C.C. Estimating F-Statistics for the analysis of population struc-ture. Evolution, 1984, 38(6): 1358-1370 (doi: 10.2307/2408641).
29. N e i M. Genetic distance between populations. Am. Nat., 1972, 106(949): 283-292 (doi: 10.1086/282771).
30. H a m m e r O., H a r p e r D.A.T., R y a n P.D. PAST: Paleontological statistics software package for education and data analysis. Palaeontologia Electronica, 2001, 4(1): 4-9.
31. H a r t l D.L., C l a r k A.G. Principles of population genetics. Sunderland, United Kingdom, 1997. 32. M o r o z V.A. Ovtsy, kozy, sherstyanoe delo, 2015, 2: 45-48 (in Russ.). 33. S e l ' k i n I.I., S o k o l o v A.N. Ovtsy, kozy, sherstyanoe delo, 2002, 3: 10-12 (in Russ.). 34. M e d v e d e v M.V., E r o k h i n A.I. Ovtsy, kozy, sherstyanoe delo, 2004, 1: 29-30 (in Russ.). 35. S e l ' k i n I.I. Severokavkazskaya myasosherstnaya poroda [A dual-purpose North Caucasian
meat and wool sheep breed]. Stavropol, 2007 (in Russ.). 36. E r o k h i n A.I., K o t a r e v V.I., E r o k h i n S.A. Ovtsevodstvo [Sheep breeding]. Voronezh,
2014 (in Russ.). 37. G a d z h i e v Z.K. Grubosherstnye ovtsy Dagestana [Dagestan coarse-wool sheep]. Makhachka-
la, 2010 (in Russ.). 38. M u r z i n a T.V., V e r s h i n i n a V.A. Informatsionnyi byulleten', 2016, 1(11): 35-41 (in Russ.). 39. B i l t u e v S.I. Materialy Mezhdunarodnoi nauchno-prakticheskoi konferentsii «Znachenie i perspek-
tivy razvitiya ovtsevodstva v Agrarnoi ekonomike Sibiri i Dal'nego Vostoka» [Proc. Int. Conf. «The value and prospects of sheep farming in the economy of Siberia and the Far East»]. Chita, 2016: 52-57 (in Russ.).
40. S t o l p o v s k i i Yu.A., S h i m i i t L.V., K o l N.V., E v s y u k o v A.N., R u s i n a M.N., C h u r g u i -o o l O.I., S u l i m o v a G.E. Analysis of genetic variability and phylogenetic rela-tions in populations of Tuvinian short-fat-tailed sheep with ISSR-markers usage. Sel’sko-khozyaistvennaya biologiya [Agricultural Biology], 2009, 6: 34-43 (in Russ.).
811
AGRICULTURAL BIOLOGY, ISSN 2412-0324 (English ed. Online)
2016, V. 51, ¹ 6, pp. 811-823 (SEL’SKOKHOZYAISTVENNAYA BIOLOGIYA) ISSN 0131-6397 (Russian ed. Print)
ISSN 2313-4836 (Russian ed. Online) UDC 636.294:575.174 doi: 10.15389/agrobiology.2016.6.811rus
doi: 10.15389/agrobiology.2016.6.811eng
STUDY OF THE ALLELE POOL AND THE DEGREE OF GENETIC INTROGRESSION OF SEMI-DOMESTICATED AND WILD POPULATIONS OF REINDEER (Rangifer tarandus L., 1758)
USING MICROSATELLITES
V.R. KHARZINOVA1, A.V. DOTSEV1, A.S. KRAMARENKO2, K.A. LAYSHEV3, T.M. ROMANENKO4, A.D. SOLOV’EVA1, T.E. DENISKOVA1, O.V. KOSTYUNINA1,
G. BREM1, 5, N.A. ZINOVIEVA1
1L.K. Ernst All-Russian Research Institute of Animal Husbandry, Federal Agency of Scientific Organizations, 60, pos. Dubrovitsy, Podolsk District, Moscow Province, 142132 Russia, e-mail [email protected], [email protected], [email protected], [email protected], [email protected], [email protected]; 2Mykolayiv National Agrarian University, 9, vul. Georgiya Gongadze, Mykolayiv, 54020 Ukraine, e-mail [email protected]; 3North-West Center of Interdisciplinary Food Research, 7, sh. Podbelskogo, St. Petersburg—Pushkin, 196608 Russia, e-mail [email protected]; 4Naryan-Mar Agricultural Experimental Station, Federal Agency of Scientific Organizations, 1a, ul. Rybnikova, Naryan-Mar, Nenets Autonomous District, 166004 Russia, e-mail [email protected]; 5Institut für Tierzucht und Genetik, University of Veterinary Medicine (VMU), Veterinärplatz, A-1210, Vienna, Aus-tria, e-mail [email protected] Acknowledgements: Supported by Russian Science Foundation (project ¹ 16-16-10068) Received September 5, 2016
A b s t r a c t
The coexistance of domestic and wild reindeer populations (Rangifer tarandus L., 1758) — is an important feature of this species. Both forms inhabit in conditions, which remain substantially unchanged for a long time. Due to gene flow between domestic and wild populations we observe a relatively high amount of admixture in the gene pool. Biodiversity characteristics of two most nu-merous reindeer populations (semi-domesticated Nenets breed and wild population of reindeer in-habiting territories of Nenets Autonomous Okrug (NAO) and Taimyr Autonomous Okrug (TAO) based on the analysis of microsatellites are given and the degree of introgression in these populations is determined. Samples of Nenets breed of domestic rein deer were collected in several farms in NAO and TAO (n = 115, four subpopulations). Samples of wild Taimyr population were collected in the course of field research in different geographic regions of TAO (n = 63, five subpopulations). Genomic DNA was isolated using Nexttec columns («Nexttec Biotechnologie GmbH», Germany). Polymorphism of 9 STR-loci (NVHRT21, NVHRT24, NVHRT76, RT1, RT6, RT7, RT9, RT27, RT30) was determined according to the previously developed technique for DNA analyzer ABI3130xl («Applied Biosystems», US). To estimate the allele pool of each population average num-ber of alleles (Na), the effective number of alleles (Ne) based on the locus, rarified allelic richness (Ar), private allelic richness (PrAr), observed (Ho) and expected (He) heterozygosity and inbreeding coefficient (FIS) were calculated. The degree of genetic differentiation of populations was assessed using pairwise FST values and Nei’s genetic distances. We calculated the degree of migration of genes between populations based on microsatellite allele frequencies. Distribution of genetic variation be-tween and within populations was studied by analysis of molecular variance (AMOVA). It was found that the wild population of reindeer is characterized by a higher level of genetic diversity: the average number of alleles per locus was 10.00±0.78 vs. 8.44±0.80, the observed heterozygosity — 0.633±0.060 vs. 0.589±0.049. STRUCTURE analysis revealed the formation of two independent clusters corresponding to the wild and domestic populations with high values of the membership co-efficient in own clusters: QWLD = 0.940±0.013 and QDOM = 0.938±0.010. However, a few individu-als (4.4-4.8 %) carrying a mixed genetic origin were found. The degree of introgression between the populations was around 6 %. Cluster analysis of genetic structure performed separately for wild and domestic populations at the level of subpopulations for the number of cluster k ranged from 2 to 5 did not reveal a clear clustering between subpopulation. It’s confirmed the homogeneity of genetic structure within populations. Examination of overall genetic diversity with AMOVA procedure indi-cated that most of the variation was observed within populations (95.4 %, p < 0.001). Principal component analysis (PCA) revealed clear differentiation of the studied domestic and wild popula-
812
tions along the axis 1 with their slight overlapping; herewith the principal component 1 was responsi-ble for 5.15 % of variability. Evaluation of differentiation degree between subpopulations of rein deer, performed by calculation of the pairwise values of FST and Nei’s genetic distances (DN) showed rel-atively higher degree of genetic differentiation between subpopulations within wild population com-paring to domestic population (maximal FST and DN values were 0.046 vs 0.023 and 0.353 vs 0.151, respectively). The obtained results of genetic diversity and population structure of reindeer will be used to develop the breeding program with Nenets breed of domestic rein deer and to organize the measures for protection and sustainable use of wild reindeer bioresources.
Keywords: allele pool, introgression, populations, reindeer, microsatellites
Reindeer breeding is one of the oldest animal industries that takes the leading place in agriculture and commercial industry of the Far North. This is the only agricultural industry in which 18 indigenous minorities numbering over 130,000 people, mostly rural dwellers, are directly or indirectly involved [1]. Due to reindeer in the tundra and forest tundra zones, millions of hectares of pastures unavailable to other animals are effectively used [2]. According to the Arctic Council's project “Sustainable Reindeer Breeding” [3)], Russia has about 2/3 of the world's domestic reindeer stock browsing in tundra, forest tundra, boreal for-est, and mountain regions throughout the territory of over 3 mln km2.
Reindeer (Rangifer tarandus L., 1758) is the only representative of Rangi-fer C. H. Smith, 1827. For a historically long period, a large group of domestic reindeer was bred with clearly expressed morpho-biological and useful sustaina-bly inherited traits. In 1985, four reindeer breeds were approved and entered into the State Register: Nenets, Chukotka, Evenk, and Even. For the last decade, the number of domestic reindeer in Russia reduced 2-fold and as of 1 January 2012 was assessed at 1,583,000 livestock units, which amounted only to 70.0 % as compared to 1990 [4].
The Nenets indigenious reindeer breed is the largest in Russia by the number (950,000 livestock units) and pasture territory (110 million ha) [5]. The reindeer of this breed are of an average size with rather well-defined working characgeristics [6]. They are perfectly adapted to the local climate conditions [7]. The Nenets reindeer are widely spread in the Nenets, Yamalo-Nenets, Khanty-Mansi, and Tamyr Autonomous Okrugs, Murmansk and Arkhangelsk regions, and the Republic of Komi. According to the breeding records as of 1 January 2015, there are about 170,000 reindeer bred by 23 farms in the Nenets Autonomous Okrug (NAO) [8]. Despite the existence of several ecological geo-graphic types, the Nenets indigenous reindeer are the most homotypic and con-solidated. Larger species can be found only on the arctic islands (Kolguev, Vaigach, etc.), which is explained by favorable feeding conditions, rather than genetic peculiarities [9].
The number of wild reindeer has also reduced for the said period [10-12]. Currently, their number is 1.4 million livestock units, with over 70 % con-centrated in the north of Middle Siberia. The largest population is the Taymyr population which is of exclusive value as a key component of Taymyr biodiver-sity. Wild reindeer largely determine the conditions for vegetation recovery, and are the species that affect the habitat of mammals and birds in the region [13, 14]. The Taymyr reindeer population is a geographic and ecological phe-nomenon having no analogs by the number, the distance of migrations (up to 1,500 km), and the coverage of zonal types (from the northern tundra to polar deserts) [15].
The co-existence of domestic and wild forms is an important peculiarity of the species. Domestic reindeer does not differ substantially from its wild ancestor. Both forms dwell in almost similar conditions that remain practically unchanged for a long time. In reindeer breeding, no artificial forage is used and there are no
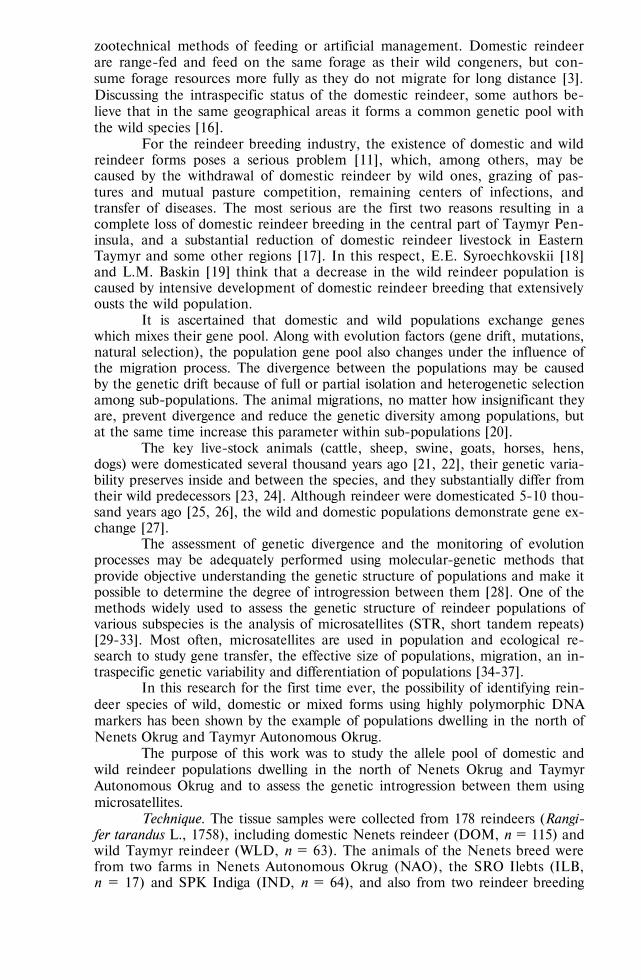
813
zootechnical methods of feeding or artificial management. Domestic reindeer are range-fed and feed on the same forage as their wild congeners, but con-sume forage resources more fully as they do not migrate for long distance [3]. Discussing the intraspecific status of the domestic reindeer, some authors be-lieve that in the same geographical areas it forms a common genetic pool with the wild species [16].
For the reindeer breeding industry, the existence of domestic and wild reindeer forms poses a serious problem [11], which, among others, may be caused by the withdrawal of domestic reindeer by wild ones, grazing of pas-tures and mutual pasture competition, remaining centers of infections, and transfer of diseases. The most serious are the first two reasons resulting in a complete loss of domestic reindeer breeding in the central part of Taymyr Pen-insula, and a substantial reduction of domestic reindeer livestock in Eastern Taymyr and some other regions [17]. In this respect, E.E. Syroechkovskii [18] and L.M. Baskin [19] think that a decrease in the wild reindeer population is caused by intensive development of domestic reindeer breeding that extensively ousts the wild population.
It is ascertained that domestic and wild populations exchange genes which mixes their gene pool. Along with evolution factors (gene drift, mutations, natural selection), the population gene pool also changes under the influence of the migration process. The divergence between the populations may be caused by the genetic drift because of full or partial isolation and heterogenetic selection among sub-populations. The animal migrations, no matter how insignificant they are, prevent divergence and reduce the genetic diversity among populations, but at the same time increase this parameter within sub-populations [20].
The key live-stock animals (cattle, sheep, swine, goats, horses, hens, dogs) were domesticated several thousand years ago [21, 22], their genetic varia-bility preserves inside and between the species, and they substantially differ from their wild predecessors [23, 24]. Although reindeer were domesticated 5-10 thou-sand years ago [25, 26], the wild and domestic populations demonstrate gene ex-change [27].
The assessment of genetic divergence and the monitoring of evolution processes may be adequately performed using molecular-genetic methods that provide objective understanding the genetic structure of populations and make it possible to determine the degree of introgression between them [28]. One of the methods widely used to assess the genetic structure of reindeer populations of various subspecies is the analysis of microsatellites (STR, short tandem repeats) [29-33]. Most often, microsatellites are used in population and ecological re-search to study gene transfer, the effective size of populations, migration, an in-traspecific genetic variability and differentiation of populations [34-37].
In this research for the first time ever, the possibility of identifying rein-deer species of wild, domestic or mixed forms using highly polymorphic DNA markers has been shown by the example of populations dwelling in the north of Nenets Okrug and Taymyr Autonomous Okrug.
The purpose of this work was to study the allele pool of domestic and wild reindeer populations dwelling in the north of Nenets Okrug and Taymyr Autonomous Okrug and to assess the genetic introgression between them using microsatellites.
Technique. The tissue samples were collected from 178 reindeers (Rangi-fer tarandus L., 1758), including domestic Nenets reindeer (DOM, n = 115) and wild Taymyr reindeer (WLD, n = 63). The animals of the Nenets breed were from two farms in Nenets Autonomous Okrug (NAO), the SRO Ilebts (ILB, n = 17) and SPK Indiga (IND, n = 64), and also from two reindeer breeding
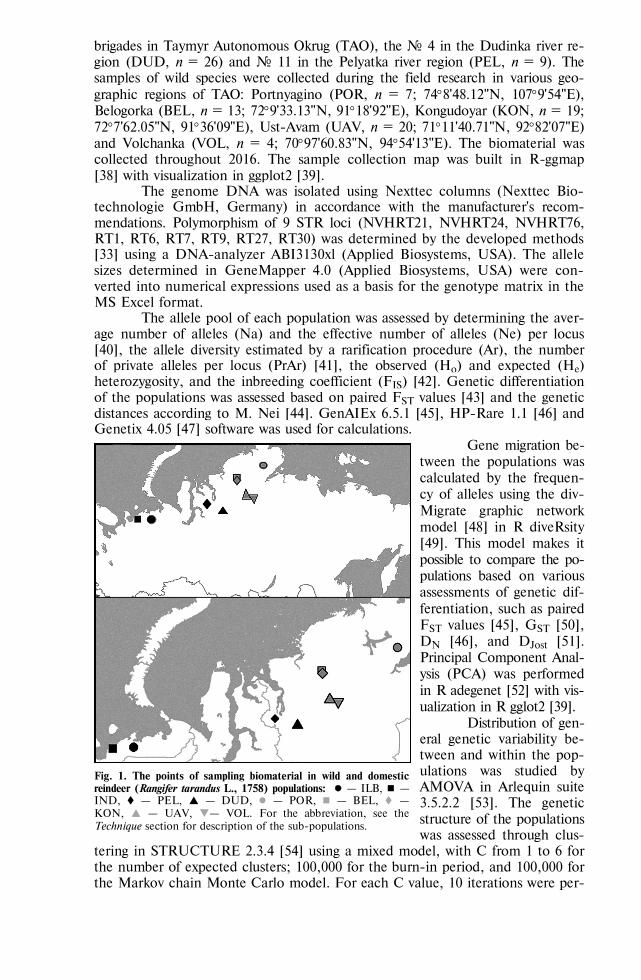
814
brigades in Taymyr Autonomous Okrug (TAO), the ¹ 4 in the Dudinka river re-gion (DUD, n = 26) and ¹ 11 in the Pelyatka river region (PEL, n = 9). The samples of wild species were collected during the field research in various geo-graphic regions of TAO: Portnyagino (POR, n = 7; 748'48.12"N, 1079'54"E), Belogorka (BEL, n = 13; 729'33.13"N, 9118'92"E), Kongudoyar (KON, n = 19; 727'62.05"N, 9136'09"E), Ust-Avam (UAV, n = 20; 7111'40.71"N, 9282'07"E) and Volchanka (VOL, n = 4; 7097'60.83"N, 9454'13"E). The biomaterial was collected throughout 2016. The sample collection map was built in R-ggmap [38] with visualization in ggplot2 [39].
The genome DNA was isolated using Nexttec columns (Nexttec Bio-technologie GmbH, Germany) in accordance with the manufacturer's recom-mendations. Polymorphism of 9 STR loci (NVHRT21, NVHRT24, NVHRT76, RT1, RT6, RT7, RT9, RT27, RT30) was determined by the developed methods [33] using a DNA-analyzer ABI3130xl (Applied Biosystems, USA). The allele sizes determined in GeneMapper 4.0 (Applied Biosystems, USA) were con-verted into numerical expressions used as a basis for the genotype matrix in the MS Excel format.
The allele pool of each population was assessed by determining the aver-age number of alleles (Na) and the effective number of alleles (Ne) per locus [40], the allele diversity estimated by a rarification procedure (Ar), the number of private alleles per locus (PrAr) [41], the observed (Ho) and expected (He) heterozygosity, and the inbreeding coefficient (FIS) [42]. Genetic differentiation of the populations was assessed based on paired FST values [43] and the genetic distances according to M. Nei [44]. GenAIEx 6.5.1 [45], HP-Rare 1.1 [46] and Genetix 4.05 [47] software was used for calculations.
Gene migration be-tween the populations was calculated by the frequen-cy of alleles using the div-Migrate graphic network model [48] in R diveRsity [49]. This model makes it possible to compare the po-pulations based on various assessments of genetic dif-ferentiation, such as paired FST values [45], GST [50], DN [46], and DJost [51]. Principal Component Anal-ysis (PCA) was performed in R аdegenet [52] with vis-ualization in R gglot2 [39].
Distribution of gen-eral genetic variability be-tween and within the pop-ulations was studied by AMOVA in Arlequin suite 3.5.2.2 [53]. The genetic structure of the populations was assessed through clus-
tering in STRUCTURE 2.3.4 [54] using a mixed model, with C from 1 to 6 for the number of expected clusters; 100,000 for the burn-in period, and 100,000 for the Markov chain Monte Carlo model. For each C value, 10 iterations were per-
Fig. 1. The points of sampling biomaterial in wild and domestic reindeer (Rangifer tarandus L., 1758) populations: — ILB, — IND, — PEL, — DUD, — POR, — BEL, — KON, — UAV, — VOL. For the abbreviation, see the Technique section for description of the sub-populations.
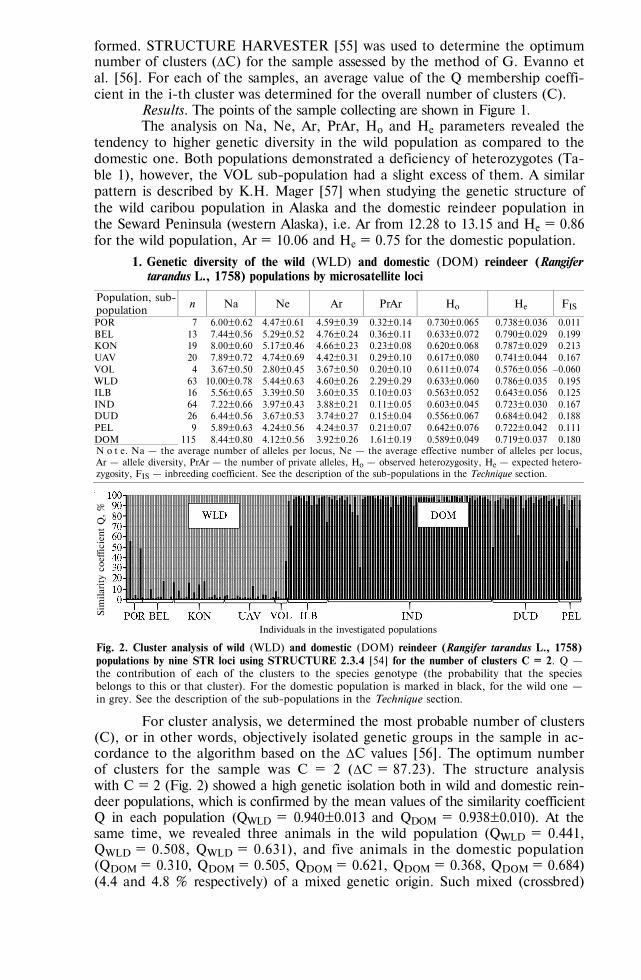
815
formed. STRUCTURE HARVESTER [55] was used to determine the optimum number of clusters (ΔC) for the sample assessed by the method of G. Evanno et al. [56]. For each of the samples, an average value of the Q membership coeffi-cient in the i-th cluster was determined for the overall number of clusters (C).
Results. The points of the sample collecting are shown in Figure 1. The analysis on Na, Ne, Ar, PrAr, Ho and He parameters revealed the
tendency to higher genetic diversity in the wild population as compared to the domestic one. Both populations demonstrated a deficiency of heterozygotes (Ta-ble 1), however, the VOL sub-population had a slight excess of them. A similar pattern is described by K.H. Mager [57] when studying the genetic structure of the wild caribou population in Alaska and the domestic reindeer population in the Seward Peninsula (western Alaska), i.e. Ar from 12.28 to 13.15 and He = 0.86 for the wild population, Ar = 10.06 and He = 0.75 for the domestic population.
1. Genetic diversity of the wild (WLD) and domestic (DOM) reindeer (Rangifer tarandus L., 1758) populations by microsatellite loci
Population, sub-population
n Na Ne Ar PrAr Ho He FIS
POR 7 6.00±0.62 4.47±0.61 4.59±0.39 0.32±0.14 0.730±0.065 0.738±0.036 0.011 BEL 13 7.44±0.56 5.29±0.52 4.76±0.24 0.36±0.11 0.633±0.072 0.790±0.029 0.199 KON 19 8.00±0.60 5.17±0.46 4.66±0.23 0.23±0.08 0.620±0.068 0.787±0.029 0.213 UAV 20 7.89±0.72 4.74±0.69 4.42±0.31 0.29±0.10 0.617±0.080 0.741±0.044 0.167 VOL 4 3.67±0.50 2.80±0.45 3.67±0.50 0.20±0.10 0.611±0.074 0.576±0.056 0.060 WLD 63 10.00±0.78 5.44±0.63 4.60±0.26 2.29±0.29 0.633±0.060 0.786±0.035 0.195 ILB 16 5.56±0.65 3.39±0.50 3.60±0.35 0.10±0.03 0.563±0.052 0.643±0.056 0.125 IND 64 7.22±0.66 3.97±0.43 3.88±0.21 0.11±0.05 0.603±0.045 0.723±0.030 0.167 DUD 26 6.44±0.56 3.67±0.53 3.74±0.27 0.15±0.04 0.556±0.067 0.684±0.042 0.188 PEL 9 5.89±0.63 4.24±0.56 4.24±0.37 0.21±0.07 0.642±0.076 0.722±0.042 0.111 DOM 115 8.44±0.80 4.12±0.56 3.92±0.26 1.61±0.19 0.589±0.049 0.719±0.037 0.180 N o t e. Na — the average number of alleles per locus, Ne — the average effective number of alleles per locus, Ar — allele diversity, PrAr — the number of private alleles, Ho — observed heterozygosity, He — expected hetero-zygosity, FIS — inbreeding coefficient. See the description of the sub-populations in the Technique section.
Fig. 2. Cluster analysis of wild (WLD) and domestic (DOM) reindeer (Rangifer tarandus L., 1758) populations by nine STR loci using STRUCTURE 2.3.4 [54] for the number of clusters C = 2. Q — the contribution of each of the clusters to the species genotype (the probability that the species belongs to this or that cluster). For the domestic population is marked in black, for the wild one — in grey. See the description of the sub-populations in the Technique section.
For cluster analysis, we determined the most probable number of clusters (C), or in other words, objectively isolated genetic groups in the sample in ac-cordance to the algorithm based on the ΔC values [56]. The optimum number of clusters for the sample was C = 2 (ΔC = 87.23). The structure analysis with C = 2 (Fig. 2) showed a high genetic isolation both in wild and domestic rein-deer populations, which is confirmed by the mean values of the similarity coefficient Q in each population (QWLD = 0.940±0.013 and QDOM = 0.938±0.010). At the same time, we revealed three animals in the wild population (QWLD = 0.441, QWLD = 0.508, QWLD = 0.631), and five animals in the domestic population (QDOM = 0.310, QDOM = 0.505, QDOM = 0.621, QDOM = 0.368, QDOM = 0.684) (4.4 and 4.8 % respectively) of a mixed genetic origin. Such mixed (crossbred)
Sim
ilar
ity
coef
fici
ent Q
, %
Individuals in the investigated populations
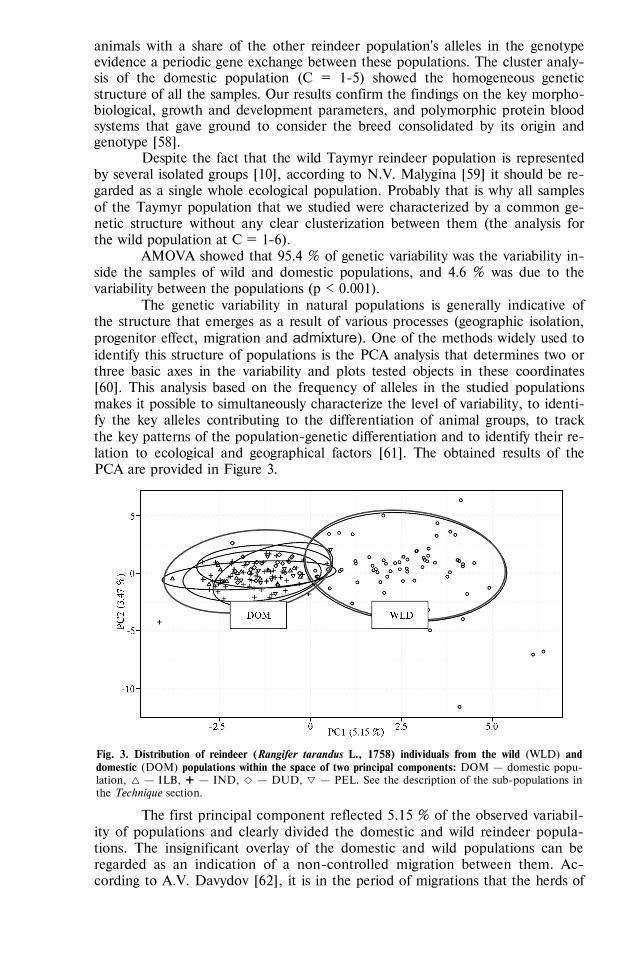
816
animals with a share of the other reindeer population's alleles in the genotype evidence a periodic gene exchange between these populations. The cluster analy-sis of the domestic population (C = 1-5) showed the homogeneous genetic structure of all the samples. Our results confirm the findings on the key morpho-biological, growth and development parameters, and polymorphic protein blood systems that gave ground to consider the breed consolidated by its origin and genotype [58].
Despite the fact that the wild Taymyr reindeer population is represented by several isolated groups [10], according to N.V. Malygina [59] it should be re-garded as a single whole ecological population. Probably that is why all samples of the Taymyr population that we studied were characterized by a common ge-netic structure without any clear clusterization between them (the analysis for the wild population at C = 1-6).
AMOVA showed that 95.4 % of genetic variability was the variability in-side the samples of wild and domestic populations, and 4.6 % was due to the variability between the populations (p < 0.001).
The genetic variability in natural populations is generally indicative of the structure that emerges as a result of various processes (geographic isolation, progenitor effect, migration and admixture). One of the methods widely used to identify this structure of populations is the PCA analysis that determines two or three basic axes in the variability and plots tested objects in these coordinates [60]. This analysis based on the frequency of alleles in the studied populations makes it possible to simultaneously characterize the level of variability, to identi-fy the key alleles contributing to the differentiation of animal groups, to track the key patterns of the population-genetic differentiation and to identify their re-lation to ecological and geographical factors [61]. The obtained results of the PCA are provided in Figure 3.
Fig. 3. Distribution of reindeer (Rangifer tarandus L., 1758) individuals from the wild (WLD) and domestic (DOM) populations within the space of two principal components: DOM — domestic popu-lation, — ILB, — IND, — DUD, — PEL. See the description of the sub-populations in the Technique section.
The first principal component reflected 5.15 % of the observed variabil-ity of populations and clearly divided the domestic and wild reindeer popula-tions. The insignificant overlay of the domestic and wild populations can be regarded as an indication of a non-controlled migration between them. Ac-cording to A.V. Davydov [62], it is in the period of migrations that the herds of
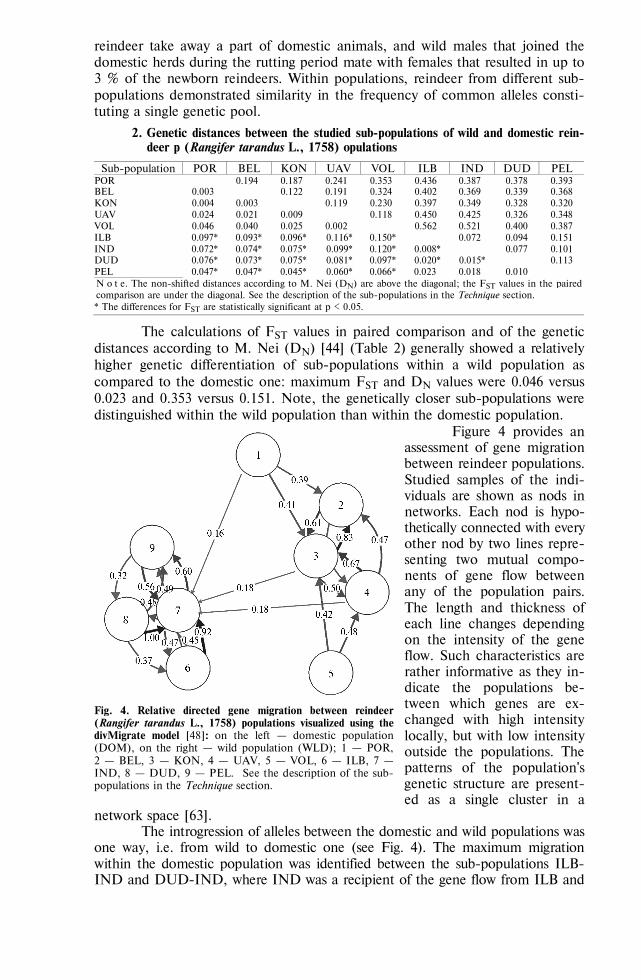
817
reindeer take away a part of domestic animals, and wild males that joined the domestic herds during the rutting period mate with females that resulted in up to 3 % of the newborn reindeers. Within populations, reindeer from different sub-populations demonstrated similarity in the frequency of common alleles consti-tuting a single genetic pool.
2. Genetic distances between the studied sub-populations of wild and domestic rein-deer p (Rangifer tarandus L., 1758) opulations
Sub-population POR BEL KON UAV VOL ILB IND DUD PEL POR 0.194 0.187 0.241 0.353 0.436 0.387 0.378 0.393 BEL 0.003 0.122 0.191 0.324 0.402 0.369 0.339 0.368 KON 0.004 0.003 0.119 0.230 0.397 0.349 0.328 0.320 UAV 0.024 0.021 0.009 0.118 0.450 0.425 0.326 0.348 VOL 0.046 0.040 0.025 0.002 0.562 0.521 0.400 0.387 ILB 0.097* 0.093* 0.096* 0.116* 0.150* 0.072 0.094 0.151 IND 0.072* 0.074* 0.075* 0.099* 0.120* 0.008* 0.077 0.101 DUD 0.076* 0.073* 0.075* 0.081* 0.097* 0.020* 0.015* 0.113 PEL 0.047* 0.047* 0.045* 0.060* 0.066* 0.023 0.018 0.010 N o t e. The non-shifted distances according to M. Nei (DN) are above the diagonal; the FST values in the paired comparison are under the diagonal. See the description of the sub-populations in the Technique section. * The differences for FST are statistically significant at p < 0.05.
The calculations of FST values in paired comparison and of the genetic distances according to M. Nei (DN) [44] (Table 2) generally showed a relatively higher genetic differentiation of sub-populations within a wild population as compared to the domestic one: maximum FST and DN values were 0.046 versus 0.023 and 0.353 versus 0.151. Note, the genetically closer sub-populations were distinguished within the wild population than within the domestic population.
Figure 4 provides an assessment of gene migration between reindeer populations. Studied samples of the indi-viduals are shown as nods in networks. Each nod is hypo-thetically connected with every other nod by two lines repre-senting two mutual compo-nents of gene flow between any of the population pairs. The length and thickness of each line changes depending on the intensity of the gene flow. Such characteristics are rather informative as they in-dicate the populations be-tween which genes are ex-changed with high intensity locally, but with low intensity outside the populations. The patterns of the population's genetic structure are present-ed as a single cluster in a
network space [63]. The introgression of alleles between the domestic and wild populations was
one way, i.e. from wild to domestic one (see Fig. 4). The maximum migration within the domestic population was identified between the sub-populations ILB-IND and DUD-IND, where IND was a recipient of the gene flow from ILB and
Fig. 4. Relative directed gene migration between reindeer (Rangifer tarandus L., 1758) populations visualized using the divMigrate model [48]: on the left — domestic population (DOM), on the right — wild population (WLD); 1 — POR, 2 — BEL, 3 — KON, 4 — UAV, 5 — VOL, 6 — ILB, 7 — IND, 8 — DUD, 9 — PEL. See the description of the sub-populations in the Technique section.
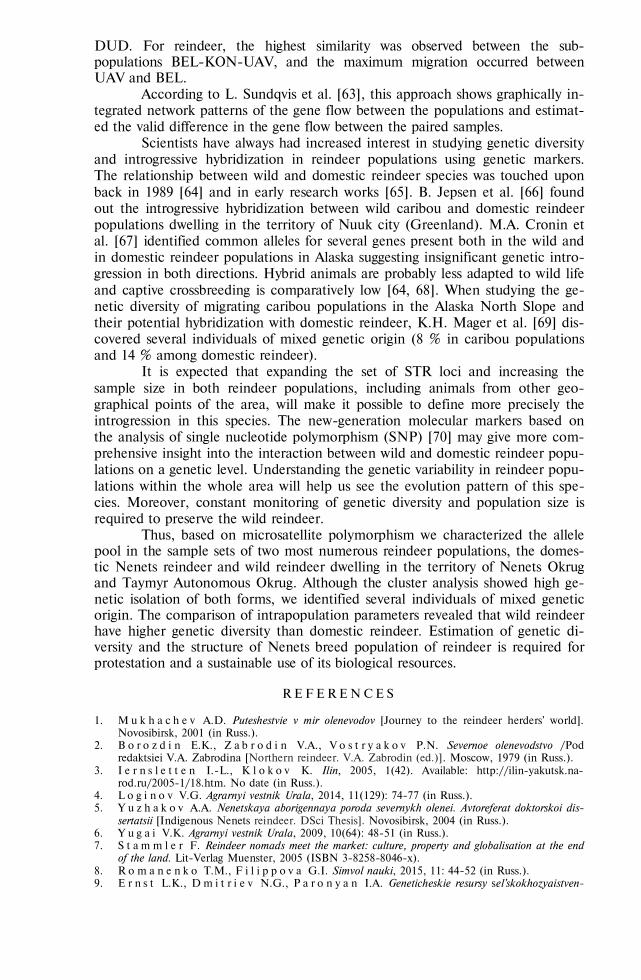
818
DUD. For reindeer, the highest similarity was observed between the sub-populations BEL-KON-UAV, and the maximum migration occurred between UAV and BEL.
According to L. Sundqvis et al. [63], this approach shows graphically in-tegrated network patterns of the gene flow between the populations and estimat-ed the valid difference in the gene flow between the paired samples.
Scientists have always had increased interest in studying genetic diversity and introgressive hybridization in reindeer populations using genetic markers. The relationship between wild and domestic reindeer species was touched upon back in 1989 [64] and in early research works [65]. В. Jepsen et al. [66] found out the introgressive hybridization between wild caribou and domestic reindeer populations dwelling in the territory of Nuuk city (Greenland). М.А. Cronin et al. [67] identified common alleles for several genes present both in the wild and in domestic reindeer populations in Alaska suggesting insignificant genetic intro-gression in both directions. Hybrid animals are probably less adapted to wild life and captive crossbreeding is comparatively low [64, 68]. When studying the ge-netic diversity of migrating caribou populations in the Alaska North Slope and their potential hybridization with domestic reindeer, K.H. Mager et al. [69] dis-covered several individuals of mixed genetic origin (8 % in caribou populations and 14 % among domestic reindeer).
It is expected that expanding the set of STR loci and increasing the sample size in both reindeer populations, including animals from other geo-graphical points of the area, will make it possible to define more precisely the introgression in this species. The new-generation molecular markers based on the analysis of single nucleotide polymorphism (SNP) [70] may give more com-prehensive insight into the interaction between wild and domestic reindeer popu-lations on a genetic level. Understanding the genetic variability in reindeer popu-lations within the whole area will help us see the evolution pattern of this spe-cies. Moreover, constant monitoring of genetic diversity and population size is required to preserve the wild reindeer.
Thus, based on microsatellite polymorphism we characterized the allele pool in the sample sets of two most numerous reindeer populations, the domes-tic Nenets reindeer and wild reindeer dwelling in the territory of Nenets Okrug and Taymyr Autonomous Okrug. Although the cluster analysis showed high ge-netic isolation of both forms, we identified several individuals of mixed genetic origin. The comparison of intrapopulation parameters revealed that wild reindeer have higher genetic diversity than domestic reindeer. Estimation of genetic di-versity and the structure of Nenets breed population of reindeer is required for protestation and a sustainable use of its biological resources.
R E F E R E N C E S
1. M u k h a c h e v A.D. Puteshestvie v mir olenevodov [Journey to the reindeer herders' world].
Novosibirsk, 2001 (in Russ.). 2. B o r o z d i n E.K., Z a b r o d i n V.A., V o s t r y a k o v P.N. Severnoe olenevodstvo /Pod
redaktsiei V.A. Zabrodina [Northern reindeer. V.A. Zabrodin (ed.)]. Moscow, 1979 (in Russ.). 3. I e r n s l e t t e n I.-L., K l o k o v K. Ilin, 2005, 1(42). Available: http://ilin-yakutsk.na-
rod.ru/2005-1/18.htm. No date (in Russ.). 4. L o g i n o v V.G. Agrarnyi vestnik Urala, 2014, 11(129): 74-77 (in Russ.). 5. Y u z h a k o v A.A. Nenetskaya aborigennaya poroda severnykh olenei. Avtoreferat doktorskoi dis-
sertatsii [Indigenous Nenets reindeer. DSci Thesis]. Novosibirsk, 2004 (in Russ.). 6. Y u g a i V.K. Agrarnyi vestnik Urala, 2009, 10(64): 48-51 (in Russ.). 7. S t a m m l e r F. Reindeer nomads meet the market: culture, property and globalisation at the end
of the land. Lit-Verlag Muenster, 2005 (ISBN 3-8258-8046-x). 8. R o m a n e n k o T.M., F i l i p p o v a G.I. Simvol nauki, 2015, 11: 44-52 (in Russ.). 9. E r n s t L.K., D m i t r i e v N.G., P a r o n y a n I.A. Geneticheskie resursy sel'skokhozyaistven-
819
nykh zhivotnykh v Rossii i sopredel'nykh stranakh [Genetic diversity of farm animals in Russia and neighboring countries]. St. Petersburg, 1994 (in Russ.).
10. K o l p a s h c h i k o v L.A. Taimyrskaya populyatsiya dikogo severnogo olenya (biologicheskie os-novy upravleniya i ustoichivogo ispol'zovaniya resursov). Avtoreferat doktorskoi dissertatsii [Taimyr population of wild reindeer — biological aspects of control and sustainable use. DSci Thesis]. Noril'sk, 2000 (in Russ.).
11. S y r o e c h k o v s k i i E.E., R o g a c h e v a E.V., S a v c h e n k o A.P., S o k o l o v G.A., B a r a n o v A.A., E m e l ' y a n o v V.I. Krasnaya kniga Krasnoyarskogo kraya. Redkie i na-khodyashchiesya pod ugrozoi ischeznoveniya vidy zhivotnykh [Red Data Book of Krasnoyarsk re-gion. Rare and endangered animal species]. Krasnoyarsk, 2000 (in Russ.).
12. M u k h a c h e v A.D., K o l p a s h c h i k o v L.A., L a i s h e v K.A. Myasnaya produktivnost' severnykh olenei [Meat production in reindeer]. Novosibirsk, 2001 (in Russ.).
13. T i k h o m i r o v B.A. Vzaimosvyazi zhivotnogo mira i rastitel'nogo pokrova tundry [Relationships of wildlife and vegetation of the tundra]. Moscow-Leningrad, 1959 (in Russ.).
14. T i s h k o v A.A. Zhurnal obshchei biologii, 1977, 38(1): 15-23 (in Russ.). 15. K o l p a s h c h i k o v L.A., M i k h a i l o v V.V. Sovremennye problemy prirodopol'zovaniya,
okhotovedeniya i zverovodstva, 2012, 1: 108-109 (in Russ.). 16. S e m e n o v - T y a n - S h a n s k i i O.I. Severnyi olen' [Reindeer]. Moscow, 1977 (in Russ.). 17. K l o k o v K.B. Materialy III Mezhdunarodnoi shkoly po yuridicheskoi antropologii «Olen' vsegda
prav» [Proc. III Int. Workshop on anthropology of law «Reindeer is always right»]. St. Peters-burg—Pushkin, 2003: 53-74 (in Russ.).
18. S y r o e c h k o v s k i i E.E. Wild reindeer. Amerind Publishing, New Delhi, India, 1995. 19. B a s k i n L.M. Number of wild and domestic reindeer in Russia in the late 20th century. Ran-
gifer, 2005, 25(1): 51-57 (doi: 10.7557/2.25.1.337). 20. P a p a R. Gene flow and introgression between domesticated crops and their wild relatives.
Proc. Int. Workshop «The role of biotechnology for the characterization and conservation of crop, forestry, animal and fishery genetic resources». Turin, Italy, 2005: 71-76.
21. M a c H u g h D.E., B r a d l e y D.G. Livestock genetic origins: goats buck the trend. PNAS USA, 2001, 98: 5382-5384 (doi: 10.1073/pnas.111163198).
22. B r u f o r d M.W., B r a d l e y D.G., L u i k a r t G. DNA markers reveal the complexity of livestock domestication. Nat. Rev. Genet., 2003, 4: 900-910 (doi: 10.1038/nrg1203).
23. M a c H u g h D.E., S h r i v e r M.D., L o f t u s R.T., C u n n i n g h a m P., B r a d l e y D.G. Microsatellite DNA variation and the evolution, domestication and phylogeography of taurine and zebu cattle (Bos taurus and Bos indicus). Genetics, 1997, 146: 1071-1086.
24. L u i k a r t G., G i e l l y L., E x c o f f i e r L., V i g n e J.-D., B o u v e t J., T a b e r l e t P. Multiple maternal origins and weak phylogeographic structure in domestic goats. PNAS USA, 2001, 98: 5927-5932 (doi: 10.1073/pnas.091591198).
25. B a s k i n L.M. Reindeer husbandry in the Soviet Union. Wildlife production systems: economic utilization of wild ungulates. R.J. Hudson, K.R. Drew, L.M. Baskin (eds.). Cambridge University Press, Cambridge, UK, 1989: 197-206.
26. S t a a l a n n d H., E i k e l m a n n I.M.H. Status of the reindeer industry in Fennoscandia. Wild-life production: conservation and sustainable development. L.A. Renecker, R.J. Hudson (eds.). AFES Misc. University of Alaska, Fairbanks, 1991, 91(6): 77-88.
27. D a v y d o v A.V., K h o l o d o v a M.V., M e s h c h e r s k i i I.G., G r u z d e v A.R., S i p k o T.P., K o l N.V., T s a r e v S.A., Z h e l e z n o v - C h u k o t s k i i N.K., M i r u t e n k o V.S., G u b a r ’ Yu.P., L i n ’ k o v A.B., R o z h k o v Yu.I. Differentiation of wild and domestic forms of caribou (Rangifer tarandus L.) on the results of mtDNA analysis. Sel’skokhozyaistvennaya biologiya [Agricultural Biology], 2007, 6: 48-53. Available http://agrobio-logy.ru/articles/6-2007davydov.pdf. No date (in Russ.).
28. K h o k h l o v A.M. Teoreticheskoe obosnovanie protsessa domestikatsii, selektsionno-geneticheskii i tekhnologicheskii monitoring v svinovodstve. Avtoreferat doktorskoi dissertatsii [Theoretical aspects of domestication, genetic and technological monitoring in pig-breeding. DSci Thesis]. Khar'kov, 2006 (in Russ.).
29. B a l l M.C., F i n n e g a n L., M a n s e a u M., W i l s o n P. Integrating multiple analytical approaches to spatially delineate and characterize genetic population structure: an application to boreal caribou (Rangifer tarandus caribou) in central Canada. Conserv. Genet., 2010, 11: 2131-2143 (doi: 10.1007/s10592-010-0099-3).
30. Z i t t l a u K.A. Population genetic analyses of North American caribou (Rangifer tarandus). PhD Thesis. University of Alberta, Canada, 2004.
31. C r o n i n M.A., M a c N e i l M.D., P a t t o n J.C. Variation in mitochondrial DNA and mi-crosatellite DNA in caribou (Rangifer tarandus) in North America. J. Mammal., 2005, 86: 495-505 (doi: 10.1644/1545-1542(2005)86[495:VIMDAM]2.0.CO;2).
32. T y l e r S.K., M c f a r l a n e K.A., P a m e l a G r o v e s P., M o o e r s A.Ø., S h a p i r o B. Modern and ancient DNA reveal recent partial replacement of caribou in the southwest Yukon. Mol. Ecol., 2010, 19: 1312-1323 (doi: 10.1111/j.1365-294X.2010.04565.x).
33. K h a r z i n o v a V.R., G l a d y r ’ E.A., F e d o r o v V.I., R o m a n e n k o T.M., S h i m -
820
i t L.D., L a y s h e v K.A., K a l a s h n i k o v a L.A., Z i n o v i e v a N.A. Development of multiplex microsatellite panel to assess the parentage verification in and differentiation degree of reindeer populations (Rangifer tarandus). Agricultural Biology, 2015, 50(6): 756-765 (doi: 10.15389/agrobiology.2015.6.756eng) (in Engl.).
34. P f e i f f e r A., O l i v i e r i A.M., M o r g a n t e M. Identification and characterization of mi-crosatellites in Norway spruce (Picea abies K.). Genome, 1997, 40: 411-419.
35. S c o t t i I., M a g n i F., P a g l i a G.P., M o r g a n t e M. Trinucleotide microsatellite in Norway spruce (Picea abies): their features and the development of molecular markers. Theor. Appl. Genet., 2002, 106: 40-50 (doi: 10.1007/s00122-002-0986-1).
36. F l u c h S., B u r g A., K o p e c k y D., H o m o l k a A., S p i e s s N., V e n d r a m i n G.G. Characterization of variable EST SSR markers for Norway spruce (Picea abies L.). BMC Res. Not., 2011, 4: 401-412 (doi: 10.1186/1756-0500-4-401).
37. C r e m e r E., L i e p e l t S., S e b a s t i a n i F., B u o n a m i c i A., M i c h a l c z y k I.M., Z i e g e n h a g e n B., V e n d r a m i n G.G. Identification and characterization of nuclear mi-crosatellite loci in Abies alba Mill. Mol. Ecol. Notes, 2006, 6: 374-376 (doi: 10.1111/j.1471-8286.2005.01238.x).
38. K a h l e D., W i c k h a m H. ggmap: Spatial visualization with ggplot2. The R Journal, 2013, 5(1): 144-161.
39. W i c k h a m H. ggplot2: Elegant graphics for data analysis. Springer-Verlag, NY, 2009. 40. B r o w n A.H.D., W e i r B.S. Measuring genetic variability in plant populations. In: Isozymes
in plant genetics and breeding, Part A. S.D. Tanksley, T.J. Orton (eds.). Elsevier Science Publ., Amsterdam, 1983.
41. K a l i n o w s k i S.T. Counting alleles with rarefaction: Private alleles and hierarchical sampling designs. Conserv. Genet., 2004, 5: 539-543 (doi: 10.1023/B:COGE.0000041021.91777.1a).
42. H a r t l D.L., C l a r k A.G. Principles of population genetics. Sunderland, Massachusetts, 1997. 43. W e i r B.S., C o c k e r h a m C.C. Estimating F-statistics for the analysis of population struc-
ture. Evolution, 1984, 38: 1358-1370. 44. N e i M. Genetic distance between populations. Am. Nat., 1972, 106(949): 283-292 (doi:
10.1086/282771). 45. P e a k a l l R., S m o u s e P.E. GenAlEx 6.5: genetic analysis in Excel. Population genetic
software for teaching and research — an update. Bioinformatics, 2012, 28: 2537-2539 (doi: 10.1093/bioinformatics/bts460).
46. K a l i n o w s k i S.T. HP RARE 1.0: a computer program for performing rarefaction on measures of allelic richness. Mol. Ecol. Notes, 2005, 5: 187-189 (doi: 10.1111/j.1471-8286.2004.00845.x).
47. B e l k h i r K., B o r s a P., C h i k h i L., R a u f a s t e N., B o n h o m m e F. GENETIX 4.05, logiciel sous Windows TM pour la génétique des populations. Laboratoire Génome, Populations, In-teractions, CNRS UMR 5171, Université de Montpellier II, Montpellier (France), 1996-2004.
48. S u n d q v i s t L., Z a c k r i s s o n M.Z., K l e i n h a n s D. Directional genetic differentiation and asymmetric migration. Available https://arxiv.org/abs/1304.0118 [q-bio.PE]. No date.
49. K e e n a n K., M c G i n n i t y P., C r o s s T.F., C r o z i e r W.W., P r o d o h l P.A. diveRsi-ty: An R package for the estimation of population genetics parameters and their associated er-rors. Methods in Ecology and Evolution, 2013, 4: 782-788 (doi: 10.1111/2041-210X.12067).
50. M e i r m a n s P.G., H e d r i c k P.W. Assessing population structure: FST and related measures. Mol. Ecol. Resour., 2011, 11: 5-18 (doi: 10.1111/j.1755-0998.2010.02927.x).
51. J o s t L. GST and its relatives do not measure differentiation. Mol. Ecol., 2008, 17: 4015-4026 (doi: 10.1111/j.1365-294X.2008.03887.x).
52. J o m b a r t T. adegenet: a R package for the multivariate analysis of genetic markers. Bioinfor-matics, 2008, 24: 1403-1405 (doi: 10.1093/bioinformatics/btn129).
53. E x c o f f i e r L., L i s c h e r H.E.L. Arlequin suite ver 3.5: A new series of programs to per-form population genetics analyses under Linux and Windows. Mol. Ecol. Resour., 2010, 10: 564-567 (doi: 10.1111/j.1755-0998.2010.02847.x).
54. P r i t c h a r d J.K., S t e p h e n s M., D o n n e l l y P. Inference of population structure using multilocus genotype data. Genetics, 2000, 155: 945-959.
55. E a r l D.A., v o n H o l d t B.M. Structure Harvester: A website and program for visualizing Structure output and implementing the Evanno method. Conserv. Genet. Resour., 2012, 4: 359-361 (doi: 10.1007/s12686-011-9548-7).
56. E v a n n o G., R e g n a u t S., G o u d e t J. Detecting the number of clusters of individuals using the software STRUCTURE: A simulation study. Mol. Ecol., 2005, 14: 2611-2620 (doi: 10.1111/j.1365-294X.2005.02553.x).
57. M a g e r K.H. Population structure and hybridization of Alaskan caribou and reindeer: integrating ge-netics and local knowledge. Dissertation of the degree doctor of philosophy. Fairbanks, Alaska, 2012.
58. Y u z h a k o v A.A. Nenetskaya aborigennaya poroda severnykh olenei. Avtoreferat doktorskoi dis-sertatsii [Indigenous Nenets reindeer. DSci Thesis]. Novosibirsk, 2004 (in Russ.).
59. M a l y g i n a N.V. Dikii severnyi olen' (Rangifer tarandus L.) Vostochnogo Taimyra. Avtoreferat
821
kandidatskoi dissertatsii [Reindeer (Rangifer tarandus L.) of eastern Taimyr. PhD Thesis]. Mos-cow, 2000 (in Russ.).
60. M c V e a n G. A genealogical interpretation of principal components analysis. PLoS Genet., 2009, 5(10): e1000686 (doi: 10.1371/journal.pgen.1000686).
61. Y u r c h e n k o A.A. Geneticheskaya struktura populyatsii sakhalinskogo taimenya Parahucho per-ryi brevoort i voprosy prirodookhrannoi genetiki vida. Avtoreferat kandidatskoi dissertatsii [Genetic structure of Parahucho perryi brevoort population and conservation genetics of the species. PhD Thesis]. Moscow, 2015 (in Russ.).
62. D a v y d o v A.V. Morfologicheskaya i geneticheskaya differentsiatsiya populyatsii severnogo olenya Evrazii. Avtoreferat kandidatskoi dissertatsii [Morphological and genetic differentiation of the Eurasian reindeer populations. PhD Thesis]. Moscow, 1997.
63. S u n d q v i s t L., K e e n a n K., Z a c k r i s s o n M., P r o d ö h l P., K l e i n h a n s D. Di-rectional genetic differentiation and asymmetric migration. Ecol. Evol., 2016, 6(11): 3461-3475 (doi: 10.1002/ece3.2096).
64. B u r n s J.J. Report of the scientific workshop on caribou in the NPRA. Barrow, Alaska, 1989. 65. K l e i n D.R. Conflicts between domestic reindeer and their wild counterparts: A review of
Eurasian and North American experience. Arctic, 1980, 33: 739-756. 66. J e p s e n B., S i e g i s m u n d H., F r e d h o l m M. Population genetics of the native caribou
(Rangifer tarandus groenlandicus) and the semi-domestic reindeer (Rangifer tarandus tarandus) in Southwestern Greenland: Evidence of introgression. Conserv. Genet., 2002, 3: 401-409 (doi: 10.1023/A:1020523303815).
67. C r o n i n M.A., R e n e c k e r L.A., P i e r s o n B.J., P a t t o n J.C. Genetic variation in do-mestic reindeer and wild caribou in Alaska. Anim. Genet., 1995, 26: 427-434 (doi: 10.1111/j.1365-2052.1995.tb02695.x).
68. C r o n i n M.A., P a t t o n J.C., B a l m y s h e v a N., M a c N e i l M.D. Genetic variation in caribou and reindeer (Rangifer tarandus). Anim. Genet., 2003, 34: 33-41 (doi: 10.1046/j.1365-2052.2003.00927.x).
69. M a g e r K.H., C o l s o n K.E., H u n d e r t m a r k K.J. High genetic connectivity and intro-gression from domestic reindeer characterize northern Alaska caribou herds. Conserv. Genet., 2013, 14: 1111-1123 (doi: 10.1007/s10592-013-0499-2).
70. K h a r z i n o v a V.R., S e r m y a g i n A.A., G l a d y r E.A., O k h l o p k o v I.M., B r e m G., Z i n o v i e v a N.A. A study of applicability of SNP chips developed for Bovine and Ovine species to whole-genome analysis of reindeer Rangifer tarandus. J. Heredity, 2015, 106(6): 758-761 (doi: 10.1093/jhered/esv081).
Events RNA THERAPEUTICS
(22-23 February, 2017, London, United Kingdom)
SMi Group announces the return of its 8th annual RNA Therapeutics conference to London on the 22nd-23rd of February 2017. Technology in RNA interference, oligonucleotides and mRNA has rev-olutionised the way infectious disease, cancer and neurological disorders are treated. It is now possi-ble to target previously ‘un-druggable’ sites, therefore expanding the range of therapeutics that selec-tively silence genes before the disease develops.
This exciting program for 2017 will showcase new developments through clinical and pre-clinical re-sults in topics such as: messenger RNA-based therapeutics, anti-sense oligonucleotides and new sites for RNA silencing.
The main challenge in RNA therapeutics continues to be the delivery of RNA based drugs to target sites outside the liver. Join us in exploring the different delivery systems in use and in development such as transportation with nanoparticles and the ability to enhance drug stability.
We will be reviewing clinical trial updates in RNA-based therapeutics and discussing the current reg-ulations involved in getting drug approval.
Contacts: https://www.cambridgenetwork.co.uk/news/astrazeneca-and-moderna-therapeutics-announce-new-collaboration
Information: http://www.globaleventslist.elsevier.com/events/2016/04/the-application-of-molecular-and-functional-imaging-in-neurodegenerative-disease/
824
AGRICULTURAL BIOLOGY, ISSN 2412-0324 (English ed. Online)
2016, V. 51, ¹ 6, pp. 824-829 (SEL’SKOKHOZYAISTVENNAYA BIOLOGIYA) ISSN 0131-6397 (Russian ed. Print)
ISSN 2313-4836 (Russian ed. Online)
Reproductive biotechnologies UDC 636.2:591.391.1:591.158.1 doi: 10.15389/agrobiology.2016.6.824rus
doi: 10.15389/agrobiology.2016.6.824eng
IN VITRO PRODUCTION OF INTERSPECIES HYBRID EMBRYOS OF CATTLE (Bos taurus) AND WISENT (Bison bonasus)
G.N. SINGINA, V.A. BAGIROV, S.S. DANCH, T.E. TARADAINIK, A.V. DOTSEV, N.A. ZINOVIEVA
L.K. Ernst All-Russian Research Institute of Animal Husbandry, Federal Agency of Scientific Organizations, 60, pos. Dubrovitsy, Podolsk District, Moscow Province, 142132 Russia, e-mail [email protected] Acknowledgements Supported by the Program of Presidium of the Russian Academy of Science (project No IV.13.3) Received September 28, 2016
A b s t r a c t
European bison or wisent (Bison bonasus) is a rare species that is endangered. The technol-ogy for producing in vitro embryos using oocytes of cows and wisent semen can be an effective tool for conservation of genetic resources of this species and their rational use in basic research on the physiology of development and to create the new animals’ types. However, the methods for produc-tion of in vitro embryos using the above-mentioned germ cells are currently not described in the lit-erature. In this work, we first attempted to obtain the hybrid cow-wisent embryos in vitro using the IVM/IVF/IVC protocol, developed for domestic cattle (Bos taurus). Frozen epididymal sperm de-rived from wisent was thawed and prepared by the swim-up procedure. Matured oocytes were co-incubated during 18 h together with prepared sperm in Fert-Talp medium, which was replaced then by embrional medium where the embryos were cultured until the blastocyst state. Additionally, for positive control, a part of matured bovine oocytes were fertilized with frozen/thawed ejaculated bull sperm. Fertilizing capacity of male cells of both species was assessed according to the nature of spermatozoa-egg interactions, as well as the capacity of fertilized bovine oocytes to subsequent embryonic development. It was found that the rate of oocytes with sing polyspermy was higher for fertilization with wisent sperm comparing to allogenic insemination (21.6 vs. 8.5 %, P < 0.05). There were no differences between two types of fertilizations nether for the sperm penetration rate (90.0±0.3 vs. 93.3±1.7 % for bull and wisent, respectively), nor for the rate of normal fertilization (78.3±1.7 % vs. 73.2±2.3 %). The similar cleavage and blastocyst formation rates were observed for two fertilization types. Our data indicate the similarity in the mechanisms of oocyte activation and embryonic development in cow and wisent females. In addition, it is obvious that IVM/IVF/IVP protocol, in general, allows in vitro producing cattle-wisent hybrid embryos, however, high levels of polyspermy observed in heterogeneous fertilization, indicates the necessity to adjust the method.
Keywords: cattle oocytes, the European bison sperm, fertilization in vitro, hybrid embryos
European bison, or wisent, (Bison bonasus) is a rare endangered spe-cies. Current European bison population is strongly inbred. All modern wisents come from 12 individuals kept in the zoos and reserves in the early XX century [1]. Low genetic variability is one of the main threats to the long-term mainte-nance of the species. Assisted reproductive technology such as production of in vitro embryos using oocytes of domestic cattle and wisent semen will not only help to maintain the existing genetic resources of the species, but also to in-volve this species in basic research on the physiology of development and use in creations of new bred forms [2-4].
Cow oocytes are a universal object for interspecific hybridization. In publications, there is evidence of their in vitro fertilization using semen of gaur [5], antelope [6], horse [7], sheep [8], and donkey [9]. Сlose relationship be-tween the species, the lack of specific antigens against wisent spermatozoa in the pellucid zone (PZ) of cow oocytes [10], and the previously described possibility to obtain a hybrid offspring by crossing [11] are the prerequisites for extracorpo-
825
real hybridization between bovine oocytes and wisent sperm. Current development of in vitro technologies makes the efficient and
large-scale obtaining of the embryos of domestic animals possible [12-16]. How-ever, the biological usefulness of oocytes reduces during further embryonic de-velopment with interspecific extracorporeal fertilization (even with closely related species) [17]. One solution to the problem is adjustment of the method depend-ing on the specificity of source gametes and embryos.
Typically, the schemes developed for domestic animals are used for ex-tracorporeal hybridization involving the gametes of rare and wild species as basic IVM (in vitro maturation)/IVF (in vitro fertilization)/IVC (in vitro culture) pro-tocols [17-19]. Own technology for producing embryos in vitro for wisent has not been modeled yet. Cases of Bos taurus and Bison bonasus hybrids under simi-lar conditions have not been described in publications as well.
In this paper, a possibility of formation and development of interspecific hybrids resulting from in vitro fertilization of cow oocytes by wisent sperm until the blastocyst stage is demonstrated for the first time.
The purpose of the study was fertilization of bovine oocytes by wisent sperm and evaluation of their further embryonic development in vitro using a protocol routinely used in vitro for domestic cattle embryos.
Technique. The source of females germ cells were cow ovaries collected after slaughter and delivered to the laboratory within 2-3 hours at 30-35 С.
Oocyte-cumulus complexes (OCC) were isolated by dissecting visible fol-licles and washing 3 times in TC-199 medium containing 5 % fetal bovine serum, 10 μg/ml heparin, 0.2 mM sodium pyruvate, and 50 μg/ml gentamicin (Sigma, USA). Round shape oocytes with homogeneous cytoplasm and uniform width pellucid area surrounded by compact cumulus were collected for the experi-ments. OCC were cultured in groups of 25-35 oocytes in 500 μl of modified TC-199 medium [20] under a layer of light mineral oil (Sigma, USA) for 24 hours. The matures oocyte was transferred to Fert-TALP fertilization medium contain-ing 114 mМ NaCl, 3.2 mМ KCl, 0.4 mМ NaH2PO4½2H2O, 2 mМ CaCl2½2H2O, 0.5 mМ MgCl2½6H2O, 25 mМ NaHCO3, 10 mМ HEPES, 10 mM sodium lactate, 0.25 mM sodium pyruvate, 6 mg/ml bovine serum albumin (BSA), 10 μg/ml heparin, 20 μM penicillamine, 10 μM hypotaurine, 1 μM epinephrine, 0.1 % nonessential amino acids and 50 μg/ml gentamicin (Sigma, USA).
Frozen epididymal semen obtained after the forced shooting of 7 year old wisents was used for fertilization (♀ cow — ♂ wisent fertilization). Bovine semen was the positive control (♀ cow — ♂ bull fertilization). Before the proce-dure, sperm was thawed for 1 min at 37 C and prepared by swim-up procedure [21] using Sperm-TALP medium containing 100 mМ NaCl, 3.1 mМ KC1, 0.3 mМ NaH2PO4∕2H2O, 2 mМ CaCl2∕2H2O, 1.5 mМ MgCl2∕6H2O, 25 mМ NaHCO3, 10 mМ HEPES, 21.6 mM sodium lactate, 1 mM sodium pyruvate, 6 mg/ml BSA (Sigma, USA). The resulting active spermatozoa fraction was add-ed to the dishes with Fert-TALP medium and mature oocytes at a dose of 1.0½106 spermatozoa/ml.
After 18-20 hours of co-culture, cumulus cells and the adhered sperm cells were removed from oocytes, then part of the oocytes was used for the cy-tological analysis of penetration and fertilization rates. The remaining oocytes were transferred to specialized medium [22] and cultured until day 7. The oo-cyte cleavage and blastocyst formation rates were determined.
For the cytogenetic studies of the nuclei of inseminated oocytes, they were fixed in 4 % paraformaldehyde, subjected to permeabilization in 0.5 % Tri-ton X-100 solution, stained with 1 μg/ml DAPI (Sigma, USA), then transferred to a degreased glass slide and embedded in Vectashield medium (Vector Labora-
826
tories, UK). Cytological preparations were examined using fluorescence light microscopy (Axiovert 40 CFL microscope, Carl Zeiss, Germany) at a ½40 mag-nification.
When calculating penetration rate, the presence of condensed sperm heads and male pronuclei in the cytoplasm of mature oocytes were counted. The oocytes with male and female pronuclei, or condensed sperm heads, as well as the ones in anaphase II or telophase II were considered the cells with normal fertilization. In addition, oocytes that contain two or more condensed sperm heads in the cytoplasm and two or more male pronuclei were defined as the oo-cytes with polyspermic fertilization.
OCC maturation and fertilization were carried out, and embryo cultures were maintained in 5 % СО2 atmosphere at a temperature of 38.5 С and 90 % humidity.
Experiments on OCC culture were performed in 3-4 independent repli-cates. The data were processed by ANOVA using SigmaStat software (IBM SPSS, USA). The significance of differences of the mean values compared was assessed using Tukey test. Percentages (X) and the error of the mean (m) are provided.
Results. Domestic cattle (Bos taurus) is the leader in the efficient and large-scale obtaining of embryos in vitro. There is evidence of extracorporeal fer-tilization of bovine oocytes by the semen of different species [6-9], including closely related ones: gaur (Bos gaurus), banteng (B. javanicus) [5], yak (B. grun-niens) [5, 18], African (Syncerus caffer caffer) and Asian (Bubalus bubalis) buffalo [17, 19], and American bison (Bison bison) [23].
Analysis of the data obtained in this study (Table 1) demonstrated an in-crease in the proportion of oocytes with polyspermy at interspecific fertilization (by 13.1 %, P < 0.05) as compared to intraspecific fertilization, but did not re-veal any differences between the two types of fertilization neither in the propor-tion of oocytes with manifestations of sperm penetration through pellucid zone, nor in the proportion of normally fertilized oocytes. According to the published data, polyspermy is observed in 8-55 % at IVF in cows, depending on the indi-vidual characteristics of the bull, sperm concentration and conditions of capaci-tation and fertilization [24, 25].
As in most other studies, to obtain interspecific hybrid embryos, we used the technological system used in extracorporeal fertilization in cattle [26]. As in the case of bovine oocytes contact with bull sperm a polyspermy was lower than when they interacted with wisent sperm, it can be assumed that a too high con-centration of male gametes was used for interspecific fertilization, or the condi-tions for the interaction of male and female cells proved inadequate. It is worth noting that similar results were observed when bovine oocytes were in vitro ferti-lized by yak semen [18].
1. Extracorporeal fertilization of cow (Bos taurus) oocytes by frozen-thawed bull and wisent (Bison bonasus) epididymal semen (X±m)
Fertilization Number of experiments
Inseminated oocytes, n
Proportion of oocytes, %
with penetration with normal fertilization
with polyspermic fertilization
♀cow—♂bull 3 77 90.0±0.3 78.3±1.7 8.5±1.8а ♀cow—♂wisent 3 81 93.3±1.7 73.2±2.3 21.6±0.8b а, b Differences are significant at p < 0.05.
In an earlier study, heterogeneous fertilization of bovine oocytes was used to assess the European bison sperm fertility. The effectiveness of insemina-tion was determined by the penetration of sperm through the oocyte PZ and pronuclei formation [10]. However, embryo formation and development is the
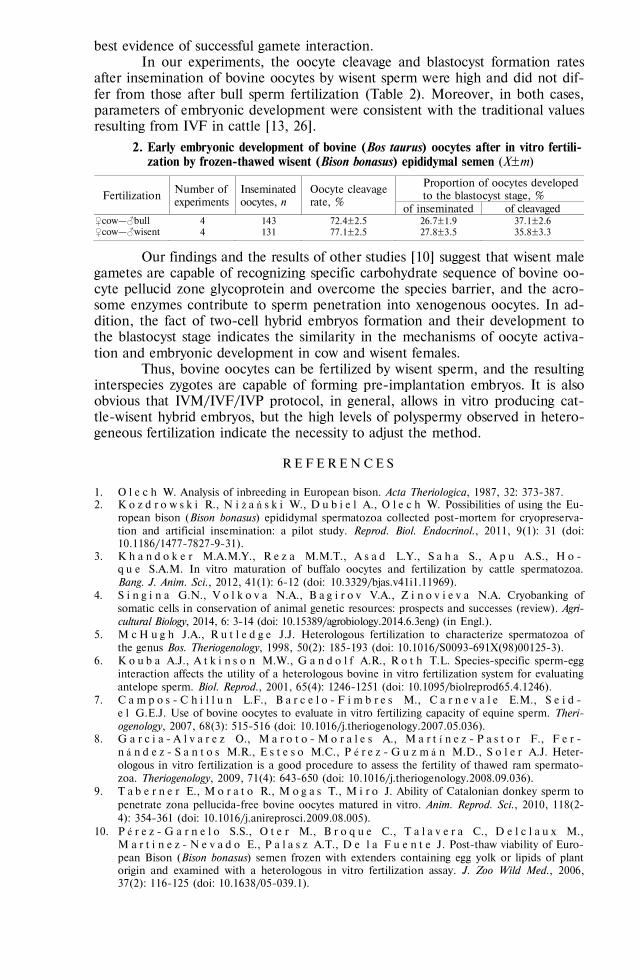
827
best evidence of successful gamete interaction. In our experiments, the oocyte cleavage and blastocyst formation rates
after insemination of bovine oocytes by wisent sperm were high and did not dif-fer from those after bull sperm fertilization (Table 2). Moreover, in both cases, parameters of embryonic development were consistent with the traditional values resulting from IVF in cattle [13, 26].
2. Early embryonic development of bovine (Bos taurus) oocytes after in vitro fertili-zation by frozen-thawed wisent (Bison bonasus) epididymal semen (X±m)
Fertilization Number of experiments
Inseminated oocytes, n
Oocyte cleavage rate, %
Proportion of oocytes developed to the blastocyst stage, %
of inseminated of cleavaged ♀cow—♂bull 4 143 72.4±2.5 26.7±1.9 37.1±2.6 ♀cow—♂wisent 4 131 77.1±2.5 27.8±3.5 35.8±3.3
Our findings and the results of other studies [10] suggest that wisent male gametes are capable of recognizing specific carbohydrate sequence of bovine oo-cyte pellucid zone glycoprotein and overcome the species barrier, and the acro-some enzymes contribute to sperm penetration into xenogenous oocytes. In ad-dition, the fact of two-cell hybrid embryos formation and their development to the blastocyst stage indicates the similarity in the mechanisms of oocyte activa-tion and embryonic development in cow and wisent females.
Thus, bovine oocytes can be fertilized by wisent sperm, and the resulting interspecies zygotes are capable of forming pre-implantation embryos. It is also obvious that IVM/IVF/IVP protocol, in general, allows in vitro producing cat-tle-wisent hybrid embryos, but the high levels of polyspermy observed in hetero-geneous fertilization indicate the necessity to adjust the method.
R E F E R E N C E S
1. O l e c h W. Analysis of inbreeding in European bison. Acta Theriologica, 1987, 32: 373-387. 2. K o z d r o w s k i R., N i ż a ń s k i W., D u b i e l A., O l e c h W. Possibilities of using the Eu-
ropean bison (Bison bonasus) epididymal spermatozoa collected post-mortem for cryopreserva-tion and artificial insemination: a pilot study. Reprod. Biol. Endocrinol., 2011, 9(1): 31 (doi: 10.1186/1477-7827-9-31).
3. K h a n d o k e r M.A.M.Y., R e z a M.M.T., A s a d L.Y., S a h a S., A p u A.S., H o - q u e S.A.M. In vitro maturation of buffalo oocytes and fertilization by cattle spermatozoa. Bang. J. Anim. Sci., 2012, 41(1): 6-12 (doi: 10.3329/bjas.v41i1.11969).
4. S i n g i n a G.N., V o l k o v a N.A., B a g i r o v V.A., Z i n o v i e v a N.A. Cryobanking of somatic cells in conservation of animal genetic resources: prospects and successes (review). Agri-cultural Biology, 2014, 6: 3-14 (doi: 10.15389/agrobiology.2014.6.3eng) (in Engl.).
5. M c H u g h J.A., R u t l e d g e J.J. Heterologous fertilization to characterize spermatozoa of the genus Bos. Theriogenology, 1998, 50(2): 185-193 (doi: 10.1016/S0093-691X(98)00125-3).
6. K o u b a A.J., A t k i n s o n M.W., G a n d o l f A.R., R o t h T.L. Species-specific sperm-egg interaction affects the utility of a heterologous bovine in vitro fertilization system for evaluating antelope sperm. Biol. Reprod., 2001, 65(4): 1246-1251 (doi: 10.1095/biolreprod65.4.1246).
7. C a m p o s - C h i l l u n L.F., B a r c e l o - F i m b r e s M., C a r n e v a l e E.M., S e i d - e l G.E.J. Use of bovine oocytes to evaluate in vitro fertilizing capacity of equine sperm. Theri-ogenology, 2007, 68(3): 515-516 (doi: 10.1016/j.theriogenology.2007.05.036).
8. G a r c i a - A l v a r e z O., M a r o t o - M o r a l e s A., M a r t í n e z - P a s t o r F., F e r -n á n d e z - S a n t o s M.R., E s t e s o M.C., P é r e z - G u z m á n M.D., S o l e r A.J. Heter-ologous in vitro fertilization is a good procedure to assess the fertility of thawed ram spermato-zoa. Theriogenology, 2009, 71(4): 643-650 (doi: 10.1016/j.theriogenology.2008.09.036).
9. T a b e r n e r E., M o r a t o R., M o g a s T., M i r o J. Ability of Catalonian donkey sperm to penetrate zona pellucida-free bovine oocytes matured in vitro. Anim. Reprod. Sci., 2010, 118(2-4): 354-361 (doi: 10.1016/j.anireprosci.2009.08.005).
10. P é r e z - G a r n e l o S.S., O t e r M., B r o q u e C., T a l a v e r a C., D e l c l a u x M., M a r t i n e z - N e v a d o E., P a l a s z A.T., D e l a F u e n t e J. Post-thaw viability of Euro-pean Bison (Bison bonasus) semen frozen with extenders containing egg yolk or lipids of plant origin and examined with a heterologous in vitro fertilization assay. J. Zoo Wild Med., 2006, 37(2): 116-125 (doi: 10.1638/05-039.1).
828
11. E r n s t L.K., A b i l o v A.I., S i p k o T.P., S H u m o v A.V., S o k o l o v s k a y a I.I., K o m b a r o v a N.A., B r o n s k a y a A.V. Molochnoe i myasnoe skotovodstvo, 1993, 4: 19-21 (in Russ.).
12. C o g n i e Y., B a r i l G., P o u l i n N., M e r m i l l o d P. Current status of embryo technolo-gies in sheep and goat. Theriogenology, 2003, 59(1): 171-188 (doi: 10.1016/S0093-691X(02)01270-0).
13. L o n e r g a n P., F a i r T. In vitro-produced bovine embryos: dealing with the warts. Theri-ogenology, 2008, 69(1): 17-22 (doi: 10.1016/j.theriogenology.2007.09.007).
14. G i l M.A., C u e l l o C., P a r r i l l a I., V a z q u e z J.M., R o c a J., M a r t i n e z E.A. Ad-vances in swine in vitro embryo production technologies. Reprod. Domest. Anim., 2010, 45: 40-48 (doi: 10.1111/j.1439-0531.2010.01623.x).
15. H i n r i c h s K. In vitro production of equine embryos: state of the art. Reprod. Domest. Anim., 2010, 45: 3-8 (doi: 10.1111/j.1439-0531.2010.01624.x).
16. D a n g - N g u y e n T.Q., S o m f a i T., H a r a g u c h i S., K i k u c h i K., T a j i m a A., K a n a i Y., N a g a i T. In vitro production of porcine embryos: current status, future perspec-tives and alternative applications. Anim. Sci. J., 2011, 82(3): 374-382 (doi: 10.1111/j.1740-0929.2011.00883.x).
17. O w i n y O.D., B a r r y D.M., A g a b a c M., G o d k e R.A. In vitro production of cattle ½ buffalo hybrid embryos using cattle oocytes and African buffalo (Syncerus caffer caffer) epididy-mal sperm. Theriogenology, 2009, 71(6): 884-894 (doi: 10.1016/j.theriogenology.2008.10.016).
18. Z i X-D., L u H., Y i n R-H., C h e n S-W. Development of embryos after in vitro fertiliza-tion of bovine oocytes with sperm from either yaks (Bos grunniens) or cattle (Bos taurus). Anim. Reprod. Sci., 2008, 108(1-2): 208-215 (doi: 10.1016/j.anireprosci.2007.08.005).
19. K o c h h a r H.P.S., A p p a R a o K.B.C., L u c i a n o A.M., T o t e y S.M., G a n d o l f i F., B a s r u r P.K., K i n g W.A. In vitro production of cattle-water buffalo (Bos taurus Bubalus bubalis) hybrid embryos. Zygote, 2002, 10(2): 155-162 (doi: 10.1017/S0967199402002216).
20. S i n g i n a G., T a r a d a j n i c T., T a r a d a j n i c N., Z i n o v i e v a N. Effects of in vitro culture system modification using CR1aa medium on embryo development and pregnancy rate in cattle. Reprod. Fertil. Dev., 2014, 26(1): 154 (doi: 10.1071/RDv26n1Ab81).
21. P a r r i s h J.J., S u s k o - P a r r i s h J.L., L e i b f r i e d - R u t l e d g e M.L., C r i t s e r E.S., E y e s t o n e W.H., F i r s t N.L. Bovine in vitro fertilization with frozen-thawed semen. Theriogenology, 1986, 25(4): 591-600 (doi: 10.1016/0093-691X(86)90143-3).
22. R o s e n k r a n s C.F.Jr., F i r s t N.L. Effect of free amino acids and vitamins on cleavage and developmental rate of bovine zygotes in vitro. J. Anim. Sci., 1994, 72(2): 434-437.
23. K r i s h n a k u m a r S., W h i t e s i d e D., D a n c e A., E l k i n B., T h u n d a t h i l J. Effect of chilling duration on post-thaw characteristics of sperm from the North American bison (Bi-son bison). Reprod. Dom. Anim., 2013, 48(4): 636-642 (doi: 10.1111/rda.12137).
24. C h i k a m a t s u N., U r a k a w a M., F u k u i Y., A o y a g i Y., O n o H. In vitro fertiliza-tion and early development of bovine follicular oocytes matured in different culture systems and inseminated with spermatozoa treated by different methods. Jpn. J. Anim. Reprod., 1989, 35: 154-158.
25. L o n g C.R., P i n t o - C o r r e i a C., D u b y R.T., Po n ce d e L eo n F.A., B o l a n d M.P., R o c h e J.F., R o b l J.M. Chromatin and microtubule morphology during the first cell cycle in bovine zygotes. Mol. Reprod. Dev., 1993, 36(1): 23-32 (doi: 10.1002/mrd.1080360105).
26. S i n g i n a G.N., T a r a d a i n i k T.E., T a r a d a i n i k N.P. Problema biologii produktivnykh zhivotnykh, 2011, 4: 132-133 (in Russ.).
830
AGRICULTURAL BIOLOGY, ISSN 2412-0324 (English ed. Online)
2016, V. 51, ¹ 6, pp. 830-836 (SEL’SKOKHOZYAISTVENNAYA BIOLOGIYA) ISSN 0131-6397 (Russian ed. Print)
ISSN 2313-4836 (Russian ed. Online) UDC 636.2:636.018:591.147 doi: 10.15389/agrobiology.2016.6.830rus
doi: 10.15389/agrobiology.2016.6.830eng
BLOOD ESTRADIOL LEVEL IN BULL SIRES INFLUENCES SPERM COUNT AND EFFECTIVENESS OF ARTIFICIAL INSEMINATION
A.I. ABILOV1, G.V. ESKIN1, N.A. KOMBAROVA2
1L.K. Ernst All-Russian Research Institute of Animal Husbandry, Federal Agency of Scientific Organizations, pos. Dubrovitsy, Podolsk Region, Moscow Province, 142132 Russia; 2Head Center for Reproduction of Farm Animals OAO, 3, ul. Tsentralnaya, pos. Bykovo, Podolsk Region, Moscow Province, 142143 Russia, e-mail [email protected] Received May 13, 2016
A b s t r a c t
Wide use of artificial insemination necessitates a deeper understanding of how hormones and immune system influence on semen production in sires. With this regard, the role of follicle stimulating hormone and luteinizing hormone in spermatogenesis is under consideration. Blood tes-tosterone and estradiol levels are related and depend on a testosterone-estradiol binding globulin function. We first examined seasonal effects of blood estradiol levels as a reproduction marker in Holstein bull sires and showed the relationship between the blood estradiol concertation, semen fertilizing ability, semen volume, and semen concentration which, in turn, impact on the results of artificial insemination. Estradiol level in Holstein sires aged 30±6 months (n = 18) was assayed using Immuno-FA-E ELISA kit and a Uniplan equipment (ZAO Pikon, Russia). The effectiveness of artificial insemination was tested in 214 cows. We showed that in the bulls the blood estradiol level varied significantly depending on a season (Р < 0.001). In spring, the lowest (0.100 nmol/l) estra-diol level detected in 78 % of the bulls was mostly characteristic, and only in 17 % of the bulls es-tradiol was beyond 0.200 nmol/l (Р < 0.001). At autumn, blood estradiol concentration increased in 94 % bulls (Р < 0.001). When estradiol level rises two times and more, a 31 % decrease in se-men volume per ejaculation is observed (i.e. 3.4 ml vs 4.6 ml) which results in about 50 % de-crease in semen dose number (112 vs 171). When low blood estradiol on the daу of semen collect-ing, a 12-17 % success rate occurred in cows after a single insemination (Р < 0.05), and 17-29 % heifers became pregnant to first insemination (Р < 0.001). Thus the blood estradiol in bulls addi-tionally indicates a fertilizing ability of the semen and can be used to improve effectiveness of arti-ficial insemination technique.
Keywords: estradiol, bull sires, seasonal changes, semen indices, success rate of insemination
For effective breeding and artificial insemination of farm animals, the ra-tional use of sires' sperm [1] should be employed, which requires, in turn, an in-depth research of the role of the hormonal and immune systems in the sperm production. Even V.K. Milovanov [2] indicated to a major importance of sex hormones for normal functioning of both reproductive organs and the whole body of sires. Sexual function of animals is known to be under neuroendocrine control. Hormones exert their effects on the metabolism and all physiological functions at very low concentrations (10-6-10-12 mol/l) [3]. In all mammalians, spermatogenesis is modulated by peptide and steroid hormones, such as follicle-stimulating hormone (FSH) and luteinizing hormone (LH), testosterone, estra-diol, etc. [4]. Under the influence of LH, which is secreted by the pituitary gland after puberty, Leydig cells begin actively to synthesize testosterone which acts on Sertoli cells. Steroid hormones secreted by the testes are represented by androgens and progesterone. They can easily penetrate the cytoplasm and con-trol the cell function, with the participation of specific high-molecular-weight protein receptors [3, 5-7].
Significant variations in the testosterone concentrations have been doc-umented in animals of different origin. Thus, in the Sverdlovsk region, testos-
831
terone concentrations in sires imported from abroad were 1.64 times higher than those in domestic bulls (14.28±2.26 vs. 8.72±1.92 nmol/l) [8]. M. Anderson [9] reported a positive correlation between the testosterone concentrations in bulls and the pregnancy occurrence in cows. In addition, there was a high positive correlation between the sperm counts in the semen and the amounts of testos-terone, as well as a negative correlation between the semen pH and testosterone blood concentrations [10]. Testosterone levels in the blood of bulls correlate with their age and breed (higher in beef breeds vs. milk breeds) as well as exogenous factors [11). A positive correlation has been identified between the concentra-tions of cholesterol and testosterone in bulls, where the latter increases when the former is raised [12].
Testosterone-estradiol binding globulin, involved in transport, regulato-ry and protective functions, plays a major role in the formation of the testos-terone/estradiol complex. A certain amount of androgens is converted to DHT and estradiol. Estradiol is synthesized from testosterone by the enzyme aroma-tase [13, 14]. In mammalian males, the adrenal glands also produce estrogens, moreover, their positive impact on the quality of sperm is observed.
Estrogens influence the development of the genitals and the secondary sexual characteristics, fat metabolism (in particular, increase the plasma concen-trations of phospholipids and β-lipoprotein, reduce the levels of cholesterol and -lipoprotein), stimulate protein anabolism and the growth hormone production, and slow bone growth in mature adult animals. Under influence of estrogens, the reticuloendothelial system is stimulated, the body's resistance to infections in-creases, and tissue regeneration is enhanced [3]. LH induces the secretion of an-drogens in the testes, stimulates the development of interstitial tissue and the production of the male hormone testosterone, and, together with FSH, promotes the proliferation of the seminiferous tubules (the initial stages of spermatogene-sis). In males and females, FSH promotes the development of sperm and egg cells, respectively [2, 3].
However, at high doses, estrogens can cause the opposite effect (up to necrotic phenomena in the kidneys and liver) [3]. With increases in the concen-trations of estradiol over the upper limits, worsening of spermatologic parameters has been revealed [15]. The excess weight in sires may serve as an indirect signal of excessive amounts of estrogens and worsened quantitative and qualitative indi-cators of the sperm [16, 17].
A.I. Abilov et al. [11] revealed the dependence of the blood concentra-tions of estradiols in sires on exogenous factors. Furthermore, the quantitative indicators of the sperm production increased with decreasing amounts of estradi-ol. There is evidence on the relationship between the spermatozoa autoantibod-ies in sires and the estradiol concentrations [18].
With increasing productivity in cattle, hormonal processes, metabolic rate [19] and, as a consequence, the reproductive capacity are changed. There-fore, it is important to take into account the productive type of the animal when studying its hormonal status.
In view of the discussion on the role of estrogens in the sperm produc-tion, papers assessing the impact of phyto-, xenoestrogens and chemically syn-thesized estradiol on the metabolism and animal reproductive function are also of interest. Xenoestrogens demonstrate activity similar to that of the endogenous estrogens and mimic their properties, therefore, influencing the synthesis, secre-tion, transport, metabolism, binding and excretion of endogenous hormones in-volved in the regulation of homeostasis, reproduction and development [20]. Da-ta are available for the negative impact of phytoestrogens on reproductive func-tion. For instance, it has been shown that phytoestrogens may inhibit LH and
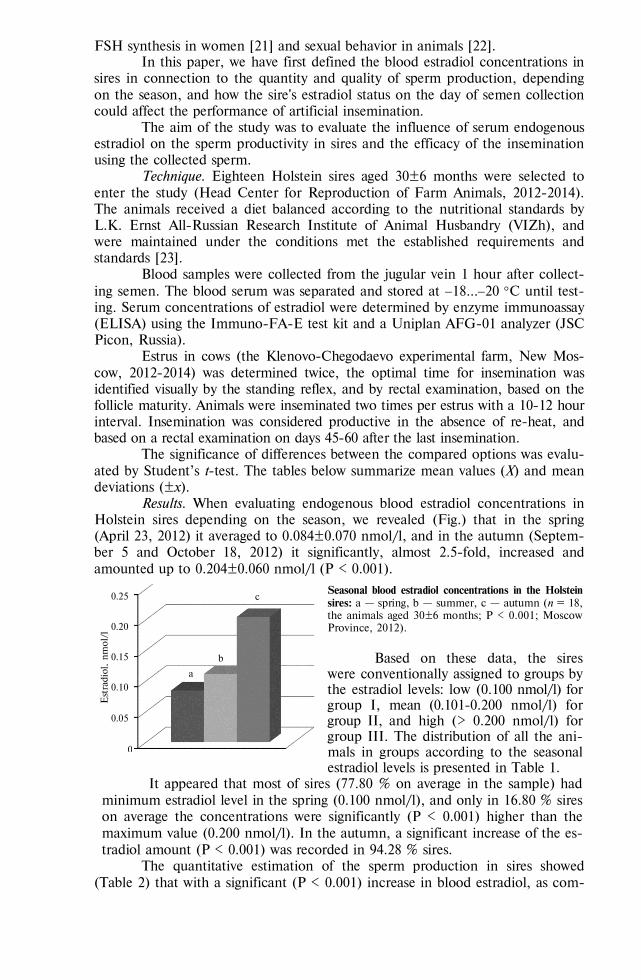
832
FSH synthesis in women [21] and sexual behavior in animals [22]. In this paper, we have first defined the blood estradiol concentrations in
sires in connection to the quantity and quality of sperm production, depending on the season, and how the sire's estradiol status on the day of semen collection could affect the performance of artificial insemination.
The aim of the study was to evaluate the influence of serum endogenous estradiol on the sperm productivity in sires and the efficacy of the insemination using the collected sperm.
Technique. Eighteen Holstein sires aged 30±6 months were selected to enter the study (Head Center for Reproduction of Farm Animals, 2012-2014). The animals received a diet balanced according to the nutritional standards by L.K. Ernst All-Russian Research Institute of Animal Husbandry (VIZh), and were maintained under the conditions met the established requirements and standards [23].
Blood samples were collected from the jugular vein 1 hour after collect-ing semen. The blood serum was separated and stored at 18…20 С until test-ing. Serum concentrations of estradiol were determined by enzyme immunoassay (ELISA) using the Immuno-FA-E test kit and a Uniplan AFG-01 analyzer (JSC Picon, Russia).
Estrus in cows (the Klenovo-Chegodaevo experimental farm, New Mos-cow, 2012-2014) was determined twice, the optimal time for insemination was identified visually by the standing reflex, and by rectal examination, based on the follicle maturity. Animals were inseminated two times per estrus with a 10-12 hour interval. Insemination was considered productive in the absence of re-heat, and based on a rectal examination on days 45-60 after the last insemination.
The significance of differences between the compared options was evalu-ated by Student’s t-test. The tables below summarize mean values (X) and mean deviations (±х).
Results. When evaluating endogenous blood estradiol concentrations in Holstein sires depending on the season, we revealed (Fig.) that in the spring (April 23, 2012) it averaged to 0.084±0.070 nmol/l, and in the autumn (Septem-ber 5 and October 18, 2012) it significantly, almost 2.5-fold, increased and amounted up to 0.204±0.060 nmol/l (P < 0.001).
Seasonal blood estradiol concentrations in the Holstein sires: a — spring, b — summer, c — autumn (n = 18, the animals aged 30±6 months; P < 0.001; Moscow Province, 2012).
Based on these data, the sires were conventionally assigned to groups by the estradiol levels: low (0.100 nmol/l) for group I, mean (0.101-0.200 nmol/l) for group II, and high (> 0.200 nmol/l) for group III. The distribution of all the ani-mals in groups according to the seasonal estradiol levels is presented in Table 1.
It appeared that most of sires (77.80 % on average in the sample) had minimum estradiol level in the spring (0.100 nmol/l), and only in 16.80 % sires on average the concentrations were significantly (P < 0.001) higher than the maximum value (0.200 nmol/l). In the autumn, a significant increase of the es-tradiol amount (P < 0.001) was recorded in 94.28 % sires.
The quantitative estimation of the sperm production in sires showed (Table 2) that with a significant (P < 0.001) increase in blood estradiol, as com-
a
b b
a
c 0.25
0.20
0.15
0.10
0.05
0
Еst
radi
ol, nm
ol/
l
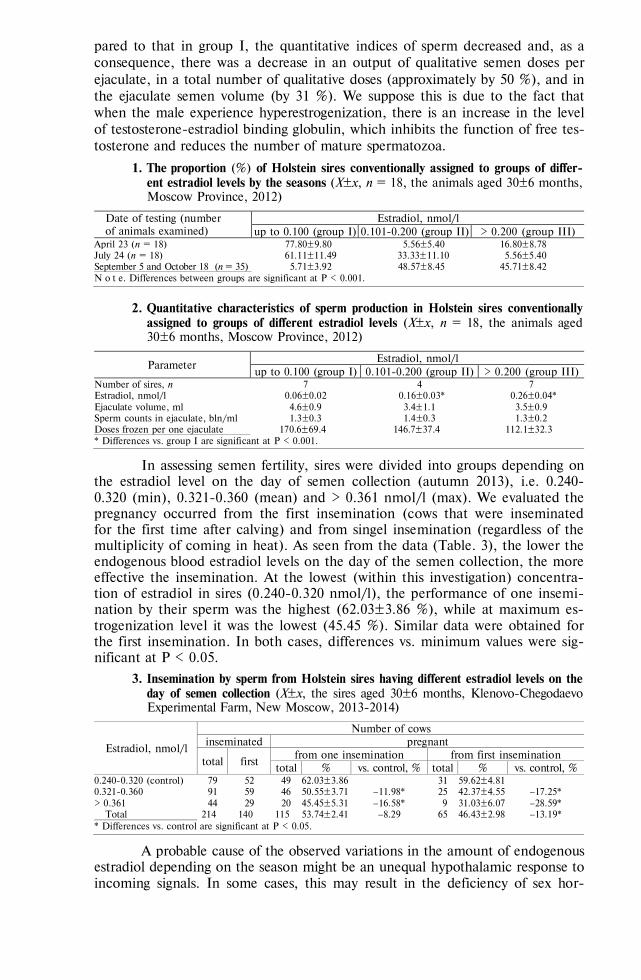
833
pared to that in group I, the quantitative indices of sperm decreased and, as a consequence, there was a decrease in an output of qualitative semen doses per ejaculate, in a total number of qualitative doses (approximately by 50 %), and in the ejaculate semen volume (by 31 %). We suppose this is due to the fact that when the male experience hyperestrogenization, there is an increase in the level of testosterone-estradiol binding globulin, which inhibits the function of free tes-tosterone and reduces the number of mature spermatozoa.
1. The proportion (%) of Holstein sires conventionally assigned to groups of differ-ent estradiol levels by the seasons (X±x, n = 18, the animals aged 30±6 months, Moscow Province, 2012)
Date of testing (number of animals examined)
Estradiol, nmol/l up to 0.100 (group I) 0.101-0.200 (group II) > 0.200 (group III)
April 23 (n = 18) 77.80±9.80 5.56±5.40 16.80±8.78 July 24 (n = 18) 61.11±11.49 33.33±11.10 5.56±5.40 September 5 and October 18 (n = 35) 5.71±3.92 48.57±8.45 45.71±8.42 N o t e. Differences between groups are significant at P < 0.001.
2. Quantitative characteristics of sperm production in Holstein sires conventionally assigned to groups of different estradiol levels (X±x, n = 18, the animals aged 30±6 months, Moscow Province, 2012)
Parameter Estradiol, nmol/l
up to 0.100 (group I) 0.101-0.200 (group II) > 0.200 (group III) Number of sires, n 7 4 7 Estradiol, nmol/l 0.06±0.02 0.16±0.03* 0.26±0.04* Ejaculate volume, ml 4.6±0.9 3.4±1.1 3.5±0.9 Sperm counts in ejaculate, bln/ml 1.3±0.3 1.4±0.3 1.3±0.2 Doses frozen per one ejaculate 170.6±69.4 146.7±37.4 112.1±32.3 * Differences vs. group I are significant at Р < 0.001.
In assessing semen fertility, sires were divided into groups depending on the estradiol level on the day of semen collection (autumn 2013), i.e. 0.240-0.320 (min), 0.321-0.360 (mean) and > 0.361 nmol/l (max). We evaluated the pregnancy occurred from the first insemination (cows that were inseminated for the first time after calving) and from singel insemination (regardless of the multiplicity of coming in heat). As seen from the data (Table. 3), the lower the endogenous blood estradiol levels on the day of the semen collection, the more effective the insemination. At the lowest (within this investigation) concentra-tion of estradiol in sires (0.240-0.320 nmol/l), the performance of one insemi-nation by their sperm was the highest (62.03±3.86 %), while at maximum es-trogenization level it was the lowest (45.45 %). Similar data were obtained for the first insemination. In both cases, differences vs. minimum values were sig-nificant at P < 0.05.
3. Insemination by sperm from Holstein sires having different estradiol levels on the day of semen collection (X±x, the sires aged 30±6 months, Klenovo-Chegodaevo Experimental Farm, New Moscow, 2013-2014)
Estradiol, nmol/l
Number of cows inseminated pregnant
total first from one insemination from first insemination
total % vs. control, % total % vs. control, % 0.240-0.320 (control) 79 52 49 62.03±3.86 31 59.62±4.81 0.321-0.360 91 59 46 50.55±3.71 11.98* 25 42.37±4.55 17.25* > 0.361 44 29 20 45.45±5.31 16.58* 9 31.03±6.07 28.59*
Total 214 140 115 53.74±2.41 8.29 65 46.43±2.98 13.19* * Differences vs. control are significant at Р < 0.05.
A probable cause of the observed variations in the amount of endogenous estradiol depending on the season might be an unequal hypothalamic response to incoming signals. In some cases, this may result in the deficiency of sex hor-
834
mone binding globulin, as well as in increased levels of LH and FSH, leading to manifestation of the primary and secondary testicular failure that may cause a drastic change in blood estradiol concentrations [19]. Our findings are consistent with the results showing that hyperestrogenization increases the amount of tes-tosterone-estradiol binding globulin, and this in turn suppresses the free testos-terone function and leads to deterioration of spermatologic parameters [15], in-cluding reduced sexual activity and number of spermatozoa in the ejaculate. In-creased serum estradiol concentrations may also serve as an indicator of the on-set of fatty liver disease (especially if sires are fed with concentrates).
Thus, the level of endogenous blood serum estradiol in sires significantly (P < 0.001) varies depending on the season, that affects the sperm productivity (P < 0.001) and the insemination (P < 0.05). Low levels of estradiol exert a positive effect on quantitative characteristics of sperm production with an in-crease in ejaculate volume by 31 %, and in the output of high-quality doses by 52 %. The number of successful inseminations, resulted in pregnancy from single or from the first insemination, is inversely proportional to the blood estradiol level in sires on the day of semen collection. These data can be used as an addi-tional test in predicting the results of artificial insemination.
R E F E R E N C E S
1. E r n s t L.K., S u b b o t i n A.D. Materialy Mezhdunarodnoi nauchno-prakticheskoi konferentsii «Rol' i znachenie metoda iskusstvennogo osemeneniya sel'skokhozyaistvennykh zhivotnykh v pro-gresse zhivotnovodstva XX-XXI vekov» [Proc. Int. Conf. «Artificial insemination and progress in animal husbandry in XX-XXI»]. Dubrovitsy, 2004: 10-26 (in Russ.).
2. M i l o v a n o v V.K. Biologiya vosproizvedeniya i iskusstvennogo osemeneniya zhivotnykh [Biology of animal reproduction and artificial insemination]. Moscow, 1962 (in Russ.).
3. A l i e v A.A. Obmen veshchestv u zhvachnykh zhivotnykh [Metabolism in ruminants]. Moscow, 1997 (in Russ.).
4. K u m a n o v P., N a n d i p a t i K., T o m o v a A., A g a r w a l A. Inhibin B is a better marker of spermatogenesis than other hormones in the evaluation of male factor infertility. Fer-til. Steril., 2006, 86: 332-338.
5. S v e r d l o f f R., B k h a s i n Sh. V knige: Endokrinologiya /Pod redaktsiei N. Lavina [In: En-docrinology. N. Lavin (ed.)]. Moscow, 1999: 369-409.
6. B r o w d e r L. Developmental biology. Philadelphia, Saunders, 1980: 146-231. 7 . Biology of fertilization. V. 3. The fertilization response of the egg. C.B. Metz, A. Monroy (eds.).
Academic Press, Orlando, FL, 1985: 1-44. 8. M y m r i n V.S., K h a l t u r i n a L.V., S h k u r a t o v a I.A., R y a p o s o v a M.V. Mo-
lochnoe i myasnoe skotovodstvo, 2012, 4: 7-9 (in Russ.). 9. A n d e r s o n M. Relationship between GnRH-induced sperm motility and fertility in Ayrshire
bulls. Animal Reprod. Sci., 1992, 27(2): 107-111. 10. C h a c u r M.G.M., M i z u s a k i K.T., G a b r i e l F i l h o L.R.A., O b a E., R a m o s A.A.
Seasonal effects on semen and testosterone in Zebu and Taurine bulls. Acta Scientiae Veterinari-ae, 2013, 41: pub. 1110.
11. A b i l o v A.I., K o m b a r o v a N.A., M i t y a s h o v a O.S. Materialy Х Konferentsii mo-lodykh uchenykh s mezhdunarodnym uchastiem «Sovremennye dostizheniya i problemy bio-tekhnologii sel'skokhozyaistvennykh zhivotnykh — BioTekhZH-2015» [Proc. X Int. Young Scien-tists Conf. «Recent advances and challenges in farm animals’ biotechnology — BioTechAni-mals-2015]. Dubrovitsy, 2015: 182-192 (in Russ.).
12. A m e r k h a n o v Kh.A., A b i l o v A.I., E s k i n G.V., K o m b a r o v a N.A., T u r b i - n a I.S., F e d o r o v a E.V., V a r e n n i k o v M.V., G u s e v I.V. Concentration of testos-terone and cholesterol in blood serum of servicing bulls depending on their type of productivity, age and the season. Sel’skokhozyaistvennaya biologiya [Agricultural Biology], 2014, 2: 59-66 (doi: 10.15389/agrobiology.2014.2.59rus) (in Russ.).
13. Re z n i k o v A.G., V a r g a S.V. Antiandrogeny [Anti-androgens]. Moscow, 1988 (in Russ.). 14. Re z n i k o v A.G. Polovye gormony i differentsiatsiya mozga [Sexual hormones and brain differ-
entiation]. Kiev, 1982 (in Russ.). 15. G u t o r o v a N.V., O s a d c h u k L.V., K l e s h o v M.A., K u z n e t s o v a N.N., O s a d -
c h u k A.V. Problemy reproduktsii, 2010, 6: 89-93 (in Russ.). 16. F e j e s I., K o l o s z a r S., Z a v a c z k i Z., D a r u J., S z o l l o s i J., P a l A. Effect of
835
body weight on testosterone, estradiol ratio in oligozoospermie patients. Arch. Androl., 2006, 52: 97-102.
17. Q i n D.D., Y u a n W., Z h o u W.J., C u i Y., W u J., G a o E. Do reproductive hor-mones explain the association between body mass index and semen quality? Asian J. Androl., 2007, 9: 827-834.
18. A b i l o v A.I., A m e r k h a n o v Kh.A., E s k i n G.V., F e d o r o v a E.V., Z h a - v o r o n k o v a N.V., K o m b a r o v a N.A., V a r e n n i k o v M.V. Zootekhniya, 2013, 11: 9-11 (in Russ.).
19. S m i r n o v a E.V., N e z h d a n o v A.G., R e t s k y M.I., B r a t c h e n k o E.V., P a - p i n N.E., S t e p a n o v A.V., S h u s h l e b i n V.I., C h u s o v a G.G. The metabolic profile of late pregnant cows of various ethological activity types. Sel’skokhozyaistvennaya biologiya [Ag-ricultural Biology], 2014, 2: 67-71 (doi: 10.15389/agrobiology.2014.2.67rus) (in Russ.).
20. D i a m a n t i - K a n d a r a k i s E., B o u r g u i g n o n J.P., G i u d i c e L.C., H a u s e r R., P r i n s G.S., S o t o A.M., Z o e l l e r R.T., G o r e A.C. Endocrine-disrupting chemicals: an Endocrine Society scientific statement. Endocr. Rev., 2009, 30(4): 293-342 (doi: 10.1210/er.2009-0002).
21. H o o p e r L., R y d e r J.J., Ku r z e r M.S., L a m p e J.W., M e s s i n a M.J., P h i p p s W.R., C a s s i d y A. Effects of soy protein and isoflavones on circulating hormone concentrations in pre- and post-menopausal women: a systematic revive and meta-analysis. Hum. Reprod. Update, 2009, 15: 423-440.
22. P a t i s a u l H.B., J e f f e r s o n W. The pros and cons of phytoestrogens. Front. Neuroendocrin., 2010, 31(4): 400-419.
23. Natsional'naya tekhnologiya zamorazhivaniya i ispol'zovaniya spermy plemennykh bykov-proizvoditelei /Pod redaktsiei N.M. Reshetnikovoi, A.I. Abilova [National Technique for freezing and usage of sperm from bull sires. N.M. Reshetnikova, A.I. Abilov (eds.)]. Moscow, 2008 (in Russ.).
837
AGRICULTURAL BIOLOGY, ISSN 2412-0324 (English ed. Online)
2016, V. 51, ¹ 6, pp. 837-844 (SEL’SKOKHOZYAISTVENNAYA BIOLOGIYA) ISSN 0131-6397 (Russian ed. Print)
ISSN 2313-4836 (Russian ed. Online)
African swine fever: virus proteomics, diagnostics UDC 636.4:619:616.636:578:[577.2.08+51-76 doi: 10.15389/agrobiology.2016.6.837rus
doi: 10.15389/agrobiology.2016.6.837eng
EXPRESSION OF RECOMBINANT GENES ENCODING FRAGMENTS OF THE PROTECTIVE IMPORTANT PROTEINS OF AFRICAN SWINE
FEVER VIRUS IN EUCARYOTIC CELLS
A.R. IMATDINOV, A.D. SEREDA, I.R. IMATDINOV, A.S. KAZAKOVA, O.A. DUBROVSKAYA, D.V. KOLBASOV
All-Russian Institute of Veterinary Virology and Microbiology, Federal Agency of Scientific Organizations, 1, ul. Akade-mika Bakuleva, pos. Vol’ginskii, Petushinskii Region, Vladimir Province, 601125 Russia, e-mail [email protected] Acknowledgements: We thank Prof. V.M. Balyshev, Dr S.P. Zhivoderov and Dr I.A. Titov for assistance in carrying out the work. Supported by Russian Science Foundation (the research project «Design of African swine fever virus candidate vac-cine based on chimeric viruses», contract No 16-16-00090) Received August 30, 2016
A b s t r a c t
Control of African swine fever (ASF) is complicated by the lack of specific prevention medications. The attempts to obtain live attenuated vaccines by conventional methods were not promising, and the inactivated or subunit vaccines have not been developed so far (N.J. Petiska, 1965; D.V. Kolbasov et al., 2014; V. Makarov et al., 2016). The investigation of protective immune response against ASF virus (ASFV) enabled determination of a critical role of cellular defense mechanisms and the most important viral proteins p30, p54 and CD2v (or gp 110-140) involved (P. Gomez-Puertas еt al., 1998; J.M. Argilaguet et al., 2012; A.D. Sereda et al., 2015). In view to develop a DNA vaccine against ASFV seroimmunotype 3 we have constructed a set of hybrid plasmids containing fragments of ASFV genes CP204L, E183L and EP402R from attenuated strain MK-200 (pCI-neo/ASFV/p30, pCI-neo/ASFV/p54 and pCI-neo/ASFV/CD2v). To study expression of the antigenically active polypeptide products for recombinant proteins rp30, rp54 and rCD2v in the eukaryotic cells, we transfected human embryonic kidney cells HEK293T, which stably express the SV40 large T antigen, with recombinant plasmids pCI-neo/ASFV/p30, pCI-neo/ASFV/p54 and pCI-neo/ASFV/CD2v. By immunoblotting, the polypeptides of the expressed recombinant proteins were identified in the HEK293T cell lysates and characterized for their molecular weights. Regarding size, some antigenically active recombinant polypeptides were as calculated, whereas the other ones apparently resulted from post translational modification. We identified a 21.6 kDa polypeptide after pCI-neo/ASFV/p30 transfection, a major (20.9 kDa) and a minor (36.3 kDa) polypeptides after pCI-neo/ASFV/p54 transfection, and, finally, major polypeptides of 39.8 kDa and 63.1 kDa, together with minor polypeptides of 28.8 kDa and 104.7 kDa when pCI-neo/ASFV/CD2v transfected. These genetic constructions will be helpful to investigate antigenic, immunogenic and protective properties of ASFV recombinant proteins rp30, rp54 and rCD2v.
Keywords: African swine fever, recombinant genes and proteins, transfection, antigenicity
African swine fever (ASF) is a contagious viral septic disease of swine, characterized by fever, toxical signs, hemorrhagic diathesis and high mortality; it may be hyperacute, acute, subacute, chronic and asymptomatic. In acute, the most common form of infection, 100 % of animals die within 5-10 days after onset of clinical signs. The disease affects wild boars and domestic pigs, is transmitted from sick animals and virus carriers through direct contact, alimen-tary and transplacentally [1]. In the South Eastern Africa, the evolution of ASF virus occurs within the sylvatic cycle, which includes warthogs and ticks of the genus Ornitodoros [2, 3]. After outbreaks of ASF reported in Georgia in 2007, the disease has spread to Armenia, Azerbaijan, Nagorno-Karabakh, Iran, Abkha-zia, Russia, the Baltic States, Belarus, Poland, and Ukraine [4-6].
The infection control is complicated by the lack of specific prevention.
838
The attempts to immunize domestic pigs with attenuated strains of ASF in Spain and Portugal in the 1960s were unsuccessful [7, 8]. Later, it was confirmed that due to the high probability of reversion and poor immunobiological characteris-tics of many attenuated strains the live vaccines based on them were unsuitable for widespread use [9].
The experiments to develop inactivated or subunit vaccines against ASF using conventional methods have also failed because of their inability to induce cell-mediated immunity, which plays a crucial role in the formation of protec-tion at ASF [10-12]. However, the research on the development of safe protec-tive candidate drugs for the temporary protection of swine, ensuring their pro-tection in enzootic areas or the planned slaughter on large pig farms, is ongoing [9, 13]. It has been shown that immunization of swine with recombinant p30 and p54 proteins or a preparation of the GP 110-140 serotype-specific major vi-ral glycoprotein led to partial protection of animals against challenge with ho-mologous virulent isolates [14-17].
The investigation of the protective properties of DNA constructs con-taining the genes of p30, p54 and CD2v proteins (GP 110-140) suggests a cru-cial role of the latter in the formation of protection against ASF [18, 19]. There-fore, the research of antigenic and immunogenic characteristics of the expression products of the DNA constructs, encoding genes of the protectively important ASF virus (ASFV) proteins, opens up perspectives for a new generation of drugs against virulent isolates of different immunotypes. The necessary steps of this work are cloning genes in the DNA constructs, their expression in eukaryotic systems, and the confirmation of deriving antigenically active translation prod-ucts [20]. We believe that attenuated strains of ASF virus, which are character-ized by the seroimmunotype and protective properties, should be used as a source of viral genes.
In this work, for the first time we have constructed hybrid plasmids that are suitable for proteomic research and development of the DNA vaccine against ASFV of seroimmunotype III.
Our purpose was to derive DNA constructs containing fragments of the CP204L, E183L, EP402R genes of the ASFV (seroimmunotype III), and identify the corresponding antigenically active translational products of the recombinant rp30, rp54, rCD2v proteins in the transfected eukaryotic cells.
Technique. Mozambique-78 (M-78) and Stavropol 01/08 (highly viru-lent) ASFV strains of seroimmunotypes III and VIII, as well as the MK-200 strain and the Stavropol 01/08 A4C2/9k variant (attenuated) are deposited in the State Collection of Microorganisms (All-Russian Research Institute of Veterinary Virology and Microbiology — VNIIVViM) [21-23].
Protocols to obtain antisera were as follows: No. 1 — twice intramuscular administration of the Stavropol 01/08 A4S2/9k attenuated variant at a dose of 103 HAU50 to a domestic pig (days 0 and 14), intramuscular infection with the Stav-ropol 01/08 virulent strain at a dose of 103 HAU50 (day 28) and bleeding the ani-mal (on day 35 after the start of the experiment); No. 2 — blood withdrawal on day 24 after a single intramuscular inoculation of the MK-200 attenuated strain (106.5 HAU50) to a wild boar; No. 3 — a single intramuscular inoculation of the MK-200 attenuated strain at a dose of 106.5 HAU50 (day 0) to a domestic pig, in-tramuscular infection with the M-78 virulent strain at a dose of 103 HAU50 (day 21) and bleeding the animal (on day 35 after the start of the experiment).
The PCR mixture contained the primers, flanking genes CP204L, E183L, EP402R of ASFV MC-200 strain. For the accumulation of PCR products, previ-ously obtained recombinant plasmids pJET1.2/p30-M200/2, pJET1.2/p54-M200/1 and pJET1.2/CD2v-M200/10 were used. Ligation was performed using a commer-
839
cial kit CloneJET PCR Cloning Kit according to the manufacturer's recommenda-tions (Thermo Fisher Scientific, Inc., USA) and description [24].
Competent cells of the Escherichia coli XL-1 strain were transformed by heat shock in the presence of Ca2+ ions [25]. Plasmids were isolated from the selected ampicillin-resistant transformants, and the presence of specific inserts was confirmed by the restriction analysis.
Nucleotide sequences of the derived chimerical structures, containing CP204L, E183L and EP402R genes in the pJET1.2 and pCI-neo plasmids, were determined using an Applied Biosystems 3130xl genetic analyzer (Applied Bio-systems, Inc., USA).
A human embryonic kidney cell line transformed with the gene of T-antigen of SV40 virus (HEK293T; the Collection of Cell Cultures, VNIIVViM) was transfected with the pCI-neo/ASFV/p30/1, pCI-neo/ASFV/p54/1 and pCI-neo/ASFV/CD2v/1 recombinant plasmids by the calcium-phosphate method ac-cording to the guidelines [26], and cultured for 1 to 5 days after the change of the Eagle's MEM (Chumakov Federal Scientific Center for Research and De-velopment of Immune-and-Biological Products, Russia). Transfection was moni-tored by the GFP protein expression, with plasmid phMGFP as positive control (Promega, USA) using an Olympus MIT-2 inverted fluorescence microscope (Olympus Corp., Japan). Transfected cells were collected from the substrate me-chanically, after thrice washing off from serum proteins with phosphate buffered saline pH 7.2 (FBS), then sedimented by centrifugation (3,000 g, 10 min) and frozen at 70 С. Further, 106 cells were lyzed in 1 cm3 of RIPA-buffer [24], the cell debris was pelleted by centrifugation (3,000 g, 20 min) and the superna-tants were investigated by Western blot analysis. Electrophoresis, electromigra-tion and Western blot analysis were performed by U.K. Laemmle [27], J. Kyhse-Andersen [28] and J.M. Escribano, E. Tabares [29].
The BLASTn program was used to compare the nucleotide sequences of the derived chimerical constructs with those published in GenBank (available on the website http://www.ncbi.nlm.nih.gov/BLAST/). Alignment and analysis were performed using the BioEdit 7.2.5 software (intellectual property of Tom Hall, Freeware) and uGene 1.22 (LLC Novosibirsk Center of Information Technologies UniPro). Prediction of epitopes and structural elements was performed using online servers (Technical University of Denmark, http://www.cbs.dtu.dk/cgi-bin/).
Results. Bioinforma-tic analysis of three poten-tially protective proteins, the p30, p54 and CD2v, of ASFV MK-200 strain re-vealed the signal sequences, transmembrane regions and potential sites for post-
translational modifications. This resulted in identification of extracellular (external to virion) domains of membrane-spanning proteins that carry the highest num-ber of predicted B- and T-cell epitopes in the amino acid sequences.
A clonable region of gene EP402R with 49-651 bp (201 residues) exclud-ed native signal and membrane-spanning regions as well as a cytoplasmic do-main with 721-1137 bp. Similar regions were localized for CP204L (142-546 bp) and E183L (160-597 bp) genes. Primers were designed in accordance with the further strategy of "seamless" cloning of DNA constructs by D.G. Gibson et al. [30]. The nucleotide sequences of the specific primers are shown in the Table.
To improve the efficiency of intracellular sorting of these proteins, we used the universal signal elements from heterologous viruses, i.e. the signal se-
Specific oligonucleotide primers, flanking regions of genes encoding p30, p54 and CD2v proteins
Name Nucleotide sequence F-p30Domen 5´-AGTACTGTTAAGTATGATATTGTGAAATCTG-3´ R-p30Domen 5´-AAGTTTAATAACCATGAGTCTTACCACC-3´ F-p54Domen 5´-TCCTCAAGAAAGAAAAAAGCTGCTGCTATTGAG-3´R-p54Domen 5´-CAAGGAGTTTTCTAGGTCTTTATGCGTATAGG-3´ F-CD2-IgHA 5´-AGTTATAATGAAACAATAATTTTAAATAGTAAT-3´ R-CD2-IgHA 5´-GTGATTTCCTAATAAAAAAGAATATTGATAATA-3´
840
quence of fusion (F) glycoprotein of human parainfluenza virus type 1 and a transmembrane region of the HN protein of Sendai virus. To do this, the p30-Domain, p54-Domain and CD2v-IgHA amplicons were subcloned with signal sequences and membrane-spanning regions into the pJET1.2 plasmid vector (Thermo Fisher Scientific, Inc., USA). Based on the PCR screening and re-striction analysis, the clones were selected which contained plasmids with the specific nucleotide insertions. Plasmid sequencing showed the integrity of read-ing frames of the obtained chimerical sequences.
At the next stage, DNA constructs, expressing in eukaryotic cells, were ob-tained. For this purpose, the corresponding nucleotide sequences were re-cloned in-to the pCI-neo plasmid vector (Promega, USA) in the NheI and SmaI restriction sites. A CMV promoter in the pCI-neo vector ensures the high expression in eukar-yotic systems. The maps of open reading frames of the chimerical genes are shown in Figure 1.
Fig. 1. A diagram of open reading frames for the chimerical genes with cloned sequences of the frag-ments encoding p30, p54 and CD2v proteins of African swine fever virus in the resulting DNA con-structs: A — pCI-neo/ASFV/p30, B — pCI-neo/ASFV/p54, C — pCI-neo/ASFV/CD2v; CMV en-hancer/promoter — the human cytomegalovirus immediate early enhancer and promoter, CMV promoter — promoter of human cytomegalovirus, chim intron — a chimerical intron, T7 promoter — promoter of T7 phage, SV40 PA terminator — the polyadenylation signal and terminator of the SV40 virus DNA, Signal peptide — a signal sequence.
The analysis of the derived recombinant pCI-neo/ASFV/p30, pCI-neo/ASFV/p54 and pCI-neo/ASFV/CD2v plasmids by PCR with diagnostic primers demonstrated that the amplicons, the sizes of which are consistent with the estimated ones, are synthesized based on these matrices (Fig. 2). The first clones of each construct were chosen for further work.
HEK293T cell line (human embryonic kidney cells transformed with the gene of SV40 virus T-antigen) served as an in vitro expression tool for the ob-tained recombinant genes. The presence of the virus SV40 replication origin in the pCI-neo plasmid provides for its episomal replication. After by calcium phosphate transfection of the HEK293T cell monolayer using each of the recombinant plas-mids (a confluency of 80-90 %) and subsequent culturing for 1-5 days, the trans-
A
B
C
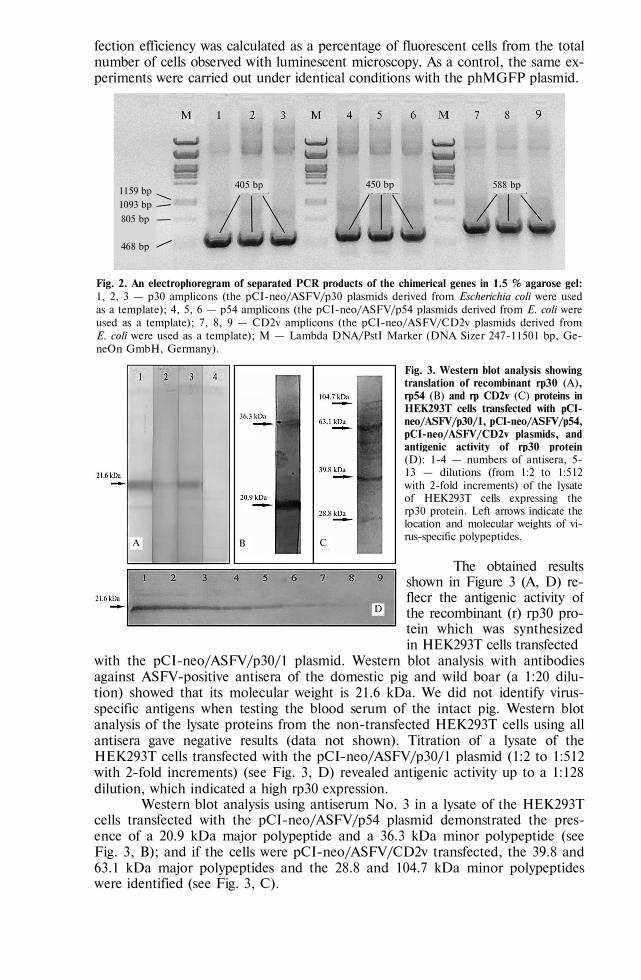
841
fection efficiency was calculated as a percentage of fluorescent cells from the total number of cells observed with luminescent microscopy. As a control, the same ex-periments were carried out under identical conditions with the phMGFP plasmid.
Fig. 2. An electrophoregram of separated PCR products of the chimerical genes in 1.5 % agarose gel: 1, 2, 3 — p30 amplicons (the pCI-neo/ASFV/p30 plasmids derived from Escherichia coli were used as a template); 4, 5, 6 — p54 amplicons (the pCI-neo/ASFV/p54 plasmids derived from E. coli were used as a template); 7, 8, 9 — CD2v amplicons (the pCI-neo/ASFV/CD2v plasmids derived from E. coli were used as a template); M — Lambda DNA/PstI Marker (DNA Sizer 247-11501 bp, Ge-neOn GmbH, Germany).
Fig. 3. Western blot analysis showing translation of recombinant rp30 (A), rp54 (B) and rp CD2v (C) proteins in HEK293T cells transfected with pCI-neo/ASFV/p30/1, pCI-neo/ASFV/p54, pCI-neo/ASFV/CD2v plasmids, and antigenic activity of rp30 protein (D): 1-4 — numbers of antisera, 5-13 — dilutions (from 1:2 to 1:512 with 2-fold increments) of the lysate of HEK293T cells expressing the rp30 protein. Left arrows indicate the location and molecular weights of vi-rus-specific polypeptides.
The obtained results
shown in Figure 3 (A, D) re-flecr the antigenic activity of the recombinant (r) rp30 pro-tein which was synthesized in HEK293T cells transfected
with the pCI-neo/ASFV/p30/1 plasmid. Western blot analysis with antibodies against ASFV-positive antisera of the domestic pig and wild boar (a 1:20 dilu-tion) showed that its molecular weight is 21.6 kDa. We did not identify virus-specific antigens when testing the blood serum of the intact pig. Western blot analysis of the lysate proteins from the non-transfected HEK293T cells using all antisera gave negative results (data not shown). Titration of a lysate of the HEK293T cells transfected with the pCI-neo/ASFV/p30/1 plasmid (1:2 to 1:512 with 2-fold increments) (see Fig. 3, D) revealed antigenic activity up to a 1:128 dilution, which indicated a high rp30 expression.
Western blot analysis using antiserum No. 3 in a lysate of the HEK293T cells transfected with the pCI-neo/ASFV/p54 plasmid demonstrated the pres-ence of a 20.9 kDa major polypeptide and a 36.3 kDa minor polypeptide (see Fig. 3, B); and if the cells were pCI-neo/ASFV/CD2v transfected, the 39.8 and 63.1 kDa major polypeptides and the 28.8 and 104.7 kDa minor polypeptides were identified (see Fig. 3, C).
1159 bp
1093 bp
805 bp
468 bp
405 bp 450 bp 588 bp
A C B
D
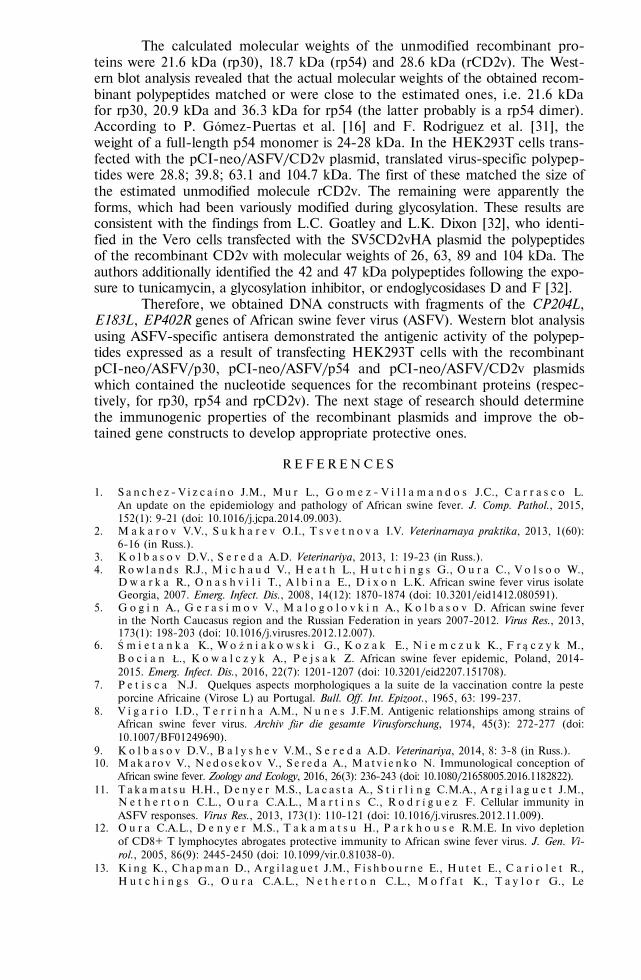
842
The calculated molecular weights of the unmodified recombinant pro-teins were 21.6 kDa (rp30), 18.7 kDa (rp54) and 28.6 kDa (rCD2v). The West-ern blot analysis revealed that the actual molecular weights of the obtained recom-binant polypeptides matched or were close to the estimated ones, i.e. 21.6 kDa for rp30, 20.9 kDa and 36.3 kDa for rp54 (the latter probably is a rp54 dimer). According to P. Gómez-Puertas et al. [16] and F. Rodriguez et al. [31], the weight of a full-length p54 monomer is 24-28 kDa. In the HEK293T cells trans-fected with the pCI-neo/ASFV/CD2v plasmid, translated virus-specific polypep-tides were 28.8; 39.8; 63.1 and 104.7 kDa. The first of these matched the size of the estimated unmodified molecule rCD2v. The remaining were apparently the forms, which had been variously modified during glycosylation. These results are consistent with the findings from L.C. Goatley and L.K. Dixon [32], who identi-fied in the Vero cells transfected with the SV5CD2vHA plasmid the polypeptides of the recombinant CD2v with molecular weights of 26, 63, 89 and 104 kDa. The authors additionally identified the 42 and 47 kDa polypeptides following the expo-sure to tunicamycin, a glycosylation inhibitor, or endoglycosidases D and F [32].
Therefore, we obtained DNA constructs with fragments of the CP204L, E183L, EP402R genes of African swine fever virus (ASFV). Western blot analysis using ASFV-specific antisera demonstrated the antigenic activity of the polypep-tides expressed as a result of transfecting HEK293T cells with the recombinant pCI-neo/ASFV/p30, pCI-neo/ASFV/p54 and pCI-neo/ASFV/CD2v plasmids which contained the nucleotide sequences for the recombinant proteins (respec-tively, for rp30, rp54 and rpCD2v). The next stage of research should determine the immunogenic properties of the recombinant plasmids and improve the ob-tained gene constructs to develop appropriate protective ones.
R E F E R E N C E S
1. S a n ch e z - V i z c a ín o J.M., M u r L., G o m e z - V i l l a m a n d o s J.C., C a r r a s c o L. An update on the epidemiology and pathology of African swine fever. J. Comp. Pathol., 2015, 152(1): 9-21 (doi: 10.1016/j.jcpa.2014.09.003).
2. M a k a r o v V.V., S u k h a r e v O.I., T s v e t n o v a I.V. Veterinarnaya praktika, 2013, 1(60): 6-16 (in Russ.).
3. K o l b a s o v D.V., S e r e d a A.D. Veterinariya, 2013, 1: 19-23 (in Russ.). 4. Ro w l a n d s R.J., M i c h a u d V., H e a t h L., H u t c h i n g s G., O u r a C., V o l s o o W.,
D w a r k a R., O n a s h v i l i T., A l b i n a E., D i x o n L.K. African swine fever virus isolate Georgia, 2007. Emerg. Infect. Dis., 2008, 14(12): 1870-1874 (doi: 10.3201/eid1412.080591).
5. G o g i n A., G e r a s i m o v V., M a l o g o l o v k i n A., K o l b a s o v D. African swine fever in the North Caucasus region and the Russian Federation in years 2007-2012. Virus Res., 2013, 173(1): 198-203 (doi: 10.1016/j.virusres.2012.12.007).
6. Ś m i e t a n k a K., W o ź n i a k o w s k i G., K o z a k E., N i e m c z u k K., F r ą c z y k M., B o c i a n Ł., K o w a l c z y k A., P e j s a k Z. African swine fever epidemic, Poland, 2014-2015. Emerg. Infect. Dis., 2016, 22(7): 1201-1207 (doi: 10.3201/eid2207.151708).
7. P e t i s c a N.J. Quelques aspects morphologiques à la suite de la vaccination contre la peste porcine Africaine (Virose L) au Portugal. Bull. Off. Int. Epizoot., 1965, 63: 199-237.
8. V i g a r i o I.D., T e r r i n h a A.M., N u n e s J.F.M. Antigenic relationships among strains of African swine fever virus. Archiv für die gesamte Virusforschung, 1974, 45(3): 272-277 (doi: 10.1007/BF01249690).
9. K o l b a s o v D.V., B a l y s h e v V.M., S e r e d a A.D. Veterinariya, 2014, 8: 3-8 (in Russ.). 10. M ak a ro v V., N ed o s ek o v V., S e r ed a A., M a t v i e n k o N. Immunological conception of
African swine fever. Zoology and Ecology, 2016, 26(3): 236-243 (doi: 10.1080/21658005.2016.1182822). 11. T a k a m a t s u H.H., D e n y e r M.S., L a c a s t a A., S t i r l i n g C.M.A., A r g i l a g u e t J.M.,
N e t h e r t o n C.L., O u r a C.A.L., M a r t i n s C., R o d r í g u e z F. Cellular immunity in ASFV responses. Virus Res., 2013, 173(1): 110-121 (doi: 10.1016/j.virusres.2012.11.009).
12. O u r a C.A.L., D e n y e r M.S., T a k a m a t s u H., P a r k h o u s e R.M.E. In vivo depletion of CD8+ T lymphocytes abrogates protective immunity to African swine fever virus. J. Gen. Vi-rol., 2005, 86(9): 2445-2450 (doi: 10.1099/vir.0.81038-0).
13. Ki n g K., Ch ap man D., A rg i l a g u e t J.M., F i s h bou r n e E., Hu t e t E., C a r i o l e t R., H u t c h i n g s G., O u r a C.A.L., N e t h e r t o n C.L., M o f f a t K., T a y l o r G., Le
843
P o t i e r M.F., D i x o n L.K., T a k a m a t s u H.H. Protection of European domestic pigs from virulent African isolates of African swine fever virus by experimental immunization. Vac-cine, 2011, 29(28): 4593-4600 (doi: 10.1016/j.vaccine.2011.04.052).
14. B a c h m a n n M.F., K u n d i g T.M., F r e e r G., Li Y., K a n g C.Y., B i s h o p D.H., H e n g a r t n e r H., Z i n k e r n a R.M. Induction of protective cytotoxic T cells with viral proteins. Eur. J. Immunol., 1994, 24: 2228-2236 (doi: 10.1002/eji.1830240944).
15. G o m e z - P u e r t a P., R o d r i g u e z F., O v i e d o J.M., R a m i r o - I b a n e z F., R u - i z - G o n z a l v o F., E s c r i b a n o J.M. Neutralizing antibodies to different proteins of African swine fever virus inhibit both virus attachment and internalization. Virology, 1996, 70(8): 5689-5694.
16. G ó m e z - P u e r t a s P., R o d r i g u e z F., O v i e d o J.M., B r u n A., A l o n s o C., E s c r i b a n o J.M. The African swine fever virus proteins p54 and p30 are involved in two dis-tinct steps of virus attachment and both contribute to the antibody-mediated protective immune response. Virology, 1998, 243: 461-471 (doi: 10.1006/viro.1998.9068).
17. S e r e d a A.D. Aktual'nye voprosy veterinarnoi biologii, 2013, 4(20): 31-35 (in Russ.). 18. A r g i l a g u e t J.M., P e r e z - M a r t i n E., N o f r a r i a s M., G a l l a r d o C., A c c e n s i F.,
L a c a s t a A., M o r a M., B a l l e s t e r M., G a l i n d o - C a r d i e l I., L o p e z - S o r i a S., E s c r i b a n o J.M., R e c h e P.A., R o d r ı g u e z F. DNA vaccination partially protects against African swine fever virus lethal challenge in the absence of antibodies. PLoS ONE, 2012, 7(9): e40942 (doi: 10.1371/journal.pone.0040942).
19. S e r e d a A.D., K a z a k o v a A.S., I m a t d i n o v A.R., K o l b a s o v D.V. Humoral and cell immune mechanisms under African swine fever (review). Agricultural Biology, 2015, 50(6): 709-718 (doi: 10.15389/agrobiology.2015.6.709eng) (in Engl.).
20. M i m a K.A., B u r m a k i n a G.S., T i t o v I.A., M a l o g o l o v k i n A.S. African swine fe-ver virus glycoproteins p54 and CD2v in the context of immune response modulation: bioin-formatic analysis of genetic variability and heterogeneity. Agricultural Biology, 2015, 50(6): 785-793 (doi: 10.15389/agrobiology.2015.6.785eng) (in Engl.).
21. S e r e d a A.D., B a l y s h e v V.M. Voprosy virusologii, 2011, 4: 38-42 (in Russ.). 22. M a l o g o l o v k i n A., B u r m a k i n a G., T i t o v I., S e r e d a A., Go g i n A., B a r y s h -
n i k o v a E., K o l b a s o v D. Comparative analysis of African swine fever virus genotypes and serogroups. Emerg. Infect. Dis., 2015, 21(2): 312-315 (doi: 10.3201/eid2102.140649).
23. B a l y s h e v a V.I., P r u d n i k o v a E.Yu., G a l ' n b e k T.V., B a l y s h e v V.M. Voprosy virusologii, 2015, 2: 43-47 (in Russ.).
24. G r e e n M.R., S a m b r o o k J. Molecular sloning: a laboratory manual. Cold Spring Harbor Laboratory Press, NY, 2012.
25. M a n i a t i s T., F r i t s c h E. F., S a m b r o o k J. Molecular cloning: a laboratory manual. Cold Spring Harbor, NY, 1982.
26. G r a h a m F.L., v a n d e r E b A.J. Transformation of rat cells by DNA of human adenovi-rus 5. Virology, 1973, 54(2): 536-539 (doi: 10.1016/0042-6822(73)90163-3).
27. L a e m m l e U.K. Clevage of structural proteins during the assembly of the head of bacterio-phage T4. Nature, 1970, 227: 680-685 (doi: 10.1038/227680a0).
28. K y h s e - A n d e r s e n J. Electroblotting of multiple gels: a simple apparatus without buffer tank for rapid transfer of proteins from polyacrylamide to nitrocellulose. J. Biochem. Biophys. Methods, 1984, 10(3/4): 203-209.
29. E s c r i b a n o J.M., T a b a r e s E. Proteins specified by African swine fever virus. V. Identification of immediate early, early and late proteins. Arch. Virol., 1987, 92: 221-238.
30. G i b s o n D.G., Y o u n g L., C h u a n g R.Y., V e n t e r J.C., H u t c h i s o n C.A. III, S m i t h H.O. Enzymatic assembly of DNA molecules up to several hundred kilobases. Nature Methods, 2009, 6: 343-345 (doi: 10.1038/nmeth.1318).
31. R o d r i g u e z F., A l c a r a z S., Y a n e z R.J., R o d r i g u e z J.M., A l o n s o C., R o d - r i g u e z J.F., E s c r i b a n o J.M. Characterization and molecular basis of heterogeneity of the African swine fever virus envelope protein p54. J. Virol., 1994, 68(11): 7244-7252.
32. G o a t l e y L.C., D i x o n L.K. Processing and localization of the African swine fever virus CD2v transmembrane protein. J. Virol., 2011, 85(7): 3294-3305 (doi: 10.1128/jvi.01994-10).
845
AGRICULTURAL BIOLOGY, ISSN 2412-0324 (English ed. Online)
2016, V. 51, ¹ 6, pp. 845-852 (SEL’SKOKHOZYAISTVENNAYA BIOLOGIYA) ISSN 0131-6397 (Russian ed. Print)
ISSN 2313-4836 (Russian ed. Online) UDC 619:616.98:578.842.1:57.083.3 doi: 10.15389/agrobiology.2016.6.845rus
doi: 10.15389/agrobiology.2016.6.845eng
VALIDATION OF AN ELISA KIT FOR DETECTION OF ANTIBODIES AGAINST ASF VIRUS IN BLOOD OR SPLEEN OF DOMESTIC PIGS
AND WILD BOARS
O.M. STRIZHAKOVA, V.M. LYSKA, A.S. MALOGOLOVKIN, M.B. NOVIKOVA, M.V. SIDLIK, I.V. NOGINA, A.E. SHKAEV, E.A. BALASHOVA, V.V. KURINNOV,
A.P. VASIL’EV
All-Russian Institute of Veterinary Virology and Microbiology, Federal Agency of Scientific Organizations, 1, ul. Akade-mika Bakuleva, pos. Vol’ginskii, Petushinskii Region, Vladimir Province, 601120 Russia, e-mail [email protected] Received September 25, 2016
A b s t r a c t
The causal agent of African swine fever (ASF) is a DNA virus belonging to Asfaviridae family which affects both wild boar Sus scrofa and domestic pig Sus scrofa domestica. Special features of the course of (ASF and its forms should be considered for the effective use of various ASF diag-nostic methods aimed at the pathogen or specific antibody identification. ASF diagnosis in the wild boar is of special importance. The wild boar susceptibility to ASF virus is well known, and the dis-ease has been repeatedly reproduced in experiments and detected in European wild boars in natural conditions. It is not unfrequently that when shooting wild boars, only organ samples are delivered to laboratories, so we decided to estimate the diagnostic value of the antibodies detected in tissues and evaluate an earlier developed test system for its efficacy when used for the assay. This report repre-sents the results of validation of an indirect ELISA (a commercial kit «VNIIVViM ASF-ELISA Ab/Ag») ASF virus specific antibody detection in blood serum and spleen tissue extracts. For com-parison, an indirect immunofluorescence assay (indirect IFA) was used. To estimate the obtained results, ROC analysis was applied. Examination of positive (n = 66) and negative (n = 410) por-cine blood serum samples using indirect ELISA showed high sensitivity and specificity of the method with reference to IFA. Among the 476 serum samples examined in indirect ELISA, only 8 sera (1.6 %) were within the positive/negative cutoff area. The highest sensitivity (100 %) and specificity (99.27 %) for indirect ELISA when examining both domestic pig and wild boar blood sera were determined at a cutoff value of 0.264. The samples of spleen extracts to be used for the study were collected from clinically healthy wild boars in ASF-affected Smolensk region in 2013 to 2014. In view of an acute form of the disease, we can suspect that the animals exhibiting positive reaction were in a latency pe-riod of the pathogeny. When examining the positive (n = 59) and negative (n = 678) spleen extracts, we also determined high sensitivity and specificity levels of indirect ELISA with reference to indirect IFA. Among the samples examined (n = 737), 10 (1.3 %) samples of spleen extracts were within the positive/negative cutoff area. The highest sensitivity (100 %) and specificity (98.82 %) were observed at a cutoff value of 0.284. Thus, we confirmed the assay to be effective for porcine blood sera with 100 % sensitivity (94.6 to 100 %) and 99.27 % specificity (97.90 to 99.80 %) and for spleen extracts with 100 % sensitivity (93.90 to 100 %) and 98.82 % specificity (97.70 to 99.50 %).
Keywords: African swine fever, specific antibody, indirect ELISA, ROC analysis
African swine fever (ASF) is a highly contagious disease with 100 % mortality when acute course, leading to significant economic losses [1]. ASF is characterized by fever, hemorrhagic diathesis and necro-degenerative changes in parenchymal organs [2-5]. The causative agent of ASF is a DNA-containing vi-rus of Asfarviridae family [6]. There are hyperacute, acute, subacute, chronic, and latent ASF [7-9]. Special features of the ASF course and its forms should be considered for the effective use of various ASF diagnostic methods [10] aimed at the identification of the pathogen or specific antibodies. If hyperacute and acute forms, detection of virus-specific antibodies is possible only in spleen samples, as specific antibody producing cells and, respectively, the very antibodies appear there on day 2 to 3 post-infection, whereas the animals die on days 3-7 [11, 12].
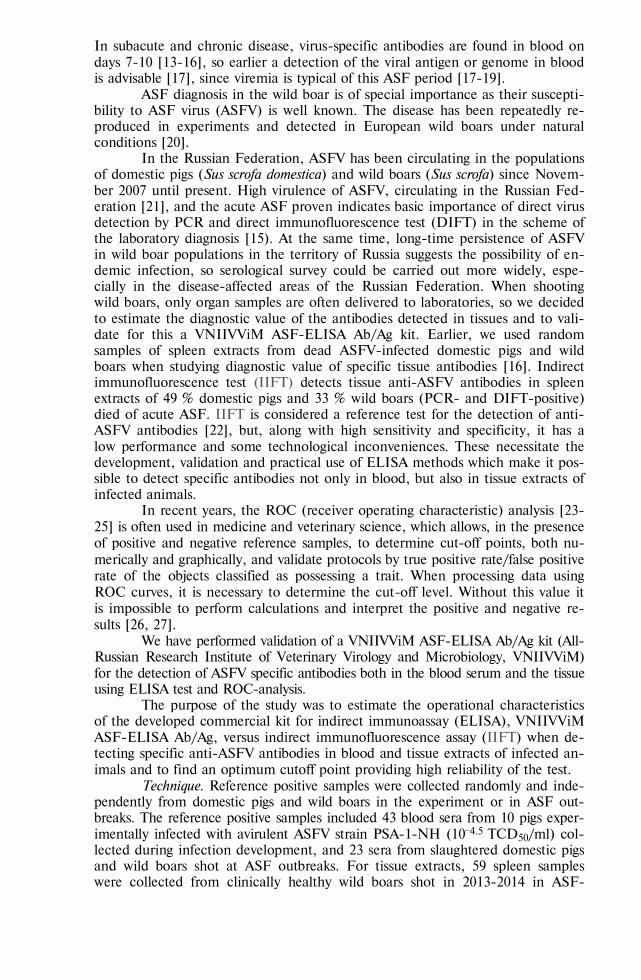
846
In subacute and chronic disease, virus-specific antibodies are found in blood on days 7-10 [13-16], so earlier a detection of the viral antigen or genome in blood is advisable [17], since viremia is typical of this ASF period [17-19].
ASF diagnosis in the wild boar is of special importance as their suscepti-bility to ASF virus (ASFV) is well known. The disease has been repeatedly re-produced in experiments and detected in European wild boars under natural conditions [20].
In the Russian Federation, ASFV has been circulating in the populations of domestic pigs (Sus scrofa domestica) and wild boars (Sus scrofa) since Novem-ber 2007 until present. High virulence of ASFV, circulating in the Russian Fed-eration [21], and the acute ASF proven indicates basic importance of direct virus detection by PCR and direct immunofluorescence test (DIFT) in the scheme of the laboratory diagnosis [15). At the same time, long-time persistence of ASFV in wild boar populations in the territory of Russia suggests the possibility of en-demic infection, so serological survey could be carried out more widely, espe-cially in the disease-affected areas of the Russian Federation. When shooting wild boars, only organ samples are often delivered to laboratories, so we decided to estimate the diagnostic value of the antibodies detected in tissues and to vali-date for this a VNIIVViM ASF-ELISA Ab/Ag kit. Earlier, we used random samples of spleen extracts from dead ASFV-infected domestic pigs and wild boars when studying diagnostic value of specific tissue antibodies [16]. Indirect immunofluorescence test (IIFT) detects tissue anti-ASFV antibodies in spleen extracts of 49 % domestic pigs and 33 % wild boars (PCR- and DIFT-positive) died of acute ASF. IIFT is considered a reference test for the detection of anti-ASFV antibodies [22], but, along with high sensitivity and specificity, it has a low performance and some technological inconveniences. These necessitate the development, validation and practical use of ELISA methods which make it pos-sible to detect specific antibodies not only in blood, but also in tissue extracts of infected animals.
In recent years, the ROC (receiver operating characteristic) analysis [23-25] is often used in medicine and veterinary science, which allows, in the presence of positive and negative reference samples, to determine cut-off points, both nu-merically and graphically, and validate protocols by true positive rate/false positive rate of the objects classified as possessing a trait. When processing data using ROC curves, it is necessary to determine the cut-off level. Without this value it is impossible to perform calculations and interpret the positive and negative re-sults [26, 27].
We have performed validation of a VNIIVViM ASF-ELISA Ab/Ag kit (All-Russian Research Institute of Veterinary Virology and Microbiology, VNIIVViM) for the detection of ASFV specific antibodies both in the blood serum and the tissue using ELISA test and ROC-analysis.
The purpose of the study was to estimate the operational characteristics of the developed commercial kit for indirect immunoassay (ELISA), VNIIVViM ASF-ELISA Ab/Ag, versus indirect immunofluorescence assay (IIFT) when de-tecting specific anti-ASFV antibodies in blood and tissue extracts of infected an-imals and to find an optimum cutoff point providing high reliability of the test.
Technique. Reference positive samples were collected randomly and inde-pendently from domestic pigs and wild boars in the experiment or in ASF out-breaks. The reference positive samples included 43 blood sera from 10 pigs exper-imentally infected with avirulent ASFV strain PSA-1-NH (104.5 ТСD50/ml) col-lected during infection development, and 23 sera from slaughtered domestic pigs and wild boars shot at ASF outbreaks. For tissue extracts, 59 spleen samples were collected from clinically healthy wild boars shot in 2013-2014 in ASF-
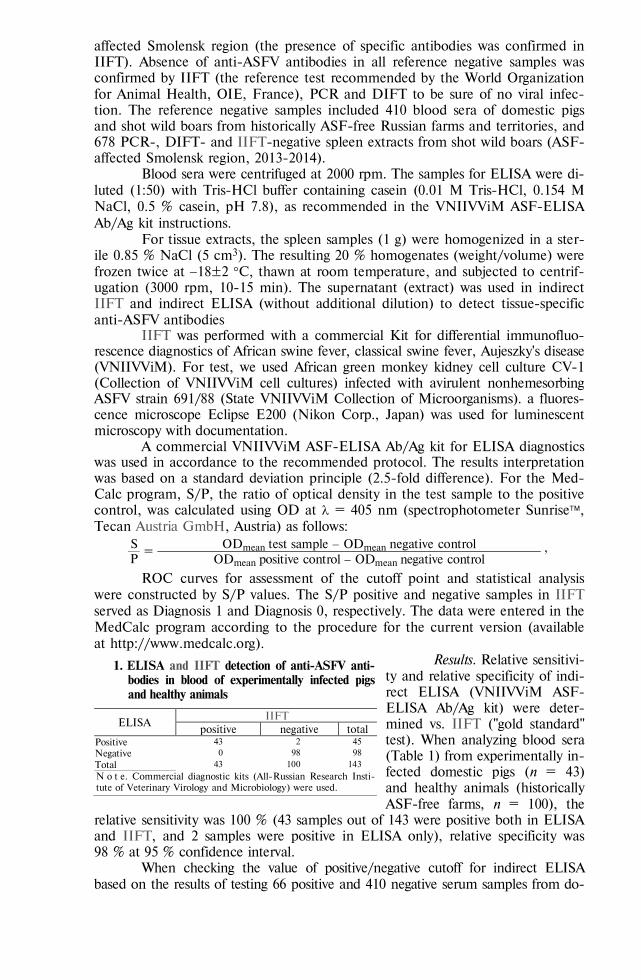
847
affected Smolensk region (the presence of specific antibodies was confirmed in IIFT). Absence of anti-ASFV antibodies in all reference negative samples was confirmed by IIFT (the reference test recommended by the World Organization for Animal Health, OIE, France), PCR and DIFT to be sure of no viral infec-tion. The reference negative samples included 410 blood sera of domestic pigs and shot wild boars from historically ASF-free Russian farms and territories, and 678 PCR-, DIFT- and IIFT-negative spleen extracts from shot wild boars (ASF-affected Smolensk region, 2013-2014).
Blood sera were centrifuged at 2000 rpm. The samples for ELISA were di-luted (1:50) with Tris-HCl buffer containing casein (0.01 M Tris-HCl, 0.154 M NaCl, 0.5 % casein, pH 7.8), as recommended in the VNIIVViM ASF-ELISA Ab/Ag kit instructions.
For tissue extracts, the spleen samples (1 g) were homogenized in a ster-ile 0.85 % NaCl (5 сm3). The resulting 20 % homogenates (weight/volume) were frozen twice at 18±2 С, thawn at room temperature, and subjected to centrif-ugation (3000 rpm, 10-15 min). The supernatant (extract) was used in indirect IIFT and indirect ELISA (without additional dilution) to detect tissue-specific anti-ASFV antibodies
IIFT was performed with a commercial Kit for differential immunofluo-rescence diagnostics of African swine fever, classical swine fever, Aujeszky's disease (VNIIVViM). For test, we used African green monkey kidney cell culture CV-1 (Collection of VNIIVViM cell cultures) infected with avirulent nonhemesorbing ASFV strain 691/88 (State VNIIVViM Collection of Microorganisms). a fluores-cence microscope Eclipse E200 (Nikon Corp., Japan) was used for luminescent microscopy with documentation.
A commercial VNIIVViM ASF-ELISA Ab/Ag kit for ELISA diagnostics was used in accordance to the recommended protocol. The results interpretation was based on a standard deviation principle (2.5-fold difference). For the Med-Calc program, S/P, the ratio of optical density in the test sample to the positive control, was calculated using OD at = 405 nm (spectrophotometer Sunrise, Teсan Austria GmbH, Austria) as follows:
S =
ОDmean test sample ОDmean negative control , P ОDmean positive control ОDmean negative control
ROC curves for assessment of the cutoff point and statistical analysis were constructed by S/P values. The S/P positive and negative samples in IIFT served as Diagnosis 1 and Diagnosis 0, respectively. The data were entered in the MedCalc program according to the procedure for the current version (available at http://www.medcalc.org).
Results. Relative sensitivi-ty and relative specificity of indi-rect ELISA (VNIIVViM ASF-ELISA Ab/Ag kit) were deter-mined vs. IIFT ("gold standard" test). When analyzing blood sera (Table 1) from experimentally in-fected domestic pigs (n = 43) and healthy animals (historically ASF-free farms, n = 100), the
relative sensitivity was 100 % (43 samples out of 143 were positive both in ELISA and IIFT, and 2 samples were positive in ELISA only), relative specificity was 98 % at 95 % confidence interval.
When checking the value of positive/negative cutoff for indirect ELISA based on the results of testing 66 positive and 410 negative serum samples from do-
1. ELISA and IIFT detection of anti-ASFV anti-bodies in blood of experimentally infected pigs and healthy animals
ELISA IIFT
positive negative total Positive 43 2 45 Negative 0 98 98 Total 43 100 143 N o t e. Commercial diagnostic kits (All-Russian Research Insti-tute of Veterinary Virology and Microbiology) were used.
848
mestic pigs and wild boars, a diagram was plotted (Fig. 1) for the frequency of dis-tribution of the values obtained. A total of 5 reference positive and 19 reference neg-ative samples were co-located in the S/P interval from 0.2 to 0.4, that is the optical densities of the samples within this range could be classified both as false negative and false positive.
Fig. 1. Distribution of 410 reference negative (Di-agnosis 0) and 66 reference positive for African swine fever (Diagnosis 1) samples of pig blood se-rum in indirect ELISA by S/P index (the ratio of the test sample to positive control optical densi-ty). Each point represents the average of individ-ual sample analysis duplicates. A sensitivity of 100 % and a specificity of 99.3 % correspond to the cutoff line at S/P > 0.264. The S/P area boundaries are marked in which both positive and negative samples are co-located.
Sensitivity and specificity of indirect ELISA blood test were cal-culated for different cutoff values (Ta-ble 2). In the samples from domestic pigs and wild boars, the highest diag-nostic sensitivity (100 %) at 95 % con-
fidence interval (CI of 94.6 to 100 %) along with the highest specificity of 99.27 % (95 % CI: 97.9-99.8 %) was observed at the cutoff value of 0.264.
2. Criteria and ROC curve coordinates for indirect ELISA tests of serum anti-ASFV antibodies depending on the cutoff value
Criterion Sen, % 95 % CI Sp, % 95 % CI +LR 95 % CI LR 95 % CI > 0.258 100.00 94.6-100.0 98.54 96.8-99.5 68.33 30.9-151.2 0.000 > 0.261 100.00 94.6-100.0 98.78 97.2-99.6 82.00 34.3-196.0 0.000 > 0.263 100.00 94.6-100.0 99.02 97.5-99.7 102.50 38,7-271,8 0.000 > 0.264 100.00 94.6-100.0 99.27 97.9-99.8 136.67 44.3-422.0 0.000 > 0.271 98.48 91.8-100.0 99.27 97.9-99.8 134.60 43.6-415.8 0.015 0.002-0.1 > 0.285 96.97 89.5-99.6 99.27 97.9-99.8 132.53 42.9-409.5 0.031 0.008-0.1 > 0.298 96.97 89.5-99.6 99.51 98.2-99.9 198.79 49.9-792.7 0.030 0.008-0.1 > 0.388 93.94 85,2-98,3 99.76 98.6-100.0 385.15 54.3-2730.4 0.061 0.020-0.2
N o t e. A total of 66 blood serum samples from ASFV-infected (positive group, Diagnosis = 1) and 410 sam-ples from non-infected pigs and wild boars (negative group, Diagnosis = 0) have been tested; 476 samples in total). Sen — sensitivity, Sp — specificity, CI — confidence interval, +LR and LR mean the likelihood ratio: +LR = Sen/(100 Sp), LR = (100 Sen)/Sp. The table shows part of ROC analysis criteria and coordinates calcu-lated in the MedCalc program for the most relevant cutoff values in the range of optimal sensitivity and specificity.
Area under the ROC curve (AUC): area under the ROC curve — 1.000; standard error — 0.000269; 95 % confidence interval — from 0.992 tо 1.000; Z-statistics — 1857.961; significance level P (area = 0.5) < 0.0001.
Youden index: index J — 0.9927; associative criterion > 0.264.
When testing 59 reference positive and 678 reference negative spleen tis-sue extracts (Fig. 2), the S/P overlap frequencies of false positive (51 samples) and false-negative (3 samples) results were in the same range (0.2-0.4) as for the serum antibodies. The optimal parameters were at a cutoff value of 0.284: meth-od sensitivity was 100 % (95 % CI: 93.9-100 %), specificity was 98.82 % (95 % CI: 97.7-99.5 %) (Table 3).
Currently, ELISA is approved by OIE for primary screening anti-ASFV antibodies [26], but in general all of the known tests allow detecting specific anti-bodies in blood only [10, 12, 14]. The validation of ELISA kit by ROC analysis showed the possibility to use this kit for the detection of specific anti-ASFV an-tibodies in blood and tissue extracts in infected domestic pigs and wild boars. Examination of positive (n = 66) and negative (n = 410) pig blood samples con-firmed high sensitivity and specificity of the method compared to IIFT. Only 8 (1.6 %) of the 476 samples were within the positive/negative cutoff area (see Fig. 1).
Diagnosis
S/P
1.2
1.0
0.8
0.6
0.4
0.2
0
849
Fig. 2. Distribution of 678 reference negative (Diagnosis 0) and 59 reference positive for Afri-can swine fever (Diagnosis 1) pig tissue samples (spleen) in indirect ELISA by S/P index (the ratio of the test sample to positive control opti-cal density). Each point represents the average of individual sample analysis duplicates. A sensitivity of 100 % and a specificity of 98.8 % correspond to the cutoff line at S/P > 0.284. The S/P area boundaries are marked in which both positive and negative samples are co-located.
When testing positive (n = 59) and negative (n = 678) spleen extracts from clinically healthy wild boars shot in ASF-affected areas, sensitivity and specificity of indirect ELISA also was high compared to IIFT. Only 10 sam-ples (1.3 %) were within the posi-tive/ne-gative cutoff area (see Fig. 2).
Considering the acute disease character, we can assume a state corre-sponding to the incubation period of infection in the animals with positive re-actions.
3. Criteria and ROC curve coordinates for indirect ELISA tests of serum anti-ASFV antibodies in spleen tissue depending on the cutoff value
Criterion Sen, % 95 % CI Sp, % 95 % CI +LR 95 % CI LR 95 % CI > 0.263 100.00 93.9-100.0 97.94 96.6-98.9 48.43 28.8-81.3 0.000 > 0.268 100.00 93.9-100.0 98.08 96,7-99,0 52.15 30.4-89.4 0.000 > 0.269 100.00 93.9-100.0 98.23 96.9-99.1 56.50 32.2-99.0 0.000 > 0.270 100.00 93.9-100.0 98.53 97.3-99.3 67.80 36.6-125.4 0.000 > 0.276 100.00 93.9-100.0 98.67 97.5-99.4 75.33 39.4-144.2 0.000 > 0.284 100.00 93.9-100.0 98.82 97.7-99.5 84.75 42.6-168.8 0.000 > 0.304 98.31 90.9-100.0 98.82 97.7-99.5 83.31 41.8-166.1 0.017 0.002-0.1 > 0.310 98.31 90.9-100.0 99.12 98.1-99.7 111.08 50.0-246.6 0.017 0.002-0.1 > 0.320 98.31 90.9-100.0 99.26 98.3-99.8 133.30 55.6-319.4 0.017 0.002-0.1 > 0.330 98.31 90.9-100.0 99.56 98.7-99.9 222.17 71.8-687.5 0.017 0.002-0.1 > 0.380 94.92 85.9-98.9 99.85 99.2-100.0 643.53 90.7-4566.1 0.051 0.020-0.2
N o t e. A total of 59 spleen samples from ASFV-infected (positive group, Diagnosis = 1) and 678 samples from non-infected pigs and wild boars (negative group, Diagnosis = 0) have been tested; 737 samples in to-tal. Sen — sensitivity, Sp — specificity, CI — confidence interval, +LR and LR mean the likelihood ratio: +LR = Sen/(100 Sp), LR = (100 Sen)/Sp. The table shows part of ROC analysis criteria and coordinates calcu-lated in the MedCalc program for the most relevant cutoff values in the range of optimal sensitivity and specificity.
Area under the ROC curve (AUC): area under the ROC curve — 1.000; standard error — 0.000243; 95 % confidence interval — from 0.994 tо 1.000; Z-statistics — 2055.362; significance level P (area = 0.5) < 0.0001.
Youden index: index J — 0.9882; associative criterion > 0.284.
The results of indirect ELISA ROC analysis obtained in the study of blood and tissue samples allow choosing cutoff points in a wide range with the possibility of optimizing method performance. In both cases, alternative options are possible depending on the planned purposes, such as diagnosis, monitoring, or confirmation of the absence of ASF infection in the population of domestic pigs (farm) or wild boars (hunting facilities). Thus, if it is necessary to prevent the introduction of infection, high sensitivity is more important and specificity is of less significance (e.g. in diagnosis or screening in an affected area). In this case, the set cutoff level is 0.264 (blood) or 0.284 (tissue). If a false positive re-sult is inadmissible, that is, specificity is important (e.g. when screening animals for ASF in an ASF-free area), the cutoff threshold can be increased to 0.380 with a minimal effect on sensitivity.
Thus, the validation indicates that the VNIIVViM ASF-ELISA Ab/Ag kit allows reliable detection of anti-ASFV antibodies both in the blood serum and spleen tissue extracts at S/P cutoff values of 0.264 (blood) or 0.284 (tissue), re-
Diagnosis
S/P
1.6
1.4
1.2
1.0
0.8
0.6
0.4
0.2
0
850
spectively. This is especially important for monitoring wild boars after shooting, when only organs are often delivered to the laboratory. The commercial set devel-oped and validated by us is expedient for using to evaluate the presence of anti-ASFV antibodies and the ASF status of an animal and the population as a whole.
R E F E R E N C E S 1. K u r i n n o v V.V., K o l b a s o v D.V., T S y b a n o v S.Zh., V a s i l ' e v A.P., S h e n d r i k
A.G., B a l y s h e v V.M., M i k o l a i c h u k S.V., B e l y a n i n S.A., K a l a n t a e n k o Yu.F., Z h u k o v A.N. Zhizn' bez opasnostei, 2010, 3: 82-87 (in Russ.).
2. A t u h a i r e D.K., A f a y o a M., O chw o S., M w e s i gw a S., M w i i n e F.N., O k u n i J.B., O l a h o -M u k a n i W., O j o k L. Prevalence of African swine fever virus in apparently healthy domestic pigs in Uganda. BMC Vet. Res., 2013, 9: 263-271 (doi: 10.1186/1746-6148-9-263).
3. G a l l a r d o C., R e o y o A.T., F e r n á n d e z -P i n e r o J., I g l e s i a s I., M u с o z J., A r i a s L. African swine fever: a global view of the current challenge. Porcine Health Manage-ment, 2015, 1: 21 (doi: 10.1186/s40813-015-0013-y).
4. C a r r a s c o L. An update on the epidemiology and pathology of African swine fever. J. Comp. Pathol., 2015, 152: 9-21 (doi: 10.1016/j.jcpa.2014.09.003).
5. Gu i n a t C., R e i s A.L., N e t h e r t o n C., Go a t l e y L., P f e i f f e r D., D i x o n L. Dynam-ics of African swine fever virus shedding and excretion in domestic pigs infected by intramuscular inoculation and contact transmission. Vet. Res., 2014, 45: 93 (doi: 10.1186/s13567-014-0093-8).
6. Diseases of swine. D.J. Taylor, J.J. Zimmerman, S. D’Allaire (eds.) Iowa State University Press, 2006.
7. G a l l a r d o C., S o l e r A., N i e t o R., C a no C., P e l a y o V., S á n ch e z M.A., P r i d o t -k a s G., F e r n a n d e z -P i n e r o J., B r i o n e s V., A r i a s M. Experimental infection of do-mestic pigs with African swine fever virus Lithuania 2014 genotype II field isolate. Transbound. Emerg. Dis., 2015 Mar 22: 1-5 (doi: 10.1111/tbed.12346) [Epub ahead of print].
8. B o i n a s F.S., H u t c h i n g s G.H., D i x o n L.K., W i l k i n s o n P.J. Characterisation of path-ogenic and non-pathogenic African swine fever virus isolated from Ornithodoros erraticus inhabiting pig premises in Portugal. J. Gen. Virol., 2004, 5(8): 2117-2187 (doi: 10.1099/vir.0.80058-0).
9. H o w e y E.B., O ’ D o n n e l l V., d e C a r v a l h o F e r r e i r a H.C., B o r c a M.V., A r z t J. Pathogenesis of highly virulent African swine fever virus in domestic pigs exposed via intraoro-pharyngeal, intranasopharyngeal, and intramuscular inoculation, and by direct contact with in-fected pigs. Virus Res., 2013, 178: 328-339 (doi: 10.1016/j.virusres.2013.09.024).
10. Cha r l e s t o n B., B a nko ws k i B.M., Gu b b i n s S., C h a s e -T o p p i n g M.E., S c h l e y D., H o w e y R., B a r n e t t P.V., G i b s o n D., J u l e f f N.D., W o o l h o u s e M.E. Relation-ship between clinical signs and transmission of an infectious disease and the implications for control. Science, 2011, 332: 726-729 (doi: 10.1126/science.1199884).
11. B o t i j a S., O r d a s A. Rapid diagnosis by identification of antibodies extracted from tissues using indirect immunofluorescence. Hog Cholera. In: Classical swine fever and African swine fever. Luxembourg, 1977: 658-659.
12. R e i s A.L., P a r k h o u s e R.M., P e n e d o s A.R., M a r t i n s C., L e i t ã o A.. Systematic analysis of longitudinal serological responses of pigs infected experimentally with African swine fever virus. J. Gen. Virol., 2007, 88: 2426-2434 (doi: 10.1099/vir.0.82857-0).
13. P é r e z J., F e r n á nd ez A.I., S i e r r a M.A., He r r ae z P., F e rn á nd ez A. Serological and im-munohistochemical study of African swine fever in wild boar in Spain. Vet Rec., 1998, 143: 136-139.
14. G a l l a r d o C., S o l e r A., N i e t o R., C a r r a s c o s a A.L., D e M i a G.M., B i s h o p R.P., M a r t i n s C., F a s i n a F.O., C o u a c y -H y m m a n E., H e a t h L., P e l a y o V., M a r -t í n E., S i m ó n A., M a r t í n R., O k u r u t A.R., L e k o l o l I., O k o t h E., A r i a s M. Comparative evaluation of novel African swine fever virus (ASF) antibody detection techniques derived from specific ASF viral genotypes with the OIE internationally prescribed serological tests. Vet. Microbiol., 2013, 162: 32-43 (doi: 10.1016/j.vetmic.2012.08.011).
15. K u r i n n o v V.V., V a s i l ' e v A.P., B e l y a n i n S.A., S t r i z h a k o v a O.M., N o g i - n a I.V., S i d l i k M.V., G a z a e v I.Kh., T s y b a n o v S.Zh., M i r o n o v a L.P., A l i k o - v a G.A., D z h a i l i d i G.A., C h e r n y k h O.Yu. Veterinariya Kubani, 2014, 3: 5-9 (in Russ.).
16. Kur i n no v V.V., B e l y an i n S.A., Va s i l ' e v A.P., S t r i z hako va O.M., L y s k a V.M., No -g i na I.V., Zub a i ro v a S.N., B a l y s h ev V.M., T s y b a n o v S.Zh., K o l b a s o v D.V., M i r o n o v a P.L., C h e r n y k h O.Yu., A l i k o v a G.A. Veterinariya Kubani, 2012, 4: 9-11 (in Russ.).
17. C u b i l l o s C., G ó m e z -S e b a s t i a n S., M o r e n o N., N u ñ e z M.C., M u l u m b a -M f u m u L.K., Q u e m b o C.J., H e a t h L., E t t e r E.M.C., J o r i F., E s c r i b a n o J.M., B l a n c o E. African swine fever virus serodiagnosis: A general review with a focus on the analyses of African serum samples. Virus Res., 2013, 173(1): 159-167 (doi: 10.1016/j.virusres.2012.10.021).
18. N i e t o -P e l e g r E., R i v e r a -A r r o y o B., S a n c h e z -V i z c a ı n o J.M. First detection of antibodies against African swine fever virus in faeces samples. Transbound. Emerg. Dis., 2015,
851
62(6): 594-602 (doi: 10.1111/tbed.12429). 19. Zs ak L., Bo rc a M., R i s a t t i G., Z s ak A., F re nc h R., Lu Z., Ku t i s h G., N e i l a n J.,
C a l l ah a n J., Ne l s on W. Preclinical diagnosis of African swine fever in contact-exposed swine by a real-time PCR assay. J. Clin. Microbiol., 2005, 43: 112-119 (doi: 10.1128/JCM.43.1.112-119.2005).
20. M a k a r o v V.V., S u k h a r e v O.I., B o e v B.V., G a v r y u s h k i n D., K o l o my t s e v A.A., L i t v i n o v O.B. Veterinariya, 2010, 9: 24-28 (in Russ.).
21. K ho me nk o S., B e l t r á n -A l c r u d o D., Ro z s t a l n y y A., G o g i n A., K o l b a s o v D., P i n t o J., L u b r o t h J., M a r t i n V. African swine fever in the Russian Federation: risk factors for Europe and beyond. EMPRES Watch, 2013, 28: 1-14.
22. Manual of diagnostic tests and vaccines for terrestrial animals. 7th Ed. OIE, France. 2012. Availa-ble http://www.oie.int/manual-of-diagnostic-tests-and-vaccines-for-terrestrial-animals/. No date.
23. G a r d n e r A., G r e i n e r M., D u b e y J. Statistical evaluation of test accuracy studies for Toxoplasma gondii in food animal intermediate hosts. Zoonoses and Public Health, 2010, 57: 82-94 (doi: 10.1111/j.1863-2378.2009.01281).
24. G r e i n e r M., S o h r D., G i j b e l P. A modified ROC analysis for the selection of cut-off val-ues and the definition of intermediate results of serodiagnostic tests. J. Immunol. Methods, 1995, 185: 123-132.
25. The ELISA guidebook. J.R. Crowther (ed.). Vienna, 2009. 26. J a c o b s o n R.H. Validation of serological assays for diagnosis of infectious diseases. Rev. Sci.
Tech. OIE, 1998, 17(2): 469-486. 27. T i g n o n M., G a l l a r d o C., I s c a r o C., H u t e t E., V a n d e r S t e d e Y., K o l b a s o v D.,
D e M i a G.M., L e P o t i e r M.-F., B i s h o p R.P., A r i a s M. Development and inter-laboratory validation study of an improved new real-time PCR assay with internal control for detection and laboratory diagnosis of African swine fever virus. J. Virol. Methods, 2011, 178: 161-170 (doi: 10.1016/j.jviromet.2011.09.007).
853
AGRICULTURAL BIOLOGY, ISSN 2412-0324 (English ed. Online)
2016, V. 51, ¹ 6, pp. 853-860 (SEL’SKOKHOZYAISTVENNAYA BIOLOGIYA) ISSN 0131-6397 (Russian ed. Print)
ISSN 2313-4836 (Russian ed. Online)
Veterinary virology, microbiology, parasitology UDC 619:578:57.083.2 doi: 10.15389/agrobiology.2016.6.853rus
doi: 10.15389/agrobiology.2016.6.853eng
PERMISSIVITY OF LAMB SYNOVIAL MEMBRANE CELL CULTURE FOR AKABANE DISEASE VIRUS
E.A. BALASHOVA, E.I. BARYSHNICKOVA, V.M. LYSKA, O.L. KOLBASOVA, A.V. LUNITSIN, D.V. KOLBASOV
All-Russian Institute of Veterinary Virology and Microbiology, Federal Agency of Scientific Organizations, 1, ul. Akade-mika Bakuleva, pos. Vol’ginskii, Petushinskii Region, Vladimir Province, 601125 Russia, e-mail [email protected] Received July 31, 2016
A b s t r a c t
Presently, due to the variety and diversity of economic and tourist ties of Russia, episodes of accidental or maybe purposeful (i.e., biological terrorism) entry of exotic infectious pathogens in-cluding Akabane disease to the Russian Federation should not be excluded. Akabane disease is a viral transmissible infection. Its recurrent outbreaks are characterized by abortions, still or premature births, or malformations (e.g. arthrogryposis and/or hydrocephaly) for calves, lambs and kids. Aka-bane disease virus can persist both in animal body and in vitro (e.g., in continuous cell lines). A study of the sensitivity of African green monkey kidney cell line to Akabane virus carried out earlier showed that Akabane virus caused definite cytopathic changes resulting in cell rounding followed by cytolysis and detachment of the cell monolayer within 48 hours post infection. In this paper we first reported on the cytomorphological changes caused by Akabane virus in the primary lamb synovial membrane diploid cell culture (LSMCC) prepared according to an earlier developed procedure, and on a suitability of this culture for the virus accumulation in titers sufficient for study and making di-agnosis. It has been formerly determined that the lamb synovial membrane cell culture is sensitive to small ruminant lentiviruses like caprine arthritis encephalitis virus or Visna-Maedi virus in sheep. LSMCC was prepared using a method for tissue explant culture. On day 4 post inoculation of the cell monolayer with Akabane virus the cytopathic effect appeared which manifested as formation of symplasts that grew larger due to their fusion on day 5 to 6. The Akabane virus activity was 6.0±0.05 lg TCID50/cm3 for strain V8935, and 5.0±0.05 lg TCID50/cm3 for strain P. As many as three passag-es and also the primary cell culture (after freezing) kept the virus-producing activity, and the Aka-bane virus retained its infective properties. The lamb synovial membrane cells can be re-cultured, and excessive diploid culture can be frozen to preserve and thawed as required. It is expedient to use a strain of diploid lamb synovial membrane cells deposited and patented earlier. One more advantage of the primary LSMCC as compared to monkey cell lines is that the latter ones may be a source of simian herpes B virus.
Keywords: lamb synovial membrane cell culture, Akabane disease, Orthobunyavirus
Due to the expansion of international economic relations and the devel-opment of tourism, accidental entry of exotic infectious pathogens to the territo-ry of Russia is possible. Moreover, because of episodes of international terrorism, there is a real threat of biological terrorism, the focused introduction of the dan-gerous infections pathogens. These include the virus of Akabane disease, a vec-tor-transmitted disease with the recurrent outbreaks followed by abortions, still or premature births, or malformations (arthrogryposis, hydrocephaly) in calves [1-4], lambs and goatlings [5]. Anti-Akabane virus disease antibodies have been found in buffalo, horses, camels, pigs, and monkeys [6-8]. Encephalitis effects of the Akabane disease virus have been described in mice, hamsters, guinea pigs, and chicken embryos [9, 10]. Virus has no pathological effects on the humans, however anti-Akabane virus antibodies have been found in a number of subjects in Japan [11]. Infectious agent belongs to Simbu serogroup of the genus Or-thobunyavirus, family Bunyaviridae, which includes Aino, Chamond, and Schmallenberg diseases viruses [12].
854
Akabane disease virus is transmitted by ticks and mosquitoes which en-sures the formation of stable natural foci in harsh environments and creates the possibility of expanding the range of vertebrate hosts. Long-term preservation of the viral population in susceptible vertebrates contributes to the rapid spread of the disease among wild and domestic animals in a favorable for mosquitoes cli-mate period [13]. Akabane disease virus has been isolated from the animals in Japan [14, 15], Israel [16], Korea [17-19], Australia [20], Turkey [21], Cyprus [22], Syria [23], Sudan [24], and Kenya [25]. The widespread, high contagious-ness and economic losses are the reasons for which the study and control of this pathogen are necessary. Continuous cell cultures are the main laboratory model for the study of animal viruses, and the primary culture is the model in the ab-sence of continuous cell lines.
Akabane disease virus can persist both in animal and in continuous cul-tures in vitro. At various times, a number of foreign papers reported that ham-ster lung (HmLu-1), African green monkey kidney (Vero), newborn Syrian hamster kidney (BHK-21-W12), pig kidney (PK-15), rabbit kidney (RK-13), and fetal calf kidney (BEK) continuous cultures were sensitive to Akabane dis-ease virus [26-28].
In the Russian Federation, Akabane disease virus has been studied only at the All-Russian Scientific Research Institute of Veterinary Virology and Mi-crobiology (VNIIVViM). The pathogen morphology has been described [29], a method of reverse transcription PCR (RT-PCR) was developed to detect Aka-bane virus genome [30], and the sensitivity of Vero [31] and African green mon-key kidney CV-1 [32] cultures to the virus was studied.
Russian collections include continuous cell cultures sensitive to Akabane virus. Alternatively, however, it is important to have sensitive primary cell cul-tures (with a proof of their advantages or detection of disadvantages) which can be prepared in any equipped laboratory. A strain of lamb Ovis aries synovial membrane diploid cells has been patented and deposited in VNIIVViM [33] which is used to derive a primary culture. It is noted that this culture, and also its subcultures are stable in its biological characteristics [33] and sensitive in the early passages to small ruminant lentiviruses, such as caprine arthritis encephali-tis virus and Visna-Maedi virus in sheep [33, 34].
In this paper, we first reported the cytomorphological changes caused by Akabane disease virus in lamb synovial membrane diploid cell culture prepared according to an earlier developed procedure [34]. This culture is suitable for the virus accumulation in titers sufficient for the study and diagnosis.
We evaluated primary lamb synovial membrane cell culture as a labora-tory model for the accumulation and titration of Akabane disease virus.
Technique. Akabane disease virus (strains В8935 and Р) was obtained from State VNIIVViM collection of microorganisms. Primary synovial mem-brane cell culture donor was a 3-day old lamb (grown in VNIIVViM experi-mental animals sector).
For cell culture, we used minimal Dulbecco's Modified Eagle's Medium (DMEM, HyClone Laboratories, Inc., USA) with a double amount of amino acids and vitamins, the fetal bovine serum (HyClone Laboratories, Inc., USA), Benzylpenicillin sodium salt (150 U/cm3) and gentamicin (100 μg/cm3). A mix-ture of 0.02 % Versene (Sigma, USA) and 0.25 % trypsin (Sigma, USA) at a ra-tio of 2:1 heated to 37 С was applied for cell dispersion.
Cell culture was derived from a tissue explant [34]. Hock and wrist joints were collected aseptically, the skin was removed and the joints treated with 96 % alcohol for 15-30 seconds. The isolated synovial membrane was transferred into a Petri dish with nutrient DMEM medium containing 2 % fetal bovine serum
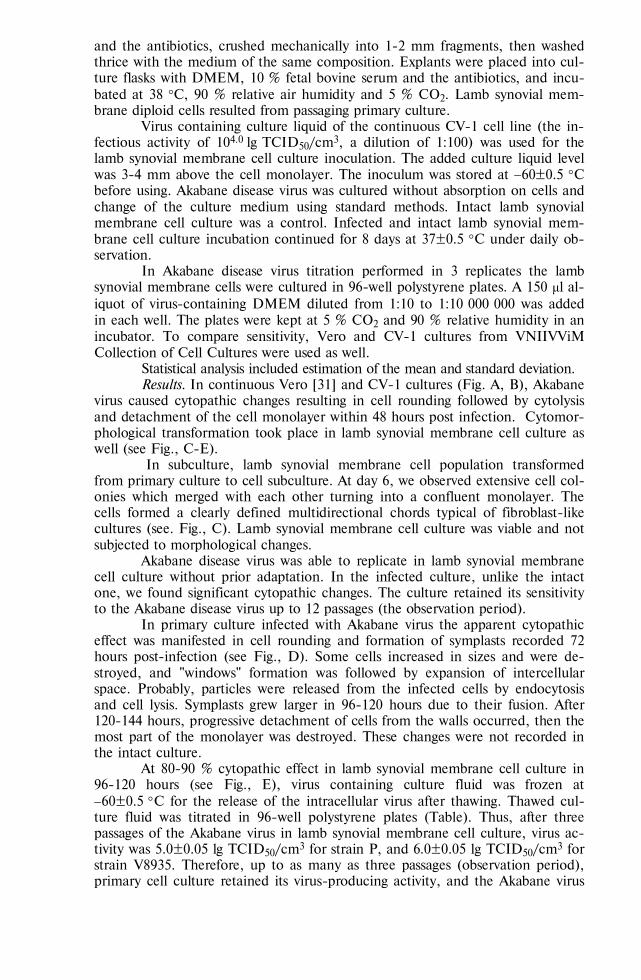
855
and the antibiotics, crushed mechanically into 1-2 mm fragments, then washed thrice with the medium of the same composition. Explants were placed into cul-ture flasks with DMEM, 10 % fetal bovine serum and the antibiotics, and incu-bated at 38 С, 90 % relative air humidity and 5 % CO2. Lamb synovial mem-brane diploid cells resulted from passaging primary culture.
Virus containing culture liquid of the continuous CV-1 cell line (the in-fectious activity of 104.0 lg TCID50/сm3, a dilution of 1:100) was used for the lamb synovial membrane cell culture inoculation. The added culture liquid level was 3-4 mm above the cell monolayer. The inoculum was stored at 60±0.5 С before using. Akabane disease virus was cultured without absorption on cells and change of the culture medium using standard methods. Intact lamb synovial membrane cell culture was a control. Infected and intact lamb synovial mem-brane cell culture incubation continued for 8 days at 37±0.5 С under daily ob-servation.
In Akabane disease virus titration performed in 3 replicates the lamb synovial membrane cells were cultured in 96-well polystyrene plates. A 150 μl al-iquot of virus-containing DMEM diluted from 1:10 to 1:10 000 000 was added in each well. The plates were kept at 5 % CO2 and 90 % relative humidity in an incubator. To compare sensitivity, Vero and CV-1 cultures from VNIIVViM Collection of Cell Cultures were used as well.
Statistical analysis included estimation of the mean and standard deviation. Results. In continuous Vero [31] and СV-1 cultures (Fig. А, B), Akabane
virus caused cytopathic changes resulting in cell rounding followed by cytolysis and detachment of the cell monolayer within 48 hours post infection. Cytomor-phological transformation took place in lamb synovial membrane cell culture as well (see Fig., C-E).
In subculture, lamb synovial membrane cell population transformed from primary culture to cell subculture. At day 6, we observed extensive cell col-onies which merged with each other turning into a confluent monolayer. The cells formed a clearly defined multidirectional сhords typical of fibroblast-like cultures (see. Fig., C). Lamb synovial membrane cell culture was viable and not subjected to morphological changes.
Akabane disease virus was able to replicate in lamb synovial membrane cell culture without prior adaptation. In the infected culture, unlike the intact one, we found significant cytopathic changes. The culture retained its sensitivity to the Akabane disease virus up to 12 passages (the observation period).
In primary culture infected with Akabane virus the apparent cytopathic effect was manifested in cell rounding and formation of symplasts recorded 72 hours post-infection (see Fig., D). Some cells increased in sizes and were de-stroyed, and "windows" formation was followed by expansion of intercellular space. Probably, particles were released from the infected cells by endocytosis and cell lysis. Symplasts grew larger in 96-120 hours due to their fusion. After 120-144 hours, progressive detachment of cells from the walls occurred, then the most part of the monolayer was destroyed. These changes were not recorded in the intact culture.
At 80-90 % cytopathic effect in lamb synovial membrane cell culture in 96-120 hours (see Fig., E), virus containing culture fluid was frozen at 60±0.5 С for the release of the intracellular virus after thawing. Thawed cul-ture fluid was titrated in 96-well polystyrene plates (Table). Thus, after three passages of the Akabane virus in lamb synovial membrane cell culture, virus ac-tivity was 5.0±0.05 lg TCID50/cm3 for strain P, and 6.0±0.05 lg TCID50/cm3 for strain V8935. Therefore, up to as many as three passages (observation period), primary cell culture retained its virus-producing activity, and the Akabane virus
856
retained its infective properties. Cytomorphological changes in lamb synovial membrane cell culture are a technical test to obtain qualitative results in the evaluation of Akabane disease virus activity by titration.
А B
C D
E
Cytopathic effect of the Akabane disease virus (strain В893) in continuous culture of African green monkey kidney cell line CV-1 and in pri-mary lamb synovial membrane cell culture: А and B — intact and infected culture CV-1 72 hours after inoculation; C — intact primary lamb syn-ovial membrane cell culture in 72 hours, D and E — infected primary lamb synovial membrane cell culture 72 and 96 hours after inoculation (light microscopy, magnification ½100).
We compared Vero, CV-1 and
lamb synovial membrane cell cultures sensitivity to Akabane disease virus and found virus activity which differed insignificantly. The obtained parame-ters were 5.85±0.05; 5.8±0.09 and 6.0±0.05 lg ТЦД50/сm3, respectively.
Therefore, we can state that all the above cultures are suitable as a labor-atory model for the Akabane disease virus research. However, the advantage of the primary diploid cell culture is that it is more sensitive, prepared in a special-
857
ized laboratory independently of available donor tissue, that is a referral to a cul-ture museum is not required. The lamb synovial membrane cells can be re-cultured, and excessive diploid culture, like the passaged cells, can be frozen to preserve and thawed if necessary. It is expedient to use a strain of diploid lamb synovial membrane cells but not the primary culture, as the physiological state of diploid lines is better. Preference is usually given to continuous cell lines for the reasons of preservation of donor animals, reducing the cost and a possibility to control cell quality. However, in the case of monkey cells, for example, lack of these animals, their high cost and the fact that they are a source of potential in-fectious danger as carriers of herpes B virus should be considered.
Dynamics of Akabane disease virus cytopathic effect in primary lamb synovial mem-brane cell culture
Virus dilution Day 1 Day 2 Day 3 Day 4 Day 5 Day 6 Day 7 Day 8 S t r a i n P
1:10 + + + + + + 1:100 + + + + + 1:1000 + + + + 1:10 000 + + + + 1:100 000 + + + 1:1 000 000 1:10 000 000
S t r a i n В 8 9 3 5 1:10 + + + + + + 1:100 + + + + + + 1:1000 + + + + + 1:10 000 + + + + 1:100 000 + + + 1:1 000 000 + + + 1:10 000 000
N o t е. «+» — effect, «» — no effect. Titration was performed in three replicates.
Lamb synovial membrane cell culture is close to the cells of one of the animal species with natural susceptibility to the pathogen, so it can subsequently be used to obtain attenuation and live vaccine. Furthermore, the suitability of this culture for the primary isolation of the virus from pathological material should be studied. Note, primary cell cultures are more sensitive and are better suited for such purposes.
Thus, lamb synovial membrane cell culture, as permissive to Akabane disease virus, may be used, along with Vero and CV-1 cell lines, to produce the culture antigen for serological tests to diagnose the disease. Akabane virus causes a characteristic cytopathic effect in the infected monolayer of the above cultures, all of them can serve as a laboratory models for the study, accumulation and ti-tration of the virus, and produced viral raw materials may be used in virology and molecular genetic studies. At the same time, the advantage of the proposed primary diploid cell culture is in its greater sensitivity and accessibility for inde-pendent preparation. It may be re-cultured and the excessive culture can be fro-zen to preserve and thawed as required.
R E F E R E N C E S
1. O m o r i T., I n a b a Y., K u r o g i H., M i u r a Y., N o b u t o K., M o t u m o t o M. Viral
abortion arthrogryposis-hydranencephaly syndrome in cattle in Japan 1972-1974. Bull. Off. Int. Epiz., 1974, 81: 447-458.
2. K o n o R., H i r a t a M., K a j i M., G o t o Y., I k e d a S., Y a n a s e T., K a t o T., T a n a k a S., T s u t s u i T., I m a d a T., Y a m a k a w a M. Bovine epizootic encephalomye-litis caused by Akabane virus in southern Japan. Vet Res., 2008, 13: 4-20.
3. O e m J.K., Y o o n H.J., K i m H.R., R o h I.S., L e e K.H., L e e O.S., B a e Y.C. Genetic and pathogenic characterization of Akabane viruses isolated from cattle with encephalomyelitis in Korea. Vet. Microbiol., 2012, 158(3-4): 259-266 (doi: 10.1016/j.vetmic.2012.02.017).
4. D e l l a - P o r t a A., M u r r a y M., C y b i n s k i D. Congenital bovine epizootic artrogryposis
858
and hydranencephaly in Australia. Distribution of antibodies to Akabane virus in Australian cattle af-ter the 1974 epixootic. Aust. Vet. J., 1976, 52: 496-501 (doi: 10.1111/j.1751-0813.1976.tb06983.x).
5. K a l m a r E., P e l e g B., S a v i r D. Arthogryposis-hydranencephaly syndrome in newborn cattle, sheep and goats. Serological survey for antibodies against the Akabane virus. Ref. Vet., 1975, 32: 47-54.
6. A l -B u s a i d y S.M., H a m b l i n C., T a y l o r V. Neutralising antibodies to Akabane virus in free-living wild animals in Africa. Tropical Animal Health and Production, 1987, 19: 197-202.
7. A l -B u s a i d y S.M., M e l l o r P.S., T a y l o r W.P. Prevalence of neutralizing antibodies to Akabane virus in Arabian Peninsula. Vet. Microbiol., 1988, 17(2): 141-149.
8. O y a A. Annual reports of WHO Regional Reference Center for Arbovirus. National Institute of Health, Tokyo, 1971.
9. N a k a j i m a Y., T a k a h a s h i E., K o n n o S. Encephalomyelitis in mice experimentally in-fected with Akabane virus. Natl. Inst. Anim. Health Q. (Japan), 1979, 19: 47-52.
10. M i a h A., S p r a d b r o w P. The growth of Akabane virus in chicken embryos. Research in Veterinary Science, 1978, 25: 253-254.
11. N a k a m u r a T., M a t s u y a m a T., O k u n o T., O y a A. Arbovirus antibody survey. Igaku no Ayumi (in Japanese), 1967, 60: 72-73.
12. N i k i t i n a E.G., S a l ' n i k o v N.I., B a l a s h o v a E.A., T s y b a n o v S.Zh., K o l b a s o v D.V. Akabane and Schmallenberg diseases: similarities and differences. Agricultural Biology, 2013, 4: 48-52 (doi: 10.15389/agrobiology.2013.4.48eng) (in Engl.).
13. M a t u m o t o M., I n a b a Y. Akabane disease and Akabane virus. Kitasato Arch. Exp. Med., 1980, 53(1-2): 1-21.
14. K a t o T., S h i r a f u j i H., T a n a k a S., S a t o M., Y a m a k a w a M., T s u d a T., Y a n a s e T. Bovine arboviruses in Culicoides biting midges and sentinel cattle in Southern Ja-pan from 2003 to 2013. Transbound. Emerg. Dis., 2015, 63(6): 160-172.
15. M o t u m o t o M., O y a A., O g a t a T., K o b a y a s h i I., N a k a m u r e T., T a k a - h a s h i H., K i t a c k a M. Isolation of arbor viruses from mosquitoes collected at live-stook pens in Gumma Prefecture in 1959. Jap. J. Med. Sci. Biol., 1960, 13: 191-198.
16. B r i n n e r J., T s u d a T., Y a d i n H., C h a i D., S t r a m Y., K a t o T. Serological and clinical evidence of a teratogenic Simbu serogroup virus infection of cattle in Israel 2001-2003. Veterinaria Italiana, 2004, 40(3): 119-123.
17. Y a n g D.K., K i m B.H., K w e o n C.H., N a h J.J., K i m H.J., L e e K.W., Y a n g Y.J., M u n K.W. Serosurveillance for Japanese encephalitis, Akabane, and Aino viruses for Thor-oughbred horses in Korea. J. Vet. Sci., 2008, 9(4): 381-385.
18. O e m J.K., K i m Y.H., K i m S.H., L e e M.H., L e e K.K. Serological characteristics of af-fected cattle during an outbreak of bovine enzootic encephalomyelitis caused by Akabane virus. Trop. Anim. Health Prod., 2014, 46: 261-263.
19. O e m J.K., L e e K.H., K i m H.R., B a e Y.C., C h u n g J.Y., L e e O.S., R o h I.S. Bovin epizootic encephalomyelitis caused by Akabane virus infection in Korea. J. Comp. Pathol., 2012, 147(2-3): 101-105 (doi: 10.1016/j.jcpa.2012.01.013).
20. M u r r a y M.D. Akabane epizoonotis in New South Wales: evidence for the long-distance dispersal of the biting midge Culicoides brevitarsis. Australian Veterinary Journal, 1987, 64(10): 305-308.
21. Y i l m a z H., H o f f m a n n B., T u r a n N., C i z m e c i g i l U.Y., R i c h t J.A., V a n d e r P o e l W.H. Detection and partial sequencing of Schmallenberg virus in cattle and sheep in Turkey. Vector-Borne and Zoonotic Diseases, 2014, 14: 223-225.
22. S e l l e r s R., H e r n i m a n K. Neutralising antibodies to Akabane virus in ruminants in Ciprus (transmitted by Culicoides midges). Trop. Anim. Health Prod., 1981, 13(1): 57-60.
23. S e l l e r s R., P e d g l e y D. Possible windborne spread to western Turkey of bluetongue virus in 1977 and of Akabane virus in 1979. Journal of Hygiene, 1995, 1: 149-158.
24. E l h a s s a n A.M., M a n s o u r M.E., S h a m o n A.A., E I H u s s e i n A.M. A serological survey of Akabane virus infection in cattle in Sudan. ISRN Veterinary Science, 2014: Article ID 123904 (doi: 10.1155/2014/123904).
25. M e t s e l a a r D., R o b i n Y. Akabane virus isolated in Kenya. Vet. Rec., 1976, 99(5): 86 (doi: 10.1136/vr.99.5.86-a).
26. A n d e r s o n A.A., C a m p b e l l C.H. Experimental placental transfer of Akabane of virus in the hamster. Am. J. Vet. Res., 1978, 39: 301-304.
27. K u r o g i H., I n a b a Y., T a k a h a s h i H., S a t o K., A k a s h i H., S a t o d a K., O m o -r i T. An attenuated strain of Akabane virus: a candidate for live virus vaccine. Natl. Inst. Anim. Health Q (Tokyo), 1979, 19(1-2): 12-22.
28. K u r o g i H., I n a b a Y., T a k a h a s h i H., S a t o K., O m o r i T., M i u r a Y., G o t o Y.M., F u j i w a r a Y., H a t a n o Y., K o d a m a K., F u k u y a m a S., S a s a k i N., M a -t u m o t o M. Epizootik congenital artrogryposis-hydranencephaly syndrom in cattle of Aka-bane virus from affected fetuses. Arch. Virol., 1976, 51: 67-74.
29. M a l a k h o v a M.S., B a l a s h o v a E.A. Tezisy konferentsii «Voprosy veterinarnoi virusologii,

859
mikrobiologii i epizootologii» [Proc. Conf. «Veterinary virology, microbiology and epizootology»]. Pokrov, 1990: 83-84 (in Russ.).
30. N i k i t i n a E.G., S a l ’ n i k o v N.I., K a t o r k i n S.A., B a l a s h o v a E.A., T s y b a n o v S.Zh., K o l b a s o v D.V., L u n i t s i n A.V. Detection of Akabane virus genome in organs and blood of experimentally infected cavies. Agricultural Biology, 2014, 6: 67-72 (doi: 10.15389/agrobiology.2014.6.67eng) (in Engl.).
31. K o t o v a O.Yu., K h a n E.O., K u s h n i r S.D., P o n o m a r e v V.N., Y u r k o v S.D., B a l a s h o v a E.A. Nauchnyi zhurnal KubGau (Krasnodar), 2012, 83(09). Available http://www.ej.kubagro.ru/2012/09/pdf/52.pdf. No date (in Russ.).
32. Ko t o v a O.Yu., S u vo ro v a Yu.A., Ku s h n i r S.D., Yu rk o v S.G., B a l a s ho v a E.A. Veter-inariya, 2015, 3: 57-59 (in Russ.).
33. B a r y s h n i k o v a E.I., K o l b a s o v a O.L. Shtamm diploidnykh kletok sinovial'noi membrany yagnenka Ovis aries, ispol'zuemyi dlya virusologicheskikh issledovanii. Pat. RF 2507255. GNU NIIVViM Rossel'khozakademii. Zayavl. 23.07.2012. Opubl. 20.02.2014 [A strain of diploid cells of lamb Ovis aries synovial membrane for virological research. Patent RF 2507255. GNU NIIV-ViM RAS. Appl. July 23, 2012. Publ. February 20, 2014] (in Russ.).
34. S i d e l ' n i k o v G.D., K o l b a s o v a O.L., Z h i g a l e v a O.N., T s y b a n o v S.Zh., K o l b a s o v D.V. Veterinariya, 2009, 4: 52-55 (in Russ.).
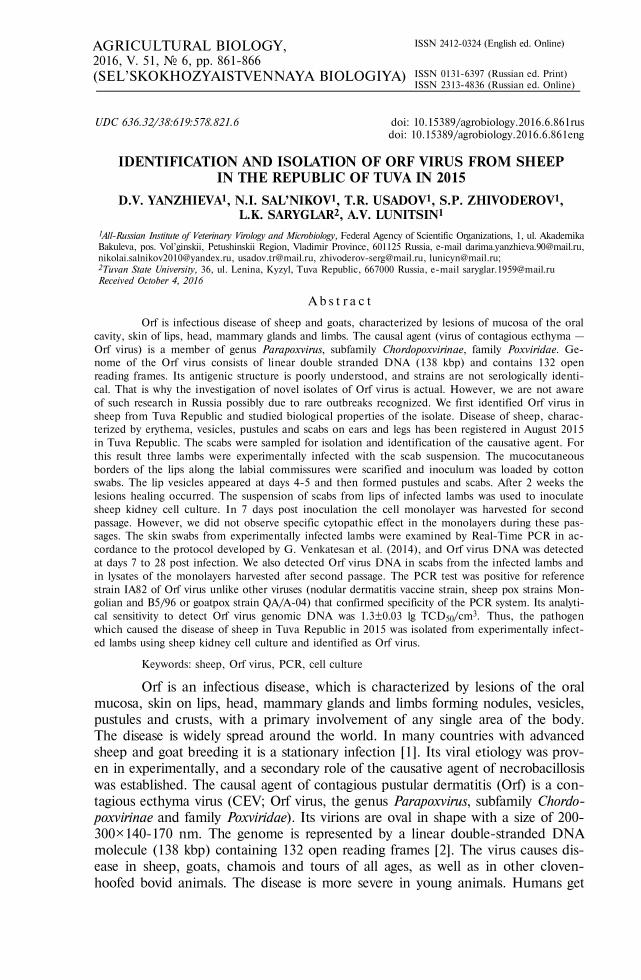
861
AGRICULTURAL BIOLOGY, ISSN 2412-0324 (English ed. Online)
2016, V. 51, ¹ 6, pp. 861-866 (SEL’SKOKHOZYAISTVENNAYA BIOLOGIYA) ISSN 0131-6397 (Russian ed. Print)
ISSN 2313-4836 (Russian ed. Online) UDC 636.32/38:619:578.821.6 doi: 10.15389/agrobiology.2016.6.861rus
doi: 10.15389/agrobiology.2016.6.861eng
IDENTIFICATION AND ISOLATION OF ORF VIRUS FROM SHEEP IN THE REPUBLIC OF TUVA IN 2015
D.V. YANZHIEVA1, N.I. SAL’NIKOV1, T.R. USADOV1, S.P. ZHIVODEROV1, L.K. SARYGLAR2, A.V. LUNITSIN1
1All-Russian Institute of Veterinary Virology and Microbiology, Federal Agency of Scientific Organizations, 1, ul. Akademika Bakuleva, pos. Vol’ginskii, Petushinskii Region, Vladimir Province, 601125 Russia, e-mail [email protected], [email protected], [email protected], [email protected], [email protected]; 2Tuvan State University, 36, ul. Lenina, Kyzyl, Tuva Republic, 667000 Russia, e-mail [email protected] Received October 4, 2016
A b s t r a c t
Orf is infectious disease of sheep and goats, characterized by lesions of mucosa of the oral cavity, skin of lips, head, mammary glands and limbs. The causal agent (virus of contagious ecthyma — Orf virus) is a member of genus Parapoxvirus, subfamily Chordopoxvirinae, family Poxviridae. Ge-nome of the Orf virus consists of linear double stranded DNA (138 kbp) and contains 132 open reading frames. Its antigenic structure is poorly understood, and strains are not serologically identi-cal. That is why the investigation of novel isolates of Orf virus is actual. However, we are not aware of such research in Russia possibly due to rare outbreaks recognized. We first identified Orf virus in sheep from Tuva Republic and studied biological properties of the isolate. Disease of sheep, charac-terized by erythema, vesicles, pustules and scabs on ears and legs has been registered in August 2015 in Tuva Republic. The scabs were sampled for isolation and identification of the causative agent. For this result three lambs were experimentally infected with the scab suspension. The mucocutaneous borders of the lips along the labial commissures were scarified and inoculum was loaded by cotton swabs. The lip vesicles appeared at days 4-5 and then formed pustules and scabs. After 2 weeks the lesions healing occurred. The suspension of scabs from lips of infected lambs was used to inoculate sheep kidney cell culture. In 7 days post inoculation the cell monolayer was harvested for second passage. However, we did not observe specific cytopathic effect in the monolayers during these pas-sages. The skin swabs from experimentally infected lambs were examined by Real-Time PCR in ac-cordance to the protocol developed by G. Venkatesan et al. (2014), and Orf virus DNA was detected at days 7 to 28 post infection. We also detected Orf virus DNA in scabs from the infected lambs and in lysates of the monolayers harvested after second passage. The PCR test was positive for reference strain IA82 of Orf virus unlike other viruses (nodular dermatitis vaccine strain, sheep pox strains Mon-golian and B5/96 or goatpox strain QA/A-04) that confirmed specificity of the PCR system. Its analyti-cal sensitivity to detect Orf virus genomic DNA was 1.3±0.03 lg TCD50/cm3. Thus, the pathogen which caused the disease of sheep in Tuva Republic in 2015 was isolated from experimentally infect-ed lambs using sheep kidney cell culture and identified as Orf virus.
Keywords: sheep, Orf virus, PCR, cell culture
Orf is an infectious disease, which is characterized by lesions of the oral mucosa, skin on lips, head, mammary glands and limbs forming nodules, vesicles, pustules and crusts, with a primary involvement of any single area of the body. The disease is widely spread around the world. In many countries with advanced sheep and goat breeding it is a stationary infection [1]. Its viral etiology was prov-en in experimentally, and a secondary role of the causative agent of necrobacillosis was established. The causal agent of contagious pustular dermatitis (Orf) is a con-tagious ecthyma virus (CEV; Orf virus, the genus Parapoxvirus, subfamily Chordo-poxvirinae and family Poxviridae). Its virions are oval in shape with a size of 200-300½140-170 nm. The genome is represented by a linear double-stranded DNA molecule (138 kbp) containing 132 open reading frames [2]. The virus causes dis-ease in sheep, goats, chamois and tours of all ages, as well as in other cloven-hoofed bovid animals. The disease is more severe in young animals. Humans get
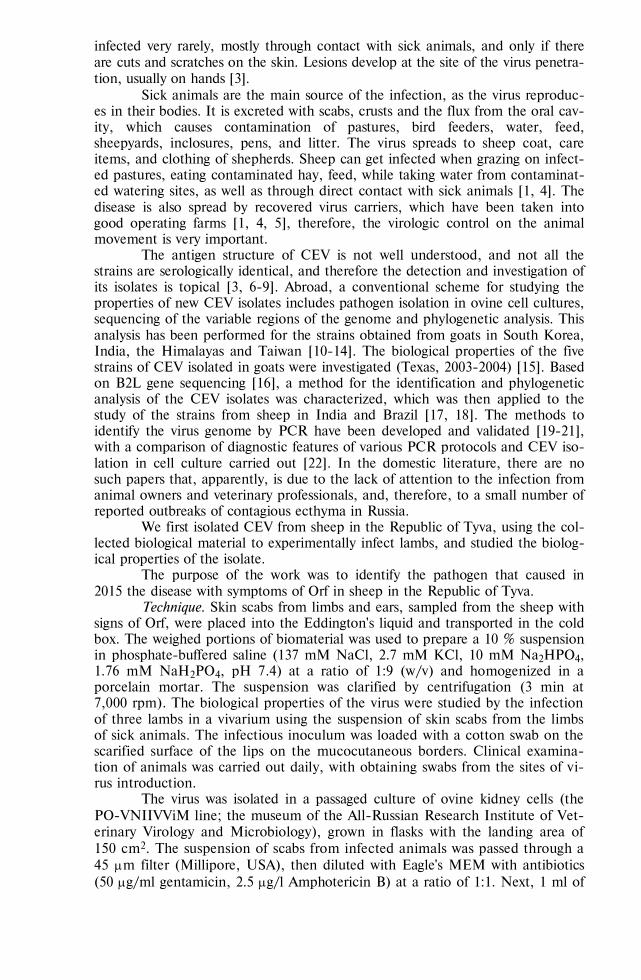
862
infected very rarely, mostly through contact with sick animals, and only if there are cuts and scratches on the skin. Lesions develop at the site of the virus penetra-tion, usually on hands [3].
Sick animals are the main source of the infection, as the virus reproduc-es in their bodies. It is excreted with scabs, crusts and the flux from the oral cav-ity, which causes contamination of pastures, bird feeders, water, feed, sheepyards, inclosures, pens, and litter. The virus spreads to sheep coat, care items, and clothing of shepherds. Sheep can get infected when grazing on infect-ed pastures, eating contaminated hay, feed, while taking water from contaminat-ed watering sites, as well as through direct contact with sick animals [1, 4]. The disease is also spread by recovered virus carriers, which have been taken into good operating farms [1, 4, 5], therefore, the virologic control on the animal movement is very important.
The antigen structure of CEV is not well understood, and not all the strains are serologically identical, and therefore the detection and investigation of its isolates is topical [3, 6-9]. Abroad, a conventional scheme for studying the properties of new CEV isolates includes pathogen isolation in ovine cell cultures, sequencing of the variable regions of the genome and phylogenetic analysis. This analysis has been performed for the strains obtained from goats in South Korea, India, the Himalayas and Taiwan [10-14]. The biological properties of the five strains of CEV isolated in goats were investigated (Texas, 2003-2004) [15]. Based on B2L gene sequencing [16], a method for the identification and phylogenetic analysis of the CEV isolates was characterized, which was then applied to the study of the strains from sheep in India and Brazil [17, 18]. The methods to identify the virus genome by PCR have been developed and validated [19-21], with a comparison of diagnostic features of various PCR protocols and CEV iso-lation in cell culture carried out [22]. In the domestic literature, there are no such papers that, apparently, is due to the lack of attention to the infection from animal owners and veterinary professionals, and, therefore, to a small number of reported outbreaks of contagious ecthyma in Russia.
We first isolated CEV from sheep in the Republic of Tyva, using the col-lected biological material to experimentally infect lambs, and studied the biolog-ical properties of the isolate.
The purpose of the work was to identify the pathogen that caused in 2015 the disease with symptoms of Orf in sheep in the Republic of Tyva.
Technique. Skin scabs from limbs and ears, sampled from the sheep with signs of Orf, were placed into the Eddington's liquid and transported in the cold box. The weighed portions of biomaterial was used to prepare a 10 % suspension in phosphate-buffered saline (137 mM NaCl, 2.7 mM KCl, 10 mM Na2HPO4, 1.76 mM NaH2PO4, pH 7.4) at a ratio of 1:9 (w/v) and homogenized in a porcelain mortar. The suspension was clarified by centrifugation (3 min at 7,000 rpm). The biological properties of the virus were studied by the infection of three lambs in a vivarium using the suspension of skin scabs from the limbs of sick animals. The infectious inoculum was loaded with a cotton swab on the scarified surface of the lips on the mucocutaneous borders. Clinical examina-tion of animals was carried out daily, with obtaining swabs from the sites of vi-rus introduction.
The virus was isolated in a passaged culture of ovine kidney cells (the PO-VNIIVViM line; the museum of the All-Russian Research Institute of Vet-erinary Virology and Microbiology), grown in flasks with the landing area of 150 cm2. The suspension of scabs from infected animals was passed through a 45 m filter (Millipore, USA), then diluted with Eagle's MEM with antibiotics (50 g/ml gentamicin, 2.5 g/l Amphotericin B) at a ratio of 1:1. Next, 1 ml of
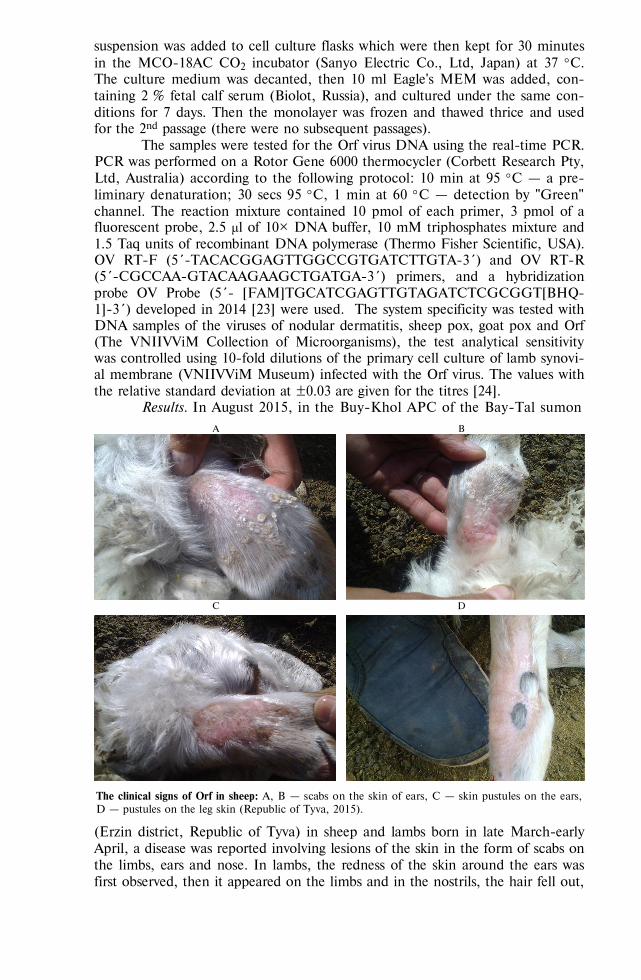
863
suspension was added to cell culture flasks which were then kept for 30 minutes in the MCO-18AC CO2 incubator (Sanyo Electric Co., Ltd, Japan) at 37 С. The culture medium was decanted, then 10 ml Eagle's MEM was added, con-taining 2 % fetal calf serum (Biolot, Russia), and cultured under the same con-ditions for 7 days. Then the monolayer was frozen and thawed thrice and used for the 2nd passage (there were no subsequent passages).
The samples were tested for the Orf virus DNA using the real-time PCR. PCR was performed on a Rotor Gene 6000 thermocycler (Corbett Research Pty, Ltd, Australia) according to the following protocol: 10 min at 95 С — a pre-liminary denaturation; 30 secs 95 С, 1 min at 60 С — detection by "Green" channel. The reaction mixture contained 10 pmol of each primer, 3 pmol of a fluorescent probe, 2.5 μl of 10½ DNA buffer, 10 mM triphosphates mixture and 1.5 Taq units of recombinant DNA polymerase (Thermo Fisher Scientific, USA). OV RT-F (5´-TACACGGAGTTGGCCGTGATCTTGTA-3´) and OV RT-R (5´-CGCCAA-GTACAAGAAGCTGATGA-3´) primers, and a hybridization probe OV Probe (5´- [FAM]TGCATCGAGTTGTAGATCTCGCGGT[BHQ-1]-3´) developed in 2014 [23] were used. The system specificity was tested with DNA samples of the viruses of nodular dermatitis, sheep pox, goat pox and Orf (The VNIIVViM Collection of Microorganisms), the test analytical sensitivity was controlled using 10-fold dilutions of the primary cell culture of lamb synovi-al membrane (VNIIVViM Museum) infected with the Orf virus. The values with the relative standard deviation at ±0.03 are given for the titres [24].
Results. In August 2015, in the Buy-Khol APC of the Bay-Tal sumon
A B
C D
The clinical signs of Orf in sheep: A, B — scabs on the skin of ears, C — skin pustules on the ears, D — pustules on the leg skin (Republic of Tyva, 2015).
(Erzin district, Republic of Tyva) in sheep and lambs born in late March-early April, a disease was reported involving lesions of the skin in the form of scabs on the limbs, ears and nose. In lambs, the redness of the skin around the ears was first observed, then it appeared on the limbs and in the nostrils, the hair fell out,
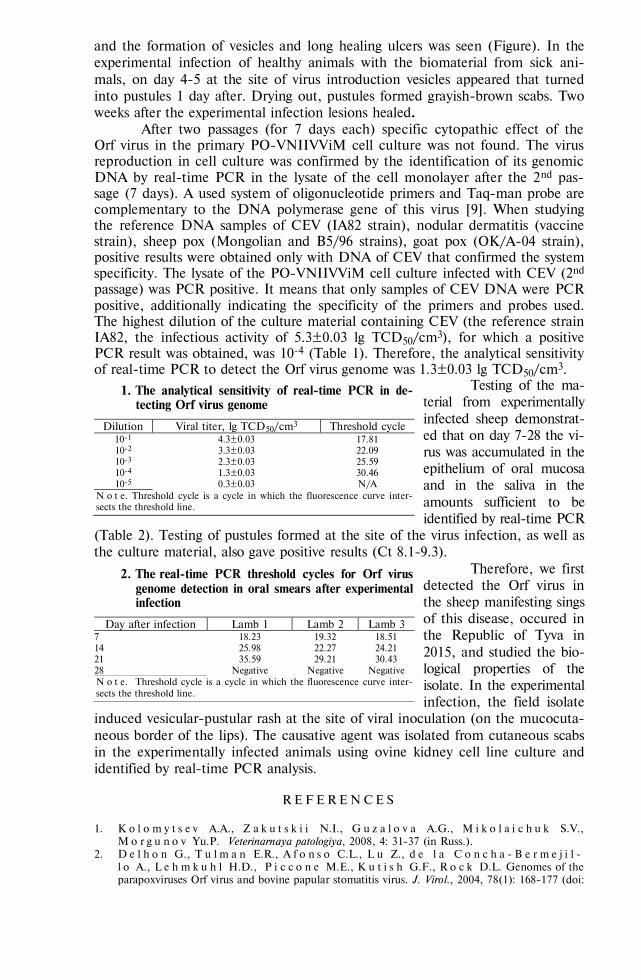
864
and the formation of vesicles and long healing ulcers was seen (Figure). In the experimental infection of healthy animals with the biomaterial from sick ani-mals, on day 4-5 at the site of virus introduction vesicles appeared that turned into pustules 1 day after. Drying out, pustules formed grayish-brown scabs. Two weeks after the experimental infection lesions healed.
After two passages (for 7 days each) specific cytopathic effect of the Orf virus in the primary PO-VNIIVViM cell culture was not found. The virus reproduction in cell culture was confirmed by the identification of its genomic DNA by real-time PCR in the lysate of the cell monolayer after the 2nd pas-sage (7 days). A used system of oligonucleotide primers and Taq-man probe are complementary to the DNA polymerase gene of this virus [9]. When studying the reference DNA samples of CEV (IA82 strain), nodular dermatitis (vaccine strain), sheep pox (Mongolian and B5/96 strains), goat pox (OK/A-04 strain), positive results were obtained only with DNA of CEV that confirmed the system specificity. The lysate of the PO-VNIIVViM cell culture infected with CEV (2nd passage) was PCR positive. It means that only samples of CEV DNA were PCR positive, additionally indicating the specificity of the primers and probes used. The highest dilution of the culture material containing CEV (the reference strain IA82, the infectious activity of 5.3±0.03 lg TCD50/cm3), for which a positive PCR result was obtained, was 10-4 (Table 1). Therefore, the analytical sensitivity of real-time PCR to detect the Orf virus genome was 1.3±0.03 lg TCD50/cm3.
Testing of the ma-terial from experimentally infected sheep demonstrat-ed that on day 7-28 the vi-rus was accumulated in the epithelium of oral mucosa and in the saliva in the amounts sufficient to be identified by real-time PCR
(Table 2). Testing of pustules formed at the site of the virus infection, as well as the culture material, also gave positive results (Ct 8.1-9.3).
Therefore, we first detected the Orf virus in the sheep manifesting sings of this disease, occured in the Republic of Tyva in 2015, and studied the bio-logical properties of the isolate. In the experimental infection, the field isolate
induced vesicular-pustular rash at the site of viral inoculation (on the mucocuta-neous border of the lips). The causative agent was isolated from cutaneous scabs in the experimentally infected animals using ovine kidney cell line culture and identified by real-time PCR analysis.
R E F E R E N C E S
1. K o l o m y t s e v A.A., Z a k u t s k i i N.I., G u z a l o v a A.G., M i k o l a i c h u k S.V.,
M o r g u n o v Yu.P. Veterinarnaya patologiya, 2008, 4: 31-37 (in Russ.). 2. D e l h o n G., T u l m a n E.R., A f o n s o C.L., L u Z., d e l a C o n c h a - B e r m e j i l -
l o A., L e h m k u h l H.D., P i c c o n e M.E., K u t i s h G.F., R o c k D.L. Genomes of the parapoxviruses Orf virus and bovine papular stomatitis virus. J. Virol., 2004, 78(1): 168-177 (doi:
1. The analytical sensitivity of real-time PCR in de-tecting Orf virus genome
Dilution Viral titer, lg TCD50/cm3 Threshold cycle 10-1 4.3±0.03 17.81 10-2 3.3±0.03 22.09 10-3 2.3±0.03 25.59 10-4 1.3±0.03 30.46 10-5 0.3±0.03 N/A
N o t e. Threshold cycle is a cycle in which the fluorescence curve inter-sects the threshold line.
2. The real-time PCR threshold cycles for Orf virus genome detection in oral smears after experimental infection
Day after infection Lamb 1 Lamb 2 Lamb 3 7 18.23 19.32 18.51 14 25.98 22.27 24.21 21 35.59 29.21 30.43 28 Negative Negative Negative N o t e. Threshold cycle is a cycle in which the fluorescence curve inter-sects the threshold line.
865
10.1128/JVI.78.1.168-177.2004). 3. B a y i n d i r Y., B a y r a k t a r M., K a r a d a g N., O z c a n H., K a y a b a s U., O t l u B.,
D u r m a z R., D o g a n a y M. Investigation and analysis of a human orf outbreak among people living on the same farm. New microbiologica, 2011, 34: 37-43.
4. H o s a m a n i A., S c a g l i a r i n i A., B h a n u p r a k a s h V., M c I n n e s C.J., S i n g h R.K. Orf: an update on current research and future perspectives. Expert Review on Anti-infective Ther-apy, 2009, 7(7): 879-893 (doi: 10.1586/eri.09.64).
5. B h a n u p r a k a s h V., V e n k a t e s a n G., B a l a m u r u g a n V., H o s a m a n i M., Y o -g i s h a r a d h y a R., C h a u h a n R.S., P a n d e A., M o n d a l B., S i n g h R.K. Pox out-breaks in sheep and goats at Makhdoom (Uttar Pradesh), India: evidence of sheep pox vi-rus infection in goats. Transbound. Emerg. Dis., 2010, 57(5): 375-382 (doi: 10.1111/j.1865-1682.2010.01158.x).
6. A b u b a n k r M.I., A b u -E l z e i n E.M., H o u s a w i F.M., A b d e l r a h m a n A.O., F a d l a l l a h M.E., N a y e l M.N., A d a m A.S., M o s s S., F o r r e s t e r N.L., C o l o y a n E., G a m e e t A., A l -A f a l e q A.I., G o u l d E.A. Pseudo cow poxvirus: the etiological agent of contagious ecthyma (Auzdyk) in camels (Camelus dromedarius) in the Arabi-an peninsula. Vector Borne Zoonotic Diseases, 2007, 7(2): 257-260 (doi: 10.1089/vbz.2006.0627).
7. A b d e l r a b m a n K., S o l i m a n H. Molecular and virological studies on contagious pustular dermatitis isolates from Egyption sheep and goats. Research in Veterinary Science, 2010, 89(2): 290-294 (doi: 10.1016/j.rvsc.2010.02.019).
8. W i s e L.M., S a v o r y L.J., D r y d e n N.H., W h e l a n E.M., F l e m i n g S.B., M e r c - e r A.A. The development of oral lesions in lambs naturally infected with orf virus. Veterinary Journal, 2007, 174(3): 663-664 (doi: 10.1016/j.tvjl.2006.10.024).
9. V e n k a t e s a n G., B a l a m u r u g a n V., B h a n u p r a k a s h V. TaqMan based real-time duplex PCR for simultaneous detection and quantitation of Capri pox and Orf virus genomes in clinical samples. J. Virol. Methods, 2014, 201: 44-50 (doi: 10.1016/j.jviromet.2014.02.007).
10. O e m J.-K., C h u n g J.-Y., K i m Y.-J., L e e K.-K., K i m S.-H., J u n g B.-Y., H y - u n B.-H. Isolation and characterization of orf viruses from Korean black goats. J. Vet. Sci., 2013, 14(2): 227-230 (doi: 10.4142/jvs.2013.14.2.227).
11. B o r a D.P., B a r m a n N.N., D a s S.K., B h a n u p r a k a s h V., Y o g i s h a r a d h y a R., V e n k a t e s a n G., K u m a r A., R a j b o n g s h i G., K h a t o o n E., C h a k r a b o r t y A., B u j a r b a r u a h K.M. Identification and phylogenetic analysis of orf viruses isolated from outbreaks in goats of Assam, a northeastern state of India. Virus Genes, 2012, 45: 98-104 (doi: 10.1007/s11262-012-0740-y).
12. C h a n K.W., L i n J.W., L e e S.H., L i a o C.J., T s a i M.C., H s u W.L., W o n g M.L., S h i h H.C. Identification and phylogenetic analysis of orf virus from goats in Taiwan. Virus Genes, 2007, 35: 705-712 (doi: 10.1007/s11262-007-0144-6).
13. M o n d a l B., B e r a A.K., H o s a m a n i M., T e m b h u r n e P.A., B a n d y o p a d h y - a y S.K. Detection of orf virus from an outbreak in goats and its genetic relation with other parapox-viruses. Veterinary Research Community, 2006, 30: 531-539 (doi: 10.1007/s11259-006-3270-z).
14. H o s a m a n i M., Y a d a v S., K a l l e s h D.J., M o n d a l B., B h a n u p r a k a s h V., S i n g h R.K. Isolation and characterization of an Indian orf virus from goats. Zoonoses Public Health, 2007, 54: 204-208 (doi: 10.1111/j.1863-378.2007.01046.x).
15. M u s s e r J.M.B., T a y l o r C.A., G u o J., T i z a r d I.R., W a l k e r J.W. Development of a contagious ecthyma vaccine for goats. Am. J. Vet. Res., 2008, 69: 1366-1370 (doi: 10.2460/ajvr.69.10.1366).
16. H o s a m a n i M., B h a n u p r a k a s h V., S c a g l i a r i n i A., S i n g h R.K. Compara-tive sequence analysis of major envelope protein gene (B2L) of Indian orf viruses isolated from sheep and goats. Vet. Microbiol., 2006, 116: 317-324 (doi: 10.1016/j.vetmic.2006.04.028).
17. V e n k a t e s a n G., B a l a m u r u g a n V., B o r a D.P., Y o g i s h a r a d h y a R., P r a b h u M., B h a n u p r a k a s h V. Sequence and phylogenetic analyses of an Indian iso-late of orf virus from sheep. Veterinaria Italiana, 2011, 47(3): 323-332.
18. A b r a h ã o J.S., C a m p o s R.K., T r i n d a d e G.S., G u e d e s M.I., L o b a t o Z.I., M a z u r C., F e r r e i r a P.C., B o n j a r d i m C.A., K r o o n E.G. Detection and phy-logenetic analysis of orf virus from sheep in Brazil: a case report. Virol. J., 2009, 6: 47 (doi: 10.1186/1743-422X-6-47).
19. C h a n K.W., H s u W.L., W a n g C.Y., Y a n g C.H., Li n F.Y., C h u l a k a s i a n S., W o n g M.L. Differential diagnosis of orf viruses by a single-step PCR. J. Virol. Methods, 2009, 160(1-2): 85-89 (doi: 10.1016/j.jviromet.2009.04.025).
20. Ga l l i n a L., Da l P o z z o F., M c I n n e s C.J., C a rd e t i G., Gu e r c i o A., B a t t i l a n i M., C i u l l i S., S c a g l i a r i n i A. A real-time PCR assay for the detection and quantification of orf virus. J. Virol. Methods, 2005, 134: 140-145 (doi: 10.1016/j.jviromet.2005.12.014).
21. N i t s c h e A., B u t t n e r M., W i l h e l m S., P a u l i G. M e y e r H. Real-Time PCR detec-tion of parapoxvirus DNA. Clin. Chem., 2006, 52(2): 316-319 (doi: 10.1373/clinchem.2005.060335).
22. K o t t a r i d i C., N o m i k o u K., L e l l i R., M a r k o u l a t o s P., M a n g a n a O. Laborato-

866
ry diagnosis of contagious ecthyma: comparison of different PCR protocols with virus isolation in cell culture. J. Virol. Methods, 2006, 134: 119-124 (doi: 10.1016/j.jviromet.2005.12.005).
23. V e n k a t e s a n G., B a l a m u r u g a n V., B h a n u p r a k a s h V. TaqMan based real-time duplex PCR for simultaneous detection and quantitation of Capri pox and Orf virus genomes in clinical samples. J. Virol. Methods, 2014, 201: 44-50 (doi: 10.1016/j.jviromet.2014.02.007).
24. L a k i n G.F. Biometriya [Biometry]. Moscow, 1990 (in Russ.).
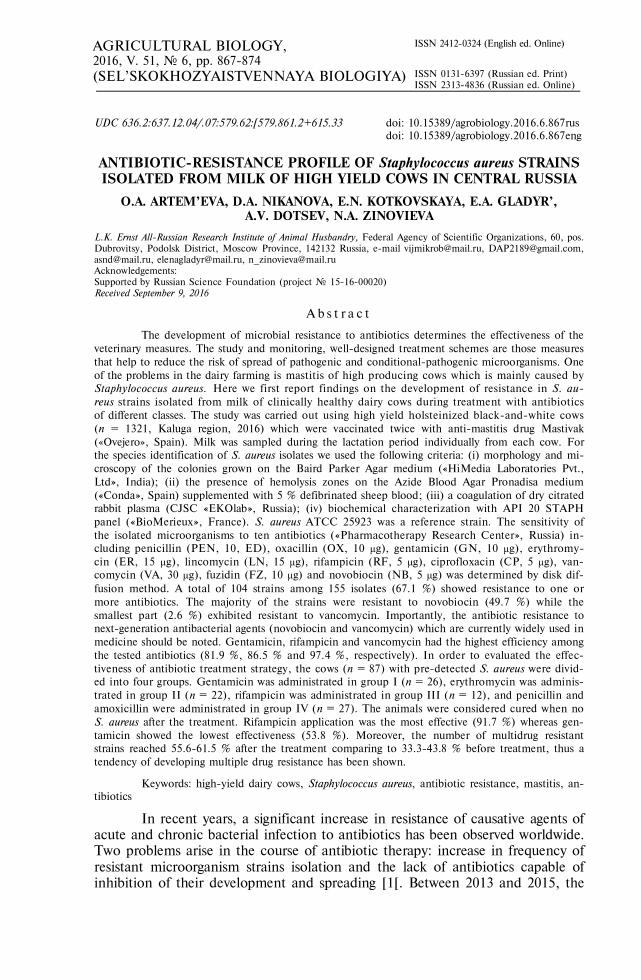
867
AGRICULTURAL BIOLOGY, ISSN 2412-0324 (English ed. Online)
2016, V. 51, ¹ 6, pp. 867-874 (SEL’SKOKHOZYAISTVENNAYA BIOLOGIYA) ISSN 0131-6397 (Russian ed. Print)
ISSN 2313-4836 (Russian ed. Online) UDC 636.2:637.12.04/.07:579.62:[579.861.2+615.33 doi: 10.15389/agrobiology.2016.6.867rus
doi: 10.15389/agrobiology.2016.6.867eng ANTIBIOTIC-RESISTANCE PROFILE OF Staphylococcus aureus STRAINS ISOLATED FROM MILK OF HIGH YIELD COWS IN CENTRAL RUSSIA
O.A. ARTEM’EVA, D.A. NIKANOVA, E.N. KOTKOVSKAYA, E.A. GLADYR’, A.V. DOTSEV, N.A. ZINOVIEVA
L.K. Ernst All-Russian Research Institute of Animal Husbandry, Federal Agency of Scientific Organizations, 60, pos. Dubrovitsy, Podolsk District, Moscow Province, 142132 Russia, e-mail [email protected], [email protected], [email protected], [email protected], [email protected] Acknowledgements: Supported by Russian Science Foundation (project ¹ 15-16-00020) Received September 9, 2016
A b s t r a c t
The development of microbial resistance to antibiotics determines the effectiveness of the veterinary measures. The study and monitoring, well-designed treatment schemes are those measures that help to reduce the risk of spread of pathogenic and conditional-pathogenic microorganisms. One of the problems in the dairy farming is mastitis of high producing cows which is mainly caused by Staphylococcus aureus. Here we first report findings on the development of resistance in S. au-reus strains isolated from milk of clinically healthy dairy cows during treatment with antibiotics of different classes. The study was carried out using high yield holsteinized black-and-white cows (n = 1321, Kaluga region, 2016) which were vaccinated twice with anti-mastitis drug Mastivak («Ovejero», Spain). Milk was sampled during the lactation period individually from each cow. For the species identification of S. aureus isolates we used the following criteria: (i) morphology and mi-croscopy of the colonies grown on the Baird Parker Agar medium («HiMedia Laboratories Pvt., Ltd», India); (ii) the presence of hemolysis zones on the Azide Blood Agar Pronadisa medium («Conda», Spain) supplemented with 5 % defibrinated sheep blood; (iii) a coagulation of dry citrated rabbit plasma (CJSC «EKOlab», Russia); (iv) biochemical characterization with API 20 STAPH panel («BioMerieux», France). S. aureus ATCC 25923 was a reference strain. The sensitivity of the isolated microorganisms to ten antibiotics («Pharmacotherapy Research Center», Russia) in-cluding penicillin (PEN, 10, ED), oxacillin (OX, 10 μg), gentamicin (GN, 10 μg), erythromy-cin (ER, 15 μg), lincomycin (LN, 15 μg), rifampicin (RF, 5 μg), ciprofloxacin (CP, 5 μg), van-comycin (VA, 30 μg), fuzidin (FZ, 10 μg) and novobiocin (NB, 5 μg) was determined by disk dif-fusion method. A total of 104 strains among 155 isolates (67.1 %) showed resistance to one or more antibiotics. The majority of the strains were resistant to novobiocin (49.7 %) while the smallest part (2.6 %) exhibited resistant to vancomycin. Importantly, the antibiotic resistance to next-generation antibacterial agents (novobiocin and vancomycin) which are currently widely used in medicine should be noted. Gentamicin, rifampicin and vancomycin had the highest efficiency among the tested antibiotics (81.9 %, 86.5 % and 97.4 %, respectively). In order to evaluated the effec-tiveness of antibiotic treatment strategy, the cows (n = 87) with pre-detected S. aureus were divid-ed into four groups. Gentamicin was administrated in group I (n = 26), erythromycin was adminis-trated in group II (n = 22), rifampicin was administrated in group III (n = 12), and penicillin and amoxicillin were administrated in group IV (n = 27). The animals were considered cured when no S. aureus after the treatment. Rifampicin application was the most effective (91.7 %) whereas gen-tamicin showed the lowest effectiveness (53.8 %). Moreover, the number of multidrug resistant strains reached 55.6-61.5 % after the treatment comparing to 33.3-43.8 % before treatment, thus a tendency of developing multiple drug resistance has been shown.
Keywords: high-yield dairy cows, Staphylococcus aureus, antibiotic resistance, mastitis, an-tibiotics
In recent years, a significant increase in resistance of causative agents of acute and chronic bacterial infection to antibiotics has been observed worldwide. Two problems arise in the course of antibiotic therapy: increase in frequency of resistant microorganism strains isolation and the lack of antibiotics capable of inhibition of their development and spreading [1[. Between 2013 and 2015, the
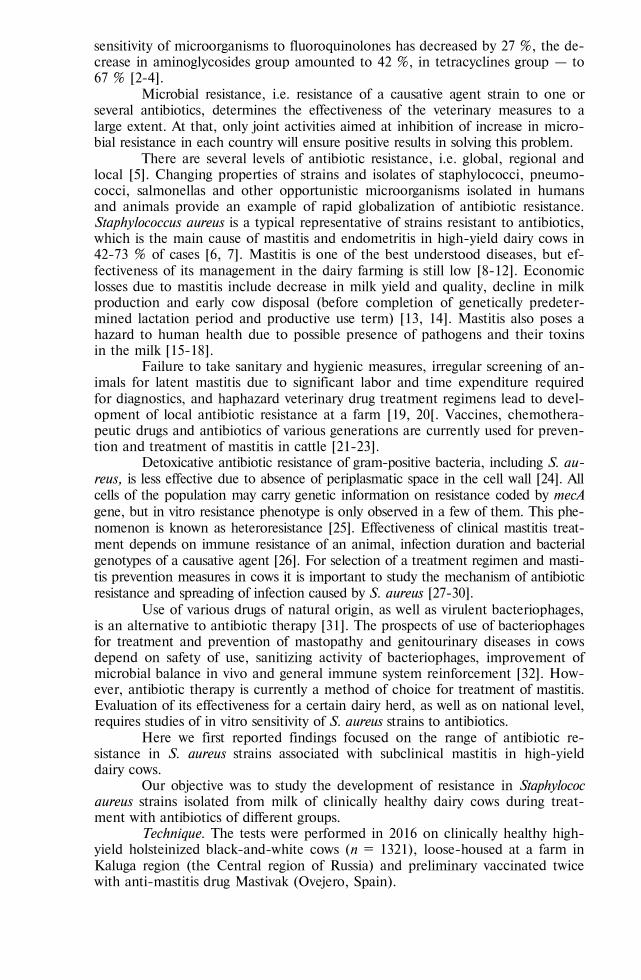
868
sensitivity of microorganisms to fluoroquinolones has decreased by 27 %, the de-crease in aminoglycosides group amounted to 42 %, in tetracyclines group — to 67 % [2-4].
Microbial resistance, i.e. resistance of a causative agent strain to one or several antibiotics, determines the effectiveness of the veterinary measures to a large extent. At that, only joint activities aimed at inhibition of increase in micro-bial resistance in each country will ensure positive results in solving this problem.
There are several levels of antibiotic resistance, i.e. global, regional and local [5]. Changing properties of strains and isolates of staphylococci, pneumo-cocci, salmonellas and other opportunistic microorganisms isolated in humans and animals provide an example of rapid globalization of antibiotic resistance. Staphylococcus aureus is a typical representative of strains resistant to antibiotics, which is the main cause of mastitis and endometritis in high-yield dairy cows in 42-73 % of cases [6, 7]. Mastitis is one of the best understood diseases, but ef-fectiveness of its management in the dairy farming is still low [8-12]. Economic losses due to mastitis include decrease in milk yield and quality, decline in milk production and early cow disposal (before completion of genetically predeter-mined lactation period and productive use term) [13, 14]. Mastitis also poses a hazard to human health due to possible presence of pathogens and their toxins in the milk [15-18].
Failure to take sanitary and hygienic measures, irregular screening of an-imals for latent mastitis due to significant labor and time expenditure required for diagnostics, and haphazard veterinary drug treatment regimens lead to devel-opment of local antibiotic resistance at a farm [19, 20[. Vaccines, chemothera-peutic drugs and antibiotics of various generations are currently used for preven-tion and treatment of mastitis in cattle [21-23].
Detoxicative antibiotic resistance of gram-positive bacteria, including S. au-reus, is less effective due to absence of periplasmatic space in the cell wall [24]. All cells of the population may carry genetic information on resistance coded by mecA gene, but in vitro resistance phenotype is only observed in a few of them. This phe-nomenon is known as heteroresistance [25]. Effectiveness of clinical mastitis treat-ment depends on immune resistance of an animal, infection duration and bacterial genotypes of a causative agent [26]. For selection of a treatment regimen and masti-tis prevention measures in cows it is important to study the mechanism of antibiotic resistance and spreading of infection caused by S. aureus [27-30].
Use of various drugs of natural origin, as well as virulent bacteriophages, is an alternative to antibiotic therapy [31]. The prospects of use of bacteriophages for treatment and prevention of mastopathy and genitourinary diseases in cows depend on safety of use, sanitizing activity of bacteriophages, improvement of microbial balance in vivo and general immune system reinforcement [32]. How-ever, antibiotic therapy is currently a method of choice for treatment of mastitis. Evaluation of its effectiveness for a certain dairy herd, as well as on national level, requires studies of in vitro sensitivity of S. aureus strains to antibiotics.
Here we first reported findings focused on the range of antibiotic re-sistance in S. aureus strains associated with subclinical mastitis in high-yield dairy cows.
Our objective was to study the development of resistance in Staphylococ aureus strains isolated from milk of clinically healthy dairy cows during treat-ment with antibiotics of different groups.
Technique. The tests were performed in 2016 on clinically healthy high-yield holsteinized black-and-white cows (n = 1321), loose-housed at a farm in Kaluga region (the Central region of Russia) and preliminary vaccinated twice with anti-mastitis drug Mastivak (Ovejero, Spain).
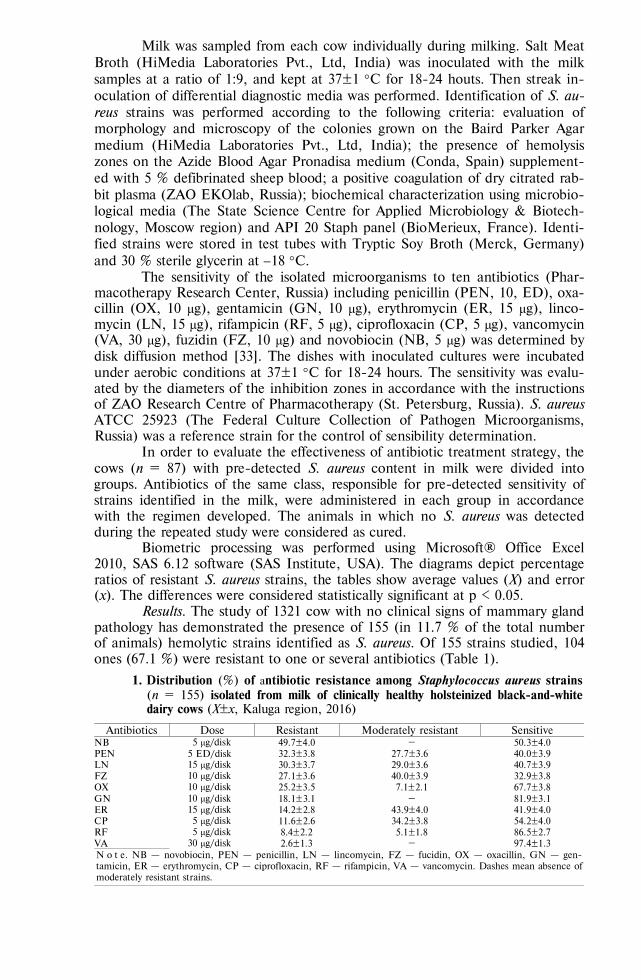
869
Milk was sampled from each cow individually during milking. Salt Meat Broth (HiMedia Laboratories Pvt., Ltd, India) was inoculated with the milk samples at a ratio of 1:9, and kept at 37±1 С for 18-24 houts. Then streak in-oculation of differential diagnostic media was performed. Identification of S. au-reus strains was performed according to the following criteria: evaluation of morphology and microscopy of the colonies grown on the Baird Parker Agar medium (HiMedia Laboratories Pvt., Ltd, India); the presence of hemolysis zones on the Azide Blood Agar Pronadisa medium (Conda, Spain) supplement-ed with 5 % defibrinated sheep blood; a positive coagulation of dry citrated rab-bit plasma (ZAO EKOlab, Russia); biochemical characterization using microbio-logical media (The State Science Centre for Applied Microbiology & Biotech-nology, Moscow region) and API 20 Staph panel (BioMerieux, France). Identi-fied strains were stored in test tubes with Tryptic Soy Broth (Merck, Germany) and 30 % sterile glycerin at 18 С.
The sensitivity of the isolated microorganisms to ten antibiotics (Phar-macotherapy Research Center, Russia) including penicillin (PEN, 10, ED), oxa-cillin (OX, 10 μg), gentamicin (GN, 10 μg), erythromycin (ER, 15 μg), linco-mycin (LN, 15 μg), rifampicin (RF, 5 μg), ciprofloxacin (CP, 5 μg), vancomycin (VA, 30 μg), fuzidin (FZ, 10 μg) and novobiocin (NB, 5 μg) was determined by disk diffusion method [33]. The dishes with inoculated cultures were incubated under aerobic conditions at 37±1 С for 18-24 hours. The sensitivity was evalu-ated by the diameters of the inhibition zones in accordance with the instructions of ZAO Research Centre of Pharmacotherapy (St. Petersburg, Russia). S. aureus ATCC 25923 (The Federal Culture Collection of Pathogen Microorganisms, Russia) was a reference strain for the control of sensibility determination.
In order to evaluate the effectiveness of antibiotic treatment strategy, the cows (n = 87) with pre-detected S. aureus content in milk were divided into groups. Antibiotics of the same class, responsible for pre-detected sensitivity of strains identified in the milk, were administered in each group in accordance with the regimen developed. The animals in which no S. aureus was detected during the repeated study were considered as cured.
Biometric processing was performed using Microsoft® Office Excel 2010, SAS 6.12 software (SAS Institute, USA). The diagrams depict percentage ratios of resistant S. aureus strains, the tables show average values (X) and error (x). The differences were considered statistically significant at p < 0.05.
Results. The study of 1321 cow with no clinical signs of mammary gland pathology has demonstrated the presence of 155 (in 11.7 % of the total number of animals) hemolytic strains identified as S. aureus. Of 155 strains studied, 104 ones (67.1 %) were resistant to one or several antibiotics (Table 1).
1. Distribution (%) of antibiotic resistance among Staphylococcus aureus strains (n = 155) isolated from milk of clinically healthy holsteinized black-and-white dairy cows (X±x, Kaluga region, 2016)
Antibiotics Dose Resistant Moderately resistant Sensitive NB 5 μg/disk 49.7±4.0 − 50.3±4.0 PEN 5 ED/disk 32.3±3.8 27.7±3.6 40.0±3.9 LN 15 μg/disk 30.3±3.7 29.0±3.6 40.7±3.9 FZ 10 μg/disk 27.1±3.6 40.0±3.9 32.9±3.8 OX 10 μg/disk 25.2±3.5 7.1±2.1 67.7±3.8 GN 10 μg/disk 18.1±3.1 − 81.9±3.1 ER 15 μg/disk 14.2±2.8 43.9±4.0 41.9±4.0 CP 5 μg/disk 11.6±2.6 34.2±3.8 54.2±4.0 RF 5 μg/disk 8.4±2.2 5.1±1.8 86.5±2.7 VA 30 μg/disk 2.6±1.3 − 97.4±1.3 N o t e. NB — novobiocin, PEN — penicillin, LN — lincomycin, FZ — fucidin, OX — oxacillin, GN — gen-tamicin, ER — erythromycin, CP — ciprofloxacin, RF — rifampicin, VA — vancomycin. Dashes mean absence of moderately resistant strains.
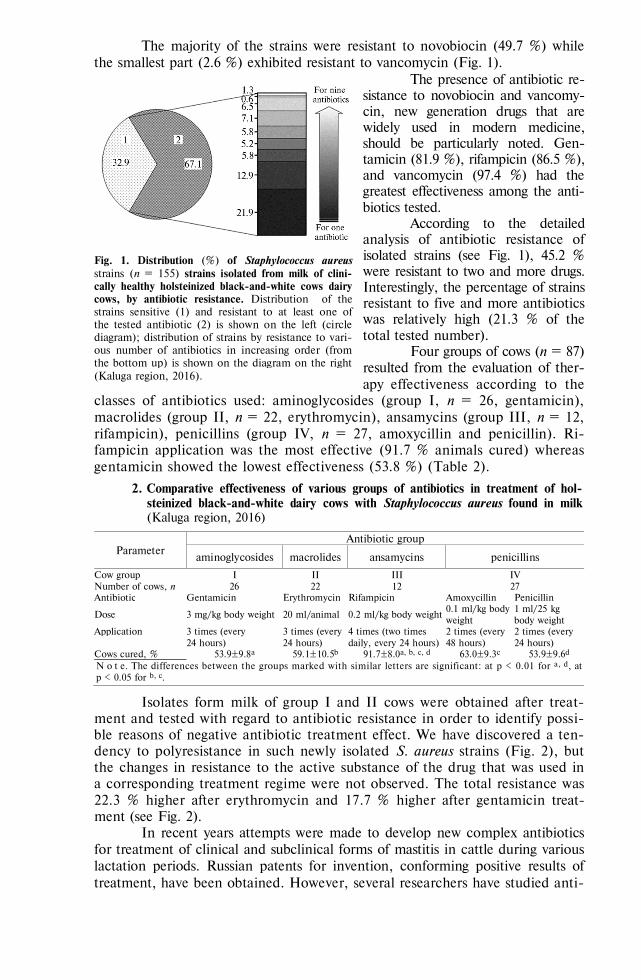
870
The majority of the strains were resistant to novobiocin (49.7 %) while the smallest part (2.6 %) exhibited resistant to vancomycin (Fig. 1).
The presence of antibiotic re-sistance to novobiocin and vancomy-cin, new generation drugs that are widely used in modern medicine, should be particularly noted. Gen-tamicin (81.9 %), rifampicin (86.5 %), and vancomycin (97.4 %) had the greatest effectiveness among the anti-biotics tested.
According to the detailed analysis of antibiotic resistance of isolated strains (see Fig. 1), 45.2 % were resistant to two and more drugs. Interestingly, the percentage of strains resistant to five and more antibiotics was relatively high (21.3 % of the total tested number).
Four groups of cows (n = 87) resulted from the evaluation of ther-apy effectiveness according to the
classes of antibiotics used: aminoglycosides (group I, n = 26, gentamicin), macrolides (group II, n = 22, erythromycin), ansamycins (group III, n = 12, rifampicin), penicillins (group IV, n = 27, amoxycillin and penicillin). Ri-fampicin application was the most effective (91.7 % animals cured) whereas gentamicin showed the lowest effectiveness (53.8 %) (Table 2).
2. Comparative effectiveness of various groups of antibiotics in treatment of hol-steinized black-and-white dairy cows with Staphylococcus aureus found in milk (Kaluga region, 2016)
Parameter Antibiotic group
aminoglycosides macrolides ansamycins penicillins
Cow group I II III IV Number of cows, n 26 22 12 27 Antibiotic Gentamicin Erythromycin Rifampicin Amoxycillin Penicillin
Dose 3 mg/kg body weight 20 ml/animal 0.2 ml/kg body weight 0.1 ml/kg body weight
1 ml/25 kg body weight
Application 3 times (every 24 hours)
3 times (every 24 hours)
4 times (two times daily, every 24 hours)
2 times (every 48 hours)
2 times (every 24 hours)
Cows cured, % 53.9±9.8a 59.1±10.5b 91.7±8.0a, b, c, d 63.0±9.3c 53.9±9.6d N o t e. The differences between the groups marked with similar letters are significant: at p < 0.01 for a, d, at p < 0.05 for b, c.
Isolates form milk of group I and II cows were obtained after treat-ment and tested with regard to antibiotic resistance in order to identify possi-ble reasons of negative antibiotic treatment effect. We have discovered a ten-dency to polyresistance in such newly isolated S. aureus strains (Fig. 2), but the changes in resistance to the active substance of the drug that was used in a corresponding treatment regime were not observed. The total resistance was 22.3 % higher after erythromycin and 17.7 % higher after gentamicin treat-ment (see Fig. 2).
In recent years attempts were made to develop new complex antibiotics for treatment of clinical and subclinical forms of mastitis in cattle during various lactation periods. Russian patents for invention, conforming positive results of treatment, have been obtained. However, several researchers have studied anti-
Fig. 1. Distribution (%) of Staphylococcus aureus strains (n = 155) strains isolated from milk of clini-cally healthy holsteinized black-and-white cows dairy cows, by antibiotic resistance. Distribution of the strains sensitive (1) and resistant to at least one of the tested antibiotic (2) is shown on the left (circle diagram); distribution of strains by resistance to vari-ous number of antibiotics in increasing order (from the bottom up) is shown on the diagram on the right (Kaluga region, 2016).
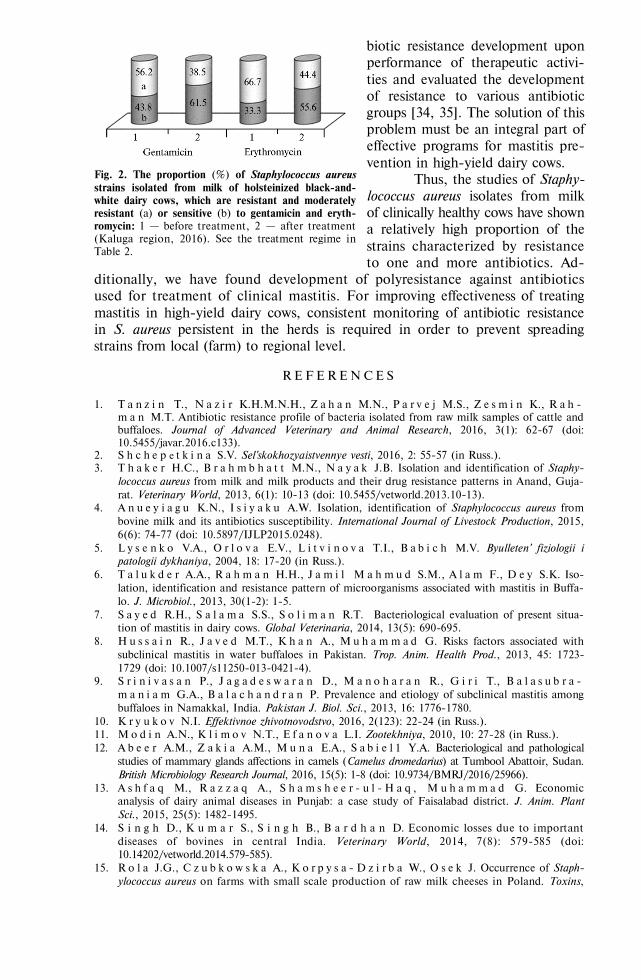
871
biotic resistance development upon performance of therapeutic activi-ties and evaluated the development of resistance to various antibiotic groups [34, 35]. The solution of this problem must be an integral part of effective programs for mastitis pre-vention in high-yield dairy cows.
Thus, the studies of Staphy-lococcus aureus isolates from milk of clinically healthy cows have shown a relatively high proportion of the strains characterized by resistance to one and more antibiotics. Ad-
ditionally, we have found development of polyresistance against antibiotics used for treatment of clinical mastitis. For improving effectiveness of treating mastitis in high-yield dairy cows, consistent monitoring of antibiotic resistance in S. aureus persistent in the herds is required in order to prevent spreading strains from local (farm) to regional level.
R E F E R E N C E S
1. T a n z i n T., N a z i r K.H.M.N.H., Z a h a n M.N., P a r v e j M.S., Z e s m i n K., R a h -
m a n M.T. Antibiotic resistance profile of bacteria isolated from raw milk samples of cattle and buffaloes. Journal of Advanced Veterinary and Animal Research, 2016, 3(1): 62-67 (doi: 10.5455/javar.2016.c133).
2. S h c h e p e t k i n a S.V. Sel'skokhozyaistvennye vesti, 2016, 2: 55-57 (in Russ.). 3. T h a k e r H.C., B r a h m b h a t t M.N., N a y a k J.B. Isolation and identification of Staphy-
lococcus aureus from milk and milk products and their drug resistance patterns in Anand, Guja-rat. Veterinary World, 2013, 6(1): 10-13 (doi: 10.5455/vetworld.2013.10-13).
4. A n u e y i a g u K.N., I s i y a k u A.W. Isolation, identification of Staphylococcus aureus from bovine milk and its antibiotics susceptibility. International Journal of Livestock Production, 2015, 6(6): 74-77 (doi: 10.5897/IJLP2015.0248).
5. L y s e n k o V.A., O r l o v a E.V., L i t v i n o v a T.I., B a b i c h M.V. Byulleten' fiziologii i patologii dykhaniya, 2004, 18: 17-20 (in Russ.).
6. T a l u k d e r A.A., R a h m a n H.H., J a m i l M a h m u d S.M., A l a m F., D e y S.K. Iso-lation, identification and resistance pattern of microorganisms associated with mastitis in Buffa-lo. J. Microbiol., 2013, 30(1-2): 1-5.
7. S a y e d R.H., S a l a m a S.S., S o l i m a n R.T. Bacteriological evaluation of present situa-tion of mastitis in dairy cows. Global Veterinaria, 2014, 13(5): 690-695.
8. H u s s a i n R., J a v e d M.T., K h a n A., M u h a m m a d G. Risks factors associated with subclinical mastitis in water buffaloes in Pakistan. Trop. Anim. Health Prod., 2013, 45: 1723-1729 (doi: 10.1007/s11250-013-0421-4).
9. S r i n i v a s a n P., J a g a d e s w a r a n D., M a n o h a r a n R., G i r i T., B a l a s u b r a -m a n i a m G.A., B a l a c h a n d r a n P. Prevalence and etiology of subclinical mastitis among buffaloes in Namakkal, India. Pakistan J. Biol. Sci., 2013, 16: 1776-1780.
10. K r y u k o v N.I. Effektivnoe zhivotnovodstvo, 2016, 2(123): 22-24 (in Russ.). 11. M o d i n A.N., K l i m o v N.T., E f a n o v a L.I. Zootekhniya, 2010, 10: 27-28 (in Russ.). 12. A b e e r A.M., Z a k i a A.M., M u n a E.A., S a b i e l 1 Y.A. Bacteriological and pathological
studies of mammary glands affections in camels (Camelus dromedarius) at Tumbool Abattoir, Sudan. British Microbiology Research Journal, 2016, 15(5): 1-8 (doi: 10.9734/BMRJ/2016/25966).
13. A s h f a q M., R a z z a q A., S h a m s h e e r - u l - H a q , M u h a m m a d G. Economic analysis of dairy animal diseases in Punjab: a case study of Faisalabad district. J. Anim. Plant Sci., 2015, 25(5): 1482-1495.
14. S i n g h D., K u m a r S., S i n g h B., B a r d h a n D. Economic losses due to important diseases of bovines in central India. Veterinary World, 2014, 7(8): 579-585 (doi: 10.14202/vetworld.2014.579-585).
15. R o l a J.G., C z u b k o w s k a A., K o r p y s a - D z i r b a W., O s e k J. Occurrence of Staph-ylococcus aureus on farms with small scale production of raw milk cheeses in Poland. Toxins,
Fig. 2. The proportion (%) of Staphylococcus aureus strains isolated from milk of holsteinized black-and-white dairy cows, which are resistant and moderately resistant (a) or sensitive (b) to gentamicin and eryth-romycin: 1 — before treatment, 2 — after treatment (Kaluga region, 2016). See the treatment regime in Table 2.
872
2016, 8(3): 62 (doi: 10.3390/toxins8030062). 16. H e n n e k i n n e J.A., d e B u y s e r M.L., D r a g a c c i S. Staphylococcus aureus and its food
poisoning toxins: characterization and outbreak investigation. FEMS Microbiol. Rev., 2012, 36: 815-836 (doi: 10.1111/j.1574-6976.2011.00311.x).
17. R o l a J.G., K o r p y s a - D z i r b a W., O s e k J. Prevalence of Staphylococcus aureus and staphylococcal enterotoxins at different stages of production of raw milk cheeses — preliminary results. Bulletin of the Veterinary Institute in Pulawy, 2013, 57: 341-345 (doi: 10.2478/bvip-2013-0059).
18. B i a n c h i D.M., G a l l i n a S., B e l l i o A., C h i e s a F., C i v e r a T., D e c a s t e l l i L. Enterotoxin gene profiles of Staphylococcus aureus isolated from milk and dairy products in Ita-ly. Lett. Appl. Microbiol, 2014, 58: 190-196 (doi: 10.1111/lam.12182).
19. T a s s e w A., N e g a s h M., D e m e k e A., F e l e k e A., T e s f a y e B., S i s a y T. Isola-tion, identification and drug resistance patterns of methicillin resistant Staphylococcus aureus from mastitis cow’s milk from selected dairy farms in and around Kombolcha, Ethiopia. J. Vet. Med. Anim. Health, 2016, 8(1): 1-10 (doi: 10.5897/JVMAH2015.0422).
20. H e z i l N., B a a z i z e - A m m i D., K e b b a l S., S a a d a o u i R., B r a h i m E.M., G u e t a r n i D. Principal germs causing clinical mastitis in dairy cattle farms in governorate of Blida (Algeria). Journal of Animal Science Advances, 2013, 3(1): 19-26
21. S a n k a r P. New therapeutic strategies to control and treatment of bovine mastitis. Vet. Med. Open J., 2016, 1(2): e7-e8 (doi: 10.17140/VMOJ-1-e004).
22. G o m e s F., H e n r i q u e s M. Control of bovine mastitis: old and recent therapeutic ap-proaches. Curr. Microbiol., 2016, 72: 377-382 (doi: 10.1007/s00284-015-0958-8).
23. S u n H., X u e F., Q i a n K., Z h a n g X., Y i n Z. Intramammary expression and therapeu-tic effect of a human lysozyme-expressing vector for treating bovine mastitis. J. Zhejiang Univ. - Sci. B, 2006, 7: 324-330 (doi: 10.1631/jzus.2006.B0324).
24. S u p o t n i t s k i y M.V. Mechanisms of antibiotics resistance in bacteria. Biopreparats (Bio-pharmaceuticals), 2011, 2: 4-11.
25. A l - A s h m o n y A.L., A l - S a w y A.A.F., T o r k y H.A. Genotypic molecular detection of certain genes encoding virulence determinates and atibiotic resistance in Staphylococcus aureus isolates from mastitis cows. Alexandria Journal of Veterinary Sciences (AJVS), 2016, 49(2): 90-98 (doi: 10.5455/ajvs.230403).
26. M a r a m A., M a m u G., B i r h a n u T. Prevalence and antibiotic resistance of Staphylococ-cus aureus mastitis in Holeta area, Western Ethiopia. Global Veterinaria, 2016, 16(4): 365-370.
27. V i l l a n u e v a S a n M a r t i n M., J o u s s e l i n A., B a e k K.T., P r a d o s J., A n d - r e y D.O., R e n z o n i A., I n g m e r H., F r e e s D. Rifampicin resistance rpoB alleles or multicopy thioredoxin/thioredoxin reductase suppresses the lethality of disruption of the global stress regulator spx in Staphylococcus aureus. J. Bacteriol., 2016, 198(19): 2719-2731 (doi: 10.1128/JB.00261-16).
28. J o u s s e l i n A., M a n z a n o C.S., B i e t t e A., R e e d P., P i n h o M.G., R o s a t o A.E., K e l l e y W.L., R e n z o n i A.M. The Staphylococcus aureus chaperone prsA is a new auxiliary factor of oxacillin resistance affecting penicillin-binding protein 2A. Antimicrob. Agents Chemother., 2016, 60(3): 1656-1666 (doi: 10.1128/AAC.02333-15).
29. A r t e m ’ e v a O.A., P e r e s e l k o v a D.A., F o m i c h e v Yu.P. Dihydroquercetin, the bio-active substance, to be used against pathogenic microorganisms as an alternative to antibiotics. Agricultural Biology, 2015, 50(4): 513-519 (doi: 10.15389/agrobiology.2015.4.513eng) (in Engl.).
30. A r t e m ’ e v a O.A., P e r e s e l k o v a D.A., V i n o g r a d o v a I.V., K o t k o v s k a y a E.N., G l a d y r ’ E.A., S i v k i n N.V., Z i n o v i e v a N.A. Screening of dairy cows’ herd for pres-ence in milk of hemolytic microorganisms in relation to somatic cell content. Agricultural Biolo-gy, 2015, 50(6): 810-816 (doi: 10.15389/agrobiology.2015.6.810eng) (in Engl.).
31. M a š l a ň o v á I., D o š k a J., V a r g a M., K u n t o v á L., M u ž í k J., M a l ú š k o v á D., R ů ž i č k o v á V., P a n t ů č e k R. Bacteriophages of Staphylococcus aureus efficiently package various bacterial genes and mobile genetic elements including SCCmec with different frequen-cies. Environ. Microbiol. Reports, 2013, 5: 66-73 (doi: 10.1111/j.1758-2229.2012.00378.x).
32. Ve r s t a p p e n K.M., T u l i n s k i P., D u i m B., F l u i t A.C., C a r n e y J., v a n N e s A. The effectiveness of bacteriophages against methicillin-resistant staphylococcus aureus ST398 nasal colonization in pigs. PLoS ONE, 2016, 11(8): e0160242 (doi: 10.1371/journal.pone.0160242).
33. Opredelenie chuvstvitel'nosti mikroorganizmov k antibakterial'nym preparatam. Metodicheskie uka-zaniya. MUK 4.2.1890-04 (utv. Glavnym gosudarstvennym sanitarnym vrachom RF 04.03.2004) [Assay of the sensitivity of microorganisms to antibacterial agents — guidelines (approved by Chief State Sanitary Physician of the Russian Federation, March 4, 2004]. Available http://docs.cntd.ru/document/1200038583 [No date] (in Russ.).
34. K o m a r o v V.Yu., B e l k i n B.L. Izvestiya Orlovskogo GAU, 2015, 3(53): 100-102 (in Russ.). 35. K o m a r o v V.Yu., B e l k i n B.L. Vestnik Altaiskogo gosudarstvennogo agrarnogo universiteta,
2015, 5(127): 107-110 (in Russ.).
873
Events
26th INTERNATIONAL CONFERENCE OF THE WORLD ASSOCIATION FOR THE ADVANCEMENT OF VETERINARY PARASITOLOGY (WAAVP 2017)
(4-8 September 2017, Kuala Lumpur, Malaysia)
Organization: Malaysian Society of Parasitology & Tropical Medicine (MSPTM) and Department of Veterinary Services (DVS)
Disciplines: Life Science, Health Science
The World Association for the Advancement of Veterinary Parasitology (WAAVP) is the largest in-ternational veterinary parasitology organization in the world, which is affiliated with the World Vet-erinary Association, cooperates with various national, international and affiliated organizations, such as WHO and FAO, in all matters concerning veterinary parasitology. WAAVP conferences are held bi-annually in various major cities around the world for the past 52 years.
The Conference theme is: Combating Zoonoses: Strength in East–West Partnerships.
The Conference provides an opportunity for scientists who study the parasites of animals, encom-passing helminthology, protozoology and entomology to meet with each other to discuss the matters of common interest and benefit from a comprehensive and ambitious scientific programme designed by the organising committee, which will include presentations by a range of knowledgeable speakers from within and beyond the region.
The Conference will also provide maximum opportunity for discussion, networking and informal en-gagement to promote exchange of information and material amongst researchers, veterinary practi-tioners and animal health investigators. It is intended that a number of priority recommendations and strategies will emerge and that these will be endorsed by the Conference for intended action by individual member states.
Contacts: http://www.waavp2017kl.org/
Information: http://www.globaleventslist.elsevier.com/events/2017/09/waavp-2017-the-26th-international-conference-of-the-world-association-for-the-advancement-of-veterinary-parasitology/
875
AGRICULTURAL BIOLOGY, ISSN 2412-0324 (English ed. Online)
2016, V. 51, ¹ 6, pp. 875-882 (SEL’SKOKHOZYAISTVENNAYA BIOLOGIYA) ISSN 0131-6397 (Russian ed. Print)
ISSN 2313-4836 (Russian ed. Online) UDC 619+61]:615.284:615.45:616-098 doi: 10.15389/agrobiology.2016.6.875rus
doi: 10.15389/agrobiology.2016.6.875eng
DERIVATIVES OF 16-MEMBERED MACROCYCLIC LACTONES: ANTIPARASITIC PROPERTIES AND INTERACTION WITH GABAA
RECEPTORS
M.Kh. DZHAFAROV1, F.I. VASILEVICH1, G.I. KOVALEV1, 2, K.S. KRIVONOS1, I.I. TSEPILOVA1, I.V. ZAVARZIN3, E.V. VASIL’EVA2
1Moscow State Academy of Veterinary Medicine and Biotechnology—K.I. Skryabin Moscow Veterinary Academy, 23, ul. Akademika Skryabina, Moscow, 109472 Russia, e-mail [email protected]; 2V.V. Zakusov Research Institute of Pharmacology, Federal Agency of Scientific Organizations, 8, ul. Baltiiskaya, Moscow, 125315 Russia, e-mail [email protected]; 3N.D. Zelinsky Institute of Organic Chemistry, Federal Agency of Scientific Organizations, 47, Leninskii prosp., 119991 Russia, e-mail [email protected] Acknowledgements: Supported by Russian Science Foundation, grant ¹ 15-16-00019 Received June 8, 2016
A b s t r a c t
Searching for antiparasitics with a different mode of action than existing drugs, and (or) with the same but much more effective mechanisms is necessary to periodically update the applicable protection chemicals. For the first time we here present data on the biocidal action of new semisyn-thetic derivatives of avermectin B1 that we have synthetized earlier. These are the 16-membered macrocyclic lactones, the representatives of an important class of anthelmintics. In 2015 S. Omura (Japan) and W. Campbell (USA) who discovered this avermectin group, were awarded the Nobel Prize in physiology and medicine. In our study the oligochaetes Tubificidal tubifex were used as a test-object. The original chemicals and synthetized derivatives tested were avermectin B1 (abamectin), ivermectin, monosaccharide analogues of abamectin and ivermectin, namely abamectin, ivermectin, 5-O-succinyl avermectin B1, methyl ester of 5-O-succinyl avermectin B1, ethyl ester of 5-O-succinyl avermectin B1, diethyl ester of 5,4-di-O-succinyl avermectin B1, ethyl ester of 5-O-malonyl avermectin B1, diethyl ester of 5,4-di-O-dimalonyl avermectin B1, monosaccharide hemi-succinate of avermectin B1 (5-O-succinyl-4´-dezoleandrozyl-4´-hydroxyavermectin B1), ethyl ester of 5-O-succinyl-4-O-chloroacetyl avermectin B1, 5-O-succinyl ivermectin, ethyl ester of 5-O-suc-cinoyl ivermectin, 5,4-di-O-succinyl ivermectin, diethyl ester of 5,4-di-O-succinyl-ivermectin, ethyl ester of 5-O-malonylivermectin, diethyl ester of 5,4-di-O-dimalonyl ivermectin, monoaver-mectin-5-yl ester of 4-[2-(4-nitrophenyl)-2-oxoethoxy]-4-oxobutanoic acid, monoavermectin-5-yl ester of 4-[2-(4-chlorophenyl)-2-oxoethoxy]-4-oxobutanoic acid, monoavermectin-5-yl ester of 4-[(4-nit-rophenyl)-methoxy]-butanoic acid, monoavermectin-5-yl ester of 4-[1-methyl-2-(4-methylphenyl)-2-oxoethoxy]-4-oxobutanoic acid, monoavermectin-5-yl ester of 4-[2-(4-chlorophenyl)-1-methyl-2-oxoethoxy]-4-oxobutanoic acid, monoavermectin-5-yl ester of 4-[3-chloro-1-(4-сhlorbenzoil)-pro-poxy]-4-oxobutanoic acid, monoavermectin-5-yl ester of 4-{2-[(4-methylphenyl)-amino]-2-oxoeth-oxy}-4-oxobutanoic acid and monoavermectin-5-yl ester of 4-{2-[(4-bromophenyl)-amino]-2-oxo-ethoxy}-4-oxobutanoic acid. The acute toxicity (LD50) of the most effective ones, 5-O-succinyl aver-mectin B1, 5-O-ethylsuccinyl avermectin B1 and 5,4-di-О-ethylsuccinyl avermectin B1, for intra-peritoneally challenged white mice was 37.85; 41.37 and 45.82 mg/kg, respectively. We also used membrane preparations of rat brain as in vitro model for screening and studying activity of natural and semi-synthetic avermectins. A radioligand [G-3H]SR 95531 binding assay of avermectin B1, ivermectin, and 5-O-succinyl avermectin B1 interaction with GABA-receptors (the biotargets for these compounds) showed a 30 % increase of maximal inhibition (Imax) of specific binding by hemi-succinate derivative of avermectin B1 when compared to original avermectin B1.
Keywords: 16-membered macrocyclic lactones, avermectins, avermectin monosaccharides, 5-O-succinyl avermectin B1, 5-O-ethylsuccinyl avermectin B1, 5,4-di-O-ethylsuccinyl avermectin B1, antiparasitics, oligochaeta Tubifex tubifex, GABAA-receptor, radioligand binding assay
Chemotherapy and prophylaxis remain among the most effective and cheap methods of controlling parasites. The most important classes of anthel-mintics are benzimidazoles, imidazoles and thiazoles, pyrazine isoquinolines,
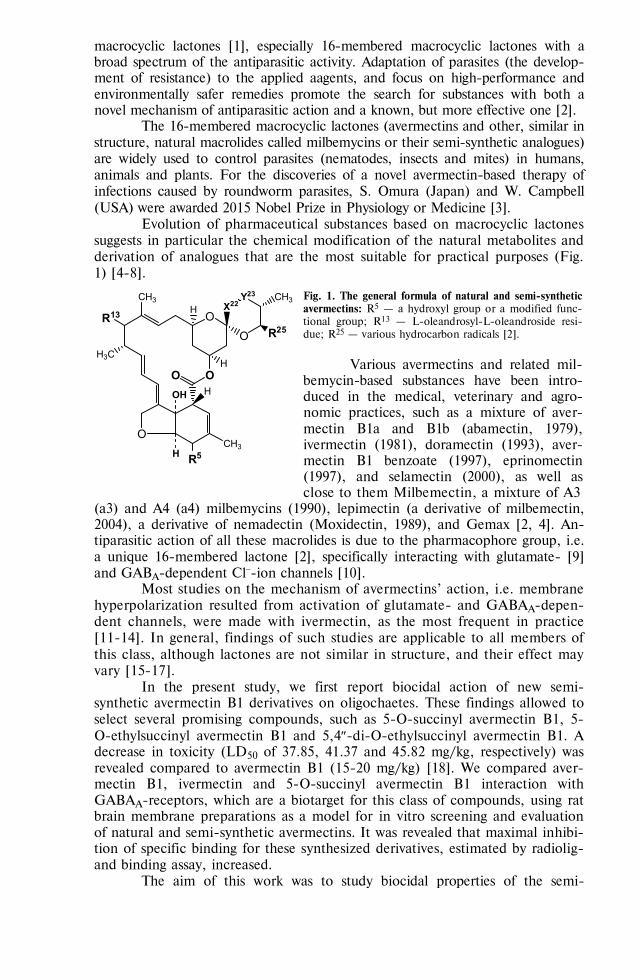
876
macrocyclic lactones [1], especially 16-membered macrocyclic lactones with a broad spectrum of the antiparasitic activity. Adaptation of parasites (the develop-ment of resistance) to the applied aagents, and focus on high-performance and environmentally safer remedies promote the search for substances with both a novel mechanism of antiparasitic action and a known, but more effective one [2].
The 16-membered macrocyclic lactones (avermectins and other, similar in structure, natural macrolides called milbemycins or their semi-synthetic analogues) are widely used to control parasites (nematodes, insects and mites) in humans, animals and plants. For the discoveries of a novel avermectin-based therapy of infections caused by roundworm parasites, S. Оmura (Japan) and W. Campbell (USA) were awarded 2015 Nobel Prize in Physiology or Medicine [3].
Evolution of pharmaceutical substances based on macrocyclic lactones suggests in particular the chemical modification of the natural metabolites and derivation of analogues that are the most suitable for practical purposes (Fig. 1) [4-8].
OO
OO
Y23X22
O
CH3
CH3
CH3
H
OH
H3C
R25
H
H
H
R13
R5
Fig. 1. The general formula of natural and semi-synthetic avermectins: R5 — a hydroxyl group or a modified func-tional group; R13 — L-oleandrosyl-L-oleandroside resi-due; R25 — various hydrocarbon radicals [2].
Various avermectins and related mil-
bemycin-based substances have been intro-duced in the medical, veterinary and agro-nomic practices, such as a mixture of aver-mectin B1a and B1b (abamectin, 1979), ivermectin (1981), doramectin (1993), aver-mectin B1 benzoate (1997), eprinomectin (1997), and selamectin (2000), as well as close to them Milbemectin, a mixture of A3
(a3) and A4 (a4) milbemycins (1990), lepimectin (a derivative of milbemectin, 2004), a derivative of nemadectin (Moxidectin, 1989), and Gemax [2, 4]. An-tiparasitic action of all these macrolides is due to the pharmacophore group, i.e. a unique 16-membered lactone [2], specifically interacting with glutamate- [9] and GABA-dependent Cl-ion channels [10].
Most studies on the mechanism of avermectins’ action, i.e. membrane hyperpolarization resulted from activation of glutamate- and GABAA-depen-dent channels, were made with ivermectin, as the most frequent in practice [11-14]. In general, findings of such studies are applicable to all members of this class, although lactones are not similar in structure, and their effect may vary [15-17].
In the present study, we first report biocidal action of new semi-synthetic avermectin B1 derivatives on oligochaetes. These findings allowed to select several promising compounds, such as 5-O-succinyl avermectin B1, 5-O-ethylsuccinyl avermectin B1 and 5,4-di-O-ethylsuccinyl avermectin B1. A decrease in toxicity (LD50 of 37.85, 41.37 and 45.82 mg/kg, respectively) was revealed compared to avermectin B1 (15-20 mg/kg) [18]. We compared aver-mectin B1, ivermectin and 5-O-succinyl avermectin B1 interaction with GABAA-receptors, which are a biotarget for this class of compounds, using rat brain membrane preparations as a model for in vitro screening and evaluation of natural and semi-synthetic avermectins. It was revealed that maximal inhibi-tion of specific binding for these synthesized derivatives, estimated by radiolig-and binding assay, increased.
The aim of this work was to study biocidal properties of the semi-
877
synthetic derivatives of 16-membered macrocyclic lactones and their interaction with the GABAA-receptors.
Technique. The 5-O- and 5,4-di-O-derivatives of avermectin B1, iver-mectin, and monosaccharide analogues have been previously synthesized [2, 19]. Their antiparasitic activity at a dose of 15 g/ml was studied in a rapid assay using Tubifex tubifex oligochaetes. Acute toxicity of 5-O-succinyl-, 5-O-ethylsuccinyl-, 5,4-di-O-ethylsuccinyl avermectins B1 was determined accord-ing to the recommendations on preclinical studies of drugs using white outbred mice weighing 18-21 g (the drug was administered intraperitoneally) [20].
For the radioreceptor assay, avermectin B1, ivermectin and a hemisuc-cinate derivative of avermectin B1 were dissolved in dimethylsulfoxide (DMSO). In vitro effects of the substances on the GABAA-receptors were investigated at the range of concentrations of 10-10-10-4 mol/l.
Membrane preparations containing GABAA-receptors of rat cerebral cor-tex were isolated by a modified method of J.E. Hawkinsonet al. [21]. Bio-material was taken after decapitation. Frontal cortex was separated and ho-mogenized (a Potter S homogenizer, Sartorius AG, Germany) in 20 volumes of ice-cold sucrose (0.32 M, pH 7.1). A dense fraction was separated using the Optima L-70K ultracentrifuge (Beckman Coulter, Inc., USA) for 10 min at 1 000 g. The supernatant was re-centrifuged (20 000 g, 20 min). The precipi-tate was resuspended in 20 ml of cold distilled water and centrifuged (8 000 g, 20 min), the supernatant and the yellow supernatant were centrifuged once again at 48 000 g for 20 min. The precipitate was suspended in a freshly pre-pared 0.05M Tris-citrate buffer (TCB) (pH 7.1) and centrifuged (48 000 g, 20 min). The resulting membrane fraction was frozen and stored at 85 С. On the day of testing, the membranes were suspended in 40 volumes of 0.05M TCB (pH 7.1) and centrifuged at 48 000 g for 20 min. The resulting precipitate was suspended in 40 volumes of 0.05M TCB (pH 7.1), incubated at 24 С for 30 min, and centrifuged again at 48 000 g for 20 min. The final precipitate was resuspended in the fresh buffer.
Tritium-labeled [G-3H]SR 95531 (Perkin Elmer, USA) with a specific ac-tivity of 49.5 Ci/mmol was used in radioligand binding assays. The incubation mixture (0.5 ml final volume) contained 50 l of [G-3H]SR 5531, 250 l of buffer and 200 l of membrane protein suspension; for non-specific binding, 50 l of unlabeled SR 95531 ligand (1 mM) was added. The reaction mixture was incubat-ed at 4 С for 1 hour. After incubation samples were passed through the GF/B glass fiber filters (Whatman PLC, UK) previously immersed in 0.3 % polyethyl-enimine for 2 hours. Each tube was washed twice with cold buffer and then the filters were washed twice with the same volume of buffer. The filters were dried out in air, transferred to scintillation vials and poured over with 5 ml of scintilla-tion liquid (4 g of PPO, 0.2 g of POPOP per liter of toluene). Radioactivity was determined on a Tri-Carb 2900TR counter (Perkin Elmer, USA) with 42-46 % counting efficiency . Specific binding was calculated as the difference between total and non-specific binding. The results of radioligand binding assay were ex-pressed as the concentration corresponding to 50 % inhibition of specific radi-oligand binding (IC50) and the maximal degree of inhibition (Imax), reflecting the difference between the lower and upper plateau [21]. Protein concentration was measured by a standard procedure [22].
Animal experiments were performed in accordance with the provisions of the Geneva Convention and the principles of Good Laboratory Practice (National Standard of the Russian Federation, GOST R 53434-2009), as well as recommen-dations set out in The Guide for the Care and Use of Laboratory Animals (Na-
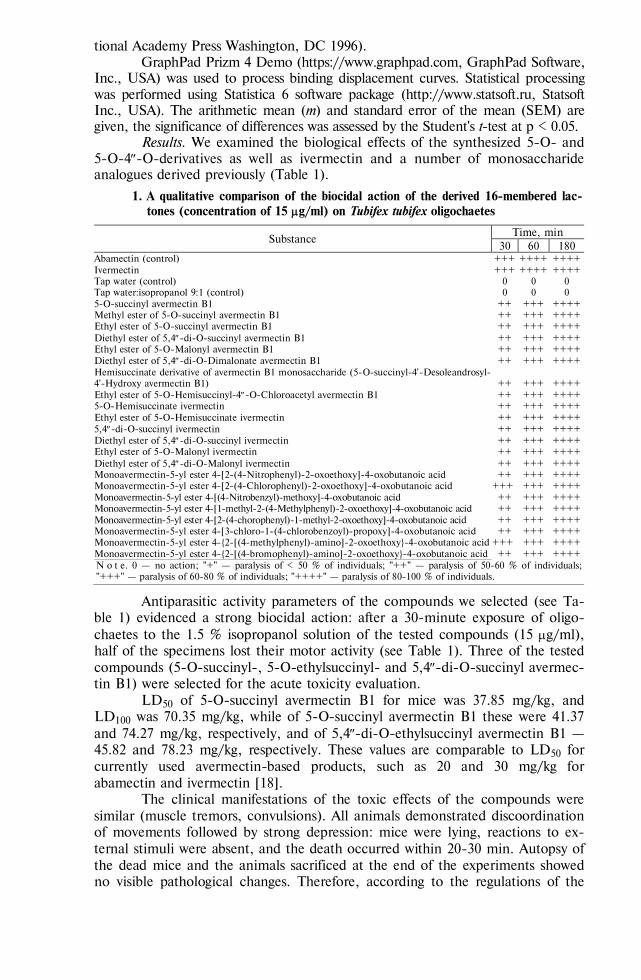
878
tional Academy Press Washington, DC 1996). GraphPad Prizm 4 Demo (https://www.graphpad.com, GraphPad Software,
Inc., USA) was used to process binding displacement curves. Statistical processing was performed using Statistica 6 software package (http://www.statsoft.ru, Statsoft Inc., USA). The arithmetic mean (m) and standard error of the mean (SEM) are given, the significance of differences was assessed by the Student's t-test at p < 0.05.
Results. We examined the biological effects of the synthesized 5-O- and 5-O-4-O-derivatives as well as ivermectin and a number of monosaccharide analogues derived previously (Table 1).
1. A qualitative comparison of the biocidal action of the derived 16-membered lac-tones (concentration of 15 g/ml) on Tubifex tubifex oligochaetes
Substance Time, min
30 60 180 Abamectin (control) +++ ++++ ++++ Ivermectin +++ ++++ ++++ Tap water (control) 0 0 0 Tap water:isopropanol 9:1 (control) 0 0 0 5-O-succinyl avermectin B1 ++ +++ ++++ Methyl ester of 5-O-succinyl avermectin B1 ++ +++ ++++ Ethyl ester of 5-O-succinyl avermectin B1 ++ +++ ++++ Diethyl ester of 5,4-di-O-succinyl avermectin B1 ++ +++ ++++ Ethyl ester of 5-O-Malonyl avermectin B1 ++ +++ ++++ Diethyl ester of 5,4-di-O-Dimalonate avermectin B1 ++ +++ ++++ Hemisuccinate derivative of avermectin B1 monosaccharide (5-O-succinyl-4'-Desoleandrosyl-4'-Hydroxy avermectin B1) ++ +++ ++++ Ethyl ester of 5-O-Hemisuccinyl-4-О-Chloroacetyl avermectin B1 ++ +++ ++++ 5-O-Hemisuccinate ivermectin ++ +++ ++++ Ethyl ester of 5-O-Hemisuccinate ivermectin ++ +++ ++++ 5,4-di-O-succinyl ivermectin ++ +++ ++++ Diethyl ester of 5,4-di-O-succinyl ivermectin ++ +++ ++++ Ethyl ester of 5-O-Malonyl ivermectin ++ +++ ++++ Diethyl ester of 5,4-di-O-Malonyl ivermectin ++ +++ ++++ Monoavermectin-5-yl ester 4-[2-(4-Nitrophenyl)-2-oxoethoxy]-4-oxobutanoic acid ++ +++ ++++ Monoavermectin-5-yl ester 4-[2-(4-Chlorophenyl)-2-oxoethoxy]-4-oxobutanoic acid +++ +++ ++++ Monoavermectin-5-yl ester 4-[(4-Nitrobenzyl)-methoxy]-4-oxobutanoic acid ++ +++ ++++ Monoavermectin-5-yl ester 4-[1-methyl-2-(4-Methylphenyl)-2-oxoethoxy]-4-oxobutanoic acid ++ +++ ++++ Monoavermectin-5-yl ester 4-[2-(4-chorophenyl)-1-methyl-2-oxoethoxy]-4-oxobutanoic acid ++ +++ ++++ Monoavermectin-5-yl ester 4-[3-chloro-1-(4-chlorobenzoyl)-propoxy]-4-oxobutanoic acid ++ +++ ++++ Monoavermectin-5-yl ester 4-{2-[(4-methylphenyl)-amino]-2-oxoethoxy}-4-oxobutanoic acid +++ +++ ++++ Monoavermectin-5-yl ester 4-{2-[(4-bromophenyl)-amino]-2-oxoethoxy}-4-oxobutanoic acid ++ +++ ++++ N o t e. 0 — no action; "+" — paralysis of < 50 % of individuals; "++" — paralysis of 50-60 % of individuals; "+++" — paralysis of 60-80 % of individuals; "++++" — paralysis of 80-100 % of individuals.
Antiparasitic activity parameters of the compounds we selected (see Ta-ble 1) evidenced a strong biocidal action: after a 30-minute exposure of oligo-chaetes to the 1.5 % isopropanol solution of the tested compounds (15 g/ml), half of the specimens lost their motor activity (see Table 1). Three of the tested compounds (5-O-succinyl-, 5-O-ethylsuccinyl- and 5,4-di-O-succinyl avermec-tin B1) were selected for the acute toxicity evaluation.
LD50 of 5-O-succinyl avermectin B1 for mice was 37.85 mg/kg, and LD100 was 70.35 mg/kg, while of 5-O-succinyl avermectin B1 these were 41.37 and 74.27 mg/kg, respectively, and of 5,4-di-O-ethylsuccinyl avermectin B1 — 45.82 and 78.23 mg/kg, respectively. These values are comparable to LD50 for currently used avermectin-based products, such as 20 and 30 mg/kg for abamectin and ivermectin [18].
The clinical manifestations of the toxic effects of the compounds were similar (muscle tremors, convulsions). All animals demonstrated discoordination of movements followed by strong depression: mice were lying, reactions to ex-ternal stimuli were absent, and the death occurred within 20-30 min. Autopsy of the dead mice and the animals sacrificed at the end of the experiments showed no visible pathological changes. Therefore, according to the regulations of the
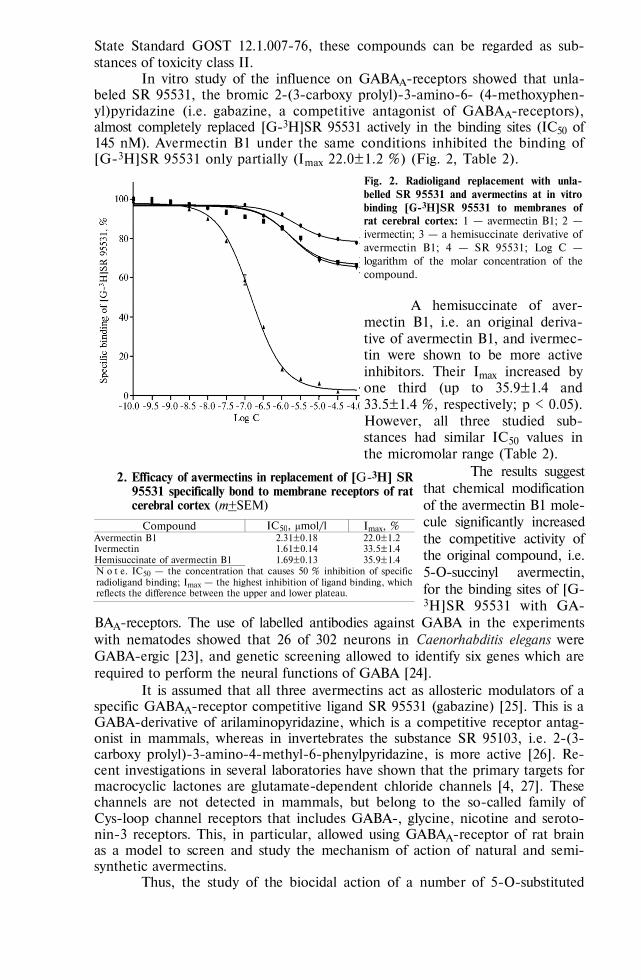
879
State Standard GOST 12.1.007-76, these compounds can be regarded as sub-stances of toxicity class II.
In vitro study of the influence on GABAA-receptors showed that unla-beled SR 95531, the bromic 2-(3-carboxy prolyl)-3-amino-6- (4-methoxyphen-yl)pyridazine (i.e. gabazine, a competitive antagonist of GABAA-receptors), almost completely replaced [G-3H]SR 95531 actively in the binding sites (IC50 of 145 nM). Avermectin B1 under the same conditions inhibited the binding of [G-3H]SR 95531 only partially (Imax 22.0±1.2 %) (Fig. 2, Table 2).
Fig. 2. Radioligand replacement with unla-belled SR 95531 and avermectins at in vitro binding [G-3H]SR 95531 to membranes of rat cerebral cortex: 1 — avermectin B1; 2 — ivermectin; 3 — a hemisuccinate derivative of avermectin B1; 4 — SR 95531; Log С — logarithm of the molar concentration of the compound.
A hemisuccinate of aver-
mectin B1, i.e. an original deriva-tive of avermectin B1, and ivermec-tin were shown to be more active inhibitors. Their Imax increased by one third (up to 35.9±1.4 and 33.5±1.4 %, respectively; p < 0.05). However, all three studied sub-stances had similar IC50 values in the micromolar range (Table 2).
The results suggest that chemical modification of the avermectin B1 mole-cule significantly increased the competitive activity of the original compound, i.e. 5-O-succinyl avermectin, for the binding sites of [G-3H]SR 95531 with GA-
BAA-receptors. The use of labelled antibodies against GABA in the experiments with nematodes showed that 26 of 302 neurons in Caenorhabditis elegans were GABA-ergic [23], and genetic screening allowed to identify six genes which are required to perform the neural functions of GABA [24].
It is assumed that all three avermectins act as allosteric modulators of a specific GABAA-receptor competitive ligand SR 95531 (gabazine) [25]. This is a GABA-derivative of arilaminopyridazine, which is a competitive receptor antag-onist in mammals, whereas in invertebrates the substance SR 95103, i.e. 2-(3-carboxy prolyl)-3-amino-4-methyl-6-phenylpyridazine, is more active [26]. Re-cent investigations in several laboratories have shown that the primary targets for macrocyclic lactones are glutamate-dependent chloride channels [4, 27]. These channels are not detected in mammals, but belong to the so-called family of Cys-loop channel receptors that includes GABA-, glycine, nicotine and seroto-nin-3 receptors. This, in particular, allowed using GABAA-receptor of rat brain as a model to screen and study the mechanism of action of natural and semi-synthetic avermectins.
Thus, the study of the biocidal action of a number of 5-O-substituted
2. Efficacy of avermectins in replacement of [G-3H] SR 95531 specifically bond to membrane receptors of rat cerebral cortex (m+SEM)
Compound IC50, μmol/l Imax, % Avermectin B1 2.31±0.18 22.0±1.2 Ivermectin 1.61±0.14 33.5±1.4 Hemisuccinate of avermectin B1 1.69±0.13 35.9±1.4 N o t e. IC50 — the concentration that causes 50 % inhibition of specific radioligand binding; Imax — the highest inhibition of ligand binding, which reflects the difference between the upper and lower plateau.
880
avermectins found that the 1.5 % solution of 5-O-succinyl, 5-O-ethylsuccinyl and 5,4-di-O-ethylsuccinyl avermectin B1 after a 60-minute exposure com-pletely paralyzed oligochaetes. The LD50 values of these compounds, when ad-ministered intraperitoneally to mice at a dose of 37-47 mg/kg, are comparable to or lower than those of the known analogues. Moreover, based on the effects ac-cording to State Standard GOST 12.1.007-76, these substances belong to toxicity class II, i.e. can be considered as promising antiparasitic agents.
R E F E R E N C E S
1. A r k h i p o v I.A. Antigel'mintiki: farmakologiya i primenenie [Anthelmintics: pharmacology and
use]. Moscow, 2009 (ISBN 978-5-85941-305-8) (in Russ.). 2. D z h a f a r o v M.Kh. Evolution in chemotherapy of human and animal helminthiases (re-
view). Agricultural Biology, 2013, 4: 26-44 (doi: 10.15389/agrobiology.2013.4.26eng) (in Engl.). 3. N o b e l f o r s a m l i n g e n . The Nobel Assembly at Karolinska Institutet. The 2015 Nobel Prize in
Physiology or Medicine. Available http://www.nobelprize.org/nobel_prizes/medi-cine/laurea-tes/2015/press.pdf. No date.
4. C a m p b e l l W.C. History of avermectin and ivermectin, with notes on the history of other macrocyclic lactone antiparasitic agents. Curr. Pharm. Biotechnol., 2012, 13(6): 853-865 (doi: 10.2174/138920112800399095).
5. O m u r a S. Ivermectin: 25 years and still going strong. Int. J. Antimicrob. Agents, 2008, 31: 91-98 (doi: 10.1016/j.ijantimicag.2007.08.023).
6. P i t t e r n a T., C a s s a y r e J., H u t e r O., J u n g P.M., M a i e n f i s c h P., K e s s a - b i F.M., Q u a r a n t a L., T o b l e r H. New ventures in the chemistry of avermectins. Bioorg. Med. Chem., 2009, 17: 4085-4095 (doi: 10.1016/j.bmc.2008.12.069).
7. D z h a f a r o v M.Kh., M i r z a e v M.N., U r a z a e v D.N., M a k s i m o v V.I. Antiparasitic activity of adermectin and compounds of a steroid nature. Russian Agricultural Sciences, 2010, 36(2): 130-132 (doi: 10.3103/S1068367410020163).
8. D z h a f a r o v M.Kh., M y r z a e v M.N., Z a v a r s i n I.V. Antiparasitic activity of famectin and some compounds of different chemical nature. Agricultural Biology, 2011, 2: 108-111. Avail-able http://www.agrobiology.ru/2-2011dzhafarov-eng.html. No date (in Eng.).
9. R a y m o n d V., S a t t e l l e D.B. Novel animal-health drug targets from ligand-gated chloride channels. Nat. Rev. Drug Discov., 2002, 1: 427-436 (doi: 10.1038/nrd821).
10. E s t r a d a - M o nd r a g o n A., L y n c h J.W. Functional characterization of ivermectin binding sites in α1β2γ2LGABA(A) receptors. Front. Mol. Neurosci., 2015, 8: 55 (doi: 10.3389/fnmol.2015.00055).
11. W o l s t e n h o l m e A.J., R o g e r s A.T. Glutamate-gated chloride channels and the mode of action of the avermectin/milbemycin anthelmintics. Parasitology, 2005, 131: S85-S95 (doi: 10.1017/S0031182005008218).
12. L y n a g h T., L y n c h J.W. Molecular mechanisms of Cys-loop ion channel receptor modula-tion by ivermectin. Front. Mol. Neurosci., 2012, 5: 60 (doi: 10.3389/fnmol.2012.00060).
13. Y o l u k Ö., B r ö m s t r u p T., B e r t a c c i n i E.J., T r u d e l l J.R., L i n d a h l E. Stabiliza-tion of the GluCl ligand-gated ion channel in the presence and absence of ivermectin. Biophys. J., 2013, 105: 640-647 (doi: 10.1016/j.bpj.2013.06.037).
14. P a n g S., Q i S., R a n Z., S o n g X., L i X., W a n g C., D u a n L. Synergistic effect of gamma-aminobutyric acid with avermectin on Bombyx mori. J. Food Agric. Environ., 2013, 11(1): 1022-1024.
15. C o b b R., B o e c k h A. Moxidectin: a review of chemistry, pharmacokinetics and use in horses. Parasites Vectors, 2009, 2(Suppl 2): S5 (doi: 10.1186/1756-3305-2-S2-S5).
16. P r i c h a r d R., M é n e z C., L e s p i n e A. Moxidectin and the avermectins: Consanguinity but not identity. International Journal of Parasitology: Drugs and Drug Resistance, 2012, 2: 134-153 (doi: 10.1016/j.ijpddr.2012.04.001).
17. M e n e z C., S u t r a J.-F., P r i c h a r d R., L e s p i n e A. Relative neurotoxicity of ivermec-tin and moxidectin in Mdr1ab (2/2) mice and effects on mammalian GABA(A) channel activi-ty. PLOS, 2012, 6(11): e1883 (doi: 10.1111/jnc.13644).
18. L a n k a s G.R., G o r d o n L.R. Toxicology. In: Ivermectin and avermectin. W.C. Campbell (ed.). Springer-Verlag, NY, 1989: 89-112.
19. C h e r n o b u r o v a E.I., L i s h c h u k V.A., O v c h i n n i k o v K.L., K o l o b o v A.V., D z h a f a r o v M.Kh., V a s i l e v i c h F.I., Z a v a r z i n I.V. Izvestiya RAN. Seriya khimich-eskaya, 2016, 12: 2965-2969 (in Russ.).
20. M i r o n o v A.N., B u n y a t y a n N.D., V a s i l ' e v A.N., V e r s t a k o v a O.L., Z h u r a v -l e v a M.V., L e p a k h i n V.K., K o r o b o v N.V., M e r k u l o v V.A., O r e k h o v S.N., S a k a e v a I.V., U t e s h e v D.B., Y a v o r s k i i A.N. Rukovodstvo po provedeniyu doklinich-eskikh issledovanii lekarstvennykh sredstv. Chast' I [Preclinical studies of drugs — guidelines. Part I]. Moscow, 2012: 13-25 (in Russ.).
881
21. H a w k i n s o n J.E., A c o s t a -B u r r u e l M., K i m b r o u g h C.L., G o o d n o u g h D.B., W o o d P.L. Steroid inhibition of [3H]SR 95531 binding to the GABAA recognition site. Eur. J. Pharmacol., 1996, 304: 141-146 (doi: 10.1016/0014-2999(96)00090-8).
22. L o w r y O.H., R o s e n b r o u g h N.J., F a r r A.L., R a n d a l l R.J. Protein measurement with the Folin phenol reagent. J. Biol. Chem., 1951, 193: 265-275.
23. S c h u s k e K., B e g A.A., J o r g e n s e n E.M. The GABA nervous system in C. elegans. Trends Neurosci., 2004, 27: 407-414 (doi: 10.1016/j.tins.2004.05.005).
24. W o l s t e n h o l m e A.J. Surviving in a toxic world. Science, 2012, 335: 545-546 (doi: 10.1126/science.1218166).
25. M a k s a y G. Differential effects of thiocyanate on the binding thermodynamics of bicuculline methiodide versus SR95531 (Gabazine) to the -aminobutyric acid receptor-ionophore complex. Biochem. Pharmacol., 1998, 56: 729-731 (doi: 10.1016/S0006-2952(98)00064-1).
26. D u i t t o z A.H., M a r t i n R.J. Effects of the arylaminopyridazine-GABA derivatives, SR95103 and SR95531 on the Ascaris muscle GABA receptor: the relative potency of the antagonists in the Ascaris is different to that at vertebrate GABAa receptors. Comp. Biochem. Physiol., 1991, 98C: 417-422 (doi: 10.1016/0742-8413(91)90227-K).
27. N a k a o T., B a n b a Sh., H i r a s e K. Comparison between the modes of action of novel meta-diamide and macrocyclic lactone insecticides on the RDL GABA receptor. Pestic. Bio-chem. Phys., 2015, 120: 101-108 (doi: 10.1016/j.pestbp.2014.09.011).
Events BACTERIOPHAGE 2017
(17-19 January 2017, online event, United Kingdom)
Organization: Euroscicon
Subdisciplines: biology, microbiology, molecular biology, biochemistry, medicine, biotechnology, virology
This is the FIRST live streamed only, three day professional conference discussing bacteriophages. This annual event will discuss emerging research relating to bacteriophage structure and mechanism of action, and their application in medical and industrial biotechnologies.
As one of the most abundant biological entities on earth, bacteriophages are major drivers of bacteri-al adaptive evolution through the predator-prey roles of the phage-bacterium interaction and through the adaptive impacts of lysogeny and lysogenic conversion. Bacteriophage biology underpins many biochemical reagents and technologies, indispensible for modern molecular biology, and phages con-tinue to be exploited in several areas of biotechnology, including diagnostics, prophylaxis and other aspects of food microbiology. Furthermore, the use of bacteriophages as natural alternatives to anti-biotics (known as phage therapy) are of increasing interest for the treatment of human and animal disease in the face of rising levels of antibiotic resistance. This meeting will bring together researchers working with phages across these disciplines to encourage collaboration and knowledge sharing. This event is aimed at those interested in the biology of bacteriophages and their applications in biotech-nology, including research scientists, academics and pharmaceutical professionals.
Contacts: http://lifescienceevents.com/phage2017/
Information: http://www.globaleventslist.elsevier.com/events/2017/01/bacteriophage-2017/
883
AGRICULTURAL BIOLOGY, ISSN 2412-0324 (English ed. Online)
2016, V. 51, ¹ 6, pp. 883-890 (SEL’SKOKHOZYAISTVENNAYA BIOLOGIYA) ISSN 0131-6397 (Russian ed. Print)
ISSN 2313-4836 (Russian ed. Online)
Microbiome and productivity UDC 636.52/.58:591.3:579.64 doi: 10.15389/agrobiology.2016.6.883rus
doi: 10.15389/agrobiology.2016.6.883eng
POULTRY GASTROINTESTINAL MICROBIOME CHANGES DURING ONTOGENESIS
V.I. FISININ1, G.Yu. LAPTEV2, I.N. NIKONOV2, L.A. IL’INA2, E.A. YILDIRIM2, V.A. FILIPPOVA2, N.I. NOVIKOVA2, A.A. GROZINA1, T.A. EGOROVA1,
T.N. LENKOVA1, V.A. MANUKYAN1, I.A. EGOROV1
1All-Russian Research and Technological Poultry Institute, Federal Agency of Scientific Organizations, 10, ul. Pti-tsegradskaya, Sergiev Posad, Moscow Province, 141311 Russia, e-mail [email protected]; 2JSC «Biotrof», Kolpino, St. Petersburg, 192288 Russia, e-mail [email protected] Acknowledgements: Supported by grant from Russian Science Foundation (project ¹ 14-16-00140 «Modern views on the intestinal microflora of poultry in different diets: molecular genetic approaches») Received September 13, 2016
A b s t r a c t
Microorganisms which inhabit gut play great role in providing with nutrients, antibiotics, hormones and vitamins necessary for poultry health and performance. Therefore study of gut micro-biome changes during ontogenesis seems to be essential. The structure of gut microflora in poultry embryos is of particular interest and debated because of very few publications on the problem. De-spite embryo intestine is commonly considered sterile there are several reports on gut colonization by microorganisms in embryos during ontogenesis. Using T-RFLP (Terminal Restriction Fragment Length Polymorphism) analysis to generate a fingerprint of a microbial community we compared gut flora in chick embryos on days 6 and 17 to those in 26-day, 150-day and 300-day old Hisex White layers. Unlike accepted view, a high biodiversity was seen in embryo gut with Enterobacteriaceae (Escherichia coli mainly) predominated. Clostridia, Bacteroides, Negativicutes, Actinomycetales, Bifi-docteriales were also found in contrast to earlier reports of their presence only in chicks at hatching and in adult poultry gut. Moreover, in the embryo gut we found the causal agents of dangerous ani-mal disease, Burkholderia sp., Pseudomonas sp., Salmonella sp., Klebsiella sp. and Rickettsiales bacte-ria. Interestingly, the embryo gut biodiversity on day 6 was higher as compared to day 17 (75±2.75 phylotypes vs 30±1.20 phylotypes). In the layers aged 26, 150 and 300 days the diversity was much higher (over 175±8.12 phylotypes) as compared to embryos due to new members involved into gut bacterial community. Moreover, the poultry aged 300 days was lower both in the total diversity and in the percentage of unidentified microorganisms when compared to 26-day and 150-day old hens. In the adults, the predominating microbial taxa changed, in particular, Clostridia and Negativicutes became more abundant whereas Bacillales and Bifidobacteriales were depressed. Our findings indicate gut colonization by Lactobacilales and pathogenic Listeria sp., Pantoea sp., Enterobacter sp., Myco-plasma sp., Acinetobacter sp., Pasteurellaceae, Campylobacteraceae, Fusobacteria which occurred dur-ing ontogenesis. Thus the gut microbiome formation starts in embryo which is important for hatch-ing and growing healthy poultry.
Keywords: gut microflora, caecum, ontogenesis, hens, embryo, T-RFLP
Microorganisms which inhabit the gastrointestinal tract (GIT), by using their own cellulosolytic and amylolytic enzymes, completely absent in poultry, pro-vide the host with nutrients, vitamins, antibiotics, proteins, hormones and other compounds involved in metabolism [1-4]. According to traditional concepts, micro-biocenosis of embryonal digestive system is sterile, and its colonization by microor-ganisms takes place after chicken hatching [5-7]. Bacteria inhabiting poultry intes-tine normally include bifidobacteria, streptococci, lactobacilli, lactate fermenting bacteria, eubacteria, bacteroides and enterobacteria [1, 8, 9].
Bacterial community of digestive tract undergoes subsequent changes throughout life of a bird, related to a number of factors, the main of which are growth and development of digestive tract, feeding regime and feed composition.
884
At that, intestinal microorganisms act as a highly sensitive indicator system. It should be noted that the change of ecological balance between obligatory micro-organisms of digestive tract do not always have a positive impact on metabolic processes and health of a bird [10]. In this context, studies of qualitative and quantitative composition of GIT microbiota in ontogenesis are worthwhile.
Up to the 1990s, studies of microorganisms in various ecosystems were limited to examination of strains cultivated on artificial media. Development of metagenomic methods, without a necessity to cultivate microorganisms, allowed us to broaden our understanding of composition of microbiota [11, 12]. This is of crucial significance, as up to 99 % of biosphere microorganisms are uncul-turable on artificial media, but may play an important ecological role. We failed to find any data on composition of chicken embryo GIT microbiome in availa-ble literature.
For the first time, we have analyzed the composition of chicken GIT bac-terial community in ontogenesis, from an embryo to an adult bird, using T-RFLP (terminal restriction fragment length polymorphism) method. A wide taxonomic composition of embryonal intestine bacteria has been demonstrated, including op-portunistic strains, pathogens and unculturable microorganisms.
The work focuses on examination of succession in a bacterial community of poultry GIT in ontogenesis, using T-RFLP method.
Technique. Three samples of GIT content of 6 and 12-day old chicken embryos and three samples from cecum of Hisex White adult 26, 150 and 300-day old laying hens were collected (hatching house of the All-Russian Research and Technological Poultry Institute — VNITIP, Zagorskoe EPH VNITIP vivari-um, Moscow region). The poultry were fed manually, ad libitum with dry com-plete feed according to the cross standards. The birds were kept in cage batteries (Big Dutchman, Germany) in groups of 35 individuals, with no gender separa-tion, in compliance with all technological parameters according to the norms of VNITIP. Sampling and sample preparation was performed in strict compliance with sterility in accordance with the established requirements [13].
Total DNA was isolated from the samples using Genomic DNA Purifi-cation Kit (Fermentas, Inc., Lithuania) according to manufacturer's recommen-dations. T-RFLP analysis was used for examination of bacterial community composition. PCR was performed using a Verity DNA amplificator (Life Tech-nologies, Inc., USA) and 63F primer (CAGGCCTAACACATGCAAGTC) with the 5' end marked (fluorophore WellRed D4, Beckman Coulter, USA), and 1492R primer (TACGGHTA-CCTTGTTACGACTT). Fluorescence-labelled am-plicons of 16S rRNA gene were purified by a standard methodology [14]. The obtained amplicons (30-50 ng) were treated with endonucleases HaeIII, HhaI and MspI, according to the manufacturer's recommendation (Fermentas, Lithu-ania). Restriction products were analyzed on a CEQ 8000 sequencer (Beckman Coulter, USA). Phylogenetic status of bacteria was determined using Fragment Sorter software (http://www.oardc.ohiostate.edu/trflpfragsort/index.php).
Statistical processing of the results was performed by means of analysis of variance using Microsoft Excel 2010.
Results. It is generally believed that the GIT of avian embryos is ster-ile [1, 15, 16], and the formation of digestive system microbiocenosis takes place after hatching as due to a contact with the environment [5-7]. Howev-er, there is evidence obtained by classical microbiology methods [17, 18] and real time PCR [19] which indicates the ability of microorganisms to colonize GIT of birds still inside an egg, at the embryonic development stage.
Using T-RFLP analysis, we have established that embryonal GIT bacte-rial community was characterized by significant taxonomic diversity (Table). Bi-
885
odiversity of microorganisms in microbiocoenosis of chicken embryo GIT con-tent on day 6 of incubation was much more significant than that on day 16. Members of family Enterobacteriaceae, typical of poultry intestine microflora, were predominant, mainly Escherichia coli. Interestingly, their number was twice as much as that of 16-day old embryos (46.90±1.87 % vs. 21,30±1,03 %). Rep-resentatives of class Clostridia (families Lachnospiraceae, Eubacteriaceae, etc.), phylum Bacteroidetes, orders Negativicutes, Actinomycetales, Bifidobacteriales were also identifies among the embryonal GIT indigenous microflora, which were previously detected in hatched and adult chickens [20]. Amylo- and proteolytic bacteria of order Actinomycetales, cellulolytic microorganisms of class Clostridia, phylum Bacteroidetes, inhabiting GIT of hatched chickens and adult birds, play an important role in metabolism due to active participation in fermentation of protein, starch and polysaccharides of feeds.
Microorganisms of order Bifidobacteriales, producing organic acids and bacteriocins in GIT of birds, can ensure colonization resistance of a microbio-topes to pathogens, and produce essential nutrients [1]. We heve observed 130-fold increase in bifidobacteria amount in embryonal intestine during incubation
Interestingly, metagenomic community of GIT of 16-day old embryos has shown absence of autochthonous symbiotic intestine microflora, typical in birds, i.e. facultative anaerobic bacteria of order Lactobacillales, while the pro-portion of these bacteria in GIT of 6-day old chicken embryos was high (10.11±0.42 %). Most bacteria of order Lactobacillales are capable of active acid production, so they ensure competitive exclusion of pathogens in GIT of hatched chickens and adult birds [1]. With regard to order Lactobacillales, the proportion of microorganisms of genus Lactobacillus was 9.30±0.39 %, of genus Pediococcus — 0.66±0.02 % and Trichococcus — 0.150±0.006 %. A high percent-age of order Bacillales representatives, mostly bacteria of genus Bacillus, were de-tected in GIT of embryos. The majority of them are capable of poultry digestive tract colonization, synthesis of organic acids, bacteriocins, antibiotics and en-zymes, active participation in metabolic processes of various nutritious substrates [18, 19]. Apart from that, several unidentified bacterial genotypes were observed.
Pathogenic and opportunistic bacteria, causative agents of dangerous dis-eases in animals of genera Burkholderia, Pseudomonas, Salmonella, Klebsiella, order Rickettsiales, etc. (Table) were detected in metagenomic community of 6-day old embryo intestine; on day 16 of incubation a colonization of GIT with new microorganisms of genera Staphylococcus, Morganella, Bordetella was ob-served, which have possibly entered through eggshell pores.
It should be noted that E. coli and bacteria of genera Staphylococcus and Pseudomonas, detected by us in GIT of embryos during incubation, may cause omphalitis (i.e. inflammation of the navel and yolk sac), a dangerous disease which is the main reason of death in chickens from hatching to day 14 of life [21]. Microorganisms of genus Bordetella cause respiratory tract diseases in poul-try, mostly in young chickens [22]. Bacteria of order Rickettsiales are pathogens, transmitted by representatives of Arthropoda. Presumably, development of the said diseases is caused by unfavorable composition of GIT microflora, i.e. in-crease in the number of the pathogens during embryonic development.
The results obtained by us using T-RFLP analysis correspond to the data of Z. Babaca [18]. Using classical microbiological methods, the author has ex-amined more than 3000 samples of chicken embryo GIT content from incuba-tors of three poultry farms, in order to identify the reasons of the mass death of embryos, and has detected pathogenic bacteria E. coli (18.28 %), Staphylococcus (14.10 %), Pseudomonas (11.75 %) and Klebsiella sp. in the samples. It has been also reported that microflora of laying hens plays a key role in formation of em-
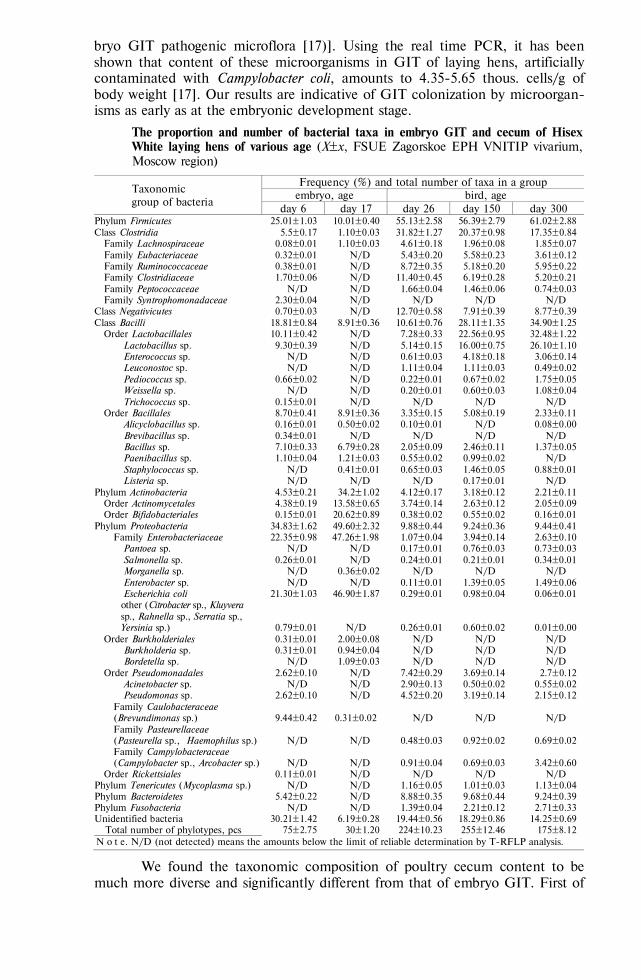
886
bryo GIT pathogenic microflora [17)]. Using the real time PCR, it has been shown that content of these microorganisms in GIT of laying hens, artificially contaminated with Campylobacter coli, amounts to 4.35-5.65 thous. cells/g of body weight [17]. Our results are indicative of GIT colonization by microorgan-isms as early as at the embryonic development stage.
The proportion and number of bacterial taxa in embryo GIT and cecum of Hisex White laying hens of various age (Х±х, FSUE Zagorskoe EPH VNITIP vivarium, Moscow region)
Taxonomic group of bacteria
Frequency (%) and total number of taxa in a group embryo, age bird, age
day 6 day 17 day 26 day 150 day 300 Phylum Firmicutes 25.01±1.03 10.01±0.40 55.13±2.58 56.39±2.79 61.02±2.88 Class Clostridia 5.5±0.17 1.10±0.03 31.82±1.27 20.37±0.98 17.35±0.84 Family Lachnospiraceae 0.08±0.01 1.10±0.03 4.61±0.18 1.96±0.08 1.85±0.07 Family Eubacteriaceae 0.32±0.01 N/D 5.43±0.20 5.58±0.23 3.61±0.12 Family Ruminococcaceae 0.38±0.01 N/D 8.72±0.35 5.18±0.20 5.95±0.22 Family Clostridiaceae 1.70±0.06 N/D 11.40±0.45 6.19±0.28 5.20±0.21 Family Peptococcaceae N/D N/D 1.66±0.04 1.46±0.06 0.74±0.03 Family Syntrophomonadaceae 2.30±0.04 N/D N/D N/D N/D Class Negativicutes 0.70±0.03 N/D 12.70±0.58 7.91±0.39 8.77±0.39 Class Bacilli 18.81±0.84 8.91±0.36 10.61±0.76 28.11±1.35 34.90±1.25 Order Lactobacillales 10.11±0.42 N/D 7.28±0.33 22.56±0.95 32.48±1.22 Lactobacillus sp. 9.30±0.39 N/D 5.14±0.15 16.00±0.75 26.10±1.10 Enterococcus sp. N/D N/D 0.61±0.03 4.18±0.18 3.06±0.14 Leuconostoc sp. N/D N/D 1.11±0.04 1.11±0.03 0.49±0.02 Pediococcus sp. 0.66±0.02 N/D 0.22±0.01 0.67±0.02 1.75±0.05 Weissella sp. N/D N/D 0.20±0.01 0.60±0.03 1.08±0.04 Trichococcus sp. 0.15±0.01 N/D N/D N/D N/D Order Bacillales 8.70±0.41 8.91±0.36 3.35±0.15 5.08±0.19 2.33±0.11 Alicyclobacillus sp. 0.16±0.01 0.50±0.02 0.10±0.01 N/D 0.08±0.00 Brevibacillus sp. 0.34±0.01 N/D N/D N/D N/D Bacillus sp. 7.10±0.33 6.79±0.28 2.05±0.09 2.46±0.11 1.37±0.05 Paenibacillus sp. 1.10±0.04 1.21±0.03 0.55±0.02 0.99±0.02 N/D Staphylococcus sp. N/D 0.41±0.01 0.65±0.03 1.46±0.05 0.88±0.01 Listeria sp. N/D N/D N/D 0.17±0.01 N/D Phylum Actinobacteria 4.53±0.21 34.2±1.02 4.12±0.17 3.18±0.12 2.21±0.11 Order Actinomycetales 4.38±0.19 13.58±0.65 3.74±0.14 2.63±0.12 2.05±0.09 Order Bifidobacteriales 0.15±0.01 20.62±0.89 0.38±0.02 0.55±0.02 0.16±0.01 Phylum Proteobacteria 34.83±1.62 49.60±2.32 9.88±0.44 9.24±0.36 9.44±0.41 Family Enterobacteriaceae 22.35±0.98 47.26±1.98 1.07±0.04 3.94±0.14 2.63±0.10 Pantoea sp. N/D N/D 0.17±0.01 0.76±0.03 0.73±0.03 Salmonella sp. 0.26±0.01 N/D 0.24±0.01 0.21±0.01 0.34±0.01 Morganella sp. N/D 0.36±0.02 N/D N/D N/D Enterobacter sp. N/D N/D 0.11±0.01 1.39±0.05 1.49±0.06 Escherichia coli 21.30±1.03 46.90±1.87 0.29±0.01 0.98±0.04 0.06±0.01 other (Citrobacter sp., Kluyvera sp., Rahnella sp., Serratia sp., Yersinia sp.) 0.79±0.01 N/D 0.26±0.01 0.60±0.02 0.01±0.00 Order Burkholderiales 0.31±0.01 2.00±0.08 N/D N/D N/D Burkholderia sp. 0.31±0.01 0.94±0.04 N/D N/D N/D Bordetella sp. N/D 1.09±0.03 N/D N/D N/D Order Pseudomonadales 2.62±0.10 N/D 7.42±0.29 3.69±0.14 2.7±0.12 Acinetobacter sp. N/D N/D 2.90±0.13 0.50±0.02 0.55±0.02 Pseudomonas sp. 2.62±0.10 N/D 4.52±0.20 3.19±0.14 2.15±0.12 Family Caulobacteraceae (Brevundimonas sp.) 9.44±0.42 0.31±0.02 N/D N/D N/D Family Pasteurellaceae (Pasteurella sp., Haemophilus sp.) N/D N/D 0.48±0.03 0.92±0.02 0.69±0.02 Family Campylobacteraceae (Campylobacter sp., Arcobacter sp.) N/D N/D 0.91±0.04 0.69±0.03 3.42±0.60 Order Rickettsiales 0.11±0.01 N/D N/D N/D N/D Phylum Tenericutes (Mycoplasma sp.) N/D N/D 1.16±0.05 1.01±0.03 1.13±0.04 Phylum Bacteroidetes 5.42±0.22 N/D 8.88±0.35 9.68±0.44 9.24±0.39 Phylum Fusobacteria N/D N/D 1.39±0.04 2.21±0.12 2.71±0.33 Unidentified bacteria 30.21±1.42 6.19±0.28 19.44±0.56 18.29±0.86 14.25±0.69
Total number of phylotypes, pcs 75±2.75 30±1.20 224±10.23 255±12.46 175±8.12 N o t e. N/D (not detected) means the amounts below the limit of reliable determination by T-RFLP analysis.
We found the taxonomic composition of poultry cecum content to be much more diverse and significantly different from that of embryo GIT. First of
887
all, regardless of the age of chickens, representatives of phylum Firmicutes (above 55.13 %), the proportion of which increased with age, rather than microorgan-isms of family Enterobacteriaceae, were taxonomic dominants. In 26-day old chickens and 150 and 300-day old laying hens the representatives of class Clos-tridia predominated, which mostly includes bacteria of families Eubacteriaceae, Ruminococcaceae, Peptococcaceae, Clostridiaceae, Lachnospiraceae with cellulose- and amylolytic properties, content of which decreased with age. The number of bacteria with similar properties from phylum Bacteroidetes was not related to the age of laying hens and was higher than that in embryo GIT. Birds have little, if any, digestive enzymes of their own, required for cellulose and other non-starch polysaccharides cleavage, so the role of the said microorganisms in digestion of chickens is extremely important [1, 2].
As compared to embryos, the number of bacteria from class Nega-tivicutes, which play an important role in digestion by fermentation of organic acids, including lactate, with formation of volatile fatty acids necessary for ener-gy supply [2], increased significantly in adult chickens.
The proportion of microorganisms of orders Bacillales and Bifidobacte-riales, characterized by high antagonistic activity towards pathogenic microflora, decreased with age and was significantly lower than that of embryo GIT. An in-verse trend was observed for lactobacilli of order Lactobacillales, the largest pro-portion of which was detected in 300-day old chickens. Diversity of lactobacilli in adult chickens was higher than in enbryos, and included the representatives of genera Weissella, Leuconostoc and Enterococcus as well.
The diversity of pathogens in 26-day chickens and 150 and 300-day old adults was significantly higher than that in embryos. Poultry GIT was colonized by new pathogens of genera Listeria, Pantoea, Enterobacter, Mycoplasma, Aci-netobacter, families Pasteurellaceae, Campylobacteraceae, phylum Fusobacteria. Some microorganisms of the listed taxa (Pantoea, Enterobacter, Acinetobacter) cause intestine dysbiotic disorders in mammals and birds, while the other (genus Mycoplasma, family Pasteurellaceae) are mostly detected in the respiratory tract in birds and are considered as causative agents of respiratory diseases. The fact that bacteria of phylum Fusobacteria, which were previously considered as typical inhabitants of the rumen of ruminants, are found in poultry cecum is of signifi-cant interest [23]. It should be noted that the presence of several listed patho-gens in poultry GIT was previously reported only based on molecular genetic studies [24, 25].
Interestingly, some pathogens detected in embryo GIT, including bacteria of orders Burkholderiales and Rickettsiales and genus Brevundimonas, have not been observed in 26-day old chickens, as well as in 150 and 300-day old laying hens. At that, the number of unidentified bacteries decreased with age of a bird.
Thus, using T-RFLP analysis, highly abundant taxonomic diversity of bac-teria has been detected in the gastrointestinal tract (GIT) of chicken embryos, in-cluding the representatives of indigenous GIT normal flora of hatched and adult chickens, opportunistic and pathogenic microflora, and unculturable microorgan-isms. Taxonomic diversity in chicken GIT content on day 6 of incubation was much more significant than that on day 16. The bacterial community of poultry GIT develops during ontogenesis, and new microorganisms appear. Cecum com-munity in 26-day old chicken, as well as 150 and 300-day old poultry is represent-ed by a wide variety of microorganisms, including opportunistic and pathogenic ones. In conclusion, development of microbioecological system, as GIT content with inhabiting microflora, starts in poultry as early as at the embryonic develop-ment stage. Presumably, the structure of embryo GIT microbiotope forms under the influence of a laying hen microflora by vertical transfer due to bacterial trans-
888
location. Presumably, microflora that colonizes chicken embryo GIT enters through eggshell pores. At that, microorganisms in embryo GIT act as a basis of the forming initial intestine biocenosis in hatched chickens, which in many ways determines their viability, resistance to pathogens and development.
R E F E R E N C E S
1. T i m o s h k o M.A. Mikroflora pishchevaritel'nogo trakta sel'skokhozyaistvennykh zhivotnykh [Mi-
croflora of alimentary canal in farm animals]. Kishinev, 1990 (in Russ.). 2. T a r a k a n o v B.V. Metody issledovaniya mikroflory pishchevaritel'nogo trakta sel'skokho-
zyaistvennykh zhivotnykh i ptitsy [Study of microflora in alimentary canal of farm animals — methods]. Moscow, 2006 (in Russ.).
3. S a l a n i t r o J., F a i r c h i l d s I., Z g o r n i c k i Y. Isolation, culture characteristics, and identification of anaerobic bacteria from the chicken cecum. Appl. Microbiol., 1974, 27: 678-687.
4. S t a n l e y D., H u g h e s R.J., M o o r e R.J. Microbiota of the chicken gastrointestinal tract: influence on health, productivity and disease. Appl. Microbiol. Biotechnol., 2014, 98: 4301-4309 (doi: 10.1007/s00253-014-5646-2).
5. M e a d G.C. Microbes of the avian cecum: types present and substrates utilized. J. Exp. Zool. Suppl., 1989, 3: 48-54.
6. A m i t R o m a c h E., S k l a n D., U n i Z. Microflora ecology of the chicken intestine using 16S ribosomal DNA primers. Poultry Sci., 2004, 83: 1093-1098.
7. D i b n e r J.J., R i c h a r d s J.D., K n i g h t C.D. Microbial imprinting in gut development and Health. J. Appl. Poultry Res., 2008, 17: 174-188 (doi: 10.3382/japr.2007-00100).
8. B a r n e s E. The intestinal microbiota of poultry and game birds during life and after storage. J. Appl. Bacteriol., 1979, 46: 407-419.
9. M e a d G.C. Microbes of the avian cecum: types present and substrates utilized. J. Exp. Zool., 1989, 3: 48-54 (doi: 10.1002/jez.1402520508).
10. T o r o k V., O p h e l - K e l l e r K., L o o M., H u g h e s R. Application of methods for iden-tifying broiler chicken gut bacterial species linked with increased energy metabolism. Appl. Envi-ron. Microbiol., 2008, 74(3): 783-791 (doi: 10.1128/AEM.01384-07).
11. P a r k S.H., L e e S.I., R i c k e S.C. Microbial populations in naked neck chicken ceca raised on pasture flock fed with commercial yeast cell wall prebiotics via an Illumina MiSeq Platform. PLoS ONE, 2016, 11(3): e0151944 (doi: 10.1371/journal.pone.0151944).
12. A m a n n R.I., L u d w i g W., S c h l e i f e r K.H. Phylogenetic identification and in situ de-tection of individual microbial cells without cultivation. Microbiol. Rev., 1995, 59: 143-169.
13. Instruktsiya po sanitarno-mikrobiologicheskomu kontrolyu tushek, myasa ptitsy, ptitseproduktov, yaits i yaitseproduktov na ptitsevodcheskikh i pererabatyvayushchikh predpriyatiyakh [Instruction for the sanitary-microbiological control of poultry carcasses, meat, eggs and egg products in the poultry production and processing enterprises]. Moscow, 1990 (in Russ.).
14. M a n i a t i s T., F r i t s c h E. F., S a m b r o o k J. Molecular cloning: a laboratory manual. Cold Spring Harbor, NY, 1982.
15. v a n d e r W i e l e n P.W.J.J., K e u z e n k a m p D.A., L i p m a n L.J.A., v a n K n a - p e n F., B i e s t e r v e l d S. Spatial and temporal variation of the intestinal bacterial commu-nity in commercially raised broiler chickens during growth. Microbiol. Ecol., 2002, 44: 286-293.
16. M a i o r k a A., D a h l k e F., d e A z e v e d o M o r g u l i s M.S.F. Broiler adaptation to post-hatching period. Ciencia Rural, 2006, 36: 701-708.
17. K i z e r w e t t e r - S w i d a M., B i n e k M. Bacterial microflora of the chicken embryos and newly hatched chicken. J. Animal Feed Sci., 2008, 17: 224-232 (doi: 10.22358/jafs/66602/2008).
18. B a b a c a Z. Isolation of bacterial pathogens from dead in-shell chicken embryos from local hatcheries. J. Vet. Sci. Technol., 2014, 5: 170-171.
19. R o s s i D.A., F o n s e c a B.B., d e M e l o R.T., d a S i l v a F e l i p e G., d a S i l v a P.L., M e n d o n ç a E.P., F i l g u e i r a s A.L., B e l e t t i M.E. Transmission of Campylobacter coli in chicken embryos. Brazil. J. Microbiol., 2012, 43(2): 535-543 (doi: 10.1590/S1517-83822012000200014).
20. N a k p h a i c h i t M., T h a n o m w o n g w a t t a n a S., P h r a e p h a i s a r n C., S a -k a m o t o N., K e a w s o m p o n g S., N a k a y a m a J., N i t i s i n p r a s e r t S. The effect of including Lactobacillus reuteri KUB AC5 during post hatch feeding on the growth and ileum mi-crobiota of broiler chickens. Poultry Sci., 2011, 12(90): 2753-2765 (doi: 10.3382/ps.2011-01637).
21. L o w d e r B.V., F i t z g e r a l d J.R. Human origin for avian pathogenic Staphylococcus aureus. Virulence, 2010, 4(1): 283-284 (doi: 10.4161/viru.1.4.11838).
22. B i b e r s t e i n E.L., H i r s h D.C. Bordetella in veterinary microbiology. Reino Unido, Black-well Sci., Oxford, 1999: 148-150.
23. G o n g J., F o r s t e r R.J., Y u H., C h a m b e r s J.R., S a b o u r P.M., W h e a t c r o f t R.,

889
C h e n S. Diversity and phylogenetic analysis of bacteria in the mucosa of chicken ceca and comparison with bacteria in the cecal lumen. FEMS Microbiol. Lett., 2002, 208(1): 1-7 (doi: 10.1111/j.1574-6968.2002.tb11051.x).
24. T o r o k V.A., H u g h e s R.J., M i k k e l s e n L.L. Identification and characterization of po-tential performance-related gut microbiota in broiler chickens across various feeding trials. Appl. Environ. Microbiol., 2011, 77(17): 5868-5878 (doi: 10.1128/AEM.00165-11).
25. R i n t t i l a T., A p a j a l a h t i J. Intestinal microbiota and metabolites — implications for broiler chicken health and performance. J. Appl. Poultry Res., 2013, 22(3): 647-658 (doi: 10.3382/japr.2013-00742).
891
AGRICULTURAL BIOLOGY, ISSN 2412-0324 (English ed. Online)
2016, V. 51, ¹ 6, pp. 891-902 (SEL’SKOKHOZYAISTVENNAYA BIOLOGIYA) ISSN 0131-6397 (Russian ed. Print)
ISSN 2313-4836 (Russian ed. Online) UDC 636.52/.58:636.084:579.64 doi: 10.15389/agrobiology.2016.6.891rus
doi: 10.15389/agrobiology.2016.6.891eng
THE Saccharomyces sp. AND Bacillus subtilis BASED PROBIOTICS INFLUENCE ON CHICKEN BROILER PRODUCTIVITY AND CAECUM
MICROBIOME COMMUNITY
T.A. EGOROVA1, T.N. LENKOVA1, L.A. IL’INA2, E.A. YILDIRIM2, I.N. NIKONOV2, V.A. FILIPPOVA2, G.Yu. LAPTEV2, N.I. NOVIKOVA2, A.A. GROZINA1,
V.A. MANUKYAN1, V.I. FISININ1, I.A. EGOROV1 1All-Russian Research and Technological Poultry Institute, Federal Agency of Scientific Organizations, 10, ul. Pti-tsegradskaya, Sergiev Posad, Moscow Province, 141311 Russia, e-mail [email protected]; 2JSC «Biotrof», Kolpino, St. Petersburg, 192288 Russia, e-mail [email protected] Acknowledgements: Supported by grant from Russian Science Foundation (project ¹ 14-16-00140 «Modern views on the intestinal microflora of poultry in different diets: molecular genetic approaches») Received September 26, 2016
A b s t r a c t
Study of probiotic microorganisms which can produce enzymes and amino acids is im-portant to develop biologicals to prevent disease and increase productivity in poultry. Lactbacillus sp. and Bifidobacterium sp. are widely used as probiotics due to their adhesive ability and antipathogenic activity. Bacillus sp. and yeasts Saccharomyces sp. are less examined but considered perspective as probiotic agents due to antibiotic activity and some other helpful features. Using T-RFLP (Terminal Restriction Fragment Length Polymorphism) and Real-Time PCR we compared number and com-position of caecum microbiome in 37-day old Cobb 500 broiler chicken. In group I the chickens were fed with balanced combined fodder. In group II the chickens were fed with the same combined fodder supplemented with a probiotic which contained Saccharomyces sp. living cells, and in group III this probiotic was replaced by a probiotic product Cellobacterin-T. Chickens’ caecum microbi-ome contained various taxa including several unidentified phylotypes in addition to commonly found gut microorganisms. Phylum Firmcutes (mainly cellulolytic and amylolitic Clostridia) and Bacillus sp., Lactobacillus sp., Enterococcus sp. which possess anti-bacterial activity are identified as predominat-ing taxa. In addition, various opportunistic and pathogenic microorganism were found including causative agents of respiratory diseases (Pasteurellaceae, Mycoplasma sp., etc.). Both probiotics result-ed in an increase of total caecum microbiome and a decreased of its biodiversity. The most remarka-ble changes we found in the chickens fed with yeast probiotic. Caecum microbiome community of the broilers from group II showed the lowest Shannon index and Simpson index. Cellobacte-rin-T had the highest probiotic effect. In the broilers from group III the microbiome Bacillus sp. counts increased 1.38-fold, Lactobacillus sp. number was 1.47 times higher whereas the Campylobac-ter sp. number was 3.00 times lower and the family Enterobacteriaceae number was 1.44 times lower as compared to the control chicks. Yeast probiotic resulted in positive effect on cellulolytic Clostrid-ia microorganisms but also led to rise of Campylobacter sp., Pasteurella sp. and Mycoplasma sp. counts. Poultry growth rate and productivity were influenced positively by both probiotics. The highest growth rate, weight gain, digestibility coefficient and vitamin A, E, B2 and carotinoid accumulation in liver were characteristic of the chickens from group III. Yeast probiotic pro-moted feed consumption. Chemical composition of pectoral and leg muscles of the chicks fed with probiotics remained unchanged.
Keywords: microflora, caecum, broiler chickens, bacterial community, T-RFLP, real time PCR, probiotic, Cellobacterin-T, yeast, productivity
Nowadays the studies of effect of probiotics based on beneficial microor-ganism strains, producing enzymes, amino acids and other biologically active substances, on the intestinal microbiome content of poultry, are of fundamental scientific interest [1, 2)]. It is known that normal intestinal microflora affects the macroorganism immune system formation, contributes to inactivation of some harmful decomposition products, and prevents reproduction of opportunistic bacteria [3, 4]. In poultry, gastrointestinal tract (GIT) caecum, where the intes-
892
tine content remains for the longest time, and the basic processes of microbial proteolysis and cellulose and starch cleavage take place, is usually studied [5, 6].
Bacteria of the genus Bacillus are promising subjects for development of probiotics. For example, the species Bacillus subtilis, B. licheniformis, B. coagu-lans, B. clausii, B. pumilus, and B. cereus have been tested as probiotics for human use [7]. The properties of bacilli differ significantly from those of classic probiotic microorganisms, such as lactobacilli or bifidobacteria; however, they have a num-ber of benefits. First of all, the bacilli are more resistant to GIT conditions be-cause of spore formation [8]. It has been shown that the baccilli are able to colo-nize the digestive tract of poultry, interacting both with intestine epithelium of the host organism and directly with microorganisms that inhabit GIT. Most bacilli are capable of synthesis of organic acids, bacteriocins, and antibiotic substances, so they may act as antagonists forcing pathogens (salmonellas, proteus, staphylococci, E. coli, and streptococci) out of the intestine [8, 9]. Apart from that, most bacilli strains show significant enzyme activity and contribute to processes of metabolism of various nutritious substrates.
Yeasts Saccharomyces sp. are of interest as a probiotic for poultry be-cause of production of various antibiotic compounds, inhibiting the growth of pathogens [10, 11]. Antibiotic resistance is the key competitive advantage of yeasts. Positive effect of yeasts on intestine mucosa (i.e. increase in villi size and density of goblet cells), and on performance of various monogastric animals and ruminants has been reported (12, 13). A positive effect of yeasts is related to both metabolites produced and components of their cell walls [14, 15]. The studies also confirm positive effect of probiotic microorganisms on immunity in poultry [16-18]. For example, ability of two strains, Saccharomyces boulardii and B. subtilis, to activate the immunity due to interaction with toll-like receptors (TLR) of poultry cells has been demonstrated recently [18-20].
Despite of the widespread interest in the subject, the mentions microor-ganisms are relatively new probiotics in poultry farming. The effect of baccilli and yeasts on intestine microbiocoenosis and productivity performance is still not fully understood. The work becomes more complicated due to nearly com-plete absence of methodological base for studies of facultative anaerobic and strictly anaerobic microorganisms inhabiting the digestive tract of poultry.
According to traditional concepts based on classical microbiology meth-ods, bifidobacteria, lactobacilli, nonspore-forming anaerobes, and bacteroides prevail among the intestine microorganisms [21, 22]. The advances in microbiol-ogy of the recent decades allow for analysis of intestine microorganism composi-tion using molecular-genetic methods and determination of microbial diversity without the culturing stage [23-24]. As a result, the presence of significantly larger amount of species was identified, comparing with that previously suggest-ed, which lead to reevaluation of classical concepts. Molecular-genetic methods, such as T-RFLP analysis, ensure detailed characterization of microbial commu-nity, identification of taxonomic dominants and minor components, including uncultured microorganisms, the proportion of which in various ecosystems may be as high as 90 % [25]. Real time PCR method ensures determination of quan-tity of microorganisms within an ecosystem [26]. However, there are only a few examples of molecular genetic studies of intestine microbiome [24-28], and the data on effect of bacilli and yeast probiotic strains on microbiocenosis of intes-tine content are nearly almost absent.
In this study we first have demonstrated the effect of live Saccharomyces yeast product and cellobacterine-T, a probiotic based on B. subtilis bacteria, on caecum bacterial community, using T-RFLP and real time PCR. By a biodiver-sity coefficient analysis, the yeast biological was shown to have the most signifi-
893
cant effect on the bacterial community. However, probiotic effect on pathogenic microorganisms was higher when using the bacterial product.
This work focused on caecum bacteria characteristics and productivity in broiler chickens, as influenced by dietary probiotics based on Saccharomyces (yeasts) and Bacillus subtilis (bacteria).
Technique. The study was performed in 3 groups of Cobb 500 broiler chick-ens from 1 to 37 days of age (Zagorskoe EPH VNITIP vivarium, Moscow region). Chickens were fed manually, ad libitum with dry complete feed according to the cross standards. Group I (control) chickens were fed with balanced complete feed (BD). In group II the same feed was enriched with foreign-manufactured probiotic based on live Saccharomyces yeast cells at a dose of 1 kg/t. Group III broilers were provided with the same BD with addition of cellobacterine-T probiotic (JSC Bio-trof) at a dose of 1 kg/t. The broilers consumed the same pre-starter granulated feed during the first 5 days; later they were fed according to the experimental design.
The broilers were kept in cage AviMax batteries (Big Dutchman Live-stock Equipment Co., Ltd, China) in groups with no gender separation, in com-pliance with all technological norms of the All-Russian Poultry Research and Technology Institute (VNITIP).
The following parameters were estimated: stock preservation, live weight of broilers at the age of 7, 21, and 37 days (individual weighing), average daily live weight gain, feed consumption and conversion rate per 1 kg of live weight, the levels of vitamins and carotenoids in the liver, chemical composition of pec-toral and femoral muscles, digestibility and utilization of the feed nutrients based on a physiological balance between their intake and excretion [29].
Bacterial community composition was examined by T-RFLP and real time PCR methods. Caecum content for molecular studies was collected asepti-cally from slaughtered 37-day old poultry in accordance to requirements [30].
Total DNA was isolated using Genomic DNA Purification Kit (Fermen-tas, Inc., Lithuania) according to manufacturer's manual. PCR was performed using a Verity DNA amplificator (Life Technologies, Inc., USA) and eubacterial primers, the 63F (CAGGCCTAACACATGCAAGTC) marked on 5' end (fluor-ophore WellRed D4, Beckman Coulter, USA), and 1492R (TACGGHTAC-CTTGTTACGACTT). Fluorescence-labelled products of 16S rRNA gene ampli-fication were purified as described [31]. The amplicons (30-50 ng) were digwsted with restriction endonucleases HaeIII, HhaI and MspI following the manufac-turer’s protocol (Fermentas, Lithuania). Restriction products were analyzed on a CEQ 8000 (Beckman Coulter, USA) according to the attached manual. Phylo-genetic status of bacteria was determined using Fragment Sorter software (http://www.oardc.ohiostate.edu/trflpfragsort/in-dex.php). Real time PCR to account for the total number of bacteria was performed on a DT Lite-4 ampli-fier (OOO NPO DNA Technology, Russia) with the Reagents for qPCR in the presence of intercalating EVA Green stain Kit (JSC Syntol, Russia) and Eub338/Eub518 primers (5´-ACTCCTACGGGAGGCAGCAG-3´ and 5´-AT-TACCGCGGCTGCTGG-3´) by the following protocol: 95 С for 3 min; 95 С for 13 sec, 57 С for 13 sec, 72 С for 30 sec (40 cycles).
MS Excel 2010 dispersion analysis software was applied for quantitative data processing. Shannon and Simpson biodiversity coefficients were calculated using Past software (http://folk.uio.no/ohammer/past/).
Results. It is known that bacteria act as taxonomic dominants in caecum microbial community and, according to traditional concepts, play an important role in provision of nutritional components, vitamins and other vital substances in poultry. The total number of bacteria in poultry caecum in the control group
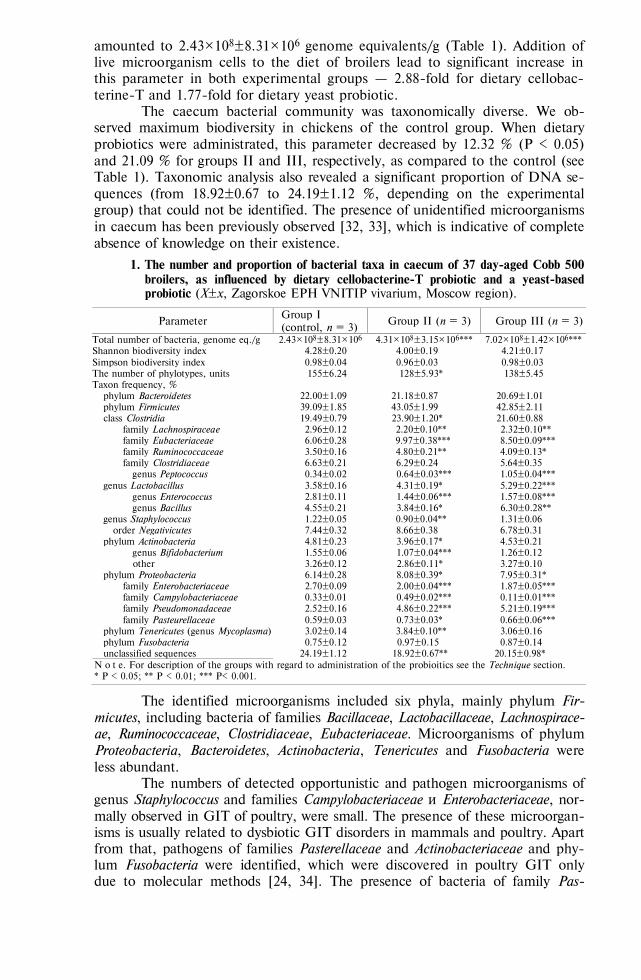
894
amounted to 2.43½108±8.31½106 genome equivalents/g (Table 1). Addition of live microorganism cells to the diet of broilers lead to significant increase in this parameter in both experimental groups — 2.88-fold for dietary cellobac-terine-T and 1.77-fold for dietary yeast probiotic.
The caecum bacterial community was taxonomically diverse. We ob-served maximum biodiversity in chickens of the control group. When dietary probiotics were administrated, this parameter decreased by 12.32 % (Р < 0.05) and 21.09 % for groups II and III, respectively, as compared to the control (see Table 1). Taxonomic analysis also revealed a significant proportion of DNA se-quences (from 18.92±0.67 to 24.19±1.12 %, depending on the experimental group) that could not be identified. The presence of unidentified microorganisms in caecum has been previously observed [32, 33], which is indicative of complete absence of knowledge on their existence.
1. The number and proportion of bacterial taxa in caecum of 37 day-aged Cobb 500 broilers, as influenced by dietary cellobacterine-T probiotic and a yeast-based probiotic (Х±х, Zagorskoe EPH VNITIP vivarium, Moscow region).
Parameter Group I (control, n = 3)
Group II (n = 3) Group III (n = 3)
Total number of bacteria, genome eq./g 2.43½108±8.31½106 4.31½108±3.15½106*** 7.02½108±1.42½106*** Shannon biodiversity index 4.28±0.20 4.00±0.19 4.21±0.17 Simpson biodiversity index 0.98±0.04 0.96±0.03 0.98±0.03 The number of phylotypes, units 155±6.24 128±5.93* 138±5.45 Taxon frequency, %
phylum Bacteroidetes 22.00±1.09 21.18±0.87 20.69±1.01 phylum Firmicutes 39.09±1.85 43.05±1.99 42.85±2.11 class Clostridia 19.49±0.79 23.90±1.20* 21.60±0.88 family Lachnospiraceae 2.96±0.12 2.20±0.10** 2.32±0.10** family Eubacteriaceae 6.06±0.28 9.97±0.38*** 8.50±0.09*** family Ruminococcaceae 3.50±0.16 4.80±0.21** 4.09±0.13* family Clostridiaceae 6.63±0.21 6.29±0.24 5.64±0.35 genus Peptococcus 0.34±0.02 0.64±0.03*** 1.05±0.04*** genus Lactobacillus 3.58±0.16 4.31±0.19* 5.29±0.22*** genus Enterococcus 2.81±0.11 1.44±0.06*** 1.57±0.08*** genus Bacillus 4.55±0.21 3.84±0.16* 6.30±0.28** genus Staphylococcus 1.22±0.05 0.90±0.04** 1.31±0.06 order Negativicutes 7.44±0.32 8.66±0.38 6.78±0.31 phylum Actinobacteria 4.81±0.23 3.96±0.17* 4.53±0.21 genus Bifidobacterium 1.55±0.06 1.07±0.04*** 1.26±0.12 other 3.26±0.12 2.86±0.11* 3.27±0.10 phylum Proteobacteria 6.14±0.28 8.08±0.39* 7.95±0.31* family Enterobacteriaceae 2.70±0.09 2.00±0.04*** 1.87±0.05*** family Сampylobacteriaceae 0.33±0.01 0.49±0.02*** 0.11±0.01*** family Pseudomonadaceae 2.52±0.16 4.86±0.22*** 5.21±0.19*** family Pasteurellaceae 0.59±0.03 0.73±0.03* 0.66±0.06*** phylum Tenericutes (genus Mycoplasma) 3.02±0.14 3.84±0.10** 3.06±0.16 phylum Fusobacteria 0.75±0.12 0.97±0.15 0.87±0.14 unclassified sequences 24.19±1.12 18.92±0.67** 20.15±0.98*
N o t e. For description of the groups with regard to administration of the probioitics see the Technique section. * Р < 0.05; ** Р < 0.01; *** Р< 0.001.
The identified microorganisms included six phyla, mainly phylum Fir-micutes, including bacteria of families Bacillaceae, Lactobacillaceae, Lachnospirace-ae, Ruminococcaceae, Clostridiaceae, Eubacteriaceae. Microorganisms of phylum Proteobacteria, Bacteroidetes, Actinobacteria, Tenericutes and Fusobacteria were less abundant.
The numbers of detected opportunistic and pathogen microorganisms of genus Staphylococcus and families Campylobacteriaceae и Enterobacteriaceae, nor-mally observed in GIT of poultry, were small. The presence of these microorgan-isms is usually related to dysbiotic GIT disorders in mammals and poultry. Apart from that, pathogens of families Pasterellaceae and Actinobacteriaceae and phy-lum Fusobacteria were identified, which were discovered in poultry GIT only due to molecular methods [24, 34]. The presence of bacteria of family Pas-
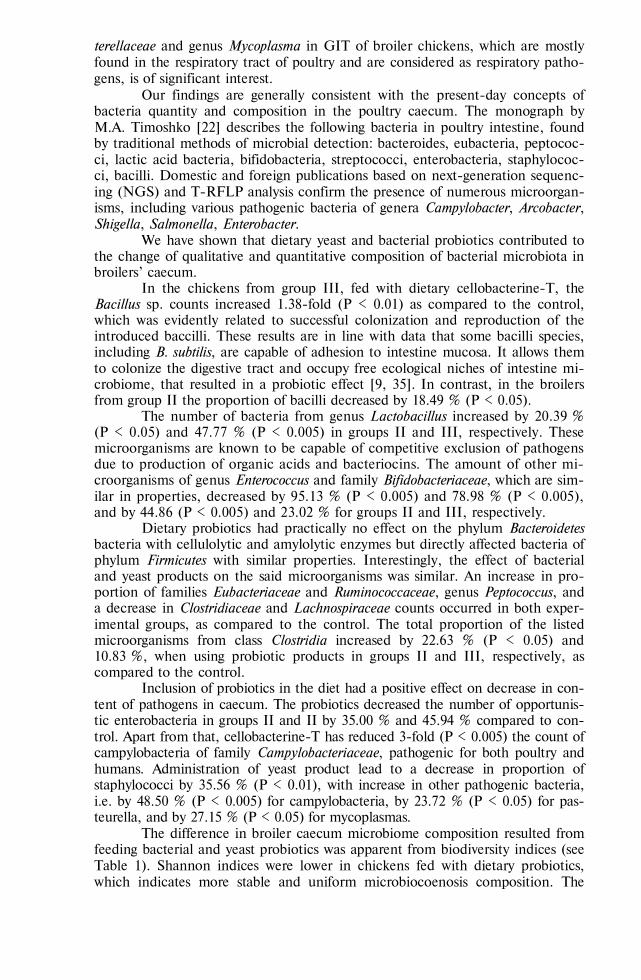
895
terellaceae and genus Mycoplasma in GIT of broiler chickens, which are mostly found in the respiratory tract of poultry and are considered as respiratory patho-gens, is of significant interest.
Our findings are generally consistent with the present-day concepts of bacteria quantity and composition in the poultry caecum. The monograph by M.A. Timoshko [22] describes the following bacteria in poultry intestine, found by traditional methods of microbial detection: bacteroides, eubacteria, peptococ-ci, lactic acid bacteria, bifidobacteria, streptococci, enterobacteria, staphylococ-ci, bacilli. Domestic and foreign publications based on next-generation sequenc-ing (NGS) and T-RFLP analysis confirm the presence of numerous microorgan-isms, including various pathogenic bacteria of genera Campylobacter, Arcobacter, Shigella, Salmonella, Enterobacter.
We have shown that dietary yeast and bacterial probiotics contributed to the change of qualitative and quantitative composition of bacterial microbiota in broilers’ caecum.
In the chickens from group III, fed with dietary cellobacterine-T, the Bacillus sp. counts increased 1.38-fold (Р < 0.01) as compared to the control, which was evidently related to successful colonization and reproduction of the introduced baccilli. These results are in line with data that some bacilli species, including B. subtilis, are capable of adhesion to intestine mucosa. It allows them to colonize the digestive tract and occupy free ecological niches of intestine mi-crobiome, that resulted in a probiotic effect [9, 35]. In contrast, in the broilers from group II the proportion of bacilli decreased by 18.49 % (Р < 0.05).
The number of bacteria from genus Lactobacillus increased by 20.39 % (Р < 0.05) and 47.77 % (Р < 0.005) in groups II and III, respectively. These microorganisms are known to be capable of competitive exclusion of pathogens due to production of organic acids and bacteriocins. The amount of other mi-croorganisms of genus Enterococcus and family Bifidobacteriaceae, which are sim-ilar in properties, decreased by 95.13 % (Р < 0.005) and 78.98 % (Р < 0.005), and by 44.86 (Р < 0.005) and 23.02 % for groups II and III, respectively.
Dietary probiotics had practically no effect on the phylum Bacteroidetes bacteria with cellulolytic and amylolytic enzymes but directly affected bacteria of phylum Firmicutes with similar properties. Interestingly, the effect of bacterial and yeast products on the said microorganisms was similar. An increase in pro-portion of families Eubacteriaceae and Ruminococcaceae, genus Peptococcus, and a decrease in Clostridiaceae and Lachnospiraceae counts occurred in both exper-imental groups, as compared to the control. The total proportion of the listed microorganisms from class Clostridia increased by 22.63 % (Р < 0.05) and 10.83 %, when using probiotic products in groups II and III, respectively, as compared to the control.
Inclusion of probiotics in the diet had a positive effect on decrease in con-tent of pathogens in caecum. The probiotics decreased the number of opportunis-tic enterobacteria in groups II and II by 35.00 % and 45.94 % compared to con-trol. Apart from that, cellobacterine-T has reduced 3-fold (Р < 0.005) the count of campylobacteria of family Сampylobacteriaceae, pathogenic for both poultry and humans. Administration of yeast product lead to a decrease in proportion of staphylococci by 35.56 % (Р < 0.01), with increase in other pathogenic bacteria, i.e. by 48.50 % (Р < 0.005) for campylobacteria, by 23.72 % (Р < 0.05) for pas-teurella, and by 27.15 % (Р < 0.05) for mycoplasmas.
The difference in broiler caecum microbiome composition resulted from feeding bacterial and yeast probiotics was apparent from biodiversity indices (see Table 1). Shannon indices were lower in chickens fed with dietary probiotics, which indicates more stable and uniform microbiocoenosis composition. The
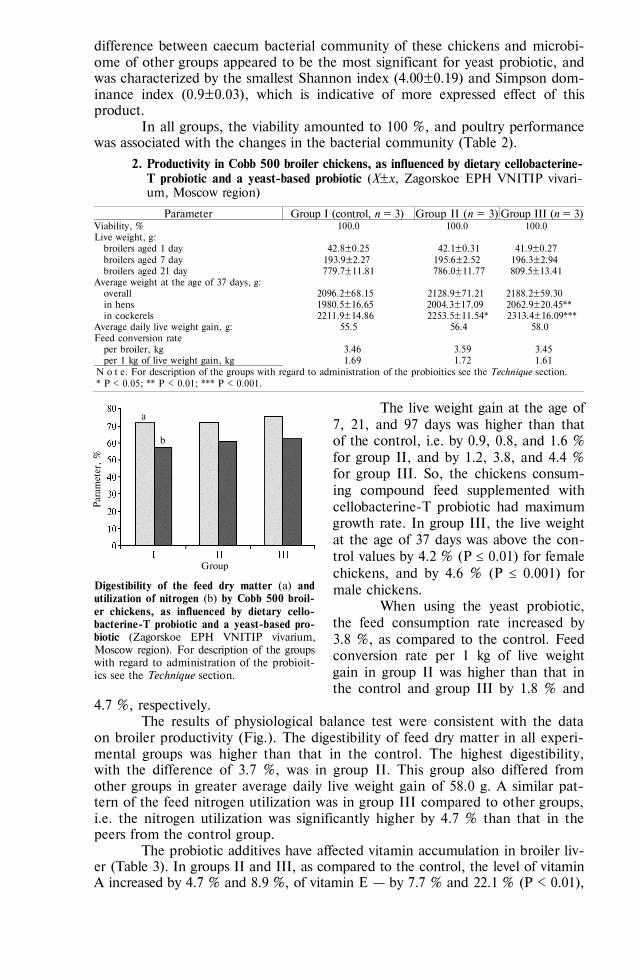
896
difference between caecum bacterial community of these chickens and microbi-ome of other groups appeared to be the most significant for yeast probiotic, and was characterized by the smallest Shannon index (4.00±0.19) and Simpson dom-inance index (0.9±0.03), which is indicative of more expressed effect of this product.
In all groups, the viability amounted to 100 %, and poultry performance was associated with the changes in the bacterial community (Table 2).
2. Productivity in Cobb 500 broiler chickens, as influenced by dietary cellobacterine-T probiotic and a yeast-based probiotic (Х±х, Zagorskoe EPH VNITIP vivari-um, Moscow region)
Parameter Group I (control, n = 3) Group II (n = 3) Group III (n = 3) Viability, % 100.0 100.0 100.0 Live weight, g: broilers aged 1 day 42.8±0.25 42.1±0.31 41.9±0.27 broilers aged 7 day 193.9±2.27 195.6±2.52 196.3±2.94 broilers aged 21 day 779.7±11.81 786.0±11.77 809.5±13.41 Average weight at the age of 37 days, g: overall 2096.2±68.15 2128.9±71.21 2188.2±59.30 in hens 1980.5±16.65 2004.3±17.09 2062.9±20.45** in cockerels 2211.9±14.86 2253.5±11.54* 2313.4±16.09*** Average daily live weight gain, g: 55.5 56.4 58.0 Feed conversion rate per broiler, kg 3.46 3.59 3.45 per 1 kg of live weight gain, kg 1.69 1.72 1.61 N o t e. For description of the groups with regard to administration of the probioitics see the Technique section. * Р < 0.05; ** Р < 0.01; *** Р < 0.001.
The live weight gain at the age of 7, 21, and 97 days was higher than that of the control, i.e. by 0.9, 0.8, and 1.6 % for group II, and by 1.2, 3.8, and 4.4 % for group III. So, the chickens consum-ing compound feed supplemented with cellobacterine-T probiotic had maximum growth rate. In group III, the live weight at the age of 37 days was above the con-trol values by 4.2 % (Р 0.01) for female chickens, and by 4.6 % (Р 0.001) for male chickens.
When using the yeast probiotic, the feed consumption rate increased by 3.8 %, as compared to the control. Feed conversion rate per 1 kg of live weight gain in group II was higher than that in the control and group III by 1.8 % and
4.7 %, respectively. The results of physiological balance test were consistent with the data
on broiler productivity (Fig.). The digestibility of feed dry matter in all experi-mental groups was higher than that in the control. The highest digestibility, with the difference of 3.7 %, was in group II. This group also differed from other groups in greater average daily live weight gain of 58.0 g. A similar pat-tern of the feed nitrogen utilization was in group III compared to other groups, i.e. the nitrogen utilization was significantly higher by 4.7 % than that in the peers from the control group.
The probiotic additives have affected vitamin accumulation in broiler liv-er (Table 3). In groups II and III, as compared to the control, the level of vitamin A increased by 4.7 % and 8.9 %, of vitamin E — by 7.7 % and 22.1 % (Р < 0.01),
Digestibility of the feed dry matter (a) and utilization of nitrogen (b) by Cobb 500 broil-er chickens, as influenced by dietary cello-bacterine-T probiotic and a yeast-based pro-biotic (Zagorskoe EPH VNITIP vivarium, Moscow region). For description of the groups with regard to administration of the probioit-ics see the Technique section.
Par
amet
er, %
Group
a
b
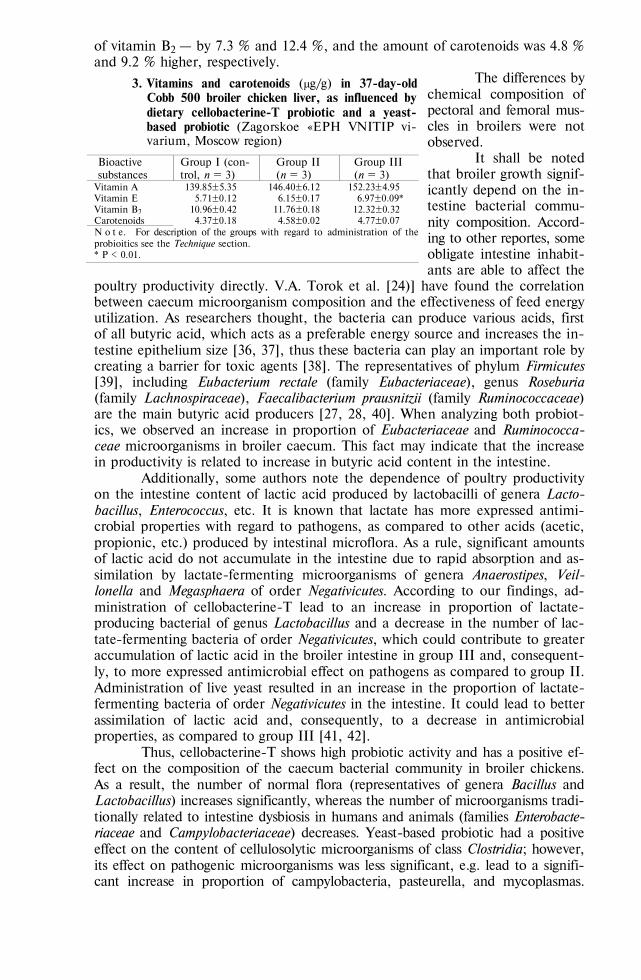
897
of vitamin В2 — by 7.3 % and 12.4 %, and the amount of carotenoids was 4.8 % and 9.2 % higher, respectively.
The differences by chemical composition of pectoral and femoral mus-cles in broilers were not observed.
It shall be noted that broiler growth signif-icantly depend on the in-testine bacterial commu-nity composition. Accord-ing to other reportes, some obligate intestine inhabit-ants are able to affect the
poultry productivity directly. V.A. Torok et al. [24)] have found the correlation between caecum microorganism composition and the effectiveness of feed energy utilization. As researchers thought, the bacteria can produce various acids, first of all butyric acid, which acts as a preferable energy source and increases the in-testine epithelium size [36, 37], thus these bacteria can play an important role by creating a barrier for toxic agents [38]. The representatives of phylum Firmicutes [39], including Eubacterium rectale (family Eubacteriaceae), genus Roseburia (family Lachnospiraceae), Faecalibacterium prausnitzii (family Ruminococcaceae) are the main butyric acid producers [27, 28, 40]. When analyzing both probiot-ics, we observed an increase in proportion of Eubacteriaceae and Ruminococca-ceae microorganisms in broiler caecum. This fact may indicate that the increase in productivity is related to increase in butyric acid content in the intestine.
Additionally, some authors note the dependence of poultry productivity on the intestine content of lactic acid produced by lactobacilli of genera Lacto-bacillus, Enterococcus, etc. It is known that lactate has more expressed antimi-crobial properties with regard to pathogens, as compared to other acids (acetic, propionic, etc.) produced by intestinal microflora. As a rule, significant amounts of lactic acid do not accumulate in the intestine due to rapid absorption and as-similation by lactate-fermenting microorganisms of genera Anaerostipes, Veil-lonella and Megasphaera of order Negativicutes. According to our findings, ad-ministration of cellobacterine-T lead to an increase in proportion of lactate-producing bacterial of genus Lactobacillus and a decrease in the number of lac-tate-fermenting bacteria of order Negativicutes, which could contribute to greater accumulation of lactic acid in the broiler intestine in group III and, consequent-ly, to more expressed antimicrobial effect on pathogens as compared to group II. Administration of live yeast resulted in an increase in the proportion of lactate-fermenting bacteria of order Negativicutes in the intestine. It could lead to better assimilation of lactic acid and, consequently, to a decrease in antimicrobial properties, as compared to group III [41, 42].
Thus, cellobacterine-T shows high probiotic activity and has a positive ef-fect on the composition of the caecum bacterial community in broiler chickens. As a result, the number of normal flora (representatives of genera Bacillus and Lactobacillus) increases significantly, whereas the number of microorganisms tradi-tionally related to intestine dysbiosis in humans and animals (families Enterobacte-riaceae and Сampylobacteriaceae) decreases. Yeast-based probiotic had a positive effect on the content of cellulosolytic microorganisms of class Clostridia; however, its effect on pathogenic microorganisms was less significant, e.g. lead to a signifi-cant increase in proportion of campylobacteria, pasteurella, and mycoplasmas.
3. Vitamins and carotenoids (μg/g) in 37-day-old Cobb 500 broiler chicken liver, as influenced by dietary cellobacterine-T probiotic and a yeast-based probiotic (Zagorskoe «EPH VNITIP vi-varium, Moscow region)
Bioactive substances
Group I (con-trol, n = 3)
Group II (n = 3)
Group III (n = 3)
Vitamin A 139.85±5.35 146.40±6.12 152.23±4.95 Vitamin E 5.71±0.12 6.15±0.17 6.97±0.09* Vitamin В2 10.96±0.42 11.76±0.18 12.32±0.32 Carotenoids 4.37±0.18 4.58±0.02 4.77±0.07 N o t e. For description of the groups with regard to administration of the probioitics see the Technique section. * Р < 0.01.
898
Both probiotics positively influenced on poultry productivity, feed digestibility, uti-lization of nutrients and the level of vitamins in liver. The maximum live weight gain, accelerated growth and higher digestibility of the feed nutrients, as well as accumulation of vitamins А, Е, В2 and carotenoids in the liver were characteristic of the chickens fed with cellobacterine-T.
R E F E R E N C E S
1. C z e r w i n s k i J., H o j b e r g O., S m u l i k o w s k a S., E n g b e r g R.M., M i e c z k o w -
s k a A. Influence of dietary peas and organic acids and probiotic supplementation on perfor-mance and caecal microbial ecology of broiler chickens. Brit. Poultry Sci., 2010, 51(2): 258-569 (doi: 10.1080/00071661003777003).
2. M a l i k N.I., P a n i n A.N. Veterinariya, 2001, 1: 27 (in Russ.). 3. S t a n l e y D., H u g h e s R.J., M o o r e R.J. Microbiota of the chicken gastrointestinal tract:
influence on health, productivity and disease. Appl. Microbiol. Biotechnol., 2014, 98: 4301-4309 (doi: 10.1007/s00253-014-5646-2).
4. Ro d r i g u e z - L e c o mp t e J.C., Y i t b a r e k A., B r a d y J., S h a r i f S., C a v a n a g h M.D., C r o w G., G u e n t e r W., H o u s e J.D., C a m e l o - J a i m e s G. The effect of microbial-nutrient interaction on the immune system of young chicks after early probiotic and organic ac-id administration. J. Anim. Sci., 2012, 90(7): 2246-2254 (doi: 10.2527/jas.2011-4184).
5. S t a n l e y D., H u g h e s R.J., M o o r e R.J. Microbiota of the chicken gastrointestinal tract: influence on health, productivity and disease. Appl. Microbiol. Biotechnol., 2014, 98: 4301-4310 (doi: 10.1007/s00253-014-5646-2).
6. R e h m a n H., V a h j e n W., A w a d W., Z e n t e k J. Indigenous bacteria and bacterial metabolic products in the gastrointestinal tract of broiler chickens. Arch. Anim. Nutr., 2007, 61: 319-335 (doi: 10.1080/17450390701556817).
7. U r d a c i M.C., B r e s s o l l i e r P., P i n c h u k I. Bacillus clausii probiotic strains: antimi-crobial and immunomodulatory activities. J. Clin. Gastroenterol., 2004, 38: 86-90.
8. M a z z a P. The use of Bacillus subtilis as an antidiarrhoeal microorganism. Boll. Chim. Farm., 1994, 133: 3-18.
9. H o n g H.A., H u a n g J.M., K h a n e j a R., H i e p L.V., U r d a c i M.C., C u t t i n g S.M. The safety of Bacillus subtilis and Bacillus indicus as food probiotics. J. Appl. Microbiol., 2008, 105: 510-520 (doi: 10.1111/j.1365-2672.2008.03773.x).
10. M o u n t z o u r i s K.C., D a l a k a E., P a l a m i d i I., P a r a s k e u a s V., D e m e y V., T h e o d o r o p o u l o s G., F e g e r o s K. Evaluation of yeast dietary supplementation in broilers challenged or not with Salmonella on growth performance, cecal microbiota composi-tion and Salmonella in ceca, cloacae and carcass skin. Poultry Sci., 2015, 94(10): 2445-2455 (doi: 10.3382/ps/pev243).
11. M ' S a d e q S.A., W u S.B., C h o c t M., F o r d e r R., S w i c k R.A. Use of yeast cell wall extract as a tool to reduce the impact of necrotic enteritis in broilers. Poultry Sci., 2015, 94(5): 898-905 (doi: 10.3382/ps/pev035).
12. D e V r i e s T.J., C h e v a u x E. Modification of the feeding behavior of dairy cows through live yeast supplementation. J. Dairy Sci., 2014, 97(10): 6499-6510 (doi: 10.3168/jds.2014-8226).
13. Z h a n g Z., C a o L., Z h o u Y., W a n g S., Z h o u L. Analysis of the duodenal microbiotas of weaned piglet fed with epidermal growth factor-expressed Saccharomyces cerevisiae. BMC Mi-crobiol., 2016, 28: 161-166 (doi: 10.1186/s12866-016-0783-7).
14. P i z z o l i t t o R.P., A r m a n d o M.R., C o m b i n a M., C a v a g l i e r i L.R., D a l c e - r o A.M., S a l v a n o M.A. Evaluation of Saccharomyces cerevisiae strains as probiotic agent with aflatoxin B₁ adsorption ability for use in poultry feedstuffs. J. Environ. Sci. Health. B, 2012, 47(10): 933-941 (doi: 10.1080/03601234.2012.706558).
15. S l i z e w s k a K., P i o t r o w s k a M. Reduction of ochratoxin A in chicken feed using probi-otic. Ann. Agric. Environ. Med., 2014, 21(4): 676-680 (doi: 10.5604/12321966).
16. A m i t - R o m a c h E., U n i Z., R e i f e n R. Multistep mechanism of probiotic bacterium, the effect on innate immune system. Mol. Nutr. Food. Res., 2010, 54: 277-284 (doi: 10.1002/mnfr.200800591).
17. P a g n i n i C., S a e e d R., B a m i a s G., A r s e n e a u K.O., P i z a r r o T.T., C o -m i n e l l i F., A m i t - R o m a c h E., U n i Z., R e i f e n R. Probiotics promote gut health through stimulation of epithelial innate immunity. PNAS USA, 2010, 107: 454-459 (doi: 10.1073/pnas.0910307107).
18. R a j p u t I.R., H u s s a i n A., L i Y.L., Z h a n g X., X u X., L o n g M.Y., Y o u D.Y., L i W.F. Saccharomyces boulardii and Bacillus subtilis B10 modulate TLRs mediated signaling to induce immunity by chicken BMDCs. J. Cell. Biochem., 2014, 115(1): 189-198 (doi: 10.1002/jcb.24650).
899
19. A l i z a d e h M., R o g i e w i c z A., M c M i l l a n E., R o d r i g u e z -L e c o m p t e J.C., P a t t e r s o n R., S l o m i n s k i B.A. Effect of yeast-derived products and distillers dried grains with solubles (DDGS) on growth performance and local innate immune response of broiler chickens challenged with Clostridium perfringens. Avian Pathol., 2016, 45(3): 334-345 (doi: 10.1080/03079457.2016.ne).
20. A l i z a d e h M., R o d r i g u e z - L e c o m p t e J.C., Y i t b a r e k A., S h a r i f S., C r o w G., S l o m i n s k i B.A. Effect of yeast-derived products on systemic innate immune response of broiler chickens following a lipopolysaccharide challenge. Poultry Sci., 2016, 95(10): 2266-2273 (doi: 10.3382/ps/pew154).
21. T a r a k a n o v B.V. Metody issledovaniya mikroflory pishchevaritel'nogo trakta sel'skokho-zyaistvennykh zhivotnykh i ptitsy [Study of microflora in alimentary canal of farm animals — methods]. Moscow, 2006 (in Russ.).
22. T i m o s h k o M.A. Mikroflora pishchevaritel'nogo trakta sel'skokhozyaistvennykh zhivotnykh [Mi-croflora of alimentary canal in farm animals]. Kishinev, 1990 (in Russ.).
23. P a r k S.H., L e e S.I., R i c k e S.C. Microbial populations in naked neck chicken ceca raised on pasture flock fed with commercial yeast cell wall prebiotics via an Illumina MiSeq Platform. PLoS ONE, 11(3): e0151944 (doi: 10.1371/journal.pone.0151944).
24. T o r o k V.A., H u g h e s R.J., M i k k e l s e n L.L. Identification and characterization of po-tential performance-related gut microbiota in broiler chickens across various feeding trials. Appl. Environ. Microbiol., 2011, 77(17): 5868-5878 (doi: 10.1128/AEM.00165-11).
25. W i t z i g M., C a m a r i n h a - S i l v a A., G r e e n - E n g e r t R., H o e l z l e K., Z e l - l e r E., S e i f e r t J., H o e l z l e L.E., R o d e h u t s c o r d M. Correction: spatial variation of the gut microbiota in broiler chickens as affected by dietary available phosphorus and as-sessed by T-RFLP analysis and 454 pyrosequencing. PLoS ONE, 2015, 10(12): e0145588 (doi: 10.1371/journal.pone.0145588).
26. d e B o e r P., R a h a o u i H., L e e r R.J., M o n t i j n R.C., v a n d e r V o s s e n J.M. Re-al-time PCR detection of Campylobacter spp.: a comparison to classic culturing and enrichment. Food Microbiol., 2015, 51: 96-100 (doi: 10.1016/j.fm.2015.05.006).
27. H o l d G.L., S c h w i e r t z A., A m i n o v R.I., B l a u t M., F l i n t H.J. Oligonucleotide probes that detect quantitatively significant groups of butyrate-producing bacteria in human fe-ces. Appl. Environ. Microbiol., 2003, 69: 4320-4324.
28. B j e r r u m L., E n g b e r g R.M., L e s e r T.D., J e n s e n B.B., F i n s t e r K., P e d e r -s e n K. Microbial community composition of the ileum and cecum of broiler chickens as re-vealed by molecular and cellular-based techniques. Poultry Sci., 2006, 85: 1151-1164.
29. Metodika provedeniya nauchnykh i proizvodstvennykh issledovanii po kormleniyu sel'skokho-zyaistvennoi ptitsy. Molekulyarno-geneticheskie metody opredeleniya mikroflory kishechnika /Pod redaktsiei V.I. Fisinina [Poultry feeding: research and practical study. Molecular methods for the analysis of gut microflora. V.I. Fisinin (ed.)]. Sergiev Posad, 2013 (in Russ.).
30. Instruktsiya po sanitarno-mikrobiologicheskomu kontrolyu tushek, myasa ptitsy, ptitseproduk-tov, yaits i yaitseproduktov na ptitsevodcheskikh i pererabatyvayushchikh predpriyatiyakh [In-struction for the sanitary-microbiological control of poultry carcasses, meat, eggs and egg prod-ucts in the poultry production and processing enterprises]. Moscow, 1990 (in Russ.).
31. M a n i a t i s T., F r i t s c h E. F., S a m b r o o k J. Molecular cloning: a laboratory manual. Cold Spring Harbor, NY, 1982.
32. G o n g J., F o r s t e r R.J., Y u H., C h a m b e r s J.R., S a b o u r P.M., W h e a t c r o f t R., C h e n S. Diversity and phylogenetic analysis of bacteria in the mucosa of chicken ceca and comparison with bacteria in the cecal lumen. FEMS Microbiol. Lett., 2002, 208: 1-7 (doi: 10.1016/S0378-1097(01)00521-3).
33. A m i t - R o m a c h E., S k l a n D., U n i Z. Microflora ecology of the chicken intestine using 16S ribosomal DNA primers. Poultry Sci., 2004, 83: 1093-1098 (doi: 10.1093/ps/83.7.1093).
34. R i n t t i l a T., A p a j a l a h t i J. Intestinal microbiota and metabolites — Implications for broiler chicken health and performance. J. Appl. Poultry Res., 2013, 22(3): 647-658 (doi: 10.3382/japr.2013-00742).
35. S a n c h e z B., A r i a s S., C h a i g n e p a i n S., D e n a y r o l l e s M., S c h m i t t e r J.M., B r e s s o l l i e r P., U r d a c i M.C. Identification of surface proteins involved in the adhesion of a probiotic Bacillus cereus strain to mucin and fibronectin B. Microbiology, 2009, 155: 1708-1716 (doi: 10.1099/mic.0.025288-0).
36. L e B l a y G., B l o t t i e r e H.M., F e r r i e r L., L e F o l i E.C., B o n n e t J.P., G a - l m i c h e C., C h e r b u t C. Shortchain fatty acids induce cytoskeletal and extracellular pro-tein modifications associated with modulation of proliferation on primary culture of rat intesti-nal smooth muscle cells. Dig. Dis. Sci., 2000, 45: 1623-1630.
37. Y a s u o k a T., T s u j i k a w a Y. F u j i y a m a , B a m b a T. Effects of the soluble fibre pectin on intestinal cell proliferation, fecal short chain fatty acid production and microbial population. Digestion, 2003, 67: 42-49.
38. N i b a A.T., B e a l J.D., K u d i A.C., B r o o k s P.H. Bacterial fermentation in the gastroin-

900
testinal tract of non-ruminants: Influence of fermented feeds and fermentable carbohydrates. Trop. Anim. Health Prod., 2009, 41: 1393-1407 (doi: 10.1007/s11250-009-9327-6).
39. P r y d e S.E., D u n c a n S.H., H o l d G.L., S t e w a r t C.S., F l i n t H.J. The microbiology of butyrate formation in the human colon. FEMS Microbiol. Lett., 2002, 217: 133-139.
40. L o u i s P., Y o u n g P., H o l t r o p G., F l i n t H.J. Diversity of human colonic butyrate-producing bacteria revealed by analysis of the butyryl-CoA:acetate CoA-transferase gene. Envi-ron. Microbiol., 2010, 12: 304-314 (doi: 10.1111/j.1462-2920.2009.02066.x).
41. B e l e n g u e r A., D u n c a n S.H., H o l t r o p G., A n d e r s o n S.E., L o b l e y G.E., F l i n t H.J. Impact of pH on lactate formation and utilization by human fecal microbial com-munities. Appl. Environ. Microbiol., 2007, 73: 6526-6533.
42. H a r m s e n H.J.M., R a a n g s G.C., H e T., D e g e n e r J.E., W e l l i n g G.W. Extensive set of 16S rRNAbased probes for detection of bacteria in human feces. Appl. Environ. Microbiol., 2002, 68: 2982-2990.
43. S w i q t k i e w i c z S., A r c z e w s k a - W l o s e k , J o z e t i a k D. Immunomodulatory effi-cacy of yeast cell products in poultry: a current review. World’s Poultry Science Journal, 2014, 70(1): 57-68.
44. B i r g i t K. Hefen in der Nutztierfutterung. Feed Mag., 2015, 98(1-2): 17-21. 45. F a n e l l i A., A g a z z i A., A l b o r a l i G.L., P i l o t t o A., P i l o t t o A., B o n t e m -
p o V., D e l l ’ O r t o V., D e m e y V., C a p u t o J.M., S a v o i n i G. Prevalence reduction of pathogens in poultry fed with Saccharomyces cerevisiae. Biotechnol. Agron. Soc. Environ., 2015, 19(1): 3-10.
903
AGRICULTURAL BIOLOGY, ISSN 2412-0324 (English ed. Online)
2016, V. 51, ¹ 6, pp. 903-911 (SEL’SKOKHOZYAISTVENNAYA BIOLOGIYA) ISSN 0131-6397 (Russian ed. Print)
ISSN 2313-4836 (Russian ed. Online)
Nanoparticles of metals: bioeffects UDC 636.52/.58:636.087.72: 546.56-022.532 doi: 10.15389/agrobiology.2016.6.903rus
doi: 10.15389/agrobiology.2016.6.903eng
MORPHOLOGICAL AND BIOCHEMICAL BLOOD PARAMETERS IN BROILERS AT CORRECTION WITH DIETARY COPPER SALTS AND
NANOPARTICLES
Е.А. SIZOVA1, 2, V.L. KOROLEV1, Sh.A. MAKAEV1, E.P. MIROSHNIKOVA2, V.A. SHAKHOV3
1All-Russian Research Institute of Beef Cattle Breeding, Federal Agency of Scientific Organizations, 29, ul. 9 Yan- varya, Orenburg, 460000 Russia, e-mail [email protected], [email protected]; 2Orenburg State University, 13, prosp. Pobedy, Orenburg, 460018 Russia; 3Orenburg State Agrarian University, 18, ul. Chelyuskintsev, Orenburg, 460014 Russia (ORCID: Sizova Е.А. orcid.org/0000-0002-5125-5981) Acknowledgements: Chemical analysis was performed in the Laboratory of Agroecology of Nanomaterials and Test Center of All-Russian Research Institute of Beef Cattle Breeding (accreditation certificate RA. RU.21PF59 of 12/02/15). Сhemi-cal analysis was performed in the laboratory of ANO Center for Biotic Medicine, Moscow (accreditation certificate GSEN.RU.TSAO.311, registration number in the State Register ROSS RU. 0001.513118) Supported by Russian Scienсe Foundation (project ¹ 14-36-00023) Received July 11, 2016
A b s t r a c t
Diets of modern crosses and breeds of farm animals require mandatory correction of mineral nutrition. Ionic forms commonly used for correction are characterized by low bioavailability, prooxi-dant effect, and high toxicity in vivo. That is why low-toxic sources of essential chemical elements are of particular interest, including nanocrystalline metals. We firstly assessed the efficient of na-nosized copper on the model of broiler chickens. A comparative study of productive and biological effects of copper nanoparticles (CuNPs) and сopper sulfate was carried out on Smena 7 chickens of 14-42 days of age using different administration methods. Hematologic and biochemical parameters and elemental composition of tissues were assessed. We revealed an increase in red blood cells and hemoglobin and decrease of platelets at the highest doses of Cu NPs administrated orally or intra-muscularly. The biochemical blood parameters assessed indicated an enhancement of plastic process-es in the body and, as a consequence, an increase in the growth rate under Cu NPs administration. The difference of the total protein compared to the control (33.6 %, p < 0.05) was the highest when Cu NPs injected at a dose of 2 mg/kg which increased the supply of protein synthesis. The albumin level was higher in 28-day old chicks injected with Cu NPs (2 and 0.2 mg/kg). A replacement of dietary CuSO4 with dietary Cu NPs led to an increase in the growth rate. When Cu NPs fed, the found biochemical parameters indicated strengthening of energy and synthetic processes in the body, and therefore, an increase in the poultry growth. At 1.7 mg/kg of dietary Cu NPs the gained weight was 13.5-23.8 % (p < 0.01 to p < 0.001) more as compared to the control. Dietary Cu NPs at 0.7 mg/kg was not enough to highly stimulate the poultry growth and resulted in the weight gain which was lower than in the poultry fed with Cu NPs at 1.7 mg/kg but higher (by 8.5-18.4 %, p < 0.01 to p < 0.01) as compared to the poultry not fed with Cu NPs. Thus, the promoting effect depends on the form of copper source. The Cu NPs effectiveness under enteral administration at 1.7 mg/kg or intra-muscular double injections at 0.2 mg/kg was superior to that of dietary copper sulfate.
Keywords: nanoparticles, cooper, broiler chicks, growth intensity, chemical elements, blood, biochemical and morphological parameters
Diets in the modern animal and poultry farming are subject to mandato-ry adjustment of mineral composition, which is determined by an increase in ge-netic potential [1], the specific properties of biogeochemical provinces [2, 3], and impact of regional components on availability of mineral components [4-6], etc. Generally, ionic forms act as the sources of essential chemical elements. They are characterized in vivo by low bioavailability, pro-oxidant effect and high toxicity [7]. In particular, this explains controversial attitude to metallotherapy
904
and special interest to low-toxic sources of essential chemical elements, which may include nanocrystalline metal forms [8-10].
Unique properties of nanomaterials may ensure the possibility of their wide use in medicine and biology [11, 12] due to low toxicity and high bioavail-ability at a size of about 100 nm [13]. Unique properties of nanomaterials have objectively determined the emergence of new nanoparticle-based sources of mi-croelements, with feasibility of application in feeding animals and poultry demonstrated in several studies [14, 15].
Here we first assessed effectiveness of various copper forms (CuSO4 and nanocrystalline compiund) in poultry farming, and have revealed the tendency towards increase in erythropoeisis, albumin synthesis in liver and growth intensi-ty due to Cu nanoparticles.
Our objective was a comparative evaluation of cooper nanoparticle and mineral salt product with regard to bioavailability and effect on growth, devel-opment, hematological and biochemical parameters in broiler chickens.
Technique. Сu nanoparticles (Cu NPs) were synthesized by high-temperature condensation method (Migen-3, Institute for Energy Problems of Chemical Physics, RAS, Moscow) in accordance with the description [16]. The material attestation of the preparations included electronic scanning and trans-mission microscopy (JSM 7401F and JEM-2000FX, JEOL, Japan). The X-ray phase analysis was conducted using a diffractometer DRON-7 (Burevestnik, Russia). The size (d) of obtained nanoparticles is 103±2 nm. Nanoparticle lyso-zoles in saline solution were prepared in an ultrasonic disperser UZDN-2T (NPP Akadempribor, Russia) (35 kHz, 300/450 W, 10 A), with UV sterilization.
The studies were performed on Smena 7 broiler chickens (Orenburg State University vivarium). The keeping conditions and test procedures met the recommendations provided for by the national regulations (Order of the USSR Ministry of Health No. 755 d/d August 12, 1977) and The Guide for Care and Use of Laboratory Animals (National Academy Press, Washington, D.C., 1996). The day-old chickens (n = 270) were assigned individual tags and placed in the same conditions. At the age of 2 weeks, based on individual daily weighing and food consumption data, three control and five test groups were formed (n = 30 in each group). Chickens received a complete compound feed recommended by the All-Russian Scientific Research and Technology Poultry Institute (VNITIP) [17, 18]. Copper content in starting basic diet (BD) amounted to 11.79 mg/kg, in growth BD — to 9.51 mg/kg, including that due to introduction of copper sulphate (1.7 mg/kg) [18]. Basic diet only (BD, К1), BD without CuSO4∕5H2O (К2) and BD with double intramuscular injections of saline solution at the age of 14 and 28 days (К3) were the controls. The difference between the groups was as follows: group I — BD without CuSO4∕5H2O plus Сu nanoparticles fed at a dose of 1.7 mg/kg, group II — BD without CuSO4∕5H2O plus Сu nanoparticles fed at a dose of 0.7 mg/kg (oral consumption of nanoparticles); group III — BD without CuSO4∕5H2O plus Сu nanoparticles (2 mg/kg of live weight) injected into femoral muscles, group IV — BD without CuSO4∕5H2O plus Сu nanopar-ticles (0.2 mg/kg) injected into femoral muscles, group V — BD without CuSO4∕5H2O plus Сu nanoparticles (0.02 mg/kg of live weight) injected into femoral muscles (double parenteral input at the age of 14 and 28 days). All chickens received distilled water. From day 14 to day 28 the BD formulation con-tained 320 g/kg wheat, 10 g/kg barley, 184 g/kg sunflower cake, 200 g/kg soy bean meal, 40 g/kg fish flour, 60 g/kg vegetable oil, 163 g/kg corn grain, 10 g/kg wheat bran, 10 g/kg limestone, and 3 g/kg common salt. From day 28 to day 42 the BD contained 182 g/kg wheat, 50 g/kg barley, 180 g/kg sunflower cake, 75 g/kg soy bean meal, 45 g/kg fish flour, 45 g/kg vegetable oil, 400 g/kg corn
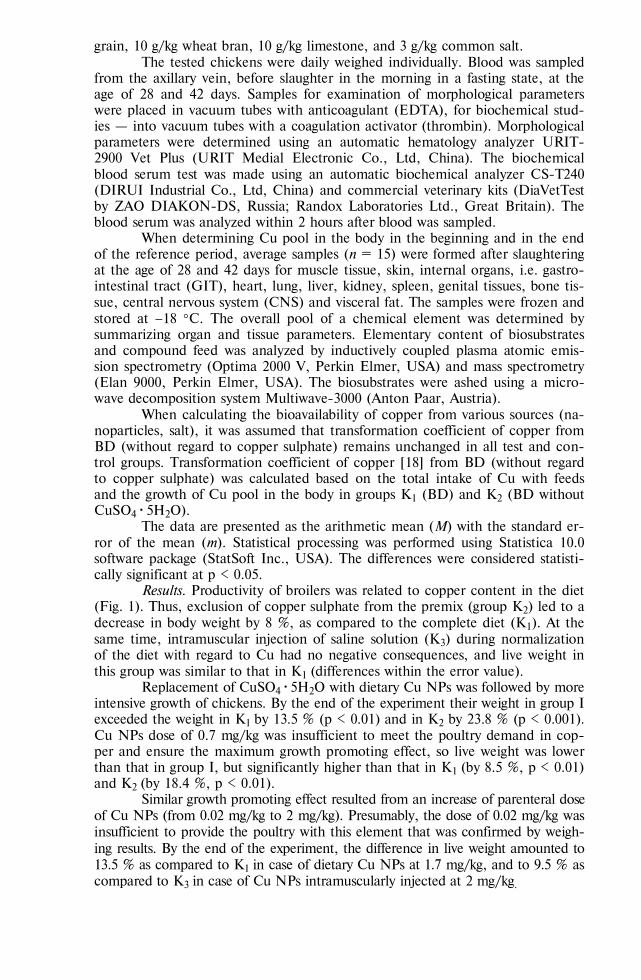
905
grain, 10 g/kg wheat bran, 10 g/kg limestone, and 3 g/kg common salt. The tested chickens were daily weighed individually. Blood was sampled
from the axillary vein, before slaughter in the morning in a fasting state, at the age of 28 and 42 days. Samples for examination of morphological parameters were placed in vacuum tubes with anticoagulant (EDTA), for biochemical stud-ies — into vacuum tubes with a coagulation activator (thrombin). Morphological parameters were determined using an automatic hematology analyzer URIT-2900 Vet Plus (URIT Medial Electronic Co., Ltd, China). The biochemical blood serum test was made using an automatic biochemical analyzer СS-T240 (DIRUI Industrial Co., Ltd, China) and commercial veterinary kits (DiaVetTest by ZAO DIAKON-DS, Russia; Randox Laboratories Ltd., Great Britain). The blood serum was analyzed within 2 hours after blood was sampled.
When determining Cu pool in the body in the beginning and in the end of the reference period, average samples (n = 15) were formed after slaughtering at the age of 28 and 42 days for muscle tissue, skin, internal organs, i.e. gastro-intestinal tract (GIT), heart, lung, liver, kidney, spleen, genital tissues, bone tis-sue, central nervous system (CNS) and visceral fat. The samples were frozen and stored at 18 С. The overall pool of a chemical element was determined by summarizing organ and tissue parameters. Elementary content of biosubstrates and compound feed was analyzed by inductively coupled plasma atomic emis-sion spectrometry (Optima 2000 V, Perkin Elmer, USA) and mass spectrometry (Elan 9000, Perkin Elmer, USA). The biosubstrates were ashed using a micro-wave decomposition system Multiwave-3000 (Anton Paar, Аustria).
When calculating the bioavailability of copper from various sources (na-noparticles, salt), it was assumed that transformation coefficient of copper from BD (without regard to copper sulphate) remains unchanged in all test and con-trol groups. Transformation coefficient of copper [18] from BD (without regard to copper sulphate) was calculated based on the total intake of Cu with feeds and the growth of Cu pool in the body in groups К1 (BD) and К2 (BD without CuSO4∕5H2O).
The data are presented as the arithmetic mean (M) with the standard er-ror of the mean (m). Statistical processing was performed using Statistica 10.0 software package (StatSoft Inc., USA). The differences were considered statisti-cally significant at p < 0.05.
Results. Productivity of broilers was related to copper content in the diet (Fig. 1). Thus, exclusion of copper sulphate from the premix (group К2) led to a decrease in body weight by 8 %, as compared to the complete diet (К1). At the same time, intramuscular injection of saline solution (K3) during normalization of the diet with regard to Cu had no negative consequences, and live weight in this group was similar to that in K1 (differences within the error value).
Replacement of CuSO4∕5H2O with dietary Cu NPs was followed by more intensive growth of chickens. By the end of the experiment their weight in group I exceeded the weight in K1 by 13.5 % (p < 0.01) and in К2 by 23.8 % (p < 0.001). Cu NPs dose of 0.7 mg/kg was insufficient to meet the poultry demand in cop-per and ensure the maximum growth promoting effect, so live weight was lower than that in group I, but significantly higher than that in K1 (by 8.5 %, p < 0.01) and K2 (by 18.4 %, p < 0.01).
Similar growth promoting effect resulted from an increase of parenteral dose of Cu NPs (from 0.02 mg/kg to 2 mg/kg). Presumably, the dose of 0.02 mg/kg was insufficient to provide the poultry with this element that was confirmed by weigh-ing results. By the end of the experiment, the difference in live weight amounted to 13.5 % as compared to К1 in case of dietary Cu NPs at 1.7 mg/kg, and to 9.5 % as compared to К3 in case of Cu NPs intramuscularly injected at 2 mg/kg.
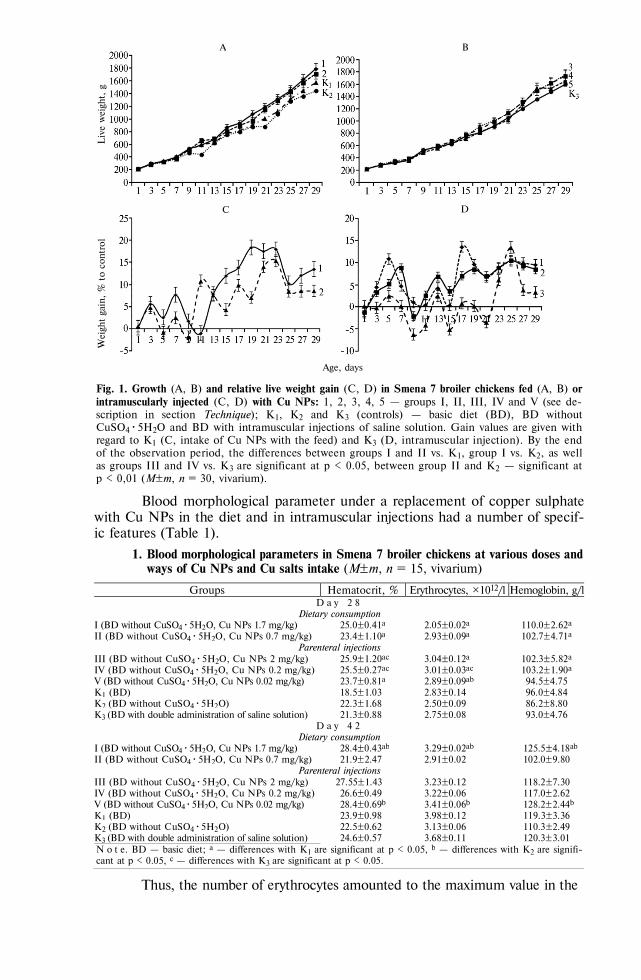
906
Fig. 1. Growth (A, B) and relative live weight gain (C, D) in Smena 7 broiler chickens fed (A, B) or intramuscularly injected (C, D) with Cu NPs: 1, 2, 3, 4, 5 — groups I, II, III, IV and V (see de-scription in section Technique); К1, К2 and К3 (controls) — basic diet (BD), BD without CuSO4∕5H2O and BD with intramuscular injections of saline solution. Gain values are given with regard to К1 (C, intake of Сu NPs with the feed) and К3 (D, intramuscular injection). By the end of the observation period, the differences between groups I and II vs. К1, group I vs. К2, as well as groups III and IV vs. К3 are significant at p < 0.05, between group II and К2 — significant at p < 0,01 (M±m, n = 30, vivarium).
Blood morphological parameter under a replacement of copper sulphate with Cu NPs in the diet and in intramuscular injections had a number of specif-ic features (Table 1).
1. Blood morphological parameters in Smena 7 broiler chickens at various doses and ways of Cu NPs and Cu salts intake (M±m, n = 15, vivarium)
Groups Hematocrit, % Erythrocytes, ½1012/l Hemoglobin, g/l D a y 2 8
Dietary consumption I (BD without CuSO4∕5H2O, Сu NPs 1.7 mg/kg) 25.0±0.41a 2.05±0.02a 110.0±2.62a II (BD without CuSO4∕5H2O, Сu NPs 0.7 mg/kg) 23.4±1.10a 2.93±0.09a 102.7±4.71a
Parenteral injections III (BD without CuSO4∕5H2O, Сu NPs 2 mg/kg) 25.9±1.20ac 3.04±0.12a 102.3±5.82a IV (BD without CuSO4∕5H2O, Сu NPs 0.2 mg/kg) 25.5±0.27ac 3.01±0.03ac 103.2±1.90a V (BD without CuSO4∕5H2O, Сu NPs 0.02 mg/kg) 23.7±0.81a 2.89±0.09ab 94.5±4.75 K1 (BD) 18.5±1.03 2.83±0.14 96.0±4.84 K2 (BD without CuSO4∕5H2О) 22.3±1.68 2.50±0.09 86.2±8.80 K3 (BD with double administration of saline solution) 21.3±0.88 2.75±0.08 93.0±4.76
D a y 4 2 Dietary consumption
I (BD without CuSO4∕5H2O, Сu NPs 1.7 mg/kg) 28.4±0.43ab 3.29±0.02ab 125.5±4.18ab II (BD without CuSO4∕5H2O, Сu NPs 0.7 mg/kg) 21.9±2.47 2.91±0.02 102.0±9.80
Parenteral injections III (BD without CuSO4∕5H2O, Сu NPs 2 mg/kg) 27.55±1.43 3.23±0.12 118.2±7.30 IV (BD without CuSO4∕5H2O, Сu NPs 0.2 mg/kg) 26.6±0.49 3.22±0.06 117.0±2.62 V (BD without CuSO4∕5H2O, Сu NPs 0.02 mg/kg) 28.4±0.69b 3.41±0.06b 128.2±2.44b K1 (BD) 23.9±0.98 3.98±0.12 119.3±3.36 K2 (BD without CuSO4∕5H2О) 22.5±0.62 3.13±0.06 110.3±2.49 K3 (BD with double administration of saline solution) 24.6±0.57 3.68±0.11 120.3±3.01 N o t e. BD — basic diet; a — differences with K1 are significant at p < 0.05, b — differences with K2 are signifi-cant at p < 0.05, с — differences with K3 are significant at p < 0.05.
Thus, the number of erythrocytes amounted to the maximum value in the
Wei
ght ga
in, %
to
contr
ol
Liv
e w
eigh
t, g
Age, days
A B
C D
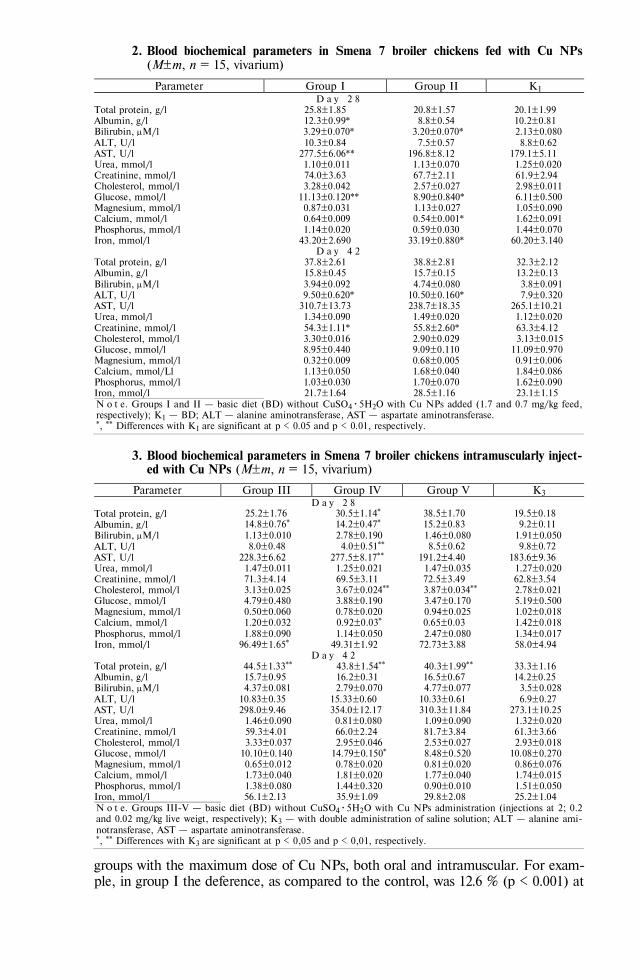
907
2. Blood biochemical parameters in Smena 7 broiler chickens fed with Cu NPs (M±m, n = 15, vivarium)
Parameter Group I Group II K1 D a y 2 8
Total protein, g/l 25.8±1.85 20.8±1.57 20.1±1.99 Albumin, g/l 12.3±0.99* 8.8±0.54 10.2±0.81 Bilirubin, M/l 3.29±0.070* 3.20±0.070* 2.13±0.080 ALT, U/l 10.3±0.84 7.5±0.57 8.8±0.62 AST, U/l 277.5±6.06** 196.8±8.12 179.1±5.11 Urea, mmol/l 1.10±0.011 1.13±0.070 1.25±0.020 Creatinine, mmol/l 74.0±3.63 67.7±2.11 61.9±2.94 Cholesterol, mmol/l 3.28±0.042 2.57±0.027 2.98±0.011 Glucose, mmol/l 11.13±0.120** 8.90±0.840* 6.11±0.500 Magnesium, mmol/l 0.87±0.031 1.13±0.027 1.05±0.090 Calcium, mmol/l 0.64±0.009 0.54±0.001* 1.62±0.091 Phosphorus, mmol/l 1.14±0.020 0.59±0.030 1.44±0.070 Iron, mmol/l 43.20±2.690 33.19±0.880* 60.20±3.140
D a y 4 2 Total protein, g/l 37.8±2.61 38.8±2.81 32.3±2.12 Albumin, g/l 15.8±0.45 15.7±0.15 13.2±0.13 Bilirubin, M/l 3.94±0.092 4.74±0.080 3.8±0.091 ALT, U/l 9.50±0.620* 10.50±0.160* 7.9±0.320 AST, U/l 310.7±13.73 238.7±18.35 265.1±10.21 Urea, mmol/l 1.34±0.090 1.49±0.020 1.12±0.020 Creatinine, mmol/l 54.3±1.11* 55.8±2.60* 63.3±4.12 Cholesterol, mmol/l 3.30±0.016 2.90±0.029 3.13±0.015 Glucose, mmol/l 8.95±0.440 9.09±0.110 11.09±0.970 Magnesium, mmol/l 0.32±0.009 0.68±0.005 0.91±0.006 Calcium, mmol/Ll 1.13±0.050 1.68±0.040 1.84±0.086 Phosphorus, mmol/l 1.03±0.030 1.70±0.070 1.62±0.090 Iron, mmol/l 21.7±1.64 28.5±1.16 23.1±1.15 N o t e. Groups I and II — basic diet (BD) without CuSO4∕5H2O with Сu NPs added (1.7 and 0.7 mg/kg feed, respectively); K1 — BD; ALT — alanine aminotransferase, AST — aspartate aminotransferase. *, ** Differences with K1 are significant at p < 0.05 and p < 0.01, respectively.
3. Blood biochemical parameters in Smena 7 broiler chickens intramuscularly inject-ed with Cu NPs (M±m, n = 15, vivarium)
Parameter Group III Group IV Group V К3 D a y 2 8
Total protein, g/l 25.2±1.76 30.5±1.14* 38.5±1.70 19.5±0.18 Albumin, g/l 14.8±0.76* 14.2±0.47* 15.2±0.83 9.2±0.11 Bilirubin, M/l 1.13±0.010 2.78±0.190 1.46±0.080 1.91±0.050 ALT, U/l 8.0±0.48 4.0±0.51** 8.5±0.62 9.8±0.72 AST, U/l 228.3±6.62 277.5±8.17** 191.2±4.40 183.6±9.36 Urea, mmol/l 1.47±0.011 1.25±0.021 1.47±0.035 1.27±0.020 Creatinine, mmol/l 71.3±4.14 69.5±3.11 72.5±3.49 62.8±3.54 Cholesterol, mmol/l 3.13±0.025 3.67±0.024** 3.87±0.034** 2.78±0.021 Glucose, mmol/l 4.79±0.480 3.88±0.190 3.47±0.170 5.19±0.500 Magnesium, mmol/l 0.50±0.060 0.78±0.020 0.94±0.025 1.02±0.018 Calcium, mmol/l 1.20±0.032 0.92±0.03* 0.65±0.03 1.42±0.018 Phosphorus, mmol/l 1.88±0.090 1.14±0.050 2.47±0.080 1.34±0.017 Iron, mmol/l 96.49±1.65* 49.31±1.92 72.73±3.88 58.0±4.94
D a y 4 2 Total protein, g/l 44.5±1.33** 43.8±1.54** 40.3±1.99** 33.3±1.16 Albumin, g/l 15.7±0.95 16.2±0.31 16.5±0.67 14.2±0.25 Bilirubin, M/l 4.37±0.081 2.79±0.070 4.77±0.077 3.5±0.028 ALT, U/l 10.83±0.35 15.33±0.60 10.33±0.61 6.9±0.27 AST, U/l 298.0±9.46 354.0±12.17 310.3±11.84 273.1±10.25 Urea, mmol/l 1.46±0.090 0.81±0.080 1.09±0.090 1.32±0.020 Creatinine, mmol/l 59.3±4.01 66.0±2.24 81.7±3.84 61.3±3.66 Cholesterol, mmol/l 3.33±0.037 2.95±0.046 2.53±0.027 2.93±0.018 Glucose, mmol/l 10.10±0.140 14.79±0.150* 8.48±0.520 10.08±0.270 Magnesium, mmol/l 0.65±0.012 0.78±0.020 0.81±0.020 0.86±0.076 Calcium, mmol/l 1.73±0.040 1.81±0.020 1.77±0.040 1.74±0.015 Phosphorus, mmol/l 1.38±0.080 1.44±0.320 0.90±0.010 1.51±0.050 Iron, mmol/l 56.1±2.13 35.9±1.09 29.8±2.08 25.2±1.04 N o t e. Groups III-V — basic diet (BD) without CuSO4∕5H2O with Сu NPs administration (injections at 2; 0.2 and 0.02 mg/kg live weigt, respectively); K3 — with double administration of saline solution; ALT — alanine ami-notransferase, AST — aspartate aminotransferase. *, ** Differences with K3 are significant at p < 0,05 and p < 0,01, respectively.
groups with the maximum dose of Cu NPs, both oral and intramuscular. For exam-ple, in group I the deference, as compared to the control, was 12.6 % (p < 0.001) at
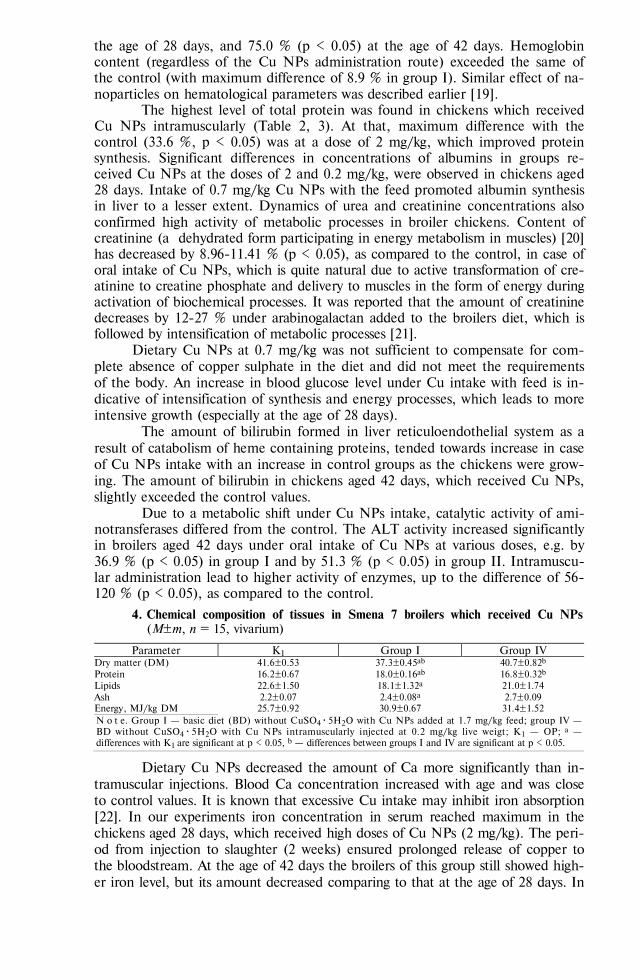
908
the age of 28 days, and 75.0 % (p < 0.05) at the age of 42 days. Hemoglobin content (regardless of the Cu NPs administration route) exceeded the same of the control (with maximum difference of 8.9 % in group I). Similar effect of na-noparticles on hematological parameters was described earlier [19].
The highest level of total protein was found in chickens which received Cu NPs intramuscularly (Table 2, 3). At that, maximum difference with the control (33.6 %, p < 0.05) was at a dose of 2 mg/kg, which improved protein synthesis. Significant differences in concentrations of albumins in groups re-ceived Cu NPs at the doses of 2 and 0.2 mg/kg, were observed in chickens aged 28 days. Intake of 0.7 mg/kg Cu NPs with the feed promoted albumin synthesis in liver to a lesser extent. Dynamics of urea and creatinine concentrations also confirmed high activity of metabolic processes in broiler chickens. Content of creatinine (a dehydrated form participating in energy metabolism in muscles) [20] has decreased by 8.96-11.41 % (p < 0.05), as compared to the control, in case of oral intake of Cu NPs, which is quite natural due to active transformation of cre-atinine to creatine phosphate and delivery to muscles in the form of energy during activation of biochemical processes. It was reported that the amount of creatinine decreases by 12-27 % under arabinogalactan added to the broilers diet, which is followed by intensification of metabolic processes [21].
Dietary Cu NPs at 0.7 mg/kg was not sufficient to compensate for com-plete absence of copper sulphate in the diet and did not meet the requirements of the body. An increase in blood glucose level under Cu intake with feed is in-dicative of intensification of synthesis and energy processes, which leads to more intensive growth (especially at the age of 28 days).
The amount of bilirubin formed in liver reticuloendothelial system as a result of catabolism of heme containing proteins, tended towards increase in case of Cu NPs intake with an increase in control groups as the chickens were grow-ing. The amount of bilirubin in chickens aged 42 days, which received Cu NPs, slightly exceeded the control values.
Due to a metabolic shift under Cu NPs intake, catalytic activity of ami-notransferases differed from the control. The ALT activity increased significantly in broilers aged 42 days under oral intake of Cu NPs at various doses, e.g. by 36.9 % (p < 0.05) in group I and by 51.3 % (p < 0.05) in group II. Intramuscu-lar administration lead to higher activity of enzymes, up to the difference of 56-120 % (p < 0.05), as compared to the control.
4. Chemical composition of tissues in Smena 7 broilers which received Cu NPs (M±m, n = 15, vivarium)
Parameter K1 Group I Group IV Dry matter (DM) 41.6±0.53 37.3±0.45аb 40.7±0.82b
Protein 16.2±0.67 18.0±0.16аb 16.8±0.32b
Lipids 22.6±1.50 18.1±1.32а 21.0±1.74 Ash 2.2±0.07 2.4±0.08а 2.7±0.09 Energy, MJ/kg DM 25.7±0.92 30.9±0.67 31.4±1.52 N o t e. Group I — basic diet (BD) without CuSO4∕5H2O with Сu NPs added at 1.7 mg/kg feed; group IV — BD without CuSO4∕5H2O with Сu NPs intramuscularly injected at 0.2 mg/kg live weigt; K1 — ОР; а — differences with K1 are significant at p < 0.05, b — differences between groups I and IV are significant at p < 0.05.
Dietary Cu NPs decreased the amount of Ca more significantly than in-tramuscular injections. Blood Ca concentration increased with age and was close to control values. It is known that excessive Cu intake may inhibit iron absorption [22]. In our experiments iron concentration in serum reached maximum in the chickens aged 28 days, which received high doses of Cu NPs (2 mg/kg). The peri-od from injection to slaughter (2 weeks) ensured prolonged release of copper to the bloodstream. At the age of 42 days the broilers of this group still showed high-er iron level, but its amount decreased comparing to that at the age of 28 days. In
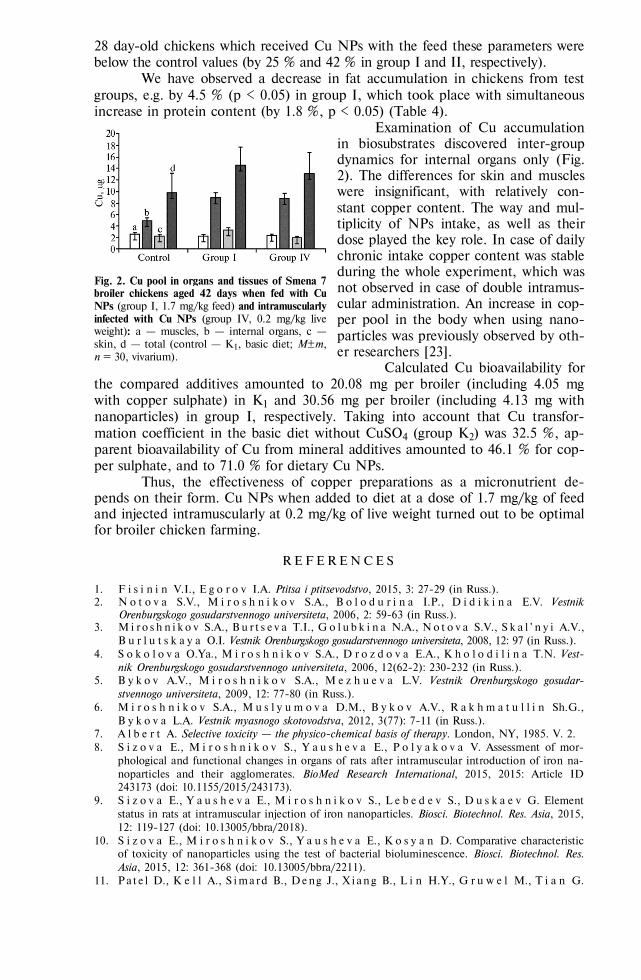
909
28 day-old chickens which received Cu NPs with the feed these parameters were below the control values (by 25 % and 42 % in group I and II, respectively).
We have observed a decrease in fat accumulation in chickens from test groups, e.g. by 4.5 % (p < 0.05) in group I, which took place with simultaneous increase in protein content (by 1.8 %, p < 0.05) (Table 4).
Examination of Cu accumulation in biosubstrates discovered inter-group dynamics for internal organs only (Fig. 2). The differences for skin and muscles were insignificant, with relatively con-stant copper content. The way and mul-tiplicity of NPs intake, as well as their dose played the key role. In case of daily chronic intake copper content was stable during the whole experiment, which was not observed in case of double intramus-cular administration. An increase in cop-per pool in the body when using nano-particles was previously observed by oth-er researchers [23].
Calculated Cu bioavailability for the compared additives amounted to 20.08 mg per broiler (including 4.05 mg with copper sulphate) in K1 and 30.56 mg per broiler (including 4.13 mg with nanoparticles) in group I, respectively. Taking into account that Cu transfor-mation coefficient in the basic diet without CuSO4 (group K2) was 32.5 %, ap-parent bioavailability of Cu from mineral additives amounted to 46.1 % for cop-per sulphate, and to 71.0 % for dietary Cu NPs.
Thus, the effectiveness of copper preparations as a micronutrient de-pends on their form. Cu NPs when added to diet at a dose of 1.7 mg/kg of feed and injected intramuscularly at 0.2 mg/kg of live weight turned out to be optimal for broiler chicken farming.
R E F E R E N C E S
1. F i s i n i n V.I., E g o r o v I.A. Ptitsa i ptitsevodstvo, 2015, 3: 27-29 (in Russ.). 2. N o t o v a S.V., M i r o s h n i k o v S.A., B o l o d u r i n a I.P., D i d i k i n a E.V. Vestnik
Orenburgskogo gosudarstvennogo universiteta, 2006, 2: 59-63 (in Russ.). 3. M i r o s h n i k o v S.A., B u r t s e v a T.I., G o l u b k i n a N.A., N o t o v a S.V., S k a l ' n y i A.V.,
B u r l u t s k a y a O.I. Vestnik Orenburgskogo gosudarstvennogo universiteta, 2008, 12: 97 (in Russ.). 4. S o k o l o v a O.Ya., M i r o s h n i k o v S.A., D r o z d o v a E.A., K h o l o d i l i n a T.N. Vest-
nik Orenburgskogo gosudarstvennogo universiteta, 2006, 12(62-2): 230-232 (in Russ.). 5. B y k o v A.V., M i r o s h n i k o v S.A., M e z h u e v a L.V. Vestnik Orenburgskogo gosudar-
stvennogo universiteta, 2009, 12: 77-80 (in Russ.). 6. M i r o s h n i k o v S.A., M u s l y u m o v a D.M., B y k o v A.V., R a k h m a t u l l i n Sh.G.,
B y k o v a L.A. Vestnik myasnogo skotovodstva, 2012, 3(77): 7-11 (in Russ.). 7. A l b e r t A. Selective toxicity — the physico-chemical basis of therapy. London, NY, 1985. V. 2. 8. S i z o v a E., M i r o s h n i k o v S., Y a u s h e v a E., P o l y a k o v a V. Assessment of mor-
phological and functional changes in organs of rats after intramuscular introduction of iron na-noparticles and their agglomerates. BioMed Research International, 2015, 2015: Article ID 243173 (doi: 10.1155/2015/243173).
9. S i z o v a E., Y a u s h e v a E., M i r o s h n i k o v S., L e b e d e v S., D u s k a e v G. Element status in rats at intramuscular injection of iron nanoparticles. Biosci. Biotechnol. Res. Asia, 2015, 12: 119-127 (doi: 10.13005/bbra/2018).
10. S i z o v a E., M i r o s h n i k o v S., Y a u s h e v a E., K o s y a n D. Comparative characteristic of toxicity of nanoparticles using the test of bacterial bioluminescence. Biosci. Biotechnol. Res. Asia, 2015, 12: 361-368 (doi: 10.13005/bbra/2211).
11. Pa t e l D., K e l l A., S imard B., Deng J., X i an g B., L i n H.Y., G r u w e l M., T i a n G.
Fig. 2. Сu pool in organs and tissues of Smena 7 broiler chickens aged 42 days when fed with Сu NPs (group I, 1.7 mg/kg feed) and intramuscularly infected with Сu NPs (group IV, 0.2 mg/kg live weight): a — muscles, b — internal organs, c — skin, d — total (control — К1, basic diet; M±m, n = 30, vivarium).
910
Cu2+-labeled, SPION loaded porous silica nanoparticles for cell labeling and multifunctional im-aging probes. Biomaterials, 2010, 31(10): 2866-2873 (doi: 10.1016/j.biomaterials.2009.12.025).
12. R u p a r e l i a J.P., C h a t t e r j e e A.K., D u t t a g u p t a S.P., M u k h e r j i S. Strain speci-ficity in antimicrobial activity of silver and copper nanoparticles. Acta Biomaterialia, 2008, 4: 707-716 (doi: 10.1016/j.actbio.2007.11.006).
13. B o g o s l o v s k a y a O.A., S i z o v a E.A., P o l y a k o v a V.S., M i r o s h n i k o v S.A., L e i p u n s k i i I.O., O l ' k h o v s k a y a I.P., G l u s h c h e n k o N.N. Vestnik Orenburgskogo gosudarstvennogo universiteta, 2009, 2: 124-127 (in Russ.).
14. N i k o n o v I.N., F o l m a n i s Yu.G., F o l m a n i s G.E., K o v a l e n k o L.V., L a p - t e v G.Yu., E g o r o v I.A., F i s i n i n V.I., T a n a n a e v I.G. Doklady akademii nauk, 2011, 440(4): 565-569 (in Russ.).
15. M i r o s h n i k o v a E.P., A r i n z h a n o v A., K i l y a k o v a Y., S i z o v a E.A., M i r o s h -n i k o v S.A. Antagonism metal alloy nanoparticles of iron and cobalt: impact on trace element metabolism in carp and chicken. Hum. Vet. Med., 2015, 7(4): 253-259.
16. Z h i g a c h A.N., L e i p u n s k i i I.O., K u s k o v M.L., S t o e n k o N.I., S t o r o - z h e v V.B. Pribory i tekhnika eksperimenta, 2000, 6: 122-127 (in Russ.).
17. F i s i n i n V.I., E go ro v I.A., Le nko v a T.N., Oko l e lo v a T.M., I g n a t o v a G.V., S h e v y ak o v A.N., E go ro v a T.V., And r i a no v a E.N., E g o r o v a T.A., P a n i n I.G., G r e c h i s h n i k o v V.V., P a n i n A.I., S e r g a c h e v P.A., R y a s n o i P.V., A f a n a s ' e v V.A. Metodicheskie ukazaniya po optimizatsii retseptov kombikormov dlya sel'skokhozyaistvennoi ptitsy [Guidelines for the optimization of animal feed recipes for poultry. VNITIP]. Moscow, 2009 (in Russ.).
18. F i s i n i n V.I., E g o r o v I.A., O k o l e l o v a T.M. Nauchnye osnovy kormleniya sel'skokho-zyaistvennoi ptitsy [Scientific basis for poultry feeding]. Sergiev Posad, 2008 (in Russ.).
19. V i s h n y a k o v A.I., U s h a k o v A.S., L e b e d e v S.V. Vestnik myasnogo skotovodstva, 2011, 2(54): 96-102 (in Russ.).
20. H o f m a n n E. Dinamicheskaya biokhimiya [Dynamic biochemistry=Dynamische Biochemie]. Moscow, 1971 (in Russ.).
21. T o r s h k o v A.A. Fundamental'nye issledovaniya, 2011, 9(3): 583-587 (in Russ.). 22. S k a l ' n y i A.V., R u d a k o v I.A. Bioelementy v meditsine [Bioelements in medicine]. Mos-
cow, 2004 (in Russ.). 23. C u i l l e l M., C h e v a l l e t M., C h a r b o n n i e r P., F a u q u a n t C., P i g n o t -
P a i n t r a n d I., A r n a u d J., C a s s i o D., M i c h a u d - S o r e t I., M i n t z E. Interfer-ence of CuO nanoparticles with metal homeostasis in hepatocytes under sub-toxic conditions. Nanoscale, 2014, 6(3): 1707-1715 (doi: 10.1039/c3nr05041f).
912
AGRICULTURAL BIOLOGY, ISSN 2412-0324 (English ed. Online)
2016, V. 51, ¹ 6, pp. 912-920 (SEL’SKOKHOZYAISTVENNAYA BIOLOGIYA) ISSN 0131-6397 (Russian ed. Print)
ISSN 2313-4836 (Russian ed. Online) UDC 636.52/.58:636.087.7:[546.72-022.532+577.112.3 doi: 10.15389/agrobiology.2016.6.912rus
doi: 10.15389/agrobiology.2016.6.912eng
NANOPARTICLES IN COMBINATION WITH AMINO ACIDS CHANGE PRODUCTIVE AND IMMUNOLOGICAL INDICATORS OF BROILER
CHICKEN
E.V. YAUSHEVA1, S.A. MIROSHNIKOV1, D.B. KOSYAN1, 2, Е.А. SIZOVA1, 2
1All-Russian Research Institute of Beef Cattle Breeding, Federal Agency of Scientific Organizations, 29, ul. 9 Yan- varya, Orenburg, 460000 Russia, e-mail [email protected], [email protected]; 2Orenburg State University, 13, prosp. Pobedy, Orenburg, 460018 Russia (ORCID: Sizova Е.А. orcid.org/0000-0002-5125-5981) Acknowledgements: We thank Dr N.N. Glushchenko (Institute of Energy Problems of Chemical Physics, RAS, Moscow) for kindly providing the Fe nanoparticles used in the study. Hematological studies were performed using standard techniques in the Laboratory of Agroecology of Nanomateri-als and Test Center of All-Russian Research Institute of Beef Cattle Breeding (accreditation certificate RA. RU.21PF59 of 12/02/15) Supported by Russian Scienсe Foundation (project ¹ 14-16-00060) Received September 1, 2016
A b s t r a c t
The prospects of using metal nanoparticles to stimulate productivity of farm animals are widely discussed. However, nano-sized materials exhibit various negative properties, such as pro-oxidant effects, and can provoke apoptosis and kidney damage. A possible approach is the use of ul-trafine materials in combination with agents leveling adverse effects of nanoparticles. For the first time we studied the prospects of joint use of iron and arginine nanoparticles, the mechanism of their interaction and influence on the productivity of poultry and demonstrated that their simultaneous application promote live weight gain. We formed 6 groups (n = 30) of 11-day old broilers of the cross Smena 8. The poultry was injected twice (after 2 week intervals) with iron nanoparticles and fed either with dietary arginine (the amino acid which is known to influence metabolism and im-mune response and considered as conditionally essential for inflammatory and oxidative stress), or the mixture of arginine, lysine and methionine. Our experiments showed that the joint use of iron nanoparticles and arginine increased the weight gain up to 9.2 % as compared to the control, and moreover, the iron nanoparticles together with a mixture of amino acids provided an increase up to 20 %. Withal, the nanoparticles and amino acids when applied separately resulted in lower weight gain, and at the end of the experiment the body weight of broilers fed with dietary arginine (group II) and those injected with iron nanoparticles (group III) increased by 6.1 and 5.9 % (P 0.05), respectively. Intramuscular administration of iron nanoparticles (the poultry groups III, IV and VI) promoted the immune response that was manifested in enhanced level of leukocytes — by 8.12; 10.50 and 3.88 % (P 0.05), respectively, on the day 1, and by 7.3; 8.19 and 4.00 % (P 0.05), respectively, in a week. The study of NO-metabolites showed an increased level in blood and liver (by 3-4 %) only in groups III, IV and VI. Singly injected iron nanoparticles (group III) changed metabolism of arginine and increased its level by 3.83 % (P 0.05). Thus the joint use of iron na-noparticles and the complex of arginine with other amino acids is most likely to be helpful in the poultry meat production.
Keywords: nanoparticles cooper, broiler chicks, growth intensity, chemical elements, bio-chemical and morphological parameters of blood
The search for substances with growth-stimulating action is one of the current trends in agricultural biology. A number of studies indicate the prospects of using metal nanoparticles as preparations to increase productivity of farm an-imals [1, 2]. Essential metal-based nanoparticles have been reported to signifi-cantly exceed the analogues in the form of mineral salts in their bioavailability [3], are characterized by less pronounced toxic effect (4), with which the prom-ise of their use as sources of microelements is associated [5].
However, nanoparticles have a number of disadvantages. They stimulate
913
the production of active forms of oxygen [6, 7], apoptosis [8], and structural and functional reorganization of tissues [9], cause kidney damage [10], affect the ele-mental status of organs and tissues [11]. Nevertheless, a set of measures for lev-eling the negative effects of micronutrient nanoparticles can make the practical application of such ultradisperse substances possible.
Previously, we have demonstrated that the intake of iron nanoparticles by animals is associated with an increase in the arginine level in the liver [12]. The mechanism of this is unclear yet. Arginine is known to exhibit various met-abolic and immunological effects and is considered conditionally essential for in-flammatory and oxidative stress [13, 14]. At the same time, arginine is one of the factors involved in the regulation of animal growth [15]. Mechanisms for triggering arginine synthesis are closely related to the proliferation of white blood cells and NO synthase activation. It is noteworthy that iron homeostasis is closely related to the homeostasis of NO metabolites [16]. The use of argi-nine to reduce the negative effects of zinc nanoparticles intake has been re-ported by L.M. Faddah et al. [17].
In this paper, we are for the first time demonstrating that inclusion of arginine in the diet in combination with intramuscular injections of iron nano-particles increases productivity of agricultural poultry more efficiently than each of these techniques used individually.
Our purpose was to study the prospects for the joint use of the prepara-tions of iron nanoparticles with arginine and other amino acids, the mechanism of their interaction and the impact on productivity in poultry.
Technique. Iron nanoparticles (NP) of d = 80±5 nm were used (the par-ticles are a core of crystalline iron with an oxide shell of Fe3O4 on the surface). Preparations of nanoparticles were obtained by high-temperature condensation at the MiGen assembly (Institute for Energy Problems of Chemical Physics, RAS, Moscow). Material certification of preparations included electronic scanning and translucent microscopy using a JSM 7401F and JEM-2000FX (JEOL, Japan), X-ray diffraction analysis using a diffractometer DRON-7 (NPP Burevestnik, Russia), atomic force microscopy using a multi-microscope SMM-2000 (OJSC PROTON-MIET, Russia). For injection, iron nanoparticles were prepared by mixing with saline solution, after which they were subjected to UV sterilization and processed for 30 minutes using ultrasonic disperser UZDN-2T (NPP Akadempribor, Russia) (35 kHz, 300-450 W, amplitude of oscillation of 10 μm).
Dietary methionine (JSC Volzhsky Orgsintez, Russia); lysine monochlo-rohydrate (Ha-ngzhou Greensky Biological Tech Co., Ltd., China), and arginine hydrochloride (Tianjin Tiyanyan Pharmaceutical Co., Ltd., China) were used as amino acid preparations.
Experiments were performed in the vivarium (Orenburg State University) with broiler chicken cross Smena 8. The keeping conditions and experimental procedures met the instructions and recommendations provided for by the Russian regulations (Order of the USSR Ministry of Health No. 755 of August 12, 1977) and The Guide for Care and Use of Laboratory Animals (National Academy Press, Washington, D.C., 1996). All efforts were taken to minimize the suffering of animals and to reduce the number of samples used. The 11-day old chickens (n = 168) were selected for the experiment and divided into six groups by analo-gous pair method (n = 28). At the age of 15 and 29 days, birds from groups III, IV, and VI were injected with Fe nanoparticle (NP) lysozoles (2 mg/kg live weight) intramuscularly [18]. Starting from the age of 15 days, daily arginine at a dose of 7 g/kg of feed [19] was added to the basic diet (BD) in groups II and IV. Arginine (7 g/kg), lysine (6 g/kg), and methionine (2 g/kg) were adminis-tered in group V and VI. Control poultry (group I) received BD. Diets were
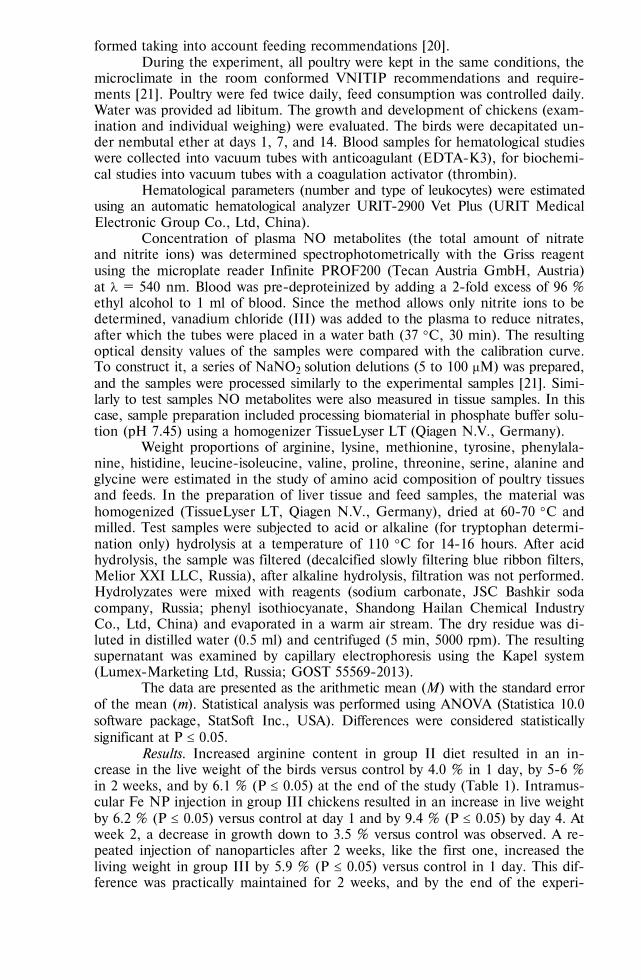
914
formed taking into account feeding recommendations [20]. During the experiment, all poultry were kept in the same conditions, the
microclimate in the room conformed VNITIP recommendations and require-ments [21]. Poultry were fed twice daily, feed consumption was controlled daily. Water was provided ad libitum. The growth and development of chickens (exam-ination and individual weighing) were evaluated. The birds were decapitated un-der nembutal ether at days 1, 7, and 14. Blood samples for hematological studies were collected into vacuum tubes with anticoagulant (EDTA-K3), for biochemi-cal studies into vacuum tubes with a coagulation activator (thrombin).
Hematological parameters (number and type of leukocytes) were estimated using an automatic hematological analyzer URIT-2900 Vet Plus (URIT Medical Electronic Group Co., Ltd, China).
Concentration of plasma NO metabolites (the total amount of nitrate and nitrite ions) was determined spectrophotometrically with the Griss reagent using the microplate reader Infinite PROF200 (Tecan Austria GmbH, Аustria) at = 540 nm. Blood was pre-deproteinized by adding a 2-fold excess of 96 % ethyl alcohol to 1 ml of blood. Since the method allows only nitrite ions to be determined, vanadium chloride (III) was added to the plasma to reduce nitrates, after which the tubes were placed in a water bath (37 С, 30 min). The resulting optical density values of the samples were compared with the calibration curve. To construct it, a series of NaNO2 solution delutions (5 tо 100 μМ) was prepared, and the samples were processed similarly to the experimental samples [21]. Simi-larly to test samples NO metabolites were also measured in tissue samples. In this case, sample preparation included processing biomaterial in phosphate buffer solu-tion (рН 7.45) using a homogenizer TissueLyser LT (Qiagen N.V., Germany).
Weight proportions of arginine, lysine, methionine, tyrosine, phenylala-nine, histidine, leucine-isoleucine, valine, proline, threonine, serine, alanine and glycine were estimated in the study of amino acid composition of poultry tissues and feeds. In the preparation of liver tissue and feed samples, the material was homogenized (TissueLyser LT, Qiagen N.V., Germany), dried at 60-70 С and milled. Test samples were subjected to acid or alkaline (for tryptophan determi-nation only) hydrolysis at a temperature of 110 С for 14-16 hours. After acid hydrolysis, the sample was filtered (decalcified slowly filtering blue ribbon filters, Melior XXI LLC, Russia), after alkaline hydrolysis, filtration was not performed. Hydrolyzates were mixed with reagents (sodium carbonate, JSC Bashkir soda company, Russia; phenyl isothiocyanate, Shandong Hailan Chemical Industry Co., Ltd, China) and evaporated in a warm air stream. The dry residue was di-luted in distilled water (0.5 ml) and centrifuged (5 min, 5000 rpm). The resulting supernatant was examined by capillary electrophoresis using the Kapel system (Lumex-Marketing Ltd, Russia; GOST 55569-2013).
The data are presented as the arithmetic mean (M) with the standard error of the mean (m). Statistical analysis was performed using ANOVA (Statistica 10.0 software package, StatSoft Inc., USA). Differences were considered statistically significant at Р 0.05.
Results. Increased arginine content in group II diet resulted in an in-crease in the live weight of the birds versus control by 4.0 % in 1 day, by 5-6 % in 2 weeks, and by 6.1 % (Р 0.05) at the end of the study (Table 1). Intramus-cular Fe NP injection in group III chickens resulted in an increase in live weight by 6.2 % (P 0.05) versus control at day 1 and by 9.4 % (P 0.05) by day 4. At week 2, a decrease in growth down to 3.5 % versus control was observed. A re-peated injection of nanoparticles after 2 weeks, like the first one, increased the living weight in group III by 5.9 % (P 0.05) versus control in 1 day. This dif-ference was practically maintained for 2 weeks, and by the end of the experi-
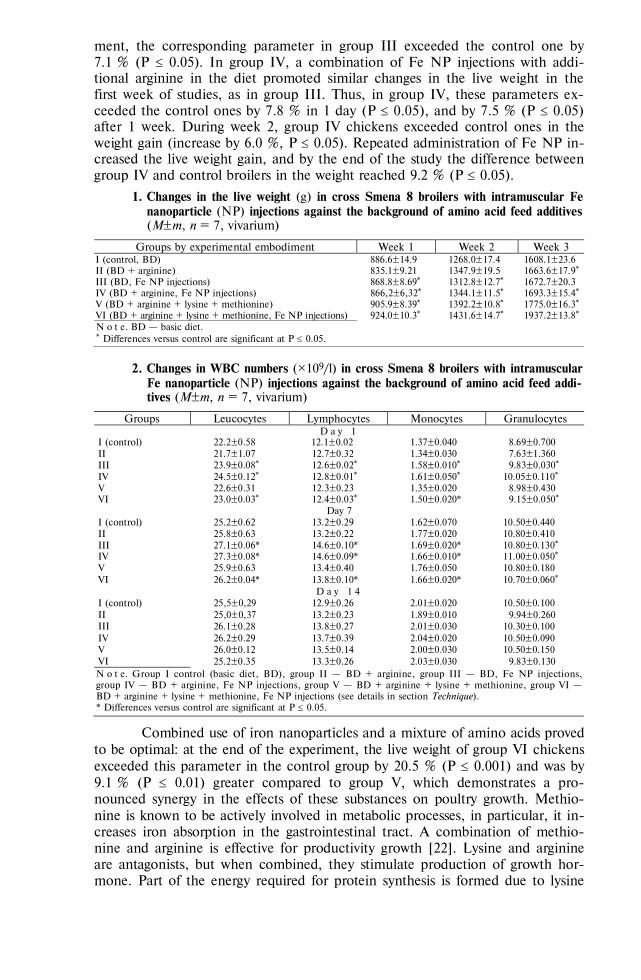
915
ment, the corresponding parameter in group III exceeded the control one by 7.1 % (P 0.05). In group IV, a combination of Fe NP injections with addi-tional arginine in the diet promoted similar changes in the live weight in the first week of studies, as in group III. Thus, in group IV, these parameters ex-ceeded the control ones by 7.8 % in 1 day (Р 0.05), and by 7.5 % (Р 0.05) after 1 week. During week 2, group IV chickens exceeded control ones in the weight gain (increase by 6.0 %, P 0.05). Repeated administration of Fe NP in-creased the live weight gain, and by the end of the study the difference between group IV and control broilers in the weight reached 9.2 % (P 0.05).
1. Changes in the live weight (g) in cross Smena 8 broilers with intramuscular Fe nanoparticle (NP) injections against the background of amino acid feed additives (M±m, n = 7, vivarium)
Groups by experimental embodiment Week 1 Week 2 Week 3 I (control, BD) 886.6±14.9 1268.0±17.4 1608.1±23.6 II (BD + arginine) 835.1±9.21 1347.9±19.5 1663.6±17.9* III (BD, Fe NP injections) 868.8±8.69* 1312.8±12.7* 1672.7±20.3 IV (BD + arginine, Fe NP injections) 866,2±6,32* 1344.1±11.5* 1693.3±15.4* V (BD + аrginine + lysine + methionine) 905.9±8.39* 1392.2±10.8* 1775.0±16.3* VI (BD + аrginine + lysine + methionine, Fe NP injections) 924.0±10.3* 1431.6±14.7* 1937.2±13.8* N o t e. BD — basic diet. * Differences versus control are significant at Р 0.05.
2. Changes in WBC numbers (½109/l) in cross Smena 8 broilers with intramuscular Fe nanoparticle (NP) injections against the background of amino acid feed addi-tives (M±m, n = 7, vivarium)
Groups Leucocytes Lymphocytes Monocytes Granulocytes D a y 1
I (control) 22.2±0.58 12.1±0.02 1.37±0.040 8.69±0.700 II 21.7±1.07 12.7±0.32 1.34±0.030 7.63±1.360 III 23.9±0.08* 12.6±0.02* 1.58±0.010* 9.83±0.030* IV 24.5±0.12* 12.8±0.01* 1.61±0.050* 10.05±0.110* V 22.6±0.31 12.3±0.23 1.35±0.020 8.98±0.430 VI 23.0±0.03* 12.4±0.03* 1.50±0.020* 9.15±0.050*
Day 7 I (control) 25.2±0.62 13.2±0.29 1.62±0.070 10.50±0.440 II 25.8±0.63 13.2±0.22 1.77±0.020 10.80±0.410 III 27.1±0.06* 14.6±0.10* 1.69±0.020* 10.80±0.130* IV 27.3±0.08* 14.6±0.09* 1.66±0.010* 11.00±0.050* V 25.9±0.63 13.4±0.40 1.76±0.050 10.80±0.180 VI 26.2±0.04* 13.8±0.10* 1.66±0.020* 10.70±0.060*
D a y 1 4 I (control) 25,5±0,29 12.9±0.26 2.01±0.020 10.50±0.100 II 25,0±0,37 13.2±0.23 1.89±0.010 9.94±0.260 III 26.1±0.28 13.8±0.27 2.01±0.030 10.30±0.100 IV 26.2±0.29 13.7±0.39 2.04±0.020 10.50±0.090 V 26.0±0.12 13.5±0.14 2.00±0.030 10.50±0.150 VI 25.2±0.35 13.3±0.26 2.03±0.030 9.83±0.130 N o t е. Group I control (basic diet, BD), group II — BD + arginine, group III — BD, Fe NP injections, group IV — BD + arginine, Fe NP injections, group V — BD + аrginine + lysine + methionine, group VI — BD + аrginine + lysine + methionine, Fe NP injections (see details in section Technique). * Differences versus control are significant at Р 0.05.
Combined use of iron nanoparticles and a mixture of amino acids proved to be optimal: at the end of the experiment, the live weight of group VI chickens exceeded this parameter in the control group by 20.5 % (Р 0.001) and was by 9.1 % (Р 0.01) greater compared to group V, which demonstrates a pro-nounced synergy in the effects of these substances on poultry growth. Methio-nine is known to be actively involved in metabolic processes, in particular, it in-creases iron absorption in the gastrointestinal tract. A combination of methio-nine and arginine is effective for productivity growth [22]. Lysine and arginine are antagonists, but when combined, they stimulate production of growth hor-mone. Part of the energy required for protein synthesis is formed due to lysine
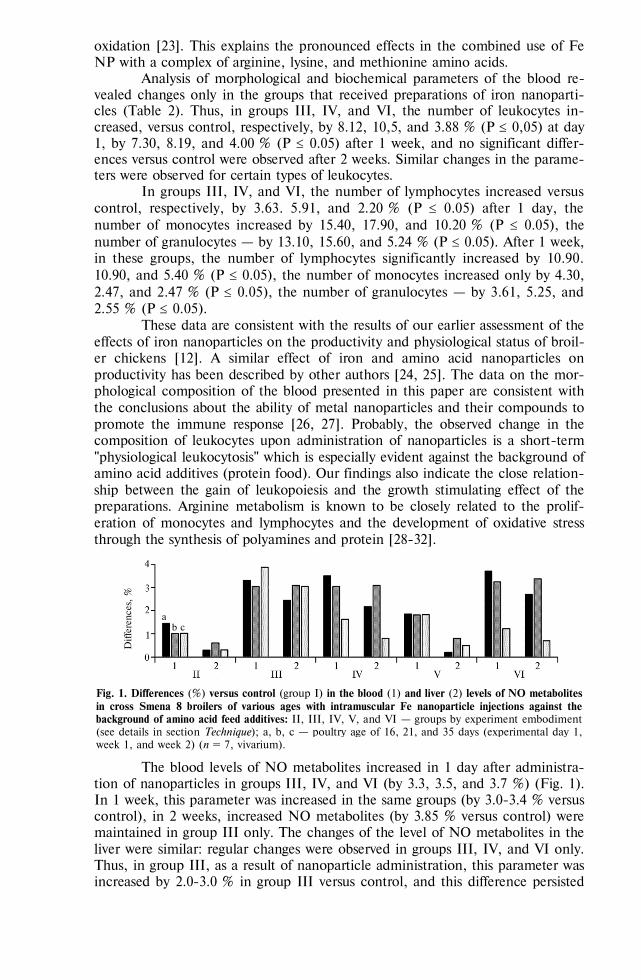
916
oxidation [23]. This explains the pronounced effects in the combined use of Fe NP with a complex of arginine, lysine, and methionine amino acids.
Analysis of morphological and biochemical parameters of the blood re-vealed changes only in the groups that received preparations of iron nanoparti-cles (Table 2). Thus, in groups III, IV, and VI, the number of leukocytes in-creased, versus control, respectively, by 8.12, 10,5, and 3.88 % (Р 0,05) at day 1, by 7.30, 8.19, and 4.00 % (P 0.05) after 1 week, and no significant differ-ences versus control were observed after 2 weeks. Similar changes in the parame-ters were observed for certain types of leukocytes.
In groups III, IV, and VI, the number of lymphocytes increased versus control, respectively, by 3.63. 5.91, and 2.20 % (P 0.05) after 1 day, the number of monocytes increased by 15.40, 17.90, and 10.20 % (Р 0.05), the number of granulocytes — by 13.10, 15.60, and 5.24 % (P 0.05). After 1 week, in these groups, the number of lymphocytes significantly increased by 10.90. 10.90, and 5.40 % (P 0.05), the number of monocytes increased only by 4.30, 2.47, and 2.47 % (Р 0.05), the number of granulocytes — by 3.61, 5.25, and 2.55 % (P 0.05).
These data are consistent with the results of our earlier assessment of the effects of iron nanoparticles on the productivity and physiological status of broil-er chickens [12]. A similar effect of iron and amino acid nanoparticles on productivity has been described by other authors [24, 25]. The data on the mor-phological composition of the blood presented in this paper are consistent with the conclusions about the ability of metal nanoparticles and their compounds to promote the immune response [26, 27]. Probably, the observed change in the composition of leukocytes upon administration of nanoparticles is a short-term "physiological leukocytosis" which is especially evident against the background of amino acid additives (protein food). Our findings also indicate the close relation-ship between the gain of leukopoiesis and the growth stimulating effect of the preparations. Arginine metabolism is known to be closely related to the prolif-eration of monocytes and lymphocytes and the development of oxidative stress through the synthesis of polyamines and protein [28-32].
Fig. 1. Differences (%) versus control (group I) in the blood (1) and liver (2) levels of NO metabolites in cross Smena 8 broilers of various ages with intramuscular Fe nanoparticle injections against the background of amino acid feed additives: II, III, IV, V, and VI — groups by experiment embodiment (see details in section Technique); а, b, c — poultry age of 16, 21, and 35 days (experimental day 1, week 1, and week 2) (n = 7, vivarium).
The blood levels of NO metabolites increased in 1 day after administra-tion of nanoparticles in groups III, IV, and VI (by 3.3, 3.5, and 3.7 %) (Fig. 1). In 1 week, this parameter was increased in the same groups (by 3.0-3.4 % versus control), in 2 weeks, increased NO metabolites (by 3.85 % versus control) were maintained in group III only. The changes of the level of NO metabolites in the liver were similar: regular changes were observed in groups III, IV, and VI only. Thus, in group III, as a result of nanoparticle administration, this parameter was increased by 2.0-3.0 % in group III versus control, and this difference persisted
Diffe
rence
s, %
a b c
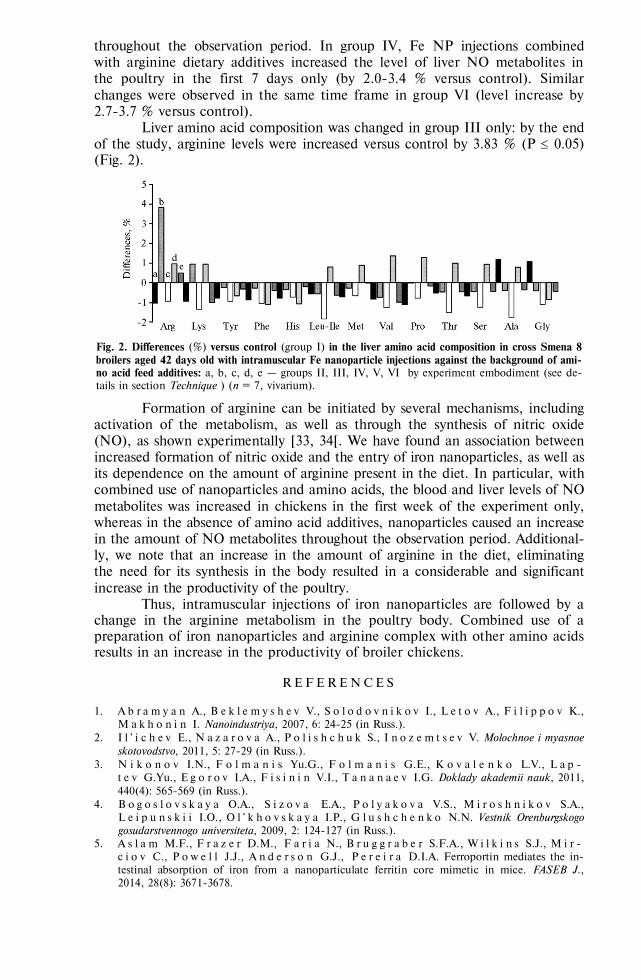
917
throughout the observation period. In group IV, Fe NP injections combined with arginine dietary additives increased the level of liver NO metabolites in the poultry in the first 7 days only (by 2.0-3.4 % versus control). Similar changes were observed in the same time frame in group VI (level increase by 2.7-3.7 % versus control).
Liver amino acid composition was changed in group III only: by the end of the study, arginine levels were increased versus control by 3.83 % (P 0.05) (Fig. 2).
Fig. 2. Differences (%) versus control (group I) in the liver amino acid composition in cross Smena 8 broilers aged 42 days old with intramuscular Fe nanoparticle injections against the background of ami-no acid feed additives: а, b, c, d, e — groups II, III, IV, V, VI by experiment embodiment (see de-tails in section Technique ) (n = 7, vivarium).
Formation of arginine can be initiated by several mechanisms, including activation of the metabolism, as well as through the synthesis of nitric oxide (NO), as shown experimentally [33, 34[. We have found an association between increased formation of nitric oxide and the entry of iron nanoparticles, as well as its dependence on the amount of arginine present in the diet. In particular, with combined use of nanoparticles and amino acids, the blood and liver levels of NO metabolites was increased in chickens in the first week of the experiment only, whereas in the absence of amino acid additives, nanoparticles caused an increase in the amount of NO metabolites throughout the observation period. Additional-ly, we note that an increase in the amount of arginine in the diet, eliminating the need for its synthesis in the body resulted in a considerable and significant increase in the productivity of the poultry.
Thus, intramuscular injections of iron nanoparticles are followed by a change in the arginine metabolism in the poultry body. Combined use of a preparation of iron nanoparticles and arginine complex with other amino acids results in an increase in the productivity of broiler chickens.
R E F E R E N C E S
1. A b r a m y a n A., B e k l e m y s h e v V., S o l o d o v n i k o v I., L e t o v A., F i l i p p o v K., M a k h o n i n I. Nanoindustriya, 2007, 6: 24-25 (in Russ.).
2. I l ' i c h e v E., N a z a r o v a A., P o l i s h c h u k S., I n o z e m t s e v V. Molochnoe i myasnoe skotovodstvo, 2011, 5: 27-29 (in Russ.).
3. N i k o n o v I.N., F o l m a n i s Yu.G., F o l m a n i s G.E., K o v a l e n k o L.V., L a p -t e v G.Yu., E g o r o v I.A., F i s i n i n V.I., T a n a n a e v I.G. Doklady akademii nauk, 2011, 440(4): 565-569 (in Russ.).
4. B o g o s l o v s k a y a O.A., S i z o v a E.A., P o l y a k o v a V.S., M i r o s h n i k o v S.A., L e i p u n s k i i I.O., O l ' k h o v s k a y a I.P., G l u s h c h e n k o N.N. Vestnik Orenburgskogo gosudarstvennogo universiteta, 2009, 2: 124-127 (in Russ.).
5. A s l a m M.F., F r a z e r D.M., F a r i a N., B r u g g r a b e r S.F.A., W i l k i n s S.J., M i r -c i o v C., P o w e l l J.J., A n d e r s o n G.J., P e r e i r a D.I.A. Ferroportin mediates the in-testinal absorption of iron from a nanoparticulate ferritin core mimetic in mice. FASEB J., 2014, 28(8): 3671-3678.
918
6. L i N., S i o u t a s C., C h o A., M i s r a C., S e m p f J., W a n g M., O b e r l e y T., F r o i n e s J., N e l A. Ultrafine particulate pollutants induce oxidative stress and mitochron-drial damage. Environmental Health Perspectives, 2003, 111: 455-460.
7. M ø l l e r P., J a c o b s e n N.R., F o l k m a n n J.K., D a n i e l s e n P.H., M i k k e l - s e n L., H e m m i n g s e n J.G., V e s t e r d a l L.K., F o r c h h a m m e r L., W a l l i n H., L o f t S. Role of oxidative damage in toxicity of particulates. Free Radical Research, 2010, 44(1): 1-46 (doi: 10.3109/10715760903300691).
8. S i z o v a E.A., M i r o s h n i k o v S.A., P o l y a k o v a V.S., L e b e d e v S.V., G l u s h -c h e n k o N.N. Morfologiya, 2013, 144(4): 47-52 (in Russ.).
9. P o l y a k o v a V.S., S i z o v a E.A., M i r o s h n i k o v S.A., N o t o v a S.V., Z a v a l e e v a S.M. Morfologiya, 2015, 148(6): 54-58 (in Russ.).
10. B e r u B e K., B a l h a r r y D., S e x t o n K., K o s h y L., J o n e s T. Combustion-derived nanoparticles: mechanisms of pulmonary toxicity. Clinical and Experimental Pharmacology and Physiology, 2007, 34(10): 1044-1050 (doi: 10.1111/j.1440-1681.2007.04733.x).
11. S i z o v a E., G l u s h c h e n k o N., M i r o s h n i k o v S., S k a l n y A. Influence of Cu10x copper nanoparticles intramuscular injection on mineral composition of rat spleen. Journal of Trace Elements in Medicine and Biology, 2011, 25: 84-89.
12. S i z o v a E., Y a u s h e v a E., K o s y a n D., M i r o s h n i k o v S. Growth enhancement by intramuscular injection of elemental iron nano- and microparticles. Modern Applied Science, 2015, 9(10): 17-26 (doi: 10.5539/mas.v9n10p17).
13. H u a n g C.C., T s a i S.C., L i n W.T. Potential ergogenic effects of L-arginine against oxida-tive and inflammatory stress induced by acute exercise in aging rats. Exp. Gerontol., 2008, 43(6): 571-577 (doi: 10.1016/j.exger.2008.03.002).
14. M o s t a f a v i - P o u r Z., Z a l F., M o n a b a t i A., V e s s a l M. Protective effects of a combination of Quercetin and vitamin E against cyclosporine A-induced oxidative stress and hepato-toxicity in rats. Hepatol. Res., 2008, 38(4): 385-392 (doi: 10.1111/j.1872-034X.2007.00273.x).
15. F l y n n N.E., M e i n i n g e r C.J., H a y n e s T.E., W u G. The metabolic basis of arginine nutrition and pharmacotherapy. Biomed. Pharmacother., 2002, 56: 427-438.
16. N a i r z M., S c h l e i c h e r U., S c h r o l l A., S o n n w e b e r T., T h e u r l I., L u d -w i c z e k S., T a l a s z H., B r a n d a c h e r G., M o s e r P.L., M u c k e n t h a l e r M.U., F a n g F.C., B o g d a n C., W e i s s G.J. Nitric oxide-mediated regulation of ferroportin-1 controls macrophage iron homeostasis and immune function in Salmonella infection. J. Exp. Med., 2013, 210(5): 855-873 (doi: 10.1084/jem.20121946).
17. F a d d a h L.M., A b d e l B a k y N.A., A l - R a s h e e d N.M., A l - R a s h e e d N.M., F a t a n i A.J., A t t e y a M. Role of quercetin and arginine in ameliorating nano zinc oxide-induced nephrotoxicity in rats. BMC Complementary and Alternative Medicine, 2012, 12: 1062 (doi: 10.1186/1472-6882-12-60).
18. S i p a i l o v a O.Yu., L e b e d e v S.V., S i z o v a E.A. Voprosy biologicheskoi, meditsinskoi i farmatsevticheskoi khimii, 2011, 9(8): 43-46 (in Russ.).
19. S a k o m u r a N.K., E k m a y R.D., M e i S.J., C o o n C.N. Lysine, methionine, phenylala-nine, arginine, valine, isoleucine, leucine, and threonine maintenance requirements of broiler breeders. Poultry Sci., 2015, 94(11): 2715-2721 (doi: 10.3382/ps/pev287).
20. F i s i n i n V.I., E g o r o v I.A., L e n k o v a T.N., O k o l e l o v a T.M., I g n a t o v a G.V., S h e v y a k o v A.N. et al. Metodicheskie ukazaniya po optimizatsii retseptov kombikormov dlya sel'skokhozyaistvennoi ptitsy [Guidelines for the optimization of animal feed recipes for poultry. VNITIP]. Moscow, 2009 (in Russ.).
21. M a z h i t o v a M.V. Sovremennye problemy nauki i obrazovaniya, 2011, 3: 2-9 (in Russ.). 22. C h a m r u s p o l l e r t M., P e s t i M., B a k a l l i R.I. Dietary interrelationships among argi-
nine, methionine, and lysine in young broiler chicks. Brit. J. Nutr., 2002, 88(6): 655-660. 23. E k m a y R.D., D e B e e r M., M e i S.J., M a n a n g i M., C o o n C.N. Amino acid re-
quirements of broiler breeders at peak production for egg mass, body weight, and fertility. Poul-try Sci., 2013, 92(4): 992-1006 (doi: 10.3382/ps.2012-02554).
24. S z a b ó J., A n d r á s o f s z k y E., T u b o l y T., B e r s é n y i A., W e i s z A., H e t é - n y i N., H u l l á r I. Effect of arginine or glutamine supplementation on production, organ weights, interferon gamma, interleukin 6 and antibody titre of broilers. Acta Vet. Hung., 2014, 62(3): 348-361.
25. B a u t i s t a - O r t e g a J., C o r t e s - C u e v a s A., E l l i s E.A., R u i z - F e r i a C.A. Sup-plemental L-arginine and vitamins E and C preserve xanthine oxidase activity in the lung of broiler chickens grown under hypobaric hypoxia. Poultry Sci., 2014, 93(4): 979-988.
26. M o h a m m a d i V., G h a z a n f a r i S., M o h a m m a d i - S a n g c h e s h m e h A., N a z -a r a n M.H. Comparative effects of zinc-nano complexes, zinc-sulphate and zinc-methionine on performance in broiler chickens. Brit. Poultry Sci., 2015, 56(4): 486-493.
27. D ž a r o v á A., D u b n i č k o v á M., Z á v i š o v á V., K o n e r a c k á M., K o p č a n - s k ý P., G o j z e w s k i H., T i m k o M. The influence of magnetite nanoparticles on human. Journal of Life Sciences, 2010, 4(5): 37-43.
919
28. Y u S.S., L a u C.M., T h o m a s S.N., J e r o m e W.G., M a r o n D.J., D i c k e r s o n J.H., H u b b e l l J.A., G i o r g i o T.D. Size- and charge-dependent non-specific uptake of PEGylat-ed nanoparticles by macrophages. Int. J. Nanomedicine, 2012, 7: 799-813.
29. S u c h n e r U., H e y l a n d D.K., P e t e r K. Immune-modulatory actions of arginine in the critically ill. Brit. J. Nutr., 2002, 87: 121-132.
30. H u a n g C.C., L i n T.J., L u Y.F., C h e n C.C., H u a n g C.Y., L i n W.T. Protective ef-fects of L-arginine supplementation against exhaustive exercise-induced oxidative stress in young rat tissues. Chinese J. Physiol., 2009, 52(5): 306-315.
31. L i n W.T., Y a n g S.C., C h e n K.T., H u a n g C.C., L e e N.Y. Protective effects of L-arginine on pulmonary oxidative stress and antioxidant defenses during exhaustive exercise in rats. Acta Pharmacologica Sinica, 2005, 26(8): 992-999 (doi: 10.1111/j.1745-7254.2005.00155.x).
32. A h a m e d M., A k h t a r M.J., S i d d i q u i M.A., A h m a d J., M u s a r r a t J., A l -K h e d h a i r y A.A., A l S a l h i M.S., A l r o k a y a n S.A. Oxidative stress mediated apoptosis induced by nickel ferrite nanoparticles in cultured A549 cells. Toxicology, 2011, 283(2-3): 101-108 (doi: 10.1016/j.tox.2011.02.010).
33. W e i s s G., W e r n e r - F e l m a y e r G., W e r n e r E.R., G r ü n e w a l d K., W a c h t e r H., H e n t z e M.W. Iron regulates nitric oxide synthase activity by controlling nuclear tran-scription. J. Exp. Med., 1994, 180: 969-976.
34. D l a s k a M., W e i s s G. Central role of transcription factor NF-IL6 for cytokine and iron-mediated regulation of murine inducible nitric oxide synthase expression. J. Immunol., 1999, 162: 6171-6177.
Events 3D CELL CULTURE
TECHNOLOGICAL INNOVATION AND CLINICAL SUCCESS
(22-23 February 2017, London, United Kingdom)
3D Cell Culture 2017 will address the latest developments of 3D cell culture techniques; the ways in which 3D methods are presently paving the way to future technologies, and the ways in which they are currently revolutionising cancer research, stem cell and regenerative medicine. The 3D cell cul-ture market is predicted to reach $3702.2 million by 2021 with main increase seen in novel technolo-gies and culture methods. This event will highlight emerging technologies, like 3D and 4D bio imag-ing, and their application to furthering research and medical practice.
In addition, we aim to focus on the involvement of 3D culture methods in drug development and screening, a topic of great current commercial interest to pharmaceutical and research bodies. 3D Cell Culture 2017 will bring together leading professionals and researchers in the industry to discuss the latest developments and future potential of this technique.
We aim to provide a unique and exciting conference on 3D cell culture, covering cutting edge tech-nologies like CRISPR. There will also be emphasis on the success and bright future of 3D methods in cancer research and stem cell research, the potential of organoids, and drug development besides.
Contacts: http://www.smi-online.co.uk/pharmaceuticals/uk/3D-Cell-Culture?utm_medium=www.3d-cellculture.com&utm_source=P-220&utm_campaign=glob
Information: http://www.globaleventslist.elsevier.com/events/2016/03/paediatric-clinical-trials/
921
AGRICULTURAL BIOLOGY, ISSN 2412-0324 (English ed. Online)
2016, V. 51, ¹ 6, pp. 921-928 (SEL’SKOKHOZYAISTVENNAYA BIOLOGIYA) ISSN 0131-6397 (Russian ed. Print)
ISSN 2313-4836 (Russian ed. Online) UDC 639.2/.3:574.5:57.084.1:[546.28+546.28]-022.532 doi: 10.15389/agrobiology.2016.6.921rus
doi: 10.15389/agrobiology.2016.6.921eng
ASSESSMENT OF GENERAL TOXICITY AND PROOXIDANT EFFECTS OF CeO2 AND SiO2 NANOPARTICLES ON Danio rerio
Е.P. MIROSHNIKOVA1, D.B. KOSYAN1, 2, A.E. ARIZHANOV1, Е.А. SIZOVA1, 2, V.V. KALASHNIKOV3
1Orenburg State University, 13, prosp. Pobedy, Orenburg, 460018 Russia; 2All-Russian Research Institute of Beef Cattle Breeding, Federal Agency of Scientific Organizations, 29, ul. 9 Yan- varya, Orenburg, 460000 Russia, e-mail [email protected], [email protected]; 3All-Russian Research Institute of Horse Breeding, Federal Agency of Scientific Organizations, pos. Divovo, Rybnovskii Region, Ryazan Province, 391105 Russia (ORCID: Sizova Е.А. orcid.org/0000-0002-5125-5981) Acknowledgements: Supported by Russian Scienсe Foundation (project ¹ 14-36-00023) Received May 25, 2016
A b s t r a c t
A diversified use of nanomaterials leads to their accumulation in the environment and in-volvement into remediation. In water biocoenosis, nanomaterials influence fishes. Lipid peroxidation (LPO) in aquatic bioindicators is considered the parameters generally used to assess an impact of man-caused water pollution. It should be taken into account that the level of LPO products can be due not only to anthropogenic pollution, but also to the presence of peroxide substrates in fish tis-sues. We firstly showed the effect of silica and cerium nanoparticles in water environment with direct assay of the enzyme activity of the bioindiator used. Our purpose was to evaluate the prooxidant ef-fects of CeO2 (15.8 nm) and SiO2 (40.9 nm) nanoparticles (NPs) on the Danio rerio model, to study LPO as influenced by the NPs doses, and to find out if there are any adaptive mechanisms in Danio rerio to withstand the NPs in the habitat. Complete death of the test objects occurred on days 80 and 84 when CeO2 NPs used. The first signs of the CeO2 NPs toxic effect at a dose of 10 mg/dm3 in the feed appeared on day 45, on day 56 the test-organism number was 33 % lower, and on day 65 a more than 54 % decline occurred. SiO2 NPs led to 33 % reduced survival. The presence of the na-noparticles in the habitat depressed the antioxidant system of Danio rerio but the signs of adaptation were manifested by the end of week 2, and a significant increase in catalase (CAT) and superoxide dismutase (SOD) activity proceeded by the end of the test. At 10 and 100 mg/dm3 of CeO2 NPs the malonic dialdehyde (MDA) level decreased by 11.0 % and 61.0 %, respectively. For SiO2 NPs the changes were similar with the MDA level decrease of 50.0 and 41.5 % at 10 and 100 mg/dm3 dos-age, respectively. SOD activity when influenced by CeO2 NPs (10 mg/dm3 and 100 mg/dm3) de-creased by 75 and 69 %, respectively, and for SiO2 NPs the indexes were 50 and 26 % lower as compared to control. Similar changes were characteristic of CAT activity. Thus, the investigated na-noparticles possess sufficient toxic properties that necessitates their further study.
Keywords: Danio rerio, survival, catalase, superoxide dismutase, nanoparticles of silicone and cerium dioxide, mass spectrometry
According to some estimates, by 2020, nanotechnology advances will pro-vide the establishment of industries, which will employ about 6 million people with a combined production of goods by $ 3 trillion [1]. Naturally this will in-crease the flow of ultrafine materials into the environment, where they will be in-volved in the biological processes. In the aqueous environment, nanomaterials may be incorporated into various processes, such as become the components of efflu-ents or emissions; they are not biodegradable, and leave the biological cycle very slowly [2]. This necessitates the study of the bodies of terrestrial and water (natural and anthropogenic) ecosystems upon exposure of nanomaterials, primarily, of those the forms of which have significant potential applications. These include na-nopreparations containing cerium and silicon and used in many biotechnological and medical productions [3]. Research has shown that the toxic effect of CeO2
922
and SiO2 is detected only when particles are up to 10 nm in size, but there is no exact evidence confirming their low toxicity to humans and animals. A limited number of landmark works on the effects of nanoparticles (NPs) of CeO2 and SiO2, the inconsistency of the data, as well as the expansion of the applications of materials based on the CeO2 and SiO2 NPs necessitate the biological assessment of these nanomaterials, including in the environmental objects [4, 5].
It should be noted that information on the effects of cerium- and sili-con-containing nanoparticles is ambiguous. Using the freshwater fish Catostomus commersonii, it was shown that these nanoparticles were characterized by unstable manifestation of their activity [6]. The investigation on the Danio rerio model re-vealed no toxic and damaging effects [7], while demonstrated the perspectives of using cerium-containing nanoparticles for therapeutic purposes [8]. Furthermore, the data on severe toxicity of these materials have gained widespread, particular-ly, the ability of the CeO2 NPs has been found to cause pulmonary inflamma-tions when tested in rats [9], induce oxidative stress and, as a result, the breaks of single-strand DNA [10, 11].
In its assessment, the studied parameters are the products of lipid perox-idation (LPO) in the tissues of hydrobionts considered as biological indicators of anthropogenic pollution of water bodies. However, when interpreting these re-sults, it is important to consider that revealed values can be related not only to the reaction to anthropogenic pollution, but also to endogenous substrates of pe-roxidation in the tissues.
We were the first to study the effect of nanoparticles of silicon and ceri-um dioxide in an aquatic environment with immediate assessment of enzyme system of the bioindicator organism.
Our purpose was to determine the biological effects of the CeO2 and SiO2 NPs in an aquatic environment depending on the preparation dose and routes of contamination.
Tecnique. The investigations were performed on a model of Danio rerio aged 1 month and selected by weight.
The preparations of SiO2 (d = 40.9 nm) and CeO2 (d = 15.8 nm) nano-particles, used in the research, were synthesized by a vapour-phase method in the Shared Knowledge Center at The A.N. Tupolev Kazan National Research Technological University. Materials research certification of the preparations in-cluded electronic scanning and transmission microscopy using JSM 7401F and JEM-2000FX microscopes (JEOL, Japan), as well as X-ray diffraction analysis (DRON-7 X-ray diffraction meter, NPO Burevestnik, Russia). Atomic force mi-croscopy was performed using SMM-2000 microscope (OJSC PTOTON-MIET, Russia). The scanning used MSCT-AUNM (Park Scientific Instruments, USA) cantilevers with a spring constant at k = 0.01 N/m and the needle radius of cur-vature of 15-20 nm. Quantitative morphometric analysis of the derived images was performed using regular software microscope.
The aquarium fish Danio rerio (a species of ray-finned freshwater fish in the Cyprinidae family) aged 1 month (n = 75) were kept in a single aquarium stand (V = 300 l) for 21 days. Next, five groups (n = 15 each) were allocated us-ing the analogue method, placing each group in a separate fish tank (V = 10 l, stocking density of 15 individuals), in the water of which the studied nanoparti-cles were added: CeO2 NPs (10 mg/dm3) in group I; CeO2 NPs (100 mg/dm3) in group II; SiO2 NPs (10 mg/dm3) in group III, SiO2 NPs (100 mg/dm3) in group IV; and group V as a control (without addition of nanoparticles). After adaptation of the model object within 21 days (a preliminary experiment stage) the nanoparticles of SiO2 (SiO2 NPs) and CeO2 (CeO2 NPs) as lyosols were administered with feed (Chironomidae larvae) every 7 days (10 and 100 mg/dm3
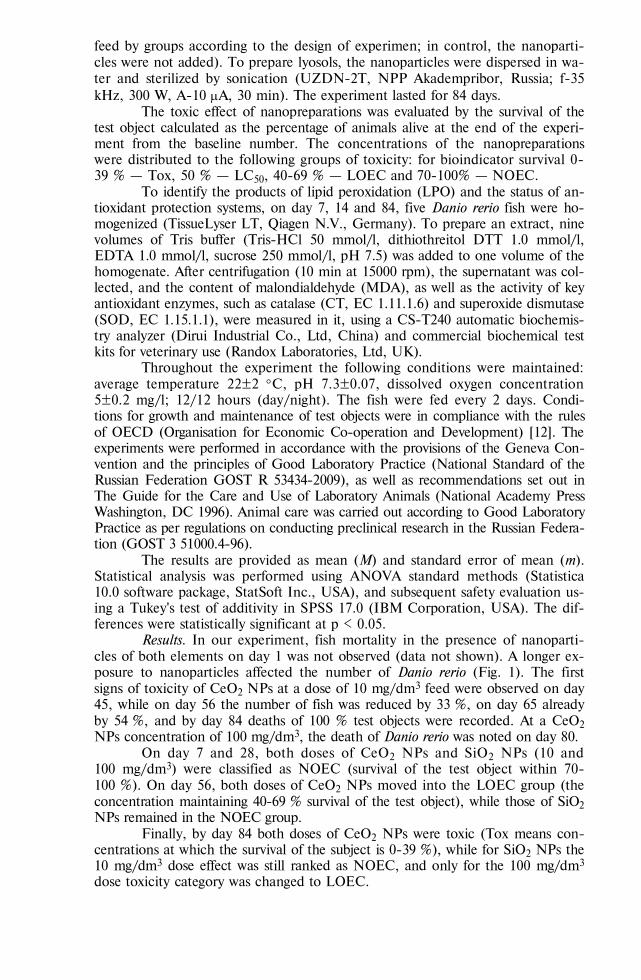
923
feed by groups according to the design of experimen; in control, the nanoparti-cles were not added). To prepare lyosols, the nanoparticles were dispersed in wa-ter and sterilized by sonication (UZDN-2T, NPP Akadempribor, Russia; f-35 kHz, 300 W, A-10 A, 30 min). The experiment lasted for 84 days.
The toxic effect of nanopreparations was evaluated by the survival of the test object calculated as the percentage of animals alive at the end of the experi-ment from the baseline number. The concentrations of the nanopreparations were distributed to the following groups of toxicity: for bioindicator survival 0-39 % — Tox, 50 % — LC50, 40-69 % — LOEC and 70-100% — NOEC.
To identify the products of lipid peroxidation (LPO) and the status of an-tioxidant protection systems, on day 7, 14 and 84, five Danio rerio fish were ho-mogenized (TissueLyser LT, Qiagen N.V., Germany). To prepare an extract, nine volumes of Tris buffer (Tris-HCl 50 mmol/l, dithiothreitol DTT 1.0 mmol/l, EDTA 1.0 mmol/l, sucrose 250 mmol/l, pH 7.5) was added to one volume of the homogenate. After centrifugation (10 min at 15000 rpm), the supernatant was col-lected, and the content of malondialdehyde (MDA), as well as the activity of key antioxidant enzymes, such as catalase (CT, EC 1.11.1.6) and superoxide dismutase (SOD, EC 1.15.1.1), were measured in it, using a CS-T240 automatic biochemis-try analyzer (Dirui Industrial Co., Ltd, China) and commercial biochemical test kits for veterinary use (Randox Laboratories, Ltd, UK).
Throughout the experiment the following conditions were maintained: average temperature 22±2 С, рН 7.3±0.07, dissolved oxygen concentration 5±0.2 mg/l; 12/12 hours (day/night). The fish were fed every 2 days. Condi-tions for growth and maintenance of test objects were in compliance with the rules of OECD (Organisation for Economic Co-operation and Development) [12]. The experiments were performed in accordance with the provisions of the Geneva Con-vention and the principles of Good Laboratory Practice (National Standard of the Russian Federation GOST R 53434-2009), as well as recommendations set out in The Guide for the Care and Use of Laboratory Animals (National Academy Press Washington, DC 1996). Animal care was carried out according to Good Laboratory Practice as per regulations on conducting preclinical research in the Russian Federa-tion (GOST 3 51000.4-96).
The results are provided as mean (M) and standard error of mean (m). Statistical analysis was performed using ANOVA standard methods (Statistica 10.0 software package, StatSoft Inc., USA), and subsequent safety evaluation us-ing a Tukey's test of additivity in SPSS 17.0 (IBM Corporation, USA). The dif-ferences were statistically significant at p < 0.05.
Results. In our experiment, fish mortality in the presence of nanoparti-cles of both elements on day 1 was not observed (data not shown). A longer ex-posure to nanoparticles affected the number of Danio rerio (Fig. 1). The first signs of toxicity of CeO2 NPs at a dose of 10 mg/dm3 feed were observed on day 45, while on day 56 the number of fish was reduced by 33 %, on day 65 already by 54 %, and by day 84 deaths of 100 % test objects were recorded. At a CeO2 NPs concentration of 100 mg/dm3, the death of Danio rerio was noted on day 80.
On day 7 and 28, both doses of CeO2 NPs and SiO2 NPs (10 and 100 mg/dm3) were classified as NOEC (survival of the test object within 70-100 %). On day 56, both doses of CeO2 NPs moved into the LOEC group (the concentration maintaining 40-69 % survival of the test object), while those of SiO2 NPs remained in the NOEC group.
Finally, by day 84 both doses of CeO2 NPs were toxic (Tox means con-centrations at which the survival of the subject is 0-39 %), while for SiO2 NPs the 10 mg/dm3 dose effect was still ranked as NOEC, and only for the 100 mg/dm3 dose toxicity category was changed to LOEC.
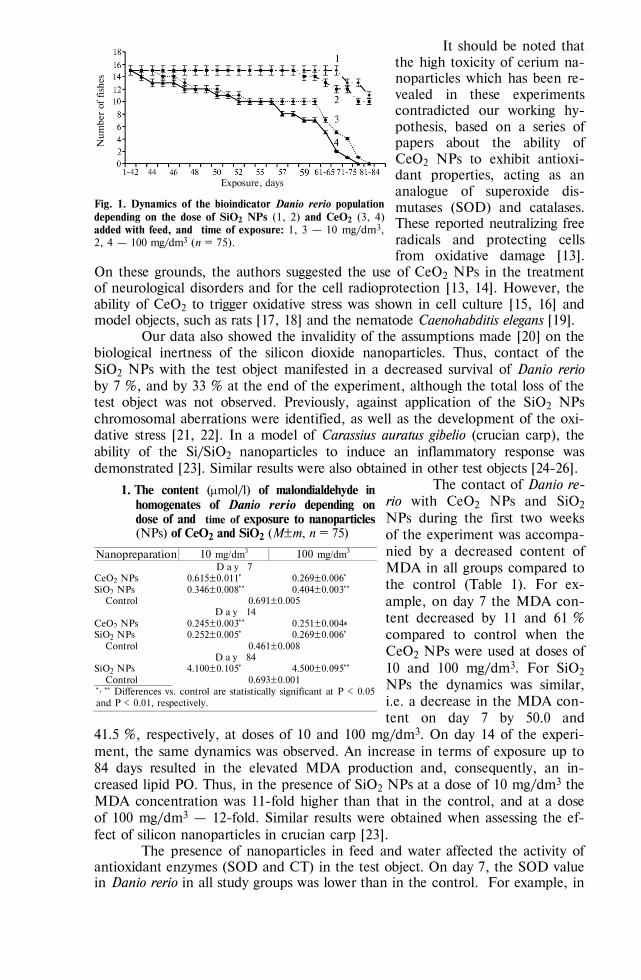
924
It should be noted that the high toxicity of cerium na-noparticles which has been re-vealed in these experiments contradicted our working hy-pothesis, based on a series of papers about the ability of CeO2 NPs to exhibit antioxi-dant properties, acting as an analogue of superoxide dis-mutases (SOD) and catalases. These reported neutralizing free radicals and protecting cells from oxidative damage [13].
On these grounds, the authors suggested the use of CeO2 NPs in the treatment of neurological disorders and for the cell radioprotection [13, 14]. However, the ability of CeO2 to trigger oxidative stress was shown in cell culture [15, 16] and model objects, such as rats [17, 18] and the nematode Caenohabditis elegans [19].
Our data also showed the invalidity of the assumptions made [20] on the biological inertness of the silicon dioxide nanoparticles. Thus, contact of the SiO2 NPs with the test object manifested in a decreased survival of Danio rerio by 7 %, and by 33 % at the end of the experiment, although the total loss of the test object was not observed. Previously, against application of the SiO2 NPs chromosomal aberrations were identified, as well as the development of the oxi-dative stress [21, 22]. In a model of Carassius auratus gibelio (crucian carp), the ability of the Si/SiO2 nanoparticles to induce an inflammatory response was demonstrated [23]. Similar results were also obtained in other test objects [24-26].
The contact of Danio re-rio with CeO2 NPs and SiO2 NPs during the first two weeks of the experiment was accompa-nied by a decreased content of MDA in all groups compared to the control (Table 1). For ex-ample, on day 7 the MDA con-tent decreased by 11 and 61 % compared to control when the CeO2 NPs were used at doses of 10 and 100 mg/dm3. For SiO2 NPs the dynamics was similar, i.e. a decrease in the MDA con-tent on day 7 by 50.0 and
41.5 %, respectively, at doses of 10 and 100 mg/dm3. On day 14 of the experi-ment, the same dynamics was observed. An increase in terms of exposure up to 84 days resulted in the elevated MDA production and, consequently, an in-creased lipid PO. Thus, in the presence of SiO2 NPs at a dose of 10 mg/dm3 the MDA concentration was 11-fold higher than that in the control, and at a dose of 100 mg/dm3 — 12-fold. Similar results were obtained when assessing the ef-fect of silicon nanoparticles in crucian carp [23].
The presence of nanoparticles in feed and water affected the activity of antioxidant enzymes (SOD and CT) in the test object. On day 7, the SOD value in Danio rerio in all study groups was lower than in the control. For example, in
Fig. 1. Dynamics of the bioindicator Danio rerio population depending on the dose of SiO2 NPs (1, 2) and CeO2 (3, 4) added with feed, and time of exposure: 1, 3 — 10 mg/dm3, 2, 4 — 100 mg/dm3 (n = 75).
1. The content (mol/l) of malondialdehyde in homogenates of Danio rerio depending on dose of and time of exposure to nanoparticles (NPs) of CeO2 and SiO2 (M±m, n = 75)
Nanopreparation 10 mg/dm3 100 mg/dm3 D a y 7
CeO2 NPs 0.615±0.011 0.269±0.006 SiO2 NPs 0.346±0.008 0.404±0.003
Control 0.691±0.005 D a y 14
CeO2 NPs 0.245±0.003 0.251±0.004 SiO2 NPs 0.252±0.005 0.269±0.006
Control 0.461±0.008 D a y 84
SiO2 NPs 4.100±0.105 4.500±0.095 Control 0.693±0.001
, Differences vs. control are statistically significant at Р < 0.05 and Р < 0.01, respectively.
Exposure, days
Num
ber
of fishes
925
the option with CeO2 NPs, it decreased by 75 % at a nanopreparation dose of 10 mg/dm3 and by 69 % at a dose of 100 mg/dm3, and with SiO2 NPs by 50 and 26 %, respectively, at a dose of 10 and 100 mg/dm3. On day 14, the SOD activity in the presence of nanoparticles differed depending on their type. CeO2 NPs induced a decrease in the SOD values, such as by 41 % for 10 mg/dm3, and by 29 % for 100 mg/dm3 (Table 2). When SiO2 NPs were added to the feed, the SOD activity parameters exceeded those in the control samples only on day 20, reaching values 1.96 and 1.48 times as much as control ones at doses of 10 and 100 mg/dm3, respectively.
2. The catalase (CT) and superoxide dismutase (SOD) activity in homogenates of Danio rerio depending on dose of and time of exposure to nanoparticles (NPs) of CeO2 and SiO2 (M±m, n = 75)
Nanopreparation CT, μmol/L SOD, % of epinephrine inhibition
dose of 10 mg/dm3 dose of 100 mg/dm3 dose of 10 mg/dm3 dose of 100 mg/dm3 D a y 7
CeO2 NPs 93.1±0.7 51.4±0.5 17.6±2.8 48.5±1.7 SiO2 NPs 15.9±0.4 46.9±1.0 35.6±1.2 52.4±2.6
Control 16.4±0.5 70.6±0.5 D a y 14
CeO2 NPs 97.4±2.1 83.3±2.9 28.1±1.5 33.7±1.1 SiO2 NPs 77.1±2.8 29.3±1.4 93.6±3.7 70.6±2.1
Control 16.2±0.3 47.6±0.6 D a y 84
SiO2 NPs 15.9±0.9 20.2±1.1 6.1±0.2 10.8±1.1 Control 23.1±0.8 59.3±1.8
, Differences vs. control are statistically significantat Р < 0.05 and Р < 0.01, respectively.
A significant decrease in SOD activity by the end of the experiment was quite expected, and is determined by the development of toxic reactions similar to those described previously in the presence of xenobiotics and cadmium [27]. We also observed similar dynamics for catalase (see Table 2).
Therefore, our results indicate that at the initial stages of NPs exposure to the body there is a pronounced reduction in the function of cell protection systems against oxidative stress. This is probably a consequence of the NPs abil-ity to act as an analogue of catalase, and exert activity, to some extent similar to the effect of SOD [28]. It is also specific that the CT and SOD activity, which changes in the presence of CeO2 NPs and SiO2 NPs, is recovered with time [29]. Therefore, we believe it is natural that the changes in SOD and CT values in Danio rerio under the influence of nanoparticles are opposite to the dynamics previously described for toxic substances, such as the insecticide imidacloprid, whose action first manifested in the increased activity of CT and SOD, and then in its significant decrease [30].
It is therefore difficult to explain the death of Danio rerio in the experiment. The reason could be that the ultradispersive nature of oxide particles may lead to their accumulation in the tissues of fish. It has previously been shown in several studies [24, 27, 30]. Such a fact was also observed in our exper-iments, especially in the first weeks, which is well seen on the example of silicon (Fig. 2). However, further on the silicon content in the body of Danio rerio decreased, probably due to homeostasis activity [25]. In
Fig. 2. The amount of silicon in tissues of Danio rerio de-pending on time of exposure to SiO2 NPs (100 mg/dm3 water): a — control; b — experiment. , Differences vs. control are statistically significant at Р < 0.05 and Р < 0.01, respectively.
7 14 21 28 84 Exposure, days
a
b
Con
centr
atio
n, g
/g
926
addition, SiO2 NPs do not prevent the regeneration of tissues [23], but can cause both prothrombotic effects and increased concentrations of fibrinogen, as well as of anti-inflammatory cytokines in the blood plasma [22, 31]. Moreover, the markers of oxidative stress (SOD, CT) are not affected [22]. An interesting explanation of the death of the test organism after the contact with NPs was proposed by S.N. Petrache et al. [26], who linked it with the influence of CeO2 on Escherichia coli, which is accompanied by a decrease in feed intake and sub-sequent changes in metabolism [32]. Similar data were reported by M.C. Arnold et al. [33].
Thus, the investigated nanoparticles (NPs) possess toxic effects, because their entry into the body of Danio rerio (a bioindicator) is accompanied by a total (in case of CeO2 NPs) or partial (in case of SiO2 NPs) loss of the test object at the end of the experiment. In the initial period of exposure, there is a depression of the antioxidant system, but by the end of the 2nd week the signs of adaptation develop. The content of malondialdehyde at a SiO2 NPs dose of 10 mg/dm3 in-creased by 11 times, and at a dose of 100 mg/dm3 by 12 times; and similar chang-es were found for CeO2 NPs.
R E F E R E N C E S
1. R o c o M.M. The long view of nanotechnology development: the National Nanotechnology
Initiative at 10 years. J. Nanopart. Res., 2011, 13: 427-445 (doi: 10.1007/s11051-010-0192-z). 2. K e l l e r A.A., M c F e r r a n S., L a z a r e v a A., S u h S. Global life cycle releases of engi-
neered nanomaterials. J. Nanopart. Res., 2013, 15: 1692 (doi: 10.1007/s11051-013-1692-4). 3. G e r a s h c h e n k o I.I. Mediko-biologicheskie aspekty poverkhnostnykh yavlenii, 2009, 1(16):
288-306 (in Russ.). 4. J a c k s o n P., R a u n J a c o b s e n N., B a u n A., B i r k e d a l R., K ü h n e l D., A l -
s t r u p J e n s e n K., V o g e l U., W a l l i n H. Bioaccumulation and ecotoxicity of carbon nanotubes. Chem. Cent. J., 2013, 7(1): 154.
5. L i Y., L i P., Y u H., B i a n Y. Recent advances (2010-2015) in studies of cerium oxide nanoparticles’ health effects. Environ. Toxicol. Pharmacol., 2016, 9(44): 25-29 (doi: 10.1016/j.etap.2016.04.004).
6. Ru nd l e A., Ro b e r t s o n A.B., B l a y A.M., B u t l e r K.M., C a l l a g h a n N.I., D i e - n i C.A., M a cC o r m a c k T.J. Cerium oxide nanoparticles exhibit minimal cardiac and cytotox-icity in the freshwater fish Catostomus commersonii. Comparative Biochemistry and Physiology Part C: Toxicology & Pharmacology, 2016, 181-182: 19-26 (doi: 10.1016/j.cbpc.2015.12.007).
7. P i c c i n e t t i C.C., M o n t i s C., B o n i n i M., L a u r à R., G u e r r e r a M.C., R a d a e l - l i G., V i a n e l l o F., S a n t i n e l l i V., M a r a d o n n a F., N o z z i V., M i c c o l i A., O l i v o t t o I. Transfer of silica-coated magnetic (Fe3O4) nanoparticles through food: a molecular and morphological study in zebrafish. Zebrafish, 2014, 11(6): 567-579 (doi: 10.1089/zeb.2014.1037).
8. O u y a n g Z., M a i n a l i M.K., S i n h a N., S t r a c k G., A l t u n d a l Y., H a o Y., W i n n i n g h a m T.A., S a j o E., C e l l i J., N g w a W. Potential of using cerium oxide na-noparticles for protecting healthy tissue during accelerated partial breast irradiation (APBI). Phys. Medica, 2016, 32(4): 631-635 (doi: 10.1016/j.ejmp.2016.03.014).
9. M o r i m o t o Y., I z u m i H., Y o s h i u r a Y., T o m o n a g a T., O y a b u T., M y o j o T., K a w a i K., Y a t e r a K., S h i m a d a M., K u b o M., Y a m a m o t o K., K i t a j i - m a S., K u r o d a E., K a w a g u c h i K., S a s a k i T. Pulmonary toxicity of well-dispersed cerium oxide nanoparticles following intratracheal instillation and inhalation. J. Nanopart. Res., 2015, 17(11): 442 (doi: 10.1007/s11051-015-3249-1).
10. D o g r a Y., A r k i l l K.P., E l g y C., S t o l p e B., L e a d J., V a l s a m i - J o n e s E., T y -l e r C.R., G a l l o w a y T.S. Cerium oxide nanoparticles induce oxidative stress in the sedi-ment-dwelling amphipod Corophium volutator. Nanotoxicology, 2016, 10(4): 480-487 (doi: 10.3109/17435390.2015.1088587).
11. OECD Guideline for Testing of Chemicals. Guideline 203. Fish, Acute Toxicity Test. Organization of Economic Cooperation Development, Paris, France, 1992.
12. R a m e s h R., K a v i t h a P., K a n i p a n d i a n N., A r u n S., T h i r u m u r u g a n R., S u b r a m a n i a n P. Alteration of antioxidant enzymes and impairment of DNA in the SiO2 nanoparticles exposed zebra fish (Danio rerio). Environment Monitoring and Assessment, 2013, 185(7): 5873-5881 (doi: 10.1007/s10661-012-2991-4).
13. T a r n u z z e r R.W., C o l o n J., P a t i l S., S e a l S. Vacancy engineered ceria nanostruc-tures for protection from radiation-induced cellular damage. Nano Lett., 2005, 5(12): 2573-2577 (doi: 10.1021/nl052024f).
927
14. S c h u b e r t D., D a r g u s c h R., R a i t a n o J., C h a n S.W. Cerium and yttrium oxide na-noparticles are neuroprotective. BBRC, 2006, 342(1): 86-91 (doi: 10.1016/j.bbrc.2006.01.129).
15. P a r k E.J., C h o i J., P a r k Y.K., P a r k K. Oxidative stress induced by cerium oxide nanoparti-cles in cultured BEAS-2B cells. Toxicology, 2008, 245(1-2): 90-100 (doi: 10.1016/j.tox.2007.12.022).
16. K i m I.S., B a e k M., C h o i S.J. Comparative cytotoxicity of Al2O3, CeO2, TiO2 and ZnO nanoparticles to human lung cells. J. Nanosci. Nanotechnol., 2010, 10(5): 3453-3458 (doi: 10.1166/jnn.2010.2340).
17. D a s M., P a t i l S., P a t i l S., B h a r g a v a N., K a n g J.F., R i e d e l L.M., S e a l S., H i c k m a n J.J. Auto-catalytic ceria nanoparticles offer neuroprotection to adult rat spinal cord neurons. Biomaterials, 2007, 28(10): 1918-1925 (doi: 10.1016/j.biomaterials.2006.11.036).
18. S r i n i v a s A., R a o P.J., S e l v a m G., M u r t h y P.B., R e d d y P.N. Acute inhalation toxicity of cerium oxide nanoparticles in rats. Toxicol. Lett., 2011, 205(2): 105-115 (doi: 10.1016/j.toxlet.2011.05.1027).
19. Ro g e r s S., R i c e K.M., M ann e N.D., S h o k u h f a r T., H e K., S e l v a r a j V., B l o - u g h E.R. Cerium oxide nanoparticle aggregates affect stress response and function in Caenorhabditis elegans. SAGE Open Medicine, 2015, 3: 2050312115575387 (doi: 10.1177/2050312115575387).
20. E r o g b o g b o F., Y o n K.-T., R o y I., X u G., P r a s a d P.N., S w i h a r t M.T. Biocom-patible luminescent silicon quantum dots for imaging of cancer cells. ACS Nano, 2008, 2(5): 873-878 (doi: 10.1021/nn700319z).
21. R a j i v S., J e r o b i n J., S a r a n y a V., N a i n a w a t M., S h a r m a A., M a k w a n a P., G a y a t h r i C., B h a r a t h L., S i n g h M., K u m a r M., M u k h e r j e e A., C h a n d r a -s e k a r a n N. Comparative cytotoxicity and genotoxicity of cobalt (II, III) oxide, iron (III) oxide, silicon dioxide, and aluminum oxide nanoparticles on human lymphocytes in vitro. Hum. Exp. Toxicol., 2016, 35(2): 170-183 (doi: 10.1177/0960327115579208).
22. N e m m a r A., B e e g a m S., Y u v a r a j u P., Y a s i n J., S h a h i n A., A l i B.H. Interac-tion of amorphous silica nanoparticles with erythrocytes in vitro: role of oxidative stress. Cell Physiol. Biochem., 2014, 34(2): 255-265 (doi: 10.1159/000362996).
23. S t a n c a L., P e t r a c h e S.N., R a d u M., S e r b a n A.I., M u n t e a n u M.C., T e o -d o r e s c u D., S t a i c u A.C., S i m a C., C o s t a c h e M., G r i g o r i u C., Z a r n e s c u O., D i n i s c h i o t u A. Impact of silicon-based quantum dots on the antioxidative system in white muscle of Carassius auratus gibelio. Fish Physiol. Biochem., 2012, 38: 963-975 (doi: 10.1007/s10695-011-9582-0).
24. S e r b a n A.I., S t a n c a L., S i m a C., S t a i c u A.C., Z a r n e s c u O., D i n i s c h i o t u A. Complex responses to Si quantum dots accumulation in carp liver tissue: Beyond oxidative stress. Chem-Biol. Interact., 2015, 239: 56-66 (doi: 10.1016/j.cbi.2015.06.015).
25. N e m m a r A., A l b a r w a n i S., B e e g a m S., Y u v a r a j u P., Y a s i n J., A t t o u b S., A l i B.H. Amorphous silica nanoparticles impair vascular homeostasis and induce systemic in-flammation. Int. J. Nanomed., 2014, 9(1): 2779-2789 (doi: 10.2147/IJN.S52818).
26. P e t r a c h e S.N., S t a n c a L., S e r b a n A.I., S i m a C., S t a i c u A.C., M u n t e a - n u M.C., C o s t a c h e M., B u r l a c u R., Z a r n e s c u O., D i n i s c h i o t u A. Structural and oxidative changes in the kidney of crucian carp induced by silicon-based quantum dots. Int. J. Mol. Sci., 2012, 13(8): 10193-10211 (doi: 10.3390/ijms130810193).
27. A s a g b a S.O., E r i y a m r e m u G.E., I g b e r a e s e M.E. Bioaccumulation of cadmium and its biochemical effect on selected tissues of the catfish (Clarias gariepinus). Fish Physiol. Bio-chem., 2008, 34: 61-69 (doi: 10.1007/s10695-007-9147-4).
28. P i r m o h a m e d T., D o w d i n g J.M., S i n g h S., W a s s e r m a n B., H e c k e r t E., K a - r a k o t i A.S., K i n g J.S., S e a l S., S e l f W.T. Nanoceria exhibit redox state-dependent catalase mimetic activity. Chem. Sommun., 2010, 46: 2736-2738 (doi: 10.1039/b922024k).
29. H e c k e r t E.G., K a r a k o t i A.S., S e a l S., S e l f W.T. The role of cerium redox state in the SOD mimetic activity of nanoceria. Biomaterials, 2008, 29: 2705-2709 (doi: 10.1016/j.biomaterials.2008.03.014).
30. G e W., Y a n S., W a n g J., Z h u L., C h e n A., W a n g J. Oxidative stress and DNA damage induced by imidacloprid in zebrafish (Danio rerio). J. Agric. Food Chem., 2015, 63(6): 1856-1862 (doi: 10.1021/jf504895h).
31. X i e G., S u n J., Z h o n g G., S h i L., Z h a n g D. Biodistribution and toxicity of intrave-nously administered silica nanoparticles in mice. Arch. Toxicol., 2010, 84: 183-190 (doi: 10.1007/s00204-009-0488-x).
32. M i r o s h n i k o v S.A., L e b e d e v S.V. Vestnik Orenburgskogo gosudarstvennogo universiteta, 2009, 6(112): 241-243.
33. A r n o l d M.C., B a d i r e d d y A.R., W i e s n e r M.R., D i G i u l i o R.T., M e y e r J.N. Cerium oxide nanoparticles are more toxic than equimolar bulk cerium oxide in Caenorhabditis el-egans. Arch. Environ. Contam. Toxicol., 2013, 65(2): 224-233 (doi: 10.1007/s00244-013-9905-5).
929
AGRICULTURAL BIOLOGY, ISSN 2412-0324 (English ed. Online)
2016, V. 51, ¹ 6, pp. 929-936 (SEL’SKOKHOZYAISTVENNAYA BIOLOGIYA) ISSN 0131-6397 (Russian ed. Print)
ISSN 2313-4836 (Russian ed. Online) UDC 615.9:546.77-022.532]:57.084.1 doi: 10.15389/agrobiology.2016.6.929rus
doi: 10.15389/agrobiology.2016.6.929eng MORPHOLOGICAL AND BIOCHEMICAL PARAMETERS IN Wistar RATS INFLUENCED BY MOLYBDENUM AND ITS OXIDE NANOPARTICLES
Е.А. SIZOVA1, 2, S.A. MIROSHNIKOV1, V.V. KALASHNIKOV3
1All-Russian Research Institute of Beef Cattle Breeding, Federal Agency of Scientific Organizations, 29, ul. 9 Yan- varya, Orenburg, 460000 Russia, e-mail [email protected], [email protected]; 2Orenburg State University, 13, prosp. Pobedy, Orenburg, 460018 Russia; 3All-Russian Research Institute of Horse Breeding, Federal Agency of Scientific Organizations, pos. Divovo, Rybnovskii Region, Ryazan Province, 391105 Russia (ORCID: Sizova Е.А. orcid.org/0000-0002-5125-5981) Acknowledgements: Studies were performed using standard techniques in the Laboratory of Agroecology of Nanomaterials and Test Center of All-Russian Research Institute of Beef Cattle Breeding (accreditation certificate RA. RU.21PF59 from 12/02/15). Analysis of chemical elements was performed in the laboratory of ANO Center for Biotic Medicine, Moscow (accreditation certificate GSEN.RU.TSAO.311, registration number in the State Register ROSS RU. 0001.513118) Supported by Russian Scienсe Foundation (project ¹ 14-36-00023) Received July 11, 2016
A b s t r a c t
Despite widespread use of nanoparticles in industry and medicine, there is very little in-formation about how the newly developed nanomaterials interact with biological objects. Certain properties of the Mo-containing nanoparticles (NPs) suggest their possible toxic effect on warm-blooded animals. In this paper we compared the effect of Mo NPs (at 1 and 25 mg/kg) and its oxide MoO3 NPs (at 1.2 and 29 mg/kg), when administrated parenterally, on metabolic parameters and the exchange of chemical elements in Wistar laboratory rats. There, we assessed the red and white blood cell counts, the hemoglobin level, the activity of catalase (CAT) and superoxide dismutase (SOD) (for oxidative status), the ALT, AST, LDH, GGT, creatine kinase activity, blood creati-nine, bilirubin and urea concentrations (for metabolic status) at days 1, 7 and 14. A day after Mo NPs and MoO3 NPs administration the number of blood leukocyte lowered by 11.3 % (Р < 0.05) and 58.5 % (Р < 0.01), respectively. Also, a decrease in monocyte number by 18.9 (Р < 0.05), 41.9 (Р < 0.01), 51.7 (Р < 0.05) and 83.3 % (Р < 0.001) as depending on NPs chemical composition and doses was characteristic, though on day 14 a significant difference to control (54.5 %, Р < 0.05) was found only for MoO3 NPs at a dose of 29 mg/kg. The number of thrombocytes was the high-est on day 14 for the maximum dosage of both NPs leading to hindered blood microcirculation. The experiments also showed an increase in serum aminotransferases, GGT and LDH activity. In sum, we observed manifestations of oxidative stress, anemia and capillary-trophic insufficiency in the animals administrated with high doses of molybdenum and Mo oxide NPs. These signs were progressing and the most apparent for molybdenum oxide NPs. Given the comparable doses used, the molybdenum nanoparticles exhibit lower toxicity as compared to its oxide.
Keywords: catalase, superoxide dismutase, glutamyl transferase, lactate dehydrogenase, aminotransferase, nanoparticles of molybdenum, nanoparticles of molybdenum trioxide
Molybdenum nanoforms are widely used in modern technologies [1, 2], e.g. for multifunctional electrocalalysis [3] and production of lubricants [4]. Apart from that, ultradisperse products containing molybdenum and its com-pounds show unique biological properties, which allows using them for onco-therapy [5], as antibiotics [6, 7] and antifungal agents [8], and for blue-green al-gae growth promotion [9].
Molybdenum is a well-studied essential microelement. Its participation in enzymatic systems is well-known [10]. Ranges of molybdenum deficiency, sufficiency and toxicity have been described [11]. Background [12], threshold and toxic concentration of molybdenum for invertebrates in soils have been re-ported [13]. However, the knowledge on consequences of interaction of newly developed molybdenum-based nanomaterials with biological objects is still ex-
930
tremely poor. At the same time, according to investigative studies, biological ef-fects of nanoforms of molybdenum are much more expressed. Various models have been used to demonstrate this. For example, entry of molybdenum oxide nanoparticles into soil leads to high mortality rate, adaptive changes of antioxi-dant enzyme activity and inhibition of Cr, Fe, Mg, Mn, Ni, Si, V metabolism in Eisenia fetida [14]. The presence of molybdenum nanoparticles in water has a negative impact on cell membrane permeability in Stylonychia mytilus and leads to processes, accompanying the damage. Analysis of collected data on biological effects of molybdenum-based nanoparticles suggests that they may have a toxic effect on warm-blooded animals.
Here we for the first time compared the biological effects of molybdenum nanoparticles and molybdenum oxide on rats, the homeothermic mammals.
The objective of this work was the examination of morphological and bi-ochemical blood parameters, morphological and functional characteristics of tis-sue and chemical element metabolism in model objects due to the effects of mo-lybdenum nanoparticles and molybdenum oxide.
Technique. Molybdenum and molybdenum oxide nanoparticles (NPs) (Mo NPs and MoO3 NPs) were obtained by plasma chemical synthesis (OOO Platina, Moscow). Мо NPs products (d = 50 nm, specific surface area 14 m2/g, Z-potential 43±0,52 mV) contained 99,7 % Мо and 0,3 % O2, and МоО3 NPs (d = 92 nm, specific surface area 12 м2/г, Z-potential 43±0,21 mV) con-tained 99,8 % Мо and 0,2 % O2. The material attestation (determination of par-ticle size, polydispersity, voluminosity, fraction content, surface area) included electronic scanning, transmission and atomic force microscopy using LEX T OLS4100, JSM 7401F и JEM-2000FX (JEOL, Japan). Particle size distribution was examined using a Photocor Compact analyzer (OOO Photocor, Russia). Nanoparticle samples were dispersed in saline solution using UZDN-2T (NPP Akadempribor, Russia) (35 kHz, 300 W, 10 uA, 30 min).
The studies were performed in 75 Wistar white male rats, with the weight of 150-180 g in standard vivarium conditions (experimental biological clinic, Orenburg State University).The diet of animals (State Standard GOST R 50258-92) complied with the requirements of the Good Laboratory Practice in con-ducting preclinical research in the Russian Federation (State Standard GOST 51000.4-96). The experiments were performed in accordance with the provisions of the Geneva Convention and the principles of Good Laboratory Practice (Na-tional Standard of the Russian Federation GOST R 53434-2009), as well as recommendations set out in The Guide for the Care and Use of Laboratory Animals (National Academy Press Washington, DC 1996). After the prelimi-nary period (1 month) the animals were divided into 5 groups (n = 15 per group). Mo NPs were administered intraperitoneally in a single dose of 1 and 25 mg/kg of live weight in groups I and II, respectively, and in groups III and IV MoO3 NPs were administered at the dose of 1.2 and 29 mg/kg, respectively. Sa-line solution was injected to control animals.
Biomaterial for the study was obtained after decapitation of rats under Nembutal anesthesia (5 species for each option of the experiment and control in 1, 7, and 14 days after administration of nanopreparations). Blood for examina-tion of morphological parameters was placed in vacuum tubes with anticoagu-lant, for biochemical studies — into vacuum tubes with a coagulation activator (thrombin). Morphological blood composition and hemoglobin concentration were estimated using an nautomatic hematological analyzer URIT-2900 Vet Plus (URIT Medical Electronic Group Co., Ltd, China). The biochemical blood se-rum test was performed using an automatic biochemical analyzer СS-T240 (DIRUI Industrial Co., Ltd, China) and commercial veterinary kits (DiaVetTest
931
by DIAKON-DS, Russia; Randox Laboratories Ltd., Great Britain). The con-tent of chemical elements in the examined samples studied was measured using a mass spectrometer Elan 9000 and an atomic emission spectrometer Optima 2000V (Perkin Elmer, USA). The samples were ashed using microwave decompo-sition system Multiwave-3000 (Anton Paar, Аustria).
For liver microstructure studies, samples were fixed in 10 % neutral for-malin and embedded in paraffin mixture HISTOMIX® (OOO BioVitrum, Russia). 5-6 μm thick histological sections were prepared using a semi-automatic micro-tome (01 MW, Tekhnom, Russia), stained with Mayer's Haematoxylin and Eosin and examined under a light microscope MT 5300L (Meiji Techno Co., Ltd, Ja-pan, ½400).
The data are presented as the arithmetic mean (M) with the standard error of the mean (m). Statistical analysis was performed using ANOVA (Statistica 10.0 software package, StatSoft Inc., USA) and Microsoft Excel. The validity of differ-ences in the indicators compared was determined by Student's t- test. The values were considered statistically significant at Р < 0.05.
Results. Significant morphological changes of blood were observed as early as 1 day after administration of molybdenum and molybdenum oxide na-noparticles (Table 1). For example, leukocyte counts in groups II and IV have decreased by 11.3 % (Р < 0.05) and 58.5 % (Р < 0.01).
1. Morphological blood parameters in Wistar rats upon intraperitoneal administra-tion of Мо and MoO3 NPs at various doses (M±m, n = 75)
Parameter Control Мо NPs МоО3 NPs
group I group II group III group IV Day 1
Leucocytes, ½109/l 8.80±0.180 8.85±0.095 7.90±0.080 7.25±0.550 6.55±0.150 Erythrocytes, ½1012/l 8.59±0.120 8.90±0.155 8.65±0.155 9.50±0.380 8.52±0.165 Hemoglobin, g/l 172.5±1.50 189.5±5.50 162.5±4.50 184.0±6.00 133.5±1.50 Platelets, ½109/l 170.50±9.500 176.00±12.000 250.00±5.130* 188.50±6.500 184.50±6.500 Lymphocytes, ½109/l 4.10±0.010 3.75±0.015 4.35±0.015 2.90±0.030 2.30±0.090 Monocytes, ½109/l 2.20±0.090 1.85±0.050* 1.55±0.035* 1.45±0.035** 1.20±0.070** Granulocytes, ½109/l 2.50±0.090 3.25±0.015* 2.00±0.050 2.90±0.090* 2.05±0.055
D a y 7 Leucocytes, ½109/l 7.10±0.120 6.50±0.160 7.85±0.195 6.60±0.110 7.95±0.450 Erythrocytes, ½1012/l 8.12±0.430 7.60±0.360 7.43±0.110 6.62±0.230 7.55±0.050 Hemoglobin, g/l 165.0±10.20 156.0±6.00 143.0±3.00 126.0±5.0 145.0±8.0 Platelets, ½109/l 159.5±3.50 162.0±8.00 182.5±2.50* 183.0±8.00 179.5±7.50 Lymphocytes, ½109/l 3.80±0.01 3.50±0.07 3.70±0.09 2.90±0.01* 3.40±0.07 Monocytes, ½109/l 2.10±0.210 2.35±0.150 2.65±0.300 1.95±0.020 1.40±0.060* Granulocytes, ½109/l 2.50±0.090 1.65±0.035 2.50±0.070 2.75±0.085 3.15±0.015*
D a y 14 Leucocytes, ½109/l 8.15±0.350 8.95±0.150 8.75±0.150 6.26±0.043 7.95±0.250 Erythrocytes, ½1012/l 8.78±0.430 8.62±0.165 6.86±0.105 5.91±0.139 6.76±0.160 Hemoglobin, g/l 166.5±9.50 157.5±5.50 122.5±5.50 108.8±5.25 128.0±8.00 Platelets, ½109/l 188.5±7.50 154.5±3.50 352.0±6.00** 149.88±5.13 311.5±9.50** Lymphocytes, ½109/l 4.50±0.012 3.05±0.015 2.20±0.020 2.10±0.099 2.75±0.035 Monocytes, ½109/l 2.55±0.015 2.05±0.015 2.10±0.012 2.42±0.038 1.65±0.015* Granulocytes, ½109/l 2.10±0.020 3.85±0.025 4.45±0.035 4.74±0.066 3.55±0.045 N o t e. Groups I and II — doses of 1 and 25 mg/kg live weight, respectively; groups III and IV — 1.2 and 29 mg/kg. *, ** Differences vs. control are statistically significant at Р < 0.05 and Р < 0.01, respectively.
The effect of molybdenum-based nanoparticles was characterized by de-crease in monocyte counts on day 1 by 18.9 (Р < 0.05), 41.9 (Р < 0.01), 51.7 (Р < 0.05) and 83.3 % (Р < 0.001) in groups I, II, III and IV, respectively. In 7 days this difference amounted to 55.6 (Р < 0.05), 27.3 (Р < 0.05), 7.7 and 50.0 % (Р < 0.05). At the time of completion of the experiment significant dif-ferences were only observed between the control and group IV (54.5 %, Р < 0.05). The nanoparticle effects with regard to the monocytes observed by us differed dramatically from those reported for polystyrene nanoparticles [16] and Cu and Fe nanoforms [17]. Similar dynamics was observed for lymphocytes, the number
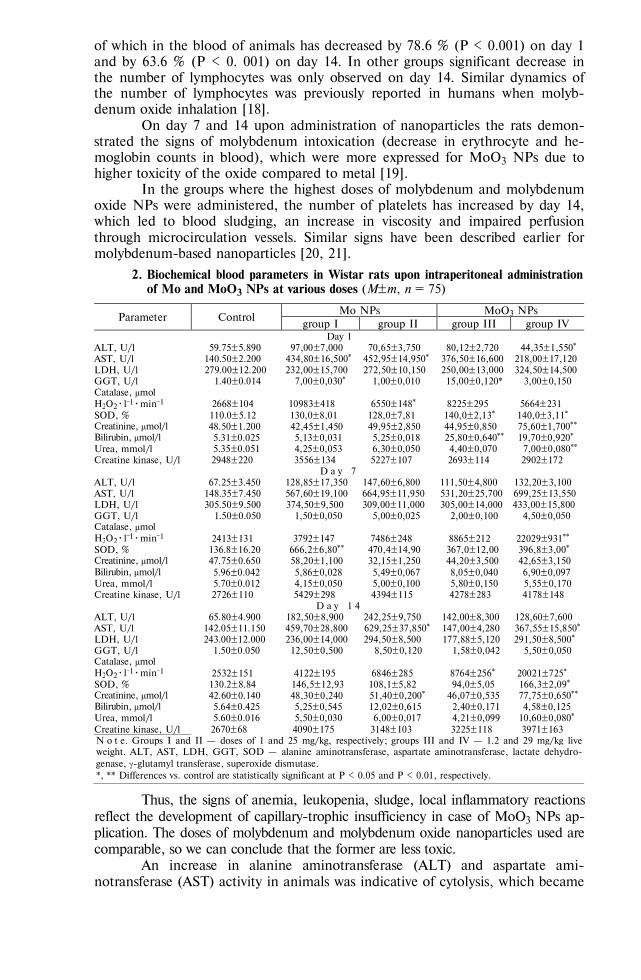
932
of which in the blood of animals has decreased by 78.6 % (Р < 0.001) on day 1 and by 63.6 % (Р < 0. 001) on day 14. In other groups significant decrease in the number of lymphocytes was only observed on day 14. Similar dynamics of the number of lymphocytes was previously reported in humans when molyb-denum oxide inhalation [18].
On day 7 and 14 upon administration of nanoparticles the rats demon-strated the signs of molybdenum intoxication (decrease in erythrocyte and he-moglobin counts in blood), which were more expressed for MoO3 NPs due to higher toxicity of the oxide compared to metal [19].
In the groups where the highest doses of molybdenum and molybdenum oxide NPs were administered, the number of platelets has increased by day 14, which led to blood sludging, an increase in viscosity and impaired perfusion through microcirculation vessels. Similar signs have been described earlier for molybdenum-based nanoparticles [20, 21].
2. Biochemical blood parameters in Wistar rats upon intraperitoneal administration of Мо and MoO3 NPs at various doses (M±m, n = 75)
Parameter Control Мо NPs МоО3 NPs
group I group II group III group IV Day 1
ALT, U/l 59.75±5.890 97,00±7,000 70,65±3,750 80,12±2,720 44,35±1,550* AST, U/l 140.50±2.200 434,80±16,500* 452,95±14,950* 376,50±16,600 218,00±17,120 LDH, U/l 279.00±12.200 232,00±15,700 272,50±10,150 250,00±13,000 324,50±14,500 GGT, U/l 1.40±0.014 7,00±0,030* 1,00±0,010 15,00±0,120* 3,00±0,150 Catalase, μmol Н2О2∕l1∕min1 2668±104 10983±418 6550±148* 8225±295 5664±231 SOD, % 110.0±5.12 130,0±8,01 128,0±7,81 140,0±2,13* 140,0±3,11* Creatinine, μmol/l 48.50±1.200 42,45±1,450 49,95±2,850 44,95±0,850 75,60±1,700** Bilirubin, μmol/l 5.31±0.025 5,13±0,031 5,25±0,018 25,80±0,640** 19,70±0,920* Urea, mmol/l 5.35±0.051 4,25±0,053 6,30±0,050 4,40±0,070 7,00±0,080** Creatine kinase, U/l 2948±220 3556±134 5227±107 2693±114 2902±172
D a y 7 ALT, U/l 67.25±3.450 128,85±17,350 147,60±6,800 111,50±4,800 132,20±3,100 AST, U/l 148.35±7.450 567,60±19,100 664,95±11,950 531,20±25,700 699,25±13,550 LDH, U/l 305.50±9.500 374,50±9,500 309,00±11,000 305,00±14,000 433,00±15,800 GGT, U/l 1.50±0.050 1,50±0,050 5,00±0,025 2,00±0,100 4,50±0,050 Catalase, μmol Н2О2∕l1∕min1 2413±131 3792±147 7486±248 8865±212 22029±931** SOD, % 136.8±16.20 666,2±6,80** 470,4±14,90 367,0±12,00 396,8±3,00* Creatinine, μmol/l 47.75±0.650 58,20±1,100 32,15±1,250 44,20±3,500 42,65±3,150 Bilirubin, μmol/l 5.96±0.042 5,86±0,028 5,49±0,067 8,05±0,040 6,90±0,097 Urea, mmol/l 5.70±0.012 4,15±0,050 5,00±0,100 5,80±0,150 5,55±0,170 Creatine kinase, U/l 2726±110 5429±298 4394±115 4278±283 4178±148
D a y 1 4 ALT, U/l 65.80±4.900 182,50±8,900 242,25±9,750 142,00±8,300 128,60±7,600 AST, U/l 142.05±11.150 459,70±28,800 629,25±37,850* 147,00±4,280 367,55±15,850* LDH, U/l 243.00±12.000 236,00±14,000 294,50±8,500 177,88±5,120 291,50±8,500* GGT, U/l 1.50±0.050 12,50±0,500 8,50±0,120 1,58±0,042 5,50±0,050 Catalase, μmol Н2О2∕l1∕min1 2532±151 4122±195 6846±285 8764±256* 20021±725* SOD, % 130.2±8.84 146,5±12,93 108,1±5,82 94,0±5,05 166,3±2,09* Creatinine, μmol/l 42.60±0.140 48,30±0,240 51,40±0,200* 46,07±0,535 77,75±0,650** Bilirubin, μmol/l 5.64±0.425 5,25±0,545 12,02±0,615 2,40±0,171 4,58±0,125 Urea, mmol/l 5.60±0.016 5,50±0,030 6,00±0,017 4,21±0,099 10,60±0,080* Creatine kinase, U/l 2670±68 4090±175 3148±103 3225±118 3971±163 N o t e. Groups I and II — doses of 1 and 25 mg/kg, respectively; groups III and IV — 1.2 and 29 mg/kg live weight. ALT, AST, LDH, GGT, SOD — alanine aminotransferase, aspartate aminotransferase, lactate dehydro-genase, -glutamyl transferase, superoxide dismutase. *, ** Differences vs. control are statistically significant at Р < 0.05 and Р < 0.01, respectively.
Thus, the signs of anemia, leukopenia, sludge, local inflammatory reactions reflect the development of capillary-trophic insufficiency in case of MoO3 NPs ap-plication. The doses of molybdenum and molybdenum oxide nanoparticles used are comparable, so we can conclude that the former are less toxic.
An increase in alanine aminotransferase (ALT) and aspartate ami-notransferase (AST) activity in animals was indicative of cytolysis, which became
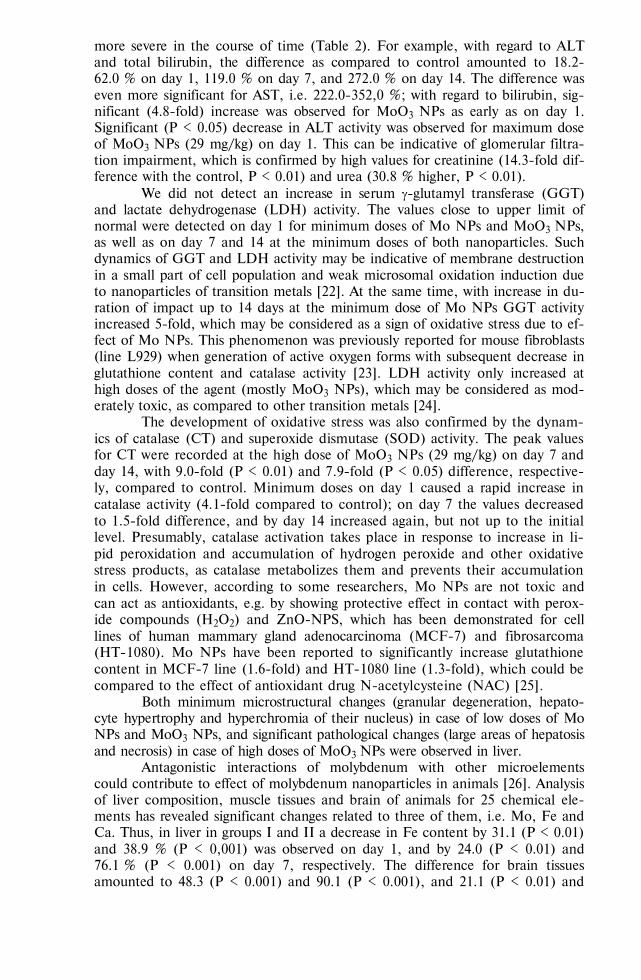
933
more severe in the course of time (Table 2). For example, with regard to ALT and total bilirubin, the difference as compared to control amounted to 18.2-62.0 % on day 1, 119.0 % on day 7, and 272.0 % on day 14. The difference was even more significant for AST, i.e. 222.0-352,0 %; with regard to bilirubin, sig-nificant (4.8-fold) increase was observed for МоО3 NPs as early as on day 1. Significant (Р < 0.05) decrease in ALT activity was observed for maximum dose of МоО3 NPs (29 mg/kg) on day 1. This can be indicative of glomerular filtra-tion impairment, which is confirmed by high values for creatinine (14.3-fold dif-ference with the control, Р < 0.01) and urea (30.8 % higher, Р < 0.01).
We did not detect an increase in serum -glutamyl transferase (GGT) and lactate dehydrogenase (LDH) activity. The values close to upper limit of normal were detected on day 1 for minimum doses of Мо NPs and MoO3 NPs, as well as on day 7 and 14 at the minimum doses of both nanoparticles. Such dynamics of GGT and LDH activity may be indicative of membrane destruction in a small part of cell population and weak microsomal oxidation induction due to nanoparticles of transition metals [22]. At the same time, with increase in du-ration of impact up to 14 days at the minimum dose of Mo NPs GGT activity increased 5-fold, which may be considered as a sign of oxidative stress due to ef-fect of Mo NPs. This phenomenon was previously reported for mouse fibroblasts (line L929) when generation of active oxygen forms with subsequent decrease in glutathione content and catalase activity [23]. LDH activity only increased at high doses of the agent (mostly МоО3 NPs), which may be considered as mod-erately toxic, as compared to other transition metals [24].
The development of oxidative stress was also confirmed by the dynam-ics of catalase (CT) and superoxide dismutase (SOD) activity. The peak values for CT were recorded at the high dose of МоО3 NPs (29 mg/kg) on day 7 and day 14, with 9.0-fold (Р < 0.01) and 7.9-fold (Р < 0.05) difference, respective-ly, compared to control. Minimum doses on day 1 caused a rapid increase in catalase activity (4.1-fold compared to control); on day 7 the values decreased to 1.5-fold difference, and by day 14 increased again, but not up to the initial level. Presumably, catalase activation takes place in response to increase in li-pid peroxidation and accumulation of hydrogen peroxide and other oxidative stress products, as catalase metabolizes them and prevents their accumulation in cells. However, according to some researchers, Mo NPs are not toxic and can act as antioxidants, e.g. by showing protective effect in contact with perox-ide compounds (H2O2) and ZnO-NPS, which has been demonstrated for cell lines of human mammary gland adenocarcinoma (MCF-7) and fibrosarcoma (HT-1080). Mo NPs have been reported to significantly increase glutathione content in MCF-7 line (1.6-fold) and HT-1080 line (1.3-fold), which could be compared to the effect of antioxidant drug N-acetylcysteine (NAC) [25].
Both minimum microstructural changes (granular degeneration, hepato-cyte hypertrophy and hyperchromia of their nucleus) in case of low doses of Mo NPs and MoO3 NPs, and significant pathological changes (large areas of hepatosis and necrosis) in case of high doses of MoO3 NPs were observed in liver.
Antagonistic interactions of molybdenum with other microelements could contribute to effect of molybdenum nanoparticles in animals [26]. Analysis of liver composition, muscle tissues and brain of animals for 25 chemical ele-ments has revealed significant changes related to three of them, i.e. Mo, Fe and Ca. Thus, in liver in groups I and II a decrease in Fe content by 31.1 (Р < 0.01) and 38.9 % (Р < 0,001) was observed on day 1, and by 24.0 (Р < 0.01) and 76.1 % (Р < 0.001) on day 7, respectively. The difference for brain tissues amounted to 48.3 (Р < 0.001) and 90.1 (Р < 0.001), and 21.1 (Р < 0.01) and
934
41.5 % (Р < 0,001), respectively. Application of MoO3 NPs was accompanied by similar changes. With regard to Ca, significant increase in accumulation in liver was only observed on day 1, by 17.1 % (Р < 0.05) in group I and by 26.3 % (Р < 0.01) in group II. Mo level analysis has demonstrated the same dy-namics (Fig.). Peak values were observed on day 1 and were directly dependent on Mo administration dose with clinical difference (136.9 %) for liver. During the next 7 days the amount of Мo in liver decreased in animals of group II by 41.55 %, of group I — by 4.41 %, as compared to the value on day 1.
Accumulation in brain at a dose of 1 mg/kg was comparable with that of intact animals. Increase of the dose up to 25 mg/kg led to an increase in Mo content by 83.3 % on day 1 and its decrease on day 7 up to the values below control ones.
The obtained results are gen-erally expectable. It is known that molybdenum is one of the essential microelements and its deficiency is accompanied by development of a number of pathologies in humans and animals [27]. However, reports exist
on toxic effect of molybdenum in the body, a strong connection between exces-sive Mo content and development of asthma [28], alveolar and bronchial ade-nomas and carcinomas [29], etc.
So, administration of Mo nanoparticles in rats is accompanied by capil-lary-trophic insufficiency, signs of oxidative stress, with more clear manifestation in case of molybdenum oxide nanoparticles. Considering the comparable doses of the agents, we may suggest that Mo nanoparticles are less toxic than nanoforms of its oxide.
R E F E R E N C E S
1. C h e n Y.X., W u C.W., K u o T.Y., C h a n g Y.L., J e n M.H., C h e n I.W. Large-scale
production of large-size atomically thin semiconducting molybdenum dichalcogenide sheets in water and its application for supercapacitor. Sci. Rep., 2016, 26(6): 26660 (doi: 10.1038/srep26660).
2. N a y l o r C.H., K y b e r t N.J., S c h n e i e r C., X i J., R o m e r o G., S a v e n J.G., L i u R., J o h n s o n A.T. Scalable production of molybdenum disulfide based biosensors. ACS Nano, 2016, 10(6): 6173-6179 (doi: 10.1021/acsnano.6b02137).
3. T a d i K.K., P a l v e A.M., P a l S., S u d e e p P.M., N a r a y a n a n T.N. Single step, bulk synthesis of engineered MoS2 quantum dots for multifunctional electrocatalysis. Nanotechnology, 2016, 27(27): 275402 (doi: 10.1088/0957-4484/27/27/275402).
4. P a r e n a g o O.P., B a k u n i n V.N., K u z ' m i n a G.N., S u s l o v A.L., V e d e n e e - v a L.M. DAN, 2002, 383(1): 84-86 (in Russ.).
5. L i u Q., S u n C., H e Q., L i u D., K h a l i l A., X i a n g T., W u Z., W a n g J., S o n g L. Ultrathin carbon layer coated MoO2 nanoparticles for high-performance near-infrared photothermal cancer therapy. Chem. Commun. (Camb.), 2015, 51(49): 10054-10057 (doi: 10.1039/c5cc02016f).
6. F a k h r i A., N e j a d P.A. Antimicrobial, antioxidant and cytotoxic effect of Molybdenum triox-ide nanoparticles and application of this for degradation of ketamine under different light illumina-tion. J. Photochem. Photobiol. B, 2016, 159: 211-217 (doi: 10.1016/j.jphotobiol.2016.04.002).
7. Z h a n g W., S h i S., W a n g Y., Y u S., Z h u W., Z h a n g X., Z h a n g D., Y a n g B., W a n g X., W a n g J. Versatile molybdenum disulfide based antibacterial composites for in vitro enhanced sterilization and in vivo focal infection therapy. Nanoscale, 2016, 8(22): 11642-11648 (doi: 10.1039/c6nr01243d).
8. Q u r e s h i N., C h a u d h a r i R., M a n e P., S h i n d e M., J a d a k a r S., R a n e S., K a l e B., B h a l e r a o A., A m a l n e r k a r D. Nanoscale Mo-MoO3 entrapped in engineer-ing thermoplastic: inorganic pathway to bactericidal and fungicidal action. IEEE Transactions on NanoBioscience, 2016, 15(3): 258-264 (doi: 10.1109/TNB.2016.2535285).
Mo accumulation in organs of Wistar rats upon single administration of Mo nanoparticles at various doses: a — control, b — 1 mg/kg, c — 25 mg/kg.
935
9. S a m J.S., Y u v a k k u m a r R., S u r i y a P.R., K a r u n a k a r a n G., R a j e n d r a n V., H o n g S.I. Facile and novel synthetic method to prepare nano molybdenum and its catalytic activity. IET Nanobiotechnology, 2015, 9(4): 201-208 (doi: 10.1049/iet-nbt.2014.0015).
10. M e n d e l R.R., B i t t n e r F. Cell biology of molybdenum. BBA, 2006, 1763: 621-635 (doi: 10.1016/j.bbamcr.2006.03.013).
11. M c B r i d e M.B., R i c h a r d s B.K., S t e e n h u i s T., S p i e r s G. Molybdenum uptake by forage crops grown on sewage sludge-amended soils in the field and greenhouse. J. Environ. Qual., 2000, 29: 848-854.
12. H e Z.L.L., Y a n g X.E., S t o f f e l l a P.J. Trace elements in agroecosystems and impacts on the environment. J. Trace Elem. Med. Bio., 2005, 19: 125-140 (doi: 10.1016/j.jtemb.2005.02.010).
13. V a n G e s t e l C.A.M., B o r g m a n E., V e r w e i j R.A., D i e z - O r t i z M. The influence of soil properties on the toxicity of molybdenum to three species of soil invertebrates. Ecotox. Environ. Safe., 2011, 74: 1-9 (doi: 10.1016/j.ecoenv.2010.10.001).
14. L e b e d e v S., Y a u s h e v a E., G a l a k t i o n o v a L., S i z o v a E. Impact of molybdenum nanoparticles on survival, activity of enzymes, and chemical elements in Eisenia fetida using test on artificial substrata. Environ. Sci. Pollut. Res. Int., 2016, 23(18): 18099-18110.
15. K o s y a n D., R u s a k o v a E., S i z o v a E., M i r o s h n i k o v S., S k a l n i y A. Impact of nanoparticles of heavy metals and their oxides on Stylonychia mytilus. Ecology, Environment and Conservation, 2015, 21: 113-119.
16. Fe rn á nd ez -Ur ru s uno R., F a t t a l E., Ro d r i g u e s J.M., F é g e r J., B e d o s s a P., C o - u v r e u r P. Effect of polymeric nanoparticle administration on the clearance activity of the mononuclear phagocyte system in mice. J. Biomed. Mater. Res., 1996, 31(3): 401-408.
17. Y a u s h e v a E.V., M i r o s h n i k o v S.A., K v a n O.V. Vestnik Orenburgskogo gosudarstven-nogo universiteta, 2013, 12(161): 203-207 (in Russ.).
18. O t t H.C., P r i o r C., H e r o l d M., R i h a M., L a u f e r G., O t t G. Respiratory symp-toms and bronchoalveolar lavage abnormalities in molybdenum exposed workers. Wien Klin Wochenschr., 2004, 116(1): 25-30.
19. K h a n t u r i n a G.R., I b r a e v a L.K., L e b e d e v a E.A. Uspekhi sovremennogo estestvoz-naniya, 2012, 12: 11-13 (in Russ.).
20. O s t r o u s h k o A.A., D a n i l o v a I.G., M e d v e d e v a S.Yu., G e t t e I.F., T o n -k u s h i n a M.O. Ural'skii meditsinskii zhurnal, 2010, 9(74): 114-117 (in Russ.).
21. O s t r o u s h k o A.A., G e t t e I.F., D a n i l o v a I.G., M e d v e d e v a S.Yu., T o n -k u s h i n a M.O., P r o k o f ' e v a A.V. Ural'skii meditsinskii zhurnal, 2011, 11(89): 75-79 (in Russ.).
22. A s a d i F., M o h s e n i M., D a d a s h i N o s h a h r K., S o l e y m a n i F.H., J a l i l v a n d A., H e i d a r i A. Effect of Molybdenum nanoparticles on blood cells, liver enzymes, and sexual hormones in male rats. Biol. Trace Elem. Res., 2016: 1-7 (doi: 10.1007/s12011-016-0765-5).
23. S i d d i q u i M.A., S a q u i b Q., A h a me d M., F a r s h o r i N.N., A h m a d J., W a h a b R., K h a n S.T., A l h a d l a q H.A., M u s a r r a t J., A l -K h e d h a i r y A.A., P a n t A.B. Mo-lybdenum nanoparticles-induced cytotoxicity, oxidative stress, G2/M arrest, and DNA damage in mouse skin fibroblast cells (L929). Colloids and Surfaces B: Biointerfaces, 2015, 1(125): 73-81 (doi: 10.1016/j.colsurfb.2014.11.014).
24. H u s s a i n S.M., H e s s K.L., G e a r h a r t J.M., G e i s s K.T., S c h l a g e r J.J. In vitro toxicity of nanoparticles in BRL 3A rat liver cells. Toxicol. in Vitro, 2005, 19(7): 975-983 (doi: 10.1016/j.tiv.2005.06.034).
25. A k h t a r M.J., A h a m e d M., A l h a d l a q H.A., A l s h a m s a n A., K h a n M.A., Al-rokayan S.A. Antioxidative and cytoprotective response elicited by molybdenum nanoparticles in hu-man cells. J. Colloid Interf. Sci., 2015, 457: 370-377 (doi: 10.1016/j.jcis.2015.07.034).
26. Z h o u S., Z h a n g C., X i a o Q., Z h u a n g Y., G u X., Y a n g F., X i n g C., H u G., C a o H. Effects of different levels of molybdenum on rumen microbiota and trace elements changes in tissues from goats. Biol. Trace Elem. Res., 2016, 174(1): 1-8 (doi: 10.1007/s12011-016-0706-3).
27. B o u r k e C.A. Molybdenum deficiency produces motor nervous effects that are consistent with amyotrophic lateral sclerosis. Front. Neurol., 2016, 7: 28 (doi: 10.3389/fneur.2016.00028).
28. H u a n g X., X i e J., C u i X., Z h o u Y., Wu X., L u W., S h e n Y., Y u a n J., C h e n W. Association between concentrations of metals in urine and adult asthma: a case-control study in Wuhan, China. PLoS ONE, 2016, 11(5): e0155818 (doi: 10.1371/journal.pone.0155818).
29. C h a n P.C., H e r b e r t R.A., R o y c r o f t J.H., H a s e m a n J.K., G r u m b e i n S.L., M i l l e r R.Al. Lung tumor induction by inhalation exposure to molybdenum trioxide in rats and mice. Toxicol. Sci., 1998, 45(1): 58-65.
937
AGRICULTURAL BIOLOGY, ISSN 2412-0324 (English ed. Online)
2016, V. 51, ¹ 6, pp. 937-945 (SEL’SKOKHOZYAISTVENNAYA BIOLOGIYA) ISSN 0131-6397 (Russian ed. Print)
ISSN 2313-4836 (Russian ed. Online)
Mycotoxicology: feeds, fodder crops UDC 636.085.19:636.086.1/.3:632.4(470) doi: 10.15389/agrobiology.2016.6.937rus
doi: 10.15389/agrobiology.2016.6.937eng
AFFECTION OF COARSE FODDERS BY TOXIGENIC Fusarium FUNGI
E.A. PIRYAZEVA, G.P. KONONENKO, A.A. BURKIN
All-Russian Research Institute of Sanitary, Hygiene and Ecology, Federal Agency of Scientific Organizations, 5, Zvenigorodskoe sh., Moscow, 123022 Russia, e-mail [email protected] Acknowledgements: We thank Dr T.Yu. Gagkaeva (All-Russian Research Institute of Plant Protection, St. Petersburg—Pushkin) for fungal identification and consultations Received April 27, 2016
A b s t r a c t
Lack of information about the distribution of toxigenic Fusarium fungi in hay and cereal straw which is used for bedding and feeding animals inhibits preventive measures against animal toxi-coses. Multiple combined fusariotoxin contamination of hay was recently established during ad-vanced mycotoxicological survey of commercially used batches from the livestock farms in European Russia (G.P. Kononenko, A.A. Burkin, 2014). The aim of this work was to study the species com-plex of fusaric fungi in fodders from Chelyabinsk, Bryansk and Moscow regions of Russia in different years and to evaluate the toxin-producing capacity of their populations. All 60 samples of hay and straw from Chelyabinsk region (1992) were colonized by fusaric fungi of 6 species — F. spo-rotrichioides Sherb, F. avenaceum (Corda ex Fr.) Sacc., F. poae (Peck) Wr., F. tricinctum (Corda) Sacc., F. culmorum (W.G. Smith) Sacc. and F. sambucinum Fuckel. Unidentified Fusarium species were detected in hay of bromegrass, galega, annual (a mixture of wheat, oats and peas) and perennial grasses, and a complex of these fungi was found in rye straw. The majority of samples (90 %) con-tained F. sporotrichioides (a single species, or this species along with other, but F. sporotrichioides mostly predominated). Of 19 samples of the hay and straw harvested in the Bryansk region (2011), 16 were infected by Fusarium fungi belonging to the same 8 species. F. sporotrichioides was found in 11 samples and prevailed, and the other 7 detected species were less frequent — F. tricinctum (4 sam-ples), F. equiseti (Corda) Sacc. (3 samples), F. poae (2 samples), F. solani (Mart.) Sacc. (2 samples), F. culmorum, F. graminearum Schw. and F. semitectum Berk. et Rav. (each in one sample). In fodders from Moscow region (2013) Fusarium fungi were found in 171 samples of 239 tested (71.5 %) and the affection was often very high. Isolated fungi belonged to the same 8 species as in other regions mentioned. By the frequency of occurrence they were ranged in the following order: F. sporotrichi-oides, F. tricinctum, F. avenaceum, F. poae, F. culmorum, F. graminearum, F. semitectum, F. solani, with F. sporotrichioides found in 85.7 % of the samples. In addition, we identified three isolates as F. cere-alis (Cooke) Sacc., F. sambucinum and F. torulosum (Berk. & M. A. Curtis). Fungal cultures grown on rice grain substrate at 23 С for 7 days were first used to test the toxin production. F. sporotrichi-oides was shown to possess 100 % potential for T-2 toxin (122-1078 μg/g) and diacetoxyscirpenol (0.7-20 μg/g) production, F. culmorum, F. graminearum, F. cerealis, F. torulosum — for deoxyniva-lenol and zearalenone production, and in two F. semitectum isolates the level of zearalenone was high. Extensive distribution of F. sporotrichioides producing T-2 toxin and its highly toxic analog di-acetoxyscirpenol, necessitates special attention to control the level of these trichothecenes at harvest-ing and storage of roughage. Specific features of toxin-production of other Fusarium species and hay contamination with deoxynivalenol and zearalenone are discussed.
Keywords: hay, straw, Fusarium fungi, mycotoxins
High-quality hay and straw are critical for the successful dairy and beef farmers both in temperate climatic zone and tropical areas. There is a significant progress in formation and optimal exploiting grasslands in many countries, but their safe use remains understudied. The reports on roughage contaminated with microscopic fungi capable of toxin production are of great concern. The abun-dant Fusarium, Aspergillus, Mucor, and Absidia microbiota has been found at sur-veys in Canada and Ireland [1, 2]. When harvesting bermudagrass (Cynodon sp.) hay, the major fodder cereal in tropics and subtropics, Fusarium population ac-
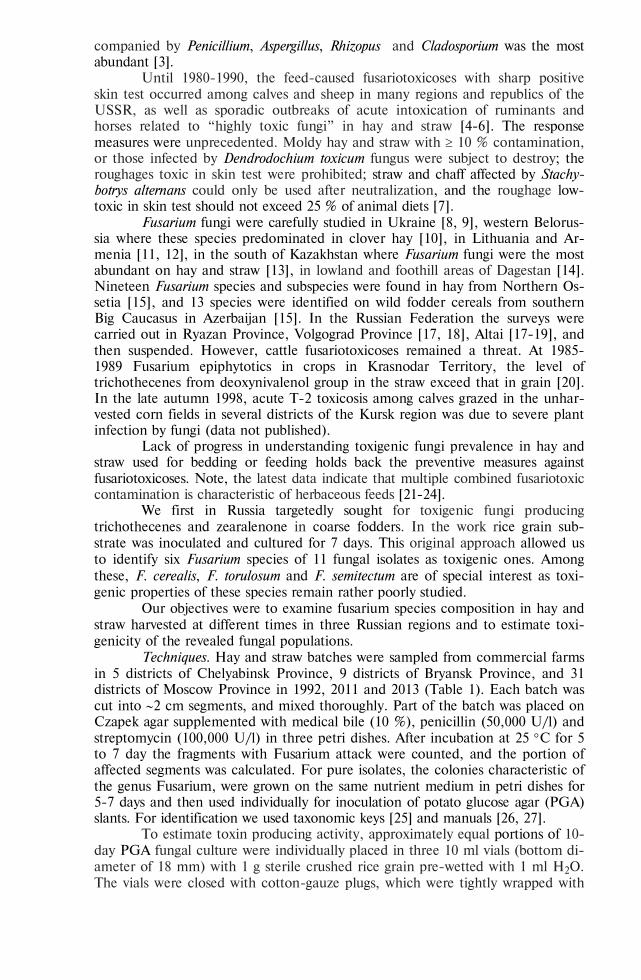
938
companied by Penicillium, Aspergillus, Rhizopus and Cladosporium was the most abundant [3].
Until 1980-1990, the feed-caused fusariotoxicoses with sharp positive skin test occurred among calves and sheep in many regions and republics of the USSR, as well as sporadic outbreaks of acute intoxication of ruminants and horses related to “highly toxic fungi” in hay and straw [4-6]. The response measures were unprecedented. Moldy hay and straw with 10 % contamination, or those infected by Dendrodochium toxicum fungus were subject to destroy; the roughages toxic in skin test were prohibited; straw and chaff affected by Stachy-botrys alternans could only be used after neutralization, and the roughage low-toxic in skin test should not exceed 25 % of animal diets [7].
Fusarium fungi were carefully studied in Ukraine [8, 9], western Belorus-sia where these species predominated in clover hay [10], in Lithuania and Ar-menia [11, 12], in the south of Kazakhstan where Fusarium fungi were the most abundant on hay and straw [13], in lowland and foothill areas of Dagestan [14]. Nineteen Fusarium species and subspecies were found in hay from Northern Os-setia [15], and 13 species were identified on wild fodder cereals from southern Big Caucasus in Azerbaijan [15]. In the Russian Federation the surveys were carried out in Ryazan Province, Volgograd Province [17, 18], Altai [17-19], and then suspended. However, cattle fusariotoxicoses remained a threat. At 1985-1989 Fusarium epiphytotics in crops in Krasnodar Territory, the level of trichothecenes from deoxynivalenol group in the straw exceed that in grain [20]. In the late autumn 1998, acute Т-2 toxicosis among calves grazed in the unhar-vested corn fields in several districts of the Kursk region was due to severe plant infection by fungi (data not published).
Lack of progress in understanding toxigenic fungi prevalence in hay and straw used for bedding or feeding holds back the preventive measures against fusariotoxicoses. Note, the latest data indicate that multiple combined fusariotoxic contamination is characteristic of herbaceous feeds [21-24].
We first in Russia targetedly sought for toxigenic fungi producing trichothecenes and zearalenone in coarse fodders. In the work rice grain sub-strate was inoculated and cultured for 7 days. This original approach allowed us to identify six Fusarium species of 11 fungal isolates as toxigenic ones. Among these, F. cerealis, F. torulosum and F. semitectum are of special interest as toxi-genic properties of these species remain rather poorly studied.
Our objectives were to examine fusarium species composition in hay and straw harvested at different times in three Russian regions and to estimate toxi-genicity of the revealed fungal populations.
Techniques. Hay and straw batches were sampled from commercial farms in 5 districts of Chelyabinsk Province, 9 districts of Bryansk Province, and 31 districts of Moscow Province in 1992, 2011 and 2013 (Table 1). Each batch was cut into 2 cm segments, and mixed thoroughly. Part of the batch was placed on Czapek agar supplemented with medical bile (10 %), penicillin (50,000 U/l) and streptomycin (100,000 U/l) in three petri dishes. After incubation at 25 С for 5 to 7 day the fragments with Fusarium attack were counted, and the portion of affected segments was calculated. For pure isolates, the colonies characteristic of the genus Fusarium, were grown on the same nutrient medium in petri dishes for 5-7 days and then used individually for inoculation of potato glucose agar (PGA) slants. For identification we used taxonomic keys [25] and manuals [26, 27].
To estimate toxin producing activity, approximately equal portions of 10-day PGA fungal culture were individually placed in three 10 ml vials (bottom di-ameter of 18 mm) with 1 g sterile crushed rice grain pre-wetted with 1 ml H2O. The vials were closed with cotton-gauze plugs, which were tightly wrapped with
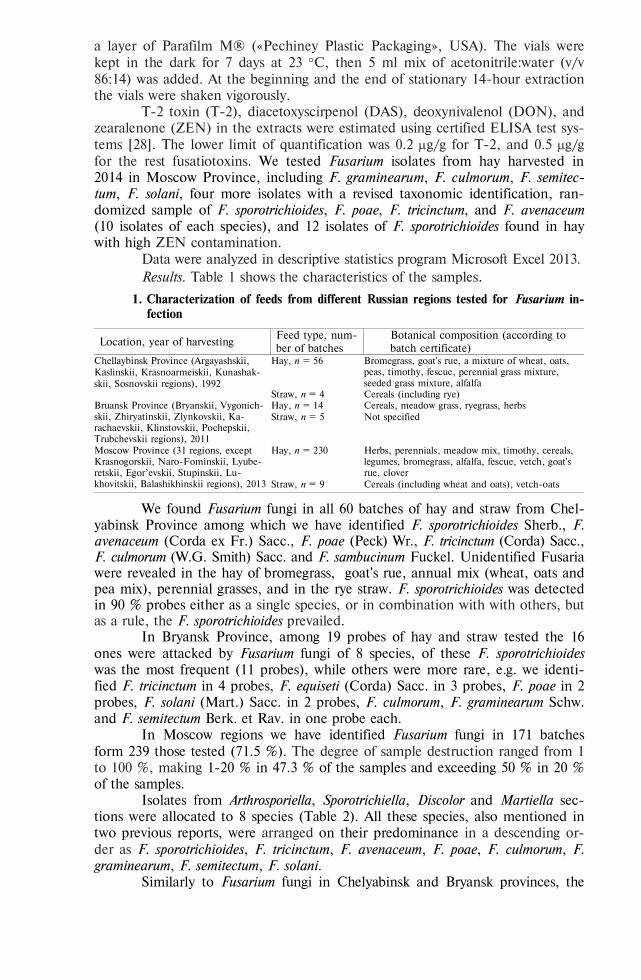
939
a layer of Parafilm M® («Pechiney Plastic Packaging», USA). The vials were kept in the dark for 7 days at 23 С, then 5 ml mix of acetonitrile:water (v/v 86:14) was added. At the beginning and the end of stationary 14-hour extraction the vials were shaken vigorously.
T-2 toxin (T-2), diacetoxyscirpenol (DAS), deoxynivalenol (DON), and zearalenone (ZEN) in the extracts were estimated using certified ELISA test sys-tems [28]. The lower limit of quantification was 0.2 g/g for Т-2, and 0.5 g/g for the rest fusatiotoxins. We tested Fusarium isolates from hay harvested in 2014 in Moscow Province, including F. graminearum, F. culmorum, F. semitec-tum, F. solani, four more isolates with a revised taxonomic identification, ran-domized sample of F. sporotrichioides, F. poae, F. tricinctum, and F. avenaceum (10 isolates of each species), and 12 isolates of F. sporotrichioides found in hay with high ZEN contamination.
Data were analyzed in descriptive statistics program Microsoft Excel 2013. Results. Table 1 shows the characteristics of the samples.
1. Characterization of feeds from different Russian regions tested for Fusarium in-fection
Location, year of harvesting Feed type, num-ber of batches
Botanical composition (according to batch certificate)
Chellaybinsk Province (Argayashskii, Kaslinskii, Krasnoarmeiskii, Kunashak-skii, Sosnovskii regions), 1992
Hay, n = 56 Bromegrass, goat's rue, a mixture of wheat, oats, peas, timothy, fescue, perennial grass mixture, seeded grass mixture, alfalfa
Straw, n = 4 Cereals (including rye) Bruansk Province (Bryanskii, Vygonich-skii, Zhiryatinskii, Zlynkovskii, Ka-rachaevskii, Klinstovskii, Pochepskii, Trubchevskii regions), 2011
Hay, n = 14 Cereals, meadow grass, ryegrass, herbs Straw, n = 5 Not specified
Moscow Province (31 regions, except Krasnogorskii, Naro-Fominskii, Lyube-retskii, Egor’evskii, Stupinskii, Lu-khovitskii, Balashikhinskii regions), 2013
Hay, n = 230 Herbs, perennials, meadow mix, timothy, cereals, legumes, bromegrass, alfalfa, fescue, vetch, goat's rue, clover
Straw, n = 9 Cereals (including wheat and oats), vetch-oats
We found Fusarium fungi in all 60 batches of hay and straw from Chel-yabinsk Province among which we have identified F. sporotrichioides Sherb., F. avenaceum (Corda ex Fr.) Sacc., F. poae (Peck) Wr., F. tricinctum (Corda) Sacc., F. culmorum (W.G. Smith) Sacc. and F. sambucinum Fuckel. Unidentified Fusaria were revealed in the hay of bromegrass, goat's rue, annual mix (wheat, oats and pea mix), perennial grasses, and in the rye straw. F. sporotrichioides was detected in 90 % probes either as a single species, or in combination with with others, but as a rule, the F. sporotrichioides prevailed.
In Bryansk Province, among 19 probes of hay and straw tested the 16 ones were attacked by Fusarium fungi of 8 species, of these F. sporotrichioides was the most frequent (11 probes), while others were more rare, e.g. we identi-fied F. tricinctum in 4 probes, F. equiseti (Corda) Sacc. in 3 probes, F. poae in 2 probes, F. solani (Mart.) Sacc. in 2 probes, F. culmorum, F. graminearum Schw. and F. semitectum Berk. et Rav. in one probe each.
In Moscow regions we have identified Fusarium fungi in 171 batches form 239 those tested (71.5 %). The degree of sample destruction ranged from 1 to 100 %, making 1-20 % in 47.3 % of the samples and exceeding 50 % in 20 % of the samples.
Isolates from Arthrosporiella, Sporotrichiella, Discolor and Martiella sec-tions were allocated to 8 species (Table 2). All these species, also mentioned in two previous reports, were arranged on their predominance in a descending or-der as F. sporotrichioides, F. tricinctum, F. avenaceum, F. poae, F. culmorum, F. graminearum, F. semitectum, F. solani.
Similarly to Fusarium fungi in Chelyabinsk and Bryansk provinces, the
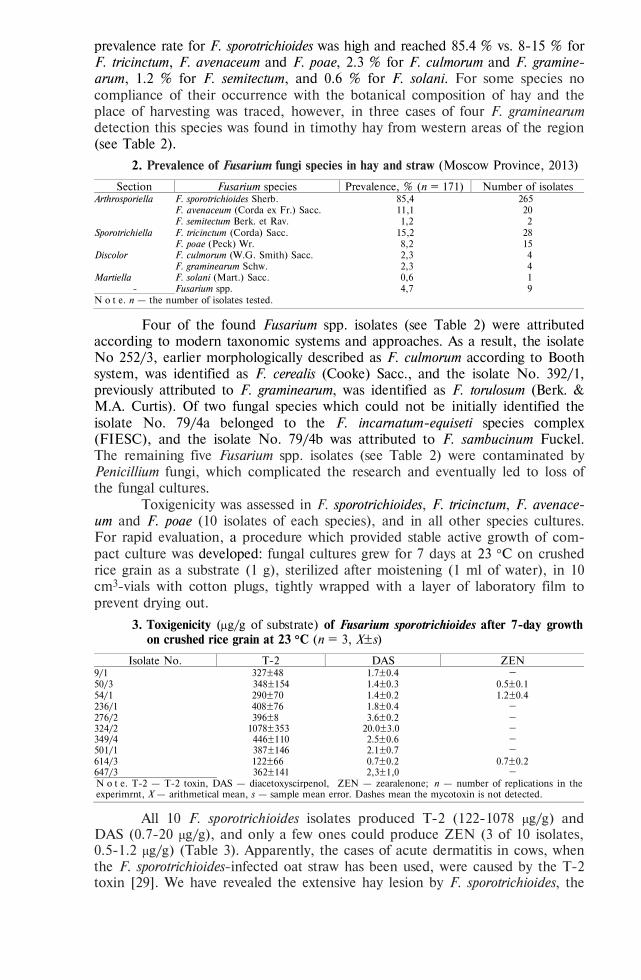
940
prevalence rate for F. sporotrichioides was high and reached 85.4 % vs. 8-15 % for F. tricinctum, F. avenaceum and F. poae, 2.3 % for F. culmorum and F. gramine-arum, 1.2 % for F. semitectum, and 0.6 % for F. solani. For some species no compliance of their occurrence with the botanical composition of hay and the place of harvesting was traced, however, in three cases of four F. graminearum detection this species was found in timothy hay from western areas of the region (see Table 2).
2. Prevalence of Fusarium fungi species in hay and straw (Moscow Province, 2013)
Section Fusarium species Prevalence, % (n = 171) Number of isolates Arthrosporiella F. sporotrichioides Sherb. 85,4 265 F. avenaceum (Corda ex Fr.) Sacc. 11,1 20 F. semitectum Berk. et Rav. 1,2 2 Sporotrichiella F. tricinctum (Corda) Sacc. 15,2 28 F. poae (Peck) Wr. 8,2 15 Discolor F. culmorum (W.G. Smith) Sacc. 2,3 4 F. graminearum Schw. 2,3 4 Martiella F. solani (Mart.) Sacc. 0,6 1
- Fusarium spp. 4,7 9 N o t e. n — the number of isolates tested.
Four of the found Fusarium spp. isolates (see Table 2) were attributed according to modern taxonomic systems and approaches. As a result, the isolate No 252/3, earlier morphologically described as F. culmorum according to Booth system, was identified as F. cerealis (Cooke) Sacc., and the isolate No. 392/1, previously attributed to F. graminearum, was identified as F. torulosum (Berk. & M.A. Curtis). Of two fungal species which could not be initially identified the isolate No. 79/4a belonged to the F. incarnatum-equiseti species complex (FIESC), and the isolate No. 79/4b was attributed to F. sambucinum Fuckel. The remaining five Fusarium spp. isolates (see Table 2) were contaminated by Penicillium fungi, which complicated the research and eventually led to loss of the fungal cultures.
Toxigenicity was assessed in F. sporotrichioides, F. tricinctum, F. avenace-um and F. poae (10 isolates of each species), and in all other species cultures. For rapid evaluation, a procedure which provided stable active growth of com-pact culture was developed: fungal cultures grew for 7 days at 23 С on crushed rice grain as a substrate (1 g), sterilized after moistening (1 ml of water), in 10 cm3-vials with cotton plugs, tightly wrapped with a layer of laboratory film to prevent drying out.
3. Toxigenicity (g/g of substrate) of Fusarium sporotrichioides after 7-day growth on crushed rice grain at 23 С (n = 3, X±s)
Isolate No. Т-2 DAS ZEN 9/1 327±48 1.7±0.4 – 50/3 348±154 1.4±0.3 0.5±0.1 54/1 290±70 1.4±0.2 1.2±0.4 236/1 408±76 1.8±0.4 – 276/2 396±8 3.6±0.2 – 324/2 1078±353 20.0±3.0 – 349/4 446±110 2.5±0.6 – 501/1 387±146 2.1±0.7 – 614/3 122±66 0.7±0.2 0.7±0.2 647/3 362±141 2,3±1,0 – N o t е. Т-2 — Т-2 toxin, DAS — diacetoxyscirpenol, ZEN — zearalenone; n — number of replications in the experimrnt, X — arithmetical mean, s — sample mean error. Dashes mean the mycotoxin is not detected.
All 10 F. sporotrichioides isolates produced T-2 (122-1078 μg/g) and DAS (0.7-20 μg/g), and only a few ones could produce ZEN (3 of 10 isolates, 0.5-1.2 μg/g) (Table 3). Apparently, the cases of acute dermatitis in cows, when the F. sporotrichioides-infected oat straw has been used, were caused by the T-2 toxin [29]. We have revealed the extensive hay lesion by F. sporotrichioides, the
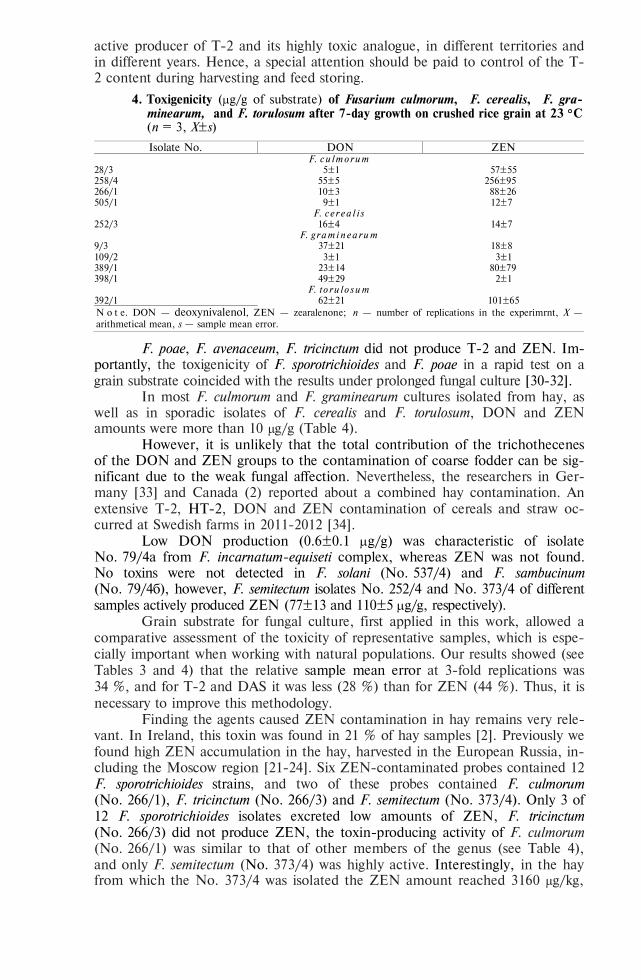
941
active producer of T-2 and its highly toxic analogue, in different territories and in different years. Hence, a special attention should be paid to control of the T-2 content during harvesting and feed storing.
4. Toxigenicity (g/g of substrate) of Fusarium culmorum, F. cerealis, F. gra-minearum, and F. torulosum after 7-day growth on crushed rice grain at 23 С (n = 3, X±s)
Isolate No. DON ZEN F. cu lmo rum
28/3 5±1 57±55 258/4 55±5 256±95 266/1 10±3 88±26 505/1 9±1 12±7
F. c e r ea l i s 252/3 16±4 14±7
F. g ram i nea ru m 9/3 37±21 18±8 109/2 3±1 3±1 389/1 23±14 80±79 398/1 49±29 2±1
F. to ru l o su m 392/1 62±21 101±65 N o t е. DON — deoxynivalenol, ZEN — zearalenone; n — number of replications in the experimrnt, X — arithmetical mean, s — sample mean error.
F. poae, F. аvenaceum, F. tricinctum did not produce Т-2 and ZEN. Im-portantly, the toxigenicity of F. sporotrichioides and F. poae in a rapid test on a grain substrate coincided with the results under prolonged fungal culture [30-32].
In most F. culmorum and F. graminearum cultures isolated from hay, as well as in sporadic isolates of F. cerealis and F. torulosum, DON and ZEN amounts were more than 10 μg/g (Table 4).
However, it is unlikely that the total contribution of the trichothecenes of the DON and ZEN groups to the contamination of coarse fodder can be sig-nificant due to the weak fungal affection. Nevertheless, the researchers in Ger-many [33] and Canada (2) reported about a combined hay contamination. An extensive T-2, НТ-2, DON and ZEN contamination of cereals and straw oc-curred at Swedish farms in 2011-2012 [34].
Low DON production (0.6±0.1 g/g) was characteristic of isolate No. 79/4а from F. incarnatum-equiseti complex, whereas ZEN was not found. No toxins were not detected in F. solani (No. 537/4) and F. sambucinum (No. 79/4б), however, F. semitectum isolates No. 252/4 and No. 373/4 of different samples actively produced ZEN (77±13 and 110±5 g/g, respectively).
Grain substrate for fungal culture, first applied in this work, allowed a comparative assessment of the toxicity of representative samples, which is espe-cially important when working with natural populations. Our results showed (see Tables 3 and 4) that the relative sample mean error at 3-fold replications was 34 %, and for T-2 and DAS it was less (28 %) than for ZEN (44 %). Thus, it is necessary to improve this methodology.
Finding the agents caused ZEN contamination in hay remains very rele-vant. In Ireland, this toxin was found in 21 % of hay samples [2]. Previously we found high ZEN accumulation in the hay, harvested in the European Russia, in-cluding the Moscow region [21-24]. Six ZEN-contaminated probes contained 12 F. sporotrichioides strains, and two of these probes contained F. culmorum (No. 266/1), F. tricinctum (No. 266/3) and F. semitectum (No. 373/4). Only 3 of 12 F. sporotrichioides isolates excreted low amounts of ZEN, F. tricinctum (No. 266/3) did not produce ZEN, the toxin-producing activity of F. culmorum (No. 266/1) was similar to that of other members of the genus (see Table 4), and only F. semitectum (No. 373/4) was highly active. Interestingly, in the hay from which the No. 373/4 was isolated the ZEN amount reached 3160 μg/kg,
942
and, when compared to the collection Fusarium strains on potato-sucrose agar, this species was classified as a possible ZEN producer [24].
Obviously, the mycological analyses of plants and feeds can not exhaust-ively reflect complex and dynamic processes in mycobiota, so the probability of identifying the causal relationships leading to an increased risk of fusariotoxicosis, is not so great. Nevertheless, the determination of the species composition and the toxigenic potential of the entire complex of Fusarium fungi affecting coarse fodder remains important, since high-toxic isolates are found among the new species [35]. Mycotoxicological evaluation of roughage should be continued not only for fusari-um fungi. The ability to produce ZEN and its derivatives is known for the phyto-pathogenic fungus Drechslera portulacae [36] and fungi of the genus Stachybotrys [37]. Using a moist chamber technique, we did not find fungi of highly toxic cel-lulose destructors — Stachybotrys alternans and Dendrodochium toxicum (= My-rothecium roridum) in hay and straw samples from the Chelyabinsk region, never-theless, fodder contamination by toxic metabolites is of special relevance. In re-cent years, new information about the prevalence of such fungi inhabiting soils and plant residues has appeared. Recently, mycobiota of maize phylloplans in the Primorsky Territory have been replenished with the Myrothecium verrucaria fun-gus, which can infect plants in the early ontogenesis [38].
Thus, among the fusarium fungi affecting hay and straw, six species are able to provide a combined contamination with mycotoxins — T-2 and DAS (Fusarium sporotrichioides), DON and ZEN (F. graminearum, F. culmorum, F. cere-alis, F. torulosum), and ZEN (F. semitectum). The extensive F. sporotrichioides in-fection, found in different territories and in different years, specially indicates the need to control the amount of T-2 and its highly toxic analogue, DAS, dur-ing harvesting and storage. It is rational to elucidate the causes of ZEN contam-ination in hay, taking into account the effects of biogenic and anthropogenic factors, as well as the possible contribution of fungi belonging to other taxonom-ic groups. The rapid fungal culture on grain substrate, first applied in this work and allowing a comparative assessment of the toxicity of fungi in a representative sample sets, seems to be promising for the investigation of natural populations.
R E F E R E N C E S
1. U n d i M., W i t t e n b e r g K.M., H o l l i d a y N.J. Occurrence of fungal species in stored
alfalfa forage as influenced by moisture content at baling and temperature during storage. Cana-dian Journal of Animal Science, 1997, 77: 95-103 (doi: 10.4141/A96-024).
2. B u c k l e y T., C r e i g h t o n A., F o g a r t y U. Analysis of Canadian and Irish forage, oats and commercially available equine concentrate feed for pathogenic fungi and mycotoxins. Irish Veterinary Journal, 2007, 60: 231-236 (doi: 10.1186/2046-0481-60-4-231).
3. T a f f a r e l L.E., M e s q u i t a E.E., C a s t a g n a r a D.D., C o s t a P.B., N e r e s M.A., H o r n M.B., O l i v e i r a P.S.R., M e i n e r s C.C. Dehydration curve, fungi and mycotoxins in Tifton 85 hay dehydrated in the field and in shed. Revista Brasileira de Zootecnia, 2013, 42(6): 395-403 (doi: 10.1590/S1516-35982013000600003).
4. K u r m a n o v I.A. Veterinariya, 1961, 11: 30-31 (in Russ.). 5. V e r t i n s k i i K.I., D z h i l a v y a n Kh.A., K o r o l e v a V.P. Byulleten' Vsesoyuznogo insti-
tuta eksperimental'noi veterinarii, 1967, issue 2: 86-90 (in Russ.). 6. K h m e l e v s k i i B.N., P i l i p e t s V.I., M a l i n o v s k a y a L.S., K o s t i n V.V., K o -
m a r n i t s k a y a N.P., I v a n o v V.G. Profilaktika mikotoksikozov zhivotnykh [Prevention of ani-mal mycotoxicoses]. Moscow, 1985 (in Russ.).
7. I v a n o v a L.G., G o l o v i n a N.L. V sbornike: Otsenka zagryazneniya pishchevykh produktov mikotoksinami. Tom III. Kontrol' za zagryazneniem prodovol'stvennogo syr'ya i pishchevykh produktov mikotoksinami [In: Evaluation of food contamination with mycotoxins. V. III. Control of raw materials and food contamination]. Moscow, 1985: 33-37 (in Russ.).
8. S t a r c h e n k o L.E. Toksichnye griby na grubykh kormakh i ikh mikologicheskii kontrol' v usloviyakh L'vovskoi oblasti. Avtoreferat kandidatskoi dissertatsii [Toxigenic fungi affecting coarse feed and mucological control under the conditions of Lvov region. PhD Thesis]. Lvov, 1967 (in Russ.).
943
9. R u k h l y a d a V.V. Fuzario-T-2-toksikoz sel'skokhozyaistvennykh zhivotnykh. Avtoreferat doktorskoi dissertatsii [T-2 fusariotoxicosis in farm animals. DSci. Thesis]. Moscow, 1991 (in Russ.).
10. I v a n o v A.T. Sanitarno-mikologicheskie issledovaniya bobovykh kul'tur v usloviyakh Belorusskoi SSR. Avtoreferat kandidatskoi dissertatsii [Sanitary and mycological study of legume crops in the Byelorussian SSR. PhD Thesis]. Moscow, 1967 (in Russ.).
11. G u s t a s A.P. Sanitarno-mikologicheskie issledovaniya kormov v usloviyakh Litovskoi SSR. Avtoreferat kandidatskoi dissertatsii [Sanitary and mycological study of fodder under conditions of the Lithuanian SSR. PhD Thesis]. Kaunas, 1968 (in Russ.).
12. L u g i n a Zh.A. Trudy Vsesoyuznogo nauchno issledovatel'skogo instituta veterinarnoi sanitarii, 1970, 35: 73-79 (in Russ.).
13. Z h a k h a n o v A. Mikotoksikologicheskaya kharakteristika grubykh kormov i osobennosti toksinoobrazovaniya griba Fusarium sporotrichioides Scherb. na yuge Kazakhstana. Avtoreferat kandidatskoi dissertatsii [Mycological characterization of coarse fodder and Fusarium sporotrichi-oides Scherb. toxigenesis in southern Kazakhstan. PhD Thesis]. Alma-Ata, 1975 (in Russ.).
14. S a l i k h o v a N.M. Trudy Vsesoyuznogo nauchno-issledovatel'skogo instituta veterinarnoi sanitar-ii, 1973, 47: 43-46 (in Russ.).
15. K a l o e v S.S. Trudy Kubanskogo sel'skokhozyaistvennogo instituta, 1975, 97(125): 3-7 (in Russ.). 16. I b r a g i m o v R.G. Mikoflora zernofurazha i vegetiruemykh kormovykh zlakov v yuzhnoi chasti
Bol'shogo Kavkaza Azerbaidzhana i ikh toksikologicheskaya kharakteristika. Avtoreferat kandi-datskoi dissertatsii [Mycoflora of grain fodder and cereals grown in southern Big Caucasus and their toxicologial characterization. PhD Thesis]. Kiev, 1980 (in Russ.).
17. L y c h a g i n G.Ya. Sbornik nauchnykh trudov Ryazanskogo SKHI, 1970, 24(2): 56-60 (in Russ.). 18. K o n o v o d o v a T.V. Materialy po izucheniyu aflatoksikoza ptits i toksicheskikh gribov na
kormakh Volgogradskoi oblasti. Avtoreferat kandidatskoi dissertatsii [Aflatoxicosis in birds and feed contamination with toxigenic fungi in Vlgograd region. PhD Thesis]. Moscow, 1974 (in Russ.).
19. K u r m a no v I.A., O s i p o v A.N. Trudy Vsesoyuznogo nauchno-issledovatel'skogo instituta veteri-narnoi sanitarii, 1970, 35: 80-87 (in Russ.).
20. L e o n o v A.N., K o n o n e n k o G.P., S o b o l e v a N.A. Mikologiya i fitopatologiya, 1989, 23(2): 147-151 (in Russ.).
21. K o n o n e n k o G.P., B u r k i n A.A. Mycotoxin contaminations in commercially used hay. Sel’skokhozyaistvennaya biologiya [Agricultrural Biology], 2014, 4: 120-126 (doi: 10.15389/agrobiology.2014.4.120rus) (in Russ.).
22. K o n o n e n k o G.P., B u r k i n A.A. Uspekhi meditsinskoi mikologii, 2014, 13: 305-306 (in Russ.). 23. K o n o n e n k o G.P., B u r k i n A.A. Materialy III Mezhdunarodnogo kongressa veterinarnykh
farmakologov i toksikologov «Effektivnye i bezopasnye lekarstvennye sredstva v veterinarii» [Proc. III Int. Conr. «Effective and safe drugs for veterinary»]. St. Petersburg, 2014: 123-125 (in Russ.).
24. B u r k i n A.A., K o n o n e n k o G.P., G a v r i l o v a O.P., G a g k a e v a T.Yu. About zeara-lenone levels in grass fodders and toxin producing activity of Fusarium fungi. Agricultural Biolo-gy, 2015, 50(2): 255-262 (doi: 10.15389/agrobiology.2015.2.255eng) (in Engl.).
25. V o o t h C. The genus Fusarium. Commonwealth Mycological Institute, Kew Surrey, 1971. 26. G e r l a c h W., N i r e n b e r g H. The genus Fusarium — a pictorial atlas. Berlin, 1982. 27. B i l a i V.I. Fuzarii [Fusarium fungi]. Kiev, 1977 (in Russ.). 28. B u r k i n A.A., K o n o n e n k o G.P. Mycotoxin contamination of meadow grasses in Europe-
an Russia. Agricultural Biology, 2015, 50(4): 503-512 (doi: 10.15389/agrobiology.2015.4.503eng) (in Engl.).
29. W u W., C o o k M.E., C h u F.S., B u t t l e s T., H u n g e r J., S u t h e r l a n d P. Case study of bovine dermatitis caused by oat straw infected with Fusarium sporotrichioides. Veterinary Records, 1997, 140(15): 399-400 (doi: 10.1136/vr.140.15.399).
30. B u r k i n A.A., S o b o l e v a N.A., K o n o n e n k o G.P. Mikologiya i fitopatologiya, 2008, 42(4): 354-358 (in Russ.).
31. T o k a r e v S.V., K o n o n e n k o G.P., S o b o l e v a N.A., B u r k i n A.A. Toxin production in population Fusarium poae on corn of cereals in Ural and Western Siberia. Sel’skokhozyaistvennaya biologiya [Agricultrural Biology], 2009, 1: 89-92. Available http://www.agrobiology.ru/1-2009tokarev.html. No date (in Russ.).
32. K o n o n e n k o G.P., B u r k i n A.A., S o b o l e v a N.A. Trudy VIEV (Moskva), 2009, 75: 364-371 (in Russ.).
33. S c h o l l e n b e r g e r M., M ü l l e r H.M., R ü f l e M., S u c h y S., P l a n k S., D r o c h -n e r W. Natural occurrence of 16 Fusarium toxins in grains and feedstuffs of plant origin from Germany. Mycopathologia, 2006, 161: 43-52 (doi: 10.1007/s11046-005-0199-7).
34. N o r d k v i s t E., H ä g g b l o m P. Fusarium mycotoxin contamination of cereals and bedding straw at Swedish pig farms. Anim. Feed Sci. Tech., 2014, 198: 231-237 (doi: 10.1016/j.anifeedsci.2014.10.002).
35. Y l i - M a t t i l a T., W a r d T.J., O ’ D o n n e l l K., P r o c t o r R.H., B u r k i n A.A., K o -n o n e n k o G.P., G a v r i l o v a O.P., A o k i T., M c C o r m i c k S.P., G a g k a e v a T.Yu.

944
Fusarium sibiricum sp.nov, a novel type A trichothecene-producing Fusarium from northern Asia closely related to F. sporotrichioides and F. langsethiae. Int. J. Food Microbiol., 2011, 147(1): 58-68 (doi: 10.1016/j.ijfoodmicro.2011.03.007).
36. S u g a w a r a F., K i m K.-W., K o b a y a s h i K., U z a w a J., Y o s h i d a S., M u - r o f u s h i N., T a k a h a s h i N., S t r o b e l G.A. Zearalenone derivatives produced by the fungus Drechslera portulacae. Phytochemistry, 1992, 31(6): 1987-1990 (doi: 10.1016/0031-9422(92)80346-G).
37. Z a i c h e n k o A.M., A n d r i e n k o E.V., T s y g a n e n k o E.S. Makrotsiklicheskie trikhotet-senovye mikotoksiny [Macrocyclic trichothecene mycotoxins]. Kiev, 2008 (in Russ.).
38. M a r t y n y u k T.D., E g o r o v a L.N. Mikologiya i fitopatologiya, 2009, 43(5): 457-459 (in Russ.).
946
AGRICULTURAL BIOLOGY, ISSN 2412-0324 (English ed. Online)
2016, V. 51, ¹ 6, pp. 946-950 (SEL’SKOKHOZYAISTVENNAYA BIOLOGIYA) ISSN 0131-6397 (Russian ed. Print)
ISSN 2313-4836 (Russian ed. Online) UDC 636.085.19:615.917:579.64:579.222 doi: 10.15389/agrobiology.2016.6.946rus
doi: 10.15389/agrobiology.2016.6.946eng
STUDY OF AFLATOXIN B1-DESTROYING ACTIVITY OF Gliocladium roseum AND Trichoderma viride AND THEIR АNTAGONISM TOWARD
TOXIGENIC Aspergillus flavus
L.A. SHCHERBAKOVA, O.D. MIKITYUK, T.A. NAZAROVA, V.G. DZHAVAKHIYA
All-Russian Research Institute of Phytopathology, Federal Agency of Scientific Organizations, 5, ul. Institute, pos. Bol’shie Vyazemy, Odintsovskii Region, Moscow Province, 143050 Russia, e-mail [email protected], [email protected] Acknowledgements: Supported financially by Russian Science Foundation (RSF project ¹ 14-16-00150) Received February 9, 2016
A b s t r a c t
Aflatoxin B1-destroying activity and antagonistic potential of Gliocladium roseum GRZ7 and Trichoderma viride TV35 strains isolated from natural substrates colonized by aflatoxigenic As-pergillus flavus were studied in vitro. Submerged cultures of G. roseum grown on liquid Czapek's me-dium with casein hydrolizate (Czapek-CasH) at 28 С and 200 rpm for 7 days were able to destroy 80-90 % of aflatoxin B1 (AFB1), which was added in the nutrient medium before inoculation. T. viride grown under the same conditions destroyed only 48 % of initial AFB1 during the same time of cultivation. The tested T. viride strain effectively suppressed the growth of toxigenic A. flavus strain A11 on Czapek-CasH agar. Co-cultivation of A11 with T. viride TV35 resulted in 64 % diminution of the average colony diameter of the aflatoxigenic strain. The strain GRZ7 of G. roseum was ineffec-tive as an antagonist of A11. AFB1-destroyimg activity was detected in samples of high-molecular weight metabolites (> 5 kDa) isolated from culture liquid of G. roseum grown without AFB1. In ad-dition, T. viride ability to degrade the mycotoxin was shown to be inducible. Obtained results were supposed to be of interest for further investigation on decontamination of feeds, which are contami-nated with AFB1 or AFB1-producers.
Keywords: aflatoxin B1, biological decontamination, Gliocladium roseum, Trichoderma viride
Contamination of forage grains and plant materials with aflatoxins, the secondary metabolites of aspergillus fungi, is a serious problem. Because of hepatotoxicity, carcinogenicity and teratogenicity, aflatoxins are dangerous for the vast majority of warm-blooded organisms [1]. Feed contamination with afla-toxins can cause animal death or decreased production, and also lead to food stuff contamination [2]. Due to wide spread of aspergillas, their ability to evolve as facultative parasites on vegetating plants and, at the same time, to keep up saprophytic growth, it is almost impossible to completely exclude the contamina-tion of grain and fodder grass by aflatoxin producers during harvesting and stor-age. Therefore, the approaches to solving the problem are mainly aimed at de-contamination of raw materials [3, 4] or biocontrol of potentially aflatoxigenic Aspergillium species, in particular Aspergillus flavus, by microbial antagonists [5]. Due to the high stability of aflatoxins, their chemical or physical degradation is carried out under stringent conditions [6, 7]. This often reduces the feed quality making such treatment economically unprofitable. The biological method of de-contamination [8-10] is based on the use of secondary metabolites of some plants toxic to A. flavus [11], and also on the search for natural inhibitors of af-latoxinogenesis or microorganism that could serve as a source of enzymes de-stroying aflatoxins or transform them to non-hazardous derivatives [12-16].
For example, when some micromycetes colonizing natural substrates are grown together with the toxigenic isolates of A. flavus, aflatoxin B1 (AFB1), typ-
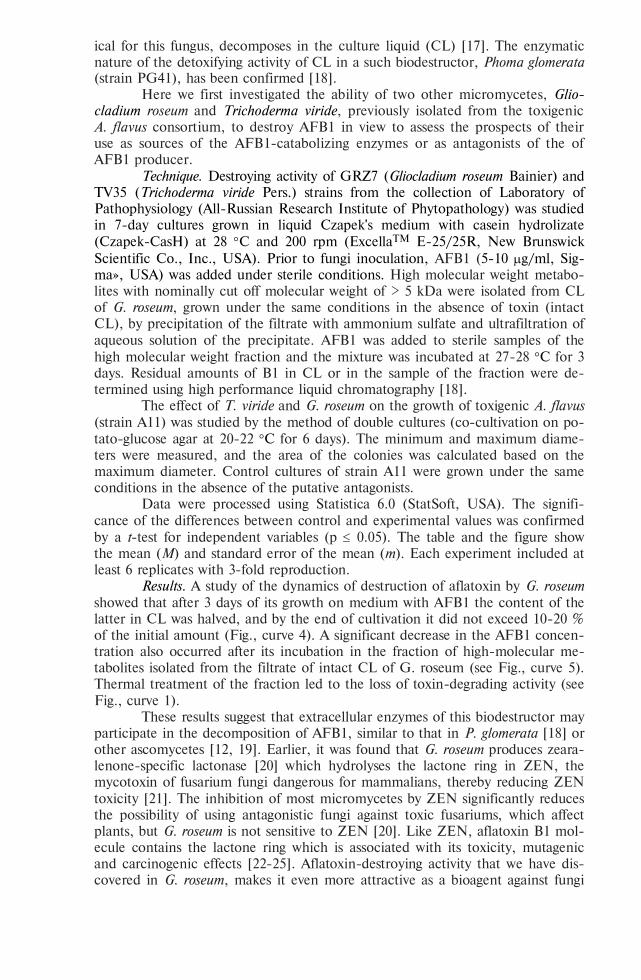
947
ical for this fungus, decomposes in the culture liquid (СL) [17]. The enzymatic nature of the detoxifying activity of СL in а such biodestructor, Phoma glomerata (strain PG41), has been confirmed [18].
Here we first investigated the ability of two other micromycetes, Glio-cladium roseum and Trichoderma viride, previously isolated from the toxigenic A. flavus consortium, to destroy AFB1 in view to assess the prospects of their use as sources of the AFB1-catabolizing enzymes or as antagonists of the of AFB1 producer.
Technique. Destroying activity of GRZ7 (Gliocladium roseum Bainier) and TV35 (Trichoderma viride Pers.) strains from the collection of Laboratory of Pathophysiology (All-Russian Research Institute of Phytopathology) was studied in 7-day cultures grown in liquid Czapek's medium with casein hydrolizate (Czapek-CasH) at 28 С and 200 rpm (ExcellaTM E-25/25R, New Brunswick Scientific Co., Inc., USA). Prior to fungi inoculation, AFB1 (5-10 g/ml, Sig-ma», USA) was added under sterile conditions. High molecular weight metabo-lites with nominally cut off molecular weight of > 5 kDa were isolated from СL of G. roseum, grown under the same conditions in the absence of toxin (intact СL), by precipitation of the filtrate with ammonium sulfate and ultrafiltration of aqueous solution of the precipitate. AFB1 was added to sterile samples of the high molecular weight fraction and the mixture was incubated at 27-28 С for 3 days. Residual amounts of B1 in СL or in the sample of the fraction were de-termined using high performance liquid chromatography [18].
The effect of T. viride and G. roseum on the growth of toxigenic A. flavus (strain A11) was studied by the method of double cultures (co-cultivation on po-tato-glucose agar at 20-22 С for 6 days). The minimum and maximum diame-ters were measured, and the area of the colonies was calculated based on the maximum diameter. Control cultures of strain A11 were grown under the same conditions in the absence of the putative antagonists.
Data were processed using Statistiсa 6.0 (StatSoft, USA). The signifi-cance of the differences between control and experimental values was confirmed by a t-test for independent variables (p 0.05). The table and the figure show the mean (M) and standard error of the mean (m). Each experiment included at least 6 replicates with 3-fold reproduction.
Results. A study of the dynamics of destruction of aflatoxin by G. roseum showed that after 3 days of its growth on medium with AFB1 the content of the latter in CL was halved, and by the end of cultivation it did not exceed 10-20 % of the initial amount (Fig., curve 4). A significant decrease in the AFB1 concen-tration also occurred after its incubation in the fraction of high-molecular me-tabolites isolated from the filtrate of intact CL of G. roseum (see Fig., curve 5). Thermal treatment of the fraction led to the loss of toxin-degrading activity (see Fig., curve 1).
These results suggest that extracellular enzymes of this biodestructor may participate in the decomposition of AFB1, similar to that in P. glomerata [18] or other ascomycetes [12, 19]. Earlier, it was found that G. roseum produces zeara-lenone-specific lactonase [20] which hydrolyses the lactone ring in ZEN, the mycotoxin of fusarium fungi dangerous for mammalians, thereby reducing ZEN toxicity [21]. The inhibition of most micromycetes by ZEN significantly reduces the possibility of using antagonistic fungi against toxic fusariums, which affect plants, but G. roseum is not sensitive to ZEN [20]. Like ZEN, aflatoxin B1 mol-ecule contains the lactone ring which is associated with its toxicity, mutagenic and carcinogenic effects [22-25]. Aflatoxin-destroying activity that we have dis-covered in G. roseum, makes it even more attractive as a bioagent against fungi
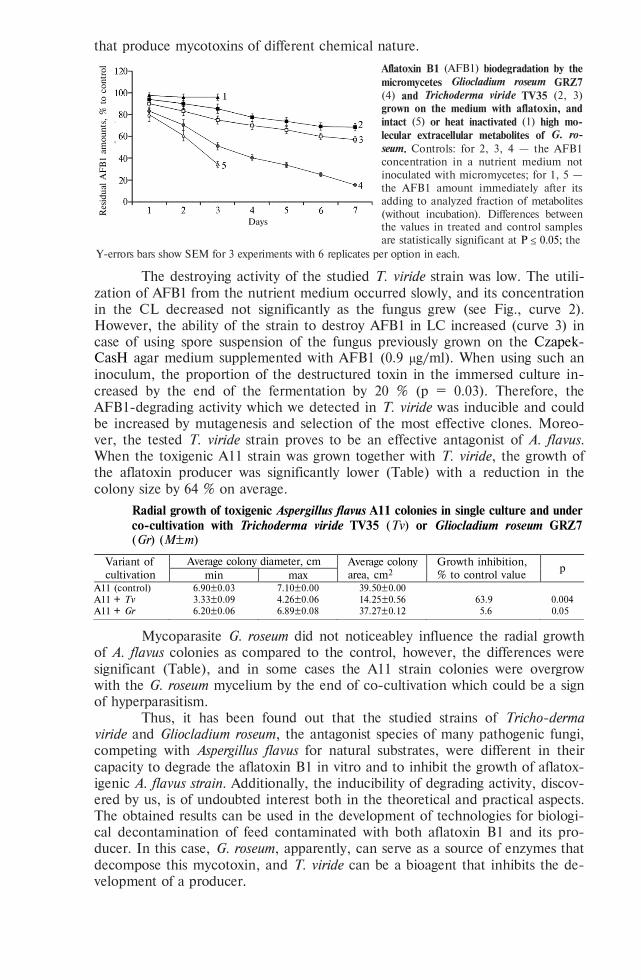
948
that produce mycotoxins of different chemical nature.
Aflatoxin B1 (AFB1) biodegradation by the micromycetes Gliocladium roseum GRZ7 (4) and Trichoderma viride TV35 (2, 3) grown on the medium with aflatoxin, and intact (5) or heat inactivated (1) high mo-lecular extracellular metabolites of G. ro-seum. Controls: for 2, 3, 4 — the AFB1 concentration in a nutrient medium not inoculated with micromycetes; for 1, 5 — the AFB1 amount immediately after its adding to analyzed fraction of metabolites (without incubation). Differences between the values in treated and control samples are statistically significant at Р 0.05; the
Y-errors bars show SEM for 3 experiments with 6 replicates per option in each.
The destroying activity of the studied T. viride strain was low. The utili-zation of AFB1 from the nutrient medium occurred slowly, and its concentration in the CL decreased not significantly as the fungus grew (see Fig., curve 2). However, the ability of the strain to destroy AFB1 in LC increased (curve 3) in case of using spore suspension of the fungus previously grown on the Czapek-CasH agar medium supplemented with AFB1 (0.9 μg/ml). When using such an inoculum, the proportion of the destructured toxin in the immersed culture in-creased by the end of the fermentation by 20 % (p = 0.03). Therefore, the AFB1-degrading activity which we detected in T. viride was inducible and could be increased by mutagenesis and selection of the most effective clones. Moreo-ver, the tested T. viride strain proves to be an effective antagonist of A. flavus. When the toxigenic A11 strain was grown together with T. viride, the growth of the aflatoxin producer was significantly lower (Table) with a reduction in the colony size by 64 % on average.
Radial growth of toxigenic Aspergillus flavus А11 colonies in single culture and under co-cultivation with Trichoderma viride TV35 (Tv) or Gliocladium roseum GRZ7 (Gr) (M±m)
Variant of cultivation
Average colony diameter, сm Average colony area, cm2
Growth inhibition, % to control value
р min max
А11 (control) 6.90±0.03 7.10±0.00 39.50±0.00 А11 + Tv 3.33±0.09 4.26±0.06 14.25±0.56 63.9 0.004 А11 + Gr 6.20±0.06 6.89±0.08 37.27±0.12 5.6 0.05
Mycoparasite G. roseum did not noticeabley influence the radial growth of A. flavus colonies as compared to the control, however, the differences were significant (Table), and in some cases the A11 strain colonies were overgrow with the G. roseum mycelium by the end of co-cultivation which could be a sign of hyperparasitism.
Thus, it has been found out that the studied strains of Tricho-derma viride and Gliocladium roseum, the antagonist species of many pathogenic fungi, competing with Aspergillus flavus for natural substrates, were different in their capacity to degrade the aflatoxin B1 in vitro and to inhibit the growth of aflatox-igenic A. flavus strain. Additionally, the inducibility of degrading activity, discov-ered by us, is of undoubted interest both in the theoretical and practical aspects. The obtained results can be used in the development of technologies for biologi-cal decontamination of feed contaminated with both aflatoxin B1 and its pro-ducer. In this case, G. roseum, apparently, can serve as a source of enzymes that decompose this mycotoxin, and T. viride can be a bioagent that inhibits the de-velopment of a producer.
Res
idual
AFB
1 am
ounts
, %
to
contr
ol
Days
949
R E F E R E N C E S
1. B b o s a G.S., K i t y a D., L u b e g a A., O g w a l -O k e n g J., A n o k b o n g g o W.W., K y e g o m b e D.B. Review of the biological and health effects of aflatoxins on body organs and body systems. In: Aflatoxins: recent advances and future prospects. M. Razzaghi-Abyaneh (ed.). InTech, Rijeka, Croatia, 2013: 239-266 (doi: 10.5772/51201).
2. F i l a s i A., S i r e l i U.T. Occurrence of aflatoxins in food. In: Aflatoxins: recent advances and future prospects. M. Razzaghi-Abyaneh (ed.). InTech, Rijeka, Croatia, 2013: 143-170 (doi: 10.5772/51031).
3. M i l l e r J.D., S c h a a f s m a A.W., B h a t n a g a r D., B o n d y G., C a r b o n e I., H a r -r i s L.J., H a r r i s o n G., M u n k v o l d G.P., O s w a l d I.P., P e s t k a J.J., S h a r p e L., S u m a r a h M.W., T i t t l e m i e r S.A., Z h o u T. Mycotoxins that affect the North Ameri-can agrifood sector: state of the art and directions for the future. World Mycotoxin Journal, 2014, 7(1): 63-82.
4. W h i t l o w L.W. Evaluation of mycotoxin binders. Proc. 4th Mid-Atlantic Nutrition Conference. N.G. Zimmermann (ed.). College Park, University of Maryland, 2006: 132-143.
5. D h r a m a p u t r a O.S., P u t r i A.S.R., R e t n o v a t i I., A m b a r w a t i S. Antagonistic ef-fect of three fungal isolates to aflatoxin-producing Aspergillus flavus. Biothropia, 2003, 21: 19-31.
6. R a t e r s M., M a t i s s e k R. Thermal stability of aflatoxin B1 and ochratoxin A. Mycotoxin Research, 2008, 24(3): 130-134 (doi: 10.1007/BF03032339).
7. W o m a c k E.D., B r o w n a b A.E., S p a r k s a D.L. A recent review of non-biological reme-diation of aflatoxin-contaminated crops. J. Sci. Food Agric., 2014, 94(9): 1706-1714 (doi: 10.1002/jsfa.6520).
8. Wu Q., J e z k o v a A., Y u a n Z., P a v l i k o v a L., D o h n a l V., K u c a K. Biological deg-radation of aflatoxins. Drug Metab. Rev., 2009, 41(1): 1-7 (doi: 10.1080/03602530802563850).
9. K a b a k B., D o b s o n A.D.W., V a r I. Strategies to prevent mycotoxin contamination of food and animal feed: A review. Critical Reviews in Food Science and Nutrition, 2006, 46: 593-619 (doi: 10.1080/10408390500436185).
10. M i s h r a H.N., D a s C. A review on biological control and metabolism of aflatoxin. Critical Reviews in Food Science and Nutrition, 2003, 43: 245-264 (doi: 10.1080/10408690390826518).
11. S h u k l a R., K u m a r A., P r a s a d C.S., S r i v a s t a v a B., D u b e y N.K. Antimycotic and antiaflatoxigenic potency of Adenocalymma alliaceum Miers. on fungi causing biodeteriora-tion of food commodities and raw herbal drugs. Int. Biodeter. Biodegr., 2008, 62: 348-351 (doi: 10.1016/j.ibiod.2007.11.006).
12. S a r d j o n o E., R a h a y u S., R a h a r j o S., R a h a y u K. Detoxification of aflatoxin B1 by extracellular enzymes of Aspergillus oryzae KKB4. Indonesian Food and Nutrition Progress, 2004, 11(1): 30-34.
13. M o t o m u r a M., T o y o m a s u T., M i z u n o 1 K., S h i n o z a w a 1 T. Purification and characterization of an aflatoxin degradation enzyme from Pleurotus ostreatus. Microbiol. Res., 2003, 158: 237-242 (doi: 10.1078/0944-5013-00199).
14. A l b e r t s J.F. Microbial degradation of mycotoxins. PhD Thesis. University of Stellenbosch, 2007. 15. G u a n S., J i C., Z h o u T., L i J.X., M a Q.G, N i u T.G. Aflatoxin B1 degradation by
Stenotrophomonas maltophilia and other microbes selected using coumarin medium. Int. J. Mol. Sci., 2008, 9: 1489-1503 (doi: 10.3390/ijms9081489).
16. C a o H., L i u D., M o X., X i e C., Y a o D. A fungal enzyme with the ability of aflatoxin B1 conversion: purification and ESI-MS/MS identification. Microbiol. Res., 2011, 166: 475-483 (doi: 10.1016/j.micres.2010.09.002).
17. Z h e m c h u z h i n a N., M i k i t y u k O., S h c h e r b a k o v a L., C a m p b e l l B., D o - r o f e e v a L., D z h a v a k h i y a V. Isolation of aflatoxin B1-degrading fungi among the my-coflora coincidental with toxigenic Aspergillus flavus. Proc. 14th Int. Congr. on Molecular Plant-Microbe Interactions. Quebec City, 2009: 158.
18. S h c h e r b a k o v a L., S t a t s y u k N., M i k i t y u k O., N a z a r o v a T., D z h a v a k h i -y a V. Aflatoxin B1-degrading activity by Phoma glomerata PG41 isolated from natural substrate colonized by aflatoxigenic Aspergillus flavus. Jundishapur Journal of Microbiology, 2015, 8(1): 1-5 (doi: 10.5812/jjm.24324).
19. Fo r oo t a n f a r a H., F a r a m a r z i a M.A., S h a h v e r d i a A.R., Y a z d i a M.T. Purifica-tion and biochemical characterization of extracellular laccase from the ascomycete Paraconiothyrium variabile. Bioresource Technol., 2011, 10(2): 1808-1814 (doi: 10.1016/j.biortech.2010.09.043).
20. U t e r m a r k J., K a r l o v s k y P. Role of zearalenone lactonase in protection of Gliocladium roseum from fungitoxic effects of the mycotoxin zearalenone. Appl. Environ. Microb., 2007, 73(2): 637-642 (doi: 10.1128/AEM.01440-06).
21. U t e r m a r k J., K a r l o v s k y P. Detoxification of zearalenone by Gliocladium roseum: bio-logical function and regulation of zearalenone lactonase synthesis. Proc. 29th Mycotoxin Work-shop. Fellbach, 2007: 54.
22. L e e L.S., D u n n J.J., D e L u c c a A.J., C i e g l e r A. Role of lactone ring of aflatoxin B1

950
in toxicity and mutagenicity. Experientia, 1981, 37: 16-17 (doi: 10.1007/BF01965543). 23. G u a n S., Z h o u T., Y m Y., X i e M., R u a n Z., Y o u n g J.C. Microbial strategies
to control aflatoxins in food and feed. World Mycotoxin Journal, 2011, 4: 413-424 (doi: 10.3920/WMJ2011.1290
24. N i c o l á s - V á z q u e z I., M é n d e z -A l b o r e s A., M o r e n o -M a r t í n e z E., M i -r a n d a R., C a s t r o M. Role of lactone ring in structural, electronic, and reactivity proper-ties of aflatoxin B1: a theoretical study. Arch. Environ. Con. Tox., 2010, 59(3): 393-406 (doi: 10.1007/s00244-010-9501-x).
25. I r a m W., A n j u m T., I q b a l M., G h a f f a r A., A b b a s M. Mass spectrometric identifi-cation and toxicity assessment of degraded products of aflatoxin B1 and B2 by Corymbia citri-odora aqueous extracts. Scientific Reports, 2015, 5: 14672 (doi: 10.1038/srep14672).
951
AGRICULTURAL BIOLOGY, ISSN 2412-0324 (English ed. Online)
2016, V. 51, ¹ 6, pp. 951-960 (SEL’SKOKHOZYAISTVENNAYA BIOLOGIYA) ISSN 0131-6397 (Russian ed. Print)
ISSN 2313-4836 (Russian ed. Online) UDC 636.087.26:633.39:581.145 doi: 10.15389/agrobiology.2016.6.951rus
doi: 10.15389/agrobiology.2016.6.951eng BIOLOGY OF FLOWERING, DIVERSITY OF SEXUAL TYPES AND SEED
PRODUCTION IN Salsola orientalis S.G. Gmel.
E.Z. SHAMSUTDINOVA
W.R. Williams All-Russian Fodder Research Institute, Federal Agency of Scientific Organizations, korp. 1, ul. Nauchnii Gorodok, Lobnya, Moscow Province, 141055 Russia, å-mail [email protected] Received March 21, 2016
A b s t r a c t
Reproductive biology of many cultivated plants has been studied in detail whereas in newly introduced, especially arid fodder species, different aspects of flowering, pollination, reproduction, seed production, etc., should be understood. Salsola orientalis S.G. Gmel. is a dwarf semi shrub ha-loxerophyte plant vegetated for a long period (250-254 days), 35-55 cm in height, with the root sys-tem of the generic type that penetrates the soil to a depth of 5-8 m. The species is extremely drought-resistant and tolerant to salt stress so this is a valuable fodder pasture plant in the deserts of Central Asia, well eaten by sheep and camels, especially in autumn and winter. Salsola orientalis is a polymorphic species consisting of a plurality of intraspecific ecotypes, populations and biotypes which differ in environmental sustainability and fodder productivity. S. orientalis is considered prom-ising for breeding due to intraspecific plant polymorphism on adaptiveness and productivity. Here we report the data on flowering, intraspecific diversity of sexual types in population, and seed reproduc-tive function of S. orientalis. The seeds were collected in arid, geographically and environmentally distinct areas of Tajikistan, Kyrgyzstan, Uzbekistan, and sown in the Desert Karnabchul (Uzbeki-stan, Samarkand region, Karnab). Karnabchul is characterized by hot summers (+40-45 C in June-July) and dry climate (annual precipitation of 180 mm with 100-250 mm fluctuations). The soil is grey-brown, middle-saline. This study was carried out in the nursery (each plot of 100 m2 in size) by the method of A.N. Ponomarev. The number of functionally female flowers on each plant in all populations was estimated. The type of pollination was determined in experiments with isolation of individual plants and flowers. Embryonless seeds were found among the specimen collected in dif-ferent eco-geographical areas and in three tested S. orientalis varieties (Pervenets Karnaba, Solnech-nyi and Salang). The seed of these varieties were divided into three fractions by size (large, medium and small) and weight of 1000 seeds. We found that the flowers in S. orientalis were cross-wind-pollinated. Self-pollination does not occur, since by the time of stamen appearance in bisexual flowers the pistil turns brown and dry. S. orientalis flowering begins in June and lasts until mid-July, the hot-test season. However, the disclosure and the dusting of the flowers occur in the cooler morning hours (at a temperature of 25-26 С and relative humidity of 26-65 %). In S. orientalis, self-incompatibility to avoid self-fertilization is not limited to dichogamy (i.e., non-simultaneous maturation of male and fe-male generative structures of hermaphrodite individuals), and also combined with other adaptations to cross-pollination. These are the presence of female flowers and intermediate flowers with long stigma lobes of the pistil, and emergence of the plants with only functionally female flowers. The cross-pollination in S. orientalis is provided by both genetic incompatibility and structure of the flower. We attributed S. orientalis species to trioecious plants because i) only staminate flowers, ii) hermaphrodite and pistillate flowers, and iii) only pistillate flowers were characteristic of the individuals in the popula-tion. A wide variation on embryoless seed ratio (from 0-2 % to 98-100 %) was found in S. orientalis. Hence, selection makes it possible to increase the number of plant with low embryoless seed ratio in the population. Similar result can be achieved when using the parental forms with low percentage of em-bryoless seeds in breeding to obtain population with more frequent female forms. In both cases, you can get perspective parental forms for breeding varieties with low percentage of embryoless seeds and in-creased seed germination. Our findings are essential for development of S. orientalis breeding and seed production in the arid zones of Central Asia and Russia.
Keywords: Salsola orientalis, flowering, sex type, intrapopulation diversity, pollination type
The Russian scientists have notably contributed to plant reproductive bi-ology [1-3]. Special attention was paid to embryogeny [4], polyembryony [5], genetic heterogeneity of seeds [6, 7], embryo autonomy [8], embryological bases of androclinic haploidy [9, 10]. These fundamental knowledges were the bases
952
for effective technologies used to create wheat, barley, and sunflower varieties and lines [11-13], and to reproduce valuable genotypes of rare plant species for preserving their biodiversity and extending resource reproduction [14-16]. Fur-ther studies concerned the origin of different types of embryonic sacs and ovules, fertilization processes, the peculiar morphogenetic structures, seed development, and the role of heterospermia in seed reproduction [17-19]. The data elucidated the role of position control in the specialization of female gametophyte cells [20, 21], their capacity for polyembryony, and the cytoembryological mechanisms of interspecific and interlinear hybridization in economically important species of cultivated plants [22, 23]. The achievements in reproductive biology have be-come the theoretical basis for effective (innovative) methods in breeding [23, 24], reproduction of biological resources [25], biodiversity conservation [26] and the biotechnologies used to massively reproduce valuable genotypes [27, 28].
Though the reproductive biology of many cultivated plants has been quite well studied, in introduced species, especially arid fodder plants, bloom bi-ology, types of pollination, seed reproduction, and other related aspects have hardly been investigated [29]. Eastern salsola (Salsola orientalis S.G. Gmel.), a haloxerophytic semi-shrub which is widely used to restore the forage productivity of degraded pastures in the arid regions of Central Asia and Russia, is among these species [29]. Eastern salsola is a perennial plant with a root system of a universal type deeply penetrating into the soil, which possesses exceptionally high drought tolerance and tolerance to salt stress, serves as a valuable fodder plant on the arid pastures of Central Asia, is well eaten by sheep and camels, es-pecially in autumn and winter seasons [29].
Eastern salsola is a polymorphous species consisting of a multitude of in-traspecific ecotypes, populations and biotypes [29]. Its ecotypes and population forms that appeared during evolution in ecologically distinct climatic and edaph-ic conditions of arid zones are endowed with different adaptive and productive potentials. Such ecotype and population diversity on ecological and economical-ly valuable traits predetermines the possibility of its improvement toward more productive drought and salt tolerant varieties.
Domestic and foreign experience of breeding forage plants indicates the success to be largely depending on the knowledge of reproductive biology. In this paper we first experimentally established that the Eastern salsola is a cross-wind-pollinated trioecious species. Cross-pollination is ensured by the system of genetic incompatibility and a peculiar structure of the flower. The daily and seasonal rhythms of flowering were studied under extremely harsh xerothermal conditions of the arid climate of the Central Asia, with the stages of flowers' opening and dusting described. Manifestation of the absence of corcule and its dependence on the conditions of the year were established. Based on that, we revealed a wide var-iability of the seeds on this trait and proposed a method for selecting plants in which the absence of corcule is low and the rate of seed germination is high.
Our aim was the study of daily and seasonal flowering rhythms, as well as estimation of the intraspecific population diversity on sexual types and seed reproduction in Eastern salsola plants in view of its breeding and seed produc-tion in arid regions of Central Asia and Russia.
Technique. Eastern salsola seeds which differed in ecological and geo-graphical origin were collected in arid regions of Tajikistan, Kyrgyzstan, Uzbeki-stan, and then sown under the conditions of Karnabchul Desert, Uzbekistan, Samarkand region, Karnab) in 1998-1999. Plant reproductive biology was stud-ied in the collection nursery as described by A.N. Ponomarev [30]. A plot size was 100 m2 [30].
Since June, the flower structure was studied, and the dynamics of flower
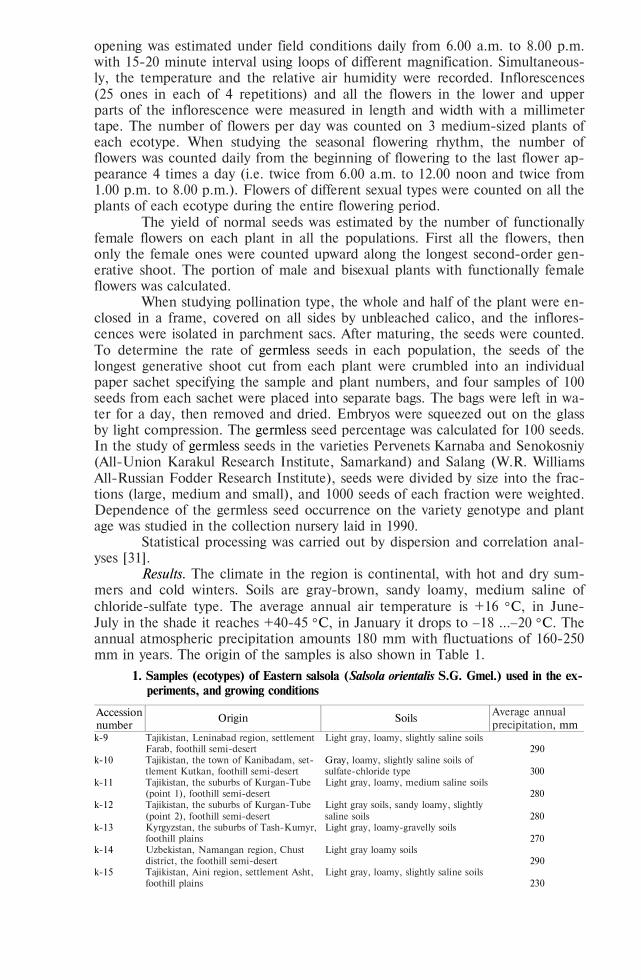
953
opening was estimated under field conditions daily from 6.00 a.m. to 8.00 p.m. with 15-20 minute interval using loops of different magnification. Simultaneous-ly, the temperature and the relative air humidity were recorded. Inflorescences (25 ones in each of 4 repetitions) and all the flowers in the lower and upper parts of the inflorescence were measured in length and width with a millimeter tape. The number of flowers per day was counted on 3 medium-sized plants of each ecotype. When studying the seasonal flowering rhythm, the number of flowers was counted daily from the beginning of flowering to the last flower ap-pearance 4 times a day (i.e. twice from 6.00 a.m. to 12.00 noon and twice from 1.00 p.m. to 8.00 p.m.). Flowers of different sexual types were counted on all the plants of each ecotype during the entire flowering period.
The yield of normal seeds was estimated by the number of functionally female flowers on each plant in all the populations. First all the flowers, then only the female ones were counted upward along the longest second-order gen-erative shoot. The portion of male and bisexual plants with functionally female flowers was calculated.
When studying pollination type, the whole and half of the plant were en-closed in a frame, covered on all sides by unbleached calico, and the inflores-cences were isolated in parchment sacs. After maturing, the seeds were counted. To determine the rate of germless seeds in each population, the seeds of the longest generative shoot cut from each plant were crumbled into an individual paper sachet specifying the sample and plant numbers, and four samples of 100 seeds from each sachet were placed into separate bags. The bags were left in wa-ter for a day, then removed and dried. Embryos were squeezed out on the glass by light compression. The germless seed percentage was calculated for 100 seeds. In the study of germless seeds in the varieties Pervenets Karnaba and Senokosniy (All-Union Karakul Research Institute, Samarkand) and Salang (W.R. Williams All-Russian Fodder Research Institute), seeds were divided by size into the frac-tions (large, medium and small), and 1000 seeds of each fraction were weighted. Dependence of the germless seed occurrence on the variety genotype and plant age was studied in the collection nursery laid in 1990.
Statistical processing was carried out by dispersion and correlation anal-yses [31].
Results. The climate in the region is continental, with hot and dry sum-mers and cold winters. Soils are gray-brown, sandy loamy, medium saline of chloride-sulfate type. The average annual air temperature is +16 С, in June-July in the shade it reaches +40-45 С, in January it drops to 18 ...20 С. The annual atmospheric precipitation amounts 180 mm with fluctuations of 160-250 mm in years. The origin of the samples is also shown in Table 1.
1. Samples (ecotypes) of Eastern salsola (Salsola orientalis S.G. Gmel.) used in the ex-periments, and growing conditions
Accession number
Origin Soils Average annual precipitation, mm
k-9 Tajikistan, Leninabad region, settlement Farab, foothill semi-desert
Light gray, loamy, slightly saline soils 290
k-10 Tajikistan, the town of Kanibadam, set-tlement Kutkan, foothill semi-desert
Gray, loamy, slightly saline soils of sulfate-chloride type 300
k-11 Tajikistan, the suburbs of Kurgan-Tube (point 1), foothill semi-desert
Light gray, loamy, medium saline soils 280
k-12 Tajikistan, the suburbs of Kurgan-Tube (point 2), foothill semi-desert
Light gray soils, sandy loamy, slightly saline soils 280
k-13 Kyrgyzstan, the suburbs of Tash-Kumyr, foothill plains
Light gray, loamy-gravelly soils 270
k-14 Uzbekistan, Namangan region, Chust district, the foothill semi-desert
Light gray loamy soils 290
k-15 Tajikistan, Aini region, settlement Asht, foothill plains
Light gray, loamy, slightly saline soils 230
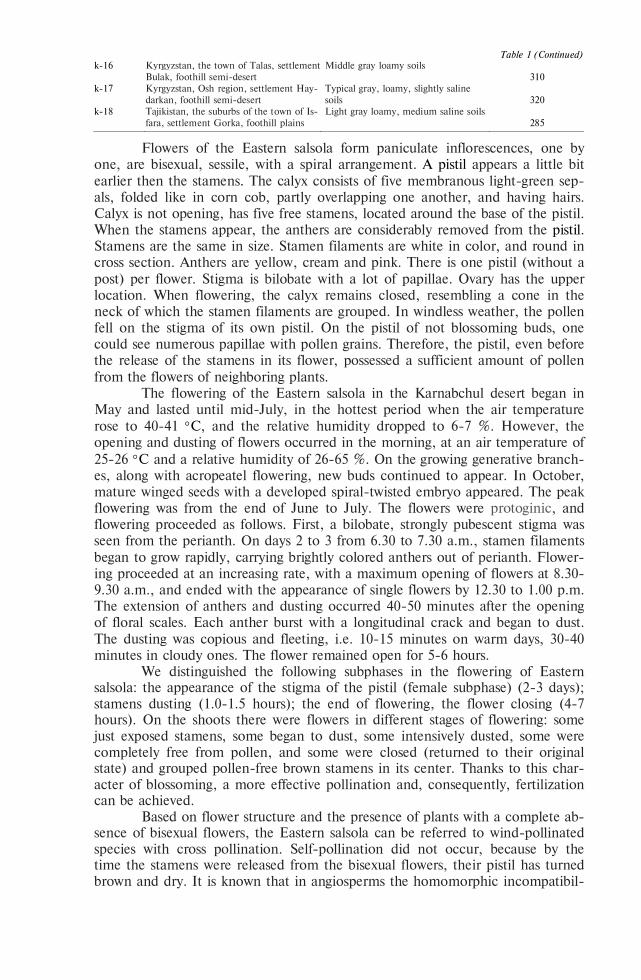
954
Table 1 (Continued)
k-16 Kyrgyzstan, the town of Talas, settlement Bulak, foothill semi-desert
Middle gray loamy soils 310
k-17 Kyrgyzstan, Osh region, settlement Hay-darkan, foothill semi-desert
Typical gray, loamy, slightly saline soils 320
k-18 Tajikistan, the suburbs of the town of Is-fara, settlement Gorka, foothill plains
Light gray loamy, medium saline soils 285
Flowers of the Eastern salsola form paniculate inflorescences, one by one, are bisexual, sessile, with a spiral arrangement. A pistil appears a little bit earlier then the stamens. The calyx consists of five membranous light-green sep-als, folded like in corn cob, partly overlapping one another, and having hairs. Calyx is not opening, has five free stamens, located around the base of the pistil. When the stamens appear, the anthers are considerably removed from the pistil. Stamens are the same in size. Stamen filaments are white in color, and round in cross section. Anthers are yellow, cream and pink. There is one pistil (without a post) per flower. Stigma is bilobate with a lot of papillae. Ovary has the upper location. When flowering, the calyx remains closed, resembling a cone in the neck of which the stamen filaments are grouped. In windless weather, the pollen fell on the stigma of its own pistil. On the pistil of not blossoming buds, one could see numerous papillae with pollen grains. Therefore, the pistil, even before the release of the stamens in its flower, possessed a sufficient amount of pollen from the flowers of neighboring plants.
The flowering of the Eastern salsola in the Karnabchul desert began in May and lasted until mid-July, in the hottest period when the air temperature rose to 40-41 С, and the relative humidity dropped to 6-7 %. However, the opening and dusting of flowers occurred in the morning, at an air temperature of 25-26 С and a relative humidity of 26-65 %. On the growing generative branch-es, along with acropeatel flowering, new buds continued to appear. In October, mature winged seeds with a developed spiral-twisted embryo appeared. The peak flowering was from the end of June to July. The flowers were protoginic, and flowering proceeded as follows. First, a bilobate, strongly pubescent stigma was seen from the perianth. On days 2 to 3 from 6.30 to 7.30 a.m., stamen filaments began to grow rapidly, carrying brightly colored anthers out of perianth. Flower-ing proceeded at an increasing rate, with a maximum opening of flowers at 8.30-9.30 a.m., and ended with the appearance of single flowers by 12.30 to 1.00 p.m. The extension of anthers and dusting occurred 40-50 minutes after the opening of floral scales. Each anther burst with a longitudinal crack and began to dust. The dusting was copious and fleeting, i.e. 10-15 minutes on warm days, 30-40 minutes in cloudy ones. The flower remained open for 5-6 hours.
We distinguished the following subphases in the flowering of Eastern salsola: the appearance of the stigma of the pistil (female subphase) (2-3 days); stamens dusting (1.0-1.5 hours); the end of flowering, the flower closing (4-7 hours). On the shoots there were flowers in different stages of flowering: some just exposed stamens, some began to dust, some intensively dusted, some were completely free from pollen, and some were closed (returned to their original state) and grouped pollen-free brown stamens in its center. Thanks to this char-acter of blossoming, a more effective pollination and, consequently, fertilization can be achieved.
Based on flower structure and the presence of plants with a complete ab-sence of bisexual flowers, the Eastern salsola can be referred to wind-pollinated species with cross pollination. Self-pollination did not occur, because by the time the stamens were released from the bisexual flowers, their pistil has turned brown and dry. It is known that in angiosperms the homomorphic incompatibil-
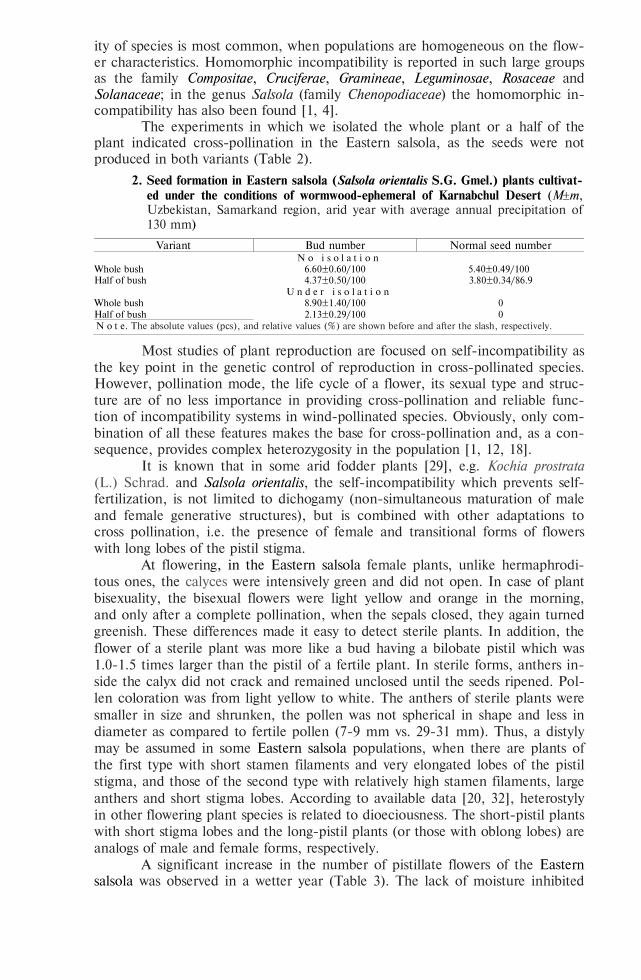
955
ity of species is most common, when populations are homogeneous on the flow-er characteristics. Homomorphic incompatibility is reported in such large groups as the family Compositae, Cruciferae, Gramineae, Leguminosae, Rosaceae and Solanaceae; in the genus Salsola (family Chenopodiaceae) the homomorphic in-compatibility has also been found [1, 4].
The experiments in which we isolated the whole plant or a half of the plant indicated cross-pollination in the Eastern salsola, as the seeds were not produced in both variants (Table 2).
2. Seed formation in Eastern salsola (Salsola orientalis S.G. Gmel.) plants cultivat-ed under the conditions of wormwood-ephemeral of Karnabchul Desert (Mm, Uzbekistan, Samarkand region, arid year with average annual precipitation of 130 mm)
Variant Bud number Normal seed number N o i s o l a t i o n
Whole bush 6.60±0.60/100 5.40±0.49/100 Half of bush 4.37±0.50/100 3.80±0.34/86.9
U n d e r i s o l a t i o n Whole bush 8.90±1.40/100 0 Half of bush 2.13±0.29/100 0 N o t å. The absolute values (pcs), and relative values (%) are shown before and after the slash, respectively.
Most studies of plant reproduction are focused on self-incompatibility as the key point in the genetic control of reproduction in cross-pollinated species. However, pollination mode, the life cycle of a flower, its sexual type and struc-ture are of no less importance in providing cross-pollination and reliable func-tion of incompatibility systems in wind-pollinated species. Obviously, only com-bination of all these features makes the base for cross-pollination and, as a con-sequence, provides complex heterozygosity in the population [1, 12, 18].
It is known that in some arid fodder plants [29], e.g. Kochia prostrata (L.) Schrad. and Salsola orientalis, the self-incompatibility which prevents self-fertilization, is not limited to dichogamy (non-simultaneous maturation of male and female generative structures), but is combined with other adaptations to cross pollination, i.e. the presence of female and transitional forms of flowers with long lobes of the pistil stigma.
At flowering, in the Eastern salsola female plants, unlike hermaphrodi-tous ones, the calyces were intensively green and did not open. In case of plant bisexuality, the bisexual flowers were light yellow and orange in the morning, and only after a complete pollination, when the sepals closed, they again turned greenish. These differences made it easy to detect sterile plants. In addition, the flower of a sterile plant was more like a bud having a bilobate pistil which was 1.0-1.5 times larger than the pistil of a fertile plant. In sterile forms, anthers in-side the calyx did not crack and remained unclosed until the seeds ripened. Pol-len coloration was from light yellow to white. The anthers of sterile plants were smaller in size and shrunken, the pollen was not spherical in shape and less in diameter as compared to fertile pollen (7-9 mm vs. 29-31 mm). Thus, a distyly may be assumed in some Eastern salsola populations, when there are plants of the first type with short stamen filaments and very elongated lobes of the pistil stigma, and those of the second type with relatively high stamen filaments, large anthers and short stigma lobes. According to available data [20, 32], heterostyly in other flowering plant species is related to dioeciousness. The short-pistil plants with short stigma lobes and the long-pistil plants (or those with oblong lobes) are analogs of male and female forms, respectively.
A significant increase in the number of pistillate flowers of the Eastern salsola was observed in a wetter year (Table 3). The lack of moisture inhibited
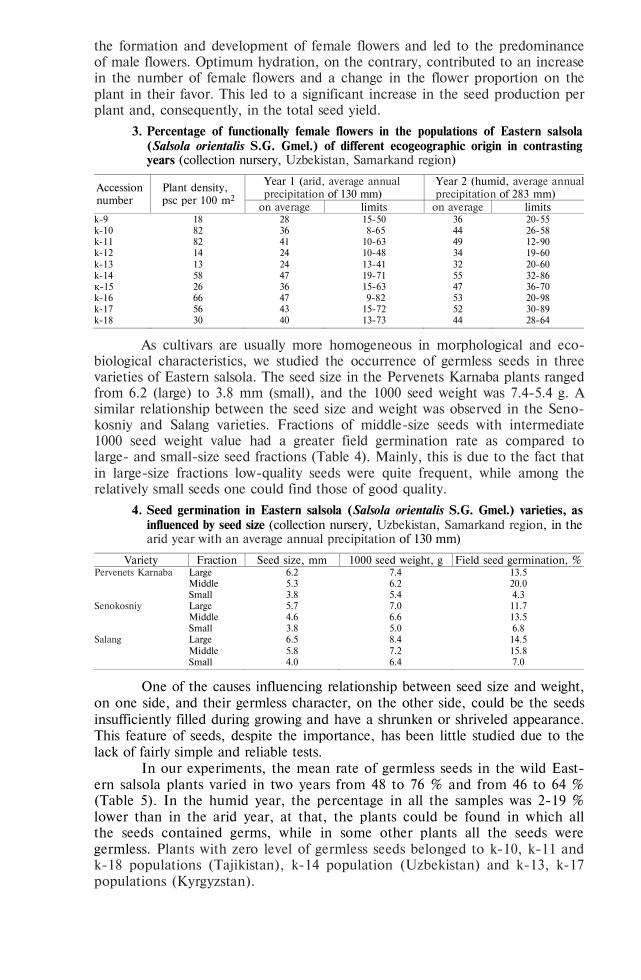
956
the formation and development of female flowers and led to the predominance of male flowers. Optimum hydration, on the contrary, contributed to an increase in the number of female flowers and a change in the flower proportion on the plant in their favor. This led to a significant increase in the seed production per plant and, consequently, in the total seed yield.
3. Percentage of functionally female flowers in the populations of Eastern salsola (Salsola orientalis S.G. Gmel.) of different ecogeographic origin in contrasting years (collection nursery, Uzbekistan, Samarkand region)
Accession number
Plant density, psc per 100 m2
Year 1 (arid, average annual precipitation of 130 mm)
Year 2 (humid, average annual precipitation of 283 mm)
on average limits on average limits k-9 18 28 15-50 36 20-55 k-10 82 36 8-65 44 26-58 k-11 82 41 10-63 49 12-90 k-12 14 24 10-48 34 19-60 k-13 13 24 13-41 32 20-60 k-14 58 47 19-71 55 32-86 к-15 26 36 15-63 47 36-70 k-16 66 47 9-82 53 20-98 k-17 56 43 15-72 52 30-89 k-18 30 40 13-73 44 28-64
As cultivars are usually more homogeneous in morphological and eco-biological characteristics, we studied the occurrence of germless seeds in three varieties of Eastern salsola. The seed size in the Pervenets Karnaba plants ranged from 6.2 (large) to 3.8 mm (small), and the 1000 seed weight was 7.4-5.4 g. A similar relationship between the seed size and weight was observed in the Seno-kosniy and Salang varieties. Fractions of middle-size seeds with intermediate 1000 seed weight value had a greater field germination rate as compared to large- and small-size seed fractions (Table 4). Mainly, this is due to the fact that in large-size fractions low-quality seeds were quite frequent, while among the relatively small seeds one could find those of good quality.
4. Seed germination in Eastern salsola (Salsola orientalis S.G. Gmel.) varieties, as influenced by seed size (collection nursery, Uzbekistan, Samarkand region, in the arid year with an average annual precipitation of 130 mm)
Variety Fraction Seed size, mm 1000 seed weight, g Field seed germination, % Pervenets Karnaba Large
Middle Small
6.2 5.3 3.8
7.4 6.2 5.4
13.5 20.0 4.3
Senokosniy Large Middle Small
5.7 4.6 3.8
7.0 6.6 5.0
11.7 13.5 6.8
Salang Large Middle Small
6.5 5.8 4.0
8.4 7.2 6.4
14.5 15.8 7.0
One of the causes influencing relationship between seed size and weight, on one side, and their germless character, on the other side, could be the seeds insufficiently filled during growing and have a shrunken or shriveled appearance. This feature of seeds, despite the importance, has been little studied due to the lack of fairly simple and reliable tests.
In our experiments, the mean rate of germless seeds in the wild East-ern salsola plants varied in two years from 48 to 76 % and from 46 to 64 % (Table 5). In the humid year, the percentage in all the samples was 2-19 % lower than in the arid year, at that, the plants could be found in which all the seeds contained germs, while in some other plants all the seeds were germless. Plants with zero level of germless seeds belonged to k-10, k-11 and k-18 populations (Tajikistan), k-14 population (Uzbekistan) and k-13, k-17 populations (Kyrgyzstan).
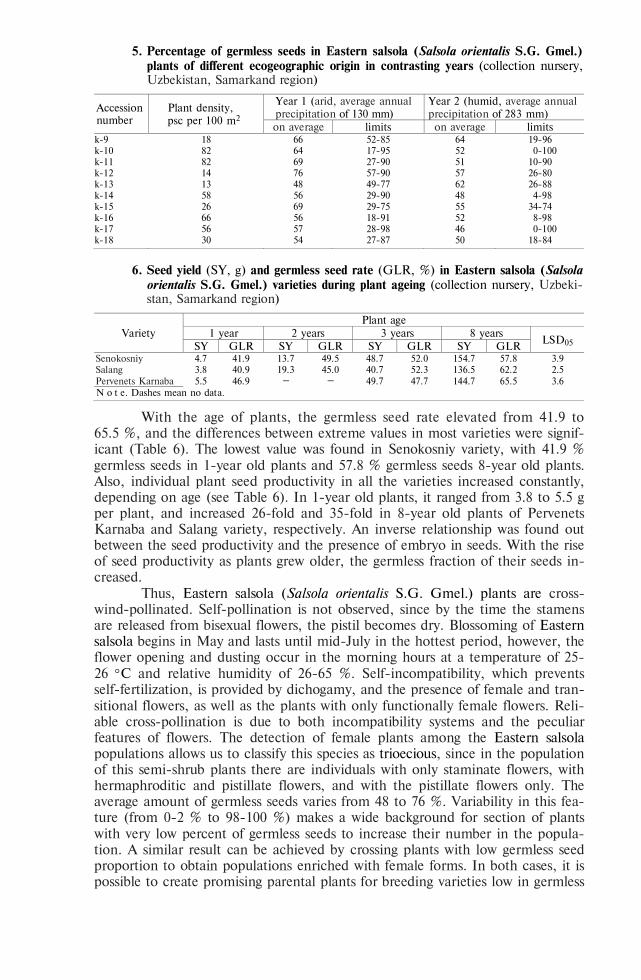
957
5. Percentage of germless seeds in Eastern salsola (Salsola orientalis S.G. Gmel.) plants of different ecogeographic origin in contrasting years (collection nursery, Uzbekistan, Samarkand region)
Accession number
Plant density, psc per 100 m2
Year 1 (arid, average annual precipitation of 130 mm)
Year 2 (humid, average annual precipitation of 283 mm)
on average limits on average limits k-9 18 66 52-85 64 19-96 k-10 82 64 17-95 52 0-100 k-11 82 69 27-90 51 10-90 k-12 14 76 57-90 57 26-80 k-13 13 48 49-77 62 26-88 k-14 58 56 29-90 48 4-98 k-15 26 69 29-75 55 34-74 k-16 66 56 18-91 52 8-98 k-17 56 57 28-98 46 0-100 k-18 30 54 27-87 50 18-84
6. Seed yield (SY, g) and germless seed rate (GLR, %) in Eastern salsola (Salsola orientalis S.G. Gmel.) varieties during plant ageing (collection nursery, Uzbeki-stan, Samarkand region)
Variety Plant age
1 year 2 years 3 years 8 years LSD05 SY GLR SY GLR SY GLR SY GLR
Senokosniy 4.7 41.9 13.7 49.5 48.7 52.0 154.7 57.8 3.9 Salang 3.8 40.9 19.3 45.0 40.7 52.3 136.5 62.2 2.5 Pervenets Karnaba 5.5 46.9 – – 49.7 47.7 144.7 65.5 3.6 N o t å. Dashes mean no data.
With the age of plants, the germless seed rate elevated from 41.9 to 65.5 %, and the differences between extreme values in most varieties were signif-icant (Table 6). The lowest value was found in Senokosniy variety, with 41.9 % germless seeds in 1-year old plants and 57.8 % germless seeds 8-year old plants. Also, individual plant seed productivity in all the varieties increased constantly, depending on age (see Table 6). In 1-year old plants, it ranged from 3.8 to 5.5 g per plant, and increased 26-fold and 35-fold in 8-year old plants of Pervenets Karnaba and Salang variety, respectively. An inverse relationship was found out between the seed productivity and the presence of embryo in seeds. With the rise of seed productivity as plants grew older, the germless fraction of their seeds in-creased.
Thus, Eastern salsola (Salsola orientalis S.G. Gmel.) plants are cross-wind-pollinated. Self-pollination is not observed, since by the time the stamens are released from bisexual flowers, the pistil becomes dry. Blossoming of Eastern salsola begins in May and lasts until mid-July in the hottest period, however, the flower opening and dusting occur in the morning hours at a temperature of 25-26 С and relative humidity of 26-65 %. Self-incompatibility, which prevents self-fertilization, is provided by dichogamy, and the presence of female and tran-sitional flowers, as well as the plants with only functionally female flowers. Reli-able cross-pollination is due to both incompatibility systems and the peculiar features of flowers. The detection of female plants among the Eastern salsola populations allows us to classify this species as trioecious, since in the population of this semi-shrub plants there are individuals with only staminate flowers, with hermaphroditic and pistillate flowers, and with the pistillate flowers only. The average amount of germless seeds varies from 48 to 76 %. Variability in this fea-ture (from 0-2 % to 98-100 %) makes a wide background for section of plants with very low percent of germless seeds to increase their number in the popula-tion. A similar result can be achieved by crossing plants with low germless seed proportion to obtain populations enriched with female forms. In both cases, it is possible to create promising parental plants for breeding varieties low in germless
958
seed percent and high in laboratory and field germination rate
R E F E R E N C E S
1. Embryology of flowering plants. Terminology and concepts. V. 3. Reproductive systems. T.B. Batygina (ed.). USA, Enfield (NH), 2009.
2. L ' v o v a I.N., M u r a s h e v V.V. Vestnik Moskovskogo universiteta. Seriya 16: Biologiya, 2005, 3: 38-43 (in Russ.).
3. A n i s i mo v a I.N., G a v r i l o v a V.A., T i m o f e e v a G.I. Materialy Mezhdunarodnoi nauchno-prakticheskoi konferentsii «Sovremennye problemy nauchnogo obespecheniya proizvodstva podsolnechni-ka», posvyashchennoi 120-letiyu so dnya rozhdeniya akademika V.S. Pustovoita. [Proc. Int. Conf. «Cur-rent scientific aspects of sunflower production»]. Krasnodar, 2006: 162-174 (in Russ.).
4. B r a g i n a E.A., B a t y g i n a T.B., L o o k s Yu.A. Reproduction system and repatriation in or-chids. Proc. I Int. School for young scientists «Embryology and biotechnology». St. Petersburg, 2005: 33.
5. B a t y g i n a T.B. Sexyal and asexsual processes in reproductive systems of flowering plants. Ac-ta Biologica Cracoviensia. Ser. Bot., 2006, 47(1): 51-60.
6. B a t y g i n a T.B., V i n o g r a d o v a G.Yu. Ontogenez, 2007, 38(3): 1-26 (in Russ.). 7. V o r o n o v a O.N., G a v r i l o v a V.A. Botanicheskii zhurnal, 2007, 92(10): 1535-1544 (in Russ.). 8. H a r r i s o n C.J., A l v e y E., H e n d e r s o n I.R Meiosis in flowering plants and other green
organisms. Journal of Experimental Botany, 2010, 61(11): 2863-2875 (doi: 10.1093/jxb/erq191). 9. A n i s i m o v a G.M., S h a m r o v I.I., Y a k o v l e v a O.V. Botanicheskii zhurnal, 2005,
90(10): 1499-1516 (in Russ.). 10. K r u g l o v a N.N., B a t y g i n a T.B., G o r b u n o v a V.Yu., T i t o v a G.E., S e l ' d i m i -
r o v a O.A. Embriologicheskie osnovy androklinii pshenitsy. Atlas /Pod redaktsiei I.I. SHamrova [Embryological bases of wheat androclinia: Atlas. I.I. Shamrov (ed.)]. Moscow, 2005.
11. S e l ' d i m i r o v a O.A., T i t o v a G.E., G a l i n I.R., K r u g l o v a N.N. Izvestiya Samar-skogo NTS RAN, 2013, 15(3): 1676-1679 (in Russ.).
12. B a t y g i n a T.B., T i t o v a G.E., V a s i l ' e v a V.E. Innovatsii, 2007, 2: 39-46 (in Russ.). 13. V i n o g r a d o v a G.Yu. Botanicheskii zhurnal, 2013, 98(8): 959-974. 14. B a b r o A.A., A n i s i m o v a G.M., S h a m r o v I.I. Rastitel'nye resursy, 2007, 43(4): 1-13
(in Russ.). 15. T o r s h i l o v a A.A., T i t o v a G.E., B a t y g i n a T.B. Female reproductive structures and
seed development in Dioscorea nipponica Makino (Dioscoreaceae). Acta Biologica Cracoviensia. Ser. Bot., 2003, 45(1): 149-154.
16. T i t o v a G.E. Botanicheskii zhurnal, 2012, 97(9): 1-26 (in Russ.). 17. V i n o g r a d o v a G.Yu. Materialy Mezhdunarodnoi konferentsii «Biotekhnologiya kak instrument
sokhraneniya bioraznoobraziya rastitel'nogo mira» [Proc. Int. Conf. «Biotechnology as a tool in saving flora biodiverdity»]. Simferopol, 2014: 264-265 (in Russ.).
18. V o r o n o v a O.N. Integumentary embryony in CMS sunflower line. Russ. J. Dev. Biol., 2010, 41(6): 394-399 (doi: 10.1134/S106236041006007X).
19. V o r o n o v a O.N. Developmental of female reproductive structures and apomixes in some CMS lines of sunflower. Helia, 2013, 6: 47-60 (doi: 10.2298/HEL1358047V).
20. B a t y g i n a T.B., O s a d t c h i y J.V. Polyembryony: Twins — the result of vegetative propa-gation. The International Journal of Plant Reproductive Biology, 2013, 5(1): 21-27.
21. B r u n d r e t t M.C. Mycorrhizal associations and other means of diversity of vascular plants: under-standing the global diversity of host plants by resolving conflicting information and developing reliable means of diagnosis. Plant Soil, 2009, 320(1-2): 37-77 (doi: 10.1007/s11104-008-9877-9).
22. M u n a f o Jr. J.P., G i a n f a g n a T.J. Quantitative analysis of steroidal glycosides in different organsof Easter lily (Lilium longiflorum Thunb.) by LC-MS/MS. J. Agr. Food Chem., 2011, 59(3): 995-1004 (doi: 10.1021/jf1036454).
23. E s s l F., B i r ó K., B r a n d e s D., B r o e n n i m a n n O., B u l l o c k J.M., C h a p - m a n D.S., C h a u v e l B., D u l l i n g e r S., F u m a n a l B., G u i s a n A., K a r r e r G., K a z i n c z i G., K u e f f e r C., L a i t u n g B., L a v o i e C., L e i t n e r M., M a n g T., M o s e r D., M ü l l e r - S c h ä r e r H., P e t i t p i e r r e B., R i c h t e r R., S c h a f f n e r U., S m i t h M., S t a r f i n g e r U., V a u t a r d R., V o g l G., L i p p e M., F o l l a k S. Biologi-cal flora of the British isles: Ambrosia artemisiifolia. J. Ecol., 2015, 103(4): 1069-1098 (doi: 10.1111/1365-2745.12424).
24. H ab b e n J.E., B a o X., B a t e N.J., D e b r u i n J.L., D o l a n D., H a s e g a w a D., H e -l e n t j a r i s T.G., L a f i t t e R.H., L o v a n N., M o H., R e i m a n n K., S c h u s s l e r J.R. Transgenic alteration of ethylene biosynthesis increases grain yield in maize under field drought-stress conditions. Plant Biotechnol. J., 2014, 12(6): 685-693 (doi: 10.1111/pbi.12172).
25. V a n D i j k H., H a u t e k è e t e N.C. Evidence of genetic change in the flowering phenology of sea beets along a latitudinal cline within two decades. J. Evolution. Biol., 2014, 27(8): 1572-1581 (doi: 10.1111/jeb.12410).
26. D e m ' y a n o v a E.I. O postanovke antiekologicheskikh issledovanii v usloviyakh introduktsii.

959
Mat. Mezhd. nauch. konf. «Biologicheskoe raznoobrazie. Introduktsiya rastenii» [Proc. Int., Conf. «Biodiversity. Plant introduction»]. St. Petersburg, 2011: 211-213 (in Russ.).
27. R u s s e l l S.D., G o u X., W e i X., Y u a n T. Male gamete biology in flowering plants. Bio-chemical Society Transactions, 2010, 38(2): 598-603 (doi: 10.1042/BST0380598).
28. B a r r e t t S.C.H. Understanding plant reproductive diversity. Philosophical Transactions of the Royal Society of London. Series B: Biological Sciences, 2010, 365(1537): 99-109 (doi: 10.1098/rstb.2009.0199).
29. Sh ams u t d i no v Z.Sh., Ko s o l ap o v V.M., S av c h e nko I.V., S ham su t d i no v N.Z. Ekologicheskaya restavratsiya pastbishch (na osnove novykh sortov kormovykh galofitov) [Eco-restoration of pastures using new vrieties of fodder halophytes]. Moscow, 2009 (in Russ.).
30. P o n o m a r e v A.N. V knige: Polevaya geobotanika, tom 2 /Pod redaktsiei E.M. Lavrenko, A.A. Korchagina [In: Field geobotany. E.M. Lavrenko, A.A. Korchagin (eds.)]. Moscow-Leningrad, 1960, V. 2: 9-19 (in Russ.).
31. D e m ' y a n o v a E.I. Vestnik Permskogo universiteta. Seriya: Biologiya, 2014, 2: 10-17 (in Russ.). 32. D o s p e k h o v B.A. Metodika polevogo opyta (s osnovami statisticheskoi obrabotki rezul'tatov is-
sledovanii) [Methods of field trials (with statistical analysis)]. Moscow, 1985 (in Russ.).