Physical and Biological Study of Cell Cultures in a Bioreactor

J Ind Microbiol Biotechnol (2008) 35:465–473DOI 10.1007/s10295-008-0302-4
123
ORIGINAL PAPER
Biological treatment of a synthetic space mission wastewater using a membrane-aerated, membrane-coupled bioreactor (M2BR)
Ruoyu D. Chen · Michael J. Semmens · Timothy M. LaPara
Received: 13 May 2007 / Accepted: 9 December 2007 / Published online: 15 January 2008© Society for Industrial Microbiology 2008
Abstract This paper describes the membrane-aerated,membrane-coupled bioreactor (M2BR), which was devel-oped for wastewater treatment during long-term space mis-sions because it achieves aeration and biomass separationusing components that are compatible with microgravityconditions. In the experiments described herein, the M2BRwas used to treat a synthetic wastewater formulated byNASA to simulate the wastewater typically collected dur-ing space missions. The M2BR was able to achieve morethan 90% removal of both chemical oxygen demand (COD)and total nitrogen when it was fed a modiWed NASA waste-water that had a 4:1 COD to nitrogen ratio. When the full-strength synthetic wastewater was fed to the M2BR(COD:N = 1), however, the nitrogenous pollutant removaleYciency was adversely aVected because of either insuY-cient oxygen transfer to support nitriWcation (an air-fedM2BR) or insuYcient electron donor to support denitriWca-tion (an oxygen-fed M2BR). In conclusion, the M2BR pro-vides considerable promise for wastewater treatment duringlong-term space missions, although additional research isneeded to identify the best approach to treat the space mis-sion wastewater, which poses a unique challenge becauseof its low COD:N ratio.
Keywords M2BR · MABR · Membrane Wltration · Microgravity · Space travel · Wastewater treatment
Introduction
Potable water is a critical resource for human beings duringlong-term space travel. While spaceships are currentlyfueled by the combustion of H2 and O2, which generatessuYcient quantities of potable water, future long-termspace missions (e.g., to Mars) will utilize nuclear-basedpower, thus eliminating this source of water. Future long-term space missions, therefore, will need to treat and reuseas much water and wastewater as possible.
Wastewater treatment during long-term spaces missionsposes unique challenges compared to analogous terrestrialsystems. Wastewater treatment must produce a very highquality eZuent without adversely aVecting the habitabilityof the spacecraft. Another challenge is to design the entireprocess to be compatible with microgravity conditions.Conventional aerobic biological wastewater treatment, forexample, depends on gravity to create buoyant air bubblesfor aeration and on gravitational clariWers to separate thebiomass from the treated eZuent.
We have proposed the membrane-aerated, membrane-coupled bioreactor (M2BR) to meet the challenge of waste-water treatment in space. The M2BR utilizes a gas-transferringmembrane to provide bubbleless gas transfer to the waste-water [1, 6]. This membrane also serves as the support for auniquely stratiWed bioWlm that can contain active popula-tions of both nitrifying and denitrifying bacteria [5, 22].The M2BR also utilizes a second membrane to completelyseparate suspended cells from the treated eZuent, thusproviding an important hygienic safety constraint forastronauts living in a conWned space for an extended periodof time. This membrane Wltration step is the most pertinentdiVerence between the M2BR and other reactor designs thatare currently being considered for wastewater treatmentduring long-term space travel [18, 20]. The retention of
R. D. Chen · M. J. Semmens · T. M. LaPara (&)Department of Civil Engineering, University of Minnesota, 122 Civil Engineering, 500 Pillsbury Drive SE, Minneapolis, MN 55455-0116, USAe-mail: [email protected]
466 J Ind Microbiol Biotechnol (2008) 35:465–473
123
high densities of bacterial cells within the bioreactor alsohelps produce a high quality eZuent from a relatively smallreactor while generating minimal quantities of residual bio-mass [4, 12, 13].
In this study, we tested the ability of the M2BR to treat asynthetic wastewater formulated by NASA to simulate thecombination of urine, atmospheric condensate, and usedhygiene water that would be generated during space mis-sions. The NASA wastewater ersatz contains relativelyhigh concentrations of both nitrogenous (700 mg N L¡1)and carbonaceous pollutants (chemical oxygendemand = 800 mg L¡1). Our goals for this study were toidentify an appropriate start-up procedure so that the M2BRcould achieve simultaneous nitriWcation/denitriWcation andto determine the limitations of the M2BR in treating thiswastewater.
Materials and methods
Membrane bioreactors
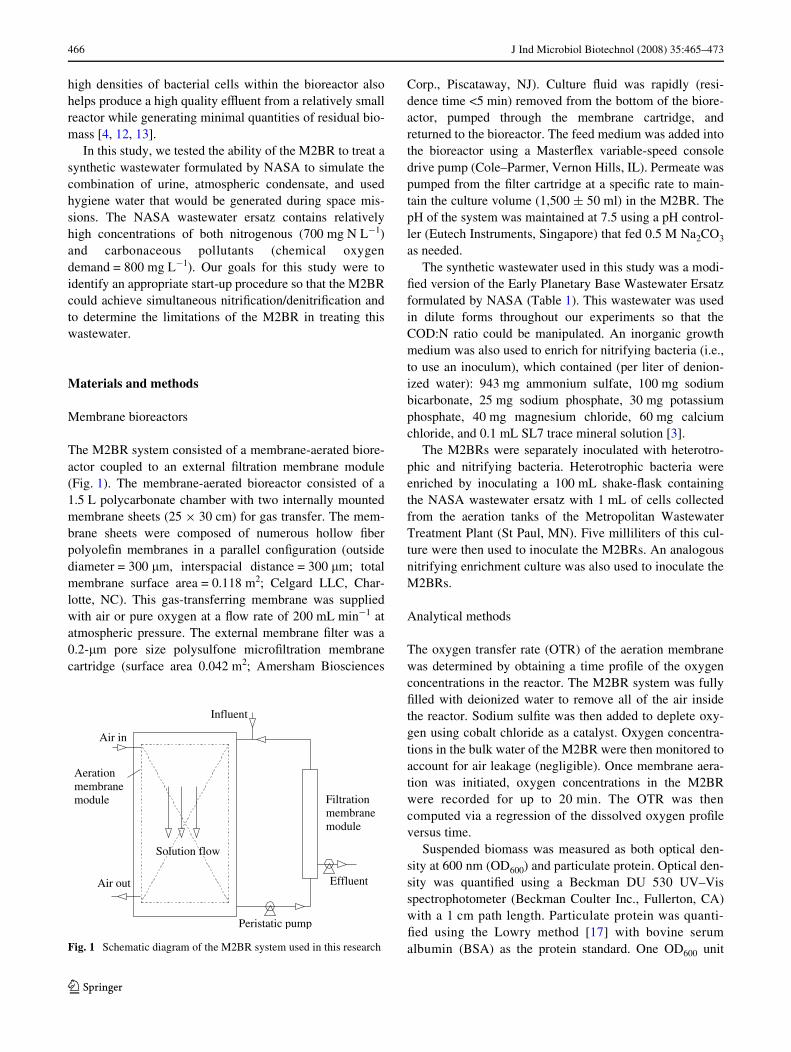
The M2BR system consisted of a membrane-aerated biore-actor coupled to an external Wltration membrane module(Fig. 1). The membrane-aerated bioreactor consisted of a1.5 L polycarbonate chamber with two internally mountedmembrane sheets (25 £ 30 cm) for gas transfer. The mem-brane sheets were composed of numerous hollow WberpolyoleWn membranes in a parallel conWguration (outsidediameter = 300 �m, interspacial distance = 300 �m; totalmembrane surface area = 0.118 m2; Celgard LLC, Char-lotte, NC). This gas-transferring membrane was suppliedwith air or pure oxygen at a Xow rate of 200 mL min¡1 atatmospheric pressure. The external membrane Wlter was a0.2-�m pore size polysulfone microWltration membranecartridge (surface area 0.042 m2; Amersham Biosciences
Corp., Piscataway, NJ). Culture Xuid was rapidly (resi-dence time <5 min) removed from the bottom of the biore-actor, pumped through the membrane cartridge, andreturned to the bioreactor. The feed medium was added intothe bioreactor using a MasterXex variable-speed consoledrive pump (Cole–Parmer, Vernon Hills, IL). Permeate waspumped from the Wlter cartridge at a speciWc rate to main-tain the culture volume (1,500 § 50 ml) in the M2BR. ThepH of the system was maintained at 7.5 using a pH control-ler (Eutech Instruments, Singapore) that fed 0.5 M Na2CO3
as needed.The synthetic wastewater used in this study was a modi-
Wed version of the Early Planetary Base Wastewater Ersatzformulated by NASA (Table 1). This wastewater was usedin dilute forms throughout our experiments so that theCOD:N ratio could be manipulated. An inorganic growthmedium was also used to enrich for nitrifying bacteria (i.e.,to use an inoculum), which contained (per liter of denion-ized water): 943 mg ammonium sulfate, 100 mg sodiumbicarbonate, 25 mg sodium phosphate, 30 mg potassiumphosphate, 40 mg magnesium chloride, 60 mg calciumchloride, and 0.1 mL SL7 trace mineral solution [3].
The M2BRs were separately inoculated with heterotro-phic and nitrifying bacteria. Heterotrophic bacteria wereenriched by inoculating a 100 mL shake-Xask containingthe NASA wastewater ersatz with 1 mL of cells collectedfrom the aeration tanks of the Metropolitan WastewaterTreatment Plant (St Paul, MN). Five milliliters of this cul-ture were then used to inoculate the M2BRs. An analogousnitrifying enrichment culture was also used to inoculate theM2BRs.
Analytical methods
The oxygen transfer rate (OTR) of the aeration membranewas determined by obtaining a time proWle of the oxygenconcentrations in the reactor. The M2BR system was fullyWlled with deionized water to remove all of the air insidethe reactor. Sodium sulWte was then added to deplete oxy-gen using cobalt chloride as a catalyst. Oxygen concentra-tions in the bulk water of the M2BR were then monitored toaccount for air leakage (negligible). Once membrane aera-tion was initiated, oxygen concentrations in the M2BRwere recorded for up to 20 min. The OTR was thencomputed via a regression of the dissolved oxygen proWleversus time.
Suspended biomass was measured as both optical den-sity at 600 nm (OD600) and particulate protein. Optical den-sity was quantiWed using a Beckman DU 530 UV–Visspectrophotometer (Beckman Coulter Inc., Fullerton, CA)with a 1 cm path length. Particulate protein was quanti-Wed using the Lowry method [17] with bovine serumalbumin (BSA) as the protein standard. One OD600 unitFig. 1 Schematic diagram of the M2BR system used in this research
Aerationmembranemodule Filtration
membrane module
Peristatic pump
Influent
Effluent
Solution flow
Air in
Air out

J Ind Microbiol Biotechnol (2008) 35:465–473 467
123
corresponded to 360 mg L¡1 of particulate protein (r2 = 0.96).Following the completion of each experiment, bioWlm sam-ples for community analysis were collected from the upper,middle, and lower sides of the outer face of both aerationmembranes as well as the inner face of each membrane.Biomass that deposited on the bottom of reactor was alsocollected for community analysis.
Chemical oxygen demand (COD) was determined color-imetrically using low-range accu-Test vials (BioscienceInc., Bethlehem, PA) using potassium hydrogen phthalateas a standard. Ammonia was measured using the Nesslermethod [7] using ammonium chloride as standard. Total
Kjeldahl nitrogen (TKN) was measured using a DigesdahlDigestion Apparatus (Hach, Loveland, CO) followed by theNessler method. Nitrite and nitrate were determined using a761 compact ion chromatography system (Metrohm,Houston, TX) using sodium nitrite and sodium nitrate asstandards. All assays were performed in triplicate. Data arepresented as the arithmetic means; the standard deviationsfor all samples were <5% of the mean (data not shown).
Bacterial community analysis
Suspended biomass and bioWlm samples were centrifugedand resuspended with 0.5 mL of lysis buVer (120 mMsodium phosphate buVer, 5% sodium dodecyl sulfate, pH8.0). After three consecutive freeze-thaw cycles, cells werelysed during 90 min incubation at 70°C. Genomic DNAwas extracted from those samples using the Fast DNA SpinKit per manufacturer’s instructions (Qbiogene, Vista, CA).
From the extracted DNA, the variable V3 region of the16S rRNA gene was ampliWed by PCR using primers 338F[14] and 518R [19], with a GC-clamp attached to the for-ward primer [19]. DGGE was performed using a D-Codeapparatus (BioRad; Hercules, CA). Equal amounts of PCRamplicons were loaded onto 8% (wt/vol) polyacrylamidegels (37.5:1, acrylamide:bisacrylamide) in 0.5 £ TAEbuVer [21] using a denaturing gradient ranging from 30 to55% denaturant (100% denaturant contains 7 M urea, 40%(vol/vol) formamide in 0.5 £ TAE). Following electropho-resis, gels were stained with SYBR Green I (MolecularProbes, Eugene, Oreg.; diluted 1:5,000 in 0.5 £ TAE). Gelswere visualized on a UV transilluminator and photographedwith a digital CCD camera (BioChemi System; UVP, Inc.,Upland, CA). Photographs were inverted and enhanced forcontrast and brightness using Adobe Photoshop v6.0.
SpeciWc bands were manually excised from the denatur-ing gel, suspended in 25 �L of sterile water, and incubatedovernight. The entire PCR–DGGE protocol was repeatedusing this water as template until only a single band wasdetectable (2–4 iterations were typically required). A WnalPCR step was performed without the GC-clamp attached tothe forward primer. These PCR products were puriWed(Geneclean II; Qbiogene) and used as template for nucleo-tide sequence analysis.
All nucleotide sequences were determined at theAdvanced Genetic Analysis Center at the University ofMinnesota using an ABI 3100 Genetic Analyzer (AppliedBiosystems, Foster City, CA). Nucleotide sequences weredetermined fully in both directions for each puriWed PCR–DGGE band using 338F and 518R as sequencing primers.Reported nucleotide sequences are the consensus ofbi-directional sequence information without the original PCRprimer sequences. Reference nucleotide sequences wereobtained from the GenBank database [2]. Nucleotide
Table 1 Components of the modiWed NASA early planetary basewastewater ersatz
Component Quantity (per L)
Shampoo (suave for kids) 275 mg
Ammonium bicarbonate 2.3 g
Ammonium hydroxide 300 mg
Ammonium citrate 370 mg
Ammonium formate 45 mg
Ammonium oxalate monohydrate 20 mg
Sodium chloride 690 mg
Potassium chloride 200 mg
Sodium bicarbonate 200 mg
Potassium phosphate monobasic 166 mg
Potassium sulfate 690 mg
Urea 160 mg
Lactic acid 80 mg
Creatinine 160 mg
Histidine 29 mg
Taurine 17 mg
Glutamic acid 51 mg
Glucose 78 mg
Acetic acid 34 mL
Benzoic acid 1 mg
Benzyl alcohol 5 �L
Ethanol 6.5 mL
Acetone 0.5 �L
Caprolactam 4 mg
Phenol 0.6 mg
N,N-dimethylformamide 0.7 �L
Ethylene glycol 3.3 �L
4-Ethyl morpholine 1.5 �L
Formaldehyde 3 �L
Formic acid 4.4 �L
Methanol 7.6 �L
1,2-Propanediol 2 �L
2-Propanol 2.4 �L
Propionic acid 15 �L

468 J Ind Microbiol Biotechnol (2008) 35:465–473
123
sequences were checked for possible chimeric sequencesby manually splitting sequences into subsections to deter-mine if the segments were from diVerent phylogeneticgroups. The nucleotide sequences obtained in this studyhave been deposited in the GenBank database under acces-sion nos. DQ838089–DQ838095.
Results
Clean membrane oxygen transfer
Prior to the initiation of any of the M2BR experiment, theoxygen transfer rate (OTR) of clean gas-transferring mem-branes (using atmospheric air as a source of oxygen) wasmeasured as 830 mg day¡1 (SD = 13 mg day¡1; n = 5).Based on stoichiometric oxidation of COD and NH3 in theNASA wastewater ersatz, the OTR needed to be approxi-mately 4,800 mg day¡1 for complete treatment at a hydrau-lic residence time of 24 h (assuming partial COD oxidationvia denitriWcation). Previous research, however, has sug-gested that bacterial growth on the gas transferring mem-brane can increase the OTR [9, 23]. Recognizing thatoxygen transfer could constrain M2BR operation, there-fore, three diVerent M2BR experiments were performedduring which the nutrient loading, feed composition, andthe oxygen content of the aeration gas (i.e., atmospheric airvs. pure oxygen) were varied.
First M2BR experiment
The Wrst M2BR was fed the full-strength NASA wastewa-ter ersatz for 66 days at a hydraulic residence time (HRT)of 24 h without biosolids removal (Fig. 2a). This experi-ment simulated the simplest start-up procedure for theM2BR. The eZuent COD concentration steadily declinedduring the Wrst 30 days of operation, after which the M2BRperformance was reasonably consistent (mean CODremoval eYciency = 87%). In contrast, no ammonia oxida-tion was observed throughout the entire experiment. Sus-pended biomass accumulated rapidly during the Wrst25 days, after which it gradually increased until the end ofthe experiment (Fig. 2b).
Second M2BR experiment
Since the Wrst M2BR experiment failed to achieve nitriWca-tion, the second M2BR experiment involved a more com-plicated start-up procedure to ensure better performance.Based on our prior experience with membrane-aerated bio-reactors [11], we attempted to establish an actively nitrify-ing bioWlm on the gas-transferring membrane beforeintroducing the NASA wastewater ersatz. The second
M2BR experiment, therefore, involved four distinct phasesof operation during which the composition of the feed solu-tion was varied while the HRT was maintained at 24 h. TheM2BR was initially fed an ammonia-only solution (Phase1: 29 days; COD = 0 mg L¡1; NH3 = 200 mg L¡1 as N) toestablish the nitrifying bacterial community, after whicha dilute version NASA wastewater ersatz was fed tothe M2BR to also establish the heterotrophic bacterialcommunity (Phase 2: 23 days; COD = 220 mg L¡1;NH3 = 170 mg L¡1 as N). After high removals of bothCOD and NH3 were observed, then the feed solution waschanged to a more concentrated version of the NASAwastewater ersatz that had a COD:N ratio that would sup-port simultaneous nitriWcation/denitriWcation in the M2BR
Fig. 2 a EZuent concentrations of COD (Wlled circles) and ammonia(open circles) during the Wrst M2BR experiment. The dotted anddashed lines represent the inXuent concentrations of COD and ammo-nia, respectively. b Suspended biomass concentrations
Con
cent
ratio
n (m
g l-1
)
0
200
400
600
800
1000A
Time (d)
0 20 40 60
Susp
ende
d B
iom
ass
(OD
600)
0.0
0.5
1.0
1.5
2.0B

J Ind Microbiol Biotechnol (2008) 35:465–473 469
123
(Phase 3: 33 days; COD = 480 mg L¡1; NH3 = 180 mg L¡1
as N). During the Wnal phase of the second M2BR experi-ment, the full-strength NASA wastewater ersatz was fed tothe bioreactor (Phase 4: 20 days; COD = 780 mg L¡1;NH3 = 700 mg L¡1 as N).
During Phase 1, ammonia removal eYciency was ini-tially low but eventually was sustained at >90% (Fig. 3a); anapparent stoichiometric conversion of the ammonia tonitrate was observed during this phase. During Phase 2,COD removal was consistently excellent (Fig. 3b) whilethe ammonia removal eYciency was sustained (Fig. 3a).The concentration of nitrate in the M2BR eZuentdecreased by about 35% during Phase 2 compared to Phase1 (Fig. 3a), indicating that denitriWcation was occurring to aminor extent. During Phase 3, COD and NH3 removalremained excellent, but a substantial reduction in the nitratelevels were observed in the eZuent of the M2BR(Fig. 3a)—corresponding to better than 90% removal ofboth COD and total nitrogenous species. During Phase 4,ammonia concentrations in the eZuent increased substan-tially (Fig. 3a), although COD removal remained excellent(Fig. 3b).
Although the majority of metabolic activity wasassumed to occur in the bioWlm, a substantial quantity ofsuspended biomass accumulated during the second M2BRexperiment (Fig. 3c). Suspended biomass concentrationswere very low throughout Phase 1, but then rapidly accu-mulated during Phase 2 and the Wrst portion of Phase 3. Forunknown reasons, a substantial decrease in suspended bio-mass was observed during Phase 3, after which suspendedbiomass levels rapidly increased for the remainder of thesecond M2BR experiment.
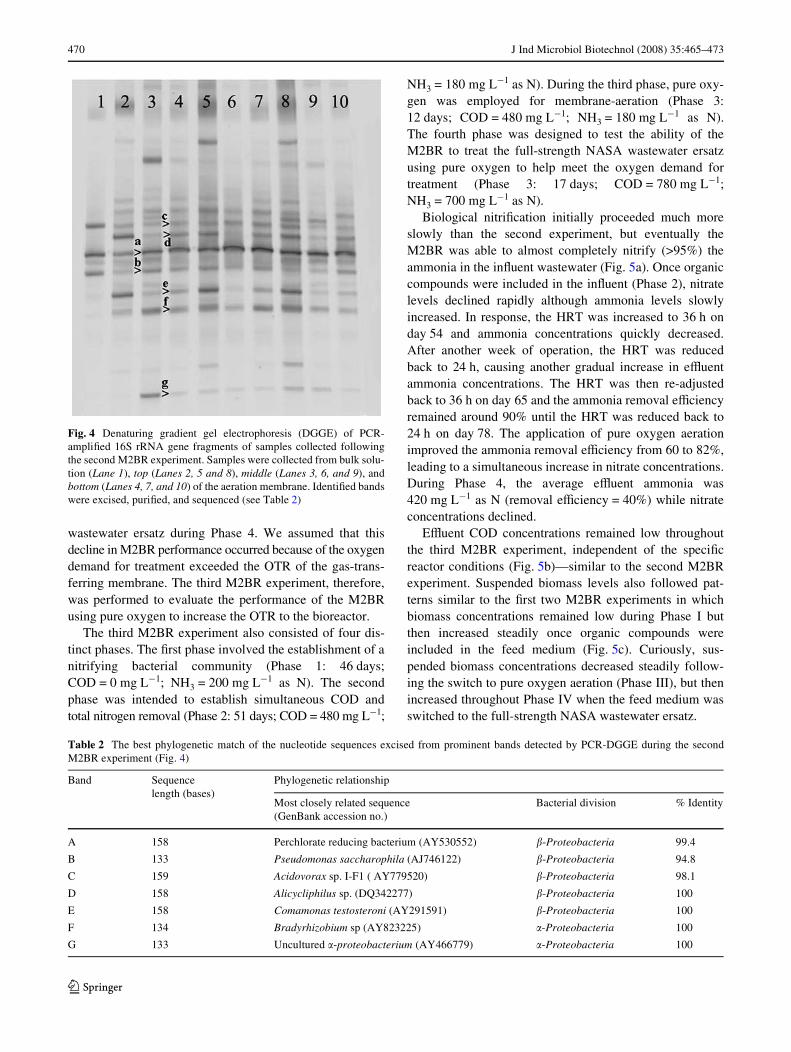
Following the second M2BR experiment, the bacterialcommunities of both the suspended biomass and the bioWlmwere analyzed by denaturing gradient gel electrophoresis ofPCR-ampliWed 16S rRNA gene fragments (PCR–DGGE)(Fig. 4). The bacterial community of the suspended bio-mass (Lane 1) contained three dominant bacterial popula-tions, each of which was found within the bioWlmcommunity (Lanes 2–10). The bioWlm community, in con-trast, was substantially more complex (>21 bands) andexhibited some spatial variation in community structure.Seven prominent bands were excised and puriWed from thedenaturing gels. These bacteria were predominantly fromthe �-subdivision of Proteobacteria (Table 2).
Third M2BR experiment
Although the second experiment demonstrated that theM2BR could achieve excellent COD and total nitrogenouspollutant removal during Phase 3, a substantial decline innitriWcation/denitriWcation eYciency was observed oncethe feed solution was switched to the full-strength NASA
Fig. 3 a EZuent concentrations of ammonia (closed circles) and nitrate(open circles) during the second M2BR experiment. The solid line rep-resents the inXuent ammonia concentration. b EZuent COD concentra-tions during the second M2BR experiment. The solid line represents theinXuent COD concentration. c Suspended biomass concentrations
Con
cent
ratio
n (m
g l-1
)
0
200
400
600
800
Con
cent
ratio
n (m
g l-1
)
0
200
400
600
800Phase I Phase II Phase III Phase IV
A
B
Time (d)0 20 40 60 80 100
Susp
ende
d B
iom
ass
(OD
600)
0.0
0.5
1.0
1.5
2.0C
470 J Ind Microbiol Biotechnol (2008) 35:465–473
123
wastewater ersatz during Phase 4. We assumed that thisdecline in M2BR performance occurred because of the oxygendemand for treatment exceeded the OTR of the gas-trans-ferring membrane. The third M2BR experiment, therefore,was performed to evaluate the performance of the M2BRusing pure oxygen to increase the OTR to the bioreactor.
The third M2BR experiment also consisted of four dis-tinct phases. The Wrst phase involved the establishment of anitrifying bacterial community (Phase 1: 46 days;COD = 0 mg L¡1; NH3 = 200 mg L¡1 as N). The secondphase was intended to establish simultaneous COD andtotal nitrogen removal (Phase 2: 51 days; COD = 480 mg L¡1;
NH3 = 180 mg L¡1 as N). During the third phase, pure oxy-gen was employed for membrane-aeration (Phase 3:12 days; COD = 480 mg L¡1; NH3 = 180 mg L¡1 as N).The fourth phase was designed to test the ability of theM2BR to treat the full-strength NASA wastewater ersatzusing pure oxygen to help meet the oxygen demand fortreatment (Phase 3: 17 days; COD = 780 mg L¡1;NH3 = 700 mg L¡1 as N).
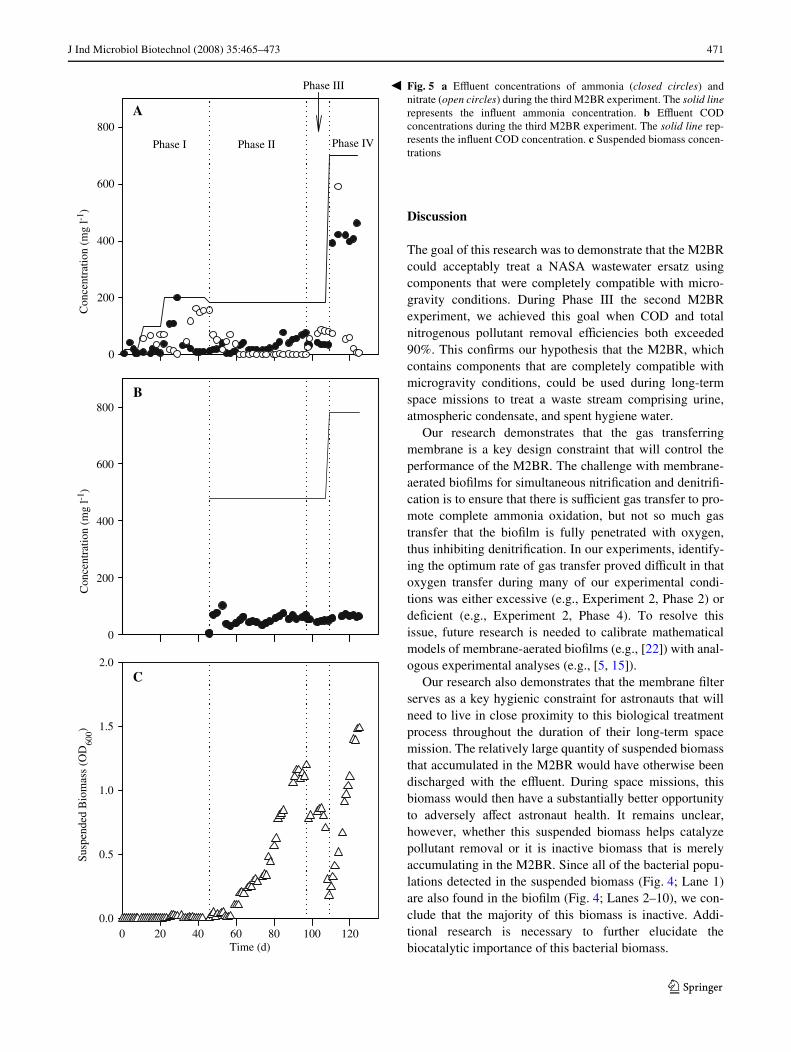
Biological nitriWcation initially proceeded much moreslowly than the second experiment, but eventually theM2BR was able to almost completely nitrify (>95%) theammonia in the inXuent wastewater (Fig. 5a). Once organiccompounds were included in the inXuent (Phase 2), nitratelevels declined rapidly although ammonia levels slowlyincreased. In response, the HRT was increased to 36 h onday 54 and ammonia concentrations quickly decreased.After another week of operation, the HRT was reducedback to 24 h, causing another gradual increase in eZuentammonia concentrations. The HRT was then re-adjustedback to 36 h on day 65 and the ammonia removal eYciencyremained around 90% until the HRT was reduced back to24 h on day 78. The application of pure oxygen aerationimproved the ammonia removal eYciency from 60 to 82%,leading to a simultaneous increase in nitrate concentrations.During Phase 4, the average eZuent ammonia was420 mg L¡1 as N (removal eYciency = 40%) while nitrateconcentrations declined.
EZuent COD concentrations remained low throughoutthe third M2BR experiment, independent of the speciWcreactor conditions (Fig. 5b)—similar to the second M2BRexperiment. Suspended biomass levels also followed pat-terns similar to the Wrst two M2BR experiments in whichbiomass concentrations remained low during Phase I butthen increased steadily once organic compounds wereincluded in the feed medium (Fig. 5c). Curiously, sus-pended biomass concentrations decreased steadily follow-ing the switch to pure oxygen aeration (Phase III), but thenincreased throughout Phase IV when the feed medium wasswitched to the full-strength NASA wastewater ersatz.
Fig. 4 Denaturing gradient gel electrophoresis (DGGE) of PCR-ampliWed 16S rRNA gene fragments of samples collected followingthe second M2BR experiment. Samples were collected from bulk solu-tion (Lane 1), top (Lanes 2, 5 and 8), middle (Lanes 3, 6, and 9), andbottom (Lanes 4, 7, and 10) of the aeration membrane. IdentiWed bandswere excised, puriWed, and sequenced (see Table 2)
Table 2 The best phylogenetic match of the nucleotide sequences excised from prominent bands detected by PCR-DGGE during the secondM2BR experiment (Fig. 4)
Band Sequence length (bases)
Phylogenetic relationship
Most closely related sequence (GenBank accession no.)
Bacterial division % Identity
A 158 Perchlorate reducing bacterium (AY530552) �-Proteobacteria 99.4
B 133 Pseudomonas saccharophila (AJ746122) �-Proteobacteria 94.8
C 159 Acidovorax sp. I-F1 ( AY779520) �-Proteobacteria 98.1
D 158 Alicycliphilus sp. (DQ342277) �-Proteobacteria 100
E 158 Comamonas testosteroni (AY291591) �-Proteobacteria 100
F 134 Bradyrhizobium sp (AY823225) �-Proteobacteria 100
G 133 Uncultured �-proteobacterium (AY466779) �-Proteobacteria 100
J Ind Microbiol Biotechnol (2008) 35:465–473 471
123
Discussion
The goal of this research was to demonstrate that the M2BRcould acceptably treat a NASA wastewater ersatz usingcomponents that were completely compatible with micro-gravity conditions. During Phase III the second M2BRexperiment, we achieved this goal when COD and totalnitrogenous pollutant removal eYciencies both exceeded90%. This conWrms our hypothesis that the M2BR, whichcontains components that are completely compatible withmicrogravity conditions, could be used during long-termspace missions to treat a waste stream comprising urine,atmospheric condensate, and spent hygiene water.
Our research demonstrates that the gas transferringmembrane is a key design constraint that will control theperformance of the M2BR. The challenge with membrane-aerated bioWlms for simultaneous nitriWcation and denitriW-cation is to ensure that there is suYcient gas transfer to pro-mote complete ammonia oxidation, but not so much gastransfer that the bioWlm is fully penetrated with oxygen,thus inhibiting denitriWcation. In our experiments, identify-ing the optimum rate of gas transfer proved diYcult in thatoxygen transfer during many of our experimental condi-tions was either excessive (e.g., Experiment 2, Phase 2) ordeWcient (e.g., Experiment 2, Phase 4). To resolve thisissue, future research is needed to calibrate mathematicalmodels of membrane-aerated bioWlms (e.g., [22]) with anal-ogous experimental analyses (e.g., [5, 15]).
Our research also demonstrates that the membrane Wlterserves as a key hygienic constraint for astronauts that willneed to live in close proximity to this biological treatmentprocess throughout the duration of their long-term spacemission. The relatively large quantity of suspended biomassthat accumulated in the M2BR would have otherwise beendischarged with the eZuent. During space missions, thisbiomass would then have a substantially better opportunityto adversely aVect astronaut health. It remains unclear,however, whether this suspended biomass helps catalyzepollutant removal or it is inactive biomass that is merelyaccumulating in the M2BR. Since all of the bacterial popu-lations detected in the suspended biomass (Fig. 4; Lane 1)are also found in the bioWlm (Fig. 4; Lanes 2–10), we con-clude that the majority of this biomass is inactive. Addi-tional research is necessary to further elucidate thebiocatalytic importance of this bacterial biomass.
Con
cent
ratio
n (m
g l-1
)
0
200
400
600
800A
Phase I Phase II Phase IV
Phase IIIC
once
ntra
tion
(mg
l-1)
0
200
400
600
800B
Time (d)0 20 40 60 80 100 120
Susp
ende
d B
iom
ass
(OD
600)
0.0
0.5
1.0
1.5
2.0C
Fig. 5 a EZuent concentrations of ammonia (closed circles) andnitrate (open circles) during the third M2BR experiment. The solid linerepresents the inXuent ammonia concentration. b EZuent CODconcentrations during the third M2BR experiment. The solid line rep-resents the inXuent COD concentration. c Suspended biomass concen-trations
�

472 J Ind Microbiol Biotechnol (2008) 35:465–473
123
Our PCR–DGGE results also demonstrate substantialspatial heterogeneity of bacterial community compositionwithin the membrane-aerated bioWlm. This spatial hetero-geneity could reXect diVerences in Xuid shear within theM2BR, which then lead to diVerent bioWlm thicknesses;this is pertinent because membrane-aerated bioWlms typi-cally exhibited substantial variation in bacterial communitycomposition as a function of bioWlm depth [5, 15]. Alterna-tively, the spatial heterogeneity of bacterial communitycomposition could reXect hydraulic short-circuitingthrough the M2BR; this would suggest that M2BR perfor-mance could be enhanced by improving mixing within thereactor. In both cases, additional research is needed tounderstand spatial heterogeneity in Xuid shear within theM2BR.
Although our results have conWrmed that the M2BR cansimultaneously remove both carbonaceous and nitrogenouspollutants, the NASA wastewater ersatz poses a particularlydiYcult challenge because of its low COD:N ratio. Simplyput, there is insuYcient electron donor to allow for com-plete denitriWcation. Our previous experiments have dem-onstrated that a COD:N ratio approximately equal to four isneeded for complete nitrogenous pollutant removal [10, 15].To fully treat the NASA wastewater ersatz, therefore, anapproach beyond the M2BR will be required. One alterna-tive would be to supply electron donor in the form of gas-eous hydrogen [8, 16]; another option would be to utilize atwo-stage system in which one M2BR achieves strictlyCOD removal while a second stage utilizes some form ofanaerobic ammonia oxidation, such as the CANON process[24], to remove the nitrogenous pollutants.
In conclusion, the M2BR has the capability of achievingsimultaneous removal of carbonaceous and nitrogenouspollutants using components that are entirely compatiblewith microgravity conditions. For long-term space mis-sions, the M2BR design is a particularly attractive bioreac-tor design because the membrane Wlter provides anadditional hygienic constraint for the astronauts who mustlive in close proximity with a wastewater bioreactor. Addi-tional research is needed, however, to identify the bestapproach to treat the NASA wastewater ersatz, which posesa unique challenge because of its low COD:N ratio.
Acknowledgments This research was funded by the NationalAeronautics and Space Administration (Grant NNJ04HF80G). Theauthors thank Celgard Inc. for generously donating the gas-transferringmembrane used in this study.
References
1. Ahmed T, Semmens MJ (1992) Use of sealed end hollow Wbers forbubbleless membrane aeration: experimental studies. J Membr Sci69:1–10
2. Benson DA, Karsch-Mizrachi I, Lipman DJ, Ostell J, Rapp BA,Wheeler DL (2002) GenBank. Nucleic Acids Res 30:17–20
3. Biebl H, Pfennig N (1981) Isolation of members of the familyRhodospirillacaea. In: Starr MP, Stolp HG, Troper HG, BalowsA, Schlegel HG (eds) The Prokaryotes. Springer, Berlin, pp267–273
4. Chen R, LaPara TM (2006) Aerobic biological treatment of low-strength synthetic wastewater in membrane-coupled bioreactors:the structure and function of bacterial enrichment cultures as thenet growth rate approaches zero. Microb Ecol 51:99–108
5. Cole AC, Semmens MJ, LaPara TM (2004) StratiWcation of activityand bacterial community structure in bioWlms grown on membranestransferring oxygen. Appl Environ Microbiol 70:1982–1989
6. Côte P, Bersillon J-L, Huyard A (1989) Bubble-free aeration usingmembranes: mass transfer analysis. J Membr Sci 47:91–106
7. Daniels L, Hanson RS, Phillips JA (1994) Chemical analysis. In:Gerhardt P, Murray RGE, Wood WA, Krieg NR (eds) Methods forgeneral and molecular bacteriology. ASM Press, Washington DC,pp 512–554
8. Edstrom JA, Semmens MJ, Hozalski RM, Clapp LW, Novak PJ(2004) Stimulation of dechlorination by membrane-deliveredhydrogen: small Weld demonstration. Environ Eng Sci 22:281–293
9. Essila NJ, Semmens MJ, Voller VR (2000) Modeling bioWlmson gas-permeable supports: concentration and activity proWles.J Environ Eng 126:250–257
10. Ghosh S, LaPara TM (2004) Removal of carbonaceous and nitrog-enous pollutants from a synthetic wastewater using a membranecoupled bioreactor. J Ind Microbiol Biotechnol 31:353–361
11. Kappell AS, Semmens MJ, Novak PJ, LaPara TM (2005) A novelapplication of oxygen-transferring membranes to improve anaero-bic wastewater treatment. Biotechnol Bioeng 89:373–380
12. Klatt CG, LaPara TM (2003) Aerobic biological treatment of syn-thetic municipal wastewater in membrane-coupled bioreactors.Biotechnol Bioeng 82:313–320
13. Konopka A, Zakharova T, Oliver L, Camp D, Turco RF (1996)Biodegradation of organic wastes containing surfactants in abiomass recycle reactor. Appl Environ Microbiol 62:3292–3297
14. Lane DJ (1991) 16S/23S rRNA sequencing. In: Stackebrandt E,Goodfellow M (eds) Nucleic acid techniques in bacterial system-atics Wiley, West Sussex, pp 115–175
15. LaPara TM, Cole AC, Shanahan JW, Semmens M (2006) TheeVects of organic carbon, ammoniacal-nitrogen, and oxygenpartial pressure on the stratiWcation of membrane-aerated bioWlms.J Ind Microbiol Biotechnol 33:315–323
16. Lee KC, Rittmann BE (2003) EVects of pH and precipitation onautohydrogenotrophic denitriWcation using the hollow-Wber mem-brane–bioWlm reactor. Water Res 37:1551–1556
17. Lowry OH, Rosebrough NJ, Farr AL, Randall RJ (1951) Proteinmeasurement with the Folin phenol reagent. J Biol Chem193:265–275
18. McLamore E, Jackson WA, Morse A (2007) Abiotic transport in amembrane aerated bioreactor. J Membr Sci 298:110–116
19. Muyzer G, Dewaal EC, Uitterlinden AG (1993) ProWling of com-plex microbial populations by denaturing gradient gel electropho-resis analysis of polymerase chain reaction-ampliWed genes codingfor 16S rRNA. Appl Environ Microbiol 59:695–700
20. Rector TJ, Garland JL, Starr SO (2006) dispersion characteris-tics of a rotating hollow Wber membrane bioreactor: eVects ofmodule packing density and rotational frequency. J Membr Sci278:144–150
21. Sambrook J, Fritsch EF, Maniatis T (1989) Molecular cloning: alaboratory manual, 2nd edn. Cold Spring Harbor Laboratory, ColdSpring Harbor

J Ind Microbiol Biotechnol (2008) 35:465–473 473
123
22. Shanahan JW, Semmens MJ (2004) Multipopulation model ofmembrane-aerated bioWlms. Environ Sci Technol 38:3176–3183
23. Shanahan JW, Semmens MJ (2006) InXuence of a nitrifying bio-Wlm on local oxygen Xuxes across a micro-porous Xat sheet mem-brane. J Membr Sci 277:65–74
24. Third KA, Paxman J, Schmid M, Strous M, Jetten MS,Cord-Ruwisch R (2005) Treatment of nitrogen-rich wastewaterusing partial nitriWcation and anammox in the CANON process.Water Sci Technol 52(4):47–54

Copyright © 2022 FDOKUMEN