Biological Assessment of the Cook Inlet Beluga - Seward ...
141
Biological Assessment of the Cook Inlet Beluga Whale (Delphinapterus leucas) for the Seward Highway MP 105-107 Windy Corner Project, Municipality of Anchorage, Upper Cook Inlet, Alaska Designated non-Federal action agency: State of Alaska Department of Transportation and Public Facilities (DOT&PF) Section 7 Biological Assessment Seward Highway, MP105-107, Windy Corner Project 0A3-1(34)/56631 Prepared for: State of Alaska Department of Transportation and Public Facilities, Central Region Prepared by: LGL Alaska Research Associates, Inc. In association with: DOWL April 2015
-
Upload
khangminh22 -
Category
Documents
-
view
2 -
download
0
Transcript of Biological Assessment of the Cook Inlet Beluga - Seward ...

Biological Assessment of the Cook Inlet Beluga Whale (Delphinapterus leucas) for the Seward Highway MP 105-107 Windy Corner Project,
Municipality of Anchorage, Upper Cook Inlet, Alaska
Designated non-Federal action agency: State of Alaska Department of Transportation and
Public Facilities (DOT&PF)
Section 7 Biological Assessment Seward Highway, MP105-107, Windy Corner
Project 0A3-1(34)/56631
Prepared for: State of Alaska Department of
Transportation and Public Facilities, Central Region
Prepared by: LGL Alaska Research Associates, Inc.
In association with: DOWL
April 2015

This page is intentionally left blank.

Biological Assessment of the Cook Inlet Beluga Whale (Delphinapterus leucas) for the Seward Highway MP 105-107 Windy Corner Project
Page i
TABLE OF CONTENTS
I. Executive Summary ................................................................................................................ 1
II. Project Description .................................................................................................................. 2
A. Project Location ................................................................................................................... 2
B. Definition of Action Area ..................................................................................................... 7
C. Proposed Action ................................................................................................................... 8
1. Overview of proposed actions ......................................................................................... 8
2. Project schedule ............................................................................................................. 10
3. Detailed steps of proposed action .................................................................................. 10
4. Best management practices and other conservation measures ...................................... 21
III. Description of the Species and Their Habitat ........................................................................ 22
A. Occurrence of Other Marine Mammals in the Project Action Area ................................... 26
B. Occurrence of Other Protected Species in the Waters of the Windy Corner Project Action Area. ................................................................................................................................... 27
C. General Description of Cook Inlet Habitat ......................................................................... 27
D. General Description of Turnagain Arm Habitat ................................................................. 30
E. Beluga Distribution and Habitat Use in Cook Inlet ........................................................... 30
1. Inter-annual distribution patterns of belugas in Cook Inlet ........................................... 31
2. Seasonal distribution patterns ........................................................................................ 35
3. CIBW feeding habitat .................................................................................................... 37
4. CIBW calving habitat .................................................................................................... 40
5. Other uses of habitat ...................................................................................................... 40
F. CIBW Critical Habitat ........................................................................................................ 41
G. PCE 2 and Overlap with Essential Fish Habitat (EFH) ...................................................... 45
H. CIBW Use of Turnagain Arm and the Windy Corner Project Action Area: Seasonal Patterns ............................................................................................................................... 46
1. Information from aerial surveys..................................................................................... 46
2. Information from satellite tags ....................................................................................... 47
3. Information from land-based surveys for DOT&PF ...................................................... 47
4. Information from land-based surveys for the CIBW Photo-ID Project ......................... 50
5. Information from traditional ecological knowledge (TEK) ........................................... 52
6. Information from LGL incidental observations ............................................................. 52
7. Information from NMML observational sighting database ........................................... 53

Biological Assessment of the Cook Inlet Beluga Whale (Delphinapterus leucas) for the Seward Highway MP 105-107 Windy Corner Project
Page ii
8. Information from Anchorage Coastal Beluga Survey (ACBS) ..................................... 54
9. CIBW use of Turnagain Arm and Windy Corner Project Action Area: tidal patterns .. 54
10. Information from land-based surveys for DOT&PF ...................................................... 54
11. Information from land-based surveys for the CIBW Photo-id Project .......................... 55
12. Information from visual monitoring during Greeneridge /DOT&PF acoustic ambient recording ........................................................................................................................ 55
13. Information from LGL incidental observations ............................................................. 56
14. Information from Anchorage Coastal Beluga Survey (ACBS) ..................................... 57
I. Summary of Seasonal and Tidal Occurrence of CIBW in Turnagain Arm and the Windy Corner Project Action Area ................................................................................................ 57
1. Seasonal ......................................................................................................................... 57
2. Tidal ............................................................................................................................... 59
3. Use of habitat ................................................................................................................. 59
IV. Environmental Baseline ........................................................................................................ 60
A. Environmental Baseline of CIBW in the Windy Corner Project Action Area ................... 60
1. CIBW abundance and population trend ......................................................................... 60
2. Conservation status of CIBW ........................................................................................ 61
B. Human-Induced Factors ..................................................................................................... 62
1. Subsistence harvest ........................................................................................................ 62
2. Poaching and illegal harassment .................................................................................... 63
3. Fishing............................................................................................................................ 63
C. Pollution ............................................................................................................................. 63
1. Air pollution ................................................................................................................... 63
2. Water pollution .............................................................................................................. 64
3. Oil and gas ..................................................................................................................... 65
D. Coastal Development ......................................................................................................... 68
E. Vessel Traffic ..................................................................................................................... 70
F. Tourism and Whale Watching ............................................................................................ 70
G. Noise ................................................................................................................................... 70
H. Scientific Research on CIBW in Turnagain Arm ............................................................... 71
I. Additional Environmental Baseline Considerations .......................................................... 72
1. Strandings ...................................................................................................................... 72
J. Cumulative Effects ............................................................................................................. 73

Biological Assessment of the Cook Inlet Beluga Whale (Delphinapterus leucas) for the Seward Highway MP 105-107 Windy Corner Project
Page iii
K. Environmental Baseline of CIBW Critical Habitat in the Windy Corner Project Action Area. ....................................................................................................................... 74
V. Effect of the Action ............................................................................................................... 75
A. Overview of Effects Section ............................................................................................... 75
B. Direct and Indirect Effects of the Windy Corner Project on CIBW .................................. 75
1. Direct and indirect effects of Windy Corner Project from habitat alteration ................ 76
2. Direct and indirect effects of Windy Corner Project from pollution ............................. 79
3. Direct and indirect effects of Windy Corner Project from reduction in availability or quality of prey species ................................................................................................... 81
4. Direct and indirect effects of Windy Corner Project from noise ................................... 81
5. Noise generated by the Windy Corner Project .............................................................. 88
6. Direct and indirect effects of Windy Corner Project from illegal harassment .............. 97
7. Direct and indirect effects of Windy Corner Project from injury or mortality .............. 98
C. Direct and Indirect Effects of the Windy Corner Project on CIBW Critical Habitat ....... 100
D. Cumulative Effects of the Windy Corner Project on CIBW and Their Critical Habitat .. 101
E. Summary of Effects of the Action .................................................................................... 102
VI. Determination of Effect ....................................................................................................... 104
A. Destruction or Adverse Modification Standard for Critical Habitat ................................ 105
VII. References and Personal Communications Cited ................................................................ 106
LIST OF TABLES
Table 1. Endangered Species and Critical Habitat, Status, and Effects Determination for the Windy Corner Project. ............................................................................................... 1
Table 2. Summary of Blasting Activities for the Windy Corner Project ..................................... 19 Table 3. Marine mammals that could occur in the Windy Corner Project Action Area. ............. 27
Table 4. Approximate timing of the presence (gray shading) and peak availability (black shading) of fish species entering fresh water drainages in Upper Cook Inlet (Moore et al. 2000a). ...................................................................................................... 38
Table 5. List of anadromous rivers or streams in or within 5 mi (8 km) of the Windy Corner Project Action Area............................................................................................ 44
Table 6. Summary of incidental sightings reports to LGL’s CIBW Photo-id Project of CIBW in Turnagain Arm, (McGuire et al. 2014, McGuire unpublished data). B and shading indicate CIBW sighting reported. .............................................................. 53
Table 7. Photoid Tidal windy. Seen < 3mi (4.8 km), of Windy Corner (McGuire et al. 2014, McGuire unpublished data).................................................................................. 55
Table 8. LGL incidentals Tidal windy. Seen < 3 mi (4.8 km) of Windy Corner in Windy Corner Project Action Area (McGuire et al. 2014, McGuire unpublished data). .......... 56

Biological Assessment of the Cook Inlet Beluga Whale (Delphinapterus leucas) for the Seward Highway MP 105-107 Windy Corner Project
Page iv
Table 9. Summary of seasonal pattern of CIBW occurrence in Turnagain Arm. ........................ 58
Table 10. Summary of tidal pattern of CIBW occurrence in the Windy Corner Project Action Area. ................................................................................................................... 59
Table 11. Baseline of primary constituent elements (PCEs) of beluga whale critical habitat in the Windy Corner Project Action Area. ......................................................... 74
Table 12. Mean in-air noise levels for various types of construction equipment (URS 2004). ............................................................................................................................. 89
Table 13. Possible effects to Cook Inlet beluga whales and their critical habitat resulting from the Windy Corner Projects, including location, project activity, project phase, and relative duration of effect. .......................................................................... 103
Table 14. Windy Corner Project actions, potential effects, and determination of effects on CIBW and critical habitat. ...................................................................................... 104
Table 15. Determination of the effects of the Windy Corner Project on CIBW and its critical habitat............................................................................................................... 105
LIST OF FIGURES
Figure 1: A map of Cook Inlet, Alaska, showing place names referred to in the text. ................... 3
Figure 2: Location of the two material sites (named Material Site 1 and Material Site 6) that will be used for fill material for the Windy Corner Project. MP refers to milepost markers. ........................................................................................................................................... 4
Figure 3: Location of the area that will be filled during the Windy Corner Project. A total of approximately 38 acres (15.4 hectares) will be filled. ................................................................ 4 Figure 4: Although the project is called the Seward Highway Windy Corner Safety Improvement Project for Mile 105-107, the inclusion of material sites extends the construction boundary for this project between milepost 104 and milepost 109 along the Seward Highway, and the inclusion of sound generated by blasting extends the Project Action Area from milepost 103.5 to milepost 109.5 and 4,921 ft (1,500 m) into Turnagain Arm. ................................................................................................................................................ 5
Figure 5: Anadromous and non-anadromous rivers and streams within and in the vicinity of the Windy Corner Project Action Area. ..................................................................................... 6 Figure 6: Current and proposed DOT&PF projects along the Seward Highway Corridor. ............ 8
Figure 7: Proposed design for the Windy Corner Project. The term “daylight limits” refers to the outermost edge of cut or fill for a road; it is the extent of excavation or fill. (http://www.dowlhkm.com/projects/windycorner/photos.html) .................................................... 9 Figure 8: Design detail showing the rescue-craft ramp (lower left corner) for the Windy Corner Project. .............................................................................................................................. 10
Figure 9: Location of the four sites where rock blasting will occur during the Windy Corner Project. .............................................................................................................................. 11
Figure 10: Gorilla Rock blasing extent. Blasting and subsequent rock ‘ripping’ will remove approximately 33 feet of height from Gorilla Rock......................................................... 12 Figure 11: Windy Corner and Gorilla Rock, typical cross-sections indicating excavation extent. ............................................................................................................................................ 14
Figure 12: Material Site 1 blasting and excavation extent. ........................................................... 16 Figure 13: Material Site 6 blasting and excavation extent. ........................................................... 18 Figure 14: Map of Cook Inlet, Alaska. ......................................................................................... 29

Biological Assessment of the Cook Inlet Beluga Whale (Delphinapterus leucas) for the Seward Highway MP 105-107 Windy Corner Project
Page v
Figure 15: Areas occupied by beluga whales in Cook Inlet, Alaska, in June/July 1978–1979 (from Rugh et al. 2010). ....................................................................................................... 32
Figure 16: Areas occupied by beluga whales in Cook Inlet, Alaska, in June/July 1993–1997 (from Rugh et al. 2010). ....................................................................................................... 33
Figure 17: Areas occupied by beluga whales in Cook Inlet, Alaska, in June 1998–2008 (from Rugh et al. 2010). ................................................................................................................ 34
Figures 18 (a–h): Monthly kernel density charts based on daily tag locations (a single best location was chosen for each day); the yellow area represents the highest density and 50% of the population, the green is 75% and the red is 95% of the population (Hobbs et al. 2005) ........................................................................................................................................ 36
Figure 19: Map of Cook Inlet Beluga Critical Habitat (NMFS 2011). ......................................... 43 Figure 20: Anadromous streams and rivers within 5 mi (8km) of the Windy Corner Project Action Area....................................................................................................................... 45
Figure 21: Sighting rates of beluga whale groups in Upper Turnagain Arm along the Seward Highway are compared (a) by month (mean values with standard errors) and (b) by day (from Markowitz et al. 2007). ........................................................................................... 48 Figure 22: The number of beluga whales observed in Upper Turnagain Arm are compared (a) by month (mean values with standard errors) and (b) by day (from Markowitz et al. 2007). ................................................................................................................. 49
Figure 23: Route and beluga whale group(s) encountered and general survey route of all 2011 land-based surveys along Turnagain Arm, Upper Cook Inlet, Alaska (McGuire et al. 2014). ............................................................................................................................................ 50
Figure 24: Route and beluga whale group(s) encountered and general survey route of all 2012 land-based surveys along Turnagain Arm, Upper Cook Inlet, Alaska (McGuire et al. 2014). ............................................................................................................................................ 51
Figure 25: Route and beluga whale group(s) encountered and general survey route of all 2013 land-based surveys along Turnagain Arm, Upper Cook Inlet, Alaska (from McGuire et al. 2014). ................................................................................................................................... 52
Figure 26: Mother and calf CIBW seen at Windy Corner on September 21, 2014 during the falling tide. (Photo credit: Amber Stephens, LGL Alaska Research Associates, Inc.) .......... 57
Figure 27: Abundance estimates for CIBW 1994-2012. The vertical bars represent 95% confidence intervals for each estimate. The red line is the trend for the years 1999–2012 (Hobbs et al. 2012). ....................................................................................................................... 61
Figure 28: Map of Cook Inlet oil and gas activities in 2014. ....................................................... 67 Figure 29: General geographic distribution of current or proposed human activities in Cook Inlet. The map was created in 2011 but the information still generally applies, although proposed Seward Highway projects run the length of Turnagain Arm. ........................ 69
Figure 30: Location of the area that will be filled during the Windy Corner Project. A total of 38 acres (15.4 hectares) will be filled. .............................................................................. 76 Figure 31: Gorilla Rock (center) and associated mudflats during low tide. Note waterline from a previous high tide (image 2014 Google earth). ................................................................. 77 Figure 32: Gorilla Rock and adjacent deep-water cove, southeast-facing views. ........................ 78
Figure 33: Explosion at Eagle Bay, Knik Arm during military exercises on August 2010. (photo T.McGuire, NMFS MMPA/ESA permit #14210) ............................................................. 84 Figure 34: Summary of maximum harassment zones per 10 kg blast of ANFO. Note there is no 180-dB contour on the farthest east site (near milepost 104; HLS 2014). ........................... 91

Biological Assessment of the Cook Inlet Beluga Whale (Delphinapterus leucas) for the Seward Highway MP 105-107 Windy Corner Project
Page vi
Figure 35: The inclusion of sound generated by blasting extends the Windy Corner Project Action Area from milepost 103.5 to milepost 109.5 and 4921 ft (1,500 m) into Turnagain Arm. ............................................................................................................................. 92
Figure 36: Beluga whales around earth-moving activity at the Port of Anchorage (photo: T.McGuire, NMFS MMPA/ESA permit #18016). ....................................................................... 99 Figure 37: Current and proposed DOT&PF projects along the Seward Highway Corridor. ...... 102
APPENDICES
Appendix 1. AMBIENT UNDERWATER SOUND LEVELS MEASURED AT WINDY CORNER, TURNAGAIN ARM, ALASKA (Greeneridge Sciences, Inc.) ........... 123
Appendix 2. ACOUSTIC MODELING SEWARD HIGHWAY, MP105-107, WINDY CORNER (Heat, Light, and Sound Research) ....................................................... 124
Appendix 3. MONITORING AND MITIGATION PLAN ........................................................ 125
Biological Assessment of the Cook Inlet Beluga Whale (Delphinapterus leucas) for the Seward Highway MP 105-107 Windy Corner Project
Page vii
ACRONYMS AND ABBREVIATIONS
< less than
> greater than
≤ less than or equal to
≥ greater than or equal to
± plus or minus
~ approximately
° degree(s)
°C degrees Celsius
°F degrees Fahrenheit
µP micropascals
AAC Alaska Administrative Code
ACBS Anchorage Coastal Beluga Survey
ADEC Alaska Department of Environmental Conservation
ADF&G Alaska Department of Fish and Game
ANFO ammonia nitrate and fuel oil
APDES Alaska Pollutant Discharge Elimination System
ARRC Alaska Railroad Corporation
BA Biological Assessment
BMPs Best Management Practice(s)
CIBW Cook Inlet beluga whales
cm centimeter(s)
CO carbon monoxide
cu m cubic meter(s)
c.y cubic yard(s)
dB decibel(s)
dB re 1 µPa decibel referenced to one micropascal
DEC Department of Environmental Conservation
DOT&PF Alaska Department of Transportation and Public Facilities
DPS distinct population segment
EFH essential fish habitat
EPA Environmental Protection Agency

Biological Assessment of the Cook Inlet Beluga Whale (Delphinapterus leucas) for the Seward Highway MP 105-107 Windy Corner Project
Page viii
ACRONYMS AND ABBREVIATIONS (CONTINUED)
EPOC emerging pollutants of concern
ESA Endangered Species Act
ESU evolutionary significant units
FAR Friends of the Anchorage Coastal Wildlife Refuge
FEMA Federal Emergency Management Agency
FHWA Federal Highway Administration
FHWG Fisheries Hydroacoustic Working Group
ft foot/feet
ft/sec feet per second
GIS Geographic Information Systems
HLS Heat, Light, and Sound Research
Hz Hertz
in inch(es)
kg kilogram(s)
kHz kilohertz
km kilometer(s)
km2 square kilometer(s)
km/hr kilometer(s) per hour
KPB Kenai Peninsula Borough
lb pound(s)
LNG liquid natural gas
m meter(s)
m/sec meters per second
mi mile(s)
mi2 square mile(s)
mi/hr mile(s) per hour
MHW mean high water
MHHW mean higher high water
MLLW mean lower low water
MMPA Marine Mammal Protection Act
MOA Municipality of Anchorage

Biological Assessment of the Cook Inlet Beluga Whale (Delphinapterus leucas) for the Seward Highway MP 105-107 Windy Corner Project
Page ix
ACRONYMS AND ABBREVIATIONS (CONTINUED)
MP milepost
MS materials site(s)
MSL mean sea level
NEPA National Environmental Policy Act
NMFS National Marine Fisheries Service
NMML National Marine Mammal Laboratory
NOAA National Oceanic and Atmospheric Administration
NPDES National Pollutant Discharge Elimination System
PAH polycyclic aromatic hydrocarbons
PCB polychlorinated biphenyl
PCE primary constituent element
POA Port of Anchorage
PSOs Protected Species Observers
PTS permanent threshold shift
rms root mean squared
SD Standard deviation
SEL sound energy level
SLE St. Lawrence Estuary
SPL sound pressure level
SWPPP Storm Water Pollution and Prevention Program
TAG Technical Advisory Group
TEK Tradition Ecological Knowledge
TS threshold shift
TTS temporary threshold shift
USCG United States Coast Guard
USFWS U.S. Fish and Wildlife Service

Biological Assessment of the Cook Inlet Beluga Whale (Delphinapterus leucas) for the Seward Highway MP 105-107 Windy Corner Project
Page x
SPECIES NAMES
Common Name Scientific Name
Arctic grayling Thymallus arcticus
Beluga whale Delphinapterus leucas
Bottlenose dolphin Tursiops truncatus
Brown trout Salmo trutta
Burbot Lota lota
Chinook salmon Oncorhynchus tshawytscha
Chum salmon Oncorhynchus keta
Coho salmon Oncorhynchus kisutch
Dolly Varden Salvelinus malma
Gray whale Eschrichtius robustus
Harbor porpoise Phocoena phocoena
Harbor seal Phoca vitulina
Humpback whale Megaptera novaeangliae
Killer whale Orcinus orca
Lake chub Couesius plumbeus
Longnose sucker Catostomus catostomus
North Atlantic right whale Eubalaena glacialis
Northern pike Esox lucius
Pacific cod Gadus macrocephalus
Pacific eulachon Thaleichthys pacificus
Pacific tomcod Microgadus proximus
Pink salmon Oncorhynchus gorbuscha
Pink snapper Pagrus auratus
Polar bear Ursus maritimus
Saffron cod Eleginus gracilis
Sockeye salmon Oncorhynchus nerka
Starry flounder Platichthys stellatus
Steelhead (Rainbow) trout Oncorhynchus mykiss
Stejners beaked whale Mesoplodon stejnegeri
Steller sea lion Eumetopias jubatus

Biological Assessment of the Cook Inlet Beluga Whale (Delphinapterus leucas) for the Seward Highway MP 105-107 Windy Corner Project
Page xi
SPECIES NAMES (CONTINUED)
Common Name Scientific Name
Tanner crab Chionoecetes bairdi
Walleye pollock Theragra chalcogramma
Whitefish Coregoninae spp.
Yellowfin sole Limanda aspera

Biological Assessment of the Cook Inlet Beluga Whale (Delphinapterus leucas) for the Seward Highway MP 105-107 Windy Corner Project
Page 1
I. EXECUTIVE SUMMARY
The Seward Highway Windy Corner Safety Improvement Project for Milepost 105-107 (hereafter referred to as the Windy Corner Project) is part of the Alaska Department of Transportation and Public Facilities’ (DOT&PF) efforts to address traffic safety concerns on the Seward Highway Corridor. The Windy Corner Project will realign the highway and the railroad along a two-mile segment of the Seward Highway in the vicinity of Windy Corner, along Cook Inlet’s Turnagain Arm. This segment is proposed to be designed as a two-lane divided highway to meet current design standards.
As the lead agency for the project, DOT&PF has conducted design development with input from the public as well as from local, state, and federal agencies, including the Alaska Railroad Corporation (ARRC), the Alaska Departments of Natural Resources and Fish and Game (ADF&G), Chugach State Park, National Marine Fisheries Service (NMFS), the U.S. Army Corps of Engineers, the Anchorage Fire Department, and others. The proposed Windy Corner Project is being completed using a combination of state and federal funds and is being developed in accordance with Federal Highway Administration (FHWA) guidelines.
For projects involving a federal nexus, the Endangered Species Act (ESA) requires a consultation between the federal agency charged with protecting the species and the federal agency involved in the project to ensure that any federally authorized action is not likely to jeopardize the continued existence of any ESA-listed species or result in the destruction or adverse modification of its critical habitat. DOT&PF has been designated by FHWA to serve as the non-federal representative for the Windy Corner Project. After DOT&PF consulted with the U.S. Fish and Wildlife Service (USFWS) and the National Marine Fisheries Service on threatened or endangered species that potentially could be affected by the proposed project, it was determined that the only federally listed species that is documented to occur in the proposed Windy Corner Project area is the Cook Inlet distinct population segment (DPS) of beluga whales (Delphinapterus leucas). Federally designated critical habitat for Cook Inlet beluga whales (CIBW) is also present in the project area. Because beluga whales fall under the jurisdiction of NMFS, the ESA consultation for Windy Corner is between NMFS and DOT&PF.
As part of the consultation, a Biological Assessment (BA) is required. This BA summarizes DOT&PF’s proposed actions for the Windy Corner Project, examines the potential effects on CIBW and their critical habitat, and proposes monitoring and mitigation measures to reduce potential impacts from the project. DOT&PF has determined that the proposed project may affect, but is not likely to adversely affect CIBW or their critical habitat (Table 1).
Table 1. Endangered Species and Critical Habitat, Status, and Effects Determination for the Windy Corner Project.
SPECIES/DISTINCT POPULATION SEGMENT (DPS)/CRITICAL HABITAT
LISTING STATUS
EFFECTS DETERMINATION
Cook Inlet beluga whale (Delphinapterus leucas) Endangered May affect, not likely to adversely affect
Cook Inlet beluga whale critical habitat Designated May affect, not likely to adversely affect

Biological Assessment of the Cook Inlet Beluga Whale (Delphinapterus leucas) for the Seward Highway MP 105-107 Windy Corner Project
Page 2
II. PROJECT DESCRIPTION
A. Project Location
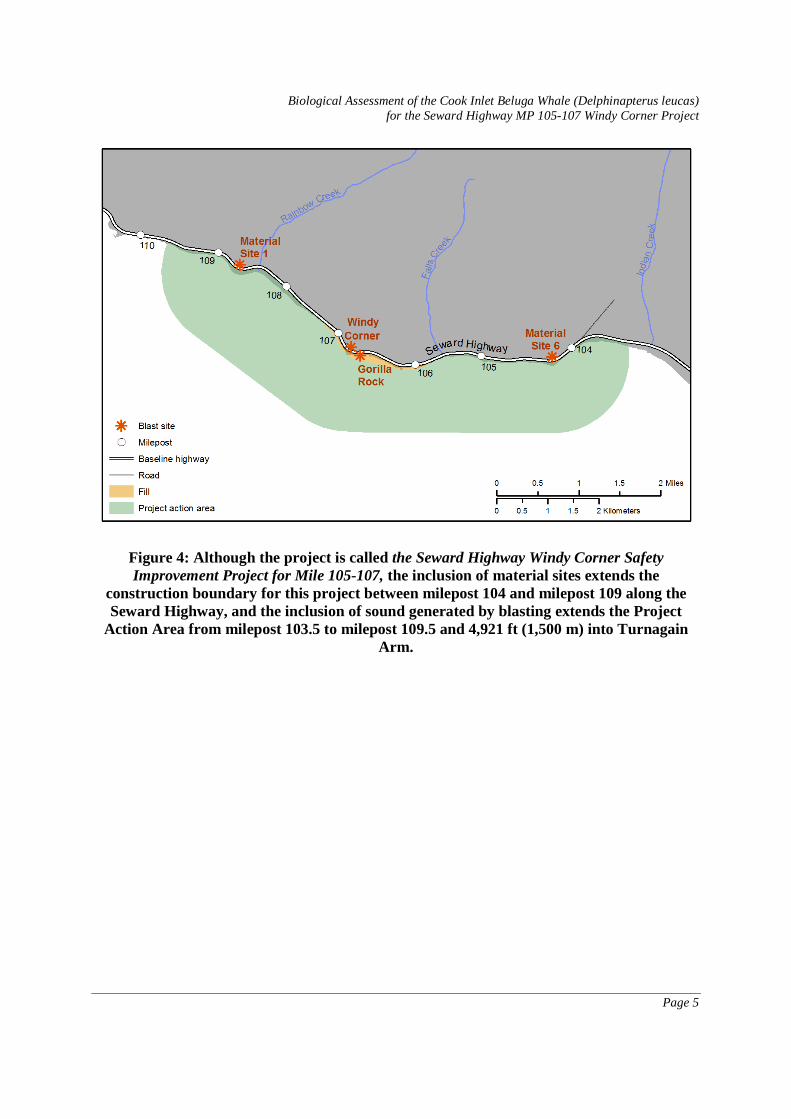
The Seward Highway Windy Corner Safety Improvement Project for Mile 105-107 (hereafter referred to as the Windy Corner Project) is located along the Seward Highway, adjacent to the north shore of Turnagain Arm in Upper Cook Inlet, Alaska (Figure 1). Windy Corner Project activities (i.e., highway realignment and railroad relocation) will occur at and adjacent to Windy Corner, located between Anchorage to the northwest and Girdwood to the southeast. Windy Corner itself is located at 60.984227 N, -149.608410 W. Although the project is called the Seward Highway Windy Corner Safety Improvement Project for Mile 105-1071, the inclusion of material sites for the project extends the construction area boundaries for this project between milepost 104 and milepost 109 along the Seward Highway (Figure 2), and fill activities will extend it 450 feet (ft) (137 meters (m)) into Turnagain Arm (Figure 3). When the effects of sound generated by this project are considered (see section below), the Windy Corner Project Action Area extends between milepost 103.5 and milepost 109.5 along the Seward Highway and 4,921 ft (1,500 m) into Turnagain Arm (Figure 4).
1 Milepost markers refer to miles along the Seward Highway, with the zero milepost marker located in Seward Alaska.

Biological Assessment of the Cook Inlet Beluga Whale (Delphinapterus leucas) for the Seward Highway MP 105-107 Windy Corner Project
Page 3
Figure 1: A map of Cook Inlet, Alaska, showing place names referred to in the text.

Biological Assessment of the Cook Inlet Beluga Whale (Delphinapterus leucas) for the Seward Highway MP 105-107 Windy Corner Project
Page 4
Figure 2: Location of the two material sites (named Material Site 1 and Material Site 6) that will be used for fill material for the Windy C orner Project. MP refers to milepost
markers.
Figure 3: Location of the area that will be filled during the Windy Corner Project. A total of approximately 38 acres (15.4 hectares) will be filled.
Biological Assessment of the Cook Inlet Beluga Whale (Delphinapterus leucas) for the Seward Highway MP 105-107 Windy Corner Project
Page 5
Figure 4: Although the project is called the Seward Highway Windy Corner Safety Improvement Project for Mile 105-107, the inclusion of material sites extends the
construction boundary for this project between milepost 104 and milepost 109 along the Seward Highway, and the inclusion of sound generated by blasting extends the Project
Action Area from milepost 103.5 to milepost 109.5 and 4,921 ft (1,500 m) into Turnagain Arm.

Biological Assessment of the Cook Inlet Beluga Whale (Delphinapterus leucas) for the Seward Highway MP 105-107 Windy Corner Project
Page 6
The Windy Corner Project is located within the borough of the Municipality of Anchorage2 and adjacent to Chugach State Park, along Cook Inlet’s Turnagain Arm. Cook Inlet is a tidal estuary approximately 220 mi (350 km) in length located in south central Alaska. Turnagain Arm is about 30 mi (48 km) long and approximately 4 mi (6 km) in width. It is quite shallow (max depth of 66 ft [20 m], 7 ft [2 m] in some areas; NOAA bathymetric database), and parts of it become exposed during low tide. The aquatic habitat of Turnagain Arm is described in more detail in Section III of this document. The USFWS National Wetlands Inventory website classifies Turnagain Arm marine waters as estuarine (http://www.fws.gov/wetlands/).
There are no major rivers or river mouths in the Windy Corner Project Action Area (milepost 103.5 to 109.5; Figure 5), nor are there any anadromous or resident fish streams (ADFG 2013). Only two streams, Falls Creek (milepost 105.6) and Rainbow Creek (milepost 108.5), are located within the Windy Corner Project Action Area and both are non-fish bearing streams with steep gradients. The nearest anadromous fish streams to the south/east are located at Bird Creek (milepost 102) and Indian Creek (milepost 103), both outside of the Windy Corner Project Action Area. The nearest anadromous fish stream to the north/west is at Rabbit Creek (milepost 117).
Figure 5: Anadromous and non-anadromous rivers and streams within and in the vicinity of the Windy Corner Project Action Area.
2 Alaska has boroughs instead of counties.

Biological Assessment of the Cook Inlet Beluga Whale (Delphinapterus leucas) for the Seward Highway MP 105-107 Windy Corner Project
Page 7
The waters off Windy Corner are classified as both “waters of the U.S.” and “Alaska state waters”. With respect to Federal jurisdiction, Cook Inlet, including Turnagain Arm, contains “waters of the United States” under the Clean Water Act because these waters are “subject to the ebb and flow of the tide” (40 CFR 230.3(s)). In addition, the U.S. Army Corps of Engineers has federal authority over these waters via their wetland/waters permitting authority. All of Cook Inlet is classified by NMFS as essential fish habitat (EFH) and is a migratory corridor for all five Pacific salmon species: pink, chum, sockeye, coho, and Chinook.
With respect to state jurisdiction, the State of Alaska is also responsible for fisheries management within and near the project area. Within ADF&G, commercial fisheries, personal use, subsistence, and sport fisheries are managed by separate divisions, and, as a result, have different management districts and regulatory requirements. Turnagain Arm’s commercial and subsistence fisheries fall under ADF&G’s Turnagain Arm subdistrict in the Northern Management District for Cook Inlet, while sports fisheries and personal-use fisheries in Turnagain Arm fall under the Anchorage Management Area.
B. Definition of Action Area
The inclusion of material sites (Figure 2) and the fill area (Figure 3) for the project extends the construction boundary for this project between milepost 104 and milepost 109 along the Seward Highway. Fill activities extend the construction boundary out to 450 ft (137 m) into Turnagain Arm.
The action area for the Windy Corner Project includes the construction boundary (defined above) plus the in-water area that will become ensonified at the 160 dB referenced to one micropascal (re 1 µPa) root mean square (RMS) SPL and 180 dB re 1 µPa RMS SPL levels by noise generated by blasting activities. More information on the estimated sound level thresholds for the Windy Corner Project is found in section V and Appendix 2. Inclusion of this ensonified area enlarges the Windy Corner Project Action Area to include the area between milepost 103.5 and milepost109.5 along the Seward Highway and 4,921 ft (1500 m) into Turnagain Arm (Figure 4).
CIBW and their critical habitat occur within the proposed Windy Corner Project Action Area (the species and habitat are discussed in more detail in Section III of this document). Potential impacts occurring in the action area during the Windy Corner Project and relevant for this Biological Assessment (BA) include:
• Habitat alteration • Pollution • Reduction in availability or quality of prey species • Noise • Illegal harassment • Injury or mortality
Section V of this document discusses these potential impacts in detail.

Biological Assessment of the Cook Inlet Beluga Whale (Delphinapterus leucas) for the Seward Highway MP 105-107 Windy Corner Project
Page 8
C. Proposed Action
1. Overview of proposed actions
The primary objective of the Windy Corner Project is to continue the Alaska Department of Transportation and Public Facilities (DOT&PF) efforts to address traffic safety concerns on the Seward Highway Corridor. DOT&PF has proposed multiple projects along the Seward Highway that are being designed and permitted as separate projects (Figure 6). The Windy Corner Project will realign the highway and the railroad along a two-mile segment of the Seward Highway in the vicinity of Windy Corner. The segment is proposed to be designed as a two-lane divided highway to meet current design standards. The railroad tracks at Windy Corner will also be realigned and extended into filled areas of Turnagain Arm in order to provide space for the proposed highway realignment.
Figure 6: Current and proposed DOT&PF projects along the Seward Highway Corridor.
As a secondary objective, the new alignment at Windy Corner creates space for new and expanded roadside recreational facilities and wildlife viewing areas (including parking and walkways) with acceleration and deceleration lanes for turning traffic (Figure 7). The realignment and relocation of the highway and railroad corridors will involve the relocation and reconstructions of adjacent utilities. Water access for emergency responders and search-and-rescue teams will also be created as a result of project activities (Figure 8).

Biological Assessment of the Cook Inlet Beluga Whale (Delphinapterus leucas) for the Seward Highway MP 105-107 Windy Corner Project
Page 9
Figure 7: Proposed design for the Windy Corner Project. The term “daylight limits” refers to the outermost edge of cut or fill for a road; it is the extent of excavation or fill. (http://www.dowlhkm.com/projects/windycorner/photos.html)

Biological Assessment of the Cook Inlet Beluga Whale (Delphinapterus leucas) for the Seward Highway MP 105-107 Windy Corner Project
Page 10
Figure 8: Design detail showing the rescue-craft ramp (lower left corner) for the Windy Corner Project.
2. Project schedule
Project construction is planned to begin in 2016, during the ice-free season, which is typically April through October in Cook Inlet. In-water work would not occur April–early June or August–October in order to minimize potential project impacts to beluga whales and migrating fish (details in Section V and Appendix 3).
3. Detailed steps of proposed action
Activities for the Windy Corner Project can be divided into road realignment and railroad realignment activities, with the following in-water components:
a) Blasting b) Filling c) Rescue-craft ramp construction
General blasting plan for Windy Corner Project
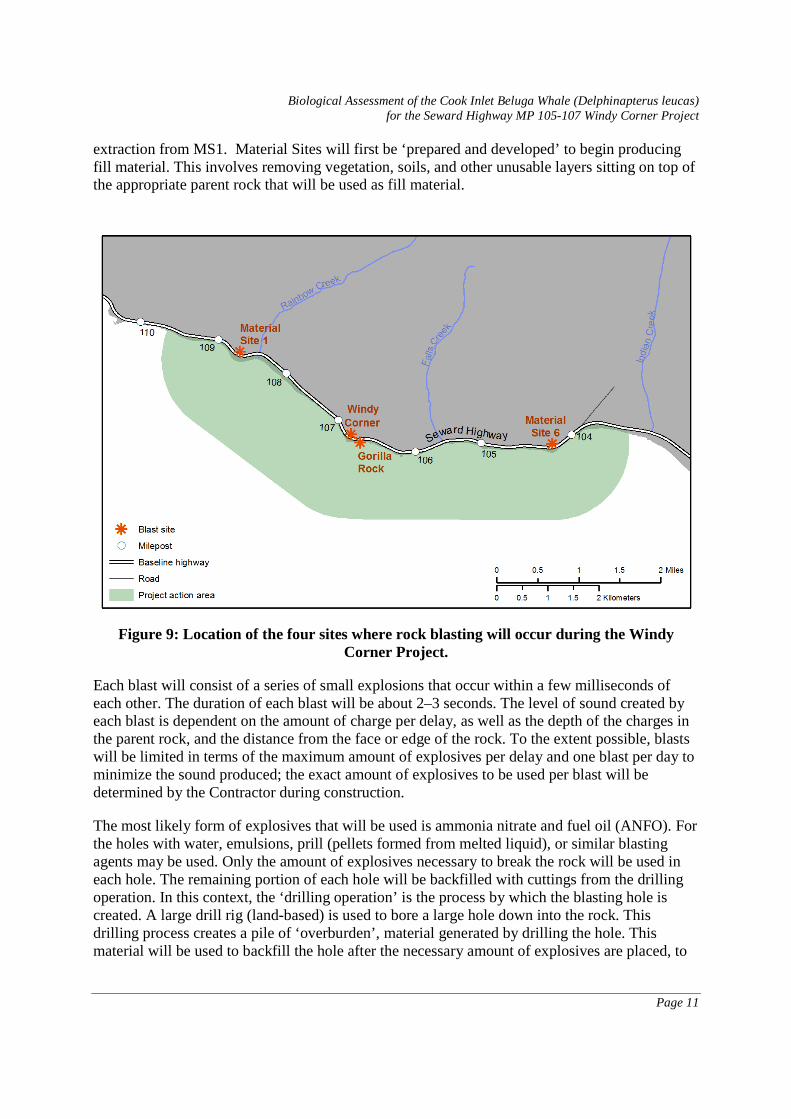
Rock blasting will occur as part of the Windy Corner Project in order to create space for the road and railroad realignment; this blasting will occur at Windy Corner proper and at Gorilla Rock (Figure 9). In addition, rock blasting will occur at either Material Sites (MS) 1 or 6 in order to create fill material for the Windy Corner Project. As currently envisioned, only one material site (MS1) will be developed. MS6 will be permitted, but only developed if needed following
Biological Assessment of the Cook Inlet Beluga Whale (Delphinapterus leucas) for the Seward Highway MP 105-107 Windy Corner Project
Page 11
extraction from MS1. Material Sites will first be ‘prepared and developed’ to begin producing fill material. This involves removing vegetation, soils, and other unusable layers sitting on top of the appropriate parent rock that will be used as fill material.
Figure 9: Location of the four sites where rock blasting will occur during the Windy Corner Project.
Each blast will consist of a series of small explosions that occur within a few milliseconds of each other. The duration of each blast will be about 2–3 seconds. The level of sound created by each blast is dependent on the amount of charge per delay, as well as the depth of the charges in the parent rock, and the distance from the face or edge of the rock. To the extent possible, blasts will be limited in terms of the maximum amount of explosives per delay and one blast per day to minimize the sound produced; the exact amount of explosives to be used per blast will be determined by the Contractor during construction.
The most likely form of explosives that will be used is ammonia nitrate and fuel oil (ANFO). For the holes with water, emulsions, prill (pellets formed from melted liquid), or similar blasting agents may be used. Only the amount of explosives necessary to break the rock will be used in each hole. The remaining portion of each hole will be backfilled with cuttings from the drilling operation. In this context, the ‘drilling operation’ is the process by which the blasting hole is created. A large drill rig (land-based) is used to bore a large hole down into the rock. This drilling process creates a pile of ‘overburden’, material generated by drilling the hole. This material will be used to backfill the hole after the necessary amount of explosives are placed, to

Biological Assessment of the Cook Inlet Beluga Whale (Delphinapterus leucas) for the Seward Highway MP 105-107 Windy Corner Project
Page 12
ensure that the hole is capped off. This also ensures that as much of the blast energy as possible is directed into the rock around it, rather than just up out of the hole.
Prior to each blast, there will be 5-minute and 1-minute warning signals. The warning signal is typically a commercially available air horn (klaxon), with a sound level ranging from 110 to 125 dB at ‘point blank’ range (approximately 3 ft [1 m]). After each blast, the Contractor’s blaster shall observe the area of the blast for five minutes to guard against injury or damage due to rockfall. The blaster shall then inspect the blast area to determine that all explosive charges were detonated. After this inspection, the blaster will sound an audible horn as an all-clear signal to alert all personnel that the area is safe for entry. Blasting must occur during daylight hours to permit the blast site to be inspected after the blast to verify that the area is safe. No blasting will occur at or below the intertidal zone. Because the rock generated from the blasts can only be placed in fill sites when the mudflats are free of ice, and due to the lack of material staging space in the project area, blasting can only occur during the ice-free season. Work in the intertidal will occur when the tide is low and the area is de-watered.
Site-specific blasting plans
Blasting plan for Gorilla Rock (Figure 10)
The portion of Gorilla Rock above approximately +30 ft (9 m) mean sea level (MSL) will be blasted to accommodate the roadway realignment. The elevation of the top of Gorilla Rock is approximately +70 to +80 ft (21–24 m; MSL). The elevation of the mudflats south of Gorilla Rock is approximately +2 ft (0.6 m; MSL). The elevation of high tide is approximately +17.5 ft (5 m; MSL). At low tide the mud flats at elevation +2 ft (0.6 m; MSL) are exposed. Total rock excavation at Gorilla Rock is approximately 4,000 cu yd (3,058 cu m). It will take approximately 5 to 10 blasts to remove the portion of Gorilla Rock that will be needed to accommodate the new road. This assumes that the rock cannot be removed mechanically; any potential for mechanical removal will reduce the amount of blasting used and required.
Figure 10: Gorilla Rock blasing extent. Blasting and subsequent rock ‘ripping’ will remove approximately 33 feet of height from Gorilla Rock.
The following steps will be taken to blast and excavate Gorilla Rock:

Biological Assessment of the Cook Inlet Beluga Whale (Delphinapterus leucas) for the Seward Highway MP 105-107 Windy Corner Project
Page 13
a) Material (i.e., rock fill, varying grain size) will be hauled from MS 1 or the excavation at Windy Corner to construct access to Gorilla Rock. Rock embankment will be placed above the water line during low tide when the mudflats are exposed.
b) Once access to Gorilla Rock has been established, dozers will rip away as much rock as possible. This reduces blast activities, and also allows for continuing work (blasting operations require work stoppages during blasting). However, a majority of the rock appears to be too hard to rip and will require blasting.
c) A track-mounted drill rig will be used to drill 3-inch (in) to 6-in diameter holes in the rock. Due to the rugged terrain and difficult access, the hole spacing will vary between 8 and 12 ft. Drilling will occur during low tide.
d) After the blaster has inspected the blast area and deemed it safe, the Contractor will then use dozers and large backhoes to remove and place the blasted rock into the roadway template.
e) Steps B and D are repeated, as necessary.
Blasting plan for sliver cut on Windy Corner (Figure 11)
The elevation of the top of the existing 110 to 120 ft (34–37 m) high cut at Windy Corner is approximately +150 to +160 ft (46–49 m; MSL). The elevation of the top of the proposed cut is +170 to +180 ft (52–55 m; MSL). Total rock excavation at Windy Corner Rock is approximately 141,000 c.y (110,860 cu m). Due to the nature of the cut, each blast is likely to remove less material than the overall average for the project. It will take approximately 20 to 35 blasts to remove the portion of Windy Corner that will be needed to accommodate the new road.

Biological Assessment of the Cook Inlet Beluga Whale (Delphinapterus leucas) for the Seward Highway MP 105-107 Windy Corner Project
Page 14
Figure 11: Windy Corner and Gorilla Rock, typical cross-sections indicating excavation extent.

Biological Assessment of the Cook Inlet Beluga Whale (Delphinapterus leucas) for the Seward Highway MP 105-107 Windy Corner Project
Page 15
The following steps will be taken to blast and excavate the rock at Windy Corner:
a) Construct Pioneer Road – A pioneer road will be constructed to allow small track mounted equipment (drills, dozers, etc.) access the top of the excavation. This may require small blasts in some areas to remove rock to construct the pioneer road.
b) Remove Vegetation and Overburden – Due to the rugged terrain, a majority of the trees will be cut by hand. The overburden that is not suitable for the embankment will be removed by small track mounted equipment and hauled to the approved waste disposal sites.
c) The following controlled blasting techniques will be used to create a stable cut face sheared along the excavation backslope.
i. Preshear holes, 2.5 to 3 in (6.4–7.6 centimeter, cm) diameter, will be drilled on approximately 24 to 30 in (61–76.2 cm) spacing along the plane of the excavation backslope. The maximum length of the preshear holes is 40 to 45 ft (12.2–13.7 m). The preshear holes will be lightly loaded with special preshear explosives.
ii. The next row of drill holes are buffer holes which are also 2.5 to 3 in (6.4–7.6 cm) in diameter and are drilled at least 6 ft (1.8 m) from the preshear holes. The buffer holes are drilled parallel to the excavation backslope. The buffer holes are loaded with only 50% of the explosives of the adjacent production holes. The explosives used in the buffer holes are the same as the production holes.
iii. The remaining rows of drill holes are production holes which are vertical holes drilled to a maximum depth of 40 to 45 ft (12.2–13.7 m). These holes are not greater than 6 in (15.2 cm) in diameter and are drilled on 8 to 12 ft (2.4–3.7 m) spacing. The spacing of the production holes is dependent on the rock type and size of rock that will be needed. For example, if large rock is needed for armor stone (i.e., large rock that will be later used to armor the shoreline against erosion), the hole spacing will be increased to produce the larger rock.
Blasting plan for Material Site 1 (MS1), Figure 12
The elevation of the top of the existing 110’ to 160’ high cut at MS 1 is approximately 200’ (MSL). The elevation of the top of the proposed cut is +200’ to +230’ (MSL). Total rock excavation needed from MS1 is approximately 1,880,000 c.y. (1,437,363 cu m). It is expected to take approximately 188 blasts to produce enough rock, including armor stone, for the project. The steps described above in the general blasting plan will be taken to blast and excavate the rock at Material Site 1.

Biological Assessment of the Cook Inlet Beluga Whale (Delphinapterus leucas) for the Seward Highway MP 105-107 Windy Corner Project
Page 16
Figure 12: Material Site 1 blasting and excavation extent.

Biological Assessment of the Cook Inlet Beluga Whale (Delphinapterus leucas) for the Seward Highway MP 105-107 Windy Corner Project
Page 17
Blasting plan for Material Site 6 (MS 6), Figure 13
The elevation of the top of the proposed cut is +170’ (MSL). Total rock excavation needed from MS 6 varies, as it would be supplemental to rock excavation from MS 1. It may be that no rock is required and MS6 may ultimately not be developed. However for purposes of estimating conservatively on potential effects, assume that 400,000 c.y. of fill are required from MS6. It will take approximately 35 to 55 blasts to produce enough rock, including armor stone, for the project. The steps described above in the general blasting plan will be taken to blast and excavate the rock at Material Site 6.

Biological Assessment of the Cook Inlet Beluga Whale (Delphinapterus leucas) for the Seward Highway MP 105-107 Windy Corner Project
Page 18
Figure 13: Material Site 6 blasting and excavation extent.
Biological Assessment of the Cook Inlet Beluga Whale (Delphinapterus leucas) for the Seward Highway MP 105-107 Windy Corner Project
Page 19
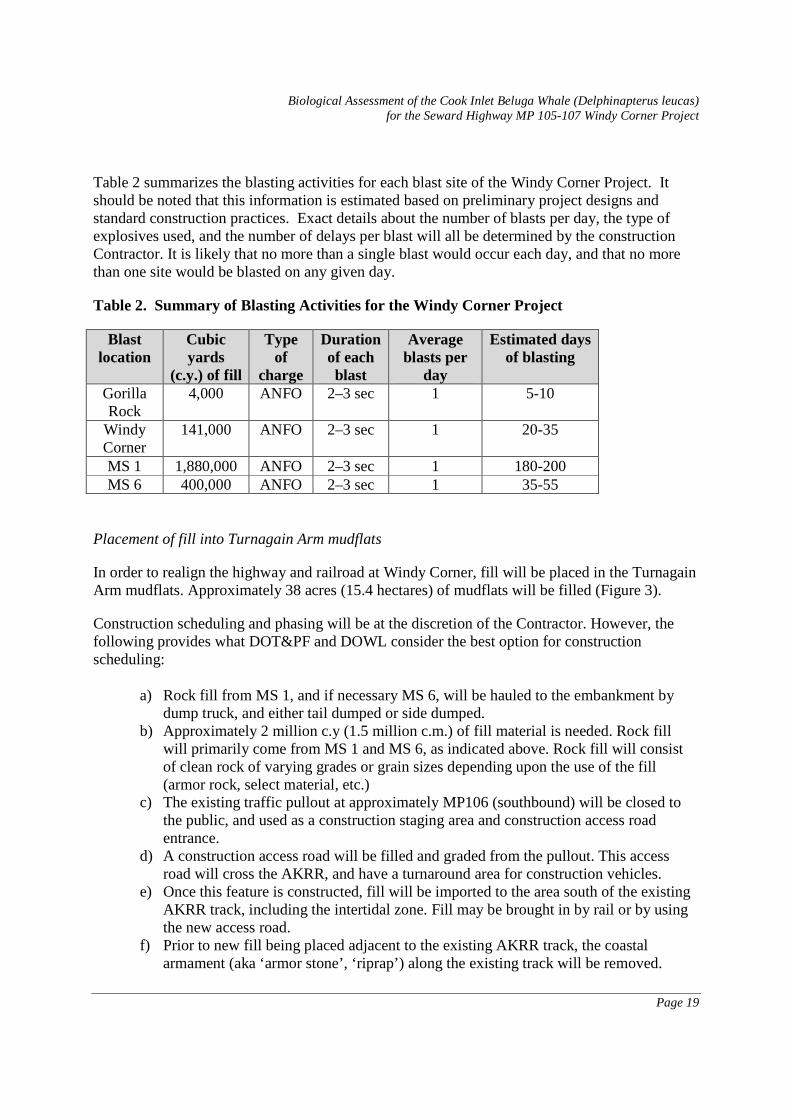
Table 2 summarizes the blasting activities for each blast site of the Windy Corner Project. It should be noted that this information is estimated based on preliminary project designs and standard construction practices. Exact details about the number of blasts per day, the type of explosives used, and the number of delays per blast will all be determined by the construction Contractor. It is likely that no more than a single blast would occur each day, and that no more than one site would be blasted on any given day.
Table 2. Summary of Blasting Activities for the Windy Corner Project
Blast location
Cubic yards
(c.y.) of fill
Type of
charge
Duration of each blast
Average blasts per
day
Estimated days of blasting
Gorilla Rock
4,000 ANFO 2–3 sec 1 5-10
Windy Corner
141,000 ANFO 2–3 sec 1 20-35
MS 1 1,880,000 ANFO 2–3 sec 1 180-200 MS 6 400,000 ANFO 2–3 sec 1 35-55
Placement of fill into Turnagain Arm mudflats
In order to realign the highway and railroad at Windy Corner, fill will be placed in the Turnagain Arm mudflats. Approximately 38 acres (15.4 hectares) of mudflats will be filled (Figure 3).
Construction scheduling and phasing will be at the discretion of the Contractor. However, the following provides what DOT&PF and DOWL consider the best option for construction scheduling:
a) Rock fill from MS 1, and if necessary MS 6, will be hauled to the embankment by dump truck, and either tail dumped or side dumped.
b) Approximately 2 million c.y (1.5 million c.m.) of fill material is needed. Rock fill will primarily come from MS 1 and MS 6, as indicated above. Rock fill will consist of clean rock of varying grades or grain sizes depending upon the use of the fill (armor rock, select material, etc.)
c) The existing traffic pullout at approximately MP106 (southbound) will be closed to the public, and used as a construction staging area and construction access road entrance.
d) A construction access road will be filled and graded from the pullout. This access road will cross the AKRR, and have a turnaround area for construction vehicles.
e) Once this feature is constructed, fill will be imported to the area south of the existing AKRR track, including the intertidal zone. Fill may be brought in by rail or by using the new access road.
f) Prior to new fill being placed adjacent to the existing AKRR track, the coastal armament (aka ‘armor stone’, ‘riprap’) along the existing track will be removed.

Biological Assessment of the Cook Inlet Beluga Whale (Delphinapterus leucas) for the Seward Highway MP 105-107 Windy Corner Project
Page 20
g) Once fill in this area is has achieved the appropriate elevation, construction efforts will shift to placing armor stone along the south side (Turnagain Arm) of the proposed future location of the AKRR tracks. This embankment will be placed for the length of the project, and given time to consolidate/settle.
h) Rock fill will be placed onto mudflats at low tide when the mudflats are exposed. In some cases, rock fill will be placed in or near a low-tide channel, in which case rock must be placed below water.
All fill activities will be terrestrially based, in the sense that all fill activities will be initiated on land and will move out towards the water. Barges or other vessels will not be used for filling activities, and dredging will not be involved. Fill activities will occur during the ice-free season of 2016, and will be restricted to daylight hours and low tide periods when the area is de-watered. Limiting intertidal fill work to low tide will ensure proper placement of rock and safe working conditions.
Railroad realignment a) Following the placement of fill along the future location of the AKRR track, and once
sufficient time has passed and settlement has stopped or levelled out, fill material will be rough-graded along the new AKRR embankment, and a temporary construction access road will be laid for building the new track.
b) The new AKRR track will be built, including placement of drainage crossing and the pedestrian/emergency access tunnel.
c) All embankment and armor stone will be placed up to above the high tide line for the length of the alignment. The remainder of the embankment, armor and sub ballast will then be set.
d) A temporary switch will be installed to allow track-mounted equipment access to the new track.
e) Track-mounted equipment will place ballast. f) The track will be de-stressed, welded, and anchored. g) The new AKRR track will be opened, and the old track closed. h) The existing Seward Highway alignment will remain open for as long as possible. Once
the AKRR is on its new alignment, construction of the new highway alignment will commence. By this time, the ‘fill footprint’ will have been completed, and blasting at Windy Corner and Gorilla Rock will continue. Gorilla Rock will probably be blasted at this point (safety closures will remain in place during all blast activities), followed by the cut at Windy Corner. Safety closures will be in effect for both of these locations.
Rescue-craft ramp construction
Pre-fabricated concrete slabs will be brought in and placed on graded rock on the silt. This will take place during low tide.

Biological Assessment of the Cook Inlet Beluga Whale (Delphinapterus leucas) for the Seward Highway MP 105-107 Windy Corner Project
Page 21
Staging area for construction
Staging areas will be located in upland areas adjacent to the proposed project area. Fuel and other petroleum products for construction equipment would be stored in the upland staging area located at least 100 ft (30.5 m) from any water body. Any fuel stored on site would be within secondary containment units. Best management practices (BMP) and compliance with applicable Alaska Department of Environmental Conservation (ADEC), Environmental Protection Agency (EPA) and U.S. Coast Guard (USCG) requirements on contaminants and spill response will minimize the potential for fuel spills and contamination.
4. Best management practices and other conservation measures
BMPs and other conservation measures (e.g., specific seasonal and tidal-stage work windows, techniques to reduce marine noise, marine mammal avoidance practices) designed to minimize effects of the Windy Corner Project are described in Section V of this document. A detailed monitoring and mitigation plan can be found in Appendix 3.

Biological Assessment of the Cook Inlet Beluga Whale (Delphinapterus leucas) for the Seward Highway MP 105-107 Windy Corner Project
Page 22
III. DESCRIPTION OF THE SPECIES AND THEIR HABITAT
The following description of CIBW focuses on those attributes that are relevant to the proposed actions and anticipated effects of the Windy Corner Project. Most of this information has been derived from the Conservation Plan for CIBW (NMFS 2008a), and from an update to it created by the Science Panel of the Cook Inlet Beluga Recovery Team for the draft Recovery Plan (https://alaskafisheries.noaa.gov/protectedresources/whales/beluga/recovery/ci.htm).
Distribution and Stock Structure: The beluga is a northern hemisphere species of small odontocete (toothed whale), and is found in shallow coastal waters of the Arctic and sub-Arctic oceans, except for a small population in the Saint Lawrence Estuary of eastern Canada. Alaska has five recognized beluga stocks, distinguished primarily by summer range: the Beaufort Sea, the eastern Chukchi Sea, the eastern Bering Sea, Bristol Bay, and Cook Inlet (Allen and Angliss 2013).
The degree of genetic differentiation between the Cook Inlet stock (or population) and the other four Alaska beluga stocks (O’Corry-Crowe et al. 1997, 2002, 2010) has led NMFS to designate it as a distinct population segment (DPS; 73 FR 62919, Oct 2008; 65 FR 38778, June 2000). Genetic analyses used to assess patterns of male and female dispersal over time revealed that the CIBW population is effectively reproductively and demographically isolated from all other beluga populations (O’Corry-Crowe et al. 2010). All available evidence indicates that CIBW reside in Cook Inlet year round and do not migrate seasonally out of the Inlet, and other beluga stocks do not foray into Cook Inlet. Only the Cook Inlet DPS of belugas occurs in the Windy Corner Project Area.
Life History: Belugas are sexually dimorphic, with length averaging 11.6 ft (355 cm) in adult females and 13.6 ft (415 cm) in adult males (Burns and Seaman 1986). Males weigh up to 3,307 pounds (lb) (1,500 kilograms (kg)) and females 2,998 lb (1,360 kg; Nowak 2003, 1991). Beluga calves in Alaska have been reported to average 4.9 ft (150 cm) in length and 159 lb (72 kg) at birth (Burns and Seaman 1986). Calves are born dark gray to brownish gray and become lighter with age. Adults become white to yellow-white, although Burns and Seaman (1986) report females may retain some gray coloration for as long as 42 years. Further evidence that color is not a definitive indicator of maturity comes from a study of over 200 harvested belugas in northwest Alaska that found that 90% of light-gray females were sexually mature (Burns and Seaman 1986). Beluga whales have low reproductive potential, giving birth to a single calf only every two, three, or more years (Sergeant 1973; Burns and Seaman 1986, Suydam 2009). Estimates of gestation period for belugas have varied from 11 to 16 months, although data from captive belugas, where conception and birth are known, indicate a gestation of 15.6 months (Robeck et al. 2005). Estimated age of sexual maturity ranges from 4 to 14 years for females and 8 to 15 years for males (Braham 1984; Nowak 1991; Heide-Jørgensen and Teilmann 1994, Suydam 2009). Calving usually occurs in late spring or early summer. The lactation period is known to last at least one year and likely longer in some cases, and the entire reproductive process on average takes three years (Sergeant 1973; Burns and Seaman 1986). Beluga whales may live 60 to 70 years or more (Suydam 2009). Belugas in Alaska are the prey of killer whales (King 1989; Shelden et al. 2003), polar bears (Lowry et al. 1987; Frost et al. 1992), and Alaska Native subsistence hunters (Mahoney and Shelden 2000).

Biological Assessment of the Cook Inlet Beluga Whale (Delphinapterus leucas) for the Seward Highway MP 105-107 Windy Corner Project
Page 23
Life history data are sparse for CIBW. Most life history data have been obtained from animals taken in subsistence harvests, although some information has come from stranded or beach-cast whales and some from captive belugas. The only known current predator of CIBW is the killer whale. Mass strandings associated with evasion of killer whales have been observed in Turnagain Arm (Hobbs et al. 2006). There has not been a subsistence hunt by Alaska Natives in Cook Inlet since 2005. Causes of death of CIBW remain largely unidentified due to difficulties in accessing carcasses to conduct post-mortem exams. Identified causes of death in CIBW included trauma, disease, malnutrition, complications during birth, and complications from previous live strandings (Burek et al. in review). The term “stranded” includes carcasses found dead and live animals on the beach. Strandings occur for a variety of reasons; beluga may intentionally ground themselves in shallow waters to more easily rub off old skin, to avoid predation or other perceived threats (e.g., acoustic disturbances, vessel traffic, or other anthropogenic activity), when chasing prey, or as a result of an inability to properly navigate or maneuver when debilitated by injury or disease (Smith et al. 1992; Moore et al. 2000; Shelden et al. 2003; Burek and Goertz 2010; Vos and Shelden 2005).
Survival data derive from CIBW carcasses reported to the NMFS Alaska Region Office, and consequently represent a minimum estimate of mortality for the CIBW population. From 1999 to 2005, years in which a limited subsistence harvest of CIBW occurred, an average of 12 mortalities were reported each year (Vos and Shelden 2005) during a time when the population size averaged around 350 animals. This provided an estimated annual survival probability for CIBW of 0.97/year. Calf survival closely relates to survival of the mother during the first year following birth. Based on gestation and timing of birthing, mating is believed to occur sometime between late winter and early spring; however, there is little documentation on the mating behavior of CIBW. Calkins (1983) suggested that most calving in Cook Inlet occurs from mid-May to mid-July, although Native hunters have reported calving from April through August (Huntington 2000). Neonates (newborn calves) were observed between mid-July and early October during over 250 photo-id surveys of Upper Cook Inlet conducted from April through November between 2005 and 2014 (McGuire and Bourdon 2012; McGuire et al. 2014, McGuire unpublished data).
Social Structure: Beluga whales are extremely social animals that typically migrate, hunt, and interact with one another, often forming dense groups. In areas of the Arctic, belugas aggregate in groups of hundreds and sometimes thousands (O’Corry-Crowe 2002). It is thought that the basic social units of these groups are maternal lineages of adult females and their offspring, and that males migrate separately (Smith et al. 1994).
CIBW generally travel in groups that range in size from several whales to 200 or more, although single whales are occasionally seen (McGuire and Bourdon 2012, McGuire et al. 2014). It is not known if groups represent distinct social divisions. Preliminary results from photo-identification research indicate beluga groups in Upper Cook Inlet during the ice-free months of the field season (i.e., April through October) are mixed (contain large white animals, medium-sized gray animals, and dark calves) and homogenous with respect to individual associations, without evidence of long-term sub groupings (McGuire et al. 2014). There is no evidence of sexual segregation. Changes in seasonal distribution of prey species may account for seasonal changes in beluga group size (Moore et al. 2000).

Biological Assessment of the Cook Inlet Beluga Whale (Delphinapterus leucas) for the Seward Highway MP 105-107 Windy Corner Project
Page 24
Ability to see, smell, and taste: Belugas have the capacity for acute vision both in and out of the water, and they appear to have the ability to see in both dim and bright light. As with other whales, belugas have a more limited capacity for color vision compared to most land mammals (Peichl et al. 2001; Levenson and Dizon 2003). It is likely that belugas, like other odontocetes, do not have a sense of smell because they lack olfactory lobes (Kellogg 1958). Belugas may have areas in their mouths that allow them to taste (Haley 1986). Research on the abilities of CIBW to see, smell, and taste has not been conducted.
Hearing: The adaptation of marine mammals to the aquatic environment, where vision, taste and smell would have limited utility, has favored sound as their primary sense (Wood 1973, Ketten 2012). Cetaceans (i.e., whales, dolphins, and porpoises) use sound to navigate, communicate, locate prey and mates, and avoid predators. Beluga whales are one of the most-studied of all odontocetes in terms of hearing abilities (Richardson et al. 1995). Hearing in many toothed whale species (including beluga whales) is most sensitive in the mid-frequency range. Beluga hearing has been reported to range from ~40 Hz to 150 kHz (Johnson 1967; White et al. 1978; Johnson et al. 1989; Au 1993), with the greatest sensitivity at ~10-100 kHz (Richardson et al. 1995), although recent work by Castellote et al. (2014) suggests belugas are most sensitive between 45 and 80 kHz and have a hearing range of 4–150 kHz. All audiograms suggest beluga whales have an overall auditory bandwidth of roughly eight times that of humans (Au 1993). Awbrey et al. (1988) reported average hearing thresholds for captive beluga whales of 65 and 120.6 dB re 1 µPa at frequencies of 8 kHz and 125 Hz, respectively. Finneran et al. (2000) measured masked hearing thresholds of ~120 dB re 1 µPa for a captive beluga whale at three frequencies between 1.2 and 2.4 kHz. Beluga whales have some limited hearing ability down to ~35 Hz, where their hearing threshold is about 140 dB re 1 µPa (Richardson et al. 1995 and references therein). Lowest auditory thresholds of wild belugas in Bristol Bay, Alaska were identified in the range 45–80 kHz (Castellote et al. 2014). Both Klishin et al. (2000) and Mooney et al. (2008) found overall low thresholds, near 45 dB, for some frequencies and a steep high-frequency cutoff near 100–128 kHz. The two studies also revealed two highly sensitive regions (<60 dB), a lower frequency region centering near 32 kHz and a higher frequency region from 70–80 kHz. Between these frequency bands, both studies found a clear dip at approximately 50 kHz. As is typical for all odontocetes, beluga hearing thresholds increase gradually at lower frequencies (<32 kHz) and more steeply for higher frequencies starting at 90–100 kHz. Beluga hearing has been determined to be as good at 984 ft (300 m) depth as at the surface (Ridgway et al. 2001). A study conducted with a captive beluga showed that the most efficient hearing pathway is from the tip of the lower jaw through fat channels that guide sound to the inner ear (Mooney et al. 2008). This feature may allow belugas greater directional hearing than other odontocetes.
Sound Production: Belugas are among the noisiest of cetaceans, making a wide variety of sounds that fall into two acoustic categories: whistles or narrow band frequency modulated vocalizations, and pulsed sounds or trains of broad band pulses. The latter can be divided into two functional categories: click trains, used largely for echolocation, and burst pulse sounds (bursts of pulses with rapid pulse repetition rates), believed to be social signals, which may sound to the human ear like grunts, squawks, screams, whines, and whistles (Schevill and Lawrence 1949; Ouellet 1979; Sjare and Smith 1986a). Beluga whistles have dominant frequencies in the 2-6 kHz range (Sjare and Smith 1986a). Other beluga call types reported by Sjare and Smith (1986a, b) included sounds at mean frequencies ranging upward from 1 kHz.

Biological Assessment of the Cook Inlet Beluga Whale (Delphinapterus leucas) for the Seward Highway MP 105-107 Windy Corner Project
Page 25
The vocalization frequencies and hearing ranges of beluga whales are much higher than those of the baleen whales. Studies show that belugas have highly developed and sophisticated echolocation capabilities, with echolocation peak frequencies from 40–120 kHz (Au et al. 1985, 1987; Au 1993).
Little work has been done on CIBW hearing and sound production. CIBW live in an extremely turbid aquatic environment with limited daylight hours during the winter months, which suggests that hearing and sound production (including echolocation) is especially important and that vision, while good, is of limited use. An array of sonobuoys was used in 2009 to detect beluga vocalizations in Knik Arm; all detections consisted of echolocation clicks and no whistles or other vocalizations were detected (Širović and Kendall 2010; Kendall 2010). Castellote et al. (2011) compared acoustic behavior with surface behavior of CIBW detected visually and found that acoustic behavior was modified during feeding or prey search.
Swimming and Diving: Beluga whales typically swim at speeds between 0.6 mi/hr (1 km/hr) and 6.2 mi/hr (10 km/hr), but have been estimated to sustain speeds over 12.4 mi/hr (20 km/hr) for periods of a half hour (Richard et al. 1998). Suydam (2009) estimated typical speeds at 1.5–2.0 mi/hr (2.5–3.3 km/hr), and Smith and Martin (1994) estimated swimming speeds of 1.0–3.7 mi/hr (1.6–6.0 km/hr) during the fall migration. Belugas from stocks found in those regions with access to deep water are capable of dives as deep as 2,624.7 ft (800 m) at vertical speeds of 1.2–4.3 mi/hr (2–7 km/hr; Heide-Jørgensen et al. 1998).
Satellite-tagged belugas in Cook Inlet showed mean dive depths of 5.2 to 22 ft (1.6 to 6.7 m) and mean dive durations of 1.1 to 6.9 minutes (Goetz et al. 2012b). In Cook Inlet, daily net travel distances have been shown to vary from 1.0 (SD ± 20) mi/hr (1.6 km/hr) to 2.7 (SD± 3.1) mi/hr (4.3 km/hr), with a mean transit rate of 1.7 (SD ±2.4) mi/hr (2.8 km/hr;Goetz et al. 2012b). Tagged CIBW travelled faster December–May than June–November, and travelled slower in coastal areas than they did in offshore waters of the Inlet (Goetz et al 2012b). In the areas of Cook Inlet occupied by belugas, the depth does not exceed 328.1 ft (100 m), and much of the time the belugas are in waters less than 65.6 ft (20 m) in depth. Consequently, CIBW are able to access the entire water column. Typical dive sequences consist of three to five short intervals of 7–10 seconds followed by a longer dive of a minute or more. Mean dive depth ranged from 5.2 (SD ± 2.1) to 22.0 (SD ±10.4) ft (1.6 to 6.7 m) and mean dive duration ranged from 1.1 (SD ±1.3) to 6.9 (SD ±-9.5) minutes (Goetz et al. 2012b), with shorter dives occurring in near-shore areas. The average dive interval (the time from the beginning of one surfacing to the beginning of the next) is 24.1 seconds for CIBW (Lerczak et al. 2000).
General Diet and Foraging: The diet of beluga whales throughout their circumpolar range is dominated by fish and invertebrates. Belugas are toothed whales that pursue their prey and swallow it whole, and are known to feed on prey that concentrate, including shrimp and schooling or spawning fish (Seaman et al. 1982). Diet data for CIBW are limited to a relatively small sample of stomach contents and stable isotope analyses (Quakenbush and Bryan 2014) as well as observations from Alaska Native subsistence harvests (Fall et al. 1984; Huntington 2000). Stomach content analysis indicated that belugas fed on: salmon, gadids, eulachon, and flounders; salmon frequencies included coho, Chinook, and chum. Gadids included saffron cod, walleye pollock, and Pacific cod. The two flounder species identified were yellowfin sole and starry flounder. A longnose sucker was the only freshwater fish found. Seven types of

Biological Assessment of the Cook Inlet Beluga Whale (Delphinapterus leucas) for the Seward Highway MP 105-107 Windy Corner Project
Page 26
invertebrates were found in the beluga stomachs, with the frequency of occurrence highest for shrimp, followed by polychaetes and amphipods. Other invertebrates included Tanner crab and sponges. Because fish found in beluga stomachs may have also consumed a variety of prey, including polychaetes, shrimps, amphipods, and other fishes (Clausen 1981, 1983; Seaman et al. 1982), some prey items in the beluga stomachs could have resulted from secondary ingestion. Natives have reported that, in addition to feeding on salmon and eulachon, CIBW feed on freshwater/brackish fish, including Pacific tomcod, burbot, steelhead trout, northern pike, whitefish, and Arctic grayling (Fall et al. 1984; Huntington 2000).
Beluga whales in Cook Inlet feed most conspicuously during the spring, summer, and fall months near the mouths of rivers during anadromous fish runs. Traditional ecological knowledge (TEK; Huntington 2000) reports that summer feeding is very important for CIBW and that spring belugas are much thinner than belugas observed in the fall after a summer of feeding. Dive behavior data from satellite tags deployed on 11 CIBW (Goetz et al. 2012b) indicted that dives were significantly shorter and shallower from June to November versus December to May. Over 50% of the dive effort occurred in shallow, near-shore areas of Chickaloon Bay, Susitna Delta, Knik Arm, Turnagain Arm, and Trading Bay suggesting feeding in these areas. These locations are also recognized as areas where anadromous prey concentrate when entering river mouths. CIBW appear to feed extensively on concentrations of spawning Pacific eulachon in the spring. (NMFS 2008a). Belugas shift to foraging on salmon species when eulachon runs diminish and salmon return to spawning streams. While winter foraging is not well known, it is presumed that CIBW forage more on benthic species or opportunistically on infrequently encountered pelagic species (NMFS 2008a).
A. Occurrence of Other Marine Mammals in the Project Action Area
In addition to the endangered CIBW, six other marine mammal species could occur in the Windy Corner Project Action Area (Table 3). Three of these species, the gray whale, the humpback whale, and the Steller sea lion (Western stock) are listed as endangered under the ESA. Sightings of these three species in Turnagain Arm are extremely rare. In nine years (2006–2014) of studying CIBWs along Turnagain Arm during the ice-free season, LGL Alaska Research Associates, Inc. (LGL) has recorded a lone gray whale in May 2006 (Markowitz et al. 2007), a lone Steller sea lion in the fall of 2006, and a lone humpback whale in April 2014 (McGuire, unpublished data). Given the rarity of sightings of other endangered marine mammals in Turnagain Arm, DOT&PF considers the likelihood of their presence in the action area to be negligible, and only considers the potential impacts to CIBW (and its critical habitat) in this BA.

Biological Assessment of the Cook Inlet Beluga Whale (Delphinapterus leucas) for the Seward Highway MP 105-107 Windy Corner Project
Page 27
Table 3. Marine mammals that could occur in the Windy Corner Project Action Area.
Common name
Listed as ESA endangered or threatened?
Critical habitat designated in
Upper Cook Inlet?
Likelihood of occurrence in project area
Gray whale endangered no low
Steller sea lion
endangered (western distinct population
segment)
no low
Humpback whale
endangered no low
Harbor seal no n/a high
Harbor porpoise
no n/a medium
Killer whale no n/a medium
Table information compiled from http://alaskafisheries.noaa.gov/protectedresources/ and http://ecos.fws.gov/speciesProfile/.
B. Occurrence of Other Protected Species in the Waters of the Windy Corner Project Action Area.
All West Coast salmon species (and associated Evolutionary Significant Units [ESUs]) currently listed as threatened or endangered under the ESA originate in freshwater habitat in Washington, Idaho, Oregon, and California. In Alaska, no stocks of Pacific salmon or steelhead from freshwater habitat are endangered species. Some listed species migrate as adults into marine waters off Alaska, but none are likely to occur in Upper Cook Inlet.
DOT&PF sent a letter to NMFS on March 19, 2013 requesting concurrence that the CIBW is the only species present in Turnagain Arm under NMFS jurisdiction. Concurrence was received from NMFS in a letter dated April 9, 2013 that the CIBW is the only species listed under the ESA under NMFS jurisdiction that is commonly observed in the waters of Turnagain Arm. DOT&PF sent a letter to USFWS on March 29, 2013, asking for concurrence that no threatened or endangered species under USFWS jurisdiction were present, and concurrence was received from USFWS in a letter dated April 1, 2013 that no threatened, endangered or candidate species occur regularly in Upper Cook Inlet.
C. General Description of Cook Inlet Habitat
Cook Inlet is a tidal estuary approximately 220 mi (350 km) in length and is located in south central Alaska (Figure 14), covering an area of ~7722 mi2 (20,000 km2). It is roughly divided into the Upper and Lower Inlet by the East and West Forelands. The tidal fluctuation in Cook
Biological Assessment of the Cook Inlet Beluga Whale (Delphinapterus leucas) for the Seward Highway MP 105-107 Windy Corner Project
Page 28
Inlet is relatively large, with a differential as great as 39.4 ft (12 m). Large areas of mud flats are exposed at low tide. Tidally driven turbulence suspends large volumes of sediment in the water from glacial outflow and coastal erosion, and is greatest near the mouth of large rivers. The peak ice presence in Cook Inlet is typically from January to March, but ice may be present from October through early June (Mulherin et al. 2001). Maximum summer air temperatures in Cook Inlet rarely exceed 70°F (21.1°C) and usually occur in August, with average summer temperatures (June through August) of 44°F to 67°F (6.7°C to 19.4°C). Average winter temperatures (November through March) typically range from 4° F to 34°F (-15.5°C to 1.1°C) although periods with colder temperatures are not uncommon and the coldest temperatures occur in January (Western Regional Climate Center 2005). Wind, rain, and heavy snowfall are common in Cook Inlet during winter. Average annual snowfall in Anchorage is approximately 70 in (178 cm). Average annual precipitation is 15 in (38 cm) in Anchorage with the greatest amounts of precipitation occurring in August and September (Western Regional Climate Center 2005). Prevailing winds in Cook Inlet are south/southwest in summer and north/northeast in winter. Daylight varies in the Cook Inlet area from approximately 5.5 hours at the winter solstice to about 19.5 hours at the summer solstice.

Biological Assessment of the Cook Inlet Beluga Whale (Delphinapterus leucas) for the Seward Highway MP 105-107 Windy Corner Project
Page 29
Figure 14: Map of Cook Inlet, Alaska.
Ice forms in Cook Inlet during winter months and can be particularly concentrated in areas such as Knik and Turnagain arms due to the freshwater input from the numerous rivers in the area. Rivers freeze in October and November and ice forms in the upper inlet by early to mid-December. Ice cover is variable, however, and break-up may occur as early as mid-March or as late as mid-May.
Cook Inlet bathymetry is varied with numerous shoals and adjacent canyons. Depth is generally less than 240 ft (73 m), although deeper water exists in channels and at the mouth of the inlet, where depths range from 600–1,200 ft (183 m to 366 m; Mulherin et al. 2001). In the northern part of Upper Cook Inlet, including Knik and Turnagain arms, vast areas of mudflat are exposed at low tide.
Surface water circulation within Cook Inlet generally follows a counterclockwise motion (Mulherin et al. 2001), though surface water movement in the offshore waters of the study area is

Biological Assessment of the Cook Inlet Beluga Whale (Delphinapterus leucas) for the Seward Highway MP 105-107 Windy Corner Project
Page 30
generally to the southwest. While circulation currents are driven by the exchange of water with the Gulf of Alaska and freshwater systems of the inlet (Mulherin et al. 2001) they exert less influence on flow in the inlet than the extreme tidal currents. Tidal currents are strongest in Upper Cook Inlet. Current velocity in Lower Cook Inlet ranges from 3.3 to 4.9 ft/sec (1.0 to 1.5 m/sec), while average values in Upper Cook Inlet reach more than 6.6 ft/sec (2 m/sec; Mulherin et al. 2001) and can reach 13.5 ft/sec (4.1 m/sec) in constricted areas such as between the forelands and at the mouths of Knik and Turnagain arms. Two unequal high and low tides occur each day, approximately six hours apart. Brief periods of slack tide occur while the tide changes direction in Upper Cook Inlet, but not in Lower Cook Inlet. Mean tidal fluctuations vary considerably within the inlet. Near Anchorage, the mean tidal differential is 25.9 ft (7.9 m) compared to 11.5 ft (3.5 m) in the southern part of the inlet, near Kennedy Entrance.
D. General Description of Turnagain Arm Habitat
Cook Inlet’s Turnagain Arm is about thirty miles long and approximately four miles in width. It is quite shallow (max depth of 65.6 ft (20 m), 6.56 ft (2 m) in some areas; NOAA bathymetric database), and parts of it become dry during low tide. The USFWS National Wetlands Inventory classifies Turnagain Arm marine waters as intertidal estuarine wetlands. Two main, deep-water channels are located along the north and south shores of the arm. Turnagain Arm sees the largest tidal range in United States, with a 30 ft (9.2 m) mean, the fourth highest in the world. Turnagain Arm exhibits a tidal bore, which may be more than 6.0 ft (1.8 m) high and travel at 15 mi/hr (24.1 km/hr) on high spring tides.
Geologically, much of the north shore of Turnagain Arm is exposed McHugh Complex outcropping, a mass of metamorphic rock. The entire length of the proposed Windy Corner project constitutes the type-site for the McHugh Complex (Clark 1973). The predominant landform from milepost 104 to milepost 109 is steep to vertical mountainside with abundant loose rock. Creeks and small seasonal streams drain the mountainsides. The predominant soil type is a variable depth organic horizon with subsoil and bedrock. Depths for each of these soil horizons are unknown presently. Glacial silt and sand compose the Turnagain Arm seafloor.
E. Beluga Distribution and Habitat Use in Cook Inlet
Data on CIBW distribution and habitat use comes primarily from two sources: aerial surveys (Hansen and Hubbard 1999; Rugh et al. 2010), and satellite transmitter tagging studies during August through March (Hobbs et al. 2005). Additional information is provided by traditional ecological knowledge of Alaskan Natives (TEK; Huntington 2000; Carter and Neilsen 2011), boat- and land-based observations (Speckman and Piatt 2000; McGuire and Bourdon 2012; McGuire et al. 2014), passive acoustic monitoring studies (Lammers et al. 2013), opportunistic reports (Rugh et al. 2000; Vate-Brattstrom et al. 2010; NMFS unpubl. data), NMFS stranding records (Vos and Shelden 2005; NMFS unpubl. data), and a citizen science beluga sighting project (Svarny Carlson and Brunner 2012).
Localized information on beluga distribution and habitat use of specific areas of Cook Inlet was obtained by reviewing studies conducted in conjunction with the following development activities: the Port of Anchorage Expansion Project; Ocean Renewable Power Company’s Fire Island Tidal Project; Pac-Rim Coal’s Chuitna Coal Project; DOT&PF’s Seward Highway

Biological Assessment of the Cook Inlet Beluga Whale (Delphinapterus leucas) for the Seward Highway MP 105-107 Windy Corner Project
Page 31
Project; the Knik Arm Bridge and Toll Authority; Joint Base Elmendorf Richardson; and various seismic programs for Apache Alaska, ConocoPhillips Alaska, and Furie/Escopeta Oil. Reports from these may be found at http://www.fakr.noaa.gov/protectedresources/whales/beluga/development.htm#pm.
1. Inter-annual distribution patterns of belugas in Cook Inlet
The distribution of CIBW has changed significantly since the 1970s, when aerial surveys for belugas were first conducted. Aerial surveys of Cook Inlet in June and July were conducted in the late 1970s by ADF&G and annually since 1993 by NMFS. Each of the surveys in the 1970s was a single sample of the study area, while the NMFS surveys covered a 4- to 10-day period each year and included 3–7 repetitions of coastal flights around the upper Inlet plus 1–2 days dedicated to a survey of the lower Inlet. While many of the early reports lacked sufficient descriptions of how and where the surveys occurred, good documentation is available for aerial surveys conducted on June 18, 1978 and June 18–22, 1979 (Alaska Department of Fish and Game, unpubl. data) and from the NMFS surveys starting in 1993 (Rugh et al. 2000, 2005a,b).
To examine changes in historical distribution patterns of CIBW, three time periods were considered: late 1978–1979 (when well-documented data are available); 1993–1997 (during a decline in abundance); and 1998–2008 (when hunting was regulated and recovery was anticipated; Rugh et al. 2010). This analysis of aerial survey data shows that the extent of the late spring/early summer distribution (June/July) of belugas in Cook Inlet has changed considerably since the late 1970s. Beluga whales were distributed over a relatively large area in 1978 and 1979, with the central location occurring between the McArthur and Beluga rivers (Figure 15). The area of highest concentration included the region from Drift River to the Susitna Delta. The TEK also indicates that CIBW had long been observed in the southern Inlet, including Kachemak Bay on the eastern side and Tuxedni and Trading bays on the western side, although rarely in large numbers (Huntington 2000). From 1993 to 1997, the central location shifted northwest to the mouth of the Susitna River and the area of highest concentration contracted to a region north of Moose Point (Figure 16). From 1998 to 2008, the central location shifted west, then occurring between the Little Susitna River and Fire Island (Figure 17); the area of highest concentration included Knik Arm and Chickaloon Bay (between Point Possession and Turnagain Arm). Changes in distribution over the three time periods were significant. These include the northwest contraction of the range of belugas into upper Cook Inlet from the 1970s to the 1990s and into the 2000s, as well as a longitudinal shift west toward Anchorage between 1993 and 2008. Core summer distribution was estimated to have contracted from over 2,703 mi2 (7,000 km2) in 1978–1979 to 1,081 mi2 (2,800 km2) in 1998–2008 (Rugh et al. 2010). Fewer sightings in this region in recent decades (Hansen and Hubbard 1999; Speckman and Piatt 2000, Rugh et al. 2000, 2004, 2010) indicate that ranging behavior has contracted to the mid and upper Inlet, coincident with a decline in population size.
The reason for this change of distribution is not known but several hypotheses have been proposed, including: 1) an effect of changing habitat, such as through diminished prey availability (Moore et al. 2000); 2) avoidance of killer whale predation (Shelden et al. 2003); and 3) this remnant population remains in preferred habitat areas (Goetz et al. 2007) because intra-specific competition is greatly reduced by the small population size. Regardless of the reason, the

Biological Assessment of the Cook Inlet Beluga Whale (Delphinapterus leucas) for the Seward Highway MP 105-107 Windy Corner Project
Page 32
result of the CIBW range contraction brings animals in a small range proximal to Anchorage during summer months, with the increased potential for disturbance from human activities.
Figure 15: Areas occupied by beluga whales in Cook Inlet, Alaska, in June/July 1978–1979 (from Rugh et al. 2010).

Biological Assessment of the Cook Inlet Beluga Whale (Delphinapterus leucas) for the Seward Highway MP 105-107 Windy Corner Project
Page 33
Figure 16: Areas occupied by beluga whales in Cook Inlet, Alaska, in June/July 1993–1997 (from Rugh et al. 2010).

Biological Assessment of the Cook Inlet Beluga Whale (Delphinapterus leucas) for the Seward Highway MP 105-107 Windy Corner Project
Page 34
Figure 17: Areas occupied by beluga whales in Cook Inlet, Alaska, in June 1998–2008 (from Rugh et al. 2010).

Biological Assessment of the Cook Inlet Beluga Whale (Delphinapterus leucas) for the Seward Highway MP 105-107 Windy Corner Project
Page 35
2. Seasonal distribution patterns
Multiple data sources indicate that beluga whales exhibit seasonal shifts in distribution and habitat use within Cook Inlet. Such patterns appear to be related to seasonal changes in the physical environment (e.g., ice, currents) and to shifts in food sources, specifically the timing of fish runs. Whales spend the ice-free months in the upper Inlet (often at discrete high-use areas), then expand their distribution south and into more offshore waters of the middle Inlet in winter, although they are also still found in waters of the upper Inlet (Hobbs et al. 2005). These seasonal patterns have been long observed and utilized by subsistence hunters (Huntington 2000), and have more recently been documented by aerial surveys (Rugh et al. 2000, 2004), satellite telemetry (Hobbs et al. 2005), and during shore- and boat-based observations (Funk et al. 2005; McGuire and Bourdon 2009). More recently, passive acoustic monitoring was used to assess seasonal movements throughout the Inlet (Lammers et al. 2013).
Of the 15 belugas tracked with satellite transmitters between May 1999 and March 2003, nine whales logged movements into December and four to the following March (Hobbs et al. 2005). All remained within Cook Inlet for duration of the tracking period. Whales spent the summer and early autumn months in the upper Inlet, concentrating at river mouths. Within this time period, whales often made weekly movements between the mouth of the Little Susitna River, Knik Arm, Turnagain Arm, and Chickaloon Bay. During the late summer the belugas remained in the upper Inlet centered in Knik Arm (Figures 18a, 18b). During the fall the belugas concentrated in Chickaloon Bay and areas of the west side near Tyonek (Figures 18c, 18d). In late fall, tagged whales began to make more extensive movements south into the middle Inlet and into deeper offshore waters (Figure 18e) and were not found in large dense groups that were commonly seen in the summer months (Rugh et al. 2004). This pattern continued through winter (Figures 18f–18h) when whales exhibited the most wide- ranging movements, spanning both near shore and offshore waters from the upper reaches of Knik Arm to the middle of Cook Inlet.

Biological Assessment of the Cook Inlet Beluga Whale (Delphinapterus leucas) for the Seward Highway MP 105-107 Windy Corner Project
Page 36
Figures 18 (a–h): Monthly kernel density charts based on daily tag locations (a single best location was chosen for each day); the yellow area represents the highest density and 50%
of the population, the green is 75% and the red is 95% of the population (Hobbs et al. 2005)
Figure 18a Figure 18b
Figure 18c Figure 18d
Figure 18e Figure 18f
Figure 18g Figure 18h

Biological Assessment of the Cook Inlet Beluga Whale (Delphinapterus leucas) for the Seward Highway MP 105-107 Windy Corner Project
Page 37
A year-round shore-and boat-based observational study in Knik Arm (July 2004–July 2005) revealed seasonal patterns in habitat use and abundance of this area, with peak abundances in fall (September) declining to lowest numbers in winter, and highest use of river mouths and mud flats (Funk et al. 2005). Shore-based studies during the ice-free months along Turnagain Arm found peak beluga abundances mid-August through October, with whales occasionally present mid-April to early May (Markowitz et al. 2007; McGuire and Bourdon 2012, McGuire et al. 2014). An ongoing (2005–present) photo-identification study within the upper Inlet with sighting histories of 312 individual belugas to date has documented movements by individual whales among several high-use areas within a summer season, including Susitna Flats, Knik Arm, Chickaloon Bay, Turnagain Arm, and the Kenai River (McGuire et al. 2014). Initial results from passive acoustic monitoring across the entire Inlet support seasonal patterns observed with other methods (Lammers et al. 2013).
Large aggregations of belugas in specific areas of Upper Cook Inlet during May to October are presumed to indicate a critical time period for foraging, based on the need for all animals to assimilate resources for overwinter survival (Calkins 1983; Huntington 2000). It is during the ice-free months that calves are born and nursed, and that the whales acquire the thick blubber layer they will need to survive through the winter months, when the anadromous fish runs end and prey move to deeper, offshore regions (Hobbs et al. 2005).
3. CIBW feeding habitat
CIBW are frequently seen aggregating near the mouths of rivers and streams, when anadromous fish species are present and often at their peak availability (Moore et al. 2000; Table 4). These concentrations of belugas within discrete areas of the upper Inlet and offshore of several important salmon streams are assumed to be the result of a feeding strategy that takes advantage of the bathymetry of the area: the fish are funneled into the channels formed by the river mouths and the shallow waters act as a gauntlet for fish as they move past waiting belugas. Hazard (1988) hypothesized that belugas were more successful feeding in rivers where prey were concentrated than in bays where prey were dispersed, implying that CIBW seek areas where anadromous prey escapement (return to natal rivers) numbers are high, but also areas that have certain habitat features. Research by Frost et al. (1983) on beluga whales in Bristol Bay suggested those whales preferred certain streams for feeding based on the configuration of the stream channel. Their study theorized beluga whales’ feeding efficiencies improved in relatively shallow channels where fish were confined or concentrated. Because beluga whales do not always feed at the streams with the largest runs of fish, bathymetry and fish density may be more important than sheer numbers of fish in their feeding success. For example, CIBW today are seen less frequently at the mouth of the Kenai River than they were historically, despite large salmon returns to the river. This may also be due to preference for particular species, for example, a preference for oily coho salmon over much less oily sockeye salmon.

Biological Assessment of the Cook Inlet Beluga Whale (Delphinapterus leucas) for the Seward Highway MP 105-107 Windy Corner Project
Page 38
Table 4. Approximate timing of the presence (gray shading) and peak availability (black shading) of fish species entering fresh water drainages in Upper Cook Inlet (Moore et al. 2000).
Jan Feb Mar Apr May June July Aug Sept Oct Nov Dec
Chinook
Sockeye
Chum
Pink
Coho
Steelhead
Dolly Varden
Euchalon
Habitat use in the summer months consists of semi-predictable diurnal (daily) movements of groups of beluga whales between river mouths and shallow tidal flats in the upper Inlet. These movements are largely cued to physical conditions, especially tide, but may also be influenced by anthropogenic activities. Traditional ecological knowledge indicates that daily movements are determined by the ebb and flow of the tide and the related movements and size of fish runs, and also by the presence of killer whales (Huntington 2000). For example, whales often concentrate on the shallow mudflats of the Susitna River Delta and Chickaloon Bay at low tide, and enter many of the upper Inlet rivers on the flooding tide, although the reverse tidal pattern has been observed in Eagle River in Knik Arm (McGuire et al. 2014, Funk et al. 2005). Observational studies (Funk et al. 2005, Markowitz and McGuire 2007) and ocean circulation and inundation models, combined with tracks from tagged individual whales (Ezer et al. 2008), confirm long-held local knowledge that daily feeding movements are influenced greatly by tidal cycle.
In the fall, as anadromous fish runs begin to decline, belugas again return to consume the fish species found in nearshore bays and estuaries. Habitat associations of nonanadromous beluga prey species in Cook Inlet include preferences for sand and mud substrates (Cohen et al. 1990, Eschmeyer et al. 1983,) and a number of these species move seasonally from shallow to deep water. Movements of belugas within the Inlet during the months when anadromous fish runs are not present may reflect the seasonal movements of these other prey species. The prey available in winter do not tend to form large concentrations, and it may be that belugas tend to disperse throughout the upper Inlet during November through April, to utilize the more-dispersed prey (Hobbs et al. 2005). In the winter, CIBW use deeper waters in the mid Inlet past Kalgin Island

Biological Assessment of the Cook Inlet Beluga Whale (Delphinapterus leucas) for the Seward Highway MP 105-107 Windy Corner Project
Page 39
and make deep feeding dives. The presence of Kalgin Island south of the Forelands may create upwelling and eddies which concentrate nutrients and provides a still-water refuge area for migrating anadromous fishes (Calkins 1983, 1989). This area may be a late-winter staging area for Pacific eulachon before they return to streams in the upper Inlet. Given the unique oceanographic conditions and the diversity of fish and crustaceans found near Kalgin Island, this area may be rich in biological productivity, and thus an important winter feeding habitat for belugas. Passive acoustic monitoring of beluga whales in Cook Inlet was recently conducted (Lammers et al. 2013) and is beginning to provide important information about distribution of CIBW during the winter months.
Goetz et al. (2007, 2012a) used geographic information systems (GIS) to develop quantitative models of the summer habitat preferences of the CIBW population. Habitat models were used to examine ecological relationships among belugas and several environmental variables. Parameters used in the models were based on June/July beluga sightings (1993–2004) relative to available environmental data: 1) bathymetry; 2) mudflats; and 3) flow rates among freshwater tributaries entering Cook Inlet. The two quantitative models predicted similar size and location of beluga habitat and identified mudflats and river size as important environmental features. Belugas are found near mudflats and prefer medium and high flow accumulation areas (i.e., medium to large river basins). Although sighting data in this study were collected primarily in June, other aerial surveys (Rugh et al. 2000, 2004), shore-based systematic and opportunistic observations (Funk et al. 2005; NMFS, Vate-Brattstrom et al. 2010), boat-based photo-id surveys (McGuire and Bourdon 2012), and whales tagged with satellite transmitters (Hobbs et al. 2005) show that the distribution documented in June is representative of the distribution throughout the ice-free months; Knik Arm, Turnagain Arm, Chickaloon River, and the Susitna River Delta are used extensively. In fact, belugas occasionally access these preferred habitats in winter despite thick ice cover (Hobbs et al. 2005). Tidal movement corridors are also important to Cook Inlet belugas, as beluga movements with the tides may occur up to twice daily and allow or limit access to feeding areas (Hobbs et al. 2005, Funk et al. 2005, Markowitz and McGuire 2007). Access to these areas and to corridors between these areas is important for obtaining prey.
Additional analyses by Goetz et al. (2012a) concluded that belugas were found in areas of high fish availability and access to tidal flats and sandy substrates, and that belugas were negatively associated with anthropogenic disturbance. These habitat models predicted that beluga distribution would include coastal areas extending nearly the entire length of Cook Inlet (Goetz et al. 2007), and, in fact, historically belugas inhabited large parts of the Inlet, including its central and southern reaches (Rugh et al. 2000). However, since 1993, when NMFS began systematic documentation of the distribution, beluga sightings have been rare (0–4% of all reported sightings per year) in areas south of the Forelands (Figure 2), and almost all sightings have been in the upper Inlet, from the Susitna Delta to Knik Arm and Chickaloon Bay (Rugh et al. 2000; 2005a, b). A significantly reduced CIBW population (Hobbs et al. 2006), in combination with beluga preference for estuarine waters with the largest concentration of prey species, may explain the current distribution of whales, but data on relative densities of fish by species and season are not available to test this hypothesis.

Biological Assessment of the Cook Inlet Beluga Whale (Delphinapterus leucas) for the Seward Highway MP 105-107 Windy Corner Project
Page 40
4. CIBW calving habitat
In addition to being important feeding habitats, the shallow waters of the upper Inlet may also play important roles in reproduction. One hypothesis is that since newborn beluga whales do not have the thick blubber layer of adults, they may benefit from warmer water temperatures in the shallow tidal flats areas where fresh water empties into the Inlet, and it is likely these regions are used as nursery areas (Katona et al. 1983; Calkins 1989); however, a comparison of the temperatures of glacially fed freshwaters to seawater has not been conducted. These shallow areas may also provide refuge from killer whale predation on calves. The TEK of Alaska Natives has described historical beluga calving and nursery habitats as the northern side of Kachemak Bay, the mouths of the Beluga and Susitna Rivers, as well as Chickaloon Bay and Turnagain Arm (Huntington 2000). Knik Arm is also used extensively in the late summer and fall by cow/calf pairs: Funk et al. (2005) noted a relatively high representation of calves in the uppermost part of Knik Arm; the mouth of Knik Arm has been reported to be transited in the summer and fall by cow/calf pairs (Cornick and Kendall 2008a); and groups seen in Eagle Bay usually contain calves (McGuire and Bourdon 2012).
Because calving events have not been documented in Cook Inlet, specific calving grounds have not been identified, although it seems likely that the areas identified as nursery areas might also serve as calving grounds. Based on the presence of calves sighted in summer aerial surveys, Calkins (1983) speculated that calving might occur in the larger estuaries of upper western Cook Inlet. During boat-based surveys for calves conducted in 2007–2011, the first neonates of the season were seen at the Susitna River Delta (McGuire and Bourdon 2012), although later in the season, groups seen in Knik Arm were more likely than groups in other areas to contain neonates. However, distinct areas for neonate and calf rearing were not identified, as calves and neonates were seen in all locations surveyed in Upper Cook Inlet (the Susitna River Delta, Knik Arm, Chickaloon Bay/Southeast Fire Island, and Turnagain Arm). Surveys of the lower Kenai River and its delta were conducted in 2011 and 2012, and groups seen there also contained calves and neonates (McGuire et al. 2014).
5. Other uses of habitat
Other important uses of habitat by CIBW may include avoidance/escape from predators, transiting among feeding and/or nursery habitats, refuge from human activities (e.g., in-water noise, ship traffic, hunting), and molting (NMFS 2008a). The shallower waters of Turnagain Arm may be important habitat for predator avoidance from killer whales (Shelden et al. 2003; 76 FR 20180).
In the 2008 Conservation Plan (NMFS 2008a), NMFS states that warmer, fresher coastal waters may be important areas for belugas’ seasonal summer molt and that shallow waters may provide conditions necessary to help facilitate the shedding of dead skin and regeneration of epidermal layers. However, ten years of photographic records of over 312 individual CIBW whales photographed April–November do not display signs of obvious molting (McGuire et al. 2014); it may be that molting in CIBW is a more diffuse, gradual process than it is for those beluga stocks found in more northern latitudes and that habitat specifically for seasonal molting is not required.

Biological Assessment of the Cook Inlet Beluga Whale (Delphinapterus leucas) for the Seward Highway MP 105-107 Windy Corner Project
Page 41
F. CIBW Critical Habitat
In April 2011, NMFS designated critical habitat for CIBW (NMFS 2011). The Windy Corner Project Action Area is located within CIBW critical habitat. In designating the critical habitat, NMFS had to consider physical and biological features essential to the conservation of the species and that may require special management. These features may include: 1) space for individual and population growth, and for normal behavior; 2) food, water, air, light, minerals, or other nutritional or physiological requirements; 3) cover or shelter; 4) sites for breeding, reproduction, rearing of offspring, germination, or seed dispersal; and generally 5) habitats that are protected from disturbance or are representative of the historic geographical and ecological distributions of the species. The critical habitat is defined in terms of essential physical and biological features, which are the primary constituent elements (PCE) of the critical habitat. Based on the best scientific data available of the ecology and natural history of CIBW and their conservation needs, NMFS determined the following physical or biological features (PCEs) are essential to the conservation of this species:
1. Intertidal and subtidal waters of Cook Inlet with depths less than 30 feet (9.1 m; MLLW) and within 5 miles (8 km) of high and medium flow anadromous fish streams;
2. Primary prey species consisting of four species of Pacific salmon (Chinook, sockeye, chum, and coho), Pacific eulachon, Pacific cod, walleye pollock, saffron cod, and yellowfin sole;
3. Waters free of toxins or other agents of a type and amount harmful to CIBW; 4. Unrestricted passage within or between the critical habitat areas; and 5. Waters with in-water noise below levels resulting in the abandonment of critical
habitat areas by CIBW.
In the designation, NMFS identified two specific marine areas in Cook Inlet, Alaska as containing one or more of the essential features (Figure 19). These areas, totaling 3,013 mi2 (7,800 km2) are bounded on the upland by Mean High Water (MHW) datum, except for the lower reaches of specific tributary rivers. Critical habitat does not extend into the tidally influenced channels of tributary waters of Cook Inlet, with the exceptions noted in the descriptions of each critical habitat area. Critical Habitat Area 1 includes all marine waters of Cook Inlet north of a line from the mouth of Threemile Creek (61°08.5′ N., 151°04.4′ W.) connecting to Point Possession (61°02.1′ N., 150°24.3′ W.), including waters of the Susitna River south of 61°20.0′ N., the Little Susitna River south of 61°18.0′ N., and the Chickaloon River north of 60°53.0′ N. Critical Habitat Area 2 includes all marine waters of Cook Inlet south of a line from the mouth of Threemile Creek (61°08.5′ N., 151°04.4′ W.) to Point Possession (61°02.1′ N., 150°24.3′ W.) and north of 60°15.0′N., including waters within 2 nautical miles seaward of MHW along the western shoreline of Cook Inlet between 60°15.0′ N. and the mouth of the Douglas River (59°04.0′ N., 153°46.0′ W.); all waters of Kachemak Bay east of 151°40.0′ W.; and waters of the Kenai River below the Warren Ames bridge at Kenai, Alaska. Two areas were excluded from the critical habitat designation given their interest to national security: 1) all property and overlying waters of Joint Base Elmendorf-Richardson between Mean Higher High Water (MHHW) and MHW, and 2) all waters off the Port of Anchorage which are east of a line connecting Cairn Point (61°15.4’ N., 149°52.8’ W.) and Point MacKenzie (61°14.3’ N., 149°59.2’ W.) and north of a line connecting Point MacKenzie and the north bank of the mouth

Biological Assessment of the Cook Inlet Beluga Whale (Delphinapterus leucas) for the Seward Highway MP 105-107 Windy Corner Project
Page 42
of Ship Creek (61°13.6’ N., 149°53.8’ W.). The Windy Corner Project Action Area is located in CIBW Critical Habitat Area 1.
The NMFS Conservation Plan for CIBW (NMFS 2008a) states the following about Type 1 Habitat (now called Critical Habitat Area 1): This area is full of shallow tidal flats, river mouths or estuarine areas, and is important as foraging and calving habitats. Many rivers in Type 1 habitat have large eulachon and salmon runs. These shallow areas may also provide for other biological needs, such as escape from predators. This area has the highest concentrations of belugas from spring through fall as well as greatest potential for impact from anthropogenic threats. For these reasons, Type 1 habitat is considered the most valuable habitat type. Belugas are particularly vulnerable to impacts in Type 1 habitat due to their concentrated use and the biological importance of these areas. Because of their intensive use of this area (e.g., foraging, nursery, predator avoidance), activities that restrict or deter access to Type 1 habitat could reduce beluga calving success, impair their ability to secure prey, and increase their susceptibility to predation by killer whales. Projects that reduce anadromous fish runs could also negatively impact beluga foraging success during this time. Furthermore, the tendency for belugas to occur in high concentrations in Type 1 habitat predisposes them to harm from such events as oil spills.

Biological Assessment of the Cook Inlet Beluga Whale (Delphinapterus leucas) for the Seward Highway MP 105-107 Windy Corner Project
Page 43
Figure 19: Map of Cook Inlet Beluga Critical Habitat (NMFS 2011).
The following primary constituent elements (PCEs) of CIBW critical habitat are present in the Windy Corner Project Action Area:
PCE 1 consists of intertidal and subtidal waters of Cook Inlet with bottom depths less than 30 ft (9.1 m; MLLW) and within 5 mi (8 km) of high- and medium-flow accumulation anadromous

Biological Assessment of the Cook Inlet Beluga Whale (Delphinapterus leucas) for the Seward Highway MP 105-107 Windy Corner Project
Page 44
fish streams. There are nine anadromous rivers or creeks that discharge within 5 miles of the Windy Corner Project Action Area (Table 5; Figure 20), although none of them are within it. Shallow intertidal and subtidal waters within 5 mi (8 km) of these creeks and rivers make up PCE 1 within the action area. Goetz et al. (2007) indicate that the portion of Turnagain Arm containing the Windy Corner Project Action Area contains habitat defined as PCE 1.
Table 5. List of anadromous rivers or streams in or within 5 mi (8 km) of the Windy Corner Project Action Area.
Name of creek or river ADF&G anadromous stream no.
Indian Creek 247-60-10290
Bear Creek 247-60-10160
Porcupine Creek 247-60-10140
Cripple Creek 247-60-10150-2008
unnamed 247-60-10160-2008
Penguin Creek 247-60-10280-2008
Resurrection Creek 247-60-10150
Bird Creek 247-60-10280
unnamed 247-60-10278

Biological Assessment of the Cook Inlet Beluga Whale (Delphinapterus leucas) for the Seward Highway MP 105-107 Windy Corner Project
Page 45
Figure 20: Anadromous streams and rivers within 5 mi (8km) of the Windy Corner Project Action Area.
PCE 2 consists of the following primary prey species for CIBW: Chinook, sockeye, chum, and coho salmon; Pacific eulachon; Pacific cod; walleye pollock; saffron cod; and yellow fin sole. All four species of Pacific salmon (Chinook, sockeye, coho, chum) and Pacific eulachon listed under PCE 2s have the potential be found within the action area as they migrate to anadromous tributaries in Turnagain Arm, therefore PCE 2 exists in the Windy Corner Project Action Area. In addition, the late juvenile and mature stages of Pacific cod and walleye Pollock may be found here.
G. PCE 2 and Overlap with Essential Fish Habitat (EFH)
In 1996, the Sustainable Fisheries Act amended the Magnuson-Stevens Fishery Conservation and Management Act (Magnuson-Stevens Act) to require the description and identification of EFH in fishery management plans, the identification of adverse impacts on essential fish habitat, and actions to conserve and enhance such habitats. EFH includes those waters and substrate necessary to fish for spawning, breeding, feeding, or growth to maturity. NMFS classifies all of Cook Inlet as EFH for all five Pacific salmon species (Chinook, chum, coho, sockeye, and pink salmon), including the marine juvenile, marine immature, and maturing adults stages of each of these species. The Windy Corner Project Action Area does not contain freshwater EFH for salmon but does contain marine EFH by virtue of occurring in Cook Inlet. Therefore, with respect to Chinook, chum, coho, and sockeye, PCE2 and EFH overlap in the Windy Corner Project Action Area. Turnagain Arm provides EFH, for all five stocks of Pacific salmon: Chinook, coho, sockeye, chum and pink, in addition to Dolly Varden. Turnagain Arm may also

Biological Assessment of the Cook Inlet Beluga Whale (Delphinapterus leucas) for the Seward Highway MP 105-107 Windy Corner Project
Page 46
provide EFH for Gulf of Alaska groundfish species. Adult fish use Turnagain Arm as a primary migratory route, returning to spawning streams, such as Rabbit Creek, Potter Creek, Indian Creek, and Bird Creek. A query using the Alaska GIS mapping tool (http://www.habitat.noaa.gov/protection/efh/habitatmapper.html) on the EFH website for the NMFS Alaska Regional Office indicated no EFH habitats of particular concern were identified at the location, nor were any EFH Areas protected from fishing.
PCE 3 is the absence of toxins or other agents of a type or amount harmful to beluga whales. The Alaska Department of Environmental Conservation has designated Upper Cook Inlet as a Category 3 area within the Clean Water Act Section 303(d). This categorization is due to insufficient information available to determine water quality (ADEC 2010). There are several sources of toxins and contaminants in Cook Inlet waters, including storm water runoff, wastewater treatment facilities, oil and gas activities, aircraft deicing activities, and military training (Moore et al. 2000; NMFS 2008a). Specific activities in Turnagain Arm include discharge from the Girdwood Waste Water Treatment Facility and runoff from the Seward Highway. There is insufficient information to evaluate the presence of PCE3 in the Windy Corner Project Action Area. There is currently nothing to indicate that the waters of the Project Action Area contain or have contained toxins of an amount or type deemed harmful to CIBW.
PCE 4 is unrestricted passage within or between critical habitat areas. The Windy Corner Project Action Area currently has unrestricted passage within or between the critical habitat areas, therefore it contains PCE 4.
PCE 5 is the absence of in-water noise at levels resulting in the abandonment of habitat by CIBW. Anthropogenic underwater noise (Section IV) in the Windy Corner Project Action Area is primarily from road traffic, aircraft overflights, trains, and the rare vessel navigating Turnagain Arm. Beluga whales use Turnagain Arm and the Windy Corner Project Action Area (see below). Under baseline conditions, there is no indication that ambient noise levels in the action area have caused CIBW to abandon or avoid this habitat, therefore PCE 5 exists in the Windy Corner Project Action Area. See Appendix 1 for ambient underwater sound levels at Windy Corner in August 2014.
H. CIBW Use of Turnagain Arm and the Windy Corner Project Action Area: Seasonal Patterns
The Conservation Plan for CIBW (NMFS 2008a) states that “belugas visit Turnagain Arm in early spring traveling up to 20-Mile River and Placer Creeks, indicating the importance of Pacific eulachon runs for beluga feeding. Beluga use of upper Turnagain Arm decreases in the summer and then increases again in August through the fall, coinciding with the coho salmon run.”
1. Information from aerial surveys
Aerial surveys conducted by NMFS in June/July 1978–1979 detected CIBW in only the very lowest part of the Arm (i.e., nearest Anchorage), west of the Windy Corner Project Action Area. Continuation of these surveys in 1993–2007 detected CIBW throughout Turnagain Arm (Rugh et al. 2010), as did many of the surveys conducted in June and August of 2009–2012 (Shelden et al.

Biological Assessment of the Cook Inlet Beluga Whale (Delphinapterus leucas) for the Seward Highway MP 105-107 Windy Corner Project
Page 47
2012, 2011, 2010a,b, 2009a, 2009b). Surveys in 2008 were conducted in June, August, Sept, and Oct (Shelden et al. 2008a,b); belugas were seen in Turnagain Arm in all of these months except October. NMFS did not conduct aerial surveys in 2013, and results from 2014 have not yet been made available.
2. Information from satellite tags
Of the 15 belugas tracked with satellite transmitters between May 1999 and March 2003, nine whales logged movements into December and four in to the following March (Hobbs et al. 2005). Tagged individuals spent the summer and early autumn months in the upper Inlet, concentrating at river mouths, and often made weekly movements between the mouth of the Little Susitna River, Knik Arm, Turnagain Arm and Chickaloon Bay. Tagged whales ranged over a greater part of the inlet during the winter months. Tagged whales were detected in Turnagain Arm in August, September, October, November, December, January, February, and March (data not available for April-July).
3. Information from land-based surveys for DOT&PF
A monitoring program along the Seward Highway was conducted in 2006 by LGL for HDR on behalf of the DOT&PF to document the presence, habitat use, and behavior of CIBW in Turnagain Arm, with emphasis on milepost 75-90 and milepost 99-115 (Markowitz et al. 2007).
The objective of this monitoring program was to provide baseline data on CIBW use of the Turnagain Arm prior to improvements to the Seward Highway. Shore-based visual monitoring was conducted in Upper Turnagain Arm (Bird Point to Placer River) May 8–Nov 20 and Sept 23–Nov 25 in Lower Turnagain Arm (Potter Creek to Bird Point). Surveys were conducted by a land-based observer who traveled between observation stations by car, up the Arm with the incoming tide, then back down with the outgoing tide. Observers noted location, group size, color/age class composition, direction of travel, distance from shore, and behavior of all CIBW encountered. Monitoring was conducted for a total of 748 hours on 136 days. CIBW were not seen in Upper or Lower Turnagain Arm in May, June, or July. Beluga sighting rates in Upper Turnagain Arm peaked in September, with most sightings occurring between late August and early November (Figures 21 and 22). CIBW were only sighted in Lower Turnagain Arm on two days in September, and occurred in the Windy Corner Project Action Area on both days.

Biological Assessment of the Cook Inlet Beluga Whale (Delphinapterus leucas) for the Seward Highway MP 105-107 Windy Corner Project
Page 48
a. Mean number of beluga whale group sightings per day compared by month.
b. Number of beluga whale group sightings per day.
Figure 21: Sighting rates of beluga whale groups in Upper Turnagain Arm along the Seward Highway are compared (a) by month (mean values with standard errors) and (b)
by day (from Markowitz et al. 2007).
4.3
1.0
0 0 0
0.20.05
0
1
2
3
4
5
May June July August Sept Oct Nov
Month
Bel
uga
Wh
ale
Gro
up
Sig
htin
gs
Per
Day
0%
20%
40%
60%
80%
100%
Percen
t Days W
hales S
ighted
13-Sep, 12 group sightings
0
1
2
3
4
5
6
7
8
9
10
11
12
1-May
8-May
15-May
22-May
29-May
5-Jun
12-Jun
19-Jun
26-Jun
3-Jul
10-Jul
17-Jul
24-Jul
31-Jul
7-Aug
14-Aug
21-Aug
28-Aug
4-Sep
11-Sep
18-Sep
25-Sep
2-Oct
9-Oct
16-Oct
23-Oct
30-Oct
6-Nov
13-Nov
20-Nov
27-Nov
Date
Num
ber
of B
eluga
Whal
e G
roup S
ightings
per
Day

Biological Assessment of the Cook Inlet Beluga Whale (Delphinapterus leucas) for the Seward Highway MP 105-107 Windy Corner Project
Page 49
a. Mean number of beluga whales counted per day compared by month.
b. Total number of beluga whales counted per day.
Figure 22: The number of beluga whales observed in Upper Turnagain Arm are compared (a) by month (mean values with standard errors) and (b) by day (from Markowitz et al.
2007).
The average group seen along Turnagain Arm consisted of 58% white animals, 17% gray animals, 8% calves, and 17% whales of unknown color/age class. Group size ranged between 2
27
8.2 0.32
4.7
0000
5
10
15
20
25
30
35
40
May June July August Sept Oct Nov
Month
Mea
n N
um
ber
of
Bel
ug
a W
hal
es C
ou
nte
d P
er D
ay
0
10
20
30
40
50
60
1-May
8-May
15-May
22-May
29-May
5-Jun
12-Jun
19-Jun
26-Jun
3-Jul
10-Jul
17-Jul
24-Jul
31-Jul
7-Aug
14-Aug
21-Aug
28-Aug
4-Sep
11-Sep
18-Sep
25-Sep
2-Oct
9-Oct
16-Oct
23-Oct
30-Oct
6-Nov
13-Nov
20-Nov
27-Nov
Date
Tota
l Num
ber
of B
eluga
Whal
es C
oun
ted p
er D
ay

Biological Assessment of the Cook Inlet Beluga Whale (Delphinapterus leucas) for the Seward Highway MP 105-107 Windy Corner Project
Page 50
and 52 individuals. Neonates (newborns) were sighted and not further differentiated from calves in the counts. Belugas were most often sighted within 328.1 ft (100 m) of shore (detection distance was estimated at 1.9 mi [3 km]), and traveling was the predominant activity observed, although suspected feeding behavior was also seen, as was milling, diving, and resting.
4. Information from land-based surveys for the CIBW Photo-ID Project
LGL’s CIBW Photo-id Project conducted 100 land-based surveys along Turnagain Arm 2006–2014 (McGuire et al. 2014, McGuire unpublished data). Survey effort was concentrated in Upper Turnagain Arm, but CIBW encountered in the lower arm were photographed and documented whenever possible. Photographers noted group location, size, color/age class composition, direction of travel, and behavior of all CIBW encountered. Surveys were conducted 2006–2014 between August and October, with greatest effort mid-August through mid-September. CIBW were seen in Turnagain Arm during all months surveyed. Maximum group size was 82 individuals. Groups consisted of white and gray animals, and most groups contained calves. Groups with calves and/or neonates were seen in the same areas of Turnagain Arm as were groups without. Neonates were present in many of the groups. CIBW that were observed in or near (< 3mi [4.8 km], driving distance along the highway) the Windy Corner Project Action Area were seen in August and September of 2011, 2012, 2013, and 2014 (McGuire et al. 2014; Figure 23, 24 and 25).
Figure 23: Route and beluga whale group(s) encountered and general survey route of all 2011 land-based surveys along Turnagain Arm, Upper Cook Inlet, Alaska (McGuire et al.
2014).

Biological Assessment of the Cook Inlet Beluga Whale (Delphinapterus leucas) for the Seward Highway MP 105-107 Windy Corner Project
Page 51
Figure 24: Route and beluga whale group(s) encountered and general survey route of all 2012 land-based surveys along Turnagain Arm, Upper Cook Inlet, Alaska (McGuire et al.
2014).

Biological Assessment of the Cook Inlet Beluga Whale (Delphinapterus leucas) for the Seward Highway MP 105-107 Windy Corner Project
Page 52
Figure 25: Route and beluga whale group(s) encountered and general survey route of all 2013 land-based surveys along Turnagain Arm, Upper Cook Inlet, Alaska (from McGuire
et al. 2014).
5. Information from traditional ecological knowledge (TEK)
TEK reports that CIBW travel to the upper end of Turnagain Arm, in response to the Pacific eulachon (“hooligan”) in May and the coho (“silver”) salmon in the fall (Huntington 2000).
6. Information from LGL incidental observations
Incidental beluga sighting reports were collected by the CIBW Photo-ID Project from the public and colleagues via email, phone calls, and conversations in the field. The CIBW Photo-id project website (www.cookinletbelugas.org) contains a page for members of the public to report beluga sightings, and the website address was distributed via the project bumper sticker and project pamphlets. Project pamphlets and bumper stickers were distributed to community centers, visitor’s centers, cafés, docks and boat launches, RV parks and lodges, during classroom and conference presentations, and to users/visitors encountered along Turnagain Arm and elsewhere in Upper Cook Inlet. Incidental beluga sighting reports were entered in the project database and shared with NMFS. Over 500 incidental reports of CIBW were received by LGL 2006–2014 with the number of reports increasing every year (the increase is likely the result of increased outreach efforts). Sightings were reported by fisherpeople, pilots, the media, law enforcement officers, large vessel operators, tourists, biologists, educators, environmentalists, and oil company employees. Seasonal patterns in sightings were consistent across years; CIBW were reported in Turnagain Arm in the spring and fall (Table 6).

Biological Assessment of the Cook Inlet Beluga Whale (Delphinapterus leucas) for the Seward Highway MP 105-107 Windy Corner Project
Page 53
Table 6. Summary of incidental sightings reports to LGL’s CIBW Photo-id Project of CIBW in Turnagain Arm, (McGuire et al. 2014, McGuir e unpublished data). B and shading indicate CIBW sighting reported.
Year 2006 2007 2008 2009 2010 2011 2012 2013 2014 Incidental sighting reported 2006–2014?
Month
January no
February no
March B yes
April B B B B B B yes
May B B B B B yes
June B B yes
July no
August B B B B B B B B B yes
September B B B B B B B B B yes
October B B B yes
November no
December B yes
7. Information from NMML observational sighting database
NMFS maintains a database of over 1,500 opportunistic sighting of CIBWs reported since 1975. These records show that CIBW have been seen in the Windy Corner Project Action Area during all seasons of the year over the last four decades (Vate-Brattstrom et al. 2010). During the preparation of this BA for the Windy Corner Project, NMFS provided detailed records of 167 opportunistic sightings of CIBW in Turnagain Arm 1979–2013. CIBW were seen in Turnagain Arm in all months of the year except December. There were 117 observational sightings of

Biological Assessment of the Cook Inlet Beluga Whale (Delphinapterus leucas) for the Seward Highway MP 105-107 Windy Corner Project
Page 54
CIBW in Lower Turnagain Arm (between South Anchorage and Bird Point); these sightings occurred in all months except February, November, and December. Most of the Lower Cook Inlet sightings occurred in August and September, with a smaller peak in April, May, and June. CIBW were reported twice in July, once traveling up the Arm, and once at the mouth of the Resurrection River, reportedly feeding on a run of pink salmon; these observations are the only available records from any source of CIBW in Turnagain Arm in July.
8. Information from Anchorage Coastal Beluga Survey (ACBS)
The Friends of the Anchorage Coastal Wildlife Refuge (FAR) led the Anchorage Coastal Beluga Survey (ACBS). Trained volunteer citizen scientists with the project conducted land-based visual surveys for CIBW at Windy Corner in 2010 and 2011 (Svarny Carlson and Brunner 2012). In 2010, Windy Corner surveys were conducted in September and October for a total of 18 days. Ten CIBWs, including one calf, were seen on October 13, 2010 during high tide. In 2011, Windy Corner surveys were conducted in May, and August, for a total of 22 days. CIBW were not seen at Windy Corner in May. A group of four whales (including one calf) was seen at Windy Corner on Aug 30, 2011 during high tide. FAR also reported a group of three CIBW at Windy Corner on September 11, 2011 (time/tidal stage not reported). Observers noted that the frequently high winds encountered at Windy Corner produced whitecaps that often made it difficult to determine if belugas were present.
9. CIBW use of Turnagain Arm and Windy Corner Project Action Area: tidal patterns
Tidal stage has not always been described in the same terms by various research and monitoring projects in Cook Inlet. In this document, tidal stage has been defined using the following method, regardless of how it was described by the original observer or study: the date and the time of day of the initial beluga sighting at Windy Corner was referenced to the tidal stage for Anchorage Alaska in the program J-tides (www.arachnoid.com/JTides). These times were then offset by 30 minutes to allow for the delay between Anchorage and Windy Corner, verified by the tide tables for Sunrise, Alaska, the closest location to Windy Corner for which tide tables are available (www.tides.info). The tide chart in J-tides provides a continuous height throughout a 24-hr period, while the tide table only provides water depths at the time of high and low tide. For classification purposes, the tidal cycle was divided into four periods of three hours each (high, low, rising, and falling), although actual tidal stages in Cook Inlet are of varying length depending on the date and the lunar cycle. Sighting times for belugas were then assigned to one of the four tidal stages.
10. Information from land-based surveys for DOT&PF
CIBW groups were most often seen moving up Turnagain Arm (from west to east) with the rising tide, and down the Arm (from east to west) with the falling tide. Because much of Turnagain Arm dewaters during low tide, it must be assumed that any CIBW observed in Upper Turnagain Arm during high tide had to first pass through Lower Turnagain Arm and were simply not detected by the shore-based observer in the lower arm, perhaps because whales in the lower arm were spread out over a larger area, were found along the south shore of the arm, or moved through this area at a less-predictable time with respect to the tide. The CIBW sightings closest to the Windy Corner Project Action Area occurred 4.8 and 2.9 hours after high tide (i.e., low and

Biological Assessment of the Cook Inlet Beluga Whale (Delphinapterus leucas) for the Seward Highway MP 105-107 Windy Corner Project
Page 55
falling, respectively), which suggested to the report authors that CIBW may have been more likely to occur along this section of the Seward Highway closer to mid-to-low tide periods, rather than mid-to-high tide periods, when they were seen in the Upper Arm (Markowitz et al. 2007). Monitoring shifts in Lower Turnagain Arm were scheduled around the mid-to-high tides, with each shift approx. 5.5 hours long. This coverage of the tidal cycle by the study team indicates that the observed CIBW presence in Lower Turnagain Arm during the mid-to-low tide period was not simply an artifact of the sampling schedule.
11. Information from land-based surveys for the CIBW Photo-id Project
CIBW observed in or near (< 3mi [4.8 km], driving distance along the highway) the Windy Corner Project Action Area were seen in August and September of 2011, 2012, 2013, and 2014 (McGuire et al. 2014, McGuire unpublished data), and were seen during high, rising, and falling tides (Table 7).
Table 7. Tidal stages of observations of CIBW seen < 3mi (4.8 km) of Windy Corner, Turnagain Arm during CIBW Photo-ID Project surveys (McGuire et al. 2014, McGuire unpublished data).
Year Date Time of first
beluga detection at Windy Corner
Tidal stage
2011 Aug 29 21:00 High 2011 Sept 4 10:51 Rising 2011 Sept 5 11:45 Rising 2011 Sept 5 14:48 High 2012 Sept 7 15:40 Falling 2013 Aug 13 16:24 Falling 2013 Sept 20 11:40 Falling 2014 Sept 08 13:10 High 2014 Sept 12 11:44 High
12. Information from visual monitoring during Greeneridge /DOT&PF acoustic ambient recording
During a site-selection survey for a study of ambient underwater sounds levels at Windy Corner, two belugas were sighted and photographed at Windy Corner on Aug 17, 2014 at 08:37 (low tide), approximately 820.2 ft (250 m) from shore (Burgess 2014, McGuire unpublished data). Visual observers monitored all tidal stages at Windy Corner on Aug 18, 2014, but CIBW were not observed.

Biological Assessment of the Cook Inlet Beluga Whale (Delphinapterus leucas) for the Seward Highway MP 105-107 Windy Corner Project
Page 56
13. Information from LGL incidental observations
Although incidental beluga sighting reports were collected by the LGL CIBW Photo-ID Project from the public and colleagues, only reports received from LGL employees, former LGL employees, or from members of the public who referenced a highway milepost marker are included in the summary table (below), in order to maintain a high level of confidence in the accuracy of the sighting location reported (e.g., visitors often confuse Beluga Point, Windy Point, and Bird Point when describing a location along the Seward Highway). Belugas were seen in the Windy Project Action Area during all tidal stages, and could be seen with calves (Figure 26).
Table 8. Incidental sightings of CIBW seen < 3 mi (4.8 km) of Windy Corner in the Windy Corner Project Action Area, as reported to LGL (McGuire et al. 2014, McGuire unpublished data).
Year Date Time of
first beluga
detection at Windy Corner
Tidal stage
2007 Aug 24 16:40 falling 2007 Aug 25 12:30 low 2008 Sept 5 11:30 high 2008 Sept 4 16:30 low 2010 Sept 3 18:40 falling 2011 Aug 28 10:00 falling 2011 Sept 18 09:00 rising 2012 June 22 19:30 low 2013 Sept 1 16:33 rising 2014 Sept 21 11:22 falling

Biological Assessment of the Cook Inlet Beluga Whale (Delphinapterus leucas) for the Seward Highway MP 105-107 Windy Corner Project
Page 57
Figure 26: Mother and calf CIBW seen at Windy Corner on September 21, 2014 during the falling tide.
(Photo credit: Amber Stephens, LGL Alaska Research Associates, Inc.)
14. Information from Anchorage Coastal Beluga Survey (ACBS)
CIBW seen at Windy Corner by ACBS observers during scheduled shifts were only seen during high tide (Svarny Carlson and Brunner 2012), although it should be noted that monitoring at this site was only conducted during high tide. The tidal stage/time of a single incidental beluga sighting at this location was not reported.
I. Summary of Seasonal and Tidal Occurrence of CIBW in Turnagain Arm and the Windy Corner Project Action Area
1. Seasonal
Although CIBW can be found in Turnagain Arm throughout the year, land-based observations indicate that they were most prevalent in spring and fall. There are few records of sightings in July, despite survey effort occurring during this time. Group size was largest mid-August through mid-September, although large groups (50 or more) have been seen into October (McGuire unpublished data). Table 9 summarizes the records of seasonal sightings of CIBW in Turnagain Arm.

Biological Assessment of the Cook Inlet Beluga Whale (Delphinapterus leucas) for the Seward Highway MP 105-107 Windy Corner Project
Page 58
Table 9. Summary of seasonal pattern of CIBW occurrence in Turnagain Arm.
ndc=no data collection, yes=CIBW sighted; no=CIBW not sighted.
Data source
Aerial surveys
1978-2012
Satellite tagged whales 1999-2003
Land-based surveys for DOT&PF
2006
Land-based
photo-id surveys
2006-2014
TEK NMML Opportunistic
Sightings Database
FAR ACBS
2010 2011
Incidentals
2006-2014 to LGL
CIBW detected in Turnagain Arm ?(any method)
January ndc yes ndc ndc no yes ndc no Yes
February ndc yes ndc ndc no yes ndc no Yes
March ndc yes ndc ndc no yes ndc yes Yes
April ndc ndc ndc ndc no yes ndc yes Yes
May ndc ndc no ndc yes yes No yes Yes
June yes ndc no ndc no yes ndc yes Yes
July no ndc no ndc no yes ndc no Yes
August yes yes yes yes yes yes yes yes Yes
September yes yes yes yes yes yes yes yes Yes
October no yes yes yes yes yes yes yes Yes
November ndc yes yes ndc no yes ndc no Yes
December ndc yes ndc ndc no no ndc yes Yes

Biological Assessment of the Cook Inlet Beluga Whale (Delphinapterus leucas) for the Seward Highway MP 105-107 Windy Corner Project
Page 59
2. Tidal
Although it has been reported that in the fall beluga whales routinely move into the upper end of Turnagain Arm with the rising tide and are more likely to be found in the lower part of the arm around low tide, CIBW have been seen during all tidal stages in the Windy Corner Project Action Area (Table 10).
Table 10. Summary of tidal pattern of CIBW occurrence in the Windy Corner Project Action Area. ndc=no data collection, yes=CIBW sighted; no=CIBW not sighted.
Data source
Land-based
surveys for
DOT&PF 2006
Land-based
photo-id surveys 2006-2014
LGL monitoring
for Greeneridge
2014
FAR ACBS
sightings 2010 2011
Incidental observations
2006-2014 to LGL
CIBW detected in
Project Action Area? (any method)
Tidal Stage
Low yes no yes ndc yes Yes
Rising no yes no ndc yes Yes
High no yes no yes yes Yes
Falling yes yes no ndc yes Yes
3. Use of habitat
Turnagain Arm is a seasonally important feeding habitat and travel corridor. CIBW of all age-classes have been found traversing the near-shore channels along the highway and foraging at the mouths of rivers and streams and along rocky outcroppings and riprap along the shore (Markowitz et al. 2007, McGuire et al. 2014). Movement and dive depths obtained from tagged CIBW indicate that, compared to elsewhere in Cook Inlet, dives were shorter and transits were slower in Chickaloon Bay, Susitna Delta, Knik Arm, Turnagain Arm, and Trading Bay, suggesting that animals were foraging in these areas (Goetz et al. 2012b). CIBW in Windy Corner have been reported as traveling, milling, and have been suspected be feeding.
Biological Assessment of the Cook Inlet Beluga Whale (Delphinapterus leucas) for the Seward Highway MP 105-107 Windy Corner Project
Page 60
IV. ENVIRONMENTAL BASELINE
This section describes the past and present impacts of human actions on CIBW and their critical habitat in the Windy Corner Project Action Area.
A. Environmental Baseline of CIBW in the Windy Corner Project Action Area
1. CIBW abundance and population trend
Inlet-wide abundance estimates for CIBW before the late 1970s do not exist; aerial surveys conducted by the Alaska Department of Fish and Game in the 1960s, 1970s and early 1980s counted CIBW but only a few had sufficient geographic coverage to estimate the population size (Calkins 1984, 1989). A survey in 1979 resulted in an estimate of 1,293 belugas that NMFS used as a reference number to estimate carrying capacity at 1,300 belugas; this estimate is now used for management purposes as the best available estimate of historic CIBW abundance (65 FR 34590, May 31, 2000). Between 1979 and 1994, the CIBW population fell from 1,300 to 650 individuals; the cause of decline during this period has not been identified. In 1993, NMFS began annual aerial surveys of the CIBW population. These surveys occur in early June (except for late July in 1995), include the upper, middle, and lower sections of the Inlet, and are stratified to focus survey effort in the areas of the upper Inlet where belugas are typically found in June. Annual estimates of the numbers of belugas resulting from these surveys documented a decline in abundance, from an estimate of 653 whales in 1994 to 347 whales in 1998. Analysis indicates the decline in abundance was adequately explained by the estimated take from a large unregulated Native subsistence hunt. With the very limited hunt since 1999, NMFS anticipated that the population would begin to increase. The available data at the present time indicate that the CIBW population is not growing as expected and is in fact declining despite the limits on the subsistence hunt (Hobbs et al. 2012). The most recent population estimate released by NMFS was 312 whales in 2012 (Hobbs et al. 2012, Figure 27). NMFS did not conduct aerial surveys in 2013 (Hobbs 2013) and results from the surveys conducted in 2014 have not yet been released. It remains unknown what specific factor, or combination of factors, continues to limit the recovery of this population.

Biological Assessment of the Cook Inlet Beluga Whale (Delphinapterus leucas) for the Seward Highway MP 105-107 Windy Corner Project
Page 61
Figure 27: Abundance estimates for CIBW 1994-2012. The vertical bars represent 95% confidence intervals for each estimate. The red line is the trend for the years 1999–2012
(Hobbs et al. 2012).
Turnagain Arm does not have a distinct sub-population of CIBW. Satellite tagging and photo-identification studies of individual CIBW indicate that individual belugas move around Cook Inlet and are not limited to a particular arm or river mouth (Hobbs et al. 2005, McGuire et al. 2014). Individual beluga whales identified in Turnagain Arm have also been seen in the Susitna River Delta, Knik Arm, and the Kenai River Delta (McGuire et al. 2014).
2. Conservation status of CIBW
The population decline of CIBW prompted a number of regulatory actions. In 1998, subsistence harvests were voluntarily reduced to assist with population recovery. The CIBW population was listed as depleted under the Marine Mammal Protection Act (MMPA) in 2000, which required the preparation of a Conservation Plan. In 2008 NMFS finalized the Conservation Plan (NMFS 2008a), which reviewed and assessed the known and possible threats to CIBW and identified specific conservation actions. CIBW were listed as endangered under the ESA in 2008. As a result of the ESA listing, NMFS was required to designate critical habitat and to develop a recovery plan for CIBW. NMFS designated critical habitat in Cook Inlet in 2011 (NMFS 2011) and appointed a CIBW Recovery Team in 2010. The Recovery Team provided a draft Recovery Plan to NMFS in March 2013; a final plan will be released following revision by NMFS and review by the public.
Biological Assessment of the Cook Inlet Beluga Whale (Delphinapterus leucas) for the Seward Highway MP 105-107 Windy Corner Project
Page 62
The ESA endangered listing and designation of critical habitat carry consultative requirements under section 7(a)(2) of the ESA. Under this section, all federal agencies are required to consult with NMFS regarding any action they authorize, fund, or carry out to ensure that action does not jeopardize the continued existence of the species or result in the destruction or adverse modification of designated critical habitat, whether or not the species currently uses that habitat. This BA is part of the Section 7 Consultation with NMFS for the Windy Corner Project. Because the CIBW Recovery Plan has not yet been finalized by NMFS, this BA uses the Conservation Plan for the CIBW (NMFS 2008a) as the basis of its discussion of the past and present impacts of human actions on CIBW and its critical habitat in the Windy Corner Project Action Area.
The Conservation Plan for CIBW (NMFS 2008a) classifies factors (also called threats in the Conservation Plan) with the potential to impact CIBW as either “natural” or “human induced”. The natural threats include stranding events, predation, parasitism, disease, and environmental change. Human-induced threats include subsistence harvest, poaching, fishing, pollution, vessel traffic, tourism and whale watching, coastal development, noise, oil and gas activities, coastal development (habitat loss), vessel traffic, noise, and scientific research. While a number of known and potential threats are discussed in the Conservation Plan, the actual levels of impact of these threats have not been determined. Furthermore, belugas may be affected by multiple threats at any given time, compounding the impacts of the threats.
B. Human-Induced Factors
1. Subsistence harvest
The steep decline in beluga abundance during the mid-1990s corresponds to a time of unregulated hunting, and overutilization during that period has been identified as a major contributor to the population decline (NMFS 2008a,b). This increase in harvest was largely attributed to participation by new hunters from non-traditional harvest areas. In 1998, CIBW subsistence harvests were voluntarily reduced to assist with population recovery. In 1999 there was no harvest as a result of a voluntary moratorium by the hunters that spring, and the moratorium became permanent in 2000. During 2000–2003 and 2005–2006, NMFS entered into co-management agreements for the CIBW subsistence harvest. Between 2000 and 2008, five CIBW were harvested. CIBW were not hunted 2006–2014. Legal subsistence hunting of CIBW by Alaska Natives is now well managed. Turnagain Arm has not been documented as a traditional area for beluga hunting; Huntington’s (2000) review of TEK states that historically “little hunting takes place in Turnagain Arm due to the strength of the tidal currents and winds”. Subsistence hunting does not currently occur in the Windy Corner Project Action Area.
Incidental subsistence harvest of a dead stranded CIBW occurred in the Windy Corner Project Area on September 8, 2014, milepost 104 of the Seward Highway. Hunting was not involved in this harvest; subsistence users opportunistically salvaged skin and blubber of a dead beluga incidental to a necropsy conducted by NMFS and the Alaska Marine Mammal Stranding Network.

Biological Assessment of the Cook Inlet Beluga Whale (Delphinapterus leucas) for the Seward Highway MP 105-107 Windy Corner Project
Page 63
2. Poaching and illegal harassment
Illegal hunting of CIBW is thought to be negligible, but requires continued monitoring because hunting has so negatively impacted this population in the past. The extent of direct or indirect mortality associated with illegal hunting or harassment of CIBW (e.g., chasing whales with vessels or using them for target practice) is unknown and may still be occurring at a low level. The NOAA Office of Law Enforcement has investigated several incidences of reported harassment of CIBW in the past decade. The potential for illegal harassment of belugas along Turnagain Arm, including Windy Corner, may be high as CIBW often approach within several meters of vehicle pullouts along the Seward Highway. Many of the educational signs along the Seward Highway are riddled with bullet holes, and several individual beluga whales exhibit marks that appear to be healed gunshot wounds (McGuire et al. 2014).
3. Fishing
Eulachon fishing for personal use is popular in Turnagain Arm. The most significant areas where Pacific eulachon are harvested are the Twentymile River, the Placer River, and the shoreline areas (NMFS 2008a, Spangler et al. 2003). Sport and personal use fisheries for coho salmon and Dolly Varden occur in upper Turnagain Arm (Bosch 2010). Recreational fishing for salmon occurs near the Windy Corner Project Action Area in Bird Creek and across Turnagain Arm at Resurrection Creek. The Windy Corner Project Action Area does not contain areas commonly used for personal-use, subsistence, or recreational fishing. Commercial fishing for salmon does not occur in Turnagain Arm, although migratory fish that travel into Turnagain Arm may be impacted by commercial fishing pressure elsewhere in the Inlet or the open ocean.
No mortalities or injuries of belugas have been reported in association with the salmon fishery in Cook Inlet since at least 1990. Indirect effects resulting from competition for prey species are currently of greater concern than the direct effects from fishing such as ship strike or entanglement (NMFS 2008a). It is unknown whether competition for prey with commercial fishing is having an effect on CIBW (NMFS 2008a).
C. Pollution
1. Air pollution
Traffic along the Seward Highway is the local source for air pollution along Turnagain Arm. The small communities of Girdwood (milepost 91), Rainbow (milepost 108) and Indian (milepost 103), generate a minor amount of traffic compared to the total volume along the Seward Highway which averages 10,000 vehicles per day and can reach 22,000 vehicles on a summer day (DOT&PF 2013b). Nearly constant strong winds along Turnagain Arm prevent traffic-related air pollution from becoming concentrated. The Environmental Protection Agency’s (EPA) website (http://www.epa.gov/oaqps001/greenbk/ancl.html) shows the Windy Corner Project Action Area is located in an attainment area. The EPA defines an attainment area as an area considered to have air quality as good as or better than the national ambient air quality standards as defined in the Clean Air Act.

Biological Assessment of the Cook Inlet Beluga Whale (Delphinapterus leucas) for the Seward Highway MP 105-107 Windy Corner Project
Page 64
2. Water pollution
There are several sources of toxins and contaminants in Cook Inlet waters, including storm water runoff, wastewater treatment facilities, oil and gas activities, aircraft deicing activities, and military training (Moore et al. 2000; NMFS 2008a). Runway deicing, ballast water discharge, and in-water or near-shore military training do not occur in Turnagain Arm. Specific activities that may degrade water quality in Turnagain Arm include discharge from sewage treatment facilities and runoff from the Seward Highway. Gold mining activities historically occurred at the several tributaries such as Resurrection, Bear, and Sixmile creeks flowing into Turnagain Arm, and a stampede brought over 3,000 prospectors to the area in the late 1800s. (www.alaskastateparks.org). Gold mining in Turnagain Arm does not currently exist on a scale or with methods that would be of concern as a source of pollutants that would impact the CIBW or their prey. Indirect sources of water contamination in the Windy Corner Project Action Area include sewage discharge from Anchorage to the west of Windy Corner and Girdwood to the east, highway runoff from the Seward Highway, and the circulation of polluted waters produced during oil and gas activities elsewhere in Cook Inlet.
Wastewaters entering municipal sewage plants may contain a variety of organic and inorganic pollutants, metals, nutrients, sediments, bacteria, viruses, and other emerging pollutants of concern (EPOCs). Wastewater from the Municipality of Anchorage receives primary treatment, while Girdwood wastewaters undergo tertiary treatment (Moore et al. 2000). Primary treatment means that only materials that can easily be collected from the raw wastewater (such as fats, oils, greases, sand, gravel, rocks, floating objects, and human wastes) are removed, usually through mechanical means. Wastewater undergoing secondary treatment is further treated to substantially degrade the biological content of the sewage (such as in human and food wastes). Tertiary treatment plants utilize primary and secondary treatment methods, but use additional technologies to increase the quality of the effluent discharge. The discharge from Anchorage is authorized by a National Pollution Discharge Elimination System (NPDES) permit, and by a Clean Water Act 301(h) Waiver issued by the EPA exempting the facility from requirements of the Clean Water Act. Monitoring programs required by the NPDES permit include assessment of the receiving waters in terms of water quality, biological and physical health, and toxins control. Little is known about EPOCs and their effects on CIBW. EPOCs include endocrine disruptors (substances that interfere with the functions of hormones), pharmaceuticals, personal care products, and prions (proteins that may cause an infection), among other agents that are found in wastewater and biosolids. The impacts on CIBW from many pollutants in wastewater entering Cook Inlet have not been analyzed and cannot be defined at this time.
Highway runoff is a significant source of water quality degradation. Various solids, metals, and nutrients present in highway runoff have been identified as degraders of water quality. Particulate matter may transport other pollutants to receiving waters. Heavy metals are known to adsorb to fine particles and other solids, where they may be released when exposed to water, and become a threat to aquatic life (Young et al. 1996).
There are no records of contaminated sites occurring between milepost 105-107 of the Seward Highway. Expanding past this two-mile project corridor, two Department of Environmental Conservation (DEC) contaminated site records exist:

Biological Assessment of the Cook Inlet Beluga Whale (Delphinapterus leucas) for the Seward Highway MP 105-107 Windy Corner Project
Page 65
• Milepost 98.6 – Pipeline Leak (File ID: 2111.38.003) – Soils, groundwater, and nearby wetlands showed signs of a previous spill of an unknown amount. The current status of this site is “active.”
• Milepost 101.5 – Indian Pump Station (File ID: 2102.38.046) – Soil and groundwater was contaminated by a valve failure on an oil pipeline between Portage and the Port of Anchorage. The site was remediated and the current status is “clean-up complete-institutional controls.”
It is often cited that CIBW appear to have lower levels of certain contaminants (i.e. polychlorinated biphenyls [PCB], chlorinated pesticides, and heavy metals) stored in their bodies than do other populations of belugas (Becker et al. 2000, 2001); however, the impacts of contaminants on belugas in Cook Inlet are unknown (NMFS 2008a).The URS Corporation (2010) conducted a literature review of the potential chemical exposures for belugas in Cook Inlet and despite limited site-specific data, produced a list of 19 chemical classes that they felt warranted closer evaluation in regards to their potential adverse effects on CIBW. Wetzel et al. (2010) assessed the concentrations of polycyclic aromatic hydrocarbons (PAHs) in archived CIBW tissue as well as from Upper Cook Inlet sediment and fish tissue samples. PAHs can derive from multiple sources, including oil and gas development. PAHs are suspected to be a contributing factor to high levels of cancer and deaths of beluga whales in the St. Lawrence Estuary. PAH levels in Cook Inlet sediment samples were moderately high compared to other areas with known environmental problems with PAH contamination. A highly toxic form of PAH, benzo-a-pyrene, was detected at low levels in all sample locations. Fish tissue samples exhibited the same general pattern in terms of types and concentrations of PAHs as did the sediment although they contained little or no benzo-a-pyrene. Beluga tissue from Cook Inlet exhibited much higher PAH levels when compared to the tissue of belugas from the MacKenzie River Delta. Wetzel et al. (2010) concluded that belugas in Cook Inlet appear to be bioaccumulating PAHs and expressed concerns regarding the potential impacts to the CIBW population from this class of chemicals.
The Alaska Department of Environmental Conservation has designated Upper Cook Inlet as a Category 3 waterbody within the Clean Water Act Section 303(d). This categorization is due to insufficient information available to determine water quality (ADEC 2010). There is insufficient information to evaluate the presence or levels of water-born pollutants that may be harmful to CIBW in the Windy Corner Project Action Area.
3. Oil and gas
Oil and gas exploration and production do not occur in Turnagain Arm (Figure 28). An oil spill anywhere in Cook Inlet has the potential to affect CIBW and critical habitat in Turnagain Arm and the Windy Corner Project Action Area, as does the discharge of waters contaminated during production activates at the oil and gas platforms found elsewhere in Cook Inlet. Between 1965 and 1975, there were 20,000 barrels of oil spilled in the Inlet, and between 1976 and 1979, around 10,000 barrels were spilled (MMS 1996 in NMFS 2000). In 1987, the tanker Glacier Bay struck a rock and spilled an estimated 1350–3800 barrels of crude oil into the inlet (USCG 1988 in NMFS 2000). A total of 295 minor oil spills from vessels occurred in Cook Inlet from January 1992 through August 2006, in addition to 333 spills from Cook Inlet oil production platforms (Eley and Nuka 2006). Seismic noise produced by oil and gas activities elsewhere in Cook Inlet

Biological Assessment of the Cook Inlet Beluga Whale (Delphinapterus leucas) for the Seward Highway MP 105-107 Windy Corner Project
Page 66
also has the potential to reach Turnagain Arm and the Windy Corner Project Action Area. Underwater noise produced by seismic activity is identified as one of the loudest sound sources that could potentially impact marine mammals (NMFS 2008a).

Biological Assessment of the Cook Inlet Beluga Whale (Delphinapterus leucas) for the Seward Highway MP 105-107 Windy Corner Project
Page 67
Figure 28: Map of Cook Inlet oil and gas activities in 2014.

Biological Assessment of the Cook Inlet Beluga Whale (Delphinapterus leucas) for the Seward Highway MP 105-107 Windy Corner Project
Page 68
D. Coastal Development
CIBW are unique among protected marine mammal species in Alaska given that their habitat is in close proximity to the greatest concentration of Alaska’s human population and the largest urban area in the state. In 2013 (the most-recent census year available), the human population of the State of Alaska was 736,399 individuals, with 301,134 people in the Municipality of Anchorage, 96,074 in the Matanuska-Susitna Borough, and 56,862 in Kenai Peninsula Borough3. The human population in this region has been increasing; between 1980 and 2010 the population grew by 67%4. CIBW are not uniformly distributed throughout Cook Inlet, but are predominately found in near-shore waters, adjacent to areas of high human activity. Where beluga whales must compete with people for use of nearshore habitats, coastline development (both construction and operation of a project) leads to the direct loss of habitat. Indirect alteration of habitat may occur due to increased vessel traffic, in-water noise, and discharges that affect water quality. While most beluga habitat in Cook Inlet remains relatively intact, extensive sections of Turnagain Arm shoreline have been developed (e.g., rip rap and railroad construction), as have the shorelines of the Anchorage area (NMFS 2008a). Coastal development in Cook Inlet with the potential to affect CIBW and their habitat includes tidal energy projects, hydroelectric dams, mining and associated terminals, rock quarries, forestry, farming, military activities, shipping, sub-sea cable laying for fiber optics and wind turbines, liquid natural gas (LNG) pipelines, port expansion, dock and trestle construction, bridge construction, highway expansion, coastal trail extension, and dredging operations (NMFS 2008a; Figure 29).
3 http://www.labor.state.ak.us/research/census/home.htm 4 http://quickfacts.census.gov/qfd/states/02/0203000.html

Biological Assessment of the Cook Inlet Beluga Whale (Delphinapterus leucas) for the Seward Highway MP 105-107 Windy Corner Project
Page 69
Figure 29: General geographic distribution of current or proposed human activities in Cook Inlet. The map was created in 2011 but the information still generally applies,
although proposed Seward Highway projects run the length of Turnagain Arm.
The majority of the aforementioned activities do not occur in Turnagain Arm. For example, port facilities in Cook Inlet are found at Anchorage, Point MacKenzie, Tyonek, Drift River, Nikiski, Kenai, Anchor Point, and Homer (NMFS 2008a). Ports and their associated activities of frequent dredging and vessel traffic do not exist in Turnagain Arm. There have been public scoping meetings for a tidal turbine project with an associated constructed island at the mouth of Turnagain Arm (rca.alaska.gov//Filings/Docket P-13509) and a proposed causeway spanning Turnagain Arm connecting Anchorage and the Kenai Peninsula; however, these projects do not appear to have progressed beyond the scoping and preliminary permit phase. Sources of historic and present-day coastal development in Turnagain Arm primarily include highway and railroad improvement projects along the Seward Highway.
The Alaska Railroad carries both freight and passengers along Turnagain Arm. It is owned by the State of Alaska and operated by the ARRC. Railroad construction in Seward began in 1903. The Turnagain Arm section of the Alaska Railroad was constructed 1915–1918. The Seward Highway is 127 miles (201 km) long and links Anchorage and Seward. It was completed in 1951 and paving occurred in 1952 (www.alaskastateparks.org). Railroad and highway construction,

Biological Assessment of the Cook Inlet Beluga Whale (Delphinapterus leucas) for the Seward Highway MP 105-107 Windy Corner Project
Page 70
expansion, and maintenance have involved rock blasting, filling of mudflats, and rip-rap placement along the north shore of Turnagain Arm.
E. Vessel Traffic
Vessel traffic may affect the CIBW population through increased collision risk, noise, and harassment, including habitat displacement due to high vessel traffic in feeding or calving habitats (NMFS 2008a). Several dead and live photo-identified CIBW bear signs of ship strike (McGuire et al. 2014).
Shipping traffic in and out of Cook Inlet is substantial. The following statistics on vessel traffic come from Eley and Nuka (2006): from January 2005 through mid-July 2006, 704 deep-draft vessels called at ports in Cook Inlet; ~200 tug/barge trips associated with fuel oil traveled into Cook Inlet; and approximately 500 to 900 commercial fishing vessels operate in Cook Inlet from mid-May to mid-September. Shipping lanes for large vessels do not occur in Turnagain Arm or the Windy Corner Project Action Area. The shipping lane for large vessels transiting between the Lower Inlet and the Port of Anchorage or Port MacKenzie skirt the west side of Fire Island and do not enter Turnagain Arm. Large vessels, including tugs and barges, may occasionally enter Turnagain Arm for survey/construction support, as occurred in 2013 during the geotechnical surveys for the Windy Corner Project when tideland geotechnical investigations were conducted from a barge resting on the Turnagain Arm seafloor and test holes were drilled out to 200 ft (60.9 m) from shore with an 8 in (20.3 cm) diameter hollow stem auger.
Small vessel traffic in Turnagain Arm is very sparse due to dangerous boating conditions (i.e., shallow mudflats, strong tides) and is usually associated with recreational fishing at the TwentyMile and Placer rivers, where there are boat launches for small vessels. Windsurfers, paddle boarders, and jet skiers also use Turnagain Arm on a seasonal basis.
F. Tourism and Whale Watching
Commercial boat-based whale watching for CIBW does not currently exist in Cook Inlet. Scenic overflights of Turnagain Arm from Anchorage and Girdwood airports do occur, and have the potential to disturb CIBW if pilots closely approach and circle whales. Land-based whale watching for CIBW is quite common for visitors and locals alike along Turnagain Arm during the ice-free months, especially in late summer and early fall, but these land-based activities do not impact the CIBW or their habitat.
G. Noise
Noise is generally defined as a sound that causes a disturbance. The following overview of sound is summarized from Richardson et al. 1995. Sound is vibrations that are heard. Sound waves travel through air or water as vibrations of particles, and hearing results from the vibrations exerting pressure on the eardrum. Frequency is the rate of vibration, measured in cycles per second (hertz, abbreviated as Hz) and describes the sound’s pitch. The loudness of a sound is referred to as intensity, and is measured in dB using a logarithmic scale. The sound pressure level (SPL) is a change in pressure caused by a sound wave. Root mean square (rms or RMS) refers to average pressure over the duration of a single pulse. Sound pressure is measured in micropascals (µP). Sound pressure levels are relative measurements, and are reported referenced

Biological Assessment of the Cook Inlet Beluga Whale (Delphinapterus leucas) for the Seward Highway MP 105-107 Windy Corner Project
Page 71
to a standard of 1 µPa RMS SPL. Hence, “X decibels referenced to 1 microPascal” is notated as X dB re 1 µPa RMS SPL.
In general, Cook Inlet is considered a noisy environment, both from the high ambient noise of high current and heavy glacial silt, as well as the many sources of anthropogenic noise (Blackwell and Greene 2003). Prior to 2014, baseline levels of ambient underwater noise had been measured in several locations in Upper Cook Inlet by Blackwell and Greene (2003), but not in Turnagain Arm. DOT&PF commissioned measurements of ambient underwater sounds levels at Windy Corner in August 2014 (Burgess 2014; Appendix 1). The study measured sound characteristics at different tidal stages but under otherwise quiet conditions. Acoustic measurements were conducted using a small, self-contained acoustic recorder suspended from a remote-controlled boat that brought it to distances of 161–262 ft (49–80 m) from shore, after which it was allowed to drift while recording and then retrieved by tether. The measurements showed ambient sound pressure levels at high and low tide to be 74 and 81dB re 1 µPa respectively, as computed over a 40Hz–9.3 kHz band. These levels were quieter than those measured at ebb and floodtide, which measured 103 and 108 dB re1µPa, respectively. High tide was quieter than any other part of the tide cycle, with low tide as the next-quietest. Rising tide was the noisiest part of the tide cycle at Windy Corner. Ambient sound levels at high and low tide were quieter than expected for such an active body of water, although still louder than the quietest levels recorded at other locations in Cook Inlet by Blackwell and Greene (2003). Because much of Upper Cook Inlet is characterized by shallow depth and sand/mud bottoms, it is a poor environment for propagating sound (Blackwell and Greene 2003).
Potential sources of anthropogenic underwater noise in Turnagain Arm and the Windy Corner Project Action Area include vehicular noise along the highway, aircraft noise from commercial, recreational and military overflights, railroad noise, the rare vessel navigating Turnagain Arm, and seismic operations associated with oil and gas exploration elsewhere in the Inlet. One low-altitude overflight of a small single-engine aircraft occurred during recording at Windy Corner during the falling tide, and associated sounds were present in the underwater acoustic recordings (Burgess 2014, Appendix 1). Underwater noise produced by seismic activity is identified as one of the loudest sound sources that could potentially impact marine mammals (NMFS 2008a).
It is challenging to characterize the acoustic baseline of Cook Inlet for CIBW. It may be that for a species such as CIBW whose primary sense is hearing, the combination of inherently poor acoustics and high noise of Cook Inlet result in them already living in an acoustically stressful environment. However, CIBW critical habitat PCE 5 is defined as the absence of in-water noise at levels resulting in the abandonment of habitat by CIBW. Under current, pre-project baseline conditions, there is no indication that ambient noise levels in the action area have caused CIBW to abandon or avoid their habitats. Therefore, because CIBW are regularly there on a seasonal basis, PCE 5 exists under baseline conditions and is by definition healthy/intact in the Windy Corner Project Action Area.
H. Scientific Research on CIBW in Turnagain Arm
Aerial surveys of the CIBW population were conducted in the late 1970s by ADF&G and annually since 1993 by NMFS (Hansen and Hubbard 1999; Rugh et al. 2010; Shelden et al. 2012, 2011, 2010a,b, 2009a, 2009b, 2008a,b). In 1993, NMFS began annual aerial surveys of the

Biological Assessment of the Cook Inlet Beluga Whale (Delphinapterus leucas) for the Seward Highway MP 105-107 Windy Corner Project
Page 72
CIBW population. These surveys occur in early June (except for late July in 1995), include the upper, middle, and lower sections of the Inlet, and are stratified to focus survey effort in the areas of the Upper Inlet where belugas are typically found in June. Areas surveyed include Turnagain Arm, and surveys are conducted at low enough altitudes to require a Scientific Research Authorization for incidental take by harassment (from noise).
NMFS live-captured 18 belugas between 1999 and 2002 in order to attach satellite transmitters to track the whales and learn more about movement patterns and habitat use. Whales were tagged in August, and nine whales logged movements into December and four into the following March (Hobbs et al. 2005), although three whales were presumed to have died as a result of the capture and/or tagging efforts. The last tag transmitted in March 2003, and several of these whales are still identified by their tag scars. Tagged whales were tracked moving throughout Turnagain Arm, and several whales with tagging scars have been seen in Turnagain Arm as recently as fall 2014 (McGuire et al. 2014; McGuire unpublished data). A NMFS MMPA/ESA Scientific Research Permit required to capture and tag CIBW is currently held by the NMFS NMML, although capture and tagging are not taking place at the present time.
The LGL CIBW Photo-ID Project has a NMFS MMPA/ESA Scientific Research permit allowing harassment by vessel approach to photograph CIBW for identification and tracking purposes. Photo-id surveys are conducted from vessels and from land. Vessel-based surveys are occasionally conducted in the far western end of Turnagain Arm (i.e., Chickaloon Bay and up to Gull Rock), but the survey vessel does not travel further up Turnagain Arm because of dangerous boating conditions. The majority of photo-id surveys conducted in Turnagain Arm are land-based and do not require a research permit because no harassment is involved.
Stranding response to live and dead stranded marine mammals in general, and of endangered CIBW in particular, is regulated by NMFS. Designated responders in the Alaska Marine Mammal Stranding Network may respond to CIBW strandings if activities are first authorized by NMFS on a per-case basis; these activities fall under the umbrella of the research permit held by NMFS.
I. Additional Environmental Baseline Considerations
1. Strandings
Although stranding is classified by the Conservation Plan (NMFS 2008a) as a natural threat, it should be noted that strandings may occur as a direct or indirect result of human activities. CIBW strandings have the potential to be brought about by a behavioral or navigational disturbances resulting from vessel interference, loud noise, avoidance of hunting (by people or killer whales), inability to swim or navigate because of exposure to toxins or pathogens, human-caused changes to bathymetry or other alternations that would block migration routes. Once a whale strands, death may result from stress and/or hyperthermia. Without the buoyancy provided by the water, the whale’s weight places additional stress on internal organs which can make breathing difficult. An extensive network of blood vessels within the flukes and flippers allows beluga whales to radiate excess body heat to the environment. If the flukes and flippers are out of the water, this network cannot function properly and internal body temperature rises resulting in hyperthermia. Beluga whale strandings in Upper Cook Inlet are not uncommon, with a majority

Biological Assessment of the Cook Inlet Beluga Whale (Delphinapterus leucas) for the Seward Highway MP 105-107 Windy Corner Project
Page 73
occurring in Turnagain Arm (NMFS 2008a), although this may be in part because road access along the Seward Highway affords greater opportunities for sightings compared to elsewhere in Cook Inlet. NMFS has reports of over 700 whales stranding in Upper Cook Inlet since 1988, with mass strandings (defined as involving two or more whales) primarily occurring in Turnagain Arm. For example, in 2003 there were six live-stranding events and five of these occurred in Turnagain Arm (one in April, one in August, two in September, and one in October; email from Mandy Migura, NMFS AK Region, September 03, 2013). Although mass strandings of CIBW have often coincided with extreme tidal fluctuations (“spring tides”) or killer whale sighting reports (Shelden et al. 2003), during informal consultations on the Windy Corner project, NMFS expressed concerns about a mass stranding of CIBW in Turnagain Arm in August 2003 that resulted in five CIBW mortalities and may have been associated with blasting activities along Turnagain Arm that continued into October of 2003. NMFS has not officially correlated the two events, but the possibility must be considered and acknowledged as a concern. Other anthropogenic noise sources, specifically, naval mid-range sonar, have been linked to mass strandings of otherwise healthy cetaceans. In a review of potential anthropogenic stressors experienced by CIBW, Norman (2011) hypothesized that belugas may react to noise from explosions by fleeing to shallower waters where they would consequently have a higher chance of stranding. Strandings definitively resulting from exposure to anthropogenic noise sources have not been recorded in Cook Inlet (76 FR 58473), although tests that would rule out acoustic trauma have not been conducted on the majority of stranded CIBW.
J. Cumulative Effects
While it is difficult to quantify or characterize individual impacts of human actions on CIBW and critical habitat, it is even more difficult to quantify the potential impacts that a combination of actions, either concurrently or sequentially, would have. Exposure to any given stressor, even at low levels, may predispose individual CIBW to greater susceptibility to mortality or long-term effects (for example, reproductive failure) from other stressors. For example, stressors of any kind tend to increase cortisol levels, which in turn tend to reduce immune response. Environmental factors can also interact with other factors to impact CIBW health. For example, a reduction in availability of preferred, high-calorie prey will reduce individual body condition, increasing susceptibility to parasites, disease, and predation, and possibly reduce reproductive potential. In addition, periods of restricted food access can cause belugas to use their fat reserves, resulting in the release into the blood stream of contaminants that may have bioaccumulated in that tissue (Couillard et al. 2008a; Couillard et al. 2008b). The additive effects of multiple noise sources, as well as the combination of noise and other stressors, are of particular concern, although this field remains poorly understood (NRC 2005, Kuczaj 2007). Cumulative impacts have been a long-standing issue in the debate over noise effects on marine mammals (Clark et al. 2009).
Thus, while the environmental baseline of Turnagain Arm and the Windy Corner Project Action Area suggest that these areas appear to be relatively intact and healthy for CIBW at the present time, poor and deteriorating conditions elsewhere in the Inlet could result in CIBW being more susceptible to minor stressors encountered in the project area than would otherwise be the case. Potential anthropogenic threats to CIBW exist in the waters of Turnagain Arm as well as throughout Cook Inlet, and because all of the individuals in the CIBW population move throughout the Inlet seasonally, whales are likely exposed to multiple potential threats. For
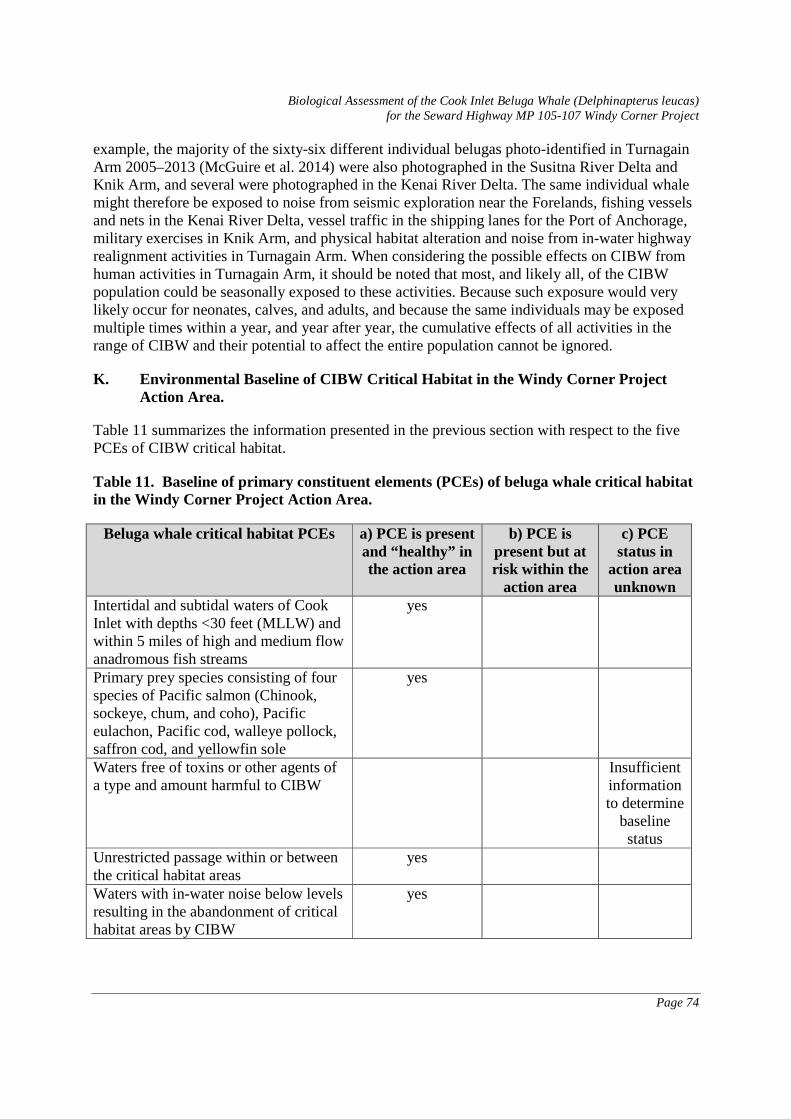
Biological Assessment of the Cook Inlet Beluga Whale (Delphinapterus leucas) for the Seward Highway MP 105-107 Windy Corner Project
Page 74
example, the majority of the sixty-six different individual belugas photo-identified in Turnagain Arm 2005–2013 (McGuire et al. 2014) were also photographed in the Susitna River Delta and Knik Arm, and several were photographed in the Kenai River Delta. The same individual whale might therefore be exposed to noise from seismic exploration near the Forelands, fishing vessels and nets in the Kenai River Delta, vessel traffic in the shipping lanes for the Port of Anchorage, military exercises in Knik Arm, and physical habitat alteration and noise from in-water highway realignment activities in Turnagain Arm. When considering the possible effects on CIBW from human activities in Turnagain Arm, it should be noted that most, and likely all, of the CIBW population could be seasonally exposed to these activities. Because such exposure would very likely occur for neonates, calves, and adults, and because the same individuals may be exposed multiple times within a year, and year after year, the cumulative effects of all activities in the range of CIBW and their potential to affect the entire population cannot be ignored.
K. Environmental Baseline of CIBW Critical Habitat in the Windy Corner Project Action Area.
Table 11 summarizes the information presented in the previous section with respect to the five PCEs of CIBW critical habitat.
Table 11. Baseline of primary constituent elements (PCEs) of beluga whale critical habitat in the Windy Corner Project Action Area.
Beluga whale critical habitat PCEs a) PCE is present and “healthy” in the action area
b) PCE is present but at risk within the
action area
c) PCE status in
action area unknown
Intertidal and subtidal waters of Cook Inlet with depths <30 feet (MLLW) and within 5 miles of high and medium flow anadromous fish streams
yes
Primary prey species consisting of four species of Pacific salmon (Chinook, sockeye, chum, and coho), Pacific eulachon, Pacific cod, walleye pollock, saffron cod, and yellowfin sole
yes
Waters free of toxins or other agents of a type and amount harmful to CIBW
Insufficient information to determine
baseline status
Unrestricted passage within or between the critical habitat areas
yes
Waters with in-water noise below levels resulting in the abandonment of critical habitat areas by CIBW
yes

Biological Assessment of the Cook Inlet Beluga Whale (Delphinapterus leucas) for the Seward Highway MP 105-107 Windy Corner Project
Page 75
V. EFFECT OF THE ACTION
A. Overview of Effects Section
This section describes the potential effects of the Windy Corner Project on the endangered CIBW and their critical habitat. Effects of the proposed action are defined as in the ESA (50 CFR 402.02):
“…the direct and indirect effects of an action on the species or habitat together with the effects of other activities that are interrelated or interdependent with that action, that will be added to the environmental baseline. The environmental baseline includes the past and present impacts of all federal, state, or private actions and other human activities in the action area, the anticipated impacts of all proposed federal projects in the action area that have already undergone formal or early Section 7 consultation, and the impact of State or private actions which are contemporaneous with the consultation process.”
The different types of effects that need to be analyzed are further defined:
Direct effects – Those immediate effects caused by the proposed action and occurring concurrently with the proposed action.
Indirect effects – Those effects that are caused by the proposed action and are later in time but still are reasonably certain to occur.
Cumulative effects – As defined in the ESA, cumulative effects are future state, tribal, local, or private activities, not involving federal activities, which are reasonably certain to occur within the action area of the proposed action.
Direct and indirect effects of the Windy Corner Project on CIBW are discussed in Section V.B. The direct and indirect effects of the Windy Corner Project on CIBW critical habitat are discussed in Section V.C. Cumulative effects within the Windy Corner Project Action Area are discussed in Section V.D. Existing and potential mitigation measures are identified and discussed within each section. A determination of effect is provided in Section VI of this document.
B. Direct and Indirect Effects of the Windy Corner Project on CIBW
The Conservation Plan for the Cook Inlet Beluga Whale (NMFS 2008a) identified a number of natural and anthropogenic threats to CIBW (discussed in Section IV of this BA). Those threats that will not be affected by the actions of the Windy Corner Project will not receive further analysis in this BA. Specifically, the natural threats unaffected by the proposed action include: predation, parasitism, disease, and environmental change (i.e., climate change). The anthropogenic threats that will not be considered in the following analysis of possible effects from the proposed action at Windy Corner include: subsistence harvest of CIBW, poaching, fishing (personal use, subsistence use, or commercial), research, and oil and gas development.
Potential effects relevant for this BA occurring in the action area during the Windy Corner Project include:

Biological Assessment of the Cook Inlet Beluga Whale (Delphinapterus leucas) for the Seward Highway MP 105-107 Windy Corner Project
Page 76
• habitat alteration • pollution • reduction in availability or quality of prey species • increased noise • illegal harassment • increased risk of injury or mortality
1. Direct and indirect effects of Windy Corner Project from habitat alteration
The proposed project requires the permanent placement of approximately 2,024,000 c.y (1,547,500 cu m) of fill material in the intertidal area, resulting in a loss of 38 ac (15.4 ha) of mudflats (Figure 30), with a maximum fill distance into the water of 450 ft (137 m). The term mudflats refers to estuarine, intertidal, flat, and regularly flooded wetlands composed primarily of inorganic silt, without vegetated areas, except for the algae that may occur on riprap and rocky outcroppings. A wetland delineation conducted in 2001 determined that tidal mudflats are the only type of wetland in the project area (DOT&PF 2013a).
Figure 30: Location of the area that will be filled during the Windy Corner Project. A total of 38 acres (15.4 hectares) will be filled.
The proposed fill area of the Windy Corner Project does not contain anadromous rivers or streams, nor will it block access to these waters. Because fill activities for the Windy Corner Project will take place along the length of the existing shoreline, and not perpendicular to the

Biological Assessment of the Cook Inlet Beluga Whale (Delphinapterus leucas) for the Seward Highway MP 105-107 Windy Corner Project
Page 77
shoreline or jutting out into Turnagain Arm, the habitat alteration from the Windy Corner Project is not anticipated to negatively impact fish passage within Turnagain Arm.
Blasting at Windy Corner and the two material sites will occur entirely on land, on the north side of the existing Seward Highway, and will not alter in-water habitat. Alteration of aquatic habitat will result from the blasting of Gorilla Rock and subsequent fill around it (Figure 31). At baseline conditions, Gorilla Rock juts into the intertidal area and potentially provides fish habit by way of in-water structure (Figure 32), a relatively deep pool, and back-eddies; similar aquatic environments such as the base of Cairn Point in Knik Arm have been described as fish habitat and feeding habitat for belugas (Markowitz and McGuire 2007).
Figure 31: Gorilla Rock (center) and associated mudflats during low tide. Note waterline from a previous high tide (image 2014 Google earth).

Biological Assessment of the Cook Inlet Beluga Whale (Delphinapterus leucas) for the Seward Highway MP 105-107 Windy Corner Project
Page 78
Figure 32: Gorilla Rock and adjacent deep-water cove, southeast-facing views.
Mitigation of habitat alteration
• During the planning stages of the Windy Corner Project, DOT&PF consulted informally with NMFS and conducted resource agency technical advisory group (TAG) meetings. As a result of discussions, DOT&PF revised the project design, shifting the proposed highway and railroad realignments to be much closer to shore to minimize the area of Turnagain Arm that the project would fill.
• Mitigation for the proposed fill is anticipated to consist of an in-lieu-fee, as determined by the Anchorage Wetlands Debit-Credit Method, however, this will be determined as part of the Section 10/404 permitting process.
• Fill activities will not occur during critical salmon and eulachon spawning and outmigration periods (March 1–June 30).
• During construction, the fill site will be graded each work shift to prevent ponding on the fill surface that could trap fishes between high tides.

Biological Assessment of the Cook Inlet Beluga Whale (Delphinapterus leucas) for the Seward Highway MP 105-107 Windy Corner Project
Page 79
• Fill activities will not occur during those times of years that CIBW are most likely to be in the project area (April–early June, and August–October). The April–early June closure period is already covered by the March 1–June 30 closure period to protect migrating fish. Details of the CIBW mitigation and monitoring plan may be found in Appendix 3.
• Fill will be placed when the site is de-watered during low tide, when CIBW are less likely to be in the project area. Details of the CIBW mitigation and monitoring plan may be found in Appendix 3.
• Fill activities will only take place when Protected Species Observers (PSOs) are on duty. Details of the CIBW mitigation and monitoring plan may be found in Appendix 3.
• Fill activities will cease if CIBW or other marine mammals are seen within the 4921 ft (1,500 m) safety zone. Details of the CIBW mitigation and monitoring plan may be found in Appendix 3.
2. Direct and indirect effects of Windy Corner Project from pollution
Air pollution
The Windy Corner Project will generate a minor amount of air pollution from project vehicles used during staging and construction, and from blasting activities. The air pollution from project vehicles will have negligible impacts on existing air quality in the proposed work area relative to the average daily traffic volume, although the public may notice diesel exhaust emissions from construction vehicles. The project area is considered by the Alaska Administrative Code (AAC) 18 AAC 50.15 as a Class II area, allowing moderate carbon monoxide pollutant increases unless otherwise designated by the State of Alaska. Impacts to air quality during construction and operation are anticipated to be minimal and temporary. Air pollution from dust created during blasting activities is expected to occur only in the minutes following a blast. No long-term impacts to air quality from the Windy Corner Project are anticipated.
Mitigation of air pollution
• The Contractor will be required to keep all equipment in good operating condition to reduce airborne particulates.
• Methods to control and contain soil and other debris tracked onto the Seward Highway by construction vehicles will be implemented. Watering, sweeping, and/or the use of hydroscopic chemicals will be implemented to minimize dust impacts on haul routes.
• Dust associated with drilling and blasting can be expected at material sites and will be partially controlled with watering.
Water pollution
Temporary water quality degradation will occur during filling of the Turnagain Arm mudflats. The Windy Corner Project may result in a temporary increase in turbidity as highway and railroad embankment construction on the tidal mudflats will disturb silt, resulting in increased

Biological Assessment of the Cook Inlet Beluga Whale (Delphinapterus leucas) for the Seward Highway MP 105-107 Windy Corner Project
Page 80
local turbidity levels. Increased sedimentation can potentially decrease fish feeding efficiency and smother benthic organisms. It should be noted however that naturally occurring (background) suspended silt sediments are high in Turnagain Arm and strong tidal currents constantly move seafloor sediment. Impacts from increased turbidity are expected to be temporary and not pose long-term threats to aquatic organisms adapted to the high ambient turbidity levels in Turnagain Arm.
Fill activities have the potential to suspend contaminants, which if trapped in fill material, could re-suspend in the water column where marine resources could be exposed to them. Water pollution can result in degradation of aquatic habitat and contaminant bioaccumulation in fish and/or CIBW.
As discussed in Section IV, contaminants are a concern for CIBW health and for subsistence use. While it appears CIBW have lower levels of tested contaminants stored in their bodies than do other populations of belugas, the impacts of these contaminants on CIBW is unknown and the presence of many contaminants remains untested. Water pollution from fill materials within the two-mile construction boundary of the Windy Corner Project is anticipated to be minor due to limited geographic scale, limited duration, and the implementation of mitigation measures. Mitigation measures will be taken to ensure that the risk of water contamination from the Windy Corner Project is minimized to the fullest extent possible.
Mitigation of water pollution
• If contamination (e.g., from fuel spills) occurs during construction and construction-related activities, all work in the contaminated area will cease, Alaska Department of Environmental Conservation (ADEC) will be contacted, and the contamination will be handled and/or disposed of according to an ADEC-approved Corrective Action Plan.
• A Storm Water Pollution and Prevention Plan (SWPPP) will be developed for this project in compliance with the Alaska Pollutant Discharge Elimination System (APDES) permit for construction activities. Temporary water quality impacts would be minimized through implementation of erosion and sedimentation control measures, as outlined in the SWPPP.
• Measures will be taken to ensure that fill originates from non-contaminated clean rock. DOT&PF will supply material sites for the road, subgrade structure, and surfacing. If the Contractor elects to use an undeveloped material site, contract language will require the Contractor to acquire all necessary permits and clearances for the site(s) and provide copies to the DOT&PF Project Engineer prior to development. Material from a borrow site that has not received the appropriate permits and clearances will not be accepted for project construction.
• Fill will be placed when the site is de-watered by low tide stages to decrease the amount of sediment introduced into the water column.

Biological Assessment of the Cook Inlet Beluga Whale (Delphinapterus leucas) for the Seward Highway MP 105-107 Windy Corner Project
Page 81
3. Direct and indirect effects of Windy Corner Project from reduction in availability or quality of prey species
The Windy Corner Project has the potential to affect the availability or quality of prey species through several mechanisms, including the loss of mudflat habitat through fill, death or injury to fish from blasting, and avoidance/reduced use of the area by fish as a result of displacement from noise generated by blasting or fill placement. Quality of prey could be decreased via water contamination. Blasting events and their associated potential effects on prey are anticipated to be of an extremely limited scope and duration. Possible contamination of prey from fill materials within the two-mile construction boundary of the Windy Corner Project is anticipated to be minor due to limited geographic scale, limited duration, and the implementation of mitigation measures. The proposed fill area of the Windy Corner Project does not contain spawning beds for prey or anadromous waters, and any anadromous species found in the project area would be transiting through the area in route to or from anadromous streams or rivers.
Mitigation of reduction in availability or quality of prey species
See section V.B.1 (habitat alteration), section V.B. 2. (pollution), and section V.B.4 (noise), for more details on how the Windy Corner Project will mitigate these effects on prey species.
4. Direct and indirect effects of Windy Corner Project from noise
The effects on CIBW from noise produced by the Windy Corner Project during construction activities (i.e., blasting, filling, and operation of machinery) and from any associated vessel traffic could include one or more of the following: masking of natural sounds, interrupted or altered behavior, behavioral disturbance leading to displacement and altered habitat use, tolerance, temporary or permanent hearing impairment, and non-auditory physical or physiological effects such as stranding or increased stress levels (Richardson et al. 1995; Nowacek et al. 2007; Southall et al. 2007).
The manner in which sound from Windy Corner Project activities may affect CIBWs depends on the SPL of the sound, but also on numerous other factors. The SPL at the location where the sound is received by a marine mammal depends on the distance of the animal from the sound source as well as the water depth and bathymetry. How a particular SPL from a noise source will affect a marine mammal will also depend on the frequency range of the sound and the hearing ability of the animal in that frequency range. The level of aquatic background noise can also affect a marine mammal’s ability to hear human-made sound. Underwater industrial sounds must have levels equal to or greater than both the ambient noise levels at the corresponding frequencies and the hearing threshold of the animal at that frequency in order to be detected by that animal. Sounds generally need to be at least ~20–30 dB stronger than the detection thresholds and/or ambient noise levels to elicit notable changes in the behavior or distribution of animals sensitive to those sounds (Richardson et al. 1995). Animals that are frequently exposed to certain types of sound will sometimes tolerate sound levels as much as ~40–60 dB above ambient or detection levels before they change their behavior or distribution. Apparent indifference to strong sounds often occurs when the sounds are familiar and when the animals have learned that the sound is not associated with any negative consequences. This learning

Biological Assessment of the Cook Inlet Beluga Whale (Delphinapterus leucas) for the Seward Highway MP 105-107 Windy Corner Project
Page 82
process is called habituation. Alternatively, animals may become less tolerant of a sound with repeated exposure, in a process called sensitization.
Masking
Masking refers to the obscuring of sounds of interest by interfering sounds, generally at similar frequencies (Richarson et al. 1995). This is of concern if the noise generated by the Windy Corner Project were to mask a beluga’s ability to detect biologically important sounds, such as those produced during echolocation, or by other belugas, prey, or predators.
The effect of shipping noise in the acoustic environment of the endangered SLE belugas was studied by Gervaise et al. (2012). Noise from car ferries and a seasonal whale-watching fleet was analyzed. The study found both beluga communication and echolocation bands were dramatically affected by these noise sources. Based on the background noise levels, spectra, and periodicity reported, and assuming no behavioral or auditory compensation, beluga communication and echolocation signals could be masked 50% of the time with a reduction of potential communication ranges to less than 30% of their values under natural ambient noise conditions. Similarly, echolocation range could be reduced to 80% of the value under natural ambient noise conditions. The study concludes that noise from these sources could easily limit long-range communication among scattered individuals or pods and affect echolocation efficiency in all exposed belugas.
Kendall (2010) speculated that masking of CIBW whistles may have occurred during construction of the marine terminal expansion at the Port of Anchorage; this was based on the fact that only echolocation clicks were detected during a passive acoustic survey.
Behavioral effects
Underwater sounds may cause changes in behavior of marine mammals. Behavioral effects on marine mammals could include temporary displacement from habitat (avoidance), altered direction of movement, and changes in resting or feeding cycles, alertness, vocal behavior, navigational and communication abilities, swimming, or diving behavior. The most common marine mammal response to construction noise would likely be avoidance, although it is possible animals could be attracted to the noise. Avoidance responses may be strong if marine mammals move rapidly away from the source, or weak if movement is only slightly deflected away from the source. In extreme cases, behavioral changes could lead to stranding events.
The reactions of individual marine mammals to noise may vary depending on multiple factors, including species, state of maturity, experience, activity, reproductive state, and time of day (Richardson et al. 1995; Wartzok et al. 2004; Southall et al. 2007; Weilgart 2007). This variability in responses makes it difficult to predict the reaction distance from a noise source for an individual marine mammal or the noise level that will consistently result in a reaction. Few studies have quantified marine mammal reactions to noise exposure and these studies have involved individual or small numbers of animals. Population-level impacts have not been determined. If a marine mammal does react briefly to an underwater sound by changing its behavior or moving a small distance, the impacts of the change are unlikely to be significant to the individual, let alone the stock or population. However, if a sound source displaces marine

Biological Assessment of the Cook Inlet Beluga Whale (Delphinapterus leucas) for the Seward Highway MP 105-107 Windy Corner Project
Page 83
mammals from an important feeding or breeding area for a prolonged period, impacts on individuals and populations could be quite significant (e.g., Lusseau and Bejder 2007; Weilgart 2007).
Beluga whale responses to industrial activity are quite variable, ranging from tolerance to extreme sensitivity, depending on the whale’s activity, its previous exposure to industrial activities, its habitat, and the type of industrial activity. Research on beluga responses to explosives do not exist. There are a few studies examining beluga whale response to pile driving. Because blasting and impact pile driving are both classified as impulsive sounds, results from impact pile driving studies may be instructive when assessing effects from blasting. During Phase 1 (pre-pile driving) of the Port of Anchorage marine terminal expansion in 2006, 80% of beluga sightings occurred within 1640 ft (500 m) of construction activities, and 64% occurred within the footprint of the project area (Markowitz and McGuire 2007). During 2007–2009 (with pile driving), 29–46% of beluga whale sightings were within the project area (Cornick and Kendall 2008a, b; Cornick et al. 2010); however, no beluga whales were seen during pile driving activities in 2007 (Cornick and Kendall 2008a). Although preliminary data showed no behavioral changes or avoidance responses by belugas during in-water pile driving or construction activities for the marine terminal (Cornick and Kendall 2008b, Cornick et al. 2010; Kendall et al. 2009), further examination of the pre-construction (2005–2007) and construction (2008–2009) periods showed significant differences in sighting duration, behavior, group composition, and group formation between pre-construction and pile-driving periods (Kendall 2010). The sighting duration decreased from 35 ± 5 min during pre-pile driving to 18 ± 3 min during pile driving activities. Beluga whales were more often seen traveling during pile driving activities, and diving and suspected feeding behavior decreased. Beluga pods were more dispersed during pile driving activities compared to pre-construction, and more lone individuals were sighted. However, no significant differences in beluga whale distribution were apparent, even when pile driving activity quadrupled from one year to the next (Kendall 2010). Passive acoustic recordings during 2009 showed that beluga click rates were higher during periods with construction noise compared to without; however, this difference was not significant (Kendall 2010). Kendall (2010) suggests that the decreased sighting duration, increased traveling, increase in sightings distance from the construction site, as well as, the reduction in click rates may indicate slight avoidance behavior by belugas during pile driving activities. When beluga whale vocal behavior was examined, click rates tended to be higher during periods without construction activity, but this difference was not statistically significant (Kendall 2010).
Evidence exists of other marine mammals being disturbed by implosive noise. During pile driving activities (using both vibratory and impact drivers) at the Nysted offshore wind farm along the coast of Denmark, a significant decrease in harbor porpoise echolocation activities and presumably abundance was reported within the construction area and in a reference area 10–15 km from the wind farm (Carstensen et al. 2006; Teilmann et al. 2008). Porpoises appeared to have left the area during pile driving but returned after several days (Tougaard et al. 2006). Two years after construction, porpoise echolocation activity and presumably abundance were still significantly reduced in the wind farm but had returned to baseline levels at the reference sites (Tougaard et al. 2006; Teilmann et al. 2008).
In 2010, researchers observing a group of CIBW in Knik Arm’s Eagle Bay noted unusual surfacing behavior during a period when explosives were being detonated on shore at Joint Base

Biological Assessment of the Cook Inlet Beluga Whale (Delphinapterus leucas) for the Seward Highway MP 105-107 Windy Corner Project
Page 84
Elmendorf Richardson (McGuire unpublished data). Boat-based observers could see smoke columns (Figure 33) and felt and heard the explosions.
Figure 33: Explosion at Eagle Bay, Knik Arm during military exercises on August 2010. (photo T.McGuire, NMFS MMPA/ESA permit #14210)
Hearing Impairment
Temporary or permanent hearing impairment is a possibility when marine mammals are exposed to very strong sounds. The following subsections summarize available data on noise-induced hearing impairment and non-auditory physical effects.
Temporary Threshold Shift (TTS)—TTS is the mildest form of hearing impairment that can occur during exposure to a strong sound (Kryter 1985). While experiencing TTS, the hearing threshold rises and a sound must be stronger in order to be heard. It is a temporary phenomenon, and (especially when mild) is not considered to represent physical damage or “injury” (Southall et al. 2007; Le Prell 2012). Rather, the onset of TTS is an indicator that, if the animal is exposed to higher levels of that sound, physical damage is ultimately a possibility. The magnitude of TTS depends on the level and duration of noise exposure, and to some degree on frequency, among other considerations (Kryter 1985; Richardson et al. 1995; Southall et al. 2007). For sound exposures at or somewhat above the TTS threshold, hearing sensitivity recovers rapidly after exposure to the noise ends. Extensive studies on terrestrial mammal hearing in air shows that TTS can last from minutes or hours to (in cases of strong TTS) days. More limited data from odontocetes and pinnipeds show similar patterns (e.g., Mooney et al. 2009a,b; Finneran et al. 2010). There are empirical data on the sound exposures that elicit onset of TTS in captive bottlenose dolphins, belugas, and porpoise. The majority of these data concern non-impulse sound, but there are some limited published data concerning TTS onset upon exposure to a single pulse of sound from a watergun (Finneran et al. 2002b) and to multiple pulses from an airgun (Finneran et al. 2011). A detailed review of all TTS data from marine mammals can be found in Southall et al. (2007). The following summarizes some of the key results from odontocetes.

Biological Assessment of the Cook Inlet Beluga Whale (Delphinapterus leucas) for the Seward Highway MP 105-107 Windy Corner Project
Page 85
Finneran et al. (2002b) exposed a beluga whale to single underwater impulsive sounds from a seismic watergun and reported a TTS of 7 and 6 dB at 0.4 and 30 kHz, respectively, ~2 min after exposure to single peak-to-peak pressures of 226 dB re 1 µPa. The received energy level that caused the onset of mild TTS, as measured without frequency weighting, was ~ 186 dB sound energy level (SEL) (Finneran et al. 2002a). Thresholds returned to within 2 dB of the pre-exposure value ~4 min after exposure. Thus, a single impact pile driving or explosive pulse might need to have a received level of ~186 dB re 1 µPa RMS in order to produce brief, mild TTS. Schlundt et al. (2000) reported that stimuli levels between 192 and 201 dB 1 µPa were necessary to induce TTS in bottlenose dolphins and beluga whales when exposed to intense one-second tones at various frequencies; altered behavior in belugas occurred at stimuli between 180 and 196 dB 1 µPa. The available TTS data for a beluga exposed to impulse sound are extremely limited. Follow-up work has shown that the SEL necessary to elicit TTS can depend substantially on frequency, with susceptibility to TTS increasing with increasing frequency above 3 kHz (Finneran and Schlundt 2010, 2011; Finneran 2012).
There has been little study of the rate of recovery from TTS in marine mammals, and in humans and other terrestrial mammals, the available data on recovery are quite variable. Southall et al. (2007) concluded that until relevant data on recovery are available from marine mammals, it is appropriate not to allow for any assumed recovery during the intervals between pulses within a pulse sequence. Additional data are needed to determine the received sound levels at which small odontocetes would start to incur TTS upon exposure to repeated pulses with variable received levels. At the present state of knowledge, it is also necessary to assume that the effect is directly related to total received energy even though that energy is received in multiple pulses separated by gaps. The lack of data on the exposure levels necessary to cause TTS in odontocetes when the signal is a series of pulsed sounds, separated by silent periods, remains a data gap.
Permanent Threshold Shift (PTS).—When PTS occurs, there is physical damage to the sound receptors in the ear. In some cases, there can be total or partial deafness, whereas in other cases, the animal has an impaired ability to hear sounds in specific frequency ranges (Kryter 1985). Physical damage to a mammal’s hearing apparatus can occur if it is exposed to sound impulses that have very high peak pressures, especially if they have very short rise times (i.e., the interval required for sound pressure to increase from the baseline pressure to peak pressure).
Relationships between TTS and PTS thresholds have not been studied in marine mammals, but are assumed to be similar to those in humans and other terrestrial mammals (Southall et al. 2007). Based on data from terrestrial mammals, a precautionary assumption is that the PTS threshold for impulse sounds (e.g., blasting) is at least 6 dB higher than the TTS threshold on a peak-pressure basis, and probably greater than (>)6 dB higher (Southall et al. 2007). The low-to-moderate levels of TTS that have been induced in captive odontocetes and pinnipeds during controlled studies have been confirmed to be temporary, with no measurable residual PTS (Kastak et al. 1999; Schlundt et al. 2000; Finneran et al. 2002a, 2005; Nachtigall et al. 2003, 2004). Very prolonged exposure to sound strong enough to elicit TTS, or shorter-term exposure to sound levels well above the TTS threshold, can cause PTS, at least in terrestrial mammals (Kryter 1985). In terrestrial mammals, the received sound level from a single non-impulsive sound exposure must be far above the TTS threshold for any risk of permanent hearing damage (Kryter 1994; Richardson et al. 1995; Southall et al. 2007). However, there is special concern about strong sounds whose pulses have very rapid rise times (e.g., explosions). In terrestrial

Biological Assessment of the Cook Inlet Beluga Whale (Delphinapterus leucas) for the Seward Highway MP 105-107 Windy Corner Project
Page 86
mammals, there are situations when pulses with rapid rise times (e.g., from explosions) can result in PTS even though their peak levels are only a few dB higher than the level causing slight TTS.
Some factors that contribute to onset of PTS, at least in terrestrial mammals, are as follows:
• exposure to single very intense sound, • fast rise time from baseline to peak pressure, • repetitive exposure to intense sounds that individually cause TTS but not PTS, and • recurrent ear infections or (in captive animals) exposure to certain drugs.
Cavanagh (2000) reviewed the thresholds used to define TTS and PTS. Based on this review and SACLANT (1998), it is reasonable to assume that PTS might occur at a received sound level 20 dB or more above that inducing mild TTS. However, for PTS to occur at a received level only 20 dB above the TTS threshold, the animal would probably have to be exposed to a strong sound for an extended period, or to a strong sound with rather rapid rise time, such as blasting.
More recently, Southall et al. (2007) estimated that received levels would need to exceed the TTS threshold by at least 15 dB, on an SEL basis, for there to be risk of PTS. Southall et al. (2007) also noted that, regardless of the SEL, there is concern about the possibility of PTS if a cetacean received one or more pulses or nonpulses with peak pressure exceeding 230 dB re 1 µPa. Thus, PTS might be expected upon exposure of cetaceans to either peak pressure greater than or equal to ( ≥) 230 dB re 1 µPa (pulses or nonpulses) or SEL ≥198 dB re 1 µPa2 · s (for pulses) or SEL ≥215 dB re 1 µPa2 · s (for nonpulses).These estimates are all first approximations, given the limited underlying data, numerous assumptions, and species differences. Also, data have been published subsequent to Southall et al. (2007) indicating that, at least for non-pulse sounds, the “equal energy” model is not entirely correct; TTS and presumably PTS thresholds may depend somewhat on the duration over which sound energy is accumulated, the frequency of the sound, whether or not there are gaps, and probably other factors (Ketten 1994, 2012). PTS effects may also be influenced strongly by the health of the receiver’s ear.
As described above for TTS, in estimating the amount of sound energy required to elicit the onset of TTS (and PTS), it is assumed that the auditory effect of a given cumulative SEL from a series of pulses is the same as if that amount of sound energy were received as a single strong sound. There are no data from marine mammals concerning the occurrence or magnitude of a potential partial recovery effect between pulses. In deriving the estimates of PTS (and TTS) thresholds quoted here, Southall et al. (2007) made the precautionary assumption that no recovery would occur between pulses.
Caution is warranted given the limited knowledge about noise-induced hearing damage in marine mammals and the lack of knowledge about TTS and PTS thresholds in many species. Avoidance reactions of belugas, along with commonly-applied monitoring and mitigation measures (seasonal/tidal closures, visual monitoring, shut downs when beluga whales and other marine mammals are detected within or approaching the “safety radii”), would reduce the probability of exposure of belugas to sounds strong enough to induce PTS, such as rock blasting. TTS has been demonstrated and studied in certain captive odontocetes and pinnipeds exposed to strong sounds (reviewed in Southall et al. 2007). There has been no specific documentation of TTS let alone PTS in free-ranging marine mammals exposed to pile driving or other impulsive activities during

Biological Assessment of the Cook Inlet Beluga Whale (Delphinapterus leucas) for the Seward Highway MP 105-107 Windy Corner Project
Page 87
realistic field conditions, although this may be due in part to the difficulties inherent in conducting such experiments.
Non-auditory physiological effects
Based on evidence from terrestrial mammals and humans, sound is a potential source of stress (Wright and Kuczaj 2007; Wright et al. 2007a,b, 2009, 2011). However, almost no information is available on sound-induced stress in marine mammals, or on its potential (alone or in combination with other stressors) to affect the long-term well-being or reproductive success of marine mammals (Fair and Becker 2000; Hildebrand 2005; Wright et al. 2007a,b). Such long-term effects, if they occur, would be mainly associated with chronic noise exposure (McCauley et al. 2000a; Nieukirk et al. 2009).
Available data on potential stress-related impacts of anthropogenic noise on marine mammals are extremely limited, and additional research on this topic is needed. The following are specific studies of noise-induced stress in marine mammals. Romano et al. (2004) examined the effects of single underwater impulse sounds from a seismic water gun (source level up to 228 dB re 1 µPa) and single short-duration pure tones (SPL up to 201 dB re 1 µPa) on the nervous and immune systems of a beluga and a bottlenose dolphin. They found that neural-immune changes to noise exposure were minimal. Although levels of some stress-released substances (e.g., catecholamines) changed significantly with exposure to sound, levels returned to baseline after 24 hr. During playbacks of recorded drilling noise to four captive beluga whales, Thomas et al. (1992) found no changes in blood levels of stress-related hormones. Long-term effects were not measured, and no short-term effects were detected. For both studies, caution is necessary when extrapolating these results to wild animals and to real-world situations given the small sample sizes, use of captive animals, and other technical limitations of the two studies. In a rea-world setting, Rolland et al. (2012) found that a reduction in ship traffic on the east coast of Canada lead to a 6 dB decrease in underwater noise which was related to a decrease in stress-related faecal hormone metabolites in the North Atlantic right whale.
Very little is known about the potential for strong underwater sounds to cause non-auditory physiological effects in marine mammals. Possible types of non-auditory physiological effects or injuries that might occur include stress, neurological effects, and other types of organ or tissue damage. The available data do not allow identification of a specific exposure level above which non-auditory effects can be expected (Southall et al. 2007), or any meaningful quantitative predictions of the numbers (if any) of marine mammals that might be affected in these ways. Evidence suggests that some marine mammal species (e.g., beaked whales) may be especially susceptible to injury and/or stranding when exposed to strong pulsed sounds. Although mass strandings of CIBW have often coincided with extreme tidal fluctuations or killer whale sighting reports (Shelden et al. 2003), during informal consultations with DOT&PF on the Windy Corner project, NMFS expressed concerns about a mass stranding of CIBW in Turnagain Arm in August 2003 that resulted in five CIBW mortalities and may have been associated with blasting activities along Turnagain Arm. Although NMFS has not officially correlated the two events, the possibility must be considered.
Other anthropogenic noise sources, specifically, naval mid-range sonar, have been linked to mass strandings of otherwise healthy cetaceans. Three dead Stejners’s beaked whales that stranded

Biological Assessment of the Cook Inlet Beluga Whale (Delphinapterus leucas) for the Seward Highway MP 105-107 Windy Corner Project
Page 88
along the Alaska coast in 2013 were found to have air bubbles in their blood vessels, a condition which has been associated with acoustic trauma; blasting, seismic, and high-intensity sonar were considered as possible causes of these strandings (www.alaskapublicorg.2014/04/24/noaa -investigating-rare-whale-beachings). In a review of potential anthropogenic stressors experienced by CIBW, Norman (2011) hypothesized that belugas may react to noise from explosions by fleeing to shallower waters where they would consequently have a higher chance of stranding. Strandings definitively resulting from exposure to anthropogenic noise sources have not been recorded in Cook Inlet (76 FR 58473), although tests that would either indicate or rule out acoustic trauma have not been conducted on the majority of stranded CIBW.
Non-auditory physiological effects from noise, if they occur at all, would presumably be limited to short distances and to activities that extend over a prolonged period. Although the noise introduced to Turnagain Arm waters from the Windy Corner Project might be limited in distance travelled and numbers of days generated, it will enter a CIBW soundscape that is already full of noise from other human activities in Cook Inlet. Therefore, when considered in isolation, the noise from a single project might not have significant effects, but when combined with the noise from other sound-producing projects in Cook Inlet, it might collectively contribute to a chronically noisy environment with non-auditory physiological effects that are quite significant overall. A study of CIBW health by Becker et al. (2000) concluded that little is known about the role of multiple stressors in animal health and that future research should examine their interactions and effects on population recruitment for a declining population like the CIBW. New acoustic guidelines being developed by NMFS (discussed in following paragraph) may help in the determination of stress and other cumulative effects from noise exposure.
NMFS Acoustic Guidance for Effects of Noise on Marine Mammals NMFS uses sound exposure thresholds to determine when an activity produces sound sufficient to affect marine mammals (70 FR 1871). With these thresholds, NMFS has specified that cetaceans and pinnipeds should not be exposed to impulsive underwater sound (such as rock blasting) with SPLs exceeding 180 and 190 dB re 1 µPa RMS, respectively (NMFS 2000). These are the received levels above which the certainty of effects being non-injurious is lost. Current NMFS guidelines assume that disturbance (harassment) is likely to occur from exposure to impulse sounds at received levels ≥160 dB re 1 µPa RMS and at received levels ≥120 dB re 1 µPa RMS for exposure to continuous sounds (NMFS 2005). These criteria were established before there was any information about the minimum received levels of sounds necessary to cause auditory impairment in marine mammals. Recommendations for new noise exposure criteria for marine mammals were published in 2007 (Southall et al. 2007) and NMFS is moving toward adoption of new procedures that take some of these recommendations into account. Until the new draft guidelines are finalized, the previous threshold limits still apply (http://www.nmfs.noaa.gov/pr/acoustics/guidelines.htm).
5. Noise generated by the Windy Corner Project
The Windy Corner Project will generate noise from construction machinery operation and rock blasting. Any emergency watercraft that utilize the emergency rescue-craft access ramp created by the project would also generate in-water noise. Direct effects of noise on CIBW could potentially range from physical injury to behavioral changes to increases in acute or chronic stress. In addition, noise could indirectly affect CIBW if it affects their prey or other components of their critical habitat.

Biological Assessment of the Cook Inlet Beluga Whale (Delphinapterus leucas) for the Seward Highway MP 105-107 Windy Corner Project
Page 89
Effects of noise produced by construction machinery
The levels of in-air noise generated by various types of construction equipment are summarized in Table 12. Noise will automatically be reduced from these levels as it enters the water via the impedance contrast that reduces how much in-air sound passes through the air-water interface, and depending on the frequency. Noise that does enter the water may not be detectable above the Windy Corner ambient aquatic sound levels of 74–108 dB ra 1 µPa (Burgess 2014, Appendix 1). None of these noise levels from construction equipment are at threshold levels considered by NMFS to be harmful or injurious to marine mammals, or of levels considered to constitute harassment.
Table 12. Mean in-air noise levels for various types of construction equipment (URS 2004).
Equipment type
Mean in-air noise level at
50 ft (dB)
Equipment type
Mean in-air noise level at
50 ft (dB) Air Compressor
81 Loader 84
Backhoe 85 Paver 89 Concrete Mixer
85 Pneumatic Tool
85
Concrete Pump
82 Pump 76
Concrete Vibrator
76 Rock Drill 98
Crane, Derrick
88 Roller 80
Crane, Mobile
83 Saw 78
Dozer 87 Scraper 88 Generator 70 Shovel 2 Grader 85 Truck 88 Jackhammer 88
Mitigation of noise produced by construction machinery
• All construction equipment will be properly maintained in acceptable working condition to reduce noise.
• The Contractor will comply with the Municipal Noise Control Ordinance for the Municipality of Anchorage. If waivers are needed, the Contractor will acquire a noise permit.
• The Contractor will employ all possible methods to reduce noise, including having mufflers on all applicable equipment.

Biological Assessment of the Cook Inlet Beluga Whale (Delphinapterus leucas) for the Seward Highway MP 105-107 Windy Corner Project
Page 90
Effects of noise produced by blasting
Explosives will be used to blast rock at four locations in the Windy Corner Project Action Area. As discussed earlier, for impulsive noises, such as those generated by the detonation of explosives, the current numerical threshold indicative of harassment take under the ESA is 160 dB re 1 µPa RMS SPL and the current numerical threshold indicative of cetacean take by injury is 180 dB re 1 µPa RMS SPL.
DOT&PF commissioned Heat, Light, and Sound Research (HLS) to conduct an analysis of the sound that would be produced by land-based blasting activities from the Windy Corner Project. HLS used models to predict the levels of sound produced by blasting and how far they would travel through the water (HLS 2014, Appendix 2). Peak explosive energy is predicted to occur around 100 Hz. Because information on the exact weight of the explosives to be used, as well as the exact location of explosive placement was unavailable to HLS, they used a conservative/precautionary approach and modeled as if blasting occurred in the water. In reality, blasting will occur in rock on land, which will decrease the actual impact range of the sound created by the blasting. Results of the HLS models are presented in Appendix 2 and summarized in Error! Reference source not found. The distance from the source to the 180 dB contour (i.e., threshold for injury to CIBW from impulsive sound) is less than 0.25 mi (0.4 km) from the center of each blast site, and the distance to the 160 dB contour (i.e., threshold for CIBW harassment) is less than 0.9 mi (1.5 km) from the center of blast site. Because the 160 dB contour is greater than the 180dB contour, the Windy Corner Project Action Area therefore encompasses all areas that may be affected by underwater sounds equal to or greater than 160 dB (Figure 35). The Windy Corner ambient aquatic sound levels across all tidal stages in August 2014 were measured at 74–108 dB re 1 µPa (Burgess 2014; Appendix 1), therefore masking of blasting noise by ambient aquatic background noise will not occur.

Biological Assessment of the Cook Inlet Beluga Whale (Delphinapterus leucas) for the Seward Highway MP 105-107 Windy Corner Project
Page 91
Figure 34: Summary of maximum harassment zones per 10 kg blast of ANFO. Note there is no 180-dB contour on the farthest east site (near milepost 104; HLS 2014).

Biological Assessment of the Cook Inlet Beluga Whale (Delphinapterus leucas) for the Seward Highway MP 105-107 Windy Corner Project
Page 92
Figure 35: The inclusion of sound generated by blasting extends the Windy Corner Project Action Area from milepost 103.5 to milepost 109.5 and 4921 ft (1,500 m) into Turnagain
Arm.
HLS also considered the possible effects of the noise contribution from the blast-warning air horn, and concluded it would not be significant because the impedance contrast between air and water is such that there is only limited coupling of the sound waves, and because what sound does penetrate the water is limited to a cone 13 degrees (°) from the vertical (this is the maximum, which occurs when the in-air sound is directly above the water). This cone of sound is spread out over 180° inside the water column, and the part traveling in the horizontal direction is miniscule.
There is a possibility that any marine mammals in the vicinity of blast activity may incur TTS, as sounds are expected to be as high as 180 dB re 1 µPa RMS up to 1175 ft (358 m) from the activity (Figure 34). However, sound levels which may cause PTS would occur much closer to the source. It is unlikely that belugas would be exposed to blasting at a sufficiently high level for a sufficiently long period to cause more than mild TTS. If some individuals did incur mild or moderate TTS through exposure to blasting sounds in this manner, this would very likely be a temporary and reversible phenomenon. However, even a temporary reduction in hearing sensitivity could be deleterious in the event that, for example, during that period of reduced sensitivity, a beluga whale needs its full hearing sensitivity to detect approaching predators. For this reason blasting will not occur during those times of year and tidal stages when belugas are most likely to be in the Windy Corner Project Action Area. In addition, PSOs will monitor all
Biological Assessment of the Cook Inlet Beluga Whale (Delphinapterus leucas) for the Seward Highway MP 105-107 Windy Corner Project
Page 93
blasting activities and will call a shut-down of operations if belugas or other marine mammals are seen within 4,921 ft (1,500 m) of blasting activities.
Madsen et al. (2006) argued that significant masking effects would be unlikely during impact pile driving given the intermittent nature of these sounds and short signal duration; it seems likely this would also apply to noise generated by rock blasting, which is also impulsive noise. The beluga whale’s extensive vocal repertoire includes trills, whistles, clicks, bangs, chirps, and other sounds (Schevill and Lawrence 1949; Ouellet 1979; Sjare and Smith 1986a). The dominant frequencies in beluga whistles are 2–6 kHz (Sjare and Smith 1986a). Other beluga call types reported by Sjare and Smith (1986a,b) included sounds at mean frequencies ranging upward from 1 kHz. Echolocation clicks are unlikely to be masked during Windy Corner Project activities. Beluga whale echolocation signals have peak frequencies from 40-120 kHz and source levels of 206–225 dB re 1 µPa at 3.3 ft (1 m; Au et al. 1985, 1987; Au 1993). In general, most vocalizations and echolocation clicks produced by CIBW have frequency ranges above those produced at highest intensity by blasting and other construction activities (predicted at 100 Hz by HLS, Appendix 2); thus, the effects of masking are expected to be limited and will be further reduced through monitoring and mitigation efforts.
Indirect effects of noise produced by blasting blast: effect of blast noise on prey
Potential effects of exposure to anthropogenic sound on fish can be behavioral, physiological, or pathological. Behavioral effects refer to temporary and permanent changes in exhibited behavior (e.g., startle and avoidance behavior). Physiological effects involve temporary and permanent primary and secondary stress responses, such as changes in levels of enzymes and proteins. Pathological effects involve lethal and temporary or permanent sub-lethal injury. The three categories of effects are interrelated in complex ways. For example, it is possible that certain physiological and behavioral changes could potentially lead to an ultimate pathological effect on individuals (i.e., mortality). Hastings and Popper (2005), Popper (2009), and Popper and Hastings (2009a,b) provided recent critical reviews of the known effects of sound on fish, which are summarized below.
Behavioral effects include changes in the distribution, migration, mating, and “catchability” of fish populations. Fish often react to sounds, especially strong and/or intermittent low-frequency sounds. Short-duration, sharp sounds can cause overt or subtle changes in fish behavior and local distribution. Hart Crowser et al. (2009) and Houghton et al. (2010) exposed caged juvenile coho salmon to sounds from vibratory pile driving with maximum peak SPLs of 177 to 195 dB re 1 µPa and SELs of 174.8 to 190.6 dB re 1 µPa. They reported no mortalities or behavioral abnormalities; pile driving did not affect the feeding ability of the juvenile coho salmon. Similarly, coho salmon exposed to impact pile driving with peak source levels of 208 dB re 1 µPa and SEL of 207 re 1 µPa2
ˑs showed some minor startle responses, but feeding behavior was not affected, and no mortalities were observed (Ruggerone et al. 2008). Nedwell et al. (2006) reported little reaction of caged brown trout to pile driving sounds. In contrast, cod and sole held in net pens showed significant movement responses to playbacks of pile-driving noise at received peak SPLs as low as 140 dB re 1 µPa (Thomsen et al. 2012). Both species showed movement away from the sound source, but there was a decrease in response with multiple exposures.

Biological Assessment of the Cook Inlet Beluga Whale (Delphinapterus leucas) for the Seward Highway MP 105-107 Windy Corner Project
Page 94
The specific received sound levels at which permanent adverse effects to fish potentially could occur are little studied and largely unknown. However, there are currently interim physiological injury onset criteria in place for pile driving projects on the U.S. west coast (Woodbury and Stadler 2008; Stadler and Woodbury 2009). The potential for pathological damage to hearing structures in fish depends on the energy level of the received sound and the physiology and hearing capability of the species in question. For a given sound to result in hearing loss, the sound must exceed the hearing threshold of the fish for that sound (see Hastings and Popper 2005). The consequences of temporary or permanent hearing loss in individual fish on a fish population are unknown; however, they likely depend on the number of individuals affected and whether critical behaviors involving sound (e.g., predator avoidance, prey capture, orientation and navigation, reproduction, etc.) are adversely affected.
There have been some reports of fish kills during pile driving operations (e.g., Abbott and Bing-Sawyer 2002; Caltrans 2004). In a laboratory setting, Halvorsen et al. (2011) documented that pile driving signals caused tissue damage and/or death of exposed juvenile Chinook salmon. Tissue damage was not reported for studies conducted by Ruggerone et al. (2008) or Houghton et al. (2010), but Halvorsen et al. (2011) noted that these studies did not allow fish to fill their swim bladders before exposure; thus, they are not applicable to fish in the wild. A study on juvenile steelhead trout also showed no tissue damage when fish were exposed to cumulative SEL as high as 194 re 1 µPa2
ˑs or peak SPLs as high as 188 dB re 1 µPa (Oestman and Earle 2012). McCauley et al. (2003) found that exposure to airgun sound caused observable anatomical damage to the auditory maculae of “pink snapper.” This damage in the ears had not been repaired in fish sacrificed and examined almost two months after exposure. On the other hand, only TTS was documented in northern pike and lake chub when exposed to seismic sounds (Popper et al. 2005), in rainbow trout after exposure to high-intensity, low-frequency active sonar sound (Popper et al. 2007), and in juvenile Chinook salmon exposed to noise in barge holding tanks (Halvorsen et al. 2009). No pathologies were observed in caged rainbow trout exposed to low- and mid-frequency sonar at received peak levels of 193 and 210 dB re 1 µParms, respectively (Kane et al. 2010). In general, any adverse effects on fish behavior from blasting noise will likely depend on the species in question. It may also depend on the age of the fish, its motivational state, its size, and numerous other factors that are difficult, if not impossible, to quantify at this point. Mitigation strategies such as blasting only during low water and ceasing blasting activities during peak periods of spawning and migration periods will reduce the likelihood of fish experiencing negative effects from blasting noise.
The Fisheries Hydroacoustic Working Group (FHWG), composed of state and federal organizations, set an underwater injury threshold for impulse sounds (i.e., pile driving, blasting) as 206 dB SPLpeak and 187 dB SELcumulative for fish weighing ≥0.07 ounces (oz; 1.98 grams [g]). Fish weighing <0.07 oz (1.98g) had an injury threshold set to 206 dB SPLpeak and 183 dB SELcumulative (Stadler and Woodbury 2009).
There is increasing interest in assessing the possible direct and indirect effects of noise on invertebrate behavior, particularly in relation to the consequences for fisheries. Changes in behavior could potentially affect such aspects as reproductive success, distribution, susceptibility to predation, and catchability by fisheries. There are a few studies investigating the possible behavioral effects of exposure to impulse sounds on crustaceans and cephalopods, including those from airguns. Literature reviews of the effects of seismic sound on invertebrates were

Biological Assessment of the Cook Inlet Beluga Whale (Delphinapterus leucas) for the Seward Highway MP 105-107 Windy Corner Project
Page 95
provided by Moriyasu et al. (2004) and Payne et al. (2008). In some cases, invertebrates exhibited startle responses when exposed to seismic sounds (e.g., squid in McCauley et al. 2000a,b). In other cases, no behavioral impacts were noted (e.g., crustaceans in Christian et al. 2003, 2004; DFO 2004). There have been anecdotal reports of reduced catch rates of shrimp shortly after exposure to seismic surveys; however, other studies have not observed any significant changes in shrimp catch rate (Andriguetto-Filho et al. 2005). Similarly, Parry and Gason (2006) did not find any evidence that lobster catch rates were affected by seismic surveys. Any adverse effects on crustacean and cephalopod behavior or fisheries attributable to seismic survey sound depend on the species in question and the nature of the fishery (season, duration, fishing method).
Lethal and sub-lethal injury to organisms exposed to noise appears to depend on at least two features of the sound source: 1) the received peak pressure, and 2) the time required for the pressure to rise and decay. Generally, as received pressure increases, the period for the pressure to rise and decay decreases, and the chance of acute pathological effects increases. For the type activities planned, the pathological (mortality) zone for invertebrates is expected to be within a few meters of the sound source, at most; however, very few specific data are available on levels of sound that might damage these animals. Restricting blasting activities to low-water periods will mitigate the effects of blasting noise on invertebrates.
Mitigation of noise produced by blasting
Although the possibility cannot be entirely excluded, it is unlikely that the project would result in any cases of temporary or permanent hearing impairment to CIBW, any significant non-auditory physical or physiological effects, or any acoustic effects to CIBW prey, particularly if the following monitoring and mitigation measures are implemented (see Appendix 3 for more details):
• Blast and fill activities will not occur during those times of years that CIBW are most likely to be in the project area (April–early June, and August–October). The April–early June closure period is already covered by the March 1–June 30 closure period designed to protect migrating fish.
• Blasting activities will be limited to low-water periods, in 3-hour blocks of time centered on the low tide (i.e., 1.5 hours before and after low tide). Because there are two low tides per 24-hour day, there is the potential for two workable low-tide windows per day if low tides occur during daylight hours. No blasting will occur at or below the intertidal zone.
o Although CIBW may occur in the Windy Corner Project Area at any tidal stage, at low tide they are more likely to be found farther east at the mouth of Turnagain Arm and in Chickaloon Bay.
o Low tide will result in a greater distance between the blasting activities and the water and any CIBW that happen to be in the area. For example, the cove around Gorilla Rock becomes dry or almost dry during low tide (the extent of drying depends on the lunar phase).

Biological Assessment of the Cook Inlet Beluga Whale (Delphinapterus leucas) for the Seward Highway MP 105-107 Windy Corner Project
Page 96
o Sound will not travel as far in water during low tide because more sound will be absorbed by the dewatered mudflats and because sound doesn’t travel as far in shallow water.
• Blasting activities will only take place when PSOs are on duty.
• Blasting activities will cease if a CIBW or other marine mammal is seen within the 4,921 ft (1,500 m) safety zone.
Effects of noise produced by vessel use of the rescue-craft ramp
The construction of the rescue-craft ramp may lead to an increase in watercraft in the project area, which in turn would create noise. Small vessels have been reported to produce sound in the 250-1,000 Hz frequency range, at source levels of 151 dB re 1 µPa at 1 m (Richardson et al. 1995). Beluga responses to vessels are quite variable ranging from tolerance to extreme sensitivity, depending on the whale’s activity and experience, its habitat, and boat type and behavior (Fraker 1978; Richardson et al. 1995). Although belugas in the St. Lawrence River occasionally show positive reactions to ecotourism boats by approaching and investigating these boats, one study found that belugas surface less frequently, swim faster, and group together more in the presence of boats (Blane and Jaakson 1994). The degree of disturbance varied with the number and speeds of the approaching vessels, the activity and age of the whale (young belugas were less likely to respond than adults), and location (Blane 1990; Blane and Jaakson 1994). Feeding or traveling belugas were less likely to react, but when they did, responses were typically stronger; the fact that they use high traffic areas should not be interpreted as a lack of disturbance effects (Blane 1990). Caron and Sergeant (1988) noted that a decrease in beluga numbers coincided with an increase in boat activity in one part of the St. Lawrence River, but no causative relationship could be established. Declines in abundance and possibly reduced reproductive success have been reported for dolphins disturbed by tourism vessels (Bejder 2005; Bejder et al. 2006a,b). Lerczak et al. (2000) reported that vessel pursuits and tagging of belugas only caused short-term disturbance, and that whales did not leave the immediate study area even when harassed. Lesage et al. (1999) examined the effect of vessel noise on belugas in the SLE Québec. They used controlled experiments to record the surface behavior and vocalizations of beluga whales before, during, and after the passing of two different types of boats—an outboard motorboat moving rapidly and erratically on an unpredictable course, and a ferry moving regularly and slowly through the study area on a predictable route. Beluga whales changed their vocalizations in response to both vessels, and changes included the use of higher-frequency vocalizations, a greater redundancy in vocalizations (more calls emitted in a series), and a lower calling rate. The lower calling rate persisted for longer during exposure to the ferry than to the motorboat. Scheifele et al. (2005) also found that beluga whales changed the intensity of their vocalizations with increased noise levels in the St. Lawrence River.
Small crafts operating in Cook Inlet are not regulated by NMFS, although NMFS guidelines recommend that vessels maintain a minimum distance of 100 yd (91.4 m) from all marine mammals and federal law prohibits the pursuit of marine mammals (http://alaskafisheries.noaa.gov/protectedresources/mmv/guide.htmcite). Vessels needing to approach CIBW at closer distances for research are required to have an MMPA/ESA Scientific Research permit with a limited number of takes by approach. Sanctioned use of the Windy

Biological Assessment of the Cook Inlet Beluga Whale (Delphinapterus leucas) for the Seward Highway MP 105-107 Windy Corner Project
Page 97
Corner ramp for search-and-rescue operations is anticipated to be very rare and limited to emergencies in the ice-free season.
The creation of the rescue-craft ramp could aid in the stranding response to live or dead stranded CIBW in this section of Turnagain Arm by allowing NMFS stranding responders increased access to stranded marine mammals.
Mitigation of noise produced by vessel use of the rescue-craft ramp
The effects of noise produced by the use of the rescue-craft ramp will be mitigated by controlling access to and appropriate use of the rescue-craft ramp.
• Access to the rescue-craft ramp will be controlled via a locked gate or locked posts preventing access and use by the general public.
• Signs will be posted at the ramp to inform the public that the ramp is for emergency rescue-craft use only.
• NMFS-approved signs will be posted with the NMFS Office of Law Enforcement hotline number for the public to report illegal harassment of CIBW or other marine mammals.
• NMFS-approved signs will be posted with the NMFS Marine Mammal Stranding Network hotline numbers for the public to report live or dead strandings of CIBW or other marine mammals.
6. Direct and indirect effects of Windy Corner Project from illegal harassment
The Windy Corner Project is not anticipated to lead directly to an increase in any illegal harassment. There may be an indirect effect however if the construction of the rescue-craft ramp leads to an increase in unsanctioned (i.e., recreational) watercraft in the project area. This includes an increase in boats, jet skis, paddle boarders, windsurfers, or kayakers. This could result in increased noise, as well as increased risk of beluga injury or mortality from collision. Beluga reactions to vessels are quite variable, but small vessels that travel at high speeds and frequently change course increase the danger of ship-strike for CIBW (NMFS 2008a). In addition, the creation of parking and wildlife viewing areas for the Windy Corner Project may lead to an increase in beluga watching and illegal harassment from shore.
Mitigation of effects from illegal harassment
• Access to the rescue-craft ramp will be controlled via a locked gate or locked posts preventing access and use by the general public.
• Signs will be posted at the ramp to inform the public that the ramp is for emergency rescue-craft use only.
• NMFS-approved signs will be posted at the rescue-craft ramp and at beluga viewing areas with the NMFS Office of Law Enforcement hotline number for the public to report illegal harassment of CIBW or other marine mammals.

Biological Assessment of the Cook Inlet Beluga Whale (Delphinapterus leucas) for the Seward Highway MP 105-107 Windy Corner Project
Page 98
• NMFS-approved signs will be posted at the rescue-craft ramp and at beluga viewing areas with the NMFS Marine Mammal Stranding Network hotline numbers for the public to report live or dead strandings of CIBW or other marine mammals.
7. Direct and indirect effects of Windy Corner Project from injury or mortality
The potential for CIBW injury or mortality from blasting noise is described above in the noise section, along with the mitigation measures that will be implemented to prevent this from happening.
There is also a remote possibility that CIBW could be injured or killed from rock falling into the water during blasting or fill placement. There is practically no likelihood of this happening however due to the construction methods used and the mitigation measures employed on the Windy Corner project. With respect to non-noise related injury from blasting, only the amount of explosives necessary to break the rock will be used in each hole. The remaining portion of each hole will be backfilled with cuttings from the drilling operation. A large drill rig (land-based) is used to bore a large hole down into the rock. This drilling process creates a pile of ‘overburden’ or material generated by drilling the hole. This material will be used to backfill the hole after the necessary amount of explosives are placed, to ensure that the hole is capped off. The combination of drilling and capping will reduce the possibility of rock flying into the water. The purpose of the blasting is to crack the rock, not “blow it up.” After each blast, the Contractor’s blaster shall observe the area of the blast for five minutes to guard against injury or damage to the construction crew due to rockfall. The blaster shall then inspect the blast area to determine that all explosive charges were detonated. After this inspection, the blaster will sound an audible horn as an all-clear signal to alert all personnel that the area is safe for entry. Blasting must occur during daylight hours to permit the blast site to be inspected after the blast to verify that the area is safe. Because the rock generated from the blasts can only be placed when the mudflats are free of ice, and due to the lack of material staging space in the project area, blasting can only occur during the ice-free season.
As with any earth-moving activities along the waterline, such as at the Port of Anchorage (Figure 10), there is the possibly that a CIBW moving along the shoreline could be struck as fill material is being placed. Seasonal and tidal limitations on fill activities will reduce the probability of CIBW being in the Windy Corner Area, and all fill activities will be monitored by PSOs who will immediately call for a shutdown if a beluga or other marine mammals is seen within 4,921 ft (1,500 m) of fill activities. During monitoring of CIBW during fill activities at the Port of Anchorage in 2006, 80% of CIBW sightings were within 1,640 ft (500 m) of in-water construction activities yet no incidents of debris falling on CIBW were reported, although at times individual belugas approached within meters of filling activities (Markowitz and McGuire 2007).

Biological Assessment of the Cook Inlet Beluga Whale (Delphinapterus leucas) for the Seward Highway MP 105-107 Windy Corner Project
Page 99
Figure 36: Beluga whales around earth-moving activity at the Port of Anchorage (photo: T.McGuire, NMFS MMPA/ESA permit #18016).
Mitigation of injury or mortality
See Appendix 3 for a detailed mitigation and monitoring plan.
• Blast and fill activities will not occur during those times of years that CIBW are most likely to be in the project area (April–early June, and August–October). The April–early June closure period is already covered by the March 1-June 30 closure period designed to protect migrating fish.
• Blasting and fill activities will be limited to low-water periods, in 3-hour blocks of time centered on the low tide (i.e., 1.5 hours before and after low tide). Because there are two low tides per 24-hour day, there is the potential for two workable low-tide windows per day if low tides occur during daylight hours.
• No blasting will occur at or below the intertidal zone.
• Blasting and fill activities will only take place when Protected Species Observers (PSOs) are on duty.
• Blasting and fill activities will cease if a CIBW or other marine mammal is seen within the 4,921 ft (1,500 m) safety zone.
Biological Assessment of the Cook Inlet Beluga Whale (Delphinapterus leucas) for the Seward Highway MP 105-107 Windy Corner Project
Page 100
C. Direct and Indirect Effects of the Windy Corner Project on CIBW Critical Habitat
The potential direct and indirect effects of the Windy Corner Project on CIBW Critical Habitat are considered with respect to each of the five PCEs of critical habitat.
PCE 1: Intertidal and subtidal waters of Cook Inlet with depths <30 feet (MLLW) and within 5 miles of high and medium flow anadromous fish streams.
Anadromous fish streams do not exist within the Windy Corner Project Action Area, therefore this component of CIBW critical habitat will not be directly affected. The project does have the potential to indirectly affect nearby anadromous streams via increased turbidity, sedimentation, pollution, or noise; however, these effects will be reduced through the mitigation measures presented in previous sections.
PCE 2: Primary prey species consisting of four species of Pacific salmon (Chinook, sockeye, chum, and coho), Pacific eulachon, Pacific cod, walleye pollock, saffron cod, and yellowfin sole.
Adult fish use Turnagain Arm as a primary migration route, returning to spawning streams outside of the project area, such as Rabbit Creek, Potter Creek, Indian Creek, the Twentymile River, and Bird Creek. The proposed project is not anticipated to negatively impact fish passage within Turnagain Arm. The project has the potential to affect primary prey species via habitat alteration, pollution, noise, and injury/mortality; however, these will be reduced through the mitigation measures presented in previously. Potential adverse effects during construction would primarily be related to increased turbidity of Turnagain Arm waters adjacent to embankment construction, and net loss of habitat. Given that anadromous fish passage in Turnagain Arm will not be blocked by the project, and that critical marine fish species have not been documented in the area, DOT&PF assumes that adverse effects to EFH will not be significant. DOT&PF stated during the March 2013 TAG meeting that NOAA had relayed it had no concerns about EFH in the Windy Corner Project Action Area.
PCE3: Waters free of toxins or other agents of a type and amount harmful to CIBW.
The project has the potential to affect CIBW and their prey primary prey species via pollution during fill placement; however, this will be reduced through the mitigation measures presented in previous section.
PCE4: Unrestricted passage within or between the critical habitat areas.
Because fill activities for the Windy Corner Project will take place along the length of the existing shoreline and not perpendicular to the shoreline or jutting out into Turnagain Arm, the habitat alteration from the Windy Corner Project is not anticipated to negatively impact CIBW passage within Turnagain Arm. Noise generated by blasting activities has the potential to temporarily restrict passage of CIBW through the project area, however this will be reduced through the mitigation measures presented in previous sections.
PCE5: Waters with in-water noise below levels resulting in the abandonment of critical habitat areas by CIBW.

Biological Assessment of the Cook Inlet Beluga Whale (Delphinapterus leucas) for the Seward Highway MP 105-107 Windy Corner Project
Page 101
Noise will be generated by the Windy Corner Project. Although the noise introduced to Turnagain Arm waters from the Windy Corner Project might be limited in distance travelled and numbers of days generated, it will enter a CIBW soundscape that is already quite full of noise from other human activities in Cook Inlet. Therefore, when considered in isolation, the noise from a single project might not have significant effects, but when combined with the noise from other sound-producing projects in Cook Inlet, it might collectively contribute to a chronically noisy environment with non-auditory physiological effects that are quite significant overall.
Monitoring and mitigation will reduce the exposure of CIBW to noise, thus minimizing the likelihood that CIBW abandon this area of critical habitat. See Appendix 3 for details.
D. Cumulative Effects of the Windy Corner Project on CIBW and Their Critical Habitat
Cumulative effects – As defined in the ESA, cumulative effects are future state, tribal, local, or private activities, not involving federal activities, which are reasonably certain to occur within the action area of the proposed action.
In addition to the Windy Corner Project, DOT&PF in conjunction with FHWA is planning improvements along several sections of the Seward Highway along Turnagain Arm over the next few of years (Figure 11). The proposed projects are being designed and permitted as separate projects, and will address safety concerns and other improvements along the Seward Highway. The majority of these projects will not involve in-water work and those projects would not impact CIBW. The proposed highway improvement projects along the Turnagain Arm include:
Seward Highway MPs 99-105 Improvements
This proposed project involves rehabilitating the pavement structural section of the roadway. No work below MHW would occur in Turnagain Arm.
Seward Highway: MP 75-90 Road and Bridge Rehabilitation.
In-water work, including pile driving, within Turnagain Arm is proposed for this project and a Biological Assessment is being prepared.

Biological Assessment of the Cook Inlet Beluga Whale (Delphinapterus leucas) for the Seward Highway MP 105-107 Windy Corner Project
Page 102
Figure 37: Current and proposed DOT&PF projects along the Seward Highway Corridor.
Concerns about the total number of acres of wetland filled and cumulative hydrological changes (e.g., channel movements, current velocity) brought about by the sum of the many Seward Highway improvements projects was expressed in 2004 by the US Army Corps of Engineers and the USFWS (DOT&PF 2004), however it should be noted that this was with respect to the NEPA definition of cumulative effects. The National Environmental Policy Act (NEPA) defines cumulative effects as “the incremental impact of the action when added to other past, present, and reasonably forseeable future actions regardless of what agency or person undertakes such actions” (40 CFR Part 1508, Sec 7). The definition of cumulative effects used by the ESA and required in this BA do not take the effects of multiple Seward Highway projects into account, because this ESA definition of cumulative effects is restricted to effects within the project action area involving “future state, tribal, local, or private activities, not involving federal activities, which are reasonably certain to occur within the action area of the proposed action.” In addition, the involvement of FHWA means that these DOT&PF projects involve federal activities and do not fall under the ESA definition of cumulative effects.
Aside from the Windy Corner Project, to DOT&PF’s knowledge there are no other future state, tribal, local, or private activities that are reasonably certain to occur within the Windy Corner Project Action Area, therefore there are no cumulative effects of this project to consider in the BA.
E. Summary of Effects of the Action
Table 13 summarizes the information in the preceding sections regarding the possible effects of the Windy Corner Project with respect to CIBW and their critical habitat.

Biological Assessment of the Cook Inlet Beluga Whale (Delphinapterus leucas) for the Seward Highway MP 105-107 Windy Corner Project
Page 103
Table 13. Possible effects to Cook Inlet beluga whales and their critical habitat resulting from the Windy Corner Projects, including location, project activity, project phase, and relative duration of effect.
Effects Type of effect
Location Activity Phase of activity Relative duration of effect (short-term <1 year)
Habitat alteration
• direct • onshore • intertidal
• blasting • fill
• construction • operation
• short-term • long-term
Pollution • direct • water
• air • fill
• construction
• short-term
Reduction in availability or quality of prey species
• indirect • intertidal • off shore
• blasting • fill
• construction • operation
• short-term • long-term
Noise • direct • indirect
• onshore • intertidal • offshore
• blasting • construction
equipment • use of rescue-craft
ramp
• construction • operation
• short-term • long-term
Illegal harassment
• indirect • offshore • use of rescue-craft ramp
• operation • long-term
Injury or mortality
• direct • intertidal • off shore
• blasting • fill • use of rescue-craft
ramp
• construction • operation
• short-term • long-term

Biological Assessment of the Cook Inlet Beluga Whale (Delphinapterus leucas) for the Seward Highway MP 105-107 Windy Corner Project
Page 104
VI. DETERMINATION OF EFFECT
For each species, there are three possible determinations of effects, as defined by the ESA:
1. No effect – The proposed action or interrelated or interdependent actions will not affect (positively or negatively) listed species or their habitat.
2. May affect, not likely to adversely affect – The proposed action or interrelated or interdependent actions may affect listed species or their habitat, but the effects are expected to be insignificant, discountable, or entirely beneficial. Insignificant effects relate to the size of the impact and should never reach the scale where a take will occur. Discountable effects are those that are extremely unlikely to occur. Based on best judgment, one would not 1) be able to meaningfully measure, detect, or evaluate insignificant effects; or 2) expect discountable effects to occur. Beneficial effects are contemporaneous positive effects with no adverse effects to listed species.
3. May affect, likely to adversely affect – The proposed action or interrelated or interdependent actions may have measurable or significant adverse effects on listed species or their habitat. Such a determination requires formal ESA Section 7 consultation.
DOTP&F concludes that the proposed Windy Corner Project, and the various actions associated with it; Table 14) may affect, but is not likely to adversely affect, the CIBW. Mitigation measures (Section V and Appendix 3) will be implemented throughout the project to reduce CIBW exposure to the effects of these actions.
Table 14. Windy Corner Project actions, potential effects, and determination of effects on CIBW and critical habitat.
Action Potential effect Mitigation measures proposed?
Determination
Fill • habitat alteration • pollution • reduction in availability or
quality of prey species • injury or mortality • noise
yes May affect, not likely to adversely affect
Blasting • habitat alteration • reduction in availability or
quality of prey species • noise • injury or mortality
yes May affect, not likely to adversely affect
Vessel use of rescue-craft ramp
• noise • illegal harassment • injury or mortality
yes May affect, not likely to adversely affect

Biological Assessment of the Cook Inlet Beluga Whale (Delphinapterus leucas) for the Seward Highway MP 105-107 Windy Corner Project
Page 105
A. Destruction or Adverse Modification Standard for Critical Habitat
For critical habitat, NMFS relies upon the statutory provisions of the ESA to complete the analysis of effect of an action with respect to critical habitat. NMFS will evaluate “destruction or adverse modification” of critical habitat by determining if the action reduces the value of critical habitat for the conservation of the species.
The proposed Windy Corner Project is not likely to destroy or adversely modify CIBW critical habitat to the extent that the critical habitat will no longer remain functional or able to serve its intended conservation role for CIBW. Therefore, DOT&PF concludes the project may affect, but is not likely to adversely affect CIBW critical habitat within the action area (Table 15).
Table 15. Determination of the effects of the Windy Corner Project on CIBW and its critical habitat.
Species/DPS Listing status Determination
Cook Inlet beluga whale Endangered May affect, not likely to adversely affect
Cook Inlet beluga whale critical habitat
Designated May affect, not likely to adversely affect

Biological Assessment of the Cook Inlet Beluga Whale (Delphinapterus leucas) for the Seward Highway MP 105-107 Windy Corner Project
Page 106
VII. REFERENCES AND PERSONAL COMMUNICATIONS CITED
Abbott, R. and E. Bing-Sawyer. 2002. Assessment of pile driving impacts on the Sacramento blackfish (Orthodon microlepidotus). Draft report prepared for Caltrans District 4, San Francisco, CA.
Alaska Department of Environmental Conservation (ADEC). 2010. Alaska’s Final 2010 Integrated Water Quality Monitoring and Assessment Report. Website: http://dec.alaska.gov/water/wqsar/Docs/2010_Integrated_Report_Final_20100715_corrected_july_19.pdf.
Alaska Department of Transportation and Public Utilities (DOT&PF). 2004. Categorical exclusion checklist, Seward Highway Safety Improvements Indian to Potter Marsh, MP 105-115. June 2004.
Alaska Department of Transportation and Public Utilities (DOT&PF). 2013a. Agency scoping letter for Seward Highway Mile Posts 105-107, Windy Corner, Safety Improvements Project No. NH-0A3-1(34) / 56631. March 5, 2013.
Alaska Department of Transportation and Public Utilities (DOT&PF). 2013b. Preliminary Geotechnical Investigation May 2013 Seward Highway MP 105 to MP 107 Windy Corner Project No. 56631. LWCF Temporary Non-Conforming Use Environmental Assessment. http://www.dowlhkm.com/projects/windycorner/documents/Draft%20EA%20%20TNCU%20Apx%20A_01.pdf
Allen, B. M. and R. P. Angliss. 2013. Alaska marine mammal stock assessments, 2012. U.S. Dep. Commerr., NOAA Tech. Memo. NMFS-AFSC-234. 288 p.
Andriguetto-Filho, J. M., A. Ostrensky, M. R. Pie, U. A. Silva, and W. A. Boeger. 2005. Evaluating the impact of seismic prospecting on artisanal shrimp fisheries. Continental. Shelf Research 25:1720-1727.
Au, W. W. L. 1993. The sonar of dolphins. Springer-Verlag, Nw York. 277 p.
Au, W. W. L., D. A. Carder, R. H. Penner, and B. L. Scronce. 1985. Demonstration of adaptation in beluga whale echolocation signals. Journal of the Acoustical Society of America 77(2):726-730.
Au, W. W. L., R. H. Penner, and C. W. Turl. 1987. Propagation of beluga echolocation signals. J. Acoust. Soc. Am. 82(3):807-813.
Awbrey F. T., J. A. Thomas, and R. A. Kastelein. 1988. Low-frequency underwater hearing sensitivity in belugas, Delphinapterus leucas. Journal of the Acoustical Society of America 84:2273-2275.
Becker, P. R., M. M. Krahn, E. A. Mackey, R. Demiralp, M. M. Schantz, M. S. Epstein, M. K. Donais, B .J. Porter, D. C. G. Muir, and S. A. Wise. 2000. Concentrations of polychlorinated biphenyls (PCB’s), chlorinated pesticides, and heavy metals and other elements in tissues of belugas, Delphinapterus leucas, from Cook Inlet, Alaska. Marine Fisheries Review 62(3): 81-98.
Becker, P., R. S. Pugh, M. M. Schantz, E. A. Mackey, R. Demiralp, M. S. Epstein, M. K. Donais, B. J. Porter, S. A. Wise, and B. A. Mahoney. 2001. Persistent Chlorinated Compounds

Biological Assessment of the Cook Inlet Beluga Whale (Delphinapterus leucas) for the Seward Highway MP 105-107 Windy Corner Project
Page 107
and Elements in Tissues of Cook Inlet Beluga Whales, Delphinapterus leucas, Banked by the Alaska Marine Mammal Tissue Archival Project. Report No. MMS 2000-67. NOAA, USDOI, USGS.
Bejder, L. 2005. Linking short and long-term effects of nature-based tourism on cetaceans. Ph.D. thesis, Department of Biology, Dalhousie University, Halifax, N.S.
Bejder, L., A. Samuels, H. Whitehead, and N. Gales. 2006a. Interpreting short-term behavioural responses to disturbance within a longitudinal perspective. Animal Behav. 72:1149-1158.
Bejder, L., A. Samuels, H. Whitehead, N. Gales, J. Mann, R. Connor, M. Heithaus, J. Watson-Capps, and C. Flaherty. 2006b. Decline in relative abundance of bottlenose dolphins exposed to long-term disturbance. Conserv. Biol. 20:1791-1798.
Blackwell, S. B., and C. R. Greene, Jr. 2003. Acoustic measurements in Cook Inlet, Alaska, during August 2001. Report from Greeneridge Sciences, Inc., 271 1. Prepared for National Marine Fisheries Service, Protected Resources Division, Anchorage, Alaska. 43p.
Blane, J. M. 1990. Avoidance and interactive behaviour of the St. Lawrence beluga whale (Delphinapterus leucas) in response to recreational boating. M.A. Thesis, Dep. Geogr., Univ. Toronto, Toronto, Ont. 59 p.
Blane, J. M. and R. Jaakson. 1994. The impact of ecotourism boats on the St Lawrence beluga whales. Environ. Conserv. 21:267-269.
Bosch, D. and C. Lipka. 2010. Joint Base Elmendorf Richardson Cook Inlet Beluga Whale Habitat Monitoring 2010: Six Mile Creek Salmon Smolt Emigration and Adult Salmon Enumeration. Prepared for 673d Civil Engineer Squadron, Cultural and Natural Resources Conservation, 673 CES/CEANC, JBER-Elmendorf, AK. 33pp.
Braham, H. W. 1984. The status of endangered whales: An overview. Marine Fisheries Review, 46(4), 2-6.
Burek K. A. and C. Goertz. 2010. Morbidity and mortality trends in stranded Cook Inlet beluga whales. Available from: http://www.fakr.noaa.gov/protectedresources/whales/beluga/workshop/presentations/21_burek_cib_strandings.pdf
Burek, K., J. Dushane, and C. Goertz. In review. Morbidity and mortality trends in stranded Cook Inlet beluga whales (Delphinapterus leucas). Marine Fisheries Review.
Burgess, W. C. 2014. Ambient underwater sound levels measured at Windy Corner, Turnagain Arm, Alaska. Report by Greeneridge Sciences, Inc., Santa Barbara, CA in association with LGL Alaska Research Associates, Inc., Anchorage, AK, for Alaska Department of Transportation and Public Facilities. Report 515-1.
Burns, J. J. and G. A. Seaman. 1986. Investigations of Belukha whales in coastal waters of western and northern Alaska. II. Biology and ecology. U.S. Department of Commerce, NOAA, OCSEAP Final Report 56(1988):221-357.
California Department of Transportation (Caltrans). 2004. Fisheries and hydroacoustic monitoring program compliance report for the San Francisco-Oakland Bay Bridge East

Biological Assessment of the Cook Inlet Beluga Whale (Delphinapterus leucas) for the Seward Highway MP 105-107 Windy Corner Project
Page 108
Span Seismic Safety Project. Prepared by Strategic Environmental Consulting, Inc., and Illingworth & Rodkin, Inc.
Calkins, D. G. 1983. Marine mammals of lower Cook Inlet and the potential for impacts from outer continental shelf oil and gas exploration, development and transport. U.S. Dep. Commer., NOAA, OCSEAP Final Report 20:171-265.
Calkins, D. G. 1984. Susitna hydroelectric project final report: Volume IX, beluga whale. Alaska Department of Fish and Game, Anchorage, AK (2328): 1-17.
Calkins, D. G. 1989. Status of beluga whales in Cook Inlet. In: L.E. Jarvela and L.K. Thorsteinson (eds.) Gulf of Alaska, Cook Inlet and north Aleutian basin information update meeting, February 7-8, 1989, Anchorage, AK. USDOC, NOAA, OCSEAP. Pg 109-112.
Caron, L. M. J., and D. E. Sergeant. "Yearly variation in the frequency and passage of beluga whales (Delphinapterus leucas) at the mouth of the Saguenay River, Québec, over the past decade." Naturaliste Canada 115 (2) (1988): 111-116.
Carstensen, J., O. D. Henriksen, and J. Teilmann. 2006. Impacts on harbour porpoises from offshore wind farm construction: acoustic monitoring of echolocation activity using porpoise detectors (T-PODs). Mar. Ecol. Prog. Ser. 321:295-308.
Carter, B.T.G., and E.A. Nielsen. 2011. Exploring ecological changes in Cook Inlet beluga whale habitat though traditional and local ecological knowledge of contributing factors for population decline. Marine Policy. 35(3):299-308.
Castellote, M., T. A. Mooney, L. T. Quakenbush, R. Hobbs, C. Goertz and E. Gaglione. 2014. Baseline hearing abilities and variability in wild beluga whales (Delphinapterus leucas). The Journal of Experimental Biology (2014)217,1682-1691.
Castellote, M., T. McGuire, C. McKee, and M. O. Lammers. 2011. Can we hear Cook Inlet beluga whales feeding? Presented at the 2011 Alaska Marine Science Symposium, Anchorage, AK.
Cavanagh, R. C. 2000. Criteria and thresholds for adverse effects of underwater noise on marine animals. PDF Url : ADA395599. Final Report Oct 1996-May 2000, Science Applications Incl.
Christian, J. R., A. Mathieu, D. H. Thomson, D. White, and R. A. Buchanan. 2003. Effect of seismic energy on snow crab (Chionoecetes opilio). Environ. Stud. Res. Funds Rep. 144. Calgary, Alberta.
Christian, J. R., A. Mathieu, and R. A. Buchanan. 2004. Chronic effects of seismic energy on snow crab (Chionoecetes opilio). Environ. Stud. Res. Funds Rep. 158, Calgary, Alberta.
Clark, C. W., W. T. Ellison, B. L. Southall, L. Hatch, S. VanParijs, A. Frankel, and D. Ponirakis. 2009. Acoustic masking in marine ecosystems: intuitions, analysis, and implications. Marine Ecology Progress Series 395: 201-222.
Clark, S.H.B. 1973. The McHugh Complex of South-Central Alaska. Contributions to Stratigraphy. Geological Survey Bulletin 1372-D. Library of Congress catalog NO. 72-600325.

Biological Assessment of the Cook Inlet Beluga Whale (Delphinapterus leucas) for the Seward Highway MP 105-107 Windy Corner Project
Page 109
Clausen, D. M. 1981. Summer food of Pacific cod, Gadus macrocephalus, in coastal waters of southeastern Alaska. Fishery Bulletin 78(4): 968-973.
Clausen, D. M. 1983. Food of walleye pollock, Theragra chalcogramma, in an embayment in southeastern Alaska. Fishery Bulletin 81(3): 637-642.
Cohen, D.M., T. Inada, T. Iwamoto, and N. Scialabba. 1990. Gadiform fishes of the world (Order Gadiformes). FAO species catalogue: An annotated and illustrated catalogue of cods, hakes, grenadiers and other gadiform fishes known to date. FAO Fisheries Synopsis 10(125): 1-442.
Cornick, L. A., and L. S. Kendall. 2008a. Distribution, habitat use, and behavior of Cook Inlet beluga whales in Knik Arm, Fall 2007. Final annual report for 2007. Prepared for Integrated Concepts and Research Corporation. Prepared by Alaska Pacific University. Anchorage, Alaska.
Cornick, L. A., and L. S. Kendall. 2008b. Distribution, habitat use and behavior of Cook Inlet Beluga Whales and other marine mammals at the Port of Anchorage Marine Terminal Redevelopment Project June-November, 2008. Prepared for U.S. Department of Transportation Maritime Administration, Port of Anchorage and Integrated Concepts and Research Corporation. Prepared by Alaska Pacific University. Anchorage, Alaska.
Cornick, L. A., L. S. Kendall, and L. C. Pinney. 2010. Distribution, habitat use and behavior of the Cook Inlet beluga whales and other marine mammals at the Port of Anchorage Marine Terminal Redevelopment Project, May-November 2009. Scientific Marine Mammal Monitoring Program 2009 Annual Report. Prepared for U.S. Department of Transportation Maritime Administration, the Port of Anchorage and Integrated Concepts and Research Corporation. Prepared by Alaska Pacific University. Anchorage, Alaska. 99 p.
Couillard, C. M., R. W. Macdonald, S. C. Courtenay, and V. P. Palace. 2008a. Interactions between toxic chemicals and other environmental factors affecting the risk of impacts on aquatic organisms: a review with a Canadian perspective - Interactions affecting exposure. Environmental Review 16: 1-17.
Couillard, C. M., S. C. Courtenay, and R. W. Macdonald. 2008b. Interactions between toxic chemicals and other environmental factors affecting the risk of impacts on aquatic organisms: a review with a Canadian perspective - Interactions affecting vulnerability. Environmental Review 16: 19-44.
DFO. 2004. Potential impacts of seismic energy on snow crab. Canadian Science Advisory Secretariat Habitat Status Report 2004/003.
Eley, W. David and Nuka Research & Planning, Inc. 2006. Cook Inlet Vessel Traffic Study:Report to Cook Inlet Regional Citizens Advisory Council, Cape International, Inc. and Nuka Research & Planning Inc., December 2006.
Eschmeyer, W.N., E.S. Herald, and H. Hammann. 1983. A field guide to Pacific coast fishes of North America. Houghton Mifflin Company, Boston, MA.
Ezer, T., R. Hobbs, and L.Y. Oey. 2008. On the movement of beluga whales in Cook Inlet, Alaska: Simulations of tidal and environmental impacts using a hydrodynamic inundation model. Oceanography 21(4): 186-195.

Biological Assessment of the Cook Inlet Beluga Whale (Delphinapterus leucas) for the Seward Highway MP 105-107 Windy Corner Project
Page 110
Fair, P. A. and P. R. Becker. 2000. Review of stress in marine mammals. J. Aquat. Ecosyst. Stress Recov. 7:335-354.
Fall, J. A., D. J. Foster, and R. T. Stanek. 1984. The use of fish and wildlife resources in Tyonek, Alaska - Tubughna ch'adach' ełnen ghuhdiłt'a. Alaska Department of Fish and Game, Division of Subsistence, Technical Paper 105: 233 p.
Finneran, J. J. 2012. Auditory effects of underwater noise in odontocetes. p. 197-202 In: A.N. Popper and A. Hawkins (eds.). The effects of noise on aquatic life. Springer, New York. 695 p.
Finneran, J. J. and C. E. Schlundt. 2010. Frequency-dependent and longitudinal changes in noise-induced hearing loss in a bottlenose dolphin (Tursiops truncatus) (L). J. Acoust. Soc. Am. 128(2):567-570.
Finneran, J. J. and C. E. Schlundt. 2011. Noise-induced temporary threshold shift in marine mammals. J. Acoust. Soc. Am. 129(4):2432. [supplemented by oral presentation at the ASA meeting, Issaquah, WA, May 2011].
Finneran, J. J., C. E. Schlundt, D. A. Carder, J. A. Clark, J. A. Young, J. B. Gaspin, and S. H. Ridgway. 2000. Auditory and behavioral responses of bottlenose dolphins (Tursiops truncatus) and beluga whale (Delphinapterus leucas) to impulsive sounds resembling distant signatures of underwater explosions. J. Acoust. Soc. Am. 108(1):417-431.
Finneran, J. J., C. E. Schlundt, R. Dear, D.A. Carder, and S.H. Ridgway. 2002b. Temporary shift in masked hearing thresholds (MTTS) in odontocetes after exposure to single underwater impulses from a seismic watergun. Journal of the Acoustical Society of America 111(6): 2929-2940.
Finneran, J. J., Carder, D. A., & Ridgway, S. H. 2002a. Low frequency acoustic pressure, velocity and intensity thresholds in a bottlenose dolphin (Tursiops truncatus) and white whale (Delphinapterus leucas). Journal of the Acoustical Society of America, 111, 447-456.
Finneran, J. J., D. A. Carder, C. E. Schlundt, and S. H. Ridgway. 2005. Temporary threshold shift in bottlenose dolphins (Tursiops truncatus) exposed to mid-frequency tones. J. Acoust. Soc. Am. 118(4):2696-2705.
Finneran, J. J., D. A. Carder, C. E. Schlundt, and R. L. Dear. 2010. Temporary threshold shift in a bottlenose dolphin (Tursiops truncatus) exposed to intermittent tones. J. Acoust. Soc. Am. 127(5):3267-3272.
Finneran, J. J., J. S. Trickey, B. K. Branstetter, C. E. Schlundt, and K. Jenkins. 2011. Auditory effects of multiple underwater impulses on bottlenose dolphins (Tursiops truncatus). J. Acoust. Soc. Am. 130(4):2561.
Fraker, M. A. 1978. The 1978 whale monitoring program/Mackenzie Estuary, N.W.T. Rep. from F.F. Slaney & Co. Ltd., Vancouver, B.C., for Esso Resources Canada Ltd., Calgary, Alb. 28 p.
Frost, K.J., L.F. Lowry, and R.R. Nelson. 1983. Investigations of belukha whales in coastal waters of western and northern Alaska, 1982-1983: marking and tracking of whales in Bristol Bay. U.S. Dept. Commer. NOAA, OCSEAP Final Rep. 43(1986):461-585.

Biological Assessment of the Cook Inlet Beluga Whale (Delphinapterus leucas) for the Seward Highway MP 105-107 Windy Corner Project
Page 111
Frost, K. J., R. B. Russell, and L. F. Lowry. 1992. Killer whales, Orcinus orca, in the southeastern Bering Sea: recent sightings and predation on other mairne mammals. Marine Mammal Science 8(2): 110-119.
Funk, D. W., T. M. Markowitz, and R. J. Rodrigues, (eds.). 2005. Baseline studies of beluga whale habitat use in Knik Arm, Upper Cook Inlet, Alaska: July 2004-July 2005. Report from LGL Alaska Research Associates, Inc., Anchorage, AK, in association with HDR Alaska, Inc., Anchorage, AK, for Knik Arm Bridge and Toll Authority, Anchorage, AK, Department of Transportation and Public Facilities, Anchorage, AK, and Federal Highway Administration, Juneau, AK.
Gervaise, C., Y. Simard, N. Roy, B. Kinda, and N. Menard. 2012. Shipping noise in whale habitat: Characteristics, sources, budget, and impact on belugas in Saguenay--St. Lawrence Marine Park hub. The Journal of the Acoustical Society of America 132(1): 76-89.
Goetz, K. T., D. J. Rugh, A. J. Read, and R. C. Hobbs. 2007. Habitat use in a marine ecosystem: beluga whales Delphinapterus leucas in Cook Inlet, Alaska. Marine Ecology Progress Series 330:247-256.
Goetz, K. T., P. W. Robinson, R. C. Hobbs, K. L. Laidre, L. A. Huckstadt, and K. E. W. Shelden. 2012b. Movement and dive behaviour of beluga whales in Cook Inlet, Alaska. AFSC Processed Rep. 2012-03, 40 p. Alaska Fish. Sci. Cent., NOAA, Natl. Mar. Fish. Serv., 7600 Sand Point Way NE, Seattle, WA, 98115.
Goetz, K. T., R. A. Montgomery, J. M. Ver Hoef, R. C. Hobbs, and D. S. Johnson. 2012a. Identifying essential summer habitat of the endangered beluga whale Delphinapterus leucas in Cook Inlet, Alaska. Endang. Spec. Res. 16:135-147.
Haley, D. 1986. Marine Mammals. Second edition.Pacific Search Press, Seattle, WA.
Halvorsen, M. B., L. E. Wysocki, C. M. Stehr, D. H. Baldwin, D. R. Chicoine, N. L. Scholz, and A. N. Popper. 2009. Barging effects on sensory systems of Chinook salmon smolts. Trans. Am. Fish. Soc. 138:777-789.
Halvorsen, M. B., B. M. Casper, C. M. Woodley, T. J. Carlson, and A. N. Popper. 2011. Predicting and mitigating hydroacoustic impacts on fish from pile installations. NCHRP Research Results Digest 363, Project 25-28, National Cooperative Highway Research Program, Transportation Research Board, National Academy of Sciences, Washington, DC.
Hansen, D. J. and J. D. Hubbard. 1999. Distribution of Cook Inlet beluga whales (Delphinapterus leucas) in winter. U.S. Dept. Inter., Minerals Manage. Serv., Alaska OCS Region, Anchorage, Final Rep., OCS Study MMS 99-0024.
Hart Crowser, Incorporated/Pentec Environmental and Illingworth and Rodkin, Incorporated. 2009. Acoustic monitoring and in-situ exposures of juvenile coho salmon to pile-driving noise at the Port of Anchorage Marine Terminal Redevelopment Project, Knik Arm, Anchorage, Alaska. Prepared for URS Corporation, Integrated Concepts and Research Corporation, and Port of Anchorage. October 21, 2009. Report Number 12684-03.

Biological Assessment of the Cook Inlet Beluga Whale (Delphinapterus leucas) for the Seward Highway MP 105-107 Windy Corner Project
Page 112
Hastings, M. C. and A. N. Popper. 2005. Effects of sound on fish. Prepared for Jones & Stokes, Sacramento, CA, for California Department of Transportation, Sacramento, CA. 28 January.
Hazard, K. 1988. Beluga whale, Delphinapterus leucas. Pages 195-235 In: Selected marine mammals of Alaska: Species accounts with research and management recommendations. J.W. Lentfer (ed.). Marine Mammal Commission, Washington, D.C.
Heat, Light, and Sound Research (HLS). 2014. Sound Propagation Modeling, Turnagain Arm, Cook Inlet. Report by Heat, Light, and Sound Research, La Jolla, CA, in association with LGL Alaska Research Associates, Inc., for Alaska Department of Transportation and Public Facilities.
Heide-Jørgensen, M. P. and J. Teilmann. 1994. Growth, reproduction, age structure and feeding habits of white whales (Delphinapterus leucas) in West Greenland waters. Meddeleleser om Grønland, Bioscience 39: 195-212.
Heide-Jørgensen, M. P., P. R. Richard, and A. Rosing-Asvid. 1998. Dive patterns of belugas (Delphinapterus leucas) in waters near eastern Devon Island. Arctic 51(1): 17-26.
Hildebrand, J. A. 2005. Impacts of anthropogenic sound. p. 101-124 In: J.E. Reynolds, W.F. Perrin, R.R. Reeves, S. Montgomery, and T. Ragen (eds.) Marine Mammal Research: Conservation Beyond Crisis. Johns Hopkins Univ. Press, Baltimore, MD. 223 p.
Hobbs, R. C. 2013. Detecting Changes in Population Trends for Cook Inlet Beluga Whales (Delphinapterus leucas) Using Alternative Schedules for Aerial Surveys. Technical Memorandum NMFS-AFSC-252. Seattle: National Marine Fisheries Service.
Hobbs, R. C., K. L. Laidre, D. J. Vos, B. A. Mahoney, and M. Eagleton. 2005. Movements and area use of belugas, Delphinapterus leucas, in a Subarctic Alaskan estuary. Arctic 58(4):331-340.
Hobbs, R. C., K. E. W. Shelden, D. J. Vos, K. T. Goetz, and D. J. Rugh. 2006. Status review and extinction assessment of Cook Inlet belugas (Delphinapterus leucas). AFSC Processed Report 2006-16. Alaska Fisheries Science Center, National Maine Fisheries Service, NOAA, 74 p.
Hobbs, R. C., C. L. Sims, and K. E. W. Shelden. 2012. Estimated abundance of belugas in Cook Inlet, Alaska, from aerial surveys conducted in June 2012. NMFS, NMML Unpublished Report. 7 pp.
Huntington, H. P. 2000. Traditional knowledge of the ecology of belugas, Delphinapterus leucas, in Cook Inlet, Alaska. Mar. Fish. Rev. 62(3):134-140.
Houghton, J., J. Starkes, J. Stutes, M. Havey, J. Reyff, and D. Erikson. 2010. Acoustic monitoring and in-situ exposures of juvenile coho salmon to pile-driving noise at the Port of Anchorage Marine Terminal Redevelopment Project, Knik Arm, Alaska. Poster presentation at Alaska Marine Science Symposium. January 18–22, 2010, Anchorage.
Johnson C. S. 1967. Sound detection thresholds in marine mammals. p. 247-260 In: W.N. Tavolga (ed.) Marine Bio-Acoustics, Vol. 2. Pergamon, New York.
Johnson C. S., M. W. McManus, and D. Skaar. 1989. Masked tonal hearing thresholds in the beluga whale. J. Acoust. Soc. Am. 85(6):2651-2654.

Biological Assessment of the Cook Inlet Beluga Whale (Delphinapterus leucas) for the Seward Highway MP 105-107 Windy Corner Project
Page 113
Kane, A. S., J. Song, M. B. Halvorsen, D. L. Miller, J. D. Salierno, L. E. Wysocki, D. Zeddies, and A. N. Popper. 2010. Exposure of fish to high-intensity sonar does not induce acute pathology. J. Fish Biol. 76(7):1825-1840.
Kastak, D., R. L. Schusterman, B. L. Southall, and C. J. Reichmuth. 1999. Underwater temporary threshold shift induced by octave-band noise in three species of pinnipeds. J. Acoust. Soc. Am. 106(2):1142-1148.
Katona, S.K., V. Rough, and D.T. Richardson. 1983. A field guide to the whales, porpoises and seals of the Gulf of Maine and eastern Canada. New York: Charles Scribner's Sons.
Kellogg, W. N. 1958. Echo-ranging in the porpoise. Science 128: 982-988.
Kendall, L. S. 2010. Construction impacts on the Cook Inlet beluga whale (Delphinapterus leucas) at the Port of Anchorage Marine Terminal Redevelopment Project. M.Sc. thesis, Alaska Pacific University. 88 p.
Kendall, L. S., A. Širović, and L. A. Cornick. 2009. Movement patterns and behavioral responses of the Cook Inlet beluga whale (Delphinapterus leucas) to pile driving at the Port of Anchorage Expansion. Abstract of the 18th Biennial Conference on the Biology of Marine Mammals, 12-16 October 2009, Quebec, Canada.
Ketten, D. R. 1994. Functional analysis of whale ears: adaptations for underwater hearing. IEEE Proc. Underw. Acoust. 1:264-270.
Ketten, D. R. 2012. Marine mammal auditory system noise impacts: evidence and incidence. p. 207-212 In: A.N. Popper and A. Hawkins (eds.) The effects of noise on aquatic life. Springer, New York. 695 p.
King, B. 1989. It's whale eat whale in Naknek. Alaska Fishermen's Journal 12(6): 2.
Klishin, V. O., V. V. Popov, and A. Y. Supin. 2000. Hearing capabilities of a beluga whale, Delphinapterus leucas. Aquatic Mammals 2000, 26.3, 212-228.
Kryter, K. D. 1985. The effects of noise on man, 2nd ed. Academic Press, Orlando, FL. 688 p.
Kryter, K. D. 1994. The handbook of hearing and the effects of noise. Academic Press, Orlando, FL.
Kuczaj, S. (ed). 2007. Considerations of the effects of noise on marine mammals and other animals. International Journal of Comparative Psychology, Special Issue Volume 20(2-3): 233.
Lammers, M. O., M. Castellote, R. J. Small, S. Atkinson, J. Jenniges, A. Rosinski, J. N. Oswald, C. Garner. 2013. Acoustic monitoring of beluga whales and noise in Cook Inlet. 2013. Passive acoustic monitoring of Cook Inlet beluga whales (Delphinapterus leucas) J. Acoust. Soc. Am. 134 (3), Pt. 2, September 2013.
Le Prell, C. G. 2012. Noise-induced hearing loss: from animal models to human trials. p. 191-195 In: A.N. Popper and A. Hawkins (eds.) The effects of noise on aquatic life. Springer, New York. 695 p.

Biological Assessment of the Cook Inlet Beluga Whale (Delphinapterus leucas) for the Seward Highway MP 105-107 Windy Corner Project
Page 114
Lerczak, J. A., K. E. W. Shelden, and R. C. Hobbs. 2000. Application of suction-cup-attached VHF transmitters to the study of beluga, Delphinapterus leucas, surfacing behavior in Cook Inlet, Alaska. Mar. Fish. Rev. 62(3): 99-111.
Lesage, V., C. Barrette, M. C. S. Kingsley, and B. Sjare. 1999. The effect of vessel noise on the vocal behavior of belugas in the St. Lawrence River estuary, Canada. Marine Mammal Science, 15(1), 65-84.
Levenson, D. H. and A. Dizon. 2003. Genetic evidence for the ancestral loss of short-wave length-sensitive cone pigments in mysticete and odontocete cetaceans. Proceedings of the Royal Society of London Series B-Biological Sciences 270(1516): 673-679.
Lowry, L. F., J. J. Burns, and R. R. Nelson. 1987. Polar bear, Ursus maritmus, predation on belugas, Delphinapterus leucas, in the Bering and Chukchi Seas. Canadian Field-Naturalist 101(2): 141-146.
Lusseau, D. and L. Bejder. 2007. The long-term consequences of short-term responses to disturbance experience from whalewatching impact assessment. Intern. J. Comp. Psych. 20(2-3):228-236.
Madsen, P. T., M. Wahlberg, J. Tougaard, K. Lucke, and P. Tyack. 2006. Wind turbine underwater noise and marine mammals: implications of current knowledge and data needs. Mar. Ecol. Prog. Ser. 309:279-295.
Mahoney, B. A., and K. E. W. Shelden. 2000. Harvest history of beluga whale, Delphinapterus leucas, in Cook Inlet, Alaska. Mar. Fish. Rev. 62(3): 124-133.
Markowitz, T. M. and T. L. McGuire (eds.) 2007. Temporal-spatial distribution, movements and behavior of beluga whales near the Port of Anchorage, Alaska. Report from LGL Alaska Research Associates, Inc., Anchorage, AK, for Integrated Concepts and Research Corporation and the U.S. Department of Transportation Maritime Administration.
Markowitz, T. M., T. L. McGuire, and D. M. Savarese. 2007. Monitoring beluga whale (Delphinapterus leucas) distribution and movements in Turnagain Arm along the Seward Highway. Final Report. Report from LGL Alaska Research Associates, Inc., Anchorage, AK, for HDR and the Alaska Department of Transportation and Public Facilities.
McCauley, R. D., J. Fewtrell, A. J. Duncan, C. Jenner, M. N. Jenner, J. D. Penrose, R. I. T. Prince, A. Adhitya, J. Murdoch, and K. McCabe. 2000a. Marine seismic surveys: analysis of airgun signals; and effects of air gun exposure on humpback whales, sea turtles, fishes and squid. Rep. from Centre for Marine Science and Technology, Curtin Univ., Perth, W.A., for Austral. Petrol. Prod. Assoc., Sydney, N.S.W. 188 p.
McCauley, R. D., J. Fewtrell, A. J. Duncan, M. N. Jenner, C. Jenner, R. I. T. Prince, A. Adhitya, K. McCabe, and J. Murdoch. 2000b. Marine seismic surveys – a study of environmental implications. APPEA (Austral. Petrol. Product. Explor. Assoc.) J. 40:692-708.
McCauley, R. D., J. Fewtrell, and A. N. Popper. 2003. High intensity anthropogenic sound damages fish ears. J. Acoust. Soc. Am. 113, 1: 638-642.
McGuire, T. L. Unpublished data. Personal observations of CIBW 2006-2014. LGL Alaska Research Associates, Inc. 2000 W International Airport Rd, Ste C1, Anchorage, AK. 99502.

Biological Assessment of the Cook Inlet Beluga Whale (Delphinapterus leucas) for the Seward Highway MP 105-107 Windy Corner Project
Page 115
McGuire, T. L., and M. L. Bourdon. 2009. Pre-Deployment Visual Monitoring for Beluga Whales in and near the Cook Inlet Tidal Energy Project Proposed Deployment Area, June-November 2009. Report prepared by LGL Alaska Research Associates, Inc., Anchorage, AK, for Ocean Renewable Power Company, Anchorage, AK. 36 p. + Appendices.
McGuire, T. and M. Bourdon. 2012. Photo-identification of beluga whales in Upper Cook Inlet, Alaska. Final report of field activities and belugas re-sighted in 2010. Report prepared by LGL Alaska Research Associates, Inc., Anchorage, AK, for National Fish and Wildlife Foundation, Chevron, and ConocoPhillips Alaska, Inc. 43 p. + Appendices.
McGuire, T. L., M. L. Bourdon and R. Kirchner. 2011. Pre-Deployment Visual Monitoring for Beluga Whales in and near the Cook Inlet Tidal Energy Project Proposed Deployment Area, May-November 2010. Report prepared by LGL Alaska Research Associates, Inc., Anchorage, AK, for Ocean Renewable Power Company, Anchorage, AK. 35 p. + Appendices.
McGuire, T., A. Stephens, and L. Bisson. 2014. Photo-identification of Cook Inlet Beluga Whales in the Waters of the Kenai Peninsula Borough, Alaska. Final Report of Field Activities and Belugas Identified 2011–2013. Report prepared by LGL Alaska Research Associates, Inc., Anchorage, AK, for the Kenai Peninsula Borough. 92 p. + Appendices.
Mooney, T. A., P. E. Nachtigall, M. Castellote, K. A. Talylor, A. F. Pacini and J. A. Esteban. 2008. Hearing pathways and directional sensitivity of the beluga whale, Delphinapterus leucas. Journal of Experimental Marine Biology and Ecology 362(2008):108-116.
Mooney, T. A., P. E. Nachtigall, M. Breese, S. Vlachos, and W. W. L. Au. 2009a. Predicting temporary threshold shifts in a bottlenose dolphin (Tursiops truncatus): the effects of noise level and duration. J. Acoust. Soc. Am. 125(3):1816-1826.
Mooney, T. A., P. E. Nachtigall, and S. Vlachos. 2009b. Sonar-induced temporary hearing loss in dolphins. Biol. Lett. 4(4):565-567.
Moore, S. E., K. E. W. Shelden, L. K. Litzky, B. A. Mahoney, and D. J. Rugh. 2000. Beluga, Delphinapterus leucas, habitat associations in Cook Inlet, Alaska. Marine Fisheries Review 62:60-80.
Moriyasu, M., R. Allain, K. Benhalima, and R. Claytor. 2004. Effects of seismic and marine noise on invertebrates: A literature review. Fisheries and Oceans Canada, Science. Canadian Science Advisory Secretariat Research Document 2004/126.
Mulherin, N.D, W.B. Tucker III, O.P. Smith, W.J. Lee. 2001. Marine ice atlas for Cook Inlet, Alaska. ERDC/CRREL TR-01-10, Cold Regions Research and Engineering Laboratory, Hanover, NH, for NOAA, Office of Response and Restoration, Seattle, WA.
Nachtigall, P. E., J. L. Pawloski, and W. W. L. Au. 2003. Temporary threshold shifts and recovery following noise exposure in the Atlantic bottlenose dolphin (Tursiops truncatus). J. Acoust. Soc. Am. 113(6):3425-3429.

Biological Assessment of the Cook Inlet Beluga Whale (Delphinapterus leucas) for the Seward Highway MP 105-107 Windy Corner Project
Page 116
Nachtigall, P. E., A. Y. Supin, J. Pawloski, and W. W. L. Au. 2004. Temporary threshold shifts after noise exposure in the bottlenose dolphin (Tursiops truncatus) measured using evoked auditory potentials. Mar. Mamm. Sci. 20(4):673-687.
National Marine Fisheries Service (NMFS). 2000. Taking marine mammals incidental to construction and operation of offshore oil and gas facilities in the Beaufort Sea/Final Rule. Fed. Regist. 65 (102, 25 May): 34014-34032.
National Marine Fisheries Service (NMFS). 2005. Endangered Fish and Wildlife; Notice of Intent to Prepare an Environmental Impact Statement. Fed. Regist. 70(7):1871-1875.
National Marine Fisheries Service (NMFS). 2008a. Conservation plan for the Cook Inlet beluga whale (Delphinapterus leucas). National Marine Fisheries Service, Juneau, Alaska. 122p. [available from http://www.fakr.noaa.gov].
National Marine Fisheries Service (NMFS). 2008b. Endangered and threatened species; endangered status of the Cook Inlet beluga whale. Federal Register 73(205):62919-62930.
National Marine Fisheries Service (NMFS). 2011. Endangered and threatened species: designation of critical habitat for Cook Inlet beluga whale; Final rule. Fed. Reg. 76(69, 11 April 2011):20180-20214.
National Oceanic and Atmospheric Administration (NOAA) bathymetric database. http://www.ngdc.noaa.gov/mgg/bathymetry/relief.html
National Research Council (NRC). 2005. Marine Mammal Population and Ocean Noise: Determining When Noise Causes Biologically Significant Effects. Washington DC: The National Academies Press. 126pp.
Nedwell, J. R., A. W. H. Turnpenny, J. M. Lovell, and B. Edwards. 2006. An investigation into the effects of underwater piling noise on salmonids. J. Acoust. Soc. Am. 120(5):2550-2554.
Nemeth, M. J., C. C. Kaplan, A. M. Prevel-Ramos, G. D. Wade, D. M. Savarese, and C. D. Lyons. 2007. Baseline studies of marine fish and mammals in Upper Cook Inlet, April through October 2006. Final report prepared by LGL Alaska Research Associates, Inc., Anchorage, AK for DRven Corporation, Anchorage, AK.
Nieukirk, S. L., S. L. Heimlich, S. E. Moore, K. M. Stafford, R. P. Dziak, M. Fowler, J. Haxel, J. Goslin, and D. K. Mellinger. 2009. Whales and airguns: an eight-year acoustic study in the central North Atlantic. p. 181-182 In: Abstr. 18th Bienn. Conf. Biol. Mar. Mamm., Québec, Oct. 2009. 306 p.
Norman, S. A. 2011. Anthropogenic and environmental stressors in Cook Inlet beluga whales (Delphinapterus leucas)- Literature Review and Assessment. Report for NOAA Fisheries, National Marine Fisheries Service, Anchorage, Alaska. NMFS contract no. HA133F-10-SE-3639. 113p.
Nowacek, D. P., L. H. Thorne, D. W. Johnston, and P. L. Tyack. 2007. Responses of cetaceans to anthropogenic noise. Mamm. Rev. 37(2):81-115.
Nowak, R. M. 1991. Walker's Mammals of the World, Volume 2, Fifth edition. The Johns Hopkins University Press, Baltimore.

Biological Assessment of the Cook Inlet Beluga Whale (Delphinapterus leucas) for the Seward Highway MP 105-107 Windy Corner Project
Page 117
Nowak, R. M. 2003. Walker’s Marine Mammals of the World. Johns Hopkins University Press, Baltimore, Maryland.
O’Corry-Crowe, G. M. 2002. Beluga whales. In: Encyclopedia of Marine Mammals. W. F. Perrin, B. Würsig, and J. G. M. Thewissen (eds.). Academic Press, San Diego, CA.
O’Corry-Crowe, G. M., A. E. Dizon, R. S. Suydam, and L. F. Lowry. 2002. Molecular genetic studies of population structure and movement patterns in a migratory species: the beluga whale (Delphinapterus leucas) in the western Nearctic. In: Molecular and Cell Biology of Marine Mammals. C.J. Pfeiffer (ed.). Krieger Publishing Company, Malabar FL. Pg 53-64.
O’Corry-Crowe, G. M., R. S. Suydam, A. Rosenberg, K. J. Frost, and A. E. Dizon. 1997. Phylogeography, population structure and dispersal patterns of beluga whale Delphinapterus leucas in western Nearctic revealed by mitochondrial DNA. Molecular Ecology, 6(10): 955-970.
O’Corry-Crowe, G. M., C. Lydersen, M. P. Heide-Jorgensen, L. Hansen, L. M. Mukhametov, O. Dove, and K. M. Kovacs. 2010. Population genetic structure and evolutionary history of North Atlantic beluga whales (Delphinapterus leucas) from West Greenland, Svalbard and the White Sea. Polar Biology 33(9): 1179-1194.
Oestman, R. and C. J. Earle. 2012. Effects of pile-driving noise on Oncorhynchus mykiss (steelhead trout). p. 263-268 In: A. Hawkins and A.N. Popper (eds.) The Effects of Noise on Aquatic Life. Springer-Verlag, New York, NY.
Ouellet, P. 1979. Northern whales [LP phonograph record]. Cat. No. 19. Music Gallery Editions, Toronto, Ont.
Parry, G. D. and A. Gason. 2006. The effect of seismic surveys on catch rates of rock lobsters in western Victoria, Australia. Fish. Res. 79:272-284.
Payne, J. F., C. Andrews, L. Fancey, D. White, and J. Christian. 2008. Potential effects of seismic energy on fish and shellfish: An update since 2003. Canadian Science Advisory Secretariat Research Document 2008/060. Department of Fisheries and Oceans Canada.
Peichl, L., G. Behrmann, and R. H. H. Kröger. 2001. For whales and seals the ocean is not blue: A visual pigment loss in marine mammals. European Journal of Neuroscience 13(8): 1520-1528.
Popper, A. N. 2009. Are we drowning out fish in a sea of noise? Mar. Scientist 27:18-20.
Popper, A. N. and M. C. Hastings. 2009a. The effects of human-generated sound on fish. Integ. Zool. 4: 43-52.
Popper, A. N. and M. C. Hastings. 2009b. The effects of anthropogenic sources of sound on fishes. J. Fish Biol. 75: 455-489.
Popper, A. N., M. E. Smith, P. A. Cott, B. W. Hanna, A. O. MacGilvray, M. E. Austin, and D. A. Mann. 2005. Effects of exposure to seismic air gun use on hearing of three fish species. J. Acoust. Soc. Am. 117(6):3958-3971.
Prevel-Ramos, A. M., M. J. Nemeth, and A. M. Baker. 2008. Marine mammal monitoring at Ladd Landing in Upper Cook Inlet, Alaska, from July through October 2007. Report

Biological Assessment of the Cook Inlet Beluga Whale (Delphinapterus leucas) for the Seward Highway MP 105-107 Windy Corner Project
Page 118
prepared by LGL Alaska Research Asociates, Inc., Anchorage, AK, for DRven Corporation, Anchorage, AK.
Quakenbush. L. T., and A. L. Bryan. 2014. Diet of Cook Inlet beluga whales from stomach contents. Abstract for 2014 NMFS CIBW Beluga Whale Conference. http://alaskafisheries.noaa.gov/protectedresources/whales/beluga/conference/default.htm.
Richard, P. R., M. P. Heide-Jørgensen, and D. St Aubin. 1998. Fall movements of belugas (Delphinapterus leucas) with satellite-linked transmitters in Lancaster Sound, Jones Sound, and northern Baffin Bay. Arctic 51(1): 5-16.
Richardson, W. J., C. R. Greene, Jr., C. I. Malme, and D. H. Thomson. 1995. Marine Mammals and Noise. Academic Press, San Diego, CA. 576 p.
Ridgway, S., D. A. Carder, T. Kamolnick, R. R. Smith, C. E. Schlundt and W. R. Elsberry. 2001. Hearing and whistling in the deep sea: depth influences whistle spectra but does not attenuate hearing by white whales (Delphinapterus leucas) (Odontoceti, Cetacea). The Journal of Experimental Biology 204, 3829-3841 (2001).
Robeck, T. R., Monfort, S. L., Calle, P. P., Dunn, J. L., Jensen, E., Boehm, J. R., Clark, S. T. 2005. Reproduction, growth and development in captive beluga (Delphinapterus leucas). Zoo Biology, 24(1), 29-49.Sergeant, D.E. 1973. Biology of white whales (Delphinapterus leucas) in western Hudson Bay. Journal of the Fisheries Research Board of Canada 30(8): 1065-1090.
Rolland, R. M., S. E. Parks, K. E. Hunt, M. Castellote, P. J. Corkeron, D. P. Nowacek, S. K. Wasser, and S. D. Kraus. 2012. Evidence of ship noise increases stress in right whales. Proc. R. Soc. B 279:2363-2368.
Romano, T. A., M. J. Keogh, C. Kelly, P. Feng, L. Berk, C. E. Schlundt, D. A. Carder, and J. J. Finneran. 2004. Anthropogenic sound and marine mammal health: measures of the nervous and immune systems before and after intense sound exposure. Can. J. Fish. Aquat. Sci. 61:1124-1134.
Ruggerone, G. T., S. Goodman, and R. Miner. 2008. Behavioral response and survival of juvenile coho salmon exposed to pile driving sounds. Report to Port of Seattle by Natural Resources Consultants, Inc., Seattle, WA.
Rugh, D.J., K.E.W. Shelden, and B.A. Mahoney. 2000. Distribution of beluga whales, Delphinapterus leucas, in Cook Inlet, Alaska, during June/July 1993–99. Marine Fisheries Review 62(3): 6-21.
Rugh, D.J., B.A. Mahoney, and B.K. Smith. 2004. Aerial surveys of beluga whales in Cook Inlet, Alaska, between June 2001 and June 2002. U.S. Department of Commerce, NOAA Technical Memorandum NMFS-AFSC-145, 44 p.
Rugh, D.J., K.E.W. Shelden, C.L. Sims, B.A. Mahoney, B.K. Smith, L.K. Litzky, and R.C. Hobbs. 2005a. Aerial surveys of belugas in Cook Inlet, Alaska, June 2001, 2002, 2003, and 2004. U.S. Department of Commerce, NOAA Technical Memorandum NMFS-AFSC-149, 71 p.
Biological Assessment of the Cook Inlet Beluga Whale (Delphinapterus leucas) for the Seward Highway MP 105-107 Windy Corner Project
Page 119
Rugh, D.J., K.T. Goetz, B.A. Mahoney, B.K. Smith, and T.A. Ruszkowski. 2005b. Aerial surveys of belugas in Cook Inlet, Alaska, June 2005. Unpublished document. National Marine Mammal Laboratory, NMFS, NOAA, Alaska Fisheries Science Center, 17 p.
Rugh, D. J., K. E. W. Shelden, and R. C. Hobbs. 2010. Range contraction in a beluga whale population. Endang. Species Res. 12:69-75.
SACLANT. 1998. Estimation of cetacean hearing criteria levels. Section II, Chapter 7 In: SACLANTCEN Bioacoustics Panel Summary Record and Report. Rep. from NATO Undersea Res. Center. Available at http://enterprise.spawar.navy.mil/nepa/whales/pdf/doc2-7.pdf
Scheifele, P. M., S. Andrew, R. A. Cooper, M. Darre, F. E. Musiek, and L. Max. 2005. Indication of a Lombard vocal response in the St. Lawrence River beluga. J. Acoust. Soc. Am. 117(3):1486-1492.
Schevill, W. E. and B. Lawrence. 1949. Underwater listening to the white porpoise (Delphin-apterus leucas). Science 109(2824):143-144.
Schlundt, C. E., J. J. Finneran, D. A. Carder, and S. H. Ridgway. 2000. Temporary shift in masking hearing thresholds of bottlenose dolphins, Tursiops truncatus, and white whales, Delphinapterus leucas, after exposure to intense tones. J. Acoust. Soc. Am. 107(6):3496-3508.
Seaman, G. A., L. F. Lowry, and K. J. Frost. 1982. Foods of belukha whales (Delphinapterus leucas) in western Alaska. Cetology 44: 1-19
Sergeant, D.E. 1973. Biology of white whales (Delphinapterus leucas) in western Hudson Bay. Journal of the Fisheries Research Board of Canada 30(8): 1065-1090.
Shelden, K. E. W., D. J. Rugh, and B. A. Mahoney. 2003. Killer whale predation on belugas in Cook Inlet, Alaska: Implications for a depleted population. Mar. Mamm. Sci. 19(3):529-44.
Shelden, K. E. W., D. J. Rugh, K. T. Goetz, L. Vate Brattstrom, and B. A. Mahoney. 2008a. Aerial surveys of belugas in Cook Inlet, Alaska, June 2008. NMFS, NMML Unpublished Field Report. 18 p.
Shelden, K. E. W., K. T. Goetz, C. Sims, and B. A. Mahoney. 2008b. Aerial surveys of belugas in Cook Inlet, Alaska, September and October 2008. Unpublished National Marine Fisheries Service aerial survey report. 9 p.
Shelden, K. E. W., D. J. Rugh, K. T., Goertz, C. L. Sims, L. Vate Brattstron, and R. C. Hobbs. 2009a. Aerial surveys of belugas in Cook Inlet, Alaska, June 2009a. NMFS, NMML Unpublished Field Report. 19 p.
Shelden, K. E. W., K. T. Goetz, L. Vate Brattstrom, and B. A. Mahoney. 2009b. Aerial surveys of belugas in Cook Inlet, Alaska, August 2009. NMFS, NMML Unpublished Field Report. 10p.
Shelden, K. E. W., L. Vate Brattstrom, and C. L. Sims. 2010a. Aerial surveys of belugas in Cook Inlet, Alaska, June 2010. NMFS, NMML Unpublished Field Report. 19 p.

Biological Assessment of the Cook Inlet Beluga Whale (Delphinapterus leucas) for the Seward Highway MP 105-107 Windy Corner Project
Page 120
Shelden, K. E. W., L.Vate Brattström, and C. L. Sims. 2010b. Aerial surveys of belugas in Cook Inlet, Alaska, August 2010. Unpublished National Marine Fisheries Service aerial survey report. 11 p.
Shelden, K. E. W., K. T. Goetz, C. L. Sims, L. Vate Brattström, , and R. C. Hobbs. 2011. Aerial surveys of belugas in Cook Inlet, Alaska, June 2011. NMFS, NMML Unpublished Field Report. 18 p.
Shelden, K. E. W., C. L. Sims, L. Vate Brattström, J. A. Mocklin, and R. C. Hobbs. 2012. Aerial surveys of belugas in Cook Inlet, Alaska, June 2012. NMFS, NMML Unpublished Field Report. 18 p.
Širović, A. and L. S. Kendall. 2010. Cook Inlet beluga whale echolocations at the Port of Anchorage expansion. J. Acoust. Soc. Am. 127(3, Part 2):1727.
Sjare, B. L. and T. G. Smith. 1986a. The relationship between behavioral activity and underwater vocalizations of the white whale, Delphinapterus leucas. Can. J. Zool. 64(12):2824-2831.
Sjare, B. L. and T. G. Smith. 1986b. The vocal repertoire of white whales, Delphinapterus leucas, summering in Cunningham Inlet, Northwest Territories. Can. J. Zool. 64(2):407-415.
Smith, T. G. and A. R. Martin. 1994. Distribution and movements of belugas, Delphinapterus leucas in the Canadian high Arctic. Canadian Journal of Fisheries and Aquatic Sciences 51(7): 1653-1663.
Smith, T. G., D. J. St. Aubin, and M. O. Hammill. 1992. Rubbing behaviour of belugas, Delphinapterus leucas, in a high Arctic estuary. Can. J. Zool. 70(12): 2405-2409.
Smith, T. G., M. O. Hammill, and A. R. Martin. 1994. Herd composition and behaviour of white whales (Delphinapterus leucas) in two Canadian Arctic estuaries. Meddelelser om Grønland. Bioscience 39:175-184.
Southall, B. L., A. E. Bowles, W. T. Ellison, J. J. Finneran, R. L. Gentry, C. R. Greene Jr., D. Kastak, D. R. Ketten, J. H. Miller, P. E. Nachtigall, W. J. Richardson, J. A. Thomas, and P. L. Tyack. 2007. Marine mammal noise exposure criteria: initial scientific recommendations. Aquat. Mamm. 33(4):411-522.
Spangler, E. K., R. E., Spangler, and B. L. Norcross. 2003. Eulachon subsistence use and ecology investigations. USFWS Office of Subsistence Management, Fisheries Resource Monitoring Program, Final Report No. 00-041, Anchorage, Alaska.
Speckman, S.G. and J.F. Piatt. 2000. Historic and Current Use of Lower Cook Inlet, Alaska, by Belugas, Delphinapterus leucas. Mar. Fish. Rev. 63(3):22-26.Sp
Stadler, J. H. and D. P. Woodbury. 2009. Assessing the effects to fishes from pile driving: applications of new hydroacoustic criteria. Inter-Noise 2009, Ottawa, Ontario, Canada.
Suydam, R. S. 2009. Age, growth, reproduction, and movements of beluga whales (Delphinapterus leucas) from the eastern Chukchi Sea. PhD Dissertation, University of Washington, 170 p.

Biological Assessment of the Cook Inlet Beluga Whale (Delphinapterus leucas) for the Seward Highway MP 105-107 Windy Corner Project
Page 121
Svarny Carlson B. and S. Brunner. 2012. Observations of Cook Inlet beluga whales, Delphinapterus leucas, along the Anchorage coast between 2008 and 2011. Report submitted by Friends of the Anchorage Coastal Wildlife Refuge to National Marine Fisheries Service, Anchorage, AK. v.p. i-227. http://alaskafisheries.noaa.gov/protectedresources/whales/beluga/reports/cibobservations_2008-2011.pdf
Teilmann, J., J. Tougaard, and J. Carstensen. 2008. Effects from offshore wind farms on harbor porpoises in Denmark. p. 50-59 In: P.G.H. Evans (ed.) Proceedings of the Ascobans/ECS Workshop Offshore Wind Farms and Marine Mammals: Impacts & Methodologies for Assessing Impacts. European Cetacean Society special Publication Series No. 49. San Sebastian, Spain.
Thomas, J. A., R. A. Kastelein, and A. Y. Supin. 1992. Marine mammal sensory systems. Plenum Press, New York.
Thomsen, F., C. Mueller-Blenkle, A. Gill, J. Metcalfe, P. K. McGregor, V. Bendall, M. H. Andersson, P. Sigray, and D. Wood. 2012. Effects of pile driving on the behavior of cod and sole. p. 387-388 In: A. Hawkins and A.N. Popper (eds.) The Effects of Noise on Aquatic Life. Springer-Verlag, New York, NY.
Tougaard, J., J. Carstensen, N. I. Bech, and J. Teilmann. 2006. Final report on the effect of Nysted Offshore wind farm on harbour porpoises. Annual Report to Energi E2 A/S. NERI, Roskilde, Denmark.
URS Corp. 2004. Traffic Noise Analysis Report. Appendix D in Categorical exclusion checklist, Seward Highway Safety Improvements Indian to Potter March, MP 105-115. June 2004.
URS Corp. 2010. Chemical exposures for Cook Inlet beluga whales: a literature review and evaluation. Report prepared for NOAA Fisheries, National Marine Fisheries Service, Anchorage, Alaska. NMFS contract no. AB133F-06-BU-0058. URS Corp.
Vate-Brattstrom, L., C. Sims, R. Hobbs, and B. Mahoney. 2010. The Cook Inlet Beluga Whale Opportunistic Database: A Summary of Opportunistic Sightings During the Past 35 Years. Poster at Alaska Marine Science Symposium, Anchorage, AK, Jan 2010. http://access.afsc.noaa.gov/pubs/posters/pdfs/pVate-Brattstrom01_cook-inlet-beluga-db.pdf
Vos, D. J. and K. E. W. Shelden. 2005. Unusual Mortality in the Depleted Cook Inlet Beluga Population (Delphinapterus leucas). Northwest Naturalist. 86:59-67.
Wartzok, D., A. N. Popper, J. Gordon, and J. Merrill. 2004. Factors affecting the responses of marine mammals to acoustic disturbance. Mar. Technol. Soc. J. 37(4):6-15.
Weilgart, L. S. 2007. A brief review of known effects of noise on marine mammals. Intern. J. Comp. Psychol. 20:159-168.
Western Regional Climate Center 2005. http://www.wrcc.dri.edu/
Wetzel, D. L., E. L. Pulster, and J. E. Reynolds. 2010. Investigating the possibility that pollution due to oil and gas activities may be affecting recovery of Cook Inlet beluga whales (Delphinapterus leucas). Report to the National Marine Fisheries Service,
Biological Assessment of the Cook Inlet Beluga Whale (Delphinapterus leucas) for the Seward Highway MP 105-107 Windy Corner Project
Page 122
Anchorage, AK and the Cook Inlet Region Citizens’ Advisory Council, Anchorage, AK. Mote Marine Laboratory Technical Report Number 1505. 39 p.
White, M. J., J. Norris, D. Ljungblad, K. Baron, and G. Di Sciara. 1978. Auditory thresholds of two beluga whales (Delphinapterus leucas). Hubbs/Sea World Research Institute and Naval Ocean Systems Center, San Diego, California. Techincal Report H/SWRI 78-109.
Wood, F. G. 1973. Marine mammals and man: the Navy's porpoises and sea lions. Robert B. Luce, Washington, D.C.
Woodbury, D. and J. Stadler. 2008. A proposed method to assess physical injury to fishes from underater sound produced during pile driving. Bioacoustics 17(1-3):289-291.
Wright, A. J. and S. Kuczaj. 2007. Noise-related stress and marine mammals: An Introduction. Intern. J. Comp. Psychol. 20(2-3):iii-viii.
Wright, A. J., N. Aguilar Soto, A. L. Baldwin, M. Bateson, C. M. Beale, C. Clark, T. Deak, E. F. Edwards, A. Fernández, A. Godinho, L. T. Hatch, A. Kakuschke, D. Lusseau, D. Martineau, L. M. Romero, L. S. Weilgart, B. A. Wintle, G. Notarbartolo-di-Sciara, and V. Martin. 2007a. Do marine mammals experience stress related to anthropogenic noise? Intern. J. Comp. Psychol. 20(2-3):274-316.
Wright, A. J., N. Aguilar Soto, A. L. Baldwin, M. Bateson, C. M. Beale, C. Clark, T. Deak, E. F. Edwards, A. Fernández, A. Godinho, L. T. Hatch, A. Kakuschke, D. Lusseau, D. Martineau, L. M. Romero, L. S. Weilgart, B. A. Wintle, G. Notarbartolo-di-Sciara, and V. Martin. 2007b. Anthropogenic noise as a stressor in animals: A multidisciplinary perspective. Intern. J. Comp. Psychol. 20(2-3): 250-273.
Wright, A. J., T. Deak, and E. C. M. Parsons. 2009. Concerns related to chronic stress in marine mammals. Intern. Whal. Comm. Working Pap. SC/61/E16. 7 p.
Wright, A. J., T. Deak and E. C. M. Parsons. 2011. Size matters: management of stress responses and chronic stress in beaked whales and other marine mammals may require larger exclusion zones. Mar. Poll. Bull. 63(1-4):5-9.
Young F. C., S. Stein, P. Cole, T. Krarner, F. Graziano. 1996. Evaluation and Management of Highway Runoff Water Quality. Federal Highway Administration, Washington, DC. 113.

Biological Assessment of the Cook Inlet Beluga Whale (Delphinapterus leucas) for the Seward Highway MP 105-107 Windy Corner Project
Page 123
APPENDIX 1. AMBIENT UNDERWATER SOUND LEVELS MEASURE D AT WINDY CORNER, TURNAGAIN ARM, ALASKA (GREENERIDGE SCIENCES , INC.)

Biological Assessment of the Cook Inlet Beluga Whale (Delphinapterus leucas) for the Seward Highway MP 105-107 Windy Corner Project
Page 124
APPENDIX 2. ACOUSTIC MODELING SEWARD HIGHWAY, MP10 5-107, WINDY CORNER (HEAT, LIGHT, AND SOUND RESEARCH)
Biological Assessment of the Cook Inlet Beluga Whale (Delphinapterus leucas) for the Seward Highway MP 105-107 Windy Corner Project
Page 125
APPENDIX 3. MONITORING AND MITIGATION PLAN
The “will affect, not likely to adversely affect” CIBW determination made by DOT&PF with respect to the Windy Corner Project is based on monitoring and mitigation. The overall purpose of the monitoring and mitigation efforts is to reduce exposure of the CIBW to Windy Corner Project activities by reducing the spatial and temporal overlap of project activities and CIBW occurrence. As discussed in Section V, those activities that are of greatest concern with respect to CIBW are blasting and filling. The following provides detailed information about the monitoring and mitigation measures that are an integral part of the Windy Corner Project.
1. Design Modification
The current design was selected from over ten possible project designs considered by DOT&PF. It was selected in part because it minimized the amount of total acres of mudflats that would have to be filled, resulting not only in reduced habitat loss but also a lower potential for disturbance from in-water construction activities. Because less fill material is required, this design also reduces the amount of blasting required. DOT&PF has conducted multiple resource agency technical advisory group (TAG) meetings, with one result being that DOT&PF shifted the proposed highway and railroad realignments to be much closer to shore to minimize impacts to Turnagain Arm and the CIBW.
2. Seasonal Restrictions
In-water construction activities (e.g., blasting and filling) that have the potential to injure or harass marine mammals will be scheduled to coincide with seasons when CIBW are least-likely to be within or near the project area. Seasonal patterns of CIBW occurrence in the Windy Corner Project Action Area were summarized in Section III. Blasting and fill activities will not occur April-early June, or August-October. These activities will be restricted to June, July, and possibly November, December, January, and February.
3. Tidal Restrictions
In-water construction activities (e.g., blasting and filling) which have the potential to injure or harass marine mammals will be scheduled to coincide with tidal stages when CIBW are least-likely to be within or near the project area. Tidal patterns of CIBW occurrence in the Windy Corner Project Action Area were discussed in Section III. Blasting and fill activities will not occur during high, falling, or rising tidal stages. These activities will be limited to low-water periods, in 3-hour blocks of time centered on the low tide (i.e., 1.5 hours before and after low tide). Because there are two low tides per 24-hour day, there is the potential for two workable low-tide windows per day if low tides occur during daylight hours.
4. Acoustic Modelling to Determine Appropriate Safety Zones
Acoustic modelling was used to determine appropriate safety and disturbance zones for CIBW and other marine mammals around Windy Corner Project blasting activities. DOT&PF commissioned Heat, Light, and Sound Research (HLS) to conduct an analysis of the sound that would be produced by land-based blasting activities from the Windy Corner Project. HLS used models to predict the levels of sound produced by blasting and how far this sound would travel

Biological Assessment of the Cook Inlet Beluga Whale (Delphinapterus leucas) for the Seward Highway MP 105-107 Windy Corner Project
Page 126
through the water. Results of the HLS models are presented in Appendix 2 and summarized in Figure. The distance from the sound source to the 180 dB contour (i.e., threshold for injury to CIBW from impulsive sound) is less than 0.2 mi (0.4 km) from the center of each blast site, and the distance to the 160 dB contour (i.e., threshold for CIBW harassment) is less than 0.9 mi (1.5 km) from the center of blast site. The Windy Corner ambient aquatic sound levels across all tidal stages in August 2014 were measured at 74-108 dB re 1 µPa (Burgess 2014, Appendix 1), therefore masking of blasting noise by ambient aquatic background noise will not occur, and 0.9 mi (1.5 km) will be used as a minimum safety zone for all marine mammals.
Figure A1. Windy Corner Project summary of maximum harassment zones per 10 kg blast of ANFO. Note there is no 180-dB contour on the farthest east site (near milepost 104: HLS 2014).
1. Monitoring of Activities with Potential to Injure o r Disturb
Land-based Visual Monitoring
Land-based visual monitoring for CIBW and other marine mammals will be conducted during all blasting and fill activities associated with the Windy Corner Project. Land-based observation stations will be established to monitor safety zones during all blasting and fill activities. Observation stations will be located at shore-sites MS1, MS6, Windy Corner, and Gorilla Rock

Biological Assessment of the Cook Inlet Beluga Whale (Delphinapterus leucas) for the Seward Highway MP 105-107 Windy Corner Project
Page 127
(Figure A1). Although protected species observers (PSOs) will focus on the 1.5 km safety zone around each blast site, they will also monitor to the 1.9 mi (3 km) average detection distance previously estimated for this general location (Markowitz et al. 2007) to allow the PSOs to observe marine mammals that may be approaching the project area from the north or south. Methods used by PSOs to record marine mammal observations and environmental conditions will be the same as those used during other recent land-based studies (Funk et al. 2005; Nemeth et al. 2007; Prevel-Ramos et al. 2008, Markowitz et al. 2007, Markowitz and McGuire 2007, McGuire and Bourdon 2009, McGuire et al. 2011). PSOs will scan the area with a combination of the unaided eye, 7x50 binoculars equipped with an internal compass, and a 20 x 60 spotting scope. All PSOs will have prior experience observing marine mammals and will also undergo project-specific training. Observations will be limited to daylight hours and will cease if environmental conditions limit the PSOs’ ability to detect whales in the 3-km zone (i.e., fog, heavy rain, snow, strong winds, whitecaps). Basic sighting information collected at each observation station will include date, time, species and number of marine mammals sighted, primary and secondary behavior, swimming formation, and environmental conditions. Locations of marine mammals within the surveyed area will be determined using the compass bearing in the binoculars to place animals in 1 km2 grid cells overlaid onto a map of the project area. Distance between marine mammals and Windy Corner Project activities will be noted. All PSOs will have direct communication (via two-way radio) with each other and with the on-duty Windy Corner Project construction managers to initiate shut-down procedures if necessary. The exact protocols for PSOs will be further developed in consultation with NMFS as the details of the Windy Corner construction plan and schedule are finalized.
Ramp-Up Procedures
A trained PSO will be on watch at each active blast or fill site for 30 minutes prior to blasting or fill activity. Blasting or fill activities will not commence if marine mammals are seen in the 3 km monitoring zone during the 30-minute ramp-up period. PSOs will give the all-clear to construction crews after 30 minutes of observations without marine mammals.
Shut-Down Procedures
The monitoring and safety zones will be monitored throughout all blasting and filling activities. If a marine mammal is observed entering or about to enter these zones, operations will be suspended until the animal is clear of the zone. Monitoring of the zone will continue for 30 minutes following the completion of blasting or filling.
Team Briefing
In the weeks preceding seasonal construction activities likely to affect belugas (i.e., blasting and fill), Windy Corner project managers, construction supervisors, and the PSO team will attend a briefing to clearly define the responsibilities of each party, discuss the objectives of the marine mammal monitoring and mitigation program, define the chains of command and points of contact, and review operational procedures. NMFS will be invited to participate in the meeting.

Biological Assessment of the Cook Inlet Beluga Whale (Delphinapterus leucas) for the Seward Highway MP 105-107 Windy Corner Project
Page 128
2. Reporting
DOT&PF will formally notify the NMFS Alaska Region prior to the seasonal commencement of blasting and fill activities for the Windy Corner Project.
During construction, brief monthly progress reports of activities, including marine mammal and monitoring work, and other pertinent information will be provided to NMFS. Any significant observations concerning impacts to marine mammals will be transmitted to NMFS immediately or as soon as possible. A preliminary report on activities and results of the monitoring and mitigation program will be submitted to NMFS within 90 days after the termination of the construction season. The report will provide summaries of the dates and locations of construction operations and details of marine mammal sightings (dates, times, locations, activities, and associated construction activities). All technical reports will provide full documentation of methods, results, and interpretation of all monitoring tasks. The draft final report may be subject to a review process by NMFS. All progress and final reports will be made publically available on the Windy Corner Project Website and on the NMFS Alaska Region Cook Inlet Beluga Website.
3. Stranding and Harassment Response Plans
Windy Corner PSOs will immediately notify NMFS and the Alaska Marine Mammal Stranding Network of any stranded marine mammals are observed. If requested/authorized by NMFS, PSOs would render assistance with any stranding response. In the event of a stranding in the Windy Corner Project Action Area, all project activities will cease until NMFS is consulted.
Windy Corner PSOs will immediately notify the NMFS Office of Law Enforcement if they witness any marine mammal harassment, such as from sightseeing planes, paddle boarders, boaters, hunters, etc.
4. Coordination
PSOs with the Windy Corner Project will coordinate with CIBW research projects that may be occurring in the areas, such as NMFS aerial surveys and the LGL CIBW Photo-ID Project. This coordination will be to share results and to minimize potential conflicts so that activities of one effort do not negatively impact efforts of the other (e.g., coordinate activities so blasting doesn’t occur on a day that NMFS is flying an aerial survey of Turnagain Arm). PSOs will also coordinate with any other monitoring efforts going on in the area. For example, if PSOs for the Seward Highway Milepost 75-90 project are monitoring during the same time, observers on the two projects could alert each other when CIBW were traveling up or down the Arm between monitoring areas.
Attempts will be made to coordinate activities on various DOT&PF projects in Turnagain Arm to minimize cumulative impacts associated with each other (e.g., blasting at Windy Corner and pile driving MP 75-90) and with development projects at other locations in Cook Inlet.