Frit inlet/frit outlet flow field-flow fractionation: methodology for colored dissolved organic...
11
Analytica Chimica Acta 443 (2001) 171–181 Frit inlet/frit outlet flow field-flow fractionation: methodology for colored dissolved organic material in natural waters Eliete Zanardi-Lamardo ∗ , Catherine D. Clark 1 , Rod G. Zika Division of Marine and Atmospheric Chemistry, Rosenstiel School of Marine and Atmospheric Science, University of Miami, 4600 Rickenbacker Causeway, Miami, FL 33149-1098, USA Received 14 June 2000; received in revised form 29 May 2001; accepted 13 June 2001 Abstract Results from the first application FIFO–FlFFF (1 frit inlet/frit outlet–flow field-flow fractionation) to the characterization of colored dissolved organic material (CDOM) in river and coastal waters are described. FlFFF separates compounds based on their diffusional characteristics. The frit inlet/frit outlet (FIFO) feature was recently developed to concentrate samples inside the FlFFF channel for improved stability, reproducibility and sensitivity. Our results show that FIFO increases sensitivity by an order of magnitude and the system has a linear response to molecular weight and concentration over a wide dynamic range. Errors for replicate analyses with a Caloosahatchee River sample from southwest Florida were <2.5% for retention time and <4% for peak areas, indicating good reproducibility and precision for the analysis of CDOM in natural water samples. However, recovery rates were low (35–65% for fresh waters and 5.7–8.1% for marine waters) and it will be necessary to test different membranes and lower molecular weight cut-off to improve recoveries in future studies. Molecular weights were calculated from the measured retention times and log-linear calibration curves generated with polystyrene sulfonate standards (1800–35,000 Da). In river water, ∼98% of CDOM occurred in a fraction centered around 2 kDa and ∼2% in a fraction with a maximum at 13 kDa (based on maximum peak intensity for absorbance at 330 nm and fluorescence at 350–450 nm). This minor higher molecular weight fraction was completely gone in offshore coastal waters. This loss may be due to dilution of the river samples and/or biological and photochemical degradation of CDOM. Irradiating a river sample with sunlight produced a fractogram characteristic of marine waters, suggesting that photodegradation is an important mechanism in altering the molecular and optical characteristics of CDOM. © 2001 Elsevier Science B.V. All rights reserved. Keywords: CDOM; Molecular weight; Field-flow fractionation 1. Introduction Dissolved organic material (DOM), the most abun- dant form of organic matter in the ocean, plays a critical role in marine photochemistry, photobiology ∗ Corresponding author. Tel.: +1-305-361-4713; fax: +1-305-361-4894. E-mail address: [email protected] (E. Zanardi-Lamardo). 1 Present address: Department of Environmental and Chemical Sciences, Chapman University, 1 University Drive, Orange, CA 92866, USA. and the oceanic carbon cycle [1]. Humic materials, a heterogeneous mixture of complex high molecular weight biopolymers with alkyl, aromatic and carboxyl substituents, constitute a significant fraction of DOM [2–5]. The absorption of sunlight by colored DOM (CDOM), the most important sunlight-absorbing dis- solved substance in the sea, leads to the production of short-lived reactive intermediates [6,7]. These radical species participate in a complex interplay of reactions with organic and inorganic substrates (including trace metals) in natural waters. Low molecular weight car- bon compounds from the photodegradation of DOM 0003-2670/01/$ – see front matter © 2001 Elsevier Science B.V. All rights reserved. PII:S0003-2670(01)01202-8
Transcript of Frit inlet/frit outlet flow field-flow fractionation: methodology for colored dissolved organic...

Analytica Chimica Acta 443 (2001) 171–181
Frit inlet/frit outlet flow field-flow fractionation: methodology forcolored dissolved organic material in natural waters
Eliete Zanardi-Lamardo∗, Catherine D. Clark1, Rod G. ZikaDivision of Marine and Atmospheric Chemistry, Rosenstiel School of Marine and Atmospheric Science,
University of Miami, 4600 Rickenbacker Causeway, Miami, FL 33149-1098, USA
Received 14 June 2000; received in revised form 29 May 2001; accepted 13 June 2001
Abstract
Results from the first application FIFO–FlFFF (1 frit inlet/frit outlet–flow field-flow fractionation) to the characterization ofcolored dissolved organic material (CDOM) in river and coastal waters are described. FlFFF separates compounds based ontheir diffusional characteristics. The frit inlet/frit outlet (FIFO) feature was recently developed to concentrate samples insidethe FlFFF channel for improved stability, reproducibility and sensitivity. Our results show that FIFO increases sensitivity byan order of magnitude and the system has a linear response to molecular weight and concentration over a wide dynamic range.Errors for replicate analyses with a Caloosahatchee River sample from southwest Florida were <2.5% for retention timeand <4% for peak areas, indicating good reproducibility and precision for the analysis of CDOM in natural water samples.However, recovery rates were low (35–65% for fresh waters and 5.7–8.1% for marine waters) and it will be necessary to testdifferent membranes and lower molecular weight cut-off to improve recoveries in future studies. Molecular weights werecalculated from the measured retention times and log-linear calibration curves generated with polystyrene sulfonate standards(1800–35,000 Da). In river water, ∼98% of CDOM occurred in a fraction centered around 2 kDa and ∼2% in a fraction witha maximum at 13 kDa (based on maximum peak intensity for absorbance at 330 nm and fluorescence at 350–450 nm). Thisminor higher molecular weight fraction was completely gone in offshore coastal waters. This loss may be due to dilution of theriver samples and/or biological and photochemical degradation of CDOM. Irradiating a river sample with sunlight produceda fractogram characteristic of marine waters, suggesting that photodegradation is an important mechanism in altering themolecular and optical characteristics of CDOM. © 2001 Elsevier Science B.V. All rights reserved.
Keywords: CDOM; Molecular weight; Field-flow fractionation
1. Introduction
Dissolved organic material (DOM), the most abun-dant form of organic matter in the ocean, plays acritical role in marine photochemistry, photobiology
∗ Corresponding author. Tel.: +1-305-361-4713;fax: +1-305-361-4894.E-mail address: [email protected](E. Zanardi-Lamardo).
1 Present address: Department of Environmental and ChemicalSciences, Chapman University, 1 University Drive, Orange, CA92866, USA.
and the oceanic carbon cycle [1]. Humic materials,a heterogeneous mixture of complex high molecularweight biopolymers with alkyl, aromatic and carboxylsubstituents, constitute a significant fraction of DOM[2–5]. The absorption of sunlight by colored DOM(CDOM), the most important sunlight-absorbing dis-solved substance in the sea, leads to the production ofshort-lived reactive intermediates [6,7]. These radicalspecies participate in a complex interplay of reactionswith organic and inorganic substrates (including tracemetals) in natural waters. Low molecular weight car-bon compounds from the photodegradation of DOM
0003-2670/01/$ – see front matter © 2001 Elsevier Science B.V. All rights reserved.PII: S0003 -2670 (01 )01202 -8

172 E. Zanardi-Lamardo et al. / Analytica Chimica Acta 443 (2001) 171–181
stimulate the growth, reproduction, and proliferationof bacteria, with photochemical and biological pro-cesses interacting in the further degradation of DOMin the ocean [8]. CDOM thus lies at the center of aphotochemical cycle that critically impacts the ma-rine environment, but fundamental questions about itsstructure and reactivity remain.
Since chemical composition is a major factor af-fecting reactivity, answers lie within the chemicalstructure of this material. However, characterizationstudies are challenging due to DOM’s complexityand low concentrations in natural waters. Isolatingmaterial from filtered bulk natural water samples canbe done by chromatographic techniques based on thehydrophobic character and acidic functional groupsof the samples, giving fractions with similar chemi-cal properties [9]; or molecular size techniques, e.g.ultrafiltration, producing fractions that may containother non-acidic organic compounds [10].
Another approach to separating humic materials bymolecular size is flow field-flow fractionation (FlFFF).This refers to a set of chromatography-like analyt-ical separation techniques carried out in unpackedribbon-shaped channels [11]. In a FlFFF channel,separation depends only on the diffusion coefficient(D) of the sample, i.e. molecular size. FlFFF thus hasseveral advantages compared to other DOM fraction-ation techniques, e.g. gel permeation chromatographyand ultrafiltration, which may suffer from adsorptionand charge repulsive effects. It is a non-destructivemethod that allows for the use of multiple detectorsin-line or for sized fractions to be collected for anal-ysis by other techniques. FlFFF has previously beenused in studies of water soluble polymers [12], nat-ural samples [13–16], protein characterization [17],and biological organic molecules [18].
Humic substances from soils and rivers have alsobeen analyzed by coupling FlFFF to a UV detector[13,14]. Highly colored natural waters had molecularweight (MW) distributions closest to that of the soilhumate with a molecular weight of approximately1.5 kDa. In related measurements of the molecularsizes of humic materials by other techniques, Thur-man et al. [19] used small-angle X-ray scattering todetermine molecular sizes of 0.5–2 kDa for aquaticfulvic acids and 1 to >10 kDa for aquatic humic acidfractions. High-pressure size exclusion chromatog-raphy (HPSEC) studies of aquatic fulvic acids and
a natural water sample gave similar values rangingfrom 1 to 2.3 kDa [20]. More recently, low molecularweight material (<1 kDa) in natural waters has beenanalyzed by FlFFF with UV detection [15].
These previous studies have demonstrated the util-ity of FlFFF techniques for environmental analysesof complex compounds present in low concentrationsin natural waters [15]. In standard FlFFF techniques,a stop-flow relaxation mode is normally used, whichconsists of stopping the flow and waiting until thesample inside the channel is relaxed, e.g. each samplecomponent forms a steady state distribution near theaccumulation wall. The frit inlet/frit outlet (FIFO)feature was recently added to the FlFFF system todirectly concentrate samples inside the channel, in-stead of using a stop-flow relaxation technique. FIFOeliminates the pressure fluctuations associated withstop-flow relaxation, reduces baseline noise and im-proves reproducibility [17]. FIFO–FlFFF has notbeen used before to analyze natural water samples,but has previously been shown to be useful for pro-tein characterization [17]. In this paper, we report theresults of the first application of FIFO–FlFFF to thecharacterization of CDOM in river and coastal waters.
2. Theory
FlFFF is a size separation technique based on achannel with walls consisting of a ceramic frit ma-terial. Separation is accomplished with two liquidflows, a normal flow inside the channel and a secondcross-flow at 90◦ to the channel that creates a trans-verse barrier. A semi-permeable membrane covers oneside of the channel, allowing the cross-flow to pass butnot the compounds of interest. FlFFF separates com-pounds based on their diffusional characteristic, i.e.molecular size. With appropriate standards, molecularweight distributions and diffusion coefficients (D) canbe calculated from the retention time (tr) and channeloperating conditions. The principles of this techniquehave been described in detail elsewhere [11,13,21,22]and are presented briefly as follows.
The retention ratio (R) is related to the diffusioncoefficient (D) by the following equations:
R = t0
tr= V 0
Vr= 6λ
[coth
(1
2λ
)− 2λ
](1)

E. Zanardi-Lamardo et al. / Analytica Chimica Acta 443 (2001) 171–181 173
λ = DV0
Vcw2(2)
where t0 is the void peak time, tr the retention time,V 0 the channel void peak volume, Vr the retentionvolume, λ the retention parameter, Vc the volumetriccross-flow rate and w the channel thickness.
Many polymers can be used as molecular weightstandards [12–14]. Diffusion coefficients can be re-lated to molecular weight according to the followingequation [23]:
D = a
Mbw
(3)
where a depends on the polymer composition, solventviscosity and temperature, and b is dependent on thepolymer conformation in the solution [24,25].
Rearranging Eqs. (2) and (3), Mw can be directlyrelated to the retention parameter λ by
log λ = −b log Mw + log
(V 0a
w2Vc
)(4)
where a plot of log λ versus log Mw would be linear,with a slope of −b and an intercept equal to the secondterm in Eq. (4).
Fig. 1. A simplified schematic of the FlFFF channel (not to scale).
3. Experimental methodology
3.1. System
The device used was a F-1000-FIFO–FlFFF (FF-Fractionation, Salt Lake City, UT) which has a FIFOsystem that concentrates the sample inside the chan-nel to increase the detection limit of the compounds.Fig. 1 shows a simplified schematic of the FlFFFchannel. The FIFO mechanism consists of a frit el-ement that allows the fluid to be introduced intothe channel through the frit inlet (FI) and removedthrough the frit outlet (FO). The FI flow drives sam-ple components to the other side of the channel, inthe vicinity of their steady-state position, where thesample components are relaxed (Fig. 2). The sum ofthe FI flow and the sample flow equals the channelflow, which for this study was fixed at 1.40 ml min−1.The FO is designed to concentrate the sample com-ponents eluting from the channel by diverting partof the carrier flow, above the accumulation wall,through the permeable frit material. If the FO is dis-abled, all flow goes to the detector, causing dilutionof the fractionated compounds. When the FO flow is
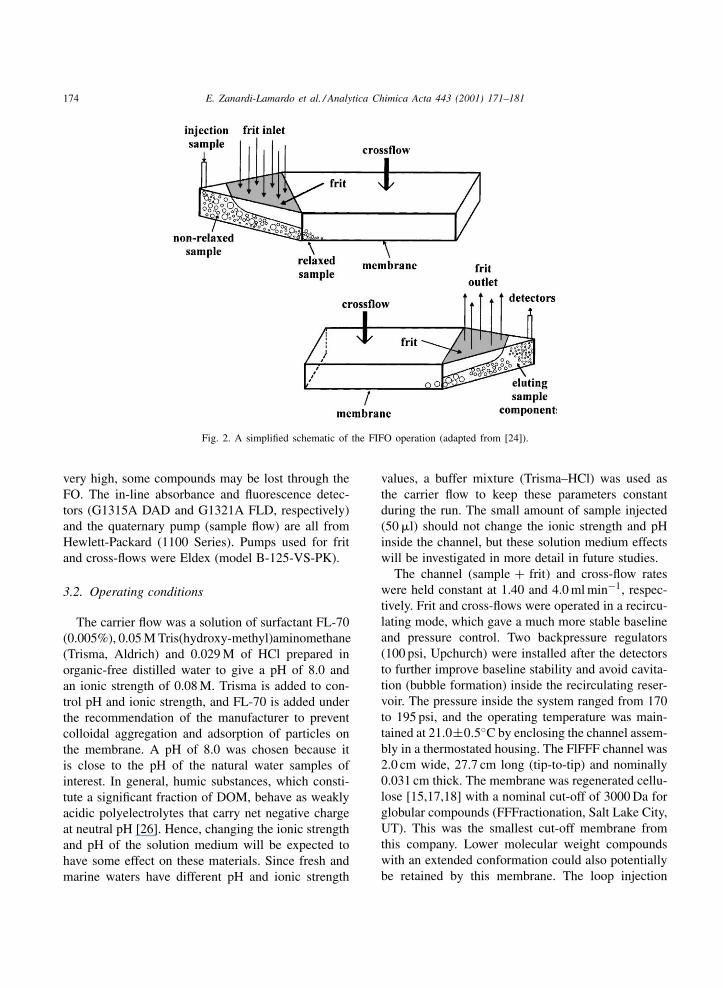
174 E. Zanardi-Lamardo et al. / Analytica Chimica Acta 443 (2001) 171–181
Fig. 2. A simplified schematic of the FIFO operation (adapted from [24]).
very high, some compounds may be lost through theFO. The in-line absorbance and fluorescence detec-tors (G1315A DAD and G1321A FLD, respectively)and the quaternary pump (sample flow) are all fromHewlett-Packard (1100 Series). Pumps used for fritand cross-flows were Eldex (model B-125-VS-PK).
3.2. Operating conditions
The carrier flow was a solution of surfactant FL-70(0.005%), 0.05 M Tris(hydroxy-methyl)aminomethane(Trisma, Aldrich) and 0.029 M of HCl prepared inorganic-free distilled water to give a pH of 8.0 andan ionic strength of 0.08 M. Trisma is added to con-trol pH and ionic strength, and FL-70 is added underthe recommendation of the manufacturer to preventcolloidal aggregation and adsorption of particles onthe membrane. A pH of 8.0 was chosen because itis close to the pH of the natural water samples ofinterest. In general, humic substances, which consti-tute a significant fraction of DOM, behave as weaklyacidic polyelectrolytes that carry net negative chargeat neutral pH [26]. Hence, changing the ionic strengthand pH of the solution medium will be expected tohave some effect on these materials. Since fresh andmarine waters have different pH and ionic strength
values, a buffer mixture (Trisma–HCl) was used asthe carrier flow to keep these parameters constantduring the run. The small amount of sample injected(50 �l) should not change the ionic strength and pHinside the channel, but these solution medium effectswill be investigated in more detail in future studies.
The channel (sample + frit) and cross-flow rateswere held constant at 1.40 and 4.0 ml min−1, respec-tively. Frit and cross-flows were operated in a recircu-lating mode, which gave a much more stable baselineand pressure control. Two backpressure regulators(100 psi, Upchurch) were installed after the detectorsto further improve baseline stability and avoid cavita-tion (bubble formation) inside the recirculating reser-voir. The pressure inside the system ranged from 170to 195 psi, and the operating temperature was main-tained at 21.0±0.5◦C by enclosing the channel assem-bly in a thermostated housing. The FlFFF channel was2.0 cm wide, 27.7 cm long (tip-to-tip) and nominally0.031 cm thick. The membrane was regenerated cellu-lose [15,17,18] with a nominal cut-off of 3000 Da forglobular compounds (FFFractionation, Salt Lake City,UT). This was the smallest cut-off membrane fromthis company. Lower molecular weight compoundswith an extended conformation could also potentiallybe retained by this membrane. The loop injection

E. Zanardi-Lamardo et al. / Analytica Chimica Acta 443 (2001) 171–181 175
was 50 �l. Diode-array absorbance and fluorescencedetectors (Hewlett-Packard, 1100 Series) were con-nected in-line after the channel outlet. The absorbancewavelengths were 330 nm, and the fluorescence sig-nals were monitored at an excitation wavelength of350 nm and an emission wavelength of 450 nm forCDOM analyses. Both retention time and peak areawere obtained with HP ChemStation software. Thesamples were filtered with glass fiber filters in the fieldand with a 0.2 �m nylon filter just prior to injection(Gelman).
Polystyrene sulfonate, sodium salt (PSS, Poly-sciences, Inc.) was used as a standard to determinethe molecular weight of samples. This standard hasbeen previously used to calibrate humic materi-als [13–16]. The standards were 1800, 4600, 8000and 35,000 MW. Standards were prepared in 0.05 MTrisma, 0.029 M of HCl, pH = 8.0. The absorbancefor all PSS standards was monitored at 224 nm andfluorescence at excitation and emission wavelengthsof 228 and 360 nm, respectively (the intensity peakmaxima). The same carrier flow and flow rates as forthe CDOM analyses were used.
The thickness of the channel (w) needed to calculatethe retention parameter and molecular weights was ob-tained from the void peak observed during normal an-alytical operation, i.e. with 0.005%FL-70/Tris–HCl asthe carrier flow and a cross-flow rate of 4.0 ml min−1.To check the void peak, a sample was spiked withacetone (5%) and analyzed as a normal run. Acetonewas chosen because it is a very small molecule (highlydiffusive compound) and should appear together withthe void peak. The retention time for this peak was2.1 min, which was identical to the void peak ob-served during normal runs. The dead volume from thechannel to the detector is 0.034 ml, and the Vr insidethe channel was calculated to be 2.63 ml. The valueof 0.048 ± 0.001 cm for w was obtained from thismethod and used for the rest of the calculations re-ported here. An attempt was also made to measure thethickness directly with a 50 ± 2 nm polystyrene (PS)latex standard (Duke Scientific Corp.) from a methoddescribed by Miller [24]. A higher surfactant concen-tration of 0.1% (v/v) FL-70 had to be used to pre-vent coagulation and deposition of the standard onthe membrane and frit ceramic material. The thick-ness obtained by this method was 0.0192±0.0001 cm(lower since w depends on the nature of the carrier
liquid [24]). The nominal thickness of the channel indirect measurements of the thickness of the spacermaterial is close to the average of the two calculatedthickness values. Since the surfactant concentrationused for the polystyrene latex standard method was 20times higher than the one used during normal opera-tion, the w value obtained by the void peak (acetone)method under the usual channel operating conditionswas used.
4. Results and discussion
4.1. Concentration of samples inside the channel
To check the performance of the FIFO op-eration, a test was performed with a 8000 MWPSS standard at 10 �g ml−1. Sample flows in andout were 0.15 ml min−1, FI and FO flows were1.25 ml min−1, the channel flow was 1.40 ml min−1,and the cross-flow was 4.0 ml min−1, which gavethe most stable baseline. In this study, the ratio of8:1 frit flow–sample flow was found to give optimalseparation. Rates higher than that resulted in lowerabsorbance and fluorescence signals, indicating lossthrough the frit outlet. For lower rates, an increasein retention time was observed, with no improvementin separation. Those are the same conditions usedfor sample analyses. The test consisted of runningthe standard in the normal operating conditions first(FIFO). Following that, the same standard was in-jected with the FO disabled. The peak area under thefractogram is proportional to the concentration of thecompounds. As the sample flow rate to the detectorincreased from 0.15 to 1.40 ml min−1 with the FO dis-abled, the retention time and peak area for absorbanceand fluorescence should decrease (dilution effect).The ratio between these flow rates (1.40/0.15 = 9.3)is the expected concentration factor. As the sameresult was obtained for both absorbance and fluo-rescence, only the latter is shown here (Fig. 3). Theratio between the two-peak areas (proportional to theconcentration) for the fractograms is 9.3, the sameas for the concentration factor estimated from theflow rates. This shows that compounds are indeedbeing concentrated as expected with the FIFO con-ditions used here. This indicates that the FIFO tech-nique increases sensitivity by an order of magnitude,

176 E. Zanardi-Lamardo et al. / Analytica Chimica Acta 443 (2001) 171–181
Fig. 3. Fluorescence (excitation/emission = 228/360 nm) as a func-tion of retention time for a PSS standard (8000 MW, 10 �g l−1).Channel flow = 1.4 ml min−1, sample flow = 0.15 ml min−1
and cross-flow = 4.0 ml min−1. With FO disabled (–·–·–), peakarea = 5.7 cm2; with FIFO (—), peak area = 53.0 cm2.
and hence allows for the improved analysis of bulkunconcentrated samples, such as natural waters con-taining low CDOM concentrations.
4.2. Reproducibility
The continuous use of the membrane may change itsproperties due to swelling and/or material depositionfrom standards and samples, causing a reduction inthe reproducibility of the peak area or retention time.To monitor the reproducibility of the system, severalreplicate analyzes of a natural water sample from theCaloosahatchee River in southwest Florida were per-formed. Six replicates were analyzed on 5 differentdays and retention time and peak areas determined(Fig. 4). The peak area from the fluorescence detector(excitation/emission 350/450 nm) gave an average of512±17; retention time was more precise with an av-erage of 3.90±0.05 min. The results from the UV–VISdetector (absorbance = 330 nm) were peak area =2160 ± 84 and retention time = 4.22 ± 0.10 min. Theerrors for both detectors were similar at 1.4–2.5% forretention time and 3.3–3.9% for peak areas. These re-sults indicate that the system in its current configura-tion is very reproducible and precise for the analysisof CDOM in natural water samples.
Fig. 4. Fluorescence (excitation/emission = 350/450 nm) as a func-tion of retention time for replicate analyses of CaloosahatcheeRiver water from southwest Florida. Peak area = 512 ± 17; reten-tion time = 3.90 ± 0.05 min.
4.3. Linearity of response
Excessive loading of sample material in a FlFFFchannel can change the response by decreasing re-tention times and broadening peaks. This is proba-bly due to the cross-flow rate not being high enoughto be a strong barrier to the excess material, allow-ing material to pass through the channel faster (i.e. alower retention time), but not all at the same speed(i.e. a broader peak). Increasing the cross-flow is notalways possible since it changes the separation of thecompounds and may cause adsorption of the materialon the membrane. To determine the linearity of thesystem response, a series of PSS 4600 MW standardswere prepared at different concentrations. Concentra-tions below 25 �g ml−1 (corresponding to 1.25 �g ofthis material for a 50 �l injection) gave a constant re-tention time (Fig. 5) and a linear decrease with con-centration. Plotting fluorescence and absorbance peakareas versus concentration, a straight line was obtainedwith r = 0.996 and 0.993, respectively. This resultdemonstrates that the system has a linear response withboth detectors for PSS 4600 MW for <1.25 �g of thiscompound. This concentration provided absorbanceand fluorescence values of 0.075 and 50, respectively.Higher concentrations gave peaks shifted to lower re-tention times, indicative of overloading.

E. Zanardi-Lamardo et al. / Analytica Chimica Acta 443 (2001) 171–181 177
Fig. 5. Fluorescence (excitation/emission = 228/360 nm) as a func-tion of retention time for different concentrations of a 4600 MWPSS standard. Concentrations (�g l−1): 25 (—), 20 (– – –), 10(· · · ), 5 (–·–·–), 2 (–··–··–), and 1 (- - -).
In a related study in this laboratory, a natural wa-ter sample was concentrated and a series of dilutionswas run with similar absorbance and fluorescencedetection parameters as in this work. No signs ofoverloading artifacts were observed for values below0.35 (absorbance) and 30 (fluorescence). The CDOM
Fig. 6. Fluorescence (excitation/emission = 228/360 nm) as a function of retention time for PSS molecular weight standards: 1800 (—,250 �g l−1), 4600 (– – –, 25 �g l−1), 8000 (–·–·–, 10 �g l−1), and 35,000 (–··–··–, 50 �g l−1). The outside scales are for the 35,000 MWstandard.
samples described here had absorbance values <0.038and fluorescence values <5, well within the linearresponse regime for this system.
4.4. Molecular weight calibration
A sequence of different molecular weights of PSSwas analyzed, ranging from 1800 to 35,000 Da. Theconcentration of each standard was chosen accordingto their absorbance and fluorescence capacity in orderto obtain a good signal. Fig. 6 shows the results ob-tained from fluorescence for this sequence of molec-ular weight standards. These data were convertedto a calibration curve of log λ (retention parameter,Eq. (2)) versus log Mw. A linear fit with r = 0.98,slope = −0.749 and intercept = 0.945 was obtainedfor fluorescence; for absorbance, r = 0.98, slope =−0.762 and intercept = 1.404. The molecular weightdistribution for CDOM was calculated from the mea-sured retention times and these calibration curves.
4.5. CDOM analyses
A fresh water sample from the CaloosahatcheeRiver and a coastal water sample from the riverplume in off-shore waters in the Gulf of Mexico were

178 E. Zanardi-Lamardo et al. / Analytica Chimica Acta 443 (2001) 171–181
analyzed. This river receives significant inputs of or-ganic material, and has high levels of CDOM basedon its absorbance, fluorescence and total organiccarbon levels. The basic spectroscopic properties ofhumic materials have been thoroughly reviewed [26].The absorption of most CDOM samples is character-ized by a featureless tail that extends from 200 nmthrough most of the visible region and decreases withincreasing wavelength, with essentially no absorptionabove 550 nm. Upon absorption of sunlight, DOM flu-oresces with broad emission bands observed between200 and 500 nm. Previous studies of humic materialsby FlFFF used in-line UV absorbance detection at254 [13] and 270 nm [15]. In this study, we used bothUV–VIS absorbance and an additional in-line fluo-rescence detector. Fluorescence has some advantagesover absorbance for environmental samples, includ-ing improved selectivity, sensitivity and reduced lightscattering effects, i.e. an improved baseline. Trends inabsorbance versus fluorescence for CDOM from dif-ferent environments or for transformation processessuch as photodegradation may very well be different,since some of the chromophores that absorb lightmay be chemically different to the fluorophores thatemit light. Fluorescence measurements thus providean additional complementary probe of the complexCDOM matrix.
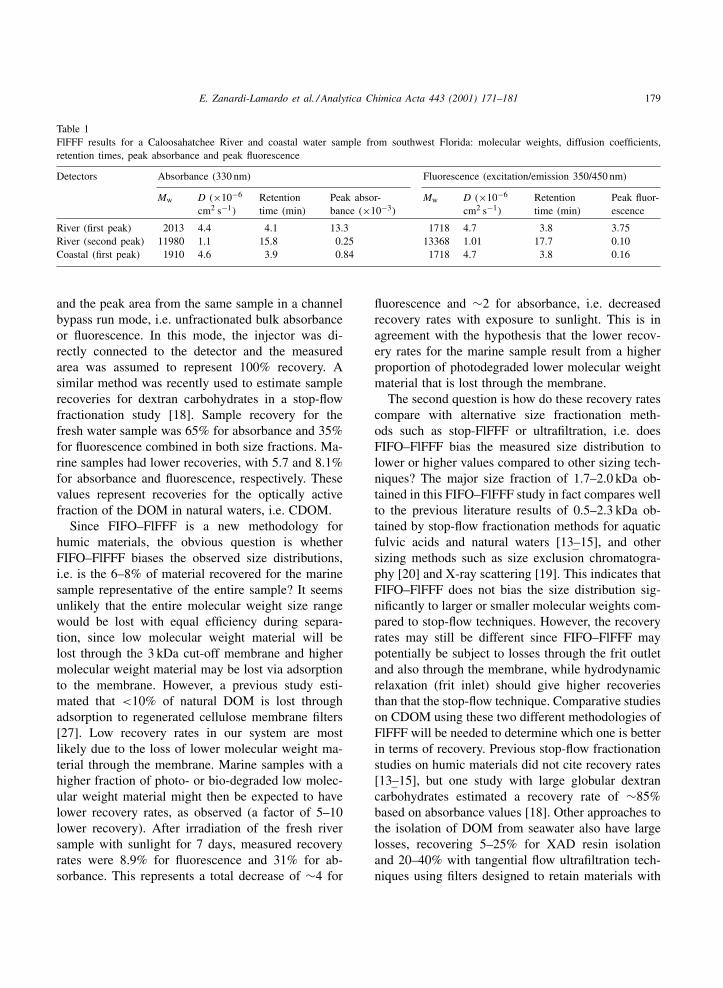
FlFFF analyses with absorbance (330 nm) and fluo-rescence (excition/emission 350/450 nm) detection areshown in Figs. 7 and 8, respectively. Using the PSScalibration curves described above, molecular weightswere determined from the retention times of the peakmaxima. Table 1 shows the data obtained for the riverand coastal water samples. We observed two discretemolecular size fractions of CDOM in river water basedon signal areas for absorbance or fluorescence de-tection, with most in a size fraction centered around2 kDa and about 2% in a larger 13 kDa size fraction.The results for the major low molecular weight sizefraction are similar to those obtained with FlFFF tech-niques for the Baltic Sea [15] and to humic substancesfrom soils and other rivers [13]. The minor highermolecular weight size fraction was completely gonein an offshore coastal water sample (based on the lossof fluorescence). The absence of this second highermolecular weight peak in more marine waters maybe due to dilution of the river samples as they mixinto the off-shore waters, or to biodegradation and/or
Fig. 7. Absorbance (×10−3; 330 nm) vs. molecular weight fora Caloosahatchee River (—) and coastal (− − −) natural watersample from southwest Florida.
photodegradation of the CDOM by sunlight in surfacewaters. In preliminary photochemical experiments, ir-radiating a fresh river sample with sunlight for 7 daysproduced a fractogram that was characteristic of ma-rine waters. This suggests that photodegradation is animportant mechanism in altering the molecular andoptical characteristics of CDOM.
Sample recovery was estimated from the sum ofthe fractionated peak areas from a natural sample
Fig. 8. Fluorescence (excitation/emission = 350/450 nm) vs.molecular weight for a Caloosahatchee River (—) and coastal(− − −) natural water sample from southwest Florida.
E. Zanardi-Lamardo et al. / Analytica Chimica Acta 443 (2001) 171–181 179
Table 1FlFFF results for a Caloosahatchee River and coastal water sample from southwest Florida: molecular weights, diffusion coefficients,retention times, peak absorbance and peak fluorescence
Detectors Absorbance (330 nm) Fluorescence (excitation/emission 350/450 nm)
Mw D (×10−6
cm2 s−1)Retentiontime (min)
Peak absor-bance (×10−3)
Mw D (×10−6
cm2 s−1)Retentiontime (min)
Peak fluor-escence
River (first peak) 2013 4.4 4.1 13.3 1718 4.7 3.8 3.75River (second peak) 11980 1.1 15.8 0.25 13368 1.01 17.7 0.10Coastal (first peak) 1910 4.6 3.9 0.84 1718 4.7 3.8 0.16
and the peak area from the same sample in a channelbypass run mode, i.e. unfractionated bulk absorbanceor fluorescence. In this mode, the injector was di-rectly connected to the detector and the measuredarea was assumed to represent 100% recovery. Asimilar method was recently used to estimate samplerecoveries for dextran carbohydrates in a stop-flowfractionation study [18]. Sample recovery for thefresh water sample was 65% for absorbance and 35%for fluorescence combined in both size fractions. Ma-rine samples had lower recoveries, with 5.7 and 8.1%for absorbance and fluorescence, respectively. Thesevalues represent recoveries for the optically activefraction of the DOM in natural waters, i.e. CDOM.
Since FIFO–FlFFF is a new methodology forhumic materials, the obvious question is whetherFIFO–FlFFF biases the observed size distributions,i.e. is the 6–8% of material recovered for the marinesample representative of the entire sample? It seemsunlikely that the entire molecular weight size rangewould be lost with equal efficiency during separa-tion, since low molecular weight material will belost through the 3 kDa cut-off membrane and highermolecular weight material may be lost via adsorptionto the membrane. However, a previous study esti-mated that <10% of natural DOM is lost throughadsorption to regenerated cellulose membrane filters[27]. Low recovery rates in our system are mostlikely due to the loss of lower molecular weight ma-terial through the membrane. Marine samples with ahigher fraction of photo- or bio-degraded low molec-ular weight material might then be expected to havelower recovery rates, as observed (a factor of 5–10lower recovery). After irradiation of the fresh riversample with sunlight for 7 days, measured recoveryrates were 8.9% for fluorescence and 31% for ab-sorbance. This represents a total decrease of ∼4 for
fluorescence and ∼2 for absorbance, i.e. decreasedrecovery rates with exposure to sunlight. This is inagreement with the hypothesis that the lower recov-ery rates for the marine sample result from a higherproportion of photodegraded lower molecular weightmaterial that is lost through the membrane.
The second question is how do these recovery ratescompare with alternative size fractionation meth-ods such as stop-FlFFF or ultrafiltration, i.e. doesFIFO–FlFFF bias the measured size distribution tolower or higher values compared to other sizing tech-niques? The major size fraction of 1.7–2.0 kDa ob-tained in this FIFO–FlFFF study in fact compares wellto the previous literature results of 0.5–2.3 kDa ob-tained by stop-flow fractionation methods for aquaticfulvic acids and natural waters [13–15], and othersizing methods such as size exclusion chromatogra-phy [20] and X-ray scattering [19]. This indicates thatFIFO–FlFFF does not bias the size distribution sig-nificantly to larger or smaller molecular weights com-pared to stop-flow techniques. However, the recoveryrates may still be different since FIFO–FlFFF maypotentially be subject to losses through the frit outletand also through the membrane, while hydrodynamicrelaxation (frit inlet) should give higher recoveriesthan that the stop-flow technique. Comparative studieson CDOM using these two different methodologies ofFlFFF will be needed to determine which one is betterin terms of recovery. Previous stop-flow fractionationstudies on humic materials did not cite recovery rates[13–15], but one study with large globular dextrancarbohydrates estimated a recovery rate of ∼85%based on absorbance values [18]. Other approaches tothe isolation of DOM from seawater also have largelosses, recovering 5–25% for XAD resin isolationand 20–40% with tangential flow ultrafiltration tech-niques using filters designed to retain materials with

180 E. Zanardi-Lamardo et al. / Analytica Chimica Acta 443 (2001) 171–181
molecular weights >1000 Da (recoveries based on‘dissolved organic carbon’ values [28]). These re-covery rates are about 3–5 times higher than thoseobtained here by FIFO–FlFFF for a coastal seawatersample (based on CDOM absorbance and fluores-cence). Our recovery rates may be improved by eitherusing a FlFFF membrane with a smaller molecularweight cut-off of <1000 Da (recently available fromanother manufacturer — Amicon) or a different kindof membrane. Having established methodology forCDOM analyses in natural waters by FIFO–FlFFF,future studies will focus in part on improving recov-ery rates and on a detailed inter-comparison to thestop-flow fractionation techniques previously used formolecular weight measurements of humic materials[13–15].
5. Conclusions
This study has demonstrated that FIFO–FlFFFis a reproducible technique with a linear responseto molecular weight and concentration over a widedynamic range. FIFO provides for relaxation andconcentration of the compounds inside the channelwithout stopping or reversing flows, giving a sta-ble pressure inside the system. This improves base-line stability and reproducibility compared to otherFlFFF systems. The results presented here show thatFIFO–FlFFF is a powerful tool for the analysis of themolecular weight distribution of compounds in envi-ronmental water samples. FlFFF analyses of CDOMin bulk river and coastal waters show two molecu-lar size fractions of CDOM in river water based onabsorbance or fluorescence detection, with most in asize fraction centered around 2 kDa and about 2% in alarger 13 kDa size fraction. This minor higher molec-ular weight fraction was completely gone in offshorecoastal waters (based on the loss of optical properties).
These studies of the structural properties (specifi-cally molecular weight distribution) of colored DOMin natural waters centered on the use of optical de-tection techniques as a tracer for the colored material.In future work, we plan to extend these studies byusing a mass spectroscopic detector in tandem withthe optical detectors to identify the distribution andrelative proportion of non-optically active material inDOM, as well as the specific structural characteristics
of molecular weight peaks separated by FlFFF for dif-ferent natural waters. Efforts will also be concentratedon improving recovery rates. We will also apply thistechnique to a study of CDOM in natural waters from awide range of different sources in the Gulf of Mexico,and examine the effects of photochemical degradationon molecular weight distributions in more detail.
Acknowledgements
The authors gratefully acknowledge support ofthis work by the Office of Naval Research (ONRN000149810625). E. Zanardi-Lamardo thanks CNPq,the Brazilian Graduate Research Fellowship Program.The authors thank the crew of the R/V Calanus andCynthia Moore, Erik Stabenau and Raphael Tremblayfor sample acquisition and associated measurements.
References
[1] R.G. Zepp, Interactions of marine biogeochemical cyclesand the photodegradation of dissolved organic carbon anddissolved organic nitrogen, in: A. Gianguzza, E. Pelizzetti,S. Sammartano (Eds.), Marine Chemistry, Kluwer AcademicPublishers, Amsterdam, The Netherlands, 1997, p. 329.
[2] M. McKnight, G.R. Aiken, Sources and age of aquatichumus, in: D.O. Hessen, L.J. Tranvik (Eds.), Aquatic HumicSubstances, Springer, Berlin, Heidelberg, 1998, Chapter 1, 7pp.
[3] M.D. McCarthy, J.I. Hedges, R. Benner, Chem. Geol. 107(1993) 503.
[4] R. Benner, B. Biddanda, B. Black, M. McCarthy, Mater.Chem. 57 (1997) 243.
[5] J.D. Pakulski, R. Benner, Limnol. Oceanogr. 39 (1994) 930.[6] A. Bruccoleri, G. Lepore, C.A. Langford, The physical chem-
istry of photochemical oxidant generation in natural watersystems, in: J.O. Nriagu, M.S. Simmons (Eds.), Environ-mental Oxidants, Wiley, New York, 1994.
[7] R.G. Zepp, Environmental photoprocesses involving naturalorganic matter, in: F.H. Frimmel, R.F. Christman (Eds.),Humic Substances and their Role in the Environment,Wiley/Interscience, New York, 1988, p. 193.
[8] W.L. Miller, M.A. Moran, Limnol. Oceanogr. 42B (1997)1317.
[9] J.A. Amador, P.J. Milne, C. A Moore, R.G. Zika, Mater.Chem. 29 (1990) 1.
[10] R. Benner, Ultrafiltration for the concentration of bacteria,viruses and dissolved organic matter, in: D.C. Hurd, D.W.Spencer (Eds.), Marine Particles: Analysis and Characteri-zation, Geophysics Monograph 63, American GeophysicalUnion, Washington, DC, 1991, p. 181.

E. Zanardi-Lamardo et al. / Analytica Chimica Acta 443 (2001) 171–181 181
[11] M. Martin, P.S. Williams, Theoretical basis of field-flowfractionation, in: F. Dondi, G. Guiochon (Eds.), TheoreticalAdvancement in Chromatography and Related SeparationTechniques, Kluwer Academic Publishers, Amsterdam, TheNetherlands, 1992, p. 513.
[12] K.G. Wahlund, H.S. Winegarner, K.D. Caldwell, J.C.Giddings, Anal. Chem. 58 (1986) 573.
[13] R. Beckett, Z. Jue, J.C. Giddings, Eviron. Sci. Technol. 21(1987) 289.
[14] R. Beckett, J.C. Bigelow, Z. Jue, J.C. Giddings, Analysisof humic substances using flow field-flow fractionation, in:I.H. Suffet, P. MacCarthy (Eds.), Aquatic Humic Substances,American Chemical Society, Washington, DC, 1989,p. 68.
[15] B. Lyven, M. Hasselov, C. Haraldsson, D.R. Turner, Anal.Chim. Acta 357 (1997) 187.
[16] M. Hasselov, B. Lyven, C. Haraldsson, W. Sirinawin, Anal.Chem. 71 (1999) 3497.
[17] S.G. Stevenson, T. Ueno, K.R. Preston, Anal. Chem. 71(1999) 8.
[18] S.K.R. Williams, R.G. Keil, J. Liq. Chromatogr. Relat.Technol. 20 (1997) 2815.
[19] E.M. Thurman, R.L. Wershaw, R.L. Malcolm, D.J. Pinckney,Org. Geochem. 4 (1982) 27.
[20] Y.P. Chin, G. Aiken, E. O’Loughlin, Environ. Sci. Technol.28 (1994) 1853.
[21] J.C. Giddings, F.J.F. Yang, M.N. Myers, Science 193 (1976)1244.
[22] J.C. Giddings, F.J.F. Yang, M.N. Myers, Anal. Chem. 48 (8)(1976) 1126.
[23] C. Tanford, Physical Chemistry of Macromolecules, Wiley,New York, 1961 (Chapter 6).
[24] M.E. Miller, Instrument Manual for the Model F-1000-FOUniversal Fractionator, FFFractionation, Inc., Salt Lake City,UT, 1996.
[25] J.C. Giddings, Science 260 (1993) 1456.[26] R.G. Zika, W.J. Cooper (Eds.), Photochemistry of Environ-
mental Aquatic Systems, ACS Symposium Series 327,American Chemical Society, Washington, DC, 1987.
[27] R. Benner, J.D. Pakulski, M. McCarthy, J.I. Hedges, P.G.Hatcher, Science 255 (1992) 1561.
[28] R. Benner, Cycling of dissolved organic matter in theocean, in: D.O. Hessen, L.J. Tranvik (Eds.), Aquatic HumicSubstances, Springer, Berlin, Heidelberg, 1998 (Chapter 12).