Bioinformatics Approach to Understanding Interacting Pathways in Neuropsychiatric Disorders
16
157 Ronald Trent (ed.), Clinical Bioinformatics, Methods in Molecular Biology, vol. 1168, DOI 10.1007/978-1-4939-0847-9_9, © Springer Science+Business Media New York 2014 Chapter 9 Bioinformatics Approach to Understanding Interacting Pathways in Neuropsychiatric Disorders Ali Alawieh, Zahraa Sabra, Amaly Nokkari, Atlal El-Assaad, Stefania Mondello, Fadi Zaraket, Bilal Fadlallah, and Firas H. Kobeissy Abstract Bioinformatics-based applications have been incorporated into several medical disciplines, including cancer, neuroscience, and recently psychiatry. Both the increasing interest in the molecular aspect of neu- ropsychiatry and the availability of high-throughput discovery and analysis tools have encouraged the incorporation of bioinformatics and neurosystems biology techniques into psychiatry and neuroscience research. As applied to neuropsychiatry, systems biology involves the acquisition and processing of high- throughput datasets to infer new information. A major component in bioinformatics output is pathway analysis that provides an insight into and prediction of possible underlying pathogenic processes which may help understand disease pathogenesis. In addition, this analysis serves as a tool to identify potential biomarkers implicated in these disorders. In this chapter, we summarize the different tools and algorithms used in pathway analysis along with their applications to the different layers of molecular investigations, from genomics to proteomics. Key words Algorithms, Bioinformatics, Computational, Data mining, Genomics, Omics, Pathways, Phenotype, Phenomics, Polymorphisms, Proteomics, Psychiatry, Tools, Transcriptomics Abbreviations CNVs Copy number variants GWAS Genome-wide association study SNPs Single-nucleotide polymorphisms 1 Introduction After the great success in the sequencing of the first human genome in 2003 [1], the use of bioinformatics tools in biological and medi- cal research has escalated enormously. The main reason behind this increase was the availability of large clinical and molecular datasets that could no longer be handled manually and required high
Transcript of Bioinformatics Approach to Understanding Interacting Pathways in Neuropsychiatric Disorders

157
Ronald Trent (ed.), Clinical Bioinformatics, Methods in Molecular Biology, vol. 1168,DOI 10.1007/978-1-4939-0847-9_9, © Springer Science+Business Media New York 2014
Chapter 9
Bioinformatics Approach to Understanding Interacting Pathways in Neuropsychiatric Disorders
Ali Alawieh , Zahraa Sabra , Amaly Nokkari , Atlal El-Assaad , Stefania Mondello , Fadi Zaraket , Bilal Fadlallah , and Firas H. Kobeissy
Abstract
Bioinformatics-based applications have been incorporated into several medical disciplines, including cancer, neuroscience, and recently psychiatry. Both the increasing interest in the molecular aspect of neu-ropsychiatry and the availability of high-throughput discovery and analysis tools have encouraged the incorporation of bioinformatics and neurosystems biology techniques into psychiatry and neuroscience research. As applied to neuropsychiatry, systems biology involves the acquisition and processing of high- throughput datasets to infer new information. A major component in bioinformatics output is pathway analysis that provides an insight into and prediction of possible underlying pathogenic processes which may help understand disease pathogenesis. In addition, this analysis serves as a tool to identify potential biomarkers implicated in these disorders. In this chapter, we summarize the different tools and algorithms used in pathway analysis along with their applications to the different layers of molecular investigations, from genomics to proteomics.
Key words Algorithms , Bioinformatics , Computational , Data mining , Genomics , Omics , Pathways , Phenotype , Phenomics , Polymorphisms , Proteomics , Psychiatry , Tools , Transcriptomics
Abbreviations
CNVs Copy number variants GWAS Genome-wide association study SNPs Single-nucleotide polymorphisms
1 Introduction
After the great success in the sequencing of the fi rst human genome in 2003 [ 1 ], the use of bioinformatics tools in biological and medi-cal research has escalated enormously. The main reason behind this increase was the availability of large clinical and molecular datasets that could no longer be handled manually and required high

158
throughput processing tools [ 2 – 4 ]. The importance of computa-tional applications in biological and clinical research has brought up several collaborative efforts between mathematicians, engineers, statisticians, biologists, and physicians and has boosted the fi eld of bioinformatics. This fi eld aims to provide the fastest and most reli-able way to handle, analyze, store, and visualize massive datasets as well as to evaluate their clinical implications.
Bioinformatics has been incorporated in several medical disci-plines including recently psychiatry. Psychiatry is a discipline with complex and heterogeneous diseases where computational bioin-formatics tools are urgently needed. Until now, the fi eld of molecu-lar psychiatry is still in its infancy and insight into the etiology and pathophysiology of psychiatric diseases is poor due to their multi-factorial etiology and the infl uence of multiple environmental fac-tors [ 5 – 7 ]. Similar to molecular psychiatry, psychiatric practices face major challenges involving the lack of objective techniques for disease diagnosis and classifi cation along with the need for personalized medicine due to the unpredictable outcome of dis-ease pharmacology. In this context, bioinformatics has enabled a new direction for understanding pathogenesis in molecular and clinical psychiatry through the ability to comprehend and draw inferences from data on genomics, transcriptomics, proteomics, and phenomics as well as other high-throughput data acquisition techniques [ 5 ]. These data inputs have been used in two major interrelated applications: biomarker discovery and pathway analy-sis. In this chapter, we review the methods and applications of bio-informatics tools in molecular psychiatry with major emphasis on pathway discovery and network analysis.
2 Methods in Pathway Analysis
In addition to the challenges listed above, simple inspection of large datasets with basic visual computational aids and low-order statistical metrics will not extract the full informational potential of the available data, hence the importance of using computational methods for data mining. Data mining concerns information extraction technique from large and huge datasets using mathe-matical methods [ 8 ]. In bioinformatics, data mining is used in applications such as fi nding keynotes in sequences to provision pat-terns, fi nding genome pathways of diseases, and fi nding cluster rules for DNA and protein sequences [ 9 ]. Data mining method-ologies and algorithms differ in techniques and goals from one application to another. The following is a list of the most impor-tant categories of data mining methodologies with associated algo-rithms, techniques, and sample applications.
Ali Alawieh et al.
159
Since we are dealing with large datasets, it is necessary to separate the useful information from the distributed and heterogeneous data [ 9 ]. Many algorithms can be used to preprocess the data prior to analysis. Time-series fi ltering, outlier detection, data cleaning algorithms, and data normalization algorithms are some of the applied mathematical algorithms depending on the bioinformatics applications [ 8 ].
The cleaning stage aims at ensuring the quality of raw data by manipulations based on answering some important questions related to the delivery, gathering, and analysis of the data. A micro-array processing procedure represents a data quality continuum example [ 10 ].
The preprocessing stage involves the use of several concepts including (1) management , which covers unifying the data content and format [ 11 , 12 ], automating the data preprocessing, e.g., microarray spot analysis [ 13 ], and publishing the data, e.g., by using online sites like MedLine and optimizing the data quality; (2) documentation , which aims at preprocessing the fi les in a way that allows their smooth usage and storage [ 14 ]; and (3) metrics specifi -cation that should be carefully selected based on the data analysis, in a way that mostly adheres with the studied information [ 15 , 16 ].
Integration techniques such as unit normalization and statistical aggregation fi nd common representation of related data gathered from different sources. The resulting integrated data forms a nor-malized input that is less biased than the data in its original form.
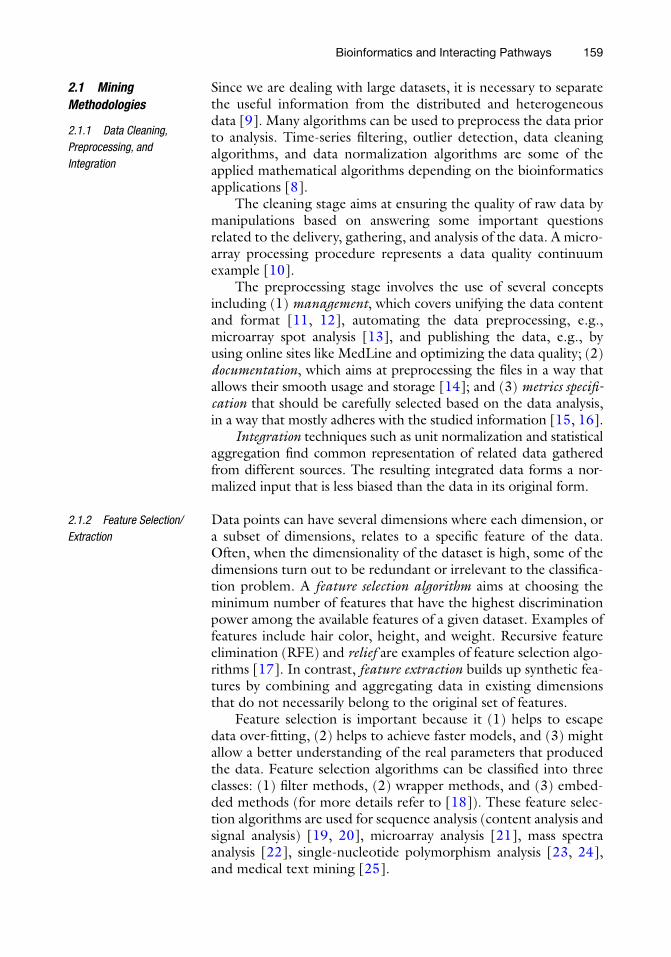
Data points can have several dimensions where each dimension, or a subset of dimensions, relates to a specifi c feature of the data. Often, when the dimensionality of the dataset is high, some of the dimensions turn out to be redundant or irrelevant to the classifi ca-tion problem. A feature selection algorithm aims at choosing the minimum number of features that have the highest discrimination power among the available features of a given dataset. Examples of features include hair color, height, and weight. Recursive feature elimination (RFE) and relief are examples of feature selection algo-rithms [ 17 ]. In contrast, feature extraction builds up synthetic fea-tures by combining and aggregating data in existing dimensions that do not necessarily belong to the original set of features.
Feature selection is important because it (1) helps to escape data over-fi tting, (2) helps to achieve faster models, and (3) might allow a better understanding of the real parameters that produced the data. Feature selection algorithms can be classifi ed into three classes: (1) fi lter methods, (2) wrapper methods, and (3) embed-ded methods (for more details refer to [ 18 ]). These feature selec-tion algorithms are used for sequence analysis (content analysis and signal analysis) [ 19 , 20 ], microarray analysis [ 21 ], mass spectra analysis [ 22 ], single-nucleotide polymorphism analysis [ 23 , 24 ], and medical text mining [ 25 ].
2.1 Mining Methodologies
2.1.1 Data Cleaning, Preprocessing, and Integration
2.1.2 Feature Selection/Extraction
Bioinformatics and Interacting Pathways

160
Given a certain dataset and possibly relevant expert information, machine learning techniques produce sets of rules that allow judg-ing new data points. For example, such techniques can identify the patterns within the data provided by the high-throughput omics techniques [ 5 ]. Machine learning approaches include supervised methods, unsupervised methods, and semi-supervised methods ( see also Chapter 16 ).
● Supervised learning . Supervised learning methods include algorithms and techniques that use a categorized subset of the dataset to train a computational model. Each point in the training subset is labeled with a known category, also known as a class. The points along with their class labels are passed to the computational model in the training phase where the model modifi es its parameters to learn. Then, once the training phase is done, the computational model works as a classifi er that takes an input point and returns its class.
Known algorithms belonging to this category include artifi cial neural networks, Bayesian classifi ers, genetic algorithms, support vector machines (SVMs), k-nearest neighbor (KNN)-based classifi ers, and others [ 26 – 31 ].
● Clustering (unsupervised) learning . When labels and classes of data points are not available or not trusted, techniques such as clustering algorithms exist that group similar points together. Clustering algorithms identify a structure that fi ts the training data points and allow for the use of the structure later to test new data. In the past, hierarchical clustering was fi rstly used on microarray data to fi nd similar patterns of gene expression [ 32 ]. Then several other clustering techniques were used including simple ones such as the k-means algorithm and more advanced techniques such as self-organizing maps (SOM), SVMs, association rules, and general neural networks. GeneSpring and Spotfi re use the above-listed algorithms for microarray analysis [ 9 ]. These algorithms return clustered data with an estimated accuracy. These clustered data can be imported to network analysis, modeling, simulation, and visu-alization tools [ 5 ].
New approaches using clustering algorithms were recently introduced like biclustering [ 33 ] and p-clustering [ 34 ]. Both work on microarray data ( see Note 1 ). Greedy algorithms, spectral biclustering, column reordering, and 0–1 fractional programming provide other approaches to biclustering. In addi-tion, biclustering may also be found in a supervised form depending on the application.
● Semi-supervised learning . Semi-supervised methods generally make use of both labeled and unlabeled data in the training process. They are useful in cases where part of the label is known but contains pairwise constraints; i.e., points a and b
2.1.3 Machine Learning
Ali Alawieh et al.

161
are part of the same class. This aims to use all the available information to produce a more accurate model that represents the existing data for evaluation and prediction [ 8 ].
Networks or graphs represent a way of visualizing the relations among different components of the system model after applying the suitable algorithms to process the bioinformatics data. These networks include the visualization of metabolic network or path-way, protein network, and genetic or gene regulatory network. Tuning and cross-validation of a system (using k-fold, leave-one- out, and holdout cross validation) are methods used for improving the accuracy of the model.
Some tools are generic in the sense that they contain the different mining methodologies and allow users to make use of them optimally based on the application. Others can be classifi ed as knowledge discovery in databases (KDD) and model visualization tools and interactive visualization environments for integrating data mining and visualization processes [ 35 ]. In addition, Weka ( http://www.cs.waikato.ac.nz/ml/weka ) [ 36 ] is one of the tools that contain a collection of machine learning algorithms to pre- process, classify, regress, cluster, and select features and visualize the mined bioinformatics data. Other computational bioinformat-ics tools that include a combination of some of the above-listed methods are:
● R ( http://www.r-project.org ). ● Cytoscape package [ 37 ]. ● Octave ( http://www.gnu.org/software/octave/ ). ● LibSVM and SVMlite, which are open-source packages used to
implement SVM and can be used to distinguish between schizophrenia patients and controls [ 38 ].
● Matlab Arsenal: A Matlab toolbox that contains a large num-ber of functions related to data clustering, feature selection, and extraction.
3 Applications in Psychiatric Research
The algorithms and tools summarized above are incorporated into different domains in psychiatric research. These include (1) analysis of gene associations with disease and implication of pos-sible pathways, (2) evaluation of gene regulation and identifi ca-tion of co-regulated proteins, (3) assay of disease-associated protein profi le changes along with protein network analysis, and (4) a holistic integration of all the previously enumerated factors with the ultimate phenotypic manifestations of the disease (Fig. 1 ).
2.1.4 Visualizing
2.2 Tools and Illustrations
Bioinformatics and Interacting Pathways

162
In this section, we illustrate the use of bioinformatics at different levels of pathway and network analysis as relevant to psychiatric disorders. The aim of this application is to investigate possible pathways implicated in the pathogenesis of the disease as well as identify disease-related network regulatory disturbances. Both the implicated pathways and the major nodes in the identifi ed networks serve as putative targets for theragnostics applications.
Genome-wide association studies (GWAS) are large-scale genetic studies involving the study of large numbers of genes or SNPs across extensive populations with a particular phenotype compared to con-trols. This allows gene discovery associated with disease predisposi-tion, severity, comorbidity, outcome, and relapse. Detected gene variations may be a single nucleotide (single-nucleotide polymor-phisms or SNPs) or structural changes in the genome (copy number variants or CNVs). Along with the discovery of implicated SNPs and CNVs, GWAS analysis utilizes several tools and online databases of gene–gene interactions among involved loci [ 39 ]. This provides insight into the underlying pathophysiology of the disease.
3.1 Pathway Analysis in Psychiatric Genomics
Fig. 1 Systems biology hierarchy. A proposed differential layer of investigation in a systems biology approach: at the very basic later interaction of genes whose polymorphism confers susceptibility to disease is fi rst mapped; then the interac-tion and co-regulation of the different mRNA transcripts of the genes are mapped and correlated with the third-layer proteomics interactions. This fi nal layer of protein–protein interaction network is considered to be the closest contributor to the phenotypic manifestations and variations
Ali Alawieh et al.

163
Several tools are available for the use of investigators in this fi eld such as the R & Bioconductor-associated packages (GWAStools, GenABEL, and others) or SNPranker [ 40 – 42 ]. These tools help analyze, display, clean, and stratify GWAS data and allow for pathway analysis based on online data on gene inter-actions ( see Chapters 4 and 5 ). Special packages have also been dedicated for regional visualization of GWAS results, such as LocusZoom [ 43 ], the UCSC Genome Graphs ( http://genome.ucsc.edu/cgi-bin/hgGenome ) [ 44 ], and the Integrative Genomics Viewer or IGV ( http://www.broadinstitute.org/igv/viewing_gwas ). The latter can generate Manhattan plots from different GWAS formats [ 45 ]. The increasing use of these tools and their incorporation into psychiatric research have led to the association of different pathways with putative disease pathogenesis. For instance, the GWAS done by the Schizophrenia Psychiatric GWAS Consortium used both PLINK, an R-based GWAS tool, as well as Haploview for haplotype analysis and visualization of results and discovered the association of fi ve new loci with schizophrenia [ 46 ]. A major discovery of the study was the implication of an SNP, rs1625579, in the intron of MIR137 gene which is a known regu-lator of neuronal development and for whom four target loci had also genome-wide signifi cance. This was behind the implication of the MIR137 pathway of neuronal development in the pathogene-sis of schizophrenia. Other signifi cant pathways include calcium signaling in bipolar disorder; cholesterol metabolism and the innate immune response in Alzheimer disease; and postsynaptic signaling in schizophrenia and bipolar disorder [ 47 ]. A review of CNV stud-ies followed by comprehensive pathway analysis have shown enrich-ment of specifi c genes in autism spectrum disorders related to pathways of cellular proliferation, projection and motility, GTPase/Ras signaling, neuronal synaptic complex genes, and ubiquitin degradation genes [ 48 ].
The main avenue of pathway analysis in genomics research depends on predetermined knowledge of gene function and gene interaction maps obtainable from online databases like Gene Ontology ( http://www.geneontology.org/ ), GeneNet ( http://wwwmgs.bionet.nsc.ru/mgs/gnw/genenet/ ), and KEGG ( http://www.genome.jp/kegg/ ). Assisted with pathway and net-work prediction tools like Ingenuity Pathway Analysis (IPA), those databases help to discover if disease-associated CNVs or SNPs can be associated with a physiological or a clinical phenotype (Fig. 2 ). For instance, Greenwood et al. used Collaborative Oncological Gene-environment Study (COGS) SNP chips to associate several SNPs with neurophysiological and neurocognitive endopheno-types in schizophrenia [ 49 ]. Results showed 47 SNP–endopheno-type associations, and the involved genes were mapped into implicated pathways using IPA. Involved pathways in the patho-genesis of different endophenotypes include neurotransmitter
Bioinformatics and Interacting Pathways

164
receptor signaling, cell signal transduction, amino acid metabo-lism, and axonal guidance. Similarly, Ayalew et al. used a transla-tional convergent functional genomics to prioritize genes involved in schizophrenia pathogenesis and identifi ed, using IPA, the involvement of brain development, myelination, cell adhesion, glu-tamate receptor signaling, G-protein-coupled receptor signaling, and cAMP-mediated signaling in the key pathophysiology of schizophrenia [ 50 ].
One major challenge when dealing with large genomics datas-ets is their high dimensionality, which complicates the identifi ca-tion of patterns and correlates within the data. To handle this problem, the HapMap project used perfect proxy sets or co-sets, which are sets of directly correlated SNPs, to elucidate interindividual differences allowing for reconstructing cellular interaction networks and their association with functional states [ 51 ]. Eventually, this opens a realm of possibilities for disease classifi cation based on variations that lead to the same functional outcome. However, this bottom-up approach continues to have limited applicability in psychiatric research.
In addition to SNPs and CNVs, a better insight into the gene involvement in psychiatric disease pathogenesis comes from the assessment of gene regulation that is measured by mRNA expression
3.2 Pathway Analysis in Psychiatric Transcriptomics
Fig. 2 Flow chart of genome–genome interaction analysis. Huge datasets obtained from genome-wide association studies (GWAS) using sequence detection chips. Then, high-throughput data processing is used to clean and analyze the data using available online databases. An SNP hit list is identifi ed among the obtained datasets, and the relevant genes are recognized. Finally, genes are mapped by pathway and function using online ontology and gene interaction tools to determine pathways and networks associated with the disease
Ali Alawieh et al.
165
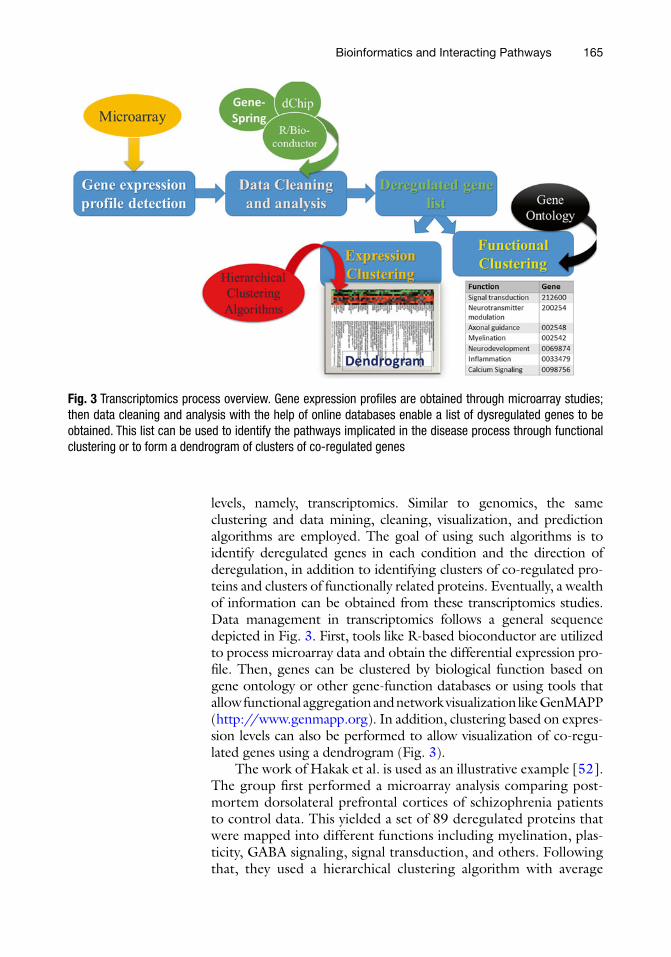
levels, namely, transcriptomics. Similar to genomics, the same clustering and data mining, cleaning, visualization, and prediction algorithms are employed. The goal of using such algorithms is to identify deregulated genes in each condition and the direction of deregulation, in addition to identifying clusters of co-regulated pro-teins and clusters of functionally related proteins. Eventually, a wealth of information can be obtained from these transcriptomics studies. Data management in transcriptomics follows a general sequence depicted in Fig. 3 . First, tools like R-based bioconductor are utilized to process microarray data and obtain the differential expression pro-fi le. Then, genes can be clustered by biological function based on gene ontology or other gene-function databases or using tools that allow functional aggregation and network visualization like GenMAPP ( http://www.genmapp.org ). In addition, clustering based on expres-sion levels can also be performed to allow visualization of co-regu-lated genes using a dendrogram (Fig. 3 ).
The work of Hakak et al. is used as an illustrative example [ 52 ]. The group fi rst performed a microarray analysis comparing post-mortem dorsolateral prefrontal cortices of schizophrenia patients to control data. This yielded a set of 89 deregulated proteins that were mapped into different functions including myelination, plas-ticity, GABA signaling, signal transduction, and others. Following that, they used a hierarchical clustering algorithm with average
Fig. 3 Transcriptomics process overview. Gene expression profi les are obtained through microarray studies; then data cleaning and analysis with the help of online databases enable a list of dysregulated genes to be obtained. This list can be used to identify the pathways implicated in the disease process through functional clustering or to form a dendrogram of clusters of co-regulated genes
Bioinformatics and Interacting Pathways
166
linkage methods to detect clusters of genes with similar expression profi le. Results were displayed in a dendrogram and showed that genes involved in myelination are co-regulated, whereas they were found to be downregulated in schizophrenic patients. This sug-gested demyelination as a possible player in the pathogenesis of the disease. Sequeira et al. further reviewed transcriptional profi ling in schizophrenia emphasizing all implicated pathways [ 53 ].
In addition, other bioinformatics tools were used for phe-nome–transcriptome association studies in which transcriptomics- associated pathways are symmetrically correlated with phenotypic features. An example of this is the study done by Gormanns et al. on both depression and anxiety transcriptomes [ 54 ]. Data mining of available experimental microarray data was performed to build the disease transcriptome through extraction of annotations from Gene Expression Omnibus (GEO) repository. Then, MMTx library mapping with manual validation was used to map transcrip-tomic annotations to Unifi ed Medical Language System (UMLS) concepts of anxiety and depression ( see Note 2 ). The GEO datas-ets where the diseased and controls are signifi cantly different were considered for further analysis resulting in a gene list with fold changes in expression. The genes were mapped into a protein list using pathway studio and into disease-related pathways using KEGG. Pathways were further enriched, the results showed six datasets matching anxiety-like phenotypes and fi ve matching depression ones, and the relevant pathways were mapped.
In another example, Nakatani and colleagues performed wide genome expression analysis in bipolar disorder using samples from Brodmann’s area [ 55 ]. They used false discovery rate algorithms to analyze the microarray datasets while using GeneChip to assess direction of deregulation. Results were further validated by RT-PCR. In total, the study identifi ed 84 differentially regulated genes with their functions and then mapped them using IPA soft-ware into three main networks: (1) cell growth and proliferation, (2) cell death, and (3) nervous system development [ 55 ].
Proteomics is one of the most heavily investigated fi elds because of the work undertaken for biomarker discovery and disease pathway eluci-dation. In terms of relevance to psychiatry, proteomic studies start from assay of the differential protein expression between disease and control specimen using one of the two main techniques: 2D-differential in-gel electrophoresis (2D-DiGE) or liquid chromatography- mass spectrometric (LC-MS) analysis. Differentially expressed spots are detected, and MS is used to identify the proteins by mining MS data-bases like X! Tandem ( http://www.thegpm.org/TANDEM/ ) or using tools like protein prospector ( http://prospector.ucsf.edu/ prospector/mshome.htm ). Identifi ed proteins are assigned into func-tional classes and inter action networks using several tools including PRrotein Ontology (PRO— http://www.obofoundry.org/cgi-bin/detail.cgi?id=protein ), IPA, MPPI ( http://mips.gsf.de/proj/ppi/ ),
3.3 Pathway Analysis in Proteomics
Ali Alawieh et al.

167
Reactome ( http://www.reactome.org/ ), and others. Examples of such applications in psychiatric disorders are numerous. In the follow-ing, we highlight two studies using this approach.
Martins-de-Souza et al. used a nano-LC coupled to shotgun proteomics approach to detect differential expression of proteins in the prefrontal cortex of schizophrenic patients compared to con-trols. Acquired lists from the MS spectra were sent to the BioTools software package for analysis and searched against the NCBI data-base. The identifi ed proteins were then clustered into groups based on biological functions using the human protein reference database (HPRD— http://www.hprd.org ). Deregulated pathways subse-quently identifi ed included signal transduction, cell communica-tion, cell growth maintenance, and energy metabolism [ 56 ].
In a similar approach, the proteomic profi le of a mouse model was studied looking at the anxiety phenotype [ 57 ]. Proteins iso-lated from the synaptosome of mice cingulate cortices were detected by LC-tandem MS (LC-MS/MS). MS data were searched against International Protein Index mouse database using the BioWorks and SEQUEST software packages, KEGG was used to identify overrepresented pathways, and statistical pathway analysis was performed in R and visualized by Pathway Studio software. Among the different pathways, oxidative phosphorylation, meta-bolic processes, and fatty acid metabolism were overrepresented [ 57 ]. The proteomic fi ndings were also correlated with the molec-ular processes involved in oxidative stress in a comparative approach described in the following section.
Comparative omics is an integrative approach that links high- throughput data from several layers of biological organizations, most commonly transcriptomics, proteomics, and metabolomics. Using this strategy, changes in regulatory pathways at each level are correlated with relevant changes at a different level in an inves-tigation that aims to understand how different components of the central dogma contribute to the overall disease manifestation. This also serves as a means to validate fi ndings at one level by demon-strating the corresponding interactive pathway at different levels. To illustrate this approach, we use the study done by Prabakaren et al. demonstrating the involvement of mitochondrial dysfunction and oxidative stress in the pathogenesis of schizophrenia [ 58 ]. Similar approaches to the ones previously described were used to analyze and interpret proteomics, transcriptomics, and metabolo-mics data. Results showed that half of the altered proteins obtained from prefrontal cortex samples were involved in oxidative stress and mitochondrial dysfunction. This protein alteration was at the same time associated with both cluster analysis of transcriptomic data showing similar association and relevant molecular metabolomics changes. Similarly, Filiou et al. used the same strategy to study an animal model of anxiety [ 57 ].
3.4 Comparative Omics Approaches
Bioinformatics and Interacting Pathways

168
4 Conclusions
The understanding of interacting pathways in neuropsychiatric disorders is facilitated and made more accurate with the use of bio-informatics tools. A fi rst step in the study of such disorders is the extraction and mathematical analysis of the massive amount of data engendered, a method referred to as data mining . Data mining methodologies follow a certain pattern, starting with a data clean-ing step where the raw data are validated. This is followed by a data preprocessing step where the data are unifi ed, automated, pub-lished, optimized, documented, and metrics specifi ed. Finally, the integration step consists in normalizing the data, making them less biased than the original sets. In parallel, feature selection and extraction algorithms enable the elimination of any redundant or irrelevant feature of the disease and aggregate the data into differ-ent dimensions compared to the starting ones, respectively.
Different machine learning approaches can also be used. The supervised learning approach matches each data point to its corre-sponding class or category. The unsupervised/clustering learning approach classifi es similar points that could not be individually cat-egorized. Semi-supervised learning approach makes use of labeled and unlabeled data so that points falling under the same category but with pairwise constraints become apparent. However, all these methodologies and algorithms tactics should be assembled into graphs and networks to visualize better the relation among the dif-ferent components of the system model. Most common networks include metabolic network or pathway, protein network, and genetic or gene regulatory network. In addition, some tools referred to as generic tools enfold data mining and visualization tools altogether.
Most importantly, these bioinformatics tools allow us to dis-cover possible pathways implicated in the pathogenesis of psychiat-ric disorders and to identify disease-cross-related networks. Indeed, molecular and clinical psychiatry can be unveiled via bioinformatics tools that make use of data on psychiatric genomics, transcrip-tomics, proteomics, and comparative omics approaches. In psychi-atric genomics , large-scale genetic analyses provided by GWAS along with disease-involved SNPs and CNVs give insight into pathways involving gene–gene interactions and so help in the understanding of the pathophysiology of the disease. In particular, LocusZoom, UCSC Genome Graphs, and IGV are dedicated for regional visualization of GWAS results. In addition, knowledge of gene function and gene interaction maps is obtained from online databases such as Gene Ontology, GeneNet, and KEGG. IPA is another bioinformatics tool that helps discover if disease-associated CNVs or SNPs can be associated with physiological or clinical psy-chiatric phenotypes. Still another promising tool to analyze large genomics data is the HapMap project. This uses perfect proxy sets or co-sets that are made of directly correlated SNPs, so that it becomes feasible to reconstruct cellular interaction networks and associate
Ali Alawieh et al.

169
them with functional states. Although this tool offers the possibility to classify disease variations with same functional outcome, its application remains limited in psychiatric research.
Psychiatric transcriptomics allows the assessment of gene regu-lation by measuring mRNA expression levels. Interestingly, gene identifi cation in this category is done in a systematic way. First microarray data are processed via an R-based bioconductor. Second, genes are clustered by biological function via gene ontol-ogy databases and networks can then be visualized through GenMAPP. Specifi cally, a dendrogram can be used to visualize co- regulated genes. Still under the fi eld of psychiatric transcriptomics, phenome–transcriptome association studies can be performed. In these studies, transcriptomics pathways are symmetrically corre-lated with phenotypic features of psychiatric disorders.
The applications of psychiatric proteomics are many, which is not surprising since proteomics provides a core approach for biomarker discovery and disease pathway elucidation. Psychiatric proteomics studies all follow a common trend, starting with the assay of differen-tial protein expression between disease and control specimen. This is done using either the 2D-DiGE or the LC-MS technique. Once the differentially expressed spots/proteins are detected and identifi ed by MS, they are assigned into functional classes and interaction networks using several tools including PRO, IPA, MPPI, and Reactome. Then they can be visualized through Pathway Studio software.
Finally, psychiatric comparative omics approaches link several layers of biological organizations, most commonly transcriptomics, proteomics, and metabolomics. Noteworthy, this approach serves to validate the fi ndings of one level by demonstrating the occur-rence of similar pathways at different levels. Comparative omics are also necessary to understand how different components of the central dogma contribute to the overall disease manifestation.
To sum up, the analysis of psychiatric disorders such as schizo-phrenia, autism, Alzheimer disease, and bipolar disorders among others is feasible and provides accurate results when applying bioin-formatics tools. These novel approaches have the potential to allow a better pathway analysis and visualization of the pathophysiology of psychiatric disorders and, therefore, to help unravel and exploit the existing heterogeneity in biology of such conditions, potentially leading to a more effective targeted clinical interventions.
5 Notes 1. In the following are listed examples where clustering methods
have used microarray gene expression data to cluster genes enabling each entry in the gene expression dataset to represent a gene feature:
(a) Row clustering was used to cluster genes having similar fl uctuating behavior in all conditions [ 59 ]. This application
Bioinformatics and Interacting Pathways
170
1. International Human Genome Sequencing Consortium (2004) Finishing the euchromatic sequence of the human genome. Nature 431:931–945
2. Benson DA, Karsch-Mizrachi I, Lipman DJ et al (2000) GenBank. Nucleic Acids Res 28:15–18
3. Louie B, Mork P, Martin-Sanchez F et al (2007) Data integration and genomic medi-cine. J Biomed Inform 40:5–16
4. Luscombe NM, Greenbaum D, Gerstein M (2001) What is bioinformatics? A proposed defi nition and overview of the fi eld. Methods Inf Med 40:346–358
5. Alawieh A, Zaraket FA, Li JL et al (2012) Systems biology, bioinformatics, and biomark-ers in neuropsychiatry. Front Neurosci 6:187
6. Li MD (2010) Grand challenges and opportu-nities for molecular psychiatry research: a per-spective. Front Psychiatry 1:2
7. Taurines R, Dudley E, Grassl J et al (2011) Proteomic research in psychiatry. J Psychopharmacol 25:151–196
8. Tovar D, Cornejo E, Xanthopoulos P et al (2012) Data mining in psychiatric research. Methods Mol Biol 829:593–603
9. Wang JT, Zaki MJ, Hannu TT et al (2005) Data mining in bioinformatics. In: Jain L, Wu X (eds) Introduction to data mining in bioin-formatics. Springer, London, pp 3–8
10. Holloway AJ, van Laar RK, Tothill RW et al (2002) Options available—from start to fi n-ish—for obtaining data from DNA microarrays II. Nat Genet 32:481–489
11. Brazma A, Hingamp P, Quackenbush J et al (2001) Minimum information about a microar-ray experiment (MIAME)—toward standards for microarray data. Nat Genet 29:365–371
12. Spellman PT, Miller M, Stewart J et al (2002) Design and implementation of microarray gene expression markup language (MAGE-ML). Genome Biol 3:Research0046
13. Bajcsy P (2004) Gridline: automatic grid align-ment DNA microarray scans. IEEE Trans Image Process 13:15–25
14. Yandell MD, Majoros WH (2002) Genomics and natural language processing. Nat Rev Genet 3:601–610
15. Karr AF (2006) Exploratory data mining and data cleaning. J Am Stat Assoc 101:399
16. Fadlallah BH, Seth S, Keil A et al (2011) Robust EEG preprocessing for dependence- based condition discrimination. Conf Proc IEEE Eng Med Biol Soc 2011:1407–1410
17. Guyon I, Elisseeff A (2003) An introduction to variable and feature selection. JMLR 3:1157–1182
18. Saeys Y, Inza I, Larrañaga P (2007) A review of feature selection techniques in bioinformatics. Bioinformatics 23:2507–2517
results in fi nding the tightly co-regulated genes and missing the weakly regulated ones.
(b) Bicluster is a method used to measure the similarity among a subset of genes and conditions. In brief, if the squared mean residue error value of a matrix is less than a thresh-old, then the set of genes is considered to be a bicluster [ 60 ].
(c) Since bicluster uses squared mean residue error, some gene sets having high similarity may also have high error value. The work in P-clusters solves this problem. It requires the following additional constraint to form a cluster. For any 2 × 2 submatrix, given two genes, and two conditions, respectively, x 11, x 12, y 11, and y 12, the following con-straint should be satisfi ed: |( x 11 − x 12) − ( y 11 − y 12)| ≤ δ where δ is a threshold value [ 34 ].
2. MetaMap Transfer (MMTx) is a tool used to identify the con-cepts, synonyms, and multi-word terms present in the Unifi ed Medical Language System (UMLS). It parses the natural lan-guage format text into a list of computable concepts and their semantic types.
References
Ali Alawieh et al.

171
19. Liu H, Han H, Li J et al (2004) Using amino acid patterns to accurately predict translation initiation sites. In Silico Biol 4:255–269
20. Saeys Y, Degroeve S, Aeyels D et al (2004) Feature selection for splice site prediction: a new method using EDA-based feature ranking. BMC Bioinformatics 5:64
21. Ma S, Huang J (2005) Regularized ROC method for disease classifi cation and biomarker selection with microarray data. Bioinformatics 21:4356–4362
22. Ressom HW, Varghese RS, Drake SK et al (2007) Peak selection from MALDI-TOF mass spectra using ant colony optimization. Bioinformatics 23:619–626
23. He J, Zelikovsky A (2006) MLR-tagging: informative SNP selection for unphased geno-types based on multiple linear regression. Bioinformatics 22:2558–2561
24. Wang Y, Makedon F, Pearlman J (2006) Tumor classifi cation based on DNA copy num-ber aberrations determined using SNP arrays. Oncol Rep 15:1057–1059
25. Han B, Obradovic Z, Hu ZZ et al (2006) Substring selection for biomedical document classifi cation. Bioinformatics 22:2136–2142
26. Bishop CM (2006) Pattern recognition and machine learning. Springer, New York
27. Han J, Kamber M (2011) Data mining: con-cepts and techniques, 3rd edn. Morgan Kaufmann, San Francisco, CA
28. Hastie T, Tibshirani R, Friedman J et al (2005) The elements of statistical learning: data min-ing, inference and prediction. Math Intel 27(2):83–85
29. Lopresti D, Tomkins A (1997) Block edit models for approximate string matching. Theor Comput Sci 181:159–179
30. Mount DW (2004) Bioinformatics: sequence and genome analysis, 2nd edn. Cold Spring Harbour Laboratory Press, Cold Spring Harbour, NY
31. Witten IH, Frank E (2005) Data mining: prac-tical machine learning tools and techniques. Morgan Kaufmann, San Francisco, CA
32. Eisen MB, Spellman PT, Brown PO et al (1998) Cluster analysis and display of genome- wide expression patterns. Proc Natl Acad Sci U S A 95:14863–14868
33. Yang J, Wang W, Wang H et al (2002) δ-clusters: capturing subspace correlation in a large data set. Data engineering, 2002. In: Proceedings 18th international conference, IEEE, pp 517–528
34. Wang H, Wang W, Yang J et al (2002) Clustering by pattern similarity in large data
sets. In: Proceedings of the 2002 ACM SIGMOD international conference on man-agement of data, pp 394–405
35. Fayyad U, Wierse A, Grinstein G (2002) Information visualization in data mining and knowledge discovery. Morgan Kaufmann, San Francisco, CA
36. Frank E, Hall M, Trigg L et al (2004) Data mining in bioinformatics using Weka. Bioinformatics 20:2479–2481
37. Shannon P, Markiel A, Ozier O et al (2003) Cytoscape: a software environment for inte-grated models of biomolecular interaction net-works. Genome Res 13:2498–2504
38. Diederich J, Al-Ajmi A, Yellowlees P (2007) E x -ray: data mining and mental health. Appl Soft Comput 7:923–928
39. Moore JH, Asselbergs FW, Williams SM (2010) Bioinformatics challenges for genome- wide association studies. Bioinformatics 26:445–455
40. Aulchenko YS, Ripke S, Isaacs A et al (2007) GenABEL: an R library for genome-wide asso-ciation analysis. Bioinformatics 23:1294–1296
41. Gogarten SM, Bhangale T, Conomos MP et al (2012) GWASTools: an R/Bioconductor pack-age for quality control and analysis of genome- wide association studies. Bioinformatics 28:3329–3331
42. Merelli I, Calabria A, Cozzi P et al (2013) SNPranker 2.0: a gene-centric data mining tool for diseases associated SNP prioritization in GWAS. BMC Bioinformatics 14(Suppl 1):S9
43. Pruim RJ, Welch RP, Sanna S et al (2010) LocusZoom: regional visualization of genome- wide association scan results. Bioinformatics 26:2336–2337
44. Meyer LR, Zweig AS, Hinrichs AS et al (2013) The UCSC Genome Browser database: exten-sions and updates 2013. Nucleic Acids Res 41(Database issue):D64–D69
45. Robinson JT, Thorvaldsdóttir H, Winckler W et al (2011) Integrative genomics viewer. Nat Biotechnol 29:24–26
46. Schizophrenia Psychiatric Genome-Wide Association Study (GWAS) Consortium (2011) Genome-wide association study identifi es fi ve new schizophrenia loci. Nat Genet 43:969–976
47. Collins AL, Sullivan PF (2013) Genome-wide association studies in psychiatry: what have we learned? Br J Psychiatry 202:1–4
48. Marshall CR, Scherer SW (2012) Detection and characterization of copy number variation in autism spectrum disorder. Methods Mol Biol 838:115–135
Bioinformatics and Interacting Pathways

172
49. Greenwood TA, Lazzeroni LC, Murray SS (2011) Analysis of 94 candidate genes and 12 endophenotypes for schizophrenia from the Consortium on the Genetics of Schizophrenia. Am J Psychiatry 168:930–946
50. Ayalew M, Le-Niculescu H, Levey DF et al (2012) Convergent functional genomics of schizophrenia: from comprehensive under-standing to genetic risk prediction. Mol Psychiatry 17:887–905
51. Jamshidi N, Palsson BO (2006) Systems biol-ogy of SNPs. Mol Syst Biol 2:38
52. Hakak Y, Walker JR, Li C et al (2001) Genome- wide expression analysis reveals dysregulation of myelination-related genes in chronic schizo-phrenia. Proc Natl Acad Sci U S A 98:4746–4751
53. Sequeira PA, Martin MV, Vawter MP (2012) The fi rst decade and beyond of transcriptional profi ling in schizophrenia. Neurobiol Dis 45:23–36
54. Gormanns P, Mueller NS, Ditzen C et al (2011) Phenome-transcriptome correlation unravels anxiety and depression related path-ways. J Psychiatr Res 45:973–979
55. Nakatani N, Hattori E, Ohnishi T et al (2006) Genome-wide expression analysis detects eight genes with robust alterations specifi c to bipolar I disorder: relevance to neuronal network per-turbation. Hum Mol Genet 15:1949–1962
56. Martins-de-Souza D, Gattaz WF, Schmitt A et al (2009) Prefrontal cortex shotgun proteome analysis reveals altered calcium homeostasis and immune system imbalance in schizophrenia. Eur Arch Psychiatry Clin Neurosci 259:151–163
57. Filiou MD, Zhang Y, Teplytska L et al (2011) Proteomics and metabolomics analysis of a trait anxiety mouse model reveals divergent mitochondrial pathways. Biol Psychiatry 70:1074–1082
58. Prabakaran S, Swatton JE, Ryan MM et al (2004) Mitochondrial dysfunction in schizo-phrenia: evidence for compromised brain metabolism and oxidative stress. Mol Psychiatry 9:684–697, 643
59. Hartigan JA (1972) Direct clustering of a data matrix. J Am Stat Assoc 67:123–129
60. Cheng Y, Church GM (2000) Biclustering of expression data. Proc Int Conf Intell Syst Mol Biol 8:93–103
Ali Alawieh et al.