Thalamo - cortical dysrhythmia: a neurological and neuropsychiatric syndrome characterized by...
6
Thalamocortical dysrhythmia: A neurological and neuropsychiatric syndrome characterized by magnetoencephalography Rodolfo R. Llina ´ s* , Urs Ribary*, Daniel Jeanmonod ‡ , Eugene Kronberg*, and Partha P. Mitra § *Department of Physiology and Neuroscience, New York University School of Medicine, 550 First Avenue, New York, NY 10016; ‡ Universita ¨ tsspital Zurich, Neurochirurgische Klinik, Sternwartstrasse 6, CH-8091 Zurich, Switzerland; and § Bell Laboratories, Lucent Technologies, 600 Mountain Avenue, Murray Hill, NJ 07974 Contributed by Rodolfo R. Llina ´ s, October 21, 1999 Spontaneous magnetoencephalographic activity was recorded in awake, healthy human controls and in patients suffering from neurogenic pain, tinnitus, Parkinson’s disease, or depression. Com- pared with controls, patients showed increased low-frequency u rhythmicity, in conjunction with a widespread and marked increase of coherence among high- and low-frequency oscillations. These data indicate the presence of a thalamocortical dysrhythmia, which we propose is responsible for all the above mentioned conditions. This coherent u activity, the result of a resonant interaction between thalamus and cortex, is due to the generation of low- threshold calcium spike bursts by thalamic cells. The presence of these bursts is directly related to thalamic cell hyperpolarization, brought about by either excess inhibition or disfacilitation. The emergence of positive clinical symptoms is viewed as resulting from ectopic g-band activation, which we refer to as the ‘‘edge effect.’’ This effect is observable as increased coherence between low- and high-frequency oscillations, probably resulting from in- hibitory asymmetry between high- and low-frequency thalamo- cortical modules at the cortical level. edge effect u u activity u g activity u humans I n recent years it has become evident that neuronal rhythmicity and its consequence, ensemble neuronal oscillation and reso- nance, are deeply related to the emergence of brain functions (1, 2). Prominent in these studies was the linking of high-frequency oscillations in the g domain (25–50 Hz) with sensorimotor (3, 4) and cognitive functions (5–12). Although the exact mechanism by which such coherent activity ultimately results in conscious experience is still under debate, there is little doubt that slow oscillatory activity, as observed in phase four of the sleep cycle, cannot presently be correlated with cognition (9). Here we report a set of studies concerning the presence of slow thalamo- cortical oscillation in the u-frequency band (4–8 Hz) in awake human patients who present a wide variety of neurological and psychiatric conditions. These results are in complete accordance with single-unit, medial thalamic recordings, made during ste- reotactic surgery in patients suffering from the same diseases. These recordings show the presence of low-threshold spike (LTS) bursting activity with a u rhythmicity (13). Methods Subjects and Patients. In this study, we analyzed spontaneous brain activity from nine healthy control subjects and from nine patients suffering from chronic, severe, and therapy-resistant neurological or neuropsychiatric disorders. Control subjects ranged between 24 and 45 years old; patients ranged between 28 and 73 years old. The patient population included four patients diagnosed with Parkinson’s disease (three akinetic–choreatic forms and one tremulant form), one patient with tinnitus, two patients with neurogenic pain (one trigeminal and one upper- limb phantom pain), and two patients with major depression. Patients were carefully selected by using standard neurologi- calypsychiatric diagnostic procedures. Magnetoencephalography (MEG) Recordings and Analysis. Magnetic recordings were obtained at our laboratory with a whole-head, 148-channel MEG system Magnes 2500 WH (Biomagnetic Tech- nologies, San Diego). During the recording sessions, the subject was placed on a bed with the MEG recording port (Fig. 1A) surrounding the subject’s head to record the magnetic fields from different angles over the head surface. Spontaneous brain activity was continuously recorded for 10 min while the subject rested with eyes closed (bandpass, 0.1–100 Hz; sample rate, 508 Hz). The EKG was simultaneously recorded digitally for off-line heart-artifact rejection. MEG Analysis. Continuous MEG raw data were analyzed on a LINUX cluster computer system, by using in-house software and commercial MATLAB analysis software packages. Computational Methods. MEG data have a low signal-to-noise ratio and a large dynamic range, which make it a challenging data analysis problem. Although spectral analysis is an old subject, with a number of different techniques currently in use in EEG and MEG literature, we have benefited substantially from the usage of a modern framework for performing spectral analysis, the multitaper technique (14). This technique elegantly resolves the problems of bias and variance in spectral estimation, by averaging over a set of orthogonal basis functions, the so-called Slepian sequences (15). These sequences w k (t) form a sequence of orthogonal functions, defined on the time interval t 5 1, 2, . . . , T. They are parameterized by a bandwidth parameter W, such that there are K 5 [2WT] basis functions with spectra that are confined to a frequency band [f 2 W, f 1 W] around the frequency of interest, f. These methods have recently been applied to the analysis of neurobiological time series (16). For a given data sequence x(t), the basic quantity involved in the spectral estimation is the tapered Fourier transform: x ˜ k ~ f ! 5 O t x ~ t ! w k ~ t ! e 22pift . [1] In terms of these quantities, a direct estimate of the spectrum is given by: S MT ~ f ! < 1 K O k51 K u x ˜ k ~ f ! u 2 . [2] Abbreviations: LTS, low-threshold spike; MEG, magnetoencephalography; PET, positron emission tomography. ² To whom reprint requests should be addressed. E-mail: [email protected]. The publication costs of this article were defrayed in part by page charge payment. This article must therefore be hereby marked “advertisement” in accordance with 18 U.S.C. §1734 solely to indicate this fact. 15222–15227 u PNAS u December 21, 1999 u vol. 96 u no. 26
Transcript of Thalamo - cortical dysrhythmia: a neurological and neuropsychiatric syndrome characterized by...
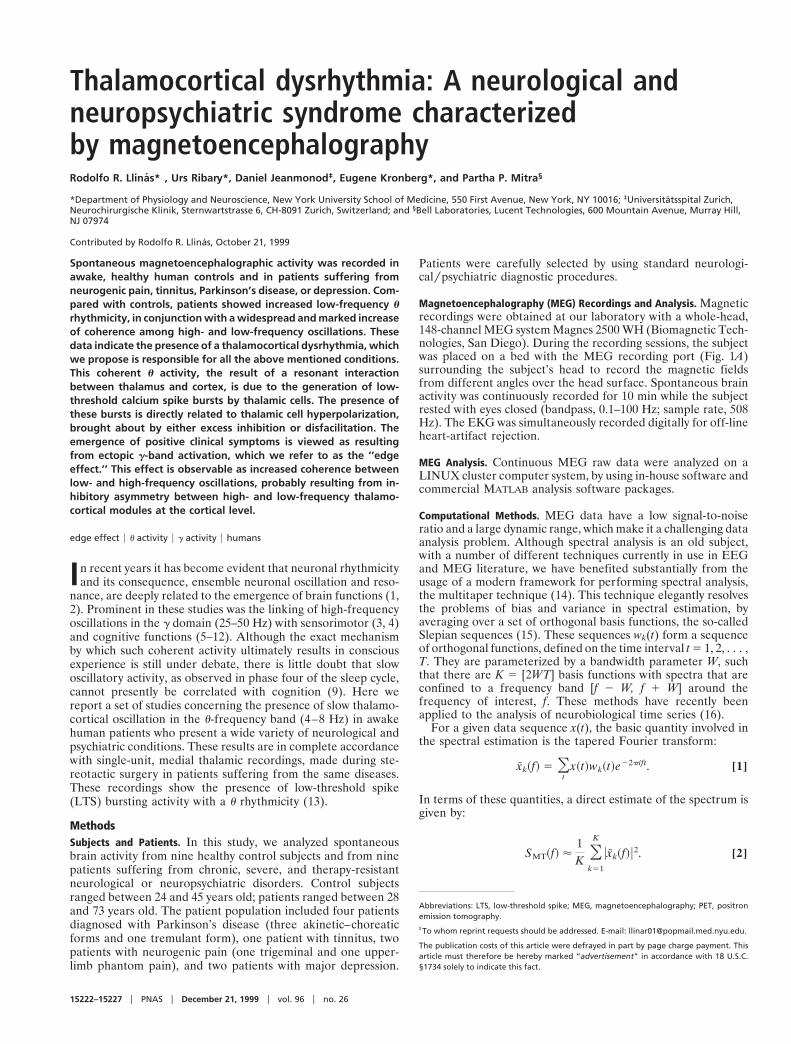
Thalamocortical dysrhythmia: A neurological andneuropsychiatric syndrome characterizedby magnetoencephalographyRodolfo R. Llinas*†, Urs Ribary*, Daniel Jeanmonod‡, Eugene Kronberg*, and Partha P. Mitra§
*Department of Physiology and Neuroscience, New York University School of Medicine, 550 First Avenue, New York, NY 10016; ‡Universitatsspital Zurich,Neurochirurgische Klinik, Sternwartstrasse 6, CH-8091 Zurich, Switzerland; and §Bell Laboratories, Lucent Technologies, 600 Mountain Avenue, Murray Hill,NJ 07974
Contributed by Rodolfo R. Llinas, October 21, 1999
Spontaneous magnetoencephalographic activity was recorded inawake, healthy human controls and in patients suffering fromneurogenic pain, tinnitus, Parkinson’s disease, or depression. Com-pared with controls, patients showed increased low-frequency u
rhythmicity, in conjunction with a widespread and marked increaseof coherence among high- and low-frequency oscillations. Thesedata indicate the presence of a thalamocortical dysrhythmia, whichwe propose is responsible for all the above mentioned conditions.This coherent u activity, the result of a resonant interactionbetween thalamus and cortex, is due to the generation of low-threshold calcium spike bursts by thalamic cells. The presence ofthese bursts is directly related to thalamic cell hyperpolarization,brought about by either excess inhibition or disfacilitation. Theemergence of positive clinical symptoms is viewed as resultingfrom ectopic g-band activation, which we refer to as the ‘‘edgeeffect.’’ This effect is observable as increased coherence betweenlow- and high-frequency oscillations, probably resulting from in-hibitory asymmetry between high- and low-frequency thalamo-cortical modules at the cortical level.
edge effect u u activity u g activity u humans
In recent years it has become evident that neuronal rhythmicityand its consequence, ensemble neuronal oscillation and reso-
nance, are deeply related to the emergence of brain functions (1,2). Prominent in these studies was the linking of high-frequencyoscillations in the g domain (25–50 Hz) with sensorimotor (3, 4)and cognitive functions (5–12). Although the exact mechanismby which such coherent activity ultimately results in consciousexperience is still under debate, there is little doubt that slowoscillatory activity, as observed in phase four of the sleep cycle,cannot presently be correlated with cognition (9). Here wereport a set of studies concerning the presence of slow thalamo-cortical oscillation in the u-frequency band (4–8 Hz) in awakehuman patients who present a wide variety of neurological andpsychiatric conditions. These results are in complete accordancewith single-unit, medial thalamic recordings, made during ste-reotactic surgery in patients suffering from the same diseases.These recordings show the presence of low-threshold spike(LTS) bursting activity with a u rhythmicity (13).
MethodsSubjects and Patients. In this study, we analyzed spontaneousbrain activity from nine healthy control subjects and from ninepatients suffering from chronic, severe, and therapy-resistantneurological or neuropsychiatric disorders. Control subjectsranged between 24 and 45 years old; patients ranged between 28and 73 years old. The patient population included four patientsdiagnosed with Parkinson’s disease (three akinetic–choreaticforms and one tremulant form), one patient with tinnitus, twopatients with neurogenic pain (one trigeminal and one upper-limb phantom pain), and two patients with major depression.
Patients were carefully selected by using standard neurologi-calypsychiatric diagnostic procedures.
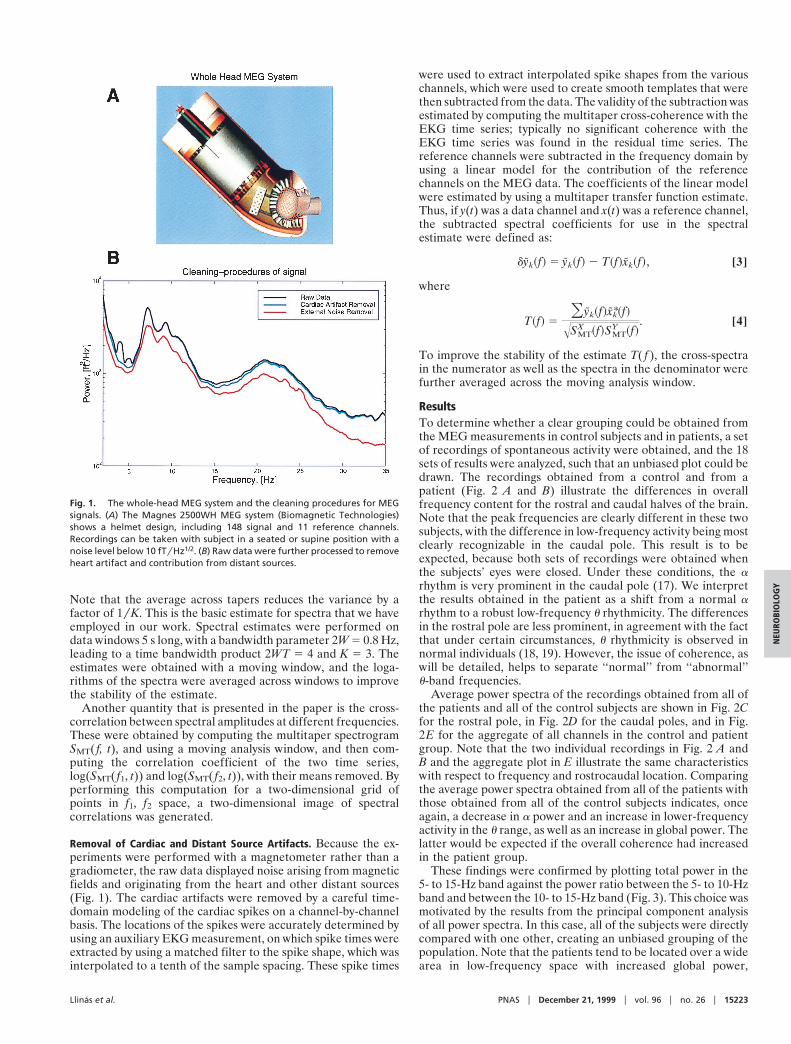
Magnetoencephalography (MEG) Recordings and Analysis. Magneticrecordings were obtained at our laboratory with a whole-head,148-channel MEG system Magnes 2500 WH (Biomagnetic Tech-nologies, San Diego). During the recording sessions, the subjectwas placed on a bed with the MEG recording port (Fig. 1A)surrounding the subject’s head to record the magnetic fieldsfrom different angles over the head surface. Spontaneous brainactivity was continuously recorded for 10 min while the subjectrested with eyes closed (bandpass, 0.1–100 Hz; sample rate, 508Hz). The EKG was simultaneously recorded digitally for off-lineheart-artifact rejection.
MEG Analysis. Continuous MEG raw data were analyzed on aLINUX cluster computer system, by using in-house software andcommercial MATLAB analysis software packages.
Computational Methods. MEG data have a low signal-to-noiseratio and a large dynamic range, which make it a challenging dataanalysis problem. Although spectral analysis is an old subject,with a number of different techniques currently in use in EEGand MEG literature, we have benefited substantially from theusage of a modern framework for performing spectral analysis,the multitaper technique (14). This technique elegantly resolvesthe problems of bias and variance in spectral estimation, byaveraging over a set of orthogonal basis functions, the so-calledSlepian sequences (15). These sequences wk(t) form a sequenceof orthogonal functions, defined on the time interval t 5 1, 2, . . . ,T. They are parameterized by a bandwidth parameter W, suchthat there are K 5 [2WT] basis functions with spectra that areconfined to a frequency band [f 2 W, f 1 W] around thefrequency of interest, f. These methods have recently beenapplied to the analysis of neurobiological time series (16).
For a given data sequence x(t), the basic quantity involved inthe spectral estimation is the tapered Fourier transform:
xk~f! 5 Ot
x~t!wk~t!e22pift. [1]
In terms of these quantities, a direct estimate of the spectrum isgiven by:
SMT~f! <1K O
k51
K
uxk~f!u2. [2]
Abbreviations: LTS, low-threshold spike; MEG, magnetoencephalography; PET, positronemission tomography.
†To whom reprint requests should be addressed. E-mail: [email protected].
The publication costs of this article were defrayed in part by page charge payment. Thisarticle must therefore be hereby marked “advertisement” in accordance with 18 U.S.C.§1734 solely to indicate this fact.
15222–15227 u PNAS u December 21, 1999 u vol. 96 u no. 26
Note that the average across tapers reduces the variance by afactor of 1yK. This is the basic estimate for spectra that we haveemployed in our work. Spectral estimates were performed ondata windows 5 s long, with a bandwidth parameter 2W 5 0.8 Hz,leading to a time bandwidth product 2WT 5 4 and K 5 3. Theestimates were obtained with a moving window, and the loga-rithms of the spectra were averaged across windows to improvethe stability of the estimate.
Another quantity that is presented in the paper is the cross-correlation between spectral amplitudes at different frequencies.These were obtained by computing the multitaper spectrogramSMT( f, t), and using a moving analysis window, and then com-puting the correlation coefficient of the two time series,log(SMT( f1, t)) and log(SMT( f2, t)), with their means removed. Byperforming this computation for a two-dimensional grid ofpoints in f1, f2 space, a two-dimensional image of spectralcorrelations was generated.
Removal of Cardiac and Distant Source Artifacts. Because the ex-periments were performed with a magnetometer rather than agradiometer, the raw data displayed noise arising from magneticfields and originating from the heart and other distant sources(Fig. 1). The cardiac artifacts were removed by a careful time-domain modeling of the cardiac spikes on a channel-by-channelbasis. The locations of the spikes were accurately determined byusing an auxiliary EKG measurement, on which spike times wereextracted by using a matched filter to the spike shape, which wasinterpolated to a tenth of the sample spacing. These spike times
were used to extract interpolated spike shapes from the variouschannels, which were used to create smooth templates that werethen subtracted from the data. The validity of the subtraction wasestimated by computing the multitaper cross-coherence with theEKG time series; typically no significant coherence with theEKG time series was found in the residual time series. Thereference channels were subtracted in the frequency domain byusing a linear model for the contribution of the referencechannels on the MEG data. The coefficients of the linear modelwere estimated by using a multitaper transfer function estimate.Thus, if y(t) was a data channel and x(t) was a reference channel,the subtracted spectral coefficients for use in the spectralestimate were defined as:
dyk~f! 5 yk~f! 2 T~f!xk~f!, [3]
where
T~f! 5Oyk~f!x*k~f!
ÎSMTX ~f!SMT
Y ~f!. [4]
To improve the stability of the estimate T( f ), the cross-spectrain the numerator as well as the spectra in the denominator werefurther averaged across the moving analysis window.
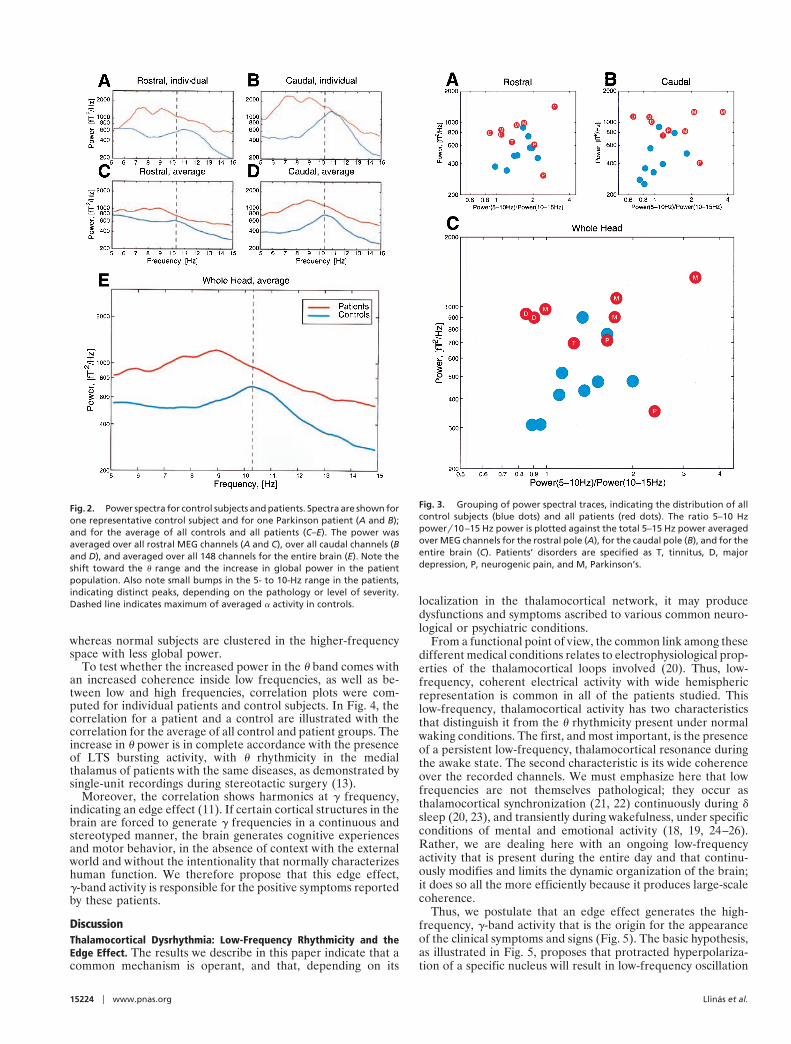
ResultsTo determine whether a clear grouping could be obtained fromthe MEG measurements in control subjects and in patients, a setof recordings of spontaneous activity were obtained, and the 18sets of results were analyzed, such that an unbiased plot could bedrawn. The recordings obtained from a control and from apatient (Fig. 2 A and B) illustrate the differences in overallfrequency content for the rostral and caudal halves of the brain.Note that the peak frequencies are clearly different in these twosubjects, with the difference in low-frequency activity being mostclearly recognizable in the caudal pole. This result is to beexpected, because both sets of recordings were obtained whenthe subjects’ eyes were closed. Under these conditions, the arhythm is very prominent in the caudal pole (17). We interpretthe results obtained in the patient as a shift from a normal arhythm to a robust low-frequency u rhythmicity. The differencesin the rostral pole are less prominent, in agreement with the factthat under certain circumstances, u rhythmicity is observed innormal individuals (18, 19). However, the issue of coherence, aswill be detailed, helps to separate ‘‘normal’’ from ‘‘abnormal’’u-band frequencies.
Average power spectra of the recordings obtained from all ofthe patients and all of the control subjects are shown in Fig. 2Cfor the rostral pole, in Fig. 2D for the caudal poles, and in Fig.2E for the aggregate of all channels in the control and patientgroup. Note that the two individual recordings in Fig. 2 A andB and the aggregate plot in E illustrate the same characteristicswith respect to frequency and rostrocaudal location. Comparingthe average power spectra obtained from all of the patients withthose obtained from all of the control subjects indicates, onceagain, a decrease in a power and an increase in lower-frequencyactivity in the u range, as well as an increase in global power. Thelatter would be expected if the overall coherence had increasedin the patient group.
These findings were confirmed by plotting total power in the5- to 15-Hz band against the power ratio between the 5- to 10-Hzband and between the 10- to 15-Hz band (Fig. 3). This choice wasmotivated by the results from the principal component analysisof all power spectra. In this case, all of the subjects were directlycompared with one other, creating an unbiased grouping of thepopulation. Note that the patients tend to be located over a widearea in low-frequency space with increased global power,
Fig. 1. The whole-head MEG system and the cleaning procedures for MEGsignals. (A) The Magnes 2500WH MEG system (Biomagnetic Technologies)shows a helmet design, including 148 signal and 11 reference channels.Recordings can be taken with subject in a seated or supine position with anoise level below 10 fTyHz1/2. (B) Raw data were further processed to removeheart artifact and contribution from distant sources.
Llinas et al. PNAS u December 21, 1999 u vol. 96 u no. 26 u 15223
NEU
ROBI
OLO
GY
whereas normal subjects are clustered in the higher-frequencyspace with less global power.
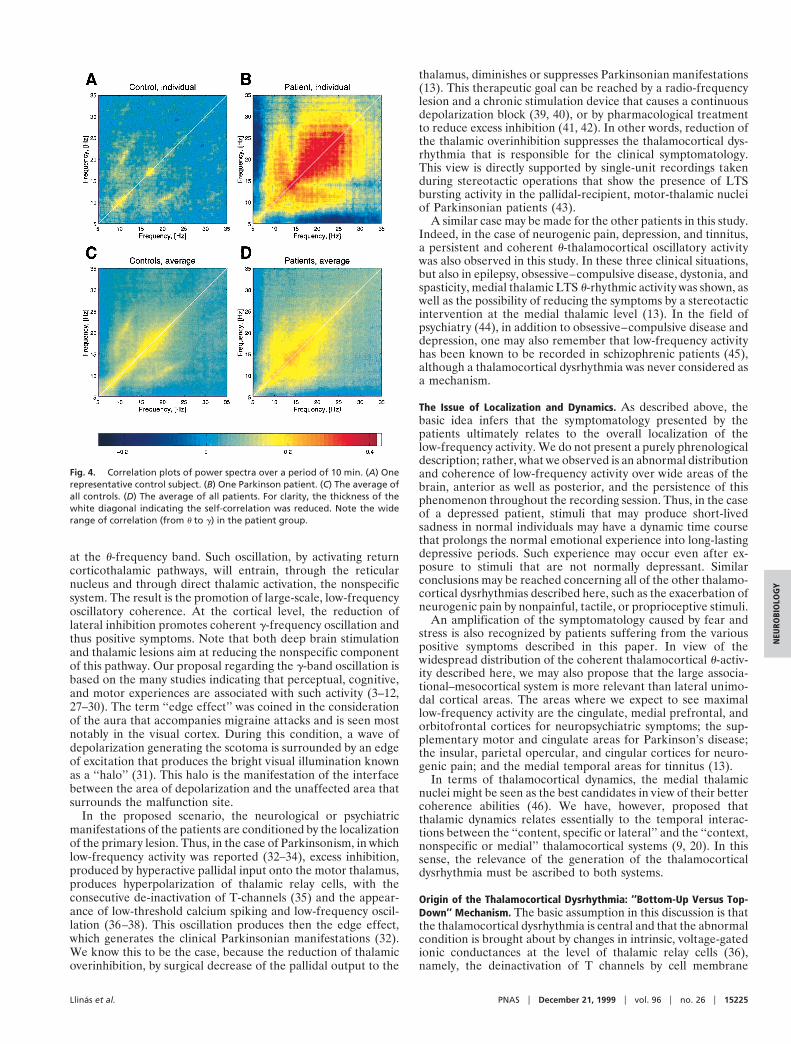
To test whether the increased power in the u band comes withan increased coherence inside low frequencies, as well as be-tween low and high frequencies, correlation plots were com-puted for individual patients and control subjects. In Fig. 4, thecorrelation for a patient and a control are illustrated with thecorrelation for the average of all control and patient groups. Theincrease in u power is in complete accordance with the presenceof LTS bursting activity, with u rhythmicity in the medialthalamus of patients with the same diseases, as demonstrated bysingle-unit recordings during stereotactic surgery (13).
Moreover, the correlation shows harmonics at g frequency,indicating an edge effect (11). If certain cortical structures in thebrain are forced to generate g frequencies in a continuous andstereotyped manner, the brain generates cognitive experiencesand motor behavior, in the absence of context with the externalworld and without the intentionality that normally characterizeshuman function. We therefore propose that this edge effect,g-band activity is responsible for the positive symptoms reportedby these patients.
DiscussionThalamocortical Dysrhythmia: Low-Frequency Rhythmicity and theEdge Effect. The results we describe in this paper indicate that acommon mechanism is operant, and that, depending on its
localization in the thalamocortical network, it may producedysfunctions and symptoms ascribed to various common neuro-logical or psychiatric conditions.
From a functional point of view, the common link among thesedifferent medical conditions relates to electrophysiological prop-erties of the thalamocortical loops involved (20). Thus, low-frequency, coherent electrical activity with wide hemisphericrepresentation is common in all of the patients studied. Thislow-frequency, thalamocortical activity has two characteristicsthat distinguish it from the u rhythmicity present under normalwaking conditions. The first, and most important, is the presenceof a persistent low-frequency, thalamocortical resonance duringthe awake state. The second characteristic is its wide coherenceover the recorded channels. We must emphasize here that lowfrequencies are not themselves pathological; they occur asthalamocortical synchronization (21, 22) continuously during dsleep (20, 23), and transiently during wakefulness, under specificconditions of mental and emotional activity (18, 19, 24–26).Rather, we are dealing here with an ongoing low-frequencyactivity that is present during the entire day and that continu-ously modifies and limits the dynamic organization of the brain;it does so all the more efficiently because it produces large-scalecoherence.
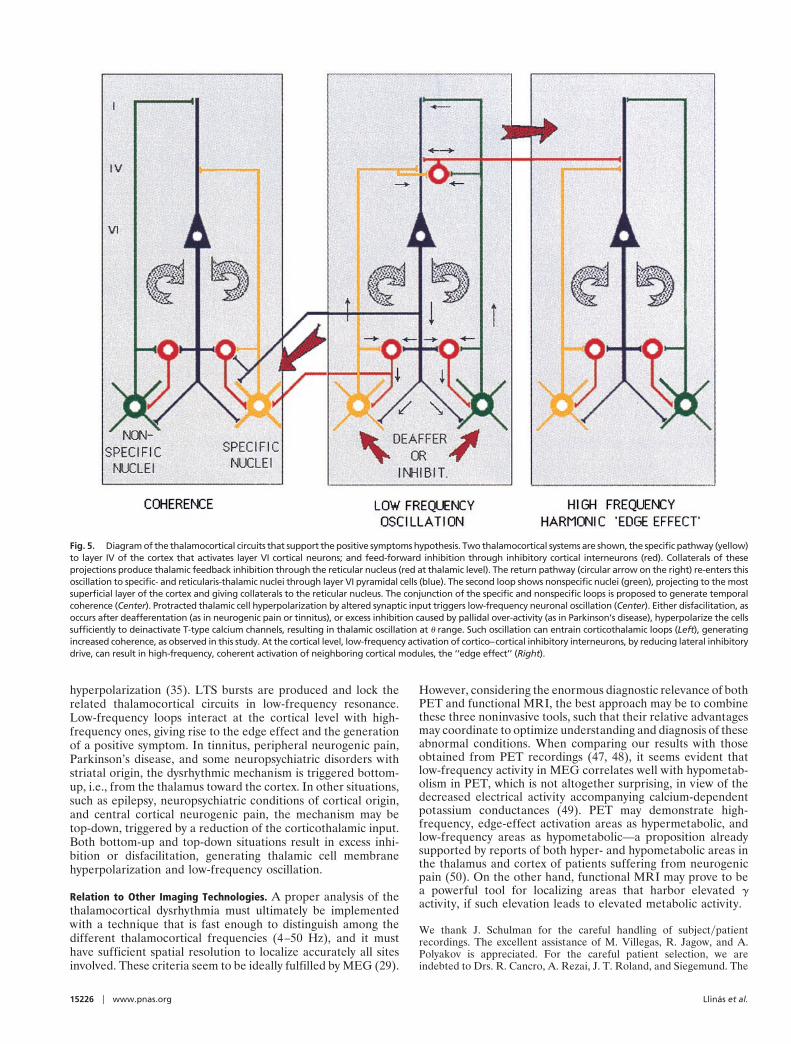
Thus, we postulate that an edge effect generates the high-frequency, g-band activity that is the origin for the appearanceof the clinical symptoms and signs (Fig. 5). The basic hypothesis,as illustrated in Fig. 5, proposes that protracted hyperpolariza-tion of a specific nucleus will result in low-frequency oscillation
Fig. 2. Power spectra for control subjects and patients. Spectra are shown forone representative control subject and for one Parkinson patient (A and B);and for the average of all controls and all patients (C–E). The power wasaveraged over all rostral MEG channels (A and C), over all caudal channels (Band D), and averaged over all 148 channels for the entire brain (E). Note theshift toward the u range and the increase in global power in the patientpopulation. Also note small bumps in the 5- to 10-Hz range in the patients,indicating distinct peaks, depending on the pathology or level of severity.Dashed line indicates maximum of averaged a activity in controls.
Fig. 3. Grouping of power spectral traces, indicating the distribution of allcontrol subjects (blue dots) and all patients (red dots). The ratio 5–10 Hzpowery10–15 Hz power is plotted against the total 5–15 Hz power averagedover MEG channels for the rostral pole (A), for the caudal pole (B), and for theentire brain (C). Patients’ disorders are specified as T, tinnitus, D, majordepression, P, neurogenic pain, and M, Parkinson’s.
15224 u www.pnas.org Llinas et al.
at the u-frequency band. Such oscillation, by activating returncorticothalamic pathways, will entrain, through the reticularnucleus and through direct thalamic activation, the nonspecificsystem. The result is the promotion of large-scale, low-frequencyoscillatory coherence. At the cortical level, the reduction oflateral inhibition promotes coherent g-frequency oscillation andthus positive symptoms. Note that both deep brain stimulationand thalamic lesions aim at reducing the nonspecific componentof this pathway. Our proposal regarding the g-band oscillation isbased on the many studies indicating that perceptual, cognitive,and motor experiences are associated with such activity (3–12,27–30). The term ‘‘edge effect’’ was coined in the considerationof the aura that accompanies migraine attacks and is seen mostnotably in the visual cortex. During this condition, a wave ofdepolarization generating the scotoma is surrounded by an edgeof excitation that produces the bright visual illumination knownas a ‘‘halo’’ (31). This halo is the manifestation of the interfacebetween the area of depolarization and the unaffected area thatsurrounds the malfunction site.
In the proposed scenario, the neurological or psychiatricmanifestations of the patients are conditioned by the localizationof the primary lesion. Thus, in the case of Parkinsonism, in whichlow-frequency activity was reported (32–34), excess inhibition,produced by hyperactive pallidal input onto the motor thalamus,produces hyperpolarization of thalamic relay cells, with theconsecutive de-inactivation of T-channels (35) and the appear-ance of low-threshold calcium spiking and low-frequency oscil-lation (36–38). This oscillation produces then the edge effect,which generates the clinical Parkinsonian manifestations (32).We know this to be the case, because the reduction of thalamicoverinhibition, by surgical decrease of the pallidal output to the
thalamus, diminishes or suppresses Parkinsonian manifestations(13). This therapeutic goal can be reached by a radio-frequencylesion and a chronic stimulation device that causes a continuousdepolarization block (39, 40), or by pharmacological treatmentto reduce excess inhibition (41, 42). In other words, reduction ofthe thalamic overinhibition suppresses the thalamocortical dys-rhythmia that is responsible for the clinical symptomatology.This view is directly supported by single-unit recordings takenduring stereotactic operations that show the presence of LTSbursting activity in the pallidal-recipient, motor-thalamic nucleiof Parkinsonian patients (43).
A similar case may be made for the other patients in this study.Indeed, in the case of neurogenic pain, depression, and tinnitus,a persistent and coherent u-thalamocortical oscillatory activitywas also observed in this study. In these three clinical situations,but also in epilepsy, obsessive–compulsive disease, dystonia, andspasticity, medial thalamic LTS u-rhythmic activity was shown, aswell as the possibility of reducing the symptoms by a stereotacticintervention at the medial thalamic level (13). In the field ofpsychiatry (44), in addition to obsessive–compulsive disease anddepression, one may also remember that low-frequency activityhas been known to be recorded in schizophrenic patients (45),although a thalamocortical dysrhythmia was never considered asa mechanism.
The Issue of Localization and Dynamics. As described above, thebasic idea infers that the symptomatology presented by thepatients ultimately relates to the overall localization of thelow-frequency activity. We do not present a purely phrenologicaldescription; rather, what we observed is an abnormal distributionand coherence of low-frequency activity over wide areas of thebrain, anterior as well as posterior, and the persistence of thisphenomenon throughout the recording session. Thus, in the caseof a depressed patient, stimuli that may produce short-livedsadness in normal individuals may have a dynamic time coursethat prolongs the normal emotional experience into long-lastingdepressive periods. Such experience may occur even after ex-posure to stimuli that are not normally depressant. Similarconclusions may be reached concerning all of the other thalamo-cortical dysrhythmias described here, such as the exacerbation ofneurogenic pain by nonpainful, tactile, or proprioceptive stimuli.
An amplification of the symptomatology caused by fear andstress is also recognized by patients suffering from the variouspositive symptoms described in this paper. In view of thewidespread distribution of the coherent thalamocortical u-activ-ity described here, we may also propose that the large associa-tional–mesocortical system is more relevant than lateral unimo-dal cortical areas. The areas where we expect to see maximallow-frequency activity are the cingulate, medial prefrontal, andorbitofrontal cortices for neuropsychiatric symptoms; the sup-plementary motor and cingulate areas for Parkinson’s disease;the insular, parietal opercular, and cingular cortices for neuro-genic pain; and the medial temporal areas for tinnitus (13).
In terms of thalamocortical dynamics, the medial thalamicnuclei might be seen as the best candidates in view of their bettercoherence abilities (46). We have, however, proposed thatthalamic dynamics relates essentially to the temporal interac-tions between the ‘‘content, specific or lateral’’ and the ‘‘context,nonspecific or medial’’ thalamocortical systems (9, 20). In thissense, the relevance of the generation of the thalamocorticaldysrhythmia must be ascribed to both systems.
Origin of the Thalamocortical Dysrhythmia: ‘‘Bottom-Up Versus Top-Down’’ Mechanism. The basic assumption in this discussion is thatthe thalamocortical dysrhythmia is central and that the abnormalcondition is brought about by changes in intrinsic, voltage-gatedionic conductances at the level of thalamic relay cells (36),namely, the deinactivation of T channels by cell membrane
Fig. 4. Correlation plots of power spectra over a period of 10 min. (A) Onerepresentative control subject. (B) One Parkinson patient. (C) The average ofall controls. (D) The average of all patients. For clarity, the thickness of thewhite diagonal indicating the self-correlation was reduced. Note the widerange of correlation (from u to g) in the patient group.
Llinas et al. PNAS u December 21, 1999 u vol. 96 u no. 26 u 15225
NEU
ROBI
OLO
GY
hyperpolarization (35). LTS bursts are produced and lock therelated thalamocortical circuits in low-frequency resonance.Low-frequency loops interact at the cortical level with high-frequency ones, giving rise to the edge effect and the generationof a positive symptom. In tinnitus, peripheral neurogenic pain,Parkinson’s disease, and some neuropsychiatric disorders withstriatal origin, the dysrhythmic mechanism is triggered bottom-up, i.e., from the thalamus toward the cortex. In other situations,such as epilepsy, neuropsychiatric conditions of cortical origin,and central cortical neurogenic pain, the mechanism may betop-down, triggered by a reduction of the corticothalamic input.Both bottom-up and top-down situations result in excess inhi-bition or disfacilitation, generating thalamic cell membranehyperpolarization and low-frequency oscillation.
Relation to Other Imaging Technologies. A proper analysis of thethalamocortical dysrhythmia must ultimately be implementedwith a technique that is fast enough to distinguish among thedifferent thalamocortical frequencies (4–50 Hz), and it musthave sufficient spatial resolution to localize accurately all sitesinvolved. These criteria seem to be ideally fulfilled by MEG (29).
However, considering the enormous diagnostic relevance of bothPET and functional MRI, the best approach may be to combinethese three noninvasive tools, such that their relative advantagesmay coordinate to optimize understanding and diagnosis of theseabnormal conditions. When comparing our results with thoseobtained from PET recordings (47, 48), it seems evident thatlow-frequency activity in MEG correlates well with hypometab-olism in PET, which is not altogether surprising, in view of thedecreased electrical activity accompanying calcium-dependentpotassium conductances (49). PET may demonstrate high-frequency, edge-effect activation areas as hypermetabolic, andlow-frequency areas as hypometabolic—a proposition alreadysupported by reports of both hyper- and hypometabolic areas inthe thalamus and cortex of patients suffering from neurogenicpain (50). On the other hand, functional MRI may prove to bea powerful tool for localizing areas that harbor elevated gactivity, if such elevation leads to elevated metabolic activity.
We thank J. Schulman for the careful handling of subjectypatientrecordings. The excellent assistance of M. Villegas, R. Jagow, and A.Polyakov is appreciated. For the careful patient selection, we areindebted to Drs. R. Cancro, A. Rezai, J. T. Roland, and Siegemund. The
Fig. 5. Diagram of the thalamocortical circuits that support the positive symptoms hypothesis. Two thalamocortical systems are shown, the specific pathway (yellow)to layer IV of the cortex that activates layer VI cortical neurons; and feed-forward inhibition through inhibitory cortical interneurons (red). Collaterals of theseprojections produce thalamic feedback inhibition through the reticular nucleus (red at thalamic level). The return pathway (circular arrow on the right) re-enters thisoscillation to specific- and reticularis-thalamic nuclei through layer VI pyramidal cells (blue). The second loop shows nonspecific nuclei (green), projecting to the mostsuperficial layer of the cortex and giving collaterals to the reticular nucleus. The conjunction of the specific and nonspecific loops is proposed to generate temporalcoherence (Center). Protracted thalamic cell hyperpolarization by altered synaptic input triggers low-frequency neuronal oscillation (Center). Either disfacilitation, asoccurs after deafferentation (as in neurogenic pain or tinnitus), or excess inhibition caused by pallidal over-activity (as in Parkinson’s disease), hyperpolarize the cellssufficiently to deinactivate T-type calcium channels, resulting in thalamic oscillation at u range. Such oscillation can entrain corticothalamic loops (Left), generatingincreased coherence, as observed in this study. At the cortical level, low-frequency activation of cortico–cortical inhibitory interneurons, by reducing lateral inhibitorydrive, can result in high-frequency, coherent activation of neighboring cortical modules, the ‘‘edge effect’’ (Right).
15226 u www.pnas.org Llinas et al.
contributions of Drs. A. Mogilner, M. Magnin, and A. Morel are alsoappreciated. We acknowledge the support of Biomagnetic Technologies,Inc. for this project. This study was supported by Lucent Technologies,
The Charles A. Dana Foundation, the National Institutes of Health(NINDS13742), and the New York University Medical Center GeneralClinical Research Center (NIH–NCRR M01 RR00096).
1. Llinas, R. (1988) Science 242, 1654–1664.2. Llinas, R., Ribary, U., Joliot, M. & Wang, X. J. (1994) in Temporal Coding in
the Brain, eds. Buzsaki, G., Llinas, R., Singer, W., Berthoz, A. & Christen, Y.(Springer, Berlin), pp. 251–272.
3. Ahissar, E. & Vaaida, E. (1990) Proc. Natl. Acad. Sci. USA 87, 8935–8939.4. Murthy, V. N. & Fetz, E. E. (1992) Proc. Natl. Acad. Sci. USA 89, 5670–5674.5. von der Marlsburg, C. (1981) Internal Report, Max Planck Institute for
Biophysical Chemistry, Gottingen, Germany.6. Eckhorn, R., Bauer, R., Jordan, W., Brosch, M., Kruse, W., Munk, M. &
Reitboeck, H. J. (1988) Biol. Cybern. 60, 121–130.7. Gray, C. M. & Singer, W. (1989) Proc. Natl. Acad. Sci. USA 86, 1698–1702.8. Crick, F. & Koch, C. (1990) Cold Spring Harbor Symp. Quant. Biol. 55, 953–962.9. Llinas, R. & Pare, D. (1991) Neuroscience 44, 521–535.
10. Joliot, M., Ribary, U. & Llinas, R. (1994) Proc. Natl. Acad. Sci. USA 91,11748–11751.
11. Llinas, R., Ribary, U., Contreras, D. & Pedroarena, C. (1998) Philos. Trans. R.Soc. London B 353, 1841–1849.
12. Ribary, U., Cappell, J., Mogilner, A., Hund-Georgiadis, M., Kronberg, E. &Llinas R. (1999) Adv. Neurol. 81, 49–56.
13. Jeanmonod, D., Magnin, M. & Morel, A. (1996) Brain 119, 363–375.14. Thomson, D. J. (1982) Proc. IEEE 70, 1055–1096.15. Slepian, D. & Pollak, H. O. (1961) Bell Syst. Techn. J. 40, 43–63.16. Mitra, P. P. & Pesaran, B. (1999) Biophys. J. 76, 691–708.17. Niedermeyer, E. & Lopes da Silva, F. (1982) Electroencephalography; Basic
Principles, Clinical Applications and Related Fields (Urban and Schwarzenberg,Baltimore).
18. Sasaki, K., Nambu, A., Tsujimoto, T., Matsuzaki, R., Kyuhou, S. & Gemba, H.(1996) Cognit. Brain Res. 5, 165–174.
19. Machleidt, W., Gutjahr, L. & Muegge, A. (1989) Grundgefuehle: Phaenom-enologie, Psychodynamik und EEG Spektralanalytik (Springer, Berlin).
20. Llinas, R. & Ribary, U. (1993) Proc. Natl. Acad. Sci. USA 90, 2078–2081.21. Contreras, D., Destexhe, A., Sejnowski, T. J. & Steriade, M. (1996) Science 274,
771–774.22. Contreras, D. & Steriade, M. (1997) Neuroscience 76, 11–24.23. Steriade, M., Curro Dossi, R. & Nunez, A. (1991) J. Neurosci. 11, 3200–3217.24. Sarnthein, J., Petsche, H., Rappelsberger, P., Shaw, G. L. & von Stein, A. (1998)
Proc. Natl. Acad. Sci. USA 95, 7092–7096.25. Lisman, J. E. & Idiart, M. A. P. (1995) Science 267, 1512–1515.26. Schack, B., Grieszback, G. & Krause, W. (1999) Int. J. Psychophysiol. 31,
219–240.
27. Galambos, R., Makeig, S. & Talmadroff, P. J. (1981) Proc. Natl. Acad. Sci. USA78, 2643–2647.
28. Engel, A. K., Konig, P. & Singer, W. (1991) Proc. Natl. Acad. Sci. USA 88,9136–9140.
29. Ribary, U., Ioannides, A. A., Singh, K. D., Hasson, R., Bolton, J. P. R., Lado,R., Mogilner, A. & Llinas, R. (1991) Proc. Natl. Acad. Sci. USA 88, 11037–11041.
30. Ghoose, G. M. & Freeman, R. D. (1992) J. Neurophysiol. 68, 1558–1574.31. Russell, M. B. & Olesen, J. (1996) Brain 119, 355–361.32. Volkmann, J., Joliot, M., Mogilner, A., Ioannides, A. A., Lado, F., Fazzini, E.,
Ribary, U. & Llinas, R. (1996) Neurology 46, 1359–1370.33. Soikkeli, R., Partanen, J., Soininen, H., Paakonen, A. & Riekkinen, P. S. (1991)
Electroencephalogr. Clin. Neurophysiol. 79, 159–165.34. England, A. C., Schwab, R. S. & Peterson, E. (1959) Electroencephalogr. Clin.
Neurophysiol. 11, 723–731.35. Tsien, R. W., Lipscombe, D., Madison, D. V., Bley, K. R. & Fox, A. P. (1988)
Trends Neurosci. 11 431–438.36. Jahnsen, H. & Llinas, R. (1984) J. Physiol. (London) 349, 205–226.37. McCormick, D. A. & Pape, H. (1990) J. Physiol. (London) 431, 291–318.38. McCormick, D. A. (1991) J. Neurophysiol. 66, 1176–1189.39. Rezai, A. R., Hutchinson, W. & Lozano, A. M. (1999) in Neurosurgical
Operative Atlas, eds. Rengachary, S. S. & Wilkins, R. H. (American Associationof Neurological Surgeons, Chicago), Vol. 8, pp. 195–207.
40. Limousin, P., Krack, P., Pollack, P., Benazzouz, A., Ardouin, C., Hoffmann, D.& Benabid, A. L. (1998) N. Engl. J. Med. 339, 1105–1111.
41. Lang, A. E. & Lozano, A. M. (1998) N. Engl. J. Med. 339, 1044–1053.42. Lang, A. E. & Lozano, A. M. (1998) N. Engl. J. Med. 339, 1130–1143.43. Raeva, S., Vainberg, N. & Dubinin, V. (1999) Neuroscience 88, 365–376.44. John, E. R., Prichep, L. S., Fridman, J. & Easton, P. (1988) Science 239,
162–169.45. Canive, J. M., Lewine, J. D., Edgar, J. C., Davis, J. T, Torres, F., Roberts, B.,
Graeber, D., Orrison, W. W. & Tuason, V. B. (1996) Psychopharmacol. Bull.32, 741–750.
46. Morrison, R. S. & Dempsey, E. W. (1942) Am. J. Physiol. 135, 281–292.47. Buchsbaum, M. S. & Hazlett, E. A. (1997) Int. Rev. Psychiatr. 9, 339–354.48. Perlmutter, J. S. & Raichle, M. E. (1985) Neurology 35, 1127–1134.49. Latorre, R., Oberhauser, A., Labarca, P. & Alvarez, O. (1989) Annu. Rev.
Physiol. 51, 385.50. Hsieh, J. C., Belfrage, M., Stone-Elander, S., Hansson, P. & Ingvar, M. (1995)
Pain 63, 225–236.
Llinas et al. PNAS u December 21, 1999 u vol. 96 u no. 26 u 15227
NEU
ROBI
OLO
GY