Lipids and Liposomes in the Enhancement of Health and Treatment of Disease
Upload
independentCategory
view
1download
0
© 2012 Cogo-Moreira et al, publisher and licensee Dove Medical Press Ltd. This is an Open Access article which permits unrestricted noncommercial use, provided the original work is properly cited.
Neuropsychiatric Disease and Treatment 2012:8 443–454
Neuropsychiatric Disease and Treatment
EACOL (Scale of Evaluation of Reading Competence by the Teacher): evidence of concurrent and discriminant validity
Hugo Cogo-Moreira1
George B Ploubidis2
Clara Regina Brandão de Ávila3
Jair de Jesus Mari1
Angela Maria Vieira Pinheiro4
1Department of Psychiatry, Federal University of São Paulo, São Paulo, Brazil; 2Department of Population Studies, University of London, London, UK; 3Department of Hearing and Speech Pathology, Federal University of São Paulo, São Paulo, Brazil; 4Department of Psychology, Federal University of Minas Gerais, Belo Horizonte, Brazil
Correspondence: Hugo Cogo-Moreira Department of Psychiatry, Federal University of São Paulo. Rua Borges Lagoa, 570, 1°Andar, São Paulo, Brazil Tel +55 11 982 083 526 Email [email protected]
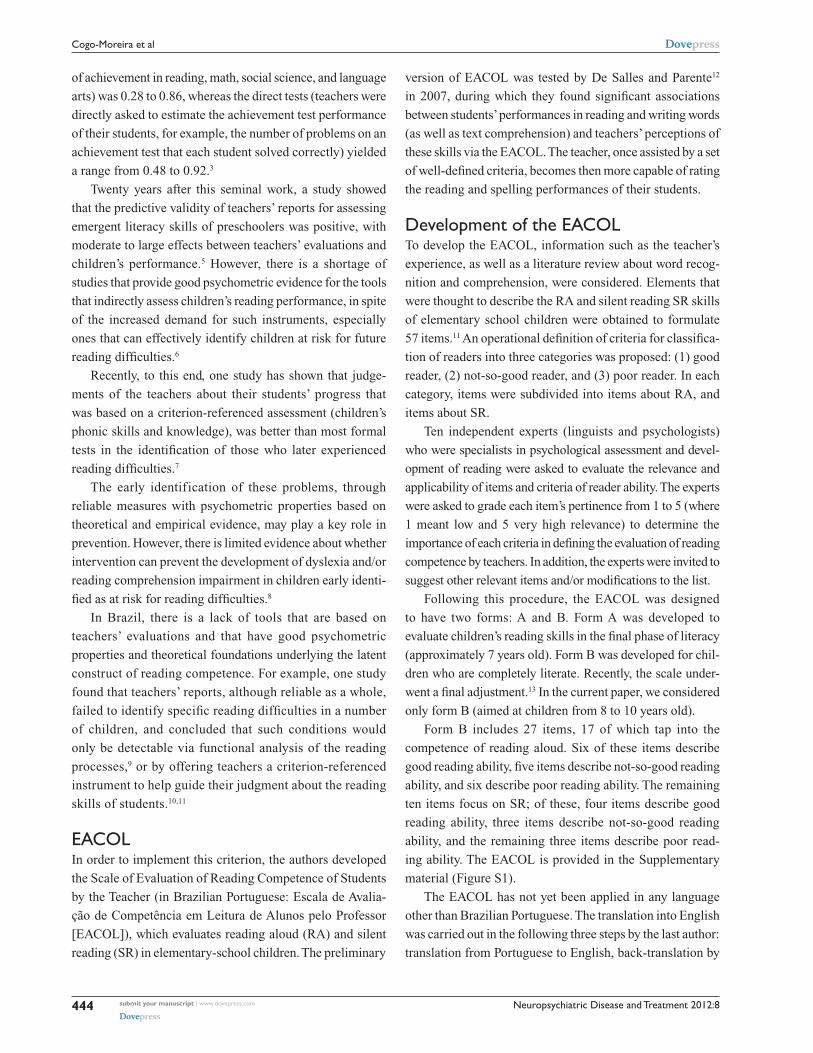
Aim: The study aimed to provide information about the concurrent and discriminant validation
of the Scale of Evaluation of Reading Competence by the Teacher (EACOL), which is composed
of 27 dichotomous items concerning reading aloud (17 items) and reading silently (10 items).
Samples: Three samples were used in this validation study. The first was composed of
335 students with an average age of 9.75 years (SD = 1.2) from Belo Horizonte (Minas Gerais
State), Brazil, where the full spectrum of reading ability was assessed. The second two samples
were from São Paulo city (São Paulo State), Brazil, where only children with reading difficul-
ties were recruited. The first São Paulo sample was labeled “SP-screening” and had n = 617,
with a mean age of 9.8 years (SD = 1.0), and the other sample was labeled “SP-trial” and had
n = 235, with a mean age of 9.15 years (SD = 0.05).
Methods: Results were obtained from a latent class analysis LCA, in which two latent groups
were obtained as solutions, and were correlated with direct reading measures. Also, students’
scores on the Wechsler Intelligence Scale and on the Strengths and Difficulties Questionnaire
tested the discriminant validation.
Results: Latent groups of readers underlying the EACOL predicted all direct reading measures,
while the same latent groups showed no association with behavior and intelligence assessments,
giving concurrent and discriminant validity to EACOL, respectively.
Conclusion: EACOL is a reliable screening tool which can be used by a wide range of profes-
sionals for assessing reading skills.
Keywords: school children, latent class analysis, assessment, reading difficulties, validation
BackgroundEvaluations and assessments by teachers are used to make educational decisions
regarding students and to provide feedback to them, as well as to parents and school
psychologists.1,2 Teachers’ reports can thus serve as a primary source of information
in the educational setting3 and play a very important role in assessment of emergent
literacy.4
The key issue that emerges in the educational context concerns the validity and reli-
ability of teachers’ evaluations and the contrast between this type of indirect assessment
and direct forms, involving the use of both behavioral methods and structured tasks,
such as the number of correctly read words per minute from a list of real words.4
A review of 16 studies concerned with the association between teachers’ evalua-
tions and test scores obtained by students revealed a high level of validity for teachers’
assessment measures, but, at the same time, showed high variability in reliability. The
range of correlation for the indirect comparisons (teachers were asked to use a rating
Dovepress
submit your manuscript | www.dovepress.com
Dovepress 443
O R i G i N A L R E S E A R C H
open access to scientific and medical research
Open Access Full Text Article
http://dx.doi.org/10.2147/NDT.S36196
Neuropsychiatric Disease and Treatment 2012:8
of achievement in reading, math, social science, and language
arts) was 0.28 to 0.86, whereas the direct tests (teachers were
directly asked to estimate the achievement test performance
of their students, for example, the number of problems on an
achievement test that each student solved correctly) yielded
a range from 0.48 to 0.92.3
Twenty years after this seminal work, a study showed
that the predictive validity of teachers’ reports for assessing
emergent literacy skills of preschoolers was positive, with
moderate to large effects between teachers’ evaluations and
children’s performance.5 However, there is a shortage of
studies that provide good psychometric evidence for the tools
that indirectly assess children’s reading performance, in spite
of the increased demand for such instruments, especially
ones that can effectively identify children at risk for future
reading difficulties.6
Recently, to this end, one study has shown that judge-
ments of the teachers about their students’ progress that
was based on a criterion-referenced assessment (children’s
phonic skills and knowledge), was better than most formal
tests in the identification of those who later experienced
reading difficulties.7
The early identification of these problems, through
reliable measures with psychometric properties based on
theoretical and empirical evidence, may play a key role in
prevention. However, there is limited evidence about whether
intervention can prevent the development of dyslexia and/or
reading comprehension impairment in children early identi-
fied as at risk for reading difficulties.8
In Brazil, there is a lack of tools that are based on
teachers’ evaluations and that have good psychometric
properties and theoretical foundations underlying the latent
construct of reading competence. For example, one study
found that teachers’ reports, although reliable as a whole,
failed to identify specific reading difficulties in a number
of children, and concluded that such conditions would
only be detectable via functional analysis of the reading
processes,9 or by offering teachers a criterion-referenced
instrument to help guide their judgment about the reading
skills of students.10,11
EACOLIn order to implement this criterion, the authors developed
the Scale of Evaluation of Reading Competence of Students
by the Teacher (in Brazilian Portuguese: Escala de Avalia-
ção de Competência em Leitura de Alunos pelo Professor
[EACOL]), which evaluates reading aloud (RA) and silent
reading (SR) in elementary-school children. The preliminary
version of EACOL was tested by De Salles and Parente12
in 2007, during which they found significant associations
between students’ performances in reading and writing words
(as well as text comprehension) and teachers’ perceptions of
these skills via the EACOL. The teacher, once assisted by a set
of well-defined criteria, becomes then more capable of rating
the reading and spelling performances of their students.
Development of the EACOLTo develop the EACOL, information such as the teacher’s
experience, as well as a literature review about word recog-
nition and comprehension, were considered. Elements that
were thought to describe the RA and silent reading SR skills
of elementary school children were obtained to formulate
57 items.11 An operational definition of criteria for classifica-
tion of readers into three categories was proposed: (1) good
reader, (2) not-so-good reader, and (3) poor reader. In each
category, items were subdivided into items about RA, and
items about SR.
Ten independent experts (linguists and psychologists)
who were specialists in psychological assessment and devel-
opment of reading were asked to evaluate the relevance and
applicability of items and criteria of reader ability. The experts
were asked to grade each item’s pertinence from 1 to 5 (where
1 meant low and 5 very high relevance) to determine the
importance of each criteria in defining the evaluation of reading
competence by teachers. In addition, the experts were invited to
suggest other relevant items and/or modifications to the list.
Following this procedure, the EACOL was designed
to have two forms: A and B. Form A was developed to
evaluate children’s reading skills in the final phase of literacy
(approximately 7 years old). Form B was developed for chil-
dren who are completely literate. Recently, the scale under-
went a final adjustment.13 In the current paper, we considered
only form B (aimed at children from 8 to 10 years old).
Form B includes 27 items, 17 of which tap into the
competence of reading aloud. Six of these items describe
good reading ability, five items describe not-so-good reading
ability, and six describe poor reading ability. The remaining
ten items focus on SR; of these, four items describe good
reading ability, three items describe not-so-good reading
ability, and the remaining three items describe poor read-
ing ability. The EACOL is provided in the Supplementary
material (Figure S1).
The EACOL has not yet been applied in any language
other than Brazilian Portuguese. The translation into English
was carried out in the following three steps by the last author:
translation from Portuguese to English, back-translation by
submit your manuscript | www.dovepress.com
Dovepress
Dovepress
444
Cogo-Moreira et al

Neuropsychiatric Disease and Treatment 2012:8
a linguist, and correction and semantic adaptation where
necessary.
The EACOL has not previously been submitted to a
large-scale test of both concurrent and discriminant valid-
ity (the former is appropriate for test scores that will be
employed in determining children’s current status with
regard to reading skills; the latter is the evidence of low
correlation between measures that are supposed to differ
[ie, EACOL not being correlated to psychiatric symptoms or
intelligence]);14 as such, the objectives of this study were: (1)
to identify subtypes of readers through use of the EACOL;
(2) to describe the associations between the subtypes of
readers found in this indirect measure of reading and vari-
ous measures directly related and unrelated to reading; and
(3) to verify whether the EACOL is sensitive to changes
in instructions. Therefore, our hypotheses were: (1) If the
EACOL is a useful screening tool for assessing reading skills
of readers in grades two to four, latent groups of readers
showing different levels of reading ability will be found;
(2) if the students judged by the teachers using the EACOL
as good, not-so-good, or poor readers show corresponding
performance in direct measures of reading, this will be
taken as concurrent validity for the instrument. Similarly,
discriminant validity will be granted if no associations are
found between the reading ability of the sample, and behav-
ior and intelligence assessments; and (3) if the EACOL is
sensitive to changes in instructions, the number of latent
groups found will vary in accordance with the instructions
given. That is, it was expected that a best-fit model with
three latent groups of readers would be obtained when no
specific direction in instruction was given to the teachers,
and that lesser latent groups would emerge in situations in
which teachers were explicitly asked to think of a particular
type of reader, whether good or poor.
MethodsSample recruitmentThree samples were used in this validation study: one from
Belo Horizonte (Minas Gerais State) and two from São Paulo
city (São Paulo State).
The first sample, called the BH-sample, was the main ref-
erence sample. This was constituted by 335 children, students
on average 9.75 years old (SD = 1.2) from second to fifth
grade at five schools. Their teachers (n = 42), who agreed to
participate through informed consent, were asked to complete
the EACOL with the following instructions: “Please classify
each of your students, according to the criterion presented.
For each item please answer ‘Yes’ if it describes the reading
ability of the student being evaluated and ‘No’ otherwise.
Thank you for your collaboration.”
Of the São Paulo samples, the main one was constituted
by 235 children aged 8 to 10 years old, from ten public
schools located in impoverished areas in the outskirts of
the city of São Paulo, which was part of a screening sample
obtained from 617 children (mean = 9.8 years old [SD = 1.0]).
The 48 teachers, from the second to fourth grades of these
ten schools, were asked to complete the EACOL consider-
ing only the children with “a reading ability below the mean
for the corresponding grade.” This instruction was given to
screen eligible children to take part in a separate randomized
clinical trial about the effectiveness of music education in the
improvement of reading skills among children with reading
difficulties (ClinicalTrial.gov: NCT01388881 and Research
Ethic Committee from Federal University of São Paulo CEP
0433/10). The 617 children in the sample formed what we
called the São Paulo Screening Sample (SP-screening).
On the basis of the SP-screening, trained psychologists
then ranked children who had the worst EACOL scores to
identify, per school, a minimum of 24 children with reading
difficulties to participate in the randomized clinical trial about
the effectiveness of music education. Since the ten schools
had different numbers of enrolled children, four schools
did not meet the criteria of 24 children per school. In the
other six schools, where the numbers of eligible children
exceeded 24, a minimum of 24 and a maximum of 27 children
were randomly selected via a lottery. After having identified
the eligible children, the research team contacted the parents
through an introductory letter that provided a description
of the objectives of the trial and the informed consent. In the
case of interest and acceptance by the parents, the children
were considered included as participants.
To avoid bias related to cognitive problems in the SP-trial
due to the nature of the experimental randomized clinical
trial, the included children were tested for nonverbal intel-
lectual ability using the Raven’s Colored Progressive Matri-
ces;15,16 and children with scores below the 25th percentile
were excluded. To avoid confounding due to contamination
or overlap of interventions, parents were asked if their
child was already receiving any regular hearing or speech
therapy and/or music classes (such as private music classes,
a social project involving musical learning, or other music
schooling).
The total number of eligible children indicated by the
teacher, selected by the psychologists as having the worst
reading scores, and for whom parents returned authorization,
was 240. Out of these, two children were excluded because
submit your manuscript | www.dovepress.com
Dovepress
Dovepress
445
Scale of assessment of reading competence
Neuropsychiatric Disease and Treatment 2012:8
they had a score below the 25th percentile, and three
because they were already participating in social projects
which involved musical learning and/or were under regular
consultation with hearing and speech therapists. This left
a sample of 235 children obtained from the SP-screening
(38.08%), who were classified as not so good and poor
readers, with average age 9.15 years (SD = 0.05). We called
this group the São Paulo Trial Sample (SP-trial).
Both the BH-sample and the SP-screening were taken
as reference groups. Only the SP-trial sample was submit-
ted to the study of the external validation of the EACOL
(described below).
This protocol for the randomized clinical trial (SP-screening
and SP-trial) was submitted to and approved by the Ethical
Research Committee of the Federal University (CEP0433/10)
of São Paulo (UNIFESP). The protocol for BH-sample was
approved by the Ethical Committee from the Federal University
of Minas Gerais (Process: n ETIC 347/04).
MeasuresTo evaluate the EACOL’s discriminant validity, we used
Intelligence Quotient (IQ) total score17 and the Strengths
and Difficulties Questionnaire (SDQ), which was completed
by teachers.18 The SDQ is a brief behavioral screening
questionnaire comprising 25 items divided between 5 scales:
emotional symptoms, conduct problems, hyperactivity/
inattention, peer relation problems, and prosocial behavior.
To test the concurrent validity of the EACOL, we selected
a number of key variables to act as outcomes in the reading
domain. These included:
• accuracy in the word task (rate of correct real words read
per minute);
• accuracy in the nonword task (rate of correct nonwords
read per minute); and
• accuracy in the text task (rate of correct words read per
minute).
The word and nonword tasks19 consisted of a total of
88 words and 88 nonwords. The words varied in frequency levels
of occurrence (high and low frequency words),19 bidirectional
regularity (regular and irregular words according to grapheme–
phoneme/phoneme–grapheme correspondence),20 and in length
(short, medium, and long words, in terms of number of letters).
The nonwords were built with the same Brazilian Portuguese
orthographic structure and the same length of stimuli used
in the word list. Here only the total number of correct words
and nonwords read per minute in these tasks are considered;
subgroup analysis related to regularity or irregularity or even
word lengths were not conducted.
Psychometrically, the word and nonwords tasks showed
excellent indices, presenting high correlation to each other
(r = 0.92, P , 0.001), and moderately positive correlation
with the Phonological Awareness Test21 (raccuracy of word
= 0.40
and raccuracy of nonword
= 0.37). As expected, the general IQ was
poorly related to word accuracy (r = 0.168, P = 0.01) and
not correlated with nonword accuracy (r = 0.01, P = 0.131).
Also, via Tobit regressions adjusted for the clusters of ten
schools, schooling effects were observable in word accuracy
through the academic years (ie, the higher education level, the
better the achievement in the accuracy of words [third grade
β = 6.62, P , 0.01; fourth grade β = 10.56, P , 0.01]) and in
the accuracy of nonwords (third grade β = 4.45, P , 0.001;
fourth grade β = 6.77, P , 0.001), corroborating for internal
validation of both tasks.
Regarding the text that had to be read, a specific text
was selected with consideration of the age of the child. The
accuracy of text reading correlated highly with word accuracy
(r = 0.916; P , 0.001) and with nonword accuracy (r = 0.873;
P , 0.001). The children’s reading was audio-recorded for
posttest analysis of accuracy.
Last, we included two covariates in the regressions
models (described below). The first was visual acuity (age-
appropriate) via Snellen chart, under conditions of monocular
viewing, conducted by a technician in ophthalmology. The
children were classified as having visual alterations or not.
The second was the Simplified Central Auditory Assessment,22
conducted by a hearing and speech pathologist, which tested
the elicitation of the auropalpebral reflex through instru-
mental sounds; sound location in five directions; sequential
verbal memory for sounds with three and four syllables; and
sequential nonverbal memory with three and four percussion
musical instruments. The children were classified as having
problems in central auditory processing or not.
Statistical modelingTo verify the number of latent groups in the three samples
(BH-sample, SP-screening and SP-trial), we used latent
classes analysis (LCA) on the 27 dichotomous items in the
EACOL. The LCA is a form of cluster analysis initially intro-
duced by Lazarsfeld and Henry in 1968.23 It is the most com-
monly applied latent structure model for categorical data,24
allowing the specification of statistical distributions through a
model-based method, which differs from methods that apply
arbitrary distance metrics to group individuals based on their
similarity (for example, K-means clustering).25 In the LCA,
unlike K-means clustering, a statistical model is built for the
population from which the data sample was obtained.26
submit your manuscript | www.dovepress.com
Dovepress
Dovepress
446
Cogo-Moreira et al

Neuropsychiatric Disease and Treatment 2012:8
To compare LCA models with different numbers of latent
classes, we used the Bayesian information criterion (BIC),
in which small values correspond to better fit, as well as the
sample size-adjusted BIC (ssaBIC). The classification quality
of the model was evaluated with the entropy criterion, in which
the values range from 0 to 1, where values close to 1 indicate
good classification. All LCA were conducted via Mplus version
6.12 (Muthén and Muthén, Los Angeles, CA).27
Both samples from SP were used to test whether the
types of instructions that were given to the teachers would
change the number of latent classes in comparison to the
BH reference sample. Both concurrent and discriminant
validity were assessed using a regressions model STATA
version 12 (StataCorp, College Station, TX), considering
robust standard errors to adjust for the cluster structure.
Covariates such as age, sex, grade, and visual acuity and
central auditory processing were considered in the regres-
sion models. It is important to emphasize that distributions,
kurtosis, and skewness of the outcomes and covariates were
checked to choose the better regression model. To optimize
the visualization of the estimated probabilities as results
of LCA, all “positive” EACOL items (eg, “reads with
intonation compatible with punctuation marks;” “quickly
reads ‘new’ and invented words;” “quickly reads ‘known’
and ‘little- known’ words”) were reverse-scored for ease of
interpretation. The recoded items were 3, 7, 12, 14, 15, 17,
20, 22, 23, and 25.
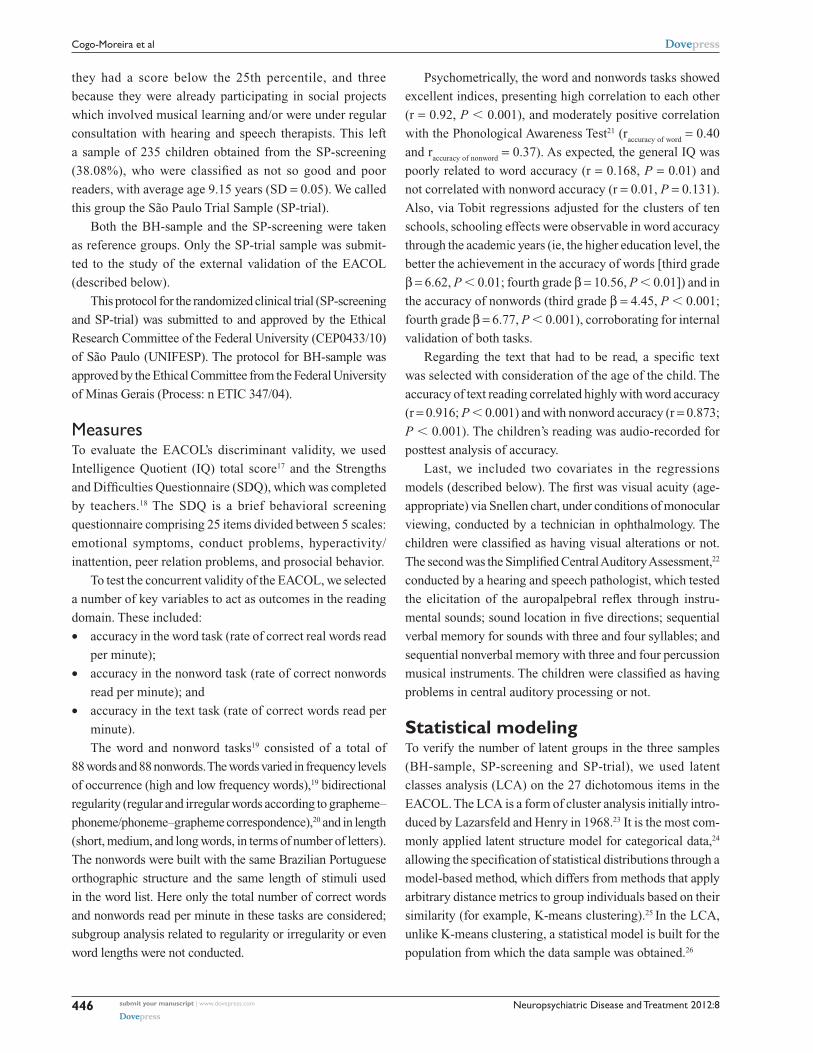
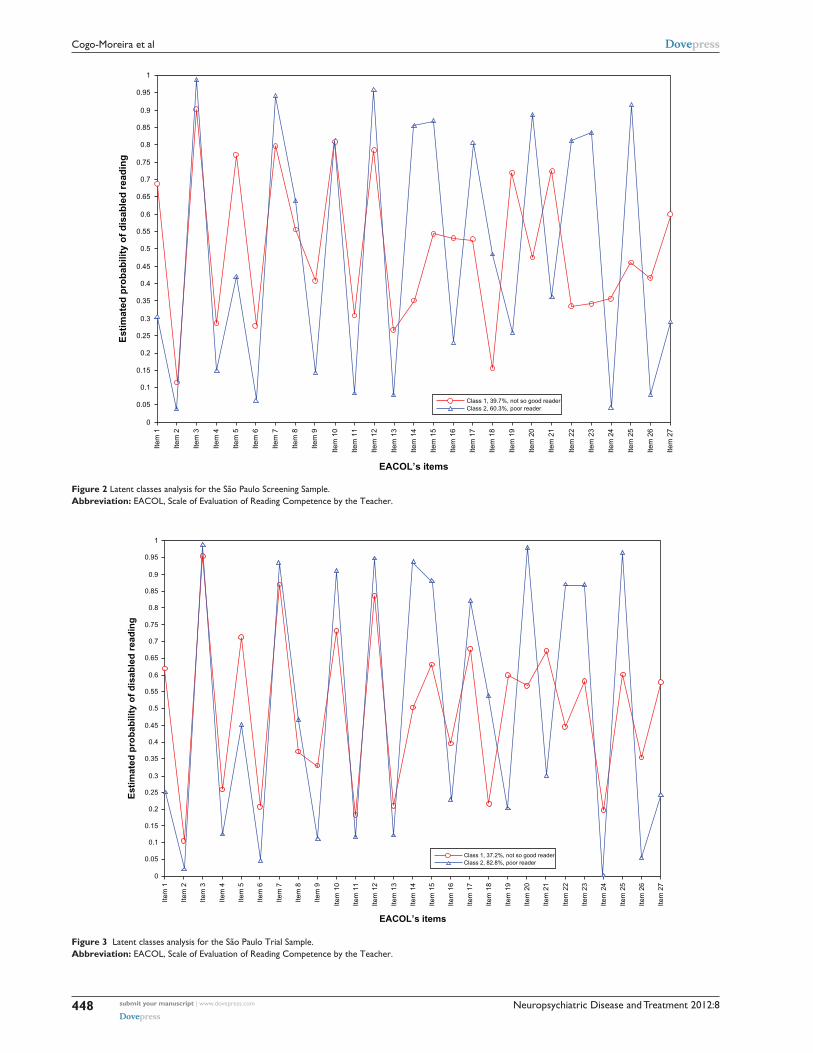
ResultsResults of the LCAThe LCA of BH suggested a good fit-model with three
classes, while a two-class model for SP-screening and SP-
trial was confirmed (Figures 1–3).
To establish which class corresponds to which category
of reader, it is necessary to refer to Figures 1–3, where the
estimated probability axis has a scale from 0 to 1. The former
indicates good reading ability, while the latter represents
reading disability.
In the BH-sample, a clear three-class solution is sup-
ported, considering empirical and theoretical elements.
For the SP-screening and SP-trial samples, the parametric
bootstrap P-values for the likelihood ratio X² goodness of fit
Item
27
Item
26
Item
25
Item
24
Item
23
Item
22
Item
21
Item
20
Item
19
Item
18
Item
17
Item
16
Item
15
Item
14
Item
13
Item
12
Item
11
Item
10
Item
9
Item
8
Item
7
Item
6
Item
5
Item
4
Item
3
Item
2
Item
1
EACOL’s items
Est
imat
ed p
rob
abili
ty o
f d
isab
led
rea
din
g
0
0.05
0.1
0.15
0.2
0.25
0.3
0.35
0.4
0.45
0.5
0.55
0.6
0.65
0.7
0.75
0.8
0.85
Class 1, 26.9%, not so good readerClass 2, 12.1%, poor readerClass 3, 61.1%, good reader
0.9
0.95
1
Figure 1 Latent classes analysis for BH-sample.Abbreviation: EACOL, Scale of Evaluation of Reading Competence by the Teacher.
submit your manuscript | www.dovepress.com
Dovepress
Dovepress
447
Scale of assessment of reading competence
Neuropsychiatric Disease and Treatment 2012:8
Item
27
Item
26
Item
25
Item
24
Item
23
Item
22
Item
21
Item
20
Item
19
Item
18
Item
17
Item
16
Item
15
Item
14
Item
13
Item
12
Item
11
Item
10
Item
9
Item
8
Item
7
Item
6
Item
5
Item
4
Item
3
Item
2
Item
1
EACOL’s items
Est
imat
ed p
rob
abili
ty o
f d
isab
led
rea
din
g
0
0.05
0.1
0.15
0.2
0.25
0.3
0.35
0.4
0.45
0.5
0.55
0.6
0.65
0.7
0.75
0.8
0.85
Class 1, 39.7%, not so good readerClass 2, 60.3%, poor reader
0.9
0.95
1
Figure 2 Latent classes analysis for the São Paulo Screening Sample.Abbreviation: EACOL, Scale of Evaluation of Reading Competence by the Teacher.
EACOL’s items
Est
imat
ed p
rob
abili
ty o
f d
isab
led
rea
din
g
0
0.05
0.1
0.15
0.2
0.25
0.3
0.35
0.4
0.45
0.5
0.55
0.6
0.65
0.7
0.75
0.8
0.85
0.9
0.95
1
Class 1, 37.2%, not so good readerClass 2, 82.8%, poor reader
Item
27
Item
26
Item
25
Item
24
Item
23
Item
22
Item
21
Item
20
Item
19
Item
18
Item
17
Item
16
Item
15
Item
14
Item
13
Item
12
Item
11
Item
10
Item
9
Item
8
Item
7
Item
6
Item
5
Item
4
Item
3
Item
2
Item
1
Figure 3 Latent classes analysis for the São Paulo Trial Sample.Abbreviation: EACOL, Scale of Evaluation of Reading Competence by the Teacher.
submit your manuscript | www.dovepress.com
Dovepress
Dovepress
448
Cogo-Moreira et al

Neuropsychiatric Disease and Treatment 2012:8
test returned values of P , 0.001 for the one-, two-, three-,
and four-class models, but only the two-class solutions had
theoretical and empirical plausibility. Taking Akaike informa-
tion criterion, BIC, ssaBIC, and entropy results together with
the theoretical information about the EACOL and the principle
of parsimony, the two-latent-class model was deemed as the
most appropriate to describe the data. The model identifies
children groups with different patterns of reported reading in
both these samples from São Paulo (Table 1).
Description of typological (latent) classificationBH-sampleIn this reference sample, a three-class model provided the opti-
mal solution, as observed in Figure 1. Class 1 had model-based
prevalence of 26.9% of the sample, class 2 had 12.1%, and
class 3 was the most prevalent at 61.1%. Class 2 is represented
by superior marginal probabilities (close to 1), class 3 by inferior
marginal probabilities (close to 0), and class 1 is represented
by the medial line where nonmarginal probabilities occur (the
majority of probabilities are centered between 0.25 and 0.75).
There are three distinct lines which have a small amount of
overlap and only two crossed trajectories (items 16 and 17).
In the BH, we referred to class 3 as “good readers,” class 1 as
“not-so-good readers,” and class 2 as “poor readers.”
São Paulo samplesThe latent structure of the classes in both samples was
similar, considering the distribution of estimated probabilities
through the 27 items, the number of classes, and the propor-
tion between the percentages of children in each class.
In the graph of the estimated probabilities for SP-screening
sample (Figure 2), class 1 comprised 39.7% of the sample. In
the case of the SP-trial (Figure 3), class 1 had a model-based
prevalence estimate of 37.2%, and included children with
median probabilities (from 0.3 to 0.7) in the majority of items
reported. We referred to this class as “not-so-good readers.”
Class 2 in the SP-trial had a model-based prevalence
of 62.8%, and included children who had a marginal value
(P . 0.8) probability, indicating that eleven out of the
27 EACOL items fit the “poor readers” class. The highest
probabilities were observed in the following items: “can
summarize the text read orally (item 20);” “can identify
characters, places, and ideas in the main text after the first
reading (item 25);” and “quickly reads ‘known’ words and
‘little-known’ ones (item 12).” In the SP-screening sample,
the percentage of the children in class 2 was 60.3%.
The two samples from São Paulo returned similar preva-
lence for the two latent classes. In addition, it is possible to
observe that some items have results with “crossed trends”
or even “overlapped trends.” This means that these items are
not good for discriminating classes and, therefore, could be
omitted or excluded in later studies.
With regard to both reading domains (AR and SR) sepa-
rately, while in BH-sample, RA (from item 1 to item 17)
works better, in the samples from São Paulo, SR domain
(from item 18 to item 27) better distinguishes the “poor
reader” from the “not-so-good” reader class.
Table 1 Latent class analysis results
BIC (L²) AIC (L²) ssaBIC Entropy Parametric bootstrapped likelihood h0 log likelihood value
P-value Overall bivariate log-likelihood Chi-square
Bh-sampleModel 1 8634.059 8531.158 8548.413 – – – 16102.95Model 2 6562.997 6353.384 6388.533 0.987 -4238.579 ,0.001 2868.681Model 3 6058.233 5768.908 5821.95 0.975 -3121.692 ,0.001 770.341Model 4 6026.771 5603.735 5674.67 0.982 -2801.454 ,0.00001 673.126SP-screeningModel 1 18317.67 18198.19 18231.95 – – – 5558.043Model 2 17173.98 16930.62 16999.37 0.819 -9072.097 ,0.001 1198.651Model 3 17089.5 16722.24 16825.99 0.854 -8410.308 ,0.001 832.6Model 4 17078.06 16586.9 16725.66 0.811 -8278.119 ,0.00001 686.545SP-trialModel 1 6336.019 6242.61 6250.44 – – – 1365.364Model 2 6146.722 5956.495 5972.455 0.827 -3094.305 ,0.001 589.026Model 3 6200.666 5913.52 5937.591 0.853 -2923.247 ,0.001 456.106Model 4 6253.835 5869.821 5902.012 0.889 -2874.432 ,0.001 395.367
Abbreviations: BiC, Bayesian information criterion; AiC, Akaike information criterion; ssaBiC, sample-size adjusted Bayesian information criterion; BH, Belo Horizonte; SP, São Paulo.
submit your manuscript | www.dovepress.com
Dovepress
Dovepress
449
Scale of assessment of reading competence

Neuropsychiatric Disease and Treatment 2012:8
Discriminant and concurrent validityiQ and SDQTo test EACOL’S discriminant validity, we used the general
IQ and total difficulties children’s score in the SDQ as a
dependent variable against the same exploratory variable
that was used in the above-cited model. We did not observe
an association between the latent classes and IQ (β = 6.55,
P . 0.05) and children’s total difficulties score measured by
the SDQ (β = 1.12, P . 0.05), as observed in the Table 2, when
controlled by age, sex, grade, and school as a cluster unity.
Reading outcomesIn the regression analyses, the class latent typology had
a significant negative association with the three reading
measures, controlling for age, grade, sex, and visual acuity
and processing auditory status; also the cluster design was
considered and consequently, robust standard errors were
generated. Results are described in Table 2.
Being a member of the poor-reader class has major nega-
tive impact in all reading outcomes, showing that this group
has more reading difficulties than the not-so-good readers.
For the accuracy of words (β = -11.12, P , 0.0001; in other
words, a significant difference of 11 correctly read words per
minute between both latent groups of readers) and accuracy
of nonwords (β = -6.50 P , 0.001), we used Tobit regression
due to the floor effects in both continuous outcomes (children
who read zero words/nonwords correctly) and, therefore, we
specified one left-censoring limit of 1 correctly read word
per minute. For the accuracy of text reading (β = -11.27,
P , 0.01), a linear-regression model was used, showing that
there is an effect of being class 1 or 2 on the outcome. More
precisely, comparing not so good readers and poor readers,
we expected that the worst indicators of reading would be
achieved from poor readers (class 2).
DiscussionThe present study explored the predictive ability of indirect
measures of teachers’ reports of children’s reading ability.
The latent groups of readers predicted direct measures of
reading abilities, particularly in the area of decoding of
isolated words (represented here as accuracy of word and
nonword reading) and words in context (represented as
the accuracy of reading text). Considering the SP-trial, the
poor-reader latent group correctly read 6.50 nonwords less
per minute than did the not-so-good readers. Also, in the
other reading measures, the differences between both groups
are statistically significant: the poor-reader latent group’s
performance was worse than that of the not-so-good-reader
group regarding accuracy of reading both isolated words and
words in context (difference of 11.12 and 11.27 correctly read
words per minute, respectively) (Table 1). These results are
evidence of the concurrent validity of the EACOL.
We also evaluated the extent to which the instructions
given to the teachers could accurately affect the identification
of the latent groups of readers.
Major findings and clinical implicationsThe BH sample returned a three-class model while SP
samples returned a two-class model due to the instructions
that were given to the teachers. As a consequence, the number
of returned classes must be different, giving evidence for
the concurrent validity of the EACOL. Considering that in
the BH-sample the EACOL covered the full spectrum of the
reading abilities (ie, no discriminative instruction was given
to the teachers), the BH-sample prevalence results may sug-
gest either that the teacher has a tendency to overestimate the
children’s reading ability, or that perhaps teachers tend to or
even prefer to answer about children who have nonspecific
academic difficulties of some sort. Since the EACOL inquires
about specific characteristics of children’s reading, which
normally are observable one-by-one, it is necessary to have a
proximal contact with the child, especially to evaluate items
related to silent reading, which showed better discrimination
in SP-sample (ie, samples of children with reading difficulty).
Therefore, when no specification of the type of reading ability
of the participants is requested, teachers may tend to complete
Table 2 Values for regression coefficients with its respective robust standard error, P-value and 95% confidence interval for variables of concurrent and discriminant validity
Outcomes on two latent groups from LCA
Coefficient (β) Robust standard error
t P-value 95% confidence interval
Concurrent
validity
Accuracy of nonword -6.50 1.546 -4.21 ,0.001 -9.55 to -3.45Accuracy of word -11.12 2.672 -4.16 ,0.001 -16.39 to -5.85Accuracy of text -11.27 3.732 -3.02 0.014 -19.71 to -2.83
Discriminant validity
iQ total 1.12 0.845 1.33 0.217 -0.79 to 3.03Total difficulties score (SDQ) -1.60 1.604 -1.00 0.344 -5.23 to 2.03
Abbreviations: LCA, latent class analysis; SDQ, Strengths and Difficulties Questionnaire.
submit your manuscript | www.dovepress.com
Dovepress
Dovepress
450
Cogo-Moreira et al

Neuropsychiatric Disease and Treatment 2012:8
the EACOL considering predominantly the children with
good and not so good reading abilities (the major prevalence
groups in the BH-sample).
We expected to observe proportions among the three
classes to be similar to the normal curve, with the majority
of the children categorized around the mean (corresponding
to the average reader, here the “not-so-good reader”) and the
minority (both good and poor readers) placed with regard
to the marginal probabilities, closer to 0 and closer to 1,
respectively.
The BH sample returned a three-class model, while SP
samples returned a two-class model, due to the instructions
given to the teachers. As a consequence, the number of
returned classes must be different, giving evidence for the
concurrent validity of EACOL.
As can be seen in Table 1, the entropy values (ie, how
well the classes are distinguished from each other) in
both samples from São Paulo are lower than in the sample
from BH. This could refer to the difficulty of teachers in
evaluating children due to the instructions, especially those
who had reading difficulties. Taking into consideration
the BH-sample, a three-class solution was achieved and
only two items had “crossed values.” Therefore, when no
instruction is given to the teachers, distinctions amongst
the three reading categories is more precise than when a
restriction is given.
Taking the two domains of the scale RA and SR into
account, some details could be addressed about the 27 items.
In the cases of SP-trial and SP-screening, it is possible to
observe in the graphs of estimated probabilities, a major
overlapping in the RA domain (ie, represented by two lines
closer or with the same trajectory), whereas in the SR domain
the two lines do not overlap.
In the BH-sample, in which the good readers and
not-so-good readers (Figure 1: classes 3 and 1, respectively)
have very close probabilities (P , 0.1), taking into account
five of the ten items (items 19, 20, 21, 22, 23), RA was found
to work better than SR. In RA, the item 15 (“reads with
rhythm, not too slowly nor too quickly”) did not have the
probability to discriminate the classes of “good reader” and
“not-so-good reader,” because there was an overlap between
two classes in the same probability. With the exception of this
item, RA seems to better differentiate the classes when no
direction is given to teachers, probably because in the school
context it might be easier to observe difficulties in reading
aloud than in silent reading (as evaluation of this latter type
of reading is often obtained “head-to-head”), through specific
investigation and inquiry about the students’ comprehension
capacity (such as his/her ability to use knowledge of world
to make inferences and to monitor the understanding of
what is being read).28 On the other hand, when teachers were
required to think about the children with reading difficulties,
SR became a better measure by which to distinguish not-so-
good readers from poor readers, since, in this condition, the
overlapping of trajectories among the items was less frequent.
With respect to discriminant validity, the latent groups in
SP-trial did not predict the total score in the Wechsler Intel-
ligence Scale, as found also by Hatcher and Hulme,29 or SDQ
as expected, showing that both of these domains were not
associated with reading skills. More specifically, children’s
behavioral characteristics evaluated via SDQ were not taken
into account in teachers’ evaluations of children’s reading.
In other words, teachers were capable of distinguishing the
presence of behavioral problems from reading difficulties,
indicating that they evaluated both theoretical constructs
domains independently. This is in disagreement with the find-
ing that the teachers’ perceptions of their students’ behavior
constituted a significant component of the judgments made
about their students’ scholastic achievements.30
Therefore, this study found evidence that the EACOL
is a reliable instrument by which to assess reading via
teachers’ judgment. Since it is simple and easy to administer,
it is an important tool to help a wide range of professionals
(eg, health professionals who work with children, teachers
and educators, and researchers).
AcknowledgmentThis study was funded by the National Council for
Scientific and Technological Development (CNPq – grant
No 482321/2010-5) and the Instituto ABCD, which is a
nongovernmental organization that supports research about
dyslexia in Brazil.
DisclosureJJM, HCM, GBP, and CRM conducted a randomized clini-
cal trial about the effectiveness of music education among
children with reading difficulties. EACOL was used as a
screening tool in selected children with reading difficul-
ties. CRBA recently received a grant (São Paulo Research
Foundation grant number 2011/11369-0) to develop a tool
to evaluate reading comprehension among schoolchildren.
HCM received a PhD scholarship from CNPq and CAPES
Foundation, an agency under the Ministry of Education of
Brazil, in order to conduct part of his doctoral research as
a visiting graduate student at London School of Hygiene
and Tropical Medicine.
submit your manuscript | www.dovepress.com
Dovepress
Dovepress
451
Scale of assessment of reading competence
Neuropsychiatric Disease and Treatment 2012:8
References 1. Elliott SN, Gresham FM, Freeman T, McCloskey G. Teacher
and observer ratings of children’s social skills: validation of the Social Skills Rating Scales. J Psychoeduc Assess. 1988;6(2): 152–161.
2. Gerber MM, Semmel MI. Teacher as imperfect test: reconceptualizing the referral process. Educ Psychol. 1984;19(3):137–148.
3. Hoge RD, Coladarci T. Teacher-based judgments of academic achievement: a review of literature. Rev Educ Res. Fal 1989;59(3):297–313.
4. Salinger T. Assessing the literacy of young children: the case for multiple forms of evidence. In: Neuman SB, Dickinson DK, editors. Handbook of Early Literacy Research. New York: Guilford Press; 2002;1: 390–418.
5. Cabell SQ, Justice LM, Zucker TA, Kilday CR. Validity of teacher report for assessing the emergent literacy skills of at-risk preschoolers. Lang Speech Hear Serv Sch. 2009;40(2):161–173.
6. Schatschneider C, Petscher Y, Williams KM. How to evaluate a screening process: the vocabulary of screening and what educators need to know. In: Justice LM, Vukelich C, editors. Achieving Excellence in Preschool Literacy Instruction. New York: Guilford Press; 2008:304–316.
7. Snowling MJ, Duff F, Petrou A, Schiffeldrin J, Bailey AM. Identification of children at risk of dyslexia: the validity of teacher judgements using ‘Phonic Phases’. J Res Read. May 2011;34(2):157–170.
8. Snowling MJ, Hulme C. Annual research review: the nature and classification of reading disorders – a commentary on proposals for DSM-5. J Child Psychol Psychiatry. 2012;53(5):593–607.
9. Pinheiro AMV. Heterogeneidade entre leitores julgados competentes pelas professoras [Heterogeneity among readers judged as compe-tent by teachers]. Psicol Refl Crít. 2001;14(3):537–551. Brazilian Portuguese.
10. Pinheiro AMV, Costa AEB. Os passos da construção da Escala de Aval-iação de Competência de Leitura de alunos pelo professor – EACOL [The development of the Scale of Evaluation of Reading Competence by the Teacher – EACOL]. Paper presented at: VII Internacional de Investigação em Leitura, Literatura Infantil e Ilustração Meeting; 2012 Sep 17–19; Braga, Lisbon. Portuguese.
11. Pinheiro AMV, Costa AEB. Escala de avaliação de competência em leitura pelo professor [Scale of Evaluation of Reading Competency by the Teacher]. Paper presented at: VII Encontro Mineiro de Avaliação Psicológica 2005; Belo Horizonte, Brazil. Brazilian Portuguese.
12. De Salles JF, Parente MAMP. Relação entre desempenho infantil em linguagem escrita e percepção do professor [Children’s performance in written language and perception of teacher]. Cad Pesqui. 2007;37(132): 687–709. Brazilian Portuguese.
13. Pinheiro AMV. Validação e Estabelecimento de Normas de Uma Prova Computadorizada de Reconhecimento de Palavras Para Crianças. Belo Horizonte: Federal University of Minas Gerais; 2012. SHA – APQ-01914-09.
14. Urbina S. Essentials of Psychological Testing. Hoboken: John Wiley & Sons; 2004.
15. Pasquali L, Wechsler S, Bensusan E. Matrizes Progressivas do Raven Infantil: um estudo de validação para o Brasil [Raven’s Colored Progres-sive Matrices for Children: a validation study for Brazil]. Aval Psicol. 2002;1(2):95–110. Brazilian Portuguese.
16. Raven J. Raven’s Progressive Matrices and Vocabulary Scales. London: HK Lewis; 1986.
17. Wechsler D. WISC-III: Wechsler Intelligence Scale for Children. San Antonio: The Psychological Corporation; 1991.
18. Goodman R. The Strengths and Difficulties Questionnaire: a research note. J Child Psychol Psychiatry. 1997;38(5):581–586.
19. Pinheiro AMV. Contagem de Frequência de Ocorrência de Palavras Expostas a Crianças na Faixa Pré-escolar e Séries Iniciais do 1° Grau [Count Frequency of Word Occurrence Amongst Preschoolers and Elementary School Children]. Sao Paulo (SP): Associação Brasileira de Dislexia; 1996. Brazilian Portuguese.
20. Pinheiro AMV. [Anexo 2.] In: Sim-Sim I, Vianna FL, editors. Para a Avaliação do Desempenho de Leitura [Reading Achievement Perfor-mance Evaluation]. Lisbon: Gabinete de Estatística e Planeamento da Educação; 2007:121–131. Brazilian Portuguese.
21. Capovilla AGS, Capovilla FC. Prova de consciência fonológica: desenvolvimento de dez habilidades da pré-escola à segunda série [Phonological Awareness Test: development of ten abilities from pre-school to third grade]. Temas Desenvolv. 1998;7(37):14–20. Brazilian Portuguese.
22. Lazarsfeld PF, Henry NW. Latent Structure Analysis. Boston: Houghton Mifflin; 1968.
23. Engelmann L, Ferreira MIDC. Avaliação do processamento auditivo em crianças com dificuldades de aprendizagem [Auditory processing evalu-ation in children with learning difficulties]. Rev Soc Bras Fonoaudiol. 2009;14(1):69–74. Brazilian Portuguese.
24. Clogg CC. Latent Class Models. New York: Plenum; 1995. 25. Everitt BS, Hand DJ. Finite mixture distributions. In: Cox DR, Isham N,
Keiding T, et al, editors. Monographs on Applied Probability and Statistics. London: Chapman and Hall; 1981.
26. Magidson J, Vermunt J. Latent class models for clustering: A comparison with K-means. Canadian Journal of Marketing Research. 2002;20(1):37–44.
27. Muthén L, Muthén B. Statistical Analysis with Latent Variables: User’s Guide. 4th ed. Los Angeles: Muthén & Muthén; 1998–2011.
28. Ricketts J. Research review: reading comprehension in developmental disorders of language and communication. Jf Child Psychol Psychiatry. 2011;52(11):1111–1123.
29. Hatcher PJ, Hulme C. Phonemes, rhymes, and intelligence as predic-tors of children’s responsiveness to remedial reading instruction: evidence from a longitudinal intervention study. J Exp Child Psychol. 1999;72(2):130–153.
30. Bennett RE, Gottesman RL, Rock DA, Cerullo F. Influence of behavior perceptions and gender on teachers’ judgments of students’ academic skill. J Educ Psychol. 1993;85(2):347–356.
submit your manuscript | www.dovepress.com
Dovepress
Dovepress
452
Cogo-Moreira et al

Neuropsychiatric Disease and Treatment 2012:8
N° Subtypes of readers Criterion Yes No
Evaluation of reading aloud01 Poor reader Reads but cannot tell what was read, even when stimulated with questions.02 Not-so-good reader Sometimes makes mistakes when reading “new” words.03 Good reader Reads with intonation compatible with the punctuation marks, expressing
emotions and feelings according to the text read. For example, gives an intonation of questioning in the whole sentence, when there is a question mark in the text. Gives intonation of joy or surprise, in the whole sentence, when there is an exclamation mark.
04 Poor reader Does not take into account the intonation compatible with the punctuation marks, reading in a monotone manner.
05 Poor reader Says “i do not know” when encounters a new word.06 Not-so-good reader Sometimes reads and cannot retell what was read.07 Good reader Quickly reads “new” and invented words.08 Poor reader Reads very slowly, without rhythm, spelling out each syllable; does
not observe the punctuation marks.09 Poor reader Reads by spelling out both “new” and “known” words.10 Not-so-good reader Sets the tone of interrogation and/or exclamation only in the word
that precedes the punctuation mark.11 Not-so-good reader Slows the rhythm of reading when “new” words are encountered,
needing to spell them out.12 Good reader Quickly reads the “known” words and the “little-known” ones.13 Poor reader Often makes mistakes when reading “new” words.14 Good reader Seems to have understood what was read when asked about the text read.15 Good reader Reads with rhythm, not too slowly nor too fast.16 Not-so-good reader Reads too slowly or too quickly.17 Good reader Reads words correctly.
Evaluation of silent reading18 Not-so-good reader Does identify characters and places, but has some difficulty identifying
main ideas without a second reading.19 Poor reader Does not identify the subject from the title, nor vice versa.20 Good reader Can summarize the text read orally.21 Poor reader Does not identify characters, places, or main ideas expressed in the text.22 Good reader is able to choose a title for passages presented with no title or even give an
alternate title for titled passages.23 Good reader is able to identify the subject from the title and vice versa.24 Not-so-good reader Presents some difficulty in orally summarizing what was read.25 Good reader Can identify characters, places, and ideas in the main text after the first reading.26 Not-so-good reader Not always able to identify the subject from the title and vice versa.27 Poor reader Not able to summarize what was read, either orally or in writing.
Supplementary material
Figure S1 EACOL form B
Student’s name: _________________________________School year: _____
Age: ____ years ____ months Teacher’s name: _______________________
School’s name: ___________________________________________________
submit your manuscript | www.dovepress.com
Dovepress
Dovepress
453
Scale of assessment of reading competence
Neuropsychiatric Disease and Treatment
Publish your work in this journal
Submit your manuscript here: http://www.dovepress.com/neuropsychiatric-disease-and-treatment-journal
Neuropsychiatric Disease and Treatment is an international, peer-reviewed journal of clinical therapeutics and pharmacology focusing on concise rapid reporting of clinical or pre-clinical studies on a range of neuropsychiatric and neurological disorders. This journal is indexed on PubMed Central, the ‘PsycINFO’ database and CAS.
The manuscript management system is completely online and includes a very quick and fair peer-review system, which is all easy to use. Visit http://www.dovepress.com/testimonials.php to read real quotes from published authors.
Neuropsychiatric Disease and Treatment 2012:8submit your manuscript | www.dovepress.com
Dovepress
Dovepress
Dovepress
454
Cogo-Moreira et al
Copyright © 2022 FDOKUMEN