Hybrid ultra-low-field MRI and magnetoencephalography system based on a commercial whole-head...
10
HARDWARE AND INSTRUMENTATION - Full Paper Hybrid Ultra-Low-Field MRI and Magnetoencephalography System Based on a Commercial Whole-Head Neuromagnetometer Panu T. Vesanen, 1 * Jaakko O. Nieminen, 1 Koos C. J. Zevenhoven, 1 Juhani Dabek, 1 Lauri T. Parkkonen, 1,2 Andrey V. Zhdanov, 1,3 Juho Luomahaara, 4,5 Juha Hassel, 4 Jari Penttil€ a, 5 Juha Simola, 2 Antti I. Ahonen, 2 Jyrki P. M€ akel€ a, 3 and Risto J. Ilmoniemi 1 Ultra-low-field MRI uses microtesla fields for signal encoding and sensitive superconducting quantum interference devices for signal detection. Similarly, modern magnetoencephalogra- phy (MEG) systems use arrays comprising hundreds of super- conducting quantum interference device channels to measure the magnetic field generated by neuronal activity. In this article, hybrid MEG-MRI instrumentation based on a commercial whole- head MEG device is described. The combination of ultra-low-field MRI and MEG in a single device is expected to significantly reduce coregistration errors between the two modalities, to sim- plify MEG analysis, and to improve MEG localization accuracy. The sensor solutions, MRI coils (including a superconducting polarizing coil), an optimized pulse sequence, and a reconstruc- tion method suitable for hybrid MEG-MRI measurements are described. The performance of the device is demonstrated by presenting ultra-low-field-MR images and MEG recordings that are compared with data obtained with a 3T scanner and a com- mercial MEG device. Magn Reson Med 69:1795–1804, 2013. V C 2012 Wiley Periodicals, Inc. Key words: ultra-low-field MRI; magnetoencephalography; MEG-MRI; superconducting quantum interference device INTRODUCTION Functional neuroimaging technologies, such as fMRI, positron emission tomography, electroencephalography, and magnetoencephalography (MEG), are vitally impor- tant tools in modern neuroscience. MEG (1) is based on a direct measurement of the magnetic field generated by neuronal activity, as opposed to fMRI (2,3), which meas- ures hemodynamic changes in the working human brain. However, the spatial resolution of MEG is limited, and the method offers little anatomical information about the brain, necessitating its combination with structural imag- ing. In this article, we address the challenge of combined structural and neuromagnetic measurements by describ- ing a hybrid device capable of both MRI and MEG. In MEG, the weak magnetic fields generated by neuro- nal activity are measured with highly sensitive supercon- ducting quantum interference devices (SQUIDs) coupled to superconducting receiver, or pick-up, coils. A typical MEG instrument comprises several hundred such sensors in a helmet-shaped configuration. Neuronal sources underlying a given multichannel MEG measurement can be estimated by imposing certain physiological con- straints and solving an inverse problem incorporating the sensitivity patterns of the sensors. The estimated sources are typically visualized on a structural MR image of the subject, which needs to be acquired separately. The necessary coregistration of MEG and MRI is suscep- tible to measurement errors, possible movements of the brain inside the skull between the two scans (particu- larly in patients), and distortions in the MR image. Still, thanks to its excellent temporal resolution and ability to locate neuronal activity, MEG is a widely used neuro- science research tool with clinically approved applica- tions, e.g., in the presurgical evaluation of epilepsy and brain-tumor patients (4). Recently, MRI using SQUIDs has been demonstrated (5,6). This approach, called ultra-low-field (ULF) MRI, uses microtesla-range fields for signal encoding. How- ever, for sufficient spin polarization, the prepolarization technique (7) is used. With SQUID detection, the polariz- ing field strength has typically been below 150 mT (5,6,8); with induction-coil detection, polarizing field strengths 20–500 mT have been reported (9–14). As SQUID-based sensors measure the magnetic field directly, as opposed to its time derivative, the signal-to- noise ratio (SNR) of the measurement for untuned sen- sors is independent of the Larmor frequency and thus field strength after the prepolarization (15). Many con- ventional MRI techniques such as spin-echo, Fourier- imaging, and phased-array methods are also available in the ULF regime. Furthermore, ULF MRI shares benefits of other types of low-field and prepolarized MRI: 1 Department of Biomedical Engineering and Computational Science, Aalto University School of Science, Espoo, Finland. 2 Elekta Oy, Helsinki, Finland. 3 BioMag Laboratory, HUSLAB, Helsinki University Central Hospital, Helsinki, Finland. 4 VTT Technical Research Centre of Finland, Espoo, Finland. 5 Aivon Oy, Espoo, Finland. Grant sponsor: The European Community’s Seventh Framework Programme (FP7/2007–2013); Grant number: 200859; Grant sponsors: The Academy of Finland, Emil Aaltonen Foundation, Instrumentarium Science Foundation, and International Doctoral Programme in Biomedical Engineering and Medical Physics (iBioMEP). *Correspondence to: Panu T. Vesanen, M.Sc., Department of Biomedical Engineering and Computational Science, Aalto University School of Science, P.O. Box 12200, FI-00076 AALTO, Finland. E-mail: [email protected] Received 14 February 2012; revised 8 May 2012; accepted 24 June 2012. DOI 10.1002/mrm.24413 Published online 17 July 2012 in Wiley Online Library (wileyonlinelibrary. com). Magnetic Resonance in Medicine 69:1795–1804 (2013) V C 2012 Wiley Periodicals, Inc. 1795
Transcript of Hybrid ultra-low-field MRI and magnetoencephalography system based on a commercial whole-head...

HARDWARE ANDINSTRUMENTATION -
Full Paper
Hybrid Ultra-Low-Field MRI and MagnetoencephalographySystem Based on a Commercial Whole-HeadNeuromagnetometer
Panu T. Vesanen,1* Jaakko O. Nieminen,1 Koos C. J. Zevenhoven,1 Juhani Dabek,1
Lauri T. Parkkonen,1,2 Andrey V. Zhdanov,1,3 Juho Luomahaara,4,5 Juha Hassel,4
Jari Penttil!a,5 Juha Simola,2 Antti I. Ahonen,2 Jyrki P. M!akel!a,3 and Risto J. Ilmoniemi1
Ultra-low-field MRI uses microtesla fields for signal encodingand sensitive superconducting quantum interference devicesfor signal detection. Similarly, modern magnetoencephalogra-phy (MEG) systems use arrays comprising hundreds of super-conducting quantum interference device channels to measurethe magnetic field generated by neuronal activity. In this article,hybrid MEG-MRI instrumentation based on a commercial whole-head MEG device is described. The combination of ultra-low-fieldMRI and MEG in a single device is expected to significantlyreduce coregistration errors between the two modalities, to sim-plify MEG analysis, and to improve MEG localization accuracy.The sensor solutions, MRI coils (including a superconductingpolarizing coil), an optimized pulse sequence, and a reconstruc-tion method suitable for hybrid MEG-MRI measurements aredescribed. The performance of the device is demonstrated bypresenting ultra-low-field-MR images and MEG recordings thatare compared with data obtained with a 3T scanner and a com-mercial MEG device. Magn Reson Med 69:1795–1804, 2013.VC 2012 Wiley Periodicals, Inc.
Key words: ultra-low-field MRI; magnetoencephalography;MEG-MRI; superconducting quantum interference device
INTRODUCTION
Functional neuroimaging technologies, such as fMRI,positron emission tomography, electroencephalography,and magnetoencephalography (MEG), are vitally impor-
tant tools in modern neuroscience. MEG (1) is based ona direct measurement of the magnetic field generated byneuronal activity, as opposed to fMRI (2,3), which meas-ures hemodynamic changes in the working human brain.However, the spatial resolution of MEG is limited, andthe method offers little anatomical information about thebrain, necessitating its combination with structural imag-ing. In this article, we address the challenge of combinedstructural and neuromagnetic measurements by describ-ing a hybrid device capable of both MRI and MEG.
In MEG, the weak magnetic fields generated by neuro-nal activity are measured with highly sensitive supercon-ducting quantum interference devices (SQUIDs) coupledto superconducting receiver, or pick-up, coils. A typicalMEG instrument comprises several hundred such sensorsin a helmet-shaped configuration. Neuronal sourcesunderlying a given multichannel MEG measurement canbe estimated by imposing certain physiological con-straints and solving an inverse problem incorporatingthe sensitivity patterns of the sensors. The estimatedsources are typically visualized on a structural MR imageof the subject, which needs to be acquired separately.The necessary coregistration of MEG and MRI is suscep-tible to measurement errors, possible movements of thebrain inside the skull between the two scans (particu-larly in patients), and distortions in the MR image. Still,thanks to its excellent temporal resolution and ability tolocate neuronal activity, MEG is a widely used neuro-science research tool with clinically approved applica-tions, e.g., in the presurgical evaluation of epilepsy andbrain-tumor patients (4).
Recently, MRI using SQUIDs has been demonstrated(5,6). This approach, called ultra-low-field (ULF) MRI,uses microtesla-range fields for signal encoding. How-ever, for sufficient spin polarization, the prepolarizationtechnique (7) is used. With SQUID detection, the polariz-ing field strength has typically been below 150 mT(5,6,8); with induction-coil detection, polarizing fieldstrengths 20–500 mT have been reported (9–14). AsSQUID-based sensors measure the magnetic fielddirectly, as opposed to its time derivative, the signal-to-noise ratio (SNR) of the measurement for untuned sen-sors is independent of the Larmor frequency and thusfield strength after the prepolarization (15). Many con-ventional MRI techniques such as spin-echo, Fourier-imaging, and phased-array methods are also available inthe ULF regime. Furthermore, ULF MRI shares benefitsof other types of low-field and prepolarized MRI:
1Department of Biomedical Engineering and Computational Science, AaltoUniversity School of Science, Espoo, Finland.2Elekta Oy, Helsinki, Finland.3BioMag Laboratory, HUSLAB, Helsinki University Central Hospital, Helsinki,Finland.4VTT Technical Research Centre of Finland, Espoo, Finland.5Aivon Oy, Espoo, Finland.
Grant sponsor: The European Community’s Seventh FrameworkProgramme (FP7/2007–2013); Grant number: 200859; Grant sponsors: TheAcademy of Finland, Emil Aaltonen Foundation, Instrumentarium ScienceFoundation, and International Doctoral Programme in BiomedicalEngineering and Medical Physics (iBioMEP).
*Correspondence to: Panu T. Vesanen, M.Sc., Department of BiomedicalEngineering and Computational Science, Aalto University School ofScience, P.O. Box 12200, FI-00076 AALTO, Finland.E-mail: [email protected]
Received 14 February 2012; revised 8 May 2012; accepted 24 June 2012.
DOI 10.1002/mrm.24413Published online 17 July 2012 in Wiley Online Library (wileyonlinelibrary.com).
Magnetic Resonance in Medicine 69:1795–1804 (2013)
VC 2012 Wiley Periodicals, Inc. 1795

excellent tolerance against susceptibility variations(11,16), imaging of objects inside metal enclosures (17),silent operation, safer instrumentation, and an open, bore-free geometry of the device. Lately, imaging near metalobjects has also been demonstrated in high-field scanners(18,19). Finally, it has been suggested that the T1 contrastenhances at lower field strengths (20,21). However, it hasalso been predicted that T1 ! T2 as the field strengthapproaches zero (22). For most substances, it is not yetclear if the T1 times are significantly different from the T2
times in microtesla-range fields. Suggested potential ULF-MRI applications include the detection of liquid explosives(23), diagnosis of prostate cancer (8), and even direct neu-ronal current imaging (24,25).
The combination of MEG and ULF MRI in a singleinstrument (6) is an attractive concept, as both methodsbenefit from SQUID-based detection, work at low mag-netic fields, and can exploit a multichannel receiverarray. Their combination would simplify the workflow ofMEG studies as no separate MRI scans are needed. Meas-uring both MEG and ULF MRI with the same sensor con-figuration provides accurate and automatic coregistrationof the two methods, which mitigates errors in processingand interpreting the data. Given the accurate anatomicalinformation, ULF-MR images could be used to constrainthe MEG source reconstruction for enhanced localizationaccuracy of the underlying neuronal sources. Finally, wehypothesize that ULF-MRI functionality can be added toan existing MEG device as a low-cost upgrade, withoutdegrading the MEG performance of the system.
In this article, we introduce a hybrid MEG-MRI devicebased on a commercial whole-head 306-channel MEGsystem design. We describe SQUID technology that toler-ates the millitesla-order polarizing fields, our MRI coilgeometry, including a superconducting polarizing coil,and an optimized pulse sequence suitable for ULF MRI.We present ULF-MR images of the human brain togetherwith MEG signals recorded with the same device. Fur-thermore, the ULF-MR images are compared with thoseobtained with a conventional 3T scanner, and the MEGresults are compared with those acquired using a com-mercial 306-channel MEG device.
METHODS
Our hybrid MEG-MRI device is based on a whole-headMEG system by Elekta Oy (Helsinki, Finland), whichincludes a helmet-shaped dewar housing the sensorarray in a liquid helium bath. The system is placedinside a two-layer magnetically shielded room for sup-pression of environmental magnetic interference. Thelayers of the magnetically shielded room contain shellsof aluminum and mu-metal, the latter being required forshielding at low frequencies (a few Hz and below),which are important in MEG experiments.
Sensors
Standard MEG SQUID sensors are incompatible with therelatively high magnetic fields of ULF MRI. When thepolarizing field is raised above the critical field BC of asuperconductor, the magnetic flux is able to penetrate
into the superconducting material. After the removal ofthe field, persistent trapped flux may be present in thematerial. This trapping may give rise to magnetic-fieldinhomogeneity in the sample volume as well as deterio-ration of SQUID performance. Furthermore, changingmagnetic fields force the trapped flux vortices to rear-range themselves in the superconductor, generating addi-tional magnetic noise. To circumvent such problems,ULF-MRI systems reported previously (5,26) rely on largeaxial second-order gradiometers connected to SQUIDsinside separate superconducting shields located awayfrom the imaging volume.
To meet the requirements set by ULF MRI, we havemodified the design of the sensors used in the commer-cial MEG system, as detailed in Ref. 27. In short, eachsensor unit in our system includes low-transition-temperature (low-Tc) thin-film SQUIDs placed on top ofa chip with three superconducting receiver coils, form-ing a three-channel sensor module with one magnetome-ter and two orthogonal planar gradiometers. Thin-filmtechnology enables reliable and automated mass produc-tion of the sensors, which, combined with the planar ge-ometry, makes these sensors well suited for large arrays.
Our present sensor modules feature two different typesof superconducting receiver coils. In the first type (seeFig. 1a), the receiver coils (a 21 " 21-mm2 magnetometerloop and 10 " 27-mm2 gradiometer loops separated by a17-mm center-to-center distance) were fabricated using6-mm-wide thin-film Nb strips. In the second type, thecoils (a 27 " 27-mm2 magnetometer loop and 13 " 31-mm2
gradiometer loops separated by a 18-mm center-to-centerdistance) were made of 0.5-mm Pb wire. These two typesdiffer in their field tolerance (27). To further enhance thefield tolerance and shielding, we inserted Nb plates ofsize 11 " 11 " 2 mm3 both above and below the center ofthe thin-film modules. For Pb-wire modules, there is a15 " 15 " 2-mm3 bowl-shaped Nb plate on top of thesensor and a 13 " 13 " 2-mm3 plate below. In addition,we placed flux dams (28) in series with the receiver coils.As a result, we demonstrated sensors with unassisted re-covery after fields up to 50 mT (27).
Currently, our system is equipped with 48 untuned chan-nels arranged as 16 sensor modules, of which 11 have thethin-film- and five Pb-wire-based receiver coils as describedabove and depicted in Fig. 1b. In the sensor helmet, themodules were installed in the region above the occipitallobe of the brain. In this configuration, the sensor planesare nearly parallel to the B0 field. If the sensor planes areperpendicular to the B0 field, the Nb plates degrade thefield homogeneity, causing image distortions; currently, weare investigating ways to avoid such distortions.
SQUIDs were operated in a flux-locked loop using dig-ital electronics. The noise-cancellation scheme presentedin Ref. 29 was used to reduce preamplifier noise. Duringan MRI acquisition, the noise levels for the thin-filmmagnetometers and gradiometers at frequencies of0.1–3 kHz were about 5 fT/Hz1/2 and 4 fT/cm/Hz1/2,respectively. The respective numbers for sensors with thePb-wire receiver coils were 4 fT/Hz1/2 and 2 fT/cm/Hz1/2.By calculating the cross-correlation spectra of neighboringSQUID channels, we estimated that the intrinsic noise lev-els of the sensors were about 4 fT/Hz1/2 and 3 fT/cm/Hz1/2
1796 Vesanen et al.

and 2 fT/Hz1/2 and 1 fT/cm/Hz1/2 for thin-film and Pb-wire sensors, respectively. The correlated noise originatesmainly from the radiation shield of the dewar. It has beenestimated that the body noise at these frequencies is below0.1 fT/Hz1/2 (15).
MRI Hardware
The B0 and gradient fields for ULF MRI are generated byplanar coils on the sides of the system as shown inFig. 2. The B0 coil consists of two pairs of concentricsquare windings connected in series so that the currentsin the smaller and larger pairs flow in the opposite direc-tions. The measured field homogeneity within the 20-cmfield-of-view is about 0.1%. The longitudinal and trans-verse gradient fields are generated with a square Max-well coil and four rectangular coils, respectively. The ex-citation (B1) field is produced with a square coilorthogonal to the B0 coil.
The SNR of a prepolarized ULF-MRI experiment isproportional to the strength of the polarizing field. Thus,similarly to conventional MRI, a successful ULF-MRImeasurement requires as strong a polarizing field (BP) aspossible. Resistive polarizing coils are typically heavyand large and require active cooling to achieve highpolarizing field strengths (26,30). Furthermore, a largepolarizing coil induces strong eddy currents in surround-ing conductive elements, especially in the layers of theshielded room (31). To address these problems, our sys-tem features a superconducting polarizing coil that has ahigh filling factor, small weight, and compact design. Toour knowledge, all previous ULF-MRI devices capable ofin vivo imaging have used resistive polarizing coils.
The superconducting wire in our polarizing coil hasNb filaments in a bronze matrix (Supercon, Inc., Boston,MA). The wire was fabricated with a standard procedurefor Nb3Sn wires, except that tin was left in the matrix.
The wire contains about 24,000 filaments with the fila-ment diameter close to 1 mm. The total wire diameter is0.44 mm, including a 0.02-mm-thick insulation layer. Inhigh-field MRI and NMR, typical multifilament super-conductors may contain several tens to several thou-sands of filaments, with diameters in the range of0.1–50 mm (32). The coil was wound around the framethat holds the SQUID modules. To minimize heat produc-tion and thus helium boil-off, the current to the low-Tc
coil is fed via high-Tc rare-earth-barium-copper-oxide(REBCO) leads (SuperPower, Inc., Schenectady, NY),which form a superconducting connection up to the neckplug of the dewar. There, the leads are further connectedto brass strips that form a low-thermal-conductivity pathout of the helium space of the dewar.
To reduce harmful eddy-current transients in the con-ducting layers of the magnetically shielded room, thepolarizing coil was designed to have zero dipole andquadrupole moments (33). Such a self-shielded polarizingcoil produces a weak magnetic field at the distance of theconductive shielding layers of the room, thus inducingonly weak eddy currents when the polarizing field isramped. The reduced eddy currents produce only a weaksecondary magnetic field within the imaging volume leav-ing the spins intact. Our polarizing coil consists of threesubcoils connected in series. The main coil (552 turns, di-ameter 30 cm) is superconducting and well coupled tothe sample. In addition, we have a superconducting (135turns, diameter 30 cm) and an uncooled resistive (93turns, mean diameter 64 cm, 3-mm copper wire) shieldingcoil that produce a field opposing that of the main coil.The shielding reduces the polarizing field at the coil cen-ter by 20%; at 1-m distance on the coil axis, the strayfield is reduced by 90%. The three-part polarizing coilhas an inductance of 130 mH and produces about 2 mT/Awithin the imaging volume. We have driven the coil withcurrents up to 25 A without observing any quenches.
FIG. 1. a: Geometry of the thin-film sensor modules. The module consists of three independent receiver coils (black, blue, and red). Thegray square represents the Nb plates placed both above and below the module. Green squares indicate the positions of the SQUID chipsand the orange line depicts the outline of the module. b: The sensor array viewed from behind of the head. The sensors in use are drawnin black. The five larger sensor modules have receiver coils made of Pb wire, the others are thin-film modules. Optional module positionsare shown as gray circles. As opposed to a similar induction-coil array, the coupling between our SQUID-based sensors is negligible.[Color figure can be viewed in the online issue, which is available at wileyonlinelibrary.com.]
Hybrid Ultra-Low-Field MRI and MEG System 1797

As our system includes magnetometers that are sensi-tive even to tiny changes in the magnetic field, all MRIcoils have to be supplied with extremely low-noise cur-rents. For example, for a magnetometer (field sensitivityof 5 fT/Hz1/2) oriented toward a B0 coil with 16 mT/A,the current noise at the ULF-MRI frequencies of 1–3 kHzhas to be well below 300 pA/Hz1/2. However, in the sim-plest case, only the B0 field and the frequency-encodinggradient have to be applied during the SQUID signal ac-quisition. Thus, presently, our solution to the current-noise problem is to supply constant current to the B0
and frequency-gradient coils using a 12-V car battery anda homemade regulator. In addition, the sensors are pres-ently placed parallel to the B0 field. The currents for thephase-encoding-gradient and B1 coils are controlled bycommercial (BOP 72-6ML and BOP 36-12M, Kepco, Inc.,Flushing, NY) and homemade amplifiers, respectively,which are disconnected by relays during the dataacquisition.
ULF-MRI Measurements and Reconstruction
The MEG and MRI experiments were approved by theEthics Committee of the Hospital District of Helsinki and
Uusimaa. These experiments involved one healthysubject.
The ULF-MR images were obtained using a 3D spin-echo sequence illustrated in Fig. 3. First, during time TP,the sample was prepolarized in a 22-mT field. Subse-quently, the polarizing field was ramped down adiabati-cally in 6 ms so that at the end of the ramp the spins
FIG. 2. a: A photograph of the system without the patient bed. b: A schematic drawing of the MRI coils and sensors. The B0 field (redcoil) and the gradient fields (Gx: yellow, Gy: green, and Gz: blue) are generated by the planar coils on the sides. The polarizing coil (or-ange) is composed of the three circular coils in the x direction. The small-diameter circular coils are superconducting and the largestone is made of copper wire. The excitation field is generated by a square coil (purple). The sensor positions are shown in black (in use)and gray (optional). c: A photograph of the sensor insert showing the low-Tc superconducting parts of the polarizing coil wound aroundthe frame holding the planar SQUID modules. In the photo, the sensors are in different positions than in the experiments. [Color figurecan be viewed in the online issue, which is available at wileyonlinelibrary.com.]
FIG. 3. The prepolarized 3D spin-echo sequence used in theULF-MRI measurements. The B0 field and the frequency-encodinggradient (Gx) were constantly on.
1798 Vesanen et al.
were aligned along the B0. The polarizing field wasswitched using an insulated-gate-bipolar-transistor(IGBT)-based circuit, which charges the inductive energyof the polarizing field into a capacitor bank by anapproach resembling that of Ref. 12. The gradient encod-ing followed at B0 ! 50 mT and the echo was formed at atime TE after the midpoint of the p/2 pulse, which had atruncated sinc envelope with a length of 8 ms, a band-width of 800 Hz, and a maximum amplitude of 10 mT.The p pulse was obtained by doubling the amplitude ofthe p/2 pulse. After disconnecting the B1 and phase-encoding-gradient coils and resetting the SQUID sensors,the data acquisition began at TWAIT ! 15 ms after themidpoint of the p pulse and lasted for TE # TWAIT.
To optimize the SNR of the resulting image, TP and TE
have to be carefully chosen. For a given total imagingtime and voxel size, the SNR of the prepolarized spin-echo sequence of Fig. 3 is
SNR / r 1# exp$#TP=T1%& ' exp$#TE=T2%
!!!!!!!!!!!!!!!!!!!!!!!!!TE # TWAIT
TP ( 3TE=2
s
;
where T1 and T2 are the longitudinal and transverserelaxation times, respectively, and q is the proton density.The factor in the square root is the fraction of the totalimaging time available for data acquisition. However,most often, one is interested in the contrast-to-noise ratio(CNR), which is defined between tissues A and B as
CNR ! SNRA # SNRBj j;
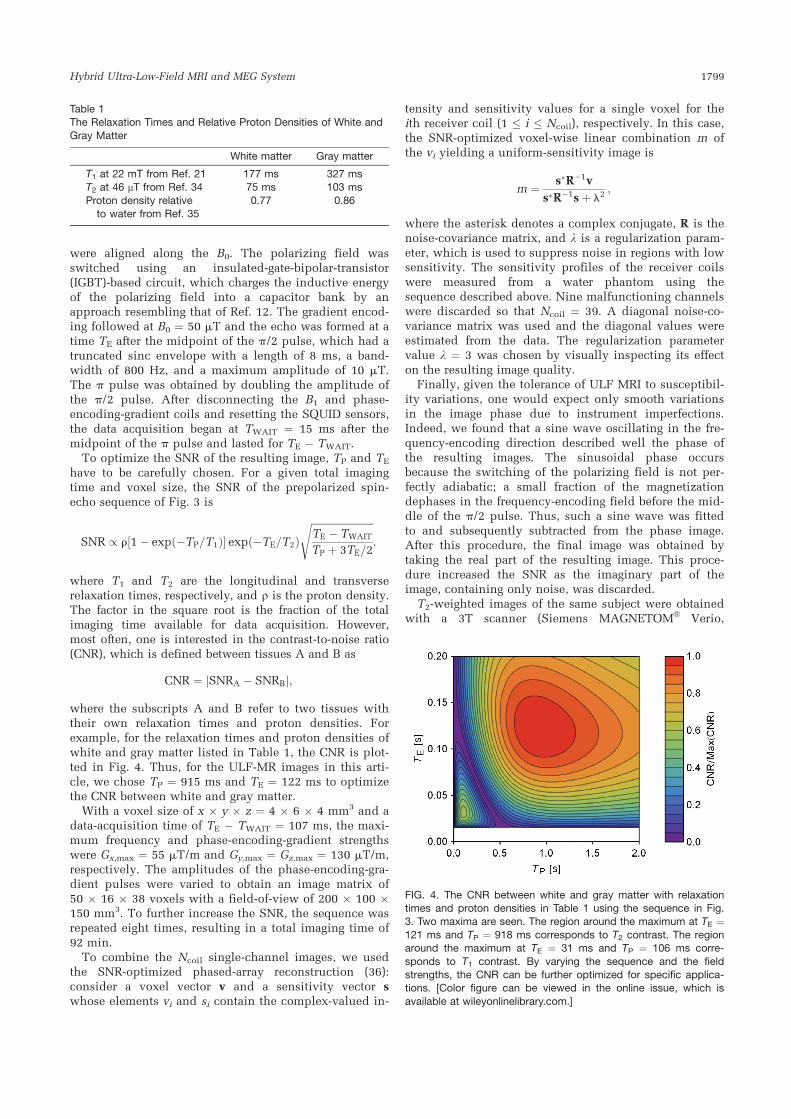
where the subscripts A and B refer to two tissues withtheir own relaxation times and proton densities. Forexample, for the relaxation times and proton densities ofwhite and gray matter listed in Table 1, the CNR is plot-ted in Fig. 4. Thus, for the ULF-MR images in this arti-cle, we chose TP ! 915 ms and TE ! 122 ms to optimizethe CNR between white and gray matter.
With a voxel size of x " y " z ! 4 " 6 " 4 mm3 and adata-acquisition time of TE # TWAIT ! 107 ms, the maxi-mum frequency and phase-encoding-gradient strengthswere Gx,max ! 55 mT/m and Gy,max ! Gz,max ! 130 mT/m,respectively. The amplitudes of the phase-encoding-gra-dient pulses were varied to obtain an image matrix of50 " 16 " 38 voxels with a field-of-view of 200 " 100 "150 mm3. To further increase the SNR, the sequence wasrepeated eight times, resulting in a total imaging time of92 min.
To combine the Ncoil single-channel images, we usedthe SNR-optimized phased-array reconstruction (36):consider a voxel vector v and a sensitivity vector swhose elements vi and si contain the complex-valued in-
tensity and sensitivity values for a single voxel for theith receiver coil (1 ) i ) Ncoil), respectively. In this case,the SNR-optimized voxel-wise linear combination m ofthe vi yielding a uniform-sensitivity image is
m ! s*R#1v
s*R#1s( l2;
where the asterisk denotes a complex conjugate, R is thenoise-covariance matrix, and k is a regularization param-eter, which is used to suppress noise in regions with lowsensitivity. The sensitivity profiles of the receiver coilswere measured from a water phantom using thesequence described above. Nine malfunctioning channelswere discarded so that Ncoil ! 39. A diagonal noise-co-variance matrix was used and the diagonal values wereestimated from the data. The regularization parametervalue k ! 3 was chosen by visually inspecting its effecton the resulting image quality.
Finally, given the tolerance of ULF MRI to susceptibil-ity variations, one would expect only smooth variationsin the image phase due to instrument imperfections.Indeed, we found that a sine wave oscillating in the fre-quency-encoding direction described well the phase ofthe resulting images. The sinusoidal phase occursbecause the switching of the polarizing field is not per-fectly adiabatic; a small fraction of the magnetizationdephases in the frequency-encoding field before the mid-dle of the p/2 pulse. Thus, such a sine wave was fittedto and subsequently subtracted from the phase image.After this procedure, the final image was obtained bytaking the real part of the resulting image. This proce-dure increased the SNR as the imaginary part of theimage, containing only noise, was discarded.
T2-weighted images of the same subject were obtainedwith a 3T scanner (Siemens MAGNETOMVR Verio,
Table 1The Relaxation Times and Relative Proton Densities of White andGray Matter
White matter Gray matter
T1 at 22 mT from Ref. 21 177 ms 327 msT2 at 46 lT from Ref. 34 75 ms 103 msProton density relative
to water from Ref. 350.77 0.86
FIG. 4. The CNR between white and gray matter with relaxationtimes and proton densities in Table 1 using the sequence in Fig.3. Two maxima are seen. The region around the maximum at TE !121 ms and TP ! 918 ms corresponds to T2 contrast. The regionaround the maximum at TE ! 31 ms and TP ! 106 ms corre-sponds to T1 contrast. By varying the sequence and the fieldstrengths, the CNR can be further optimized for specific applica-tions. [Color figure can be viewed in the online issue, which isavailable at wileyonlinelibrary.com.]
Hybrid Ultra-Low-Field MRI and MEG System 1799
Erlangen, Germany). A turbo spin-echo sequence with aTR ! 4920 ms and TE ! 121 ms was used. The resultingimage had a resolution of 1 " 2 " 1 mm3 with a field-of-view of 256 " 197 " 256 mm3. The total imaging timewas 4 min. For comparison with the ULF-MR images, wewill show two different versions of the 3T images. First,the original high-resolution images corresponding to theslice locations of the ULF-MR images will be shown.Second, for verifying the integrity of the structures in theULF-MR images, we will also show downsampled ver-sions of the 3T images. To accomplish this, the 3T imageset was Fourier transformed to k-space, where the high-frequency components of the data were removed so thatthe k-space coverage matched that of the ULF-MR imageset. Subsequently, the modified data were Fourier trans-formed back to image space.
MEG Measurements and Analysis
The MEG capability of our hybrid MEG-MRI device wasdemonstrated by measuring visually evoked responses ofthe same subject that had the ULF-MRI scan. The MEGacquisition was performed in a separate session, and allthe MRI coils were disconnected before starting the mea-surement to avoid magnetic noise. The head-position-in-dicator system, required for precise localization of thehead with respect to the sensors, and the electro-oculo-gram recording (to detect blinks and eye movements pro-ducing possible artifacts to the signal) were not availableat this stage of the work. The stimulus was a black-and-white checkerboard image presented in the lower leftvisual quadrant (spanning eccentricities of 0.5+–12+) andappearing on a uniform gray background for 100 ms; thesubject was instructed to fixate on a small black cross inthe middle of the screen. The stimulus was generatedwith the Presentation
TM
software (Neurobehavioral Sys-tems, Inc., CA) and displayed to the subject using a digi-tal-light-processing (DLP)-based video projector outsideof the magnetically shielded room and a back-projectionscreen in front of the subject. The interstimulus intervalwas 1 s, and averaging was triggered by the signal from aphotodetector behind the screen. The signals were fil-tered to 0.1–330 Hz and sampled at 1 kHz. One hundredresponses were collected and averaged in 700-ms epochsincluding a 100-ms prestimulus baseline to obtain high-SNR visually evoked fields (VEFs).
The signals of six malfunctioning channels were dis-carded. To reduce external magnetic interference, signal-space projection (37) was applied to the averaged datausing seven signal-space vectors that were determinedby principal component analysis of data acquired with-out a subject. Prior to analysis, the data were low-passfiltered at 40 Hz. To display magnetic-field maps, a mini-mum-norm estimate (38) was calculated using both themagnetometer and gradiometer data. Using the 20 largesteigenvectors of the estimate and correcting for the pro-jected-out dimensions in the signal space, detailed fieldmaps were produced on the sensor surface. Finally, anequivalent current dipole, representing a focal neuronalsource, was fitted to the data. A spherical conductormodel was used in the field computation.
For validation, the experiment was repeated at the Bio-Mag Laboratory (Helsinki University Central Hospital,Helsinki, Finland) with a commercial 306-channel MEGdevice (Vectorview
TM
, Elekta Oy, Helsinki, Finland),which is based on the same design as our hybrid MEG-MRI instrument. For a meaningful comparison, the datawere modified to include only the channels that ourMEG-MRI device currently has. Except for the differentsignal-space vectors, the data analysis was equivalent tothat of the data recorded with the MEG-MRI device.
RESULTS
ULF-MRI Measurements
The T2-weighted images acquired with the hybrid MEG-MRI device are presented in Fig. 5. In the same figure,both the original and the downsampled T2-weightedimages obtained at 3 T are shown for comparison. In theULF-MR images, the shapes of the scalp, skull, and thebrain are clearly visible and appear similar to those inthe 3T images. Several other details, such as the brightregions representing cerebrospinal fluid in the superiorpart of the more anterior slices and the slightly darkergyri, can be discerned as well. Many of these detailsappear in the 3T images as well. The reduction of theULF-MR image quality in the inferior parts of the moreanterior slices is a result of the lack of sensor coverage inthose areas; for the same reason, only the six most poste-rior slices are shown.
To further investigate the reliability of the details visi-ble in the ULF-MR images, we calculated the phased-array reconstruction separately for the eight scans, whichoriginally were just averaged. Using these data, we plot-ted the mean voxel intensities (Fig. 6) along the linedepicted in Fig. 5 together with error bars representingthe standard error of the mean across the scans. Notethat in a uniform-sensitivity image, the noise is not nec-essarily uniform across the image. Accordingly, it can beseen (Fig. 6) that the error bars are larger at the center ofthe brain reflecting the degraded sensitivity of the sensorarray at those regions. Calculated from Fig. 6, the maxi-mum SNR ! 25 occurs at the scalp, while in the brainparenchyma, the SNR remains at 3–10. For the uniform-noise-3T image, SNR ! 123 is obtained by calculatingthe signal and noise from the indicated black and whiteboxes in Fig. 5, respectively.
MEG Measurements
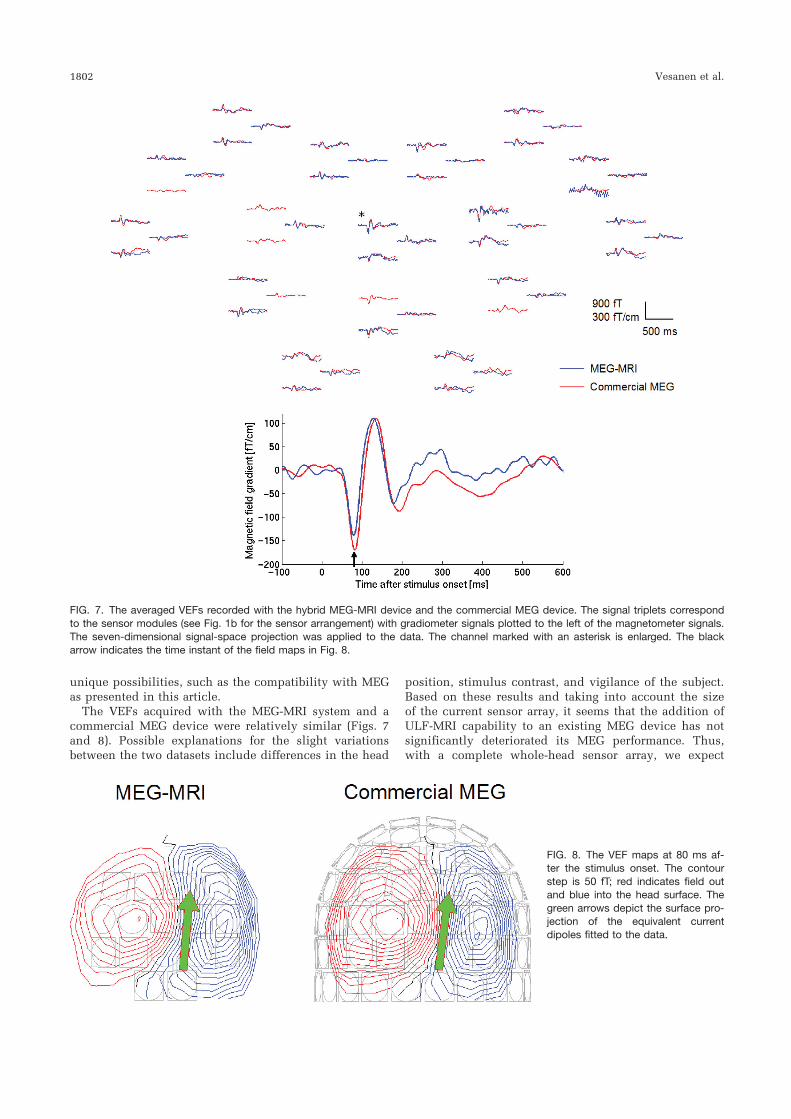
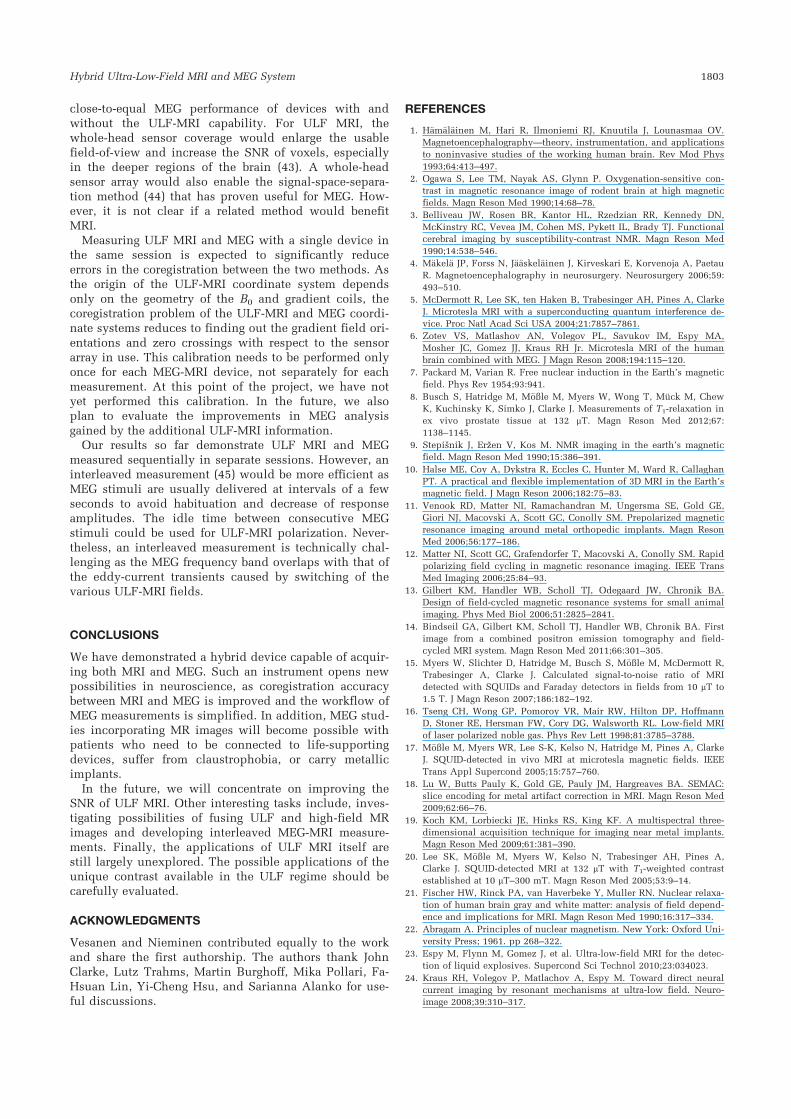
The VEFs acquired with the MEG-MRI and commercialdevices are overlaid in Fig. 7. The most prominent VEFdeflections peaked at 80 and 130 ms, as reported in theliterature (39). The field maps and an equivalent-current-dipole fit to the VEF peak at 80 ms are shown in Fig. 8.Assuming the head of the subject was situated roughlysymmetrically in the helmet, the dipole is located in theright hemisphere, as it should for a stimulus appearingin the left visual hemifield. The fitted dipole momentsfor the data acquired with the MEG-MRI and the com-mercial MEG devices were 30 and 40 nAm, and thegoodness of the fits were 95% and 96%, respectively.
1800 Vesanen et al.

After applying signal-space projection, the noise levelsin the frequency range of 10–20 Hz for magnetometersand gradiometers of the MEG-MRI device were around13 fT/Hz1/2 and 6 fT/cm/Hz1/2, respectively. In the com-mercial MEG system, the respective magnetometer andgradiometer noise levels were around 3 fT/Hz1/2 and3 fT/cm/Hz1/2, respectively.
DISCUSSION
We have constructed a hybrid device that can acquireboth MEG signals and MR images. In this article, wedescribed its design and demonstrated its performanceboth in the MEG and MRI modes.
Although the acquired ULF-MR images present severalbrain structures in detail, the overall shape of the supe-rior part of the head seems to be slightly deformed. Thisdistortion is likely due to flux trapping in the supercon-ducting filaments of the polarizing coil (40). The z com-ponent of the remnant magnetic field, caused by thetrapped flux, had a maximum amplitude and gradient ofabout 400 nT and 4 mT/m in the imaging volume, respec-tively. This remnant magnetic field distorts the B0 andgradient fields and increases as a function of the polariz-ing field strength, which currently prevents us fromusing a polarizing field higher than about 22 mT. Simi-larly, the differences between the low-frequency noiselevels of the MEG-MRI and commercial MEG device inMEG recordings are probably due to vibrations of thesensors with respect to the remnant magnetic field intro-duced by the polarizing coil, as the coil was notdegaussed between the MRI and MEG acquisitions.
The SNR of ULF MRI could be increased using stron-ger polarizing fields and by having sensors with lowernoise. As explained above, currently our polarizing fieldstrength is limited by the appearance of a remnant mag-netic field of the superconducting coil after a polarizingpulse. To overcome this problem, we are investigatingpossibilities to demagnetize the coil rapidly (<20 ms) af-ter each polarizing pulse and to use an algebraic recon-struction (41,42) to correct for the distortions in theimages. As the magnetization profile for a given BP isstatic, shimming the B0 is an option as well. While rec-ognizing the need for a higher SNR for ULF MRI, weemphasize that ULF MRI and high-field MRI should notbe considered as competing modalities; ULF MRI has
FIG. 6. ULF-MR image mean voxel intensities along the linedepicted in Fig. 5. To visualize the SNR of the image, error bars(standard error of the mean) were calculated from the eight scans.The sensor array sensitivity is reduced toward the center of thebrain as indicated by the growing error bars.
FIG. 5. Coronal slices acquired with the hybrid MEG-MRI device (left) compared with those obtained with a 3T scanner (right). For verifi-cation of the structures seen in the ULF-MR images, also downsampled 3T images are shown (middle). The arrow indicates the linealong which the voxel data in Fig. 6 are plotted, and the black and white boxes indicate the regions from which the SNR for the 3Timage was determined.
Hybrid Ultra-Low-Field MRI and MEG System 1801
unique possibilities, such as the compatibility with MEGas presented in this article.
The VEFs acquired with the MEG-MRI system and acommercial MEG device were relatively similar (Figs. 7and 8). Possible explanations for the slight variationsbetween the two datasets include differences in the head
position, stimulus contrast, and vigilance of the subject.Based on these results and taking into account the sizeof the current sensor array, it seems that the addition ofULF-MRI capability to an existing MEG device has notsignificantly deteriorated its MEG performance. Thus,with a complete whole-head sensor array, we expect
FIG. 7. The averaged VEFs recorded with the hybrid MEG-MRI device and the commercial MEG device. The signal triplets correspondto the sensor modules (see Fig. 1b for the sensor arrangement) with gradiometer signals plotted to the left of the magnetometer signals.The seven-dimensional signal-space projection was applied to the data. The channel marked with an asterisk is enlarged. The blackarrow indicates the time instant of the field maps in Fig. 8.
FIG. 8. The VEF maps at 80 ms af-ter the stimulus onset. The contourstep is 50 fT; red indicates field outand blue into the head surface. Thegreen arrows depict the surface pro-jection of the equivalent currentdipoles fitted to the data.
1802 Vesanen et al.
close-to-equal MEG performance of devices with andwithout the ULF-MRI capability. For ULF MRI, thewhole-head sensor coverage would enlarge the usablefield-of-view and increase the SNR of voxels, especiallyin the deeper regions of the brain (43). A whole-headsensor array would also enable the signal-space-separa-tion method (44) that has proven useful for MEG. How-ever, it is not clear if a related method would benefitMRI.
Measuring ULF MRI and MEG with a single device inthe same session is expected to significantly reduceerrors in the coregistration between the two methods. Asthe origin of the ULF-MRI coordinate system dependsonly on the geometry of the B0 and gradient coils, thecoregistration problem of the ULF-MRI and MEG coordi-nate systems reduces to finding out the gradient field ori-entations and zero crossings with respect to the sensorarray in use. This calibration needs to be performed onlyonce for each MEG-MRI device, not separately for eachmeasurement. At this point of the project, we have notyet performed this calibration. In the future, we alsoplan to evaluate the improvements in MEG analysisgained by the additional ULF-MRI information.
Our results so far demonstrate ULF MRI and MEGmeasured sequentially in separate sessions. However, aninterleaved measurement (45) would be more efficient asMEG stimuli are usually delivered at intervals of a fewseconds to avoid habituation and decrease of responseamplitudes. The idle time between consecutive MEGstimuli could be used for ULF-MRI polarization. Never-theless, an interleaved measurement is technically chal-lenging as the MEG frequency band overlaps with that ofthe eddy-current transients caused by switching of thevarious ULF-MRI fields.
CONCLUSIONS
We have demonstrated a hybrid device capable of acquir-ing both MRI and MEG. Such an instrument opens newpossibilities in neuroscience, as coregistration accuracybetween MRI and MEG is improved and the workflow ofMEG measurements is simplified. In addition, MEG stud-ies incorporating MR images will become possible withpatients who need to be connected to life-supportingdevices, suffer from claustrophobia, or carry metallicimplants.
In the future, we will concentrate on improving theSNR of ULF MRI. Other interesting tasks include, inves-tigating possibilities of fusing ULF and high-field MRimages and developing interleaved MEG-MRI measure-ments. Finally, the applications of ULF MRI itself arestill largely unexplored. The possible applications of theunique contrast available in the ULF regime should becarefully evaluated.
ACKNOWLEDGMENTS
Vesanen and Nieminen contributed equally to the workand share the first authorship. The authors thank JohnClarke, Lutz Trahms, Martin Burghoff, Mika Pollari, Fa-Hsuan Lin, Yi-Cheng Hsu, and Sarianna Alanko for use-ful discussions.
REFERENCES
1. H!am!al!ainen M, Hari R, Ilmoniemi RJ, Knuutila J, Lounasmaa OV.Magnetoencephalography—theory, instrumentation, and applicationsto noninvasive studies of the working human brain. Rev Mod Phys1993;64:413–497.
2. Ogawa S, Lee TM, Nayak AS, Glynn P. Oxygenation-sensitive con-trast in magnetic resonance image of rodent brain at high magneticfields. Magn Reson Med 1990;14:68–78.
3. Belliveau JW, Rosen BR, Kantor HL, Rzedzian RR, Kennedy DN,McKinstry RC, Vevea JM, Cohen MS, Pykett IL, Brady TJ. Functionalcerebral imaging by susceptibility-contrast NMR. Magn Reson Med1990;14:538–546.
4. M!akel!a JP, Forss N, J!a!askel!ainen J, Kirveskari E, Korvenoja A, PaetauR. Magnetoencephalography in neurosurgery. Neurosurgery 2006;59:493–510.
5. McDermott R, Lee SK, ten Haken B, Trabesinger AH, Pines A, ClarkeJ. Microtesla MRI with a superconducting quantum interference de-vice. Proc Natl Acad Sci USA 2004;21:7857–7861.
6. Zotev VS, Matlashov AN, Volegov PL, Savukov IM, Espy MA,Mosher JC, Gomez JJ, Kraus RH Jr. Microtesla MRI of the humanbrain combined with MEG. J Magn Reson 2008;194:115–120.
7. Packard M, Varian R. Free nuclear induction in the Earth’s magneticfield. Phys Rev 1954;93:941.
8. Busch S, Hatridge M, M!oßle M, Myers W, Wong T, Muck M, ChewK, Kuchinsky K, Simko J, Clarke J. Measurements of T1-relaxation inex vivo prostate tissue at 132 lT. Magn Reson Med 2012;67:1138–1145.
9. Stepisnik J, Erzen V, Kos M. NMR imaging in the earth’s magneticfield. Magn Reson Med 1990;15:386–391.
10. Halse ME, Coy A, Dykstra R, Eccles C, Hunter M, Ward R, CallaghanPT. A practical and flexible implementation of 3D MRI in the Earth’smagnetic field. J Magn Reson 2006;182:75–83.
11. Venook RD, Matter NI, Ramachandran M, Ungersma SE, Gold GE,Giori NJ, Macovski A, Scott GC, Conolly SM. Prepolarized magneticresonance imaging around metal orthopedic implants. Magn ResonMed 2006;56:177–186.
12. Matter NI, Scott GC, Grafendorfer T, Macovski A, Conolly SM. Rapidpolarizing field cycling in magnetic resonance imaging. IEEE TransMed Imaging 2006;25:84–93.
13. Gilbert KM, Handler WB, Scholl TJ, Odegaard JW, Chronik BA.Design of field-cycled magnetic resonance systems for small animalimaging. Phys Med Biol 2006;51:2825–2841.
14. Bindseil GA, Gilbert KM, Scholl TJ, Handler WB, Chronik BA. Firstimage from a combined positron emission tomography and field-cycled MRI system. Magn Reson Med 2011;66:301–305.
15. Myers W, Slichter D, Hatridge M, Busch S, M!oßle M, McDermott R,Trabesinger A, Clarke J. Calculated signal-to-noise ratio of MRIdetected with SQUIDs and Faraday detectors in fields from 10 lT to1.5 T. J Magn Reson 2007;186:182–192.
16. Tseng CH, Wong GP, Pomoroy VR, Mair RW, Hilton DP, HoffmannD, Stoner RE, Hersman FW, Cory DG, Walsworth RL. Low-field MRIof laser polarized noble gas. Phys Rev Lett 1998;81:3785–3788.
17. M!oßle M, Myers WR, Lee S-K, Kelso N, Hatridge M, Pines A, ClarkeJ. SQUID-detected in vivo MRI at microtesla magnetic fields. IEEETrans Appl Supercond 2005;15:757–760.
18. Lu W, Butts Pauly K, Gold GE, Pauly JM, Hargreaves BA. SEMAC:slice encoding for metal artifact correction in MRI. Magn Reson Med2009;62:66–76.
19. Koch KM, Lorbiecki JE, Hinks RS, King KF. A multispectral three-dimensional acquisition technique for imaging near metal implants.Magn Reson Med 2009;61:381–390.
20. Lee SK, M!oßle M, Myers W, Kelso N, Trabesinger AH, Pines A,Clarke J. SQUID-detected MRI at 132 lT with T1-weighted contrastestablished at 10 lT–300 mT. Magn Reson Med 2005;53:9–14.
21. Fischer HW, Rinck PA, van Haverbeke Y, Muller RN. Nuclear relaxa-tion of human brain gray and white matter: analysis of field depend-ence and implications for MRI. Magn Reson Med 1990;16:317–334.
22. Abragam A. Principles of nuclear magnetism. New York: Oxford Uni-versity Press; 1961. pp 268–322.
23. Espy M, Flynn M, Gomez J, et al. Ultra-low-field MRI for the detec-tion of liquid explosives. Supercond Sci Technol 2010;23:034023.
24. Kraus RH, Volegov P, Matlachov A, Espy M. Toward direct neuralcurrent imaging by resonant mechanisms at ultra-low field. Neuro-image 2008;39:310–317.
Hybrid Ultra-Low-Field MRI and MEG System 1803

25. Cassar"a AM, Maraviglia B, Hartwig S, Trahms L, Burghoff M. Neuro-nal current detection with low-field magnetic resonance: simulationsand methods. Magn Reson Imaging 2009;27:1131–1139.
26. Zotev VS, Matlashov AN, Volegov PL, Urbaitis AV, Espy MA, KrausRH Jr. SQUID-based instrumentation for ultralow-field MRI. Super-cond Sci Technol 2007;20:367–373.
27. Luomahaara J, Vesanen PT, Penttil!a J, et al. All-planar SQUIDs andpickup coils for combined MEG and MRI. Supercond Sci Technol2011;24:075020.
28. Koch RH, Sun JZ, Foglietta V, Gallagher WJ. Flux dam, a method toreduce extra low frequency noise when a superconducting magne-tometer is exposed to a magnetic field. Appl Phys Lett 1995;67:709–711.
29. Kiviranta M, Sepp!a H. DC-SQUID electronics based on thenoise cancellation scheme. IEEE Trans Appl Supercond 1995;5:2146–2148.
30. Busch SE. Ultra-low field MRI of prostate cancer using SQUID detec-tion. PhD Thesis, University of California, Berkeley, USA; 2011.
31. Vesanen PT, Nieminen JO, Zevenhoven KCJ, Dabek J, Simola J, Sar-vas J, Ilmoniemi RJ. The spatial and temporal distortion of magneticfields applied inside a magnetically shielded room. IEEE Trans Magn2012;48:53–61.
32. Scanlan RM, Malozemoff AP, Larbalestier DC. Superconductingmaterials for large scale applications. Proc IEEE 2004;92:1639–1654.
33. Nieminen JO, Vesanen PT, Zevenhoven KCJ, Dabek J, Hassel J, Luo-mahaara J, Penttil!a JS, Ilmoniemi RJ. Avoiding eddy-current prob-lems in ultra-low-field MRI with self-shielded polarizing coils.J Magn Reson 2011;212:154–160.
34. Zotev VS, Matlashov AN, Savukov IM, Owens T, Volegov PL, GomezJJ, Espy MA. SQUID-based microtesla MRI for in vivo relaxometry ofthe human brain. IEEE Trans Appl Supercond 2009;19:823–826.
35. Aubert-Broche B, Evans AC, Collins L. A new improved version ofthe realistic digital brain phantom. Neuroimage 2006;32:138–145.
36. Roemer PB, Edelstein WA, Hayes CE, Souza SP, Mueller OM. TheNMR phased array. Magn Reson Med 1990;16:192–225.
37. Uusitalo MA, Ilmoniemi RJ. Signal-space projection method for sepa-rating MEG or EEG into components. Med Biol Eng Comput 1997;35:135–140.
38. H!am!al!ainen MS, Ilmoniemi RJ. Interpreting magnetic fields of thebrain: minimum norm estimates. Med Biol Eng Comput 1994;32:35–42.
39. Ahlfors SP, Ilmoniemi RJ, H!am!al!ainen MS. Estimates of visuallyevoked cortical currents. Electroencephalogr Clin Neurophysiol 1992;82:225–236.
40. Bean CP. Magnetization of high-field superconductors. Rev ModPhys 1964;36:31–39.
41. Nieminen JO, Ilmoniemi RJ. Solving the problem of concomitant gra-dients in ultra-low-field MRI. J Magn Reson 2010;207:213–219.
42. Hsu Y-C, Vesanen PT, Nieminen JO, Zevenhoven KCJ, Dabek J,Chern I-L, Ilmoniemi RJ, Lin F-H. Efficient concomitant field artifactsreduction using a hybrid space-frequency domain formulism. In Pro-ceedings of the 20th Annual Meeting of ISMRM, Melbourne, Aus-tralia, 2012. p. 2474.
43. Zevenhoven K, Ilmoniemi RJ. Performance of SQUID sensor arraysfor MRI of the brain. In Proceedings of the 19th Annual Meeting ofISMRM, Montreal, Canada, 2011. p. 4226.
44. Taulu S, Simola J, Kajola M. Applications of the signal space separa-tion method. IEEE Trans Signal Process 2005;53:3359–3372.
45. Magnelind PE, Gomez JJ, Matlashov AN, Owens T, Sandin JH, Vole-gov PL, Espy MA. Coregistration of interleaved MEG and ULF MRIusing a 7 channel low-Tc SQUID system. IEEE Trans Appl Super-cond 2011;21:456–460.
1804 Vesanen et al.