
Neural processes for intentional control of perceptual switching: A magnetoencephalography study
16
r Human Brain Mapping 32:397–412 (2011) r Neural Processes for Intentional Control of Perceptual Switching: A Magnetoencephalography Study Masanori Shimono, 1 * Keiichi Kitajo, 2,3 and Tsunehiro Takeda 4 1 Cognitive Neuroscience Group, Neuroscience Research Institute, AIST, Tsukuba Central 2, Tsukuba, Ibaraki 305-8568, Japan 2 Laboratory for Dynamics of Emergent Intelligence, RIKEN, Brain Science Institute, 2-1, Hirosawa, Wako, Saitama 351-0198, Japan 3 PRESTO, Japan Science and Technology Agency (JST), 4-1-8 Honcho Kawaguchi, Saitama 332-0012, Japan 4 Laboratory for Biological Complex Systems, Department of Complexity Science and Engineering, Graduate School of Frontier Science, The University of Tokyo, 5-1-5, Kashiwanoha, Kashiwa, Chiba 277-8561, Japan r r Abstract: This article reports an interesting link between the psychophysical property of intentional control of perceptual switching and the underlying neural activities. First, we revealed that the timing of perceptual switching for a dynamical dot quartet can be controlled by the observers’ intention, with- out eye movement. However, there is a clear limitation to this control, such that each animation frame of the stimulus must be presented for a sufficiently long time length; in other words, the frequency of the stimulus alternation must be sufficiently slow for the control. The typical stimulus onset asyn- chrony for a 50% level of success was about 275 ms for an average of 10 observers. On the basis of psychophysical property, we designed three experiments for investigating the neural process with a magnetoencephalography. They revealed that: (1) a peak component occurring about 300 ms after a reversal was stronger when the direction of perceived motion was switched intentionally than when it was not switched, and (2) neural components about 30–40 ms and 240–250 ms after the reversal of the stimulus animation were stronger when perception was altered intentionally than when it was switched unintentionally. The 300 ms component is consistent with a previous study about passive perceptual switching (Struber and Herrmann [2002]: Cogn Brain Res 14:370–382), but the intentional effect was seemed to be a different component from the well-known P300 component. Hum Brain Mapp 32:397–412, 2011. V C 2010 Wiley-Liss, Inc. Key words: Intentional control; magnetoencephalography; perceptual switching; dynamical dot quartet; stimulus onset asynchrony r r Contract grant sponsor: Japan Society for the Promotion of Science. *Correspondence to: Masanori Shimono, Laboratory for Biological Complex Systems, Department of Complexity Science and Engi- neering, Graduate School of Frontier Science, The University of Tokyo, 5–1–5, Kashiwanoha, Kashiwa, Chiba 277–8561, Japan. E-mail: [email protected] Received for publication 13 August 2008; Revised 19 September 2009; Accepted 19 January 2010 DOI: 10.1002/hbm.21022 Published online 1 June 2010 in Wiley Online Library (wileyonlinelibrary.com). V C 2010 Wiley-Liss, Inc.
Transcript of Neural processes for intentional control of perceptual switching: A magnetoencephalography study

r Human Brain Mapping 32:397–412 (2011) r
Neural Processes for Intentional Control ofPerceptual Switching: A Magnetoencephalography
Study
Masanori Shimono,1* Keiichi Kitajo,2,3 and Tsunehiro Takeda4
1Cognitive Neuroscience Group, Neuroscience Research Institute, AIST, Tsukuba Central 2, Tsukuba,Ibaraki 305-8568, Japan
2Laboratory for Dynamics of Emergent Intelligence, RIKEN, Brain Science Institute, 2-1, Hirosawa,Wako, Saitama 351-0198, Japan
3PRESTO, Japan Science and Technology Agency (JST), 4-1-8 Honcho Kawaguchi, Saitama 332-0012, Japan4Laboratory for Biological Complex Systems, Department of Complexity Science and Engineering,Graduate School of Frontier Science, The University of Tokyo, 5-1-5, Kashiwanoha, Kashiwa,
Chiba 277-8561, Japan
r r
Abstract: This article reports an interesting link between the psychophysical property of intentionalcontrol of perceptual switching and the underlying neural activities. First, we revealed that the timingof perceptual switching for a dynamical dot quartet can be controlled by the observers’ intention, with-out eye movement. However, there is a clear limitation to this control, such that each animation frameof the stimulus must be presented for a sufficiently long time length; in other words, the frequency ofthe stimulus alternation must be sufficiently slow for the control. The typical stimulus onset asyn-chrony for a 50% level of success was about 275 ms for an average of 10 observers. On the basis ofpsychophysical property, we designed three experiments for investigating the neural process with amagnetoencephalography. They revealed that: (1) a peak component occurring about 300 ms after areversal was stronger when the direction of perceived motion was switched intentionally than when itwas not switched, and (2) neural components about 30–40 ms and 240–250 ms after the reversal of thestimulus animation were stronger when perception was altered intentionally than when it wasswitched unintentionally. The 300 ms component is consistent with a previous study about passiveperceptual switching (Struber and Herrmann [2002]: Cogn Brain Res 14:370–382), but the intentionaleffect was seemed to be a different component from the well-known P300 component. Hum BrainMapp 32:397–412, 2011. VC 2010 Wiley-Liss, Inc.
Keywords: Intentional control; magnetoencephalography; perceptual switching; dynamical dotquartet; stimulus onset asynchrony
r r
Contract grant sponsor: Japan Society for the Promotion ofScience.
*Correspondence to: Masanori Shimono, Laboratory for BiologicalComplex Systems, Department of Complexity Science and Engi-neering, Graduate School of Frontier Science, The University ofTokyo, 5–1–5, Kashiwanoha, Kashiwa, Chiba 277–8561, Japan.E-mail: [email protected]
Received for publication 13 August 2008; Revised 19 September2009; Accepted 19 January 2010
DOI: 10.1002/hbm.21022Published online 1 June 2010 in Wiley Online Library(wileyonlinelibrary.com).
VC 2010 Wiley-Liss, Inc.

INTRODUCTION
Perceptual switching refers to the phenomenon wherethe perception of an image changes even though the samestimulus was presented [Necker, 1832; Ramachandran and
Antis, 1983; Rubin, 1958]. This phenomenon has oftenbeen associated with stochastic neural processes, and anattractive phenomenon for understanding the neuralprocesses behind perception that is independent of exter-nal changes [Leopold and Logothetis, 1999; Merk and
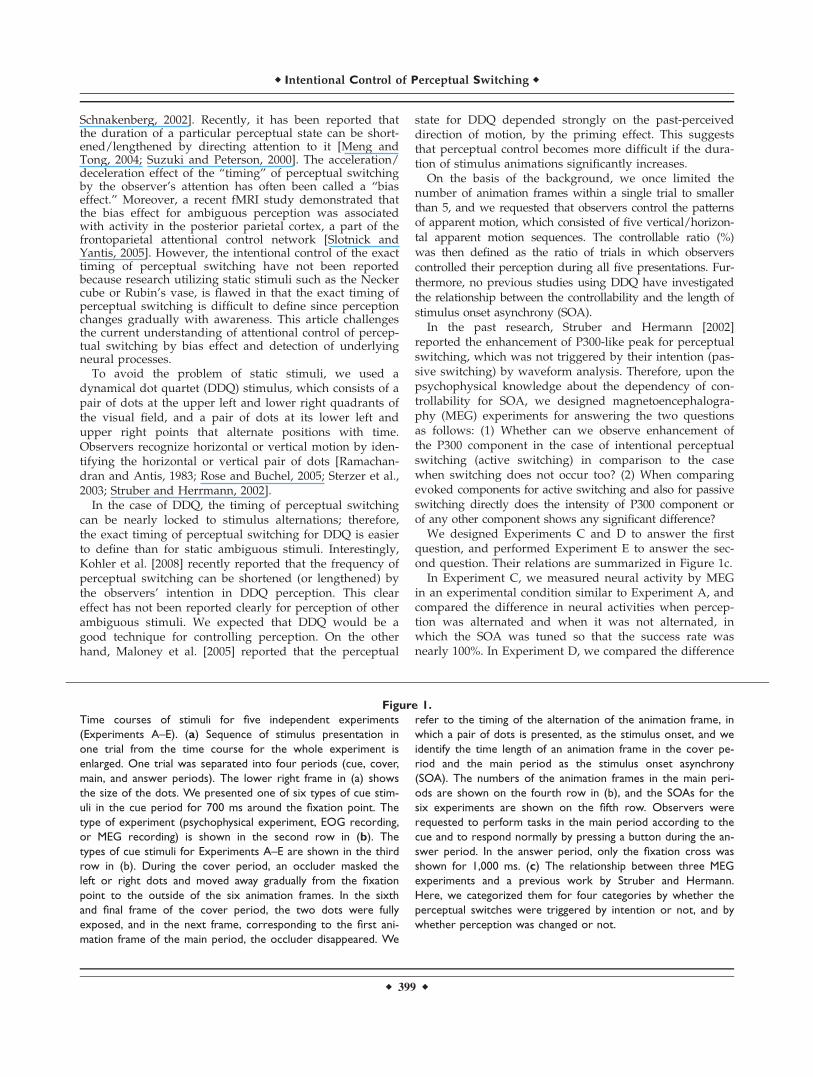
Figure 1.
r Shimono et al. r
r 398 r
Schnakenberg, 2002]. Recently, it has been reported thatthe duration of a particular perceptual state can be short-ened/lengthened by directing attention to it [Meng andTong, 2004; Suzuki and Peterson, 2000]. The acceleration/deceleration effect of the ‘‘timing’’ of perceptual switchingby the observer’s attention has often been called a ‘‘biaseffect.’’ Moreover, a recent fMRI study demonstrated thatthe bias effect for ambiguous perception was associatedwith activity in the posterior parietal cortex, a part of thefrontoparietal attentional control network [Slotnick andYantis, 2005]. However, the intentional control of the exacttiming of perceptual switching have not been reportedbecause research utilizing static stimuli such as the Neckercube or Rubin’s vase, is flawed in that the exact timing ofperceptual switching is difficult to define since perceptionchanges gradually with awareness. This article challengesthe current understanding of attentional control of percep-tual switching by bias effect and detection of underlyingneural processes.
To avoid the problem of static stimuli, we used adynamical dot quartet (DDQ) stimulus, which consists of apair of dots at the upper left and lower right quadrants ofthe visual field, and a pair of dots at its lower left andupper right points that alternate positions with time.Observers recognize horizontal or vertical motion by iden-tifying the horizontal or vertical pair of dots [Ramachan-dran and Antis, 1983; Rose and Buchel, 2005; Sterzer et al.,2003; Struber and Herrmann, 2002].
In the case of DDQ, the timing of perceptual switchingcan be nearly locked to stimulus alternations; therefore,the exact timing of perceptual switching for DDQ is easierto define than for static ambiguous stimuli. Interestingly,Kohler et al. [2008] recently reported that the frequency ofperceptual switching can be shortened (or lengthened) bythe observers’ intention in DDQ perception. This cleareffect has not been reported clearly for perception of otherambiguous stimuli. We expected that DDQ would be agood technique for controlling perception. On the otherhand, Maloney et al. [2005] reported that the perceptual
state for DDQ depended strongly on the past-perceiveddirection of motion, by the priming effect. This suggeststhat perceptual control becomes more difficult if the dura-tion of stimulus animations significantly increases.
On the basis of the background, we once limited thenumber of animation frames within a single trial to smallerthan 5, and we requested that observers control the patternsof apparent motion, which consisted of five vertical/horizon-tal apparent motion sequences. The controllable ratio (%)was then defined as the ratio of trials in which observerscontrolled their perception during all five presentations. Fur-thermore, no previous studies using DDQ have investigatedthe relationship between the controllability and the length ofstimulus onset asynchrony (SOA).
In the past research, Struber and Hermann [2002]reported the enhancement of P300-like peak for perceptualswitching, which was not triggered by their intention (pas-sive switching) by waveform analysis. Therefore, upon thepsychophysical knowledge about the dependency of con-trollability for SOA, we designed magnetoencephalogra-phy (MEG) experiments for answering the two questionsas follows: (1) Whether can we observe enhancement ofthe P300 component in the case of intentional perceptualswitching (active switching) in comparison to the casewhen switching does not occur too? (2) When comparingevoked components for active switching and also for passiveswitching directly does the intensity of P300 component orof any other component shows any significant difference?
We designed Experiments C and D to answer the firstquestion, and performed Experiment E to answer the sec-ond question. Their relations are summarized in Figure 1c.
In Experiment C, we measured neural activity by MEGin an experimental condition similar to Experiment A, andcompared the difference in neural activities when percep-tion was alternated and when it was not alternated, inwhich the SOA was tuned so that the success rate wasnearly 100%. In Experiment D, we compared the difference
Figure 1.
Time courses of stimuli for five independent experiments
(Experiments A–E). (a) Sequence of stimulus presentation in
one trial from the time course for the whole experiment is
enlarged. One trial was separated into four periods (cue, cover,
main, and answer periods). The lower right frame in (a) shows
the size of the dots. We presented one of six types of cue stim-
uli in the cue period for 700 ms around the fixation point. The
type of experiment (psychophysical experiment, EOG recording,
or MEG recording) is shown in the second row in (b). The
types of cue stimuli for Experiments A–E are shown in the third
row in (b). During the cover period, an occluder masked the
left or right dots and moved away gradually from the fixation
point to the outside of the six animation frames. In the sixth
and final frame of the cover period, the two dots were fully
exposed, and in the next frame, corresponding to the first ani-
mation frame of the main period, the occluder disappeared. We
refer to the timing of the alternation of the animation frame, in
which a pair of dots is presented, as the stimulus onset, and we
identify the time length of an animation frame in the cover pe-
riod and the main period as the stimulus onset asynchrony
(SOA). The numbers of the animation frames in the main peri-
ods are shown on the fourth row in (b), and the SOAs for the
six experiments are shown on the fifth row. Observers were
requested to perform tasks in the main period according to the
cue and to respond normally by pressing a button during the an-
swer period. In the answer period, only the fixation cross was
shown for 1,000 ms. (c) The relationship between three MEG
experiments and a previous work by Struber and Hermann.
Here, we categorized them for four categories by whether the
perceptual switches were triggered by intention or not, and by
whether perception was changed or not.
r Intentional Control of Perceptual Switching r
r 399 r
in neural activities when the observers succeeded inswitching the direction of the perceived motion and whenthey missed for the same stimulus, in which the SOA wastuned so that the success rate was 50%. In Experiment E,we compared the neural activity evoked when observersintended to switch their perceived motion with the neuralactivity occurring when the perceived motion was switchedspontaneously, in which the success rate was nearly 100%.
These MEG measurements showed that: (1) the enhance-ment of P300 component can be observed in the case ofactive switching in comparison with the case when switch-ing does not occur too (Experiments C and D) and (2) thelatency of the evoked component showed a clear differ-ence between active switching and passive switching,which was much earlier than 300 ms and the spatial mapof the component was clearly different from that of the300 ms component (Experiment E).
MATERIALS AND METHODS
Observers
Ten healthy right-handed men (aged 23–31 years; mean25.7, standard deviation 2.2) participated in the experi-ments after giving informed consent. All observers per-formed five experiments (one task per day), and theypracticed each individual task for about 15 min just beforeeach experiment. The time length of each task was about20–40 min, and we divided them into sessions of 10 min each.
Visual Stimuli
We used a digital light processing projector (V-1100Z;PLUS, Tokyo, Japan) to project visual stimuli onto a trans-lucent screen (visual angle: 30� � 40�). Figure 1a showsthe time course of the stimulus presentation. One trial con-sisted of four periods: cue, cover, main, and answer peri-ods. A fixation cross (luminance: 60 cd/m2, visual angle:3.0�) was shown at the center of the screen (Fig. 1a). Thelength of the cue period was 700 ms. We presented one ofsix cue stimuli near the fixation cross. For the cover andmain periods, two white dots (luminance: 60 cd/m2, diam-eter: 3.0�) were presented diagonally, with respect to thefixation point in each animation frame, on a black back-ground. We fixed the spacing between the centers of thetwo vertical dots at 6.0� (Fig. 1a). In addition to the twodots, we presented an occluder during the cue period. Theoccluder hides the left or right dot in the animation frameat the beginning of the period (Fig. 1a). After that, itmoves away from the fixation cross gradually, within sixanimation frames. At the last of six frames, both dotsappeared, and in the next frame the occluder disappeared.We told observers that the subsequent animation framemarked the beginning of the main period. During this pe-riod, it was necessary to unambiguously define thesequence and timings of perceptual switching for specific
motion patterns. Therefore, the existence of the cue periodwas essential [Rose and Buchel, 2005; Yantis and Nakama,1998]. As such, we provided the cover period to limit thedirection of the perceived motion to a vertical one at thebeginning of the main period. In this report, we refer tothe timings of the alternation between animation frames asstimulus onsets (Fig. 1a). We then called the duration ofan animation frame in the cover and main periods theSOA. Although we changed the SOA for each task, itstayed the same in the cover and main periods (Fig. 1b).We performed five experiments (Experiments A–E). In themain period of Experiments A–C, D, and E, we presented5, 3, and 32 animation frames, respectively (Fig. 1b).
Task Design
The aim of Experiment A was to demonstrate the psy-chophysical phenomenon of intentional switching. InExperiment B, we performed EOG recordings to showwhether or not intentional switching requires eye move-ment. In Experiments C–E, we performed MEG recordingswhile observers performed an expanded version of thetask to identify neural processes underlying this cognitivefunction. In Experiment C, the task for observers was tocontrol the sequence of apparent motions, consisting offive horizontal or vertical motions. In Experiment D, weobserved differences in neural activity between when theperceived motion was switched (vertical to horizontal orhorizontal to vertical) and it when it was not switched(vertical to vertical or horizontal to horizontal). In Experi-ment E, we measured the difference in neural activitybetween active and passive switching.
The more detailed description of these six experimentsis as follows. As shown in the ‘‘Introduction’’ section,Experiments A–C are almost same except to the selectionof SOA. In the three experiments, the cue stimuli indicatedthe sequence of (vertical or horizontal) motion, whichobservers had to try to perceive during the main period(Fig. 1b). The six types of cue stimuli, labeled as (c1), (c2),(c3), (c4), (c5), and (c6), indicated vertical motion, horizon-tal motion, clockwise and counterclockwise rotations, acombination of two lower-left L-shaped motions and anupper-right inverted L-shaped motion, and a left-rightreversed combination, respectively. Please refer to Figure4a for clarification, noting that it is just a specific case inwhich the number of animation frames is 5. In Experi-ments A–C, we instructed observers to push the buttonunder their forefinger when they succeeded in perfectlycontrolling vertical/horizontal directions of motion per-ceived at four stimulus onsets, and to push the buttonunder their middle finger when they failed even once.Then, we defined the controllable ratio (%) as the ratio oftrials in which the observers pushed the button undertheir forefinger to the total number of trials.
In Experiment A, to investigate the dependence of con-trollability on the SOA, we changed the duration of the
r Shimono et al. r
r 400 r

animation frames in the cover and main periods, usingSOAs of 100, 200, 250, 300, 400, and 500 ms. These six pa-rameters were selected by preliminary psychophysicalexperiments of three observers with wider ranges of SOA.We focused on the time range because the controllablerate was changed within these SOAs. Experiments forthese SOAs were performed within individual sessions,and the sessions for six SOAs were rearranged in differentorders for each of the 10 observers. Each observer per-formed 20 trials for each SOA condition.
In Experiments B and C, we focused on the cases inwhich observers could totally control their perception. InExperiment B for EOG recordings, the SOA is 500 ms, andin Experiment C for MEG recordings, the SOAs are 500and 700 ms (Fig. 1b).
In Experiment D, we used only (c1), and we requestedthe observers to always switch their perceived motionfrom the vertical to the horizontal direction. The numberof frames in the main period was limited to three and thetype of cue stimuli to the horizontal motion only (Fig. 1b)because the time length of one frame (�275 ms) was shortand we were unable to distinguish some component laterthan 275 ms of the second stimulus onset from an earlycomponent of the next stimulus onset. Observers noticedthe disappearance of the occluder in the first frame and per-ceived vertical motion once at the onset of the next frame.
Then, they tried to switch the perceived motion fromvertical to horizontal at the onset of the third frame. TheSOA was set to a threshold value at which the controllabil-ity was 50% for each observer.
In 300 trials, observers were requested to press the but-ton under their right forefinger in the answer period whenthey succeeded in switching the motion direction or thebutton under their middle finger when they did not. Then,we observed the difference in neural activity betweenwhen they succeeded in switching the direction of the per-ceived motion and when they failed. The analytical methodwill be explained in the ‘‘MEG Data Analysis’’ section.
In Experiment E, we used (c1) and (c2) as the cue stim-uli. In this experiment, (c1) indicated an intentionalswitching task where observers showed intent to switchthe perceived motion, and (c2) indicated a passive switch-ing task where observers simply looked at the fixationpoint and waited for the event in which the perceivedmotion changed direction. Here, we needed to enable pas-sive switching during the limited stimulus frames in themain period. Therefore, we performed additional psycho-physical experiment for selecting the optimal horizontaldistance between dots for each observer because theshorter distance facilitate passive switching from verticalto horizontal motion [Green, 1986]. Observers performingboth tasks were requested to press a button under theirright forefinger in the next animation frame after theywere aware of perceptual switching.
For the optimal horizontal distance, we compared theneural activity evoked when observers intended to switchtheir perceived motion with the neural activity occurring
when the perceived motion was switched. Each observerperformed 100 trials; comprising 50 active switching trialsand 50 passive-switching trials. In the cue period, the stim-uli were presented in random order. Thirty-two framestimuli were presented in the main period, when the SOAwas 500 ms (Fig. 1b). It should be noted that although theterms used to refer to the cue stimuli in Experiment E arethe same as (c2) in Experiments A–C, the meaning is quitedifferent (Fig. 1b).
Among all experiments, observers performed tasks inthe main period according to the cue and responded bypressing a button during the answer period. The timelength of the answer period was 1.0 s. In the training pre-ceding the experiment, we instructed the observers tocease all body movements to reduce potential MEG arti-facts that could occur during the main period. Note that inExperiment E, we requested that the observers not wait topress the button until the start of the answer period, butrather to do at the animation frame after the next onewhen the direction of perceived motion switched. Whenthe button was pressed, the stimuli were shifted from themain period to the answer period. The reason for thisrequest was to maximize the number of trials by reducingthe time length for the remaining part. However, in Experi-ment E, observers did not need to respond to any questionsduring the answer period, and we permitted blinking orminimal body movement only, to avoid MEG artifacts.
MEG Recording
Brain magnetic fields (MFs) were recorded by a whole-head MEG system comprised of 440 gradiometers(PQ2440R, Yokogawa, Tokyo, Japan) and located in a mag-netically shielded room. The superconducting quantum in-terference device (SQUID) gradiometers of our MEGsystem consisted of 300 axial gradiometers (dBz/dz) and 70� 2 planar gradiometers (dBx/dz, dBy/dz). The samplingfrequency of the MEG system was 400 Hz, and the signalswere band-pass filtered between 0.03 and 200 Hz. Here,the second Butterworth band-pass filter [6.0 (db/oct)] wasused, and the edges of frequency band were defined as 3.0db roll off points. We analyzed trials after artifact rejec-tion. MEG signals in the frontal sensor that exceeded theprescribed amplitude [>2.0 (pT)] in the main periods wererejected automatically, on the assumption that they wereproduced by blinking. We neglected the sensors in the lat-eral, temporal, or occipital regions if their activityexceeded the same threshold, because SQUID sensors canbe unstable and noisy. However, there were few sensorsin these locations.
For achieving good synchrony between visual stimulusand MEG recording, a white square was presented at oneof two lower corners of the screen by a photoprojector.The square was identified by one of two photodetectorsand the signal was recorded simultaneously with the MEGrecording system.
r Intentional Control of Perceptual Switching r
r 401 r
Eye Movement Recording
Eye movement was recorded by electrooculography(EOG) (MME-3116, Nihon Kohoden, Japan). We positionedfour electrodes above the left and right eyebrows andunder the left and right lower orbitals to record both verti-cal eye movements, and we placed four different electro-des at the nasal and temporal canthal regions of the leftand right eyes to record both horizontal eye movements.The sampling frequency was 120 Hz, and the signals wereband-pass filtered between 0.03 and 50 Hz. In previousresearch, Berea et al. [2002] reported that the EOG voltagewas proportional to the visual angle of eye movementwithin some proper region. Therefore, we calibrated theEOG voltage to the visual angle by measuring the EOGvoltages when observers saw the right/left or up/downedge of three sizes of stimuli alternatively (visual angle:3.0�, 4.5�, and 6.0�), and fitted one linear model by mini-mum square estimation for 50 samples per one visualangle. We determined that voltage 1.0 lV corresponds to0.06 visual angle (�). Then, we requested that the observerspractice minimizing their eye movements. The thresholdfor detecting eye movement was set to an EOG voltage of5.0 lV. From the linear relationship between the visualangle and the EOG voltage, we estimated that the visualangle corresponding with the voltage was 0.3�.
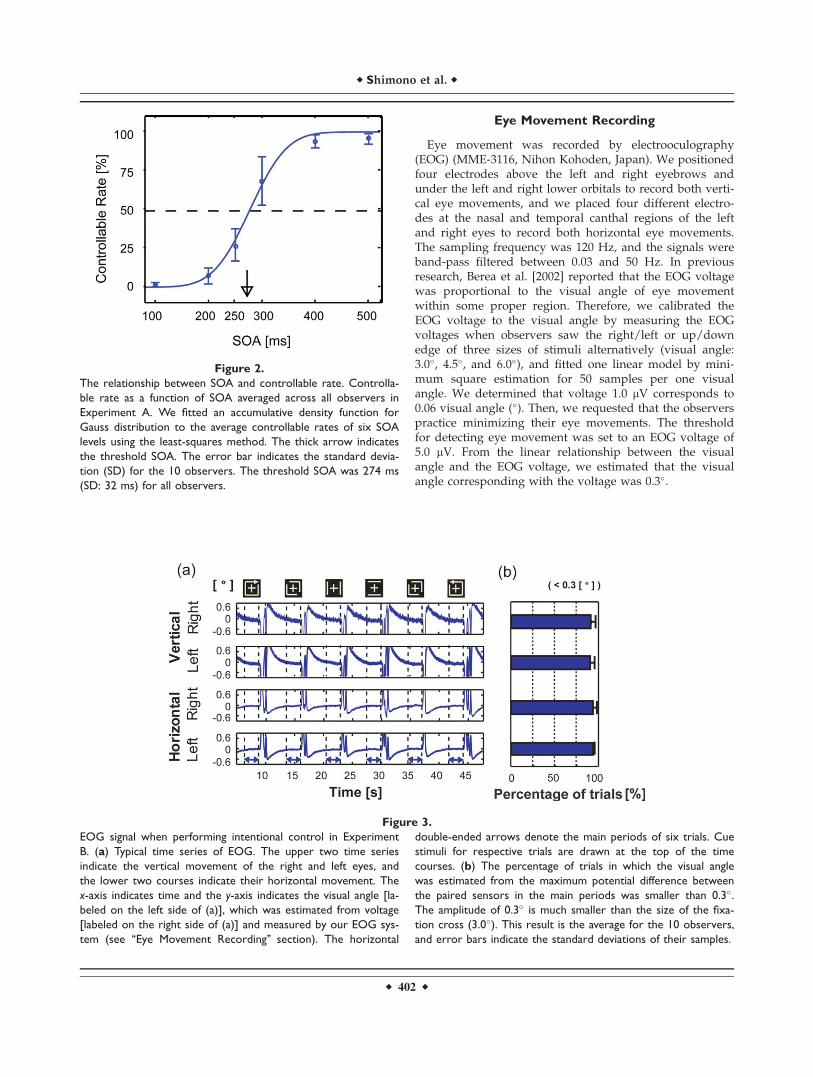
Figure 3.
EOG signal when performing intentional control in Experiment
B. (a) Typical time series of EOG. The upper two time series
indicate the vertical movement of the right and left eyes, and
the lower two courses indicate their horizontal movement. The
x-axis indicates time and the y-axis indicates the visual angle [la-
beled on the left side of (a)], which was estimated from voltage
[labeled on the right side of (a)] and measured by our EOG sys-
tem (see ‘‘Eye Movement Recording’’ section). The horizontal
double-ended arrows denote the main periods of six trials. Cue
stimuli for respective trials are drawn at the top of the time
courses. (b) The percentage of trials in which the visual angle
was estimated from the maximum potential difference between
the paired sensors in the main periods was smaller than 0.3�.The amplitude of 0.3� is much smaller than the size of the fixa-
tion cross (3.0�). This result is the average for the 10 observers,
and error bars indicate the standard deviations of their samples.
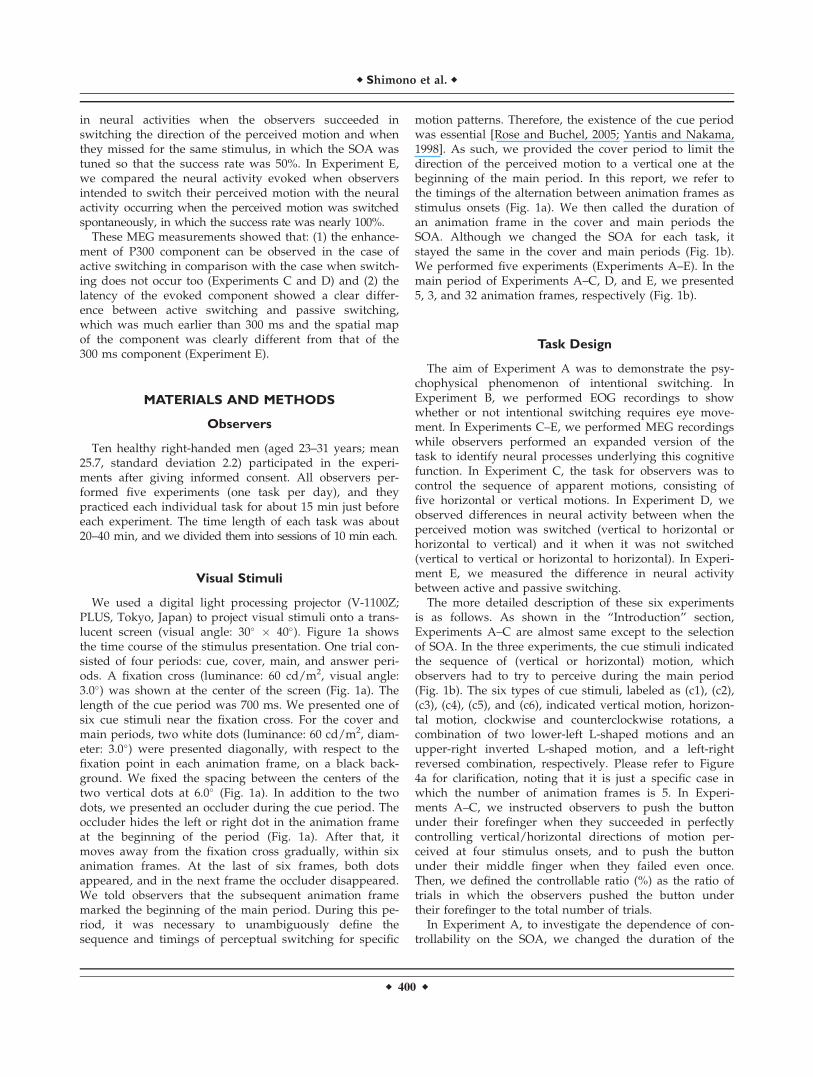
Figure 2.
The relationship between SOA and controllable rate. Controlla-
ble rate as a function of SOA averaged across all observers in
Experiment A. We fitted an accumulative density function for
Gauss distribution to the average controllable rates of six SOA
levels using the least-squares method. The thick arrow indicates
the threshold SOA. The error bar indicates the standard devia-
tion (SD) for the 10 observers. The threshold SOA was 274 ms
(SD: 32 ms) for all observers.
r Shimono et al. r
r 402 r

MEG Data Analysis
Here, we used the RMS value [Nakamura et al., 2003],which characterizes the intensity of neural activity. Here,N is 440, which corresponds to the number of all SQUIDsensors in our MEG system, and is the intensity of the MFmeasured with a kth SQUID sensor. We used the RMSvalue for three reasons: (1) During EEG recording, thehead position was spatially locked in the sensor position.However, the head position changed during MEG record-ings throughout the experiments. Therefore, spatial aver-aging of MEG signals is a reasonable for quantification. (2)When evaluating complex MF map patterns, the detectionof sensors at a spatial peak might be difficult. However,
we can use the RMS measure robustly for such cases. (3)In MF map patterns, we expect to observe a pair of posi-tive and negative peaks simultaneously for each currentdipole. Therefore, the sign does not contribute to the eval-uation of current intensity, and it is reasonable to evaluatethe absolute intensity of MFs by a square operation.
Although this analytical method has many good fea-tures, it is different from the waveform analysis commonlyused in the EEG research field. RMS analysis utilizes thespatially averaged intensity, whereas waveform analysisuses representative sensors. Therefore, we will not refer tothe 300 ms component reported in this report as P300m,but as a P300-like peak, in order to discriminate clearlybetween them [Struber and Hermann, 2002].
To increase the signal-to-noise ratio, the RMS valueswere band-pass filtered between 3.0 and 45 Hz. We con-ducted a two-tailed Wilcoxon Signed rank test of the 10sets of paired data from the 10 observers to test the differ-ences between RMS values under the two conditions foreach experiment. We determined that the two signals weresignificantly different when P < 0.01.
To estimate the location of cortical activities, dipole esti-mation with the equivalent current dipole (ECD) modelwere conducted on the MF. Three hundred axial z-sensor,70 of which were in vector sensors, were used for the anal-ysis. The following criteria were adopted for the accep-tance of the estimation: (1) the goodness of fit (GOF)should be above 85% and (2) the dipole should be in thecerebral cortex.
First, a one-dipole model was applied, and the dipolewas adopted if the aforementioned criteria were satisfied.
Figure 4.
Definition of ‘‘switching’’ and ‘‘nonswitching’’ and comparison of
MEG activity for both cases in Experiment C. (a) Schematic
illustration of the timings of perceptual switching at four stimulus
onsets in the main period for six different tasks indicated by the
respective cue stimuli. Here, we arranged five stimulus animation
frames horizontally in the time course and six cue stimuli vertically.
S stands for switching and indicates that observers were required
to switch their perceived motion from vertical (horizontal) to hori-
zontal (vertical). NS stands for nonswitching. For the six cued
motion patterns, the net number, S, was equal to NS. (b) Overall
average of RMS values before and after reversal of the onset of
stimuli. Here, the SOA was 500 ms. The blue solid line is the aver-
age for the switching ensemble; the red dotted line is the average
for the nonswitching ensemble. (c) The results of the statistical
test for the 10 pairs of RMS values. They are averages for each of
the 10 observers within switching and nonswitching ensembles
(two-tailed Wilcoxon Signed rank test). The blue solid line is the
time course of the P-value; the green long dashed-dotted line is
the significance level (P < 0.01). (d, e) Results where the SOA is
700 ms is shown. They correspond to (b) and (c) where the SOA
is 500 ms. Black thick arrows in (b) and (d) indicate the time la-
tency during which the two ensembles are significantly different.
Dashed-dotted lines in (b) and (d) indicate 275 ms.
r Intentional Control of Perceptual Switching r
r 403 r

When the criteria were not satisfied with one-dipolemodel, the two-dipole model was applied [Amano et al.,2005]. The estimated dipoles were superimposed on three-dimensional MR images of each observer. The head coor-dinate was defined as follows. The origin was defined asthe midpoint between the preauricular points. The positive
y-axis extended from the origin to the nasion. The positivey-axis extended from the origin to the left to be perpendic-ular to the x-axis on the plane made by the nasion andpreauricular points. The z-axis extended to the vertex in adirection perpendicular to the x–y plane. We used MAT-LAB (Cybernet Systems, USA) to analyze the data.
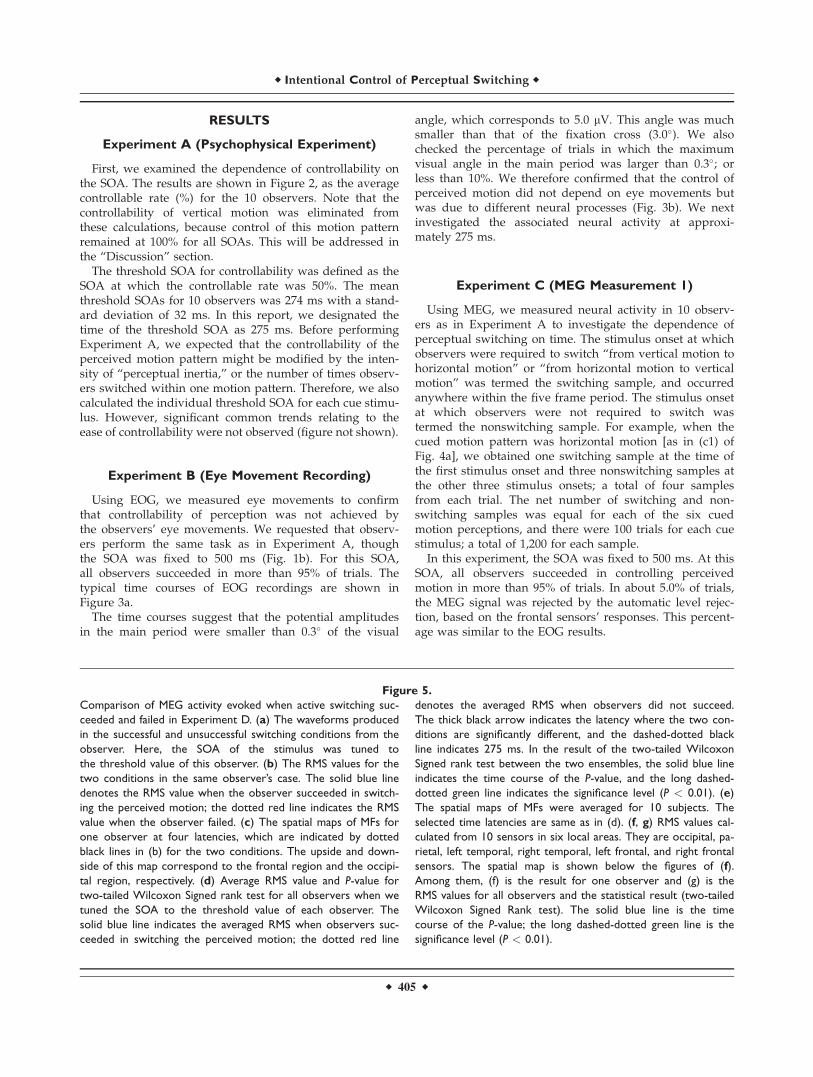
Figure 5.
r Shimono et al. r
r 404 r
RESULTS
Experiment A (Psychophysical Experiment)
First, we examined the dependence of controllability onthe SOA. The results are shown in Figure 2, as the averagecontrollable rate (%) for the 10 observers. Note that thecontrollability of vertical motion was eliminated fromthese calculations, because control of this motion patternremained at 100% for all SOAs. This will be addressed inthe ‘‘Discussion’’ section.
The threshold SOA for controllability was defined as theSOA at which the controllable rate was 50%. The meanthreshold SOAs for 10 observers was 274 ms with a stand-ard deviation of 32 ms. In this report, we designated thetime of the threshold SOA as 275 ms. Before performingExperiment A, we expected that the controllability of theperceived motion pattern might be modified by the inten-sity of ‘‘perceptual inertia,’’ or the number of times observ-ers switched within one motion pattern. Therefore, we alsocalculated the individual threshold SOA for each cue stimu-lus. However, significant common trends relating to theease of controllability were not observed (figure not shown).
Experiment B (Eye Movement Recording)
Using EOG, we measured eye movements to confirmthat controllability of perception was not achieved bythe observers’ eye movements. We requested that observ-ers perform the same task as in Experiment A, thoughthe SOA was fixed to 500 ms (Fig. 1b). For this SOA,all observers succeeded in more than 95% of trials. Thetypical time courses of EOG recordings are shown inFigure 3a.
The time courses suggest that the potential amplitudesin the main period were smaller than 0.3� of the visual
angle, which corresponds to 5.0 lV. This angle was muchsmaller than that of the fixation cross (3.0�). We alsochecked the percentage of trials in which the maximumvisual angle in the main period was larger than 0.3�; orless than 10%. We therefore confirmed that the control ofperceived motion did not depend on eye movements butwas due to different neural processes (Fig. 3b). We nextinvestigated the associated neural activity at approxi-mately 275 ms.
Experiment C (MEG Measurement 1)
Using MEG, we measured neural activity in 10 observ-ers as in Experiment A to investigate the dependence ofperceptual switching on time. The stimulus onset at whichobservers were required to switch ‘‘from vertical motion tohorizontal motion’’ or ‘‘from horizontal motion to verticalmotion’’ was termed the switching sample, and occurredanywhere within the five frame period. The stimulus onsetat which observers were not required to switch wastermed the nonswitching sample. For example, when thecued motion pattern was horizontal motion [as in (c1) ofFig. 4a], we obtained one switching sample at the time ofthe first stimulus onset and three nonswitching samples atthe other three stimulus onsets; a total of four samplesfrom each trial. The net number of switching and non-switching samples was equal for each of the six cuedmotion perceptions, and there were 100 trials for each cuestimulus; a total of 1,200 for each sample.
In this experiment, the SOA was fixed to 500 ms. At thisSOA, all observers succeeded in controlling perceivedmotion in more than 95% of trials. In about 5.0% of trials,the MEG signal was rejected by the automatic level rejec-tion, based on the frontal sensors’ responses. This percent-age was similar to the EOG results.
Figure 5.
Comparison of MEG activity evoked when active switching suc-
ceeded and failed in Experiment D. (a) The waveforms produced
in the successful and unsuccessful switching conditions from the
observer. Here, the SOA of the stimulus was tuned to
the threshold value of this observer. (b) The RMS values for the
two conditions in the same observer’s case. The solid blue line
denotes the RMS value when the observer succeeded in switch-
ing the perceived motion; the dotted red line indicates the RMS
value when the observer failed. (c) The spatial maps of MFs for
one observer at four latencies, which are indicated by dotted
black lines in (b) for the two conditions. The upside and down-
side of this map correspond to the frontal region and the occipi-
tal region, respectively. (d) Average RMS value and P-value for
two-tailed Wilcoxon Signed rank test for all observers when we
tuned the SOA to the threshold value of each observer. The
solid blue line indicates the averaged RMS when observers suc-
ceeded in switching the perceived motion; the dotted red line
denotes the averaged RMS when observers did not succeed.
The thick black arrow indicates the latency where the two con-
ditions are significantly different, and the dashed-dotted black
line indicates 275 ms. In the result of the two-tailed Wilcoxon
Signed rank test between the two ensembles, the solid blue line
indicates the time course of the P-value, and the long dashed-
dotted green line indicates the significance level (P < 0.01). (e)
The spatial maps of MFs were averaged for 10 subjects. The
selected time latencies are same as in (d). (f, g) RMS values cal-
culated from 10 sensors in six local areas. They are occipital, pa-
rietal, left temporal, right temporal, left frontal, and right frontal
sensors. The spatial map is shown below the figures of (f).
Among them, (f) is the result for one observer and (g) is the
RMS values for all observers and the statistical result (two-tailed
Wilcoxon Signed Rank test). The solid blue line is the time
course of the P-value; the long dashed-dotted green line is the
significance level (P < 0.01).
r Intentional Control of Perceptual Switching r
r 405 r

We compared the MF RMS values from all the SQUIDsensors for successful and nonrejected trials to the aver-aged RMS values for switching and nonswitching samplesat �500 and 500 ms of their stimulus onsets (Fig. 4b). Fig-ure 4c shows the results for the two-tailed WilcoxonSigned rank test for 10 pairs of averaged RMS valuesacross 10 observers. A prominent difference was foundapproximately 300 ms after the stimulus onset, when per-ceptual switching was required (P < 0.01).
Two questions remained: (1) was the significant differ-ence at approximately 300 ms a spurious result? If not,(2) was the evoked activity locked at 300 ms after thestimulus onset or to 200 ms before the next stimulusonset? To answer these questions, we performed MEGmeasurements for all observers at an SOA of 700 ms.We were able to identify a significant difference in RMSvalue at 300 ms after the stimulus onset (Fig. 4d,e).These results confirmed that the latency period was re-producible and the neural activity associated with per-ceptual switching determined that the cued motion wastime-locked to the stimulus onset, when the perceivedmotion was switched. The latency after stimulus onsetwas 300 ms.
Experiment D (MEG Measurement 2)
In Experiment C, it was not clear whether observersheld the perceived motion via top–down attention orthey did not display attentional bias, during the non-switching times. To address the question, at the SOAthreshold value where controllability was 50% for eachobserver, we compared neural activities when they suc-ceeded in switching the direction of perceived motion,to when they did not.
The number of frames in the main period was limitedto three and the types of cue stimuli to the horizontalmotion only (Fig. 1b). We then compared the MFaround the onset of the third frame when they suc-ceeded in switching, and when they did not. Figure 5a–cshows results from one observer. In this experiment, thepercentage of trials rejected was about 5%. We con-firmed that when observers succeeded, the 300 ms peakwas observed in both the waveform and in the RMSvalue of each SQUID sensor (Fig. 5a,b). Furthermore, theMF map before and after 275 ms showed characteristicdifferences; the earlier components were limited to theoccipital region, but a strong response at 296 ms wasobserved in the global map pattern around the frontalregion (Fig. 5c). From the average RMS value for allobservers, we were also able to detect a prominent 300ms peak when observers succeeded in switching per-ceived motion, and this component was common to allobservers (P < 0.01) (Fig. 5d,e). Figure 5e shows themap of the overall averaged result for 10 observers.
Furthermore, we performed two analyses to identify therelated brain regions; they were (1) RMS analysis for 10
sensors around frontal, right or left temporal, occipital,and parietal regions, and (2) the neural estimation at timepoints when the MF showed typical peaks.
The RMS values for the limited sensors are shown inFigure 5f,g. Among them, Figure 5f indicate the results forone observer, and Figure 5g indicate results averagedacross all observers. The P-values for all observers areshown under the RMS values in Figure 5g. From the resultof statistical tests, we found a significant increase in RMSvalue for the success group near the frontal region at 300ms. Furthermore, a decrease in the occipital region wasalso observed at this time.
The aforementioned results are similar to the results ofExperiment C. The evoked component at 300 ms shouldnot correlate with the observers’ intention to switch orhold perception, but only with the switching of perceivedmotion. At the same time, we observed that the waveformresponse of the sensor was located on the peak of the MFmap pattern. This suggested that the component associateswith P300m [Struber and Hermann, 2002]. The 300 mscomponent for a stimulus onset could also be interpretedas �25 ms difference in the component after the followingstimulus onset. Thus, we stopped the stimulus just after
Figure 6.
The equivalent current source estimated for one observer.
Here, we show the results when typical peaks were observed;
they are the results of the succeeded (controllable) and the
failed (uncontrollable) case at 132 ms (early component) and the
succeeded case at 296 ms (M300 component). In one observer,
the estimated equivalent current dipole (ECD) values were one
at 132 ms and two at 296 ms.
r Shimono et al. r
r 406 r
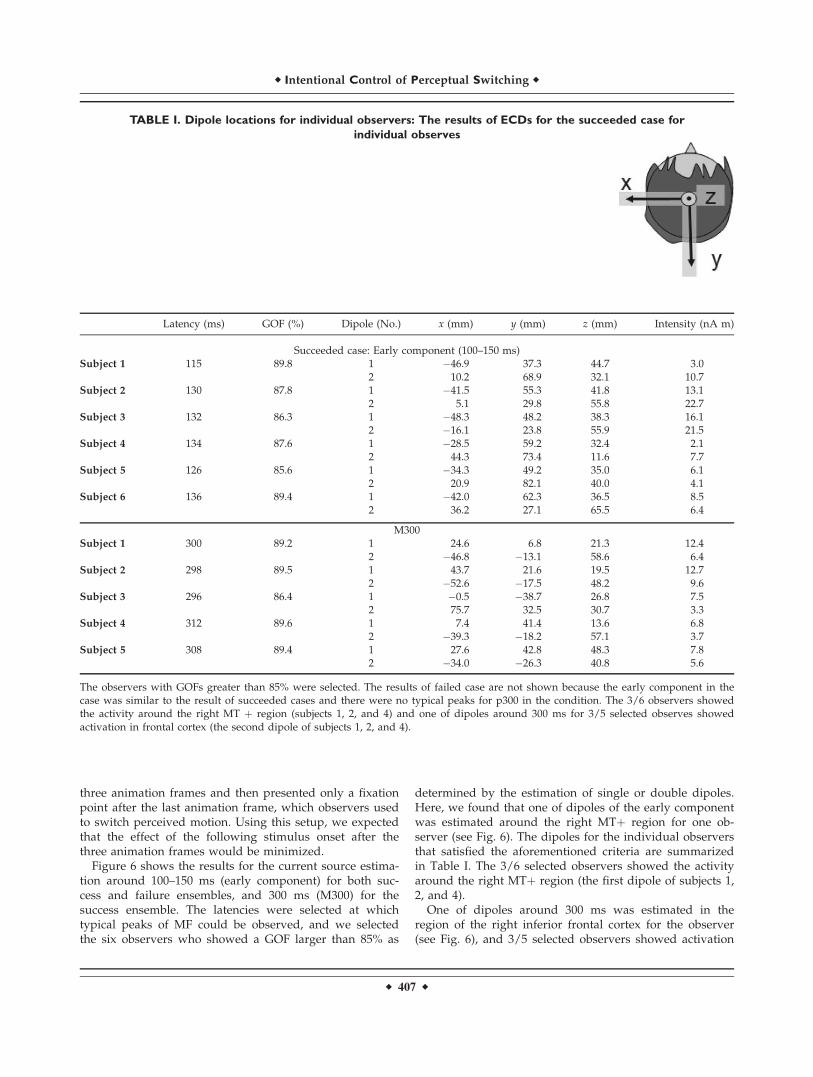
three animation frames and then presented only a fixationpoint after the last animation frame, which observers usedto switch perceived motion. Using this setup, we expectedthat the effect of the following stimulus onset after thethree animation frames would be minimized.
Figure 6 shows the results for the current source estima-tion around 100–150 ms (early component) for both suc-cess and failure ensembles, and 300 ms (M300) for thesuccess ensemble. The latencies were selected at whichtypical peaks of MF could be observed, and we selectedthe six observers who showed a GOF larger than 85% as
determined by the estimation of single or double dipoles.Here, we found that one of dipoles of the early componentwas estimated around the right MTþ region for one ob-server (see Fig. 6). The dipoles for the individual observersthat satisfied the aforementioned criteria are summarizedin Table I. The 3/6 selected observers showed the activityaround the right MTþ region (the first dipole of subjects 1,2, and 4).
One of dipoles around 300 ms was estimated in theregion of the right inferior frontal cortex for the observer(see Fig. 6), and 3/5 selected observers showed activation
TABLE I. Dipole locations for individual observers: The results of ECDs for the succeeded case for
individual observes
Latency (ms) GOF (%) Dipole (No.) x (mm) y (mm) z (mm) Intensity (nA m)
Succeeded case: Early component (100–150 ms)Subject 1 115 89.8 1 �46.9 37.3 44.7 3.0
2 10.2 68.9 32.1 10.7Subject 2 130 87.8 1 �41.5 55.3 41.8 13.1
2 5.1 29.8 55.8 22.7Subject 3 132 86.3 1 �48.3 48.2 38.3 16.1
2 �16.1 23.8 55.9 21.5Subject 4 134 87.6 1 �28.5 59.2 32.4 2.1
2 44.3 73.4 11.6 7.7Subject 5 126 85.6 1 �34.3 49.2 35.0 6.1
2 20.9 82.1 40.0 4.1Subject 6 136 89.4 1 �42.0 62.3 36.5 8.5
2 36.2 27.1 65.5 6.4
M300Subject 1 300 89.2 1 24.6 6.8 21.3 12.4
2 �46.8 �13.1 58.6 6.4Subject 2 298 89.5 1 43.7 21.6 19.5 12.7
2 �52.6 �17.5 48.2 9.6Subject 3 296 86.4 1 �0.5 �38.7 26.8 7.5
2 75.7 32.5 30.7 3.3Subject 4 312 89.6 1 7.4 41.4 13.6 6.8
2 �39.3 �18.2 57.1 3.7Subject 5 308 89.4 1 27.6 42.8 48.3 7.8
2 �34.0 �26.3 40.8 5.6
The observers with GOFs greater than 85% were selected. The results of failed case are not shown because the early component in thecase was similar to the result of succeeded cases and there were no typical peaks for p300 in the condition. The 3/6 observers showedthe activity around the right MT þ region (subjects 1, 2, and 4) and one of dipoles around 300 ms for 3/5 selected observes showedactivation in frontal cortex (the second dipole of subjects 1, 2, and 4).
r Intentional Control of Perceptual Switching r
r 407 r

in frontal cortex (Table I, the second dipole of subjects 1,2, and 4).
Experiment E (MEG Measurement 3)
Next, we compared the neural activity evoked whenobservers intended to switch their perceived motion with
the neural activity occurring when the perceived motionwas switched unwittingly, i.e., active versus passiveswitching. Then, we needed to enable passive switchingduring the limited stimulus frames in the main period.Therefore, we conducted a psychophysical experiment tochoose an optimal horizontal distance for each observer,and analyzed the relationship between the vertical-to-hor-izontal ratio and the time that was required to switch the
Figure 7.
r Shimono et al. r
r 408 r

direction of perceived motion (Fig. 7a). Here, the dura-tion time was defined as the interval between the timewhen an occluder disappeared and that when the ob-server pressed the button. We chose an optimal ratio foreach observer from among five ratios of the horizontaldistance to the vertical height (vertical-to-horizontal ra-tio): 1, 7/8, 3/4, 5/8, and 1/2. The optimal ratio wasidentified as the ratio that satisfied two conditions: (1)passive switching occurred much later than active switch-ing and (2) more than 90% of trials in the passive switch-ing task occurred within the main period. For example,we used 5/8 as the distance of the stimulus for theobserver shown in Figure 7a. We hoped to distinguishcorrectly between passive and active switching based oncue stimuli only. Observers then did not need to changethe button for active switching versus passive switching.We expected that neural activity related to finger move-ment, would not be found in the difference between theMEG signal obtained during the active switching taskand that obtained during the passive switching task,because the observers’ reaction time for the conditionswere nearly same (�350 ms).
We next measured neural activity with MEG whenobservers performed the same task for the stimulus of cho-sen distance. There were 200 trials for all observers, com-prising 100 active switching trials and 100 passiveswitching trials. The percentage of trials in which theMEG signal was rejected by the automatic level rejectionwas �5%.
The results of one observer are shown in Figure 7b–d. We
observed significant differences at 30–40 ms and 240–250 ms
in the waveforms and in RMS values. These latencies are
clearly different from the results in Experiments D and E.
Furthermore, we observed that the results at 240–250 ms dif-
fered significantly, not only in the strength of the MFs but
also in the map patterns (Fig. 7d). For example, the promi-
nent MF pattern at the latency that spread from the occipital
region to the parietal region during active switching was
clearly different from the pattern observed during passive
switching. At the same time, the map pattern at 240 ms in
active switching also differed from the map pattern at 296
Figure 7.
Comparison of MEG activity evoked by active and passive
switching in Experiment E. (a) Relationship between the vertical-
to-horizontal ratio of the stimulus size and the duration time of
the perception of the initial vertical motion for one observer
(solid blue line: average duration time for active switching en-
semble; dotted red line: average duration time for passive
switching ensemble). Here, the error bar indicates the standard
deviation for each vertical-to-horizontal ratio. (b) A pair of the
MEG waveforms with all 440 SQUID sensors for one observer
when the observer actively switched the perceived motion and
when the perceived switching occurred passively. (c) The RMS
values of all sensors for the active and passive switches (solid
blue line: the active switch; dotted red line: the passive switch).
(d) The MF maps at four latencies, which are expressed as dot-
ted lines in (c). Two double-ended arrows express the latencies
when a significant difference in RMS values was commonly
observed for all observers. The upside and downside of this
map correspond to the frontal region and the occipital region,
respectively. (e) Average RMS values after stimulus onset for all
observers (solid blue line: average RMS values for active switch-
ing ensemble; dotted red line: average RMS values for passive
switching ensemble), and results of the two-tailed Wilcoxon
Signed rank test between the two ensembles [solid blue line:
time course of P-value; dashed-dotted green line: significance
level (P < 0.01)]. In the figure of the average RMS value, the
dashed-dotted line indicates 275 ms. Two thick arrows indicate
the latencies at which a significant difference was observed
between the two ensembles. (f) The MF maps at four latencies
which are expressed dotted lines in (e). The figures in (g) are
the RMS values of one observer for the 10 sensors of local
regions. The figures in (h) are ones of the average for all
observers. The spatial map is shown below the figures of (g).
Figure 8.
Equivalent current sources estimated for one observer. The
latencies were selected when a significant peak was observed.
At 115 ms (the early component), we observed a typical peak
for active and passive conditions. The two ECDs were estimated
near right MTþ region and near left V1/V2 region. Furthermore,
the two ECDs at 240 ms was estimated in the vicinity of the
right parietal region and left temporal region.
r Intentional Control of Perceptual Switching r
r 409 r

ms in Experiment E, which produced an observable peak
near the frontal area (Figs. 5c and 7d).We also compared the average RMS value for 10 observ-
ers around the stimulus onset when perception alternatedand observed the results for two-tailed Wilcoxon Signedrank test for the 10 pairs of RMS values (Fig. 7e). Weobserved significant differences at 30–40 ms and 240–250ms and confirmed that these components were common toeach observer. Furthermore, we observed the map patternshown in Figure 7f for all observers, which exhibited prop-erties of the observer.
For identifying the detailed brain regions involved: (1)we calculated the RMS values for 10 sensors placed at five
local regions and (2) estimated the ECDs at time points oftypical peaks.
Figure 7g indicates the RMS values for one observer,Figure 7h is the average and the results of statistical testfor all observers.
The results of statistical tests indicated that the occipitalsensors showed that the significant peak occurred duringactive switching. The latency was very close to the resultin the analysis of all sensors.
Figure 8 shows current source estimation results for theobserver at latencies when a distinct peak was observed.Table II shows the estimated positions of the dipoles forall observers in the active condition. Here, we show the
TABLE II. Dipole location for individual observers: The location of ECDs for individual observers
Latency (ms) GOF (%) Dipole (No.) x (mm) y (mm) z (mm) Intensity (nA m)
Active condition: Early component (100–150 ms)Subject 1 115 89.8 1 �46.9 37.3 44.7 3.0
2 10.2 68.9 32.1 10.7Subject 2 130 87.8 1 �41.5 55.3 41.8 13.1
2 5.1 29.8 55.8 22.7Subject 3 132 86.3 1 �48.3 48.2 38.3 16.1
2 �16.1 23.8 55.9 21.5Subject 4 134 87.6 1 �28.5 59.2 32.4 2.1
2 44.3 73.4 11.6 7.7Subject 5 126 85.6 1 �34.3 49.2 35.0 6.1
2 20.9 82.1 40.0 4.1Subject 6 136 89.4 1 �42.0 60.3 36.5 8.5
2 36.2 27.1 65.6 6.4
M250Subject 1 240 90.0 1 �12.6 46.4 78.9 6.4
2 46.4 2.3 59.0 4.4Subject 2 268 85.7 1 �15.3 33.9 67.7 16.8
2 �27.0 25.7 56.3 13.6Subject 3 234 89.6 1 6.6 43.0 77.1 4.4
2 0.8 39.1 62.4 26.5Subject 4 254 87.4 1 0.4 17.6 56.2 20.4
2 �15.0 49.3 1.7 8.6Subject 5 248 88.3 1 51.3 37.1 71.3 15.6Subject 6 238 87.9 1 64.4 4.5 84.7 9.8
2 41.8 10.5 29.6 14.9
Here, we limit the result for the active condition, and the GOF is larger than 85%. The early component for was estimated near a MTþregion for observers 1–5. Furthermore, one of the ECDs near 250 ms was observed in parietal region for observers 1–4.
r Shimono et al. r
r 410 r

results for observers whose GOF was larger than 85% forthe dipole estimation with one or two dipoles.
In the observer, the two ECDs at 100–150 ms (early com-ponent) of active and passive cases were observed aroundright MTþ region and around a V1/V2 region, and theECD of 240 ms of the active case was observed in parietaland left lateral regions (see Fig. 8).
By observing the ECD of the other observers, one of theECDs of the early components were observed around rightMTþ region for 5/6 of the shown observers (Table II, the firstdipoles for observers 1–5), and one of the ECDs of a peakaround the 250 ms was observed in parietal region for 4/6 ofthe observers (Table II, the first dipoles for observer 1–4).
DISCUSSION
Our study provides the clear evidence that the controll-ability of active switching depends strongly on the stimu-lus SOA. Experiment A demonstrated that as thepresentation time got shorter, the ratio of controllable trialsalso became smaller. When the ratio was 50%, the SOAwas approximately 275 ms. Furthermore, we could notdetect specific eye movements while the 10 trained observ-ers controlled their perceived motion (in Experiment B).The results suggested that the controllability is achievedby pure neural processes, and measurements of the neuralactivity became intrinsic for understanding the psycho-physical phenomenon.
As shown in the ‘‘Introduction’’ section, the main issueswere as follows: (1) Whether can we observe enhancementof the P300 component in the case of intentional percep-tual switching (active switching) in comparison to the casewhen switching does not occur too? (2) When comparingevoked components for active switching and also for pas-sive switching directly does the intensity of P300 compo-nent or of any other component shows any significantdifference?
To answer the questions, we designed three experimentsby changing the SOAs, the numbers of animation framesand the task. Figure 1c shows the relation of our MEGrecording experiments (Experiments C–E) and the referredpast research [Struber and Herrmann, 2002].
Experiment C revealed that the 300 ms componentincreased significantly when perceptual switching wasrequired, relative to when it was not. In this experiment, theSOA was much longer than 275 ms (i.e., 500 and 700 ms). InExperiment D, we could also detect the apparent differencein neural activity when perceptual switching was possibleand when it was impossible, for stimuli with a thresholdSOA of 300 ms. Recently, the results of Experiments C andD revealed a common, prominent modulation of the P300-like peak not only in the case of passive switching of per-ceived motion, but also in the case of intentional switching.In our result, the MF pattern for the 300 ms componentshowed global activity, which was highest at the frontal sen-sors. Furthermore, one of the equivalent current sources of
the 300 ms component was often estimated near the rightprefrontal cortex. Windmann et al. [2006] investigated per-ceptual reversals in patients with circumscribed lesions ofthe prefrontal cortex and reported that the prefrontal cortexis necessary for creating bias in the selection of visual repre-sentations. In fMRI research, Sterzer and Kleinschmidt[2006] showed that right inferior frontal region was acti-vated to the rivalry of perception for DDQ in their fMRIresearch. As the answer for the question (1), these resultsensured that the enhancement of P300 component can beobserved in the case of active switching.
In Experiment E, we observed significant differences inneural activity at 240–250 ms between active and passiveswitching conditions. One of the current sources of the com-ponent was often estimated in parietal region. Slotnick andYantis [2005] reported that a common activity between theattention bias effect and perceptual switching was observedin the region of the posterior parietal cortex. They are in ac-cordance with our results. The MEG measurements showedthat the component enhanced by the difference betweenactive switching and passive switching was not 300 ms, andthe spatial map seems to be different from it of P300 compo-nent. It is the answer for the question (2).
Additionally, there were some early components Theequivalent current source on 100–150 ms componentshowed trivial result; It was commonly estimated aroundMTþ. Previous research on neural activity relating to per-ceptual switching for DDQ has also discussed the impor-tance of the MTþ region [Sterzer et al., 2003]. Althoughwe observed significant differences in intensity at 30–40ms between active switching and passive switching. Thecurrent source estimation for the component was difficultbecause of the low SN ratio in this research. However,Inui and Kakigi [2006] reported that MEG can also recordsuch early components. Therefore, further analyses of theearly component, based on a good noise reduction tech-nique, might be meaningful to clarify the specific neuralmechanisms.
In conclusion, our results suggest that controllabilityof active switching following the DDQ stimulus clearlydepends on the SOA, and the SOA level at 50% con-trollability for perceptual switching (275 ms). By usingthe psychophysical property, we introduced a new ex-perimental design for observing neural processes repre-senting intentional control of perceptual switching(active switching).
In the time parameter 250–300 ms, there seems to be amissing link between the psychophysical property and theneural process. This might become an important remark infuture works.
ACKNOWLEDGMENTS
The authors are grateful to Drs. Eugenio Rodriguez,Sam M. Doesburg, Takashi Owaki, and Tsutomu Muratafor their productive discussions.
r 411 r
r Intentional Control of Perceptual Switching r

REFERENCES
Amano K, Kuriki I, Takeda T (2005): Direction-specific adaptationof magnetic responses to motion onset. Vision Res 45:2533–2548.
Berea R, Boquete L, Mazo M (2002): System for assisted mobilityusing eye movements based on electrooculography. IEEETrans Neural Syst Rehab Eng 10:209–218.
Green M (1986): What determines correspondence strength inapparent motion? Vision Res 26:599–607.
Inui K, Kakigi R (2006): Temporal analysis of the flow from V1to the extrastriate cortex in houmas. J Neurophysiol 96:775–784.
Kohler A, Haddad L, Singer W, Muckli L (2008): Deciding whatto see: The role of intention and attention in the perception ofapparent motion. Vision Res 48:1096–1106.
Leopold DA, Logothetis NK (1999): Multistable phenomenachanging views in perception. Trends Cogn Sci 3:254–264.
Maloney LT, Dal Martello MF, Spillmann L (2005): Past trialsinfluence perception of ambiguous motion quartets throughpattern completion. Proc Natl Acad Sci USA 102:3164–3169.
Meng M, Tong F (2004): Can attention selectively bias bistableperception? Differences between binocular rivalry and ambigu-ous figures. J Vision 4:539–551.
Merk I, Schnakenberg J (2002): A stochastic model of multistablevisual perception. Biol Cybern 86:111–116.
Nakamura H, Kashii S, Nagamine T, Matsui Y, Hashimoto T,Honda Y, Shibasaki H (2003): Human V5 demonstrated bymagnetoencephalography using random dot kinematogramsof different coherence levels. Neurosci Res 46:423–433.
Necker LA (1832): Observations on some remarkable optical phae-nomena seen in Switzerland; and on an optical phaenomenonwhich occurs on viewing a figure of a crystal or geometicalsolid. London Edinburgh Philos Mag J Sci 1:329–337.
Ramachandran VS, Antis SM (1983): Extrapolation of motion pathin human visual perception. Vision Res 23:83–85.
Rose M, Buchel C (2005): Neural coupling binds visual tokens tomoving stimuli. J Neurosci 25:10101–10104.
Rubin E (1958): Figure and ground. In: Beardslee DC and Wer-theimer M Eds., Readings in Perception, Princeton, NJ: VanNostrand, 194–203.
Slotnick SD, Yantis S (2005): Common neural substrates for thecontrol and effects of visual attention and perceptual bistabil-ity. Cogn Brain Res 24:97–108.
Sterzer P, Kleinschmidt A (2006): A neural basis for inference inperceptual ambiguity. Proc Natl Acad Sci USA 104:323–328.
Sterzer P, Hynes J-D, Rees G (2006): Primary visual cortex activa-tion on the path of apparent motion is mediated by feedbackfrom hMT/V5. NeuroImage 32:1308–1316.
Struber D, Herrmann CS (2002): MEG alpha activity decreasereflects destabilization of multistable percepts. Cogn Brain Res14:370–382.
Suzuki S, Peterson M (2000): Multiplicative effects of intention on theperception of bistable apparent motion. Psychol Sci 11:202–209.
Yantis S, Nakama T (1998): Visual interaxtions in the path ofapparent motion. Nature 1:508–512.
Windmann S, Wehrmann M, Calabrese P, Gunturkun O (2006):Role of the prefrontal cortex in attentional control over bistablevision. J Cogn Neurosci 18:456–471.
r 412 r
r Shimono et al. r