Bioinformatics analysis to screen and identify key biomarkers ...
20
Page 1/20 Bioinformatics analysis to screen and identify key biomarkers of papillary renal cell carcinoma Yingying Xu Nanjing University of Chinese Medicine Zou Chunbo ( [email protected] ) Taizhou People's Hospital https://orcid.org/0000-0002-1277-8245 Research Keywords: Bioinformatics analysis, accurate classication, Differentially expressed gene, Papillary renal cell carcinoma Posted Date: February 16th, 2021 DOI: https://doi.org/10.21203/rs.3.rs-128786/v2 License: This work is licensed under a Creative Commons Attribution 4.0 International License. Read Full License
-
Upload
khangminh22 -
Category
Documents
-
view
1 -
download
0
Transcript of Bioinformatics analysis to screen and identify key biomarkers ...

Page 1/20
Bioinformatics analysis to screen and identify keybiomarkers of papillary renal cell carcinomaYingying Xu
Nanjing University of Chinese MedicineZou Chunbo ( [email protected] )
Taizhou People's Hospital https://orcid.org/0000-0002-1277-8245
Research
Keywords: Bioinformatics analysis, accurate classi�cation, Differentially expressed gene, Papillary renalcell carcinoma
Posted Date: February 16th, 2021
DOI: https://doi.org/10.21203/rs.3.rs-128786/v2
License: This work is licensed under a Creative Commons Attribution 4.0 International License. Read Full License

Page 2/20
AbstractBackground: Papillary renal cell carcinoma (PRCC) is the second most common type of renal cellcarcinoma after clear cell renal cell carcinoma(ccRCC). Its pathological classi�cation is controversial andits molecular mechanism is poorly understood. Therefore, the identi�cation of key genes and theirbiological pathways is of great signi�cance to elucidate the molecular mechanisms of PRCC occurrenceand progression.
Methods:Downloaded PRCC-related datasets GSE7023, GSE48352 and GSE15641 from the GeneExpression Omnibus (GEO) database. Differential expression genes (DEG) were identi�ed and geneontology (GO) term enrichment analysis and Kyoto Encyclopedia of Genes and Genomics (KEGG)pathway analysis were performed. Cytoscape and STRING are used to construct the Protein-ProteinInteraction Network (PPI) and module analysis to �nd hub genes and key pathways. Hierarchicalclustering of hub genes was constructed using UCSC. Overall survival and relapse-free survival of Hubgenes were analyzed using Kaplan-Meier plotter. UALCAN was applied to analyze genes expression inprimary organizations, different stages ,different subtypes and races.
Results: A total of 214 DEG genes were identi�ed, including 205 down-regulated genes and 9 up-regulatedgenes. DEG is mainly concentrated in angiogenesis, kidney development, oxidation-reduction process,metabolic pathways, etc. 17 hub gene enrichment mainly in angiogenesis, cell adhesion, plateletdegranulation, Leukocyte transendothelial migration biological processes, etc. 17 hub genes werescreened out, which were mainly enriched in the biological processes of angiogenesis, cell adhesion,platelet degranulation, and leukocyte transendothelial migration. Survival analysis showed that EGF, KDR,CXCL12, REN, PECAM1, CDH5, THY1, WT1, PLAU and DCN may be related to the carcinogenesis,metastasis or recurrence of PRCC.
Conclusions: DEG and hub genes identi�ed in present study provide clues to the speci�c molecularmechanisms of PRCC occurrence and development, and may be potential molecular markers andtherapeutic targets for accurate classi�cation and e�cient diagnosis and treatment of PRCC.
IntroductionPapillary renal cell carcinoma (PRCC) accounts for about 15% of renal cancers and is the second mostcommon type of renal cell carcinoma after clear cell renal cell carcinoma(ccRCC). Its pathologicalclassi�cation is controversial and its clinical behavior is highly variable. In addition to PRCC of type 1 andtype 2 histologically, studies in recent years have shown that PRCC of type 2 has heterogeneity, which canbe divided into other subtypes according to tumor-related molecular biomarkers, and re�ect differentclinical processes and prognosis. For example, subgroup C2c refers to tumors related to type 2 PRCC withCpG island methylator phenotype (CIMP), whose overall survival rate is the lowest.[1]Because the speci�cmolecular pathogenesis of PRCC is poorly understood, there has been no effective targeted therapy forpapillary carcinoma in the past. There is increasing evidence that abnormal gene expression and

Page 3/20
mutation are related to the development of PRCC. Linehan et al. [2] found through clinical studies that theoccurrence of PRCC type 2 was closely related to the mutations of chromatin modi�cation genes SETD2,BAP1 and PBRM1, while MET mutations in the structural domain of tyrosine kinase were related to PRCCtype 1. Hereditary leiomyomatosis and renal cell carcinoma (HLRCC) (which is an aggressive form ofPRCC Type 2 ), the mutation of Fumarate Hydratase (FH) located on chromosome 1 is relatively common.[3] However, there is currently no standard treatment for the disease, and mortality rates for PRCC patientsremain high. Therefore, understanding the exact molecular mechanisms involved in the carcinogenesis,metastasis, and recurrence of PRCC and formulating effective diagnosis and treatment strategies are ofvital importance to improving the survival rate of patients.
Microarray technology and bioinformatics analysis as a screening and identi�cation of diseasedevelopment of differentially expressed genes (DEG) one of the important method and widely used, hashelp us to explore a wide variety of DEG involved in PRCC canceration and progress. However, the falsepositive rate in single microarray analysis is relatively high and it is di�cult to obtain reliable results.Therefore, in this study, 3 mRNA microarray datasets from Gene Expression Omnibus (GEO) weredownloaded and analyzed to obtain DEG between PRCC and normal tissues. Subsequently,GeneOntology (GO), Kyoto Encyclopedia of Genes and Genomics (KEGG) pathway enrichment analysis andprotein-protein interaction (PPI) network were used for analysis to help us understand the key genes andpathways for carcinogenesis and progression. As a result, a total of 214 DEG and 17 hub genes wereselected, which may be potential molecular targets and biomarkers of PRCC.
Materials And MethodsAcquisition of microarray data
GEO (http://www.ncbi.nlm.nih.gov/geo) in the National Center for Biotechnology Information (NCBI) is apublic functional genomics database,which is used to store gene expression datasets,platforminformation and original series.Three gene expression datasets [GSE7023 (4), GSE48352 and GSE15641(5)] were downloaded from GEO. GSE7023 was based on GPL4866 platform (Affymetrix GeneChip HumanGenome U133 Plus 2.0 Array ),including 35 PRCC samples and 12 normal samples. GSE48352 wasbased on GPL16311 platform ([HG-U133_Plus_2] Affymetrix Human Genome U133 Plus 2.0 Array),including 24 PRCC samples and 8 normal samples. GSE15641 was based on GPL96 platform ([HG-U133A] Affymetrix Human Genome U133A Array ),including11 PRCC samples and 23 normal samples.
Screening of DEG
Differential expression analysis was performed for each dataset using the GEO2R online analysisprovided by the GEO database. The screening criteria for DEG between PRCC and non-cancerous sampleswere |log2FC (fold change) |> 1 and FDR adjusted P value <0.05. Based on the annotation information inthe platform, the probes were converted into the corresponding gene symbol. Remove probe sets withoutcorresponding gene symbols and duplicate data. Then, take the intersection of three data sets to

Page 4/20
determine the common DEG, using online tools Venn Diagram(http://bioinformatics.psb.ugent.be/webtools/Venn/) to draw the Venn Diagram of DEG.
KEGG and GO enrichment analysis
Annotation, Visualization and Integrated Discovery (DAVID;https://david.ncifcrf.gov/home.jsp) (version6.8) was used to conduct GO enrichment analysis of DEG. GO includes three aspects: biological pathway,cellular localization and molecular function. Use KOBAS 3.0(http://kobas.cbi.pku.edu.cn/kobas3/annotate/) for KEGG pathway enrichment analysis. P<0.05 wasconsidered statistically signi�cant.
PPI network construction and module analysis
The Search Tool for the Retrieval of Interacting Genes online database (STRING; Https://string-db.org(version 11.0) built DEG's PPI network, and the analysis results were visualized by Cytoscape (version3.6.1) and an interaction with a combined score >0.4 was considered statistically signi�cant. TheMolecular Complex Detection (MCODE) (Version 1.5.1) plug-in in Cytoscape was used to identify themost important modules in the PPI network. Selection criteria are as follows:Selection criteria are asfollows: Degree Cutoff=2, Node Score Cutoff=0.2, K-Core=2 and Max depth=100. The genes in the modulewere then analyzed by KEGG and GO using DAVID and KOBAS 3.0.
Selection and analysis of hub genes
Through degree algorithm, 17 PPI genes with scores greater than 15 on cytoHubba in Cytoscape wereidenti�ed as hub genes. The hub genes were analyzed and visualized by Biological Networks OncologyTool(BiNGO) (Version 3.0.4). The hierarchical clustering of hub genes was constructed using the UCSCcancer Genomics browser (http://xena.ucsc.edu/). Hub genes were analyzed for overall survival andrecurrence-free survival using Kaplan-Meier Plotter(https://kmplot.com/analysis/). Take advantage of theonline database Oncomine (https://www.oncomine.org) heat maps of PECAM1 and PLAU geneexpression in clinical PRCC samples and normal tissues were analyzed. Online database UALCAN(http://ualcan.path.uab.edu/) was applied to the analysis of the two genes expression in the PRCC tissueand normal tissue in primary organizations, different stages and subtypes and races.
ResultsIdenti�cation of DEG in PRCC
After the microarray results were standardized, DEGs in three datasets were identi�ed (906 in GSE7023,823in GSE48352, and 2051 in GSE15641)(Fig. 1).The overlap between the three datasets contains 214genes, as shown in the Venn diagram (Fig. 2a).It is composed of 9 up-regulated genes and 205 down-regulated genes between PRCC and normal tissues.

Page 5/20
GO and KEGG enrichment analysis of DEG
GO and KEGG enrichment analysis of DEG was performed using DAVID and KOBAS 3.0. The GO analysisresults indicated that in terms of biological processes, DEG mainly participated at excretion, kidneydevelopment, angiogenesis, negative regulation of growth, epithelial cell differentiation and oxidationreduction process. In terms of molecular functions, DEG were mainly associated with receptor bindingheparin binding prostaglandin E receptor activity calcium ion binding,sodium-
independent organic anion transmembrane transporter activity and transcriptional activator activity. Asfor celullar component, DEG were mainly located in the extracellular exosome,apical plasmamembrane,integral component of plasma membrane,extracellular region , cell surface. Fig. 3 KEGGanalysis showed that DEG were mainly concentrated in the metabolic pathways, pathways in cancer,complement and coagulation cascades, proteoglycans in cancer and PPAR signaling pathway. Fig. 4
PPI network construction and module analysis
The PPI network of DEG was constructed through STRING and Cytoscape, and the most signi�cantmodule was obtained which consists of 10 nodes 43 edges. Fig. 2b,2c DAVID and KOBAS 3.0 were usedto analyze the genes involved in this module by functional enrichment. Results showed that the genes ofthe module mainly enriched in angiogenesis, cell adhesion, platelet degranulation, Leukocytetransendothelial migration, Pathways in cancer, PI3K - Akt signaling pathway and so on. Fig. 5,Fig. 6
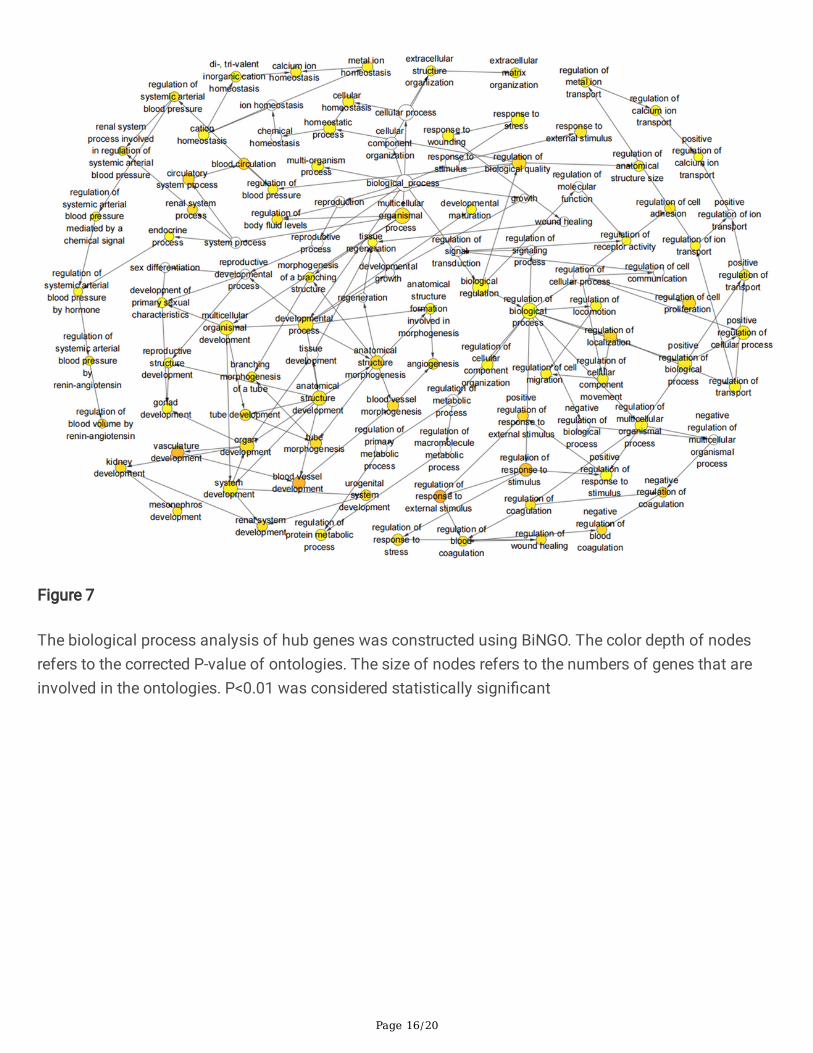
Selection and analysis of hub genes
The 17 genes whose degree score were greater than 15 were de�ned as hub genes, including propagatedEGF, KDR, CXCL12, REN, PLG, PECAM1, KNG1, CDH5, AQP2, C3, THY1, WT1, MGAM, PLAU, AGTR1, DCN.The biological process analysis of hub gene was shown in Fig. 7. Hierarchical clustering analysis showedthat hub genes could distinguish PRCC samples from normal samples.(Fig. 8)Hub genes were analyzedfor overall survival and recurrence-free survival using Kaplan-Meier Plotter. PRCC patients with changes inEGF, KDR, CXCL12, REN, PECAM1, CDH5, THY1, WT1, PLAU, and DCN showed poorer overall survival andrecurrence-free survival. However, patients with KNG1-altered PRCC had poor overall survival while nosigni�cant difference in recurrence-free survival.(Fig. 9)Among these genes with signi�cant differences inoverall survival and recurrence-free survival, PECAM1 and PLAU were shown as seed genes in thesigni�cant modules screened by MCODE, suggesting that they might play a crucial role in thecarcinogenesis and progression of PRCC. The Oncomine analysis of the carcinogenesis of PRCC andnormal tissues showed that PECAM1 and PLAU were down-regulated in PRCC in different datasets.(Fig.10)UALCAN analyzed the two genes expression in the PRCC tissue and normal tissue in primaryorganizations, different stages and subtypes and races. As shown in Fig. 11, PECAM1 and PLAU weredown-regulated in PRCC tissue compared with normal kidney tissue, which was consistent with the

Page 6/20
analysis results of UCSC and Oncomine. Moreover, the expression of both genes in PRCC carcinomatissues was related to different stages, subtypes and races. Notably, PECAM1 was most signi�cantlydown-regulated in stage 1 Caucasian PRCC type 1 patients, while PLAU was most signi�cantly down-regulated in stage 4 CIMP Type Asian PRCC patients.
DiscussionPRCC is the second most common subtype of renal cell carcinoma (RCC) after ccRCC, accounting forapproximately 15% of renal tumors, and is receiving increasing attention worldwide due to its increasingincidence. The pathological classi�cation of PRCC is controversial. Recent study has shown thatmolecular markers can help to pinpoint different subtypes of PRCC and are of great signi�cance for thedevelopment of targeted drugs and better patient strati�cation.[6]However, the potential molecularpathogenesis of PRCC is poorly understood, and there is no effective targeted therapy for papillarycarcinoma, so the mortality rate of patients with PRCC remains high. Therefore, it is urgent to explorepotential molecular markers for accurate typing and e�cient diagnosis and treatment of PRCC.Microarray technology and bioinformatics analysis have been widely used as effective methods to screenand identify novel biomarkers in various diseases and have helped us to identify a variety of DEGinvolved in the carcinogenesis and progression of PRCC. In this study, three mRNA chip datasets from theGEO database were analyzed to obtain DEG between PRCC tissue and normal tissue. A total of 214 DEGgenes were screened out, including 205 down-regulated genes and 9 up-regulated genes. To explore theinteraction between DEG, GO and KEGG enrichment analyses were performed. The results showed thatDEG were mainly concentrated in kidney development, angiogenesis, oxidation-reduction process andmetabolic pathways. Previous reports have shown that pathological angiogenesis is important for thegrowth and spread of cancer by providing nutrients and oxygen and providing catheters for distantmetastases.[7]Oxidation-reduction enzyme activity encodes tumor suppressors and plays an importantrole in tumor antioxidant reactions.[8]In addition, increased metabolic levels directly caused by genemutations and modi�cations of cancer-related protein expression can promote the occurrence anddevelopment of cancer.[9]In a word, all these theories are consistent with our analysis. As for the mostsigni�cant module, GO analysis mainly focused on angiogenesis, cell adhesion, cell migration, epithelialto mesenchymal transition, negative regulation of the intrinsic apoptotic signaling pathway in responseto DNA damage. And KEGG changes are mainly distributed in leukocyte transendothelial migration,pathways in cancer, Rap1 signaling pathway, PI3K - Akt signaling pathway.
We de�ned 17 genes with degree scores greater than 15 as hub genes and analyzed their survival. Amongthe genes with signi�cant differences in overall survival and recurrence-free survival analyses, PECAM1and PLAU showed seed genes in the signi�cant modules screened by MCODE, indicating that they mayplay a crucial role in the carcinogenesis or progression of PRCC. Platelet and endothelial cell adhesionmolecule 1 (PECAM1, also known as CD31) encodes a protein associated with angiogenesis andextracellular circulation that is involved in tumor growth and spread.[10] Study has shown that in patientswith ccRCC, the expression of PECAM1 is increased, which is associated with mild clinicopathological

Page 7/20
parameters, and it is signi�cantly increased only in the early stage of the disease.[11]However, ouranalysis showed that PECAM1 expression was down-regulated in stage 1 patients with PRCC type I.Therefore, PECAM1 may be an early diagnostic indicator to distinguish ccRCC from PRCC. Inaddition,Terashima M et al. found that in stage II/III gastric cancer patients, the level of PECAM1 in theprimary tumor was associated with a high risk of hemangiogenic metastasis.[12]The other study suggeststhat resistin affects the expression of PECAM1 by relying on CAP1, thus inducing EMT and stemness topromote the metastatic potential of breast cancer cells. [13]PLAU encodes a serine protease involved indegradation of the extracellular matrix and possibly tumor cell migration and proliferation. Study showsthat miR-193a-3p may in part inhibit the growth, migration and angiogenesis of colorectal cancer (CRC)cells by targeting PLAU. [14]Novak CM et al. found that �uid shear stress could induce signi�cant up-regulation of PLAU gene and increase of urokinase activity,thereby promoting proliferation, invasivity andchemotherapeutic resistance of breast cancer cells.[15]Survival analysis showed that changes in PECAM1and PLAU were signi�cantly associated with overall survival and recurrence - free survival in PRCCpatients. Oncomine carcinogenesis analysis showed that PECAM1 and PLAU were down-regulated inPRCC in different datasets. UALCAN analysis showed that low expression of PECAM1 and PLAU in PRCCtissues was associated with different stages, subtypes, and races. Notably, PECAM1 was mostsigni�cantly down-regulated in stage 1 Caucasian PRCC type 1 patients, while PLAU was mostsigni�cantly down-regulated in stage 4 CIMP Type Asian PRCC patients. These results suggest thatPECAM1 and PLAU play a critical role in the typing and e�cient diagnosis and treatment of PRCC.
Other hub genes have also been reported in various cancers. Low expression of ALB is a useful andindependent prognostic biomarker in patients with advanced RCC.[16]EGF can promote cell migration ofcRCC. [17]KDR polymorphism is associated with survival time in patients with advanced gastric cancer.[18]The CXCL12/CXCR4 axis promotes the development, invasion and metastasis of pancreatic cancer bymanaging the tumor microenvironment.[19]Abnormal (pro)REN receptor expression promoted theoccurrence of CRC through the Wnt/ catenin signaling pathway.[20]A cohort study con�rms PLG as abiomarker for the diagnosis of ductal adenocarcinoma of the pancreas (PDAC).[21]The overexpression ofKNG1 inhibited the proliferation of glioma cells and induced their apoptosis.[22]Cadherin 5 (CDH5) isexpressed in various malignant tumor cells such as gastric cancer and plays a role in cell adhesion.[23]C3production of cancer cells in CSF is associated with clinical processes such as metastasis andrecurrence.[24]In epithelial ovarian cancer (EOC), increased THY1 expression is associated with increasedproliferation and self-renewal capacity of cancer cells.[25]The n-glycosylation pattern of MGAM may berelated to the progression of bladder cancer.[26]AGTR1 can inhibit tumor cell metastasis in melanoma.[27]DCN can promote apoptosis of CRC cells and play an anti-tumor role.[28]Hierarchical cluster analysisof hub genes showed that these genes could distinguish PRCC samples from normal samples and mightbe potential biomarkers for the diagnosis of PRCC. In addition, changes in EGF, KDR, CXCL12, REN,PECAM1, CDH5, THY1, WT1, PLAU, and DCN were associated with poorer overall survival and recurrence-free survival, suggesting that these genes may play an important role in the carcinogenesis, progression,or recurrence of PRCC.

Page 8/20
The limitations of this study are as follows: First, the number of data samples we used is small anddownloaded from the GEO database, whose authenticity and reliability need to be considered. Secondly,despite a series of functional annotation and enrichment analysis of DEG, this study did not delve intothe detailed mechanism of action between PRCC and DEG. Furthermore, the hub genes screened from thePPI network should be further validated in vitro to observe their speci�c role in PRCC.
In summary, the purpose of this study is to identify potential molecular markers for precise typing ande�cient diagnosis and treatment of PRCC. A total of 214 DEG and 17 hub genes are identi�ed. However,the speci�c biological functions and molecular regulatory mechanisms of these genes in PRCC still needto be con�rmed by further studies.
DeclarationsFunding This work was no fund supported.
Ethics approval and consent to participate:Not applicable.
Con�icts of interest:There are no con�icts to declare.
Consent for publication: Not applicable.
Availability of data and materials:The data and images generated during and analysed during the currentstudy are available from the �rst author on reasonable request.
Authors' contributions:All authors participated in this work. XYY analysed the data and wrote themanuscript, ZCB directed the study.
Acknowledgements Not applicable.
References[1].Akhtar, Mohammed MD, FCAP,et al.Papillary Renal Cell Carcinoma (PRCC): An Update, Advances InAnatomic Pathology: March 2019; 26(2): 124-132.doi: 10.1097/PAP.0000000000000220
[2].Linehan WM, Spellman PT, Ricketts CJ,et al.Comprehensive Molecular Characterization of PapillaryRenal-Cell Carcinoma.N Engl J Med 374:135-45,2016.
[3].Toro JR, Nickerson ML, Wei MH,et al.Mutations in the fumarate hydratase gene cause hereditaryleiomyomatosis and renal cell cancer in Accepted Manuscript families in North America.Am J Hum Genet73:95-106,2003.
[4].Furge KA, Chen J, Koeman J,et al. Detection of DNA copy number changes and oncogenic signalingabnormalities from gene expression data reveals MYC activation in high-grade papillary renal cellcarcinoma. Cancer Res 2007 Apr 1;67(7):3171-6.

Page 9/20
[5].Jones J, Otu H, Spentzos D,et al. Gene signatures of progression and metastasis in renal cell cancer.Clin Cancer Res 2005 Aug 15;11(16):5730-9.
[6].Chen Q, Cheng L, Li Q. The molecular characterization and therapeutic strategies of papillary renal cellcarcinoma. Expert Rev Anticancer Ther. 2019 Feb;19(2):169-175.
[7].Hisano Y, Hla T. Bioactive lysolipids in cancer and angiogenesis. Pharmacol Ther. 2019 Jan;193:91-98.doi: 10.1016/j.pharmthera.2018.07.006. Epub 2018 Jul 23.
[8].Abu-Remaileh M, Aqeilan RI. The tumor suppressor WW domain-containing oxidoreductase modulatescell metabolism. Exp Biol Med. 240: 345-350, 2015.
[9].Sullivan LB, Gui DY, Vander Heiden MG. Altered metabolite levels in cancer: implications for tumourbiology and cancer therapy. Nat Rev Cancer. 2016 Nov;16(11):680-693.
[10].He Y, Liu Z, Qiao C,et al.Expression and signi�cance of Wnt signaling components and their targetgenes in breast carcinoma. Mol Med Rep. 2014; 9:137–43.
[11].Yang JF, Shi SN, Xu WH,et al.Screening, identi�cation and validation of CCND1 and PECAM1/CD31for predicting prognosis in renal cell carcinoma patients. Aging (Albany NY). 2019 Dec 18;11(24):12057-12079.
[12].Terashima M, Ichikawa W, Ochiai A,et al.ACTS-GC Group. TOP2A, GGH, and PECAM1 are associatedwith hematogenous, lymph node, and peritoneal recurrence in stage II/III gastric cancer patients enrolledin the ACTS-GC study. Oncotarget. 2017 Mar 4;8(34):57574-57582.
[13].Avtanski D, Garcia A, Caraballo B,et al.Resistin induces breast cancer cells epithelial to mesenchymaltransition (EMT) and stemness through both adenylyl cyclase-associated protein 1 (CAP1)-dependentand CAP1-independent mechanisms. Cytokine. 2019 Aug;120:155-164.
[14].Lin M, Zhang Z, Gao M,et al.MicroRNA-193a-3p suppresses the colorectal cancer cell proliferationand progression through downregulating the PLAU expression. Cancer Manag Res. 2019 Jun 12;11:5353-5363.
[15].Novak CM, Horst EN, Taylor CC,et al.Fluid shear stress stimulates breast cancer cells to displayinvasive and chemoresistant phenotypes while upregulating PLAU in a 3D bioreactor. Biotechnol Bioeng.2019 Nov;116(11):3084-3097.
[16].Ueda K, Ogasawara N, Yonekura S,et al.The Prognostic Value of Systemic In�ammatory Markers inAdvanced Renal Cell Carcinoma Patients Treated With Molecular Targeted Therapies. Anticancer Res.2020 Mar;40(3):1739-1745.
[17].Dehghani M, Brobey RK, Wang Y,et al.Klotho inhibits EGF-induced cell migration in Caki-1 cellsthrough inactivation of EGFR and p38 MAPK signaling pathways. Oncotarget. 2018 Jun 1;9(42):26737-

Page 10/20
26750.
[18].Zhuo YJ, Shi Y, Wu T.NRP-1 and KDR polymorphisms are associated with survival time in patientswith advanced gastric cancer. Oncol Lett. 2019 Nov;18(5):4629-4638.
[19].Sleightholm RL, Neilsen BK, Li J,et al.Emerging roles of the CXCL12/CXCR4 axis in pancreatic cancerprogression and therapy. Pharmacol Ther. 2017 Nov;179:158-170.doi: 10.1016/j.pharmthera.201
7.05.012. Epub 2017 May 23.
[20].Wang J, Shibayama Y, Zhang A,et al.(Pro)renin receptor promotes colorectal cancer through theWnt/beta-catenin signalling pathway despite constitutive pathway component mutations. Br J Cancer.2019 Jan;120(2):229-237.
[21].Resovi A, Bani MR, Porcu L,et al.Soluble stroma-related biomarkers of pancreatic cancer. EMBO MolMed. 2018 Aug;10(8):e8741.
[22].Xu J, Fang J, Cheng Z,et al.Overexpression of the Kininogen-1 inhibits proliferation and inducesapoptosis of glioma cells. J Exp Clin Cancer Res. 2018 Aug 2;37(1):180.
[23].Higuchi K, Inokuchi M, Takagi Y,et al.Cadherin 5 expression correlates with poor survival in humangastric cancer. J Clin Pathol. 2017 Mar;70(3):217-221.
[24].Boire A, Zou Y, Shieh J,et al.Complement Component 3 Adapts the Cerebrospinal Fluid forLeptomeningeal Metastasis. Cell. 2017 Mar 9;168(6):1101-1113.e13. doi: 10.1016/j.cell.2017.02.025.
[25].Connor EV, Saygin C, Braley C,et al.Thy-1 predicts poor prognosis and is associated with self-renewalin ovarian cancer. J Ovarian Res. 2019 Nov 17;12(1):112. doi: 10.1186/s13048-019-0590-5.
[26].Sathe G, George IA, Deb B,et al.Urinary glycoproteomic pro�ling of non-muscle invasive and muscleinvasive bladder carcinoma patients reveals distinct N-glycosylation pattern of CD44, MGAM, and GINM1.Oncotarget. 2020 Aug 25;11(34):3244-3255. doi: 10.18632/oncotarget.27696.
[27].Renziehausen A, Wang H, Rao B,et al.The renin angiotensin system (RAS) mediates bifunctionalgrowth regulation in melanoma and is a novel target for therapeutic intervention. Oncogene. 2019Mar;38(13):2320-2336. doi: 10.1038/s41388-018-0563-y. Epub 2018 Nov 26.
[28].Deng M, Xue Y, Xu L,et al.Chrysophanol exhibits inhibitory activities against colorectal cancer bytargeting decorin. Cell Biochem Funct. 2020 Jan;38(1):47-57. doi: 10.1002/cbf.3445. Epub 2019 Nov 11.
Figures

Page 11/20
Figure 1
Volcano Plot of DEGs in three datasets. Red represents up-regulated, green represents down-regulated,and gray represents no signi�cant difference. |logFC (fold change) |> 1 and adjusted P value <0.05 wereconsidered statistically signi�cant
Figure 2
Venn diagram, PPI network and the most signi�cant module of DEGs. (a) DEGs were selected with|log2FC (fold change) |> 1 and FDR adjusted P value <0.05 among the mRNA expression pro�ling sets

Page 12/20
GSE7023, GSE48352 and GSE15641. The three datasets showed an overlap of 214 genes. (b) STRINGand Cytoscape was used to construct PPI network of DEGs. (c) MCODE plug-in in Cytoscape was used toidentify the most important module from PPI network with 10 nodes and 43 edges. Red represents up-regulated genes and blue represents down-regulated genes
Figure 3
GO enrichment analysis of DEG in papillary renal cell carcinoma. GO, Gene Ontology

Page 13/20
Figure 4
KEGG pathway analysis of DEG in papillary renal cell carcinoma. KEGG, Kyoto Encyclopedia of Genesand Genomics

Page 14/20
Figure 5
GO enrichment analysis of the genes of the most signi�cant module in PRCC

Page 15/20
Figure 6
KEGG analysis of the genes of the most signi�cant module in PRCC
Page 16/20
Figure 7
The biological process analysis of hub genes was constructed using BiNGO. The color depth of nodesrefers to the corrected P-value of ontologies. The size of nodes refers to the numbers of genes that areinvolved in the ontologies. P<0.01 was considered statistically signi�cant

Page 17/20
Figure 8
Hierarchical clustering of hub genes was constructed using UCSC. Non-cancerous samples were markedas red and the HCC samples were marked as blue. Red represents up-regulated genes and blue representsdown-regulated genes

Page 18/20
Figure 9
(a) Overall survival and (b) recurrence-free survival analyses of hub genes were performed using Kaplan-Meier Plotter. P<0.05 was considered statistically signi�cant

Page 19/20
Figure 10
Oncomine analysis of cancer vs. normal tissue of (a) PECAM1 and (b) PLAU. Heat maps of PECAM1 andPLAU gene expression in clinical papillary renal cell carcinoma samples vs. normal tissues.

Page 20/20
Figure 11
Online database UALCAN was applied to the analysis of the two genes expression in the PRCC tissue andnormal tissue in primary organizations, different stages and subtypes and races. a-d represent PECAM1and e-h represent PLAU