Novel bioinformatics quality control metric for next-generation ...
15
Published online 12 September 2019 Nucleic Acids Research, 2019, Vol. 47, No. 21 e135 doi: 10.1093/nar/gkz775 Novel bioinformatics quality control metric for next-generation sequencing experiments in the clinical context Maxim Ivanov 1,* , Mikhail Ivanov 1 , Artem Kasianov 2 , Ekaterina Rozhavskaya 2,3 , Sergey Musienko 3 , Ancha Baranova 1,3,4,5 and Vladislav Mileyko 1,3 1 Department of Biological and Medical Physics, Moscow Instituteof Physics and Technology, Dolgoprudny 141700, Russian Federation, 2 Vavilov Institute of General Genetics, Moscow, Russian Federation, 3 Atlas Oncology Diagnostics, Ltd, Moscow, Russian Federation, 4 Research Centre for Medical Genetics, Moscow, Russian Federation and 5 School of Systems Biology, George Mason University, Fairfax, VA22030, USA Received December 17, 2018; Revised July 22, 2019; Editorial Decision August 27, 2019; Accepted August 29, 2019 ABSTRACT As the use of next-generation sequencing (NGS) for the Mendelian diseases diagnosis is expanding, the performance of this method has to be improved in order to achieve higher quality. Typically, perfor- mance measures are considered to be designed in the context of each application and, therefore, ac- count for a spectrum of clinically relevant variants. We present EphaGen, a new computational method- ology for bioinformatics quality control (QC). Given a single NGS dataset in BAM format and a pre- compiled VCF-file of targeted clinically relevant vari- ants it associates this dataset with a single arbiter parameter. Intrinsically, EphaGen estimates the prob- ability to miss any variant from the defined spectrum within a particular NGS dataset. Such performance measure virtually resembles the diagnostic sensitiv- ity of given NGS dataset. Here we present case stud- ies of the use of EphaGen in context of BRCA1/2 and CFTR sequencing in a series of 14 runs across 43 blood samples and 504 publically available NGS datasets. EphaGen is superior to conventional bioin- formatics metrics such as coverage depth and cov- erage uniformity. We recommend using this software as a QC step in NGS studies in the clinical context. Availability: https://github.com/m4merg/EphaGen or https://hub.docker.com/r/m4merg/ephagen. INTRODUCTION Next-generation sequencing has transformed the landscape of the whole field of medical genetics. It enhanced the per- formance of the genetic testing as well as expanded and fa- cilitated understanding of clinical genetics (1–4). The prin- cipal focus of the clinical geneticists remains on Mendelian diseases as they are the most well described and straightfor- ward to integrate into clinical practice. However, decades of research efforts and routine testing shed light on the spec- trum of variations in human genes, associated with a wide range of genetic disorders and their clinical significance in terms of variable penetrance and expressivity (5). Moreover, for the most wide-spread genetic diseases, numeric research collaborations and public databases provided information on common and population specific minor allele frequen- cies for clinically significant variants. For instance, as of May 2018, Breast Cancer Information Core database (6) contains information on relative clinically relevant variants across BRCA1 and BRCA2 genes, implicated in hereditary breast cancer development, based on the 11 344 affected population size. Against this background, despite excessive informational yield that NGS sequencing data provides, in routine clinical practice, in essence, it is used to confirm the findings for the patient: it is either known pathogenic variants (positive re- sult) or a wild-type (negative result). Meanwhile, the detec- tion of a variant which is not annotated in public databases and in literature may be considered as an exceptional event. Nevertheless, such de novo variants, as well as variant of un- certain significance or any findings beyond the known spec- trum of pathogenic variants, have limited significance for clinical practice. Taking this into account, commonly used NGS quality control metrics, such as read coverage depth or coverage uniformity, fail to elucidate the worth of the negative result since target sequencing regions may be in- trinsically unequal depending on their genome position. Here, we describe a novel approach to the measurement of performance in routine clinical NGS testing. Given single NGS dataset in BAM format and spectrum of the variants * To whom correspondence should be addressed. Tel: +7 9096775274; Fax: +7 495 408 42 54; Email: [email protected] C The Author(s) 2019. Published by Oxford University Press on behalf of Nucleic Acids Research. This is an Open Access article distributed under the terms of the Creative Commons Attribution License (http://creativecommons.org/licenses/by/4.0/), which permits unrestricted reuse, distribution, and reproduction in any medium, provided the original work is properly cited. Downloaded from https://academic.oup.com/nar/article/47/21/e135/5568209 by guest on 25 January 2022
-
Upload
khangminh22 -
Category
Documents
-
view
6 -
download
0
Transcript of Novel bioinformatics quality control metric for next-generation ...
Published online 12 September 2019 Nucleic Acids Research, 2019, Vol. 47, No. 21 e135doi: 10.1093/nar/gkz775
Novel bioinformatics quality control metric fornext-generation sequencing experiments in theclinical contextMaxim Ivanov1,*, Mikhail Ivanov1, Artem Kasianov2, Ekaterina Rozhavskaya2,3,Sergey Musienko3, Ancha Baranova1,3,4,5 and Vladislav Mileyko1,3
1Department of Biological and Medical Physics, Moscow Institute of Physics and Technology, Dolgoprudny 141700,Russian Federation, 2Vavilov Institute of General Genetics, Moscow, Russian Federation, 3Atlas OncologyDiagnostics, Ltd, Moscow, Russian Federation, 4Research Centre for Medical Genetics, Moscow, Russian Federationand 5School of Systems Biology, George Mason University, Fairfax, VA 22030, USA
Received December 17, 2018; Revised July 22, 2019; Editorial Decision August 27, 2019; Accepted August 29, 2019
ABSTRACT
As the use of next-generation sequencing (NGS)for the Mendelian diseases diagnosis is expanding,the performance of this method has to be improvedin order to achieve higher quality. Typically, perfor-mance measures are considered to be designed inthe context of each application and, therefore, ac-count for a spectrum of clinically relevant variants.We present EphaGen, a new computational method-ology for bioinformatics quality control (QC). Givena single NGS dataset in BAM format and a pre-compiled VCF-file of targeted clinically relevant vari-ants it associates this dataset with a single arbiterparameter. Intrinsically, EphaGen estimates the prob-ability to miss any variant from the defined spectrumwithin a particular NGS dataset. Such performancemeasure virtually resembles the diagnostic sensitiv-ity of given NGS dataset. Here we present case stud-ies of the use of EphaGen in context of BRCA1/2and CFTR sequencing in a series of 14 runs across43 blood samples and 504 publically available NGSdatasets. EphaGen is superior to conventional bioin-formatics metrics such as coverage depth and cov-erage uniformity. We recommend using this softwareas a QC step in NGS studies in the clinical context.Availability: https://github.com/m4merg/EphaGen orhttps://hub.docker.com/r/m4merg/ephagen.
INTRODUCTION
Next-generation sequencing has transformed the landscapeof the whole field of medical genetics. It enhanced the per-formance of the genetic testing as well as expanded and fa-
cilitated understanding of clinical genetics (1–4). The prin-cipal focus of the clinical geneticists remains on Mendeliandiseases as they are the most well described and straightfor-ward to integrate into clinical practice. However, decades ofresearch efforts and routine testing shed light on the spec-trum of variations in human genes, associated with a widerange of genetic disorders and their clinical significance interms of variable penetrance and expressivity (5). Moreover,for the most wide-spread genetic diseases, numeric researchcollaborations and public databases provided informationon common and population specific minor allele frequen-cies for clinically significant variants. For instance, as ofMay 2018, Breast Cancer Information Core database (6)contains information on relative clinically relevant variantsacross BRCA1 and BRCA2 genes, implicated in hereditarybreast cancer development, based on the 11 344 affectedpopulation size.
Against this background, despite excessive informationalyield that NGS sequencing data provides, in routine clinicalpractice, in essence, it is used to confirm the findings for thepatient: it is either known pathogenic variants (positive re-sult) or a wild-type (negative result). Meanwhile, the detec-tion of a variant which is not annotated in public databasesand in literature may be considered as an exceptional event.Nevertheless, such de novo variants, as well as variant of un-certain significance or any findings beyond the known spec-trum of pathogenic variants, have limited significance forclinical practice. Taking this into account, commonly usedNGS quality control metrics, such as read coverage depthor coverage uniformity, fail to elucidate the worth of thenegative result since target sequencing regions may be in-trinsically unequal depending on their genome position.
Here, we describe a novel approach to the measurementof performance in routine clinical NGS testing. Given singleNGS dataset in BAM format and spectrum of the variants
*To whom correspondence should be addressed. Tel: +7 9096775274; Fax: +7 495 408 42 54; Email: [email protected]
C© The Author(s) 2019. Published by Oxford University Press on behalf of Nucleic Acids Research.This is an Open Access article distributed under the terms of the Creative Commons Attribution License (http://creativecommons.org/licenses/by/4.0/), whichpermits unrestricted reuse, distribution, and reproduction in any medium, provided the original work is properly cited.
Dow
nloaded from https://academ
ic.oup.com/nar/article/47/21/e135/5568209 by guest on 25 January 2022
e135 Nucleic Acids Research, 2019, Vol. 47, No. 21 PAGE 2 OF 15
of interest with known allele prior probabilities, it employsmethodology which essentially resembles variant calling un-der reversed null hypothesis. Instead of detecting variants,this algorithm is utilized to estimate the probability to missany variant from the defined spectrum and, therefore, to de-cide whether collected data are suitable for clinical interpre-tation or no. Performance of presented sensitivity calcula-tion was extensively tested both on simulated and on real-life sequencing datasets. Since it matches every dataset witha single number, it is ideally suited for routine NGS qual-ity control and allow head-to-head comparison of differentsequencing approaches.
MATERIALS AND METHODS
Sample collection and sequencing
Sequencing was performed on 43 blood samples from 43breast cancer patients referred for BRCA1/2 sequencing asa part of routine case management. Participation in thisproject was based on informed consent. All further anal-yses were based on the archival data that were stored in thedatabase with no current connection to the patients’ iden-tifiers. The research was approved by the local ethics com-mittee of the Atlas Medical Center, LLC. The project wasconducted in accordance with the principles expressed inthe Declaration of Helsinki.
Twenty milliliters of peripheral blood was collected fromeach patient. Circulating plasma DNA was extracted from20 ml of plasma using Plasma DNA extraction kit (Biosil-ica) or QIAamp Circulating Nucleic Acid Kit (Qiagen) ac-cording to the manufacturer’s protocols. DNA quality andquantity were evaluated with Agilent Bioanalyzer 2100 us-ing High Sensetivity DNA kit (Agilent Technologies).
Target regions amplification was performed employingthe Atlas ABC panel. Primer panel was designed viaIon Ampliseq Designer (Thermo Fisher Scientific Inc)through White Glove process and include two primer pools,comprising 409 amplicons within 4 cancer-related genes:BRCA1, BRCA2, ATM, CHEK2. Pooled libraries were se-quenced using Ion Torrent PGM (Thermo Fisher). Raw se-quence data analysis, including base calling and demulti-plexing, were performed using the Torrent Suite Softwarev.4.0.2 (Life Technologies).
Ten nanograms of circulating plasma DNA were usedto generate sequencing libraries using the Ion Ampliseq li-brary preparation kit v2.0 (Life Technologies) according tothe manufacturer’s protocol. The barcoded libraries werequantified using an Agilent 2100 Bioanalyser and Qubit 2.0Fluorometer TM (Life Technologies) and then diluted to afinal concentration of 10 pM for template preparation usingthe OneTouch 2 instrument and Ion One Touch Templatekit v2 (Life Technologies). The resulting pooled librarieswere quality control checked using the Ion Sphere qualitycontrol Kit on the Qubit 3.0 Fluorometer. Libraries were se-quenced on the PGM Ion Torrent (Life Technologies) usinga PGM 200 sequencing kit v2 and 318 Chip v2.
All samples were sequenced within 14 sequencingruns (Figure 9). Sequence data mapping to referencegenome (GRCh37.p13) was performed with Burrows-Wheeler Aligner (BWA-mem, version 0.7.7-r441) (7).
Statistical framework
At first, we consider that object of testing is known toharbor pathogenic variants of particular, limited spectrum.This consideration is based on the methodology used tojudge whether variant is clinically relevant or no, requir-ing population data, segregation data, functional data andso on (8). Assuming that this spectrum of pathogenic vari-ants is generated based on the previously studied affectedpopulation Pa f f of size NPa f f we can define a set of M mu-tation sites with known allele count at each site m, nm :∑M
m = 1 nm = NPa f f . Therefore, relative allele frequency atsite m is pm = nm /NPa f f . Given single sequencing dataset D,covering aforementioned M sites we can define the probabil-ity to miss any variant m. This estimation resembles quasi-experiment to detect mutations in population Pa f f , whilethe average dataset quality during this experiment is thesame as the quality of the dataset D. Here, dataset qualityis defined by read count covering each position m and basequality. In this context, we can define in silico sensitivity ofthe dataset, resembling diagnostic sensitivity.
EphaGen takes aligned sequencing data in .bam for-mat as input file as well as pathogenic variant spectrumin .vcf format, describing M mutation sites with the allelecount nm for each. To estimate probability to miss variantm we employ simple probabilistic model for variant calling(9). Given sequencing data may be represented by matrixD = (D1, . . . , DM)T, totaling N reads covering M target
mutation sites, with Dm =⎛⎝1, , , 1︸ ︷︷ ︸
lm
, 0, . . . , 0︸ ︷︷ ︸km−lm
⎞⎠, representing
alignment for the site m, where 1 stands for reference alleleand 0 stands for alternative allele. Assuming that (i) dataDm at different sites are independent (ii) sequencing errorsarise independently at rate ε and (iii) error rates are identi-cal for all bases, posterior probabilities for observing dataDm at site m given 0, 1 or 2 reference alleles at this site canbe approximated with a binomial distribution:
P (D|0m) =(
kmlm
)εlm (1 − ε)km−lm (1)
P (D|1m) =(
kmlm
)/2km (2)
P (D|2m) =(
kmlm
)(1 − ε)lm εkm−lm (3)
For the posterior probability of observing 0, 1 or 2 refer-ence alleles at site m given data Dm we have:
P (αm|D) = P (D|αm) P (αm)∑2im=0 P(D|im)P (im)
, α ∈ {0, 1, 2} (4)
And called genotype is thus:
αm = argmaxαm∈{0,1,2} P (αm|D) , (5)
While mutant genotype αm = 0 or αm = 1 are accepted ifP(αm|D) > P(αm) and genotype Phred quality exceeds 20:
Qαm = −10 log10
[1 − P (αm|D)
]> 20, (6)
Dow
nloaded from https://academ
ic.oup.com/nar/article/47/21/e135/5568209 by guest on 25 January 2022
PAGE 3 OF 15 Nucleic Acids Research, 2019, Vol. 47, No. 21 e135
where P(αm|D) = P(αm|D)−P(αm)(1−P(αm))
Prior probabilities of homozygous for alterna-tive allele call, heterozygous call and homozy-gous for reference allele call can be calculated un-der Hardy-Weinberg equilibrium and are P (0m) =pm
2 , P (1m) = ∑Mi=1,i �=m 2 pi pm = 2 pm(1 − pm) and
P (2m) = ∑Mi=1,i �=m pi
2 + ∑Mi = 1,i �=m
∑Mj = 1, j �=i 2 pi p j =
(1 − pm)2 respectively.According to the aforementioned quasi-experiment, each
site is tested to be mutant (homozygous or heterozygous foralternative allele) or reference (homozygous for reference al-lele). Considering that true condition is presence of alterna-tive allele in homozygote or heterozygote, sensitivity can becalculated as ratio of number of true positives (quasi-testsystem calls mutation if allele is present in sample) to thetotal count of alleles:
S = 12
∑M
m = 1
[γm,1 P (1m) + 2 ∗ γm,0 P (0m)
], (7)
where γm,1 and γm,0 are probabilities to correctly identifysample as heterozygous and homozygous for alternative al-lele at site m respectively.
During aforementioned quasi-experiment we may expectany data Dϕ = (D1,ϕ, . . . , DM,ϕ)T, where probabilities ofobserving each data Dm,ϕ may be calculated by equations1–3. For each possible dataset Dϕ using equations 5, 6 wecan estimate whether the variant m will be detectable or no.Therefore, accounting for all possible datasets that may begenerated, probability to correctly detect α (α ∈ {0, 1}) al-ternative alleles for the site m may be calculated as γm,α =∑
ϕ P(Dm,ϕ|αm) δϕm,α P(αm),where, δϕm,α denotes where variant m is detectable in
dataset Dϕ or no:
δϕm,α ={
1, i f α = αm0, i f α �= αm
, α ∈ {0, 1}
And, thus, Equation (7) can be written as:
S = 12
∑M
m = 1
∑ϕ
[P
(Dm,ϕ|1m
)δϕm,1 P(1m)
+2 ∗ P(Dm,ϕ|0m
)δϕm,0 P (0m)
] =∑M
m=1
∑ϕ
cm,ϕ
(8)
In Equation (8), the second sum is over all combinationsof data Dm,ϕ assuming i alternative alleles. Assuming thatall reads are equal and discounting differences in base qual-ity it can be approximated with:
S =∑M
m=1
∑km,ϕ
i=0cm,ϕ , (9)
Where Dm,ϕ = Dm,i ≡
⎛⎜⎝1, , , 1︸ ︷︷ ︸
i
, 0, . . . , 0︸ ︷︷ ︸km,ϕ−i
⎞⎟⎠ .
Further, we use a Poisson distribution with cumulativedistribution function cd f (km,e) = �(�km,e�,km)
�(km) , km,e > 0 as amodel to calculate probability of observing km,e reads cov-ering site m after generating another dataset Dϕ with the
same total amount of N reads covering M target muta-tion sites. To define the set of expected coverages at site m,Km,exp, we can calculate the pair of km,l and km,h so thatKm,exp = {k : km,l ≤ k ≤ km,h}, km,l − km,h is minimal acrossall possible pairs and:{ CDF (km,h) − CDF (km,l ) ≥ 0, 99
, km,h > km, km,l > 0, orkm,h − km = km − km,l
CDF (km,h) − CDF (km,l ) ≥ 0, 95, km,h > km, km,l = 0,
which stands for the 99% confidence interval of km,e. Af-ter Km,exp defined this way, probability of observing km,e ∈Km,exp should be normalized according to the chosen inter-val: P (km,e) = pmf (km,e, km)/
∑k∈Km,exp
pmf (k, km), where
pmf (km,e, km) is probability mass function of Poisson dis-tribution.
Here, we should note, that coverage for mutation site mayequals to 0. Since it may be caused by amplicon drop-out,deeper sequencing of the same library wont naturally gen-erate data with reads covering this site. On the other handit may be caused by significant coverage non-uniformity orlow mean coverage and thus, despite not observed in dataD, it might be covered during sequence generating N > Nreads, though based on the single sequencing dataset N re-mains not-definable. Therefore, for those sites, covered with0 reads it is defined that km,l = km,h = 0 and Km,exp = {0}(10).
After defining Km,exp we can update Equation (6):
S =M∑
m=1
∑km,e∈Km,exp
km,e∑i=0
cm,ϕ P (km,e)
It is known that the process of sequence analysis is proneto produce diverse systemic errors originating at differentstages of analysis, including directly sequencing, librarypreparation and even specimen sampling. Such errors canbe handled employing more complicated variant callingmodels, cross-sample analysis or other methods. Howeversimple probabilistic model may produce false calls in suchcases, which will introduce bias into sensitivity calculation.In order to avoid such perturbation, during the step of cal-culating km for each site if homozygote or heterozygote foralternative allele is more likely than homozygote for refer-ence allele, all reads supporting alternative allele are purgedfrom the alignment.
RESULTS
Overview
We have developed EphaGen, an open-source applicationimplemented in Perl/R, which can be used as a stand-alone version. EphaGen takes two files as input: alignedsequenced data in .bam format and target variant spec-trum in .vcf format. Target variant spectrum can be con-structed based on the previously studied affected popula-tion employing prospective, retrospective, meta-analysis ordatabase view methodology. Therefore, each variant ob-served in the affected population can be associated with mi-nor allele count which should be included into input .vcf
Dow
nloaded from https://academ
ic.oup.com/nar/article/47/21/e135/5568209 by guest on 25 January 2022
e135 Nucleic Acids Research, 2019, Vol. 47, No. 21 PAGE 4 OF 15
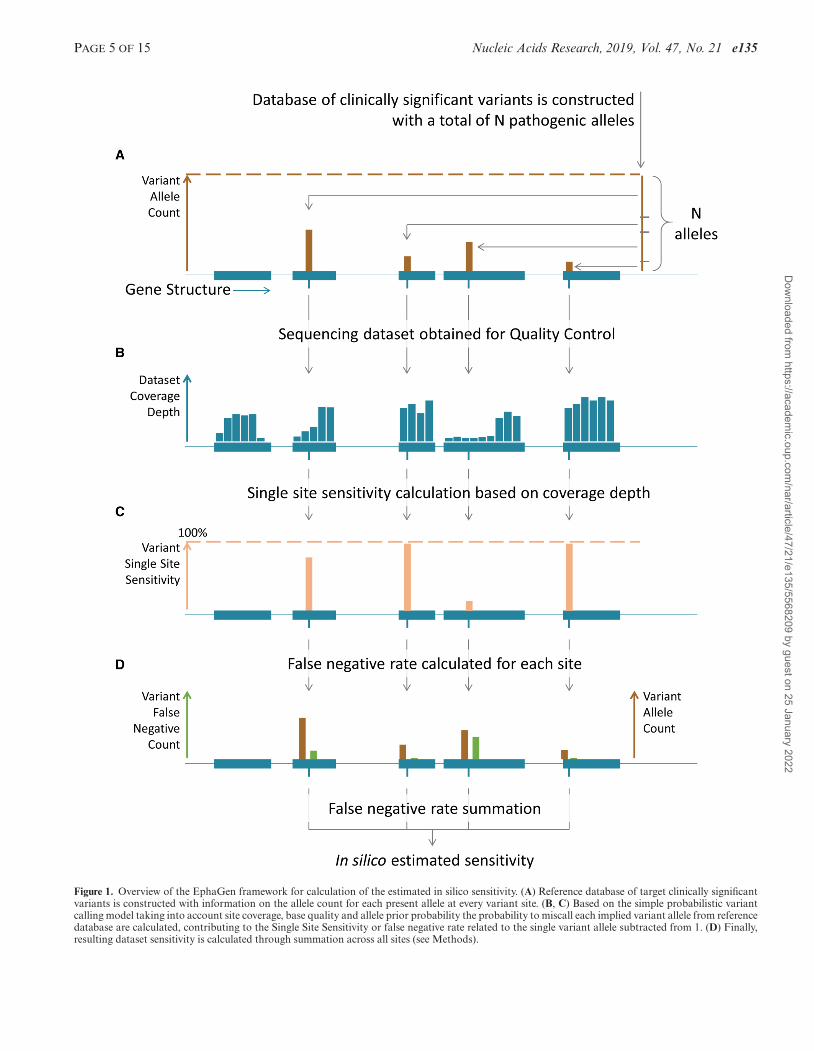
file. Based on the simple probabilistic model for variant call-ing under the reversed null hypothesis, EphaGen estimatesthe probability to miss any variant from target spectrumor single site sensitivity (Figure 1). Therefore, instead ofdirectly detecting variant from sequencing data, EphaGencalculates maximum potential diagnostic sensitivity of anyvariant calling methodology which can be employed to de-tect variants from data (see Methods for detailed statisticalframework).
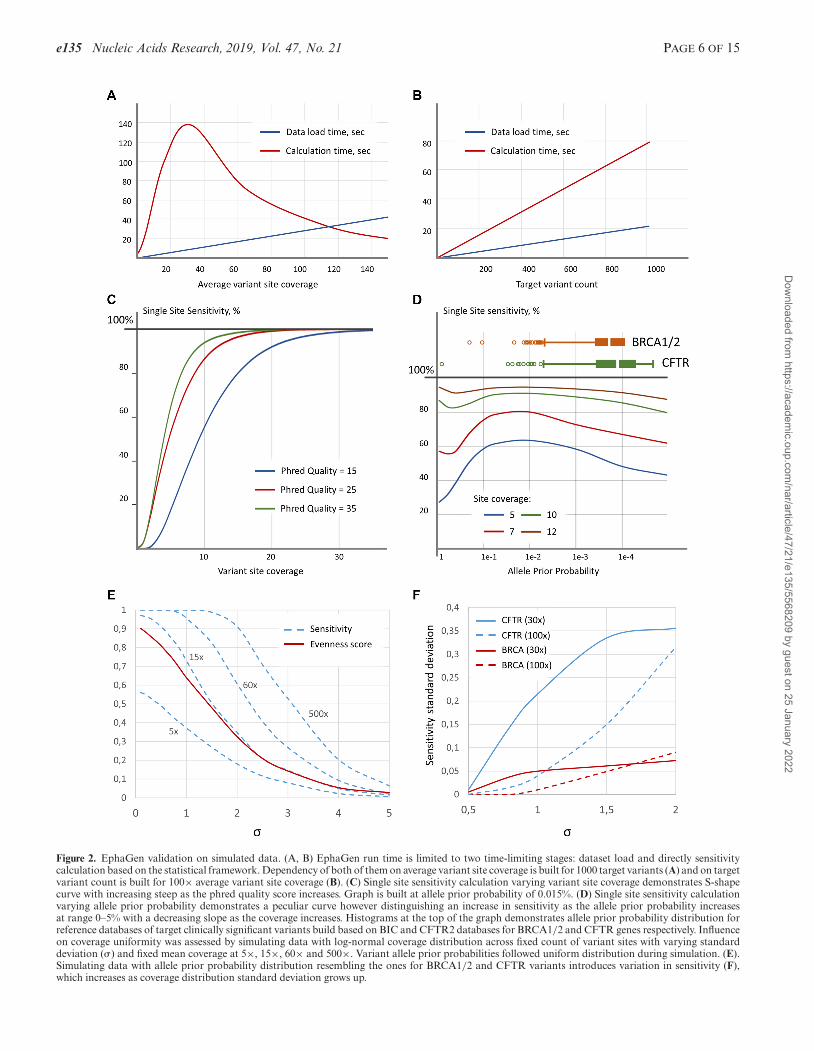
EphaGen run time depends on both the amount of refer-ence variant sites and read count generated during NGS ex-periment (Figure 2A, B). While dataset load and sensitivitycalculation based on the statistical framework are two time-limiting stages of the analysis both of them pertain lineargrowth depending on the target variant sites count. Calcu-lation time follows exponentials growth as average referencevariant site coverage increases. To eliminate drastic escala-tion of the calculation we used empirically derived single sitesensitivity approximation based on the generalized logisticcurve.
Performance of sensitivity estimation on simulated data
The crucial component of EphaGen is a pre-compiled VCF-file database of genomic variant alleles with the correspond-ing probabilities to identify each variant allele in the af-fected population. In our study, we used BIC (Breast Can-cer Information Core, assessed may 2018) (6) and CFTR2(Clinical and Functional Translation of CFTR, assessedmay 2018) (11) databases to compile two target variant spec-trums in order to test efficiency of diverse NGS-based sys-tems to detect BRCA1/2 and CFTR clinically significantvariants respectively. Only variants noted as clinically im-portant in BIC and CF-causing or those with varying clin-ical consequence in CFTR2 were used for the analysis ex-cluding variants with the reference or alternative allele of 50bp or longer. A total of 1319 various variant sites were col-lected for BRCA1/2 genes amounting to 1339 diverse alle-les comprising 11 344 alleles counts and 310 variant sites forCFTR gene (321 diverse alleles and 136 260 alleles counts).
Single site sensitivity calculation is based only on threevariables: site coverage, base quality and allele prior proba-bility, calculated as the site allele count divided by the totalallele count in reference VCF-file (see Methods for details).Therefore, we set to evaluate the performance of this sta-tistical framework varying the aforementioned parameters.The dependency of single site sensitivity on the site cov-erage built at 0.015% allele prior probability follows clas-sic S-shape curve reaching 99% sensitivity at 41×, 26× and21× site coverage at 15, 25 and 35 base Phred quality re-spectively (Figure 2C). Meanwhile, dependency on the al-lele prior probability follows peculiar form, demonstratingthe growth of the sensitivity as allele probability increase ina range 0–5% comprising the major fraction of allele proba-bility distribution across diverse genes with the heterogenicclinically significant variant spectrum (Figure 2D).
In order to estimate the dependency of the sensitivitycalculation on coverage uniformity, we simulated coveragefollowing log-normal distribution with varying mean andstandard deviation (�) for the set of 100 variant sites (Fig-ure 2E). Allele prior probabilities were simulated with the
uniform distribution. Base Phred quality was constant andset to 30. To measure coverage uniformity, we used even-ness score, essentially described in Oexle (12). Evennessscore calculation was performed across all reference vari-ant sites. At low coverage depth, sensitivity retains almostconstant ration to evenness score when standard deviationranges from 0.1 to 1, which is the most common range forNGS coverage uniformity. However, at high coverage, as ex-pected, sensitivity asymptotically approaches 100%, mean-ing that despite decreasing coverage uniformity all sites arecovered with enough reads to confidently detect every singlevariant.
Further instead of uniform distribution for variant priorallele probability we use the distribution that follows pre-viously collected BRCA1/2 of CFTR sites (Figure 2D).This resulted in variation introduced into sensitivity calcu-lation. As coverage uniformity decreases, standard devia-tion of sensitivity across different data simulations demon-strates growth, while the rate depends on the coverage depth(Figure 2F). In addition, sensitivity variation depends onthe spectrum of variant allele frequencies. For instance, thestandard deviation of the sensitivity to detect CFTR vari-ants across different data simulation is 3.6 times higher thanfor BRCA variants, which is in agreement with the dif-ference between allele frequency scatter for two referencedatabases (coefficient of allele count variation: 12.8 versus8.3 for CFTR and BRCA respectively). This means that themore allele frequency distribution resembles uniform dis-tribution, the less variation of sensitivity across datasets isobserved.
The utility of estimated sensitivity as NGS performance mea-sure
In order to assess the performance of the EphaGen sta-tistical framework, we have downloaded NGS sequencingdata from 11 SRA studies (Figure 3A) with a total of 308whole exome sequencing datasets and 196 target sequenc-ing datasets. This comprised eight different whole exome se-quencing (WXS) panels and three BRCA1/2 targeted pan-els. In addition to publically available datasets, we have per-formed 14 sequencing runs for target resequencing across atotal of unselected 43 blood samples by leveraging customamplicon panel designed to cover all exons of BRCA1 andBRCA2. As all analyzed publically available datasets wereobtained employing Illumina sequencing technology, gen-erating generally the same base quality, calculated in silicosensitivity was related to two major bioinformatics qualitycontrol metrics: mean target coverage depth and coverageuniformity defined by evenness score.
Considering that WXS datasets were collected across dif-ferent laboratories, average coverage depth significantly var-ied across different datasets. However, that does not relate toevenness scores which were generally similar across differentdatasets for particular capture panel, with an exception ofSRP072350 project utilizing SeqCap V3.0 (mean evennessscore of 0.75 versus 0.84). This indicates that library prepa-ration strategy has a potential to significantly impact result-ing sequencing efficiency of specific loci. Despite similar GCcontent between target regions mapping to BRCA1/2 andCFTR loci, most panels demonstrated slight differences of
Dow
nloaded from https://academ
ic.oup.com/nar/article/47/21/e135/5568209 by guest on 25 January 2022
PAGE 5 OF 15 Nucleic Acids Research, 2019, Vol. 47, No. 21 e135
Figure 1. Overview of the EphaGen framework for calculation of the estimated in silico sensitivity. (A) Reference database of target clinically significantvariants is constructed with information on the allele count for each present allele at every variant site. (B, C) Based on the simple probabilistic variantcalling model taking into account site coverage, base quality and allele prior probability the probability to miscall each implied variant allele from referencedatabase are calculated, contributing to the Single Site Sensitivity or false negative rate related to the single variant allele subtracted from 1. (D) Finally,resulting dataset sensitivity is calculated through summation across all sites (see Methods).
Dow
nloaded from https://academ
ic.oup.com/nar/article/47/21/e135/5568209 by guest on 25 January 2022
e135 Nucleic Acids Research, 2019, Vol. 47, No. 21 PAGE 6 OF 15
Figure 2. EphaGen validation on simulated data. (A, B) EphaGen run time is limited to two time-limiting stages: dataset load and directly sensitivitycalculation based on the statistical framework. Dependency of both of them on average variant site coverage is built for 1000 target variants (A) and on targetvariant count is built for 100× average variant site coverage (B). (C) Single site sensitivity calculation varying variant site coverage demonstrates S-shapecurve with increasing steep as the phred quality score increases. Graph is built at allele prior probability of 0.015%. (D) Single site sensitivity calculationvarying allele prior probability demonstrates a peculiar curve however distinguishing an increase in sensitivity as the allele prior probability increasesat range 0–5% with a decreasing slope as the coverage increases. Histograms at the top of the graph demonstrates allele prior probability distribution forreference databases of target clinically significant variants build based on BIC and CFTR2 databases for BRCA1/2 and CFTR genes respectively. Influenceon coverage uniformity was assessed by simulating data with log-normal coverage distribution across fixed count of variant sites with varying standarddeviation (�) and fixed mean coverage at 5×, 15×, 60× and 500×. Variant allele prior probabilities followed uniform distribution during simulation. (E).Simulating data with allele prior probability distribution resembling the ones for BRCA1/2 and CFTR variants introduces variation in sensitivity (F),which increases as coverage distribution standard deviation grows up.
Dow
nloaded from https://academ
ic.oup.com/nar/article/47/21/e135/5568209 by guest on 25 January 2022

PAGE 7 OF 15 Nucleic Acids Research, 2019, Vol. 47, No. 21 e135
Figure 3. Data used for EphaGen validation. (A) A total of 504 publically available datasets from 11 different SRA projects were downloaded to estimatesensitivity calculation performance, representing 11 different target capture strategies. In addition, 43 datasets were generated employing Ampliseq CustomDesign panel, targeting only BRCA1/2, ATM and CHEK2 genes. Diverse panels were characterized with diverse coverage of reference variant database (seemain text for calculation methods), thus, limiting their sensitivity for detection of thereof. P-values calculation was based on t-test for difference betweenparameter distribution across datasets from single project versus parameter distribution across datasets generated employing specific panel, excludingdatasets from that project. Histograms (B, C) demonstrates differences between parameter distribution (mean coverage – B and coverage uniformitycalculated as evenness score – C) across different loci, noting that coverage uniformity is far from ubiquitous across the whole target regions.
Dow
nloaded from https://academ
ic.oup.com/nar/article/47/21/e135/5568209 by guest on 25 January 2022
e135 Nucleic Acids Research, 2019, Vol. 47, No. 21 PAGE 8 OF 15
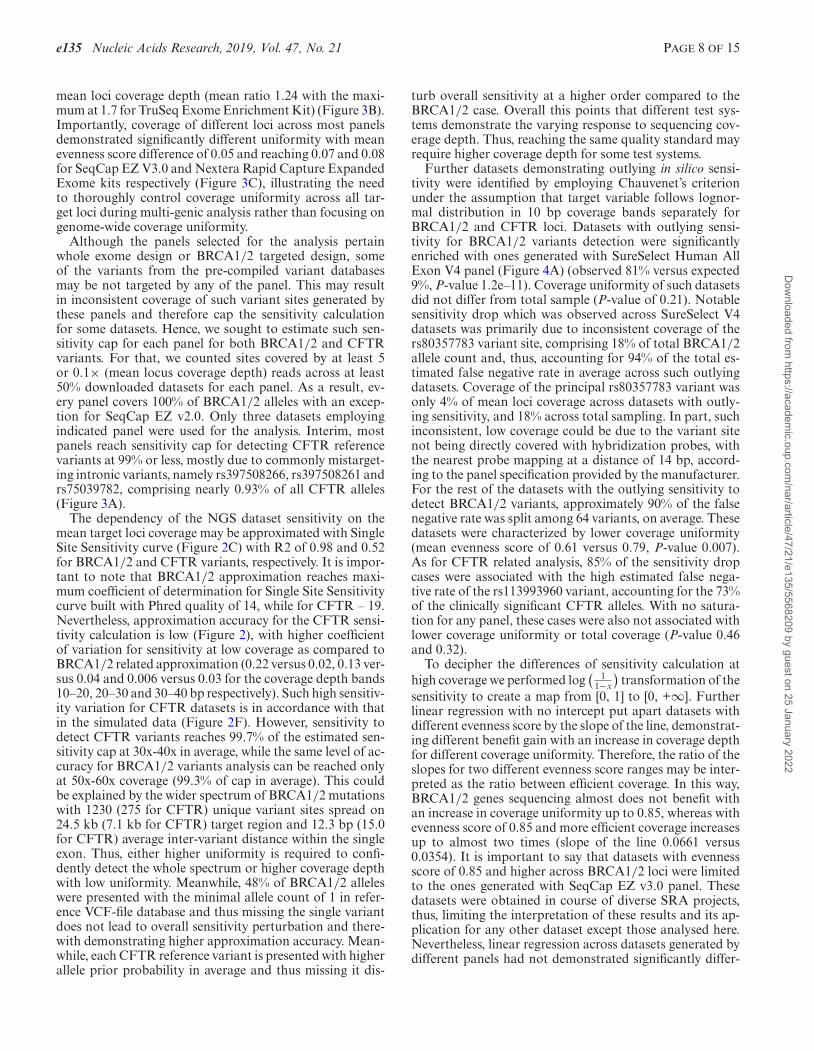
mean loci coverage depth (mean ratio 1.24 with the maxi-mum at 1.7 for TruSeq Exome Enrichment Kit) (Figure 3B).Importantly, coverage of different loci across most panelsdemonstrated significantly different uniformity with meanevenness score difference of 0.05 and reaching 0.07 and 0.08for SeqCap EZ V3.0 and Nextera Rapid Capture ExpandedExome kits respectively (Figure 3C), illustrating the needto thoroughly control coverage uniformity across all tar-get loci during multi-genic analysis rather than focusing ongenome-wide coverage uniformity.
Although the panels selected for the analysis pertainwhole exome design or BRCA1/2 targeted design, someof the variants from the pre-compiled variant databasesmay be not targeted by any of the panel. This may resultin inconsistent coverage of such variant sites generated bythese panels and therefore cap the sensitivity calculationfor some datasets. Hence, we sought to estimate such sen-sitivity cap for each panel for both BRCA1/2 and CFTRvariants. For that, we counted sites covered by at least 5or 0.1× (mean locus coverage depth) reads across at least50% downloaded datasets for each panel. As a result, ev-ery panel covers 100% of BRCA1/2 alleles with an excep-tion for SeqCap EZ v2.0. Only three datasets employingindicated panel were used for the analysis. Interim, mostpanels reach sensitivity cap for detecting CFTR referencevariants at 99% or less, mostly due to commonly mistarget-ing intronic variants, namely rs397508266, rs397508261 andrs75039782, comprising nearly 0.93% of all CFTR alleles(Figure 3A).
The dependency of the NGS dataset sensitivity on themean target loci coverage may be approximated with SingleSite Sensitivity curve (Figure 2C) with R2 of 0.98 and 0.52for BRCA1/2 and CFTR variants, respectively. It is impor-tant to note that BRCA1/2 approximation reaches maxi-mum coefficient of determination for Single Site Sensitivitycurve built with Phred quality of 14, while for CFTR – 19.Nevertheless, approximation accuracy for the CFTR sensi-tivity calculation is low (Figure 2), with higher coefficientof variation for sensitivity at low coverage as compared toBRCA1/2 related approximation (0.22 versus 0.02, 0.13 ver-sus 0.04 and 0.006 versus 0.03 for the coverage depth bands10–20, 20–30 and 30–40 bp respectively). Such high sensitiv-ity variation for CFTR datasets is in accordance with thatin the simulated data (Figure 2F). However, sensitivity todetect CFTR variants reaches 99.7% of the estimated sen-sitivity cap at 30x-40x in average, while the same level of ac-curacy for BRCA1/2 variants analysis can be reached onlyat 50x-60x coverage (99.3% of cap in average). This couldbe explained by the wider spectrum of BRCA1/2 mutationswith 1230 (275 for CFTR) unique variant sites spread on24.5 kb (7.1 kb for CFTR) target region and 12.3 bp (15.0for CFTR) average inter-variant distance within the singleexon. Thus, either higher uniformity is required to confi-dently detect the whole spectrum or higher coverage depthwith low uniformity. Meanwhile, 48% of BRCA1/2 alleleswere presented with the minimal allele count of 1 in refer-ence VCF-file database and thus missing the single variantdoes not lead to overall sensitivity perturbation and there-with demonstrating higher approximation accuracy. Mean-while, each CFTR reference variant is presented with higherallele prior probability in average and thus missing it dis-
turb overall sensitivity at a higher order compared to theBRCA1/2 case. Overall this points that different test sys-tems demonstrate the varying response to sequencing cov-erage depth. Thus, reaching the same quality standard mayrequire higher coverage depth for some test systems.
Further datasets demonstrating outlying in silico sensi-tivity were identified by employing Chauvenet’s criterionunder the assumption that target variable follows lognor-mal distribution in 10 bp coverage bands separately forBRCA1/2 and CFTR loci. Datasets with outlying sensi-tivity for BRCA1/2 variants detection were significantlyenriched with ones generated with SureSelect Human AllExon V4 panel (Figure 4A) (observed 81% versus expected9%, P-value 1.2e–11). Coverage uniformity of such datasetsdid not differ from total sample (P-value of 0.21). Notablesensitivity drop which was observed across SureSelect V4datasets was primarily due to inconsistent coverage of thers80357783 variant site, comprising 18% of total BRCA1/2allele count and, thus, accounting for 94% of the total es-timated false negative rate in average across such outlyingdatasets. Coverage of the principal rs80357783 variant wasonly 4% of mean loci coverage across datasets with outly-ing sensitivity, and 18% across total sampling. In part, suchinconsistent, low coverage could be due to the variant sitenot being directly covered with hybridization probes, withthe nearest probe mapping at a distance of 14 bp, accord-ing to the panel specification provided by the manufacturer.For the rest of the datasets with the outlying sensitivity todetect BRCA1/2 variants, approximately 90% of the falsenegative rate was split among 64 variants, on average. Thesedatasets were characterized by lower coverage uniformity(mean evenness score of 0.61 versus 0.79, P-value 0.007).As for CFTR related analysis, 85% of the sensitivity dropcases were associated with the high estimated false nega-tive rate of the rs113993960 variant, accounting for the 73%of the clinically significant CFTR alleles. With no satura-tion for any panel, these cases were also not associated withlower coverage uniformity or total coverage (P-value 0.46and 0.32).
To decipher the differences of sensitivity calculation athigh coverage we performed log
( 11−x
)transformation of the
sensitivity to create a map from [0, 1] to [0, +∞]. Furtherlinear regression with no intercept put apart datasets withdifferent evenness score by the slope of the line, demonstrat-ing different benefit gain with an increase in coverage depthfor different coverage uniformity. Therefore, the ratio of theslopes for two different evenness score ranges may be inter-preted as the ratio between efficient coverage. In this way,BRCA1/2 genes sequencing almost does not benefit withan increase in coverage uniformity up to 0.85, whereas withevenness score of 0.85 and more efficient coverage increasesup to almost two times (slope of the line 0.0661 versus0.0354). It is important to say that datasets with evennessscore of 0.85 and higher across BRCA1/2 loci were limitedto the ones generated with SeqCap EZ v3.0 panel. Thesedatasets were obtained in course of diverse SRA projects,thus, limiting the interpretation of these results and its ap-plication for any other dataset except those analysed here.Nevertheless, linear regression across datasets generated bydifferent panels had not demonstrated significantly differ-
Dow
nloaded from https://academ
ic.oup.com/nar/article/47/21/e135/5568209 by guest on 25 January 2022
PAGE 9 OF 15 Nucleic Acids Research, 2019, Vol. 47, No. 21 e135
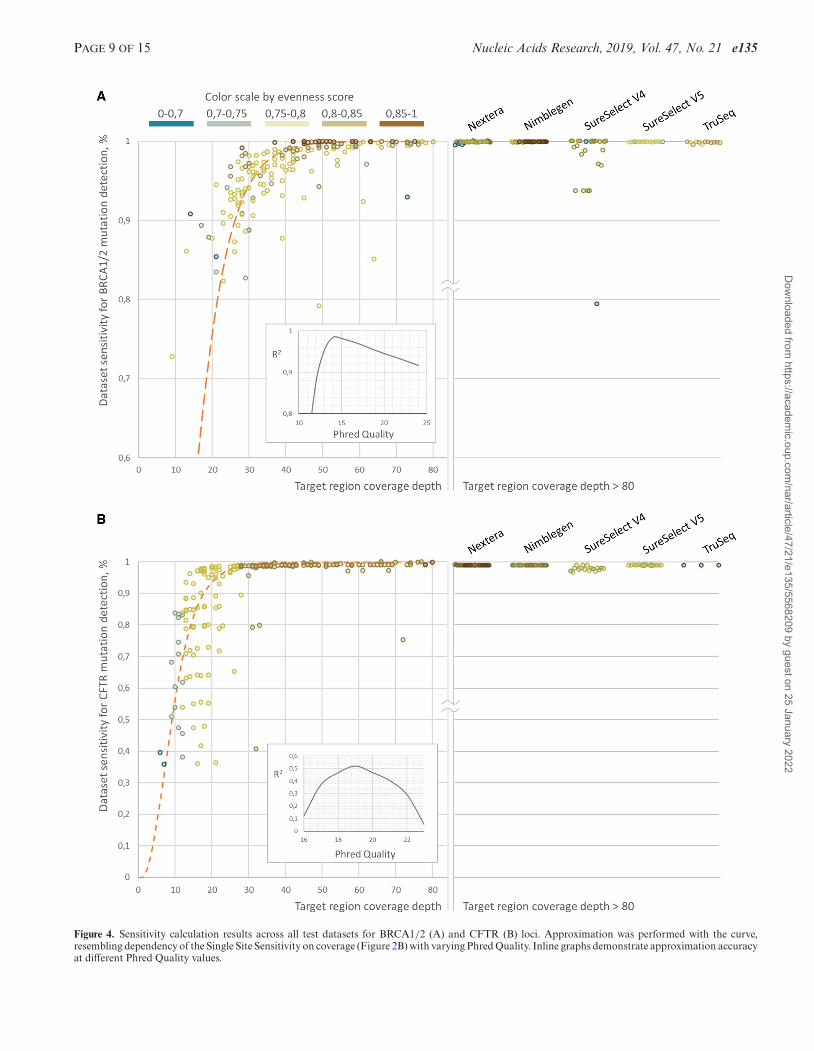
Figure 4. Sensitivity calculation results across all test datasets for BRCA1/2 (A) and CFTR (B) loci. Approximation was performed with the curve,resembling dependency of the Single Site Sensitivity on coverage (Figure 2B) with varying Phred Quality. Inline graphs demonstrate approximation accuracyat different Phred Quality values.
Dow
nloaded from https://academ
ic.oup.com/nar/article/47/21/e135/5568209 by guest on 25 January 2022
e135 Nucleic Acids Research, 2019, Vol. 47, No. 21 PAGE 10 OF 15
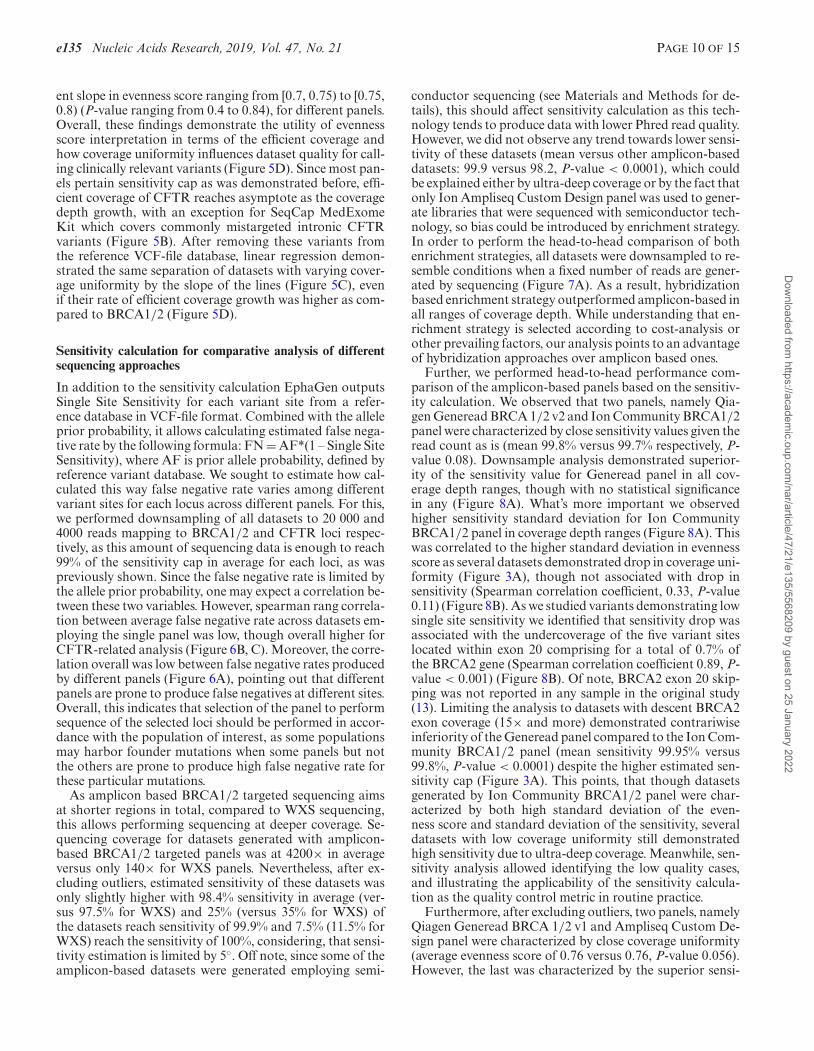
ent slope in evenness score ranging from [0.7, 0.75) to [0.75,0.8) (P-value ranging from 0.4 to 0.84), for different panels.Overall, these findings demonstrate the utility of evennessscore interpretation in terms of the efficient coverage andhow coverage uniformity influences dataset quality for call-ing clinically relevant variants (Figure 5D). Since most pan-els pertain sensitivity cap as was demonstrated before, effi-cient coverage of CFTR reaches asymptote as the coveragedepth growth, with an exception for SeqCap MedExomeKit which covers commonly mistargeted intronic CFTRvariants (Figure 5B). After removing these variants fromthe reference VCF-file database, linear regression demon-strated the same separation of datasets with varying cover-age uniformity by the slope of the lines (Figure 5C), evenif their rate of efficient coverage growth was higher as com-pared to BRCA1/2 (Figure 5D).
Sensitivity calculation for comparative analysis of differentsequencing approaches
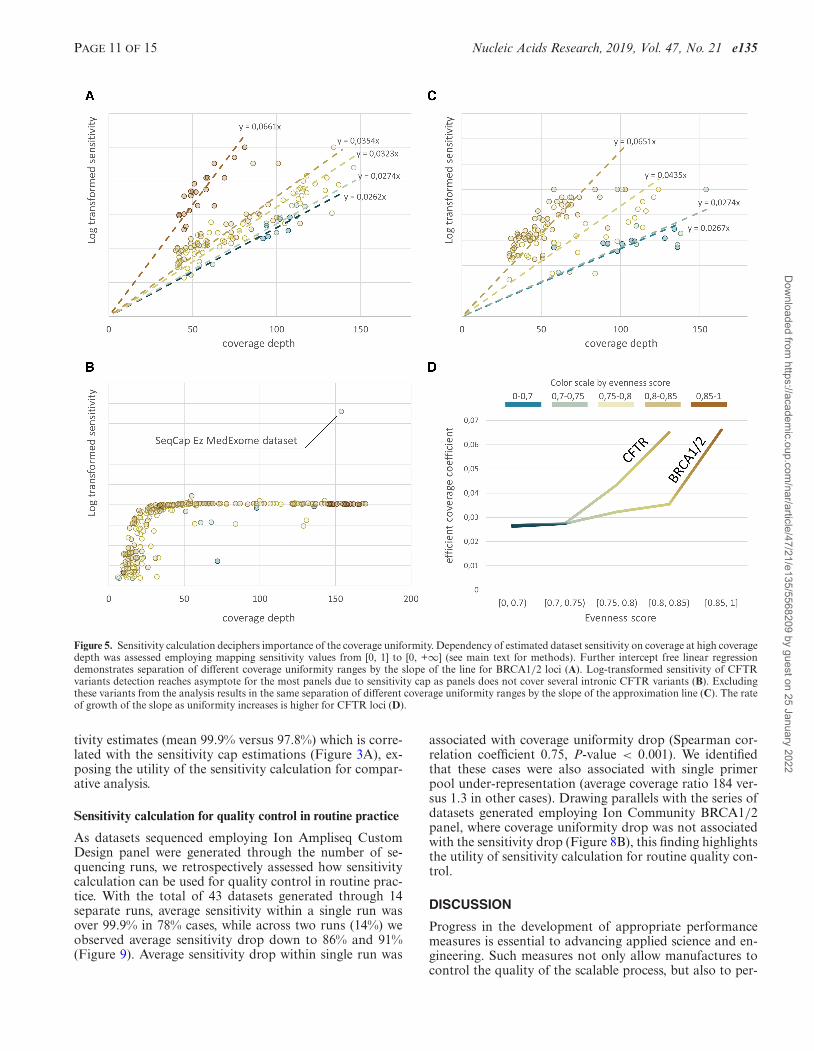
In addition to the sensitivity calculation EphaGen outputsSingle Site Sensitivity for each variant site from a refer-ence database in VCF-file format. Combined with the alleleprior probability, it allows calculating estimated false nega-tive rate by the following formula: FN = AF*(1 – Single SiteSensitivity), where AF is prior allele probability, defined byreference variant database. We sought to estimate how cal-culated this way false negative rate varies among differentvariant sites for each locus across different panels. For this,we performed downsampling of all datasets to 20 000 and4000 reads mapping to BRCA1/2 and CFTR loci respec-tively, as this amount of sequencing data is enough to reach99% of the sensitivity cap in average for each loci, as waspreviously shown. Since the false negative rate is limited bythe allele prior probability, one may expect a correlation be-tween these two variables. However, spearman rang correla-tion between average false negative rate across datasets em-ploying the single panel was low, though overall higher forCFTR-related analysis (Figure 6B, C). Moreover, the corre-lation overall was low between false negative rates producedby different panels (Figure 6A), pointing out that differentpanels are prone to produce false negatives at different sites.Overall, this indicates that selection of the panel to performsequence of the selected loci should be performed in accor-dance with the population of interest, as some populationsmay harbor founder mutations when some panels but notthe others are prone to produce high false negative rate forthese particular mutations.
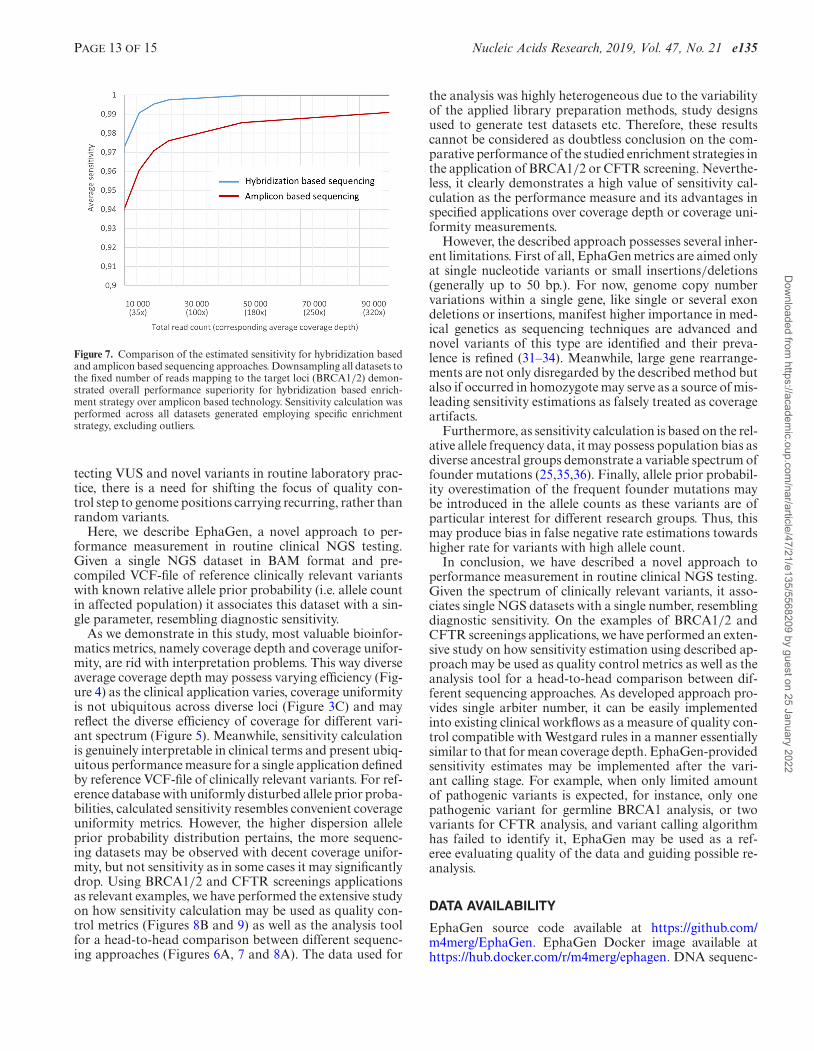
As amplicon based BRCA1/2 targeted sequencing aimsat shorter regions in total, compared to WXS sequencing,this allows performing sequencing at deeper coverage. Se-quencing coverage for datasets generated with amplicon-based BRCA1/2 targeted panels was at 4200× in averageversus only 140× for WXS panels. Nevertheless, after ex-cluding outliers, estimated sensitivity of these datasets wasonly slightly higher with 98.4% sensitivity in average (ver-sus 97.5% for WXS) and 25% (versus 35% for WXS) ofthe datasets reach sensitivity of 99.9% and 7.5% (11.5% forWXS) reach the sensitivity of 100%, considering, that sensi-tivity estimation is limited by 5◦. Off note, since some of theamplicon-based datasets were generated employing semi-
conductor sequencing (see Materials and Methods for de-tails), this should affect sensitivity calculation as this tech-nology tends to produce data with lower Phred read quality.However, we did not observe any trend towards lower sensi-tivity of these datasets (mean versus other amplicon-baseddatasets: 99.9 versus 98.2, P-value < 0.0001), which couldbe explained either by ultra-deep coverage or by the fact thatonly Ion Ampliseq Custom Design panel was used to gener-ate libraries that were sequenced with semiconductor tech-nology, so bias could be introduced by enrichment strategy.In order to perform the head-to-head comparison of bothenrichment strategies, all datasets were downsampled to re-semble conditions when a fixed number of reads are gener-ated by sequencing (Figure 7A). As a result, hybridizationbased enrichment strategy outperformed amplicon-based inall ranges of coverage depth. While understanding that en-richment strategy is selected according to cost-analysis orother prevailing factors, our analysis points to an advantageof hybridization approaches over amplicon based ones.
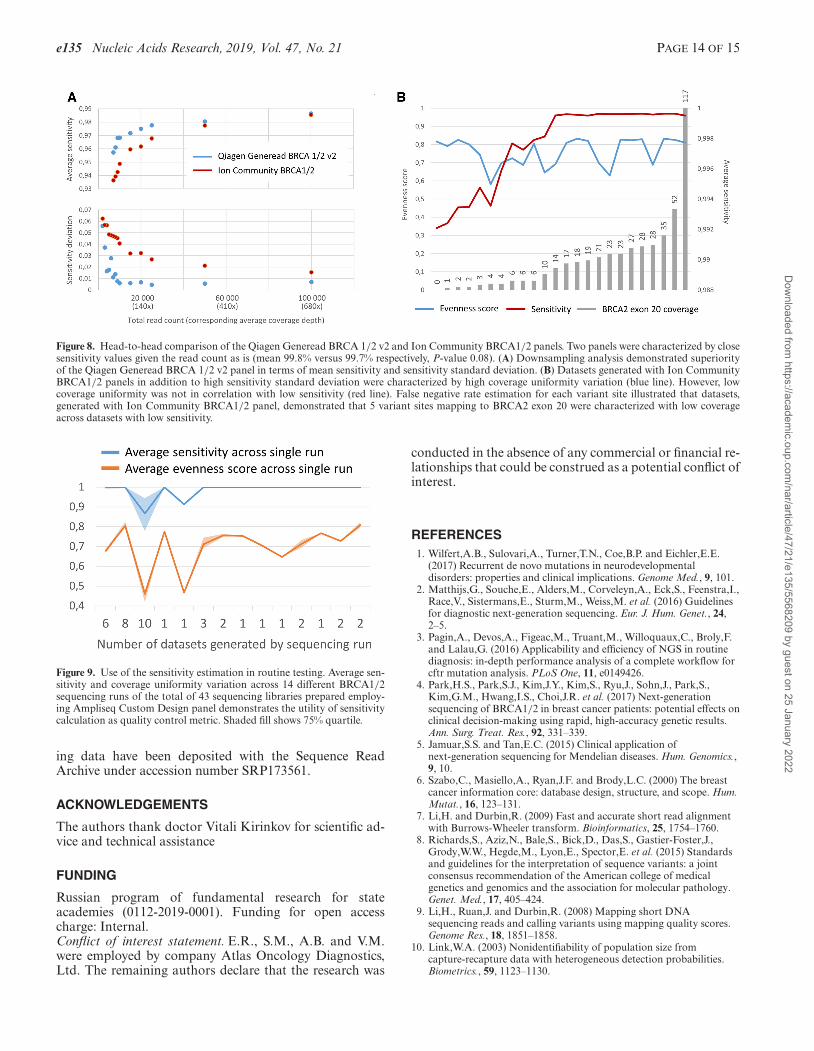
Further, we performed head-to-head performance com-parison of the amplicon-based panels based on the sensitiv-ity calculation. We observed that two panels, namely Qia-gen Generead BRCA 1/2 v2 and Ion Community BRCA1/2panel were characterized by close sensitivity values given theread count as is (mean 99.8% versus 99.7% respectively, P-value 0.08). Downsample analysis demonstrated superior-ity of the sensitivity value for Generead panel in all cov-erage depth ranges, though with no statistical significancein any (Figure 8A). What’s more important we observedhigher sensitivity standard deviation for Ion CommunityBRCA1/2 panel in coverage depth ranges (Figure 8A). Thiswas correlated to the higher standard deviation in evennessscore as several datasets demonstrated drop in coverage uni-formity (Figure 3A), though not associated with drop insensitivity (Spearman correlation coefficient, 0.33, P-value0.11) (Figure 8B). As we studied variants demonstrating lowsingle site sensitivity we identified that sensitivity drop wasassociated with the undercoverage of the five variant siteslocated within exon 20 comprising for a total of 0.7% ofthe BRCA2 gene (Spearman correlation coefficient 0.89, P-value < 0.001) (Figure 8B). Of note, BRCA2 exon 20 skip-ping was not reported in any sample in the original study(13). Limiting the analysis to datasets with descent BRCA2exon coverage (15× and more) demonstrated contrariwiseinferiority of the Generead panel compared to the Ion Com-munity BRCA1/2 panel (mean sensitivity 99.95% versus99.8%, P-value < 0.0001) despite the higher estimated sen-sitivity cap (Figure 3A). This points, that though datasetsgenerated by Ion Community BRCA1/2 panel were char-acterized by both high standard deviation of the even-ness score and standard deviation of the sensitivity, severaldatasets with low coverage uniformity still demonstratedhigh sensitivity due to ultra-deep coverage. Meanwhile, sen-sitivity analysis allowed identifying the low quality cases,and illustrating the applicability of the sensitivity calcula-tion as the quality control metric in routine practice.
Furthermore, after excluding outliers, two panels, namelyQiagen Generead BRCA 1/2 v1 and Ampliseq Custom De-sign panel were characterized by close coverage uniformity(average evenness score of 0.76 versus 0.76, P-value 0.056).However, the last was characterized by the superior sensi-
Dow
nloaded from https://academ
ic.oup.com/nar/article/47/21/e135/5568209 by guest on 25 January 2022
PAGE 11 OF 15 Nucleic Acids Research, 2019, Vol. 47, No. 21 e135
Figure 5. Sensitivity calculation deciphers importance of the coverage uniformity. Dependency of estimated dataset sensitivity on coverage at high coveragedepth was assessed employing mapping sensitivity values from [0, 1] to [0, +∞] (see main text for methods). Further intercept free linear regressiondemonstrates separation of different coverage uniformity ranges by the slope of the line for BRCA1/2 loci (A). Log-transformed sensitivity of CFTRvariants detection reaches asymptote for the most panels due to sensitivity cap as panels does not cover several intronic CFTR variants (B). Excludingthese variants from the analysis results in the same separation of different coverage uniformity ranges by the slope of the approximation line (C). The rateof growth of the slope as uniformity increases is higher for CFTR loci (D).
tivity estimates (mean 99.9% versus 97.8%) which is corre-lated with the sensitivity cap estimations (Figure 3A), ex-posing the utility of the sensitivity calculation for compar-ative analysis.
Sensitivity calculation for quality control in routine practice
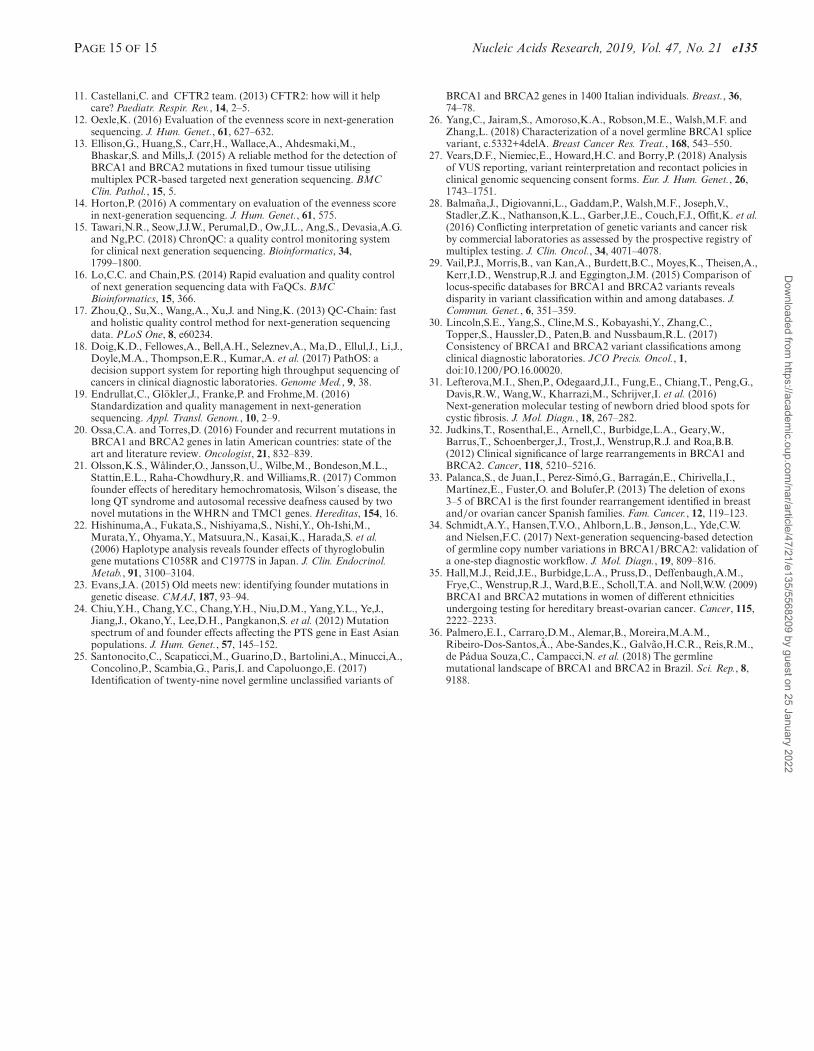
As datasets sequenced employing Ion Ampliseq CustomDesign panel were generated through the number of se-quencing runs, we retrospectively assessed how sensitivitycalculation can be used for quality control in routine prac-tice. With the total of 43 datasets generated through 14separate runs, average sensitivity within a single run wasover 99.9% in 78% cases, while across two runs (14%) weobserved average sensitivity drop down to 86% and 91%(Figure 9). Average sensitivity drop within single run was
associated with coverage uniformity drop (Spearman cor-relation coefficient 0.75, P-value < 0.001). We identifiedthat these cases were also associated with single primerpool under-representation (average coverage ratio 184 ver-sus 1.3 in other cases). Drawing parallels with the series ofdatasets generated employing Ion Community BRCA1/2panel, where coverage uniformity drop was not associatedwith the sensitivity drop (Figure 8B), this finding highlightsthe utility of sensitivity calculation for routine quality con-trol.
DISCUSSION
Progress in the development of appropriate performancemeasures is essential to advancing applied science and en-gineering. Such measures not only allow manufactures tocontrol the quality of the scalable process, but also to per-
Dow
nloaded from https://academ
ic.oup.com/nar/article/47/21/e135/5568209 by guest on 25 January 2022
e135 Nucleic Acids Research, 2019, Vol. 47, No. 21 PAGE 12 OF 15
Figure 6. Use of the EphaGen to decipher differences between target panels. During sensitivity calculation false negative rate is estimated for each variantfrom reference database. As this rate is limited by the prior probability of the variant, one may expect correlation between these two values. Spearmanrang correlation was therefore calculated for all panels between their false negative rate as well as allele prior probability (A). (B, C) Top 40 variants byfrequency and corresponding average false negative rate for BRCA1/2 (B) and CFTR (C) related analysis.
form reasonable comparison between current solutions toadopt the best one. From this perspective, control metricsproviding a single arbiter number are beneficial as they al-low ubiquitous head-to-head comparison of complex sys-tems with numerous variables (14).
As NGS moves forward into routine medical genetics ex-periment, its clinical implementation requires higher qual-ity standards. Several recently developed bioinformaticscontrol metrics (15–18), do not go further than convenientmeasures of the percentage of aligned reads, percentage ofunique reads, percentage of bases corresponding to targeted
sequences, uniformity of coverage, density of clusters, andpercentage of targeted bases with no coverage (19). Thesemetrics treat all genome positions equally. Notably, disease-causing mutations tend to be found at certain positions,in particular due to founder effect (20–24), and also tofunctional constraints. Considering that novel variants aretough for confident classification as pathogenic (11,25,26)and, in absence of segregation data, may require additionallaboratory research (11), while variants of uncertain signifi-cance (VUS) not always can be directly translated into clini-cal recommendations (27–30). Without de-emphasizing de-
Dow
nloaded from https://academ
ic.oup.com/nar/article/47/21/e135/5568209 by guest on 25 January 2022
PAGE 13 OF 15 Nucleic Acids Research, 2019, Vol. 47, No. 21 e135
Figure 7. Comparison of the estimated sensitivity for hybridization basedand amplicon based sequencing approaches. Downsampling all datasets tothe fixed number of reads mapping to the target loci (BRCA1/2) demon-strated overall performance superiority for hybridization based enrich-ment strategy over amplicon based technology. Sensitivity calculation wasperformed across all datasets generated employing specific enrichmentstrategy, excluding outliers.
tecting VUS and novel variants in routine laboratory prac-tice, there is a need for shifting the focus of quality con-trol step to genome positions carrying recurring, rather thanrandom variants.
Here, we describe EphaGen, a novel approach to per-formance measurement in routine clinical NGS testing.Given a single NGS dataset in BAM format and pre-compiled VCF-file of reference clinically relevant variantswith known relative allele prior probability (i.e. allele countin affected population) it associates this dataset with a sin-gle parameter, resembling diagnostic sensitivity.
As we demonstrate in this study, most valuable bioinfor-matics metrics, namely coverage depth and coverage unifor-mity, are rid with interpretation problems. This way diverseaverage coverage depth may possess varying efficiency (Fig-ure 4) as the clinical application varies, coverage uniformityis not ubiquitous across diverse loci (Figure 3C) and mayreflect the diverse efficiency of coverage for different vari-ant spectrum (Figure 5). Meanwhile, sensitivity calculationis genuinely interpretable in clinical terms and present ubiq-uitous performance measure for a single application definedby reference VCF-file of clinically relevant variants. For ref-erence database with uniformly disturbed allele prior proba-bilities, calculated sensitivity resembles convenient coverageuniformity metrics. However, the higher dispersion alleleprior probability distribution pertains, the more sequenc-ing datasets may be observed with decent coverage unifor-mity, but not sensitivity as in some cases it may significantlydrop. Using BRCA1/2 and CFTR screenings applicationsas relevant examples, we have performed the extensive studyon how sensitivity calculation may be used as quality con-trol metrics (Figures 8B and 9) as well as the analysis toolfor a head-to-head comparison between different sequenc-ing approaches (Figures 6A, 7 and 8A). The data used for
the analysis was highly heterogeneous due to the variabilityof the applied library preparation methods, study designsused to generate test datasets etc. Therefore, these resultscannot be considered as doubtless conclusion on the com-parative performance of the studied enrichment strategies inthe application of BRCA1/2 or CFTR screening. Neverthe-less, it clearly demonstrates a high value of sensitivity cal-culation as the performance measure and its advantages inspecified applications over coverage depth or coverage uni-formity measurements.
However, the described approach possesses several inher-ent limitations. First of all, EphaGen metrics are aimed onlyat single nucleotide variants or small insertions/deletions(generally up to 50 bp.). For now, genome copy numbervariations within a single gene, like single or several exondeletions or insertions, manifest higher importance in med-ical genetics as sequencing techniques are advanced andnovel variants of this type are identified and their preva-lence is refined (31–34). Meanwhile, large gene rearrange-ments are not only disregarded by the described method butalso if occurred in homozygote may serve as a source of mis-leading sensitivity estimations as falsely treated as coverageartifacts.
Furthermore, as sensitivity calculation is based on the rel-ative allele frequency data, it may possess population bias asdiverse ancestral groups demonstrate a variable spectrum offounder mutations (25,35,36). Finally, allele prior probabil-ity overestimation of the frequent founder mutations maybe introduced in the allele counts as these variants are ofparticular interest for different research groups. Thus, thismay produce bias in false negative rate estimations towardshigher rate for variants with high allele count.
In conclusion, we have described a novel approach toperformance measurement in routine clinical NGS testing.Given the spectrum of clinically relevant variants, it asso-ciates single NGS datasets with a single number, resemblingdiagnostic sensitivity. On the examples of BRCA1/2 andCFTR screenings applications, we have performed an exten-sive study on how sensitivity estimation using described ap-proach may be used as quality control metrics as well as theanalysis tool for a head-to-head comparison between dif-ferent sequencing approaches. As developed approach pro-vides single arbiter number, it can be easily implementedinto existing clinical workflows as a measure of quality con-trol compatible with Westgard rules in a manner essentiallysimilar to that for mean coverage depth. EphaGen-providedsensitivity estimates may be implemented after the vari-ant calling stage. For example, when only limited amountof pathogenic variants is expected, for instance, only onepathogenic variant for germline BRCA1 analysis, or twovariants for CFTR analysis, and variant calling algorithmhas failed to identify it, EphaGen may be used as a ref-eree evaluating quality of the data and guiding possible re-analysis.
DATA AVAILABILITY
EphaGen source code available at https://github.com/m4merg/EphaGen. EphaGen Docker image available athttps://hub.docker.com/r/m4merg/ephagen. DNA sequenc-
Dow
nloaded from https://academ
ic.oup.com/nar/article/47/21/e135/5568209 by guest on 25 January 2022
e135 Nucleic Acids Research, 2019, Vol. 47, No. 21 PAGE 14 OF 15
Figure 8. Head-to-head comparison of the Qiagen Generead BRCA 1/2 v2 and Ion Community BRCA1/2 panels. Two panels were characterized by closesensitivity values given the read count as is (mean 99.8% versus 99.7% respectively, P-value 0.08). (A) Downsampling analysis demonstrated superiorityof the Qiagen Generead BRCA 1/2 v2 panel in terms of mean sensitivity and sensitivity standard deviation. (B) Datasets generated with Ion CommunityBRCA1/2 panels in addition to high sensitivity standard deviation were characterized by high coverage uniformity variation (blue line). However, lowcoverage uniformity was not in correlation with low sensitivity (red line). False negative rate estimation for each variant site illustrated that datasets,generated with Ion Community BRCA1/2 panel, demonstrated that 5 variant sites mapping to BRCA2 exon 20 were characterized with low coverageacross datasets with low sensitivity.
Figure 9. Use of the sensitivity estimation in routine testing. Average sen-sitivity and coverage uniformity variation across 14 different BRCA1/2sequencing runs of the total of 43 sequencing libraries prepared employ-ing Ampliseq Custom Design panel demonstrates the utility of sensitivitycalculation as quality control metric. Shaded fill shows 75% quartile.
ing data have been deposited with the Sequence ReadArchive under accession number SRP173561.
ACKNOWLEDGEMENTS
The authors thank doctor Vitali Kirinkov for scientific ad-vice and technical assistance
FUNDING
Russian program of fundamental research for stateacademies (0112-2019-0001). Funding for open accesscharge: Internal.Conflict of interest statement. E.R., S.M., A.B. and V.M.were employed by company Atlas Oncology Diagnostics,Ltd. The remaining authors declare that the research was
conducted in the absence of any commercial or financial re-lationships that could be construed as a potential conflict ofinterest.
REFERENCES1. Wilfert,A.B., Sulovari,A., Turner,T.N., Coe,B.P. and Eichler,E.E.
(2017) Recurrent de novo mutations in neurodevelopmentaldisorders: properties and clinical implications. Genome Med., 9, 101.
2. Matthijs,G., Souche,E., Alders,M., Corveleyn,A., Eck,S., Feenstra,I.,Race,V., Sistermans,E., Sturm,M., Weiss,M. et al. (2016) Guidelinesfor diagnostic next-generation sequencing. Eur. J. Hum. Genet., 24,2–5.
3. Pagin,A., Devos,A., Figeac,M., Truant,M., Willoquaux,C., Broly,F.and Lalau,G. (2016) Applicability and efficiency of NGS in routinediagnosis: in-depth performance analysis of a complete workflow forcftr mutation analysis. PLoS One, 11, e0149426.
4. Park,H.S., Park,S.J., Kim,J.Y., Kim,S., Ryu,J., Sohn,J., Park,S.,Kim,G.M., Hwang,I.S., Choi,J.R. et al. (2017) Next-generationsequencing of BRCA1/2 in breast cancer patients: potential effects onclinical decision-making using rapid, high-accuracy genetic results.Ann. Surg. Treat. Res., 92, 331–339.
5. Jamuar,S.S. and Tan,E.C. (2015) Clinical application ofnext-generation sequencing for Mendelian diseases. Hum. Genomics.,9, 10.
6. Szabo,C., Masiello,A., Ryan,J.F. and Brody,L.C. (2000) The breastcancer information core: database design, structure, and scope. Hum.Mutat., 16, 123–131.
7. Li,H. and Durbin,R. (2009) Fast and accurate short read alignmentwith Burrows-Wheeler transform. Bioinformatics, 25, 1754–1760.
8. Richards,S., Aziz,N., Bale,S., Bick,D., Das,S., Gastier-Foster,J.,Grody,W.W., Hegde,M., Lyon,E., Spector,E. et al. (2015) Standardsand guidelines for the interpretation of sequence variants: a jointconsensus recommendation of the American college of medicalgenetics and genomics and the association for molecular pathology.Genet. Med., 17, 405–424.
9. Li,H., Ruan,J. and Durbin,R. (2008) Mapping short DNAsequencing reads and calling variants using mapping quality scores.Genome Res., 18, 1851–1858.
10. Link,W.A. (2003) Nonidentifiability of population size fromcapture-recapture data with heterogeneous detection probabilities.Biometrics., 59, 1123–1130.
Dow
nloaded from https://academ
ic.oup.com/nar/article/47/21/e135/5568209 by guest on 25 January 2022
PAGE 15 OF 15 Nucleic Acids Research, 2019, Vol. 47, No. 21 e135
11. Castellani,C. and CFTR2 team. (2013) CFTR2: how will it helpcare? Paediatr. Respir. Rev., 14, 2–5.
12. Oexle,K. (2016) Evaluation of the evenness score in next-generationsequencing. J. Hum. Genet., 61, 627–632.
13. Ellison,G., Huang,S., Carr,H., Wallace,A., Ahdesmaki,M.,Bhaskar,S. and Mills,J. (2015) A reliable method for the detection ofBRCA1 and BRCA2 mutations in fixed tumour tissue utilisingmultiplex PCR-based targeted next generation sequencing. BMCClin. Pathol., 15, 5.
14. Horton,P. (2016) A commentary on evaluation of the evenness scorein next-generation sequencing. J. Hum. Genet., 61, 575.
15. Tawari,N.R., Seow,J.J.W., Perumal,D., Ow,J.L., Ang,S., Devasia,A.G.and Ng,P.C. (2018) ChronQC: a quality control monitoring systemfor clinical next generation sequencing. Bioinformatics, 34,1799–1800.
16. Lo,C.C. and Chain,P.S. (2014) Rapid evaluation and quality controlof next generation sequencing data with FaQCs. BMCBioinformatics, 15, 366.
17. Zhou,Q., Su,X., Wang,A., Xu,J. and Ning,K. (2013) QC-Chain: fastand holistic quality control method for next-generation sequencingdata. PLoS One, 8, e60234.
18. Doig,K.D., Fellowes,A., Bell,A.H., Seleznev,A., Ma,D., Ellul,J., Li,J.,Doyle,M.A., Thompson,E.R., Kumar,A. et al. (2017) PathOS: adecision support system for reporting high throughput sequencing ofcancers in clinical diagnostic laboratories. Genome Med., 9, 38.
19. Endrullat,C., Glokler,J., Franke,P. and Frohme,M. (2016)Standardization and quality management in next-generationsequencing. Appl. Transl. Genom., 10, 2–9.
20. Ossa,C.A. and Torres,D. (2016) Founder and recurrent mutations inBRCA1 and BRCA2 genes in latin American countries: state of theart and literature review. Oncologist, 21, 832–839.
21. Olsson,K.S., Walinder,O., Jansson,U., Wilbe,M., Bondeson,M.L.,Stattin,E.L., Raha-Chowdhury,R. and Williams,R. (2017) Commonfounder effects of hereditary hemochromatosis, Wilson´s disease, thelong QT syndrome and autosomal recessive deafness caused by twonovel mutations in the WHRN and TMC1 genes. Hereditas, 154, 16.
22. Hishinuma,A., Fukata,S., Nishiyama,S., Nishi,Y., Oh-Ishi,M.,Murata,Y., Ohyama,Y., Matsuura,N., Kasai,K., Harada,S. et al.(2006) Haplotype analysis reveals founder effects of thyroglobulingene mutations C1058R and C1977S in Japan. J. Clin. Endocrinol.Metab., 91, 3100–3104.
23. Evans,J.A. (2015) Old meets new: identifying founder mutations ingenetic disease. CMAJ, 187, 93–94.
24. Chiu,Y.H., Chang,Y.C., Chang,Y.H., Niu,D.M., Yang,Y.L., Ye,J.,Jiang,J., Okano,Y., Lee,D.H., Pangkanon,S. et al. (2012) Mutationspectrum of and founder effects affecting the PTS gene in East Asianpopulations. J. Hum. Genet., 57, 145–152.
25. Santonocito,C., Scapaticci,M., Guarino,D., Bartolini,A., Minucci,A.,Concolino,P., Scambia,G., Paris,I. and Capoluongo,E. (2017)Identification of twenty-nine novel germline unclassified variants of
BRCA1 and BRCA2 genes in 1400 Italian individuals. Breast., 36,74–78.
26. Yang,C., Jairam,S., Amoroso,K.A., Robson,M.E., Walsh,M.F. andZhang,L. (2018) Characterization of a novel germline BRCA1 splicevariant, c.5332+4delA. Breast Cancer Res. Treat., 168, 543–550.
27. Vears,D.F., Niemiec,E., Howard,H.C. and Borry,P. (2018) Analysisof VUS reporting, variant reinterpretation and recontact policies inclinical genomic sequencing consent forms. Eur. J. Hum. Genet., 26,1743–1751.
28. Balmana,J., Digiovanni,L., Gaddam,P., Walsh,M.F., Joseph,V.,Stadler,Z.K., Nathanson,K.L., Garber,J.E., Couch,F.J., Offit,K. et al.(2016) Conflicting interpretation of genetic variants and cancer riskby commercial laboratories as assessed by the prospective registry ofmultiplex testing. J. Clin. Oncol., 34, 4071–4078.
29. Vail,P.J., Morris,B., van Kan,A., Burdett,B.C., Moyes,K., Theisen,A.,Kerr,I.D., Wenstrup,R.J. and Eggington,J.M. (2015) Comparison oflocus-specific databases for BRCA1 and BRCA2 variants revealsdisparity in variant classification within and among databases. J.Commun. Genet., 6, 351–359.
30. Lincoln,S.E., Yang,S., Cline,M.S., Kobayashi,Y., Zhang,C.,Topper,S., Haussler,D., Paten,B. and Nussbaum,R.L. (2017)Consistency of BRCA1 and BRCA2 variant classifications amongclinical diagnostic laboratories. JCO Precis. Oncol., 1,doi:10.1200/PO.16.00020.
31. Lefterova,M.I., Shen,P., Odegaard,J.I., Fung,E., Chiang,T., Peng,G.,Davis,R.W., Wang,W., Kharrazi,M., Schrijver,I. et al. (2016)Next-generation molecular testing of newborn dried blood spots forcystic fibrosis. J. Mol. Diagn., 18, 267–282.
32. Judkins,T., Rosenthal,E., Arnell,C., Burbidge,L.A., Geary,W.,Barrus,T., Schoenberger,J., Trost,J., Wenstrup,R.J. and Roa,B.B.(2012) Clinical significance of large rearrangements in BRCA1 andBRCA2. Cancer, 118, 5210–5216.
33. Palanca,S., de Juan,I., Perez-Simo,G., Barragan,E., Chirivella,I.,Martınez,E., Fuster,O. and Bolufer,P. (2013) The deletion of exons3–5 of BRCA1 is the first founder rearrangement identified in breastand/or ovarian cancer Spanish families. Fam. Cancer., 12, 119–123.
34. Schmidt,A.Y., Hansen,T.V.O., Ahlborn,L.B., Jønson,L., Yde,C.W.and Nielsen,F.C. (2017) Next-generation sequencing-based detectionof germline copy number variations in BRCA1/BRCA2: validation ofa one-step diagnostic workflow. J. Mol. Diagn., 19, 809–816.
35. Hall,M.J., Reid,J.E., Burbidge,L.A., Pruss,D., Deffenbaugh,A.M.,Frye,C., Wenstrup,R.J., Ward,B.E., Scholl,T.A. and Noll,W.W. (2009)BRCA1 and BRCA2 mutations in women of different ethnicitiesundergoing testing for hereditary breast-ovarian cancer. Cancer, 115,2222–2233.
36. Palmero,E.I., Carraro,D.M., Alemar,B., Moreira,M.A.M.,Ribeiro-Dos-Santos,A., Abe-Sandes,K., Galvao,H.C.R., Reis,R.M.,de Padua Souza,C., Campacci,N. et al. (2018) The germlinemutational landscape of BRCA1 and BRCA2 in Brazil. Sci. Rep., 8,9188.
Dow
nloaded from https://academ
ic.oup.com/nar/article/47/21/e135/5568209 by guest on 25 January 2022