Biogeochemical processes in intensive zero-effluent marine fish culture with recirculating aerobic...
14
This article was published in an Elsevier journal. The attached copy is furnished to the author for non-commercial research and education use, including for instruction at the author’s institution, sharing with colleagues and providing to institution administration. Other uses, including reproduction and distribution, or selling or licensing copies, or posting to personal, institutional or third party websites are prohibited. In most cases authors are permitted to post their version of the article (e.g. in Word or Tex form) to their personal website or institutional repository. Authors requiring further information regarding Elsevier’s archiving and manuscript policies are encouraged to visit: http://www.elsevier.com/copyright
Transcript of Biogeochemical processes in intensive zero-effluent marine fish culture with recirculating aerobic...

This article was published in an Elsevier journal. The attached copyis furnished to the author for non-commercial research and
education use, including for instruction at the author’s institution,sharing with colleagues and providing to institution administration.
Other uses, including reproduction and distribution, or selling orlicensing copies, or posting to personal, institutional or third party
websites are prohibited.
In most cases authors are permitted to post their version of thearticle (e.g. in Word or Tex form) to their personal website orinstitutional repository. Authors requiring further information
regarding Elsevier’s archiving and manuscript policies areencouraged to visit:
http://www.elsevier.com/copyright

Author's personal copy
Biogeochemical processes in intensive zero-effluent marine fishculture with recirculating aerobic and anaerobic biofilters
Amir Neori a,⁎, Michael D. Krom b, Jaap van Rijn c
a Israel Oceanographic and Limnological Research, The National Centre for Mariculture, P.O. Box 1212, Eilat 88112, Israelb Earth and Biosphere Institute, School of Earth and Environment, Leeds University, Leeds LS2 9JT, United Kingdom
c Department of Animal Sciences, Faculty of Agricultural, Food and Environmental Quality Sciences,The Hebrew University of Jerusalem, Rehovot 76100, Israel
Received 14 December 2006; received in revised form 11 April 2007; accepted 20 May 2007
Abstract
The biogeochemical processes that drive nutrient transformations and recycling in organic marine sediment–water environmentswere studied for 17 months in a zero-effluent intensive recirculating culture system. The system consisted of a 10 m3 gilthead seabream(Sparus aurata) tank coupled to aerobic and anaerobic water treatment elements. Nutrients and alkalinity weremeasured in the system toquantify the main biogeochemical processes. Fractions of the carbon fed in feed were found in fish (18.3%) and in sludge (11%); themissing carbon was respired by fish (45%) and by aerobic (8.4%) and anaerobic (7.7%) microorganisms. Fractions of the nitrogen fed infeed were found in fish (15.4%) and in sludge (14.3%); the missing nitrogen was eliminated by nitrification–denitrification. Most of thephosphorus and ash fed in feed and not found in fish accumulatedwithin the sludge in the system. The rates of nitrification, denitrificationand sulphate reduction increased with time, reaching 0.3 g N m−2 d−1, 53 g N m−2 d−1 and 145 g S m−2 d−1, respectively. Nitrificationdeveloped more rapidly than denitrification, leading at first to nitrate accumulation (to 20 mmol NO3 l
−1 by day 200) and a decrease inalkalinity. Once denitrification surpassed nitrification, nitrate concentrations decreased, eventually being reduced to b0.3mmol NO3 l
−1
by day 510, and alkalinity stabilized. Toxic hydrogen sulphide, generated within the anaerobic sludge, was oxidized by oxygen andnitrate as it diffused through the anaerobic–aerobic sediment–water interface.When nitrate levels in the water above the sludge droppedbelow 2 mmol l−1, sulphide was also oxidized in the fluidized bed reactor. Denitrification reduced nitrate in the water, respired (jointlywith sulphate reduction) carbon in the sludge, oxidized the hydrogen sulphide, and contributed to stabilization of alkalinity andaccumulation of polyphosphate in bacteria as a major sink of labile P.© 2007 Elsevier B.V. All rights reserved.
Keywords: Alkalinity; Fish waste treatment; Nitrification–denitrification; Nutrients; Polyphosphate accumulation; Sludge; Sparus aurata; Sulphatereduction
1. Introduction
The same microbial processes that occur naturally inorganic-rich aerobic and anaerobic environments alsooccur in intensive aquaculture systems (van Rijn, 1996).
The observations from controlled fish culture systemsprovide insights into microbial processes and interactionsdriving the environmental situation in heavily-loadednatural ecosystems. The present study in a novel seawaterfish culture system that does not require water discharge,quantified biogeochemical processes by long-term nutri-ent and alkalinity profiles and budgets. This approach hasbeen useful to understand water quality processes and
Journal of Experimental Marine Biology and Ecology 349 (2007) 235–247www.elsevier.com/locate/jembe
⁎ Corresponding author. Tel.: +972 8 6361445; fax: +972 8 6375761.E-mail address: [email protected] (A. Neori).
0022-0981/$ - see front matter © 2007 Elsevier B.V. All rights reserved.doi:10.1016/j.jembe.2007.05.023

Author's personal copy
problems in intensive aquaculture systems (e.g., Kromand Neori, 1989; Thoman et al., 2001). Specifically, suchstudies enable pinpointing of the principle biogeochem-ical processes within such systems (e.g., Krom, 1991).Several of the main processes occurring in sedimentsinvolve stoichiometric changes in alkalinity, a feature thatprovides additional information in the quantitativeelucidation of the biogeochemical processes takingplace (Lazar et al., 1989).
Modern fish mariculture is increasingly criticized forits non-sustainability (Aldhous, 2004). It is practicedalmost exclusively in flow-through systems such as cagesand ponds often in a narrow and heavily populated beltalong the coast. Mariculture is subject to publiccontroversy, since it generally discharges effluentswithout pollutant removal (Naylor et al., 1998). Recircu-lating aquaculture technology can overcome many ofaquaculture's economic and environmental limitations,because it combines good regulation of the water qualitycharacteristics with high fish yields, low water use andminimal nutrient export (Saylor et al., 1991; van Rijn,1996; Gutierrez-Wing and Malone, 2006).
The advanced biofilter system of recirculating aqua-culture used in the present study is attractive for bothfreshwater fish (Shnel et al., 2002) and marine fish(Gelfand et al., 2003). The design consists of a fish basinstocked at high fish density. Water from this basincirculates through an aerobic nitrifying filter and throughan anaerobic loop, with a sedimentation/digestion basinand a fluidized bed reactor. A particular novelty of thedesign is the use of the organic fish waste as the carbonand energy source for nitrate reduction (van Rijn, 1996).This feature results in minimal environmental pollutionand near zero water discharge, without addition of foreignchemicals (e.g., methanol) to enhance microbial respira-tion. It is possible to operate this system for prolongedperiods with water quality parameters remaining withinthe range of values acceptable for intensive fish culture(Shnel et al., 2002; Gelfand et al., 2003).
An important limitation in the large-scale applicationof the recirculating fishculture approach is the scarcity ofinformation on the microbial populations and processesthat drive them (Blancheton, 2000). Previous studies onthis particular system have looked in detail at severalindividual microbial processes that occur in variousmodules of the system (e.g., Barak et al., 2003; Gelfandet al., 2003; Cytryn et al., 2003, 2005, 2006). In thepresent study, biogeochemical processes were quantifiedthrough long-term nutrient and alkalinity profiles andbudgets. It was found that the closed environment of thefish culture system allowed a fairly accurate estimation ofthe contribution of the main biochemical processes
involved in carbon, nitrogen, sulphur and phosphorustransformations. Processes and rates were compared tothose occurring in natural hypertrophic marineenvironments.
2. Materials and methods
2.1. Fish culture system
2.1.1. ConfigurationThe physical setup has been described in detail
(Gelfand et al., 2003; Cytryn et al., 2005). It comprisedthe following components (Fig. 1): (1) a round 10,000 lpolypropylene fish production basin (FT), 3 mdiameter×1.5 m depth; (2) a sedimentation basin (SB),9.5 m length×0.5 m width×0.3–0.4 m depth; workingvolume: 1.5–2 m3; (3) a cube-shaped trickling filter (TF),containing 3.8 m3 of a PVC cross-flow medium with aspecific surface area of 240 m2 m−3 (Jerushalmi Ltd.,Israel); (4) a fluidized bed reactor (FBR), made of aPerspex column, 200 l volume, 2 m height, 36 cmdiameter. The reactor was filled as bacterial carriermaterial with several kg sand (N97% SiO2) of 1.1 mmgrain diameter (15% of grains N1.4 mm and 10% ofgrains b0.85 mm). The systemwas designed to handle upto 6 kg d−1 of fish feed input. Gilthead seabream (Sparusaurata) were cultured from May 2000 to August 2001.The fish were stocked several times to replace mortalitiesand to increase fish density as the system matured andwater quality stabilized.
Fig. 1. A basic schematic of the main components (not to scale),dimensions and water flow rates of the studied facility. Solid arrowsmark water flows.
236 A. Neori et al. / Journal of Experimental Marine Biology and Ecology 349 (2007) 235–247

Author's personal copy
2.1.2. OperationSeawater pumped from the nearby ultra-oligotrophic
Gulf of Aqaba (Eilat) filled the system and compensatedfor water spills and dilutions of the culture water. Tapwater diluted the seawater to 36 parts per thousands (ppt)from its N40 ppt natural salinity. Tap water compensatedfor evaporation loss, which was intense in the summer.Two water loops constituted the water recirculation(Fig. 1). In the aerobic loop, water from the top of theFTwas pumped and sprinkled over the TF at a rate of 15–20 m3 h−1 and drained back to the top of the FT. In theanaerobic loop, the sediment-laden water from thebottom-center of the FT was continuously withdrawnthrough a standpipe into the SB. From there it waspumped at a rate of 1.8–2.4 m3 h−1 upward through theFBR and into the TF intake. A flow of about 2.4m3 h−1 ofthe FTwater was diverted from themain pump's flow intoa foam fractionator (model: TF8AZ, Top Fathom Ltd,USA) for clarification. The force of the water returningfrom the trickling filter drove a circular water velocity ofbetween 30 and 40 cm s−1 at the circumference of the FT.Ozone (Pacific Ozone Model G11 ozone generator)injected into the foam fractionator disinfected all makeupwater. The TF outflow water was enriched, whennecessary, with pure oxygen from a liquid oxygen tank.A 1 hp blower drove air upward through the trickling filterfor cooling.An automaticmonitoring/alarm system (PointFour, Port Moody, BC, Canada) monitored water level,DO, pH and temperature. Additional measurements ofDO were made with a portable Handy Gamma Meter(OxyGuard International A/S, Blokken, Denmark). Thefish were fed a commercial feed (Matmor Ltd., EvtachIsrael) with 8%water (105 °C), 44% carbon, 45% protein(7.2% N), 19.5% lipid, 1.4% phosphorus (P), and 5 kcalenergy g−1. Feed was offered according to a standardfeeding table (Lupatsch and Kissil, 1998, 2001), based onthe average fish density, size and average watertemperature. Seabream of the size range used in thisstudy and fed this diet contain on average 317 g OM,212 g C, 27.2 g N, 7.2 g P, 43 g ash and 2100 mega-calenergy per kilogram live weight (Lupatsch and Kissil,1998, 2001). These values were used in mass budgets. Afraction of feed (a total of 100 kg) was initially put dailyinto the SB to prime the anaerobic processes until asufficient quantity of fish waste accumulated.
2.2. Analytical procedures
2.2.1. Solids analysisAt the end of the study, the sludge accumulated in the
SB and the sand-sludge flocks in the FBR were collectedand air-dried. The TF plastic medium was disassembled,
air-dried and then each piece was strongly beaten over acontainer to release the dried sludge. For protein analysis,50 g sub samples of the residual solids from each of thebiofilters was rinsed with tap water and oven-dried at60 °C for 24 h followed by drying at 105 °C to constantweights (% dw content) before TKN (total Kjeldahl N)analysis (Scheiner, 1976). For total P content, the oven-dried sludge was pulverized; then 500 mg of the drypowderwasmixedwith 9ml 65%nitric acid and 2mlHClin 120 ml Teflon PFA digestion vessels. Samples andblanks were prepared for analysis by microwave-assisteddigestion (10 min in 500 Wand another 10 min in 580 Wof microwave radiation). Liquid residues were supple-mented with deionized water to a final volume of 25 ml.Analyses were conducted on portions of the solutionsversus certified standards by inductively coupled plasmaatomic emission spectrometry (ICP-AES, Spectro Ana-lytical Instruments GmbH&Co., KGBoschstr. 10, 47533Kleve, Germany), equipped with cross-flow nebulizers(precision: b2%; accuracy: b5%).
2.2.2. Dissolved nutrients and other compoundsSeveral times a week, at 08:00 and 14:00 h, water
samples for nutrient analyses were collected from thedifferent components of the system. Nutrients wereanalyzed by an Auto Analyzer II (Technicon InstrumentsCo., Tarrytown, NewYork). Total ammonia N (TAN) wasanalyzed by a modification of the Berthelot phenolreaction (Krom et al., 1985). Nitrate and nitrite wereanalyzed after Solorzano and Sharp (1980). Orthophos-phate was analyzed after Glibert and Loder (1977). Watersamples for total hydrogen sulphide were sampled withminimum air exposure. Theywere preserved immediatelywith a stabilizing solution of sodium carboxymethylcellulose and cadmium sulphate, sealed and then analyzedcolorimetrically by a sulphide Auto Analyzer II cartridge(Bran+Luebbe GmbH, Werkstraβe 4, 22844 Norder-stedt, Schleswig-Holstein, Germany), using a reactionwith dimethyl-p-phenylenediamine dihydrochloride andferric chloride to yield methylene blue (Method No. G-193-97 of Bran+Luebbe, based on Grasshoff et al.,1983). The pH was measured with a HI 8424 pH meter(Hanna Instruments Ltd., Bedfordshire, England) andtotal alkalinity (precision b2%) was determined bytitration with hydrochloric acid (Parsons et al., 1984).
3. Results and discussion
3.1. Feed, water use, fish growth
The fish were fed in total 1158 kg feed (8% moisture).An additional 100 kg feed was added directly to the SB in
237A. Neori et al. / Journal of Experimental Marine Biology and Ecology 349 (2007) 235–247

Author's personal copy
order to speed up the development of anaerobicconditions (i.e.,b1 mg l−1 DO), so that the total dw feedinput was 1157 kg (Table 1). Filling the tanks and makingup for various water losses, mostly by evaporation (up to0.5 m3 d−1 in summer), consumed a total of only 25m3 ofseawater and 105 m3 of tap water. Specific total use ofwater was only 0.265 m3 kg−1 of gross fish production.Overall, 699 kg fish biomass was stocked and 490 kgbiomass was produced. Over the entire 512 day study, thedaily production rate averaged 1.2 kg (0.41% fish weightd−1) for an average seabream standing stock of 271 kg(partially reported in Gelfand et al., 2003).
3.2. Carbon, nitrogen and phosphorus recovery in fishand sludge
The fractions of the nutrients introduced into thesystem as feed that were recovered in fish growth were18.3% C and 15.4% N (Table 1), at the low end of therange of 15–30% reported from nutrient budgets of thisfish (Krom and Neori, 1989; Lupatsch and Kissil, 1998).Higher values of C and N recovery in seabream growthhave more recently been obtained in technically im-proved systems of this design (van Rijn, unpublished;Neori, unpublished). Only 11% of the carbon budget and14% of the nitrogen budget were recovered in sludge,mainly in the oxic sludge. The rest of the nutrients – over70% of carbon and nitrogen inputs – were missing fromthis total budget. In contrast, nearly all added P wasrecovered, with 21% in fish, 5% in dissolved phosphateand the rest in sludge (Table 1). The budgets for dryweight and for energy content paralleled those for Cand N, while the ash budget paralleled the P budget.
A comparison of the overall quantities of sludgeproduction, composition and processes found in this
study (Table 1) with budgets reviewed by Chen et al.(1997) for several different recirculating culture systemswith different fish, highlights similarities and differ-ences. The fraction of feed dw recovered in sludge in thepresent data (22.5%) was in the low range of therecoveries defined as “typical” in Chen et al. (1997) of20%–50%; it is an expression of the high rate of sludgedecomposition in the SB. The fraction of feed TKNrecovered as sludge TKN in the present data was 12.1%,compared with a recovery of 9.8% that can be calculatedfrom the data in Chen et al. (1997) for a channel catfish(Ictalurus punctatus) recirculating system. TKN contentof 4.2% in the accumulated sludge in the present study issimilar to the mean of 4.0% in Chen et al. (1997).However, while in the present system the remaining70% N not assimilated by fish or in sludge wasdenitrified to N2 (see below), in the single-loop culturesystems reviewed in Chen et al. (1997) this N wasdischarged with effluents as nitrate and created apollution hazard. An additional striking differencebetween the present data and other recirculating fishculture systems is in the fraction of feed P that wasrecovered in the sludge. In the present study nearly all Pnot found in fish was recovered as sludge, whose Pcontent in dw totaled 5.9% (Table 1). In otheraquaculture systems, on the contrary, most of waste Pwas discharged as dissolved P while sludge P contentaveraged only 0.7% (Chen et al., 1997).
3.3. Dissolved nutrients dynamics and transformations
The nutrients entered in the seawater and tap waterconstituted b1% of feed input for each of the nutrients,both because of the low water use and the lowconcentration of nutrients in both sources of water.
Table 1Budgets of the main ingredients of the fish feed introduced to the fish culture system in 17 months
Ingredient: DW C N P Ash Energy ('000 kcal)
Budget component1. Feed input
a. (kg) 1157 557 91 17.6 145 6374b. % 100 100 100 100 100 100
Outputs2. In produced fish (% of line 1) 15.8 18.3 15.4 21 15.2 16.83. In waste (% of line 1)
a. Anoxic sludge (SB+FBR) 10 3.95 4.4 50.6 48.3 3.2b. Oxic sludge (TF) 12.5 6.8 7.7 36.9 44.1 7.3c. Water 0 b0.1 2.2 5.1 0 0
4. Total waste (% of line 1) 22.5 10.75 14.3 92.6 92.4 10.55. Missing nutrient fractions (lines 2 and 4 subtracted from line 1)a
% of line 1 61.7 70.95 70.3 −13.6 −7.6 72.7
aA negative value indicates that the system contained a quantity of the substance larger than the input.
238 A. Neori et al. / Journal of Experimental Marine Biology and Ecology 349 (2007) 235–247

Author's personal copy
Ammonia (analyzed as TAN), a major excretionproduct of the fish, accumulated in the water immedi-ately after initiation of feeding. TAN concentrationpeaked at nearly 200 μmol l−1 at day 10, and graduallydecreased below 50 μmol l−1 (Fig. 2). It remained lowuntil day 370, except for a peak of ∼2700 μmol l−1,which developed on day 78 following a partial drying ofthe TF due to a burnout of the main water pump. Afterday 370, the ammonia concentration circulating throughthe system increased to between 50 and 250 μmol l−1.Nitrate concentration reached 20 mmol l−1 by day 200(Fig. 2). After day 270, it gradually dropped, tob5 mmol l−1 by day 370 and b0.3 mmol l−1 at theend of the study.
Based on our data, nitrification and denitrificationwere the dominant microbial N transformations withinthe system. Nitrification developed shortly after start upof the system. A dynamic balance between ammoniaproduction and nitrification kept ammonia levels at thistime by and large below 50 μmol l−1. Net nitrification,calculated by the difference between expected quantitiesof ammonia (5% of total feed input — Lupatsch andKissil, 1998, 2001) and measured ammonia in the water
multiplied by water volume, matched the increase infeeding. It increased from 5.9 mol N d−1 (1–270 days)to 10.0 mol N d−1 (270–370 days) and to 16.5 mol Nd−1 for the last 130 days (Table 2). The overall averagenitrification rate for the entire period was 9 mol N d−1. Itis likely that nitrification occurred mostly in the TF andon other wet surfaces, including the top of the SB sludgeand in the FBR, where ammonia produced by anaerobicrespiration processes could become exposed to
Fig. 2. Total ammonia N (TAN), nitrate and orthophosphateconcentrations in the fish basin during the study.
Table 2Total changes in titration alkalinity and associated parameters in thesystem over the following three periods: Period 1) from day 1 to day270 (270 days) when the system operated in net nitrification mode;Period 2) from day 270 to day 370 (100 days) when the systemoperated in net denitrification mode; Period 3) from day 370 to day 500(130 days) when the system operated in net denitrification mode withleakage of ammonia and hydrogen sulphide in the anaerobic loop
Measured parameters Period1
Period2
Period3
1. Alkalinity in seawater inflow(equivalents)
67 15.5 57
2. Alkalinity in tap water inflow(equivalents)
62 10.6 55
3. Alkalinity in water outflow(equivalents)
−59 −8.75 0
4. Alkalinity added as bicarbonate(equivalents)
321 0 0
5. Measured net change in alkalinity(equivalents)
5.2 8.5 −9.8
6. Dissolved N excreted by fish asammonia and reactive DON(moles)
1428 832 1978
7. Dissolved N released from labileorganic matter in SB (moles)
175 172 165.5
8. Nitrate accumulation in FT water,Fig. 2 (moles)
263.5 −99 −61.53
Calculated parameters (see text)9. Total nitrification (TN)
(moles) (Eq. (6))1603 1004 2143
10. Total denitrification (TDN)(moles) (Eq. (8))
1340 1103 2205
11. Presumed net alkalinityproduction, sum of lines 1–5(equivalents)
387 10 122
12 Calculated surplus of alkalinityproduced, line 11, but not matchedby the accumulation of nitrate,line 8 (equivalents) (Eq. (11))
123 109 183
Calculated daily rates of microbial processes13. Total nitrification rate (mol d−1) 5.9 10.0 16.514. Total denitrification rate (mol d−1) 5.0 11.0 17.015. Alkalinity surplus (sulphate
reduction) rate (equivalents d−1)0.46 1.1 1.4
All units are equivalents (for alkalinity) or moles (for dissolvednitrogen).
239A. Neori et al. / Journal of Experimental Marine Biology and Ecology 349 (2007) 235–247

Author's personal copy
dissolved oxygen in the overlying water (Blackburn,1986). The average and maximum nitrification ratesdivided by the total area of the TF and other wet surfaceswere 0.126 and 0.3 g N m−2 d−1, respectively. Values ofup to 0.28 g N m−2 d−1 have been reported for othermarine nitrifying trickling filters (Nijhof and Boven-deur, 1990; Eding et al., 2006). Denitrification devel-oped more slowly than nitrification (Tables 2, 3), so thata shift from net accumulation to net consumption ofnitrate occurred only after day 270. This was twice thetime it took in freshwater systems of similar design(Shnell et al., 2002; Gelfand et al., 2003).
Dissolved orthophosphate is produced by fish andmicrobial respiration. Orthophosphate concentrations inthe water (Fig. 2) gradually increased to a value of2.5 mmol l−1 by day 300. Then, during the period ofintense denitrification, dissolved phosphate levelsdecreased to 1.2 mmol l−1 by day 370. After nitratedropped below 5 mmol l−1 and begun to rise again,phosphate concentration also rose, to about 3 mmol l−1
by day 410 (Fig. 2).There was no detectable hydrogen sulphide circulat-
ing in the water until about day 370 (data not shown).Then as nitrate levels dropped below 2 mmol l−1,hydrogen sulphide gradually appeared in the wateroverlying the sludge in the SB. Concentrations of up to500 μmol l−1 were measured there at the end of thestudy (Fig. 3). Microbial processes in the FBR con-sumed most of the hydrogen sulphide that escaped theSB before the water returned to the main water loop.Hydrogen sulphide that escaped the FBR disappeared in
the trickling filter, by either evaporation or oxidation,leading to levels considered safe for fish in Bagarinaoand Lantin-Olaguer (1998) of b5 μmol l−1 in the fishbasin water (Fig. 3).
The rate of hydrogen sulphide release to the SB waterwas inversely related to nitrate concentration (Fig. 4).Sulphide release started at ∼350 mmol S d−1 at nitrateconcentrations below 2 mmol l−1 increasing to 18 mol Sd−1 when nitrate concentration dropped below 0.2 mmoll−1 (Fig. 4). Nitrate concentrations above 2mmol l−1 havebeen shown to totally inhibit sulphate reduction inorganically-rich aquatic sediments (Lucassen et al.,2004). The removal of sulphide and nitrate together inthe FBR suggests that a principle process for sulphideoxidation was autotrophic denitrification (Cytryn et al.,2005, 2006). Oxidation of hydrogen sulphide in the FBRwas proportional to its concentration in the water leavingthe SB (Fig. 5), reaching a rate of over 100 mmol S l−1
d−1. Considering the extreme toxicity to fish of hydrogensulphide (96 h LC50=60 μmol S l−1 in Bagarinao andLantin-Olaguer, 1998), it can be calculated that without its
Table 3Net rates of denitrification in the system, assuming it took place in theSB, based on maximal rates of nitrate disappearance from the waterduring the indicated periods (negative linear slopes in Fig. 2 nitratecurve)
Denitrificationrates
Period:
June–July2000
July–August2000
January–March2001
Totalg N d−1 80 187 249mol N d−1 5.7 13.4 17.8
Areal in SB a
g N m−2 d−1 17 39 53mol N m−2 d−1 1.2 2.8 3.8
Volumetric in SB a
mg N l−1 d−1 46 106 143m mol N l−1 d−1 3.3 7.6 10.2a Per surface area and volume (4.75 m2 and 1750 l, respectively) of
the SB.
Fig. 3. Hydrogen sulphide concentration in the water exiting the fishbasin, sedimentation basin (SB) and FBR during the final months ofthe study.
Fig. 4. Concentration of hydrogen sulphide (open triangles, right Yaxis) and rate of production (closed circles, left Y axis) in the SB as afunction of nitrate concentration in the system water.
240 A. Neori et al. / Journal of Experimental Marine Biology and Ecology 349 (2007) 235–247

Author's personal copy
oxidation hydrogen sulphide concentration in the FTcould have reached toxic levels in 1–2 h.
Significant sulphate reduction to sulphide apparentlyoccurred in the lower layers of the SB all the time.Sulphate reduction estimates based on alkalinity surplus(explained below) increased with time in parallel withthe increase in denitrification (Table 2). Hydrogensulphide levels of up to 6 mmol l−1 were determinedin the pore waters of the bottom layers of the SB anoxicsludge in a very similar system (Cytryn et al., 2003).However, during the first 370 days of the present study,no sulphide was detected in the overlying water of theSB. This was probably due to oxidation in the boundarylayer between sludge and water, where white patches ofelemental S were often visible. Reduced solutes –sulphides and ammonia – escaped into the overlyingwater only when limits were reached with regard to theoxidative capacity of the boundary layer. Microbialredox recycling processes are characteristic of theaerobic/anaerobic boundary in organic marine sedi-ments and are particularly important in the oxidation ofsulphide (Blackburn, 1986). Typically, more than 90%of the sulphide produced in marine sediments isreoxidized in this boundary layer (Jorgensen, 1980;Canfield et al., 1993). Oxidation by dissolved oxygen isgenerally considered the most important oxidativeprocess occurring in marine sediments. However, herethe artificial conditions created very high-nitrate con-centrations in the SB sludge's overlying water, asituation that is rare in nature. In natural marinesediments, autotrophic denitrification has been reportedat nitrate concentration of only 0.025 mmol l−1. Even atthose low concentrations, the process was considered ofquantitative importance for the C, N and S cycles in that
sediment (Fossing et al., 1995). With nitrate concentra-tions orders of magnitude higher, it is likely thatoxidation by nitrate was the most significant processfor the oxidation of sulphide in the present system.
3.4. Alkalinity and the biogeochemical processes
3.4.1. Alkalinity dynamicsAlkalinity of the initial seawater was 2.3 mEq l−1
while the alkalinity of the tap water was 1.2 mEq l−1.Alkalinity values for most of the first 3 months of thestudy are missing. However, during this time only 72 kgfeed was introduced to the system out of a total of1258 kg during the entire 17 months, and, therefore, theerror introduced to the quantitative analyses of theprocesses should be minor. Initially, when nitrateaccumulated in the system, pH dropped below 6.0while also alkalinity steeply declined, reaching a lowpoint after 3 months (Fig. 6). Brief but sharp rises inalkalinity and pH (with a simultaneous sharp drop in
Fig. 5. Relationship between concentration of hydrogen sulphide in thewater leaving the SB into the FBR and the rate of change in hydrogensulphide (negative units) in the FBR; data, solid circles; regression,line (Y=−29 X−376; r2=0.912; pb0.0001).
Fig. 6. Alkalinity in water exiting the trickling filter and the SB, andpH in the fish basin during the study.
241A. Neori et al. / Journal of Experimental Marine Biology and Ecology 349 (2007) 235–247

Author's personal copy
nitrate concentration) followed the temporary removalof the fish between days 99 and 128. Sodiumbicarbonate buffer (totaling 27 kg, 321 equivalents)was added occasionally between days 74 to 99 and days194 to 293 to restore alkalinity. During the initial3 months period, once measured, alkalinity levels in thevarious modules of the system were low and did notdiffer significantly between the modules (Figs. 6, 7).Between day 200 and 270, when denitrification matchedand then surpassed nitrification (Table 2), alkalinity roseto 3 mEq l−1 and pH stabilized (Fig. 6). After day 270,as a result of the intense denitrification, alkalinitygradually increased to 4–5 mEq l−1. Typically, duringthis latter period there was an increase in alkalinity of0.2–0.3 mEq l−1 in the water as it passed through theanaerobic loop (Fig. 7), indicating large net alkalinitygeneration by anaerobic processes. After day 370,alkalinity generation in the SB was balanced byconsumption elsewhere in the system and the overallalkalinity stabilized at close to 3 mEq l−1 without anyfurther addition of bicarbonate buffer. From day 200until the end of the experiment, the pH of the entire fishculture system stabilized at just above 7 with minorfluctuations (Fig. 6).
3.4.2. Alkalinity budgets and contingent biogeochem-ical processes
Alkalinity budgets (Table 2) were calculated over thefollowing three biogeochemically distinct periods:(1) period 1 (first 270 days) net nitrification (accumu-lation of nitrate); (2) period 2 (from day 270 to 370) netdenitrification (nitrate levels dropped sharply); and(3) period 3 (day 370–500) net denitrification accom-panied by leakage of ammonia and hydrogen sulphide
from the SB sludge into the overlying SB water. Thebudgets were calculated using the following assumptionsand equations (derived from Lazar et al., 1989; van Rijnet al., 2006). Duringmicrobial nitrification of ammonia 1equivalent (Eq) of alkalinity is consumed per mol ofammonia oxidized (Eq. (1) below). During denitrifica-tion 1 Eq of alkalinity is produced per mol of nitratereduced to nitrogen gas, whether the process involved isheterotrophic denitrification (Eq. (2)) or autotrophicdenitrification with H2S (Eq. (3)) coupled to sulphatereduction to produce H2S (Eq. (4)). The rearrangementof Eqs. (3) and (4) in Eq. (5) assumes that dissimilatoryreduction of nitrate to ammonia is not significant.
Nitrification:
NH3 þ 2O2 ¼ NO−3 þ Hþ þ H2O ð1Þ
Heterotrophic denitrification
2NO−3 þ ½5H2� þ 2Hþ ¼ N2 þ 6H2O ð2Þ
Autotrophic denitrification with H2S
5H2S þ 8NO−3→5SO2−
4 þ 4N2 þ 4H2O þ 2Hþ ð3ÞSulphate reduction to produce H2S
5SO2−4 þ ½20H2� þ 10Hþ→5H2S þ 20H2O ð4Þ
A rearrangement of Eqs. (3) and (4)
8NO−3 þ ½20H2� þ 8Hþ→4N2 þ 24H2O ð5Þ
For each of the three defined time periods, withinsignificant amounts of ammonia accumulating in thesystem, total nitrification (TN) is the sum of the ammoniaproduced from fish excretion (Nfish) and from decompo-sition of organic matter in the SB (NSB; Eq. (6))
TN ¼ Nfish þ NSB ð6Þ
Total net nitrification (TNN) is total nitrification(TN) minus total denitrification (TDN) and equals theamount of nitrate accumulated during the periodconsidered.
TNN ¼ TN−TDN ¼ ▵NO3 ð7Þ
Rearranging Eq. (7)
TDN ¼ TN−▵NO3 ð8Þ
Assuming that the only microbial processes thatresult in a change of alkalinity are nitrification anddenitrification, then the change in alkalinity (▵Alk)
Fig. 7. The differences in water alkalinity between the trickling filterand fish basin and between the sedimentation basin and the fish basinduring the study.
242 A. Neori et al. / Journal of Experimental Marine Biology and Ecology 349 (2007) 235–247
Author's personal copy
equals TDN−TN plus the amount of alkalinity addedexternally to the system Eq. (9).
▵Alk ¼ TDN−TN þ Alkadded ð9ÞUsing Eq. (7) and rearranging, it is calculated that:
▵Alk ¼ Alkadded−▵NO3 ð10Þ
Finally, the difference between the calculated amountof net alkalinity accumulated within the system and themeasured change in nitrate, which results in a knownchange in alkalinity, was calculated:
Alkalinity Surplus ¼ ▵Alk−▵NO3 ð11Þ
3.4.3. Biogeochemical processes derived from thealkalinity budgets
The alkalinity equations provided an independentestimate of the daily rates of nitrification and denitrifica-tion (Table 2). Both processes gradually increased withtime, following the increased feed load. There was asignificant alkalinity surplus that increased gradually withtime (Table 2: total in line 12, daily surplus in line 15)between calculated and measured values. This surplusmost probably represents an accumulation of alkalinityand its diagenetic products within the SB sludge. Themost significant additional biogeochemical processoccurring in this sludge that produces alkalinity isprobably sulphate reduction. Studies of similar systemshave found both the presence of sulphate reducingbacteria within SB sludge and the accumulation ofsignificant amounts of hydrogen sulphide in the lowerlayers of the sludge (Cytryn et al., 2003, 2005). Sulphate
reduction produces ammonia and hydrogen sulphide, twocompounds that were generated within the anaerobic loopduring period 3. The process also produces 1 Eq alkalinityper mol of reduced S (Lazar et al., 1989). Hence, as anapproximation, the surplus alkalinity determined in thesecalculations is a measure of the minimum of sulphatereduction in the SB sludge. The rate of sulphate reductionin the SB can thus be estimated to be up to 4.5 mol S m−2
d−1 (145 g Sm−2 SB surface d−1 or 6mgS g dw−1 anoxicsludge d−1). This is a high value compared with rates ofup to 36 μmol S m−2 d−1 measured in most enrichednatural marine environments (D'Hondt et al., 2002).However, it has been shown that the rate of sulphatereduction can be significantly enhanced in the presence ofhighly labile organic matter and a fast flow of water rightabove the sediment (Kelly-Gerreyn et al., 2005); thesewere the distinctive conditions in the SB. ICP analyses ofthe sludge at the end of the study backed up thisconclusion (Table 4), as the sludge contained 2090 g ofnon-sea salt sulphur, which if present mainly as organic Swould be∼3% of the total organic matter. Such S contentfalls at the upper end of a “normal” range for sulphatereducing marine sediments (Raiswell et al., 1993; Zabackand Pratt, 1993). The alkalinity surpluses in our dataprobably underestimate the actual alkalinity generation inthe SB. In such sediments, alkalinity accumulates to thepoint where the solubility product of CaCO3 is exceeded,leading to CaCO3 precipitation and accumulation as highmagnesium calcite. Using the measured amount of (non-sea salt) Ca andMg in the anaerobic sludge in the SB, thiscorresponds to 209.5 mol of calcite, which practicallydoubles the expected surplus of alkalinity if it wasprecipitated as calcite (Table 4). However, the Ca in the
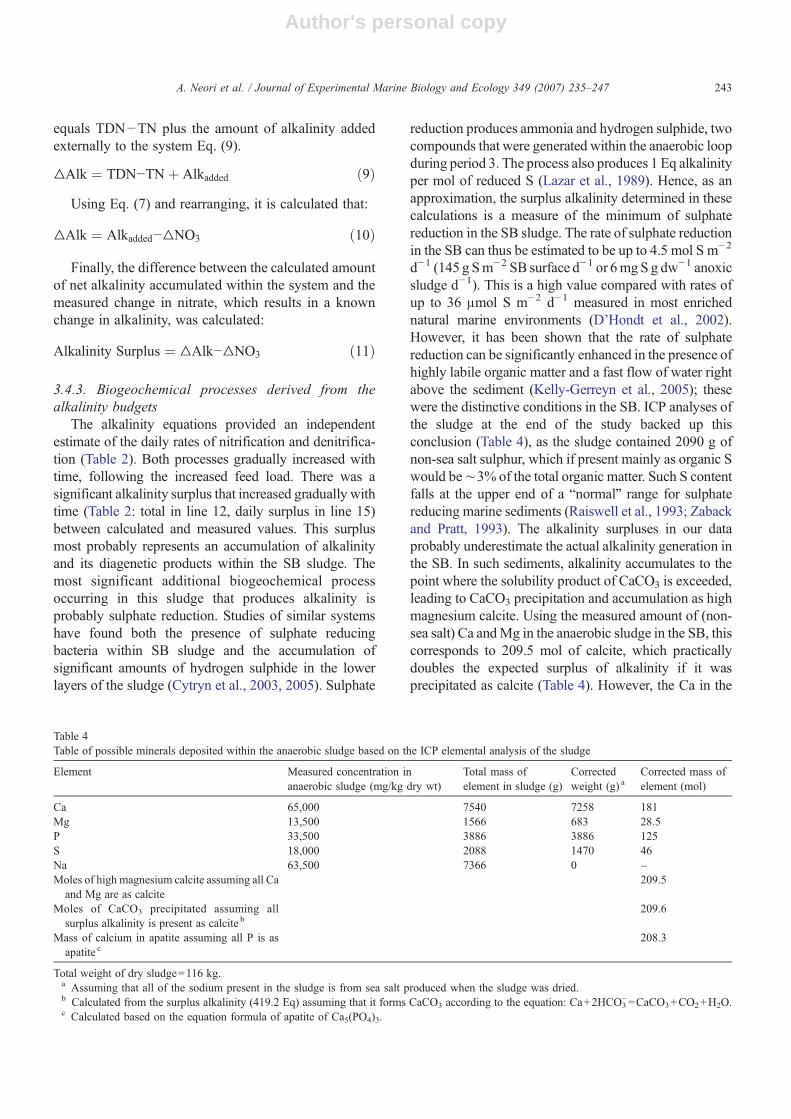
Table 4Table of possible minerals deposited within the anaerobic sludge based on the ICP elemental analysis of the sludge
Element Measured concentration inanaerobic sludge (mg/kg dry wt)
Total mass ofelement in sludge (g)
Correctedweight (g) a
Corrected mass ofelement (mol)
Ca 65,000 7540 7258 181Mg 13,500 1566 683 28.5P 33,500 3886 3886 125S 18,000 2088 1470 46Na 63,500 7366 0 –Moles of high magnesium calcite assuming all Ca
and Mg are as calcite209.5
Moles of CaCO3 precipitated assuming allsurplus alkalinity is present as calcite b
209.6
Mass of calcium in apatite assuming all P is asapatite c
208.3
Total weight of dry sludge=116 kg.a Assuming that all of the sodium present in the sludge is from sea salt produced when the sludge was dried.b Calculated from the surplus alkalinity (419.2 Eq) assuming that it forms CaCO3 according to the equation: Ca+2HCO3
−=CaCO3+CO2+H2O.c Calculated based on the equation formula of apatite of Ca5(PO4)3.
243A. Neori et al. / Journal of Experimental Marine Biology and Ecology 349 (2007) 235–247
Author's personal copy
anaerobic sludge is likely to also include undigested bonemeal from the fish feed in the form of apatite and possiblyalso diagenetic apatite. Further studies involving miner-alogical identification would be needed to determine therelative proportions of these two minerals (calcite andapatite) within the sludge.
3.5. Quantitative decomposition and fate of organicmatter constituent
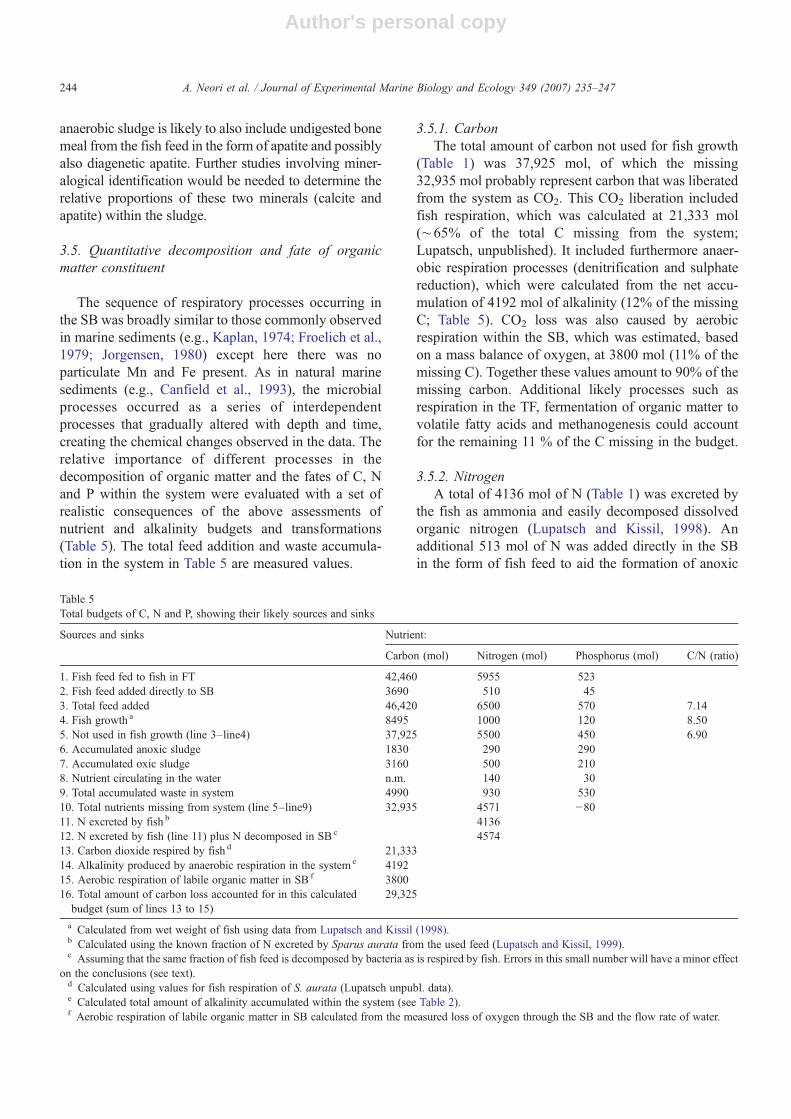
The sequence of respiratory processes occurring inthe SB was broadly similar to those commonly observedin marine sediments (e.g., Kaplan, 1974; Froelich et al.,1979; Jorgensen, 1980) except here there was noparticulate Mn and Fe present. As in natural marinesediments (e.g., Canfield et al., 1993), the microbialprocesses occurred as a series of interdependentprocesses that gradually altered with depth and time,creating the chemical changes observed in the data. Therelative importance of different processes in thedecomposition of organic matter and the fates of C, Nand P within the system were evaluated with a set ofrealistic consequences of the above assessments ofnutrient and alkalinity budgets and transformations(Table 5). The total feed addition and waste accumula-tion in the system in Table 5 are measured values.
3.5.1. CarbonThe total amount of carbon not used for fish growth
(Table 1) was 37,925 mol, of which the missing32,935 mol probably represent carbon that was liberatedfrom the system as CO2. This CO2 liberation includedfish respiration, which was calculated at 21,333 mol(∼65% of the total C missing from the system;Lupatsch, unpublished). It included furthermore anaer-obic respiration processes (denitrification and sulphatereduction), which were calculated from the net accu-mulation of 4192 mol of alkalinity (12% of the missingC; Table 5). CO2 loss was also caused by aerobicrespiration within the SB, which was estimated, basedon a mass balance of oxygen, at 3800 mol (11% of themissing C). Together these values amount to 90% of themissing carbon. Additional likely processes such asrespiration in the TF, fermentation of organic matter tovolatile fatty acids and methanogenesis could accountfor the remaining 11 % of the C missing in the budget.
3.5.2. NitrogenA total of 4136 mol of N (Table 1) was excreted by
the fish as ammonia and easily decomposed dissolvedorganic nitrogen (Lupatsch and Kissil, 1998). Anadditional 513 mol of N was added directly in the SBin the form of fish feed to aid the formation of anoxic
Table 5Total budgets of C, N and P, showing their likely sources and sinks
Sources and sinks Nutrient:
Carbon (mol) Nitrogen (mol) Phosphorus (mol) C/N (ratio)
1. Fish feed fed to fish in FT 42,460 5955 5232. Fish feed added directly to SB 3690 510 453. Total feed added 46,420 6500 570 7.144. Fish growth a 8495 1000 120 8.505. Not used in fish growth (line 3–line4) 37,925 5500 450 6.906. Accumulated anoxic sludge 1830 290 2907. Accumulated oxic sludge 3160 500 2108. Nutrient circulating in the water n.m. 140 309. Total accumulated waste in system 4990 930 53010. Total nutrients missing from system (line 5–line9) 32,935 4571 −8011. N excreted by fish b 413612. N excreted by fish (line 11) plus N decomposed in SB c 457413. Carbon dioxide respired by fish d 21,33314. Alkalinity produced by anaerobic respiration in the system e 419215. Aerobic respiration of labile organic matter in SB f 380016. Total amount of carbon loss accounted for in this calculatedbudget (sum of lines 13 to 15)
29,325
a Calculated from wet weight of fish using data from Lupatsch and Kissil (1998).b Calculated using the known fraction of N excreted by Sparus aurata from the used feed (Lupatsch and Kissil, 1999).c Assuming that the same fraction of fish feed is decomposed by bacteria as is respired by fish. Errors in this small number will have a minor effect
on the conclusions (see text).d Calculated using values for fish respiration of S. aurata (Lupatsch unpubl. data).e Calculated total amount of alkalinity accumulated within the system (see Table 2).f Aerobic respiration of labile organic matter in SB calculated from the measured loss of oxygen through the SB and the flow rate of water.
244 A. Neori et al. / Journal of Experimental Marine Biology and Ecology 349 (2007) 235–247

Author's personal copy
conditions. It is assumed that in the absence of fish in theSB, 438 mol N was converted into dissolved nitrogen byphysical, chemical and microbial processes. Thus a totalof 4574 mol of N was converted by fish metabolism andmicrobial processes into dissolved N (mainly ammonia).This is similar to the 4560 mol N missing from thesystem in the N budget (Table 1).
Denitrification occurred principally in the anaerobicloop of this system, where the dissolved oxygenconcentration was below 1–2 mg l−1 or ∼10–20%saturation (Gelfand et al., 2003), although similar condi-tions might have also occurred deep in the TF sludge.Using ‘slopes of nitrate disappearance’ in the nitrateanalyses in Fig. 2 for the calculation of net denitrification(Table 3), the rate gradually increased with time of thestudy, reaching 17.8 mol N denitrified d−1 (3.7 mol m−2
d−1 or 53 g N m−2 SB surface d−1 or 2.2 g N g dw−1
anoxic sludge d−1). The average net denitrification ratewas half of that, 9 mol N d−1, the same as the amountmissing from the system in the total nutrient budget(Tables 1, 4) averaged over the entire study. The arealdenitrification rates in the anaerobic sludge in the presentstudy are orders of magnitude above the highest rates ofonly 0.07 mol N denitrified m−2 sediment d−1, documen-ted in natural organically-enriched seawater coastal eco-systems, and 4.5 folds above the highest evermeasurementin a polluted river of 0.82 mol N denitrified m−2 sedimentd−1 (reviewed in Piña-Ochoa andÁlvarez-Cobelas, 2006).
These calculations corroborate the assumption thatthe N missing from the nutrient budget is the N nitrifiedto NO3
− and then denitrified to N2. It was not possiblewith our data to quantify the relative importance ofautotrophic and heterotrophic denitrification.
3.5.3. PhosphorusA total of 570 mol of P were added to the system,
525mol of it fed to the FT. The fish retained only 120molor 23% of fed P (21% of total P input). The proportionexcreted by fish as particulate waste is much higher for Pthan for N partly because the fish feed contains asignificant proportion of low digestibility bone meal. Itwas calculated that 250 mol of P accumulated in thesludge directly as a result of fish excretion (44% of thetotal input). The remaining 200 mol were excreted asdissolved P. However only 30 mol were detected asdissolved P, while the remaining 170 mol, 85% of thedissolved phosphate produced in the system, wasmeasured in the sludge (5.9% P in dw). Up to 19% P indw was measured in the anaerobic sludge from similarlydesigned freshwater and marine recirculating systems(Shnel et al., 2002; Barak et al., 2003). Decreases inphosphate concentration in the water occurred during
periods characterized by denitrification (Fig. 2). Barakand van Rijn (2000) have shown that denitrifying bacteriain particular can accumulate phosphorus greatly in excessof their immediate metabolic requirements. In naturalhypertrophic marine sediments, it has generally beenassumed that the major process of phosphate removal isadsorption onto particulate iron oxyhydroxides (e.g.Krom and Berner, 1980). While low levels of phosphatein the pore water of denitrification-dominated aquaticsediments can be attributed to this iron oxyhydroxidespathway (as interpreted in Lucassen et al., 2004), recentstudies have identified for the first time the potentialimportance of polyphosphate storage by bacteria innatural organic-rich sediments (Brandes et al., 2007;Sannigrahi and Ingall, 2005; Schulz and Schulz, 2005).The present study carried out without significant ironpresent, shows significant storage of phosphate in theanaerobic sludge. This may be as polyphosphate withindenitrifying bacteria, which are active within theanaerobic loop.
4. Conclusions
The biogeochemical processes that drive an ad-vanced zero-effluent recirculating aquaculture systemwith a fish basin, an aerobic biofilter and an anaerobicbiofilter were identified and quantified by budgets ofnutrients and alkalinity.
Specific conclusions:1. A 70% fraction of the carbon supplied to the system
was not found in fish, sludge and water. This missingcarbon was respired by fish (45% of supplied C), and byaerobicmicroorganisms (8.4%) and anaerobicmicroorgan-isms (7.7%).
2. Nitrification (up to 0.3 g N m−2 d−1 in the tricklingfilter or 2.25 mg N g dw−1 oxic sludge d−1) anddenitrification (heterotrophic and autotrophic, up to 53 gNm−2 SB area d−1 or 2.2 g N g dw−1 anoxic sludge d−1),controlled the dissolved N chemistry and water quality ofthe system. These processes were in approximate balanceand matched the gradual increase in feeding. Nitrificationdeveloped faster than denitrification, leading initially tonitrate accumulation. Thereafter, even though supply oflabile organic matter to the sedimentation basin continuedat an increasing rate, denitrification brought down nitrateconcentration in the water.
3. Denitrification (autotrophic and heterotrophic)caused 70% of the fixed nitrogen supplied to be lostas nitrogen gas.
4. Except for the initial phase, the internal biogeo-chemical processes in the SB stabilized alkalinity andpH in the entire system.
245A. Neori et al. / Journal of Experimental Marine Biology and Ecology 349 (2007) 235–247

Author's personal copy
5. Hydrogen sulphide generated in the anoxic sludge(at a rate of up to 145 g S m−2 anoxic sludge surface d−1
or 6 mg S g dw−1 d anoxic sludge−1) was oxidized byoxygen and by autotrophic denitrification in the sludge–water boundary layer.
6. Some hydrogen sulphide leaked from the sludgeinto the overlying water when nitrate concentrationdropped below 2 mmol l−1. It was oxidized in the FBRand trickling filter treatment modules. Hydrogensulphide levels remained below detection limits in thefish basin at all times.
7. The introduced P accumulated mainly in the fish(21%) and excreted particulate P (44%). Of the 200 molof dissolved P produced in the system, only a smallfraction was found circulating as dissolved phosphate.The remaining was stored in the sludge as polypho-sphates predominantly within denitrifiers.
8. Water use per fish production was about onetwentieth of the 4 m3 kg−1 typical of common semi-closed, recirculating systems, where nitrate and phos-phorus-rich water is discharged (Masser et al., 1999). Inan insulated and temperature-controlled building, evap-orative water use could be cut even further.
Acknowledgements
This research was funded by grant FAIR-CT98-4160of the Fisheries Directorate-General, European Com-mission. We thank I Snir for his invaluable assistanceduring construction of the culture system, which wasthen operated by V Odintsev. Further thanks toI Lupatsch for advice on chemical analyses of solids,to A Zalmanzon and E Chernova for chemical analyses,to M Schönfeld for ICP-AES analyses, to TH Black-burn, R Mortimer and E Cytryn for helpful consulta-tions, and to several anonymous reviewers for helpfulsuggestions to the manuscript. [SS]
References
Aldhous, P., 2004. Fish farms still ravage the sea. Nature NewsService, February 17, 2004. http://www.nature.com/natureevents/conferencenews/aaas2004/040216-10.html.
Bagarinao, T., Lantin-Olaguer, I., 1998. The sulphide tolerance ofmilkfish and tilapia in relation to fish kills in farms and naturalwaters in the Philippines. Hydrobiologia 382, 137–150.
Barak, Y., van Rijn, J., 2000. Biological phosphorus removal in aprototype recirculating aquaculture system.Aquac. Eng. 22, 121–136.
Barak, Y., Cytryn, E., Gelfand, I., Krom, M., van Rijn, J., 2003.Phosphorus removal in a marine prototype, recirculating aquacul-ture system. Aquaculture 220, 313–326.
Blackburn, T.H., 1986. Nitrogen cycle in marine sediments. Ophelia 26,65–76.
Blancheton, J.P., 2000. Developments in recirculation systems forMediterranean fish species. Aquac. Eng. 22, 17–31.
Brandes, J.A., Ingall, E., Paterson, D., 2007. Characterization ofminerals and organic phosphorus species in marine sedimentsusing soft X-ray fluorescence spectromicroscopy. Mar. Chem. 103,250–265.
Canfield, D.E., Thamdrup, B., Hansen, J.W., 1993. The anaerobicdegradation of organic matter in Danish coastal sediments: ironreduction, manganese reduction, and sulfate reduction. Geochim.Cosmochim. acta 57, 3867–3883.
Chen, S., Coffin, D.E., Malone, R.F., 1997. Sludge production andmanagement for recirculating aquaculture systems. J. WorldAquac. Soc. 28, 303–315.
Cytryn, E., Gelfand, I., Barak, Y., van Rijn, J., Minz, D., 2003.Diversity of microbial communities correlated to physiochemicalparameters in a digestion basin of a zero-discharge mariculturesystem. Environ. Microbiol. 5, 55–63.
Cytryn, E., Gelfand, I., Neori, A., Gieseke, A., de Beer, D., van Rijn,J., 2005. Sulphide-oxidizing activity and bacterial communitystructure in a fluidized bed reactor from a zero-dischargemariculture system. Environ. Sci. Technol. 39, 1802–1810.
Cytryn, E., Minz, D., Gieseke, A., van Rijn, J., 2006. Transientdevelopment of filamentous Thiothrix species in a marine sulphideoxidizing, denitrifying fluidized bed reactor. FEMS Microbiol.Lett. 256, 22–29.
D'Hondt, S., Rutherford, S., Spivack, A.J., 2002. Metabolic activity ofsubsurface life in deep-sea sediments. Science 295, 2067–2070.
Eding, E.H., Kamstra, A., Verreth, J.A.J., Huisman, E.A.,Klapwijk, A., 2006. Design and operation of nitrifying tricklingfilters in recirculating aquaculture: a review. Aquac. Eng. 34,234–260.
Fossing, H., Gallardo, V.A., Jorgensen, B.B., Huttel, M., Nielsen, L.P.,Schulz, H., Canfield, D.E., Forster, S., Glud, R.N., Gundersen, J.K.,Kuver, J., Ramsing, N.B., Teske, A., Thamdrup, B., Ulloa, O.,1995. Concentration and transport of nitrate by the mat-formingsulphur bacterium Thioploca. Nature 374, 713–715.
Froelich, P.N., Klinkhammer, G.P., Bender, M.L., Luedtke, N.A.,Heath, G.R., Cullen, D., Dauphin, P., Hammond, D., Hartman, B.,Maynard, V., 1979. Early oxidation of organic matter in pelagicsediments of the eastern equatorial Atlantic: suboxic diagenesis.Geochim. Cosmochim. Acta 43, 1075–1090.
Gelfand, I., Barak, Y., Even-Chen, Z., Cytryn, E., Krom, M., Neori, A.,van Rijn, J., 2003. A novel zero-discharge intensive seawaterrecirculating system for culture of marine fish. J. World Aquac.Soc. 34, 344–358.
Glibert, P.L., Loder, T.C., 1977. Automated analysis of nutrients inseawater: a manual of techniques. Woods Hole OceanographicInstitute Technical Report WHOI-77-47. Woods Hole, Oceano-graphic Institute, Ma, USA, 46 pp.
Grasshoff, K., Ehrhardt, M., Kremling, K. (Eds.), 1983. Methods ofSeawater Analysis. Verl. Chemie, Weinheim. 419 pp.
Gutierrez-Wing, M.T., Ronald, F., Malone, R.E., 2006. Design andselection of biological filters for freshwater and marine applica-tions. Aquac. Eng. 34, 163–171.
Jorgensen, B.B., 1980. Mineralization and the bacterial cycling ofcarbon, nitrogen, and sulphur in marine sediments. In: Ellwood,D.C., Hedger, J.N., Latham, M.J., Lynch, J.M., Slater, J.H. (Eds.),Contemporary Microbial Ecology. Academic Press, London,pp. 239–251.
Kaplan, I.R. (Ed.), 1974. Natural Gases in Marine Sediments. PlenumPress, New York. 324 pp.
Kelly-Gerreyn, B.A., Hydes, D.J., Waniek, J., 2005. Control of thediffusive boundary layer on benthic fluxes: a model study. Mar.Ecol. Prog. Ser. 292, 61–74.
246 A. Neori et al. / Journal of Experimental Marine Biology and Ecology 349 (2007) 235–247

Author's personal copy
Krom, M.D., 1991. Importance of benthic productivity in controllingdissolved inorganic nitrogen flux from sediment in a hypertrophicmarine system. Mar. Ecol. Prog. Ser. 78, 163–172.
Krom, M.D., Berner, R.A., 1980. Adsorption of phosphate in anoxicmarine sediments. Limnol. Oceanogr. 25, 797–806.
Krom, M.D., Neori, A., 1989. A total nutrient budget for anexperimental intensive fishpond with circularly moving seawater.Aquaculture 80, 345–358.
Krom, M.D., Grayer, S., Davidson, A., 1985. An automated method ofammonia determination for use in mariculture. Aquaculture 44,153–160.
Lazar, B., Javor, B., Erez, J., 1989. Total alkalinity in marine derivedbrines and porewaters associated with microbial mats. In: Cohen,Y., Rosenberg, E. (Eds.), Microbial Mats. Am. Soc. Microbiol.,Washington DC, pp. 84–93.
Lucassen, E.C.H.E.T., Smolders, A.J.P., van der Salm, A.L., Roelofs,J.G.M., 2004. High groundwater nitrate concentrations inhibiteutrophication of sulphate-rich freshwater wetlands. Biogeochem-istry 67, 249–267.
Lupatsch, I., Kissil, G.Wm., 1998. Predicting aquaculture waste fromgilthead seabream (Sparus aurata) culture using a nutritionalapproach. Aqua Living Resour. 11, 265–268.
Lupatsch, I., Kissil, G.Wm., 2001. A model for predicting growth, feedintake, and waste production based on nutritional bioenergetics asa design tool for recirculating aquaculture systems. A case studyfor gilthead seabream (Sparus aurata). Eur. Aquacult. Soc. Spec.Publ., vol. 29. EAS, Oostende Belgium, pp. 169–171.
Masser, M.P., Rackocy, J., Losordo, T.M., 1999. RecirculatingAquaculture Tank Production Systems: Management of Recircu-lating Systems, vol. 452. Southern Regional Aquaculture Center.Publication, 12 pp.
Naylor, R., Goldburg, R., Mooney, H., Beveridge, M., Clay, J., Folke,C., Kautsky, N., Lubchenco, J., Primavera, J., Williams, M., 1998.Nature's subsidies to shrimp and salmon farming. Science 282,883–884.
Nijhof, M., Bovendeur, J., 1990. Fixed film nitrification characteristicsin sea-water recirculation fish culture systems. Aquaculture 87,133–143.
Parsons, T.R., Maita, Y., Lalli, C.R., 1984. A Manual of Chemical andBiological Methods for Seawater Analysis. Pergamon Press, NewYork. 101 pp.
Piña-Ochoa, E., Álvarez-Cobelas, M., 2006. Denitrification in aquaticenvironments: a cross-system analysis. Biogeochem. 81, 111–130.
Raiswell, R., Bottrell, S.H., Al-Biatty, H.J., Tan, M.M., 1993. Theinfluence of bottom water oxygenation and reactive iron content onsulphur incorporation into bitumens from Jurassic marine shales.Am. J. Sci. 293, 569–596.
Sannigrahi, P., Ingall, E.D., 2005. Polyphosphates as a source ofenhanced P fluxes in marine sediments overlain by anoxic waters:evidence from 31P NMR. Geochem. Transact. 6, 52–59.
Saylor, G.S., Fox, R., Blackburn, J.W., 1991. Environmentalbiotechnology for waste treatment. Environ. Sci. Res., Vol. 41.Plenum Press, New York. 288 pp.
Scheiner, D., 1976. Determinations of ammonia and Kjeldahl nitrogenby the indophenol method. Water Res. 10, 31–36.
Shnel, N., Barak, Y., Ezer, T., Dafni, Z., van Rijn, J., 2002. Design andperformance of a zero-discharge tilapia recirculating system.Aquac. Eng. 26, 191–203.
Schulz, H.N., Schulz, H.D., 2005. Large sulfur bacteria and theformation of phosphorite. Science 307, 416–418.
Solorzano, L., Sharp, J.H., 1980. Determination of total dissolvednitrogen in natural waters. Limnol. Oceanogr. 24, 751–754.
Thoman, E.S., Ingall, E.D., Davis, D.A., Arnold, C.R., 2001. Anitrogen budget for a closed, recirculating mariculture system.Aquac. Eng. 24, 195–210.
van Rijn, J., 1996. The potential for integrated biological treatmentsystems in recirculating fish culture— a review. Aquaculture 139,181–201.
Van Rijn, J., Tal, Y., Schreier, H.J., 2006. Denitrification inrecirculating systems: theory and applications. Aquac. Eng. 34,364–376.
Zaback, D.A., Pratt, L.M., 1993. Isotopic composition and speciationof sulphur in the Miocene Monterey Formation: re-evaluation ofsulphur reactions during early diagenesis in marine environments.Geochim. Cosmochim. Acta 56, 63–774.
247A. Neori et al. / Journal of Experimental Marine Biology and Ecology 349 (2007) 235–247