
Biogeochemical plant site conditions in stream valleys after winter flooding: a phytometer approach
30
BGD 5, 5203–5232, 2008 Plant site conditions after winter flooding V. Beumer et al. Title Page Abstract Introduction Conclusions References Tables Figures Back Close Full Screen / Esc Printer-friendly Version Interactive Discussion Biogeosciences Discuss., 5, 5203–5232, 2008 www.biogeosciences-discuss.net/5/5203/2008/ © Author(s) 2008. This work is distributed under the Creative Commons Attribution 3.0 License. Biogeosciences Discussions Biogeosciences Discussions is the access reviewed discussion forum of Biogeosciences Biogeochemical plant site conditions in stream valleys after winter flooding: a phytometer approach V. Beumer 1,2 , J. N. Ohm 1 , G. van Wirdum 2 , B. Beltman 1 , J. Griffioen 2 , and J. T. A. Verhoeven 1 1 Utrecht University, Institute of Environmental Biology, Landscape Ecology group, Utrecht, The Netherlands 2 Deltares/TNO Built Environment and Geosciences, Subsurface and Groundwater Systems group, Utrecht, The Netherlands Received: 30 October 2008 – Accepted: 14 November 2008 – Published: 23 December 2008 Correspondence to: V. Beumer ([email protected]) Published by Copernicus Publications on behalf of the European Geosciences Union. 5203
-
Upload
independent -
Category
Documents
-
view
3 -
download
0
Transcript of Biogeochemical plant site conditions in stream valleys after winter flooding: a phytometer approach
BGD5, 5203–5232, 2008
Plant site conditionsafter winter flooding
V. Beumer et al.
Title Page
Abstract Introduction
Conclusions References
Tables Figures
J I
J I
Back Close
Full Screen / Esc
Printer-friendly Version
Interactive Discussion
Biogeosciences Discuss., 5, 5203–5232, 2008www.biogeosciences-discuss.net/5/5203/2008/© Author(s) 2008. This work is distributed underthe Creative Commons Attribution 3.0 License.
BiogeosciencesDiscussions
Biogeosciences Discussions is the access reviewed discussion forum of Biogeosciences
Biogeochemical plant site conditions instream valleys after winter flooding: aphytometer approachV. Beumer1,2, J. N. Ohm1, G. van Wirdum2, B. Beltman1, J. Griffioen2, andJ. T. A. Verhoeven1
1Utrecht University, Institute of Environmental Biology, Landscape Ecology group, Utrecht,The Netherlands2Deltares/TNO Built Environment and Geosciences, Subsurface and Groundwater Systemsgroup, Utrecht, The Netherlands
Received: 30 October 2008 – Accepted: 14 November 2008 – Published: 23 December 2008
Correspondence to: V. Beumer ([email protected])
Published by Copernicus Publications on behalf of the European Geosciences Union.
5203
BGD5, 5203–5232, 2008
Plant site conditionsafter winter flooding
V. Beumer et al.
Title Page
Abstract Introduction
Conclusions References
Tables Figures
J I
J I
Back Close
Full Screen / Esc
Printer-friendly Version
Interactive Discussion
Abstract
Reintroduction of winter flooding events will have strong effects on the plant growthconditions in the parts of stream valleys that have not been accustomed to flooding inrecent years. The major goal of this research is, firstly, to investigate the plant growthconditions in floodplain soils in the period after a winter flood and, secondly, to assess5
whether a phytometer setup is suitable for the evaluation of winter flooding on plantgrowth conditions. Soil cores of three agricultural and three semi-natural grasslandsites have been exposed to a simulated winter flooding event. Then, cores were sub-jected to spring conditions in a growth chamber and were planted with seedlings ofAnthoxantum odoratum and Lythrum salicaria. The growth conditions changed in op-10
posite directions for our two phytometer species, expressed as biomass and nutrientchanges. We discuss possible causes of an increase or decrease in biomass, such as(1) soil nutrient effects (N, P and K), (2) toxic effects of NH4, Fe and Al, and (3) possi-ble shortage of other macro- and micronutrients. The conclusions are that plant growthafter winter flooding was affected by enhanced nutrient and toxicant availabilities in15
agricultural sites and mainly by soil nutrients in the semi-natural sites. The use of thetwo species selected had clear advantages: Lythrum salicaria is well-suited to assessthe nutrient status in previously flooded soils, because it is a well-known invader ofwetlands and not easily hampered by potentially toxic compounds, while A. odoratumis less frequently found at wetland soils and more sensitive to toxic compounds and,20
therefore, a better indicator of possible toxic effects as a result of winter flooding thanL. salicaria.
1 Introduction
Global climate change has shown to lead to a warming trend and more extreme rainfalland droughts in North-Western Europe. As a result, flooding and flood damage from25
rivers and streams are becoming more frequent and severe, especially in winter. Water
5204
BGD5, 5203–5232, 2008
Plant site conditionsafter winter flooding
V. Beumer et al.
Title Page
Abstract Introduction
Conclusions References
Tables Figures
J I
J I
Back Close
Full Screen / Esc
Printer-friendly Version
Interactive Discussion
management strategies are being developed in The Netherlands to counteract thisproblem. In periods with high rainfall and resulting high river discharge, floodwater isdiverted to areas where it is less harmful. Many of these areas are targeted for natureconservation and effects of the flooding on plant growth conditions must be considered.Reintroduction of winter flooding events will have strong effects on the plant growth5
conditions in the parts of the stream valleys that have not been accustomed to floodingin recent years (Lamers et al., 2006; Hogan et al., 2004). The present land uses ofthese floodplains include agricultural use for live stock raising and semi-natural use(extensive grazing, haymaking) for conservation of grassland biota. These differentland uses have resulted in soils with different biogeochemical characteristics.10
During a flood event, a soil becomes anaerobic and its ammonium concentration(NH4) will increase, due to a net increase of ammonification and strong reduction of(aerobic) nitrification processes. Denitrification of NO3 present will cause gaseous ni-trogen loss to the atmosphere (N2O and N2; Reddy and Patrick Jr., 1984). After theflood has receded, the penetration of air causes soil oxidation, so that NH4 will be nitri-15
fied to NO3. Flooding also leads to the reduction of Fe(III)-oxides to Fe(II), followed byoxidation back to Fe(III)-oxides as soon as the flood has receded. The oxidised formof Fe has a stronger binding capacity of phosphate (PO3−
4 ) than Fe(II). Flooding, there-fore, causes a net increase in P availability in the floodplain soil (Darke and Walbridge,2000). Although the process is reversible in case of reoxidation, Fe-sulphides are in-20
soluble and will precipitate to FeS or pyrite (FeS2) during the period of flooding andsulphate reduction. Less Fe(III) is available to bind PO4 after recession of the flood,because oxidation of pyrite is slow (Roden and Edmonds, 1997). The effects of floodingon soil potassium have hardly been investigated and the few studies carried out in wet-lands have described contrasting effects (Olde Venterink, 2002). Nutrient availability,25
primarily of nitrogen, phosphorus and potassium, is a major factor determining biomassand species composition of herbaceous vegetation. Other macronutrients as Ca, Na,Mg and SO4 can be affected by winter flooding as well through reduction/oxidation-,cation exchange and complexation processes.
5205
BGD5, 5203–5232, 2008
Plant site conditionsafter winter flooding
V. Beumer et al.
Title Page
Abstract Introduction
Conclusions References
Tables Figures
J I
J I
Back Close
Full Screen / Esc
Printer-friendly Version
Interactive Discussion
Biogeochemical soil processes related to flood-dry cycles may also produce phy-totoxines with strong effects on the vegetation. During a flood event soil aeration willdecrease; micro-organisms active in organic matter breakdown will start to use electronacceptors alternative to oxygen and will subsequently shift to NO3, Fe(III) and sulphate(SO4), thereby producing Fe(II) and sulphides (S2−, HS− and H2S) (Ponnamperuma,5
1972). Changes in pH associated with flooding events may also cause a release ofFe and Al ions. Hence, flooding events can lead to an increase of Fe(II), Al(III), NH4and sulphides, which are all potentially toxic for plants (Mitsch and Gosselink, 1993).However, after a flooding period, potentially toxic elements will be reoxidised into com-pounds which are relatively harmless, and sometimes even essential, to plants.10
The occurrence of winter floods implies that effects occur outside the growing sea-son, when plants are dormant or in a quiescent state. These effects of winter floodingare probably not acting directly on the plants during the event itself, but more by bio-geochemical consequences of flooding for plant soil conditions, which may last intothe growing season, after the flood has receded and the soil becomes aerated again.15
To our knowledge it has not been studied to what extent such alterations affect plantgrowth conditions. Do effects of a winter flood event, indeed, impact the plant growthafterwards or will the effects disappear shortly after re-aeration? A suitable methodto assess plant growth conditions is the use of phytometers (test plants) on soil coresor pots in an experimental setup (Wheeler et al., 1992). The phytometer approach20
enables evaluation of the consequences of flooding via the soil conditions on plantgrowth while geochemical measurements only address individual parameters. Soil orpore water measurements might indicate changes in nutrient availability; however, theydo not reveal the plant response to it. High nutrient availability might be the result ofhampered plant growth and associated nutrient uptake. With only geochemical infor-25
mation it would be more difficult to evaluate the effects on plants, because nutrientsand toxic substances have opposite effects and might also interfere with one another.Phytometers can indicate a potential nutrient shortage with their internal nutrient ra-tios (Koerselman and Meuleman, 1996) that cannot be concluded from soil properties
5206
BGD5, 5203–5232, 2008
Plant site conditionsafter winter flooding
V. Beumer et al.
Title Page
Abstract Introduction
Conclusions References
Tables Figures
J I
J I
Back Close
Full Screen / Esc
Printer-friendly Version
Interactive Discussion
alone. However, species may differ strongly in their reactions to a certain set of plantsite conditions and such specific effects have to be taken into account. The use ofmore than one species will reveal some of the possible differences. We have selectedtwo species as phytometers on the basis of their growth potential and their occurrencein the floodplain environment: Anthoxantum odoratum L. (Sweet vernal grass) and5
Lythrum salicaria L. (Purple loosestrife).The major goal of this research is, firstly, to investigate the plant growth conditions in
floodplain soils in the period after a winter flood and, secondly, to determine whether aphytometer setup is suitable for the evaluation of winter flooding on plant growth condi-tions. We have raised the following research questions: (1) How does winter flooding10
in riverine grasslands affect the biogeochemical plant growth conditions in spring? (2)How does land use (agricultural versus semi-natural) influence these effects? (3) Whatdo plant nutrient concentrations and their stoichiometry indicate about the changesof plant growth conditions? (4) Can the responses of seedlings of floodplain species(“phytometers”) be used in evaluations of the consequences of flooding for the vege-15
tation? And, (5) do the two selected species show different responses and what doesthat imply for the interpretation of effects at the plant community level?
We hypothesize that the use of phytometers will reveal geochemical changes after awinter flooding event. At sites with P limited plant growth, the limitation will be lifted afterwinter flooding due to phosphate mobilization processes during soil anoxia resulting20
in increased P uptake by the phytometers. Due to a net increase of ammonificationduring the winter flood event soil ammonium concentration will be elevated and mightreach toxic levels, negatively influencing plant growth. The phytometers will reflect sucheffects through lower survival or hampered growth. The toxic effects of Fe and Al willbe species specific as well.25
To test our hypotheses we have set up a phytometer experiment. Soil cores fromfloodplain soils with different land uses have been exposed to a simulated winter flood-ing event. Then, cores were subjected to spring conditions in a growth chamber andwere planted with seedlings of Anthoxantum odoratum and Lythrum salicaria. These
5207
BGD5, 5203–5232, 2008
Plant site conditionsafter winter flooding
V. Beumer et al.
Title Page
Abstract Introduction
Conclusions References
Tables Figures
J I
J I
Back Close
Full Screen / Esc
Printer-friendly Version
Interactive Discussion
species together might reveal whether effects are of nutritious or toxic nature, be-cause they have contrasting preferences for hydrological and associated geochemi-cal conditions: L. salicaria prefers wet, eutrophic, conditions and A. odoratum drier,mesotrophic, conditions.
2 Materials and methods5
Intact soil cores in PVC tubes collected in the field (see below) were subjected to a 2-month flooding treatment in a dark room with constant temperature (15◦C). The coreswere subsequently drained, planted with phytometers and kept in a plant growth cham-ber. Two plant species were used as phytometers: the grass Anthoxanthum odoratumL. and the herb Lythrum salicaria L. They have been selected based on their abun-10
dance in river catchments, germination and seedling transplantation success, but notbecause of their tolerance to flooded conditions. A. odoratum is known to be sensitiveto flooding and, therefore, less abundant in regularly flooded grasslands. In the fieldthe species is absent in permanently wet or very dry sites and prefers slightly acid soils(Weeda et al., 1994). Its root growth is hampered by increasing Al availability; however,15
available PO4 can reduce these effects (Davies and Snaydon, 1973), possibly by com-plexation of Al and PO4 (Darke and Walbridge, 2000). In the field L. salicaria prefersmoist to very wet, eutrophic sites and can sustain long and highly frequent flooding dur-ing the growing season (Weeda et al., 1987). In spring it primarily reproduces via seedgermination on moist or flooded soil indicating that the plant species is well adapted to20
anaerobic soil conditions as a seedling.The soils were collected in August 2006 on the floodplains of the Beerze river
(province of Noord-Brabant, The Netherlands) from six grassland sites that have notbeen flooded by the river in the last decade. The sites are divided into two groupsbased on their present or previous land use: (1) semi-natural grassland without inten-25
sive agricultural history (SNI=Semi-Natural I, SNII=Semi-Natural II and ASN=AcidicSemi-Natural) and (2) actual or previous agricultural grassland (FA=Former Agricul-
5208
BGD5, 5203–5232, 2008
Plant site conditionsafter winter flooding
V. Beumer et al.
Title Page
Abstract Introduction
Conclusions References
Tables Figures
J I
J I
Back Close
Full Screen / Esc
Printer-friendly Version
Interactive Discussion
tural now semi-natural, AI=Agricultural I and AII=Agricultural II). These differencesin land use history have resulted in differences in soil nutrient contents and vegeta-tion (Table 1). The floodplains have sandy soils and generally are discharge areas ofcalcium-rich groundwater. One semi-natural site (ASN) had a low pore water pH of3.8–3.9 units. The FA site is placed in the group of agricultural land use, despite its5
present semi-natural land use, because of its former agricultural use and associatedfertilizer application. None of the sites had been flooded in the winter previous to ourexperiment.
In all sites studied, 32 cores were collected to enable a winter-flooded and a controltreatment, with separate groups of cores for the two phytometer species: 6 sites×210
treatments×2 plant species gives 24 groups with n=8. Intact soil cores were col-lected in PVC-tubes (Ø: 8 cm and length: 30 cm). The winter-flooded treatment wasperformed by subjecting the cores to flooding with artificial brook water (SO4=49.0,NO3=10.2, NH4=1.6, PO4=0.05, K=14.9, Fe=0.2, all as mg·l−1, and pH=6.8) that wasrefreshed every two weeks. The control cores were kept in a drained condition, but15
desiccation was prevented by regularly adding small amounts of rain water. All coreswere stored in darkness at a temperature of 15◦C. After 8 weeks of winter flooding,all cores were transported to a plant growth chamber (with a temperature of 20◦C, airhumidity of 75% and a light period with a photon flux density of 400 micromols−1 m−2
from 07:00 till 21:30) to simulate spring conditions after the flood has receded. The20
cores were perforated at the bottom and placed in artificial groundwater (SO4=18.6,NO3=0.04, NH4=0.2, PO4=0.18, K=6.7, Fe=0.03, all as mg·l−1, and pH=8.0) up to10 cm below soil surface so the groundwater could infiltrate from bottom to top. The ar-tificial groundwater was refreshed every two weeks. Rain water was supplied regularlyat the top.25
One week after seed germination, equally sized seedlings of the phytometer specieswere planted on the cores. Survival was monitored and after 8 weeks the above-ground biomass was harvested, dried for 48 h at 70◦C and weighed. After grinding, theplant material was digested with a mixture of salicylic acid (0.36 M) and sulphuric acid
5209
BGD5, 5203–5232, 2008
Plant site conditionsafter winter flooding
V. Beumer et al.
Title Page
Abstract Introduction
Conclusions References
Tables Figures
J I
J I
Back Close
Full Screen / Esc
Printer-friendly Version
Interactive Discussion
(29.5 M) using a selenium mixture as catalyst (Page et al., 1982). Nitrogen, P and Kconcentrations were determined colorimetrically on a continuous flow analyzer (SA-40;Skalar analytical, Breda, the Netherlands). The same extraction method was used todetermine the soil nutrient contents; it mainly concerns the organic and exchangeablefractions of N, P and K in the soil.5
The nutrient concentrations of the plants were used as an indication for nutrient limi-tation. The N:P ratios higher than 15 indicate P limitation and lower than 14 indicate Nlimitation, N:K ratios higher or lower than 2.1 indicate K limitation and N limitation, re-spectively, and P:K ratios higher or lower than 0.3 indicate K limitation and P limitation,respectively (Koerselman and Meuleman, 1996; Olde Venterink et al., 2003).10
Pore water from 4 cores per treatment group was sampled using soil moisture sam-plers (Rhizon SMS-10 cm; Eijkelkamp Agrisearch Equipment, Giesbeek, the Nether-lands). Due to logistic reasons we had to limit the replication of the soil moisture mea-surements to four. Therefore, we considered the cores with L. salicaria and A. odora-tum equal in this and sampled two replicate cores of both species. After the pH was15
determined, pore water samples were stored at −20◦C. Concentrations of NH4, NO3,PO4, K, Al, Fe, Cl, SO4, Mg and Na were determined colorimetrically on a continuousflow analyzer.
Data were tested for normal distribution and transformed with natural logarithm ifneeded. One-way and two-way ANOVA were used to investigate the data sets. To test20
differences in plant variables between the areas within the land uses, the sites wereanalysed as nested factors within the land use factor in a two-way ANOVA. All statisticalanalyses were performed using SPSS 15.0.1 for Windows.
5210
BGD5, 5203–5232, 2008
Plant site conditionsafter winter flooding
V. Beumer et al.
Title Page
Abstract Introduction
Conclusions References
Tables Figures
J I
J I
Back Close
Full Screen / Esc
Printer-friendly Version
Interactive Discussion
3 Results
3.1 Site characterization
Table 1 presents some characteristics of the sites we used. The soils of the SNI andSNII sites had the highest N and organic matter content and the soils of the AI and AIIsites had the lowest. The sites of the agricultural land use group had the highest soil5
P; probably as a result of fertilizer applications. The nutrient ratios in plant biomassin these sites indicated a clear K and N-limitation, reflecting the strong accumulationof bio-available P in the soils. In the vegetation of the SNI and SNII sites, plant nutri-ent ratios revealed a N limitation, but, here, something else than availability must behampering the N uptake of the vegetation, since bio-available N is present in higher10
concentrations than in the other sites. The ASN site has a co-limitation of N and Kwhich explained the higher bio-available P in the soil than in the SNI and SNII sites.
3.2 Phytometer biomass and survival
Table 2 shows that the survival of both species on the cores from semi-natural siteswhich had received the winter flooding treatment was higher than on the control cores.15
For L. salicaria this was especially the case for the cores from the ASN site. Floodingtreatment had almost no effect on phytometer survival in the soils from the agriculturalsites.
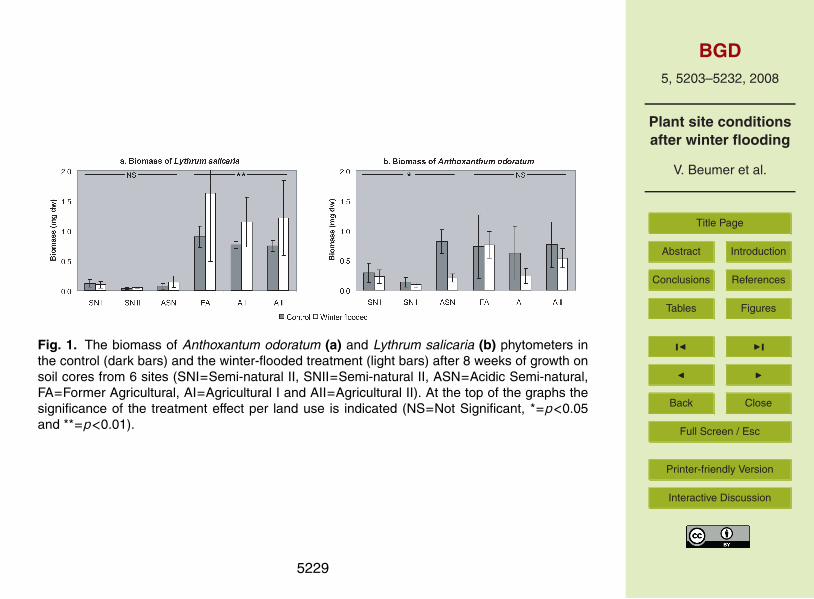
The effect of winter flooding on phytometer biomass was opposite for the two species(Fig. 1). A two-way ANOVA for each species with treatment and land use as fixed20
factors, and site as a nested factor within the land use factor, indicated no interac-tion effects for both species (Table 3). Treatment turned out to significantly affect thebiomass of A. odoratum: the biomass was lower in the winter-flooded treatment than inthe control treatment (on average 38% lower); regardless of the difference in land use(Table 3). Figure 1 showed this difference primarily for the ASN, AI and AII cores. For25
L. salicaria a significant treatment effect was found as well: the biomass was higher in
5211
BGD5, 5203–5232, 2008
Plant site conditionsafter winter flooding
V. Beumer et al.
Title Page
Abstract Introduction
Conclusions References
Tables Figures
J I
J I
Back Close
Full Screen / Esc
Printer-friendly Version
Interactive Discussion
the winter-flooded treatment. This overall effect was mostly the result of the cores of theagricultural land use group. For both species a significant land use effect was found(Table 3), i.e., they had a significantly lower biomass on the semi-natural cores thanon the agricultural ones. The analysis of site as a nested factor within land use indi-cated that there was no significant difference in L. salicaria biomass between the cores5
of different agricultural sites (Table 3). Among the cores from semi-natural sites, thebiomass on the SNII cores was significantly lower than on the cores from the other twosites. Anthoxantum odoratum biomass differed significantly between the semi-naturalcores as well as between the agricultural cores. It was highest in the control cores andshowed the largest reduction in the flooding-treated cores from the ASN site (Fig. 1).10
Using one-way ANOVA for both land uses separately for each species and with treat-ment as a fixed factor, we investigated effects of the winter-flooded treatment per landuse per species (indicated at the top of the graphs in Fig. 1). We found a significant,negative effect of the winter-flooded treatment on the biomass of A. odoratum on thesemi-natural cores (F=5.0 and p<0.05), and this effect was not significant on the agri-15
cultural cores. The biomass of L. salicaria was significantly positively affected by win-ter flooding on the agricultural cores (F=7.9 and p<0.01), and not on the semi-naturalcores.
3.3 Phytometer nutrients and nutrient stoichiometry
3.3.1 Anthoxantum odoratum20
Figure 2 shows the nutrient concentrations (N, P and K) of A. odoratum and Table 3presents the results of a two-way ANOVA with treatment and land use as fixed factors,and site nested within land use for both phytometer species separately. We did notfind a significant treatment effect, but we did find a land use effect: the A. odoratumN concentrations were significantly higher on the semi-natural than on the agricultural25
cores. The nested site factor indicated that the cores of the sites within both land usegroups differed significantly (Table 3). Total N content (TN) of the phytometers, how-
5212
BGD5, 5203–5232, 2008
Plant site conditionsafter winter flooding
V. Beumer et al.
Title Page
Abstract Introduction
Conclusions References
Tables Figures
J I
J I
Back Close
Full Screen / Esc
Printer-friendly Version
Interactive Discussion
ever, was significantly affected by both treatment and land use (Table 3). TN was lowerin the winter-flooded treatment than in the control (Fig. 2d) and cores of the sites dif-fered significantly within both land use groups (Table 3). The treatment effect on TNconcurs with that on the biomass (note that TN is the phytometer N concentration mul-tiplied by its biomass). We found significant interaction effects between the two main5
factors for the phytometers P as well as K concentrations, implying that the two landuse groups showed different treatment effects. Phosphor concentrations on the semi-natural cores were mostly higher in the winter-flooded treatment than in the control,while on the agricultural cores they were generally lower than in the control (Fig. 3b).The K concentrations on the cores of both land use groups were generally higher in10
the winter-flooded treatment than in the control, however, the difference was larger onthe semi-natural cores (Fig. 2c; 116% versus 33% increase). Note that the cores dif-fered significantly within the land use groups (Table 3) and that the K concentrations ofA. odoratum increased due to the winter flooding effect (Fig. 2c), while their biomassdecreased. The treatment and land use effect on TP were similar to the effects on the15
biomass. However, for TK this was not the case: TK was not affected significantly bytreatment (Table 3).
3.3.2 Lythrum salicaria
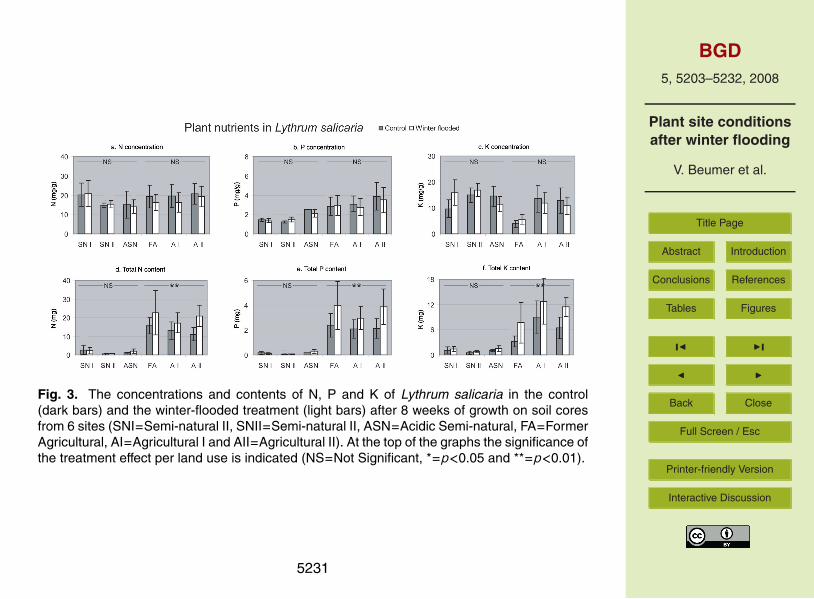
Figure 3 shows the nutrient concentrations (N, P and K) of L. salicaria. There wereno significant differences in phytometer N concentrations between treatments or land20
use groups; however, cores differed significantly within both land use groups (Table 3).Phytometer TN was significantly affected by land use and treatment (Table 3) concur-rently to its biomass. Land use had a significant effect on both phytometer P and Kconcentration (Table 3); P concentration was higher and K concentration lower thanon the cores with agricultural than with semi-natural land use (Fig. 3b and 3c). Both25
TP and TK were significantly affected by land use as well as treatment (Table 3), withhigher values on the agricultural than on the semi-natural land use and higher values inwinter-flooded than in control treatments (Fig. 3e and f). None of the nutrients showed
5213
BGD5, 5203–5232, 2008
Plant site conditionsafter winter flooding
V. Beumer et al.
Title Page
Abstract Introduction
Conclusions References
Tables Figures
J I
J I
Back Close
Full Screen / Esc
Printer-friendly Version
Interactive Discussion
interactions among treatment and land use. However, L. salicaria took up more N, Pand K from the agricultural soil cores and more P and K from the cores that had beensubjected to winter flooding. One-way ANOVA with treatment as a fixed factor, usingonly the cores with agricultural land use, showed significant increases of all three totalnutrient contents when cores were winter-flooded (Fig. 3d, e and f; TN: F=9.9 and5
p<0.01; TP: F=12.6 and p<0.01; TK: F=12.6 and p<0.01).To compare the N, P and K uptake between the two phytometer species (TN, TP
and TP), we have used two-way ANOVA for both land use groups separately, withtreatment and species as fixed factors. Note that these results are not presented in atable. In the semi-natural cores we found a significant interaction effect for TN (F=4.410
and p<0.05). On average, A. odoratum took up 45% less N from the winter-floodedthan from the control cores, while L. salicaria extracted 17% more N from the soil inthe winter-flooded cores. In the cores from agricultural soils all three total phytometernutrient contents had significant interaction effects (TN: F=8.3 and p<0.01; TP: F=9.3and p<0.01; TK: F=5.9 and p<0.05). Lythrum salicaria took up more of all three15
nutrients in the winter-flooded than in the control treatment (ranging between 51–71%more), whereas A. odoratum extracted more of all three nutrients in the control than inthe winter-flooded treatment (ranging between 41–74% more).
3.3.3 Nutrient stoichiometry
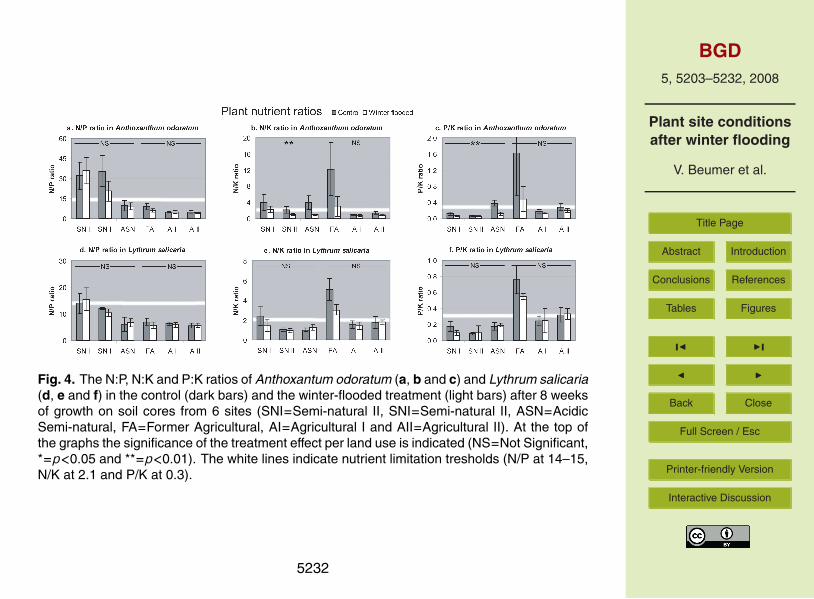
The nutrient ratios of A. odoratum in the control treatment indicated P limitation in the20
SNI and SNII cores, K limitation in the ASN cores and N limitation in the AI, AII and FAcores (Fig. 4a, b and c). Treatment affected N:P, N:K and P:K ratios significantly for thisphytometer (Table 3). In general, all ratios decreased when cores were winter-flooded(Fig. 4a, b and c). This indicates that A. odoratum experienced a shift towards strongerN limitation in most cores. On the SNII cores we found P limitation remaining in the25
winter-flooded treatment. On the ASN cores both N:K and P:K ratios showed a shiftfrom indication of K limitation to indication of N limitation.
The nutrient ratios of L. salicaria in the control treatment indicated weak P limitation5214
BGD5, 5203–5232, 2008
Plant site conditionsafter winter flooding
V. Beumer et al.
Title Page
Abstract Introduction
Conclusions References
Tables Figures
J I
J I
Back Close
Full Screen / Esc
Printer-friendly Version
Interactive Discussion
on the SNI cores, N limitation on the SNII, ASN, AI and AII cores and K limitation onthe FA cores (Fig. 4d, e and f). The winter-flooded treatment affected N:K and P:Kratios of L. salicaria significantly (Table 3). Especially on the SNI and the FA coresratios decreased when cores had been winter-flooded, indicating a weaker K limitationon FA cores and a change from indication of P limitation to N and P co-limitation on5
SNI cores.
3.4 Pore water chemistry
Two-way ANOVA with treatment and land use as fixed factors for pore water nutrientsmeasured 3 days after the start of the phytometer experiment showed significant treat-ment effects for NO3 and NH4 and a significant land use effect for PO4 (Table 4). Pore10
water NH4 was significantly higher and NO3 significantly lower (except in SNI and SNIIcores) in the winter-flooded than in the control cores (Table 4). Two-way ANOVA withtime and treatment as fixed factors, for both land use groups separately, showed: asignificant time effect for PO4 in the semi-natural land use cores, and significant inter-actions of time and treatment for NO3 in the agricultural land use cores as well as for15
NH4 in the cores of both land use groups (Table 4). Phosphate decreased significantlyover time in the semi-natural group, but showed no trend in the agricultural group. Porewater nitrate decreased significantly over time in the control treatment, whereas it didnot show a trend in the winter flooding treatment (except in the SNII cores). For NH4 itis the other way around: a decrease over time in the winter-flooded treatment (except20
in the SNI cores) and no trend in the control.Pore water pH increased significantly during the winter flooding treatment in cores
from semi-natural land use sites (data not shown). At the start of the experiment pHwas mostly higher in the cores from sites with agricultural than with semi-natural landuse. Pore water Al showed the opposite trend, although concentrations were low in the25
SNI, SNII, FA and AI cores. Pore water pH in the ASN cores with control treatment waslow and Al was high. Pore water Fe showed significant treatment effects in the coresof both land use groups. The Fe concentrations were higher in the winter-flooded
5215
BGD5, 5203–5232, 2008
Plant site conditionsafter winter flooding
V. Beumer et al.
Title Page
Abstract Introduction
Conclusions References
Tables Figures
J I
J I
Back Close
Full Screen / Esc
Printer-friendly Version
Interactive Discussion
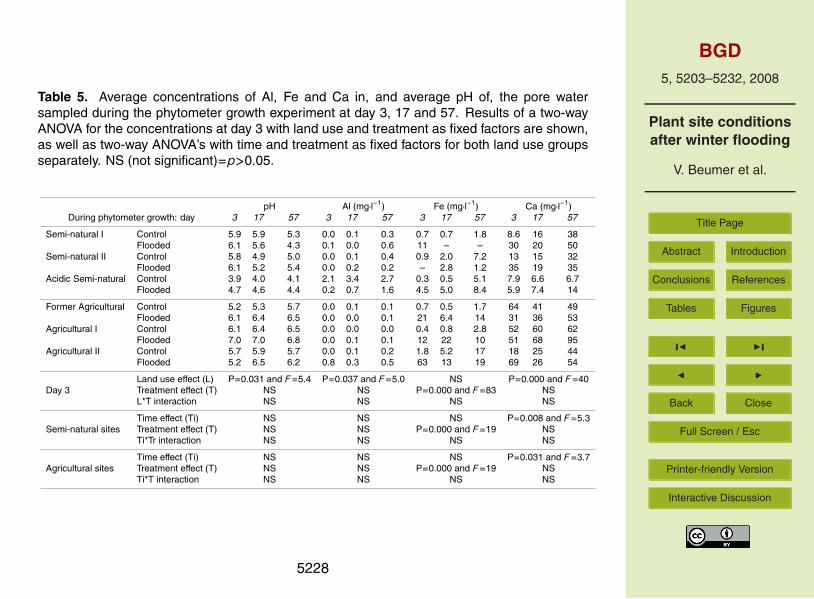
than in the control cores, albeit that measurements in the SNI and SNII cores wereincomplete. Pore water Fe increased during winter flooding (data not shown) and,subsequently, showed significant treatment effects at the start of the phytometer growth(Table 5). Pore water Ca did not show significant treatment effects in the cores of bothland use groups; however, Ca concentration in the flooded cores at the start of the5
phytometer growth was three times as high as in the control cores (Table 5). Porewater concentrations of Na, Mg and SO4 were also not significantly different betweenthe treatments (data not shown). Sulphate reduction did take place in some coresduring the flooding treatment; however, it seemed that the sulphides were oxidisedagain at day 3 of the phytometer growth.10
4 Discussion and conclusion
In this study, we wanted to test a phytometer approach to evaluate whether plant growthconditions in spring were affected by a preceding winter flood, even after the floodhad receded. The flooding treatment resulted in changed growth conditions affectingour two phytometer species in opposite directions. For L. salicaria, conditions were15
generally improved in the winter-flooded treatment, while for A. odoratum they haddeclined. This surprising result shows that the ecological characteristics of speciesoccurring in flooded sites may differ quite strongly. Possible causes of an increase ordecrease in biomass as a result of a previous winter flooding might include (1) soilnutrient effects (N, P and K), (2) toxic effects of NH4, Fe and Al, and (3) possible20
shortage of other macro- and micronutrients. However, our results have shown thatthis last possibility most probably did not play a role in our experiment.
4.1 N, P and K effects
A decrease in biomass growth after winter flooding suggests that the limiting nutrientin the control situation became more limiting as a result of the flooding or that another25
5216

BGD5, 5203–5232, 2008
Plant site conditionsafter winter flooding
V. Beumer et al.
Title Page
Abstract Introduction
Conclusions References
Tables Figures
J I
J I
Back Close
Full Screen / Esc
Printer-friendly Version
Interactive Discussion
nutrient started to overrule the original limitation by being even more limiting. In theASN site, where the lower biomass of A. odoratum in the winter-flooded treatment wasobvious, the K limitation in the control cores changed into N limitation in the winter-flooded cores. The (non-flooded) vegetation in the field indicated an N and K co-limitation. These results imply that when winter flooding will be introduced here, K5
might no longer limit plant growth at this site. Although the N uptake by A. odoratumwas strongly reduced after winter flooding, it is hard to tell whether the N limitationwas more severe than the original K limitation. In the SNI and SNII sites, A. odoratumindicated P limitation in both the control and winter-flooded treatments, whereas thevegetation in the field indicated N limitation. The phytometers produced only a little less10
biomass in the winter-flooded than in the control treatment and were able to maintaintheir P uptake, suggesting that P limitation was not the primary cause of the lowerbiomass production. Similarly, in the AI and AII sites A. odoratum growth was N limitedin both treatments, but there are no indications that the slightly lower growth in winter-flooded soils was due to a stronger N limitation. Concluding, winter flooding did not15
affect A. odoratum biomass production strongly, but when it did the biomass decreased,and limiting nutrients did not correspond with the non-flooded field situation.
Lythrum salicaria reacted differently. It showed a higher biomass after winter-floodingin the agricultural sites, which suggests a higher availability of the limiting nutrient. Nu-trient stoichiometry in the phytometers, as well as in the vegetation in the field, indicated20
N limitation in these sites, which did not change after winter flooding. In this case, win-ter flooding must have weakened N limitation, resulting in an increased biomass of thevegetation. We have shown a shift from high NO3 to high NH4 availability in the porewater after winter flooding. Apparently, L. salicaria plants can use both forms of inor-ganic N directly for growth. Lythrum salicaria showed also higher biomass growth after25
winter flooding in the former agricultural site, which was K-limited. This suggests thatK became more available for the plants, which was confirmed by the lower pore waterK concentrations after the growth period in the winter-flooded cores. Summarizing, weconclude that the winter flooding causes higher availabilities of N in the agricultural
5217
BGD5, 5203–5232, 2008
Plant site conditionsafter winter flooding
V. Beumer et al.
Title Page
Abstract Introduction
Conclusions References
Tables Figures
J I
J I
Back Close
Full Screen / Esc
Printer-friendly Version
Interactive Discussion
sites and K in the former agricultural site, because L. salicaria grew more biomassafter winter flooding and indicated no change in type of nutrient limitation. Obviously,A. odoratum did not benefit from these conditions and must have experienced othertypes of effects.
4.2 Toxicity5
The hampered growth of A. odoratum could have been the result of toxicity effects ofiron or ammonium. Iron toxicity thresholds for iron sensitive plants starts from 8 mg·l−1
(Snowden and Wheeler, 1993) and this concentration was well exceeded in our agricul-tural soils after winter flooding. However, the growth of A. odoratum was not hamperedin the winter-flooded cores of the FA site, despite the high pore water Fe concentration,10
so that we can rule out toxic iron effects in our experiment. Anthoxantum odoratum hasbeen reported to be rather sensitive to enhanced ammonium concentrations, althoughno quantitative information on toxic levels was given (Weeda et al., 1994). There is suchinformation for species occurring in the same habitats with A. odoratum. Lucassen etal. (2003) found that Cirsium dissectum was negatively affected when pore water am-15
monium concentrations exceeded 3.5 mg·l−1, while Van den Berg et al. (2005) foundSuccisa pratensis already negatively affected at 1.4 mg·l−1. In our experiment, the am-monium concentrations in the agricultural sites and in the semi-natural land use groupranged between 3 and 19 mg·l−1 during the first three weeks after the winter-floodedtreatment. Therefore, it is likely that A. odoratum growth was affected by ammonium20
toxicity in these sites.Several studies (Stevens et al., 1997; Lempe et al., 2001) have shown that
L. salicaria is well suited to grow in anaerobic soil conditions. Also, Snowder andWheeler (1993) found in growth experiments that L. salicaria was semi-tolerant for Fe,it did not experience serious growth restrictions up to 50 mg·l−1. We think that tolerance25
for high Fe concentrations is one of the factors explaining why L. salicaria was not neg-atively affected by the flooding treatment. Moreover, in the winter-flooded treatment thepore water Al concentration was lowered from potentially toxic levels to non-toxic levels,
5218

BGD5, 5203–5232, 2008
Plant site conditionsafter winter flooding
V. Beumer et al.
Title Page
Abstract Introduction
Conclusions References
Tables Figures
J I
J I
Back Close
Full Screen / Esc
Printer-friendly Version
Interactive Discussion
which could also have contributed to a better growth of L. salicaria in the flooded treat-ment. Toxic levels of Al for wetland species have hardly been reported, but Gensemerand Playle (1999) stated that rice seedlings were already growth inhibited at Al con-centrations of 0.2 mg·l−1, indicating that Al in the control cores of the ASN site may wellhave been toxic (2 mg·l−1 and higher) for our wetland species. The temporary lowering5
of the pore water Al concentration after the winter flood event probably allowed L. sali-caria to survive, whereas the high Al concentrations in the non-flooded treatment arethe most probably cause of the high mortality we found in this treatment.
4.3 Differences in land use
The phytometer experiment showed that, for soils that had not been subject to a winter10
flood, growth conditions for A. odoratum and L. salicaria were better suited in soils withagricultural than with semi-natural land use. The A. odoratum phytometers indicateda P limitation in both semi-natural sites, while the plant nutrient concentrations in thefield revealed an N limitation. This shows that plant nutrient limitation in the field notalways corresponds with that found in a phytometer experiment. Depending on the15
species composition in the field and the identity of the phytometers, results may ormay not be similar. Both phytometers showed that winter flooding affected plant growthconditions most in the soils with agricultural land use. Lythrum salicaria showed thatmore nitrogen or potassium became available after winter flooding in the agriculturalland use group, while it did not show a change in nutrient availability in the semi-natural20
land use group. And A. odoratum indicated an increase of the availability of toxiccompounds after winter flooding in the semi-natural land use group and, presumably,in the two agricultural sites; however, it did not indicate an increase in the availability oftoxic compounds in the former agricultural site.
5219
BGD5, 5203–5232, 2008
Plant site conditionsafter winter flooding
V. Beumer et al.
Title Page
Abstract Introduction
Conclusions References
Tables Figures
J I
J I
Back Close
Full Screen / Esc
Printer-friendly Version
Interactive Discussion
4.4 Phytometer setup
The results of the phytometer experiment showed that, even for cores from the samesite, growth conditions after the winter-flooded treatment were experienced differentlyby our two plant species. This raises the question whether we can use a phytometersetup to properly evaluate flooding effects on plant growth conditions. We argue that5
the answer is positive, for the following three reasons. First, the phytometer approachgave us a conclusive answer whether the combined reaction of various geochemicalfactors to winter flooding resulted in better or worse conditions for the growth of two con-trasting floodplain species. Second, the approach allowed us to distinguish betweennutritious and toxic effects by carefully comparing growth responses and stoichiomet-10
ric characteristics of the nutrients in plant tissues. Of our two species, Anthoxanthumodoratum primarily reacted to the presence of growth-inhibiting compounds such asFe, Al and NH4, whereas Lythrum salicaria reacted to increased nutrient availabilitywith a growth response. The use of these two species in combination has clear ad-vantages, because L. salicaria is a species of nutrient-rich wetlands, obviously able to15
cope with anaerobic soil conditions and not hampered easily by potentially toxic com-pounds (Lempe et al., 2001; Zedler and Kercher, 2004). Therefore, it is well-suitedto assess the nutrient status in previously flooded soils. Anthoxanthum odoratum is aspecies of humid, mesotrophic grasslands and less frequently found in wetlands withstrongly fluctuating water tables (Weeda et al., 1994). It is probably less adapted to20
anaerobic soil conditions and will, therefore, be a better indicator of possible toxic ef-fects as a result of flooding than L. salicaria. The combined use of these two species asphytometers has been shown to be appropriate to assess effects of winter flooding. Fi-nally, we were able to detect different responses of the phytometers to flooding of soilswith different land use histories. Both nutrient and toxicant availabilities were enhanced25
after winter flooding in agricultural sites; here, soil P content was high and NH4 and Febecame increasingly available after flooding. Plant growth in the semi-natural siteswas mainly restricted by nutrient limitation and this remained so after winter flooding.
5220
BGD5, 5203–5232, 2008
Plant site conditionsafter winter flooding
V. Beumer et al.
Title Page
Abstract Introduction
Conclusions References
Tables Figures
J I
J I
Back Close
Full Screen / Esc
Printer-friendly Version
Interactive Discussion
The potentially toxic Al concentration in the acidic semi-natural site was temporarilylowered after winter flooding. Here, the groundwater level was lower than in the othersemi-natural sites, so, without flooding, the supply of basic cations might be low andthe pore water Al concentration can reach high values. The results show that in streamvalley sites with disturbed hydrology, like our acid semi-natural site, unfavourable toxic5
growth conditions can be neutralised temporarily by winter flooding.The phytometer approach is particularly suited to evaluate spring conditions after the
flood has receded. Phytometers are seedlings that respond directly to extra nutrientsand toxicants, because they have no below-ground rhizomes or storage organs witha large perennial root system. In our experiment, they did not experience the actual10
winter flood with direct anaerobic conditions in the root zones and did not experiencecompetition. This resulted in additional insights that cannot be obtained by measuringthe response of the actual vegetation in the field. Another advantage is that the methodcan be used to predict flooding effects at sites which have not previously been subjectto flooding. However, the limitation of the approach is that no direct conclusions can be15
drawn about the response of the vegetation in terms of changes in species composi-tion. Moreover, different from the field situation, no sedimentation or erosion processesoccurred in the phytometer experiment, although they have been reported to occur dur-ing winter flooding, with the associated nutrient enrichment caused by sedimentation(Kronvang et al., 2007). Our phytometer approach was designed to investigate winter20
flooding originating from groundwater exfiltration or rain water accumulation, withoutriverbank overflow. It involves two out of the four winter flooding situations (Beumeret al., 2008) that were recognized to be important to interpret flooding effects on geo-chemistry and vegetation in Dutch river valleys. Further comparisons of the responseof phytometers with the response of the vegetation in the field, and incorporation of25
sedimentation and erosion effects, are the next steps for developing a phytometer ap-proach as a robust, standardized methodology to evaluate the response of plant siteconditions and vegetation composition to winter flooding.
5221

BGD5, 5203–5232, 2008
Plant site conditionsafter winter flooding
V. Beumer et al.
Title Page
Abstract Introduction
Conclusions References
Tables Figures
J I
J I
Back Close
Full Screen / Esc
Printer-friendly Version
Interactive Discussion
References
Beumer, V., van Wirdum, G., Beltman, B., Griffioen, J., and Verhoeven, J. T. A.: Geochemistryand flooding as determining factors of plant species composition in Dutch winter-floodedriverine grasslands, Sci. Total Environ., 402(1), 70–81, 2008.
Darke, A. K. and Walbridge, M. R.: Al and Fe biogeochemistry in a floodplain forest: Implica-5
tions for P retention, Biogeochemistry, 51(1), 1–32, 2000.Davies, M. S. and Snaydon, R. W.: Physiological differences among populations of Anthoxan-
thum odoratum L. collected from the Park Grass Experiment II., Response to aluminium, J.Appl. Ecol., 10, 47–55, 1973.
Gensemer, R. W. and Playle, R. C.: The Bioavailability and Toxicity of Aluminium in Aquatic10
Environments, Crit. Rev. Env. Sci. Tec., 29(4), 315–450, 1999.Gusewell, S. and Koerselman, M.: Variation in nitrogen and phosphorus concentrations of
wetland plants, Perspect. Plant Ecol., 5(1), 37–61, 2002.Hogan, D. M., Jordan, T. E. and Walbridge, M. R.: Phosphorus retention and soil organic carbon
in restored and natural freshwater wetlands, Wetlands, 24(3), 573–585, 2004.15
Koerselman, W. and Meuleman, A. F. M.: The vegetation N:P ratio: A new tool to detect thenature of nutrient limitation, J. Appl. Ecol., 33(6), 1441–1450, 1996.
Kronvang, B., Andersen, I. K., Hoffmann, C. C., Pedersen, M. L., Ovesen, N. B., and Andersen,H. E.: Water exchange and deposition of sediment and phosphorus during inundation ofnatural and restored lowland floodplains, Water Air Soil Poll., 181(1–4), 115–121, 2007.20
Lamers, L. P. M., Loeb, R., Antheunisse, A. M., Miletto, M., Lucassen, E. C. H. E. T., Boxman, A.W., Smolders, A. J. P., and Roelofs, J. G. M.: Biogeochemical constraints on the ecologicalrehabilitation of wetland vegetation in river floodplains, Hydrobiologia, 565, 165–186, 2007.
Lempe, J., Stevens, K. J., and Peterson, R. L.: Shoot responses of six Lythraceae species toflooding, Plant Biology, 3(2), 186–193, 2001.25
Lucassen, E. C. H. E. T., Smolders, A. J. P., and Roelofs, J. G. M.: Increased groundwaterlevels cause iron toxicity in Glyceria fluitans (L.), Aquat. Bot., 66(4), 321–327, 2000.
Lucassen, E. C. H. E. T., Bobbink, R., Smolders, A. J. P., van der Ven, P. J. M., Lamers, L. P. M.,and Roelofs, J. G. M.: Interactive effects of low pH and high ammonium levels responsiblefor the decline of Cirsium dissectum (L.), Hill, Plant Ecology, 165(1), 45–52, 2003.30
Mitsch, W. J. and Gosselink, J. G.: Wetlands, 2nd Ed., Van Nostrand, Reinhold, New York,USA, 722 pp., 1993.
5222
BGD5, 5203–5232, 2008
Plant site conditionsafter winter flooding
V. Beumer et al.
Title Page
Abstract Introduction
Conclusions References
Tables Figures
J I
J I
Back Close
Full Screen / Esc
Printer-friendly Version
Interactive Discussion
Olde Venterink, H., Pieterse, N. M., Belgers, J. D. M., Wassen, M. J., and de Ruiter, P. C.: N, Pand K budgets along nutrient availability and productivity gradients in wetlands, Ecol. Appl.,12(4), 1010–1026, 2002.
Olde Venterink, H., Wassen, M. J., Verkroost, A. W. M., and de Ruiter, P. C.: Species richness-productivity patterns differ between N-, P-, and K-limited wetlands, Ecology, 84(8), 2191–5
2199, 2003.Page, A. L., Miller, R. H., and Keen D. R.: Methods of Soil Analysis, part 2, 2nd Ed., American
Society of Agronomy and Soil Science Society of America, Madison, 1159 pp., 1982.Ponnamperuma, F. N.: The chemistry of submerged soils, Adv. Agron., 24, 29–96, 1972.Reddy, K. R. and Patrick, Jr., W. H.: Nitrogen transformations and loss in flooded soils and10
sediments, Crit. Rev. Env. Contr., 13, 273–309, 1984.Roden, E. E. and Edmonds, J. W.: Phosphate mobilization in iron-rich anaerobic sediments:
Microbial Fe(III) oxide reduction versus iron-sulfide formation, Arch. Hydrobiol., 139(3), 347–378, 1997.
Snowden, R. E. D. and Wheeler, B. D.: Iron toxicity to fen plant-species, J. Ecol., 81(1), 35–46,15
1993.Stevens, K. J., Peterson, R. L., and Stephenson, G. R.: Morphological and anatomical re-
sponses of Lythrum salicaria L (purple loosestrife) to an imposed water gradient, Int. J. PlantSci., 158(2), 172–183, 1997.
van den Berg, L. J. L., Dorland, E., Vergeer, P., Hart, M. A. C., Bobbink, R., and Roelofs, J.20
G. M.: Decline of acid-sensitive plant species in heathland can be attributed to ammoniumtoxicity in combination with low pH, New Phytol., 166(2), 551–564, 2005.
Weeda, E. J., Westra, R., Westra, C., and Westra, T.: Nederlandse Ecologische Flora, Wildeplanten en hun relaties, deel 2, IVN, Amsterdam, 1987.
Weeda, E. J., Westra, R., Westra, C., and Westra, T.: Nederlandse Oecologische Flora–Wilde25
planten en hun relaties, deel 5, IVN, Amsterdam, The Netherlands, 400 pp., 1994.Wheeler, B. D., Shaw, S. C., and Cook, R. E. D.: Phytometric assessment of the fertility of
undrained rich-fen soils, J. Appl. Ecol., 29(2), 466–475, 1992.Zedler, J. B. and Kercher, S.: Causes and consequences of invasive plants in wetlands: Op-
portunities, opportunists, and outcomes, CRC Cr. Rev. Plant Sci., 23(5), 431–452, 2004.30
5223

BGD5, 5203–5232, 2008
Plant site conditionsafter winter flooding
V. Beumer et al.
Title Page
Abstract Introduction
Conclusions References
Tables Figures
J I
J I
Back Close
Full Screen / Esc
Printer-friendly Version
Interactive Discussion
Table 1. Characterization of the sites with respect to management, soil and plant (entire vege-tation) nutrient concentration, indicated nutrient limitation and vegetation type.
Top soil layer (0-10cm, n=16, August 2006)
in % weight
Total soil nutrients (mg/g dry soil)
Bio-available soil nutrients (mg/kg
dry soil)
Plant nutrient concentrations (mg/g)
Sites
Man
agem
ent
Dis
tanc
e to
rive
r (m
)
Soi
l m
oist
ure
Org
anic
m
atte
r
N P K N P N P K Vegetation type
Semi-natural I Mowing 102 34
± 3 6.9
± 0.8 2.8
± 0.8 0.6
± 0.2 0.2
± 0.1 37
± 19 7.4
± 2.4 18.8 1.8 14.0 → N limitation
Valeriano-Filipenduletum holcetosum
Semi-natural II Mowing 68 46
± 4 11.5 ± 1.9
4.8 ± 0.8
0.9 ± 0.2
0.2 ± 0.2
14.2 ± 5.4
5.7 ± 2.1 23.7 2.1 9.4 → N
limitation Carex panicea-Succisa pratensis
Acidic semi-natural Mowing 223 28
± 3 5.3 ± 1
1.8 ± 0.9
0.9 ± 0.2
0.4 ± 0.1
6.6 ± 9.2
110 ± 31 21.6 2.7 5.9 → N+K co-
limitation Sp: Agrostis capillaris, Anthoxanthum odoratum
Former agricultural Grazing 83 27
± 4 5.7
± 1.6 2.6
± 1.3 1.5
± 0.7 0.3
± 0.2 4.7
± 3.6 68
± 32 30.5 4.1 7.4 → K limitation
Ranunculo-Alopecuretum equisetetosum palustris
Agricultural I Grazing and Fertilizing 712 21
± 2 3.8
± 0.5 1.4
± 0.5 1.7
± 0.4 0.5
± 0.2 2.1
± 1.8 400 ± 55 37.3 4.9 15.4 → N
limitation Plantagini-Lolietum perennis typicum
Agricultural II Grazing and Fertilizing 690 25
± 3 3.3
± 0.6 1.1
± 0.5 1.4
± 0.3 0.3
± 0.1 4.0
± 4.3 287 ± 56 18.4 3.6 18.6 → N
limitation Plantagini-Lolietum perennis typicum
5224

BGD5, 5203–5232, 2008
Plant site conditionsafter winter flooding
V. Beumer et al.
Title Page
Abstract Introduction
Conclusions References
Tables Figures
J I
J I
Back Close
Full Screen / Esc
Printer-friendly Version
Interactive Discussion
Table 2. Survival of Anthoxantum odoratum and Lythrum salicaria on soil cores that had beensubject to winter flooding and not (n=8).
Lythrum salicaria Anthoxantum odoratumSites Treatments Survival (%) (n=8) Survival (%) (n=8)
Semi-natural I Control 75 75Winter-flooded 100 100
Semi-natural II Control 100 100Winter-flooded 88 100
Acidic Semi-natural Control 25 88Winter-flooded 100 100
Former Agricultural Control 100 88Winter-flooded 88 88
Agricultural I Control 100 100Winter-flooded 100 100
Agricultural II Control 100 88Winter-flooded 88 100
5225
BGD5, 5203–5232, 2008
Plant site conditionsafter winter flooding
V. Beumer et al.
Title Page
Abstract Introduction
Conclusions References
Tables Figures
J I
J I
Back Close
Full Screen / Esc
Printer-friendly Version
Interactive Discussion
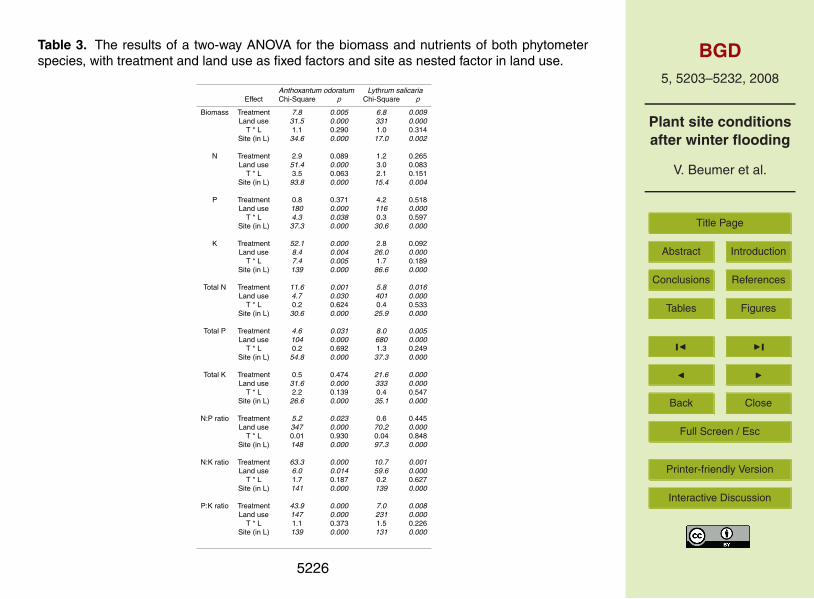
Table 3. The results of a two-way ANOVA for the biomass and nutrients of both phytometerspecies, with treatment and land use as fixed factors and site as nested factor in land use.
Anthoxantum odoratum Lythrum salicariaEffect Chi-Square p Chi-Square p
Biomass Treatment 7.8 0.005 6.8 0.009Land use 31.5 0.000 331 0.000
T * L 1.1 0.290 1.0 0.314Site (in L) 34.6 0.000 17.0 0.002
N Treatment 2.9 0.089 1.2 0.265Land use 51.4 0.000 3.0 0.083
T * L 3.5 0.063 2.1 0.151Site (in L) 93.8 0.000 15.4 0.004
P Treatment 0.8 0.371 4.2 0.518Land use 180 0.000 116 0.000
T * L 4.3 0.038 0.3 0.597Site (in L) 37.3 0.000 30.6 0.000
K Treatment 52.1 0.000 2.8 0.092Land use 8.4 0.004 26.0 0.000
T * L 7.4 0.005 1.7 0.189Site (in L) 139 0.000 86.6 0.000
Total N Treatment 11.6 0.001 5.8 0.016Land use 4.7 0.030 401 0.000
T * L 0.2 0.624 0.4 0.533Site (in L) 30.6 0.000 25.9 0.000
Total P Treatment 4.6 0.031 8.0 0.005Land use 104 0.000 680 0.000
T * L 0.2 0.692 1.3 0.249Site (in L) 54.8 0.000 37.3 0.000
Total K Treatment 0.5 0.474 21.6 0.000Land use 31.6 0.000 333 0.000
T * L 2.2 0.139 0.4 0.547Site (in L) 26.6 0.000 35.1 0.000
N:P ratio Treatment 5.2 0.023 0.6 0.445Land use 347 0.000 70.2 0.000
T * L 0.01 0.930 0.04 0.848Site (in L) 148 0.000 97.3 0.000
N:K ratio Treatment 63.3 0.000 10.7 0.001Land use 6.0 0.014 59.6 0.000
T * L 1.7 0.187 0.2 0.627Site (in L) 141 0.000 139 0.000
P:K ratio Treatment 43.9 0.000 7.0 0.008Land use 147 0.000 231 0.000
T * L 1.1 0.373 1.5 0.226Site (in L) 139 0.000 131 0.000
5226
BGD5, 5203–5232, 2008
Plant site conditionsafter winter flooding
V. Beumer et al.
Title Page
Abstract Introduction
Conclusions References
Tables Figures
J I
J I
Back Close
Full Screen / Esc
Printer-friendly Version
Interactive Discussion
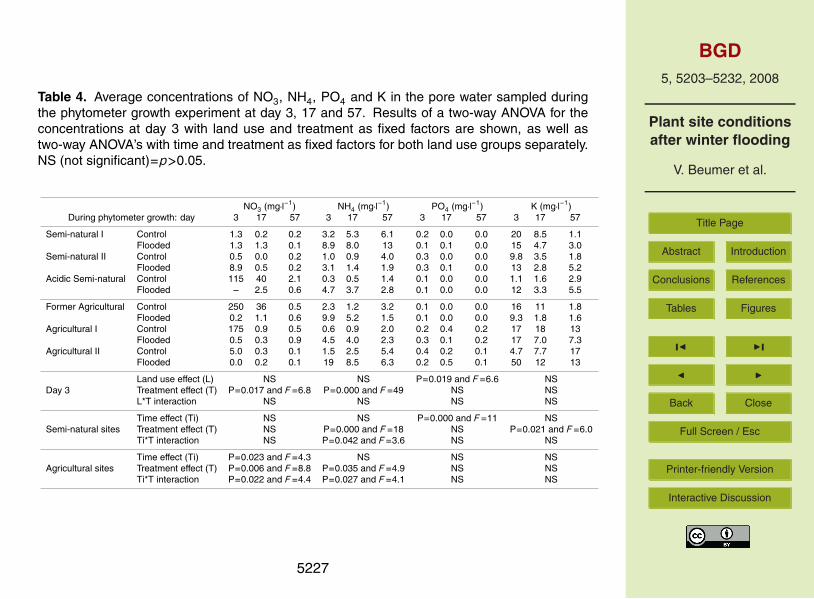
Table 4. Average concentrations of NO3, NH4, PO4 and K in the pore water sampled duringthe phytometer growth experiment at day 3, 17 and 57. Results of a two-way ANOVA for theconcentrations at day 3 with land use and treatment as fixed factors are shown, as well astwo-way ANOVA’s with time and treatment as fixed factors for both land use groups separately.NS (not significant)=p>0.05.
NO3 (mg·l−1) NH4 (mg·l−1) PO4 (mg·l−1) K (mg·l−1)During phytometer growth: day 3 17 57 3 17 57 3 17 57 3 17 57
Semi-natural I Control 1.3 0.2 0.2 3.2 5.3 6.1 0.2 0.0 0.0 20 8.5 1.1Flooded 1.3 1.3 0.1 8.9 8.0 13 0.1 0.1 0.0 15 4.7 3.0
Semi-natural II Control 0.5 0.0 0.2 1.0 0.9 4.0 0.3 0.0 0.0 9.8 3.5 1.8Flooded 8.9 0.5 0.2 3.1 1.4 1.9 0.3 0.1 0.0 13 2.8 5.2
Acidic Semi-natural Control 115 40 2.1 0.3 0.5 1.4 0.1 0.0 0.0 1.1 1.6 2.9Flooded – 2.5 0.6 4.7 3.7 2.8 0.1 0.0 0.0 12 3.3 5.5
Former Agricultural Control 250 36 0.5 2.3 1.2 3.2 0.1 0.0 0.0 16 11 1.8Flooded 0.2 1.1 0.6 9.9 5.2 1.5 0.1 0.0 0.0 9.3 1.8 1.6
Agricultural I Control 175 0.9 0.5 0.6 0.9 2.0 0.2 0.4 0.2 17 18 13Flooded 0.5 0.3 0.9 4.5 4.0 2.3 0.3 0.1 0.2 17 7.0 7.3
Agricultural II Control 5.0 0.3 0.1 1.5 2.5 5.4 0.4 0.2 0.1 4.7 7.7 17Flooded 0.0 0.2 0.1 19 8.5 6.3 0.2 0.5 0.1 50 12 13
Land use effect (L) NS NS P=0.019 and F=6.6 NSDay 3 Treatment effect (T) P=0.017 and F=6.8 P=0.000 and F=49 NS NS
L*T interaction NS NS NS NS
Time effect (Ti) NS NS P=0.000 and F=11 NSSemi-natural sites Treatment effect (T) NS P=0.000 and F=18 NS P=0.021 and F=6.0
Ti*T interaction NS P=0.042 and F=3.6 NS NS
Time effect (Ti) P=0.023 and F=4.3 NS NS NSAgricultural sites Treatment effect (T) P=0.006 and F=8.8 P=0.035 and F=4.9 NS NS
Ti*T interaction P=0.022 and F=4.4 P=0.027 and F=4.1 NS NS
5227
BGD5, 5203–5232, 2008
Plant site conditionsafter winter flooding
V. Beumer et al.
Title Page
Abstract Introduction
Conclusions References
Tables Figures
J I
J I
Back Close
Full Screen / Esc
Printer-friendly Version
Interactive Discussion
Table 5. Average concentrations of Al, Fe and Ca in, and average pH of, the pore watersampled during the phytometer growth experiment at day 3, 17 and 57. Results of a two-wayANOVA for the concentrations at day 3 with land use and treatment as fixed factors are shown,as well as two-way ANOVA’s with time and treatment as fixed factors for both land use groupsseparately. NS (not significant)=p>0.05.
pH Al (mg·l−1) Fe (mg·l−1) Ca (mg·l−1)During phytometer growth: day 3 17 57 3 17 57 3 17 57 3 17 57
Semi-natural I Control 5.9 5.9 5.3 0.0 0.1 0.3 0.7 0.7 1.8 8.6 16 38Flooded 6.1 5.6 4.3 0.1 0.0 0.6 11 – – 30 20 50
Semi-natural II Control 5.8 4.9 5.0 0.0 0.1 0.4 0.9 2.0 7.2 13 15 32Flooded 6.1 5.2 5.4 0.0 0.2 0.2 – 2.8 1.2 35 19 35
Acidic Semi-natural Control 3.9 4.0 4.1 2.1 3.4 2.7 0.3 0.5 5.1 7.9 6.6 6.7Flooded 4.7 4.6 4.4 0.2 0.7 1.6 4.5 5.0 8.4 5.9 7.4 14
Former Agricultural Control 5.2 5.3 5.7 0.0 0.1 0.1 0.7 0.5 1.7 64 41 49Flooded 6.1 6.4 6.5 0.0 0.0 0.1 21 6.4 14 31 36 53
Agricultural I Control 6.1 6.4 6.5 0.0 0.0 0.0 0.4 0.8 2.8 52 60 62Flooded 7.0 7.0 6.8 0.0 0.1 0.1 12 22 10 51 68 95
Agricultural II Control 5.7 5.9 5.7 0.0 0.1 0.2 1.8 5.2 17 18 25 44Flooded 5.2 6.5 6.2 0.8 0.3 0.5 63 13 19 69 26 54
Land use effect (L) P=0.031 and F=5.4 P=0.037 and F=5.0 NS P=0.000 and F=40Day 3 Treatment effect (T) NS NS P=0.000 and F=83 NS
L*T interaction NS NS NS NS
Time effect (Ti) NS NS NS P=0.008 and F=5.3Semi-natural sites Treatment effect (T) NS NS P=0.000 and F=19 NS
Ti*Tr interaction NS NS NS NS
Time effect (Ti) NS NS NS P=0.031 and F=3.7Agricultural sites Treatment effect (T) NS NS P=0.000 and F=19 NS
Ti*T interaction NS NS NS NS
5228
BGD5, 5203–5232, 2008
Plant site conditionsafter winter flooding
V. Beumer et al.
Title Page
Abstract Introduction
Conclusions References
Tables Figures
J I
J I
Back Close
Full Screen / Esc
Printer-friendly Version
Interactive Discussion
Fig. 1. The biomass of Anthoxantum odoratum (a) and Lythrum salicaria (b) phytometers inthe control (dark bars) and the winter-flooded treatment (light bars) after 8 weeks of growth onsoil cores from 6 sites (SNI=Semi-natural II, SNII=Semi-natural II, ASN=Acidic Semi-natural,FA=Former Agricultural, AI=Agricultural I and AII=Agricultural II). At the top of the graphs thesignificance of the treatment effect per land use is indicated (NS=Not Significant, *=p<0.05and **=p<0.01).
5229

BGD5, 5203–5232, 2008
Plant site conditionsafter winter flooding
V. Beumer et al.
Title Page
Abstract Introduction
Conclusions References
Tables Figures
J I
J I
Back Close
Full Screen / Esc
Printer-friendly Version
Interactive Discussion
Fig. 2. The concentrations and contents of N, P and K of Anthoxantum odoratum in the control(dark bars) and the winter-flooded treatment (light bars) after 8 weeks of growth on soil coresfrom 6 sites (SNI=Semi-natural II, SNII=Semi-natural II, ASN=Acidic Semi-natural, FA=FormerAgricultural, AI=Agricultural I and AII=Agricultural II). At the top of the graphs the significance ofthe treatment effect per land use is indicated (NS=Not Significant, *=p<0.05 and **=p<0.01).
5230
BGD5, 5203–5232, 2008
Plant site conditionsafter winter flooding
V. Beumer et al.
Title Page
Abstract Introduction
Conclusions References
Tables Figures
J I
J I
Back Close
Full Screen / Esc
Printer-friendly Version
Interactive Discussion
Fig. 3. The concentrations and contents of N, P and K of Lythrum salicaria in the control(dark bars) and the winter-flooded treatment (light bars) after 8 weeks of growth on soil coresfrom 6 sites (SNI=Semi-natural II, SNII=Semi-natural II, ASN=Acidic Semi-natural, FA=FormerAgricultural, AI=Agricultural I and AII=Agricultural II). At the top of the graphs the significance ofthe treatment effect per land use is indicated (NS=Not Significant, *=p<0.05 and **=p<0.01).
5231
BGD5, 5203–5232, 2008
Plant site conditionsafter winter flooding
V. Beumer et al.
Title Page
Abstract Introduction
Conclusions References
Tables Figures
J I
J I
Back Close
Full Screen / Esc
Printer-friendly Version
Interactive Discussion
Fig. 4. The N:P, N:K and P:K ratios of Anthoxantum odoratum (a, b and c) and Lythrum salicaria(d, e and f) in the control (dark bars) and the winter-flooded treatment (light bars) after 8 weeksof growth on soil cores from 6 sites (SNI=Semi-natural II, SNI=Semi-natural II, ASN=AcidicSemi-natural, FA=Former Agricultural, AI=Agricultural I and AII=Agricultural II). At the top ofthe graphs the significance of the treatment effect per land use is indicated (NS=Not Significant,*=p<0.05 and **=p<0.01). The white lines indicate nutrient limitation tresholds (N/P at 14–15,N/K at 2.1 and P/K at 0.3).
5232