Geophysical Monitoring of Hydrological and Biogeochemical Transformations Associated with Cr(VI)...
9
Geophysical Monitoring of Hydrological and Biogeochemical Transformations Associated with Cr(VI) Bioremediation SUSAN S. HUBBARD,* ,† KEN WILLIAMS, † MARK E. CONRAD, † BORIS FAYBISHENKO, † JOHN PETERSON, † JINSONG CHEN, † PHIL LONG, ‡ AND TERRY HAZEN † Earth Science Division, 1 Cyclotron Rd MS 90-1116, Lawrence Berkeley National Laboratory, Berkeley, CA 94720, and Pacific Northwest Laboratories, Richland, WA Received July 10, 2007. Revised manuscript received February 20, 2008. Accepted February 26, 2008. Understanding how hydrological and biogeochemical properties change over space and time in response to remedial treatments is hindered by our ability to monitor these processes with sufficient resolution and over field relevant scales. Here, we explored the use of geophysical approaches for monitoring the spatiotemporal distribution of hydrological and biogeochemical transformations associated with a Cr(VI) bioremediation experiment performed at Hanford, WA. We first integrated hydrological wellbore and geophysical tomographic data sets to estimate hydrological zonation at the study site. Using results from laboratory biogeophysical experiments and constraints provided by field geochemical data sets, we then interpreted time-lapse seismic and radar tomographic data sets, collected during thirteen acquisition campaigns over a three year experimental period, in terms of hydrological and biogeochemical transformations. The geophysical monitoring data sets were used to infer: the spatial distribution of injected electron donor; the evolution of gas bubbles; variations in total dissolved solids (nitrate and sulfate) as a function of pumping activity; the formation of precipitates and dissolution of calcites; and concomitant changes in porosity. Although qualitative in nature, the integrated interpretation illustrates how geophysical techniques have the potential to provide a wealth of information about coupled hydrobiogeochemical responses to remedial treatments in high spatial resolution and in a minimally invasive manner. Particularly novel aspects of our study include the use of multiple lines of evidence to constrain the interpretation of a long-term, field-scale geophysical monitoring data set and the interpretation of the transformations as a function of hydrological heterogeneity and pumping activity. 1. Introduction and Background The objective of this study was to explore the use of geophysical approaches for monitoring the spatiotemporal distribution of hydrological and biogeochemical transforma- tions associated with a Cr(VI) bioremediation experiment. Our study was motivated by the hypothesis that several of the expected transformations would yield end products that could be detectable using time-lapse geophysical methods. Recent studies have demonstrated how indirect (yet spatially extensive) geophysical data sets can be integrated with direct (yet sparse) hydrological data to provide estimates of subsurface properties in high resolution and in a minimally invasive manner. Two recent books (1, 2) describe the state- of-the-art in this field of hydrogeophysics. Although hydro- geophysical challenges exist (e.g., ref 3), recent synthetic and field studies have illustrated how geophysically obtained hydrological property estimates have improved the prediction of contaminant transport in natural systems over predictions based only on wellbore-based characterization data sets (4, 5). Several recent studies have also explored the effects of microbial processes on geophysical attributes (6, 7). For the most part, these studies have been performed at the laboratory scale to investigate time-lapse changes in a geophysical attribute corresponding to a particular bio- geochemical transformation. Although the studies hint at the potential that these methods have for field-scale monitoring, only a few studies have attempted to use geophysical methods at the field scale to monitor processes that occur in association with in situ contaminant reme- diation (e.g., ref 8). Here, we build upon these recent efforts by using multiple lines of evidence to aid in the interpretation of three-year, field-scale geophysical monitoring data set in terms of several hydrobiogeochemical transformations and in the presence of hydrogeological heterogeneity and variable pumping activity. Our study involved several components, including (a) laboratory-scale experiments designed to explore electri- cal, seismic, and radar responses to various biogeochemical transformations relevant to the Cr(VI) biostimulation; (b) analysis of geochemical data collected from field boreholes over the course of ∼2 years; (c) estimation of hydraulic conductivity zonation using field geophysical and hydrologi- cal data sets; (d) acquisition and reduction of time-lapse, field-scale tomographic radar, and seismic data sets collected over the course of ∼3 years; and (e) integrated interpretation of the field geophysical monitoring data sets in terms of hydrological and biogeochemical transformations, using information available from a-d. 1.1. The Hanford 100H Cr(VI) Bioremediation Experi- ment. Our geophysical monitoring study was performed as part of an effort to assess the ability to bioremediate the groundwater at the 100H area of the Department of Energy (DOE) Hanford Site, which is located ∼1000 m from the Columbia River. The contaminant of concern at this site is hexavalent chromium (or chromate, Cr(VI)). Cr(VI) exists in strongly oxidizing environments and is very mobile and acutely toxic, while Cr(III) exists in moderately oxidizing and reducing environments and is immobile and not toxic. The pilot experiment was performed to evaluate the ability of an electron donor called hydrogen release compound (HRC) to stimulate biological activity, thereby creating a reducing environment that will cause the transformation of Cr(VI) to Cr(III). HRC is a viscous, denser than water (F) 1.g/cm 3 ), slow-release polylactate that is designed to remain near the injection region and to slowly release soluble and bioavailable lactic acid downgradient to stimulate sustained biological activity. The bioremediation pilot experiment was performed in the saturated section of the Hanford formation within a small area of the 100H site. This formation is dominated by calcite- rich, unconsolidated, interfingered, high-permeability gravel * Corresponding author phone: (510)-486-5266; fax (510)-486-5686: e-mail: [email protected]. † Lawrence Berkeley National Laboratory. ‡ Pacific Northwest Laboratories. Environ. Sci. Technol. 2008, 42, 3757–3765 10.1021/es071702s CCC: $40.75 2008 American Chemical Society VOL. 42, NO. 10, 2008 / ENVIRONMENTAL SCIENCE & TECHNOLOGY 9 3757 Published on Web 04/18/2008
Transcript of Geophysical Monitoring of Hydrological and Biogeochemical Transformations Associated with Cr(VI)...

Geophysical Monitoring ofHydrological and BiogeochemicalTransformations Associated withCr(VI) BioremediationS U S A N S . H U B B A R D , * , † K E N W I L L I A M S , †
M A R K E . C O N R A D , †
B O R I S F A Y B I S H E N K O , † J O H N P E T E R S O N , †
J I N S O N G C H E N , † P H I L L O N G , ‡ A N DT E R R Y H A Z E N †
Earth Science Division, 1 Cyclotron Rd MS 90-1116, LawrenceBerkeley National Laboratory, Berkeley, CA 94720, and PacificNorthwest Laboratories, Richland, WA
Received July 10, 2007. Revised manuscript receivedFebruary 20, 2008. Accepted February 26, 2008.
Understanding how hydrological and biogeochemicalproperties change over space and time in response toremedial treatments is hindered by our ability to monitor theseprocesses with sufficient resolution and over field relevantscales. Here, we explored the use of geophysical approachesfor monitoring the spatiotemporal distribution of hydrologicaland biogeochemical transformations associated with a Cr(VI)bioremediation experiment performed at Hanford, WA. We firstintegrated hydrological wellbore and geophysical tomographicdata sets to estimate hydrological zonation at the studysite. Using results from laboratory biogeophysical experimentsand constraints provided by field geochemical data sets, wethen interpreted time-lapse seismic and radar tomographic datasets, collected during thirteen acquisition campaigns over athree year experimental period, in terms of hydrological andbiogeochemical transformations.Thegeophysicalmonitoringdatasets were used to infer: the spatial distribution of injectedelectron donor; the evolution of gas bubbles; variations in totaldissolved solids (nitrate and sulfate) as a function of pumpingactivity; the formation of precipitates and dissolution of calcites;and concomitant changes in porosity. Although qualitative innature, the integrated interpretation illustrates how geophysicaltechniques have the potential to provide a wealth of informationabout coupled hydrobiogeochemical responses to remedialtreatments in high spatial resolution and in a minimally invasivemanner. Particularly novel aspects of our study include theuse of multiple lines of evidence to constrain the interpretationof a long-term, field-scale geophysical monitoring data setand the interpretation of the transformations as a function ofhydrological heterogeneity and pumping activity.
1. Introduction and BackgroundThe objective of this study was to explore the use ofgeophysical approaches for monitoring the spatiotemporaldistribution of hydrological and biogeochemical transforma-tions associated with a Cr(VI) bioremediation experiment.
Our study was motivated by the hypothesis that several ofthe expected transformations would yield end products thatcould be detectable using time-lapse geophysical methods.Recent studies have demonstrated how indirect (yet spatiallyextensive) geophysical data sets can be integrated with direct(yet sparse) hydrological data to provide estimates ofsubsurface properties in high resolution and in a minimallyinvasive manner. Two recent books (1, 2) describe the state-of-the-art in this field of hydrogeophysics. Although hydro-geophysical challenges exist (e.g., ref 3), recent synthetic andfield studies have illustrated how geophysically obtainedhydrological property estimates have improved the predictionof contaminant transport in natural systems over predictionsbased only on wellbore-based characterization data sets (4, 5).
Several recent studies have also explored the effects ofmicrobial processes on geophysical attributes (6, 7). Forthe most part, these studies have been performed at thelaboratory scale to investigate time-lapse changes in ageophysical attribute corresponding to a particular bio-geochemical transformation. Although the studies hint atthe potential that these methods have for field-scalemonitoring, only a few studies have attempted to usegeophysical methods at the field scale to monitor processesthat occur in association with in situ contaminant reme-diation (e.g., ref 8).
Here, we build upon these recent efforts by using multiplelines of evidence to aid in the interpretation of three-year,field-scale geophysical monitoring data set in terms of severalhydrobiogeochemical transformations and in the presenceof hydrogeological heterogeneity and variable pumpingactivity. Our study involved several components, including(a) laboratory-scale experiments designed to explore electri-cal, seismic, and radar responses to various biogeochemicaltransformations relevant to the Cr(VI) biostimulation; (b)analysis of geochemical data collected from field boreholesover the course of ∼2 years; (c) estimation of hydraulicconductivity zonation using field geophysical and hydrologi-cal data sets; (d) acquisition and reduction of time-lapse,field-scale tomographic radar, and seismic data sets collectedover the course of ∼3 years; and (e) integrated interpretationof the field geophysical monitoring data sets in terms ofhydrological and biogeochemical transformations, usinginformation available from a-d.
1.1. The Hanford 100H Cr(VI) Bioremediation Experi-ment. Our geophysical monitoring study was performed aspart of an effort to assess the ability to bioremediate thegroundwater at the 100H area of the Department of Energy(DOE) Hanford Site, which is located ∼1000 m from theColumbia River. The contaminant of concern at this site ishexavalent chromium (or chromate, Cr(VI)). Cr(VI) exists instrongly oxidizing environments and is very mobile andacutely toxic, while Cr(III) exists in moderately oxidizing andreducing environments and is immobile and not toxic. Thepilot experiment was performed to evaluate the ability of anelectron donor called hydrogen release compound (HRC) tostimulate biological activity, thereby creating a reducingenvironment that will cause the transformation of Cr(VI) toCr(III). HRC is a viscous, denser than water (F ) 1.g/cm3),slow-release polylactate that is designed to remain near theinjection region and to slowly release soluble and bioavailablelactic acid downgradient to stimulate sustained biologicalactivity.
The bioremediation pilot experiment was performed inthe saturated section of the Hanford formation within a smallarea of the 100H site. This formation is dominated by calcite-rich, unconsolidated, interfingered, high-permeability gravel
* Corresponding author phone: (510)-486-5266; fax (510)-486-5686:e-mail: [email protected].
† Lawrence Berkeley National Laboratory.‡ Pacific Northwest Laboratories.
Environ. Sci. Technol. 2008, 42, 3757–3765
10.1021/es071702s CCC: $40.75 2008 American Chemical Society VOL. 42, NO. 10, 2008 / ENVIRONMENTAL SCIENCE & TECHNOLOGY 9 3757
Published on Web 04/18/2008

and sand layers. The water table is located within the Hanfordformation at ∼12.2 m, and the base of the Hanford formationis located at approximately 14.3 m. The Hanford formationrests atop the Ringold Formation, which at the 100H studysite is dominated by low-permeability fine grained sediments.
Historical monitoring near the 100H study site indicatedthat Cr(VI) concentrations of up to ∼160 ppb in thegroundwater within the Hanford formation had persistedfor over a decade, whereas recent measurements indicate adecrease in concentrations of 80–100 ppb. The 100H pilotstudy site was developed with the objective of reducing theconcentrations within the saturated Hanford zone to belowthe U.S. Environmental Protection Agency’s maximumcontaminant level (MCL) for Cr(VI) of 10 ppb.
Development of the pilot study site was performed in2004, including the installation of an injection well (Well 45)and a downgradient monitoring well (Well 44); the wellboregeometry and example wellbore lithology and constructionare given in the Supporting Information. The biostimulationinvolved injection of 18.2 kg of HRC mixed with 10 g of 13C-labeled lactate into Well 45. Pumping was initiated threetimes during the experiment. Two new wellbores (Wells 41and 42) were drilled approximately two years poststimulation;one was located between the injection and monitoring wells,whereas the other was located ∼5 m off of the study transect.Monitoring data showed that Cr(VI) concentrations droppedbelow water MCL within one month of the HRC injection,and concentrations remained below background concentra-tion for at least two years after stimulation. A timeline of theHRC injection, pumping campaigns, and geophysical ac-quisition campaigns is given in the Supporting Information.
1.2. Geophysical Methods. We provide a very brief back-ground of the different geophysical methods that were usedfor this study and discuss petrophysical relationships thatlink the geophysical attributes to hydrogeochemical pro-perties.
1.2.1. Electrical Methods. Electrical methods involve theapplication of current and the measurement of voltagesbetween electrodes. Perhaps the most common petrophysicalrelationship for near-subsurface geophysical exploration isArchie’s Law (9). For saturated, porous geological materials,Archie’s Law expresses the effective conductivity (σeff) as afunction of porosity (n), the electrical conductivity of thepore water (σw), and the electrical conductivity associatedwith surface conduction (σsurface):
σeff ) σwnm + σsurface (1)
where m is Archie’s exponent. Equation 1 is commonly usedwith electrical conductivity measurements to estimate po-rosity or the electrical conductivity of pore fluids, which inturn is often expressed as a function of total dissolved solids(TDS) of aqueous solutions, using empirical relationships(10) such as
σw(S/m) ≈ a × TDS(mg/L) (2)
where, depending upon the ionic composition and tem-perature of the solution, the constant a can range from ∼1.2× 10⁻⁴ to ∼2.0 × 10⁻⁴. Detailed information about electricaldata acquisition, inversion techniques, and petrophysicalrelationships is available elsewhere (11, 12).
1.2.2. Radar Methods. Radar and time domain reflecto-metry (TDR) methods use electromagnetic energy in the 50MHz to low GHz frequency range to probe geologicalmaterials. TDR methods involve propagating an electro-magnetic signal along waveguides inserted into the materialof interest, and measuring the velocity and amplitude of thetraveling wave (13). Because of the small measurementvolume associated with TDR probes, this method is com-monly used for laboratory investigations. Tomographic radar
data acquisition consists of placing a transmitter and areceiver in separate boreholes and moving them successivelyuntil many transmitter and receiver locations have beenoccupied. The travel time of the direct arrival and associatedamplitude information is extracted from the recordedwaveforms, and inversion algorithms are used to transformthis information into estimations of velocity and attenuationbetween the boreholes (14).
At the frequency of operation for TDR and radar systems,the separation (polarization) of opposite electric chargeswithin a material subjected to an external electric fielddominates the electrical response. The dielectric constant(k), which used to describe these high-frequency electricalproperties, can be approximated from the velocity (V) of theradar signal (15) by
κ ≈ ( cV)2
(3)
where c is the propagation velocity of electromagnetic wavesin free space. The large contrast in dielectric constant betweenwet and dry materials renders radar and TDR methods veryeffective for providing information about water saturation.
Dielectric mixing models have been used to express theeffective dielectric constant (κeff) of soils having a dielectriccontribution from a variety of components (16), such as theexpression for a three-component, soil–water–air system:
κeff ) (Snκwγ + (1-n)κg
γ + n(1- S)κaγ)
1
γ (4)
In eq 4, S is water saturation; n is the soil porosity; κw, κg, andκa are the unitless dielectric constants of pore water, soilgrains, and air, respectively; and γ is a factor that accountsfor the orientation of the electrical field with respect to thegeometry of the medium (which is commonly assumed tobe 0.5 for an isotropic medium). Although idealistic, themixing model shown in eq 4 can be useful for exploringchanges in dielectric constant as a function of the type ofpore fluid, mineralogy, and porosity.
Using high-frequency radar data and under the low-lossconditions, electrical conductivity can also be estimated withradar attributes following
σ[S/m] ≈ √κRA
(5)
whereR is the attenuation coefficient in dB/m, and A ()1680dB/S) is a constant that incorporates unit conversions andfree-space impedance (17). Although approximate, eq 5permits estimation of electrical conductivity using radar-derived attributes (e.g., refs 8, 17). Similarly, the amplitudeof the recorded TDR waveform can also be used to estimateelectrical conductivity (18).
1.2.3. Seismic Methods. Seismic methods use sensitivegeophones to measure disturbances that propagate outwardfrom the source as a series of wavefronts. Field-based seismictomographic data can be collected using the same conceptdescribed for tomographic radar methods, and the traveltimes and amplitudes can be inverted to obtain estimates ofthe distribution of seismic velocity and attenuation betweenthe wellbores. A review of seismic method acquisition,processing, inversion, and interpretation for hydrologicalinvestigations is available elsewhere (19). Seismic velocityand attenuation are related to the bulk elastic properties ofthe sediment and pore fluids, which in turn depend onmineralogy, fluid chemistry, and intergranular structure (20).
2. Laboratory Experiments and Field Data SetsIn this section, we present the laboratory experimental resultsand the field geochemical, hydrological, and geophysical datasets that will be used in Section 3 to assist in the interpretation
3758 9 ENVIRONMENTAL SCIENCE & TECHNOLOGY / VOL. 42, NO. 10, 2008
of hydrological heterogeneity and hydrobiogeochemicaltransformations.
2.1. Laboratory Experiments. Geophysical monitoringof hydrobiogeochemical transformations is at a very earlystage of development, and our understanding of geophysicalresponses to remediation end-products is still developing.As a step toward improving this understanding and to assistin the interpretation of the field-scale geophysical data sets,we performed a suite of laboratory experiments to explorehow radar, seismic, and electrical signatures change duringprocesses that were expected to be prevalent during the Cr(VI)biostimulation. Due to the recognized scaling and averagingchallenges associated with applying laboratory-developedpetrophysical relationships to field scale data sets and touniqueness challenges that occur when multiple factorsinfluence geophysical signatures (e.g., ref 3), we did notdevelop petrophysical relationships at the laboratory scaleand attempt to apply them to the field-scale monitoring datasets. Instead, we performed the laboratory experiments togain insight about the relative sensitivities of the differentgeophysical attributes to transformational end-products; theinsights were then used in the qualitative interpretation ofthe field-scale data sets.
The design of the laboratory experiments was based onthe plausibility of detecting expected transformational end-products using particular geophysical methods and on theconceptual model of the biogeochemical reactions that wereexpected to occur during the Cr(VI) biostimulation (refer tothe Supporting Information). Briefly, when HRC is injectedinto subsurface aquifers, hydrogen is produced via fermen-tation reactions associated with the polylactate decomposi-tion. The produced hydrogen can decrease the pH in thevicinity of the injection well, which can facilitate dissolutionof pH-sensitive minerals (such as calcites present in theHanford sands). The produced hydrogen can facilitatemicrobial activity, which in turn can accelerate the sequentialbioreduction of oxygen, nitrate, sulfate, and other competingelectron acceptors. In the presence of Cr(VI), iron-containingminerals, and iron- and sulfate-reducing bacteria (all identi-fied in the 100H Hanford formation), the decrease in redoxpotential can lead to the formation of insoluble Cr(III)precipitates. Calcite precipitates may also form, as the calcitedissolved near the injection well migrates downgradient andencounters more neutral pH groundwater. Other precipitates(such as FeS) also have the potential to form. The formationof gas bubbles and precipitates may reduce the porosity andpermeability of the subsurface materials.
We chose to investigate the geophysical responses to fourkey transformations through a suite of laboratory experi-ments: (1) Pore-water replacement by the injected electrondonor; (2) Gas bubble formation; (3) Variations in TDS; (4)Evolution, dissolution, or mineralogical alteration of solidphase constituents. The laboratory experiments are discussedin the Supporting Information, and the results are given in
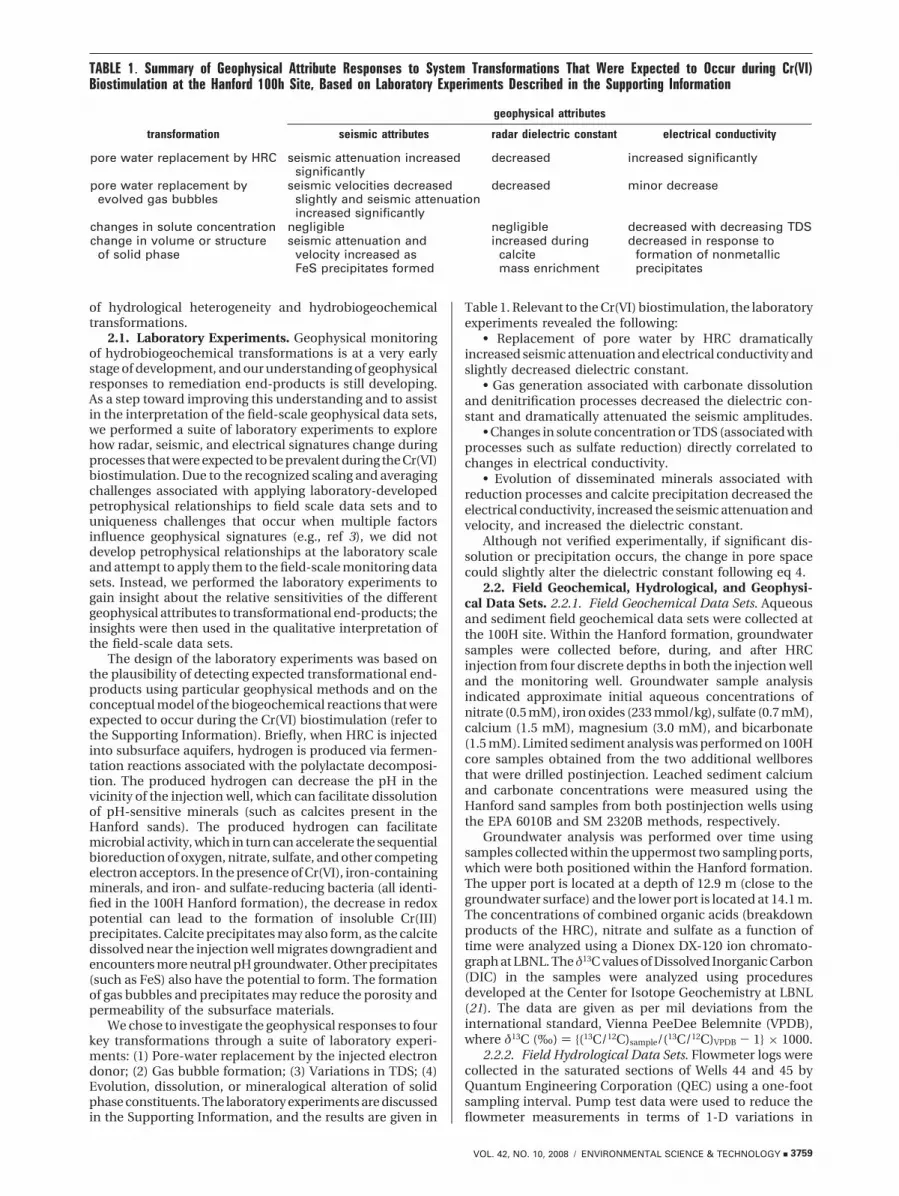
Table 1. Relevant to the Cr(VI) biostimulation, the laboratoryexperiments revealed the following:
• Replacement of pore water by HRC dramaticallyincreased seismic attenuation and electrical conductivity andslightly decreased dielectric constant.
• Gas generation associated with carbonate dissolutionand denitrification processes decreased the dielectric con-stant and dramatically attenuated the seismic amplitudes.
• Changes in solute concentration or TDS (associated withprocesses such as sulfate reduction) directly correlated tochanges in electrical conductivity.
• Evolution of disseminated minerals associated withreduction processes and calcite precipitation decreased theelectrical conductivity, increased the seismic attenuation andvelocity, and increased the dielectric constant.
Although not verified experimentally, if significant dis-solution or precipitation occurs, the change in pore spacecould slightly alter the dielectric constant following eq 4.
2.2. Field Geochemical, Hydrological, and Geophysi-cal Data Sets. 2.2.1. Field Geochemical Data Sets. Aqueousand sediment field geochemical data sets were collected atthe 100H site. Within the Hanford formation, groundwatersamples were collected before, during, and after HRCinjection from four discrete depths in both the injection welland the monitoring well. Groundwater sample analysisindicated approximate initial aqueous concentrations ofnitrate (0.5 mM), iron oxides (233 mmol/kg), sulfate (0.7 mM),calcium (1.5 mM), magnesium (3.0 mM), and bicarbonate(1.5 mM). Limited sediment analysis was performed on 100Hcore samples obtained from the two additional wellboresthat were drilled postinjection. Leached sediment calciumand carbonate concentrations were measured using theHanford sand samples from both postinjection wells usingthe EPA 6010B and SM 2320B methods, respectively.
Groundwater analysis was performed over time usingsamples collected within the uppermost two sampling ports,which were both positioned within the Hanford formation.The upper port is located at a depth of 12.9 m (close to thegroundwater surface) and the lower port is located at 14.1 m.The concentrations of combined organic acids (breakdownproducts of the HRC), nitrate and sulfate as a function oftime were analyzed using a Dionex DX-120 ion chromato-graph at LBNL. The δ13C values of Dissolved Inorganic Carbon(DIC) in the samples were analyzed using proceduresdeveloped at the Center for Isotope Geochemistry at LBNL(21). The data are given as per mil deviations from theinternational standard, Vienna PeeDee Belemnite (VPDB),where δ13C (‰) ) {(13C/12C)sample/(13C/12C)VPDB - 1} × 1000.
2.2.2. Field Hydrological Data Sets. Flowmeter logs werecollected in the saturated sections of Wells 44 and 45 byQuantum Engineering Corporation (QEC) using a one-footsampling interval. Pump test data were used to reduce theflowmeter measurements in terms of 1-D variations in
TABLE 1. Summary of Geophysical Attribute Responses to System Transformations That Were Expected to Occur during Cr(VI)Biostimulation at the Hanford 100h Site, Based on Laboratory Experiments Described in the Supporting Information
geophysical attributes
transformation seismic attributes radar dielectric constant electrical conductivity
pore water replacement by HRC seismic attenuation increasedsignificantly
decreased increased significantly
pore water replacement byevolved gas bubbles
seismic velocities decreasedslightly and seismic attenuationincreased significantly
decreased minor decrease
changes in solute concentration negligible negligible decreased with decreasing TDSchange in volume or structure
of solid phaseseismic attenuation and
velocity increased asFeS precipitates formed
increased duringcalcitemass enrichment
decreased in response toformation of nonmetallicprecipitates
VOL. 42, NO. 10, 2008 / ENVIRONMENTAL SCIENCE & TECHNOLOGY 9 3759

hydraulic conductivity at the wellbore locations followingdeveloped procedures (22).
2.2.3. Field Geophysical Data Sets. Tomographic radar (100MHz) and seismic (1000–7000 Hz) data sets were collectedbetween the injection and monitoring boreholes at the 100Hsite during thirteen acquisition campaigns and over thecourse of ∼3 years. The Supporting Information provides atime table associated with the field geophysical and pumpingcampaigns; details associated with the geophysical dataacquisition and inversion procedures; examples of raw andinverted geophysical data sets; procedures for estimatingchanges in geophysical attributes; and a discussion of theimpact of acquisition geometry and inversion procedure onthe estimated geophysical attributes.
The geophysical “baseline” tomograms were first usedwith the field flowmeter and pump test data to estimatehydrological zonation. The time-lapse geophysical data setswere then used in conjunction with the baseline data sets todetect changes in dielectric constant, electrical conductivity,and seismic attenuation that occurred over time during themanipulation experiment. Assessing the geophysical mea-surements or attributes in a “time-lapse” mode provides aparticularly powerful approach for monitoring small changesin natural systems (e.g., ref 3).
3. Interpretation and Discussion3.1. Field Geochemical Data Sets. The concentrations ofCr(VI), organic acids, δ13C, nitrate, and sulfate over a twoyear time frame following HRC injection are shown in Figure1. Figures 1a and b reveal that the Cr(VI) concentration inboth wells initially decreased significantly and remaineddepressed relative to background conditions over time.Concentrations in the samples collected from the shallowerport, located directly beneath the water table, reboundedtoward background conditions, while concentrations as-sociated with the deeper port stayed below MCL for theduration of the two year monitoring period.
Figure 1c shows that the concentration of organic acidsin both intervals in the injection well started very high,dropped down initially, and then rebounded by the end ofthe first pumping campaign. After pumping stopped, theorganic acid concentrations decreased slowly with time inboth intervals, reaching background in the upper intervalabout 450 days after injection. In the monitoring well, theorganic acids initially increased above background at 15 days(Figure 1d). After the pumping stopped, the organic acidconcentrations dropped to background and remained thereuntil the second pumping campaign when they reboundedin both intervals. At the end of the second pumping campaign,the concentrations dropped back down to background levels.
Figure 1e shows that the δ13C of the DIC in the injectionwell was significantly elevated at both depths during the firstpumping campaign, indicating that the inorganic carbon inthe groundwater was primarily derived from the labeled HRC.After pumping stopped, the δ13C of the DIC dropped downto close to background (-15‰) after approximately onemonth. This could be an indication that microbial activitywas diminished or that aerobic metabolism had becomelimited by the reduced dissolved oxygen content of thegroundwater in the vicinity of the injection well. Withtime, δ13C began to increase slowly until the beginning of thesecond pumping campaign when it increased. When thesecond pumping campaign ended, the δ13C of the DICdropped down again, but remain higher than it had beenafter the first pumping campaign. In the monitoring well,the δ13C of the DIC tracked the organic acid content of thegroundwater (Figure 1f). In the deeper interval, the δ13C ofthe DIC increased to >30‰ during the first pumpingcampaign. This is considerably higher than the isotopiccomposition of the HRC with the 13C-labeled lactate (15‰),
suggesting preferential transport and degradation of thelactate versus the HRC.
Nitrate concentration in the injection well is plotted inFigure 1g. In the upper sampling interval the concentrationsstarted out above background due to nitrate added with theHRC, but quickly dropped to zero and remained depressedthroughout the test. In the deeper interval, nitrate had alreadydisappeared by the time the first sample was taken andremained at zero throughout the experiment. In the moni-toring well (Figure 1h), the nitrate concentrations in bothintervals decreased to zero with the arrival of the organicacids during the first pumping campaign. After the pumpingstopped, nitrate slowly rebounded, reaching background afterapproximately two months. This pattern was repeated duringthe second pumping campaign. During the third pumpingcampaign, nitrate in the lower interval dropped to zero, butonly decreased briefly to about half of background in theupper interval.
In both sampling intervals in the injection well, sulfateremained near background concentrations throughout theinitial pumping campaign (Figure 1i). When the pumpingstopped, the sulfate concentrations decreased, reaching <5ppm in the lower interval within a month and in the upperinterval after about 6 months. During the second pumpingcampaign, the concentrations increased in both intervals,but dropped back down when pumping stopped. Afterapproximately one month, the concentrations began toincrease. For the third pumping campaign there is only datafor the upper interval. In that interval, the sulfate concentra-tion initially dropped slightly but then rebounded to back-ground after a couple of weeks. The sulfate in both intervalsof the monitoring well (Figure 1j) dropped slightly duringthe first pumping campaign but rebounded as soon as thepumping stopped. During the second pumping campaignthere were more significant decreases in sulfate in bothintervals, with the upper level dropping below 30 ppm andthe lower level to less than 5 ppm. After the pumping stopped,the sulfate concentrations in both intervals returned tobackground levels. Interestingly, with time the sulfateconcentrations increased above background levels, especiallyin the lower interval, possibly representing reoxidation ofprecipitated sulfides.
The geochemical data shown in Figure 1 suggest that themicrobial community was stimulated by injection of HRC,rapidly depleting the available oxygen, reducing nitrate andsulfate, and decreasing the concentration of Cr(VI). Theseeffects happened within the first 15 days postinjection, andwere more pronounced and sustained in the injection well.The rebound in sulfate during pumping is interpreted to bethe result of up-gradient water with higher redox potentialbeing pulled into the vicinity of the injection well. In bothintervals in the down gradient monitoring well, nitrateconcentrations decreased to near zero during the pumpingcampaigns (coincident with the arrival of organic acids) andthen slowly rebounded after the pumping stopped. Sulfateonly decreased slightly during the first pumping campaign,but dropped more significantly during the second campaign,especially in the deeper interval. This pattern of chemicalchange is consistent with decreasing redox potential due tomicrobial degradation of the HRC and its byproducts whenthe pumping was drawing the organic acids into the vicinityof the borehole.
Sediment analysis of Hanford sand core samples collectedfrom the postinjection wells suggests that the concentrationsof leached carbonate and calcium in the well located betweenthe injection and monitoring well were 50 and 11% greater,respectively, than concentrations associated with the welllocated outside of the treatment region. This analysissuggested that a mass enrichment of calcite likely occurreddowngradient from the HRC injection well relative to
3760 9 ENVIRONMENTAL SCIENCE & TECHNOLOGY / VOL. 42, NO. 10, 2008

preinjection conditions. This observation is consistent withour conceptual model, which suggests that injection of HRCcould dissolve calcites in the vicinity of the injection well,which could subsequently precipitate downgradient uponencountering more neutral pH groundwater.
3.2. Hydrological Zonation. The baseline tomographicdata sets were used together with electromagnetic flowmeterdata and pump test data to estimate the hydrological zonationwithin the Hanford formation target zone. The reducedflowmeter measurements in the Hanford formation revealedthat the hydraulic conductivity was bimodally distributed,suggesting that it would be most reasonable to estimate thedistribution of higher and lower hydraulic conductivity zones
in the Hanford formation, or hydrological zonation. Toperform the estimation, we used an indicator approach anda linear discriminant analysis technique (23), which is atechnique for categorizing a set of observations into severalpredefined classes. We divided the hydraulic conductivityinto two classes: a class representing all values lower thana cutoff value of 10-3 cm/s, which was the median hydraulicconductivity value (i.e., indicator ) 0), and another classrepresenting all values higher than the cutoff value (i.e.,indicator ) 1). The mean log hydraulic conductivity valuesof the two categories were –3.47 and –2.33 cm/s, respectively,and the corresponding within-group standard deviations
FIGURE 1. Results of geochemical analysis of groundwater samples collected over time using the shallow and deep sampling portswithin the Hanford formation at both the injection (left column) and monitoring (right column) wells, including (a and b) Cr(VI)concentration; (c and d) organic acids; (e and f) δ13C values of DIC; (g and h) nitrate concentration; and (i and j) sulfate. The verticalshaded regions indicate time periods associated with three different pumping campaigns.
VOL. 42, NO. 10, 2008 / ENVIRONMENTAL SCIENCE & TECHNOLOGY 9 3761

were lower than the overall standard deviation of thehydraulic conductivity data set.
Using the linear discriminant approach, the defined cutoffvalue, and the tomographic data, we obtained the spatialdistribution of the probability being in the higher hydraulicconductivity zone of the Hanford formation (Figure 2).Although the flowmeter data in the Hanford formation arequite sparse and the acquisition geometry and inversionapproach impact the baseline geophysical images used forthis interpretation, Figure 2 generally suggests that theprobability of the hydraulic conductivity being higher thanthe median value is greater in the upper part of the sandyHanford formation than the lower part.
3.3. Integrated Interpretation of Geophysical Monitor-ing Data. Figure 3 illustrates contoured changes in estimateddielectric constant, electrical conductivity, and seismicattenuation in the saturated Hanford formation relative tothe baseline data set values over a three year monitoringtime frame. The subset of the time-lapse images shown isrepresentative of the entire geophysical monitoring data set.In general, Figure 3 illustrates that the changes in dielectricconstant and electrical conductivity occurred progressivelyover time. In contrast, the seismic attenuation differenceimages reveal a complete loss of signal in portions of theHanford formation as early as one day after injection of HRC,which was sustained throughout the monitoring period.
Below, we provide an interpretation of the field-scalegeophysical data sets in terms of four key processes:distribution of the injected electron donor; evolution of gasbubbles; changes in TDS; and solid phase transformations.The interpretation of the time-lapse geophysical data sets isqualitative in nature and was developed to jointly honor ourconceptual model, the indications of geophysical responsesprovided from laboratory-scale experiments (Table 1), andour interpretation of field-scale geochemical data sets.
3.3.1. Electron Donor Distribution. Figure 3 shows thatby 1 day after HRC injection, the estimated electricalconductivity dramatically increased, the seismic signal wascompletely attenuated, and the dielectric constant wasreduced near the injection zone relative to baseline condi-tions. At 1 day after injection, the zone of increased electricalconductivity extended from the injection well toward well44, both horizontally along the Hanford-Ringold interface,
and diagonally from the bottom of Well 45 toward the pump(located just beneath the water table in Well 44). Of interestis the development by day 3 postinjection of a wedge-shapedzone of dramatically increased electrical conductivity andattenuated seismic energy. Because the observed changesare consistent with the laboratory responses of pore waterreplacement by HRC (Table 1), we interpret the responseswithin the wedge-shaped region to be associated with theemplacement and distribution of the organic amendment inthe 100H subsurface. The wedge region appears to intersectthe monitoring well by day 13, which is consistent with theincrease in organic acids at the monitoring well that wasdetected by day 15 postinjection (Figure 1).
Comparison of these difference images with the hydraulicconductivity zonation estimates (Figure 2) suggests thatalthough the entire saturated section of the injection wellwas screened, the HRC appears to have rapidly sunk throughthe well and to have entered the system at the base of theHanford formation. The HRC then appears to have beenpreferentially pulled upward during pumping into the higherconductivity zone (Figure 2) as well as horizontally along theHanford-Ringold formation interface toward Well 44. Thisresult demonstrates the influence of hydrogeological het-erogeneity on electron donor distribution at the 100H site.
3.3.2. Evolution of Gas Bubbles. Based on our conceptualmodel and laboratory experimental results, we expected gasto be generated near the injection well due to both CO2
dissolution and denitrification processes. Although thelaboratory studies suggested that seismic amplitudes areextremely sensitive to the presence of small volumes of gasbubbles (Table 1), it was impossible to use these data tointerpret subsequent bubble formation within the wedge-shaped area because much of the seismic data had beenattenuated by the first day postinjection. As such, we relyhere only on indications provided by the radar data sets. Asshown by Figure 3, the early time dielectric constant valuesdid not continue to decrease after HRC was injected. Thisobservation suggests that if gas bubbles are being generatednear the injection well, their volume is small, since the impacton the dielectric constant appears to be negligible relativeto the impact of other processes. Because field gas monitoringwas not performed during the experiment, the interpretationof gas bubble production is based on geophysical data alone.
3.3.3. TDS. Figure 3 suggests that the elevated electricalconductivity associated with the wedge-shaped regionpersisted only for several days. However, the wedge-shapedregion was still discernible throughout much of the experi-ment, as the electrical conductivity values around anddowngradient of the wedge decreased over time, and thedielectric constant values within the wedge-shaped areaincreased. We designate the region surrounding the wedgeas the “reaction halo” and interpret here the change inelectrical conductivity within the halo that surrounds thewedge.
The laboratory experiments suggest that a decrease inTDS should significantly decrease the electrical conductivity(Table 1). Figure 3 illustrates that the electrical conductivitydecreased significantly in the reaction halo region at 30 daysafter injection, recovered toward background electricalconductivity values at 86 days after injection, and thendecreased again within the reaction halo at 324 days afterinjection. Comparison with the monitoring well geochemicaldata (Figure 1) suggests that the variations in electricalconductivity values in the reaction halo area over timecorresponded with sulfate and nitrate concentrations: theelectrical conductivity decreased most significantly duringpumping (when sulfate and nitrate were most reduced), andincreased when pumping stopped (as nitrate and sulfateconcentrations rebounded toward background levels). Al-
FIGURE 2. Probability of being in a high hydraulic conductivityzone within the Hanford formation, as estimated using baselinetomographic data sets, flowmeter and slug test data, and alinear discriminant approach. The figure suggests that theprobability of hydraulic conductivity being higher than themedian flowmeter value is greater in the upper part than inthe lower part of the sandy Hanford formation.
3762 9 ENVIRONMENTAL SCIENCE & TECHNOLOGY / VOL. 42, NO. 10, 2008

though not measured, manganese production associated withCr(VI) reduction may also contribute to TDS variations.
We interpret the changes in electrical conductivity in thereaction halo to be due to changes in TDS, which fluctuateas a function of pumping activity. To test this hypothesis, theelectrical conductivity estimates associated with tomographicpixels adjacent to the shallow, downgradient sampling portwere averaged and used with eqs 1 and 2 to estimate changes
in TDS. The favorable comparison (shown in the SupportingInformation) suggests that the electrical conductivity varia-tions that occurred between the first and second pumpingcampaigns responded primarily to changes in TDS.
3.3.4. Solid Phase Transformations. Our conceptual modeland laboratory experiments suggests that several solid phasetransformations could occur during biostimulation with HRC,including the dissolution of calcite upon amendment injec-
FIGURE 3. Changes in estimated geophysical attributes relative to baseline values within the saturated Hanford stimulation zone andon selected days after HRC injection. These images were used in conjunction with biogeophysical laboratory experimental resultsand field geochemical data to interpret the spatiotemporal distribution of hydrobiogeochemical processes associated with the Cr(VI)biostimulation at the 100H site.
VOL. 42, NO. 10, 2008 / ENVIRONMENTAL SCIENCE & TECHNOLOGY 9 3763

tion and the subsequent formation of disseminated minerals,such as FeS. Relationships such as eqs 1 and 4 further indicatethat porosity changes, potentially caused by the formationand dissolution of minerals, can in turn alter the geophysicalattributes.
Figure 3 illustrates that after introduction of the HRC, thedielectric constant increased in the plume injection arearelative to baseline. This increase was first evident at 30 dayspost injection and continued to 302 days post injection. Afterthis time, the dielectric constant decreased in the reactionhalo region relative to baseline by ∼7%. By 310 dayspostinjection, the electrical conductivity in the reaction halodecreased more substantially and sustainably than previousdecreases.
Using the mixing model provided by eq 4, we interpretthe radar changes to be due to an early time increase inporosity near the injection well (as HRC dissolved calcites inthe Hanford sands), followed by a decrease in porosity duringlater times downgradient as calcites precipitated uponencountering more neutral pH regions. The decrease inelectrical conductivity, which is exemplified by the 324 dayspost injection tomogram in Figure 3, is similar in magnitudeto the decreases in electrical conductivity detected at thelaboratory scale during the formation of finely disseminatedprecipitates (such as FeS). Although time-lapse porosity anddetailed mineralogical data were not collected during thefield experiment to validate this interpretation, the inter-pretation of downgradient calcite precipitation is supportedby the sediment geochemistry data, which revealed a massenrichment of calcium and carbonate along the experimentalcenterline relative to regions outside of the stimulation region.
3.4. Discussion. In Section 3.3, we interpreted themonitoring data set in terms of specific processes. Becausethe monitoring data were collected to provide informationabout system dynamics over space and time in response tothe HRC injection, below we summarize the integratedinterpretation of the geophysical monitoring data in termsof early, intermediate, and late experimental stage transfor-mations.
3.4.1. Early Stage Transformations (e3 days). Immediatelyfollowing the HRC injection, the field geophysical differencetomograms revealed a severe attenuation of seismic ampli-tude, an increase in electrical conductivity and a decreasein dielectric constant near the injection well. Consistent withthe laboratory signatures of pore water replacement by HRC,we interpret the early stage of the field experiment to bedominated by the introduction of HRC into the Hanfordformation. Comparison of the interpretation of the HRCdistribution with the hydraulic conductivity zonation esti-mates suggests that heterogeneity governed the early em-placement of HRC within the higher hydraulic conductivityzone and along the Hanford-Ringold interface.
3.4.2. Intermediate Stage Transformations (∼13–302 days).Several processes are interpreted to be associated with theintermediate stage of the experiment: injectate migration,calcite dissolution near the injection well, and changes inTDS associated with pumping. By 15 days post injection,both the geophysical and aqueous geochemical data sug-gested that the HRC and/or its breakdown products hadmigrated to the downgradient well. The dielectric increaseobserved near the injection well during the early part of theintermediate stage are interpreted to be due to an increasein porosity associated with the dissolution of calcite bythe acidic HRC injectate. The wellbore geochemical datasuggested that nitrate and sulfate concentrations fluctuatedas aquifer redox conditions changed due to pumping.Illustrating the benefit of geophysical monitoring, theelectrical conductivity difference tomograms revealed cor-responding spatiotemporal variations of these interpreted
TDS fluctuations along the two-dimensional transect thatconnected the injection and monitoring well.
3.4.3. Late Stage Transformations (302–604 days). Pro-cesses occurring during the late experimental times areinterpreted to be dominated by solid-phase transformations.The decrease in electrical conductivity (beyond what isexpected based on decreases in TDS), decrease in dielectricconstant, and further decrease in seismic attenuation isinterpreted to be due to the formation of disseminatedprecipitates and associated porosity reduction within thereaction halo. Calcites, which were interpreted to have beendissolved upon HRC injection, are interpreted to haveprecipitated upon encountering more neutral pH ground-water downgradient. This interpretation is consistent withthe sediment geochemical data that were collected postin-jection, which revealed higher calcite and carbonate con-centrations than concentrations associated with core sampleslocated outside of the stimulated zone. Although otherminerals (such as FeS) may also have formed and contributedto the observed geophysical response and interpreted poros-ity reduction, detailed time-lapse porosity and sediment irongeochemical data are not available for corroboration.
3.4.4. Very Late Stage Transformations (1008 days). Be-cause wellbore geochemical data are only available for twoyears following the HRC injection, only the geophysical datasets are available for interpreting the very late stage trans-formations. This data set revealed that by three years postinjection, the electrical conductivity had rebounded, theseismic signal was attenuated, and the dielectric constantvalues were depressed in the reaction halo relative to baselineconditions. Following the interpretations presented previ-ously and consistent with our conceptual model and labora-tory experiments, these geophysical responses suggest thatTDS rebounded to background levels and that the interpretedporosity reduction due to the formation of precipitatescontinued to impact the system ∼3 years post injection.
The integrated interpretation illustrates the potentialbenefit of using time-lapse geophysical data sets to interpretbiogeochemical transformations associated with a biore-mediation treatment in high resolution, over field relevantscales, and in a minimally invasive manner. We found thatmultiple types of geophysical measurements, collected overa long time period, revealed small but spatially persistentchanges in geophysical attributes that were consistent withour conceptual model, laboratory experimental results, andfield geochemical data sets. In addition to illustrating thepotential of geophysical data sets for remote monitoring offield-scale processes, our study also illustrated the influenceof pumping and heterogeneity on the transformations.Although these impacts are not unexpected, it is rare inpractice to have both high enough characterization andmonitoring data to be able to explore the influence ofheterogeneity on biogeochemical transformations at the fieldscale.
Although the potential benefits of using integrated time-lapse, field-scale data sets for monitoring biogeochemicaltransformations are evident, there are currently severaluncertainties associated with the approach and the inter-pretation provided herein. For example, although field-scaleaqueous and limited sedimentary data were available tocorroborate some of the interpreted processes (such as HRCdistribution, changes in TDS, mass enrichment in calcite),time-lapse field measurements of gas bubble evolution,mineralogy, and porosity would have been helpful forcorroborating the geophysical interpretation of otherprocesses.
There are also several challenges and limitations associ-ated with using extensive yet indirect geophysical data setsto interpret hydrobiogeochemical processes, including thoseassociated with scale, uniqueness, petrophysics, estimation,
3764 9 ENVIRONMENTAL SCIENCE & TECHNOLOGY / VOL. 42, NO. 10, 2008

and imaging (e.g., ref 3). Although our laboratory and field-scale geophysical responses to particular processes weregenerally very consistent, this consistency may not be realizedunder different conditions. As is further discussed in theSupporting Information and in agreement with previousstudies (e.g., ref 24) both tomographic data acquisition andinversion procedures impact the image of the geophysicalattributes that were interpreted for this study. With thisuncertainty, the images were generally not used to estimatebiogeochemical property values or precise boundaries ofregions undergoing particular transformations. Instead, thetime-lapse geophysical attributes were used to define regionswhere transformations occurred and to indicate possible end-products associated with the transformations.
This study illustrates the wealth of information thatgeophysical data sets have the potential to provide aboutvariations in biogeochemical processes associated with Cr(VI)biostimulation; the integrated approach led to an interpreta-tion that would have been difficult to extract from wellboregeochemical data alone. Time-lapse geophysical data setscan also potentially be used to monitor other remediationtreatments besides biostimulation using HRC. Other reason-able geophysical imaging targets include monitoring thedistribution and reaction products associated with otherviscous amendments (such as vegetable oil or molasses),mobile and soluble electron donors (such as lactate, acetate,ethanol, and other organic compounds), or solid particles(such as nanoscale iron), as well as associated hydrological-biogeochemical transformations. With the continuing hy-drogeophysical and biogeophysical research that is currentlyunderway within the community, we expect that the use ofgeophysical methods for exploring complex and coupledhydrobiogeochemical subsurface processes associated withremedial treatments to increase in frequency and to becomemore quantitative in nature. Once developed, such geo-physical approaches could conceivably be used in a semi-autonomous and long-term monitoring mode. Althoughmore research is needed before these methods can beconsidered as routine remediation monitoring tools, thisstudy indicates that it is an avenue worthy of further pursuit.
AcknowledgmentsFunding for this study was provided by the EnvironmentalRemediation Science Program, Office of Biological andEnvironmental Research, U.S. Department of Energy (DOE;Grant DE-AC02-05CH11231). We thank Kim MacFarlane forher assistance with laboratory experiments; Don Vasco(LBNL) for use of his curved-ray inversion algorithm; AnnaWillett and Steve Koenigsberg (both formally of Regenesis)for supplying the HRC to the biostimulation project; andMike Kowalsky (LBNL), Frederick Day-Lewis (USGS), andtwo anonymous reviewers for critically reviewing this paper.
Supporting Information AvailableAdditional details about this study are provided in theSupporting Information about the: Hanford Study Site,biostimulation experiment; biogeochemical conceptual model;laboratory biogeophysical experiments; acquisition andinversion of field geophysical data sets; and assessment ofthe quality and use of geophysical data for monitoringtransformations associated with the biostimulation. Thismaterial is available free of charge via the Internet at http://pubs.acs.org.
Literature Cited(1) Rubin, Y.; Hubbard, S. Hydrogeophysics; Springer: The Nether-
lands, 2005; p 523.
(2) Vereecken, H.; Binley, A.; Cassiani, G.; Revil, A.; Titov, K. AppliedHydrogeophysics; Springer: The Netherlands, 2006; p 383.
(3) Hubbard, S. S.; Rubin, Y. Introduction to Hydrogeophysics,Chapter 1. In Hydrogeophysics; Rubin, Y., Hubbard, S., Eds.;Springer: The Netherlands, 2005; pp 3–21.
(4) Scheibe, T. S.; Chien, Y. J. An evaluation of conditioning datafor solute transport prediction. Ground Water 2003, 41 (2),128–141.
(5) Scheibe, T.; Fang, Y.; Murray, C. J.; Roden, E. E.; Chen, J.; Chien,Y.; Brooks, S. C.; Hubbard, S. S. Transport and biogeochemicalreactions of metals in a physically and chemically heterogeneousaquifer. Geosphere 2006, 2 4, 220-235, DOI: 10.1130/GES00029.1.
(6) Atekwana, E. A.; Werkema, D. D.; Atekwana, E. A. Biogeophysics:The effects of microbial processes on geophysical properties ofthe shallow subsurface, Chapter 6. In Applied Hydrogeophysics;Vereecken, H., Binley, A., Cassiani, G., Revil, A., Titov, K. Eds.;Springer: The Netherlands, 2006; pp 161–193.
(7) Williams, K. H.; Ntarlagiannis, D.; Slater, L. D.; Dohnalkova, A.;Hubbard, S. S.; Banfield, J. F. Geophysical imaging of stimulatedmicrobial biomineralization. Environ. Sci. Technol. 2005, 39(19), 7592-7600, DOI: 10.1021/es0504035.
(8) Lane, J. W.; Day-Lewis, F. D.; Casey, C. C. Geophysical monitoringof a field-scale biostimulation pilot project. Ground Water2006, 443, 430-443, DOI: 10.1111/j.1745-6584.2005.00134.
(9) Archie, G. E. The electrical resistivity log as an aid in determiningsome reservoir characteristics. Trans. Amer. Inst. Min. Metall.Pet. Eng. 1942, 146, 54–62.
(10) Fishman, M. J.; Friedman, L. C. Methods of determination oforganic substances and fluvial sediments, Techniques of WaterResource Investigations of the U.S. Geological Survey, Book 5,Chapter A1; U.S Geological Survey: Reston, VA, 1989.
(11) Binley, A.; Kemna, A. DC resistivity and induced polarizationmethods, Chapter 5. In Hydrogeophysics; Rubin, Y., Hubbard,S., Eds.; Springer: The Netherlands, 2005; pp 129–156.
(12) Lesmes, D.; Friedman, S. Electrical and hydrological properties,Chapter 4. In Hydrogeophysics; Rubin, Y., Hubbard, S., Eds.;Springer: The Netherlands, 2005; pp 87–128.
(13) Topp, C. G.; Davis, J. L.; Annan, A. P. Electromagnetic deter-mination of soil water content: measurements in coaxialtransmission lines. Water Resour. Res. 1980, 16 (3), 574–582.
(14) Peterson, J. E. Pre-inversion processing and analysis of tomo-graphic radar data. J. Environ. Eng. Geophys. 2001, 6 (1), 1–18.
(15) Davis, J. L.; Annan, A. P. Ground penetrating radar for highresolution mapping of soil and rock stratigraphy. Geophys.Prospect. 1989, 37 (5), 531–551.
(16) Wharton, R. P.; Hazen, G. A.; Rau, R. N.; Best, D. L. Electro-magnetic propagation logging-Advances in technique andinterpretation, Society of Petroleum Engineers Paper, 1980, 9267,12.
(17) Chang, P. D.; Alumbaugh, D.; Brainard, J.; Hall, L. Cross-boreholeground penetrating radar for monitoring and imaging solutetransport within the vadose zone Water Resour. Res. 2006, 42,DOI: 10.1029/2004WR003871.
(18) Dalton, F. N.; Herkelrath, W. N.; Rawlins, D. S.; Rhoades, J. D.Time-domain reflectometry: Simultaneous measurement of soilwater content and electrical conductivity with a single probe.Science 1984, 224 (4652), 989–990.
(19) Steeples, D. W. Shallow seismic methods, Chapter 8. InHydrogeophysics; Rubin, Y., Hubbard, S. S., Eds.; Springer: TheNetherlands, 2005.
(20) Pride, S. Relationships between seismic and hydrologicalproperties, Chapter 9. In Hydrogeophysics; Rubin, Y., Hubbard,S. S., Eds.; Springer: The Netherlands, 2005; pp 253–290.
(21) Torn, M.; Davis, S.; Bird, J. A.; Shaw, M. R.; Conrad, M. E.Automated analysis of 13C/12C ratios in dissolved CO2 anddissolved inorganic carbon for ecological and environmentalapplications. Rapid Commun. Mass Spectrom. 2003, 17 (23),2675–2682.
(22) Molz, F. J.; Boman, G. K.; Young, S. C.; Waldrop, W. R. Boreholeflowmeters: Field applications and data analysis. J. Hydrol. 1994,163, 347–371.
(23) Venables, W. N.; Ripley, B. D. Modern Applied Statistics withS-Plus; Springer: New York, 1999.
(24) Day-Lewis, F. D.; Lane, J. W. Assessing the resolution-dependentutility of tomograms for geostatistics. Geophys. Res. Lett. 2004,31, L07503 DOI:10.1029/2004GL019617.
ES071702S
VOL. 42, NO. 10, 2008 / ENVIRONMENTAL SCIENCE & TECHNOLOGY 9 3765