Binding Ensemble Profiling with Photoaffinity Labeling (BEProFL) Approach: Mapping the Binding Poses...
29
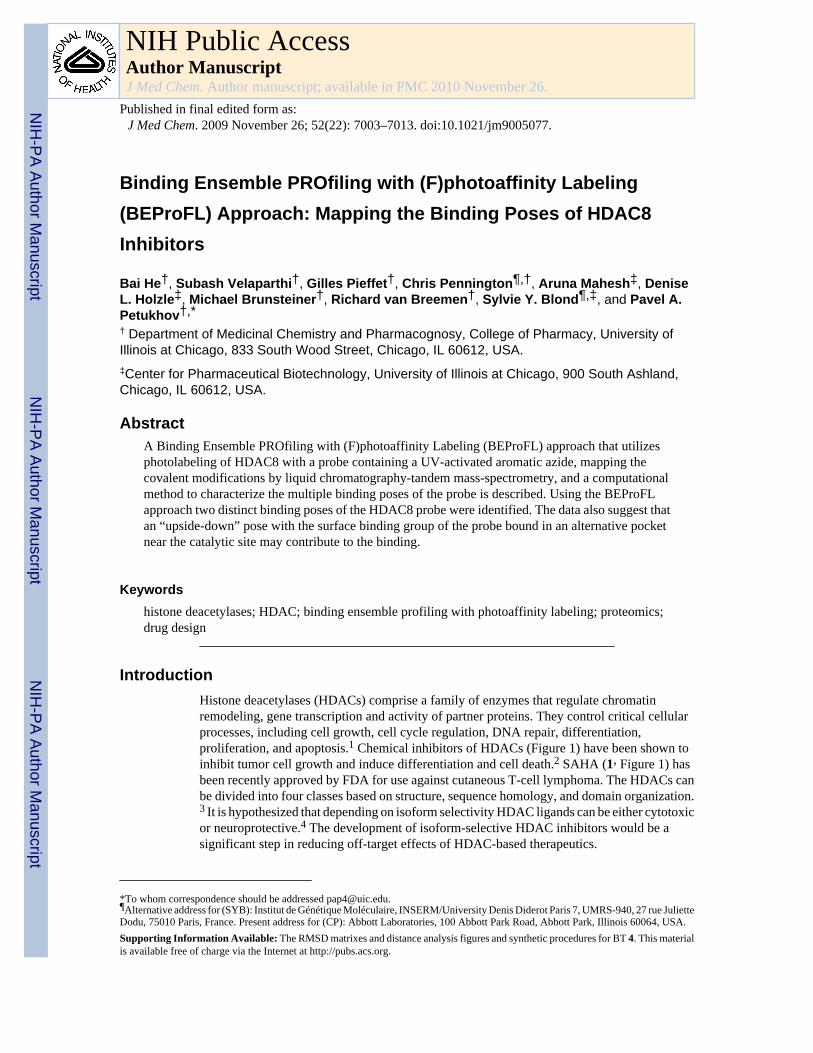
Binding Ensemble PROfiling with (F)photoaffinity Labeling (BEProFL) Approach: Mapping the Binding Poses of HDAC8 Inhibitors Bai He † , Subash Velaparthi † , Gilles Pieffet † , Chris Pennington ¶,† , Aruna Mahesh ‡ , Denise L. Holzle ‡ , Michael Brunsteiner † , Richard van Breemen † , Sylvie Y. Blond ¶,‡ , and Pavel A. Petukhov †,* † Department of Medicinal Chemistry and Pharmacognosy, College of Pharmacy, University of Illinois at Chicago, 833 South Wood Street, Chicago, IL 60612, USA. ‡ Center for Pharmaceutical Biotechnology, University of Illinois at Chicago, 900 South Ashland, Chicago, IL 60612, USA. Abstract A Binding Ensemble PROfiling with (F)photoaffinity Labeling (BEProFL) approach that utilizes photolabeling of HDAC8 with a probe containing a UV-activated aromatic azide, mapping the covalent modifications by liquid chromatography-tandem mass-spectrometry, and a computational method to characterize the multiple binding poses of the probe is described. Using the BEProFL approach two distinct binding poses of the HDAC8 probe were identified. The data also suggest that an “upside-down” pose with the surface binding group of the probe bound in an alternative pocket near the catalytic site may contribute to the binding. Keywords histone deacetylases; HDAC; binding ensemble profiling with photoaffinity labeling; proteomics; drug design Introduction Histone deacetylases (HDACs) comprise a family of enzymes that regulate chromatin remodeling, gene transcription and activity of partner proteins. They control critical cellular processes, including cell growth, cell cycle regulation, DNA repair, differentiation, proliferation, and apoptosis. 1 Chemical inhibitors of HDACs (Figure 1) have been shown to inhibit tumor cell growth and induce differentiation and cell death. 2 SAHA (1 , Figure 1) has been recently approved by FDA for use against cutaneous T-cell lymphoma. The HDACs can be divided into four classes based on structure, sequence homology, and domain organization. 3 It is hypothesized that depending on isoform selectivity HDAC ligands can be either cytotoxic or neuroprotective. 4 The development of isoform-selective HDAC inhibitors would be a significant step in reducing off-target effects of HDAC-based therapeutics. *To whom correspondence should be addressed [email protected]. ¶ Alternative address for (SYB): Institut de Génétique Moléculaire, INSERM/University Denis Diderot Paris 7, UMRS-940, 27 rue Juliette Dodu, 75010 Paris, France. Present address for (CP): Abbott Laboratories, 100 Abbott Park Road, Abbott Park, Illinois 60064, USA. Supporting Information Available: The RMSD matrixes and distance analysis figures and synthetic procedures for BT 4. This material is available free of charge via the Internet at http://pubs.acs.org. NIH Public Access Author Manuscript J Med Chem. Author manuscript; available in PMC 2010 November 26. Published in final edited form as: J Med Chem. 2009 November 26; 52(22): 7003–7013. doi:10.1021/jm9005077. NIH-PA Author Manuscript NIH-PA Author Manuscript NIH-PA Author Manuscript
-
Upload
independent -
Category
Documents
-
view
3 -
download
0
Transcript of Binding Ensemble Profiling with Photoaffinity Labeling (BEProFL) Approach: Mapping the Binding Poses...
Binding Ensemble PROfiling with (F)photoaffinity Labeling(BEProFL) Approach: Mapping the Binding Poses of HDAC8Inhibitors
Bai He†, Subash Velaparthi†, Gilles Pieffet†, Chris Pennington¶,†, Aruna Mahesh‡, DeniseL. Holzle‡, Michael Brunsteiner†, Richard van Breemen†, Sylvie Y. Blond¶,‡, and Pavel A.Petukhov†,*† Department of Medicinal Chemistry and Pharmacognosy, College of Pharmacy, University ofIllinois at Chicago, 833 South Wood Street, Chicago, IL 60612, USA.‡Center for Pharmaceutical Biotechnology, University of Illinois at Chicago, 900 South Ashland,Chicago, IL 60612, USA.
AbstractA Binding Ensemble PROfiling with (F)photoaffinity Labeling (BEProFL) approach that utilizesphotolabeling of HDAC8 with a probe containing a UV-activated aromatic azide, mapping thecovalent modifications by liquid chromatography-tandem mass-spectrometry, and a computationalmethod to characterize the multiple binding poses of the probe is described. Using the BEProFLapproach two distinct binding poses of the HDAC8 probe were identified. The data also suggest thatan “upside-down” pose with the surface binding group of the probe bound in an alternative pocketnear the catalytic site may contribute to the binding.
Keywordshistone deacetylases; HDAC; binding ensemble profiling with photoaffinity labeling; proteomics;drug design
IntroductionHistone deacetylases (HDACs) comprise a family of enzymes that regulate chromatinremodeling, gene transcription and activity of partner proteins. They control critical cellularprocesses, including cell growth, cell cycle regulation, DNA repair, differentiation,proliferation, and apoptosis.1 Chemical inhibitors of HDACs (Figure 1) have been shown toinhibit tumor cell growth and induce differentiation and cell death.2 SAHA (1, Figure 1) hasbeen recently approved by FDA for use against cutaneous T-cell lymphoma. The HDACs canbe divided into four classes based on structure, sequence homology, and domain organization.3 It is hypothesized that depending on isoform selectivity HDAC ligands can be either cytotoxicor neuroprotective.4 The development of isoform-selective HDAC inhibitors would be asignificant step in reducing off-target effects of HDAC-based therapeutics.
*To whom correspondence should be addressed [email protected].¶Alternative address for (SYB): Institut de Génétique Moléculaire, INSERM/University Denis Diderot Paris 7, UMRS-940, 27 rue JulietteDodu, 75010 Paris, France. Present address for (CP): Abbott Laboratories, 100 Abbott Park Road, Abbott Park, Illinois 60064, USA.Supporting Information Available: The RMSD matrixes and distance analysis figures and synthetic procedures for BT 4. This materialis available free of charge via the Internet at http://pubs.acs.org.
NIH Public AccessAuthor ManuscriptJ Med Chem. Author manuscript; available in PMC 2010 November 26.
Published in final edited form as:J Med Chem. 2009 November 26; 52(22): 7003–7013. doi:10.1021/jm9005077.
NIH
-PA Author Manuscript
NIH
-PA Author Manuscript
NIH
-PA Author Manuscript

One of the key challenges in designing isoform-selective HDAC inhibitors is a poorunderstanding of the binding modes (poses) available to the highly solvent exposed surfacebinding group (SBG) of HDAC inhibitors targeting the grooves and ridges on the proteinsurface directly adjacent to the catalytic well of HDACs (Figure 2). It has been hypothesizedby us in our preliminary experiments and a recent publication by Wiest and colleagues5 thatthe SBG groups may have more than one preferred position on the surface and each of themcontributes to the overall binding affinity. Although the available HDAC X-ray data provideinformation on structure of proteins and binding of ligands, its use is limited due to high solventexposure of the SBG of the ligands and additional copies of the same protein in thecrystallographic cell that interfere with the binding of the co-crystallized ligands.
Photoaffinity labeling is a strategy offering methods for the identification of drug targetproteins of biologically active compounds and mapping their binding sites.6-8 Among severalphotosensitive groups, aryl azide is perhaps one of the most widely used due to its universality,reactivity, and relative simplicity in implementation.6 One of the recent advances in thephotoaffinity labeling probe development is application of “click-chemistry” andbioorthogonal probes for activity-based proteomics profiling by Cravatt et al.9-15 and its recentmodification by Suzuki et al.16-18 This latter study is based on a concept in which a bifunctionalligand is connected to a target protein by activation of a photoreactive group, such as anaromatic azido or 3-trifluoromethyl-3H-diazirin-3-yl group, and identification of the ligandproduct is achieved by anchoring a detectable tag to an alkyl azido moiety, which survivesphotolysis, using the Staudinger-Bertozzi ligation.19-24 A similar approach was recentlyutilized to discover a new binding site in HIV-1 integrase.25 In this case a differentphotoactivated moiety - benzophenone – facilitated by mass spectrometry and docking analysiswas used to determine the exact ligand binding position. The recent study by Cravatt et al.15
presents a novel proteomics probe for histone deacetylases and is intended to discover newproteins interacting with the histone deacetylases. It does not address, however, the problemof multiple binding poses of HDAC inhibitors.
Here we introduced for the first time the use of diazide-based photoaffinity labeling probes,liquid chromatography-tandem mass-spectrometry, and molecular dynamics simulations tomap the ensemble of the poses of HDAC8 inhibitors upon binding (Figure 3) or BEProFL –(B)inding (E)nsemble (Pro)filing with (F)photoaffinity (L)abeling.
Materials and methodsSynthesis
The synthesis of probes 2 and 3 (Figure 4) is outlined in schemes 1 and 2. Commerciallyavailable subericacid monomethyl ester 5 was coupled with 4-(3-nitrophenyl)-thiazol-2-ylamine in presence pyridine and POCl3 to give ester 6.26 The nitro group of ester 6 was reducedresulting in amine 7 that was converted to azide 8 by diazotization and nucleophilic substitutionwith sodium azide. Further treatment of 8 with hydroxylamine resulted in hydroxamic acid2. The condensation of 5 with an equivalent amount of 4-benzyloxyaniline in presence ofPOCl3 and pyridine gave amide 9. The benzylhydroxy group of amide 9 was deprotected bycatalytic hydrogenation and coupled with mesylate 1227 resulting in diazide 11 that was thenconverted to the corresponding hydroxamic acid 3 in a 40% yield. BT 4 was synthesizedfollowing the procedure described earlier.28
HDAC activity assayThe inhibition of HDAC8 was measured as recommended by the supplier BIOMOLInternational using the fluorescent acetylated HDAC substrate Fluor de Lys (BIOMOL, KI178)
He et al. Page 2
J Med Chem. Author manuscript; available in PMC 2010 November 26.
NIH
-PA Author Manuscript
NIH
-PA Author Manuscript
NIH
-PA Author Manuscript
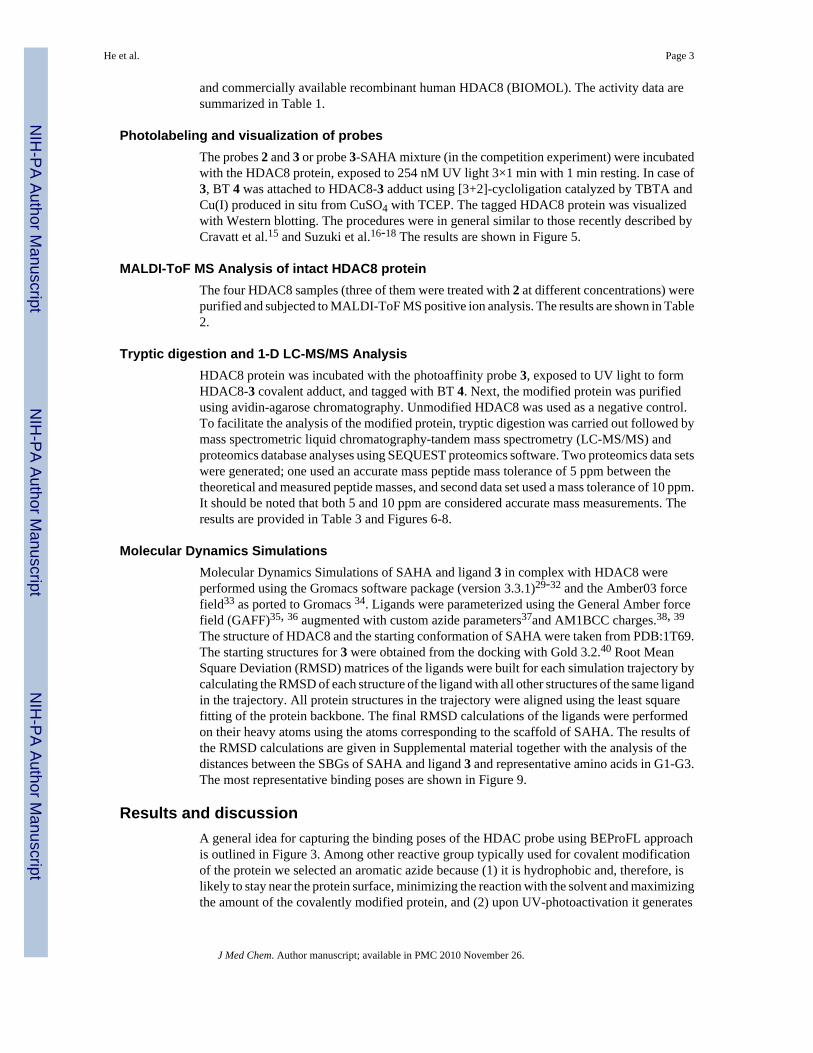
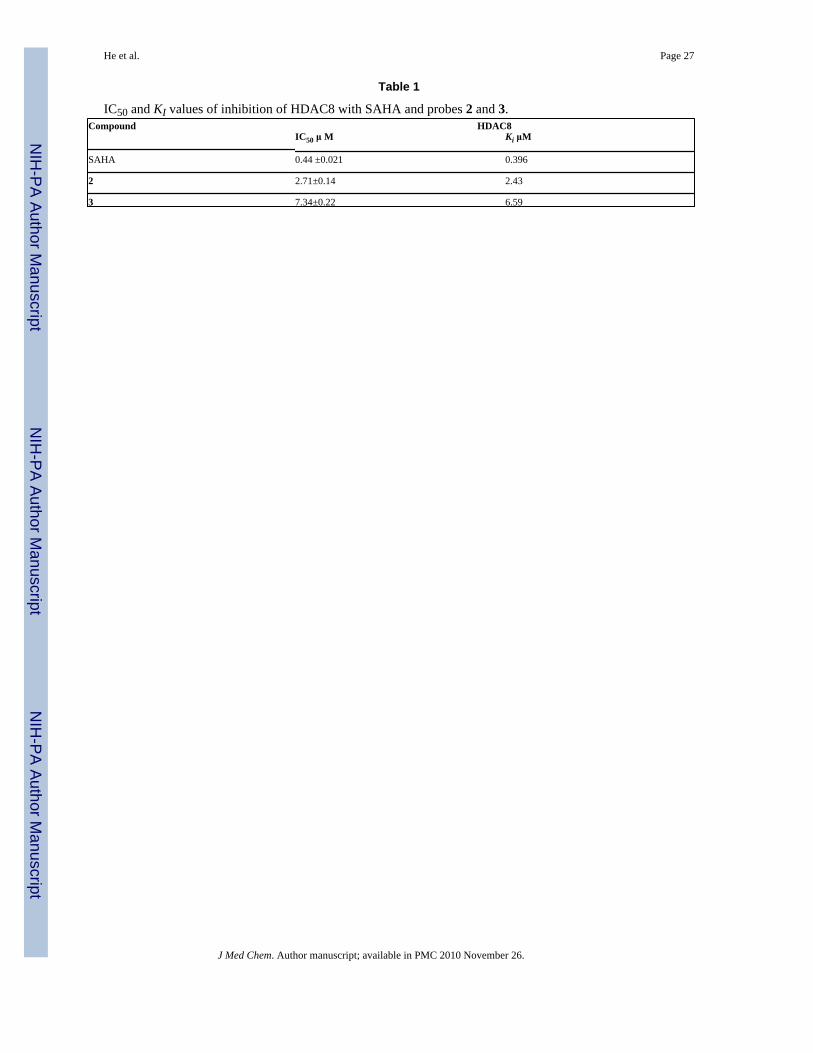
and commercially available recombinant human HDAC8 (BIOMOL). The activity data aresummarized in Table 1.
Photolabeling and visualization of probesThe probes 2 and 3 or probe 3-SAHA mixture (in the competition experiment) were incubatedwith the HDAC8 protein, exposed to 254 nM UV light 3×1 min with 1 min resting. In case of3, BT 4 was attached to HDAC8-3 adduct using [3+2]-cycloligation catalyzed by TBTA andCu(I) produced in situ from CuSO4 with TCEP. The tagged HDAC8 protein was visualizedwith Western blotting. The procedures were in general similar to those recently described byCravatt et al.15 and Suzuki et al.16-18 The results are shown in Figure 5.
MALDI-ToF MS Analysis of intact HDAC8 proteinThe four HDAC8 samples (three of them were treated with 2 at different concentrations) werepurified and subjected to MALDI-ToF MS positive ion analysis. The results are shown in Table2.
Tryptic digestion and 1-D LC-MS/MS AnalysisHDAC8 protein was incubated with the photoaffinity probe 3, exposed to UV light to formHDAC8-3 covalent adduct, and tagged with BT 4. Next, the modified protein was purifiedusing avidin-agarose chromatography. Unmodified HDAC8 was used as a negative control.To facilitate the analysis of the modified protein, tryptic digestion was carried out followed bymass spectrometric liquid chromatography-tandem mass spectrometry (LC-MS/MS) andproteomics database analyses using SEQUEST proteomics software. Two proteomics data setswere generated; one used an accurate mass peptide mass tolerance of 5 ppm between thetheoretical and measured peptide masses, and second data set used a mass tolerance of 10 ppm.It should be noted that both 5 and 10 ppm are considered accurate mass measurements. Theresults are provided in Table 3 and Figures 6-8.
Molecular Dynamics SimulationsMolecular Dynamics Simulations of SAHA and ligand 3 in complex with HDAC8 wereperformed using the Gromacs software package (version 3.3.1)29-32 and the Amber03 forcefield33 as ported to Gromacs 34. Ligands were parameterized using the General Amber forcefield (GAFF)35, 36 augmented with custom azide parameters37and AM1BCC charges.38, 39
The structure of HDAC8 and the starting conformation of SAHA were taken from PDB:1T69.The starting structures for 3 were obtained from the docking with Gold 3.2.40 Root MeanSquare Deviation (RMSD) matrices of the ligands were built for each simulation trajectory bycalculating the RMSD of each structure of the ligand with all other structures of the same ligandin the trajectory. All protein structures in the trajectory were aligned using the least squarefitting of the protein backbone. The final RMSD calculations of the ligands were performedon their heavy atoms using the atoms corresponding to the scaffold of SAHA. The results ofthe RMSD calculations are given in Supplemental material together with the analysis of thedistances between the SBGs of SAHA and ligand 3 and representative amino acids in G1-G3.The most representative binding poses are shown in Figure 9.
Results and discussionA general idea for capturing the binding poses of the HDAC probe using BEProFL approachis outlined in Figure 3. Among other reactive group typically used for covalent modificationof the protein we selected an aromatic azide because (1) it is hydrophobic and, therefore, islikely to stay near the protein surface, minimizing the reaction with the solvent and maximizingthe amount of the covalently modified protein, and (2) upon UV-photoactivation it generates
He et al. Page 3
J Med Chem. Author manuscript; available in PMC 2010 November 26.
NIH
-PA Author Manuscript
NIH
-PA Author Manuscript
NIH
-PA Author Manuscript
a nitrene moiety known to be very reactive and non-specific, which is expected to be essentialfor capturing a “snapshot” of the bound probe in a close proximity to where this reactive moietywas generated. In addition there are several critical requirements for photoaffinity probes ingeneral. First, the probes should exhibit a respectable level of HDAC binding to maximize theyield of the modified HDAC protein. Second, the procedures for UV-activated crosslinkingshould be efficient enough so that the UV damage of the protein is minimized while the yieldof the crosslinked adduct is maximized. Third, the attachment procedure of the biotin probeshould be fast and efficient to minimize possible aggregation and precipitation of the protein.
The probes used in this study were designed to mimic the scaffold of SAHA (1) and aphenylthiazole-based HDAC inhibitor.41 The synthesis of probes 2 and 3 is shown in Schemes1 and 2. It was found that probe 2 is 6.1-fold and probe 3 is 16.6-fold less active in inhibitingHDAC8 compared to SAHA (Table 1). The moderate HDAC8 activity of the ligands with thisscaffold is consistent with other reports.42 The decrease in activity of the probes is notsurprising since introduction of the azide moieties in probes 2 and 3 increased the lipophilicnature of the solvent exposed SBGs.
The success of the procedure shown in Figure 3 depends on the ability of the probes to modifythe protein rather than the solvent surrounding the ligand and the protein. Since the SBG ofHDAC inhibitors is highly solvent exposed there was a chance that the aromatic azide moietywould not be able to reach the protein surface and instead would prefer to react with the solvent.
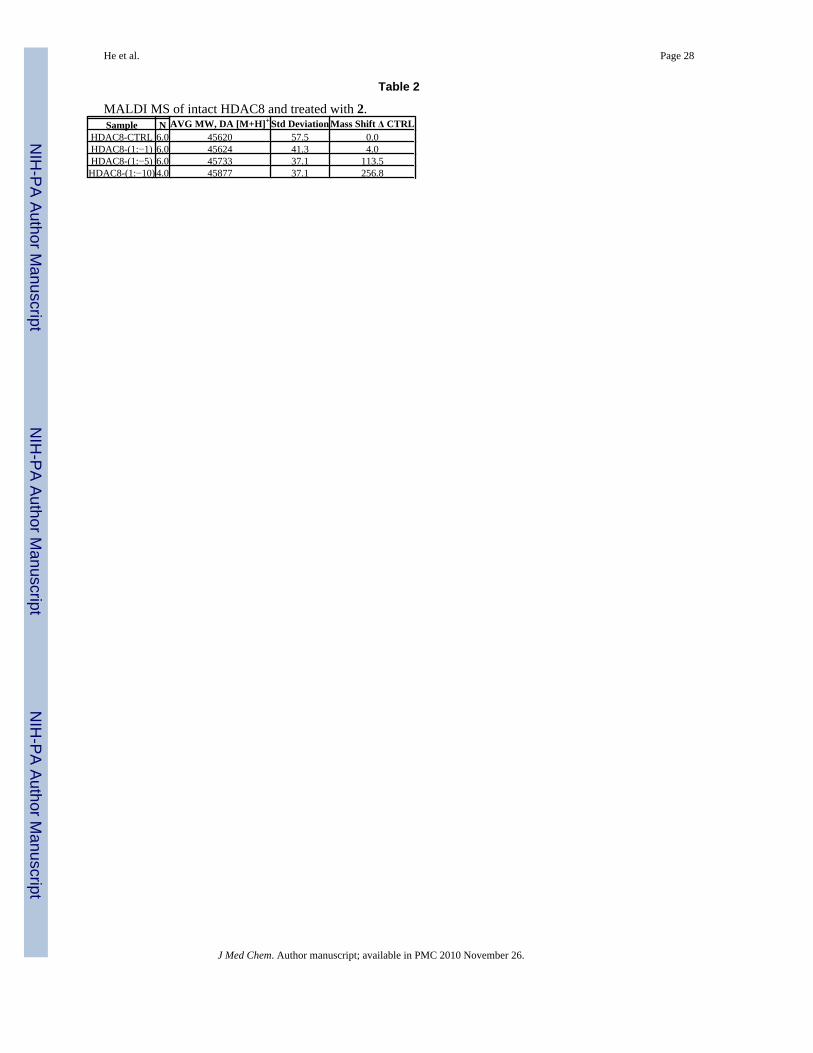
As the first step, we confirmed that an aromatic azide group can indeed be used to covalentlyattach the probes to the HDAC8 protein by detecting a mass shift in a MALDI MS experiment.The results of the MALDI MS analysis are summarized in Table 2. The average mass of theuntreated HDAC8 protein was 45620 Da. After incubation with ligand 2, the mass of theHDAC8 protein increased in dose-dependent manner. A maximum mass shift of 256.8 Da wasobserved at an enzyme to reagent ratio of 1:10. As the amount of protein modified approaches100%, the observed average mass shift would be expected to approach the mass of the reagent(360 Da). We attribute relatively high concentration of probe 2 needed to its relatively poorpotency against HDAC8 and high solvent exposure of the SBG. The results of the MALDI-MS analysis of the intact protein supported the conclusion that the protein was successfullymodified by the UV activated nitrene group generated from the probe 2 and we moved to thenext stage – cross-linking followed by attachment of BT 4 to the alkyl azide moiety of probe3.
To evaluate the selectivity of photolabeling in vitro, purified recombinant HDAC8 wasincubated with various concentrations of ligands 2 and 3. The conditions for UV crosslinkingwere optimized to increase signal-to-noise ratio. We found that in case of HDAC8 3×1 minexposure to UV light with 1 min rest gives the best signal to noise ratio. The “click-chemistry”conditions with catalysis by Cu(I) generated in situ were successfully used to attach BT 4 tothe adduct between HDAC8 and probe 3. In our preliminary studies we also tried theStaudinger-Bertozzi ligation19-24 as an attachment procedure of the biotin tag and determinedthat the “click-chemistry” approach is much faster and gives better yield as determined byWestern blotting. This is consistent with the observation made by Cravatt et al.9
As expected, the amount of biotinylated HDAC increases in a concentration-dependent mannerin the presence of ligand 3 but not with ligand 2 (Figure 5A) that lacks the alkyl azide groupdesigned to bind the biotin tag; only non-specific, background level signals are observed. Acomparison of the background levels observed in lanes 3, 9-11 shows that the backgroundlevels of biotinylation are due to non-specific modification of the HDAC8 protein with BT 4and do not depend on the presence of probes 2 and 3. It appears that the non-specificbiotinylation with BT 4 may be specific to the HDAC8 protein as in a similar experiment
He et al. Page 4
J Med Chem. Author manuscript; available in PMC 2010 November 26.
NIH
-PA Author Manuscript
NIH
-PA Author Manuscript
NIH
-PA Author Manuscript
HDAC3 protein showed negligible levels of non-specific biotinylation with BT 4 (data notshown). In the competition experiment shown in Figure 5B, the level of the covalentmodifications with probe 3 drops by 50% when SAHA is present during the photolabeling,indicating that the cross-linking of the probe 3 to HDAC8 is likely to happen when 3 is boundat the catalytic site.
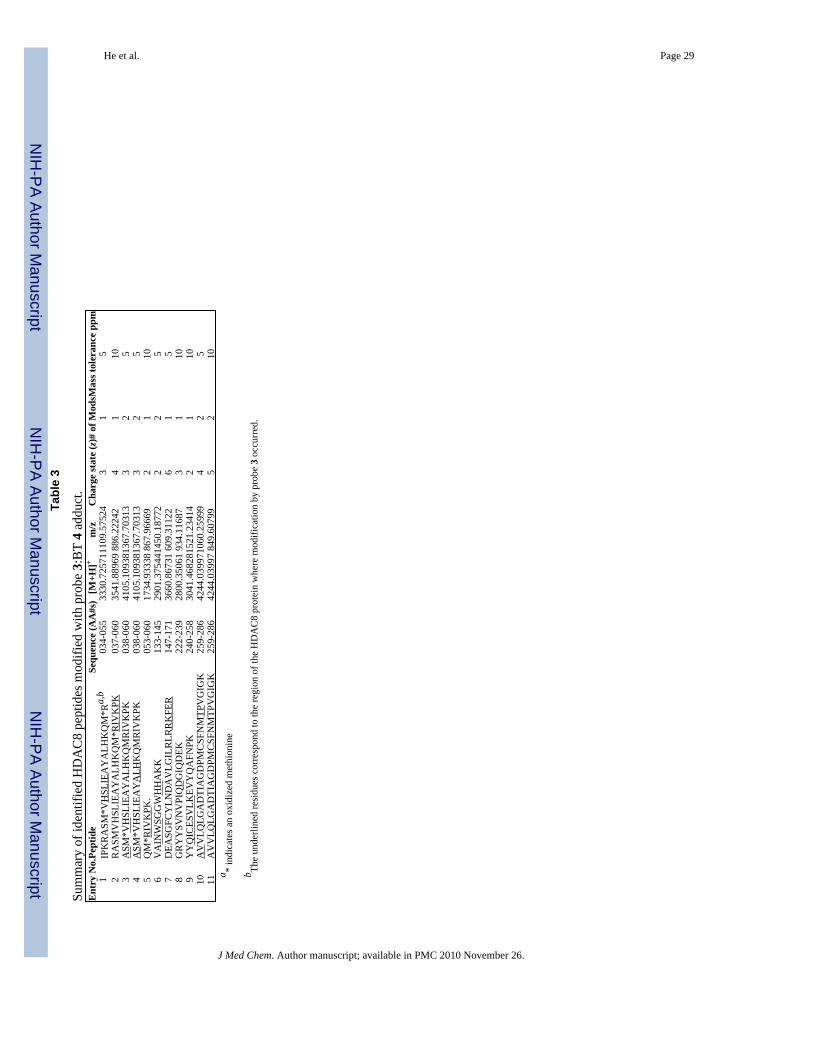
A total of 11 modified HDAC8 peptides were identified from the avidin-agarose purifiedHDAC8-3-4 adduct based on peptide mapping using high resolution accurate massmeasurement (within 10 ppm) and peptide sequencing using MS/MS (Table 3). No modifiedpeptides were detected in the negative control using unmodified HDAC8 (data not shown).The amino acids underlined in Table 3 correspond to the residues modified by 3 based on MS/MS analysis. Due to occasional missed trypsin cleavage sites, which are common intrypsinization reactions, there are some amino acid sequence overlaps among several peptides.For example, entries 1 and 2 correspond to overlapping amino acid sequences 35-55 and 37-60,respectively. Also, due to the high reactivity of the photoaffinity ligand, several amino acidresidues became modified in entries # 3,4,6,10, and 11 (Table 3).
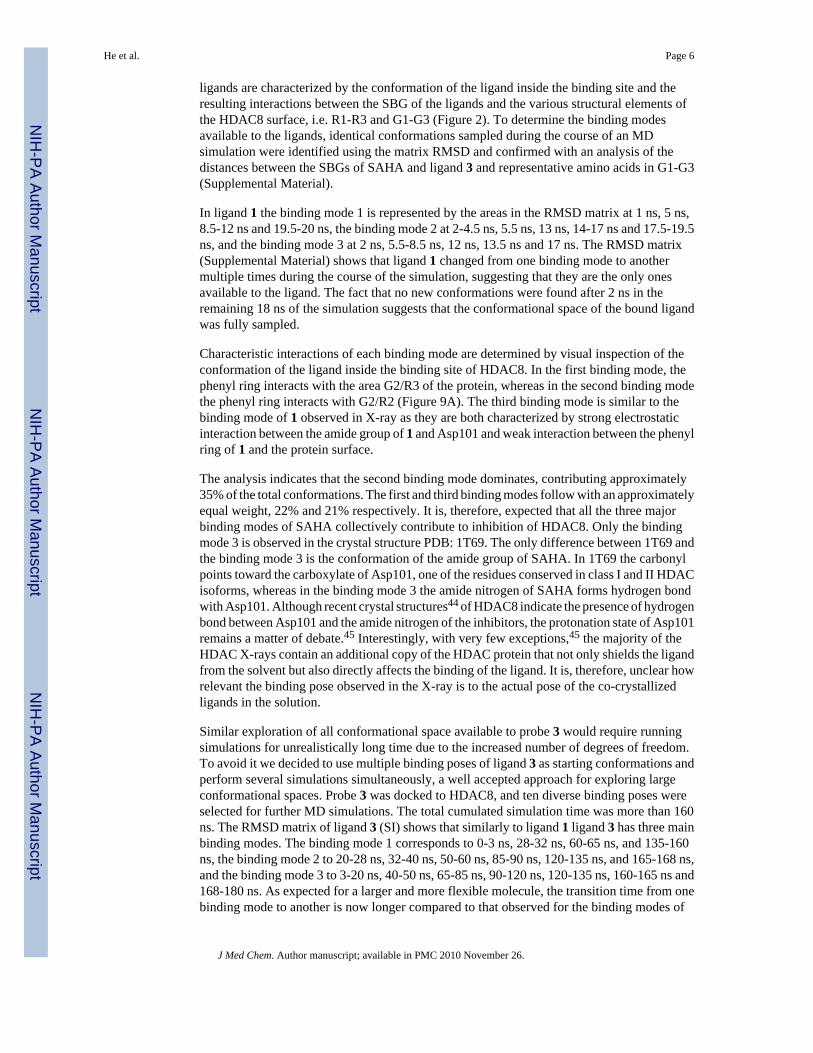
Among the sites modified by probe 3 (Table 3, Figure 8A), the two nearest to the binding siteamine acids located on the surface of the protein were Asp233 and Asp272. Asp272 maps to theR2/G1 region of HDAC8, and Asp233 neighbors with the R2/G2 (Figure 2). The two otherareas near the binding site corresponding to His142-His143 (entry #6, Table 3) and Ile135-Asn136-Trp137-Ser138 (entry #6, Table 3) are not on the surface of the protein. Photolabelingof these residues may be explained if the binding site of HDAC8 adopts a conformation similarto that found in 1T64 X-ray structure where the second molecule of TSA is bound upside down.43 The access to these residues in other crystal structures is blocked by the loop L1 (Figure 8B)that was shown to shift its position to accommodate the second molecule of TSA. If the loopL1 swings far enough it may expose the residues in entries #1-#6 for modification by the SBGof probe 3. The other labeled peptides correspond to sites on the outer periphery of HDAC8and were likely modified by excess unbound 3 upon activation by UV light. An analysis ofthese areas shows that they are either hydrophobic or in close proximity to hydrophobic areasand, thus, may participate in aggregation with probe 3.
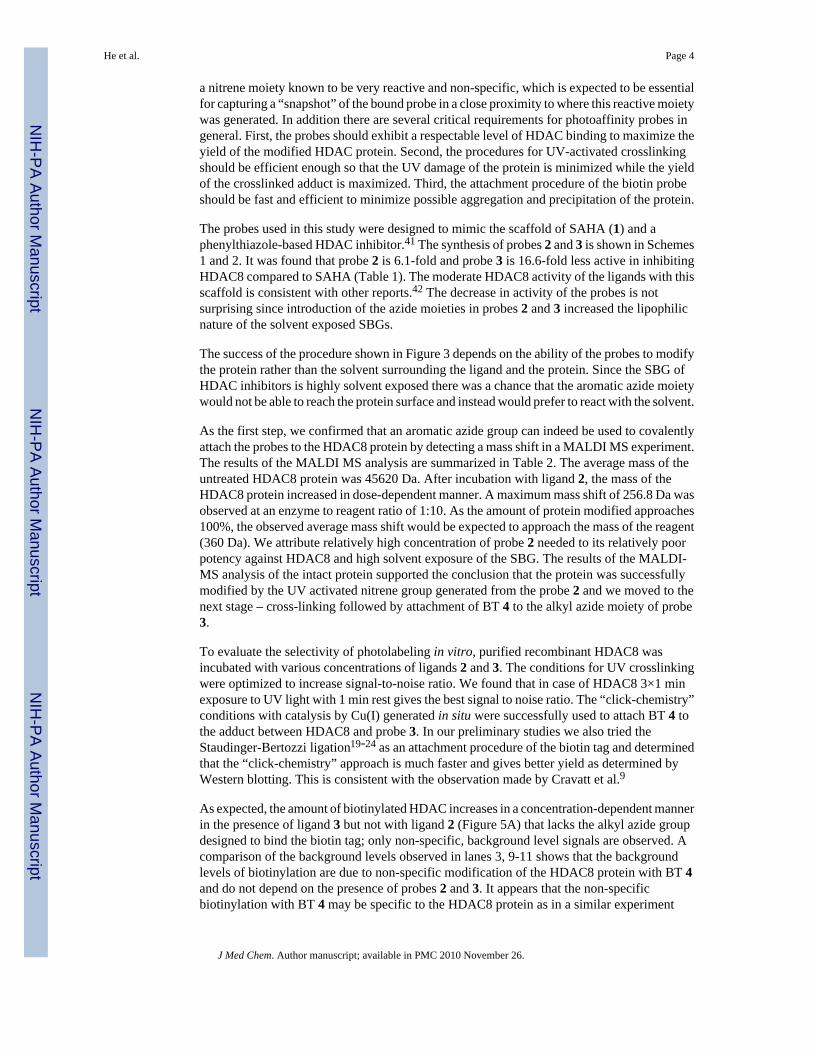
Modified Asp233 was contained in peptide GRYYSVNVPIQDGIQDEK (222-239), and theMS/MS spectrum of this modified peptide is shown in Figure 6. Based on Sequest proteomicsanalysis, the standard peptide fragment ions such as y6
+1 and a15+2 were identified, and manual
inspection of the data was used to identify additional fragment ions formed by side chainfragmentation of 3. By accounting for these side chain fragments, it was possible to identifyand assign the other peaks present in the MS/MS spectra.
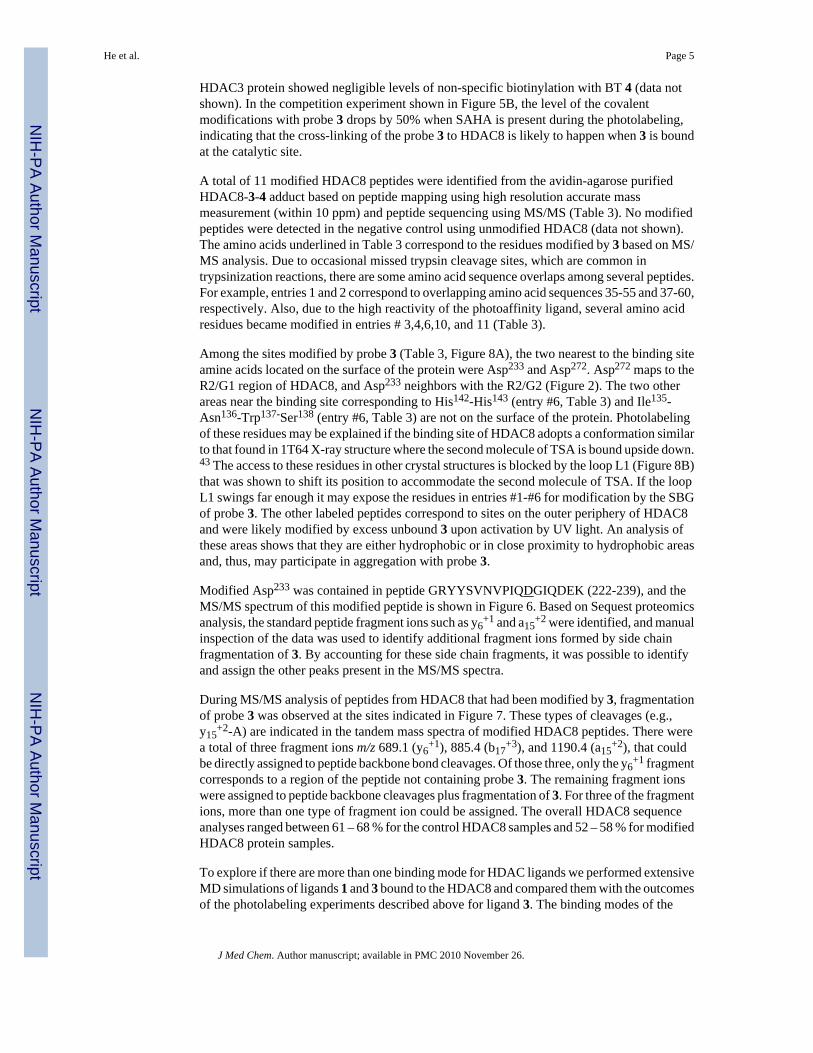
During MS/MS analysis of peptides from HDAC8 that had been modified by 3, fragmentationof probe 3 was observed at the sites indicated in Figure 7. These types of cleavages (e.g.,y15
+2-A) are indicated in the tandem mass spectra of modified HDAC8 peptides. There werea total of three fragment ions m/z 689.1 (y6
+1), 885.4 (b17+3), and 1190.4 (a15
+2), that couldbe directly assigned to peptide backbone bond cleavages. Of those three, only the y6
+1 fragmentcorresponds to a region of the peptide not containing probe 3. The remaining fragment ionswere assigned to peptide backbone cleavages plus fragmentation of 3. For three of the fragmentions, more than one type of fragment ion could be assigned. The overall HDAC8 sequenceanalyses ranged between 61 – 68 % for the control HDAC8 samples and 52 – 58 % for modifiedHDAC8 protein samples.
To explore if there are more than one binding mode for HDAC ligands we performed extensiveMD simulations of ligands 1 and 3 bound to the HDAC8 and compared them with the outcomesof the photolabeling experiments described above for ligand 3. The binding modes of the
He et al. Page 5
J Med Chem. Author manuscript; available in PMC 2010 November 26.
NIH
-PA Author Manuscript
NIH
-PA Author Manuscript
NIH
-PA Author Manuscript
ligands are characterized by the conformation of the ligand inside the binding site and theresulting interactions between the SBG of the ligands and the various structural elements ofthe HDAC8 surface, i.e. R1-R3 and G1-G3 (Figure 2). To determine the binding modesavailable to the ligands, identical conformations sampled during the course of an MDsimulation were identified using the matrix RMSD and confirmed with an analysis of thedistances between the SBGs of SAHA and ligand 3 and representative amino acids in G1-G3(Supplemental Material).
In ligand 1 the binding mode 1 is represented by the areas in the RMSD matrix at 1 ns, 5 ns,8.5-12 ns and 19.5-20 ns, the binding mode 2 at 2-4.5 ns, 5.5 ns, 13 ns, 14-17 ns and 17.5-19.5ns, and the binding mode 3 at 2 ns, 5.5-8.5 ns, 12 ns, 13.5 ns and 17 ns. The RMSD matrix(Supplemental Material) shows that ligand 1 changed from one binding mode to anothermultiple times during the course of the simulation, suggesting that they are the only onesavailable to the ligand. The fact that no new conformations were found after 2 ns in theremaining 18 ns of the simulation suggests that the conformational space of the bound ligandwas fully sampled.
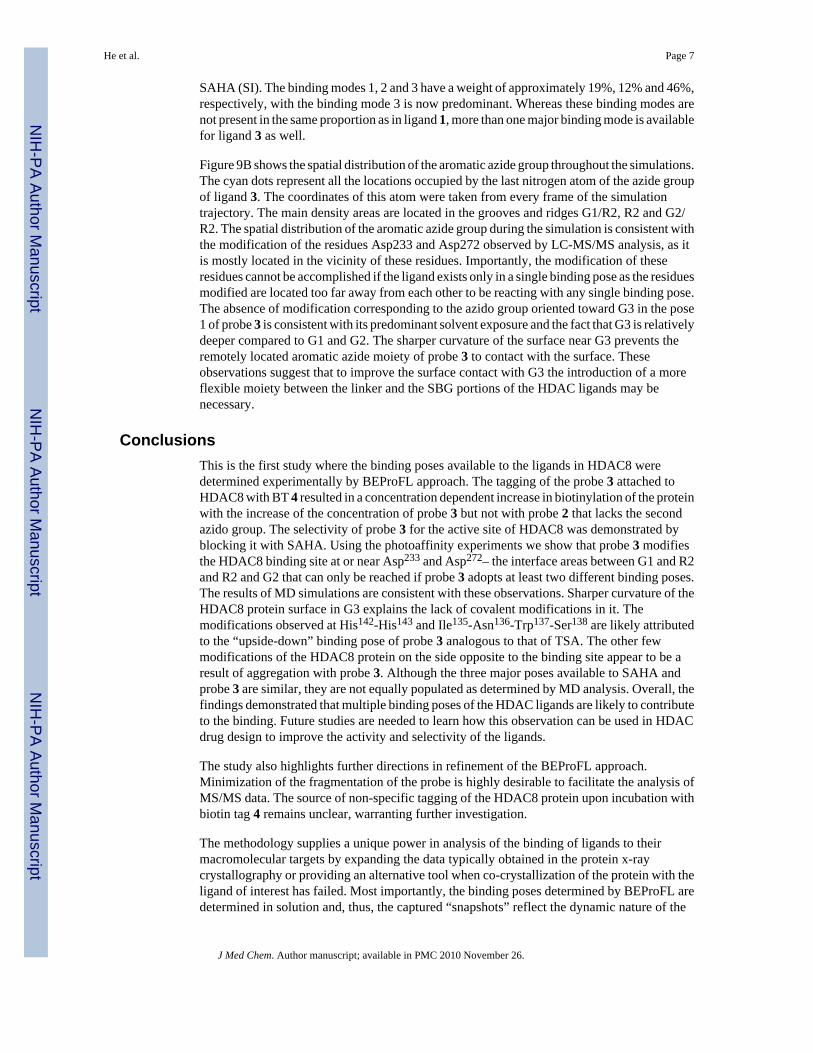
Characteristic interactions of each binding mode are determined by visual inspection of theconformation of the ligand inside the binding site of HDAC8. In the first binding mode, thephenyl ring interacts with the area G2/R3 of the protein, whereas in the second binding modethe phenyl ring interacts with G2/R2 (Figure 9A). The third binding mode is similar to thebinding mode of 1 observed in X-ray as they are both characterized by strong electrostaticinteraction between the amide group of 1 and Asp101 and weak interaction between the phenylring of 1 and the protein surface.
The analysis indicates that the second binding mode dominates, contributing approximately35% of the total conformations. The first and third binding modes follow with an approximatelyequal weight, 22% and 21% respectively. It is, therefore, expected that all the three majorbinding modes of SAHA collectively contribute to inhibition of HDAC8. Only the bindingmode 3 is observed in the crystal structure PDB: 1T69. The only difference between 1T69 andthe binding mode 3 is the conformation of the amide group of SAHA. In 1T69 the carbonylpoints toward the carboxylate of Asp101, one of the residues conserved in class I and II HDACisoforms, whereas in the binding mode 3 the amide nitrogen of SAHA forms hydrogen bondwith Asp101. Although recent crystal structures44 of HDAC8 indicate the presence of hydrogenbond between Asp101 and the amide nitrogen of the inhibitors, the protonation state of Asp101remains a matter of debate.45 Interestingly, with very few exceptions,45 the majority of theHDAC X-rays contain an additional copy of the HDAC protein that not only shields the ligandfrom the solvent but also directly affects the binding of the ligand. It is, therefore, unclear howrelevant the binding pose observed in the X-ray is to the actual pose of the co-crystallizedligands in the solution.
Similar exploration of all conformational space available to probe 3 would require runningsimulations for unrealistically long time due to the increased number of degrees of freedom.To avoid it we decided to use multiple binding poses of ligand 3 as starting conformations andperform several simulations simultaneously, a well accepted approach for exploring largeconformational spaces. Probe 3 was docked to HDAC8, and ten diverse binding poses wereselected for further MD simulations. The total cumulated simulation time was more than 160ns. The RMSD matrix of ligand 3 (SI) shows that similarly to ligand 1 ligand 3 has three mainbinding modes. The binding mode 1 corresponds to 0-3 ns, 28-32 ns, 60-65 ns, and 135-160ns, the binding mode 2 to 20-28 ns, 32-40 ns, 50-60 ns, 85-90 ns, 120-135 ns, and 165-168 ns,and the binding mode 3 to 3-20 ns, 40-50 ns, 65-85 ns, 90-120 ns, 120-135 ns, 160-165 ns and168-180 ns. As expected for a larger and more flexible molecule, the transition time from onebinding mode to another is now longer compared to that observed for the binding modes of
He et al. Page 6
J Med Chem. Author manuscript; available in PMC 2010 November 26.
NIH
-PA Author Manuscript
NIH
-PA Author Manuscript
NIH
-PA Author Manuscript
SAHA (SI). The binding modes 1, 2 and 3 have a weight of approximately 19%, 12% and 46%,respectively, with the binding mode 3 is now predominant. Whereas these binding modes arenot present in the same proportion as in ligand 1, more than one major binding mode is availablefor ligand 3 as well.
Figure 9B shows the spatial distribution of the aromatic azide group throughout the simulations.The cyan dots represent all the locations occupied by the last nitrogen atom of the azide groupof ligand 3. The coordinates of this atom were taken from every frame of the simulationtrajectory. The main density areas are located in the grooves and ridges G1/R2, R2 and G2/R2. The spatial distribution of the aromatic azide group during the simulation is consistent withthe modification of the residues Asp233 and Asp272 observed by LC-MS/MS analysis, as itis mostly located in the vicinity of these residues. Importantly, the modification of theseresidues cannot be accomplished if the ligand exists only in a single binding pose as the residuesmodified are located too far away from each other to be reacting with any single binding pose.The absence of modification corresponding to the azido group oriented toward G3 in the pose1 of probe 3 is consistent with its predominant solvent exposure and the fact that G3 is relativelydeeper compared to G1 and G2. The sharper curvature of the surface near G3 prevents theremotely located aromatic azide moiety of probe 3 to contact with the surface. Theseobservations suggest that to improve the surface contact with G3 the introduction of a moreflexible moiety between the linker and the SBG portions of the HDAC ligands may benecessary.
ConclusionsThis is the first study where the binding poses available to the ligands in HDAC8 weredetermined experimentally by BEProFL approach. The tagging of the probe 3 attached toHDAC8 with BT 4 resulted in a concentration dependent increase in biotinylation of the proteinwith the increase of the concentration of probe 3 but not with probe 2 that lacks the secondazido group. The selectivity of probe 3 for the active site of HDAC8 was demonstrated byblocking it with SAHA. Using the photoaffinity experiments we show that probe 3 modifiesthe HDAC8 binding site at or near Asp233 and Asp272– the interface areas between G1 and R2and R2 and G2 that can only be reached if probe 3 adopts at least two different binding poses.The results of MD simulations are consistent with these observations. Sharper curvature of theHDAC8 protein surface in G3 explains the lack of covalent modifications in it. Themodifications observed at His142-His143 and Ile135-Asn136-Trp137-Ser138 are likely attributedto the “upside-down” binding pose of probe 3 analogous to that of TSA. The other fewmodifications of the HDAC8 protein on the side opposite to the binding site appear to be aresult of aggregation with probe 3. Although the three major poses available to SAHA andprobe 3 are similar, they are not equally populated as determined by MD analysis. Overall, thefindings demonstrated that multiple binding poses of the HDAC ligands are likely to contributeto the binding. Future studies are needed to learn how this observation can be used in HDACdrug design to improve the activity and selectivity of the ligands.
The study also highlights further directions in refinement of the BEProFL approach.Minimization of the fragmentation of the probe is highly desirable to facilitate the analysis ofMS/MS data. The source of non-specific tagging of the HDAC8 protein upon incubation withbiotin tag 4 remains unclear, warranting further investigation.
The methodology supplies a unique power in analysis of the binding of ligands to theirmacromolecular targets by expanding the data typically obtained in the protein x-raycrystallography or providing an alternative tool when co-crystallization of the protein with theligand of interest has failed. Most importantly, the binding poses determined by BEProFL aredetermined in solution and, thus, the captured “snapshots” reflect the dynamic nature of the
He et al. Page 7
J Med Chem. Author manuscript; available in PMC 2010 November 26.
NIH
-PA Author Manuscript
NIH
-PA Author Manuscript
NIH
-PA Author Manuscript

ligand and its macromolecular target conformations. Extension of the BEProFL approach tostudy the binding poses of the ligands in cells is in progress in our laboratory. The approachhas the potential not only to guide ligand optimization but also to become a new tool indisciplines such as molecular modeling, development, validation and application of computer-aided drug design methods, especially those for rapid prediction of the protein-ligandinteractions such as docking and scoring.
Experimental ProceduresGeneral synthetic procedures
1H NMR and 13C NMR spectra were recorded on Bruker spectrometer at 300/400 MHz and75/100 MHz, respectively, with TMS as an internal standard. Standard abbreviations indicatingmultiplicity were used as follows: s = singlet, bs = broad singlet, d = doublet, t = triplet, q =quadruplet, and m = multiplet. HRMS experiment was performed on Q-TOF-2TM(Micromass). TLC was performed with Merck 60F254 silica gel plates. Columnchromatography was performed using Merck silica gel (40-60 mesh). Analytical HPLC wascarried out on an Ace 5AQ column (100 mm × 4.6 mm), with a Shimadzu 10 VP Series HPLCwith a diode array detector with detection at λ = 254 nm; Method A: H2O/MeCN (0.05% TFA),70/30 to 0/100 in 25 min, flow rate of 1.3 mL/min; Method B: H2O/MeCN (0.05% TFA), 90/10to 0/100 in 25 min, flow rate of 1.3 mL/min. The purity of compounds determined by HPLC(methods A, B) was ≥95% for all the synthesized compounds.
Synthesis of probes 2 and 37-[4-(3-Azido-phenyl)-thiazol-2-ylcarbamoyl]-heptanoic acid methyl ester (8)—To a solution of 7 (0.350 g, 0.96 mmol) in a 9:1 mixture of acetic acid and water (15 mL) wasadded NaNO2 (0.100 g, 1.45 mmol) at 0 °C and the mixture was stirred for 5 min. To this wasadded NaN3 (0.094 g, 1.45 mmol) at the same temperature and stirring was continued for 30min. To this was added saturated aqueous NaHCO3 solution followed by NaHCO3 powderuntil the mixture reached pH 7. The mixture was extracted with EtOAc and the combinedorganic extracts were washed with brine, dried (Na2SO4), filtered, and concentrated underreduced pressure to afford 8 (0.273 g, 73%); 1H NMR (400 MHz, CD3OD) δ 7.70 (d, J = 8.0Hz, 1H), 7.66 (s, 1H), 7.44 (s, 1H), 7.41 (t, J = 7.6 Hz, 1H), 7.00 (dd, J = 7.6, 1.6 Hz, 1H), 3.65(3H, s), 2.49 (t, J = 7.2 Hz, 2H), 2.34 (t, J = 7.6 Hz, 2H),1.73 (t, J = 7.2 Hz, 2H), 1.64 (t, J =6.8 Hz, 2H), 1.41(brs, 4H); 13C NMR (100 MHz, DMSO-d6): δ (ppm) 174.1, 170.2, 158.5,148.5, 146.7, 136.0, 130.2, 122.5, 122.5, 117.5, 116.7, 108.7, 51.5, 36.2, 33.9, 28.6, 24.6, 24.5.
Octanedioic acid [4-(3-azido-phenyl)-thiazol-2-yl]-amide hydroxyamide (2)—KOH (0.607 g, 10.85 mmol) was added at 40 °C for 10 min to a solution of hydroxylaminehydrochloride (0.753 g, 10.85 mmol) in MeOH. The reaction mixture was cooled to 0 °C andfiltered. Compound 8 (0.210 g, 0.54 mmol) was added to the filtrate followed by KOH (36 mg,0.65 mmol) at room temperature for 30 min and stirred for 4h. The reaction mixture wasextracted with EtOAc, and the organic layer was washed with a saturated NH4Cl aqueoussolution and brine, dried over Na2SO4, filtered, and concentrated. The crude solid was purifiedby preparative HPLC to give compound 2 (0.058 g, 28%); 1H NMR (400 MHz, DMSO-d6) δ(ppm) 12.25 (s, 1H), 10.32 (s, 1H), 8.64 (S, 1H), 7.74-7.62 (m, 3H), 7.05 (brs, 1H), 6.67 (brs,1H), 2.49 (m, 2H), 1.93 (m. 2H), 1.26 (m, 2H), 1.10 (brs, 4H); 13C NMR (100 MHz, DMSO-d6): δ (ppm) 172.0, 169.5, 158.4, 148.0, 140.3, 136.5, 130.8, 122.8, 118.8, 116.3, 109.5, 35.2,32.6, 25.4, 25.0; MS (ESI) m/z 389.1 [M+H]+; HRMS (ESI) calculated for[C17H20N6O3S1+H]+ 389.1390; found 389.1383.
7-(4-Benzyloxy-phenylcarbamoyl)-heptanoic acid methyl ester (9)—A stirringsolution of 4-Benzyloxyaniline hydrochloride (2.01 g, 10.10 mmol) and suberic acid
He et al. Page 8
J Med Chem. Author manuscript; available in PMC 2010 November 26.
NIH
-PA Author Manuscript
NIH
-PA Author Manuscript
NIH
-PA Author Manuscript
monomethyl ester 5 (1.90 g, 10.10 mmol) in dry pyridine (20 ml) was cooled to −15 °C andPOCl3 (1.2 mL, 13.13 mmol ) was added dropwise over 30 minutes and stirred for 12h at roomtemperature. The reaction mixture was diluted with EtOAc and washed thoroughly withsaturated KHSO4 solution and brine. The organic phase was dried over Na2SO4. The solventwas removed by rotary evaporation. The crude solid was washed with EtOAc to give compound9 (2.27 g, 61%); 1H NMR (400 MHz, CD3OD): δ 7.42-7.26 (m, 7H), 7.11 (s, 1H), 6.93 (d, J= 7.8 Hz, 2H), 5.22 (s, 2H), 3.66 (s, 3H), 2.34-2.31 (m, 4H), 1.77-1.71 (m, 2H), 1.70-1.62 (m,2H), 1.40-1.36 (m, 4H); 13C NMR (100 MHz, CD3OD): δ 174.2, 171.0, 155.5, 136.9, 131.3,128.5, 127.9, 127.4, 121.6, 115.2, 70.3, 51.5, 37.4, 33.9, 28.7, 28.7, 25.4, 24.6.
7-(4-Hydroxy-phenylcarbamoyl)-heptanoic acid methyl ester (10)—A suspensionof compound 9 (1.20 g, 3.24 mmol) and Pd/C (10% wt, 0.120 g) in MeOH (20 mL) was reactedunder hydrogen atmosphere at room temperature for 5h. The catalyst was removed by filtrationthrough a pad of celite. The solvent was evaporated. The crude material was purified by flashchromatography (EtOAc/hexane, 2:1) to give compound 10 (0.742 g, 81%); 1H NMR (400MHz, CD3OD): δ 7.31 (d, J = 8.8 Hz, 2H), 6.74 (d, J = 8.8 Hz, 2H), 3.65 (s, 3H), 2.34-2.31(m, 4H), 1.71-1.61 (m, 4H), 1.39-1.34 (m, 4H); 13C NMR (100 MHz, CD3OD) δ: 174.5, 172.8,153.9, 130.2, 121.9, 114.7, 50.5, 36.2, 33.2, 28.4, 25.4, 24.2.
7-[4-(3-Azido-5-azidomethyl-benzyloxy)-phenylcarbamoyl]-heptanoic acidmethyl ester (11)—To a solution of 12 (0.250 g, 0.886 mmol) and 7-(4-Hydroxy-phenylcarbamoyl)-heptanoic acid methyl ester 10 (0.247 g, 0.886 mmol) in dry acetone (8 mL)was added K2CO3 (0.367 g, 2.65 mmol) at ambient temperature, and the reaction mixture wasstirred at the same temperature for 12 h. The mixture was poured into water and extracted withEtOAc. The organic layer was washed with water three times, dried over Na2SO4, andevaporated in vacuo. The residue was purified by flash chromatography (EtOAc/hexane, 2:1)to afford 11 (0.272 g, 66%); 1H NMR (400 MHz, CDCl3): δ 7.43 (d, J = 8.8 Hz, 2H), 7.15 (s,1H), 7.11 (s, 1H), 7.08 (s, 1H), 6.92 (d, J = 9.2 Hz, 2H), 5.04 (s, 1H), 4.37 (s, 1H), 3.69 (s,3H), 2.36-2.31 (m, 4H), 1.74 (t, J = 8.0 Hz, 2H), 1.65 (t, J = 7.2 Hz, 2H), 1.40 (brs, 4H); 13CNMR (100 MHz, CDCl3): δ 174.2, 171.0155.0, 141.0, 139.8, 137.8, 131.6, 124.2, 123.1, 121.6,119.1, 118.7, 117.9, 117.5, 115.1, 69.3, 54.1, 51.4, 37.4, 33.9, 28.6, 25.3, 24.6.
Octanedioic acid [4-(3-azido-5-azidomethyl-benzyloxy)-phenyl]-amidehydroxyamide (3)—KOH (0.481 g, 8.60 mmol) was added at 40 °C for 10 min to a solutionof hydroxylamine hydrochloride (0.597 g, 8.60 mmol) in MeOH. The reaction mixture wascooled to 0 °C and filtered. Compound 11 (0.200 g, 0.43 mmol) was added to the filtratefollowed by KOH (28 mg, 0.51 mmol) at room temperature for 30 min and stirred for 4h. Thereaction mixture was extracted with EtOAc, and the organic layer was washed with a saturatedNH4Cl aqueous solution and brine, dried over Na2SO4, filtered, and concentrated. The crudesolid was purified by preparative HPLC to give compound 3 (0.080 g, 40%); 1H NMR (400MHz, DMSO-d6): δ 10.32 (s, 1H), 9.72 (s, 1H), 8.65 (s, 1H), 7.48 (d, J = 7.3 Hz, 2H), 7.26 (s,1H), 7.16 (s, 1H), 7.09 (s, 1H), 6.94 (d, J = 8.6 Hz, 2H), 5.09 (s, 1H), 4.50 (s, 1H), 2.24 (t, J =7.2 Hz, 2H), 1.93 (t, J = 7.0 Hz, 2H), 1.55-1.46 (m, 4H), 1.26 (brs, 4H); 13C NMR (100 MHz,DMSO-d6) δ 171.1, 169.52, 154.19, 140.48, 140.38, 138.56, 133.37, 124.36, 120.96, 118.61,118.0, 115.2, 68.9, 53.3, 36.6, 32.6, 28.8, 25.52, 25.47; MS (ESI) m/z 467.2 [M+H]+; HRMS(ESI) calculated for [C22H26N8O4+H]+ 467.2140; found 467.2149.
Biological materials—The HDAC8 fluorescent assay kit and the human recombinantHDAC8 protein were purchased from Biomol International (Plymouth Meeting, PA). Cellculture media MEM/EBSS, Ham's F12 as well as fetal bovine serum (FBS) and non-essentialamino acids (NEAA) were purchased from Hyclone (Logan, UT). Cell culture dishes werepurchased from BD Falcon (BD Biosciences, San Jose, CA). The primary anti-HDAC8
He et al. Page 9
J Med Chem. Author manuscript; available in PMC 2010 November 26.
NIH
-PA Author Manuscript
NIH
-PA Author Manuscript
NIH
-PA Author Manuscript
antibody was from Santa Cruz (Santa Cruz, CA) respectively. The anti-rabbit secondaryantibody conjugated to horse radish peroxidase (HRP) was from GE (Piscataway, NJ).Streptavidin and the colorimetric HRP substrate o-phenylenediamine (OPD) were from Pierce(Rockford, IL) and the 96-well plates from Nunc (Rochester, NY). Tris(2-carboxyethyl)phosphine) (TCEP) was from (Alfa Aesar chemicals, Ward Hill, MA), CuSO4, dimethylsulfoxide (DMSO), tris ((1-benzy l-1H-1,2,3- triazol-4-yl) methyl) amine (TBTA) and all otherchemicals were purchased from Sigma (St. Louis, MO) if not stated otherwise.
HDAC activity assay—The assay proceeded through a simple two-step procedure that canbe carried out in half-volume microtitration plates. The in vitro fluoro HDAC assay wasperformed in HDAC assay buffer (25 mM Tris (PH 8.0), 137 mM NaCl, 2.7 mM KCl, 1 mMMgCl2) supplemented with 0.5 mg/mL BSA. After 30 min, 50 μL of developer, supplementedwith 5 μM Trichostatin A to inactivate the enzyme were added. The fluorescence intensity wasmeasured at λexcit = 360 nm and λemis = 460 nm using a POLARStar Optima microtitrationplate reader (BMG Labtech, Durham, NC). The IC50 values were determined using theGraphPad Prism 5 software and KI were calculated using Cheng-Prusoff equation46 and aKm for the substrate equal to 222μM for HDAC8.
Visualization of probe 3 attached to HDAC 8 using biotinylated tag 4—Purifiedrecombinant human HDAC8 (0.5 μg in 5 μL of assay buffer) was incubated with variousconcentrations of compounds 2, 3 and SAHA for three hours in the dark, after which theformation of a covalent bond between the azide group present in the ligand and reactive sidechains of the HDAC was initiated by UV irradiation (λ = 254 nm) for 3×1 min with 1 min rest.Then “click chemistry” was used to attach BT 4 to probe 3 attached covalently to the protein.The biotin tag 4 was added to all the tubes at a final concentration of 50 μM, and the chemicalreaction was initiated by addition of TCEP (0.5 mM final concentration), TBTA 0.1 mM ) andCuSO4 (1 mM). After 90 min incubation at room temperature, protein samples were analyzedby SDS-PAGE and western blot using an anti-biotin primary antibody, streptavidin conjugatedto horse radish peroxidase (Pierce (Rockford, IL) and ECL (Pierce (Rockford, IL). Themembranes were then stripped in 0.2M glycine, pH 2.6 for 10 minutes, then in 0.2M glycine,pH 2.3 for another 10 minutes before being reblocked and redecorated with an anti-HDACprimary antibody and an anti-rabbit-HRP secondary antibody.
Western Blotting—Western blot was performed using 10 μg of total protein from cell lysateor 0.5 μg of purified protein with 5· loading buffer containing 10% SDS, 0.05% bromophenolblue, 50% glycerol and β-mercaptoethanol, protein samples were boiled for 5 min and allowedto cool before loading on a denaturing 10% polyacrylamide gel electrophoresis (SDS-PAGE).After electrophoresis, protein was transferred to a polyvinylidiene difluoride membrane(Imobilon-Millipore, Bedford, MA, USA). The membrane was incubated for 1 h with 1%Albumin Fraction V (USB, OH, USA) and washed three times with 1× phosphate buffer salinesupplemented with 0.05% of Tween 20 (PBS-T). The membrane was then incubated with ananti-HDAC8 antibody (1:3000) for 2 h under room temperature with slight agitation. Afterthree washes in PBS-T, the membranes were incubated with a secondary antibody anti-rabbit-HRP for 1 h at room temperature. The signals were detected using the enhancedchemiluminescence (ECL) kit from Pierce (Pierce Biotechnology, Rockford, IL, USA).Densitometry scanning of the films was performed using the ImageJ software provided byNIH.47, 48 Data obtained from at least three independent experiments are presented as the meanof the relative intensity of the biotinylated bands over the total immunoreactive HDAC bands+/− standard deviation (SD).
MALDI-ToF MS Analysis of intact HDAC8 protein—The samples were purified andconcentrated using Centricon 10,000 molecular weight cutoff filter filters (Millipore)
He et al. Page 10
J Med Chem. Author manuscript; available in PMC 2010 November 26.
NIH
-PA Author Manuscript
NIH
-PA Author Manuscript
NIH
-PA Author Manuscript
according to the manufacturer's instructions. Prior to use, the filters were washed three timeswith 400 μL of 50 mM ammonium bicarbonate, pH 7.8. Aliquots of 25 μL of each HDAC8sample were then diluted to a total volume of 250 μL with the ammonium bicarbonate bufferand applied to the pre-rinsed filters. The samples were centrifuged at 13,500×g at 4 °C for 60min. After centrifugation, the filter was transferred to a second 1.5 mL microcentrifuge tubeinverted and centrifuged at 1000×g for 6 min. The recovered protein (approx 3 - 5 μL) wasmixed with 3 μL of MALDI matrix and spotted on a MALDI plate for analysis. The MALDImatrix was saturated with sinapinic acid in 50:50 (v/v) H2O/ACN + 0.1% TFA. Positive ionMALDI mass spectra were acquired using an Applied Biosystems Voyager DE Pro MALDI-ToF MS.
Tryptic digestion of HDAC8 and modified HDAC8—HDAC8 (~10 μg) was incubatedwith the five equivalents of probe 3, irradiated with UV light to activate the probe, and taggedwith BT 4. Next, the modified protein was purified using avidin-agarose chromatographyUnmodified HDAC8 was used as a negative control. Each sample of modified or unmodifiedHDAC8 was diluted to a final volume of 100 μL with an aqueous buffer containing 50 mMammonium bicarbonate (AMBIC) and 1 mM TCEP (pH 7.8). Prior to digestion, all sampleswere tested to ensure that their pH was between 7.0 and 8.0. Control samples containing 10μg of HDAC8 were treated with 200 ng of sequence grade modified trypsin (Promega) whilethe modified HDAC8 samples (≤10 μg each) were treated with 100 mg of trypsin. Digestionswere carried out for 15 h and then analyzed using LC-MS/MS.
1-D LC-MS/MS Analysis of Tryptic Digests—Tryptic digests were analyzed using anUltimate 3000 capillary HPLC system (Dionex) interfaced with a LTQ-FT hybrid linear iontrap FT ICR mass spectrometer (Thermo-Fisher Scientific) that was operated using positiveion nanoelectrospray with data-dependent MS/MS. The resolving power of the FT ICR massspectrometer was ~100,000. Charge state screening was used to exclude singly charged ions.Samples were diluted to a concentration of ~0.1 pmol/μL of total protein using 50 mM AMBIC.The LC-MS/MS injection volume was 5 μL. The mobile phases consisted of A: 95/5 (v/v)H2O/CH3CN + 0.1% formic acid and B: 5/95 (v/v) H2O/CH3CN + 0.1% formic acid. Thetrapping column (0.3 mm i.d. × 5 mm Dionex C18 PepMap column) was operated at a flowrate of 15 μL/min using 100% solvent A during sample loading. The analytical column (75μm × 150 mm Agilent Zorbax 300-SB C18 column) was used to separate the peptide digestsof HDAC and modified HDAC was operated at a flow rate of 190 nL/min and was equippedwith a PEEK sleeve fitting containing a 75 μm i.d. pulled fused silica nanoelectrospray emitter(New Objective) with a tip i.d. of 15 μm. An 85 min linear gradient was used from 3 to 95%solvent B followed by a 10 min re-equilibration prior to the next analysis. Following LC-MS/MS analysis, the data were searched using SEQUEST (Bio Works 3.2) proteomics software.
Graphics—The protein surface in Figure 2 is rendered in Vida3.0.49 The images in Figures8 and 9 were rendered in Chimera.50
Molecular Dynamics Simulations—Molecular Dynamics Simulations were performedusing the Gromacs software package (version 3.3.1) 29-32, the Amber03 force field 33 and theGeneral Amber force field (GAFF) 35, 36 together with AM1BCC charges 38, 39. The structureof HDAC8 and the starting conformation of SAHA were taken from the x-ray structure ofHDAC8 forming a complex with SAHA (pdb structure 1T69). Since no crystal structure isavailable for ligand 3, the starting structures were obtained from the docking of ligand 3 toHDAC8 using the docking software Gold 3.2.40 TIP3P explicit solvent was used 51. Allsimulations were run in a dodecahedral box containing approximately 9100 water molecules.The bonds of the protein and ligands were constrained using the LINCS algorithm 52 while thebonds and angle of the water molecules were constrained using the SETTLE algorithm 53. A
He et al. Page 11
J Med Chem. Author manuscript; available in PMC 2010 November 26.
NIH
-PA Author Manuscript
NIH
-PA Author Manuscript
NIH
-PA Author Manuscript
time step of 2 fs was used for integrating the equations of motion. The system was simulatedin an NTP ensemble at a fixed temperature of 300 K and a fixed pressure of 1 bar. Temperaturewas kept constant using a Berendsen thermostat 54 with a coupling time of 0.1 ps and pressurewas controlled by a weak coupling to a reference pressure 55 with a coupling time of 1 ps andan isothermal compressibility of 4.6 10−5 bar−1. Long-range coulombic interactions wereevaluated using Particle Mesh Ewald (PME) algorithm 56 with an interpolation order of 4 andFourier spacing of 1.2 Å. The system was energy minimized and then equilibrated for 200 psin total. Finally the simulations were run for 20 ns each.
Root Mean Square Deviation (RMSD) matrices of the ligands were built for each simulationtrajectory by calculating the RMSD of each structure of the ligand with all other structures ofthe same ligand in the trajectory. All protein structures in the trajectory were aligned using theleast square fitting of the protein backbone. The final RMSD calculations of the ligands wereperformed on their heavy atoms using the atoms corresponding to the scaffold of SAHA.
Any two conformations of a ligand were considered different if their RMSD was more than 2Å. By using this cut-off value as a similarity criterion for the RMSD between twoconformations, identical conformations were identified and represented by a white point onthe matrix, whereas different conformations were represented by a black point. As aconsequence a white block on the matrix diagonal represents a group of identical conformationsand a white block off diagonal indicates that the corresponding two groups on the diagonalcontain identical conformations. By using this technique different sets of identicalconformations corresponding to the different binding modes of the ligand can be readilyidentified. The (RMSD) matrices of the ensemble of conformations sampled for ligands 1 and3 are shown in the Supplemental material.
The binding modes of 1 and 3 determined using the RMSD matrix were confirmed bymonitoring characteristic distances between the interacting groups. The residues were selectedin such a way that a distance less than 5 Å between the center of mass of the phenyl ring of 1and Phe208 would indicate that ligand 1 is in G2/R3. Similarly a distance less than 5 Å betweenthe center of mass of the phenyl ring of 1 and the center of mass of Met274 would be indicativeof ligand 1 in G2/R2, a distance less than 5 Å between the amide NH of the SBG and the centerof mass of Asp101 would be indicative of ligand 1 near R1. The same distance characteristicsof the three binding modes of 1 have been monitored for 3. The results of this analysis areshown in the supplemental material.
Supplementary MaterialRefer to Web version on PubMed Central for supplementary material.
AcknowledgmentsThis study was in part funded by the Breast Cancer Congressionally Directed Research Program of Department ofDefense Idea Award BC051554 and by the National Cancer Institute/NIH grant 1R01 CA131970-01A1. We also thankChicago Biomedical Consortium and Searle family for the support of FT ICR MS and the National Center for ResearchResources/NIH grant 1S10 RR14686 for the MALDI ToF mass spectrometer. Molecular graphics images wereproduced using the UCSF Chimera package from the Resource for Biocomputing, Visualization, and Informatics atthe University of California, San Francisco (supported by NIH P41 RR-01081) and OpenEye Scientific Software,Santa Fe, NM.
AbbreviationsHDAC, histone deacetylase; BEProFL, (B)inding (E)nsemble (Pro)filing with (F)photoaffinity(L)abeling; BT, biotin tag; ArN3, aromatic azide group; AlkN3, aliphatic azide group; ZBG,
He et al. Page 12
J Med Chem. Author manuscript; available in PMC 2010 November 26.
NIH
-PA Author Manuscript
NIH
-PA Author Manuscript
NIH
-PA Author Manuscript
zinc binding group; SBG, surface binding group; linker, a portion of the molecule connectingthe ZBG and SBG; SAHA, suberoyl anilide hydroxamic acid; TSA, Trichostatin A.
References1. Korner M, Tibes U. Histone deacetylase inhibitors: a novel class of anti-cancer agents on its way to
the market. Prog. Med. Chem 2008;46:205–280. [PubMed: 18381127]2. Marks PA, Richon VM, Rifkind RA. Histone deacetylase inhibitors: inducers of differentiation or
apoptosis of transformed cells. J. Natl. Cancer Inst 2000;92:1210–1216. [PubMed: 10922406]3. de Ruijter AJ, van Gennip AH, Caron HN, Kemp S, van Kuilenburg AB. Histone deacetylases
(HDACs): characterization of the classical HDAC family. Biochem. J 2003;370:737–749. [PubMed:12429021]
4. Hahnen E, Hauke J, Trankle C, Eyupoglu IY, Wirth B, Blumcke I. Histone deacetylase inhibitors:possible implications for neurodegenerative disorders. Expert Opin. Investig. Drugs 2008;17:169–184.
5. Wang DF, Helquist P, Wiech NL, Wiest O. Toward selective histone deacetylase inhibitor design:Homology modeling, docking studies, and molecular dynamics simulations of human class I histonedeacetylases. J. Med. Chem 2005;48:6936–6947. [PubMed: 16250652]
6. Nielsen, PE. Photochemical Probes in Biochemistry. Vol. 272. Kluwer Academic Publishers;Dordrecht / Boston / London: 1989.
7. Rajagopalan K, Watt DS, Haley BE. Orientation of GTP and ADP within their respective binding sitesin glutamate dehydrogenase. Eur. J. Biochem 1999;265:564–571. [PubMed: 10504387]
8. Olcott MC, Bradley ML, Haley BE. Photoaffinity labeling of creatine kinase with 2-azido- and 8-azidoadenosine triphosphate: identification of two peptides from the ATP-binding domain.Biochemistry 1994;33:11935–11941. [PubMed: 7918412]
9. Speers AE, Adam GC, Cravatt BF. Activity-based protein profiling in vivo using a copper(i)-catalyzedazide-alkyne [3 + 2] cycloaddition. J. Am. Chem. Soc 2003;125:4686–4687. [PubMed: 12696868]
10. Adam GC, Burbaum J, Kozarich JW, Patricelli MP, Cravatt BF. Mapping enzyme active sites incomplex proteomes. J. Am. Chem. Soc 2004;126:1363–1368. [PubMed: 14759193]
11. Sieber SA, Mondala TS, Head SR, Cravatt BF. Microarray platform for profiling enzyme activitiesin complex proteomes. J. Am. Chem. Soc 2004;126:15640–15641. [PubMed: 15571375]
12. Speers AE, Cravatt BF. A tandem orthogonal proteolysis strategy for high-content chemicalproteomics. J. Am. Chem. Soc 2005;127:10018–10019. [PubMed: 16011363]
13. Hanson SR, Hsu TL, Weerapana E, Kishikawa K, Simon GM, Cravatt BF, Wong CH. Tailoredglycoproteomics and glycan site mapping using saccharide-selective bioorthogonal probes. J. Am.Chem. Soc 2007;129:7266–7267. [PubMed: 17506567]
14. Li W, Blankman JL, Cravatt BF. A functional proteomic strategy to discover inhibitors foruncharacterized hydrolases. J. Am. Chem. Soc 2007;129:9594–9595. [PubMed: 17629278]
15. Salisbury CM, Cravatt BF. Activity-based probes for proteomic profiling of histone deacetylasecomplexes. Proc. Natl. Acad. Sci. U. S. A 2007;104:1171–1176. [PubMed: 17227860]
16. Hosoya T, Hiramatsu T, Ikemoto T, Nakanishi M, Aoyama H, Hosoya A, Iwata T, Maruyama K,Endo M, Suzuki M. Novel bifunctional probe for radioisotope-free photoaffinity labeling: compactstructure comprised of photospecific ligand ligation and detectable tag anchoring units. Org. Biomol.Chem 2004;2:637–641. [PubMed: 14985799]
17. Sun P, Wang GX, Furuta K, Suzuki M. Synthesis of a bis-azido analogue of acromelic acid forradioisotope-free photoaffinity labeling and biochemical studies. Bioorg. Med. Chem. Lett2006;16:2433–2436. [PubMed: 16480870]
18. Hosoya T, Hiramatsu T, Ikemoto T, Aoyama H, Ohmae T, Endo M, Suzuki M. Design of dantrolene-derived probes for radioisotope-free photoaffinity labeling of proteins involved in the physiologicalCa2+ release from sarcoplasmic reticulum of skeletal muscle. Bioorg. Med. Chem. Lett2005;15:1289–1294. [PubMed: 15713372]
19. Saxon E, Armstrong JI, Bertozzi CR. A “traceless” Staudinger ligation for the chemoselectivesynthesis of amide bonds. Org. Lett 2000;2:2141–2143. [PubMed: 10891251]
20. Saxon E, Bertozzi CR. Cell surface engineering by a modified Staudinger reaction. Science2000;287:2007–2010. [PubMed: 10720325]
He et al. Page 13
J Med Chem. Author manuscript; available in PMC 2010 November 26.
NIH
-PA Author Manuscript
NIH
-PA Author Manuscript
NIH
-PA Author Manuscript
21. Kiick KL, Saxon E, Tirrell DA, Bertozzi CR. Incorporation of azides into recombinant proteins forchemoselective modification by the Staudinger ligation. Proc. Natl. Acad. Sci. U. S. A 2002;99(1):19–24. [PubMed: 11752401]
22. Saxon E, Luchansky SJ, Hang HC, Yu C, Lee SC, Bertozzi CR. Investigating cellular metabolism ofsynthetic azidosugars with the Staudinger ligation. J. Am. Chem. Soc 2002;124:14893–14902.[PubMed: 12475330]
23. Vocadlo DJ, Hang HC, Kim EJ, Hanover JA, Bertozzi CR. A chemical approach for identifying O-GlcNAc-modified proteins in cells. Proc. Natl. Acad. Sci. U. S. A 2003;100:9116–9121. [PubMed:12874386]
24. Vocadlo DJ, Bertozzi CR. A strategy for functional proteomic analysis of glycosidase activity fromcell lysates. Angew. Chem. Int. Ed. Engl 2004;43:5338–5342. [PubMed: 15468183]
25. Al-Mawsawi LQ, Fikkert V, Dayam R, Witvrouw M, Burke TR Jr. Borchers CH, Neamati N.Discovery of a small-molecule HIV-1 integrase inhibitor-binding site. Proc. Natl. Acad. Sci. U. S.A 2006;103:10080–10085. [PubMed: 16785440]
26. Kozikowski AP, Chen Y, Gaysin A, Chen B, D'Annibale MA, Suto CM, C LB. Functional differencesin epigenetic modulators-superiority of mercaptoacetamide based-HDAC inhibitors relative tohydroxamates in cortical neuron neuroprotection studies. J. Med. Chem 2007;50:3054–3061.[PubMed: 17539623]
27. Hosoya T, Hiramatsu T, Ikemoto T, Aoyama H, Ohmae T, Endo M, Suzuki M. Design of dantrolene-derived probes for radioisotope-free photoaffinity labeling of proteins involved in the physiologicalCa2+ release from sarcoplasmic reticulum of skeletal muscle. Bioorg. Med. Chem. Lett2005;15:1289–1294. [PubMed: 15713372]
28. Lin PC, Ueng SH, Yu SC, Jan MD, Adak AK, Yu CC, Lin CC. Surface Modification of MagneticNanoparticle via Cu(I)-Catalyzed Alkyne-azide [2+3] Cycloaddition. Org. Lett 2007;9:2131–2134.[PubMed: 17477538]
29. Berendsen HJC, van der Spoel D, van Drunen R. GROMACS: A message-passing parallel moleculardynamics implementation. Comp. Phys. Comm 1995;91:43–56.
30. Lindal E, Hess B, van der Spoel D. GROMACS 3.0: A package for molecular simulation and trajectoryanalysis. J. Mol. Mod 2001;7:306–317.
31. Van Der Spoel, D.; Van Buuren, AR.; Apol, E.; Meulenhoff, PJ.; Tieleman, DP.; Sijbers, ALTM.;Hess, B.; Feenstra, KA.; Lindahl, E.; Drunen, R. v.; Berendsen, HJC. Gromacs User Manual version3.0. In Nijenborgh 4, 9747 AG Groningen. The Netherlands: 2001. Internet:http://www.gromacs.org
32. Van Der Spoel D, Lindahl E, Hess B, Groenhof G, Mark AE. GROMACS: Fast, flexible and free. J.Comput. Chem 2005;26:1701–1718. [PubMed: 16211538]
33. Cornell WD, Cieplak P, Barly CI, Gould IR, Merz KM, Ferguson DM, Spellmeyer DC, Fox T,Caldwell JW, Kollman PA. A Second Generation Force Field for the simulation of proteins, nucleicacids, and organic molecules. J. Am. Chem. Soc 1995;117:5179–5197.
34. Sorin EJ, Rhee YM, Pande VS. Does water play a structural role in the folding of small nucleic acids?Biophys. J 2005;88:2516–2524. [PubMed: 15681648]
35. Wang J, Wolf RM, Caldwell JW, Kollman PA, Case DA. Development and testing of a general amberforce field. J. Comput. Chem 2004;25:1157–1174. [PubMed: 15116359]
36. Wang J, Wang W, Kollman PA, Case DA. Automatic atom type and bond type perception in molecularmechanical calculations. J. Mol. Graph. Model 2006;25:247–260. [PubMed: 16458552]
37. Pieffet G, Petukhov PA. Parameterization of aromatic azido groups: application as photoaffinityprobes in molecular dynamics studies. J. Mol. Model 2009;15:1291–1297. [PubMed: 19288146]
38. Jakalian A, Bush BL, Jack DB, Bayly CI. Fast, Efficient Generation of High-Quality Atomic Charges.AM1-BCC Model: I: Method. J. Comput. Chem 2000;21:132–146.
39. Jakalian A, Jack DB, Bayly CI. Fast, Efficient Generation of High-Quality Atomic Charges. AM1-BCC Model: II: Parameterization and Validation. J. Comput. Chem 2002;23:1623–1641. [PubMed:12395429]
40. Jones G, Willett P, Glen RC, Leach AR, Taylor R. Development and validation of a genetic algorithmfor flexible docking. J. Mol. Bio 1997;267:727–748. [PubMed: 9126849]
He et al. Page 14
J Med Chem. Author manuscript; available in PMC 2010 November 26.
NIH
-PA Author Manuscript
NIH
-PA Author Manuscript
NIH
-PA Author Manuscript
41. Suzuki T, Kouketsu A, Matsuura A, Kohara A, Ninomiya S, Kohda K, Miyata N. Thiol-based SAHAanalogues as potent histone deacetylase inhibitors. Bioorg. Med. Chem. Lett 2004;14:3313–3317.[PubMed: 15149697]
42. Chen Y, Lopez-Sanchez M, Savoy DN, Billadeau DD, Dow GS, Kozikowski AP. A series of potentand selective, triazolylphenyl-based histone deacetylases inhibitors with activity against pancreaticcancer cells and Plasmodium falciparum. J. Med. Chem 2008;51:3437–3448. [PubMed: 18494463]
43. Somoza JR, Skene RJ, Katz BA, Mol C, Ho JD, Jennings AJ, Luong C, Arvai A, Buggy JJ, Chi E,Tang J, Sang BC, Verner E, Wynands R, Leahy EM, Dougan DR, Snell G, Navre M, Knuth MW,Swanson RV, McRee DE, Tari LW. Structural snapshots of human HDAC8 provide insights into theclass I histone deacetylases. Structure (Camb) 2004;12:1325–1334. [PubMed: 15242608]
44. Vannini A, Volpari C, Gallinari P, Jones P, Mattu M, Carfi A, De Francesco R, Steinkuhler C, DiMarco S. Substrate binding to histone deacetylases as shown by the crystal structure of the HDAC8-substrate complex. Embo. Rep 2007;8:879–884. [PubMed: 17721440]
45. Dowling DP, Gantt SL, Gattis SG, Fierke CA, Christianson DW. Structural studies of human histonedeacetylase 8 and its site-specific variants complexed with substrate and inhibitors. Biochemistry2008;47:13554–13563. [PubMed: 19053282]
46. Cheng YC, Prusoff WH. Relationship between the inhibition constant (Ki) and the concentration ofinhibitor which causes 50% inhibition (IC50) of an enzymatic reaction. Biochem. Pharmacol1973;22:3099–3108. [PubMed: 4202581]
47. Girish V, Vijayalakshmi A. Affordable image analysis using NIH Image/ImageJ. Indian J. Cancer2004;41:47. [PubMed: 15105580]
48. Eliceiri KW, Rueden C. Tools for visualizing multidimensional images from living specimens.Photochem. Photobio 2005;81:1116–1122.
49. Vida, 3.0; Openeye Scientific Software LLC. Santa Fe, NM: 2008.50. Pettersen EF, Goddard TD, Huang CC, Couch GS, Greenblatt DM, Meng EC, Ferrin TE. UCSF
Chimera--a visualization system for exploratory research and analysis. J. Comput. Chem2004;25:1605–1612. [PubMed: 15264254]
51. Jorgensen WL, Chandrasekhar J, Madura JD, Impey RW, Klein ML. Comparison of simple potentialfunctions for simulating liquid water. J. Chem. Phys 1983;79:926–935.
52. Hess B, Bekker H, Berendsen HJC, Fraaije JGEM. LINCS: A Linear Constraint Solver for MolecularSimulations. J. Comput. Chem 1997;18:1463–1472.
53. Miyamoto S, Kollman PA. SETTLE: An Analytical Version of the SHAKE and RATTLE Algorithmsfor Rigid Water Models. J. Comput. Chem 1992;13:952–962.
54. Berendsen HJC, Postma JPM, van Gunsteren WF, DiNola A, Haak JR. Molecular dynamics withcoupling to an external bath. J. Chem. Phys 1984;81:3684–3690.
55. Hoover, WG., editor. In Molecular-Dynamics Simulations of Statistical-Mechanical Systems. North-Holland; Amsterdam: 1986. Amsterdam, 1986
56. Darden T, York D, Pedersen L. Particle mesh Ewald: An N-log(N) method for Ewald sums in largesystems. J. Chem. Phys 1993;98:10089–10092.
He et al. Page 15
J Med Chem. Author manuscript; available in PMC 2010 November 26.
NIH
-PA Author Manuscript
NIH
-PA Author Manuscript
NIH
-PA Author Manuscript
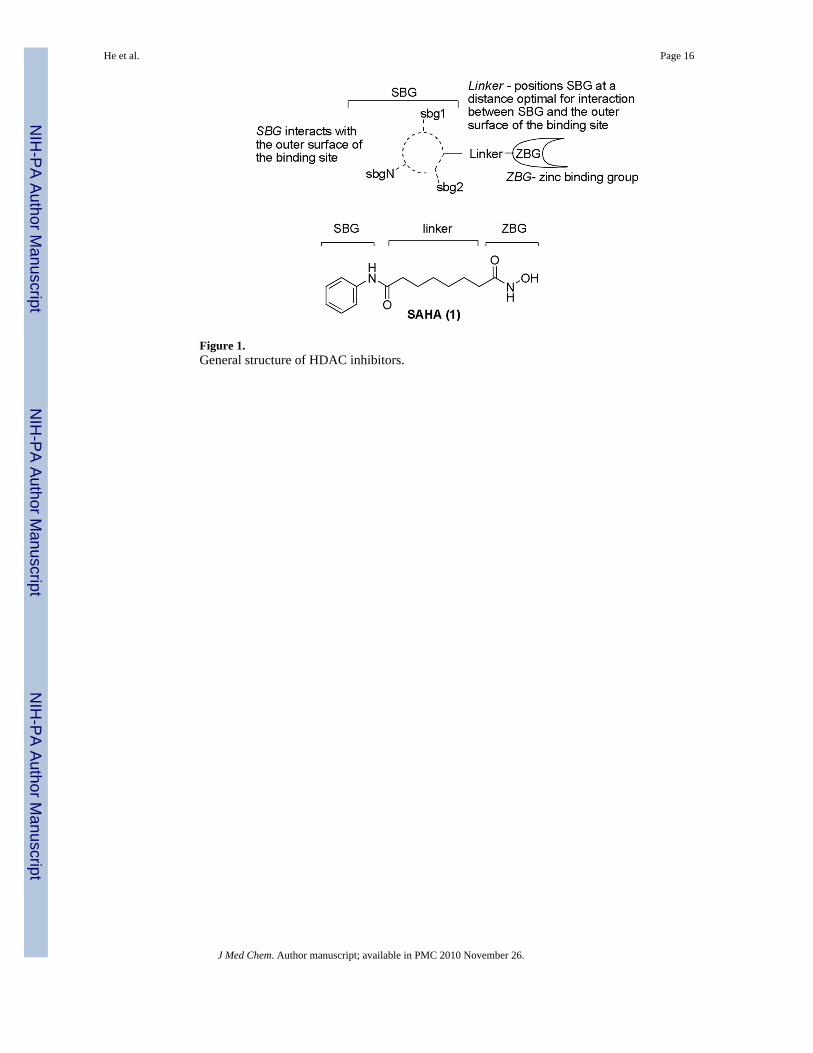
Figure 1.General structure of HDAC inhibitors.
He et al. Page 16
J Med Chem. Author manuscript; available in PMC 2010 November 26.
NIH
-PA Author Manuscript
NIH
-PA Author Manuscript
NIH
-PA Author Manuscript
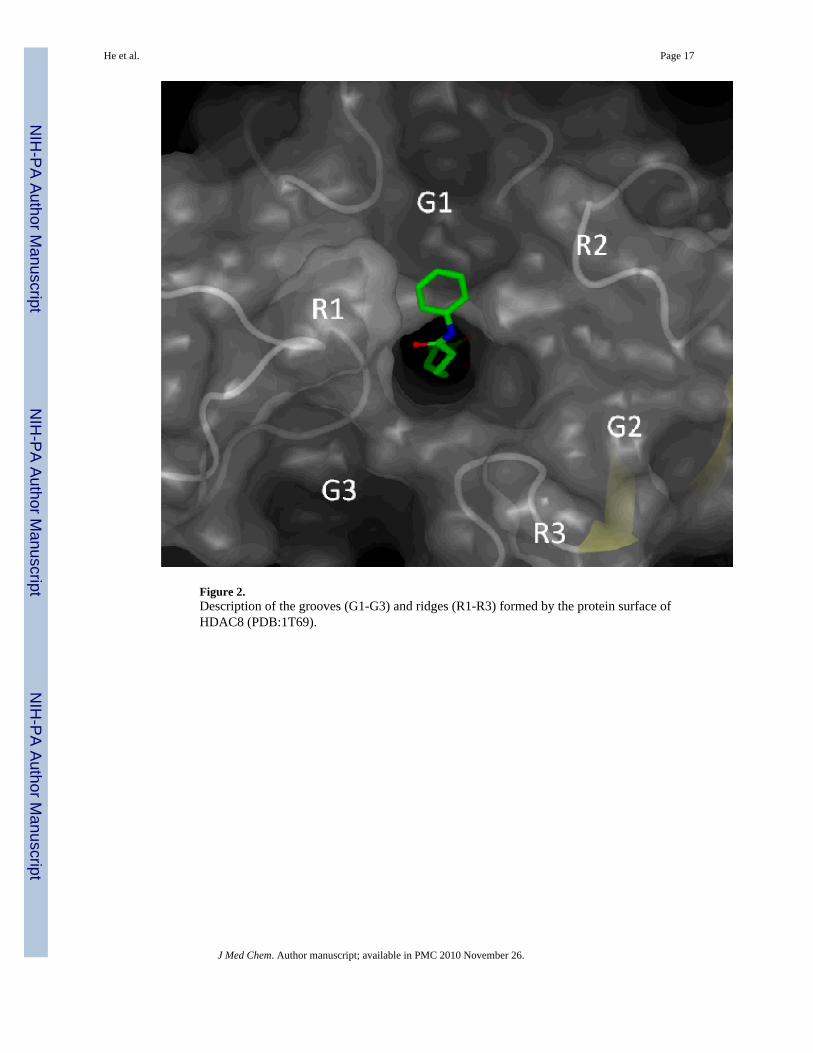
Figure 2.Description of the grooves (G1-G3) and ridges (R1-R3) formed by the protein surface ofHDAC8 (PDB:1T69).
He et al. Page 17
J Med Chem. Author manuscript; available in PMC 2010 November 26.
NIH
-PA Author Manuscript
NIH
-PA Author Manuscript
NIH
-PA Author Manuscript
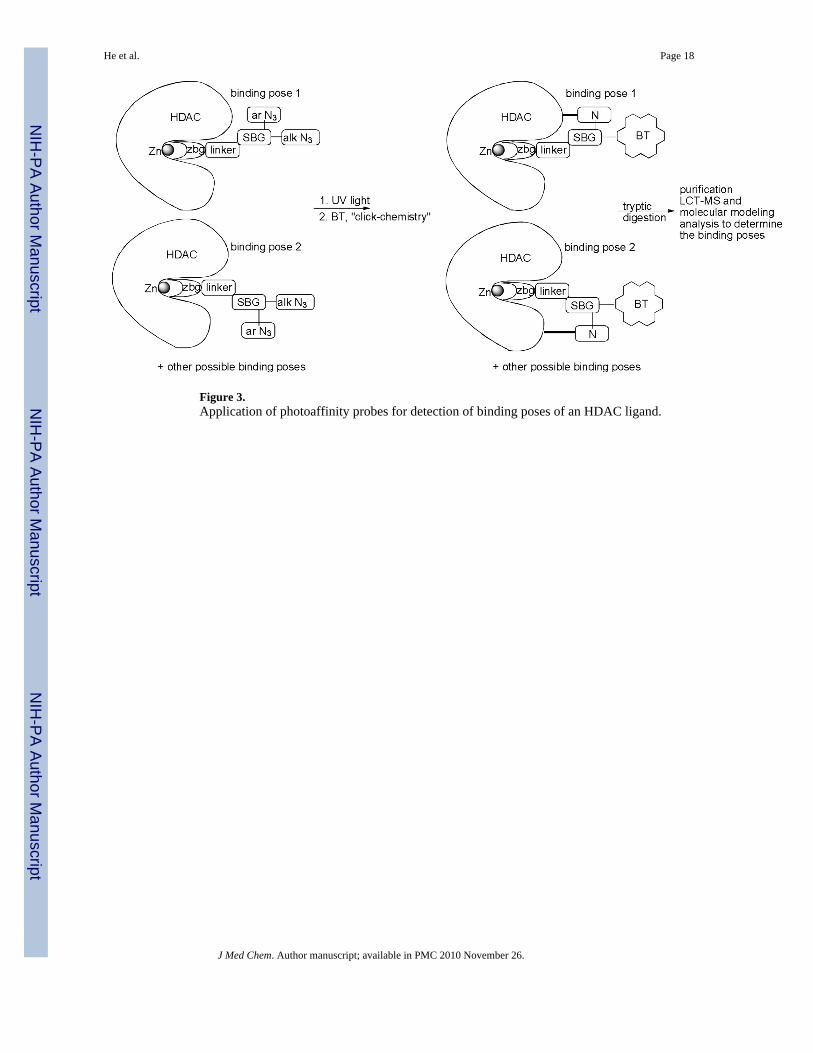
Figure 3.Application of photoaffinity probes for detection of binding poses of an HDAC ligand.
He et al. Page 18
J Med Chem. Author manuscript; available in PMC 2010 November 26.
NIH
-PA Author Manuscript
NIH
-PA Author Manuscript
NIH
-PA Author Manuscript
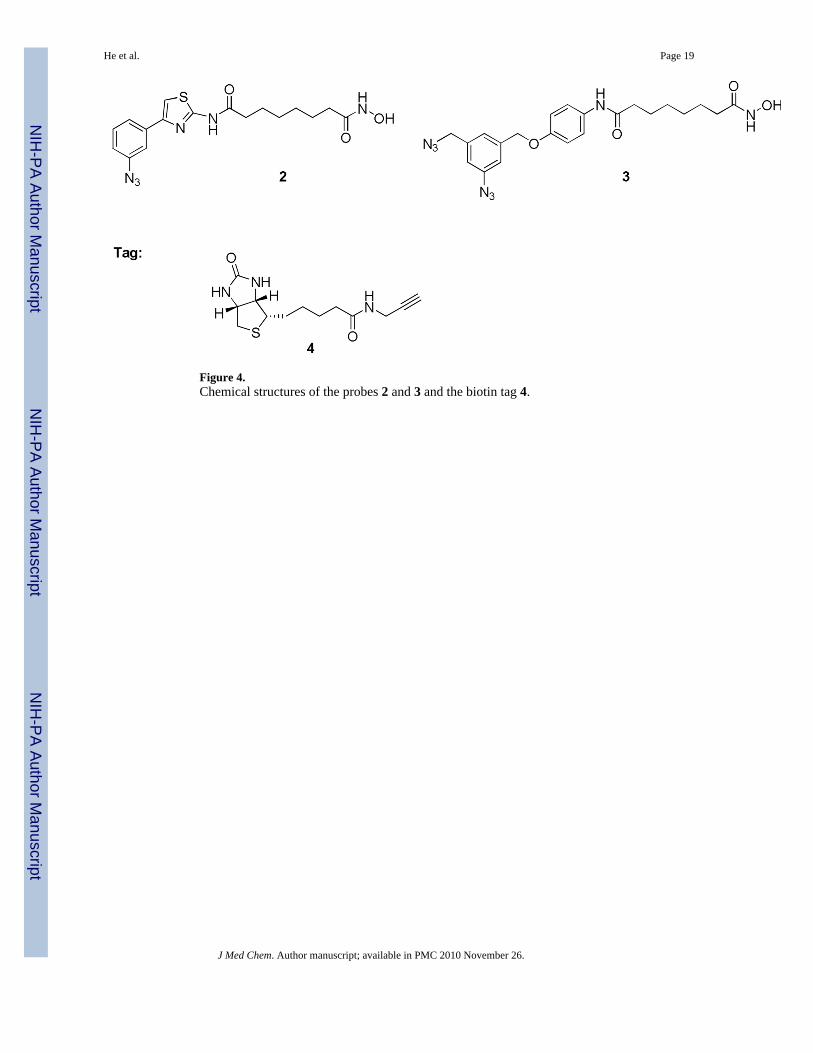
Figure 4.Chemical structures of the probes 2 and 3 and the biotin tag 4.
He et al. Page 19
J Med Chem. Author manuscript; available in PMC 2010 November 26.
NIH
-PA Author Manuscript
NIH
-PA Author Manuscript
NIH
-PA Author Manuscript
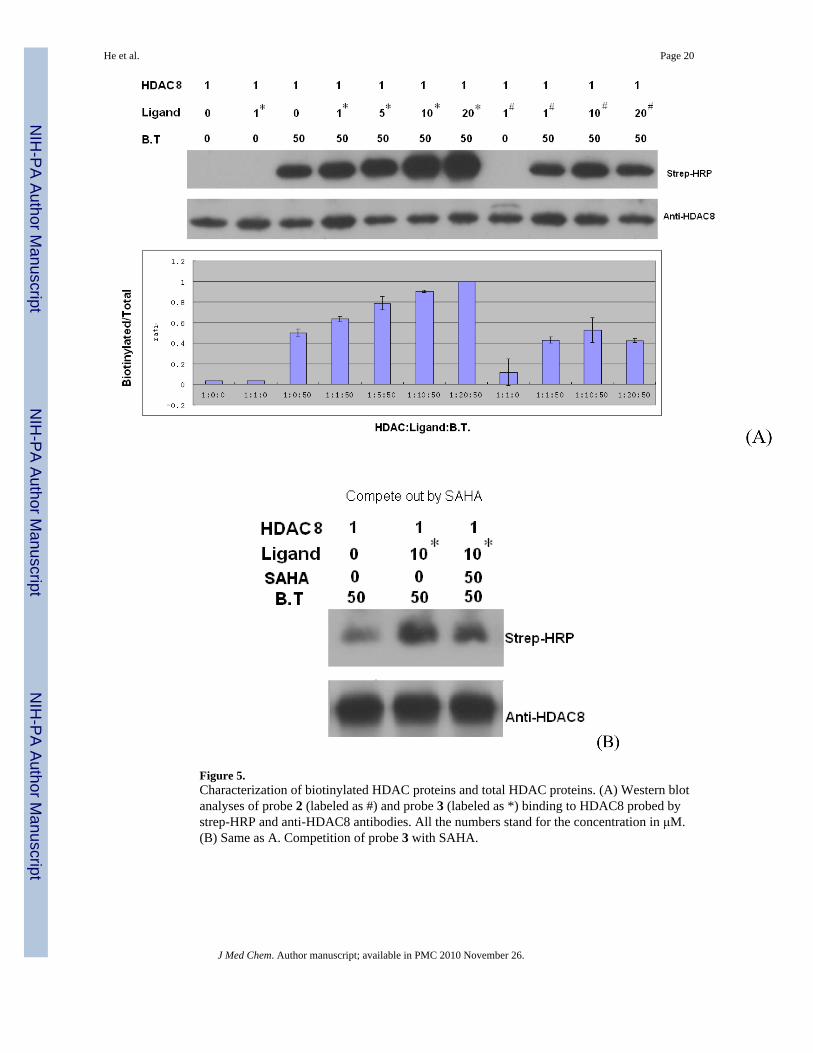
Figure 5.Characterization of biotinylated HDAC proteins and total HDAC proteins. (A) Western blotanalyses of probe 2 (labeled as #) and probe 3 (labeled as *) binding to HDAC8 probed bystrep-HRP and anti-HDAC8 antibodies. All the numbers stand for the concentration in μM.(B) Same as A. Competition of probe 3 with SAHA.
He et al. Page 20
J Med Chem. Author manuscript; available in PMC 2010 November 26.
NIH
-PA Author Manuscript
NIH
-PA Author Manuscript
NIH
-PA Author Manuscript
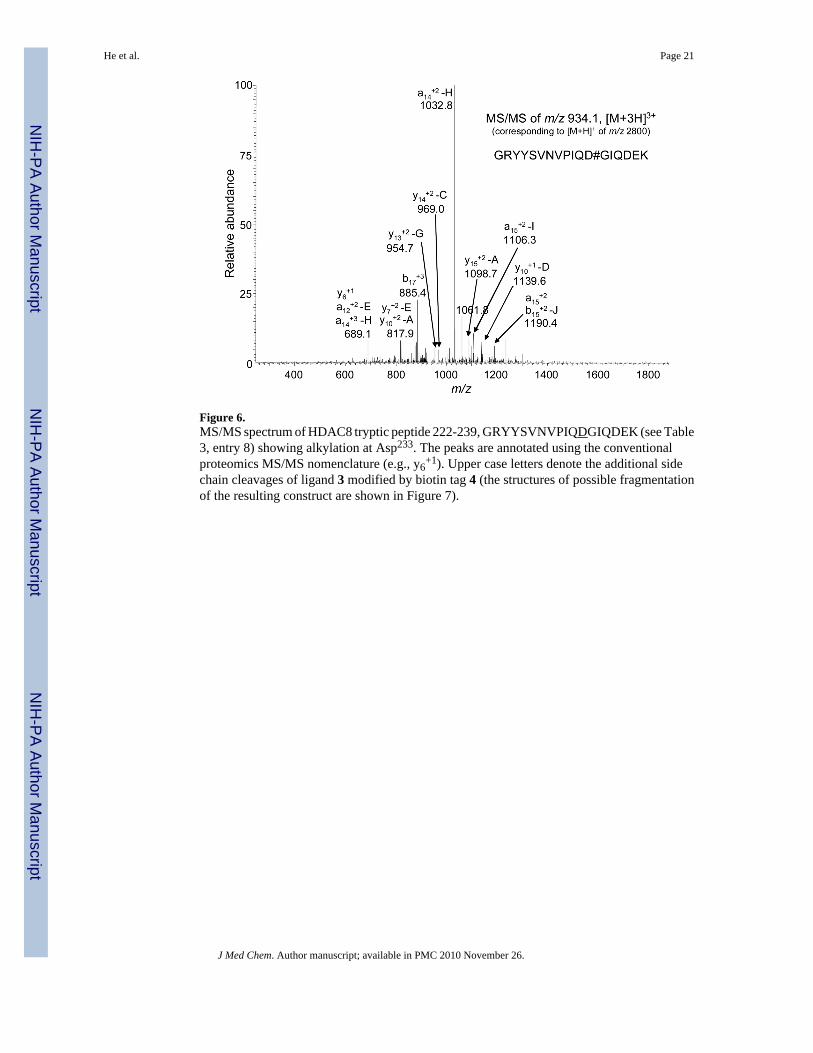
Figure 6.MS/MS spectrum of HDAC8 tryptic peptide 222-239, GRYYSVNVPIQDGIQDEK (see Table3, entry 8) showing alkylation at Asp233. The peaks are annotated using the conventionalproteomics MS/MS nomenclature (e.g., y6
+1). Upper case letters denote the additional sidechain cleavages of ligand 3 modified by biotin tag 4 (the structures of possible fragmentationof the resulting construct are shown in Figure 7).
He et al. Page 21
J Med Chem. Author manuscript; available in PMC 2010 November 26.
NIH
-PA Author Manuscript
NIH
-PA Author Manuscript
NIH
-PA Author Manuscript
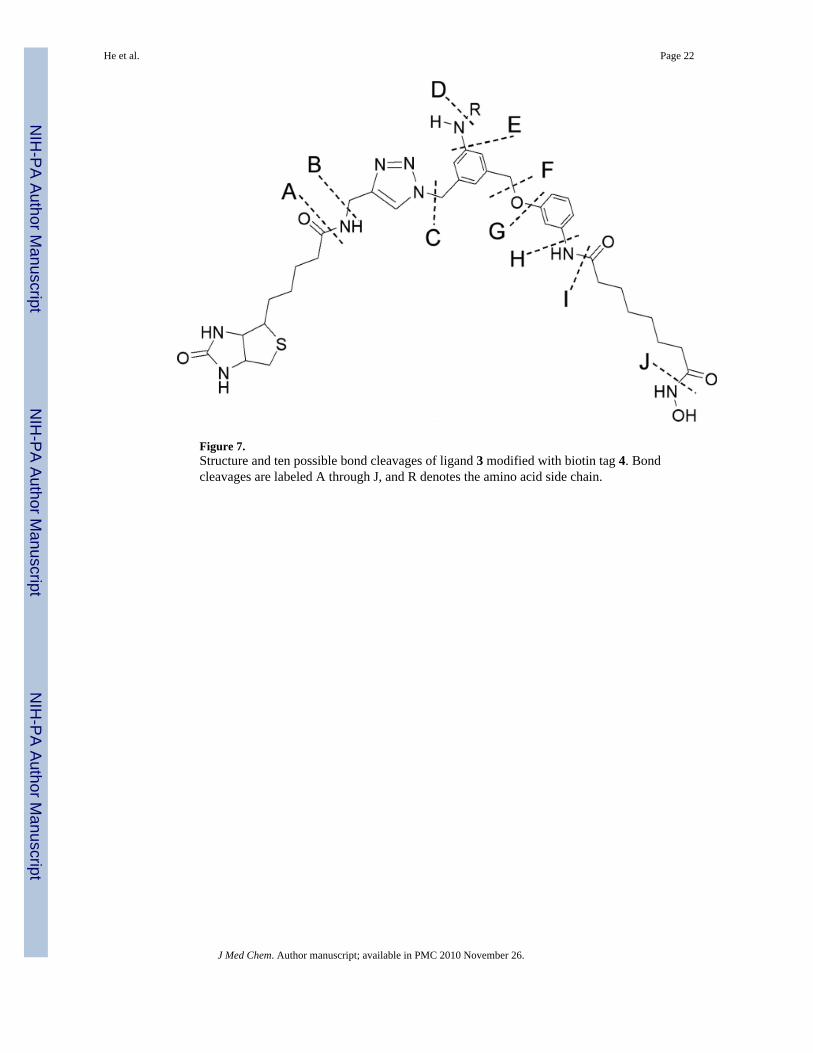
Figure 7.Structure and ten possible bond cleavages of ligand 3 modified with biotin tag 4. Bondcleavages are labeled A through J, and R denotes the amino acid side chain.
He et al. Page 22
J Med Chem. Author manuscript; available in PMC 2010 November 26.
NIH
-PA Author Manuscript
NIH
-PA Author Manuscript
NIH
-PA Author Manuscript
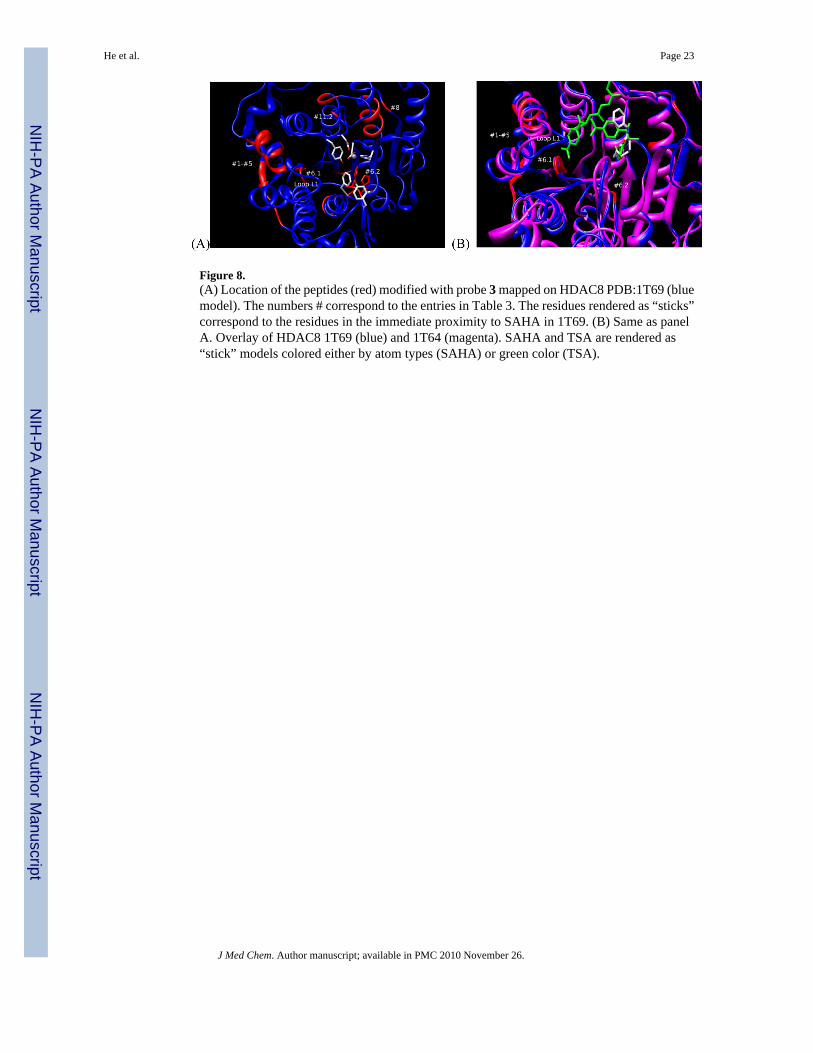
Figure 8.(A) Location of the peptides (red) modified with probe 3 mapped on HDAC8 PDB:1T69 (bluemodel). The numbers # correspond to the entries in Table 3. The residues rendered as “sticks”correspond to the residues in the immediate proximity to SAHA in 1T69. (B) Same as panelA. Overlay of HDAC8 1T69 (blue) and 1T64 (magenta). SAHA and TSA are rendered as“stick” models colored either by atom types (SAHA) or green color (TSA).
He et al. Page 23
J Med Chem. Author manuscript; available in PMC 2010 November 26.
NIH
-PA Author Manuscript
NIH
-PA Author Manuscript
NIH
-PA Author Manuscript
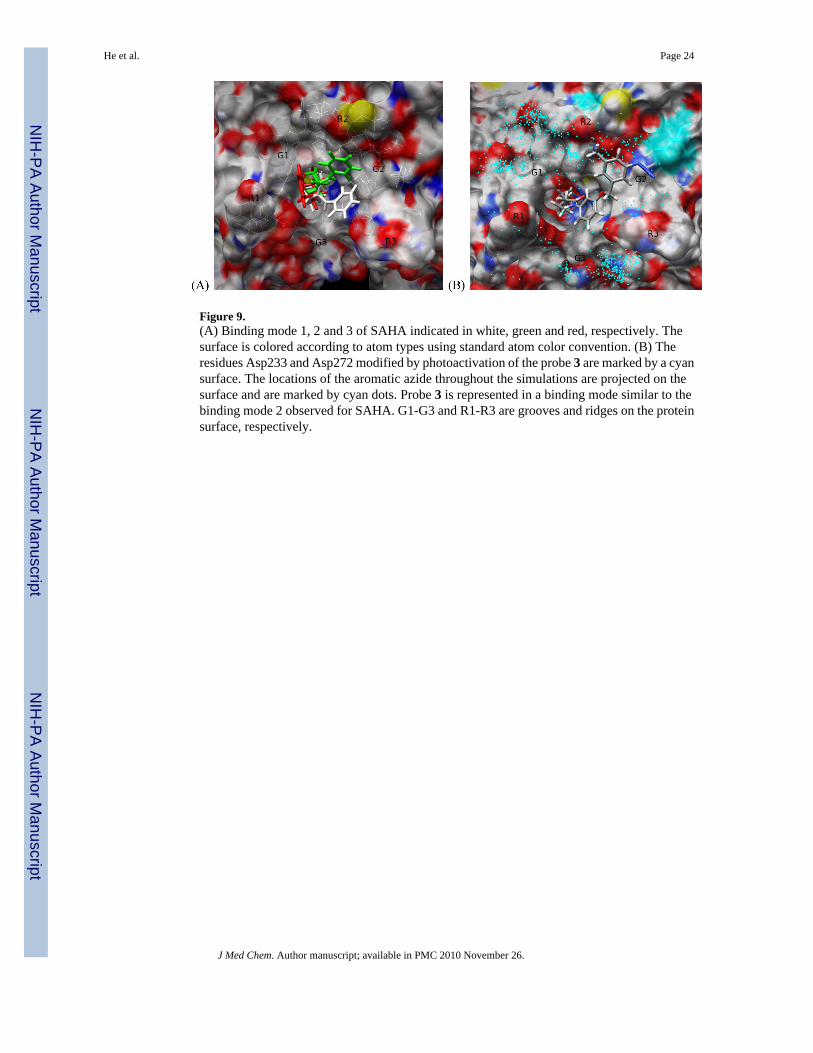
Figure 9.(A) Binding mode 1, 2 and 3 of SAHA indicated in white, green and red, respectively. Thesurface is colored according to atom types using standard atom color convention. (B) Theresidues Asp233 and Asp272 modified by photoactivation of the probe 3 are marked by a cyansurface. The locations of the aromatic azide throughout the simulations are projected on thesurface and are marked by cyan dots. Probe 3 is represented in a binding mode similar to thebinding mode 2 observed for SAHA. G1-G3 and R1-R3 are grooves and ridges on the proteinsurface, respectively.
He et al. Page 24
J Med Chem. Author manuscript; available in PMC 2010 November 26.
NIH
-PA Author Manuscript
NIH
-PA Author Manuscript
NIH
-PA Author Manuscript
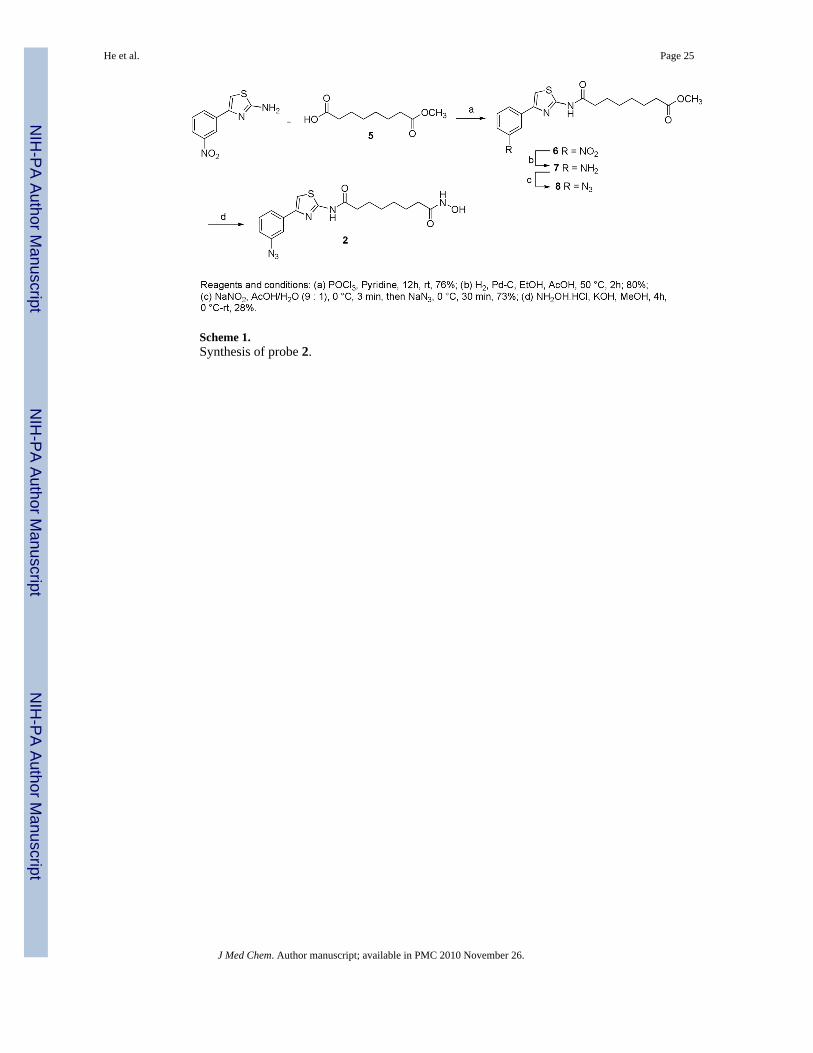
Scheme 1.Synthesis of probe 2.
He et al. Page 25
J Med Chem. Author manuscript; available in PMC 2010 November 26.
NIH
-PA Author Manuscript
NIH
-PA Author Manuscript
NIH
-PA Author Manuscript
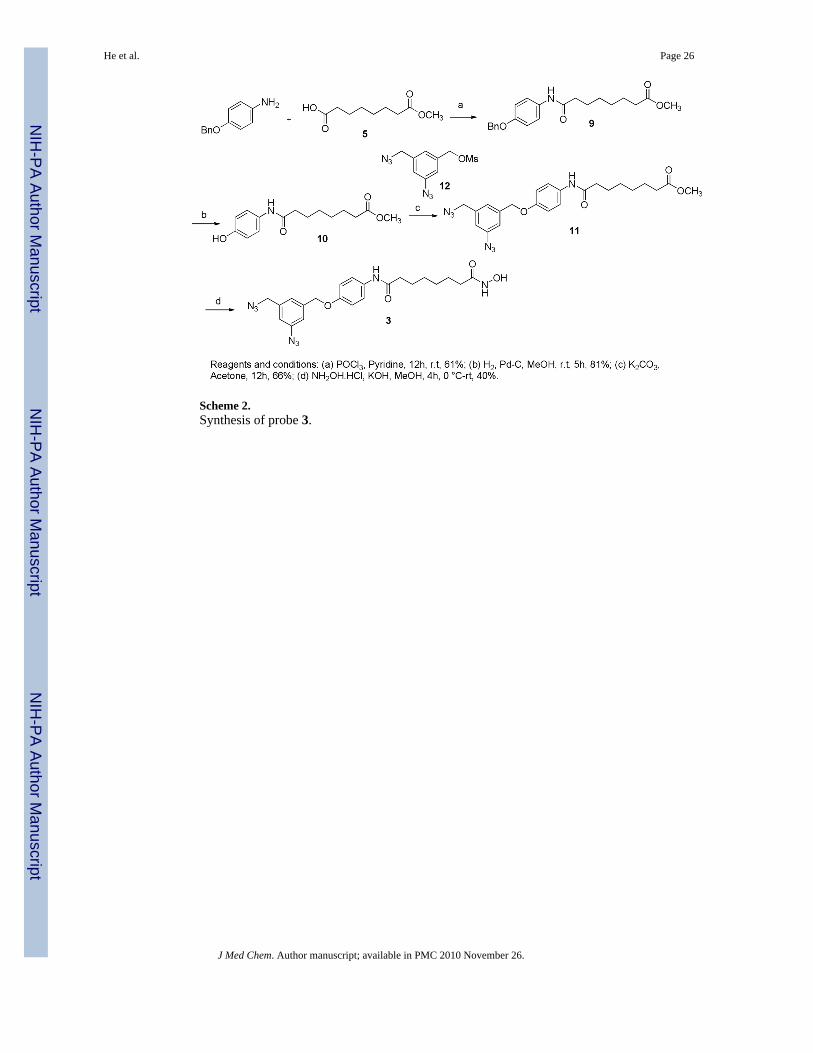
Scheme 2.Synthesis of probe 3.
He et al. Page 26
J Med Chem. Author manuscript; available in PMC 2010 November 26.
NIH
-PA Author Manuscript
NIH
-PA Author Manuscript
NIH
-PA Author Manuscript
NIH
-PA Author Manuscript
NIH
-PA Author Manuscript
NIH
-PA Author Manuscript
He et al. Page 27
Table 1
IC50 and KI values of inhibition of HDAC8 with SAHA and probes 2 and 3.Compound HDAC8 IC50 μ M Ki μM
SAHA 0.44 ±0.021 0.396
2 2.71±0.14 2.43
3 7.34±0.22 6.59
J Med Chem. Author manuscript; available in PMC 2010 November 26.
NIH
-PA Author Manuscript
NIH
-PA Author Manuscript
NIH
-PA Author Manuscript
He et al. Page 28
Table 2
MALDI MS of intact HDAC8 and treated with 2.AVG MW, DA [M+H]+ Std Deviation Mass Shift Δ CTRLSample N
HDAC8-CTRL 6.0 45620 57.5 0.0HDAC8-(1:−1) 6.0 45624 41.3 4.0HDAC8-(1:−5) 6.0 45733 37.1 113.5HDAC8-(1:−10) 4.0 45877 37.1 256.8
J Med Chem. Author manuscript; available in PMC 2010 November 26.
NIH
-PA Author Manuscript
NIH
-PA Author Manuscript
NIH
-PA Author Manuscript
He et al. Page 29Ta
ble
3
Sum
mar
y of
iden
tifie
d H
DA
C8
pept
ides
mod
ified
with
pro
be 3
:BT
4 ad
duct
.E
ntry
No.
Pept
ide
Sequ
ence
(AA
#s)
[M+H
]+m
/zC
harg
e st
ate
(z)#
of M
odsM
ass t
oler
ance
ppm
1IP
KR
ASM
*VH
SLIE
AY
ALH
KQ
M*R
a,b
034-
055
3330
.725
7111
09.5
7524
31
52
RA
SMV
HSL
IEA
YA
LHK
QM
*RIV
KPK
037-
060
3541
.889
6988
6.22
242
41
103
ASM
*VH
SLIE
AY
ALH
KQ
MR
IVK
PK03
8-06
041
05.1
0938
1367
.703
133
25
4A
SM*V
HSL
IEA
YA
LHK
QM
RIV
KPK
038-
060
4105
.109
3813
67.7
0313
32
55
QM
*RIV
KPK
.05
3-06
017
34.9
3338
867.
9666
92
110
6V
AIN
WSG
GW
HH
AK
K13
3-14
529
01.3
7544
1450
.187
722
25
7D
EASG
FCY
LND
AV
LGIL
RLR
RK
FER
147-
171
3660
.867
3160
9.31
122
61
58
GR
YY
SVN
VPI
QD
GIQ
DEK
222-
239
2800
.350
6193
4.11
687
31
109
YY
QIC
ESV
LKEV
YQ
AFN
PK24
0-25
830
41.4
6828
1521
.234
142
110
10A
VV
LQLG
AD
TIA
GD
PMC
SFN
MTP
VG
IGK
259-
286
4244
.039
9710
60.2
5999
42
511
AV
VLQ
LGA
DTI
AG
DPM
CSF
NM
TPV
GIG
K25
9-28
642
44.0
3997
849.
6079
95
210
a * in
dica
tes a
n ox
idiz
ed m
ethi
onin
e
b The
unde
rline
d re
sidu
es c
orre
spon
d to
the
regi
on o
f the
HD
AC
8 pr
otei
n w
here
mod
ifica
tion
by p
robe
3 o
ccur
red.
J Med Chem. Author manuscript; available in PMC 2010 November 26.