Between Development and Social Policies: The Impact of European Structural Funds in Objective 1...
52
Working Paper no. 28/2003 Between development and social policies: the impact of European Structural Funds in Objective 1 regions Andrés Rodríguez-Pose Ugo Fratesi The European Economy Group (EEG) was formed in 1998 within the framework of a Jean Monnet Action. Its objective is to undertake and promote research and other academic activities about the European integration process. The EEG Working Papers Series disseminates the original and unpublished research of its members and collaborators. More information on the EEG can be obtained on the web site: http://www.ucm.es/info/econeuro Grupo de Economía Europea European Economy Group
Transcript of Between Development and Social Policies: The Impact of European Structural Funds in Objective 1...

Working Paper no. 28/2003
Between development and social policies: the impact of European Structural Funds in
Objective 1 regions
Andrés Rodríguez-Pose Ugo Fratesi
The European Economy Group (EEG) was formed in 1998 within the framework of a Jean Monnet Action. Its objective is to undertake and promote research and other academic activities about the European integration process. The EEG Working Papers Series disseminates the original and unpublished research of its members and collaborators. More information on the EEG can be obtained on the web site: http://www.ucm.es/info/econeuro
Grupo de Economía Europea
European Economy Group

1
Between development and social policies:
the impact of European Structural Funds in
Objective 1 regions*
by
Andrés Rodríguez-Posea
and
Ugo Fratesib
a Department of Geography and Environment, London School of Economics, Houghton St, London WC2A 2AE, UK. E-mail: [email protected] b IEP and CERTeT, Università Bocconi, via Gobbi 5, 20136 Milano, Italy. E-mail: ugo.fratesi@uni -bocconi.it * A previous version of paper has been presented at European Economy Group IV International Seminar on European Economy at Complutense University of Madrid.

2
Between development and social policies: the impact of
European Structural Funds in Objective 1 regions*
Abstract: European regional support has grown in parallel with European integration.
The funds targeted at achieving greater economic and social cohesion and reducing
disparities within the European Union (EU) have more than doubled in relative terms
since the end of the 1980s, making development policies the second most important
policy area in the EU. The majority of the development funds have been earmarked
for Objective 1 regions, i.e. regions whose GDP per capita is below the 75% threshold
of the EU average. However, the European development policies have come under
increasing criticism based on two facts: the lack of upward mobility of assisted
regions and the absence of regional convergence. This paper assesses, using cross-
sectional and panel data analyses, the failure so far of European development policies
to fulfil their objective of delivering greater economic and social cohesion by
examining how European Structural Fund support is allocated among different
development axes in Objective 1 regions. We find that, despite the concentration of
development funds on infrastructure and, to a lesser extent, on business support, the
returns to commitments on these axes are not significant. Support to agriculture has
short-term positive effects on growth, but these wane quickly, and only investment in
education and human capital – which only represents about one eight of the total
commitments – has medium-term positive and significant returns.
Keywords: Development policy, Structural Funds, convergence, cohesion, Objective
1, European Union.
* The authors would like to thank Paul Cheshire, Gilles Duranton, Francesca Medda, three anonymous referees and the participants at seminars and conferences in Brighton, Dortmund, London, Málaga, Cambridge, Brugge, Madrid, Pescara and Pamplona for their comments and constructive criticisms to earlier drafts of this paper. The research could not have been conducted without the financial support of the Royal Society-Wolfson Research Merit Award and the Philip Leverhulme Prize.

3
Introduction
Since the mid-1980s the importance of EU development policies has not ceased to
increase, both in legal and budgetary terms. In legal terms, the question of achieving
‘Economic and Social Cohesion’ in Europe was upgraded from being just a mention
in the Preamble of the Treaty of Rome to becoming Title XIV (currently Title XVII)
after the passing of the Single European Act. In budgetary terms, development
policies have grown from representing a mere 10% of the European Communities
budget and 0.09% of the EU-15 GDP in 1980 to more than one third of the budget and
around 0.37% of the EU GDP, as an average of the period 1998-2001. Development
policies have become, after the Common Agricultural Policy (CAP), the second
largest policy area in the EU.
The increasing importance and visibility of EU development policies is related to the
political view that European integration was and is likely to unleash centripetal
economic forces and therefore to bring greater benefits to the European core,
increasing the gap between the core and the periphery to socially and politically
unacceptable levels. In accordance with this political belief, the EU gave development
policies the ambitious target of achieving greater economic and social cohesion and of
“reducing disparities between the level of development of the various regions” (Art.
158 of the EU Treaty). Such target implies not simply avoiding greater divergence
among European regions, but effectively counteracting the possible centripetal effects
of European integration and of all other factors contributing to the concentration of
economic activity in core areas. Hence every recent step towards greater economic
integration has been accompanied by measures aimed at preparing the lagging

4
countries and regions of the EU to cope with the challenges ahead. First, the
establishment of the Single Market was preceded by the 1989 reform of the Structural
Funds. The reform implied not just the co-ordination of the then three Structural
Funds and a comprehensive restructuring of the principles that guided their action, but
also the doubling in relative terms of the monies committed to regional development,
from 15.1% of the European budget in 1988 to 30.2 in 1992. Second, the de cision in
the Maastricht reform to create the Single European Currency was tied in with the
establishment of the Cohesion Fund in order to alleviate the burdens that transition to
EMU would impose on the less developed member states of the EU (Greece, Ireland,
Portugal, and Spain).
After the reform more than two thirds of all Structural Fund expenditure has been
concentrated in the so-called Objective 1 regions, that is, the regions whose GDP per
capita measured in purchasing power standards (pps) is less than 75% of the EU
average. The concentration of the Structural Funds and the Cohesion Funds in the less
privileged areas of the Community has meant that European development support
throughout the 1990s has hovered between 3 and 3.5% of GDP in Portugal, between
2.5 and 3.0% in Greece and Ireland, and between 2 and 3% in many Italian and
Spanish Objective 1 regions (European Commission, 2000: 213; Cuadrado-Roura,
2001).
Yet, despite their rising macroeconomic importance, questions are being raised about
the capacity of European development policies, in general, and of policies targeted at
Objective 1 regions, in particular, to deliver their objective of achieving greater
economic and social cohesion and of reducing the gap between the centre and the

5
periphery of the EU. These questions are fundamentally based on two facts. First is
the incapacity of assisted regions to grow beyond the threshold of assistance. Second
is the increasing evidence that regional convergence – which was the norm in across
Europe until the late 1970s – has come to a halt ( Canova and Marcet, 1995; Cheshire
and Magrini, 2000).
In this paper we analyse to what extent have the Structural Funds succeeded in their
objective of “reducing disparities between the levels of development of t he various
regions” (Art. 158), by focusing on the policy axes to which the Structural Funds have
been allocated. In order to achieve that, the paper is divided into five further sections.
The first section presents the EU development policies and the evolution of Objective
1 since the implementation of the reform of the Structural Funds in 1989. Section two
looks at recent trends in regional disparities across the EU, in general, and Objective 1
regions, in particular. Section three analyses the overall impact of Structural Fund
expenditure in Objective 1 regions, while section four highlights the extent to which
the allocation of funds across four development axes (infrastructure, business support,
agriculture and rural support, and human capital) may be affecting the capacity of
Structural policies to reduce the gap between the core and the periphery of the EU.
Section five concludes.
1. European Development Policies in Objective 1 regions
The decision to implement the Single European Market represented a boost for
European regional development policies. The political belief that European economic
integration was likely to foster the development of core regions at the expense of the

6
periphery (Padoa-Schioppa, 1987; Emerson, 1988; European Commission, 1994) led
to the introduction of the principle of ‘Economic and Social Cohesion’ in the Single
European Act. In order to achieve this principle, a radical reform of regional
development policies followed in 1989. The reform implied the coordination of all
existing Structural Funds (ERDF, ESF, and EAGGF-Guidance Section) under the
principles of territorial and financial concentration, programming, partnership, and
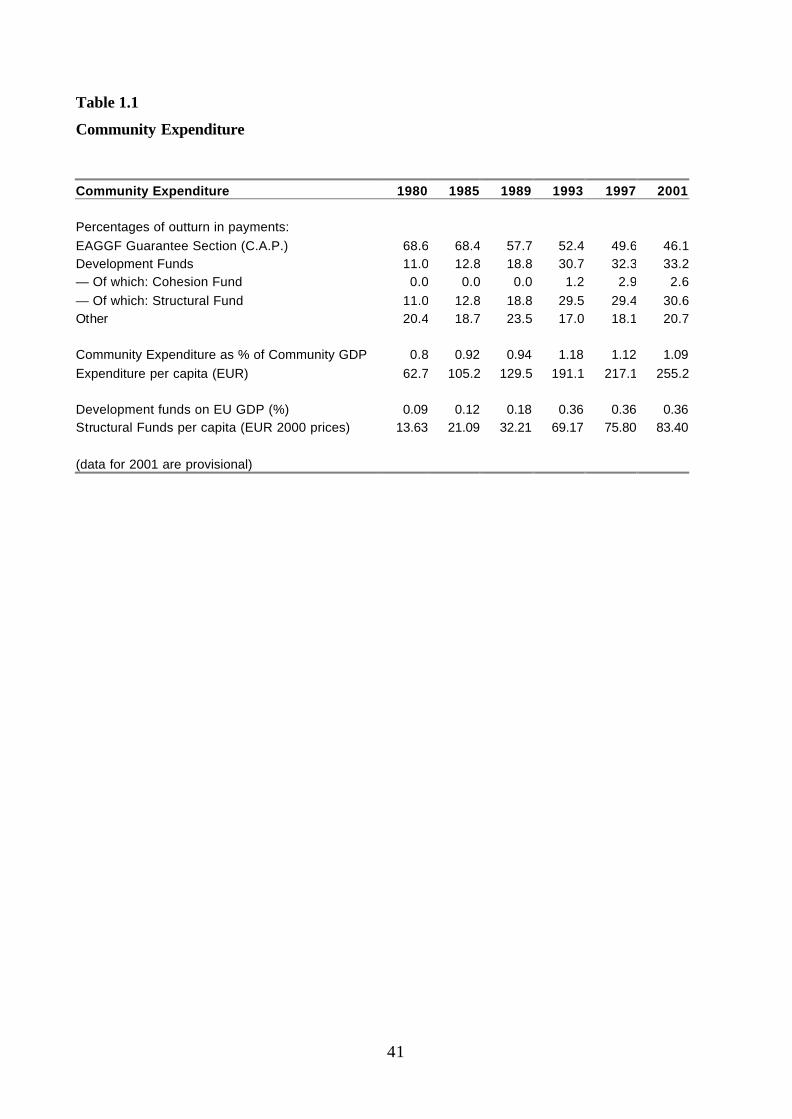
additionality1. The reform was accompanied by a doubling of the regional
development funds in the s pace of four years: from 15.1% of the European budget and
0.16% of the European GDP in 1988 to 30.2 and 0.33% respectively in 1993 (Table
1.1). Although since 1993 the relative size of the Structural Funds has increased at a
much slower pace and it is due to decline until 2006 (European Commission, 2001),
the monies available for development have continued to grow in absolute terms
(Table 1.1).
Insert Table 1.1 around here
Since the reform, the Structural Funds are allocated through the multi-annual planning
of assistance. For Objective 1 regions, five to seven year Community Support
Frameworks (CSFs), which are supplemented by Operations Programmes (Ops), are
approved by the Commission in consultation with the relevant member state – and,
whenever relevant, with the involvement of regional tiers of government in the
process – on the basis of regional development plans previously submitted by the
nation-states. Two programming periods have been already completed (1989-93 and
1994-9) and a third one (2000-6) is underway.
1 A fifth principle of efficiency was later introduced.

7
The largest percentage of Structural funds is spent, following the principle of
territorial concentration, in promoting the development and structural adjustment of
Objective 1 regions. Despite successive restructurings of the Structural Funds since
1989, the operating criterion to qualify for Objective 1 has remained unchanged: to
have a GDP per capita, measured in purchasing power parities and calculated on the
basis of Community figures for the last three years available, of less than 75% of the
Community average2 (cfr. Council Regulation 1260/99, art. 3).
The number of Objective 1 regions has grown with every programming period. In
1989 forty-four regions qualified as Objective 1. This group included the whole of
Greece, Ireland, and Portugal, the south of Italy and most regions in southern and
western Spain, plus Northern Ireland, Corsica and the French overseas Departments
and Territories. German reunification brought the five Länder of the former GDR and
East Berlin into the Objective. New regions in Belgium, France, the Netherlands,
Spain, and the UK became eligible in 1994 for the second planning period and
Burgenland after Austrian membership. For the programming period 2000-6 and after
the inclusion of the former Objective 6 into Objective 1, sixty-seven regions qualify
as Objective 1, eleven of which will be phased out by the end of the period.
2 Although the 1989-93 and 1994-99 regulations allowed for certain Objective 1 regions whose GDP was around 75% of the EC average, but for which there were special reasons to be included in Objective 1. The insertion after 2000 of the former Objective 6 regions – for the development and structural adjustment of regions with an extremely low population density in Sweden and Finland – in Objective 1 entails a further deviation from the main criterion.

8
As a whole, Objective 1 regions receive more than two-thirds of the total Structural
Fund expenditure. These funds are allocated both to regional specific operation plans
and to multiregional national plans that cover several regions. EU development
support represents a considerable percentage of the GDP of Objective 1 regions.
According to our calculations (see Annex 1), between 1989 and 1999 the
commitments of the Structural Funds amounted on average to 1.74% of the GDP of
Objective 1 regions. 0.90% was allocated to regional and an average of 0.84% went to
multiregional commitments3. There are however considerable geographical and
chronological variations in the allocation of funds. From a geographical perspective,
whereas in the better off Objective 1 regions, such as Abruzzo or Apulia in Italy,
Northern Ireland in the UK, Corsica in France, Hainaut in Belgium, or Flevoland in
the Netherlands, the Structural Fund support has remained below the 1% of GDP
threshold, in poorer areas regional support has been much higher. In the
ultraperipheral Portuguese archipelagos of the Azores and Madeira, Structural Fund
support has exceeded in certain year s 5% of GDP. In Alentejo in Portugal, in
Extremadura in Spain, and in some Greek regions Structural Fund commitments have
been at periods in excess of 3% of GDP. From a chronological perspective, the
variation is also significant.
Successive CSFs and Ops have established the priorities for intervention in Objective
1 regions. These priorities change across regions and adopt a host of different names
and labels in different CSFs, with wide variation even across regions in the same
country. The range of names used varies from the strait forward (transport, tourism,
3 Not all countries – starting by those that have only one Objective 1 region – have multiregional commitments.

9
fisheries, or human resource development) to the vague (‘development of regional
potential’ or ‘local development or potential’) and the mysterious (‘optimisation of
geographic position’ in the case of Western Greece). However, after analysing in
detail all the CSFs for the first two programming periods (1989-93 and 1994-9), the
EU’s development support intervention in Objective 1 regions can be classified
according to four main axes that closely reflect the priorities described in the First
Annual Report on the implementation of the Reform of the Structural Funds (1991).
These four priority axes are:
a) support to agriculture and rural promotion (A);
b) business and tourism support (B);
c) investment in education, re-qualification and all measures targeting the
human capital of the region (H);
d) investment in infrastructure, transport, and environment (I).
The volume of expenditure on each of the axes is very uneven. According to our
calculations, for the period 1989-99, about half (49.6%) of the Objective 1 Structural
Funds were committed to investment in infrastructure, transport, and the environment.
Business and tourism support came a distant second with 23.2%, followed by
investment in education and human capital related issues with 13.3% and support to
agriculture and rural promotion with 8%. The remaining 5.9% was committed to areas
that are difficult to classify under any of the above categories (see Annex 1 for an
explanation on the origin and calculation of data).
Once again there are huge geographical and chronological differences in the
importance of each of the axes. From a geographical perspective, different countries

10
have tended to privilege different axes. Table 1.2 reports the national allocation of
Objective 1 commitments in the two programming periods, omitting the small
percentage of funds difficult to classify under any of the four defined categories.
Infrastructure and the protection of the environment has been the preferred axis in
Spanish, Portuguese, Greek, Italian, French, and Dutch regions during both
programming periods. The focus on infrastructure has been particularly evident in
Spain and Portugal, where about half of the total available funding was committed to
that axis during t he first period, rising to more than three fourths for the second (Table
1.2). Business and tourism support has been the main axis in Ireland, accounting for
over half of the total commitments during the second period, and in the Austrian and
Belgian regions that joined Objective 1 in 1994, where it represented two thirds of the
total. It also was the most important development axis in Northern Ireland during the
first programming period. Support to human capital development only outstripped
other areas of involvement in British Objective 1 regions during the second period,
and represented more than a quarter of commitments in Portugal and Ireland in the
first period, and in Italy during the second period. Support to agriculture and rural
development has been the weakest axis, drawing more than one fifth of commitments
only in French and Spanish Objective 1 regions during the first period and in Italian
and Dutch regions during the second (Table 1.2).
Insert Table 1.2 around here
From a chronological perspective, the share of investment in business and tourism
support and, above all, in infrastructure increased in the second programming period
at the expense of the share of investment in human capital and rural support (Table
1.2). Overall, development strategies for Objective 1 regions have been characterised

11
by a strong imbalance across development axes. With a few exceptions CSFs have
been heavily biased towards one or two priority areas. The Portuguese regions in the
Iberian Peninsula or Attica during t he second programming periods, with their strong
focus on infrastructure, embody the extreme cases of an unbalanced development
strategy. Most other CSFs also suffer, to a greater or lesser extent, from the same
problem.
2. Structural Funds and the evolution of European regional
disparities
As we have seen, since the reform of the Structural Funds in 1989, the amount of
European money aimed at the strengthening of social and economic cohesion and at
the reduction of regional disparities across the EU has been multiplied. European
development policies have not only become the second largest policy area in the EU,
but also represent a significant proportion of public expenditure in Objective 1
regions. However – and in spite of some overly positive European Commission
(1999) evaluations of the contribution of the Structural Funds to economic cohesion in
Europe4 – questions have been recently raised about the capacity of Structural Funds
of delivering their objective of reducing regional inequalities across Europe (Martin,
1999; Hurst, Thisse, and Vanhoudt, 2000; Puga, 2002). It has even been claimed that,
in its current form, European regional development policies are more of an income
4 In the Executive Summary of the 1999 Sixth Periodic Report, the Commission claims that there is ‘unambiguous’ evidence of convergence and that this “unusually rapid pace of convergence, both from an historical and international perspective […] has been driven largely by closer European economic integration, but the Structural Funds have also played an important part” (1999: 7). The tone has been more moderate in successive reports (e.g. European Commission 2001).

12
support or redistribution strategy, than policies capable of setting the bases for long-
term sustainable development (Rodríguez-Pose, 2000: 112; Boldrin and Canova,
2001: 211).
To what extent are these criticisms accurate or fair? Have European development
policies more than a decade after the reform of the Structural Funds not succeeded in
their objective of triggering greater economic and social cohesion and lower
disparities? Two key factors are behind these doubts. First comes the remarkable
stability of the regions eligible for Objective 1, as forty-three of the original forty-four
regions that qualified for the Objective in 1989 remain in it fourteen years after the
reform. Only Abruzzo in Southern Italy managed to come out at the end of 1997. Four
other original regions (Corsica, Lisbon and the Tagus Valley, Molise, and Northern
Ireland), plus parts of the Republic of Ireland, are being phased out of the Objective
and will lose their support at the end of 2005 or 2006.
The second factor behind the scepticism over the capacity of European regional
policies to deliver has been the lack of convergence across European regions since the
implementation of the reform of the Structural Funds. The post-war regional
convergence detected in numerous studies (Barro and Sala-i-Martín, 1991;
Armstrong, 1995; Cheshire and Carbonaro, 1995; Molle and Boeckhout, 1995; Tondl,
2001) gradually gave way to stability or even divergence in the last two decades of
the 20th century (Magrini, 1999; Rodríguez-Pose, 1999; Cuadrado-Roura, 2001; Puga,
2002). In addition, there is growing evidence of the e mergence of convergence clubs
(Neven and Gouyette, 1995; Quah, 1996) resulting in increasing polarization and
lower economic cohesion across Europe (López-Bazo et al., 1999).

13
Our analysis of the evolution of European regional disparities since 1989 confirms the
absence of convergence, regardless of the method used to analyse regional change.
Figure 2.1 plots the evolution of the nationally weighted5 standard deviation of
regional GDP measured in PPS in the EU (with the exception of Germany), and in the
four countries of the Union with the largest number of Objective 1 regions: Greece,
Italy, Portugal, and Spain. The general trend is towards greater divergence in three of
the four countries analysed and in the EU as a whole. In the whole of the EU, the
standard deviation increased by 20.2% since 1989. The greatest increase in regional
disparities took place after the implementation of the Single Market in 1993, and is in
part the consequence of the change in the regional division in the UK, which accounts
for about three fifths of the increase in disparities. However even if this fact is taken
into account, there is a considerable growth in the standard deviation in Europe.
Between 1994 and 1999 – when the regional sample does not change – it exceeds 8%.
Insert Figure 2.1 around here
Greece, Italy, and Spain also experience a rise in regional disparities which seems cut
by the same cloth as the evolution of regional disparities in the EU: stability and even
slight decline in the late 1980s and early 1990s, followed by a sharp increase in
disparities in the second half of the 1990s. The greatest growth in disparities takes
place in Spain, where the standard deviation in GDP per capita grew by 15.7%
between 1988 and 1999, followed by Greece and Italy with an increase of 11.7% and
1.8% respectively (although in Italy disparities increase by 6.3% if only the period
5 All data is standardised nationally in order to minimise the problems of spatial autocorrelation (See Annex 2 for an explanation).

14
between 1991 and 1999 is considered). Only Portugal, with a 0.6% decline in regional
disparities that mainly took place during the first half of the 1990s, goes in an
opposite direction.
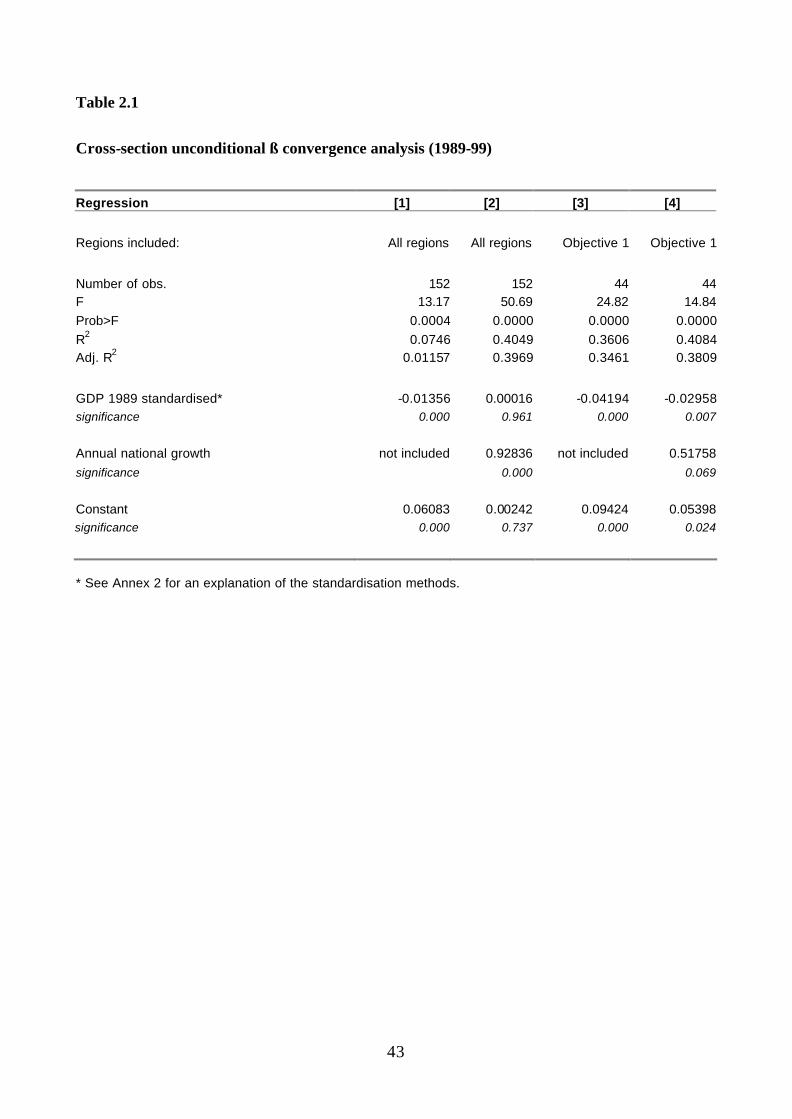
We have also conducted cross-section unconditional beta convergence analyses using
the traditional Barro and Sala-i-Martín (1992) approach in a variety of ways:
including all the EU Nuts II regions or just with the original Objective 1 subset and
controlling and not controlling for spatial autocorrelation. The results indicate the
existence of slow regional absolute convergence for the period 1989-1999, whenever
national growth rates are not considered. The rate of convergence is of 1.3% per
annum (Table 2.1, Model 1). If however national growth is introduced in the model in
order to minimise possible problems of spatial autocorrelation the rate of convergence
becomes insignificant, confirming that whatever convergence e xists at a regional level
in the EU is the result of national growth patterns rather than of any universal
tendency towards higher growth in lagging regions (Table 2.1, Model 2) (Esteban,
1994; Rodríguez-Pose, 1998; European Commission, 2001: 4; Puga, 2002).
Insert Table 2.1 around here
In contrast, if we take just the original Objective 1 regions into account, the panorama
is slightly different. There is a significant rate of regional convergence of 4.3 and 3%
respectively when regional growth is regressed on the original GDP per capita and
when national growth levels during the period of analysis are included in the model
(Table 2.1, Models 3 and 4). These results point in the direction of the existence of
convergence clubs among lagging European regions (Neven and Gouyette, 1995;

15
López-Bazo et al, 1999) and are in tune with those reported by the European
Commission (2001) in the Second Report on Economic and Social Cohesion.
Finally, we performed a convergence analysis with panel data, using the same variants
as in the cross-sectional analysis. We include the regional rate of growth GDP per
capita with a two-year lag (lag2 GDP) as a further independent variable. This variable
is preferred to the same one with a one-year lag (lag1 GDP) in order to avoid
problems of endogeneity, since lag1 GDP had been used to compute the growth rate.
The results of the panel convergence analysis indicate an absolute lack of
convergence both at EU level, as well as within Objective 1. In both cases the
coefficient is positive and not significant (Table 2.2, Models 1 and 2). When the
national growth rate is introduced in the models in order to minimise the risk of
spatial autocorrelation, the convergence coefficient for the set of European regions is
also positive and not s ignificant (Table 2.2, Model 3). In the Objective 1 regions
subset it is, in contrast, significant and negative. The magnitude of the observed
convergence within this subgroup is, however, extremely low: 1.36*10-06, that is a
1000€ difference in GDP per capita in the original year leads to a higher annual
growth rate of 0.136% (Table 2.2, Model 4).
Insert Table 2.2 around here
The convergence analyses have highlighted, first, that, when taking national growth
into account, there has been no regional convergence in the EU after the
implementation of the reform of the Structural funds and, second, that only slow
convergence seems to be happening in the subset of Objective 1 regions.

16
3. The impact of the Structural Funds on regional growth
But, to what extent can the lack of regional convergence across European regions be
attributed to the lack of capacity of the regional development expenditure in Objective
1 regions to generate economic convergence? Assessing whether European regional
development funds have an impact on economic growth is a tricky issue, since many
other policy, social, economic, institutional, and cultural factors – in many cases
difficult to control – have an influence on economic performance. We will therefore
limit ourselves to establ ishing the simplest connection between the Structural Funds
commitments in Objective 1 regions and regional growth across Europe, by
conducting a regression model in which regional growth during the period 1989-99 is
regressed on the initial GDP per capita (lnGDP 1989) and on the amount of
expenditure commitments on Objective 1 support (Total Regional Funds), measured
as a percentage of GDP in that same period. The model is performed for the whole set
of European NUTS II regions (Table 3.1, Models 1 and 2) and for the Objective 1
subset (Table 3.1, Models 3 and 4). In addition we add national growth rates (Real
National Growth) in some of the models in order to reduce the risk of spatial
autocorrelation (Table 3.1, Models 2 and 4).
Insert Table 3.1 around here
Using this type of analysis, the results point to a very weak but positive and
significant impact of European Structural Funds on regional growth across Europe.
The impact is greater when the whole set of European regions in considered than
when just Objective 1 regions are taken into account (Table 3.1).

17
However, if the Structural Funds allocation is divided into its regional and
multiregional components, the weak but positive and significant association between
Structural Fund Objective 1 commitments and regional growth in Objective 1 regions
disappears. As shown in Table 3.2, after regressing the growth of GDP per capita on
Structural Funds commitments in the whole set and in Objective 1 regions using panel
data, there is no significant statistical relation between the European development
effort and regional growth. This result holds both for funds allocated on an exclusive
regional basis and for multiregional commitments. Since the commitments of the
Structural Funds are however unlikely to lead to immediate returns in terms of
regional growth, we repeat the regression using annual lags and allowing for a
maximum of six years between the regional expenditure and its impact on growth
(Table 3.2 reports the results for the current year and years 4 and 7). In none of the six
annual lags the regression coefficient for the regional or the multiregional
commitments is statistically significant, highlighting that no real positive association
between Structural Funds and regional growth can be detected in a period of six years
following the initial investment.
Insert Table 3.2 around here
4. Unbalanced development strategies and regional growth.
Why have the Structural Funds so far had such a limited impact on regional
convergence? There are multiple factors that might explain why despite the
multiplication of funds available for regional development since the reform of the
Structural Funds there is little or no evidence of greater economic cohesion and

18
convergence across regions in the EU. Some of these e xplanations bear no connection
with the reform of European development policies. The main one is that the process
of economic integration across Europe may be favouring the concentration of
economic activity in the core of Europe, by fostering the formation of greater
agglomeration economies in the core and leading to the concentration of high-value
added scale intensive activities in a few regions (Brülhart and Torstensson, 1996;
Midelfart-Knarvik et al., 2000). The periphery thus becomes increasingly specialised
in low-value added manufacturing and non market-oriented services. The relatively
low legal migration across European regions and the deceleration in the shift from
agricultural to non-agricultural jobs are also at the root of the slowdown in regional
convergence in Europe (Cuadrado-Roura et al., 2000)
Other explanations highlight the distortionary effects of other policies. It has been
argued by Midelfart-Knarvik and Overman (2002) that national policies aimed at the
protection of certain strategic firms or industrial sectors can provoke distortions which
in some cases may contribute to counter the cohesive effects of European
development policies. The territorial concentration in core countries and regions of
the benefits of other European policies – and especially of the CAP, which represents
almost half of the European budget (De la Fuente and Doménech, 2001: 323;
European Commission, 2001: 84) – may further dilute the impact of development
policies.
A third group of possible explanations points directly to development policy related
issues. First, it may be argued that, since development strategies always have a
medium to long-term effect, it may still be too early to accurately assess the impact of

19
the reform of the Structural Funds. A second contention along this line is that, despite
the increase in the volume of development funds, the funds available are still too
scarce to have any significant impact on growth rates. With Objective 1 funds
averaging 1.74% of the GDP of Objective 1 regions, and with the total European
development support not exceeding in the best of cases 3.5 to 4% of the GDP of the
poorest regions, it could be claimed that current development support does not suffice
to counter the imbalances generated by market forces and economic integration. From
this point of view, the European development funds could be perceived more as a
means of preventing further divergence, rather than as a way to achieve greater
cohesion.
In this paper we focus however on an alternative explanation. It concerns the
development strategy of Objective 1 regions and the way in which European funds are
spent. We argue that the distribution of funds among the main development axes
described in section 1 may not be the most adequate strategy to generate medium and
long-term growth, but rather an instrument fundamentally targeted at achieving short-
term results, and therefore more adept at delivering assistance or income support
rather than a genuine development strategy.
As mentioned in Section 1, about half of all Objective 1 funds have committed to the
development of infrastructure, transport networks, and the environment. Business and
tourism support represented a bit less than a quarter. The question is to what extent is
this distribution of European Objective 1 funds across development axes impinging
on their capacity to deliver greater economic cohesion. In order to check how the
unbalanced structure of Objective 1 funds affects regional economic growth, we have

20
regressed the commitments in each of the four development axes described in section
1 (support to agriculture and rural promotion [A]; business and tourism support [B];
investment in education and human capital [H]; and investment in infrastructure,
transport networks, and the environment [I]), calculated as a percentage of the
regional GDP measured in PPS, on regional growth. We have conducted a cross-
section and panel data analysis, using annual lags, in order to capture not only static
effects, but also to measure the evolution of the coefficients in time. The classification
of regional commitments comes from our revision of the CSFs and the regional Ops
for all Objective 1 regions, with the exception of the Länder of the former East
Germany.
A number of structural variables are added to the model because of their theoretical
importance and statistical significance and represent proxies for the functioning of
regional labour market and for the socio-economic and production structures. The
functioning of the labour market is represented by a combination of employment rate
and youth unemployment rates. It is usually assumed that a high level of labour
participation is a symptom of efficient use of available resources. Hence, societies
with high levels of employment are considered to have a greater growth potential.
Most Objective 1 regions are, however, characterised by relatively low employment
rates in the western European context. The youth unemployment rate is a further
signal of whether labour markets are capable of assimilating the full potential of local
and regional human resources. Since younger generations tend on average to have a
higher level of education than the overall working population, the ability or inability
to integrate new and potentially more skilled workers into the labour force is an

21
indication of the rigidity of local markets. Most Objective 1 regions feature high
youth unemployment rates.
The female employment rate is taken as a proxy of the functioning of local labour
markets and of the regional socio-economic structure. Female participation denotes
not just another aspect of the fulfilment of human capital potential in the labour
market, but also of the role of women in society. Most Objective 1 regions are
characterised by low female employment levels. Finally, the high relative level of
employment in the primary sector of most of the original Objective 1 regions has
driven us to select agricultural employment as proxy of the production structure. All
these variables, with the exception of agricultural employment, were s ignificantly
associated with regional growth rates during the period of analysis in preliminary
regressions.
The model adopts the following form:
}ln,,,,,,,,{ 0GDPagrempfemempyunemempIHBAfyi,t = (1)
where:
y is the nationally weighted growth of regional GDP per capita measured in PPS;
A are the annual financial commitments for the support of agriculture and rural
promotion, as a percentage of regional GDP;
B are the annual financial commitments targeted at business and tourism support, as a
percentage of regional GDP;
H are the annual financial commitments in the fields of education and the
redeployment of human capital, as a percentage of regional GDP;

22
I are the annual financial commitments targeted at infrastructure, transportation
networks, and the environment, as a percentage of regional GDP;
emp is the regional rate of employment;
yunem is the regional rate of youth unemployment;
fememp is the regional rate of female employment;
agremp is the regional rate of employment in the primary sector and
lnGDP0 is the average regional GDP per capita during the first programming period.
In order to minimise the risk of spatial autocorrelation the dependent variable and all
structural variables are weighted nationally (see Annex 2). In the panel data analysis,
all structural variables are introduced in the model with a one-year lag as a way to
avoid problems of simultaneous causation.
The cross-section analysis is conducted by averaging the panel data in time. It is
therefore more similar to a between estimator than to a ‘real’ cross-section. The
analysis is performed for three different periods: the 1 st programming period, 1989-93
(models 1 and 4); the 2nd, 1994-9 (models 2 and 5) and the whole period together,
1989-99 (models 3 and 6) both for all NUTS II regions and for all regions that
belonged to Objective 1 at any time during the period of analysis. In addition, in order
to identify longer term effects, the relative regional economic performance of the
second programming period was regressed on the Structural Funds expenditure and
the structural variables of the first programming period, both including (models 9 and
10) and not including (models 7 and 8) the average regional GDP per capita for the
first programming period (Initial GDP). The results are reported in Table 4.1.
23
Insert Table 4.1 around here
Although the coefficients and significance of variables vary across models, some
common features emerge. Of the structural variables, total employment and youth
unemployment tend to be negatively associated to economic growth. The coefficient
of female employment generally displays a positive sign, whereas that of employment
in the primary sector varies. In contrast to preliminary analyses in which these
variables were individually regressed on growth, the coefficients tend to be not
significant across models (Table 4.1).
Of the expenditure variables, expenditure in human capital (H) is positive in ten out of
ten and significant at the 5% level in seven out of the ten models. Agriculture support
(A) is positive in all models that search for an immediate or short-term association
between the support to this development axis and economic growth (Models 1 to 6).
This positive association is, however, only significant at the 5% level in Objective 1
regions during the second programming period (Model 5). In contrast, in the longer
term, the relationship between economic growth and agriculture support becomes
more complex, as depicted by models 7 through 10. When all regions are considered,
the pattern is similar to that described for the contemporaneous models: a positive but
non-significant association (Models 7 and 9). If only Objective 1 regions are taken
into account, the coefficient changes sign becoming significant at the 10% level when
the initial GDP per capita is included in the model (Model 10). The connection
between regional growth and business and tourism support (B) tends to be positive
and non-significant during the first programming period (Models 1 and 4), becoming
negative and significant for the second and the whole period of analysis (Models 2-3
and 5-6). In the models that regress regional growth in the second period on the

24
variables of the first period, the coefficient becomes positive – with the exception of
Model 10 – but not significant (Models 7 through 10). The coefficient for
infrastructure and environment support (I) tends to be not significant and is negative
in eight out of ten cases. In the two cases where the coefficients are significant –
models 3 and 6 at the 10% level – the coefficients are negative (Table 4.1).
The panel data analysis presents us with a more dynamic picture of the connection
between regional growth and Objective 1 commitments6. The panel data analysis is
conducted for all regions that belonged to Objective 1 at any moment during the
period of analysis (with the exception, once again, of the former East German Länder)
using the pooled estimator7. The association between Structural Fund commitments
and regional growth is measured for the year of implementation and seven successive
years, in order to capture the evolution in time of the effects of Objective 1
commitments on regional growth. The results of the regression are reported in Table
4.2.
Insert Table 4.2 around here
The results are in strong conformity with those of the cross-section analysis. A
defined pattern emerges. First, regional commitments to agricultural support and rural
6 It has to be borne in mind that a panel data analysis covering a period of only 11 years could pick up short run cyclical, instead of long run effects. However, the harmony between the panel data and the cross-section data analysis highlight the fact that cyclical distortions may be relat ively unimportant in this case. In addition, in order to avoid problems of residual correlations, the lagged GDP per capita of the regions is left outside of the analysis, although its introduction did not change the results obtained. 7 Which according to the Breutsch and Pagan test is more suitable, since the individual ( fixed) effects are not significant.

25
restructuring (A) have a positive and significant immediate effect on economic
growth in Objective 1 regions. The positive impact however withers away almost
immediately and in later years the coefficient becomes strongly negative, albeit not
significant (Table 4.2). This pattern of immediate positive effect on growth and
waning and even negative returns as time progresses represents the archetype of funds
that tend to fulfil an income support rather than a sustainable development role. From
this perspective, the agricultural and rural support axis in Objective 1 regions can be
regarded as an instrument – as the CAP has to a greater or lesser extent become – of
ensuring that farmers and rural dwellers are rewarded for their general contribution to
society and for their role in maintaining the environment and preserving Europe’s
rural heritage (European Commission, 1997), rather than as a part of a strategy to
promote sustainable development. Hence, it is no surprise that the medium -term
returns to this type of commitments are insignificant and even negative.
The returns to the two main axes of the Objective 1 development strategy are also
disappointing. The development of infrastructure, transportation networks, and the
protection of the environment (I), and business and tourism support (B) make up
together about three quarters of Objective 1 intervention. Yet commitments in these
two development axes appear to have little or no short or medium-term impact on
regional economic growth, as indicated by the lack of significance of any of the
coefficients (Table 4.2). The lack of returns of business investment may be related to
the deficient competitiveness of many existing businesses in Objective 1 regions. A
large percentage of this type of interventions is targeted either at the development of
small and medium sized enterprises that will have to operate in relatively difficult
economic and institutional contexts and that often lack the capacity and the know-how

26
to compete in open markets, or to the support of larger firms whose comparative
advantages and prospects are rather bleak. In either case the medium and long-term
returns of this sort of support are likely to be weak and often dependent on changes in
the local environment.
The absence of returns of investment in infrastructure (I) in Objective 1 regions
(Table 4.2) may be related to several factors. First, the impact of infrastructure
investment on economic activity is never immediate and requires a considerable lapse
of time for the full impact to be felt (Vanhoudt et al., 2000). It may thus be argued
that the span of our panel data analysis is too short a period to evaluate the full effects
of infrastructure investment in Objective 1 regions. Second, annual commitments may
not be the best way of evaluating the full impact of the infrastructural effort in
Objective 1 regions. However, as the cross-section analysis showed, especially when
growth during the second programming period was regressed on regional
commitments during the first period (Models 7 through 10 in Table 4.1), no impact
was evident. Finally, the lack of impact of infrastructure investment may be due to the
fact that building roads, railways, airports, telecommunication infrastructure,
sanitation systems, and recuperating the environment, while improving the quality of
life of the inhabitants of the regions benefiting from this sort of investment – and
being highly popular and visible activities and, thus, very attractive for politicians
(Rodriguez-Pose, 2000) – does not by itself suffice to generate the economic
dynamism and the firms that will benefit from greater accessibility and improvements
in the environment. Since, as noted by Martin (1998, 1999) and Puga (2002), roads,
railways, and telecommunication networks run in two directions, a strategy strongly
skewed towards the development of infrastructure in regions with relatively
27
vulnerable local production structures, weak entrepreneurship levels and
technological base, and an often weaker human capital endowment, may solve an
important development bottleneck and reduce the infrastructural gap with the rest of
the EU, but may leave these regions more exposed to competition from stronger and
more technologically advanced firms in core areas. Spain provides an example of
where this mechanism may already be at work. The strong recent investment on
transport infrastructure in Spanish Objective 1 regions – which to a large extent has
been devoted to the construction of road and high-speed rail links between the
periphery of the country and Madrid – has probably helped to boost the phenomenal
growth rates that Madrid has experienced in the second half of the 1990s, but has left
many of the Objective 1 regions, whose economic prospects the new roads and rail-
links were supposed to increase, struggling to catch-up. Accordingly the
consequences of such an unbalanced development strategy for lagging regions may
not be the lofty economic returns predicted by Aschauer (1989), but more the absence
of a connection between infrastructure investment and regional convergence
identified by Vanhoudt et al. (2000), Puga (2002) and in this paper.
The only development axis with short and medium-term positive (and significant or
close to significant) returns is investment in human capital (H) (Table 4.2). Objective
1 regions harbour serious labour market problems. They either have a shortage of
skills, or experience problems of a mismatch between educational supply and labour
demand, since “the evidence suggests that matching the available skills of the work
force with those required by an economy undergoing fundamental change has become
a major problem” (European Commission, 2001: xxvi). Moreover, an important
percentage of the potential of the regional labour force tends to be under-utilised.

28
Human capital problems are accentuated by the lack of mobility of European
population in recent decades (Puga, 1999). In this context of inadequate human capital
provision and low labour mobility, the less than fifteen percent of the Objective 1
funds supporting education and the redeployment of human capital have the highest
and longer lasting returns (Table 4.2). Such a finding is in tune with recent studies
(i.e. Duranton and Monastiriotis, 2002; Overman and Puga, 2002), which highlight
the importance of the educational attainment of the population in the economic
potential of a region and suggest the need of redirecting the focus of supply-side
development policies from more traditional areas to education, skills, and human
capital.
As a whole, the results of the analysis argue in favour of a profound revision of
current development strategies across lagging regions in Europe; strategies based on a
greater consideration of the place-specific regional characteristics that are at the root
of the development problems of these regions (Ioannides and Petrakos, 2000; Thisse,
2000). The results also partially conform to those reported by De la Fuente and Vives
(1995) when analysing t he impact of supply-oriented development policies. As in
their case, we find that public supply-side development strategies play a role – albeit
small in the European case – in achieving greater territorial cohesion, and that, in
general, investment in education makes a greater contribution to the reduction in
regional inequality than investment in infrastructure. But, in contrast to their findings,
we cannot infer a link between the size of the redistributive effort affects its impact on
regional growth and disparities. Our results seem to point in the direction that size
only matters if the regional development strategy is adequate and adapted to the needs
and conditions of each region.

29
Conclusions
In this paper we have examined to what extent the complete overhaul of the European
development policies since the reform of the Structural Funds is succeeding in
achieving its objectives of greater economic and social cohesion and of a reduction in
regional disparities across the EU. Our analysis has focused on the impact of the
Structural Funds allocated to Objective 1 regions, which represent more than two
thirds of the Structural Funds and more than 61% of the total EU development effort.
In many ways, the Structural Funds have played an important role. The fact that, in a
period when we have witnessed a strong geographical concentration of corporate and
R&D activity in core areas of Europe, regional disparities have remained more or less
stable may be considered as possible evidence of the contribution of t he Structural
Funds to preventing the growth of regional disparities within the EU. The Structural
Funds may have also had an impact on overall growth (i.e. through contributing to
growth outside Objective 1 regions). Unfortunately the objective given to the
Structural Funds by European legislators goes well beyond the genesis of growth and
the prevention of divergence and includes the delivery of greater economic cohesion
and convergence. On this ambitious count, the results of the analysis underscore that
the EU is not only still far away from its aim of greater economic and social cohesion,
but also that the doubts about the capacity of the development funds allocated to
lagging regions in Europe to deliver sustainable economic growth and to reduce the
gap between the European core and the periphery seem to be well founded.

30
Although many factors may be behind the relative failure of lagging regions to catch-
up, in this paper we have established a link between the structure of the regional
development strategies financed by European funds and the lack of regional
convergence across western Europe. Development strategies in Objective 1 regions
have been skewed towards infrastructure and business support. However, the results
of the cross-sectional and panel data regression analyses underline that investment in
these development axes has so far had a negligible impact on regional convergence
both across the whole of the EU and if only Objective 1 regions are taken into
consideration.
The investment in agricultural support and rural restructuring presents a profile which
is closer to that of an income support strategy than a of a sustainable development
policies. While the impact of this sort of support on economic growth is positive in
the very short-term, the positive influence wanes in time and becomes progressively
negative. The only medium-term positive influence detected is that of the funds
targeted at education and the development of human capital. Regardless of the method
of analysis used, the connection between the share of funds aimed at improving the
local endowment of human capital and economic performance tends to be positive
and often significant, with the association being stable in time.
The prescription of this paper is thus that any future revision of European
development policies – which looks increasingly likely as a result of the enlargement
of the EU – should take into consideration the risks associated with an excessive focus
on only one development axis, often responding to political or national interests, in
what are vulnerable economic contexts. As we have seen, these strategies not only do

31
not deliver higher economic growth in the short and medium terms, but may be also
failing to prepare assisted regions to face the economic challenge s ahead, leaving
them as – if not more – vulnerable to future competition as they were before the
support started. Hence, there is a need to rethink regional policy along the lines of the
implementation of more innovative and region-specific development strategies which
would imply a more locally tailored combination of investment priorities across axes,
therefore avoiding some of the risks of premature exposure to the market (linked to an
emphasis on infrastructure), brain drain (human resources), or subsidizing non
competitive local firms (business supports). In addition, the European Union has a
role in contributing to making local institutions more capable and accountable, as one
of the lessons of the past years is that the delivery of development strategies has
proved difficult because of administrative constraints in complying with the principles
of EU regional policy effectively. This route may need to be followed if the European
development policies are to become true sustainable development strategies and, thus,
more capable of delivering in their objective of achieving greater economic and social
cohesion, rather than just another means of income support.

32
Annex 1
Data
The European Statistical Office (EUROSTAT) is the main source for data used in this
paper. Regional GDP data and all the structural labour market and employment data
stem from this source.
The Structural Fund database used in the analysis was constructed by the authors from
the CSFs for the programming periods 1989-93 and 1994-9 and from the annual
reports on the implementation of the reform of the Structural Funds. Unfortunately the
breakdown by year and region was not always easily available. In the few cases – all
before 1994 – for which only national, instead of regional, breakdo wns of
commitments are available, we have used the breakdown of the ERDF (which is by
far the most important financial instrument in Objective 1) as a proxy for the overall
regional quotas of all the Structural Funds. In a handful of cases concerning 1992 and
1993 for which no data were found, the regional commitment quotas were assumed to
be equal to the average of the period 1989-91. In the case of Greece, EU transfers to
municipalities were used instead for 1992 and 1993.
The inexistence of reliable Structural Fund expenditure data led us to choose data for
commitments8. We assume that Structural Funds commitments and expenditure are
8 The Commission has been severely criticised by the European Court of Auditors (2002) for its inability to produce accounts for Structural Fund expenditure. In its 2002 report, the Court found that for the programming period 1989-1994 “the procedures for examining final payment requests still took the form of

33
strongly correlated. This creates some problems, especially in terms of the distribution
over time of expenditure, as considerable lags between the commitment of Structural
Funds and actual expenditure often take place.
For the calculation of the annual commitments to the four different development axes
(A, B, H, I) we resorted, for the period 1994-9, to the re-elaboration of the operation
projects (available in the Inforegio website [www.inforegio.cec.eu.int ]), according to
the criteria described in the text. For the period 1989-93 only the CSFs were available.
Since no regional breakdown exists in this period for Portugal and Greece, we
presuppose that regional commitment quotas across the four development axes are
equal to the national quota. In addition, no annual breakdown of commitment quotas
is available. Therefore it is assumed that the quotas remain stable during the
programming periods changing only from 1994 onwards. The annual commitment to
A, B, H, I is calculated as product of the quota and the annual commitment for the
region.
The commitments are only available in nominal terms. We assume that the impact of
1 nominal Euro in regions with different level of prices is not the same. Hence, in
order to obtain the percentages of expenditure (our independent variables), we divided
the nominal commitments by the total GDP pps, and not by the nominal GDP.
Our dependent variable is the real growth rate of GDP per capita. This is calculated by
using national deflators on the nominal growth rates of GDP pps. We used national
interdepartmental consultations, and respective responsibilities had not been amended since the previous period” (p. 98) and that 549 files corresponding to that period were still open (p. 99).

34
deflators, because regional deflators were not readily available for all regions and for
the whole period of analysis. Given that the calculation of pps is done on a national
basis, the use of national deflators is not expected to create significant distortions.
Since, in order to minimise the problems of spatial autocorrelation, we frequently
resort to nationally standardised variables (see Annex 2 for a more detailed
explanation), countries with just one region (Luxembourg, Ireland, and Denmark)
were excluded from the parts of the analysis were these variables are used. German
regions are also not considered in the analysis, as a consequence of the high volatility
in regional growth rates (especially in the eastern Länder) after re-unification. Such
changes would have provoked huge alterations in the analysis, especially bearing in
mind that in the rest of the EU nothing of comparable importance happened. The
regions of the remaining fourteen countries of the EU make up the database.
Finally, the French overseas departments are also excluded from the analysis for a
twofold reason: first, the information concerning these regions is often scarce, and,
second, because we believe that, due to their geographical location, the factors
guiding their economic growth are very different from those affecting regions in
western Europe.

35
Annex 2
Spatial autocorrelation
Recent studies of the evolution of regional disparities in Europe have tended to
highlight the existence of a serious problem of spatial autocorrelation, that is a lack of
independence among observations representing neighbouring regions (Armstrong,
1995; Quah, 1996). Our analysis is no exception as significant national effects
appeared in preliminary models. Tests of the influence of national growth rates on
regional growth, by adding the lagged dependent variable and the national growth
parameter to preliminary models always produced results that were close to 1 and
significant. These results implied that regional growth in the EU was extremely
affected by national growth rates, i.e.: regions within a same country tend to grow at
similar rates.
In order to minimise the problems of spatial autocorrelation in the error term and the
distortions it generates on models we decided to transform in most of our models –
following a variant of the system used by Rodríguez-Pose (1999) – the dependent
variable and the structural independent variables into nationally weighted variables.
We used the following formula:
100*1%100%100
−
++=
c
rri y
yy (2)
where riy denotes the nationally weighted variable in region r in time i, and y the
original variable. r and c stand for region and country respectively.
36
References
Armstrong, H. W. (1995) An Appraisal of the Evidence from Cross-Sectional
Analysis of the Regional Growth Process within the European Union, in
Vickerman, R. W., Armstrong, H. W. (Eds.), Convergence and Divergence
Among European Regions, Pion Limited, London, pp. 40-65.
Aschauer, D. A. (1989) Is public expenditure productive? Journal of Monetary
Economics 23: 177-200.
Barro, R. J. and Sala-i-Martín, X. (1991) Convergence across states and regions.
Brookings Papers on Economic Activity 1:107–182.
Barro, R. J. and Sala-i-Martín, X. (1992) Convergence. Journal of Political Economy
100: 223-251.
Boldrin, M. and Canova, F. (2001) Inequality and convergence in Europe’s regions:
reconsidering European regional policies. Economic Policy 16: 207-253.
Brülhart, M. and Torstensson, J. (1996) Regional integration, scale economies and
industry location in the European Union, CEPR Discussion P apers, 1435, London.
Cheshire, P. C. and Carbonaro, G. (1995) Urban economic growth in Europe: Testing
theory and policy prescriptions. Urban Studies 33: 1111-1128.
Cheshire, P. C. and Magrini, S. (2000) Endogenous processes in European regional
growth: Convergence and policy. Growth and Change 31: 455-479.
Cuadrado-Roura, J. R. (2001) Regional convergence in the European Union: From
hypothesis to the actual trends. Annals of Regional Science 35: 333-356.
Cuadrado-Roura, J. R., Mancha-Navarro, T. and Garrido-Yserte, R. (2000) Regional
productivity patterns in Europe: An alternative approach. Annals of Regional
Science 34: 365-384.
De la Fuente, A. and Doménech, R. (2001) The redistributive effects of the EU
budget. Journal of Common Market Studies, 39: 307-330
De la Fuente, A. and Vives, X. (1995) Infrastructure and education as instruments of
regional policy: Evidence from Spain. Economic Policy, 9: 11-54.
Duranton, G. and Monastiriotis, V. (2002) Mind the Gaps: The Evolution of Regional
Inequalities in the U.K. 1982-1997. Journal of Regional Science 42: 219-256.

37
Emerson, M. (1988) The Economics of 1992. The EC Commission’s Assessment of the
Economic Effects of Completing the Internal Market. Oxford: Oxford University
Press.
Esteban J (1994) La desigualdad i nterregional en Europa y en España: descripción y
análisis. In: Crecimiento y Convergencia Regional en España y Europa vol. 2,
IAE, Barcelona, 13–84.
European Commission (1991) Annual report on the implementation of the reforms of
the structural funds 1989. Brussels: Commission of the European Communities.
European Commission (1994) Fifth Periodic Report on the Social and Economic
Situation and Development of the Regions of the Community. Brussels:
Commission of the European Communities.
European Commission (1997) Agenda 2000: for a stronger and wider Union.
Brussels: Commission of the European Communities.
European Commission (1999) Sixth Periodic Report on the Social and Economic
Situation and Development of the Regions of the European Union
Commission of the European Communities. Brussels: Commission of the
European Communities, Directorate-General for Regional Policy.
European Commission (2000) Real convergence and catching-up in the EU, in:
European Commission (Ed.) The EU Economy: 2000 Review. Brussels: European
Commission, Directorate General for Economic and Financial Affairs, pp.173-
206.
European Commission (2001) Unity, solidarity, diversity for Europe, its people and
its territory. Second report on Economic and Social Cohesion. Brussels:
Commission of the European Communities.
European Court of Auditors (2002) Annual Report Concerning the Financial Year
2001. Luxembourg.
Hurst, C. Thisse, J. F. and Vanhoudt, P. (2000) What diagnosis for Europe's ailing
regions? EIB papers 5 1 9-30.
Ioannides, Y. and Petrakos, G. (2000) Regional disparities in Greece: The
performance of Crete, Peloponnese & Thessaly. EIB Papers 5 1 31-60.
López-Bazo, E., Vayá, E., Mora A. J., and Suriñach, J. (1999) Regional economic
dynamics and convergence in the European Union. Annals of Regional Science
33: 343-370.

38
Magrini, S. (1999) The evolution of income disparities among the regions of the
European Union. Regional Science and Urban Economics 29: 257-281.
Marcet, A. and Canova, F. (1955) The poor stay poor: non-convergence across
countries and regions. London CEPR Discussion Papers.
Martin, P. (1998) Can regional policies affect growth and geography in Europe?
World Economy 21: 757-774.
Martin, P. (1999) Are European regional policies delivering? EIB Papers 4 2 10-23.
Midelfart-Knarvik, K. H., Overman, H. G., Redding, S. R. and Venables, A. J. (2000)
The location of European industry, European Commission, Economic papers No.
142, April 2000. Brussels: European Commission.
Midelfart-Knarvik, K. H. and Overman, H. G. (2002) Delocation and European
integration: Is structural spending justified? Economic Policy 17: 322-59.
Molle, W. and Boeckhout, S. (1995) Economic disparity under conditions of
integration - A long term view of the European case. Papers in Regional Science
74: 105-123.
Neven, D. and Gouyette, C. (1995) Regional convergence in the European
Community. Journal of Common Market Studies 33: 47-65.
Overman, H. G. and Puga, D. (2002) Unemployment clusters across Europe's regions
and countries. Economic Policy, 17: 115-147.
Padoa-Schioppa, T. (1987) Efficiency, Stability and Equity: A Strategy for the
Evolution of the Economic System of the European Community. Oxford: Oxford
University Press.
Puga, D. (1999) The rise and fall of regional inequalities. European Economic
Review, 43, 303–334.
Puga, D. (2002) European regional policy in light of recent location theories. Journal
of Economic Geography 2: 373-406.
Quah, D. (1996) Regional Convergence Clusters across Europe. European Economic
Review 40, 951-958.
Rodríguez-Pose, A. (1998) Dynamics of Regional Growth in Europe. Social and
Political Factors. Oxford: Clarendon Press.
Rodríguez-Pose, A. (1999) Convergence or divergence? Types of Regional Responses
to Socioeconomic Change. Tijdschrift voor Economische en Sociale Geografie 90:
363-378.

39
Rodríguez-Pose, A. (2000) Economic convergence and regional development
strategies in Spain: The case of Galicia and Navarre. EIB Papers 5 1 89-115.
Thisse, J. F. (2000) Agglomeration and regional imbalance: Why? And is it bad? EIB
Papers 5 2 47-68.
Tondl, G. (2001) Convergence after divergence?: Regional growth in Europe. Berlin:
Springer.
Vanhoudt, P., Mathä, T., and Smid, B. (2000) How productive are capital investments
in Europe? EIB Papers 5 2 81-106.

40
Figure 2.1. The evolution of standard deviation of regional GDP per capita in the
EU and in the Cohesion countries since the reform of the Structural Funds.
0.1
0.12
0.14
0.16
0.18
0.2
0.22
0.24
0.26
0.28
0.3
1988
1989
1989
1990
1991
1992
1993
1994
1995
1996
1997
1998
1999
Stan
dard
dev
iati
on EU15 (excluding Germany)
Greece
Italy
Portugal
Spain
41
Table 1.1
Community Expenditure
Community Expenditure 1980 1985 1989 1993 1997 2001 Percentages of outturn in payments:
EAGGF Guarantee Section (C.A.P.) 68.6 68.4 57.7 52.4 49.6 46.1 Development Funds 11.0 12.8 18.8 30.7 32.3 33.2 — Of which: Cohesion Fund 0.0 0.0 0.0 1.2 2.9 2.6
— Of which: Structural Fund 11.0 12.8 18.8 29.5 29.4 30.6 Other 20.4 18.7 23.5 17.0 18.1 20.7 Community Expenditure as % of Community GDP 0.8 0.92 0.94 1.18 1.12 1.09
Expenditure per capita (EUR) 62.7 105.2 129.5 191.1 217.1 255.2 Development funds on EU GDP (%) 0.09 0.12 0.18 0.36 0.36 0.36 Structural Funds per capita (EUR 2000 prices) 13.63 21.09 32.21 69.17 75.80 83.40
(data for 2001 are provisional)

42
Table 1.2 Structural fund commitments in Objective 1 regions (% of nominal values)
1989-93 1994-99 COUNTRY
A B H I TOTAL A B H I TOTAL
Austria - - - - - 15.0 68.7 16.3 0.0 100 Belgium - - - - - 0.0 66.2 17.2 16.6 100
France (except Overseas dep.) 28.6 15.9 10.1 45.4 100 9.6 32.8 18.7 39.0 100 Greece 11.2 18.4 16.6 53.8 100 18.7 13.4 13.6 54.3 100 Ireland 14.7 33.7 26.4 25.2 100 0.0 54.7 3.8 41.4 100 Italy 14.4 35.0 1.9 48.8 100 21.0 21.3 27.0 30.7 100 Netherlands - - - - - 22.2 20.4 21.0 36.4 100 Portugal 11.5 6.1 35.3 47.2 100 0.0 15.2 8.6 76.1 100 Spain 26.7 13.2 8.8 51.4 100 0.6 14.3 7.5 77.6 100
UK 10.5 38.1 20.9 30.4 100 12.2 25.0 33.1 29.7 100
Total 17.6 21.1 16.3 45.0 100 7.0 24.0 12.1 56.8 100 The 5.9% of total funds not easily ascribable to any of these categories has been omitted
43
Table 2.1
Cross-section unconditional ß convergence analysis (1989-99)
Regression [1] [2] [3] [4]
Regions included: All regions All regions Objective 1 Objective 1
Number of obs. 152 152 44 44 F 13.17 50.69 24.82 14.84
Prob>F 0.0004 0.0000 0.0000 0.0000
R2 0.0746 0.4049 0.3606 0.4084 Adj. R2 0.01157 0.3969 0.3461 0.3809
GDP 1989 standardised* -0.01356 0.00016 -0.04194 -0.02958 significance 0.000 0.961 0.000 0.007
Annual national growth not included 0.92836 not included 0.51758
significance 0.000 0.069
Constant 0.06083 0.00242 0.09424 0.05398 significance 0.000 0.737 0.000 0.024
* See Annex 2 for an explanation of the standardisation methods.

44
Table 2.2
Panel unconditional ß convergence analysis (1989-99)
Panel unconditional ß convergence (period 1989-99)
[1] [2] [3] [4]
Regions All Objective 1 All Objective 1
Observations 1348 414 1348 414
Groups 162 47 162 47 Average obs. per group 8.32 8.81 8.32 8.81
R-sq: within 0.0075 0.0195 0.1822 0.1571 between 0.0034 0.0887 0.1683 0.1012
overall 0.0018 0.0001 0.1773 0.1503
coeff. sig. coeff. sig. coeff. sig. coeff. sig.
Real National Growth 0.9905 0.000 1.0430 0.000
lag2 GDP 3.48E-07 0.123 2.05E-07 0.809 5.48E-08 0.790 -1.36E -06 0.090
Constant 0.0120 0.001 0.0148 0.121 -0.0012 0.728 0.0128 0.144
Breusch and Pagan LM test chi2 3.17 0.54 1.76 0.25
Prob > chi2 0.0752 0.4634 0.1842 0.6158

45
Table 3.1
The link between European Structural Fund support in Objective 1 regions and regional growth. Cross-sectional analysis
Dependent variable: growth in the period 1989-99
[1] [2] [3] [4]
Sample All All Objective 1 Objective 1
Observations 152 152 46 46
F 15.3 34.61 13.93 10.79
P>F 0 0 0 0
R-squared 0.1704 0.4123 0.3931 0.4352
Adj. R-squared 0.1593 0.4004 0.3649 0.3949
GDP 1989 -4.58E -06 7.32E-06 -6.34E -05 -4.01E -05
significance 0.431 0.155 0.002 0.083Total Regional Funds 0.1213 0.0812 0.0706 0.073
significance 0.000 0.002 0.068 0.054
Real National Growth 0.8789 0.5407
significance 0.000 0.084
Constant 0.6226 -0.0452 1.1823 0.5976
significance 0.000 0.675 0.000 0.121

46
Table 3.2 The link between European Structural Fund support and regional growth. Panel data analysis for the whole set and Objective 1 regions All regions Objective 1 regions
Lag No Lag No Lag Lag3 Lag3 Lag6 Lag6 No Lag No Lag Lag3 Lag3 Lag6 Lag6
Estimator Pooled (GLS) LSDV
Pooled (GLS) LSDV
Pooled (GLS) LSDV
Pooled (GLS) LSDV
Pooled (GLS) LSDV
Pooled (GLS) LSDV
Observations 1662 1662 1266 1266 810 810 507 507 373 373 235 235 Groups 162 162 162 162 162 162 47 47 47 47 47 47
Avg. obs. per group 10.26 10.26 7.81 7.81 5 5 10.79 10.79 7.94 7.94 5 5
R2 within 0.002 0.002 0.000 0.001 0.000 0.004 0.001 0.004 0.002 0.002 0.000 0.010 between 0.016 0.015 0.018 0.009 0.014 0.021 0.117 0.111 0.148 0.139 0.132 0.093 overall 0.000 0.000 0.002 0.001 0.002 0.001 0.004 0.001 0.016 0.016 0.020 0.003
Regional funds (% of GDP) 0.043 -0.333 0.227 0.176 0.014 -0.692 0.116 -0.333 0.325 0.176 0.108 -0.692 Significance 0.744 0.128 0.168 0.565 0.955 0.137 0.452 0.176 0.085 0.606 0.694 0.174
Multiregional funds (% of GDP) -0.028 0.172 -0.013 0.362 0.498 0.120 0.209 0.172 0.371 0.362 1.154 0.120 Significance 0.881 0.643 0.959 0.472 0.268 0.915 0.407 0.680 0.259 0.519 0.060 0.922
Constant -0.054 -0.003 -0.100 -0.162 -0.178 0.035 -0.437 -0.033 -0.673 -0.549 -0.903 0.268 significance 0.510 0.981 0.322 0.289 0.231 0.894 0.073 0.931 0.021 0.268 0.038 0.762

47
Table 4.1.
Commitments to the four development axes regressed on regional growth. Cross-section analysis. (1) (2) (3) (4) (5) (6) (7) (8) (9) (10) SAMPLE All regions All regions All regions Objective 1 Objective 1 Objective 1 All regions Objective 1 All regions Objective 1 Period 1989-1993 1994-1999 1989-1999 1989-1993 1994-1999 1989-1999 2 on 1 2 on 1 2 on 1 2 on 1
Number of obs 106 162 162 44 47 47 162 47 152 46 F 1.47 4.66 4.39 1.65 3.63 4.24 2.55 1.56 2.08 1.54 Prob > F 0.1786 0 0.0001 0.1472 0.0032 0.0011 0.0122 0.1698 0.0354 0.1719 R2 0.108 0.1959 0.1865 0.2734 0.433 0.4714 0.1178 0.2472 0.1163 0.2778 Adj R2 0.0345 0.1538 0.144 0.1074 0.3137 0.3601 0.0717 0.0887 0.0603 0.0973
coeff. sig. coeff. sig. coeff. sig. coeff. sig. coeff. sig. coeff. sig. coeff. sig. coeff. sig. coeff. sig. coeff. sig.
emp -2.837 0.215 0.001 0.999 -0.025 0.981 -10.038 0.034 -4.835 0.161 -5.796 0.012 -0.365 0.841 -10.673 0.032 -0.082 0.967 -14.364 0.014
unemp -0.653 0.171 -0.680 0.115 -0.351 0.155 -1.648 0.064 -1.278 0.131 -1.165 0.019 -0.560 0.234 -2.276 0.052 -0.703 0.158 -2.711 0.029 fememp 2.727 0.037 -0.315 0.838 0.581 0.555 5.976 0.014 0.926 0.739 2.763 0.089 0.116 0.941 3.300 0.275 0.079 0.961 4.034 0.192
agremp 0.048 0.779 -0.531 0.000 -0.245 0.010 0.069 0.857 -0.456 0.102 -0.109 0.531 -0.480 0.002 -0.148 0.655 -0.516 0.008 0.321 0.505
A 2.347 0.292 2.141 0.112 1.444 0.306 0.410 0.895 3.620 0.042 0.876 0.579 0.539 0.848 -5.369 0.178 0.572 0.843 -7.586 0.083 B 3.049 0.215 -2.601 0.002 -1.823 0.045 4.540 0.176 -2.500 0.007 -1.798 0.060 3.396 0.263 1.197 0.756 3.339 0.285 -0.905 0.830 H 3.044 0.028 6.294 0.000 4.244 0.000 2.848 0.124 5.978 0.001 4.473 0.000 3.538 0.043 2.355 0.270 3.521 0.049 2.241 0.296
I -2.596 0.072 -0.439 0.368 -0.972 0.070 -1.985 0.317 -0.011 0.985 -1.004 0.074 -2.151 0.238 0.380 0.872 -2.203 0.239 1.271 0.605
constant 0.621 0.777 1.462 0.492 0.017 0.990 5.331 0.177 4.954 0.134 4.166 0.049 1.287 0.581 9.643 0.045 1.736 0.475 10.573 0.033
Initial GDP -.504 0.543 2.217 0.277
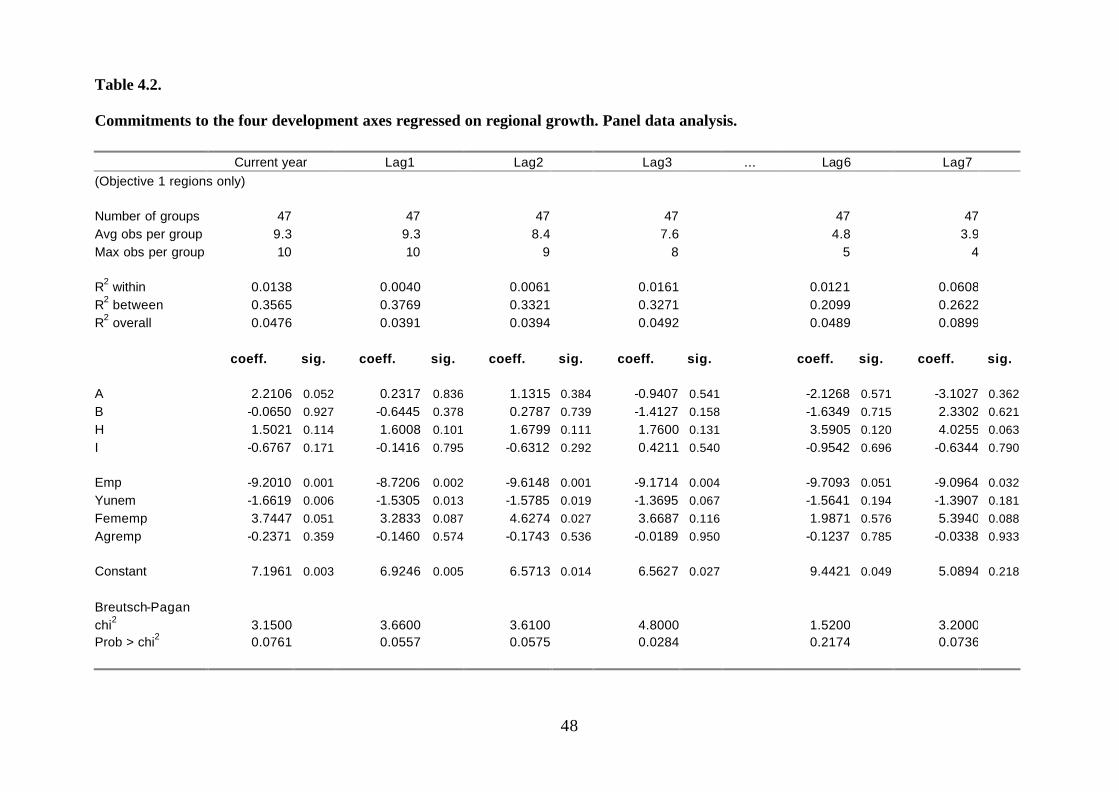
48
Table 4.2. Commitments to the four development axes regressed on regional growth. Panel data analysis. Current year Lag1 Lag2 Lag3 ... Lag6 Lag7
(Objective 1 regions only) Number of groups 47 47 47 47 47 47 Avg obs per group 9.3 9.3 8.4 7.6 4.8 3.9 Max obs per group 10 10 9 8 5 4 R2 within 0.0138 0.0040 0.0061 0.0161 0.0121 0.0608 R2 between 0.3565 0.3769 0.3321 0.3271 0.2099 0.2622 R2 overall 0.0476 0.0391 0.0394 0.0492 0.0489 0.0899
coeff. sig. coeff. sig. coeff. sig. coeff. sig. coeff. sig. coeff. sig.
A 2.2106 0.052 0.2317 0.836 1.1315 0.384 -0.9407 0.541 -2.1268 0.571 -3.1027 0.362
B -0.0650 0.927 -0.6445 0.378 0.2787 0.739 -1.4127 0.158 -1.6349 0.715 2.3302 0.621
H 1.5021 0.114 1.6008 0.101 1.6799 0.111 1.7600 0.131 3.5905 0.120 4.0255 0.063
I -0.6767 0.171 -0.1416 0.795 -0.6312 0.292 0.4211 0.540 -0.9542 0.696 -0.6344 0.790
Emp -9.2010 0.001 -8.7206 0.002 -9.6148 0.001 -9.1714 0.004 -9.7093 0.051 -9.0964 0.032
Yunem -1.6619 0.006 -1.5305 0.013 -1.5785 0.019 -1.3695 0.067 -1.5641 0.194 -1.3907 0.181
Fememp 3.7447 0.051 3.2833 0.087 4.6274 0.027 3.6687 0.116 1.9871 0.576 5.3940 0.088
Agremp -0.2371 0.359 -0.1460 0.574 -0.1743 0.536 -0.0189 0.950 -0.1237 0.785 -0.0338 0.933
Constant 7.1961 0.003 6.9246 0.005 6.5713 0.014 6.5627 0.027 9.4421 0.049 5.0894 0.218
Breutsch-Pagan chi2 3.1500 3.6600 3.6100 4.8000 1.5200 3.2000 Prob > chi2 0.0761 0.0557 0.0575 0.0284 0.2174 0.0736

EEG Working Papers Series
Blanes, J.V. and Martín, C. (1999): The Nature and Causes of Intra-Industry Trade: Back to the Comparative Advantage Explanation? The Case of Spain. Working Paper no. 1/1999. 23 pp. Martín, C. and Velázquez, F.J. (2000): Determinants of bilateral foreign direct investment flows in the OECD, with a closer look at the former communist countries. Working Paper no. 2/2000. 23 pp. Martín, C. and Sanz, I. (2000): European technology policy and Spanish industrial firms. Working Paper no. 3/2000. 27 pp. Martín, C. and Velázquez, F.J. (2000): Determinants of net trade flows in the OECD: new evidence with special emphasis on the case of the former communist members. Working Paper no. 4/2000. 30 pp. Martín, C. and Velázquez, F.J. (2001): An assessment of Real Convergence of Less Developed EU Members: Lessons for the CEEC Candidates. Working Paper no. 5/2001. 60 pp. Martín, C.; Velázquez, F.J. and Crespo, J. (2001): The Role of International Technological Spillovers in the Economic Growth of the OECD Countries. Working Paper no. 6/2001. 23 pp. Volkerink, B.; Sturm, J.E. and De Haan, J. (2001): Tax ratios in macroeconomics: Do taxes really mater? Working Paper no. 7/2001. 19 pp. Görg, H. and Strobl, E. (2001): Multinational Companies, Technology Spillovers and Plant Survival: Evidence for Irish Manufacturing. Working Paper no. 8/2001. 10 pp. Sanz, I. and Velázquez, F.J. (2001): The Evolution and Convergence of the Government Expenditure Composition in the OECD Countries: an Analysis of the Functional Distribution. Working Paper no. 9/2001. 28 pp. Andrietti, V. (2001): Occupational Pensions and Job Mobility in the European Union. Working Paper no. 10/2001. 46 pp. Martín, C. and Turrión, J. (2001): The trade impact of the integration of the Central and Eastern European Countries on the European Union. Working Paper no. 11/2001. 25 pp.

Crespo, J.; Martín, C. and Velázquez, F.J. (2002): International technology diffusion through imports and its impact on economic growth. Working Paper no. 12/2002. 25 pp. Sanz, I. and Velázquez, F.J. (2002): Determinants of the Composition of Government Expenditure by Functions. Working Paper no. 13/2002. 30 pp. Gemmell, N. and Kneller, R. (2002): Fiscal Policy, Growth and Convergence in Europe. Working Paper no. 14/2002. 28 pp. Falvey, R.; Foster, N. and Greenaway, D. (2002): North-South Trade, Knowledge Spillovers and Growth. Working Paper no. 15/2002. 22 pp. Camarero, M.; Ordóñez, J. and Tamarit, C. (2002): The Euro-Dollar exchange rate: Is it fundamental?. Working Paper no. 16/2002. 33 pp. Moreno Martín, L. and Rodríguez Rodríguez, D. (2002): Pricing to Market at firm level. Working Paper no. 17/2002. 27 pp. Maroto-Illera, R. and Mulas-Granados, C. (2002): Duration of Fiscal Budgetary Consolidations in the European Union. Working Paper no. 18/2002. 31 pp. Ayala, L. and Sastre, M. (2002): Europe vs. The United States: Is There a Trade-Off Between Mobility and Inequality?. Working Paper no. 19/2002. 47 pp. Mulas-Granados, C. (2003): The Trade-Off between Growth & Equality and the Economic Impact of Alternative Fiscal Adjustment Strategies in the EU. Working Paper no. 20/2003. 41 pp. Sanz, I. and Velázquez, F.J. (2003): Fiscal illusion, fiscal consolidation and government expenditure composition in the OECD: a dynamic panel data approach. Working Paper no. 21/2003. 25 pp. Camarero, M. and Tamarit, C. (2003): Estimating exports and imports demand for Manufactured goods: The role of FDI. Working Paper no. 22/2003. 39 pp. Widgrén, Mika (2003): Power in the Design of Constitutional Rules. Working Paper no. 23/2003. 34 pp. Martín, C. and Turrión, J. (2003): Eastern Enlargement of the European Union and Foreign Direct Investment Adjustments. Working Paper no. 24/2003. 22 pp. Girma, Sourafel (2003): Absorptive capacity and productivity spillovers from FDI: a threshold regresión analysis. Working Paper no. 25/2003. 32 pp.

Crespo, J. and Velázquez, F. J. (2003): Multinationals and diffusion of technology between developed countries. Working Paper no. 26/2003. 26 pp. Martín, C. and Sanz, I. (2003): Consequences of enlargement for European Regional Policy: the spanish viewpoint. Working Paper no. 27/2003, 66 pp. Rodríguez-Pose, A. and Fratesi, U. (2003): Between development and social policies: the impact of European Structural Funds in Objective 1 regions. Working Paper no. 28/2003, 48 pp.