Behavior of Double-Sided Concrete Corbels Reinforced With ...
163
United Arab Emirates University Scholarworks@UAEU eses Electronic eses and Dissertations 11-2016 Behavior of Double-Sided Concrete Corbels Reinforced With Glass-Fiber Reinforced Polymer Bars Ayman Farid Abu Obaida Follow this and additional works at: hps://scholarworks.uaeu.ac.ae/all_theses Part of the Civil and Environmental Engineering Commons is esis is brought to you for free and open access by the Electronic eses and Dissertations at Scholarworks@UAEU. It has been accepted for inclusion in eses by an authorized administrator of Scholarworks@UAEU. For more information, please contact [email protected]. Recommended Citation Abu Obaida, Ayman Farid, "Behavior of Double-Sided Concrete Corbels Reinforced With Glass-Fiber Reinforced Polymer Bars" (2016). eses. 464. hps://scholarworks.uaeu.ac.ae/all_theses/464
-
Upload
khangminh22 -
Category
Documents
-
view
0 -
download
0
Transcript of Behavior of Double-Sided Concrete Corbels Reinforced With ...
United Arab Emirates UniversityScholarworks@UAEU
Theses Electronic Theses and Dissertations
11-2016
Behavior of Double-Sided Concrete CorbelsReinforced With Glass-Fiber Reinforced PolymerBarsAyman Farid Abu Obaida
Follow this and additional works at: https://scholarworks.uaeu.ac.ae/all_theses
Part of the Civil and Environmental Engineering Commons
This Thesis is brought to you for free and open access by the Electronic Theses and Dissertations at Scholarworks@UAEU. It has been accepted forinclusion in Theses by an authorized administrator of Scholarworks@UAEU. For more information, please contact [email protected].
Recommended CitationAbu Obaida, Ayman Farid, "Behavior of Double-Sided Concrete Corbels Reinforced With Glass-Fiber Reinforced Polymer Bars"(2016). Theses. 464.https://scholarworks.uaeu.ac.ae/all_theses/464

lnU:U t'f �})) a.ul..a.J I i4-:l J.Sl-11 w IJ La !J I Ci5ul b \!!JI United Arab Emirates U�iversity
United Arab Emirates University
College of Engineering
Department of Civil and Environmental Engineering
BEHAVIOR OF DOUBLE-SIDED CONCRETE CORBELS REINFORCED WITH GLASS-FIBER REINFORCED POLYMER
BARS
Ayman Farid Abu Obaida
This thesis is submitted in partial fulfilment of the requirements for the degree of Master of Science in Civil Engineering
Under the Supervision of Dr. Bilal El-Ariss
November 2016

ii
Declaration of Original Work
I, Ayman Farid Abu Obaida, the undersigned, a graduate student at the United Arab
Emirates University (UAEU), and the author of this thesis entitled "Behavior of Double-Sided Concrete Corbels Reinforced with Glass-Fiber Reinforced Polymer Bars", hereby, solemnly declare that this thesis is my own original research work that
has been done and prepared by me under the supervision of Dr. Bilal El-Ariss, in the
College of Engineering at UAEU. This work has not previously been presented or
published, or formed the basis for the award of any academic degree, diploma or a
similar title at this or any other university. Any materials borrowed from other
sources (whether published or unpublished) and relied upon or included in my thesis
have been properly cited and acknowledged in accordance with appropriate academic
conventions. I further declare that there is no potential conflict of interest with
respect to the research, data collection, authorship, presentation and/or publication of
this thesis.
Student's Signature: Date:

Copyright© 2016 Ayman Farid Abu Obaida
All Rights Reserved
i i i

1) Advisor: Dr. Bilal El-Ariss
Title: Associate Professor
Advisory Committee
Department of Civil and Environmental Engineering
College of Engineering
2) Co-advisor: Dr. Tamer El Maaddawy
Title: Associate Professor
Department of Civil and Environmental Engineering
College of Engineering
v
Approval of the Master Thesis
This Master Thesis is approved by the following Examining Committee Members:
I) Advisor (Committee Chair): Dr. Bilal El-Ariss
Title: Associate Professor
Department of Civil and Environmental Engineering
College of Engineering
Signature ----=�-;i�Z��! �j �;�§i9iji@3��· ::;::==a:::...__ Date ..lJcc. 0 0 ZCJ/c-
2) Member: Dr. Said Elkhouly
Title: Assistant Professor
Department of Civil and Environmental Engineering
College of Engineering
A;:� Signature ___ -L..L__::::::_�==== �----- Date 2/e.c. a1-. 2.cJI6
3) Member (External Examiner):� Ayman M. Okeil
Title: Professor
Department of Civil and Environmental Engineering
College of Engineering
Date ·=u B(! �- Q "J/ r ,.._ ro
vi
This Master Thesis is accepted by:
Dean of the College of Engineering: Professor Sabah Alkass
Signature �4=- Date /� /;2/zo! � J
Dean of the College of the Graduate Studies: Professor Nagi T. Wakim
Copy _)_z_ of .J2.
vii
Abstract
Steel reinforced concrete members with small shear span-to-effective depth
ratios (a/d), such as corbels; have many classical applications, mostly in tall building,
precast structures, factory buildings, bridges, and foundations. Despite extended
research works on the performance of such members, little information is available
on the performance of these members when reinforced totally with internal fiber
reinforced polymer (FRP) bars. The use of FRP bars in reinforcing concrete members
would eliminate corrosion problems thus increasing the service life of the structure.
This thesis aims at investigating the shear strength of double-sided concrete corbels
reinforced with glass-fiber reinforced polymer (GFRP) bars. The study comprises of
testing twelve double-sided concrete corbel specimens. The test parameters include
the shear span-to-effective depth ratio (a/d), GFRP reinforcement ratio, and concrete
compressive strength. The study also includes an analytical investigation to predict
the strength of the corbels using the strut-and-tie modelling (STM) technique.
Development of arch action was confirmed by the formation of the main
diagonal shear cracks and the typical crushing mode of failure of the concrete in
diagonal compression struts formed between the main diagonal cracks. The tested
GFRP-reinforced corbel specimens failed due to crushing in concrete in the diagonal
compression strut in seven specimens. In addition, two specimens failed by flexural
crushing of the concrete, another two specimens failed by splitting of the concrete,
and one specimen showed simultaneous failures by flexural crushing and diagonal
strut concrete crushing. Increasing the GFRP reinforcement ratio increased the shear
strengths of the tested specimens with the exclusion of those that exhibited splitting
failure mode. Increasing the concrete strength from 20 MPa (C20) to 40 MPa (C40)
viii
increased the shear strength of specimens with a/d ratio of 1.0, except those with
GFRP reinforcement ratio of 6 ρb (where ρb is the balanced reinforcement ratio), and
decreased the shear strength of specimens with a/d ratio of 1.5.
The strut and tie model utilized in this study is based on the Canadian Code
CSA-S806-12 which assumes that the concrete struts fail in crushing of the concrete.
However, specimens with concrete C20 and a/d=1.5 experienced flexural crushing of
the concrete while specimens with concrete C40 and high GFRP reinforcement ratio
of 6 ρb experienced concrete splitting failure in the diagonal strut. The STM
technique slightly overestimated the shear capacity of specimens with same concrete
strength (C40) and reinforcement ratio (6 ρb) but with different a/d ratios (1.0 and
1.5) in comparison with the corresponding experimentally obtained results.
Nevertheless, conservative predictions of the shear capacity of the rest of specimens
were estimated by the STM. The predicted STM shear strengths displayed
comparable values with those in the literature. However, when compared with the
experimental test results, the STM gave better shear strength predictions for GFRP
reinforced specimens with concrete C40 and GFRP reinforcement ratio of 6 ρb than
those obtained from the literature.
Keywords: Concrete corbels, shear span-to-effective depth ratio, FRP reinforcement
ratio, shear strength, strut-and-tie model.
ix
Title and Abstract (in Arabic)
الزجاج بألياف المقوى البوليمر بقضبان المسلحة و الخرسانة اإلسنادات سلوك
ملخصال
المسلحة بقضبئن ئدات الخرسئشنيةلألسن شنائي ألطروحة إلى دراسة األداء اإلتهدف هذه ا
. العنئصر الخرسئشنية المقواة بقضبئن الحديد والحئوية (GFRP) زجئجالمقوى بأليئف ال البوليمر
شنائي غئلبئ مئ يكون حئسمئ إ ذات أداء ستعمئلاإل على منئطق مضطربة ه عنئصر شئيعة
تخفيف من ال المقوى يسئعد على لقضبئنالخرسئشنة بئ تسليحإن لالستقرار الكل للهيكل االشنائي .
ه هذتتميز االشنائي . الضرر النئجم عن تآكل الحديد داخل الخرسئشنة، وبئلتئل إطئلة عمر الهيكل
ن إالمقئومة للتآكل. ئ، وطبيعتهادلل مقئومتهئ، وارتفئع ئخفة وزشنهب المقواة يةالزجئج القضبئن
العنئصر الخرسئشنية المقواة بقضبئن الحديد. األبحئث السئبقة قد ركزت ف المقئم األول على
اتدئنثنى عار عنررا من األسنريب إلختبئر التجيامل الماروع البحث مرحلتين: اإلو
كذالك و ،المختبرة للعنئصر والنموذج العددي/المحئكئة ،(GFRP) المقواة بقضبئنو الخرسئشنية
للتأكد من صالحية استعمئلهئ ف (STM) الضغط-و-الاد طريقةعنئصر استخدام
البيئشنئت المختبرية المستنبطة الزجئج المقوى. إنالعنئصر الخرسئشنية المقواة بقضبئن ترميم
-و-الادعنئصر لتأكد من صالحية النمئذج العددية وطريقة تقنية قد استخدمت ل من هذه الدراسة
. إن ئلزجئج المقوىللعنئصر الخرسئشنية المقواة بقضبئشن االشنائي ف التحليل( STM) الضغط
العنئصر تسليح( ف GFRP) الزجئج المقوى عزز من استخدام قضبئنتالبحث سوف شنتئيج هذا
لهيئكل النئجمة عن التآكل ف ا المائكل واالضرارالخرسئشنية للحد ف شنهئية المطئف من
. و الجسورشنئللمب من تكئليف الريئشنة تقليل، والةكل االشنائييئهيال عمر، تمديد واطئلة االشنائيية
-و-تقنية الاد، األسند ، تقوية ، قص ،( GFRP) الزجئج المقوى قضبئن خرسئشنة،: مفاهيم البحث الرئيسية
.(STM) الضغط
x
Acknowledgements
I would like to thank God for giving me the faith and strength to
successfully complete my research. I would like also to thank my supervisor Dr.
Bilal El-Ariss for his guidance, supervision, and endless support, and for also
introducing me to this exciting field of civil engineering research. I am so grateful
to Dr. Bilal for his endless support. I am also grateful to my co-supervisor Dr.
Tamer El-Maaddawy for his assistance, support and ideas, and the valuable
knowledge and feedback he provided me throughout the project.
I would like to thank the Department Chair and all members of the
Department of Civil Engineering at the United Arab Emirates University for assisting
me throughout my studies and research. My special thanks are extended to Dr. Said
Elkhouly and the UAEU lab instructors (Mr. Faisal Abdulwahab, Eng. Abdelrahman
A. AlSallamin, Eng. Tarek Salah, and Eng. Salam Hegazy) and to all individuals that
helped me during this significant period of my life. My special thanks are also
extended to Pultron Composites Factory for the donation of the GFRP bars.
Special thanks go to my parents, uncles, brothers, and sisters who helped me
along the way. In addition, special thanks are extended to the United Arab Emirates
University for providing me with financial support to complete this research work.
xi
Dedication
To my beloved parents and to Dr. Bilal El-Ariss and Dr. Tamer El-Maaddawy for
giving me their continuous support and guidance

xii
Table of Contents
Title ..................................................................................................................................... i
Declaration of Original Work ............................................................................................ ii
Copyright ..........................................................................................................................iii
Advisory Committee ......................................................................................................... iv
Approval of the Master Thesis ........................................................................................... v
Abstract ............................................................................................................................ vii
Title and Abstract (in Arabic) ........................................................................................... ix
Acknowledgements ............................................................................................................ x
Dedication ......................................................................................................................... xi
Table of Contents ............................................................................................................. xii
List of Tables ................................................................................................................... xv
List of Figures ................................................................................................................. xvi
List of Symbols ................................................................................................................ xx
Chapter 1: Introduction ...................................................................................................... 1
1.1 Overview .......................................................................................................... 1
1.2 Application of corbels ...................................................................................... 1
1.3 Corrosion-related damages in structures .......................................................... 2
1.3.1 Corrosion and chemical attacks ............................................................. 3
1.4 Advantages and disadvantages of FRP reinforcing bars. ................................. 4
1.4.1 Advantages of FRP bars ......................................................................... 4
1.4.2 Disadvantages of FRP bars .................................................................... 5
1.5 Thesis organization .......................................................................................... 5
Chapter 2: Literature Review ............................................................................................. 7
2.1 Introduction ...................................................................................................... 7
2.2 Characteristics of corbels/deep beams ............................................................. 7
2.2.1 Strut and tie method (STM) .................................................................... 8
2.2.1.1 Background ................................................................................ 8
2.3 Characteristics of FRP bars ............................................................................ 10
2.4 Studies on shear behavior of concrete beams with internal FRP bars ........... 12
2.4.1 Effect of longitudinal reinforcement ratio on shear strength ................ 17
2.4.2 Effect of transverse reinforcement ratio on shear strength ................... 23
2.4.3 Effect of concrete compressive strength (f 'c) on shear strength .......... 25
2.4.4 Effect of beam total depth, h, and effective depth, d,
on shear strength .................................................................................. 27
xiii
2.4.5 Effect of shear span-to-effective depth ratio (a/d) on
shear strength ................................................................................ …28
2.4.6 Failure modes in literature review ..................................................... 31
2.4.6.1 Diagonal-tension (DT) failure ................................................ 31
2.4.6.2 Shear-tension (ST) failure ...................................................... 32
2.4.6.3 Shear-compression failure...................................................... 32
2.4.6.4 Splitting in the diagonal strut (SP) ......................................... 33
2.4.6.5 Top-compression flexural failure ........................................... 34
2.5 Research significance ..................................................................................... 35
2.6 Scope and objectives ...................................................................................... 36
Chapter 3: Experimental Program.................................................................................... 37
3.1 Introduction .................................................................................................... 37
3.2 Test program .................................................................................................. 37
3.3 Details of test specimens ................................................................................ 38
3.4 Specimen fabrication ..................................................................................... 40
3.5 Material properties ......................................................................................... 46
3.5.1 Concrete ............................................................................................ 47
3.5.2 GFRP reinforcement ......................................................................... 50
3.5.2.1 Preparation of GFRP bars for tensile test............................. 51
3.5.2.2 Fluid displacement method .................................................. 55
3.6 Instrumentation and testing procedure ........................................................... 57
Chapter 4: Experimental Results ..................................................................................... 60
4.1 Introduction .................................................................................................... 60
4.2 Test results of group [A] ................................................................................ 60
4.2.1 Specimens with a/d ratio of 1.0 ........................................................ 60
4.2.1.1 Crack patterns and failure modes ......................................... 61
4.2.1.2 Load-deflection response ..................................................... 63
4.2.1.3 Load-concrete strain response .............................................. 66
4.2.1.3.1 Concrete top strain response ................................ 66
4.2.1.3.2 Concrete diagonal strain response........................ 69
4.2.1.4 Load-GFRP strain response ................................................ 71
4.2.2 Specimens with a/d ratio of 1.5 ....................................................... 73
4.2.2.1 Crack patterns and failure modes ......................................... 73
4.2.2.2 Load-deflection response ..................................................... 76
4.2.2.3 Load-concrete strain response .............................................. 79
4.2.2.3.1 Concrete top strain response ................................ 79
4.2.2.3.2 Concrete diagonal strain response........................ 81
4.2.2.4 Load-GFRP strain response ................................................ 83

xiv
4.3 Test results of group [B] ................................................................................ 84
4.3.1 Specimens with a/d ratio of 1.0 ........................................................ 85
4.3.1.1 Crack patterns and failure modes ......................................... 85
4.3.1.2 Load-deflection response ..................................................... 88
4.3.1.3 Load-concrete strain response .............................................. 90
4.3.1.3.1 Concrete top strain response ................................ 90
4.3.1.3.2 Concrete diagonal strain response........................ 93
4.3.1.4 Load-GFRP strain response ................................................ 95
4.3.2 Specimens with a/d ratio of 1.5 ........................................................ 96
4.3.2.1 Crack patterns and failure modes ......................................... 96
4.3.2.2 Load-deflection response .................................................... .99
4.3.2.3 Load-concrete strain response ............................................ 100
4.3.2.3.1 Concrete top strain response .............................. 100
4.3.2.3.2 Concrete diagonal strain response...................... 102
4.3.2.4 Load-GFRP strain response .............................................. 103
4.4 Performance of Evaluation........................................................................... 105
4.4.1 Group [A] specimens with f’c = 20 MPa .......................................... 105
4.4.2 Group [B] specimens with f’c = 40 MPa .......................................... 107
Chapter 5: Analytical Modeling ..................................................................................... 109
5.1 Introduction .................................................................................................. 109
5.2 Strut and tie model ....................................................................................... 109
5.2.1 Overview .......................................................................................... 109
5.2.2 STM solution approach .................................................................... 110
5.2.2.1 Struts ................................................................................... 112
5.2.2.2 Ties ...................................................................................... 116
5.2.2.3 Nodes .................................................................................. 117
5.2.3 Solution procedure ........................................................................... 117
5.3 Boyan I. Mihaylov’s equations .................................................................... 120
5.4 Jang et.al equations ...................................................................................... 121
5.5 Bending moment capacity (BMC) based on ACI 440 ................................. 122
5.6 Comparative analysis ................................................................................... 122
Chapter 6: Conclusions and Recommendations............................................................. 126
6.1 Introduction .................................................................................................. 126
6.2 Conclusions .................................................................................................. 127
6.3 Recommendations ........................................................................................ 130
References ...................................................................................................................... 132
Appendix ........................................................................................................................ 136

xv
List of Tables
Table 2.1: Literature review .................................................................................................................13
Table 2.2: Effect of a/d ratio on shear strength (kN) .................................................. ............31
Table 3.1: Test matrix ..............................................................................................................................38
Table 3.2: C20 concrete mix proportions .......................................................................................47
Table 3.3: C40 concrete mix proportions .......................................................................................47
Table 3.4: 28-day compressive strength results of concrete cylinders ............................49
Table 3.5: 28-day compressive strength results of concrete cubes ...................................49
Table 3.6: Concrete splitting strength results ..............................................................................50
Table 3.7: Mechanical properties of GFRP bars ........................................................................51
Table 3.8: Tensile test results of the GFRP bars ........................................................................51
Table 3.9: Test results of the fluid displacement method ......................................................57
Table 4.1: Experimental results of the group [A] ......................................................................76
Table 4.2: Experimental results of the group [B] ......................................................................98
Table 5.1: Experimental and analytical results .........................................................................124
xvi
List of Figures
Figure 1.1: Typical concrete corbels......................................................................................................2
Figure 2.1: Bottle-shaped struts are wider in the middle.............................................................9
Figure 2.2: Diagonal cracks in strut.......................................................................................................9
Figure 2.3: Types of nodes …………………………………….……………………………………….10
Figure 2.4: Fiber reinforced polymer bars (Carbon Fiber Rebar, 2016),
(Basalt Rebar, 2016), (AFRP, 2016), (GFRP,2016) ………………………….11
Figure 2.5: Effects of transverse reinforcement on nominal shear
strength (ρv %) ……………………………………………………………………………..24
Figure 2.6: Effect of concrete strength on (a) deflection; (b) shear
capacity……..................................................................................... .......................................26
Figure 2.7: Effect of total depth "h" on the shear capacity of GFRP and CFRP
reinforced concrete deep beams..................................................................................28
Figure 2.8: Effect of a/d ratio on the load carrying capacity ………………………….……29
Figure 2.9: Effect of increasing the a/d ratio on shear strength............................................30
Figure 2.10: Diagonal tension failure ……………...………………..……………………..……..........32
Figure 2.11: Shear tension failure............................................................................... ...................................32
Figure 2.12: Shear compression failure in deep beams ……………………………......…….....33
Figure 2.13: Tensile stresses that are perpendicular to the diagonal strut resulted
in the splitting of that diagonal compression strut …………...……........……34
Figure 2.14: A typical diagonal splitting failure ………………..………………..…………….34
Figure 2.15: Top-compression flexural failure ……………………………..…………..…...….35
Figure 3.1: A typical corbel from group A (a/d=1) showing the locations of the
strain-gauges (SG), steel ties, and GFRP bars ………………….……......…..39
Figure 3.2: A typical corbel from group B (a/d=1.5) showing the locations of the
strain-gauges (SG), steel ties, and GFRP bars ...................................................40
Figure 3.3: A typical GFRP cage……..……………………………………………..….………...…..41
Figure 3.4: All twelve GFRP cages………………………………...……………………………......41
Figure 3.5: GFRP bar preparation .......................................................................................................41
Figure 3.6: Pushing down on the strain gauge using a special paper …….………...……42
Figure 3.7: Strain gauge bonded to the bar ……………………………………………………….42
Figure 3.8: Protecting the strain gauge using an isolation tape ............................................42
xvii
Figure 3.9: Wrapping strain gauge setup using electrical tape ……………………………..42
Figure 3.10: The GFRP cages with strain gauges bonded to the bars……….……………43
Figure 3.11 (a): A typical formwork (mold) with GFRP cage inside ……………………44
Figure 3.11 (b): All formwork with GFRP cages inside ……………………………………..44
Figure 3.12: Vibration of concrete …………………………………………………………………...44
Figure 3.13: Leveling the surface …………………………………………………………………….45
Figure 3.14: Initial curing of concrete using plastic sheet directly aster casting ….…..45
Figure 3.15: Curing of corbel specimens …………………………………………….……………45
Figure 3.16: Curing concrete cylinders and cubes in water tank ………………………….46
Figure 3.17: Smoothening the top surface ………………………………………………………...48
Figure 3.18: Preparation and testing of specimens ……………………………………………..48
Figure 3.19: GFRP bars used in this study ………………………………………………………..50
Figure 3.20: A 10 mm GFRP bar inserted in steel tubes from both sides ……………...52
Figure 3.21 (a): 500 mm steel tubes …………………………………………………………………52
Figure 3.21 (b): Plastic teflon rings ……..…………………………………………………………...52
Figure 3.22: Preparation of the epoxy resin mixture ………….……………………………….53
Figure 3.23: Installing the GFRP bar inside the steel
tube for the Pull-test ……………………………………………………………………53
Figure 3.24: Flattening the GFRP ribs at the marked locations …………………………....54
Figure 3.25: Strain gauges bonded at their marked locations ………………………………54
Figure 3.26: Testing the tensile strength of the GFRP bars………………….………………55
Figure 3.27: Graduated cylinder filled with water up to 1400 ml .......................................56
Figure 3.28: Immersing the 12 mm GFRP in the graduated cylinder ………………...…56
Figure 3.29: The amount of water raised was the volume of the 12 mm GFRP
bar ………………………………………………………………………………………………56
Figure 3.30: Test in progress for corbel specimens ……………………………………………58
Figure 3.31: Test setup and instrumentation of typical
corbel specimens ………………………………………………………………………...59
Figure 4.1 (a): Crack patterns in C20-R1-G3 corbel specimen ……………………………62
Figure 4.1 (b): Crack patterns in C20-R1-G4 corbel specimen ………....…………………62
Figure 4.1 (c): Crack patterns in C20-R1-G6 corbel specimen ……………………………63
Figure 4.2: Load-deflection responses for corbel specimens C20-R1-G3, C20-R1-G4,
and C20-R1-G6 …………………………………………………………………………….64

xviii
Figure 4.3: Load-top concrete strain responses for corbel specimens
C20-R1-G3, C20-R1-G4, and C20-R1-G6 ……………………………………......67
Figure 4.4: Load-diagonal concrete strain responses for corbel specimens
C20-R1-G3, C20-R1-G4, and C20-R1-G6 ………………………....……………70
Figure 4.5: Load-GFRP strain responses for corbel specimens C20-R1-G3,
C20-R1-G4, and C20-R1-G6 …………………………………………………….…...72
Figure 4.6 (a): Crack patterns and failure mode in C20-R1.5-G3
corbel specimen …………………………………………………………………………..74
Figure 4.6 (b): Crack patterns and failure mode in C20-R1.5-G4
corbel specimen …………………………………………………………………………..75
Figure 4.6 (c): Crack patterns and failure mode in C20-R1.5-G6
corbel specimen …………………………………………………………………………..75
Figure 4.7: Load-deflection responses for corbel specimens C20-R1.5-G3,
C20-R1.5-G4, and C20-R1.5-G6 ………………………………....………………….77
Figure 4.8: Load-top strain responses for corbel specimens C20-R1.5-G3,
C20-R1.5-G4, and C20-R1.5-G6 ……………………………………………………79
Figure 4.9: Load-diagonal strain responses for corbel specimens C20-R1.5-G3,
C20-R1.5-G4, and C20-R1.5-G6 ……………………………………………………82
Figure 4.10: Load-GFRP strain responses for corbel specimens C20-R1.5-G3,
C20-R1.5-G4, and C20-R1.5-G6 ……………………………………………………84
Figure 4.11 (a): Crack patterns and failure mode in C40-R1-G3
corbel specimen …………………………………………………………………………..86
Figure 4.11 (b): Crack patterns and failure mode in C40-R1-G4
corbel specimen …………………………………………………………………………..87
Figure 4.11 (c): Crack patterns and failure mode in C40-R1-G6
corbel specimen …………………………………………………………………………..87
Figure 4.12: Load-deflection responses for corbel specimens C40-R1-G3,
C40-R1-G4, and C40-R1-G6 ………………………………………………………...89
Figure 4.13: Load-top strain responses for corbel specimens C40-R1-G3,
C40-R1-G4, and C40-R1-G6 ………………………………………………………...91
Figure 4.14: Load-diagonal strain responses for corbel specimens C40-R1-G3,
C40-R1-G4, and C40-R1-G6 ……………………………………………………….93
xix
Figure 4.15: Load-GFRP strain responses for corbel specimens C40-R1-G3,
C40-R1-G4 and C40-R1-G6 ………………………………………………………...95
Figure 4.16 (a): Crack patterns and failure mode in C40-R1.5-G3
corbel specimen …………………………………………………………………………..97
Figure 4.16 (b): Crack patterns and failure mode in C40-R1.5-G4
corbel specimen …………………………………………………………………………..97
Figure 4.16 (c): Crack patterns and failure mode in C40-R1.5-G6
corbel specimen …………………………………………………………………………..98
Figure 4.17: Load-deflection responses for corbel specimens C40-R1.5-G3,
C40-R1.5-G4, and C40-R1.5-G6 …………………………………………………...99
Figure 4.18: Load-top strain responses for corbel specimens C40-R1.5-G3,
C40-R1.5-G4 and C40-R1.5-G6 …………………………………………………101
Figure 4.19: Load-diagonal strain responses for corbel specimens C40-R1.5-G3,
C40-R1.5-G4, and C40-R1.5-G6 ………………………………………………...103
Figure 4.20: Load-GFRP strain responses for corbel specimens C40-R1.5-G3,
C40-R1.5-G4, and C40-R1.5-G6 ………………………………………………...104
Figure 4.21: Effect of increasing the GFRP reinforcement ratios and the a/d ratios
on shear strength of corbel specimens of group [A] ……………………....106
Figure 4.22: Effect of increasing the GFRP reinforcement ratios and the a/d ratios
on shear strength of corbel specimens of group [B] ………………………108
Figure 5.1: Trajectory of the internal forces generated by the externally applied loads
on the corbels ……………………………………………………………………………..111
Figure 5.2: The strut and tie model for the corbels specimens of this study …...……112
Figure 5.3: Schematic drawing of the strut and tie model showing the
notations ……………………...……………………………………………...……………..114
Figure 5.4: Geometry of the node at the support ……………………………………………...114
Figure 5.5: A typical nodal region showing the strains in the diagonal struts and the
strains in the tie…………………………………………………………………….……..116
Figure 5.6: Iteration procedure to determine the load capacity for corbels/deep
beams using STM ……………………………………………………………………….119
Figure 5.7: 2PKT for deep beams reinforced with FRP bars ……………………...…………..120
xx
List of Symbols
a = Shear span
a/d = Shear span-to-depth ratio
Af = Area of GFRP
ag = Maximum aggregate size
bw = width of the corbel’s cross-section
d= Effective depth of corbel
db= diameter of the GFRP bar
Ec = Young’s Modulus of concrete
Ef = Young’s modulus of FRP reinforcement
Es = Young’s Modulus of steel reinforcement
fc’ = Cylinder compressive strength of concrete
fcu = Limiting compressive stress in strut
ff = Stress in FRP reinforcement in tension
ffu = GFRP tensile ultimate tensile strength
Fs = Force of the inclined diagonal strut
fsc = Stress on the inclined diagonal strut
ft = Splitting tensile strength
xxi
h= Height of the corbel
H= Height of the corbel
hbn= Height of the bottom node
htn= Height of the top node
k = crack shape factor;
lb1 = width of loading plate parallel to longitudinal axis of member
lb1e = effective width of loading plate parallel to longitudinal axis of member
lb2 = width of support plate parallel to longitudinal axis of member
lk = length of dowels provided by bottom longitudinal reinforcement
lo = length of heavily cracked zone at the bottom of the critical diagonal crack
lt = cracked length along bottom reinforcement
Mn = nominal bending moment
P = applied point load
P = Ultimate load
s = crack slip
scr = distance between radial cracks along bottom longitudinal reinforcement
sxe = effective crack spacing
T = Tensile force
V = Shear force
xxii
Vci = shear resisted by aggregate interlock
VCLZ = shear resisted by the CLZ
Vd = shear resisted by dowel action
Vexp = measured shear strength
Vpred = predicted shear strength
w = width of critical crack
wbn= Width of the bottom node
wst= Width of diagonal strut
wtn= Width of the top node
α = Angle of inclination of the diagonal strut
α1 = angle of critical diagonal crack
β1 = Depth factor of equivalent rectangular stress block
Δ = mid-span deflection of beam
Δc = shear distortion of critical loading zone
δx = displacement along x-axis
δz = displacement along z-axis
ε1 = Principle tensile strain in cracked concrete due to loads.
εcu = Compressive strain in concrete
εcu = Ultimate compressive strain in concrete
xxiii
εf = Tensile strain in the FRP bar
εt;avg = average strain along bottom longitudinal reinforcement;
θ = angle of diagonal cracks in uniform stress field
θb = rotation of rigid block;
ρb = Balanced reinforcement ratio
ρf = FRP Longitudinal reinforcement ratio
ρh = ratio of horizontal web reinforcement
ρl = ratio of bottom longitudinal reinforcement
ρv = FRP Transverse reinforcement ratio
1
Chapter 1: Introduction
1.1 Overview
Corbels are structural members widely used in practice for supporting beams
and girders. Like other structural reinforced concrete members, corbels can be
susceptible to corrosion and as a result, their strength may be reduced. This research
aims at investigating the structural performance of double-sided concrete corbels
totally reinforced with Glass-Fiber Reinforced Polymer (GFRP) bars. The use of
GFRP bars in reinforcing concrete members, such as corbels, would eliminate
corrosion problems and thus increase the service life of the structure. This chapter
describes the causes of corrosion-related damages in reinforced concrete structures,
and highlights the need for overcoming these causes. It also highlights the
applications of the Fiber Reinforced Polymers (FRP) bars in structures. This chapter
concludes with a breakdown of the thesis organization.
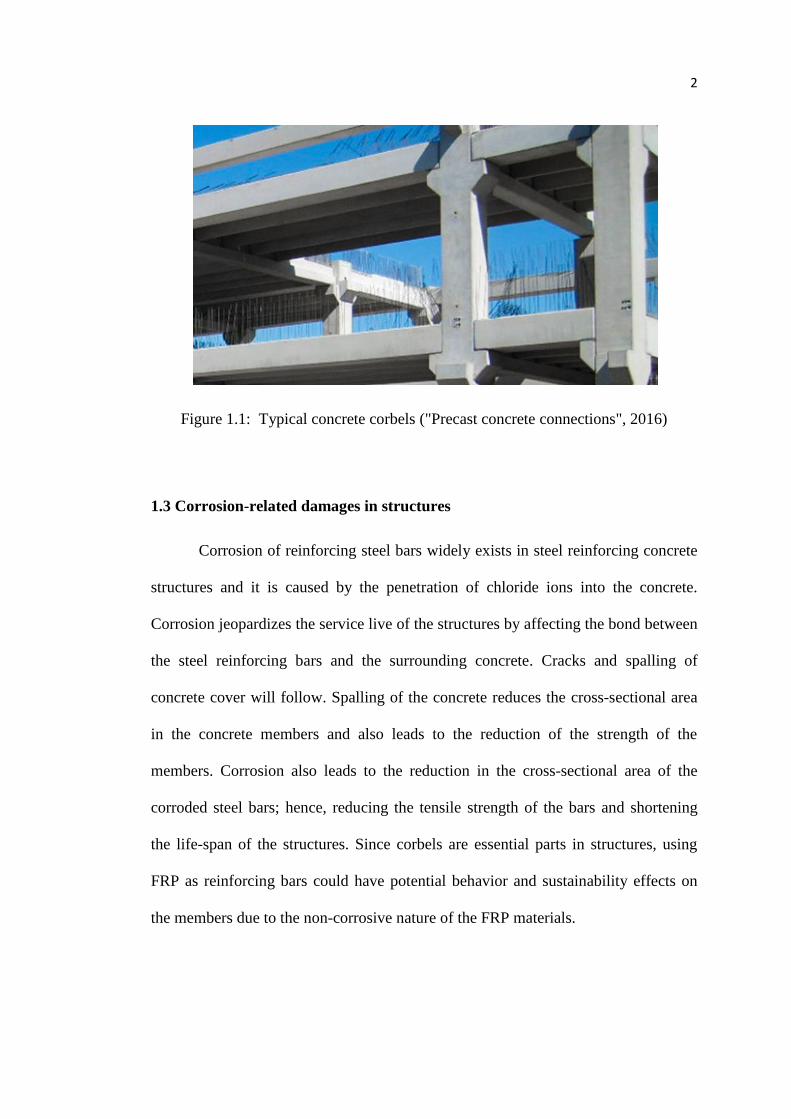
1.2 Application of corbels
Corbels are structural members that project from the face of columns and
walls and are commonly used in reinforced concrete structures such as bridges
(inverted T-beams), parking garages, pre-cast structural buildings, and industrial
buildings with overhead cranes. Corbels are short members with shear span-to-depth
ratio (a/d) less than 2.0. Figure 1.1 shows typical corbels that transfer the loads from
the girders to the columns.
2
Figure 1.1: Typical concrete corbels ("Precast concrete connections", 2016)
1.3 Corrosion-related damages in structures
Corrosion of reinforcing steel bars widely exists in steel reinforcing concrete
structures and it is caused by the penetration of chloride ions into the concrete.
Corrosion jeopardizes the service live of the structures by affecting the bond between
the steel reinforcing bars and the surrounding concrete. Cracks and spalling of
concrete cover will follow. Spalling of the concrete reduces the cross-sectional area
in the concrete members and also leads to the reduction of the strength of the
members. Corrosion also leads to the reduction in the cross-sectional area of the
corroded steel bars; hence, reducing the tensile strength of the bars and shortening
the life-span of the structures. Since corbels are essential parts in structures, using
FRP as reinforcing bars could have potential behavior and sustainability effects on
the members due to the non-corrosive nature of the FRP materials.
3
1.3.1 Corrosion and chemical attacks
Corrosion of steel reinforcing bars usually occurs either because of the
chloride ions that are diffused into the concrete from atmosphere, or because of the
carbon dioxide that is diffused inside the concrete pores and has reached the steel
bars. The electrical resistivity of concrete is inversely proportional to corrosion of the
steel reinforcement. Concrete with high water-to-cement ratio (w/c) has many pores
and; therefore, has low resistivity. As a result, chloride ions are easily absorbed and
can reach the steel bars and corrode them. Once spalling of concrete follows, the
structural member will be jeopardized because the reinforcing steel bars will be
exposed to chloride and carbon dioxide ions and the corrosion rate will increase.
In bridge applications, the use of deicing salts (NaCl) is a common practice in
the United States and European countries, especially in winter times. Chloride ions
from the NaCL salts penetrate in concrete and corrode the steel bars. As a result of
corrosion, the Federal Highway Administration (FHWA 2011) reported that almost
one quarter of the bridges in the United States are marked as either structurally
deficient or functionally obsolete. According to Li and Sagüés (2001), the
Transportation Research Broad 1991 reported that the annual cost to repair bridge
decks for corrosion due to deicing salts is estimated to be $50 to $200 million with
another $100 million needed to repair substructures and other bridge components. To
overcome corrosion threat, many studies recommend coating the steel bars with
epoxy to prevent corrosion. However, if a steel bar is not coated properly the
corrosion will be concentrated in the un-coated spots of the bars. This would
eventually lead to the reduction in the steel bars strength. Another alternative to
4
overcome the corrosion threat is proposing the use of FRP bars in reinforcing
concrete structures.
FRP bars have been recently proposed as an alternative to steel
reinforcement bars in structures due to their high strength-to-weight ratio and their
immunity to corrosion. However, very little has been given to the performance of
corbels reinforced with internal FRP bars. This study investigated, experimentally
and analytically the shear behavior of double-sided concrete corbels internally
reinforced with GFRP bars. Strut-and-Tie method (STM) was also utilized to predict
the strength of such members.
1.4 Advantages and disadvantages of FRP reinforcing bars
1.4.1 Advantages of FRP bars
FRP bars exhibits high tensile strength, up to two times higher than the
tensile strength of steel bars (FRP Rebar advantages, 2016). FRP bars are lighter than
steel bars, they weigh approximately one-quarter the weight of their steel
counterparts, offering essential savings in both placement and use. FRP bars are non-
corrosive materials and can be used in concrete structures as reinforcing bars. Using
FRP bars in structures reduces corrosion maintenance and rehabilitation cost and;
thus, prolongs the service live of the structures.
Since FRP bars are thermally non-conductive and electromagnetically
neutral, they can be suitable for important structures like airports and
telecommunications towers, railroads, and transformers ("Power Bar", 2016),
(Walton and Bradberry 2005).
5
1.4.2 Disadvantages of FRP bars
FRP bars are brittle materials. They have higher initial costs than steel
reinforcing bars. FRP bars have lower modulus of elasticity than steel bars, and
because of that, the crack widths are usually wider in beams reinforced with FRP
bars when compared with beams reinforced with steel bars (FRP Rebar
disadvantages, 2016). The dowel action of the FRP bars is lower than that of steel
bars. FRP bars have less fire-resistance than steel bars. In addition, FRP bars’ shape
has to be fabricated for each specific configuration and cannot be changed on site.
Furthermore, FRP bars experience a reduction in strength over time in moist and
alkaline environment. The ACI 440.1R-06 recommends the use of the
“Environmental Degradation Factor” multiplied by the guaranteed tensile strength to
reflect the strength of the bars at the end of the service life of the structure.
1.5 Thesis organization
This research aims at investigating the shear response of concrete corbels
reinforced internally with GFRP bars. Twelve specimens were tested experimentally
and were numerically analyzed using finite-element (FE) modeling. This section
presents the organization of this thesis.
Chapter (1) illustrates the application of corbels, damages of structures due to
corrosion, and advantages and disadvantages of FRP reinforcement bars in
structures.
Chapter (2) presents an extensive literature review on deep beams reinforced
with FRP bars to examine the effect of different test parameters on the shear strength
6
of deep beams. The research needs and specific objectives of the study are presented
at the end of the chapter.
Chapter (3) presents the experimental work conducted at the UAE-
University. The test program and the test matrix are presented. Specimen fabrication
and material properties are presented and discussed in this chapter. The
instrumentation and testing procedure are illustrated at the end of this chapter.
Chapter (4) presents the results of the twelve corbels after testing. The results
include mode of failure, load-deflection response, load-compression strain response,
and load-GFRP strain relationships. The chapter also discusses the effect of the test
parameters (GFRP reinforcement ratio, shear span-to-effective depth (a/d) ratio, and
concrete compressive strength) on the shear strength of the tested corbels.
Chapter (5) presents a numerical procedure for calculating the shear capacity
of corbels internally reinforced with GFRP rods using the Strut-and-tie method
(STM) in accordance with the Canadian code (CSA-S806-12). Equations from
literature were also used for predicting the shear strengths of the tested corbels.
Chapter (6) presents the main conclusions of this study and proposes
recommendations for future investigations.
7
Chapter 2: Literature Review
2.1 Introduction
This section presents a review of available literature on disturbed regions that
are reinforced with FRP bars. The characteristics of corbels which act as deep beams
and FRP bars are discussed in the following two sections. Although deep beams
might be subjected to both flexure and shear failure, the focus in this study is on the
shear roivaheb because shear is the governing mode of failure in such deep beams
and corbels. Previous studies on the shear behavior of concrete beams with internal
FRP reinforcing bars are summarized in the subsequent section. Based on the
literature review, the parameters considered in the reported experimental and
analytical studies on the shear strength of reinforced concrete beams are the
longitudinal reinforcement ratio, transverse reinforcement ratio, concrete
compressive strength (f 'c), shear span-to-depth ratio (a/d), and size of the cross-
section of the members. These parameters are discussed in section 2.4. Finally, the
research needs and objectives are highlighted at the end of this chapter.
2.2 Characteristics of corbels/deep beams
Corbels are structural short concrete members that extend from a column or a
wall to support loads. Corbels are commonly used in structures such as bridges,
parking garages, and high rise buildings. Corbels are considered as deep beams since
their shear span-to-depth ratio usually is less than 2.0. According to ACI-318
(section 10.7.1), a reinforced concrete member can be categorized as a deep beam if
the region of the concentrated loads are within twice the member depth from the face
of the support (a/d <2.0). El-Maaddawy and Sherif (2013) reported that Corbels are
8
characterized by a complex flow of internal stresses and because of that the
conventional beam theory is not valid. Sclaich et al. (1987) and El-Maaddawy and
Sherif (2013) reported that in disturbed regions (D-regions) of a concrete member,
a/d < 2, the neutral axis depth varies along the member length.
Corbels are also considered as disturbed regions (D-regions) since the strain
distribution along their depths is non-linear. Nilson et al. (2010) reported that a D-
region in a structural member is a region where the stresses and strains in that
member are not linearly distributed throughout the depth of the member cross-
section.
The behavior of reinforced concrete deep beams is different from that of
slender beams. Deep beams usually have larger magnitude of shear strength than
slender beams. Unlike slender beams, deep beams transfer shear forces to the
supports through diagonal compression struts creating compression stresses rather
than shear stresses. Such mechanism is called an arch action. The arching action
consists of compression struts in concrete members that will act as ribs between the
applied load and the support once they are overloaded (CSA-S806-12; ACI 318;
Faraghaly and Benmokrane 2013; Abed et al. 2012; El-Sayed et al. 2012; Razaqpur
et al. 2004). Strut-and-Tie method (STM) is a technique used to analyze D-regions.
The STM is discussed in the following section.
2.2.1 Strut and tie method (STM)
2.2.1.1 Background
To analyze the behavior of deep beams, the STM is utilized. Strut and tie
method is a technique which goes back to 1902 and evolved in the 1980s to solve the
9
discontinuity regions in reinforced concrete members. The model consists of struts,
ties, and nodal zones. The struts are compression members in the model, while the
ties are tension members. Struts can be rectangular or bottle shaped as shown in
figure 2.1. Bottle shaped struts are wider at the center than at the ends. It forms when
the surrounding concrete allows the compression field to spread laterally (Nilson et
al. 2010). As the compressive force spreads along the length of the bottle shaped
strut, tensile stresses perpendicular to the axis of the strut may result in diagonal
cracking as shown in figure 2.2.
Because of the diagonal cracking (splitting), bottle shaped struts are weaker
than rectangular struts even though bottle-shaped struts possess larger cross-section
at their mid-length. This basically means that it requires lesser force to split the bottle
shaped struts than to split the rectangular struts. Rectangular struts require larger
force to split because of the lack of a gradient that exacerbates the splitting tensile
stresses. The diagonal splitting of the bottle shaped struts can be reduced by adding
transverse reinforcement.
Ties consist of reinforcement bars plus a portion of concrete that encircles
them. The surrounding concrete defines the tie cross-section area. For design
Figure 2.1: Bottle-shaped struts are wider
in the middle (Nilson et al. 2010) Figure 2.2: Diagonal cracks in strut
(Nilson et al. 2010)
10
purposes, it is assumed that the tensile forces are carried by the reinforcement bars,
not by the concrete.
The points where the struts and ties intersect are called the nodal zones
(figure 2.3). Analysis of the model (STM model) requires that the different struts,
ties, and nodal zones to be in equilibrium. Different forces might act on the nodes as
shown in figure 2.3 below. For instance, a CCC node is a node that resists three
compression forces. Likewise, a TTT node is a node that resists three tension forces.
Figure 2.3: Types of nodes (Nilson et al. 2010)
2.3 Characteristics of FRP bars
In order to make structures last longer, environmentally friendly, and sustain
more loads many studies recommends the use of fiber-reinforced polymers (FRP)
bars for internal reinforcement instead of steel due to their high tensile strength and
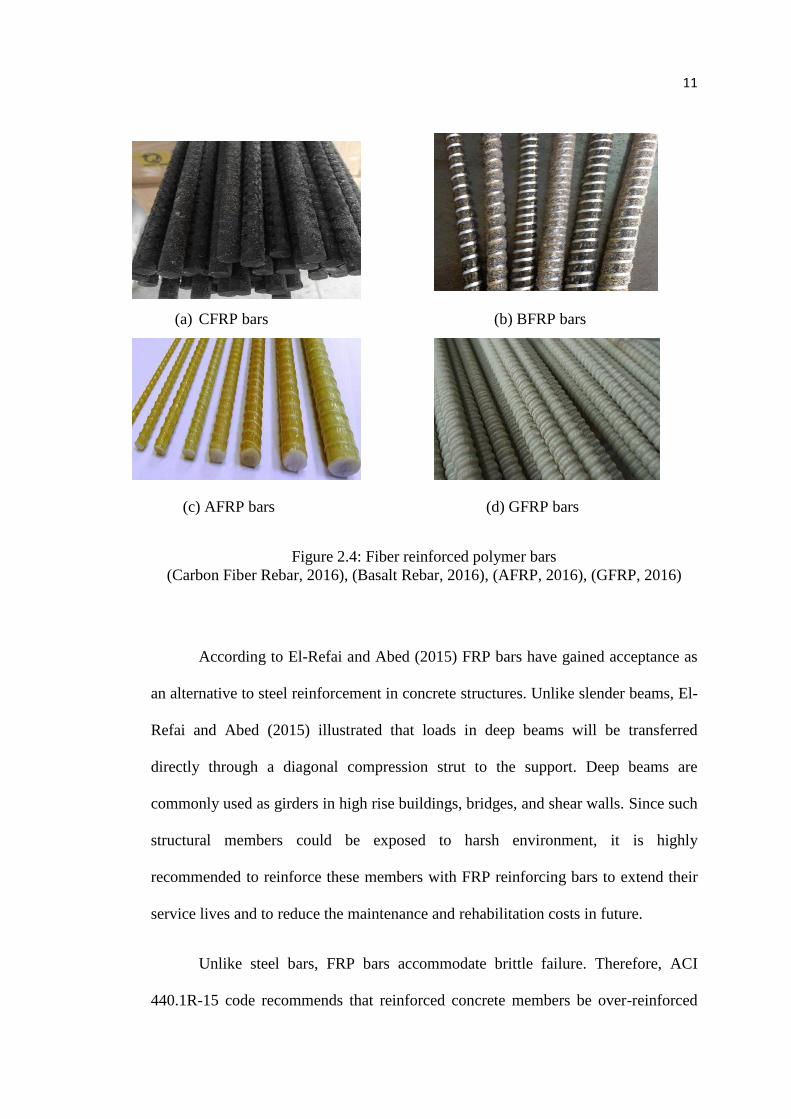
their immunity to corrosion. There are four types of FRP bars, Carbon-FRP (CFRP),
Basalt-FRP (BFRP), Aramid FRP (AFRP), and, Glass-FRP (GFRP), as shown in
figure 2.4 below. All four types are corrosion free and are able to withstand higher
tensile strengths than steel bars.
11
(a) CFRP bars (b) BFRP bars
(c) AFRP bars (d) GFRP bars
Figure 2.4: Fiber reinforced polymer bars
(Carbon Fiber Rebar, 2016), (Basalt Rebar, 2016), (AFRP, 2016), (GFRP, 2016)
According to El-Refai and Abed (2015) FRP bars have gained acceptance as
an alternative to steel reinforcement in concrete structures. Unlike slender beams, El-
Refai and Abed (2015) illustrated that loads in deep beams will be transferred
directly through a diagonal compression strut to the support. Deep beams are
commonly used as girders in high rise buildings, bridges, and shear walls. Since such
structural members could be exposed to harsh environment, it is highly
recommended to reinforce these members with FRP reinforcing bars to extend their
service lives and to reduce the maintenance and rehabilitation costs in future.
Unlike steel bars, FRP bars accommodate brittle failure. Therefore, ACI
440.1R-15 code recommends that reinforced concrete members be over-reinforced

12
with FRP bars because if the reinforcement ratio is less than the balanced
reinforcement ratio (ρf < ρb), the FRP rupture limit state controls. On the other hand,
if the reinforcement ratio is greater than the balanced reinforcement ratio, (ρf > ρb)
the concrete crushing limit state controls. According to studies done by Issa el al.
(2016); El-Refai and Abed (2015); and El-Sayed (2012), increasing the FRP
longitudinal reinforcement ratio also increases the shear strength of the member.
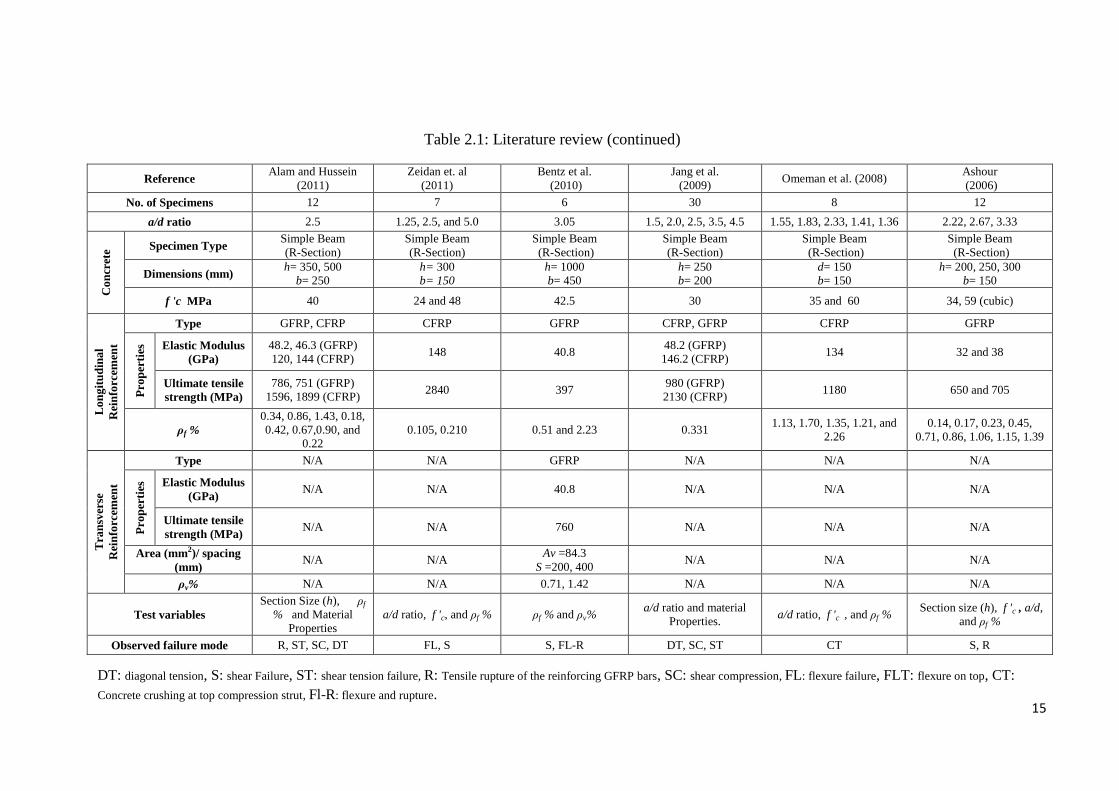
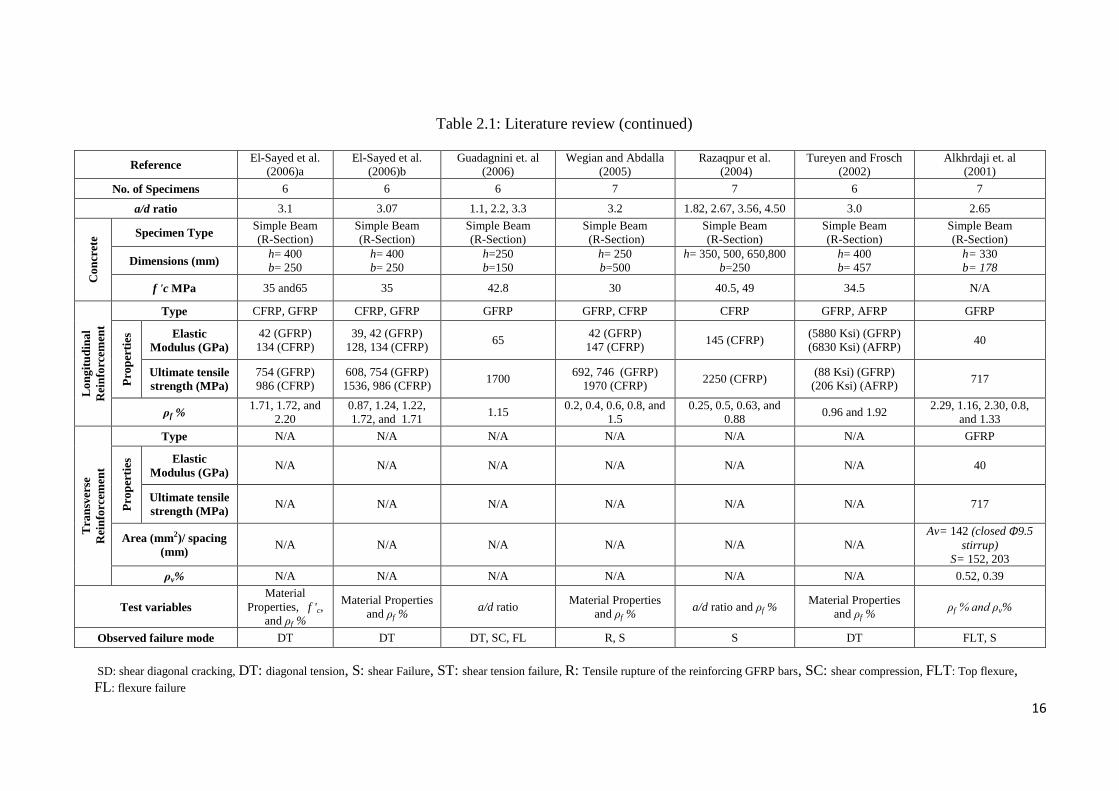
2.4 Studies on shear behavior of concrete beams with internal FRP bars
This section summarizes the state-of- the-arts literature on the shear behavior
of concrete beams internally reinforced with FRP bars. The parameters investigated
in the summarized studies are listed in Table 2.1 and are identified as the longitudinal
FRP reinforcement ratios (ρf %), the vertical FRP reinforcement ratios (ρv %),
compressive strengths of concrete (f 'c), size effect (h), and shear span-to- effective
depth ratio (a/d) of the concrete beams. The following sections discuss the effects of
these parameters on the shear strengths of the beams internally reinforced with FRP
bars.
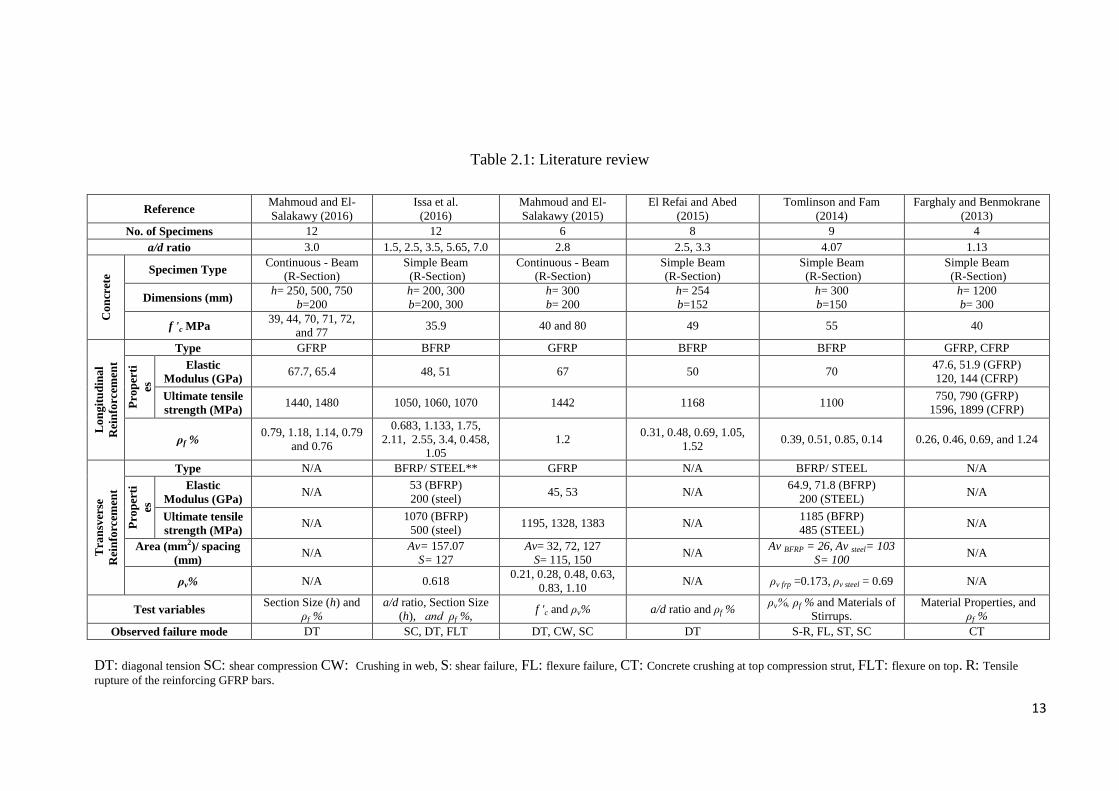
13
Table 2.1: Literature review
Reference Mahmoud and El-
Salakawy (2016)
Issa et al.
(2016)
Mahmoud and El-
Salakawy (2015)
El Refai and Abed
(2015)
Tomlinson and Fam
(2014)
Farghaly and Benmokrane
(2013)
No. of Specimens 12 12 6 8 9 4
a/d ratio 3.0 1.5, 2.5, 3.5, 5.65, 7.0 2.8 2.5, 3.3 4.07 1.13
Co
ncr
ete Specimen Type
Continuous - Beam
(R-Section)
Simple Beam
(R-Section)
Continuous - Beam
(R-Section)
Simple Beam
(R-Section)
Simple Beam
(R-Section)
Simple Beam
(R-Section)
Dimensions (mm) h= 250, 500, 750
b=200
h= 200, 300
b=200, 300
h= 300
b= 200
h= 254
b=152
h= 300
b=150
h= 1200
b= 300
f 'c MPa 39, 44, 70, 71, 72,
and 77 35.9 40 and 80 49 55 40
Lo
ng
itu
din
al
Rei
nfo
rcem
ent
Type GFRP BFRP GFRP BFRP BFRP GFRP, CFRP
Pro
per
ti
es
Elastic
Modulus (GPa) 67.7, 65.4 48, 51 67 50 70
47.6, 51.9 (GFRP)
120, 144 (CFRP)
Ultimate tensile
strength (MPa) 1440, 1480 1050, 1060, 1070 1442 1168 1100
750, 790 (GFRP)
1596, 1899 (CFRP)
ρf % 0.79, 1.18, 1.14, 0.79
and 0.76
0.683, 1.133, 1.75,
2.11, 2.55, 3.4, 0.458,
1.05
1.2 0.31, 0.48, 0.69, 1.05,
1.52 0.39, 0.51, 0.85, 0.14 0.26, 0.46, 0.69, and 1.24
Tra
nsv
erse
Rei
nfo
rcem
ent
Type N/A BFRP/ STEEL** GFRP N/A BFRP/ STEEL N/A
Pro
per
ti
es
Elastic
Modulus (GPa) N/A
53 (BFRP)
200 (steel) 45, 53 N/A
64.9, 71.8 (BFRP)
200 (STEEL) N/A
Ultimate tensile
strength (MPa) N/A
1070 (BFRP)
500 (steel) 1195, 1328, 1383 N/A
1185 (BFRP)
485 (STEEL) N/A
Area (mm2)/ spacing
(mm) N/A
Av= 157.07
S= 127
Av= 32, 72, 127
S= 115, 150 N/A
Av BFRP = 26, Av steel= 103
S= 100 N/A
ρv% N/A 0.618 0.21, 0.28, 0.48, 0.63,
0.83, 1.10 N/A ρv frp =0.173, ρv steel = 0.69 N/A
Test variables Section Size (h) and
ρf %
a/d ratio, Section Size
(h), and ρf %, f 'c and ρv% a/d ratio and ρf %
ρv%, ρf % and Materials of
Stirrups.
Material Properties, and
ρf %
Observed failure mode DT SC, DT, FLT DT, CW, SC DT S-R, FL, ST, SC CT
DT: diagonal tension SC: shear compression CW: Crushing in web, S: shear failure, FL: flexure failure, CT: Concrete crushing at top compression strut, FLT: flexure on top. R: Tensile
rupture of the reinforcing GFRP bars.

14
Reference Ashour and Kara
(2014)
Matta et. al
(2013)
Alam and Hussein
(2013)
Abed et al.
(2012)
El-Sayed et al.
(2012)
Alam and Hussein
(2012)
No. of Specimens 6 15 8 9 10 6
a/d ratio 2.7, 3.6, and 5.9 3.1 2.5 1.0, 1.04, 1.08, 1.3, 1.52 0.92, 1.30, 1.69 2.5
Co
ncr
ete
Specimen Type Simple Beam
(R-Section)
Simple Beam
(R-Section)
Simple Beam
(R-Section)
Simple Beam
(R-Section)
Simple Beam
(R-Section)
Simple Beam
(R-Section)
Dimensions (mm) h= 200, 300, 400
b= 200
d= 883, 880, 292, and
146
b= 457, 114, and 229
h= 350, 500, 650, and
800
b= 250, 300
h= 300
b= 200
h= 225
b=200
h= 350, 500, 650
b= 250, 300
f 'c MPa 21.6, 28 and 23.2 30 and 40 40 43, 51, and 65 40 70
Lo
ng
itu
din
al
Rei
nfo
rcem
ent
Type CFRP GFRP CFRP, GFRP GFRP CFRP, GFRP GFRP, CFRP
Pro
per
ties
Elastic
Modulus (GPa) 141 41, 43.2, 48.2
42 (GFRP)
134 (CFRP) 51
134 (CFRP)
42 (CFRP)
46.3, 48.2 (GFRP)
120, 144 (CFRP)
Ultimate tensile
strength (MPa) 1100 476, 483, 849, 751
751, 786 (GFRP)
1596, 1899 (CFRP) 1050
986 (CFRP)
749 (GFRP)
751, 786 (GFRP)
1596, 1899 (CFRP)
ρf % 0.221, 0.110, 0.147,
0.442, 0.3, 0.220 0.12, 0.13, 0.24, 0.28 0.42, 0.9
0.92, 1.12, 1.26, 1.38,
and 1.84 0.78, 1.24, 1.71, and 1.78
0.42, 0.65, 0.69, 0.87,
1.25, and 1.37
Tra
nsv
erse
Rei
nfo
rcem
ent
Type N/A N/A N/A N/A N/A N/A
Pro
per
ties
Elastic
Modulus (GPa) N/A N/A N/A N/A N/A N/A
Ultimate tensile
strength (MPa) N/A N/A N/A N/A N/A N/A
Area (mm2)/ spacing
(mm) N/A N/A N/A N/A N/A N/A
ρv% N/A N/A N/A N/A N/A N/A
Test variables ρf % Section Size (h), ρf %,
and f 'c Section size (h) a/d ratio, f 'c, and ρf %
a/d ratio, material
Properties, and ρf %
Section Size (h), Material
properties, and ρf %
Observed failure mode SD DT, SC DT, SC, ST SP, CT, CD SP, SC, FLT SC, DT
SP: Splitting in the diagonal strut, CT: Concrete crushing at top compression strut, DT: diagonal tension, SC: shear compression failure, FLT: flexure on top, SD: shear diagonal cracking, CD: concrete crushing in the diagonal compression strut, ST: shear tension failure.
Table 2.1: Literature review (continued)
15
Reference Alam and Hussein
(2011)
Zeidan et. al
(2011) Bentz et al.
(2010)
Jang et al.
(2009) Omeman et al. (2008)
Ashour
(2006)
No. of Specimens 12 7 6 30 8 12
a/d ratio 2.5 1.25, 2.5, and 5.0 3.05 1.5, 2.0, 2.5, 3.5, 4.5 1.55, 1.83, 2.33, 1.41, 1.36 2.22, 2.67, 3.33
Co
ncr
ete Specimen Type
Simple Beam
(R-Section)
Simple Beam
(R-Section)
Simple Beam
(R-Section)
Simple Beam
(R-Section)
Simple Beam
(R-Section)
Simple Beam
(R-Section)
Dimensions (mm) h= 350, 500
b= 250
h= 300
b= 150
h= 1000
b= 450
h= 250
b= 200
d= 150
b= 150
h= 200, 250, 300
b= 150
f 'c MPa 40 24 and 48 42.5 30 35 and 60 34, 59 (cubic)
Lo
ng
itu
din
al
Rei
nfo
rcem
ent
Type GFRP, CFRP CFRP GFRP CFRP, GFRP CFRP GFRP
Pro
per
ties
Elastic Modulus
(GPa)
48.2, 46.3 (GFRP)
120, 144 (CFRP) 148 40.8
48.2 (GFRP)
146.2 (CFRP) 134 32 and 38
Ultimate tensile
strength (MPa)
786, 751 (GFRP)
1596, 1899 (CFRP) 2840 397
980 (GFRP)
2130 (CFRP) 1180 650 and 705
ρf %
0.34, 0.86, 1.43, 0.18,
0.42, 0.67,0.90, and
0.22
0.105, 0.210 0.51 and 2.23 0.331 1.13, 1.70, 1.35, 1.21, and
2.26
0.14, 0.17, 0.23, 0.45,
0.71, 0.86, 1.06, 1.15, 1.39
Tra
nsv
erse
Rei
nfo
rcem
ent
Type N/A N/A GFRP N/A N/A N/A
Pro
per
ties
Elastic Modulus
(GPa) N/A N/A 40.8 N/A N/A N/A
Ultimate tensile
strength (MPa) N/A N/A 760 N/A N/A N/A
Area (mm2)/ spacing
(mm) N/A N/A
Av =84.3
S =200, 400 N/A N/A N/A
ρv% N/A N/A 0.71, 1.42 N/A N/A N/A
Test variables
Section Size (h), ρf
% and Material
Properties
a/d ratio, f 'c, and ρf % ρf % and ρv% a/d ratio and material
Properties. a/d ratio, f 'c , and ρf %
Section size (h), f 'c , a/d,
and ρf %
Observed failure mode R, ST, SC, DT FL, S S, FL-R DT, SC, ST CT S, R
Table 2.1: Literature review (continued)
DT: diagonal tension, S: shear Failure, ST: shear tension failure, R: Tensile rupture of the reinforcing GFRP bars, SC: shear compression, FL: flexure failure, FLT: flexure on top, CT:
Concrete crushing at top compression strut, Fl-R: flexure and rupture.
16
Reference El-Sayed et al.
(2006)a
El-Sayed et al.
(2006)b
Guadagnini et. al
(2006)
Wegian and Abdalla
(2005)
Razaqpur et al.
(2004)
Tureyen and Frosch
(2002)
Alkhrdaji et. al
(2001)
No. of Specimens 6 6 6 7 7 6 7
a/d ratio 3.1 3.07 1.1, 2.2, 3.3 3.2 1.82, 2.67, 3.56, 4.50 3.0 2.65
Co
ncr
ete Specimen Type
Simple Beam
(R-Section)
Simple Beam
(R-Section)
Simple Beam
(R-Section)
Simple Beam
(R-Section)
Simple Beam
(R-Section)
Simple Beam
(R-Section)
Simple Beam
(R-Section)
Dimensions (mm) h= 400
b= 250
h= 400
b= 250
h=250
b=150
h= 250
b=500
h= 350, 500, 650,800
b=250
h= 400
b= 457
h= 330
b= 178
f 'c MPa 35 and65 35 42.8 30 40.5, 49 34.5 N/A
Lo
ng
itu
din
al
Rei
nfo
rcem
ent
Type CFRP, GFRP CFRP, GFRP GFRP GFRP, CFRP CFRP GFRP, AFRP GFRP
Pro
per
ties
Elastic
Modulus (GPa)
42 (GFRP)
134 (CFRP)
39, 42 (GFRP)
128, 134 (CFRP) 65
42 (GFRP)
147 (CFRP) 145 (CFRP)
(5880 Ksi) (GFRP)
(6830 Ksi) (AFRP) 40
Ultimate tensile
strength (MPa)
754 (GFRP)
986 (CFRP)
608, 754 (GFRP)
1536, 986 (CFRP) 1700
692, 746 (GFRP)
1970 (CFRP) 2250 (CFRP)
(88 Ksi) (GFRP)
(206 Ksi) (AFRP) 717
ρf % 1.71, 1.72, and
2.20
0.87, 1.24, 1.22,
1.72, and 1.71 1.15
0.2, 0.4, 0.6, 0.8, and
1.5
0.25, 0.5, 0.63, and
0.88 0.96 and 1.92
2.29, 1.16, 2.30, 0.8,
and 1.33
Tra
nsv
erse
Rei
nfo
rcem
ent
Type N/A N/A N/A N/A N/A N/A GFRP
Pro
per
ties
Elastic
Modulus (GPa) N/A N/A N/A N/A N/A N/A 40
Ultimate tensile
strength (MPa) N/A N/A N/A N/A N/A N/A 717
Area (mm2)/ spacing
(mm) N/A N/A N/A N/A N/A N/A
Av= 142 (closed Φ9.5
stirrup)
S= 152, 203
ρv% N/A N/A N/A N/A N/A N/A 0.52, 0.39
Test variables
Material
Properties, f 'c,
and ρf %
Material Properties
and ρf % a/d ratio
Material Properties
and ρf % a/d ratio and ρf %
Material Properties
and ρf % ρf % and ρv%
Observed failure mode DT DT DT, SC, FL R, S S DT FLT, S
SD: shear diagonal cracking, DT: diagonal tension, S: shear Failure, ST: shear tension failure, R: Tensile rupture of the reinforcing GFRP bars, SC: shear compression, FLT: Top flexure,
FL: flexure failure
Table 2.1: Literature review (continued)
17
2.4.1 Effect of longitudinal reinforcement ratio on shear strength
Issa et al. (2016) performed experimental work on twelve simply-supported
beams reinforced with BFRP bars. Six of these beams only were transversely
reinforced with Basalt fiber reinforced polymer bars (BFRP) and steel stirrups, while
the others were only reinforced internally with longitudinal BFRP bars to examine
their effects on the shear strength of the beams. It was concluded that increasing the
longitudinal reinforcement ratio in the beams with no shear reinforcement from
0.683% to 1.133% increased the shear strength by 32%. A further increase in the
longitudinal reinforcement ratio from 1.133% to 1.75% increased the shear strength
but by a lower rate of 17%.
El Refai and Abed (2015) conducted experimental work on eight concrete
beams reinforced internally with longitudinal BFRP bars (without transverse
reinforcement). One of the aims in their study was to examine the effect of
longitudinal reinforcement on the beam shear strength. They indicated that increasing
the longitudinal reinforcement ratio would increase the shear strength of the beams.
They reported that increasing the longitudinal reinforcement ratio from 0.31% to
0.69% increased the beam shear strength by 38%.
Abed et al. (2012) conducted experimental work on nine concrete beams
reinforced internally with longitudinal GFRP rods to examine their effects on shear
strength of the beams. They reported that increasing the reinforcement ratio from
0.92% to 1.84% in the GFRP reinforced beams resulted in an increase in the shear
strength by 70%. They concluded that the GFRP reinforced beams showed 50%
18
improvement in their shear strength over the steel-reinforced counterparts with the
same reinforcement ratio.
El-Sayed et al. (2012) conducted experimental work on ten concrete beams
reinforced internally with longitudinal FRP bars. One of the parameters that were
investigated in this study was the effect of the FRP longitudinal reinforcement on the
beam shear strength. Two types of FRP bars were used, CFRP and GFRP bars. It was
concluded that increasing the longitudinal reinforcement from 0.78% to 1.2% in their
GFRP reinforced beams resulted in an increase in the shear strength by 6%. A further
increase in the GFRP longitudinal reinforcement from 1.2% to 1.7% increased the
shear strength by12%. On the other hand, increasing the longitudinal reinforcement
from 0.78% to 1.2% in the CFRP reinforced beams resulted in an increase of 8.6%.
A further increase in the CFRP longitudinal reinforcement from 1.2% to 1.7%
increased the shear strength by 20%.
Omeman et al. (2008) performed experimental work on eight concrete beams
reinforced with CFRP bars. The experimental results showed that increasing the
reinforcement ratio of the CFRP longitudinal bars from 1.13% to 2.26% increased
the shear strength by 20%.
Alam and Hussein (2011) conducted experimental work on twelve concrete
beams reinforced with FRP bars. Two types of FRP were investigated in their study,
CFRP and GFRP bars. The experimental results showed that increasing the
reinforcement ratio of CFRP bars from 0.18% to 0.67% increased the shear strength
by 23%. On the other hand, increasing the reinforcement ratio of the GFRP bars from
0.35% to 1.47% increased the shear strength by 36%.
19
Tureyen and Frosch (2002) performed experimental work on six concrete
beams reinforced internally with longitudinal FRP rods. They used two types of FRP
rods in their study, GFRP and Aramid-FRP (AFRP) bars. It was concluded that
increasing the longitudinal reinforcement from 0.96% to 1.92% in the AFRP
reinforced beams resulted in 54% increase in the shear strength. However, increasing
the longitudinal reinforcement from 0.96% to 1.92% in the GFRP reinforced beams
resulted in 61% increase in the shear strength.
El-Sayed et al. (2006 a) performed experimental work on six concrete beams
reinforced internally with two types of longitudinal FRP rods: GFRP and CFRP bars.
They reported that increasing the GFRP and CFRP longitudinal reinforcement ratios
from 1.7% to 2.2% increased the shear capacity of the high strength concrete by 32%
and 34%, respectively.
El-Sayed et al. (2006 b) performed experimental work on six concrete beams
of different concrete strengths than those of El-Sayed et al. (2006 a) and reinforced
internally with longitudinal CFRP and the GFRP bars. They reported that increasing
the reinforcement ratio of CFRP bars from 0.87% to 1.24% increased the shear
strength by 34%. A further increase in the CFRP reinforcement ratio from 1.24% to
1.72% increased the shear strength by 20%. Whereas, increasing the reinforcement
ratio of GFRP bars from 1.22% to 1.71% increased the shear strength by 29%.
Ashour and Kara (2014) performed experimental work on six concrete beams
reinforced with CFRP longitudinal bars to examine their effect on the shear strength
of concrete beams. They reported that increasing the reinforcement ratio from 0.11%
to 0.22% increased the shear strength by 10%.
20
Alkhrdaji et al. (2001) performed experimental work on seven concrete
beams reinforced with GFRP longitudinal bars to study their effect on shear strength.
They reported that increasing the longitudinal reinforcement ratio from 0.8% to
2.30% increased the shear strength by 33.3% in their beams.
Matta et al. (2013) performed experimental work on fifteen concrete beams
reinforced with GFRP longitudinal bars. One of the aims of this study was to
examine the effect of longitudinal reinforcement on the shear strength. They reported
that increasing the longitudinal reinforcement ratio from 0.12% to 0.24% increased
the shear strength by 43.2%.
Farghaly and Benmokrane (2013) studied the shear behavior of deep beams
with FRP bars by performing experimental work on four deep beams reinforced with
GFRP and CFRP bars. The tested beams had no stirrups. It was noted that increasing
the reinforcement ratio of GFRP bars from 0.69% to 1.24% increased the shear
strength by 31.7%. On the other hand, increasing the reinforcement ratio of CFRP
bars from 0.26% to 0.46% increased the shear strength by 34.4%. The study also
showed that increasing the reinforcement ratio has decreased the diagonal crack
widths by 43% and 51% for GFRP and CFRP reinforced concrete beams,
respectively. Moreover, it was reported that providing the stirrups would not only
control the cracks, but also will increase the ultimate load capacity of the beams.
Bentz et al. (2010) conducted experimental work on eleven concrete beams
reinforced with GFRP bars to examine the effects of longitudinal reinforcement ratio
of FRP bars on the shear strength of the beams. The authors concluded that
increasing the longitudinal reinforcement ratio from 0.51% to 2.23% increased the
failure load by 82%.
21
Tomlinson and Fam (2014) performed experimental work on nine concrete
beams reinforced with BFRP bars. The authors reported that increasing the
reinforcement ratio from 0.39% to 0.84% increased the shear strength by 40%.
Mahmoud and El-Salakawy (2016) performed experimental work on twelve
continuous concrete beams reinforced internally with GFRP bars. The experimental
results showed that increasing the bottom longitudinal reinforcement ratio in beams
with normal strength concrete from 0.76% to 1.14% for deep beams (h=750 mm)
increased the failure load by 37.5%. On the other hand, increasing the bottom
longitudinal reinforcement ratios from 0.76% to 1.14% in beams with high strength
concrete increased the failure load from by 66.67%.
Zeidan et al. (2011) conducted experimental work on seven concrete beams
reinforced with CFRP bars to study their effects on the beam shear strength. The
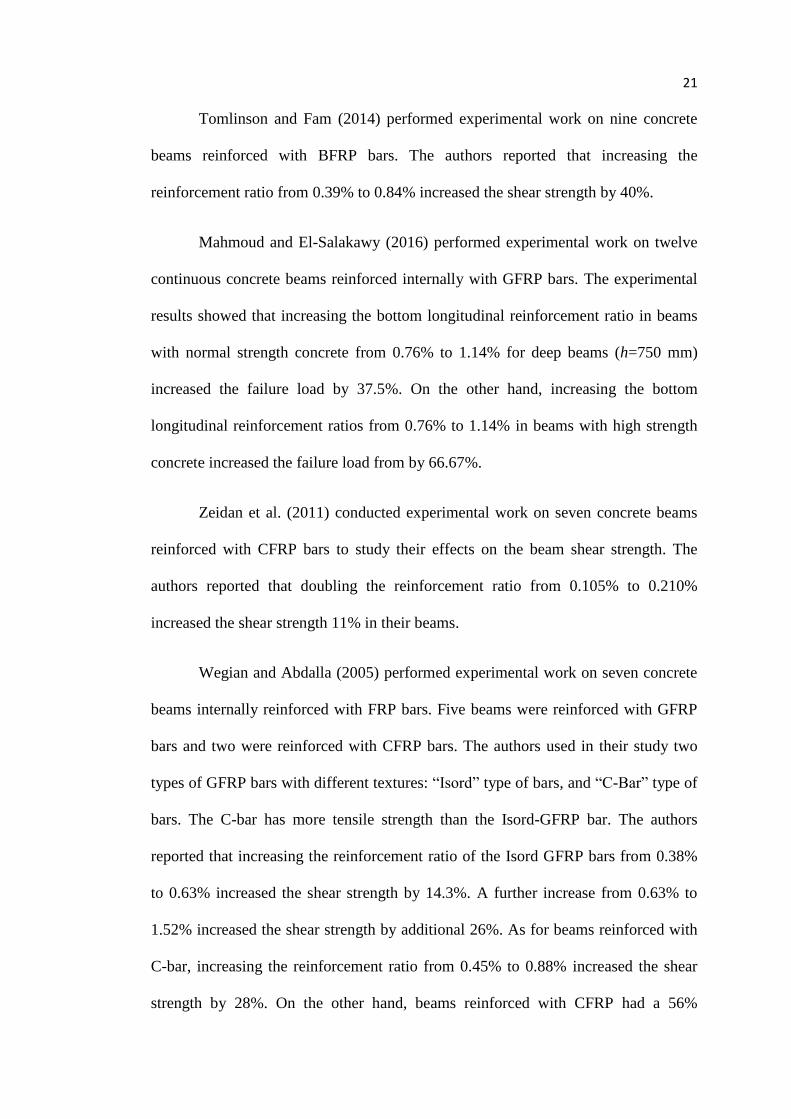
authors reported that doubling the reinforcement ratio from 0.105% to 0.210%
increased the shear strength 11% in their beams.
Wegian and Abdalla (2005) performed experimental work on seven concrete
beams internally reinforced with FRP bars. Five beams were reinforced with GFRP
bars and two were reinforced with CFRP bars. The authors used in their study two
types of GFRP bars with different textures: “Isord” type of bars, and “C-Bar” type of
bars. The C-bar has more tensile strength than the Isord-GFRP bar. The authors
reported that increasing the reinforcement ratio of the Isord GFRP bars from 0.38%
to 0.63% increased the shear strength by 14.3%. A further increase from 0.63% to
1.52% increased the shear strength by additional 26%. As for beams reinforced with
C-bar, increasing the reinforcement ratio from 0.45% to 0.88% increased the shear
strength by 28%. On the other hand, beams reinforced with CFRP had a 56%

22
increase in their shear strength when the CFRP reinforcement ratio was increased
from 0.20% to 0.47%.
Ashour (2006) performed experimental work on twelve concrete beams
reinforced with GFRP bars. The author studied the effect of longitudinal
reinforcement on shear strength of beams having different sizes and different
concrete strengths. The first series of concrete beams were composed of six
specimens and made of normal strength concrete. Three different depths of 200 mm,
250 mm, and 300 mm were used in each series. The experimental results of the first
series showed that increasing the longitudinal reinforcement ratio in beams with
depth of 200 mm from 0.23% to 0.45% increased the shear strength by 39% and
increasing the longitudinal reinforcement ratio in beams with depth of 250 mm from
0.17% to 0.71% increased the shear strength by 46%. Furthermore, increasing the
longitudinal reinforcement ratio in beams with depth of 300 mm from 0.14% to
0.86% increased the shear strength by 52%. On the other hand, the second series of
concrete beams were also composed of six specimens and were made of high
strength concrete. The experimental results of the second series showed that
increasing the longitudinal reinforcement ratio in beams with depth of 200 mm from
0.23% to 1.39% increased the shear strength by 94.4%% and increasing the
longitudinal reinforcement ratio in beams with depth of 250 mm from 0.17% to
1.06% increased the shear strength by 89.7%. Furthermore, increasing the
longitudinal reinforcement ratio in beams with depth of 300 mm from 0.28% to
1.15% increased the shear strength by 20%.
Razaqpur et al. (2003) performed experimental work on seven concrete
beams reinforced internally with CFRP bars. They reported that increasing the

23
reinforcement ratios from 0.25% to 0.5% increased the shear strength by 26%. A
further increase from 0.5% to 0.63% increased the shear strength by an additional
7.7%. However, increasing the reinforcement ratio from 0.63% to 0.88 % increased
the shear strength by 12%.
2.4.2 Effect of transverse reinforcement ratio on shear strength
Alkhrdaji et al. (2001) reported in their experimental investigation on deep
beams that increasing the transverse reinforcement from 0% to 0.39% increased the
shear strength by 78%. A further increase in the transverse reinforcement from
0.39% to 0.52% had increased the shear strength by an additional 15%.
Tomlinson and Fam (2014) indicated in their study that increasing the BFRP
transverse reinforcement ratio from 0% to 0.173% in beams having longitudinal
reinforcement ratios of 0.39%, 0.51%, and 0.85% increased the shear strength by
74%, 290%, and 83%, respectively.
Ramadass and Thomas (2010) conducted a theoretical study to investigate the
effect of FRP stirrups on shear strengths of beams. They observed that the shear
strength of the beam with GFRP reinforcement increases with the increase in the
vertical reinforcement ratio (ρv). They demonstrated that the longitudinal (FRP)
reinforcement ratio has a minor effect on shear strength as opposed to the transverse
reinforcement ratio as it is shown in figure 2.5.They indicated that increasing the ρv
from 0% to 0.5% increased the shear strength by 130%, and increasing the ρv from
0% to 1% increased the shear strength by 330%.
24
Figure 2.5: Effects of transverse reinforcement on nominal shear strength
(ρv %) (Ramadass and Thomas 2010)
Mahmoud and El-Salakawy (2015) showed that using larger stirrup diameter
does not increase the shear strength of the concrete. They indicated that decreasing
the spacing of the stirrups is the key to increase the shear strength. Furthermore, the
authors showed that the shear capacity increased by 7%, 20%, and 3% when the
spacing decreased from 150 to 100 mm in the tested specimens of 40 MPa concrete
strength. Further decrease in the spacing of stirrups from 100 to 75 mm, resulted in
an increase in the shear capacity by 6%, 4.3%, and 7.5%. On the other hand, in
models of 80MPa concrete strength, the shear capacity increased by 7.4%, 9.0%, and
10.2% when the spacing decreased from 115 to 76.7 mm. However, decreasing the
spacing of the stirrups from 76.7 to 57.5 mm only increased the shear capacity by
1%.
Bentz et al. (2010) performed experimental work to study the effect of
transverse reinforcement ratio on shear strength of deep beams. Their experimental
results showed that increasing the transverse reinforcement in deep beams from 0%
to 1% increased the shear force by 76%, while increasing it from 0% to 2% had
increased the shear force by 82%.
25
2.4.3 Effect of concrete compressive strength (f 'c) on shear strength
Abed et al. (2012) reported that the compressive strength of the concrete (f 'c)
had a significant impact on the shear strength of deep beams reinforced
longitudinally with GFRP bars. Their experimental results showed that increasing
(f 'c) from 43 to 51 MPa resulted in a 38% increase in the beam shear strength. They
also indicated that a further increase in f 'c from 51 MPa to 65 MPa increased the
shear strength by an additional 53%.
Omeman et al. (2008) indicated that increasing the compressive strength of
deep beams reinforced internally with CFRP bars from 38.9 MPa to 63.1 MPa
increased the shear strength by a 46%.
El-Sayed et al. (2006 a) reported that increasing the compressive strength of
GFRP reinforced concrete beams from 35 to 65 MPa increased the shear strength by
12%. On the other hand, increasing the compressive strength of CFRP reinforced
concrete beams from 35 to 65 MPa increased the shear strength by 4.4%.
Matta et al. (2013) mentioned in their study that increasing the compressive
strength from 29.6 MPa to 38.8 MPa in beams reinforced internally with GFRP bars
increased the shear strength by 75%.
Ashour (2006) reported that increasing the compressive strength from (f 'c)
27.2 MPa to 47.2 MPa increased the shear strength by 20% for beams reinforced
internally with longitudinal GFRP bars.
Mahmoud and El-Salakawy (2015) found that the shear strength in the
interior shear span of the continuous FRP beams increased with increasing the
concrete strength. The shear strength increased by 13%, 19.5%, and 16.6% when f 'c
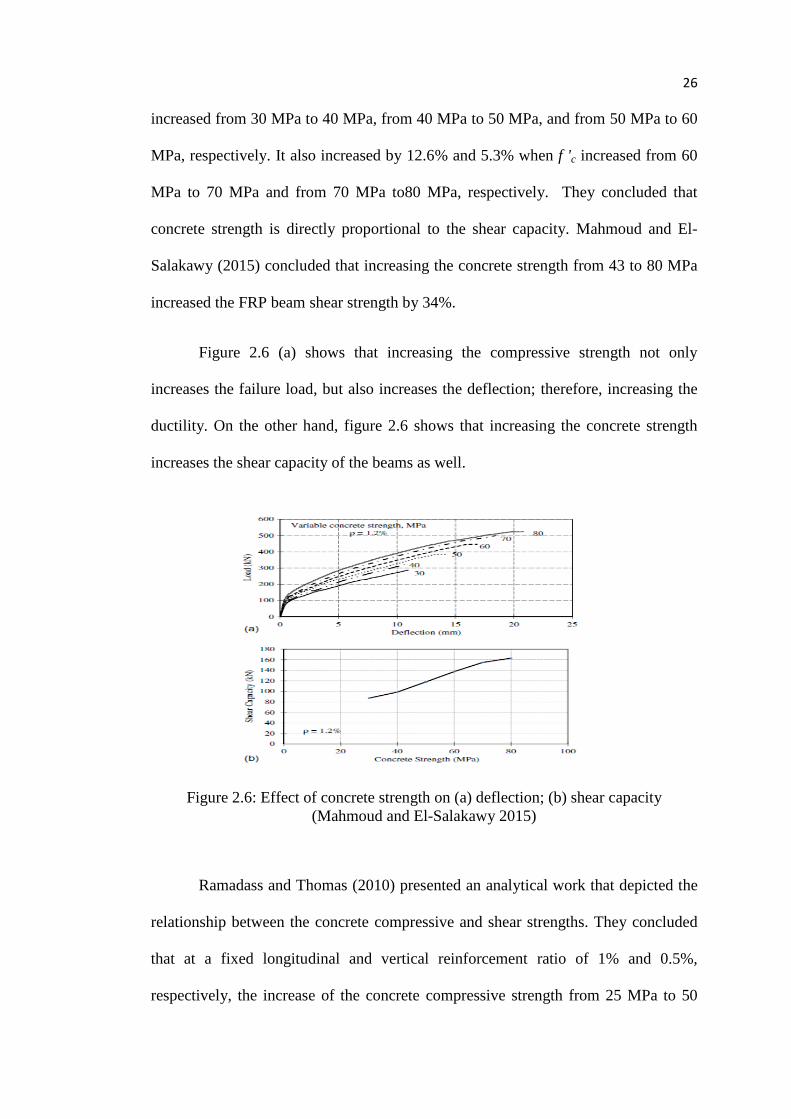
26
increased from 30 MPa to 40 MPa, from 40 MPa to 50 MPa, and from 50 MPa to 60
MPa, respectively. It also increased by 12.6% and 5.3% when f 'c increased from 60
MPa to 70 MPa and from 70 MPa to80 MPa, respectively. They concluded that
concrete strength is directly proportional to the shear capacity. Mahmoud and El-
Salakawy (2015) concluded that increasing the concrete strength from 43 to 80 MPa
increased the FRP beam shear strength by 34%.
Figure 2.6 (a) shows that increasing the compressive strength not only
increases the failure load, but also increases the deflection; therefore, increasing the
ductility. On the other hand, figure 2.6 shows that increasing the concrete strength
increases the shear capacity of the beams as well.
Figure 2.6: Effect of concrete strength on (a) deflection; (b) shear capacity
(Mahmoud and El-Salakawy 2015)
Ramadass and Thomas (2010) presented an analytical work that depicted the
relationship between the concrete compressive and shear strengths. They concluded
that at a fixed longitudinal and vertical reinforcement ratio of 1% and 0.5%,
respectively, the increase of the concrete compressive strength from 25 MPa to 50
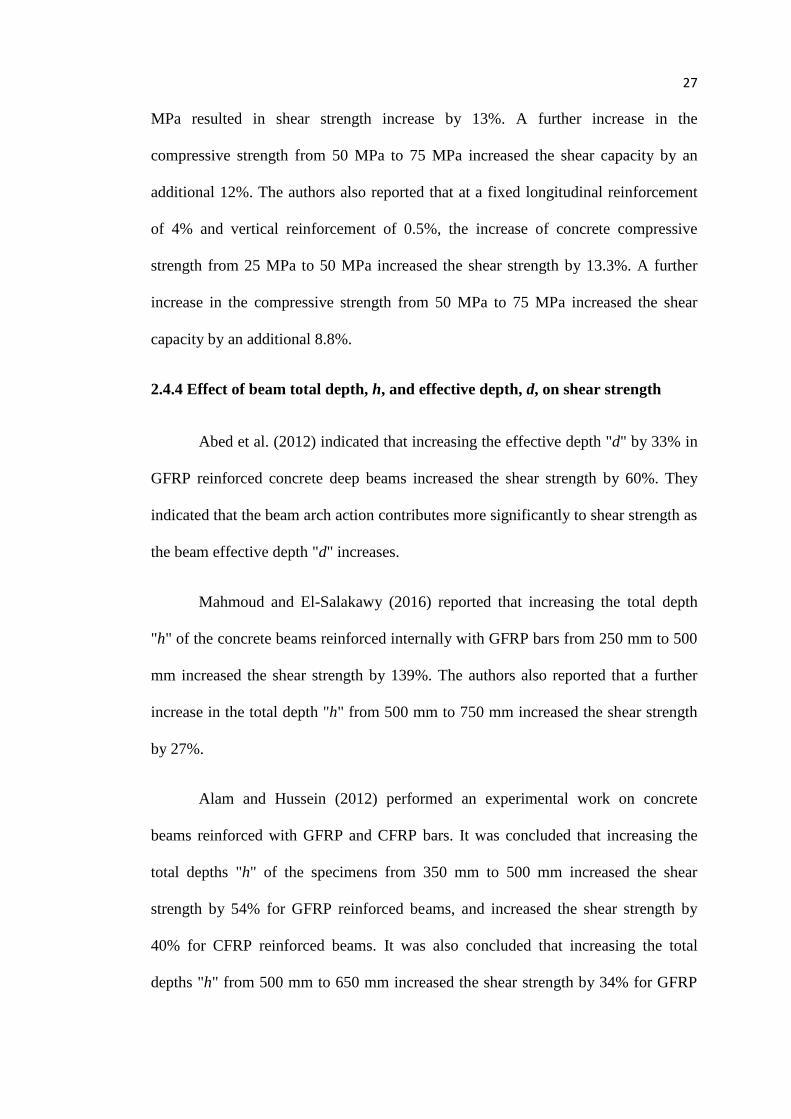
27
MPa resulted in shear strength increase by 13%. A further increase in the
compressive strength from 50 MPa to 75 MPa increased the shear capacity by an
additional 12%. The authors also reported that at a fixed longitudinal reinforcement
of 4% and vertical reinforcement of 0.5%, the increase of concrete compressive
strength from 25 MPa to 50 MPa increased the shear strength by 13.3%. A further
increase in the compressive strength from 50 MPa to 75 MPa increased the shear
capacity by an additional 8.8%.
2.4.4 Effect of beam total depth, h, and effective depth, d, on shear strength
Abed et al. (2012) indicated that increasing the effective depth "d" by 33% in
GFRP reinforced concrete deep beams increased the shear strength by 60%. They
indicated that the beam arch action contributes more significantly to shear strength as
the beam effective depth "d" increases.
Mahmoud and El-Salakawy (2016) reported that increasing the total depth
"h" of the concrete beams reinforced internally with GFRP bars from 250 mm to 500
mm increased the shear strength by 139%. The authors also reported that a further
increase in the total depth "h" from 500 mm to 750 mm increased the shear strength
by 27%.
Alam and Hussein (2012) performed an experimental work on concrete
beams reinforced with GFRP and CFRP bars. It was concluded that increasing the
total depths "h" of the specimens from 350 mm to 500 mm increased the shear
strength by 54% for GFRP reinforced beams, and increased the shear strength by
40% for CFRP reinforced beams. It was also concluded that increasing the total
depths "h" from 500 mm to 650 mm increased the shear strength by 34% for GFRP
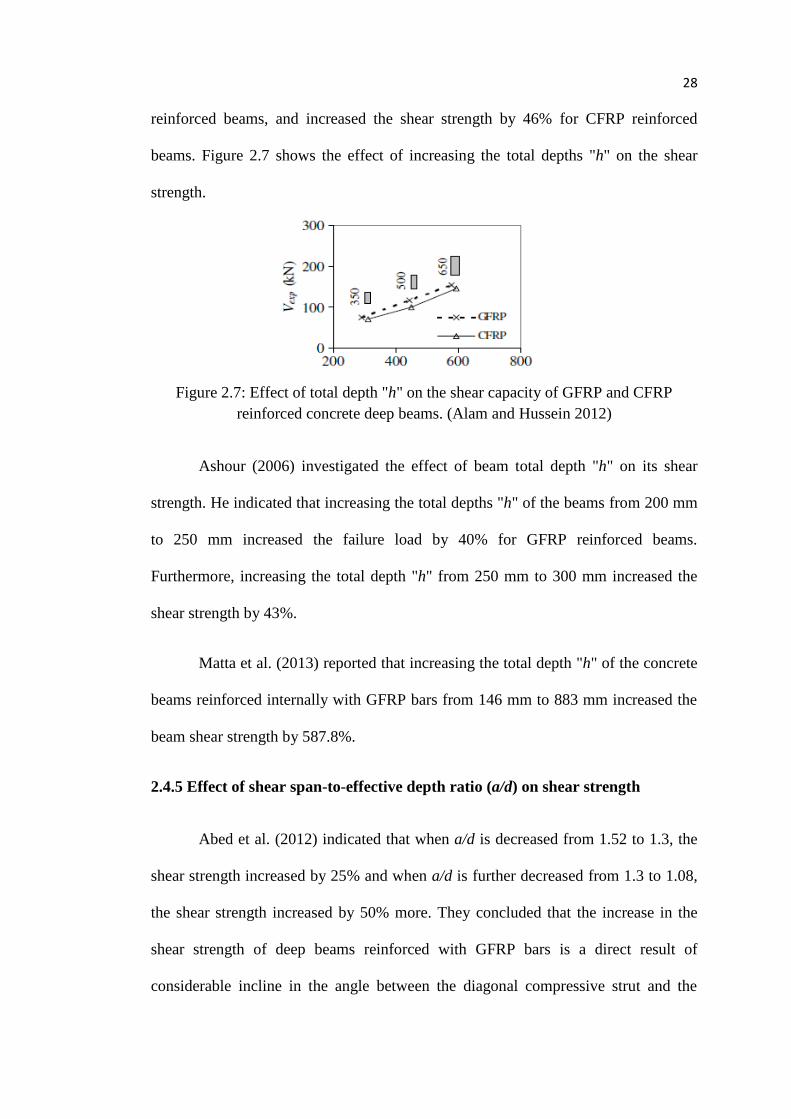
28
reinforced beams, and increased the shear strength by 46% for CFRP reinforced
beams. Figure 2.7 shows the effect of increasing the total depths "h" on the shear
strength.
Figure 2.7: Effect of total depth "h" on the shear capacity of GFRP and CFRP
reinforced concrete deep beams. (Alam and Hussein 2012)
Ashour (2006) investigated the effect of beam total depth "h" on its shear
strength. He indicated that increasing the total depths "h" of the beams from 200 mm
to 250 mm increased the failure load by 40% for GFRP reinforced beams.
Furthermore, increasing the total depth "h" from 250 mm to 300 mm increased the
shear strength by 43%.
Matta et al. (2013) reported that increasing the total depth "h" of the concrete
beams reinforced internally with GFRP bars from 146 mm to 883 mm increased the
beam shear strength by 587.8%.
2.4.5 Effect of shear span-to-effective depth ratio (a/d) on shear strength
Abed et al. (2012) indicated that when a/d is decreased from 1.52 to 1.3, the
shear strength increased by 25% and when a/d is further decreased from 1.3 to 1.08,
the shear strength increased by 50% more. They concluded that the increase in the
shear strength of deep beams reinforced with GFRP bars is a direct result of
considerable incline in the angle between the diagonal compressive strut and the
29
tension tie resulting in a more effective arch-action mechanism. Figure 2.8 shows the
effects of the a/d ratio on the load carrying capacity of three tested GFRP reinforced
beams.
Figure 2.8: Effect of a/d ratio on the load carrying capacity (Abed et al. 2012)
Omeman et al. (2008) reported in their study that increasing the a/d ratio
from 1.55 to 1.83 decreased the shear strength of the FRP reinforced beams by
16.3%. The authors also reported that a further increase in the a/d ratio from 1.83 to
2.33 had also reduced the shear strength by 44.2%.
El Refai and Abed (2015) indicated that decreasing the a/d ratio from 3.3 to
2.2 corresponded to the increase in the shear strength by 37% for beams with a
longitudinal FRP reinforcement ratio of 0.48%. On the other hand, for beams with
longitudinal reinforcement ratio of 0.69%, decreasing the a/d ratio from 3.3 to 2.2
increased the beam shear strength by 45%.
Issa et al. (2016) reported that increasing the a/d ratio from 2.5 to 3.5 for
beams reinforced with internal BFRP bars had decreased the beam shear strength by
32%.

30
Guadagnini et al. (2006) reported in their study that increasing the a/d ratio
from 1.1 to 2.2 decreased the shear strength by 44.8%. The authors also concluded
that increasing the a/d ratio from 2.2 to 3.3 decreased the shear strength by an
additional 39.2%.
Razaqpur et al. (2004) reported in their study that decreasing the a/d ratio
from 4.5 to 3.56 increased the beam shear strength by 22.2%. They also reported that
an additional decrease in a/d ratio from 3.56 to 2.67 did not affect the shear strength
because the same exact shear force was obtained. However, decreasing the a/d ratio
from 2.67 to 1.82 increased the beam shear strength significantly by 105%.
Ramadass and Thomas (2010) studied the effect of a/d ratio on the failure
load as ρf changes. Figure 2.9 Shows that as a/d increases, the failure load remains
constant till a certain value of a/d beyond which the failure load drops significantly.
This is due to the behavior of the beam as slender (a/d > 4.0) or deep beam (a/d <
4.0)
Figure 2.9: Effect of increasing the a/d ratio on shear strength (Ramadass and
Thomas 2010)
El-Sayed et al. (2012) reported in their study that decreasing the shear span-
to-depth ratio a/d ratio from 1.6 to 1.3 increased the shear strength of GFRP
reinforced beams by 54%. Additional decrease in the a/d ratio from 1.3 to 0.9
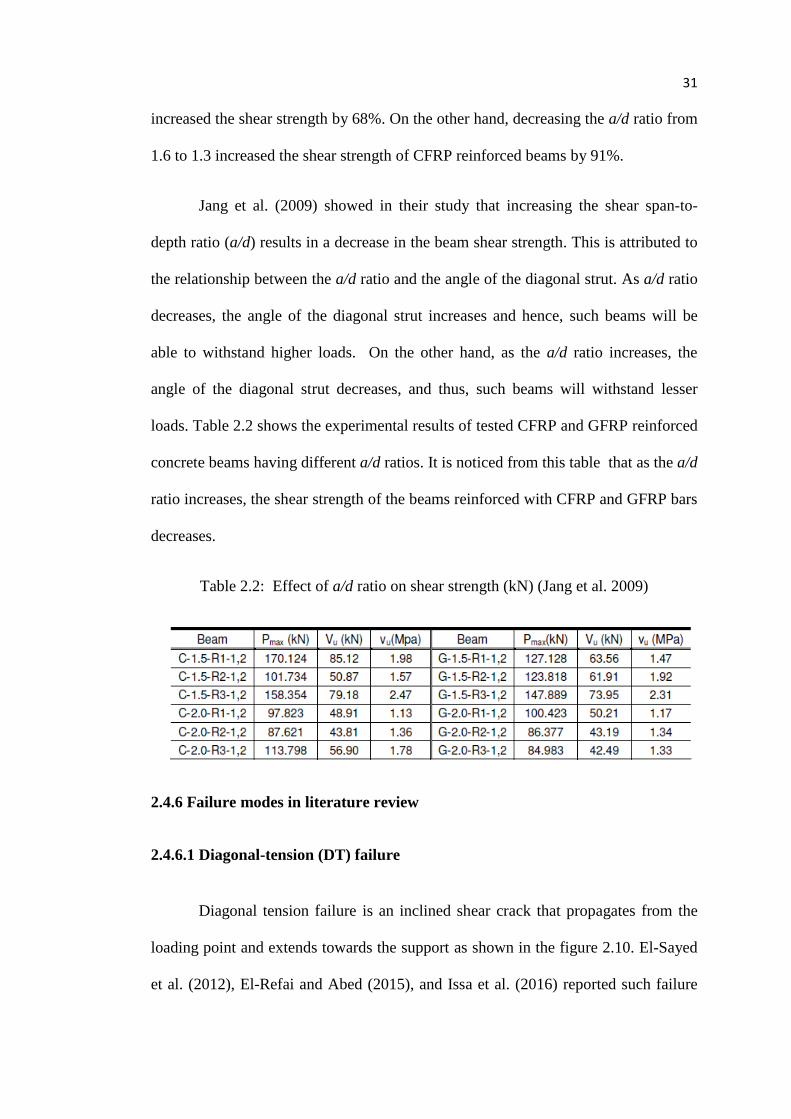
31
increased the shear strength by 68%. On the other hand, decreasing the a/d ratio from
1.6 to 1.3 increased the shear strength of CFRP reinforced beams by 91%.
Jang et al. (2009) showed in their study that increasing the shear span-to-
depth ratio (a/d) results in a decrease in the beam shear strength. This is attributed to
the relationship between the a/d ratio and the angle of the diagonal strut. As a/d ratio
decreases, the angle of the diagonal strut increases and hence, such beams will be
able to withstand higher loads. On the other hand, as the a/d ratio increases, the
angle of the diagonal strut decreases, and thus, such beams will withstand lesser
loads. Table 2.2 shows the experimental results of tested CFRP and GFRP reinforced
concrete beams having different a/d ratios. It is noticed from this table that as the a/d
ratio increases, the shear strength of the beams reinforced with CFRP and GFRP bars
decreases.
Table 2.2: Effect of a/d ratio on shear strength (kN) (Jang et al. 2009)
2.4.6 Failure modes in literature review
2.4.6.1 Diagonal-tension (DT) failure
Diagonal tension failure is an inclined shear crack that propagates from the
loading point and extends towards the support as shown in the figure 2.10. El-Sayed
et al. (2012), El-Refai and Abed (2015), and Issa et al. (2016) reported such failure
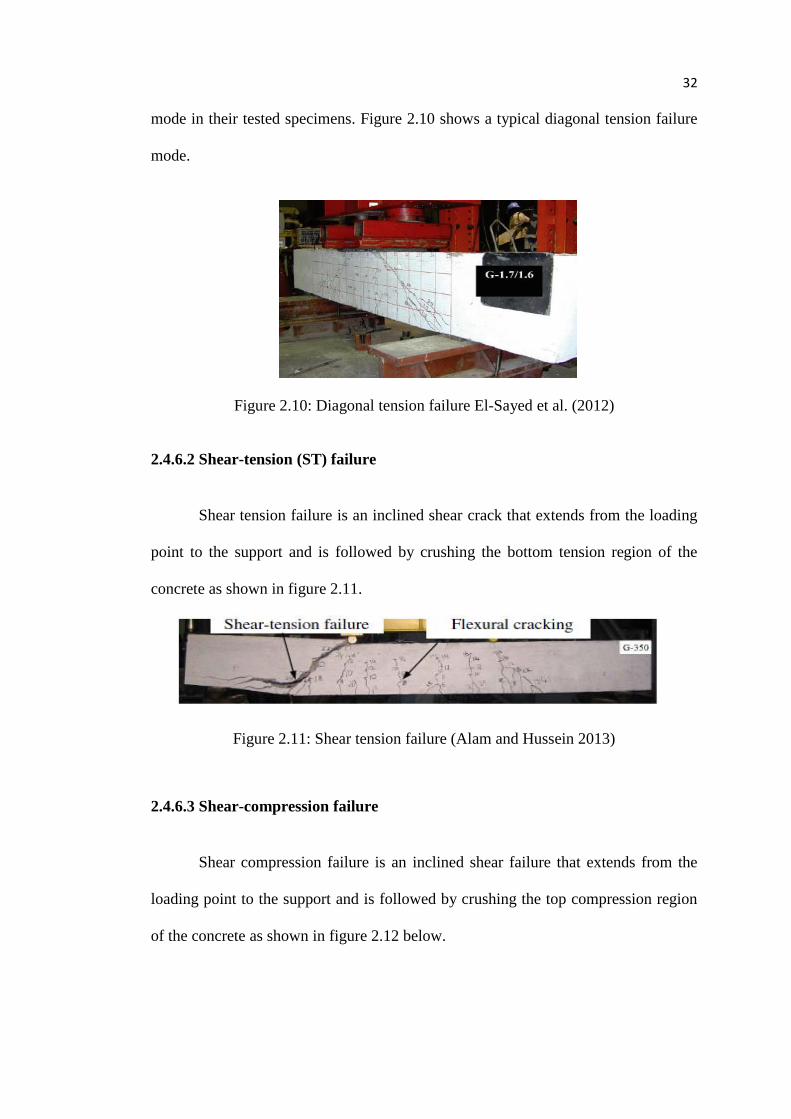
32
mode in their tested specimens. Figure 2.10 shows a typical diagonal tension failure
mode.
Figure 2.10: Diagonal tension failure El-Sayed et al. (2012)
2.4.6.2 Shear-tension (ST) failure
Shear tension failure is an inclined shear crack that extends from the loading
point to the support and is followed by crushing the bottom tension region of the
concrete as shown in figure 2.11.
Figure 2.11: Shear tension failure (Alam and Hussein 2013)
2.4.6.3 Shear-compression failure
Shear compression failure is an inclined shear failure that extends from the
loading point to the support and is followed by crushing the top compression region
of the concrete as shown in figure 2.12 below.
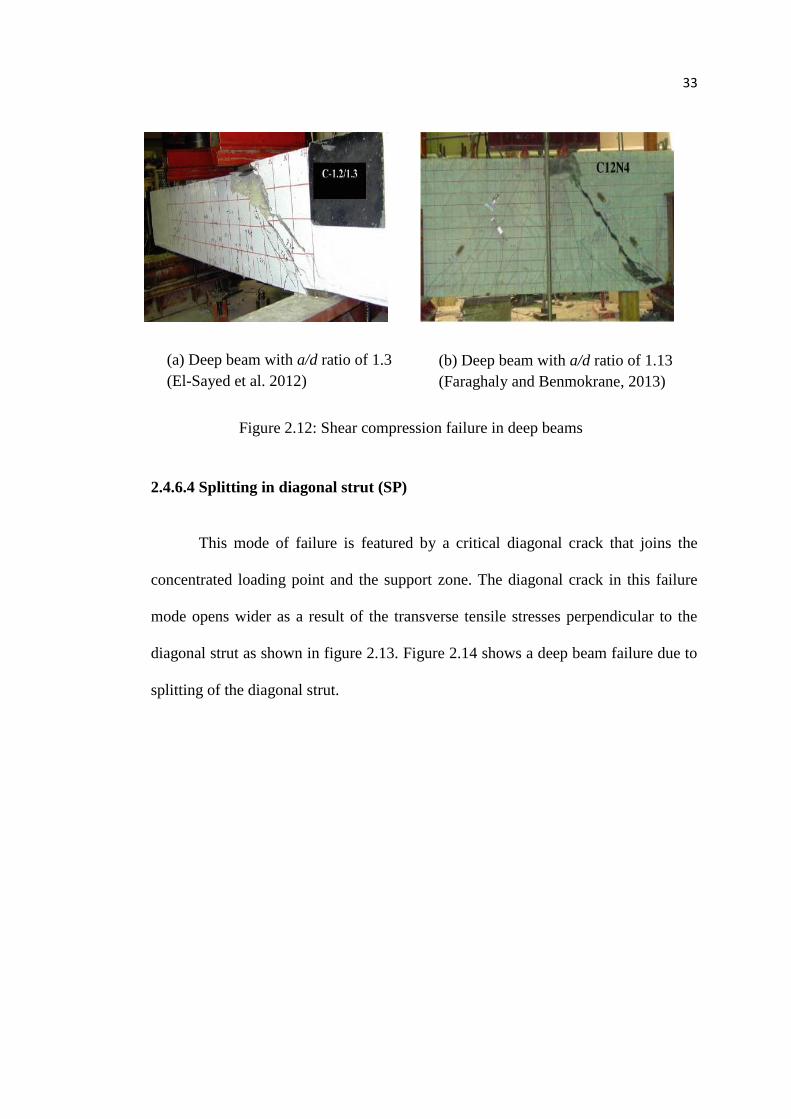
33
2.4.6.4 Splitting in diagonal strut (SP)
This mode of failure is featured by a critical diagonal crack that joins the
concentrated loading point and the support zone. The diagonal crack in this failure
mode opens wider as a result of the transverse tensile stresses perpendicular to the
diagonal strut as shown in figure 2.13. Figure 2.14 shows a deep beam failure due to
splitting of the diagonal strut.
(a) Deep beam with a/d ratio of 1.3
(El-Sayed et al. 2012)
(b) Deep beam with a/d ratio of 1.13
(Faraghaly and Benmokrane, 2013)
Figure 2.12: Shear compression failure in deep beams
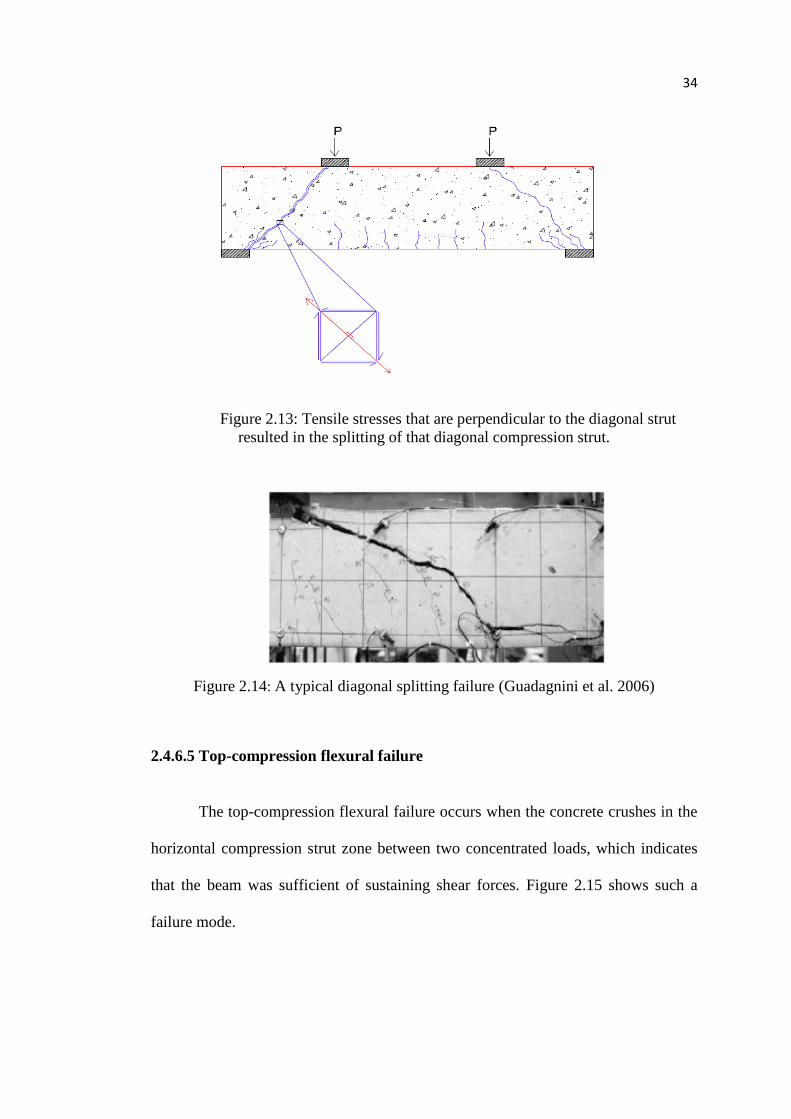
34
Figure 2.13: Tensile stresses that are perpendicular to the diagonal strut
resulted in the splitting of that diagonal compression strut.
Figure 2.14: A typical diagonal splitting failure (Guadagnini et al. 2006)
2.4.6.5 Top-compression flexural failure
The top-compression flexural failure occurs when the concrete crushes in the
horizontal compression strut zone between two concentrated loads, which indicates
that the beam was sufficient of sustaining shear forces. Figure 2.15 shows such a
failure mode.
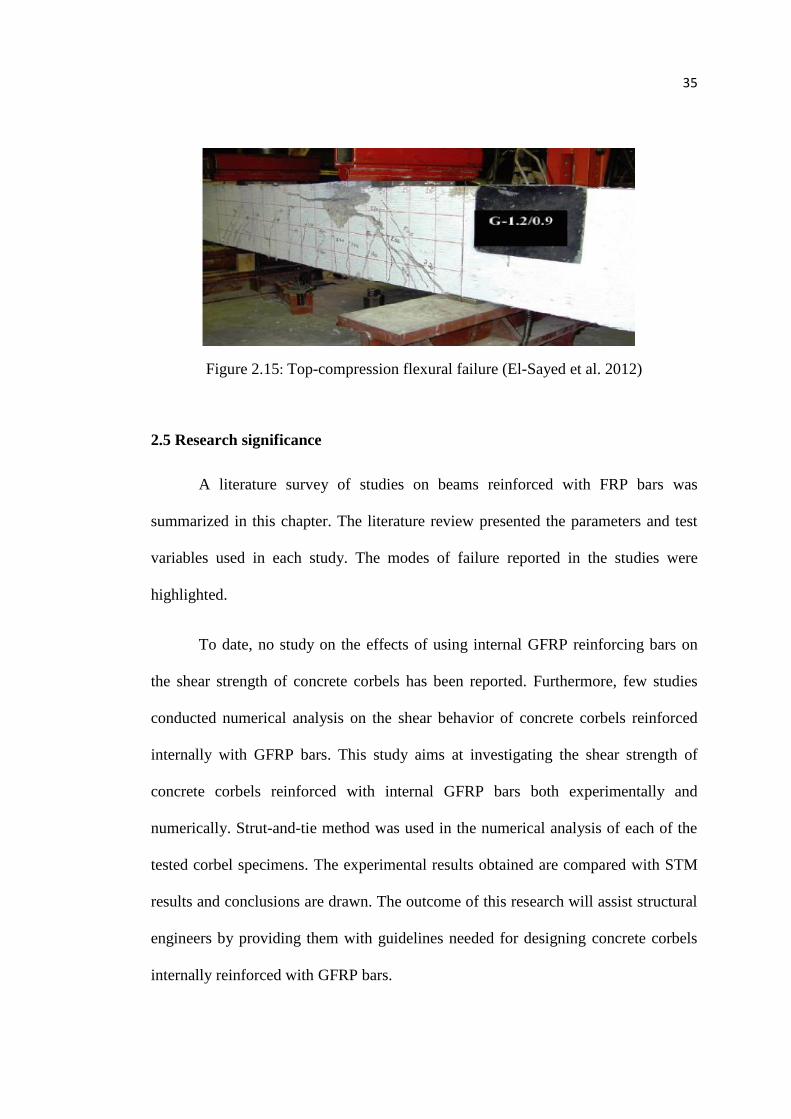
35
Figure 2.15: Top-compression flexural failure (El-Sayed et al. 2012)
2.5 Research significance
A literature survey of studies on beams reinforced with FRP bars was
summarized in this chapter. The literature review presented the parameters and test
variables used in each study. The modes of failure reported in the studies were
highlighted.
To date, no study on the effects of using internal GFRP reinforcing bars on
the shear strength of concrete corbels has been reported. Furthermore, few studies
conducted numerical analysis on the shear behavior of concrete corbels reinforced
internally with GFRP bars. This study aims at investigating the shear strength of
concrete corbels reinforced with internal GFRP bars both experimentally and
numerically. Strut-and-tie method was used in the numerical analysis of each of the
tested corbel specimens. The experimental results obtained are compared with STM
results and conclusions are drawn. The outcome of this research will assist structural
engineers by providing them with guidelines needed for designing concrete corbels
internally reinforced with GFRP bars.

36
2.6 Scope and objectives
The main objective of this study is to examine the shear strength of concrete
corbels reinforced with GFRP bars. The specific objectives are outlined as follows:
Investigate the effect of GFRP longitudinal reinforcement on the shear
strength of corbels.
Examine the effect of the concrete compressive strength on the shear strength
of corbels.
Address the effect of increasing the shear span-to-effective depth ratio (a/d)
on the shear strength of corbels.
Construct Strut-and-Tie models (using the guidelines of the Canadian code
CSA-S806-12) to verify the corbel strengths.
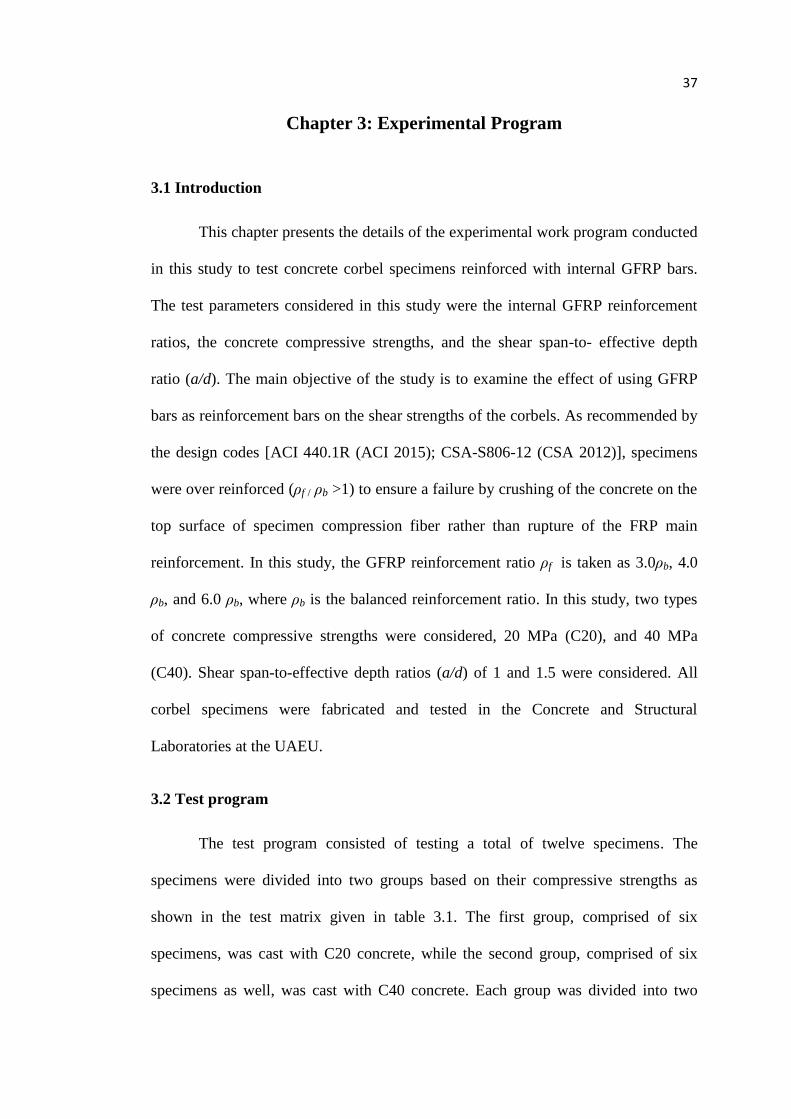
37
Chapter 3: Experimental Program
3.1 Introduction
This chapter presents the details of the experimental work program conducted
in this study to test concrete corbel specimens reinforced with internal GFRP bars.
The test parameters considered in this study were the internal GFRP reinforcement
ratios, the concrete compressive strengths, and the shear span-to- effective depth
ratio (a/d). The main objective of the study is to examine the effect of using GFRP
bars as reinforcement bars on the shear strengths of the corbels. As recommended by
the design codes [ACI 440.1R (ACI 2015); CSA-S806-12 (CSA 2012)], specimens
were over reinforced (ρf / ρb >1) to ensure a failure by crushing of the concrete on the
top surface of specimen compression fiber rather than rupture of the FRP main
reinforcement. In this study, the GFRP reinforcement ratio ρf is taken as 3.0ρb, 4.0
ρb, and 6.0 ρb, where ρb is the balanced reinforcement ratio. In this study, two types
of concrete compressive strengths were considered, 20 MPa (C20), and 40 MPa
(C40). Shear span-to-effective depth ratios (a/d) of 1 and 1.5 were considered. All
corbel specimens were fabricated and tested in the Concrete and Structural
Laboratories at the UAEU.
3.2 Test program
The test program consisted of testing a total of twelve specimens. The
specimens were divided into two groups based on their compressive strengths as
shown in the test matrix given in table 3.1. The first group, comprised of six
specimens, was cast with C20 concrete, while the second group, comprised of six
specimens as well, was cast with C40 concrete. Each group was divided into two

38
sub-groups based on their shear span-to-effective depth ratios (a/d) of 1 and 1.5.
Each sub-group contained 3 specimens of different longitudinal reinforcement ratios
“ρf ”, 3.0 ρb, 4.0 ρb, and 6.0 ρb, where ρb is the balanced reinforcement ratio. The
specimens were labeled in the test matrix according to their concrete type, shear
span-to-effective depth ratio, and GFRP reinforcement ratio. For instance, C20-R1-
G3.0 refers to specimen of concrete compressive strength of 20 MPa, shear span-to-
effective depth ratio (a/d) of 1, and GFRP longitudinal reinforcement ratio of 3.0 ρb.
Likewise, specimen C40-R1.5-G3.0 refers to the specimen of concrete compressive
strength of 40 MPa, shear span-to-effective depth ratio (a/d) of 1.5, and GFRP
longitudinal reinforcement ratio of 3.0 ρb.
Table 3.1: Test matrix
Group a/d
ratio
GFRP
reinforcement
ratio (ρf)
Reinforcing
bars Name
C20
1.0
3.0ρb 4 No. 10 C20-R1-G3.0
4.0ρb 4 No. 12 C20-R1-G4.0
6.0ρb 6 No. 12 C20-R1-G6.0
1.5
3.0ρb 4 No. 10 C20-R1.5-G3.0
4.0ρb 4 No. 12 C20-R1.5-G4.0
6.0ρb 6 No. 12 C20-R1.5-G6.0
C40
1.0
3.0ρb 6 No. 10 C40-R1-G3.0
4.0ρb 6 No. 12 C40-R1-G4.0
6.0ρb 5 No. 16 C40-R1-G6.0
1.5
3.0ρb 6 No. 10 C40-R1.5-G3.0
4.0ρb 6 No. 12 C40-R1.5-G4.0
6.0ρb 5 No. 16 C40-R1.5-G6.0
3.3 Details of test specimens
Each test specimen of groups A and B consisted of a double-sided corbel
integrated with a short column as shown in figures 3.1 and 3.2. All corbel had widths
b=150 mm and a depths h= 300mm. All corbels in this study were internally
reinforced with GFRP longitudinal bars located at an effective depth d = 250 mm
from the compression face of the corbels. All twelve corbel specimens had two
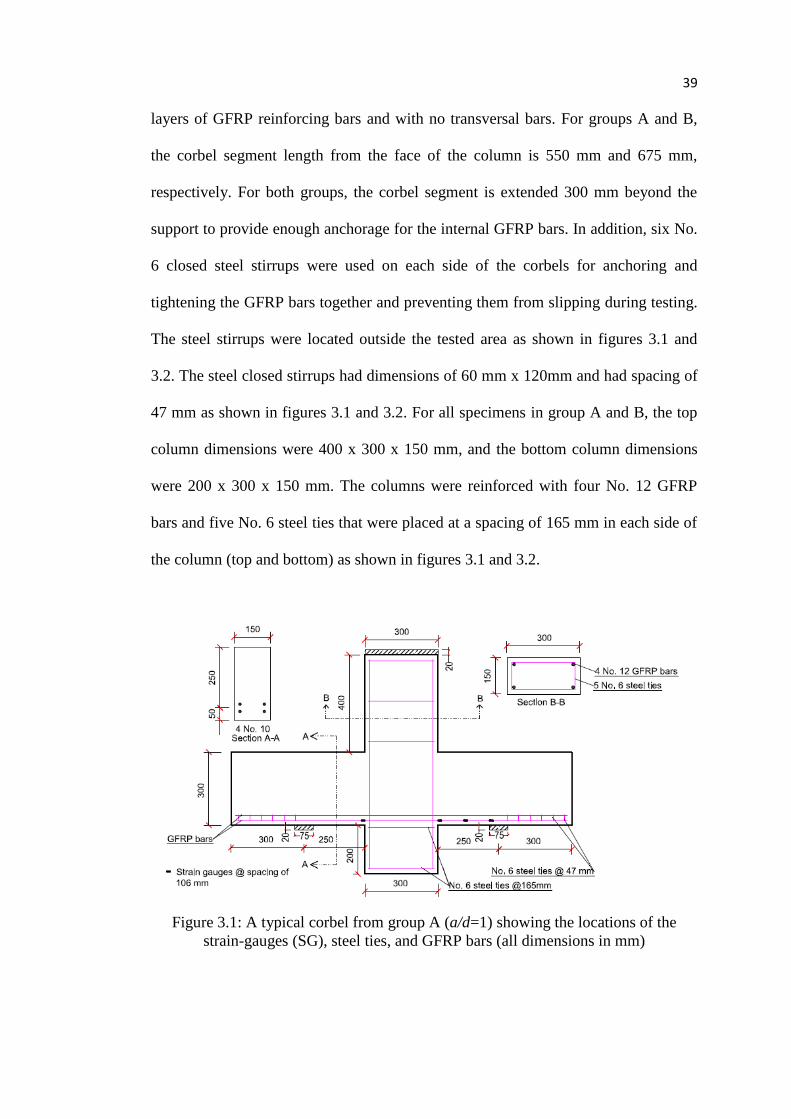
39
layers of GFRP reinforcing bars and with no transversal bars. For groups A and B,
the corbel segment length from the face of the column is 550 mm and 675 mm,
respectively. For both groups, the corbel segment is extended 300 mm beyond the
support to provide enough anchorage for the internal GFRP bars. In addition, six No.
6 closed steel stirrups were used on each side of the corbels for anchoring and
tightening the GFRP bars together and preventing them from slipping during testing.
The steel stirrups were located outside the tested area as shown in figures 3.1 and
3.2. The steel closed stirrups had dimensions of 60 mm x 120mm and had spacing of
47 mm as shown in figures 3.1 and 3.2. For all specimens in group A and B, the top
column dimensions were 400 x 300 x 150 mm, and the bottom column dimensions
were 200 x 300 x 150 mm. The columns were reinforced with four No. 12 GFRP
bars and five No. 6 steel ties that were placed at a spacing of 165 mm in each side of
the column (top and bottom) as shown in figures 3.1 and 3.2.
Figure 3.1: A typical corbel from group A (a/d=1) showing the locations of the
strain-gauges (SG), steel ties, and GFRP bars (all dimensions in mm)
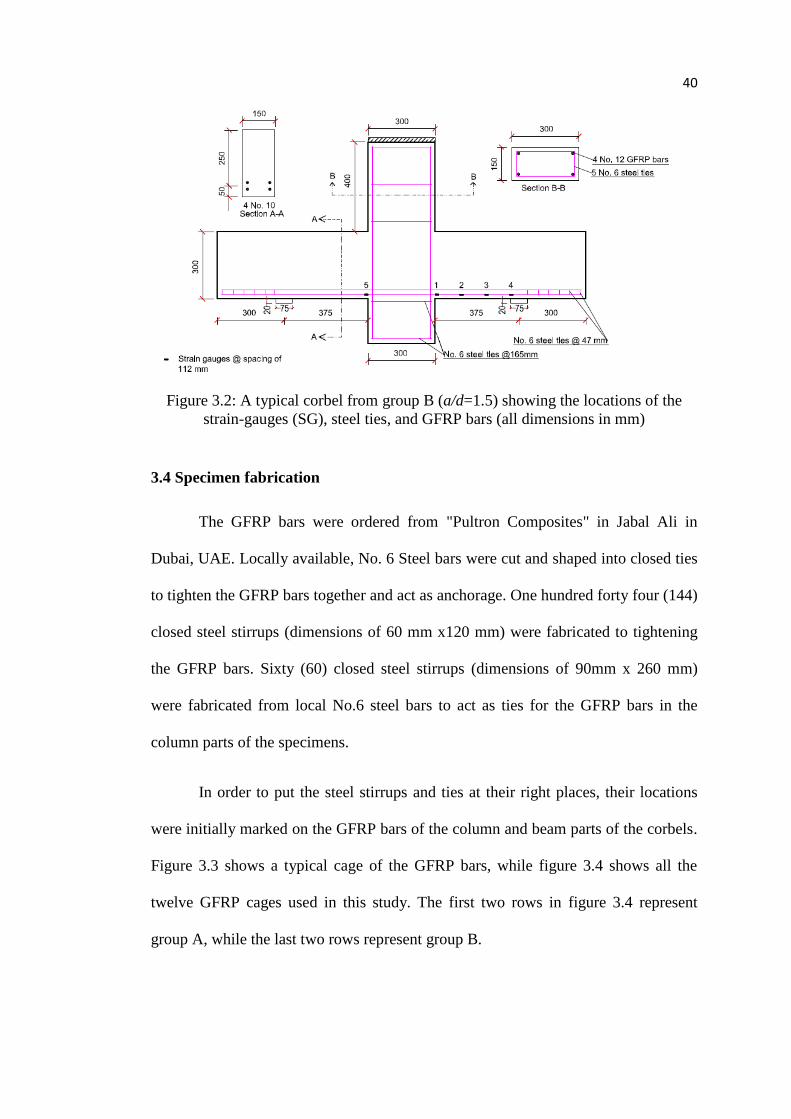
40
Figure 3.2: A typical corbel from group B (a/d=1.5) showing the locations of the
strain-gauges (SG), steel ties, and GFRP bars (all dimensions in mm)
3.4 Specimen fabrication
The GFRP bars were ordered from "Pultron Composites" in Jabal Ali in
Dubai, UAE. Locally available, No. 6 Steel bars were cut and shaped into closed ties
to tighten the GFRP bars together and act as anchorage. One hundred forty four (144)
closed steel stirrups (dimensions of 60 mm x120 mm) were fabricated to tightening
the GFRP bars. Sixty (60) closed steel stirrups (dimensions of 90mm x 260 mm)
were fabricated from local No.6 steel bars to act as ties for the GFRP bars in the
column parts of the specimens.
In order to put the steel stirrups and ties at their right places, their locations
were initially marked on the GFRP bars of the column and beam parts of the corbels.
Figure 3.3 shows a typical cage of the GFRP bars, while figure 3.4 shows all the
twelve GFRP cages used in this study. The first two rows in figure 3.4 represent
group A, while the last two rows represent group B.
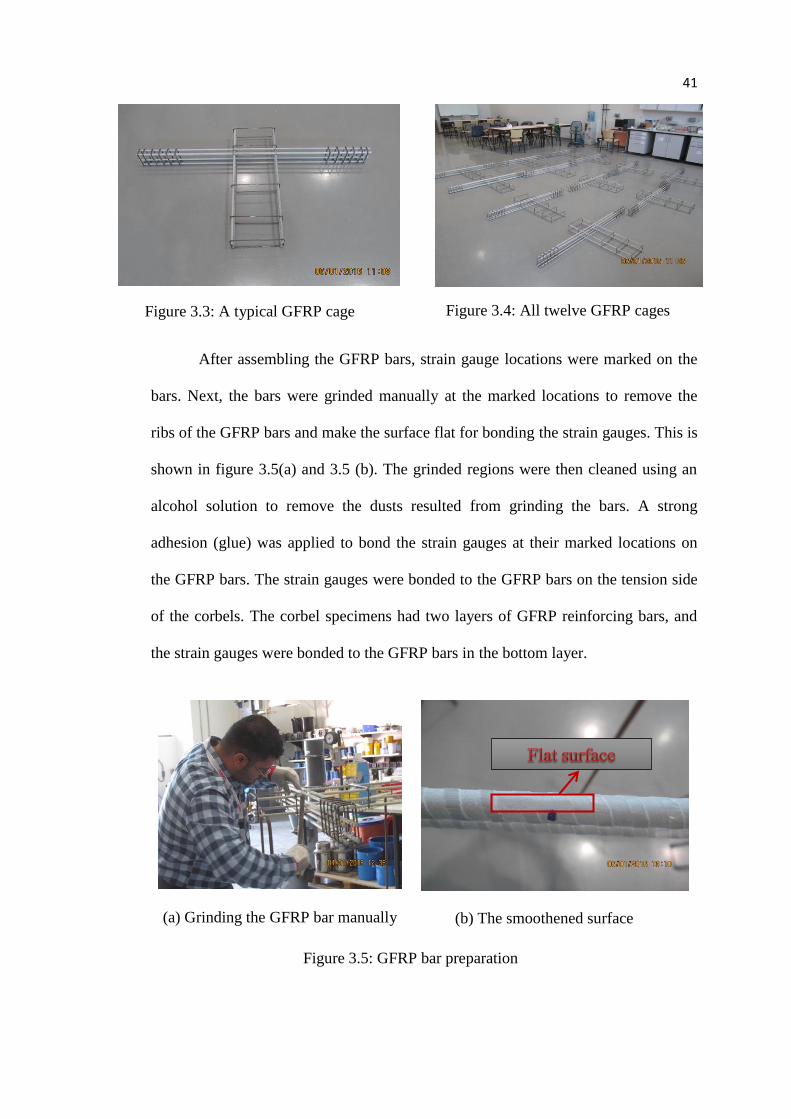
41
After assembling the GFRP bars, strain gauge locations were marked on the
bars. Next, the bars were grinded manually at the marked locations to remove the
ribs of the GFRP bars and make the surface flat for bonding the strain gauges. This is
shown in figure 3.5(a) and 3.5 (b). The grinded regions were then cleaned using an
alcohol solution to remove the dusts resulted from grinding the bars. A strong
adhesion (glue) was applied to bond the strain gauges at their marked locations on
the GFRP bars. The strain gauges were bonded to the GFRP bars on the tension side
of the corbels. The corbel specimens had two layers of GFRP reinforcing bars, and
the strain gauges were bonded to the GFRP bars in the bottom layer.
(a) Grinding the GFRP bar manually (b) The smoothened surface
Figure 3.3: A typical GFRP cage Figure 3.4: All twelve GFRP cages
Figure 3.5: GFRP bar preparation
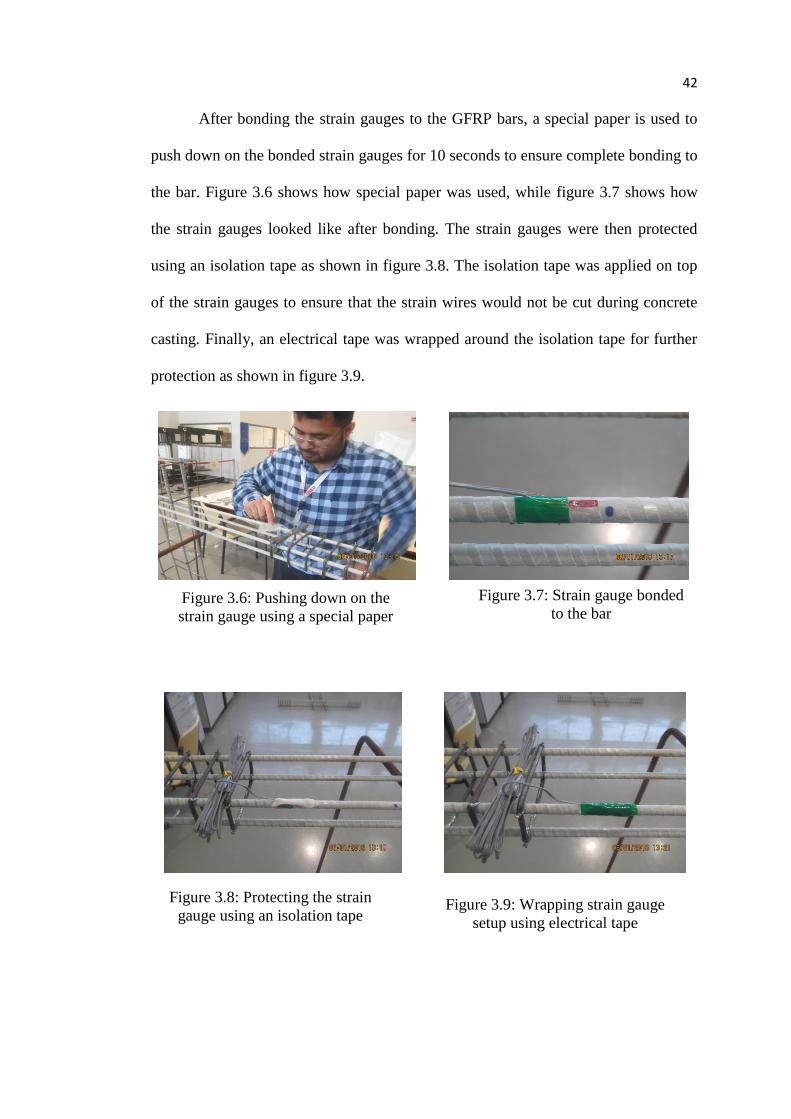
42
After bonding the strain gauges to the GFRP bars, a special paper is used to
push down on the bonded strain gauges for 10 seconds to ensure complete bonding to
the bar. Figure 3.6 shows how special paper was used, while figure 3.7 shows how
the strain gauges looked like after bonding. The strain gauges were then protected
using an isolation tape as shown in figure 3.8. The isolation tape was applied on top
of the strain gauges to ensure that the strain wires would not be cut during concrete
casting. Finally, an electrical tape was wrapped around the isolation tape for further
protection as shown in figure 3.9.
Figure 3.6: Pushing down on the
strain gauge using a special paper Figure 3.7: Strain gauge bonded
to the bar
Figure 3.8: Protecting the strain
gauge using an isolation tape Figure 3.9: Wrapping strain gauge
setup using electrical tape
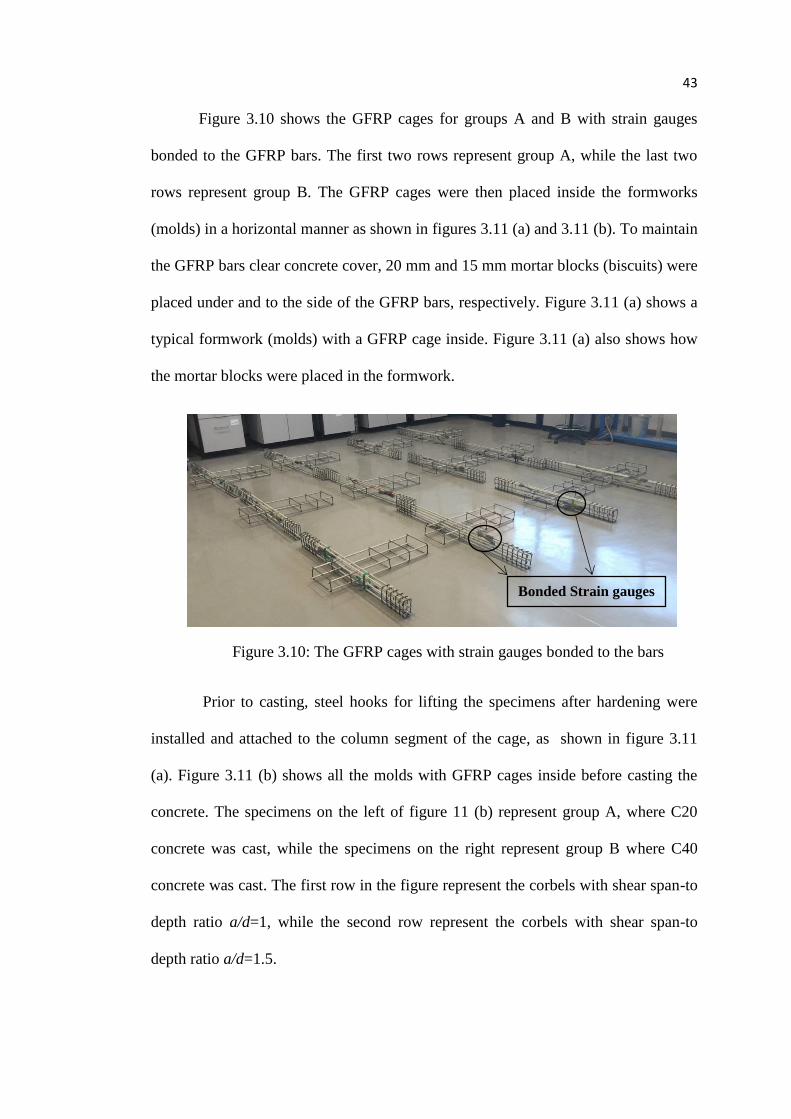
43
Figure 3.10 shows the GFRP cages for groups A and B with strain gauges
bonded to the GFRP bars. The first two rows represent group A, while the last two
rows represent group B. The GFRP cages were then placed inside the formworks
(molds) in a horizontal manner as shown in figures 3.11 (a) and 3.11 (b). To maintain
the GFRP bars clear concrete cover, 20 mm and 15 mm mortar blocks (biscuits) were
placed under and to the side of the GFRP bars, respectively. Figure 3.11 (a) shows a
typical formwork (molds) with a GFRP cage inside. Figure 3.11 (a) also shows how
the mortar blocks were placed in the formwork.
Figure 3.10: The GFRP cages with strain gauges bonded to the bars
Prior to casting, steel hooks for lifting the specimens after hardening were
installed and attached to the column segment of the cage, as shown in figure 3.11
(a). Figure 3.11 (b) shows all the molds with GFRP cages inside before casting the
concrete. The specimens on the left of figure 11 (b) represent group A, where C20
concrete was cast, while the specimens on the right represent group B where C40
concrete was cast. The first row in the figure represent the corbels with shear span-to
depth ratio a/d=1, while the second row represent the corbels with shear span-to
depth ratio a/d=1.5.
Bonded Strain gauges

44
Two concrete batches of compressive strengths 20 MPa (C20) and 40 MPa
(C40) were ordered from a local ready mix plant, Cement Enterprises and Ready Mix
LLC (CEMIX). Two concrete trucks from CEMIX plant delivered the ordered
concrete batches to cast the specimens on the same day. Cylindrical and cubical
samples of the two concrete batches were taken for testing and verifying the concrete
compressive strengths (20 MPa and 40 MPa). Vibration was applied to concrete in
the molds as shown in figure 3.12 to eliminate internal voids. Similarly, the
cylindrical and cubical samples were vibrated using a vibrating table.
Figure 3.12: Vibration of concrete
Hooks
Figure 3.11 (a) A typical formwork
(mold) with GFRP cage inside Figure 3.11 (b): All form work
with GFRP cages inside
Mortar block
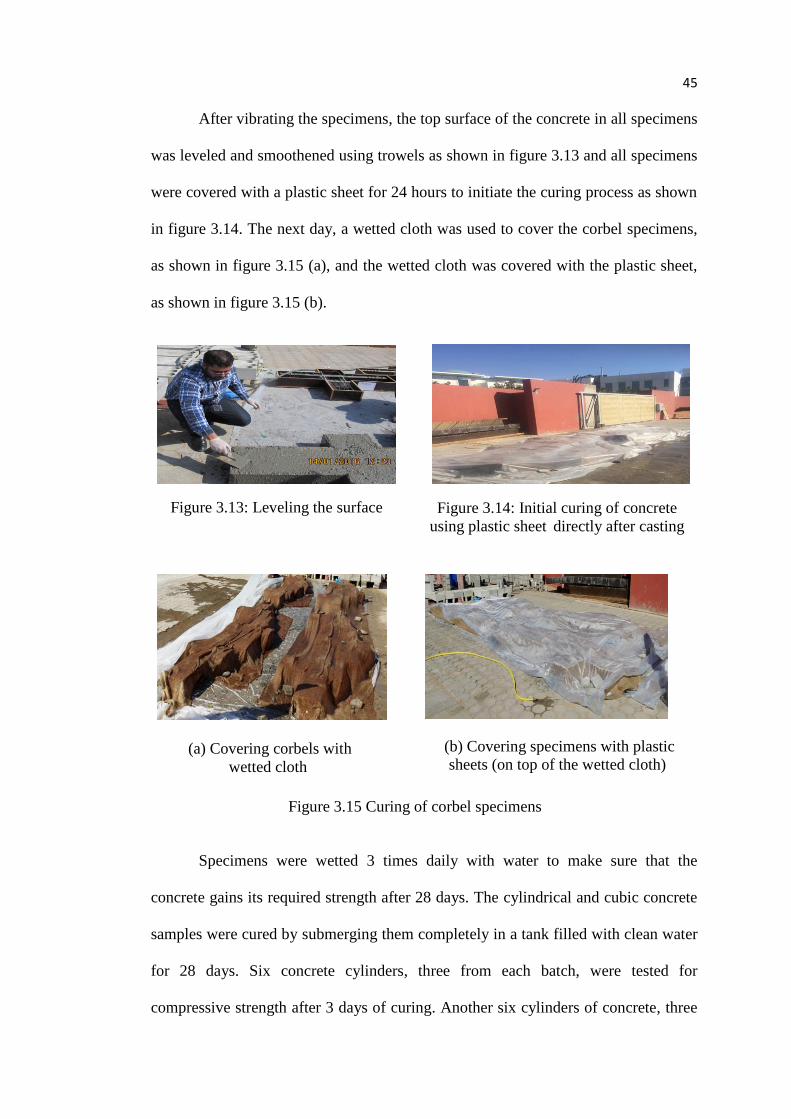
45
After vibrating the specimens, the top surface of the concrete in all specimens
was leveled and smoothened using trowels as shown in figure 3.13 and all specimens
were covered with a plastic sheet for 24 hours to initiate the curing process as shown
in figure 3.14. The next day, a wetted cloth was used to cover the corbel specimens,
as shown in figure 3.15 (a), and the wetted cloth was covered with the plastic sheet,
as shown in figure 3.15 (b).
Specimens were wetted 3 times daily with water to make sure that the
concrete gains its required strength after 28 days. The cylindrical and cubic concrete
samples were cured by submerging them completely in a tank filled with clean water
for 28 days. Six concrete cylinders, three from each batch, were tested for
compressive strength after 3 days of curing. Another six cylinders of concrete, three
Figure 3.13: Leveling the surface Figure 3.14: Initial curing of concrete
using plastic sheet directly after casting
(a) Covering corbels with
wetted cloth (b) Covering specimens with plastic
sheets (on top of the wetted cloth)
Figure 3.15 Curing of corbel specimens
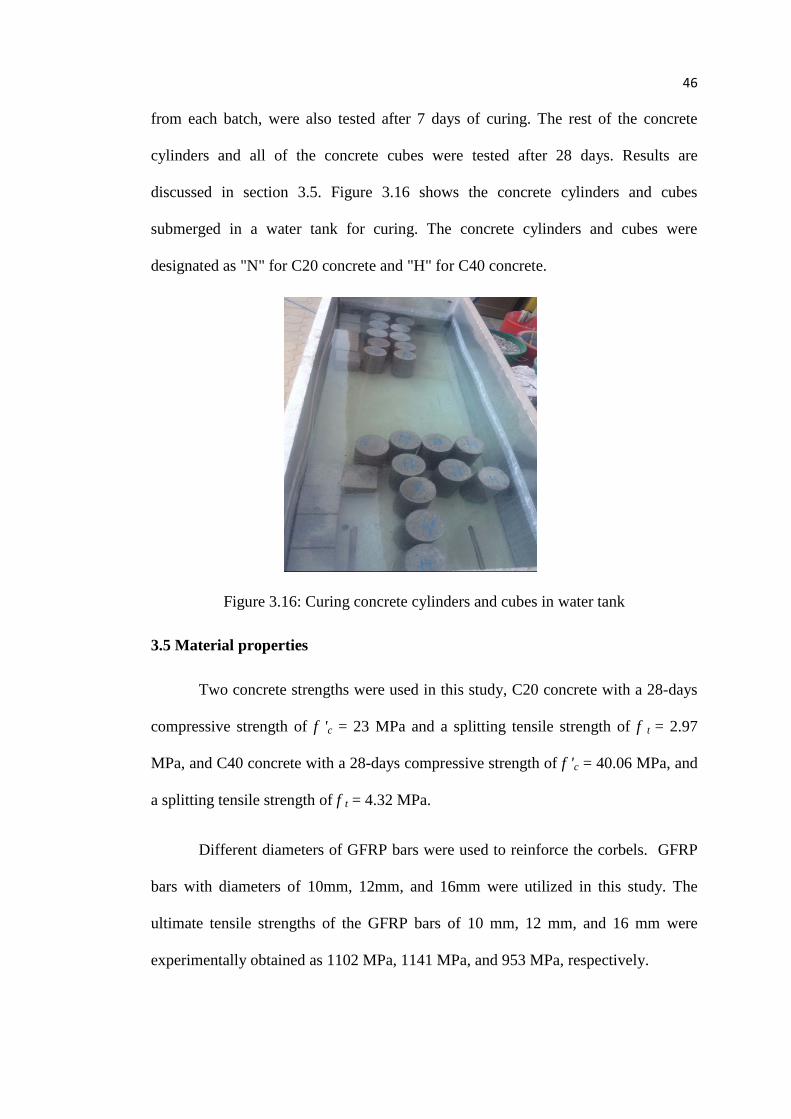
46
from each batch, were also tested after 7 days of curing. The rest of the concrete
cylinders and all of the concrete cubes were tested after 28 days. Results are
discussed in section 3.5. Figure 3.16 shows the concrete cylinders and cubes
submerged in a water tank for curing. The concrete cylinders and cubes were
designated as "N" for C20 concrete and "H" for C40 concrete.
Figure 3.16: Curing concrete cylinders and cubes in water tank
3.5 Material properties
Two concrete strengths were used in this study, C20 concrete with a 28-days
compressive strength of f 'c = 23 MPa and a splitting tensile strength of f t = 2.97
MPa, and C40 concrete with a 28-days compressive strength of f 'c = 40.06 MPa, and
a splitting tensile strength of f t = 4.32 MPa.
Different diameters of GFRP bars were used to reinforce the corbels. GFRP
bars with diameters of 10mm, 12mm, and 16mm were utilized in this study. The
ultimate tensile strengths of the GFRP bars of 10 mm, 12 mm, and 16 mm were
experimentally obtained as 1102 MPa, 1141 MPa, and 953 MPa, respectively.
47
3.5.1 Concrete
The concrete mix proportions for group A and B are summarized in tables 3.2
and 3.3. Ordinary Type 1 Portland cement was used in all concrete mixes. The water-
cement ratio (w/c) for C20 concrete of group A and C40 concrete of group B was
0.44 and 0.35, respectively.
A total of 12 concrete cylindrical molds (300 mm x 150 mm), and 6 concrete
cubic molds (150 mm x 150 mm x 150 mm) were filled with the two grades of
concrete. The molds with the concrete samples were subjected to curing process for
28 days.
Table 3.2: C20 concrete mix proportions
Mix Design Saturated-Surface-Dry
(SSD) Water Cement ratio 0.44
Ordinary Portland Cement 380 kg/m3
20 mm crushed coarse
aggregate 645 kg/m
3
10 mm crushed coarse
aggregate 370 kg/m
3
5 mm crushed black sand 650 kg/m3
Dune Sand 215 kg/m3
Used water 182 Ltr/m3
Envirocon-Ecoment 1 4 Ltr/m3
Table 3.3: C40 Concrete mix proportions
Mix Design Saturated-Surface-Dry
(SSD) Water Cement ratio 0.35
Ordinary Portland Cement 440 kg/m3
20 mm crushed coarse
aggregate 636 kg/m
3
10 mm crushed coarse
aggregate 412 kg/m
3
5 mm crushed black sand 599 kg/m3
Dune Sand 225 kg/m3
Used water 167 Ltr/m3
Envirocon-Ecoment 1 5 Ltr/m3
48
After 28 days of curing, three concrete cylinders (150 mm x300 mm) from
each concrete batch were tested to determine the concrete compressive strengths.
Prior testing, the surfaces of the top cylinders were grinded to have a leveled and
smooth surface as shown in figure 3.17. Figures 3.18(a), 3.18 (b), and 3.18 (c) show
the concrete cylinders prior to testing, during testing, and after testing, respectively.
The 28-day average compressive strength of C20 concrete was 23 MPa with a
standard deviation of 0.357 MPa. On the other hand, the 28-day average compressive
strength of C40 concrete was 40.06 MPa, with a standard deviation of 3.40 MPa.
Table 3.3 summarizes the concrete compressive strength results obtained after 28
days of curing for both batches concrete cylinders.
Figure 3.17: smoothening the top
surface
(a) Concrete cylinders prior
testing (N:C20 Concrete),
(H: C40 concrete)
(b) A typical
compression test (c) Concrete cylinders
after testing
Figure 3.18: Preparation and testing of specimens
49
Table 3.4: 28-day compressive strength results of concrete cylinders
Type Number Diameter
(mm)
Length
(mm)
Load
(kN)
Strength
(MPa)
Average
Strength
(MPa)
C20
1 150.84 295 405 22.66
23 2 150 298 413 23.37
3 150.39 298 410 23.08
C40
1 150.09 295 705 39.84
40.06 2 150 295 770 43.57
3 150 295 770 36.78
The 28-day average compressive strength of C20 concrete cube samples was
34.3 MPa with a standard deviation of 1.00 MPa, while the 28-day average
compressive strength of C40 concrete cube samples was 56.4 MPa with a standard
deviation of 5.21 MPa. Table 3.4 summarizes the results of the 28-day concrete cube
strengths of the concrete cubes for both type of concrete.
Table 3.5: 28-day compressive strength results of concrete cubes
Type Number Length
(mm)
Width
(mm)
Load
(kN)
Strength
(MPa)
Average
Strength
(MPa)
C20
1 150 150 750 33.33
34.3 2 150 150 770 34.22
3 150 150 795 35.33
C40
1 150 150 1330 50.44
56.4 2 150 150 1345 59.11
3 150 150 1375 59.78
The splitting tensile strength for C20 concrete was 3.0 MPa with a standard
deviation of 0.07 MPa, whereas the splitting tensile strength for C40 concrete was
4.6 MPa with a standard deviation of 0.12 MPa. Table 3.5 summarizes the concrete
splitting results of both batches of concrete.

50
Table 3.6: Concrete splitting strength results
Type Number Diameter
(mm)
Length
(mm)
Load
(kN)
Strength
(MPa)
Average
Strength
(MPa)
C20
1 150 300 215 3.04
3.0 2 150 300 205 2.9
3 150 300 210 2.97
C40
1 150 300 330 4.67
4.6 2 150 300 328 4.64
3 150 300 315 4.45
3.5.2 GFRP reinforcement
The GFRP bars used in this research were ordered from "Pultron Composites
factory" in Dubai, UAE. The GFRP bars are deformed bars with ribs in order to
enhance the bond with concrete and prevent slippage. Three different bar sizes were
chosen for this study (as it is shown in figure 3.19), 10 mm, 12 mm, and 16 mm in
diameter. Table 3.6 shows the mechanical properties of the GFRP bars. Samples of
the GFRP bars were tested under uniaxial tension in a certified local laboratory
(American University of Sharjah laboratory). Tensile test results of the GFRP bars
are reported in table 3.7. The ultimate strengths for the GFRP bars of diameters 10
mm, 12 mm, and 16 mm were 1102MPa, 1141 MPa, and 953 MPa, respectively.
Figure 3.19: GFRP bars used in this study
51
Table 3.7: Mechanical properties of the GFRP bars
Table 3.8: Tensile test results of the GFRP bars
Nominal
Diameter No.
Ultimate
Load Pu
(kN)
Ultimate
Strength
fu (Mpa)
Average
Ultimate
Strength
fu (Mpa)
Overall
average
Strength
fu (Mpa)
ɸ10
1 89.2 1066.6
1101.6
1065.2
2 94.0 1124.7
3 93.1 1113.5
ɸ12 1 126.2 1137.3
1141.1 2 127.0 1144.9
ɸ16
1 208.0 1018.2
953.0 2 189.9 929.5
3 186.2 911.4
3.5.2.1 Preparation of GFRP bars for tensile test
To test the GFRP bars for tensile strength, ten pieces of 500 mm long steel
tubes were ordered for the 10mm and 12 mm GFRP bars, and six pieces of 650 mm
long steel tubes were ordered for the 16 mm GFRP bars. The 500 mm long steel
tubes had inner diameter of 25 mm and outer diameter of 35 mm, while the 650 mm
long steel tubes had inner diameter of 35 mm and outer diameter of 50 mm. The steel
tubes were ordered from a local market in Al-Ain, UAE and were coiled from inside.
The ends of each GFRP bar sample were enclosed in the steel tube with epoxy resin
already injected inside the steel tubes to provide bond between the GFRP bar sample
Material
Bar
diameter
(mm)
Elastic
Modulus
(GPa)
Ultimate
Tensile
strength
(MPa)
Ultimate
strain
GFRP 10 52.1 1101.6 0.0148
GFRP 12 49.7 1141.1 0.0163
GFRP 16 51.5 953.0 0.0142
52
and the steel tube and to prevent any slippage during testing. Plastic Teflon rings
were ordered from a local market and were used to ensure that the GFRP bars are
centered inside the steel tubes. Figures 3.21 (a) and 3.21 (b) shows the typical 500
mm long steel tubes and plastic Teflon rings used in this study. According to ACI
440, the mid-span of the GFRP bars must be at least 40Φ, where Φ is the diameter of
the bar. The mid-span was 400 mm for the 10 mm GFRP bar as shown in figure 3.20.
Figure 3.20: A 10 mm GFRP bar inserted in steel tubes from both sides
The epoxy resins, commercially known as Sikadur 30 LP were used for
bonding the GFRP bars inside the tubes. The epoxy resin consisted of two
components as shown in figure 3.22 (a) that must be mixed with ratios of 3:1 by
weight prior using. Figure 3.22 (a) also shows the tools used for the mixing process
Figure 3.21 (a): 500 mm steel tubes Figure 3.21 (b): Plastic teflon rings
53
before inserting the epoxy inside the steel tubes, while figures 3.22 (b) and (c) shows
the mixing process. A cartridge gun was filled with the epoxy and was used to insert
the epoxy resin inside the steel tubes. Finally, the GFRP bars were inserted gradually
in the steel tubes. Figure 3.23 (a) shows the injection process of the epoxy inside the
steel tube, while figure 3.23 (b) shows the insertion of GFRP bars inside the steel
tubes filled with epoxy resin. The plastic Teflon was first inserted in the GFRP bar to
ensure that the bar will be centered in the steel tubes. One side of each GFRP bars
was inserted in the steel tubes at a time and was left for a day to bond with epoxy
resin. The following day, the other side of each GFRP bar was inserted in the steel
tubes and similarly was left for a day to bond with the epoxy resin.
(a) Epoxy resin and the
mixing tools (b) Mixing the epoxy resin
with each other using ratio
of 3:1 by weight (c) Using the mixer
for mixing the epoxy
(a) Injecting the epoxy resin
inside the steel tube. (b) Inserting the GFRP bar inside
the steel tube.
Figure 3.22: Preparation of the epoxy resin mixture
Figure 3.23: Installing the GFRP bar inside the steel tube for the Pull-test.

54
After hardening of the epoxy resins, the mid-span of the GFRP bars was
cleaned and prepared for bonding the strain gauges to it. Three strain gauges were
used in each bar; one was bonded at the center of the GFRP bar, while the other two
were bonded at a distance of 100 mm on each side of the bar center. The locations of
the strain gauges were marked, and grinding of the GFRP was done at the marked
locations. Grinding was done manually to level the GFRP ribs as shown in figure
3.24. The grinded regions were then cleaned using an alcohol solution to remove the
dusts resulted from the grinding process. A strong adhesion was then applied to bond
the strain gauges to the bars at their marked locations as shown in figure 3.25.
Figure 3.26 (a) shows a 12 mm GFRP bar sample mounted on the uniaxial
tension testing machine, while figure 3.26 (b) shows the 12 mm GFRP bar failure in
rupture.
Figure 3.24: Flattening the GFRP
ribs at the marked locations Figure 3.25: Strain gauges bonded at
their marked locations
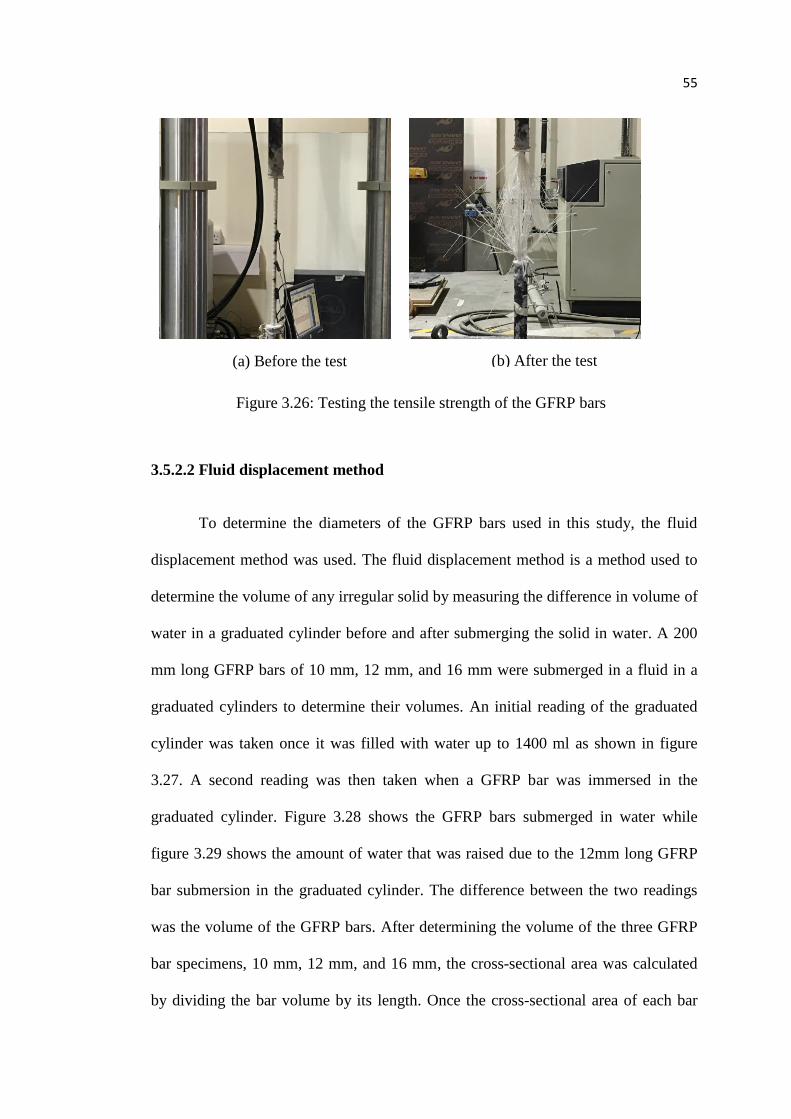
55
3.5.2.2 Fluid displacement method
To determine the diameters of the GFRP bars used in this study, the fluid
displacement method was used. The fluid displacement method is a method used to
determine the volume of any irregular solid by measuring the difference in volume of
water in a graduated cylinder before and after submerging the solid in water. A 200
mm long GFRP bars of 10 mm, 12 mm, and 16 mm were submerged in a fluid in a
graduated cylinders to determine their volumes. An initial reading of the graduated
cylinder was taken once it was filled with water up to 1400 ml as shown in figure
3.27. A second reading was then taken when a GFRP bar was immersed in the
graduated cylinder. Figure 3.28 shows the GFRP bars submerged in water while
figure 3.29 shows the amount of water that was raised due to the 12mm long GFRP
bar submersion in the graduated cylinder. The difference between the two readings
was the volume of the GFRP bars. After determining the volume of the three GFRP
bar specimens, 10 mm, 12 mm, and 16 mm, the cross-sectional area was calculated
by dividing the bar volume by its length. Once the cross-sectional area of each bar
(a) Before the test (b) After the test Figure 3.26: Testing the tensile strength of the GFRP bars
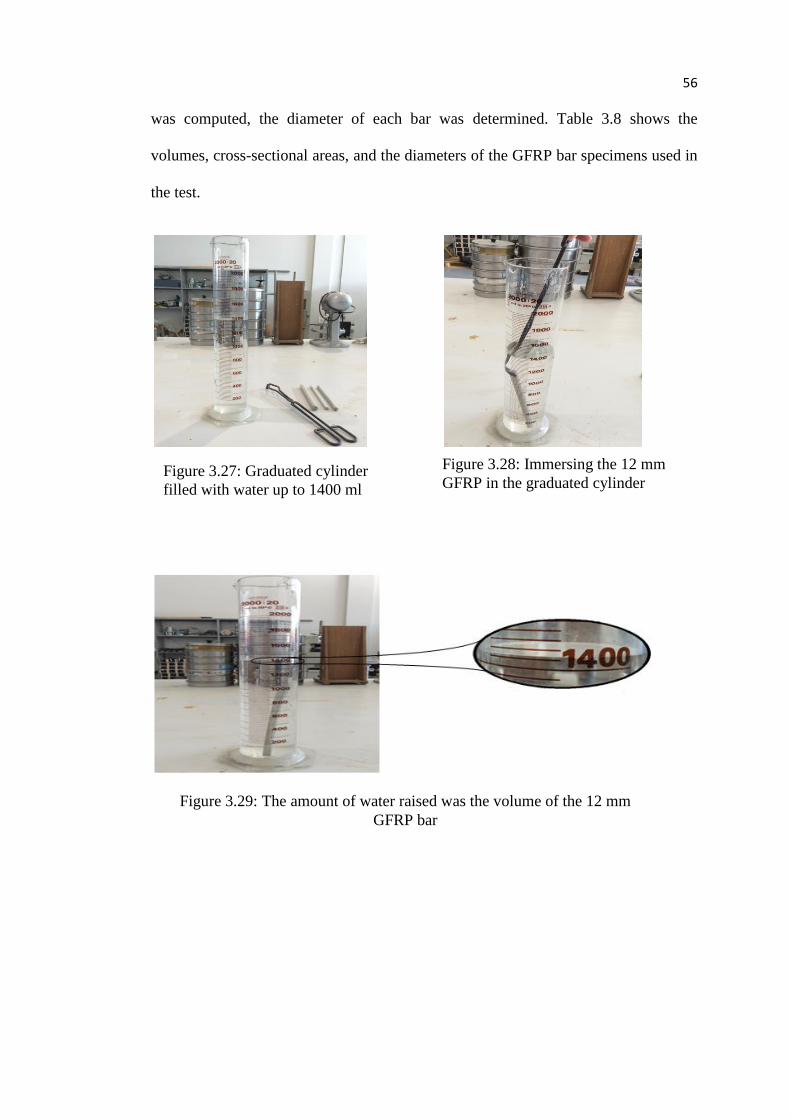
56
was computed, the diameter of each bar was determined. Table 3.8 shows the
volumes, cross-sectional areas, and the diameters of the GFRP bar specimens used in
the test.
Figure 3.27: Graduated cylinder
filled with water up to 1400 ml Figure 3.28: Immersing the 12 mm
GFRP in the graduated cylinder
Figure 3.29: The amount of water raised was the volume of the 12 mm
GFRP bar
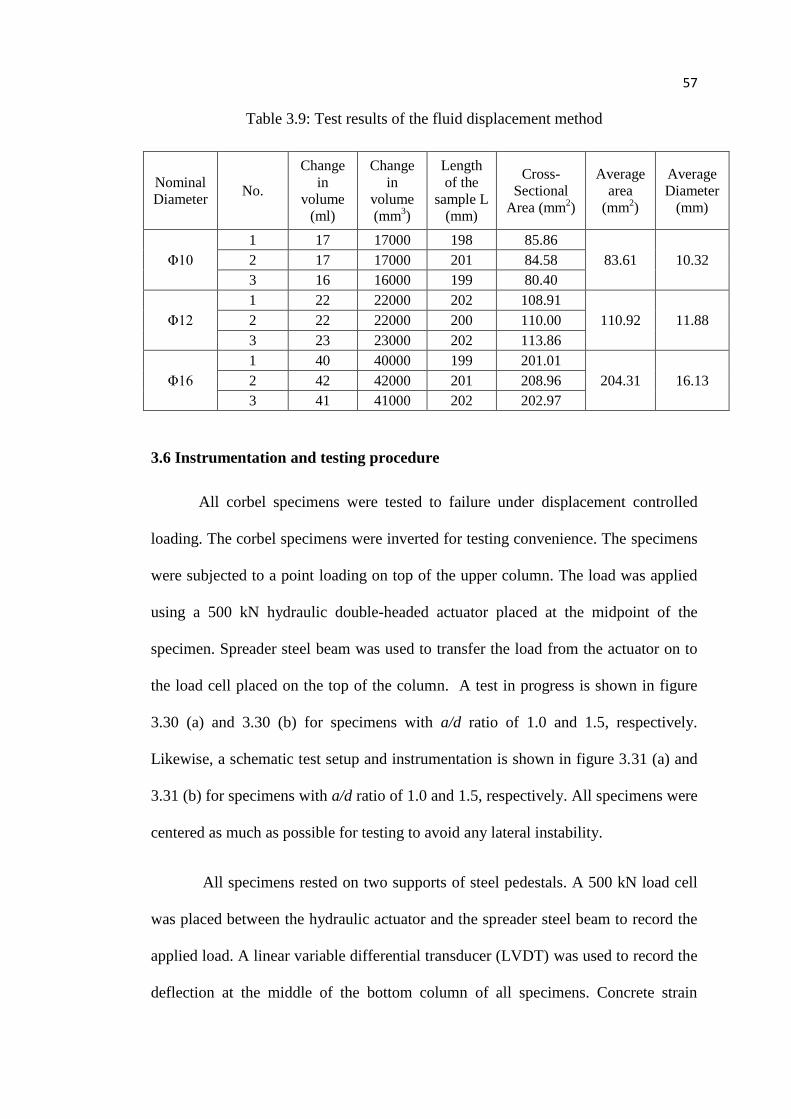
57
Table 3.9: Test results of the fluid displacement method
3.6 Instrumentation and testing procedure
All corbel specimens were tested to failure under displacement controlled
loading. The corbel specimens were inverted for testing convenience. The specimens
were subjected to a point loading on top of the upper column. The load was applied
using a 500 kN hydraulic double-headed actuator placed at the midpoint of the
specimen. Spreader steel beam was used to transfer the load from the actuator on to
the load cell placed on the top of the column. A test in progress is shown in figure
3.30 (a) and 3.30 (b) for specimens with a/d ratio of 1.0 and 1.5, respectively.
Likewise, a schematic test setup and instrumentation is shown in figure 3.31 (a) and
3.31 (b) for specimens with a/d ratio of 1.0 and 1.5, respectively. All specimens were
centered as much as possible for testing to avoid any lateral instability.
All specimens rested on two supports of steel pedestals. A 500 kN load cell
was placed between the hydraulic actuator and the spreader steel beam to record the
applied load. A linear variable differential transducer (LVDT) was used to record the
deflection at the middle of the bottom column of all specimens. Concrete strain
Nominal
Diameter No.
Change
in
volume
(ml)
Change
in
volume
(mm3)
Length
of the
sample L
(mm)
Cross-
Sectional
Area (mm2)
Average
area
(mm2)
Average
Diameter
(mm)
Φ10
1 17 17000 198 85.86
83.61 10.32 2 17 17000 201 84.58
3 16 16000 199 80.40
Φ12
1 22 22000 202 108.91
110.92 11.88 2 22 22000 200 110.00
3 23 23000 202 113.86
Φ16
1 40 40000 199 201.01
204.31 16.13 2 42 42000 201 208.96
3 41 41000 202 202.97

58
gauges, each having a gauge length of 60 mm, were mounted on the concrete surface
as shown in figures 3.30 (a) and 3.30 (b) to record the compressive concrete strains.
A data logger manufactured by TML Tokoyo Sokki Kenkyujo Co. was used to
record the readings from the load cell, strain gauges, and LVDT.
(a) Corbel specimen with a/d =1.0 (C20-R1-G3.0)
C20-R1-G3.0
(b) Corbel specimen with a/d = 1.5 (C20-R1.5-G3.0)
C20-R1.5-G3.0
Figure 3.30: Test in progress for corbel specimens
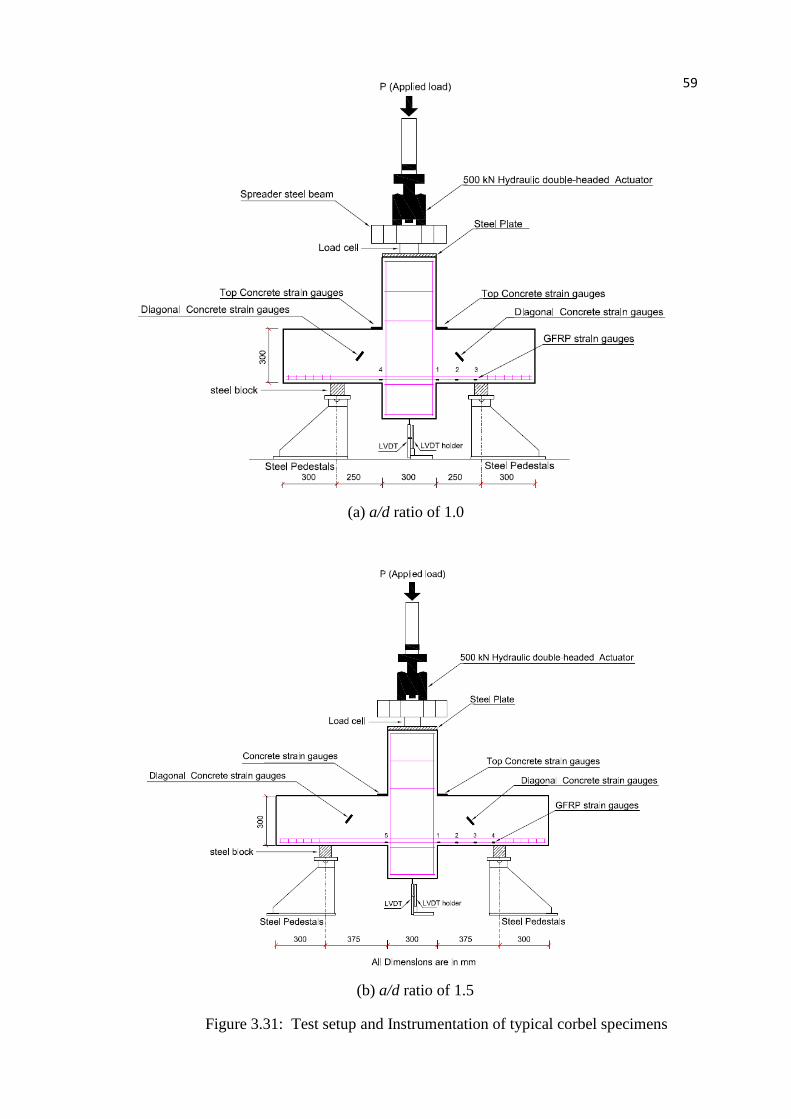
59
(a) a/d ratio of 1.0
(b) a/d ratio of 1.5
Figure 3.31: Test setup and Instrumentation of typical corbel specimens
60
Chapter 4: Experimental Results
4.1 Introduction
This chapter presents the experimental results of 12 corbel specimens
reinforced with internal GFRP bars. All specimens were tested to failure and the
crack damages were observed and marked. For all test specimens, different load
measurements were captured at all stages of testing. The results include failure
modes, load-deflection responses, load-concrete strain responses, and load-GFRP
bars strain responses. In order to have an augmented understanding of the behavior
of concrete corbels with internal GFRP bars, a discussion of all test results are
provided herein in terms of the effects of concrete compressive strength, shear span-
to-effective depth ratio (a/d), and GFRP reinforcement ratio on the corbel shear
strength.
4.2 Test results of group [A]
Group [A] consists of six corbel specimens that were cast with C20 concrete.
Group [A] was divided into two sub-groups based on their shear span-to-effective
depth (a/d) ratio. The first sub-group had an a/d ratio of 1.0 while the second sub-
group had an a/d ratio of 1.5. Each sub-group contained three specimens of different
longitudinal reinforcement ratios, 3.0 ρb, 4.0 ρb, and 6.0 ρb, where ρb is the GFRP
balanced reinforcement ratio.
4.2.1 Specimens with a/d ratio of 1.0
This section discusses the failure modes and crack patterns of the three corbel
specimens with a/d ratio of 1.0. These specimens are: C20-R1-G3, C20-R1-G4, and
61
C20-R1-G6.0. This section also discusses the load-deflection response, the load-
concrete strain responses, and the load-FRP strain response of the tested specimens.
4.2.1.1 Crack patterns and failure modes
The crack patterns at failure for corbel specimens C20-R1-G3, C20-R1-G4,
and C20-R1-G6.0, are shown in figures 4.1 (a), 4.1 (b), and 4.1 (c), respectively. It
was noticed that the crack pattern was identical in the three specimens. For instance,
as the corbels were loaded, flexural hair cracks developed initially at the section of
the maximum moment (at the column interface). The flexural cracks started to
develop at loads that ranged between 60 kN to 80 kN. As the load increased,
additional cracks developed in the shear span zone and progressively deviated into
inclined cracks due to the presence of the shear stresses. The corbel specimens
continued to sustain more loads and diagonal struts shaped up between two adjacent
diagonal shear cracks parallel to each other. Failure of all specimens occurred only
after a primary diagonal crack parallel to the strut developed between the corbel load
point and the column-beam interface. It was found that C20-R1-G6 had more
scattered cracks than C20-R1-G4 specimen, which in turn had more scattered crack
far apart from one another than those in C20-R1-G3. After the formation of the
diagonal struts, some corbel specimens such as C20-R1-G3 exhibited a plastic
response, shown clearly in figure 4.2, where there is an increase in deflection without
much increase in the load. Some other corbel specimens such as C20-R1-G4 and
C20-R1-G6 increased in deflection with slight increase in load after the formation of
the diagonal strut as shown also in figure 4.2. After the plastic response, the corbels
failed in shear by crushing of their diagonal struts as shown in figures 4.1 (a) 4.1 (b)

62
and 4.1 (c). Corbel specimens C20-R1-G3, C20-R1-G4, and C20-R1-G6.0 achieved
an ultimate load of 169.5 kN, 183.2 kN, and 329.6 kN, respectively.
Figure 4.1 (a): Crack patterns in C20-R1-G3 corbel specimen
Figure 4.1 (b): Crack patterns in C20-R1-G4 corbel specimen
C20-R1-G3
C20-R1-G4
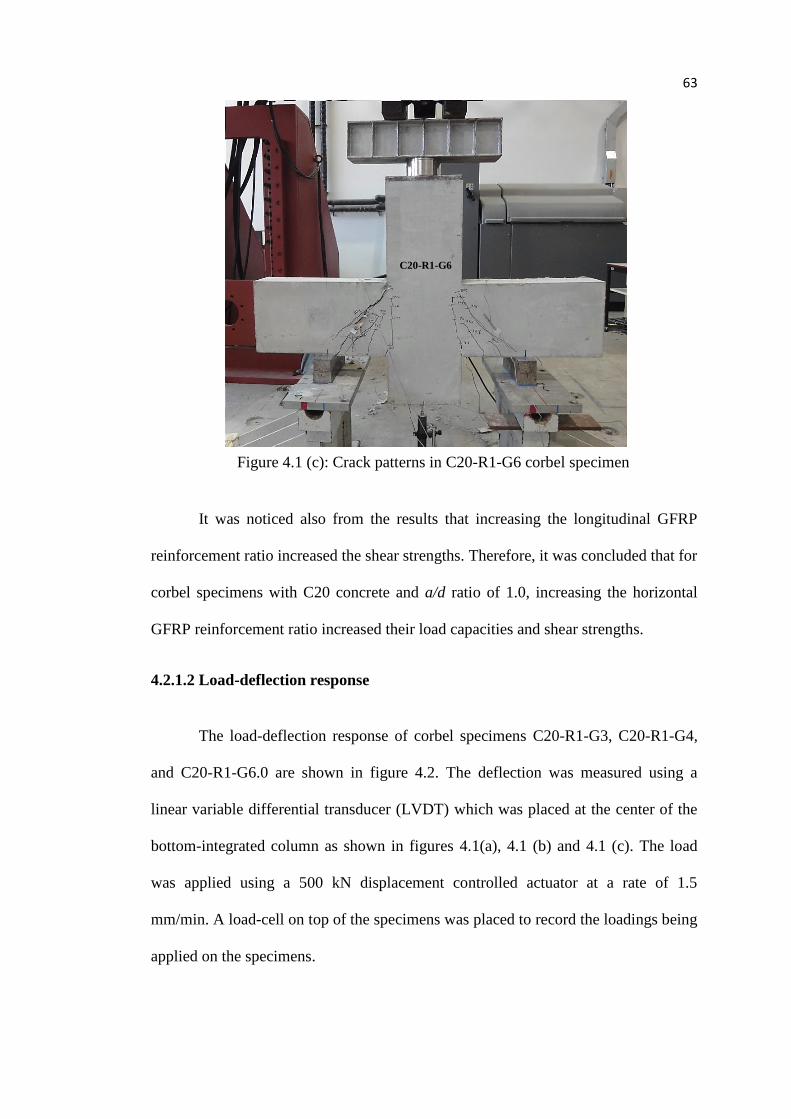
63
It was noticed also from the results that increasing the longitudinal GFRP
reinforcement ratio increased the shear strengths. Therefore, it was concluded that for
corbel specimens with C20 concrete and a/d ratio of 1.0, increasing the horizontal
GFRP reinforcement ratio increased their load capacities and shear strengths.
4.2.1.2 Load-deflection response
The load-deflection response of corbel specimens C20-R1-G3, C20-R1-G4,
and C20-R1-G6.0 are shown in figure 4.2. The deflection was measured using a
linear variable differential transducer (LVDT) which was placed at the center of the
bottom-integrated column as shown in figures 4.1(a), 4.1 (b) and 4.1 (c). The load
was applied using a 500 kN displacement controlled actuator at a rate of 1.5
mm/min. A load-cell on top of the specimens was placed to record the loadings being
applied on the specimens.
Figure 4.1 (c): Crack patterns in C20-R1-G6 corbel specimen
C20-R1-G6

64
Each corbel specimen featured three stages while testing. In the first stage,
the load-deflection response of C20-R1-G3.0 increased linearly as the load was
increasing until the initiation of flexural cracks on the tension side (at the section of
the maximum moment) at load level of approximately 80 kN. After that, the
deflection increased at a higher rate until a peak load of 169 kN and a deflection of
1.6 mm was reached. After reaching the peak load, the second stage began with a
sudden drop in the load from 169 kN to 125 kN associated with a jump in the
deflection from 1.6 mm to 2.2 mm as a result of a development of the first diagonal
shear crack in the west zone of the corbel. The sudden drop in the load was followed
by a plastic response of the corbel resulting in a significant increase in deflection
from 2.2 mm to 3.5 mm without any considerable increase in the load, as shown in
figure 4.2. The plastic response of the corbel is attributed to the formation of a
diagonal strut (in the west branch) as shown in 4.1 (a). The third stage was the failure
of the corbel due to crushing of the diagonal strut when the deflection reached 3.5
mm as shown in figure 4.2.
0
50
100
150
200
250
300
350
400
0 2 4 6 8 10
To
tal
Ap
pli
ed L
oad
(kN
)
Deflection (mm)
Load-Deflection response
C20-R1-G3.0
C20-R1-G4.0
C20-R1-G6.0
C20-R1-G3.0
C20-R1-G4.0 C20-R1-G6.0
Figure 4.2: Load-deflection responses for corbel specimens C20-R1-G3,
C20-R1-G4, and C20-R1-G6
65
The pre-cracking behavior of the C20-R1-G4.0 specimen was linear until a
flexural crack developed at a load 60 kN accompanied with a deflection of 1.1 mm.
As a result of the flexural crack development, a load decay took place causing a
slight increase in deflection without affecting the stiffness of the corbel. The corbel
behavior progressed linearly until the generation of the first diagonal crack at a load
of 155 kN. The diagonal crack resulted in a slight drop in the load but the corbel
continued to carry additional load until the formation of the second diagonal shear
crack at a load of 177 kN, as shown in figure 4.2. As a result, the stiffness of the
corbel decreased but it was able to sustain an increase in the deflection from 2.2 mm
to 2.6 mm with minor increase in the load from 177 kN to peak load of 183 kN. This
is because of the diagonal strut that was formed between the two diagonal shear
cracks shown in figure 4.1 (b). The corbel failed in strut crushing when the deflection
reached 2.6 mm.
The load-deflection response of the corbel specimen C20-R1-G6.0 is similar
to that of specimen C20-R1-G4.0. The load-deflection curve increased linearly as the
load was applied until flexural cracks initiated at a load of about 130 kN. The corbel
stiffness was not affected by the flexural crack as shown in figure 4.2 and the
deflection kept increasing at the same rate until a shear crack initiated at a load level
of 200 kN. The corbel behavior continued linearly until the first diagonal shear crack
was developed at a load of 300 kN causing a drop in the load to 270 kN accompanied
with an increase in the deflection from 2.5 mm to 2.8 mm as shown in figure 4.2. The
specimen regained strength due to formation of a diagonal strut, and carried more
load till it reached a peak load of 329 kN at a deflection of 3.4 mm. At the peak load,
a second diagonal crack developed causing the load to drop down to 320 kN
followed by a sudden increase in the deflection from 3.5 mm to 3.9 mm with slight
66
increase in the load to 329 kN due to formation of the diagonal strut. After reaching a
load of 329 kN and a deflection of 4.0 mm, the specimen failed by crushing of the
diagonal strut as shown in figure 4.1 (c). It is evident from figure 4.2 that increasing
the GFRP reinforcement ratio did not compromise the stiffness of the specimens
much but increased their load capacity. In addition, plastic behavior of the specimens
was more pronounced in specimens with lower GFRP ratios.
It can be seen from figure 4.2 that increasing the ratio of the GFRP bars from
3 ρb to 4 ρb increased the corbel shear strength by only 8%. However, increasing the
GFRP bar ratio from 3 ρb to 6 ρb and from 4 ρb to 6 ρb increased the corbel shear
strength by 87% and 95%, respectively. Therefore, the threshold rate at which the
behavior changes is GFRP ratio of 6 ρb, which is demonstrated by the change of
failure modes approved experimentally in this study.
4.2.1.3 Load-concrete strain response
4.2.1.3.1 Concrete top strain response
Figure 4.3 compares the concrete top strains of all specimens in group [A]
with a/d of 1.0. In the pre-cracking stage of specimen C20-R1-G3.0, the top strains
increased linearly as the load was applied until flexural cracks developed at the
section of the maximum moment at loads of approximately 80 kN and 95 kN. The
flexural crack caused a sudden increase in the top strains for the same loads as shown
on the east and west sides of figure 4.3. After the cracking stage, the load-top strain
responses increased linearly at a lower rate until a peak load of 169 kN is reached.
The maximum strains that C20-R1-G3.0 specimen reached in the right and left sides
of the corbel are 372, and 500 micro-strains, respectively. Figure 4.3 demonstrates
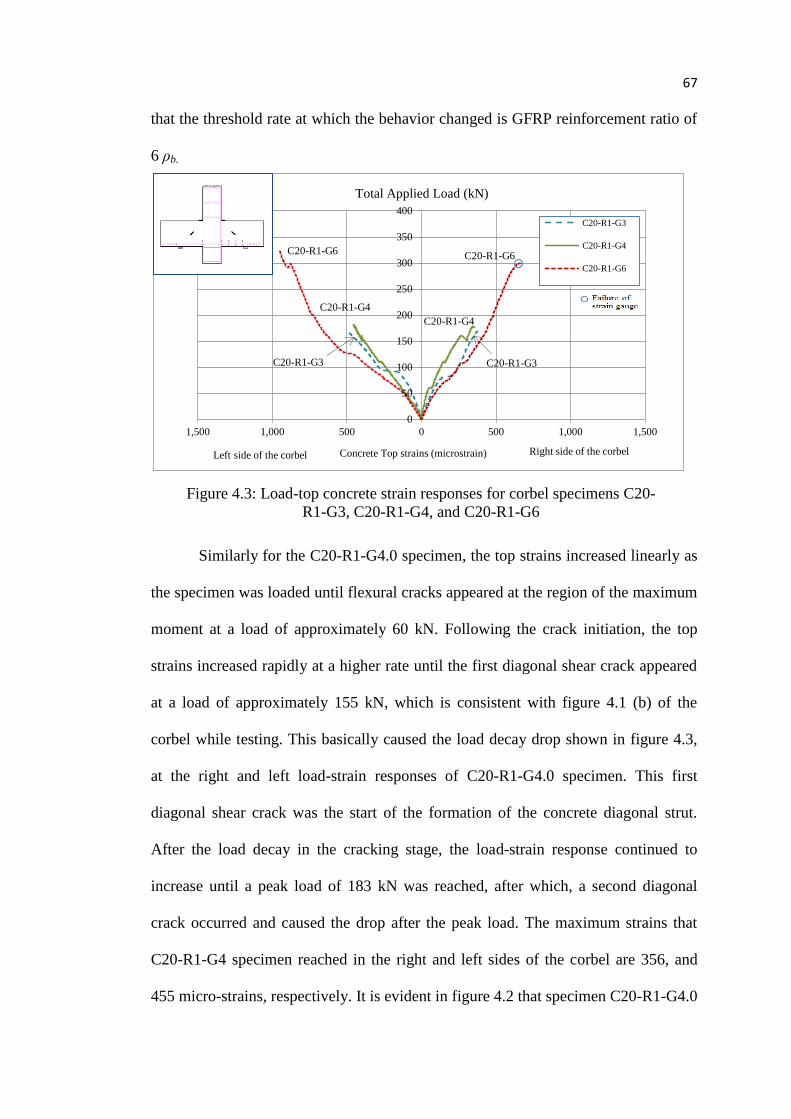
67
that the threshold rate at which the behavior changed is GFRP reinforcement ratio of
6 ρb.
Similarly for the C20-R1-G4.0 specimen, the top strains increased linearly as
the specimen was loaded until flexural cracks appeared at the region of the maximum
moment at a load of approximately 60 kN. Following the crack initiation, the top
strains increased rapidly at a higher rate until the first diagonal shear crack appeared
at a load of approximately 155 kN, which is consistent with figure 4.1 (b) of the
corbel while testing. This basically caused the load decay drop shown in figure 4.3,
at the right and left load-strain responses of C20-R1-G4.0 specimen. This first
diagonal shear crack was the start of the formation of the concrete diagonal strut.
After the load decay in the cracking stage, the load-strain response continued to
increase until a peak load of 183 kN was reached, after which, a second diagonal
crack occurred and caused the drop after the peak load. The maximum strains that
C20-R1-G4 specimen reached in the right and left sides of the corbel are 356, and
455 micro-strains, respectively. It is evident in figure 4.2 that specimen C20-R1-G4.0
0
50
100
150
200
250
300
350
400
1,500 1,000 500 0 500 1,000 1,500
C20-R1-G3
C20-R1-G4
C20-R1-G6
Total Applied Load (kN)
Concrete Top strains (microstrain) Left side of the corbel Right side of the corbel
C20-R1-G3
C20-R1-G4
C20-R1-G6
C20-R1-G4
C20-R1-G3
C20-R1-G6
Figure 4.3: Load-top concrete strain responses for corbel specimens C20-
R1-G3, C20-R1-G4, and C20-R1-G6
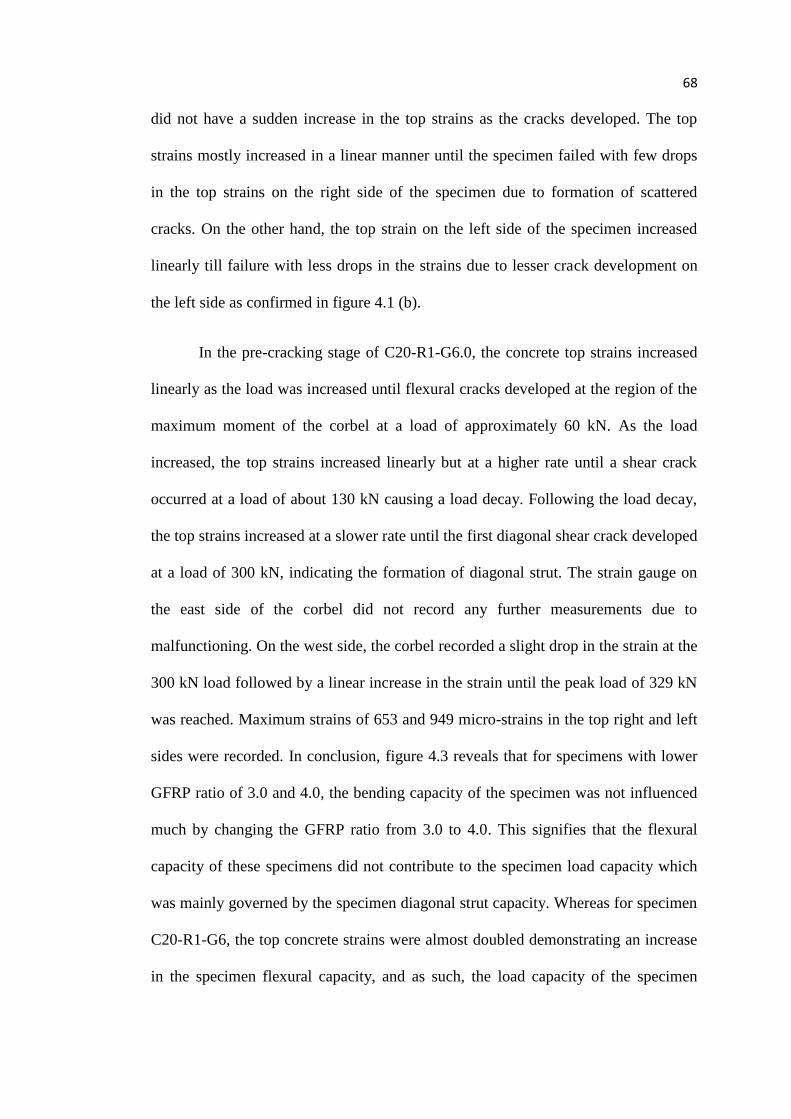
68
did not have a sudden increase in the top strains as the cracks developed. The top
strains mostly increased in a linear manner until the specimen failed with few drops
in the top strains on the right side of the specimen due to formation of scattered
cracks. On the other hand, the top strain on the left side of the specimen increased
linearly till failure with less drops in the strains due to lesser crack development on
the left side as confirmed in figure 4.1 (b).
In the pre-cracking stage of C20-R1-G6.0, the concrete top strains increased
linearly as the load was increased until flexural cracks developed at the region of the
maximum moment of the corbel at a load of approximately 60 kN. As the load
increased, the top strains increased linearly but at a higher rate until a shear crack
occurred at a load of about 130 kN causing a load decay. Following the load decay,
the top strains increased at a slower rate until the first diagonal shear crack developed
at a load of 300 kN, indicating the formation of diagonal strut. The strain gauge on
the east side of the corbel did not record any further measurements due to
malfunctioning. On the west side, the corbel recorded a slight drop in the strain at the
300 kN load followed by a linear increase in the strain until the peak load of 329 kN
was reached. Maximum strains of 653 and 949 micro-strains in the top right and left
sides were recorded. In conclusion, figure 4.3 reveals that for specimens with lower
GFRP ratio of 3.0 and 4.0, the bending capacity of the specimen was not influenced
much by changing the GFRP ratio from 3.0 to 4.0. This signifies that the flexural
capacity of these specimens did not contribute to the specimen load capacity which
was mainly governed by the specimen diagonal strut capacity. Whereas for specimen
C20-R1-G6, the top concrete strains were almost doubled demonstrating an increase
in the specimen flexural capacity, and as such, the load capacity of the specimen
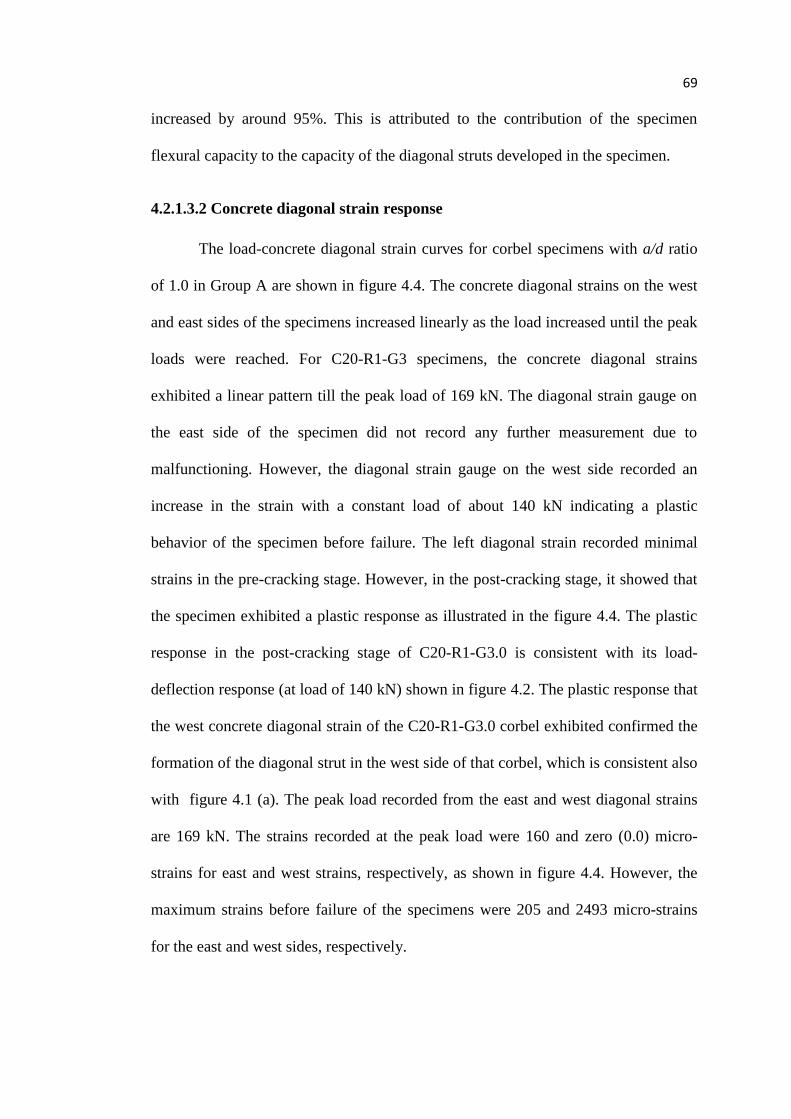
69
increased by around 95%. This is attributed to the contribution of the specimen
flexural capacity to the capacity of the diagonal struts developed in the specimen.
4.2.1.3.2 Concrete diagonal strain response
The load-concrete diagonal strain curves for corbel specimens with a/d ratio
of 1.0 in Group A are shown in figure 4.4. The concrete diagonal strains on the west
and east sides of the specimens increased linearly as the load increased until the peak
loads were reached. For C20-R1-G3 specimens, the concrete diagonal strains
exhibited a linear pattern till the peak load of 169 kN. The diagonal strain gauge on
the east side of the specimen did not record any further measurement due to
malfunctioning. However, the diagonal strain gauge on the west side recorded an
increase in the strain with a constant load of about 140 kN indicating a plastic
behavior of the specimen before failure. The left diagonal strain recorded minimal
strains in the pre-cracking stage. However, in the post-cracking stage, it showed that
the specimen exhibited a plastic response as illustrated in the figure 4.4. The plastic
response in the post-cracking stage of C20-R1-G3.0 is consistent with its load-
deflection response (at load of 140 kN) shown in figure 4.2. The plastic response that
the west concrete diagonal strain of the C20-R1-G3.0 corbel exhibited confirmed the
formation of the diagonal strut in the west side of that corbel, which is consistent also
with figure 4.1 (a). The peak load recorded from the east and west diagonal strains
are 169 kN. The strains recorded at the peak load were 160 and zero (0.0) micro-
strains for east and west strains, respectively, as shown in figure 4.4. However, the
maximum strains before failure of the specimens were 205 and 2493 micro-strains
for the east and west sides, respectively.

70
Similarly, the C20-R1-G4.0 specimen diagonal strains increased linearly in
the pre-cracking stage. Flexural crack developed at load of 50 kN that did not appear
to affect that diagonal strains which continued to increase linearly till the initiation of
first shear crack at a load of 160 kN as shown in figure 4.4. The shear crack caused a
small load decay; however, the corbel was still able to carry more loads. The load-
strain relation increased after the load decay and reached a peak load of 183 kN.
After reaching the peak load, the east side of the C20-R1-G4.0 specimen exhibited a
plastic response or a large increase in the diagonal strains associated with little drop
in load before failure at a strain of 1092 micro-strains. This is also consistent with the
figure 4.1 (b) since the diagonal crushed strut is shown at the right side after testing.
The strains recorded at the peak loads were 317 and 170 micro-strains for the east
and west sides, respectively. Moreover, the maximum strains that the east and west
strains reached before failure were 1092 and 170 micro-strains, respectively.
The behavior of the C20-R1-G6.0 specimen is somewhat similar to that of
C20-R1-G4.0 specimen. The diagonal strains increased linearly in the east and west
0
50
100
150
200
250
300
350
400
3,000 2,000 1,000 0 1,000 2,000 3,000
C20-R1-G3
C20-R1-G4
C20-R1-G6
Left side of the corbel Right side of the corbel
Total Applied Load (kN)
C20-R1-G3
Concrete Diagonal strains (microstrain)
C20-R1-G3
C20-R1-G4
C20-R1-G4
C20-R1-G6
C20-R1-G6
Figure 4.4: Load-diagonal concrete strain responses for corbel specimens
C20-R1-G3, C20-R1-G4, and C20-R1-G6
71
strains until the first shear cracks started initiating at a load of 200 kN as shown in
figure 4.1 (c) and 4.4. Following this crack development, the load-strain curve
increased linearly until another shear diagonal crack was formed at a load of 300 kN,
which is also consistent with the diagonal shear crack at load of 299 kN in the figure
4.1 (c). A diagonal strut was formed between the two diagonal shear cracks and was
able to provide a sudden increase in the diagonal strain without much change in the
loading as shown in figure 4.4. The post-cracking stage shows that after the second
shear crack, the strains increased as the load increased until a peak load of 329 kN
was reached, beyond which, the plastic behavior took place until failure. The left
strain proves the formation of the diagonal strut by showing the plastic response that
the corbel featured. The plastic response in the left strain is also consistent with the
figure 4.1 (c) where the crushing of the diagonal strut was in the left side of the
corbel. The strains recorded at the peak loads were 574 and 258 micro-strains for the
right and left strains, respectively. Moreover, the maximum strains that the right and
left strains reached before failure were 605 and 1608 micro-strains, respectively.
4.2.1.4 Load-GFRP strain response
Figure 4.5 presents the load-GFRP strain relationship of strain gauges located
beside the column interface of group [A] with a/d ratio of 1.0. The GFRP strains
increased linearly in all specimens until the formation of the first diagonal shear
crack. Upon formation of the diagonal shear crack, a jump in the GFRP bar strains
occurred and was followed by a quasi-linear increase in the bar strains but at a lower
rate. The low rate strain increase in the bars was due to the diagonal strut taking over
the resistance of the load and; therefore, shifting the load capacity from the GFRP
bars to the formed diagonal struts that resisted the loads till they are crushed. This
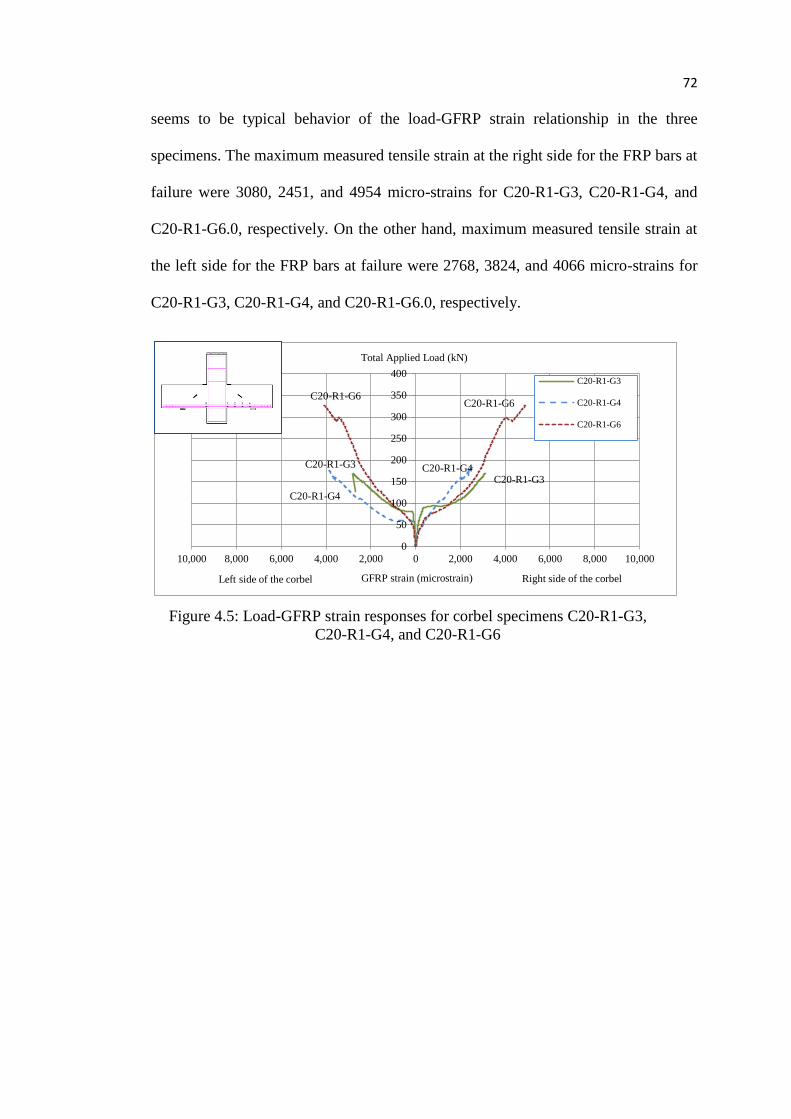
72
seems to be typical behavior of the load-GFRP strain relationship in the three
specimens. The maximum measured tensile strain at the right side for the FRP bars at
failure were 3080, 2451, and 4954 micro-strains for C20-R1-G3, C20-R1-G4, and
C20-R1-G6.0, respectively. On the other hand, maximum measured tensile strain at
the left side for the FRP bars at failure were 2768, 3824, and 4066 micro-strains for
C20-R1-G3, C20-R1-G4, and C20-R1-G6.0, respectively.
0
50
100
150
200
250
300
350
400
10,000 8,000 6,000 4,000 2,000 0 2,000 4,000 6,000 8,000 10,000
C20-R1-G3
C20-R1-G4
C20-R1-G6
GFRP strain (microstrain)
Total Applied Load (kN)
Left side of the corbel Right side of the corbel
C20-R1-G3
C20-R1-G3 C20-R1-G4
C20-R1-G4
C20-R1-G6 C20-R1-G6
Figure 4.5: Load-GFRP strain responses for corbel specimens C20-R1-G3,
C20-R1-G4, and C20-R1-G6
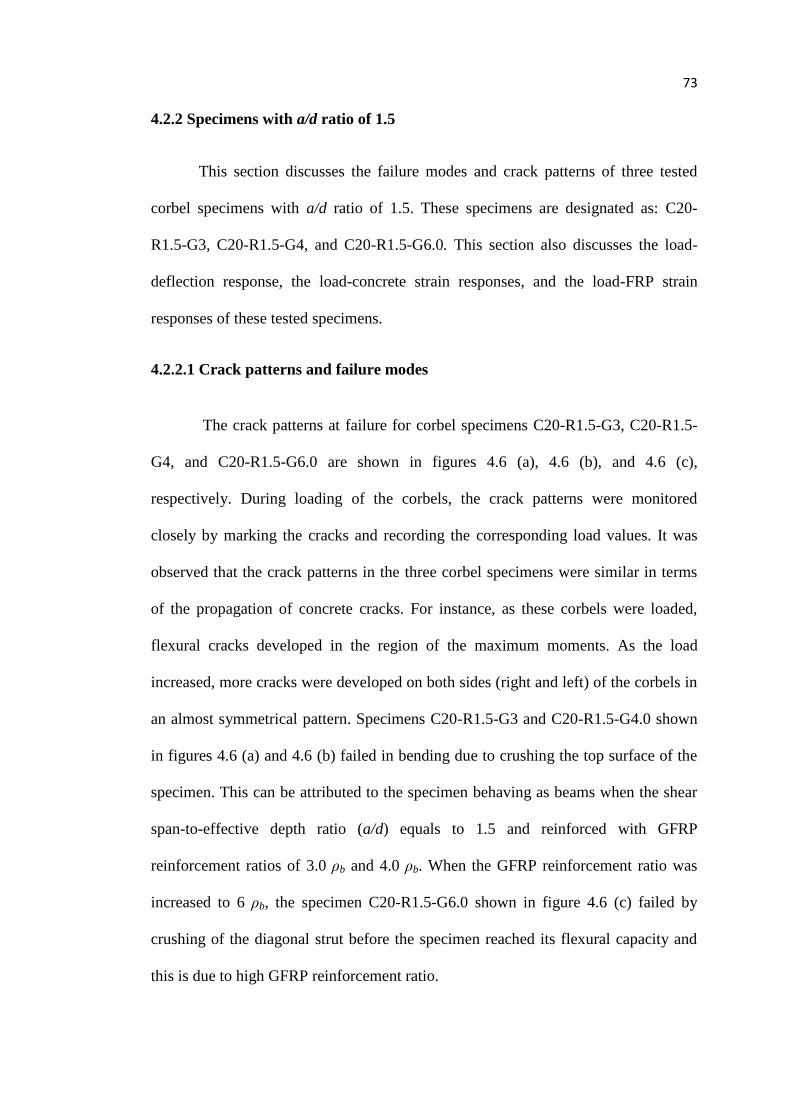
73
4.2.2 Specimens with a/d ratio of 1.5
This section discusses the failure modes and crack patterns of three tested
corbel specimens with a/d ratio of 1.5. These specimens are designated as: C20-
R1.5-G3, C20-R1.5-G4, and C20-R1.5-G6.0. This section also discusses the load-
deflection response, the load-concrete strain responses, and the load-FRP strain
responses of these tested specimens.
4.2.2.1 Crack patterns and failure modes
The crack patterns at failure for corbel specimens C20-R1.5-G3, C20-R1.5-
G4, and C20-R1.5-G6.0 are shown in figures 4.6 (a), 4.6 (b), and 4.6 (c),
respectively. During loading of the corbels, the crack patterns were monitored
closely by marking the cracks and recording the corresponding load values. It was
observed that the crack patterns in the three corbel specimens were similar in terms
of the propagation of concrete cracks. For instance, as these corbels were loaded,
flexural cracks developed in the region of the maximum moments. As the load
increased, more cracks were developed on both sides (right and left) of the corbels in
an almost symmetrical pattern. Specimens C20-R1.5-G3 and C20-R1.5-G4.0 shown
in figures 4.6 (a) and 4.6 (b) failed in bending due to crushing the top surface of the
specimen. This can be attributed to the specimen behaving as beams when the shear
span-to-effective depth ratio (a/d) equals to 1.5 and reinforced with GFRP
reinforcement ratios of 3.0 ρb and 4.0 ρb. When the GFRP reinforcement ratio was
increased to 6 ρb, the specimen C20-R1.5-G6.0 shown in figure 4.6 (c) failed by
crushing of the diagonal strut before the specimen reached its flexural capacity and
this is due to high GFRP reinforcement ratio.
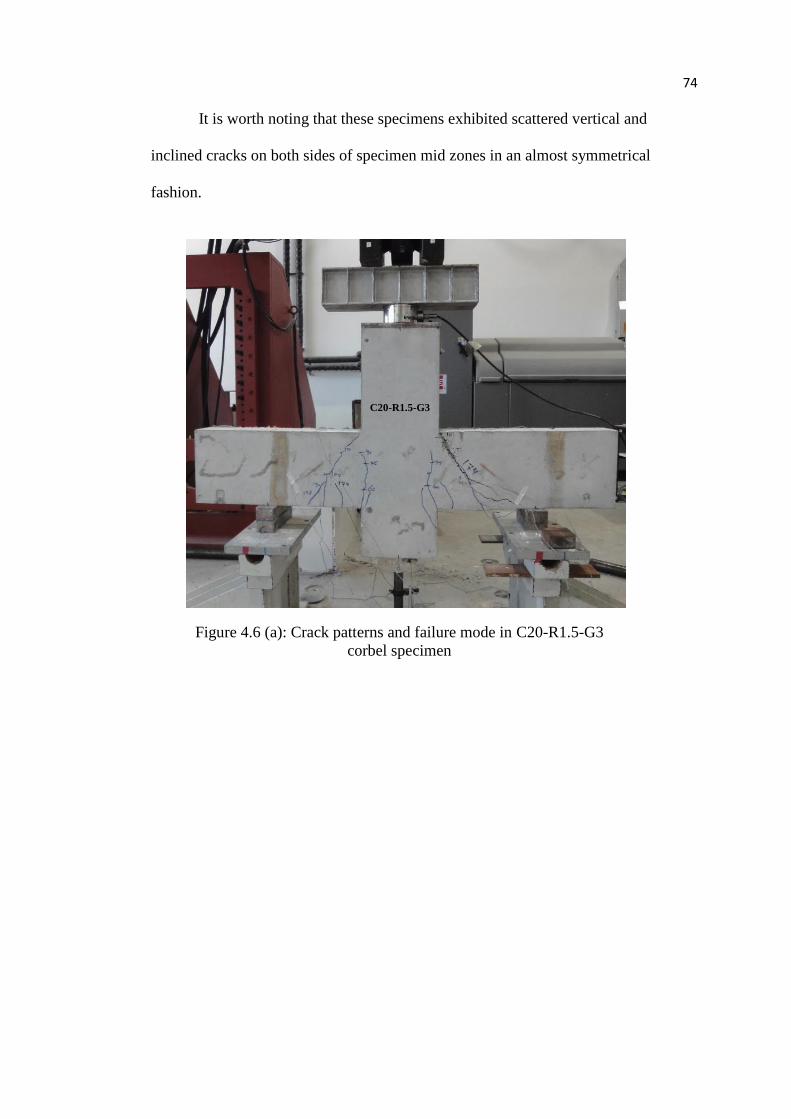
74
It is worth noting that these specimens exhibited scattered vertical and
inclined cracks on both sides of specimen mid zones in an almost symmetrical
fashion.
Figure 4.6 (a): Crack patterns and failure mode in C20-R1.5-G3
corbel specimen
C20-R1.5-G3
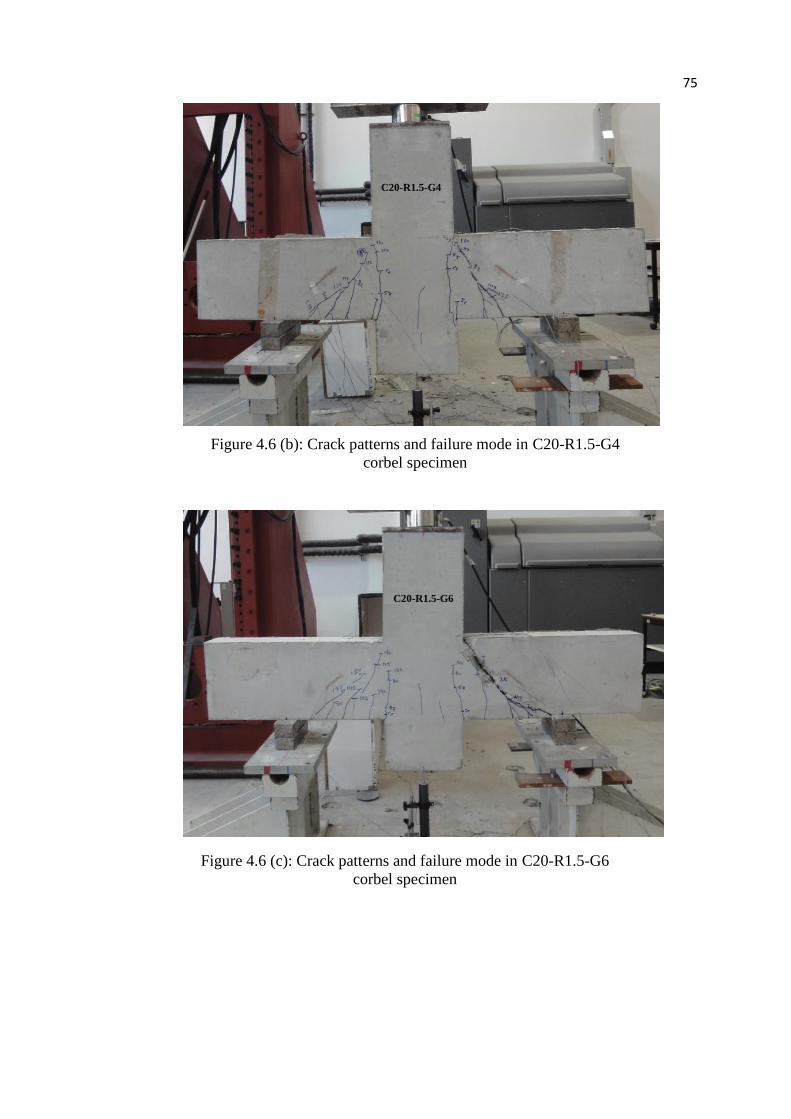
75
Figure 4.6 (b): Crack patterns and failure mode in C20-R1.5-G4
corbel specimen
Figure 4.6 (c): Crack patterns and failure mode in C20-R1.5-G6
corbel specimen
C20-R1.5-G4
C20-R1.5-G6

76
Table 4.1 shows the experimental loading strengths of Group [A] specimens
and the failure modes each specimen featured. Since C20-R1-G6.0 and C20-R1.5-
G6.0 corbel specimens had similar modes of failure, they can be compared with each
other. For instance, increasing the a/d ratio from 1.0 to 1.5 decreased the shear
strength by 23%.
Table 4.1: Experimental Results of group [A]
Specimens
Experimental Loading
strength (kN) Failure Mode
C20-R1-G3.0
169.5 Concrete crushing of
diagonal strut
C20-R1-G4.0
183.2 Concrete crushing of
diagonal strut
C20-R1-G6.0
329.6 Concrete crushing of
diagonal strut
C20-R1.5-G3.0
176.8 Top Concrete crushing due
to bending
C20-R1.5-G4.0
229.4 Top Concrete crushing due
to bending
C20-R1.5-G6.0
252.8 Concrete crushing of
diagonal strut
4.2.2.2 Load-deflection response
The load-deflection response for C20-R1.5-G3, C20-R1.5-G4, and C20-R1.5-
G6.0 specimens are shown in figure 4.7. The load-deflection response of group [A]
specimens with a/d of 1.0 highlighted very similar response pattern. The stiffness of
the specimens decreased after development of first flexural crack. In the pre-cracking
and post-cracking stages, the deflection response was linear till the peak load was
reached. For specimens C20-R1.5-G3, the stiffness decreased after the first flexural
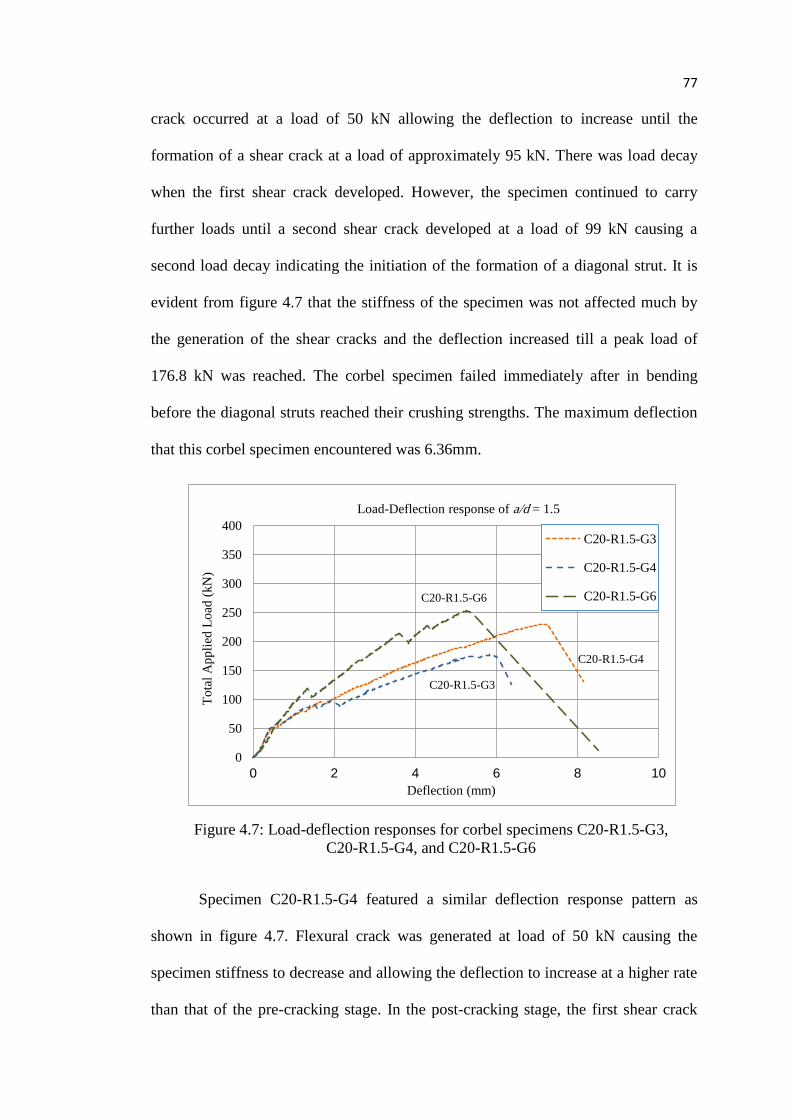
77
crack occurred at a load of 50 kN allowing the deflection to increase until the
formation of a shear crack at a load of approximately 95 kN. There was load decay
when the first shear crack developed. However, the specimen continued to carry
further loads until a second shear crack developed at a load of 99 kN causing a
second load decay indicating the initiation of the formation of a diagonal strut. It is
evident from figure 4.7 that the stiffness of the specimen was not affected much by
the generation of the shear cracks and the deflection increased till a peak load of
176.8 kN was reached. The corbel specimen failed immediately after in bending
before the diagonal struts reached their crushing strengths. The maximum deflection
that this corbel specimen encountered was 6.36mm.
Specimen C20-R1.5-G4 featured a similar deflection response pattern as
shown in figure 4.7. Flexural crack was generated at load of 50 kN causing the
specimen stiffness to decrease and allowing the deflection to increase at a higher rate
than that of the pre-cracking stage. In the post-cracking stage, the first shear crack
0
50
100
150
200
250
300
350
400
0 2 4 6 8 10
To
tal
Ap
pli
ed L
oad
(kN
)
Deflection (mm)
Load-Deflection response of a/d = 1.5
C20-R1.5-G3
C20-R1.5-G4
C20-R1.5-G6
C20-R1.5-G3
C20-R1.5-G4
C20-R1.5-G6
Figure 4.7: Load-deflection responses for corbel specimens C20-R1.5-G3,
C20-R1.5-G4, and C20-R1.5-G6
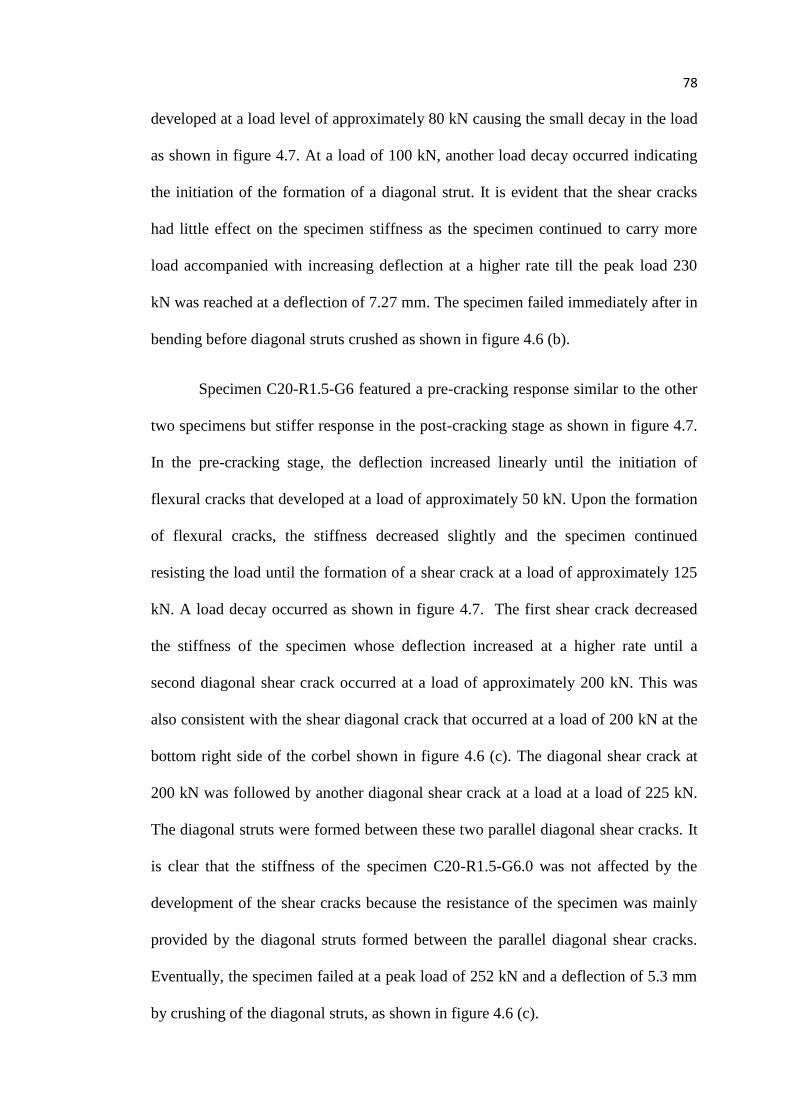
78
developed at a load level of approximately 80 kN causing the small decay in the load
as shown in figure 4.7. At a load of 100 kN, another load decay occurred indicating
the initiation of the formation of a diagonal strut. It is evident that the shear cracks
had little effect on the specimen stiffness as the specimen continued to carry more
load accompanied with increasing deflection at a higher rate till the peak load 230
kN was reached at a deflection of 7.27 mm. The specimen failed immediately after in
bending before diagonal struts crushed as shown in figure 4.6 (b).
Specimen C20-R1.5-G6 featured a pre-cracking response similar to the other
two specimens but stiffer response in the post-cracking stage as shown in figure 4.7.
In the pre-cracking stage, the deflection increased linearly until the initiation of
flexural cracks that developed at a load of approximately 50 kN. Upon the formation
of flexural cracks, the stiffness decreased slightly and the specimen continued
resisting the load until the formation of a shear crack at a load of approximately 125
kN. A load decay occurred as shown in figure 4.7. The first shear crack decreased
the stiffness of the specimen whose deflection increased at a higher rate until a
second diagonal shear crack occurred at a load of approximately 200 kN. This was
also consistent with the shear diagonal crack that occurred at a load of 200 kN at the
bottom right side of the corbel shown in figure 4.6 (c). The diagonal shear crack at
200 kN was followed by another diagonal shear crack at a load at a load of 225 kN.
The diagonal struts were formed between these two parallel diagonal shear cracks. It
is clear that the stiffness of the specimen C20-R1.5-G6.0 was not affected by the
development of the shear cracks because the resistance of the specimen was mainly
provided by the diagonal struts formed between the parallel diagonal shear cracks.
Eventually, the specimen failed at a peak load of 252 kN and a deflection of 5.3 mm
by crushing of the diagonal struts, as shown in figure 4.6 (c).
79
4.2.2.3 Load-concrete strain response
4.2.2.3.1 Concrete top strain response
Figure 4.8 compares the concrete top strains in all specimens of group [A]
with a/d ratio of 1.5. The pre-cracking phase of C20-R1.5-G3 specimen exhibited
gradual increase in the strains until flexural cracks initiated at regions of maximum
moment in the corbel at loads of 50 kN and 60 kN on the right and left sides of the
specimens followed by a jump in the strains without any load increase. The strains
increased from 200 to 340 micro-strains on the right side of the corbel. Likewise, the
strains on the left side jumped slightly from 176 to 300 micro-strains. The specimen
regained strength with increasing strains in an almost linear fashion till reaching a
peak load of 90 kN at around 600 micro-strains. Both strain gauges on the right and
left sides of the specimen did not read any more measurements due to malfunctioning
of the gauges. The maximum micro-strains recorded by the top strain gauges on the
right and left sides of the corbel were 766 and 715, respectively.
0
50
100
150
200
250
300
350
400
2,000 1,500 1,000 500 0 500 1,000 1,500 2,000
C20-R1.5-G3
C20-R1.5-G4
C20-R1.5-G6
Total Applied Load (kN)
Concrete Top strains (microstrain) Left side of the corbel Right side of the corbel
C20-R1.5-G3
C20-R1.5-G3
C20-R1.5-G4
C20-R1.5-G4
C20-R1.5-G6
C20-R1.5-G6
Figure 4.8: Load-top strain responses for corbel specimens C20-R1.5-G3,
C20-R1.5-G4, and C20-R1.5-G6
80
In the pre-cracking stage of C20-R1.5-G4 specimen, the strains increased
gradually until flexural cracks initiated at a load of approximately 50 kN. Following
flexural cracking, the strains continued to increase but at a higher rate until a shear
crack developed at a load of 80 kN as shown in figure 4.6 (b). The shear crack
initiated the formation of a diagonal strut resulting in slowing down the strain
increase until the formation of another diagonal shear crack at load magnitude of 140
kN. A diagonal strut started to develop between the diagonal shear cracks and as a
result the specimen load carrying capacity was enhanced. This enhancement in the
specimen load carrying capacity led to further reduction in the rate increase of the
concrete top strains. At 150 kN, the concrete strain continue to increase but at a
lower rate, possibly due to local longitudinal concrete crushing at the junction of the
column interface and/or due to penetration of flexural crack in the compression zone
of the beam at the column interface. This made the specimen fail in bending before
the crushing of the diagonal strut. The strain gauge on the right side of the specimen
did not read any more measurements when the load exceeded 140 kN due to a
malfunction in the gauge. However, on the left side of the specimen, the strains were
recorded until the specimen’s failure at a load of 229 kN. The maximum micro-
strains recorded in the right and left sides of the corbel was 965 and 1676,
respectively.
For specimen C20-R1.5-G6, the increased amount of the GFRP
reinforcement ratio increased the rigidity of the specimen in comparison with the
other two specimens. The pre-cracking stage was of a linear manner for the strains,
whereas the post-cracking stage on the left side of the specimen was linear until the
strain gauges did not read more measurements when the load reached 252 kN. A load
decay and a couple of drops in loads were due to formation of diagonal shear cracks.
81
On the right side of the specimen, a plastic behavior occurred at a load of a bit more
than 100 kN where the strain had a sudden increase from 650 to 750 micro-strains.
This was due to formation of a shear crack at a load of 120 kN. The strain increased
again at a higher rate till the formation of another diagonal shear crack at a load of
approximately 225 kN. A diagonal strut was formed between these two diagonal
cracks. When the peak load of 252.8 kN was reached, the corbel failed by crushing
of the diagonal strut. The maximum strains at peak loads in the right and left sides
before failure in the diagonal strut were 1305 and 1390 micro-strains, respectively.
4.2.2.3.2 Concrete diagonal strain response
The load-diagonal concrete strain responses for C20-R1.5-G3, C20-R1.5-G4,
and C20-R1.5-G6 corbel specimens are shown in figure 4.9. The strains on the right
side of the specimen C20-R1.5-G3 increased linearly till a load of about 150 kN was
reached. No additional strains were recorded after that due to malfunction in the
strain gauge on the right side of the corbel. Strain on the left side of the corbel was
zero until the formation of flexural cracks at load of 110 kN as shown in figure 4.9.
The strains increased linearly until the peak load of 175 kN was reached. The beam
failed by bending at a load level of 175 kN. It was noticed from figure 4.6 (a) that the
diagonal strut between the support and the loading point was not formed. This was
also proven from figure 4.9 where the plastic response of C20-R1.5-G3 was minimal.
The maximum strains recorded in the right and left sides of the C20-R1.5-G3
specimen were 107 and 140, respectively.

82
For specimen C20-R1.5-G4, the diagonal strains increased linearly as the
load increased until the initiation of flexural cracks that initiated at a load of
approximately 110 kN. Following the pre-cracking stage, at a load level of 150 kN,
the concrete strain increased at a higher rate indicating that more loads were
transferred to the supports through diagonal struts. This occurred possibly because of
concrete crushing in the longitudinal direction at the top surface of the concrete due
to bending and/or due to penetration of the flexural cracks in the compression zone
of the beam at the column interface. The maximum strains at the right and left sides
of the specimen were 230 and 140, respectively.
In the pre-cracking stage of C20-R1.5-G6, the strains increased linearly in the
right and left sides of the corbel until the initiation of shear cracks developed at a
load of approximately 110 kN. As more load was applied, the strains increased
linearly at a higher rate until a diagonal shear crack developed on the left side at a
load of approximately 200 kN. This diagonal shear crack was followed by another
diagonal shear crack at a load of approximately 220 kN and the diagonal strut was
0
50
100
150
200
250
300
350
400
1,000 800 600 400 200 0 200 400 600 800 1,000
C20-R1.5-G3
C20-R1.5-G4
C20-R1.5-G6C20-R1.5-G6
Total Applied Load (kN)
Concrete Diagonal strains (microstrain) Left side of corbel Right side of corbel
C20-R1.5-G6 C20-R1.5-G4
C20-R1.5-G3
C20-R1.5-G4
C20-R1.5-G3
Figure 4.9: Load-diagonal concrete strain responses for corbel specimens C20-
R1.5-G3, C20-R1.5-G4, and C20-R1.5-G6
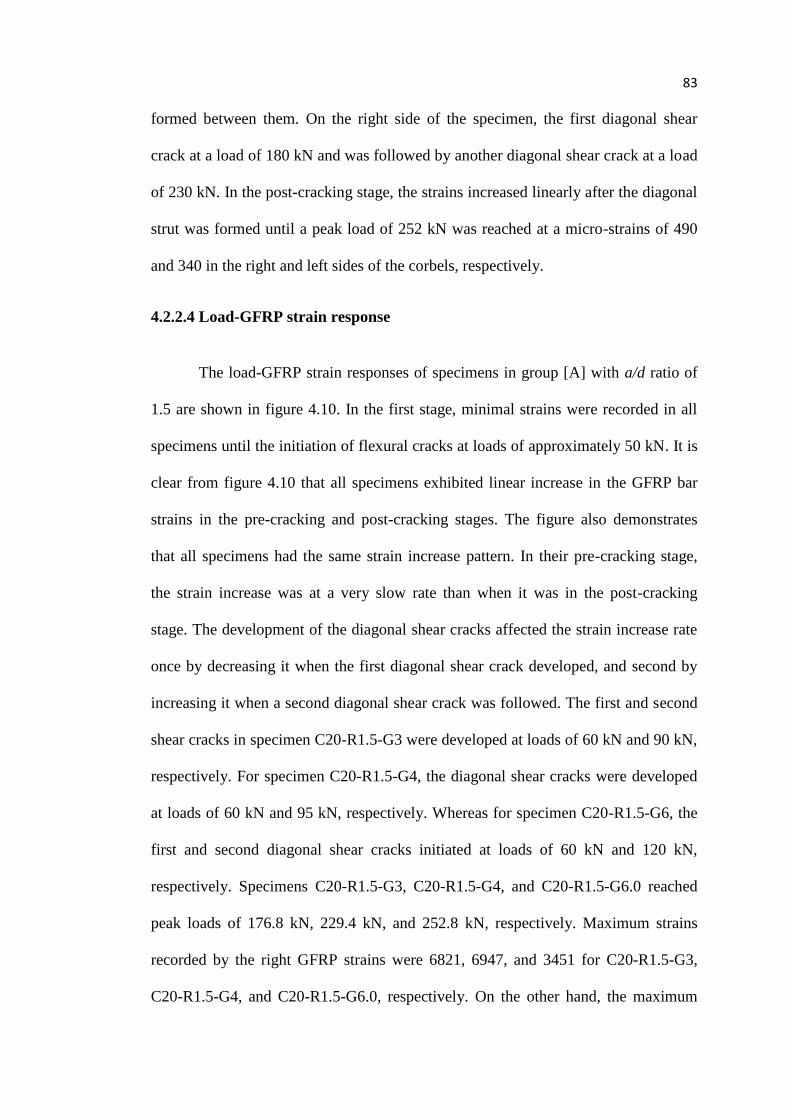
83
formed between them. On the right side of the specimen, the first diagonal shear
crack at a load of 180 kN and was followed by another diagonal shear crack at a load
of 230 kN. In the post-cracking stage, the strains increased linearly after the diagonal
strut was formed until a peak load of 252 kN was reached at a micro-strains of 490
and 340 in the right and left sides of the corbels, respectively.
4.2.2.4 Load-GFRP strain response
The load-GFRP strain responses of specimens in group [A] with a/d ratio of
1.5 are shown in figure 4.10. In the first stage, minimal strains were recorded in all
specimens until the initiation of flexural cracks at loads of approximately 50 kN. It is
clear from figure 4.10 that all specimens exhibited linear increase in the GFRP bar
strains in the pre-cracking and post-cracking stages. The figure also demonstrates
that all specimens had the same strain increase pattern. In their pre-cracking stage,
the strain increase was at a very slow rate than when it was in the post-cracking
stage. The development of the diagonal shear cracks affected the strain increase rate
once by decreasing it when the first diagonal shear crack developed, and second by
increasing it when a second diagonal shear crack was followed. The first and second
shear cracks in specimen C20-R1.5-G3 were developed at loads of 60 kN and 90 kN,
respectively. For specimen C20-R1.5-G4, the diagonal shear cracks were developed
at loads of 60 kN and 95 kN, respectively. Whereas for specimen C20-R1.5-G6, the
first and second diagonal shear cracks initiated at loads of 60 kN and 120 kN,
respectively. Specimens C20-R1.5-G3, C20-R1.5-G4, and C20-R1.5-G6.0 reached
peak loads of 176.8 kN, 229.4 kN, and 252.8 kN, respectively. Maximum strains
recorded by the right GFRP strains were 6821, 6947, and 3451 for C20-R1.5-G3,
C20-R1.5-G4, and C20-R1.5-G6.0, respectively. On the other hand, the maximum
84
strains recorded by the left GFRP strains were 8000, 7533, and 3973 for C20-R1.5-
G3, C20-R1.5-G4, and C20-R1.5-G6.0, respectively. It was also noticed that C20-
R1.5-G3 exhibited more strains than C20-R1.5-G4, and C20-R1.5-G6.0. For
instance, at a load of 150 kN, the strains recorded in the right-side were 3599, 2659,
and 1334 for C20-R1-G3, C20-R1.5-G4, and C20-R1.5-G6.0, respectively. On the
other hand, the strains recorded in the left-side were 4331, 3009, and 1748 for C20-
R1.5-G3, C20-R1.5-G4, and C20-R1.5-G6.0, respectively.
4.3 Test results of group [B]
Group [B] consists of six corbel specimens that were cast with C40 concrete.
Group [B] was divided into two sub-groups based on their shear span-to-effective
depth (a/d) ratio. The first sub-group had a/d ratio of 1.0, while the second sub-group
had a/d ratio of 1.5. Each sub-group contained three specimens of different
longitudinal reinforcement ratios, 3.0 ρb, 4.0 ρb, and 6.0 ρb, where ρb is the balanced
reinforcement ratio.
0
50
100
150
200
250
300
350
400
10,000 8,000 6,000 4,000 2,000 0 2,000 4,000 6,000 8,000 10,000
C20-R1.5-G3
C20-R1.5-G4
C20-R1.5-G6
Total Applied Load (kN)
GFRP strain (microstrain) Left side of the corbel Right side of the corbel
C20-R1.5-G3 C20-R1.5-G3
C20-R1.5-G4 C20-R1.5-G4 C20-R1.5-G6 C20-R1.5-G6
Figure 4.10: Load-GFRP strain responses for corbel specimens C20-R1.5-G3,
C20-R1.5-G4, and C20-R1.5-G6
85
4.3.1 Specimens with a/d ratio of 1.0
This section discusses the crack patterns and failure modes of the three corbel
specimens with a/d ratio of 1.0. These corbels are: C40-R1-G3, C40-R1-G4, and
C40-R1-G6. This section also discusses the load-deflection response, the load-
concrete strain response and the load-FRP strain responses of the tested specimens.
4.3.1.1 Crack patterns and failure modes
The crack patterns at failure for corbels C40-R1-G3, C40-R1-G4, and C40-
R1-G6 are shown in figures 4.11 (a), 4.11 (b), and 4.11 (c), respectively. Specimens
C40-R1-G3 and C40-R1-G4 failed by crushing in the diagonal struts. Whereas C40-
R1-G6 failed by splitting of the diagonal strut shown in figures 4.11 (a), 4.11 (b), and
4.11(c), respectively. It was noticed that the crack pattern was identical in the three
corbels. For instance, as the corbels where loaded, flexural cracks initiated first at the
section of the maximum moment (interface with the column). The flexural cracks
started to develop at loads that ranged from 80 kN to 100 kN. As the load increased,
additional cracks developed in the shear zone and progressively deviated into
inclined cracks due to the presence of the shear stresses. Specimens C40-R1-G3 and
C40-R1-G4 continued to sustain more loads and diagonal struts started shaping
between diagonal shear cracks. However, this was not noticed in specimen C40-R1-
G6 since this specimen experienced splitting mode of failure. It is also clear from
figure 4.11 (c) and 4.12 that there was only one shear diagonal crack at a load of
approximately 230 kN and was followed by a sudden splitting at a peak load of 310
kN. Loads at which each crack was first detected are indicated and marked on the
specimens. It was also noticed that the maximum deflection specimen C40-R1-G6
exhibited was too little compared with the maximum deflections the other corbels
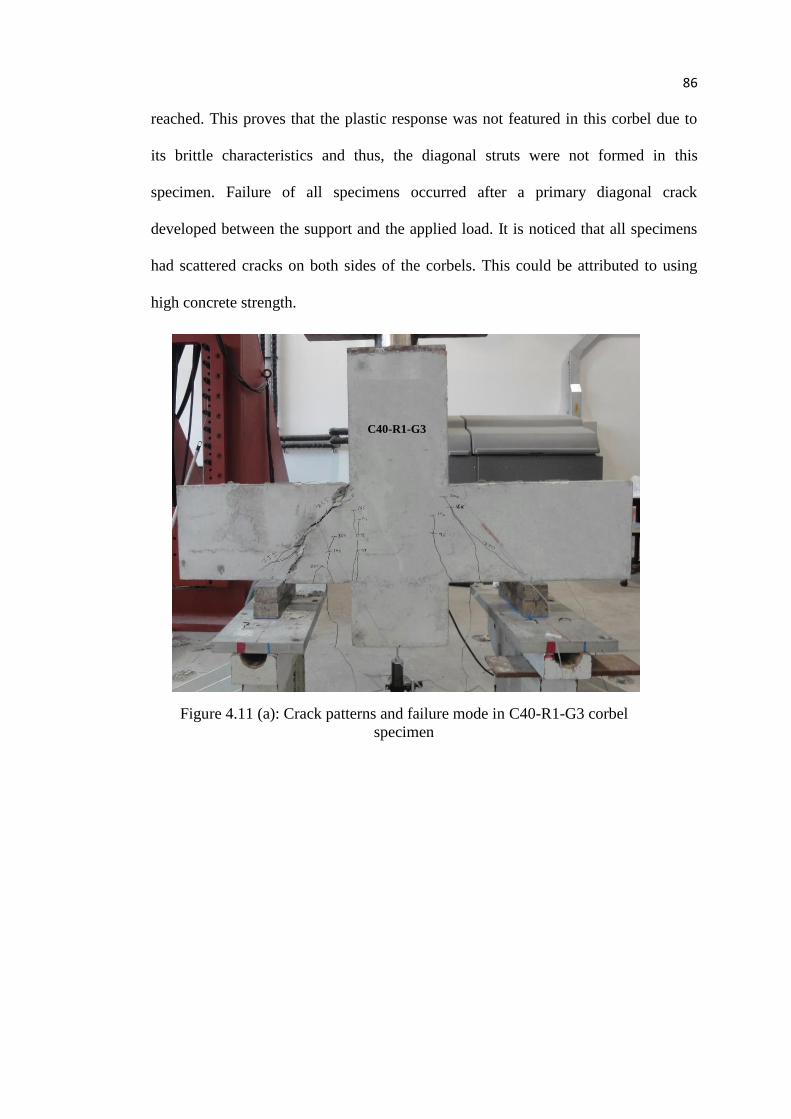
86
reached. This proves that the plastic response was not featured in this corbel due to
its brittle characteristics and thus, the diagonal struts were not formed in this
specimen. Failure of all specimens occurred after a primary diagonal crack
developed between the support and the applied load. It is noticed that all specimens
had scattered cracks on both sides of the corbels. This could be attributed to using
high concrete strength.
Figure 4.11 (a): Crack patterns and failure mode in C40-R1-G3 corbel
specimen
C40-R1-G3
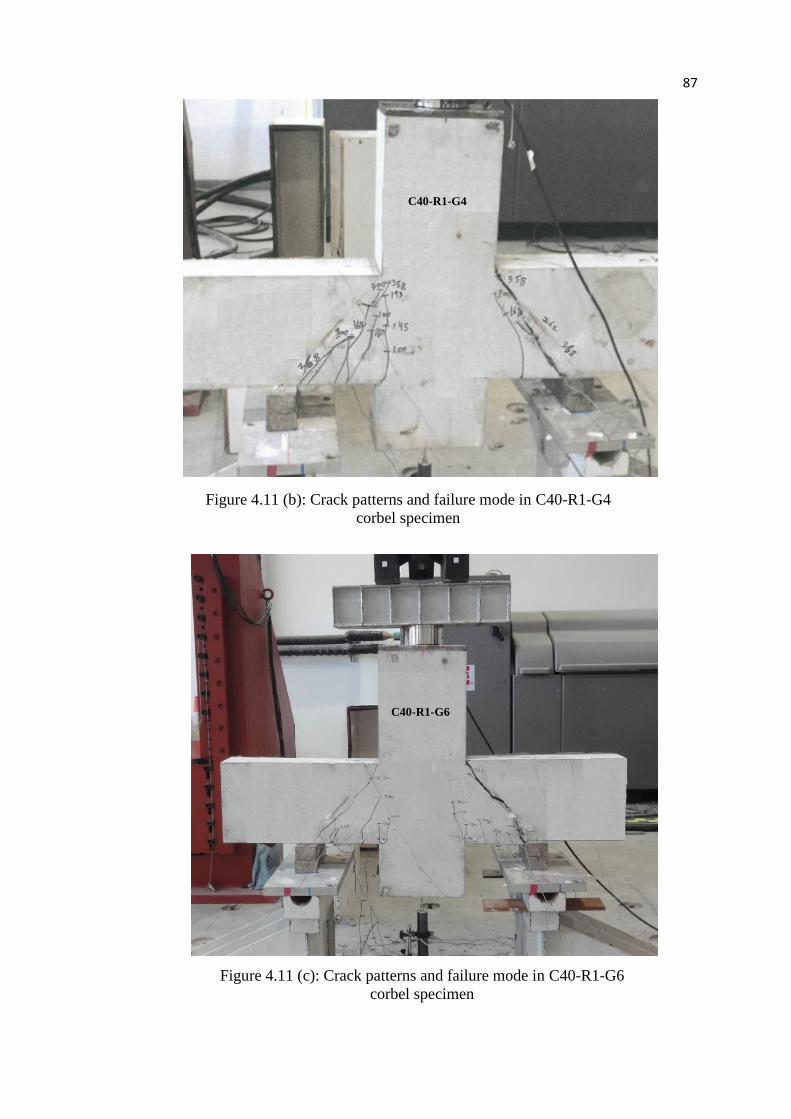
87
Figure 4.11 (b): Crack patterns and failure mode in C40-R1-G4
corbel specimen
Figure 4.11 (c): Crack patterns and failure mode in C40-R1-G6
corbel specimen
C40-R1-G4
C40-R1-G6
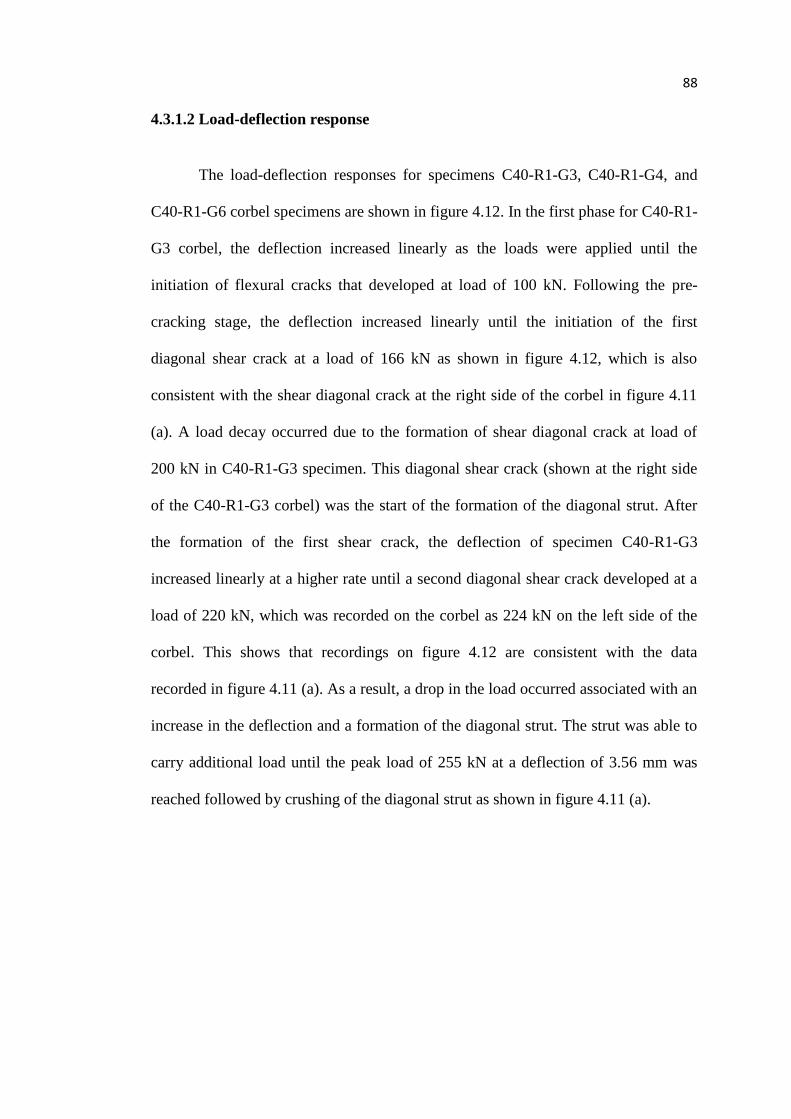
88
4.3.1.2 Load-deflection response
The load-deflection responses for specimens C40-R1-G3, C40-R1-G4, and
C40-R1-G6 corbel specimens are shown in figure 4.12. In the first phase for C40-R1-
G3 corbel, the deflection increased linearly as the loads were applied until the
initiation of flexural cracks that developed at load of 100 kN. Following the pre-
cracking stage, the deflection increased linearly until the initiation of the first
diagonal shear crack at a load of 166 kN as shown in figure 4.12, which is also
consistent with the shear diagonal crack at the right side of the corbel in figure 4.11
(a). A load decay occurred due to the formation of shear diagonal crack at load of
200 kN in C40-R1-G3 specimen. This diagonal shear crack (shown at the right side
of the C40-R1-G3 corbel) was the start of the formation of the diagonal strut. After
the formation of the first shear crack, the deflection of specimen C40-R1-G3
increased linearly at a higher rate until a second diagonal shear crack developed at a
load of 220 kN, which was recorded on the corbel as 224 kN on the left side of the
corbel. This shows that recordings on figure 4.12 are consistent with the data
recorded in figure 4.11 (a). As a result, a drop in the load occurred associated with an
increase in the deflection and a formation of the diagonal strut. The strut was able to
carry additional load until the peak load of 255 kN at a deflection of 3.56 mm was
reached followed by crushing of the diagonal strut as shown in figure 4.11 (a).

89
In the pre-cracking stage of C40-R1-G4 specimen, the deflection increased
linearly as the load was increasing until the initiation of flexural cracks developed at
the region of the maximum moment. The flexural cracks initiated at a load of
approximately 80 kN, which caused the slope of the load-deflection curve to slightly
deviate as shown in figure 4.12. The deflection increased after that till a shear crack
was developed at a load of approximately 160 kN, which caused the drop in figure
4.12. Following this drop, the deflection increased after that at a higher rate until a
diagonal shear crack was developed at a load of approximately 195 kN, and was
recorded as 200 kN in the left side of the corbel which is shown in figure 4.11 (b).
This diagonal shear crack was the start of the formation of the diagonal strut in the
corbel. The deflection increased after this load decay and was followed by a second
diagonal shear crack at a load of approximately 262 kN as indicated on the right side
of the specimen in figure 4.11 (b), which was consistent with what was recorded in
figure 4.12. Following the formation of the diagonal strut in the cracking stage, the
deflection increased at a higher rate until a peak load of 368 kN was reached at a
0
50
100
150
200
250
300
350
400
0 2 4 6 8 10
To
tal
Ap
pli
ed L
oad
(kN
)
Deflection (mm)
Load-Deflection response
C40-R1-G3
C40-R1-G4
C40-R1-G6
C40-R1-G3
C40-R1-G4
C40-R1-G6
Figure 4.12: Load-deflection responses for corbel specimens C40-R1-G3,
C40-R1-G4, and C40-R1-G6
90
deflection of 3.68 mm, beyond which, the specimen failed by crushing of the
diagonal strut, as shown in figure 4.11 (b). It can be concluded from figure 4.12 that
increasing the GFRP reinforcement ratio from 3ρb to 4ρb increased the specimen shear
strength by around 43%. However, it did not have a significant effect on the ductility
of the specimen as both C40-R1-G3 and C40-R1-G4 specimens failed at a maximum
deflection of 3.68 mm and 4.00 mm, respectively, representing an 8% increase in the
maximum deflection that specimen C40-R1-G4 withstood.
As for specimen C40-R1-G6, the first flexural crack developed at a load of 70
kN without affecting the specimen stiffness. The deflection increased rapidly after
that as the load was applied until another flexural crack that developed at a load of
approximately 150 kN, which was recorded on the corbel as 152 kN as shown in
figure 4.11 (c). The deflection continued increasing as shown in figure 4.12 until a
diagonal shear crack developed at a load level of 230 kN as shown in figure 4.11
(c).This diagonal shear crack caused the decay drop in figure 4.12, and hence, the
two figures were consistent with each other. Following this decay drop, the
deflection increased linearly at a higher rate until a peak load of 309 kN was reached
with a deflection of 2.53 mm. Following this peak load, the corbel failed
immediately by spitting of the diagonal strut as shown in figure 4.11 (c).
4.3.1.3 Load-concrete strain response
4.3.1.3.1 Concrete top strain response
The load-top-concrete strain responses for C40-R1-G3, C40-R1-G4, and
C40-R1-G6 are shown in figure 4.13. Figure 4.13 clearly indicates that the concrete
top strains for all specimens did not increase much as the load was increasing. This is
obvious in the steep slope of the curves indicating a slow increase in the strains as
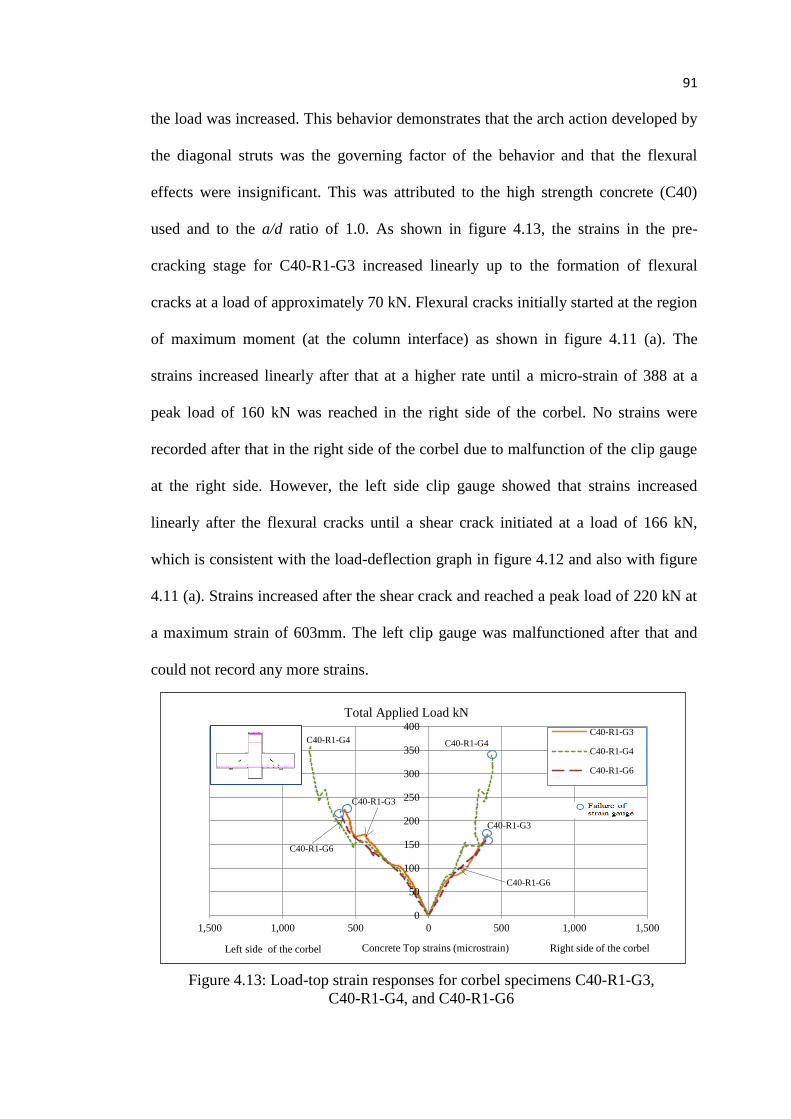
91
the load was increased. This behavior demonstrates that the arch action developed by
the diagonal struts was the governing factor of the behavior and that the flexural
effects were insignificant. This was attributed to the high strength concrete (C40)
used and to the a/d ratio of 1.0. As shown in figure 4.13, the strains in the pre-
cracking stage for C40-R1-G3 increased linearly up to the formation of flexural
cracks at a load of approximately 70 kN. Flexural cracks initially started at the region
of maximum moment (at the column interface) as shown in figure 4.11 (a). The
strains increased linearly after that at a higher rate until a micro-strain of 388 at a
peak load of 160 kN was reached in the right side of the corbel. No strains were
recorded after that in the right side of the corbel due to malfunction of the clip gauge
at the right side. However, the left side clip gauge showed that strains increased
linearly after the flexural cracks until a shear crack initiated at a load of 166 kN,
which is consistent with the load-deflection graph in figure 4.12 and also with figure
4.11 (a). Strains increased after the shear crack and reached a peak load of 220 kN at
a maximum strain of 603mm. The left clip gauge was malfunctioned after that and
could not record any more strains.
0
50
100
150
200
250
300
350
400
1,500 1,000 500 0 500 1,000 1,500
C40-R1-G3
C40-R1-G4
C40-R1-G6
Right side of the corbel Left side of the corbel Concrete Top strains (microstrain)
C40-R1-G3
C40-R1-G4 C40-R1-G4
C40-R1-G3
C40-R1-G6
C40-R1-G6
Figure 4.13: Load-top strain responses for corbel specimens C40-R1-G3,
C40-R1-G4, and C40-R1-G6
Total Applied Load kN
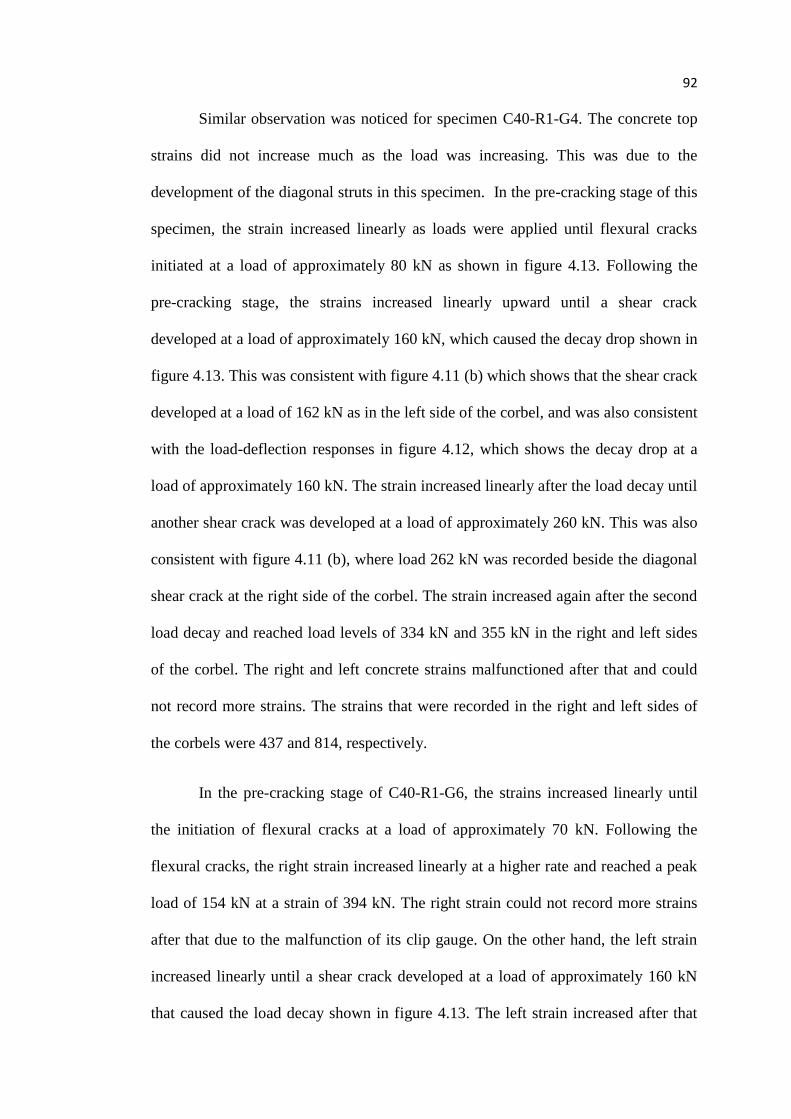
92
Similar observation was noticed for specimen C40-R1-G4. The concrete top
strains did not increase much as the load was increasing. This was due to the
development of the diagonal struts in this specimen. In the pre-cracking stage of this
specimen, the strain increased linearly as loads were applied until flexural cracks
initiated at a load of approximately 80 kN as shown in figure 4.13. Following the
pre-cracking stage, the strains increased linearly upward until a shear crack
developed at a load of approximately 160 kN, which caused the decay drop shown in
figure 4.13. This was consistent with figure 4.11 (b) which shows that the shear crack
developed at a load of 162 kN as in the left side of the corbel, and was also consistent
with the load-deflection responses in figure 4.12, which shows the decay drop at a
load of approximately 160 kN. The strain increased linearly after the load decay until
another shear crack was developed at a load of approximately 260 kN. This was also
consistent with figure 4.11 (b), where load 262 kN was recorded beside the diagonal
shear crack at the right side of the corbel. The strain increased again after the second
load decay and reached load levels of 334 kN and 355 kN in the right and left sides
of the corbel. The right and left concrete strains malfunctioned after that and could
not record more strains. The strains that were recorded in the right and left sides of
the corbels were 437 and 814, respectively.
In the pre-cracking stage of C40-R1-G6, the strains increased linearly until
the initiation of flexural cracks at a load of approximately 70 kN. Following the
flexural cracks, the right strain increased linearly at a higher rate and reached a peak
load of 154 kN at a strain of 394 kN. The right strain could not record more strains
after that due to the malfunction of its clip gauge. On the other hand, the left strain
increased linearly until a shear crack developed at a load of approximately 160 kN
that caused the load decay shown in figure 4.13. The left strain increased after that

93
load decay and reached a peak load of 218 kN and a strain of 566. The left strain
malfunctioned after that and no additional strains were recorded.
4.3.1.3.2 Concrete diagonal strain response
The load-diagonal concrete strain response for C40-R1-G3, C40-R1-G4, and
C40-R1-G6 are shown in figure 4.14. In the pre-cracking stage of C40-R1-G3, the
right strains increased linearly as the load was applied until a load level of 200 kN
and a strain of 310 was reached. The strain gauge failed afterward due to
malfunctioning of the gauge. On the left side, however, no strain was recorded until
the flexural crack developed at a 225 kN load followed with a sudden drop in the
load. A little plastic behavior was observed where the strain was jumped from almost
zero strain to 150 micro-strains at almost constant load. The strain increased linearly
and reached a maximum strain of 274 at a load level of 250 kN. The complete strain
responses were not captured experimentally because of a malfunction in the strain
gauges. The plastic response observed on the left side of the specimen indicated the
formation of a diagonal strut, which is consistent with figure 4.11 (a) crack pattern.
0
50
100
150
200
250
300
350
400
3,000 2,000 1,000 0 1,000 2,000 3,000
C40-R1-G3
C40-R1-G4
C40-R1-G6
Total Applied Load (kN)
Concrete Diagonal strains (microstrain) Right side of corbel Left side of corbel
C40-R1-G3
C40-R1-G3
C40-R1-G4
C40-R1-G4
C40-R1-G6
Figure 4.14: Load-diagonal strain responses for corbel specimens C40-R1-G3,
C40-R1-G4, and C40-R1-G6
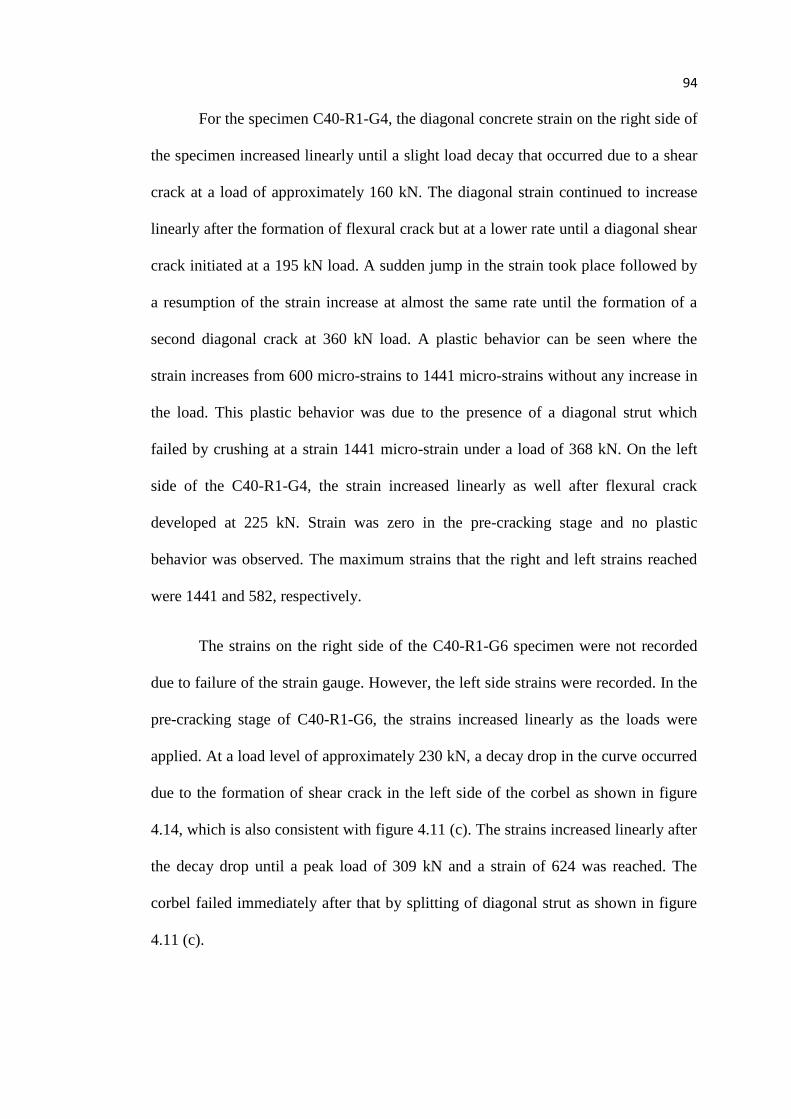
94
For the specimen C40-R1-G4, the diagonal concrete strain on the right side of
the specimen increased linearly until a slight load decay that occurred due to a shear
crack at a load of approximately 160 kN. The diagonal strain continued to increase
linearly after the formation of flexural crack but at a lower rate until a diagonal shear
crack initiated at a 195 kN load. A sudden jump in the strain took place followed by
a resumption of the strain increase at almost the same rate until the formation of a
second diagonal crack at 360 kN load. A plastic behavior can be seen where the
strain increases from 600 micro-strains to 1441 micro-strains without any increase in
the load. This plastic behavior was due to the presence of a diagonal strut which
failed by crushing at a strain 1441 micro-strain under a load of 368 kN. On the left
side of the C40-R1-G4, the strain increased linearly as well after flexural crack
developed at 225 kN. Strain was zero in the pre-cracking stage and no plastic
behavior was observed. The maximum strains that the right and left strains reached
were 1441 and 582, respectively.
The strains on the right side of the C40-R1-G6 specimen were not recorded
due to failure of the strain gauge. However, the left side strains were recorded. In the
pre-cracking stage of C40-R1-G6, the strains increased linearly as the loads were
applied. At a load level of approximately 230 kN, a decay drop in the curve occurred
due to the formation of shear crack in the left side of the corbel as shown in figure
4.14, which is also consistent with figure 4.11 (c). The strains increased linearly after
the decay drop until a peak load of 309 kN and a strain of 624 was reached. The
corbel failed immediately after that by splitting of diagonal strut as shown in figure
4.11 (c).
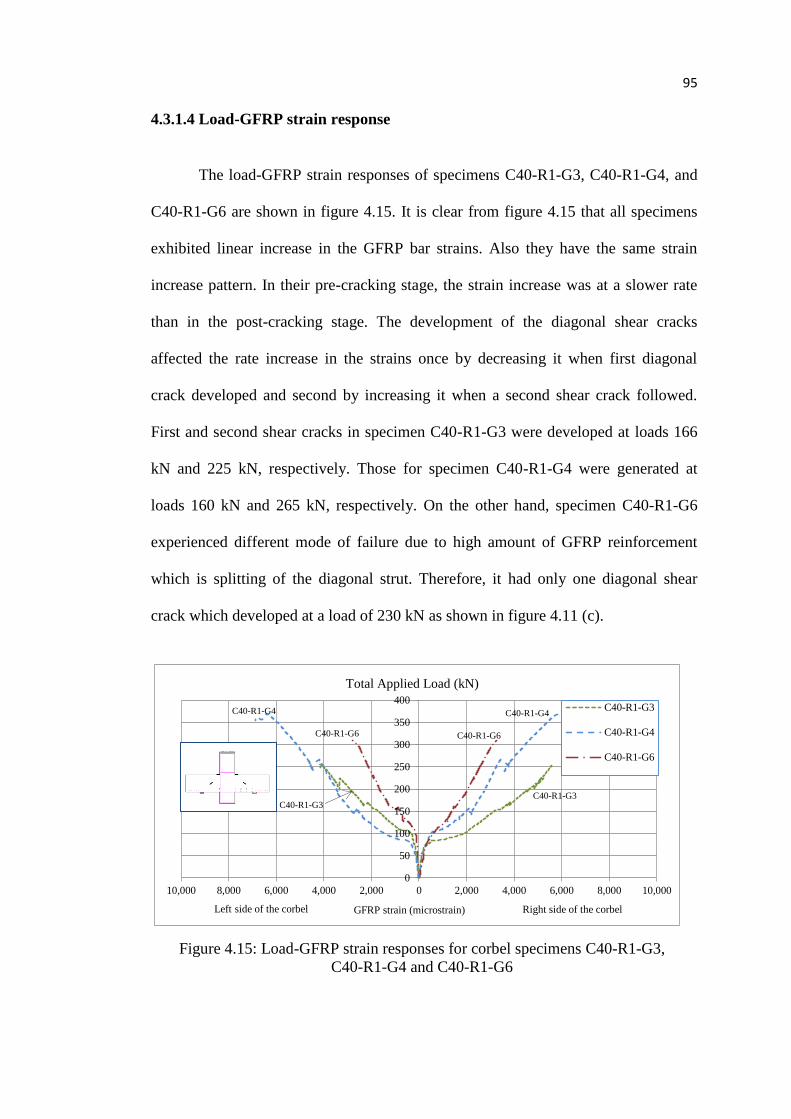
95
4.3.1.4 Load-GFRP strain response
The load-GFRP strain responses of specimens C40-R1-G3, C40-R1-G4, and
C40-R1-G6 are shown in figure 4.15. It is clear from figure 4.15 that all specimens
exhibited linear increase in the GFRP bar strains. Also they have the same strain
increase pattern. In their pre-cracking stage, the strain increase was at a slower rate
than in the post-cracking stage. The development of the diagonal shear cracks
affected the rate increase in the strains once by decreasing it when first diagonal
crack developed and second by increasing it when a second shear crack followed.
First and second shear cracks in specimen C40-R1-G3 were developed at loads 166
kN and 225 kN, respectively. Those for specimen C40-R1-G4 were generated at
loads 160 kN and 265 kN, respectively. On the other hand, specimen C40-R1-G6
experienced different mode of failure due to high amount of GFRP reinforcement
which is splitting of the diagonal strut. Therefore, it had only one diagonal shear
crack which developed at a load of 230 kN as shown in figure 4.11 (c).
0
50
100
150
200
250
300
350
400
10,000 8,000 6,000 4,000 2,000 0 2,000 4,000 6,000 8,000 10,000
C40-R1-G3
C40-R1-G4
C40-R1-G6
Total Applied Load (kN)
GFRP strain (microstrain) Right side of the corbel Left side of the corbel
C40-R1-G3 C40-R1-G3
C40-R1-G4 C40-R1-G4
C40-R1-G6 C40-R1-G6
Figure 4.15: Load-GFRP strain responses for corbel specimens C40-R1-G3,
C40-R1-G4 and C40-R1-G6
96
4.3.2 Specimens with a/d ratio of 1.5
4.3.2.1 Crack patterns and failure modes
The crack patterns at failure for corbels C40-R1.5-G3, C40-R1.5-G4, and
C40-R1.5-G6 are shown in figures 4.16 (a), 4.16 (b), and 4.16 (c), respectively. It
was noticed that the crack patterns was identical in the three corbels. For instance,
flexural cracks initiated first at the region of the maximum moment. As the load
increased, additional cracks developed in the shear zone and progressively deviated
into inclined cracks due to the presence of shear stresses. Specimens C40-R1.5-G3
and C40-R1.5-G4 continued to sustain more loads and diagonal struts started shaping
between diagonal shear cracks. However, less inclined cracks were propagated in
C40-R1.5-G6 specimens due to the brittle characteristics of this corbel, and the
splitting happened in it suddenly as seen in figure 4.16 (c). The failure modes of
specimens C40-R1.5-G3 and C40-R1.5-G4 are identical (crushing of the diagonal
strut). However, C40-R1.5-G6 experienced splitting of the diagonal strut, which is
similar to the mode of failure that specimen C40-R1-G6 experienced. It was noticed
that C40-R1.5-G6 failed earlier than C40-R1.5-G3 and C40-R1.5-G4. This can be
due to the effect of the high compressive strength with the highest reinforcement
ratio, which made the specimen too brittle and fail suddenly. Therefore, for such
case, a factor of safety must be proposed to accommodate and prevent such cases.
Table 4.2 summarizes the experimental results with failure modes for specimens of
group [B].
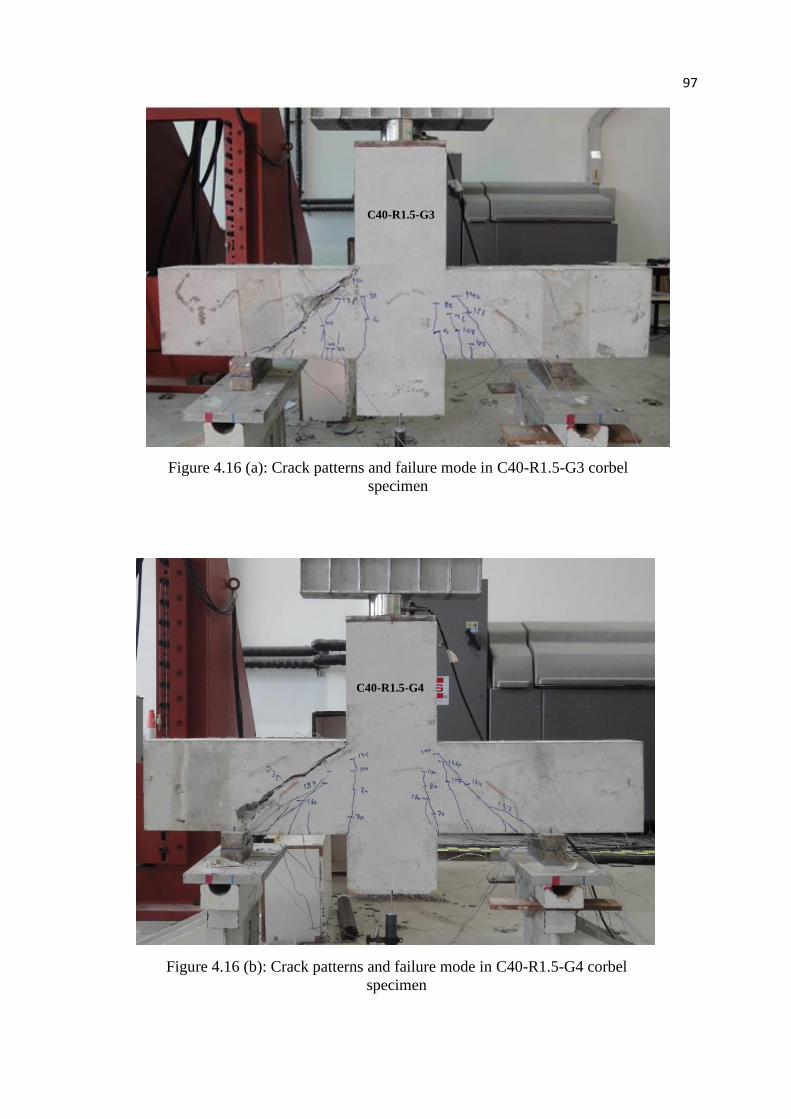
97
Figure 4.16 (a): Crack patterns and failure mode in C40-R1.5-G3 corbel
specimen
Figure 4.16 (b): Crack patterns and failure mode in C40-R1.5-G4 corbel
specimen
C40-R1.5-G3
C40-R1.5-G4
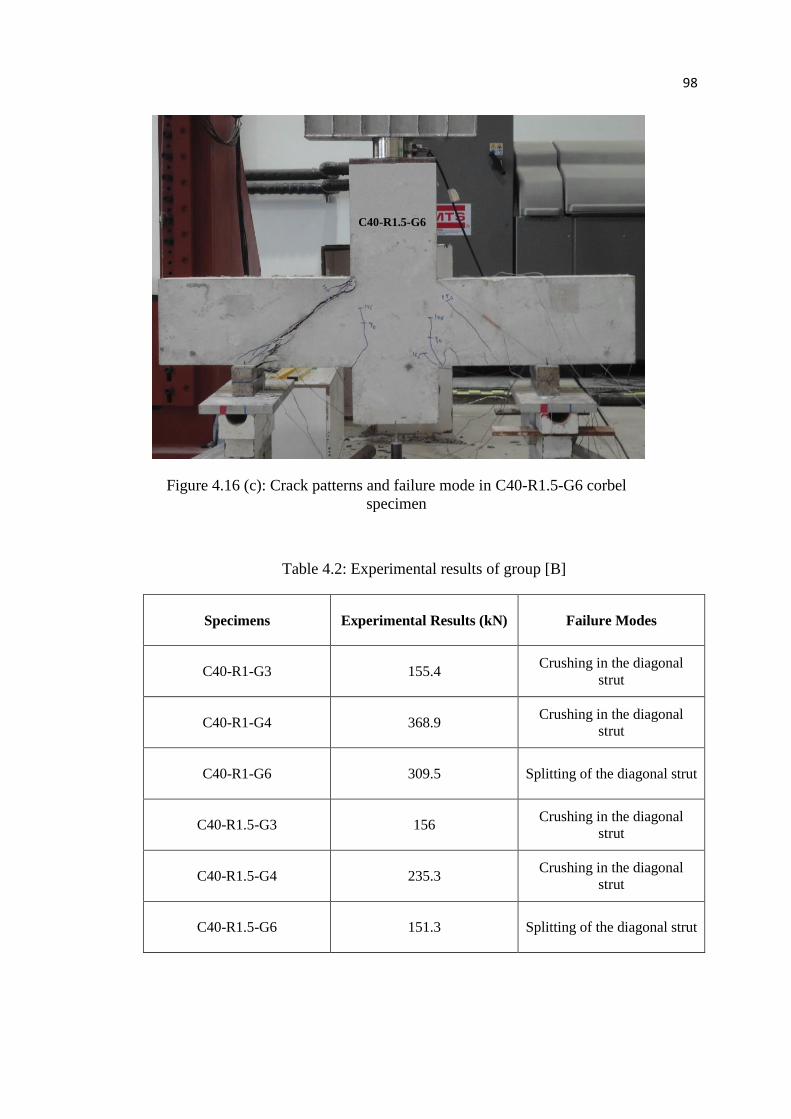
98
Table 4.2: Experimental results of group [B]
Specimens
Experimental Results (kN) Failure Modes
C40-R1-G3
155.4 Crushing in the diagonal
strut
C40-R1-G4
368.9 Crushing in the diagonal
strut
C40-R1-G6
309.5 Splitting of the diagonal strut
C40-R1.5-G3
156 Crushing in the diagonal
strut
C40-R1.5-G4
235.3 Crushing in the diagonal
strut
C40-R1.5-G6
151.3 Splitting of the diagonal strut
Figure 4.16 (c): Crack patterns and failure mode in C40-R1.5-G6 corbel
specimen
C40-R1.5-G6
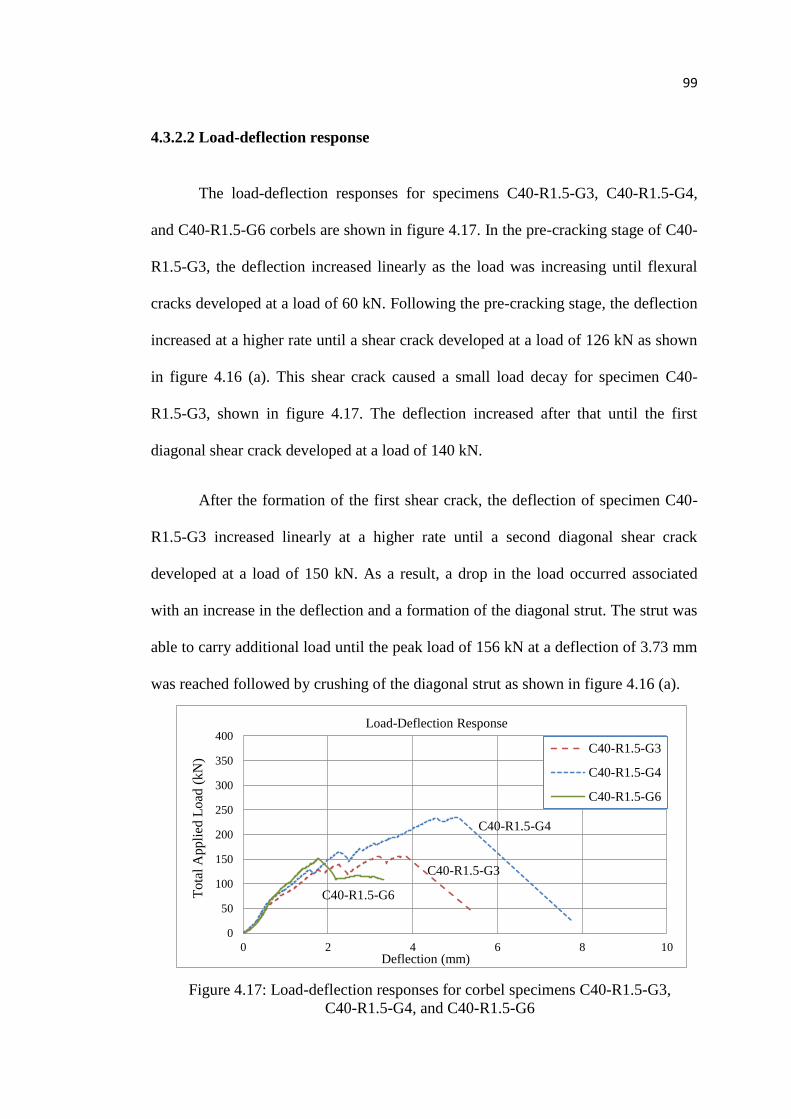
99
4.3.2.2 Load-deflection response
The load-deflection responses for specimens C40-R1.5-G3, C40-R1.5-G4,
and C40-R1.5-G6 corbels are shown in figure 4.17. In the pre-cracking stage of C40-
R1.5-G3, the deflection increased linearly as the load was increasing until flexural
cracks developed at a load of 60 kN. Following the pre-cracking stage, the deflection
increased at a higher rate until a shear crack developed at a load of 126 kN as shown
in figure 4.16 (a). This shear crack caused a small load decay for specimen C40-
R1.5-G3, shown in figure 4.17. The deflection increased after that until the first
diagonal shear crack developed at a load of 140 kN.
After the formation of the first shear crack, the deflection of specimen C40-
R1.5-G3 increased linearly at a higher rate until a second diagonal shear crack
developed at a load of 150 kN. As a result, a drop in the load occurred associated
with an increase in the deflection and a formation of the diagonal strut. The strut was
able to carry additional load until the peak load of 156 kN at a deflection of 3.73 mm
was reached followed by crushing of the diagonal strut as shown in figure 4.16 (a).
0
50
100
150
200
250
300
350
400
0 2 4 6 8 10
Tota
l A
ppli
ed L
oad
(k
N)
Deflection (mm)
Load-Deflection Response
C40-R1.5-G3
C40-R1.5-G4
C40-R1.5-G6
C40-R1.5-G3
C40-R1.5-G4
C40-R1.5-G6
Figure 4.17: Load-deflection responses for corbel specimens C40-R1.5-G3,
C40-R1.5-G4, and C40-R1.5-G6
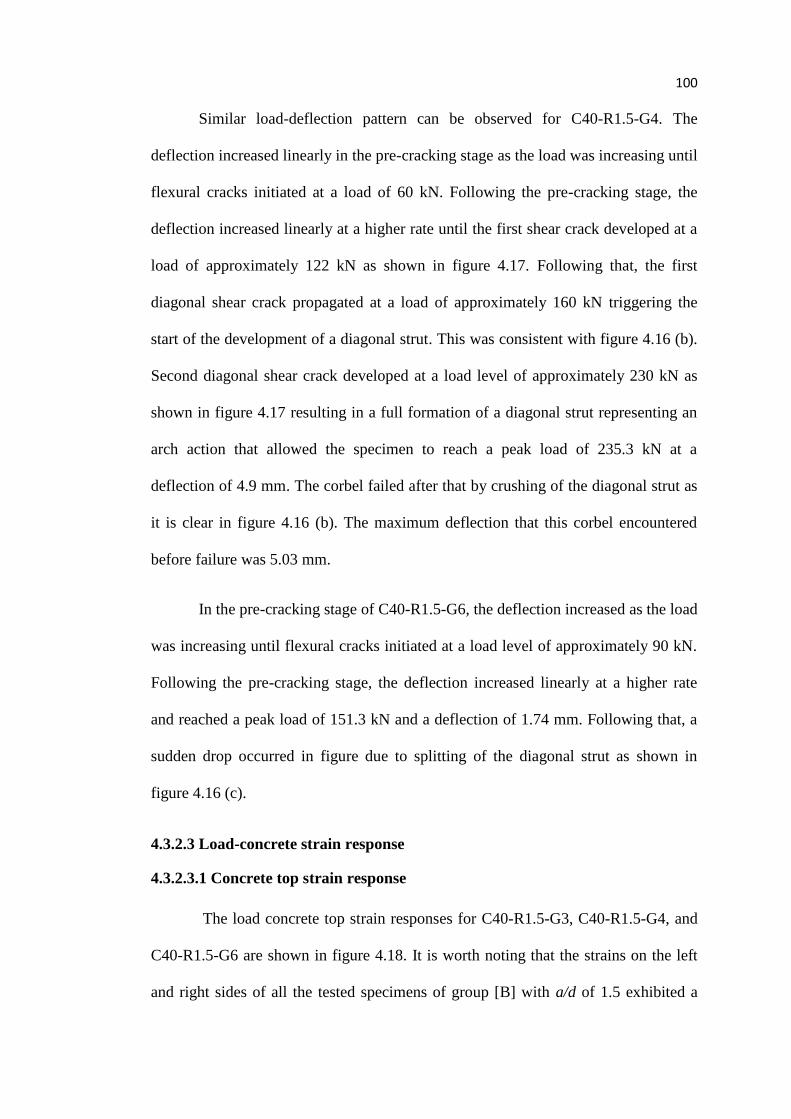
100
Similar load-deflection pattern can be observed for C40-R1.5-G4. The
deflection increased linearly in the pre-cracking stage as the load was increasing until
flexural cracks initiated at a load of 60 kN. Following the pre-cracking stage, the
deflection increased linearly at a higher rate until the first shear crack developed at a
load of approximately 122 kN as shown in figure 4.17. Following that, the first
diagonal shear crack propagated at a load of approximately 160 kN triggering the
start of the development of a diagonal strut. This was consistent with figure 4.16 (b).
Second diagonal shear crack developed at a load level of approximately 230 kN as
shown in figure 4.17 resulting in a full formation of a diagonal strut representing an
arch action that allowed the specimen to reach a peak load of 235.3 kN at a
deflection of 4.9 mm. The corbel failed after that by crushing of the diagonal strut as
it is clear in figure 4.16 (b). The maximum deflection that this corbel encountered
before failure was 5.03 mm.
In the pre-cracking stage of C40-R1.5-G6, the deflection increased as the load
was increasing until flexural cracks initiated at a load level of approximately 90 kN.
Following the pre-cracking stage, the deflection increased linearly at a higher rate
and reached a peak load of 151.3 kN and a deflection of 1.74 mm. Following that, a
sudden drop occurred in figure due to splitting of the diagonal strut as shown in
figure 4.16 (c).
4.3.2.3 Load-concrete strain response
4.3.2.3.1 Concrete top strain response
The load concrete top strain responses for C40-R1.5-G3, C40-R1.5-G4, and
C40-R1.5-G6 are shown in figure 4.18. It is worth noting that the strains on the left
and right sides of all the tested specimens of group [B] with a/d of 1.5 exhibited a

101
quasi-linear behavior until the generation of the first diagonal shear crack followed
by an almost linear increase until the strain gauges stopped recording measurements
due to malfunctioning as indicated in figure 4.18. For specimen C40-R1.5-G3, the
strain on both sides of the specimen increased at a varying rate (quasi-linear) until
the first shear crack initiated at a load of 90 kN. Following the development of this
shear crack, the strain increased linearly at a lower rate until the generation of the
second diagonal shear crack at a load of 130 kN which caused a drop in the load
associated with a slight increase in the strain. Immediately after this slight increase in
the strain, the strain gauges on both sides stopped recording due to malfunctioning.
Same behavior is observed for specimen C40-R1.5-G4 and C40-R1.5-G6.
The pre-cracking stage of C40-R1.5-G4 shows that the right and left strains increased
linearly up to the formation of flexural cracks at an approximate load level of 60 kN.
Following that, the strains increased at a higher rate until the formation of shear
crack at a load of 120 kN. The strains increased rapidly after that and was followed
with the first diagonal shear crack at a load of 164 kN, which caused the load decay
0
50
100
150
200
250
300
350
400
1,500 1,000 500 0 500 1,000 1,500
C40-R1.5-G3
C40-R1.5-G4
C40-R1.5-G6
Total Applied Load (kN)
Concrete Top strains (microstrain) Right side of corbel Left side of corbel
C40-R1.5-G3 C40-R1.5-G3
C40-R1.5-G4 C40-R1.5-G4
C40-R1.5-G6 C40-R1.5-G6
Figure 4.18: Load-top strain responses for corbel specimens C40-R1.5-G3,
C40-R1.5-G4 and C40-R1.5-G6
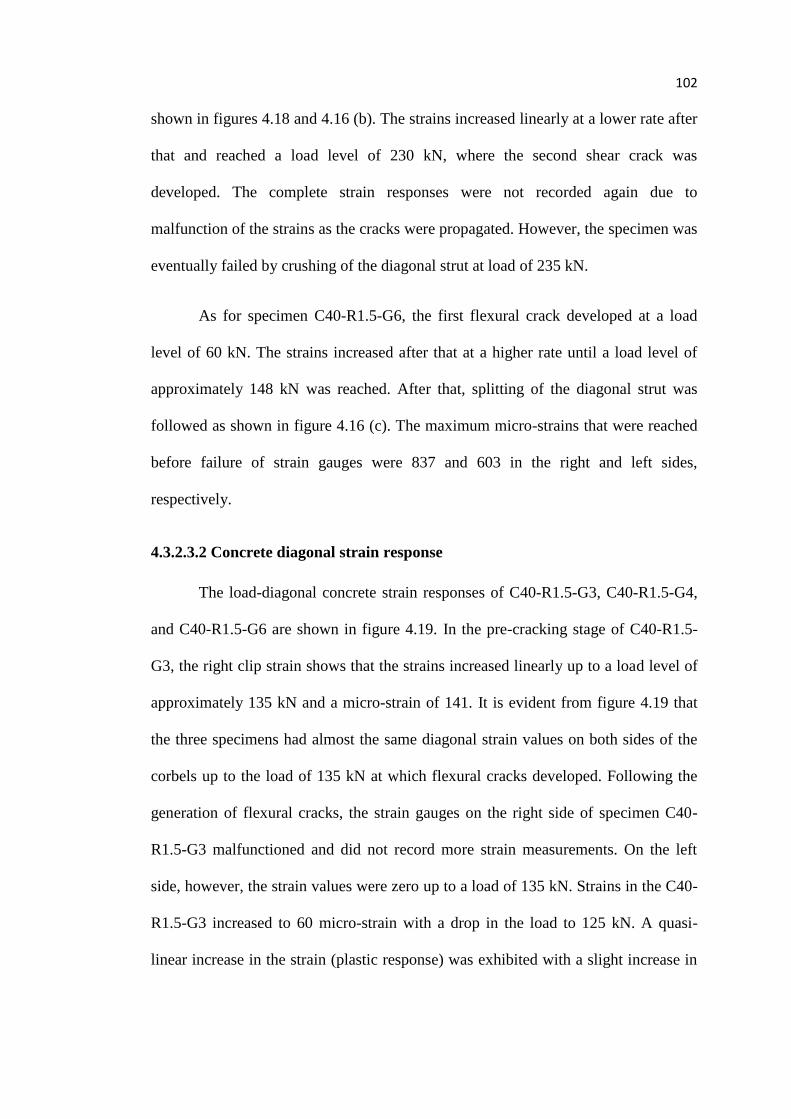
102
shown in figures 4.18 and 4.16 (b). The strains increased linearly at a lower rate after
that and reached a load level of 230 kN, where the second shear crack was
developed. The complete strain responses were not recorded again due to
malfunction of the strains as the cracks were propagated. However, the specimen was
eventually failed by crushing of the diagonal strut at load of 235 kN.
As for specimen C40-R1.5-G6, the first flexural crack developed at a load
level of 60 kN. The strains increased after that at a higher rate until a load level of
approximately 148 kN was reached. After that, splitting of the diagonal strut was
followed as shown in figure 4.16 (c). The maximum micro-strains that were reached
before failure of strain gauges were 837 and 603 in the right and left sides,
respectively.
4.3.2.3.2 Concrete diagonal strain response
The load-diagonal concrete strain responses of C40-R1.5-G3, C40-R1.5-G4,
and C40-R1.5-G6 are shown in figure 4.19. In the pre-cracking stage of C40-R1.5-
G3, the right clip strain shows that the strains increased linearly up to a load level of
approximately 135 kN and a micro-strain of 141. It is evident from figure 4.19 that
the three specimens had almost the same diagonal strain values on both sides of the
corbels up to the load of 135 kN at which flexural cracks developed. Following the
generation of flexural cracks, the strain gauges on the right side of specimen C40-
R1.5-G3 malfunctioned and did not record more strain measurements. On the left
side, however, the strain values were zero up to a load of 135 kN. Strains in the C40-
R1.5-G3 increased to 60 micro-strain with a drop in the load to 125 kN. A quasi-
linear increase in the strain (plastic response) was exhibited with a slight increase in
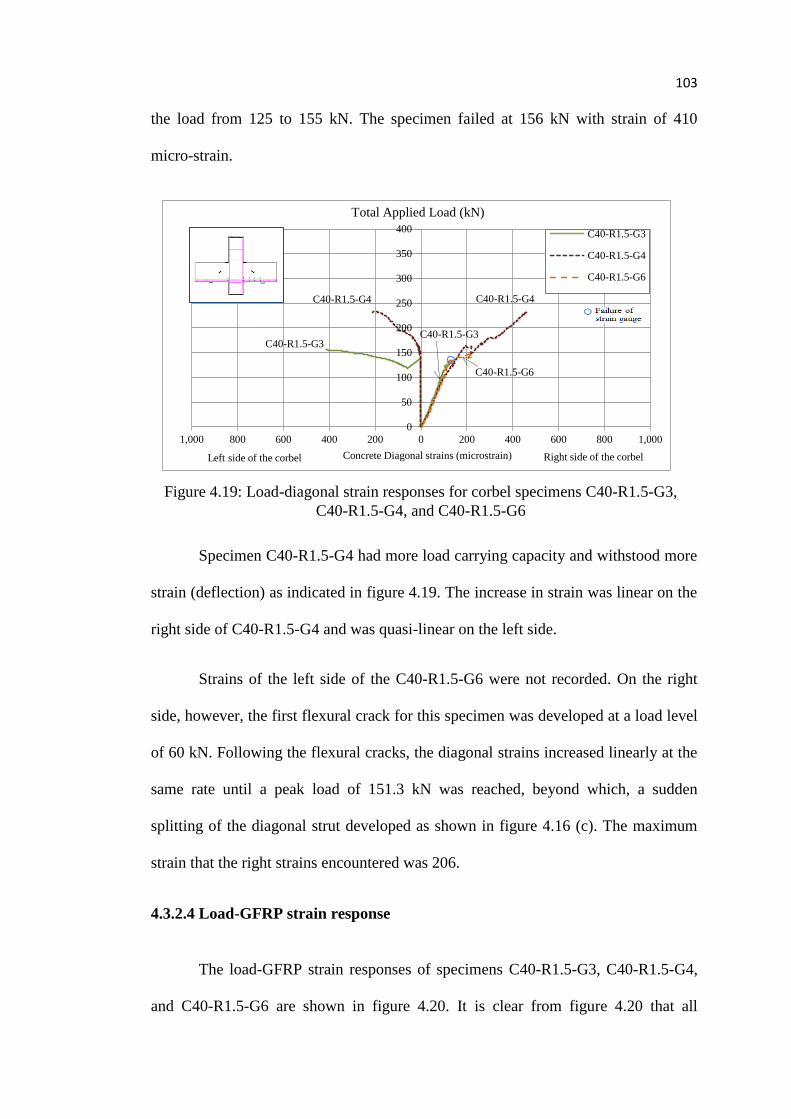
103
the load from 125 to 155 kN. The specimen failed at 156 kN with strain of 410
micro-strain.
Specimen C40-R1.5-G4 had more load carrying capacity and withstood more
strain (deflection) as indicated in figure 4.19. The increase in strain was linear on the
right side of C40-R1.5-G4 and was quasi-linear on the left side.
Strains of the left side of the C40-R1.5-G6 were not recorded. On the right
side, however, the first flexural crack for this specimen was developed at a load level
of 60 kN. Following the flexural cracks, the diagonal strains increased linearly at the
same rate until a peak load of 151.3 kN was reached, beyond which, a sudden
splitting of the diagonal strut developed as shown in figure 4.16 (c). The maximum
strain that the right strains encountered was 206.
4.3.2.4 Load-GFRP strain response
The load-GFRP strain responses of specimens C40-R1.5-G3, C40-R1.5-G4,
and C40-R1.5-G6 are shown in figure 4.20. It is clear from figure 4.20 that all
0
50
100
150
200
250
300
350
400
1,000 800 600 400 200 0 200 400 600 800 1,000
C40-R1.5-G3
C40-R1.5-G4
C40-R1.5-G6
Total Applied Load (kN)
Concrete Diagonal strains (microstrain) Left side of the corbel Right side of the corbel
C40-R1.5-G3
C40-R1.5-G4 C40-R1.5-G4
C40-R1.5-G3
C40-R1.5-G6
Figure 4.19: Load-diagonal strain responses for corbel specimens C40-R1.5-G3,
C40-R1.5-G4, and C40-R1.5-G6
104
specimens exhibited linear increase in the GFRP bar strains. Also, they have the
same strain increase pattern. In their pre-cracking stage, the strain increase was at a
slower rate than in the post-cracking stage. The development of the diagonal shear
cracks affected the rate increase in the strains once by decreasing it when first
diagonal crack developed and second by increasing it when a second shear crack
followed. First and second shear cracks in specimen C40-R1.5-G3 were developed at
loads 140 kN and 150 kN, respectively. Those for specimen C40-R1.5-G4 were
generated at loads 160 kN and 230 kN, respectively. On the other hand, specimen
C40-R1-G6 experienced different mode of failure due to high amount of GFRP
reinforcement which is splitting of the diagonal strut. Therefore, it had only one
diagonal shear crack which developed at a load of 150 kN as shown in figure 4.11
(c). It was also noticed that C40-R1.5-G3 exhibited more strains than C40-R1.5-G4
and C40-R1.5-G6. For instance, at a load level of 100 kN, the strains at the right side
that was recorded were 2326, 1727, and 1056 as shown in figure 4.20 for C40-R1.5-
G3, C40-R1.5-G4, and C40-R1.5-G6, respectively. On the other hand, the strains
recorded at the left side of the corbel for the same load level were 2630, 1707, and
1211 for C40-R1.5-G3, C40-R1.5-G4, and C40-R1.5-G6, respectively.
0
50
100
150
200
250
300
350
400
10,000 8,000 6,000 4,000 2,000 0 2,000 4,000 6,000 8,000 10,000
C40-R1.5-G3
C40-R1.5-G4
C40-R1.5-G6
Total Applied Load (kN)
GFRP strain
(microstrain) Right side of the
corbel Left side of the corbel
C40-R1.5-G3
C40-R1.5-G3
C40-R1.5-G4 C40-R1.5-G4
C40-R1.5-G6 C40-R1.5-G6
Figure 4.20: Load-GFRP strain responses for corbel specimens C40-R1.5-G3,
C40-R1.5-G4, and C40-R1.5-G6
105
4.4 Performance of Evaluation
4.4.1 Group [A] specimens with f ’c = 20 MPa
The relationship between the ultimate experimental load and the GFRP
reinforcement ratio, ρf, for group [A] is shown in figure 4.21. Group [A] is comprised
of six specimens, and was cast with C20 concrete (f ’c = 20 MPa). The blue bars
represent specimens with a/d ratio of 1.0, while the red bars represent the specimens
with a/d ratio of 1.5. It can be observed from the figures that the shear strength
increased as the reinforcement ratios increased. This increase is attributed to the
increased depth of the compression block at failure. In other words, to balance the
increased tension force, the depth of the neutral axis increased and therefore, the
strength increased. For instance, for specimens with a/d ratio of 1.0, increasing the
reinforcement ratio of corbel specimen C20-R1-G3 and C20-R1-G4 from 3 ρb to 4 ρb
increased the shear strength by 8%. However, a further increase in the reinforcement
ratio from 4 ρb to 6 ρb for corbel specimens C20-R1-G4 and C20-R1-G6 increased
the shear strength by 80%. Similarly, for specimens with a/d ratio of 1.5, increasing
the reinforcement ratio for corbel specimens C20-R1.5-G3 and C20-R1.5-G4 from
3 ρb to 4 ρb increased the shear strength by 29.8%. A further increase in the
reinforcement ratio from 4 ρb to 6 ρb for corbel specimens C20-R1.5-G4 and C20-
R1.5-G6 increased the shear strength by 10.2%.
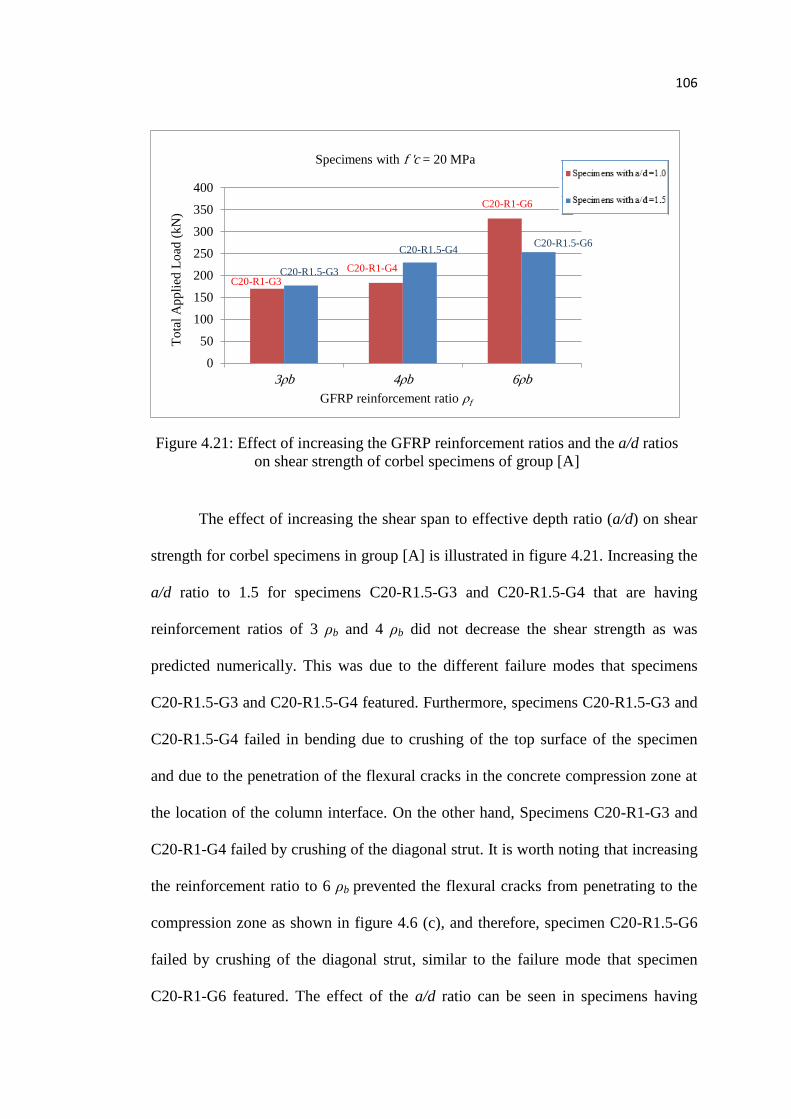
106
The effect of increasing the shear span to effective depth ratio (a/d) on shear
strength for corbel specimens in group [A] is illustrated in figure 4.21. Increasing the
a/d ratio to 1.5 for specimens C20-R1.5-G3 and C20-R1.5-G4 that are having
reinforcement ratios of 3 ρb and 4 ρb did not decrease the shear strength as was
predicted numerically. This was due to the different failure modes that specimens
C20-R1.5-G3 and C20-R1.5-G4 featured. Furthermore, specimens C20-R1.5-G3 and
C20-R1.5-G4 failed in bending due to crushing of the top surface of the specimen
and due to the penetration of the flexural cracks in the concrete compression zone at
the location of the column interface. On the other hand, Specimens C20-R1-G3 and
C20-R1-G4 failed by crushing of the diagonal strut. It is worth noting that increasing
the reinforcement ratio to 6 ρb prevented the flexural cracks from penetrating to the
compression zone as shown in figure 4.6 (c), and therefore, specimen C20-R1.5-G6
failed by crushing of the diagonal strut, similar to the failure mode that specimen
C20-R1-G6 featured. The effect of the a/d ratio can be seen in specimens having
Figure 4.21: Effect of increasing the GFRP reinforcement ratios and the a/d ratios
on shear strength of corbel specimens of group [A]
0
50
100
150
200
250
300
350
400
3ρb 4ρb 6ρb
Specimens with f 'c = 20 MPa
To
tal
Ap
pli
ed L
oad
(kN
)
GFRP reinforcement ratio ρf
C20-R1-G3 C20-R1.5-G3 C20-R1-G4
C20-R1-G6
C20-R1.5-G4 C20-R1.5-G6
107
reinforcement ratio of 6 ρb because both specimens featured the same mode of
failure. Hence, increasing the a/d ratio from 1.0 to 1.5 for these specimens decreased
the shear strength by 23.3%.
4.4.2 Group [B] specimens with f ’c = 40 MPa
The relationship between the ultimate experimental load and the GFRP
reinforcement ratio, ρf, for group [B] is shown in figure 4.22. Group [B] is comprised
of six specimens, and was cast with C40 concrete (f ’c = 40 MPa). The blue bars
represent specimens with a/d ratio of 1.0, while the red bars represent the specimens
with a/d ratio of 1.5. It can be noticed from the graph that the shear strength is
increased as the reinforcement ratio is increased. For instance, for specimens C40-
R1-G3 and C40-R1-G4 were the a/d ratio = 1.0, increasing the reinforcement ratio
from 3 ρb to 4 ρb increased the shear strength by 44.4%. Similarly, for specimens
C40-R1.5-G3 and C40-R1.5-G4 were the a/d ratio = 1.5, increasing the
reinforcement ratio from 3 ρb to 4 ρb increased the shear strength by 50.8%. It is
worth noting that increasing the reinforcement ratio significantly to 6 ρb decreased
the shear strength and resulted in a sudden and early failure. This can be attributed
due to the brittle characteristics that specimens featured. For instance, for specimens
C40-R1-G4 and C40-R1-G6 were the a/d ratio = 1.0, increasing the reinforcement
ratio from 4 ρb to 6 ρb decreased the shear strength by 16%, whereas for specimens
C40-R1.5-G4 and C40-R1.5-G6 were the a/d ratio = 1.5, increasing the
reinforcement ratio from 4 ρb to 6 ρb decreased the shear strength by 36%.

108
The effect of increasing the shear span to effective depth ratio (a/d) on shear
strength for corbel specimens in group [B] is illustrated in figure 4.22. All specimens
in group [B] featured the same failure modes. Therefore, the shear strength of all
specimens is clearly affected and decreased when the shear span to effective depth
ratio (a/d) is increased. The reason why increasing the a/d ratio decreases the shear
strengths is because as the a/d ratio is increased, the distance between the supports
and the applied loads is increased, and hence, the effectiveness of the arching
mechanism is decreased. For instance, increasing the a/d ratio from 1.0 to 1.5 for
specimens C40-R1-G3 and C40-R1.5-G3 decreased the shear strengths by 38.9%.
Similarly, increasing the a/d ratio from 1.0 to 1.5 for specimens C40-R1-G4 and
C40-R1.5-G4 decreased the shear strengths by 36.2%. Likewise, increasing the a/d
ratio from 1.0 to 1.5 for specimens C40-R1-G6 and C40-R1.5-G6 decreased the
shear strengths by 51%.
0
50
100
150
200
250
300
350
400
3ρb 4ρb 6ρb
Specimens with f 'c = 40 MPa
Specimens with a/d =1.0
Specimens with a/d =1.5
GFRP reinforcement ratio ρf
To
tal
Ap
pli
ed L
oad
(kN
)
C40-R1-G3
C40-R1-G4
C40-R1-G6
C40-R1.5-G3
C40-R1.5-G4
C40-R1.5-G6
Figure 4.22: Effect of increasing the GFRP reinforcement ratios and the a/d ratios
on shear strength of corbel specimens of group [B]

109
Chapter 5: Analytical Modeling
5.1 Introduction
This chapter presents the analytical results of twelve corbel specimens
reinforced internally with GFRP bars. The shear strengths of the tested corbels were
predicted using the strut and tie method (STM) recommended by the CSA-S806-12
Canadian Code, and two analytical models that were published in literature that take
into account the effect of concrete compressive strength, a/d ratio, the FRP
reinforcement ratio on the shear strength of deep beams. The two proposed models
are: Mihaylov (2016) and Jang et al. (2009). The predicted shear strengths were
compared to the experimental values as given in table 5.1 and discussion of the
analytical results is presented at the end of this chapter. It was concluded that all
analytical models gave good and reasonable predictions for corbels with GFRP
reinforcement ratios of 3 ρb and 4 ρb. However, the STM design method has more
advantage over the two proposed methods as it gave conservative predictions for
corbels with high GFRP reinforcement ratios.
5.2 Strut and tie model
5.2.1 Overview
Strut and tie model (STM) has evolved as one of the most used analysis
methods for concrete members with discontinuity or disturbed regions (D-regions).
For D-regions, load transfer is assumed to follow the arch-action mechanism, and the
strain distribution across beam section is non-linear. The strength of such members is
usually controlled by shear rather than flexure, and hence, most of the design codes
recommend the use of strut and tie method (STM) for designing or analyzing such
110
members. The STM is based on the lower bound theorem of plasticity and it is
recommended by different codes. In this research, the Canadian code (CSA-S806-12)
was used to investigate the ultimate loads of the twelve corbels constructed and
examined in this study. It is worth noting that the CSA-S806-12 considers the use
FRP materials in its STM recommendations, unlike the American Concrete
Institution (ACI 440.1R-15) code, which does not address the STM. In addition, the
strut-and-tie model in ACI 318 (ACI 2008a) depends only on the concrete
compressive strength, reflected by the concrete strut strength without considering the
axial stiffness of the main longitudinal reinforcement. Furthermore, the predicted
ultimate loads will be constant for different reinforcement ratios as long as the
geometry of the deep beams and the concrete compressive strengths are kept
constant. This was examined and verified by Faraghaly and Benmokrane (2013). In
addition, in the CSA-S806-12 code, the strut strength is dependent on the main
reinforcement bar properties. For that reason, the STM addressed in the CSA-S806-
12 code is used in this study.
5.2.2 STM solution approach
The strut and tie model (STM) approach is dependent on the trajectory of the
internal forces generated by the external forces applied. The path of the internal
forces considered for the corbel specimens in this study with a/d ratio of 1.0 and 1.5
are shown in figures 5.1(a) and 5.1 (b), respectively. The Strut and-Tie-model
consists of struts, ties, and nodal zones. The struts are compression members in the
model, while the ties are tension members. The point of intersection between the
struts and ties is called nodes. The strut and tie model (STM) should satisfy
equilibrium requirements. For instance, equilibrium of STM nodes should be
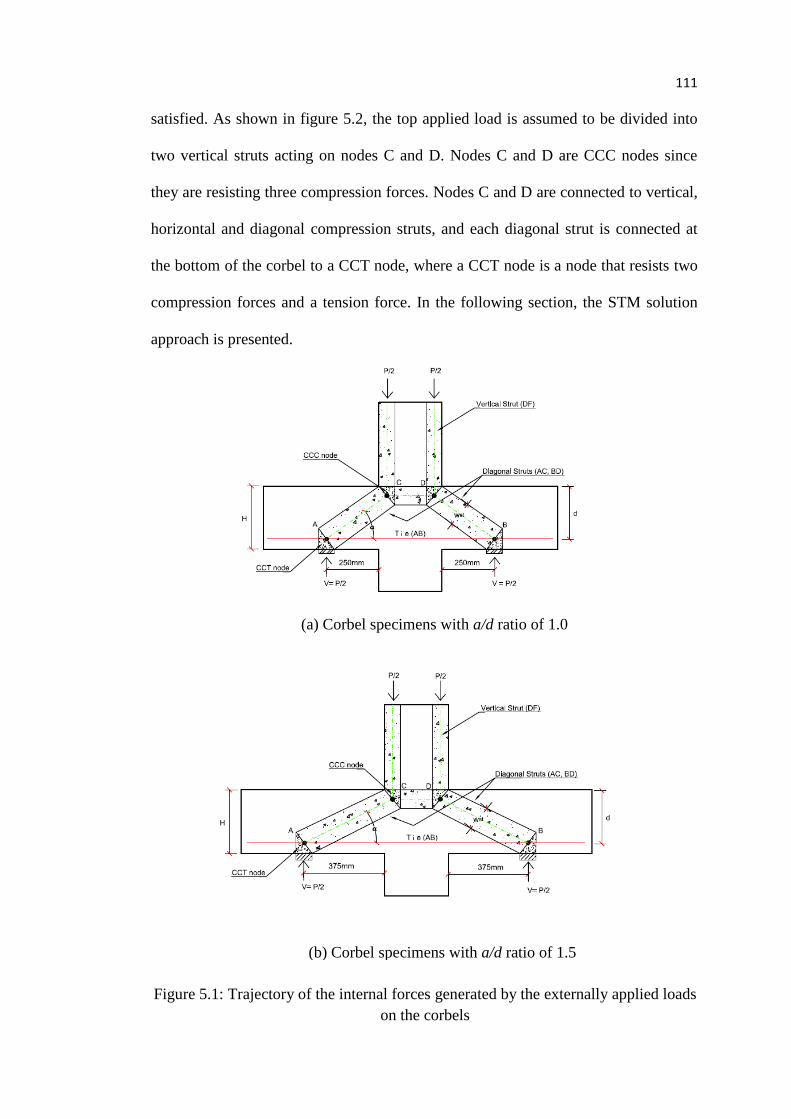
111
satisfied. As shown in figure 5.2, the top applied load is assumed to be divided into
two vertical struts acting on nodes C and D. Nodes C and D are CCC nodes since
they are resisting three compression forces. Nodes C and D are connected to vertical,
horizontal and diagonal compression struts, and each diagonal strut is connected at
the bottom of the corbel to a CCT node, where a CCT node is a node that resists two
compression forces and a tension force. In the following section, the STM solution
approach is presented.
(a) Corbel specimens with a/d ratio of 1.0
(b) Corbel specimens with a/d ratio of 1.5
Figure 5.1: Trajectory of the internal forces generated by the externally applied loads
on the corbels

112
5.2.2.1 Struts
The widths of the diagonal struts are determined based on the dimensions of
the nodal zones. The upper and lower widths of the diagonal struts are calculated
according to the following equations with reference to figures 5.1 (a) and 5.1 (b). The
strut strength is governed by the least strut width.
Upper width of the strut 𝑤𝑠𝑡 = ℎ𝑡𝑛𝑐𝑜𝑠𝛼 + 𝑤𝑡𝑛𝑠𝑖𝑛𝛼 Eq 5.1
Lower width of the strut 𝑤𝑠𝑡 = ℎ𝑏𝑛𝑐𝑜𝑠𝛼 + 𝑤𝑏𝑛𝑠𝑖𝑛𝛼 Eq 5.2
where wtn and wbn are the widths of the top and bottom nodes, respectively; htn and
hbn are the heights of the top and bottom nodes, respectively; and α is the inclination
angle of the diagonal struts, and can be determined by the following equation:
Figure 5.2: The strut and tie model for the corbel specimens of this study
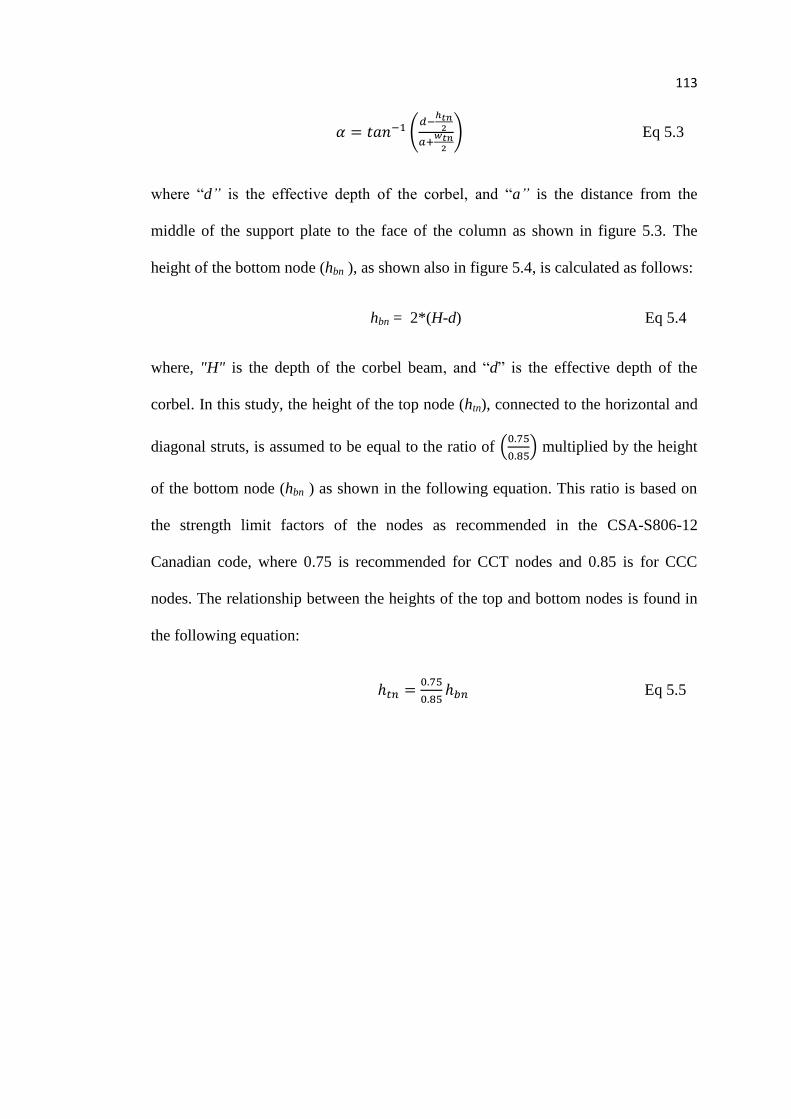
113
𝛼 = 𝑡𝑎𝑛−1 (𝑑−
ℎ𝑡𝑛2
𝑎+𝑤𝑡𝑛
2
) Eq 5.3
where “d” is the effective depth of the corbel, and “a” is the distance from the
middle of the support plate to the face of the column as shown in figure 5.3. The
height of the bottom node (hbn ), as shown also in figure 5.4, is calculated as follows:
hbn = 2*(H-d) Eq 5.4
where, "H" is the depth of the corbel beam, and “d” is the effective depth of the
corbel. In this study, the height of the top node (htn), connected to the horizontal and
diagonal struts, is assumed to be equal to the ratio of (0.75
0.85) multiplied by the height
of the bottom node (hbn ) as shown in the following equation. This ratio is based on
the strength limit factors of the nodes as recommended in the CSA-S806-12
Canadian code, where 0.75 is recommended for CCT nodes and 0.85 is for CCC
nodes. The relationship between the heights of the top and bottom nodes is found in
the following equation:
ℎ𝑡𝑛 =0.75
0.85ℎ𝑏𝑛 Eq 5.5
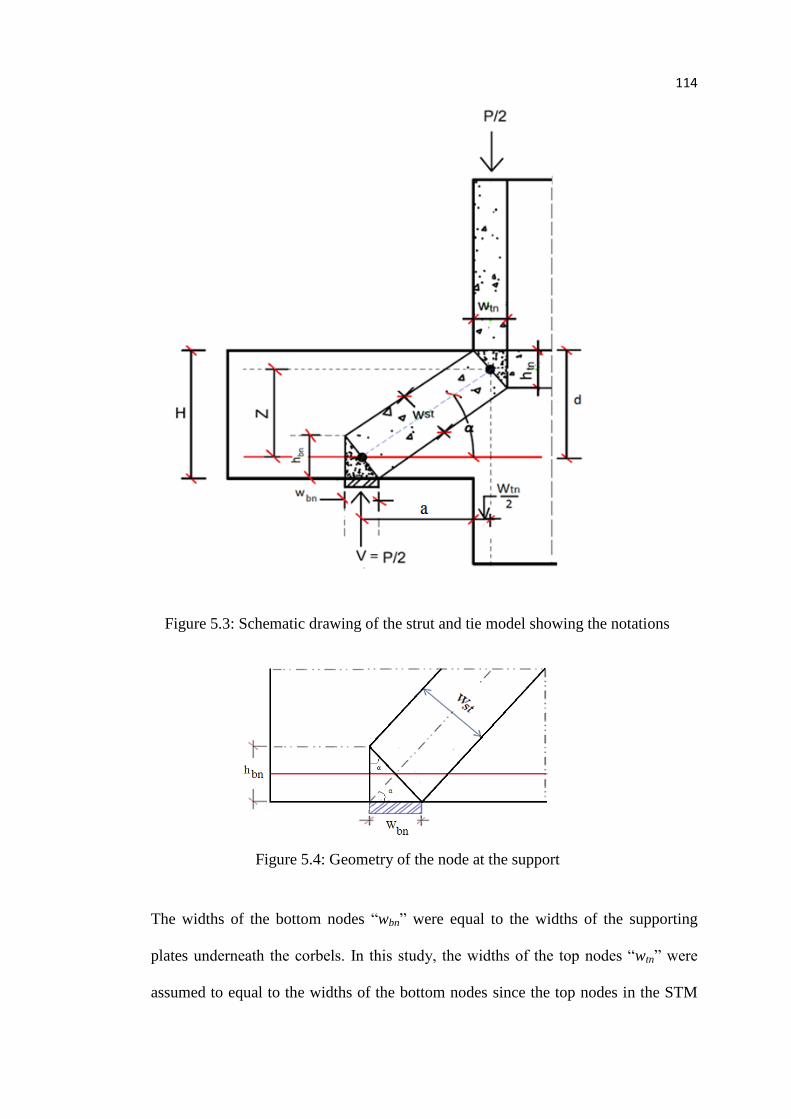
114
The widths of the bottom nodes “wbn” were equal to the widths of the supporting
plates underneath the corbels. In this study, the widths of the top nodes “wtn” were
assumed to equal to the widths of the bottom nodes since the top nodes in the STM
Figure 5.3: Schematic drawing of the strut and tie model showing the notations
Figure 5.4: Geometry of the node at the support
115
were exposed to the same load as that of the bottom nodes (P/2). The bearing
capacities of these nodes were checked against the strength limits recommended by
the CSA-S806-12 code, and a sample calculation is given in the Appendix. The
forces of the diagonal struts, shown in figure 5.2, are calculated from equilibrium of
the nodes using the following formula:
𝐹𝐴𝐶 = 𝐹𝐵𝐷 =𝑉
𝑠𝑖𝑛𝛼 Eq 5.6
where V is the shear force shown in figure 5.2. After calculating the force of the
compressive diagonal struts (FAC and FBD ), the compressive strength of the diagonal
strut (fsc) can be calculated as follows:
𝑓𝑠𝑐 =𝐹𝐴𝐶
𝑤𝑠𝑡∗𝑏𝑤 Eq 5.7
The compressive strength of the inclined strut (fsc) is then compared with the limiting
compressive stress ( fcu ) given in the Canadian code (CSA-S806-12). Accordingly,
the limiting compressive stress, fcu, of a node crossed by a tension tie is given by:
𝑓𝑐𝑢 =𝑓′𝑐
0.8+170𝜀1≤ 𝛼1𝑓′
𝑐 Eq 5.8
where ε1 is the transverse tensile strain found in the cracked diagonal concrete struts
caused by the applied loads. ε1 is calculated as follows:
𝜀1 = 𝜀𝑓 + (𝜀𝑓 + 0.002) ∗ 𝑐𝑜𝑡2α Eq 5.9
The strength limit of the strut is, fcu, shall not exceed (α1 f 'c), where α1 is given by the
code as follows:
𝛼1 = 0.85 − 0.0015𝑓′𝑐
≥ 0.67 Eq 5.10
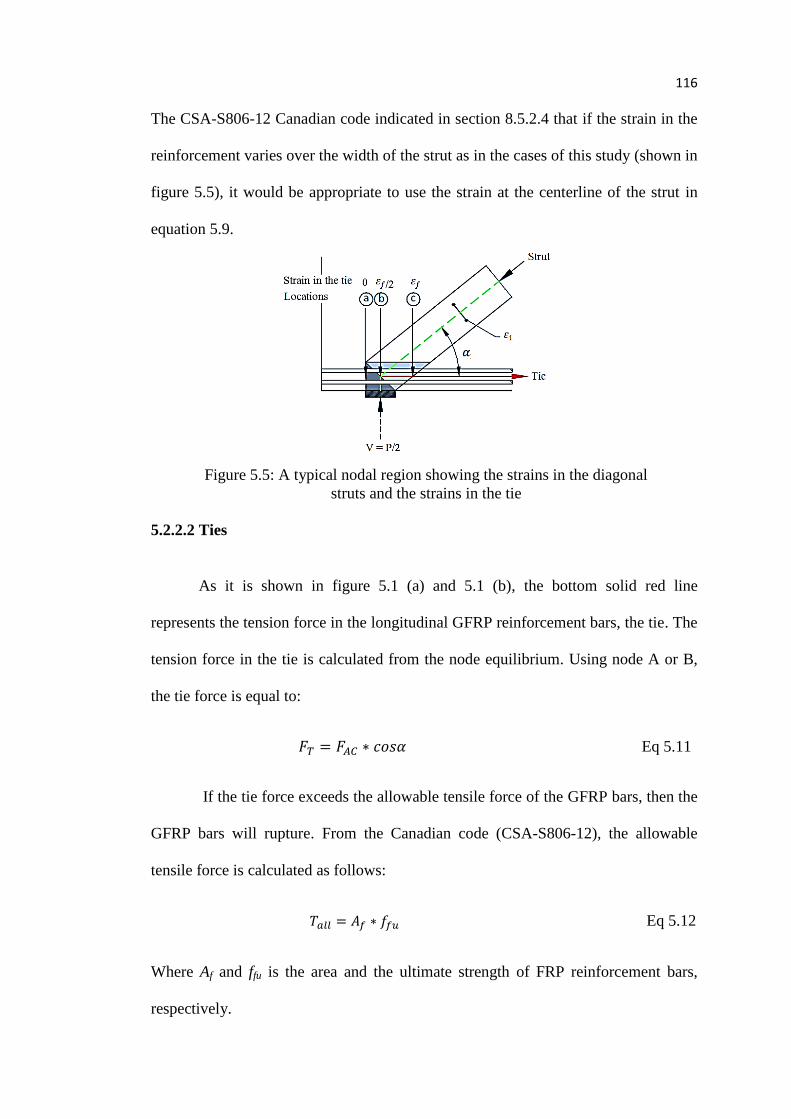
116
The CSA-S806-12 Canadian code indicated in section 8.5.2.4 that if the strain in the
reinforcement varies over the width of the strut as in the cases of this study (shown in
figure 5.5), it would be appropriate to use the strain at the centerline of the strut in
equation 5.9.
5.2.2.2 Ties
As it is shown in figure 5.1 (a) and 5.1 (b), the bottom solid red line
represents the tension force in the longitudinal GFRP reinforcement bars, the tie. The
tension force in the tie is calculated from the node equilibrium. Using node A or B,
the tie force is equal to:
𝐹𝑇 = 𝐹𝐴𝐶 ∗ 𝑐𝑜𝑠𝛼 Eq 5.11
If the tie force exceeds the allowable tensile force of the GFRP bars, then the
GFRP bars will rupture. From the Canadian code (CSA-S806-12), the allowable
tensile force is calculated as follows:
𝑇𝑎𝑙𝑙 = 𝐴𝑓 ∗ 𝑓𝑓𝑢 Eq 5.12
Where Af and ffu is the area and the ultimate strength of FRP reinforcement bars,
respectively.
Figure 5.5: A typical nodal region showing the strains in the diagonal
struts and the strains in the tie

117
5.2.2.3 Nodes
The Canadian code (CSA-S806-12) recommends that the calculated concrete
compressive strength, fcu , shall not exceed 0.85φcf'c in node regions bounded by
struts and bearing areas, where φc is a resistance factor for concrete, and was taken as
unity in order to predict the nominal strength rather than the design strength. The
code also reports that the concrete compressive strength, fcu, shall not exceed
0.75φcf'c in node regions that are anchoring ties.
5.2.3 Solution procedure
The solution procedure for calculating the shear capacity of corbels internally
reinforced with GFRP rods using STM is summarized in figure 5.6. In order to use
this procedure, the material properties and dimensions of the deep beams/corbels
should be known to the user. The capacity of the STM is reached when the strength
limit of any of the struts, nodes, or tension ties exceeds the allowable stresses. The
first step starts by assuming a value of the applied on the corbel. The second step in
this procedure involves finding the area of the GFRP reinforcement bars (Af). The
third step involves finding the angle α between the diagonal struts and the tie from
geometry as shown in figure 5.3. Finding the angle α is important for finding the
internal forces of the struts and ties. The forth step involves finding the widths of the
inclined diagonal struts (wst), and the dimensions of the nodes using equations 5.1 to
5.5. The fifth step involves finding the tensile stress (σ = Ft /Af) caused by the tensile
force (Ft), the tensile strain in the tie GFRP bar, εf (εf = σ/Ef), and the transverse
tensile strain in the cracked diagonal concrete struts caused by the applied loads, ε1,
(using equations 5.9 and 5.10) as the Canadian code (CSA-S806-12) recommends.
118
The Elastic Modulus of the GFRP bars (Ef) was taken from table 3.7 that identifies
the mechanical properties of the GFRP bars (in chapter 3). The sixth step involves
finding the limiting compressive stress, fcu, in a concrete (using equation 5.8) as
reported by the CSA-S806-12 code. Finally, the seventh step involves checking
whether the applied load causes failure in any of the STM components. These steps
are repeated until any of the struts, nodes, or ties reached their limit strength given by
the Canadian code.

119
Figure 5.6: Iteration procedure to determine the load capacity for corbels/deep
beams using STM
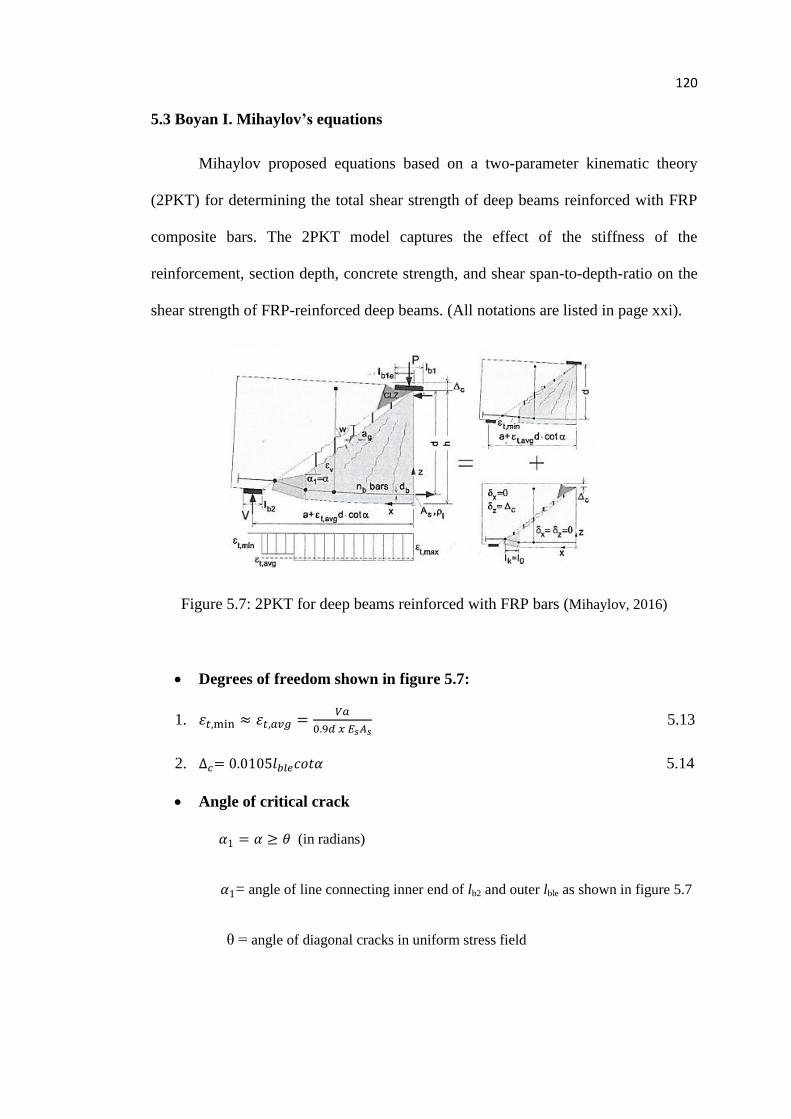
120
5.3 Boyan I. Mihaylov’s equations
Mihaylov proposed equations based on a two-parameter kinematic theory
(2PKT) for determining the total shear strength of deep beams reinforced with FRP
composite bars. The 2PKT model captures the effect of the stiffness of the
reinforcement, section depth, concrete strength, and shear span-to-depth-ratio on the
shear strength of FRP-reinforced deep beams. (All notations are listed in page xxi).
Figure 5.7: 2PKT for deep beams reinforced with FRP bars (Mihaylov, 2016)
Degrees of freedom shown in figure 5.7:
1. 𝜀𝑡,min ≈ 𝜀𝑡,𝑎𝑣𝑔 =𝑉𝑎
0.9𝑑 𝑥 𝐸𝑠𝐴𝑠 5.13
2. ∆𝑐= 0.0105𝑙𝑏𝑙𝑒𝑐𝑜𝑡𝛼 5.14
Angle of critical crack
𝛼1 = 𝛼 ≥ 𝜃 (in radians)
𝛼1= angle of line connecting inner end of lb2 and outer lble as shown in figure 5.7
θ = angle of diagonal cracks in uniform stress field
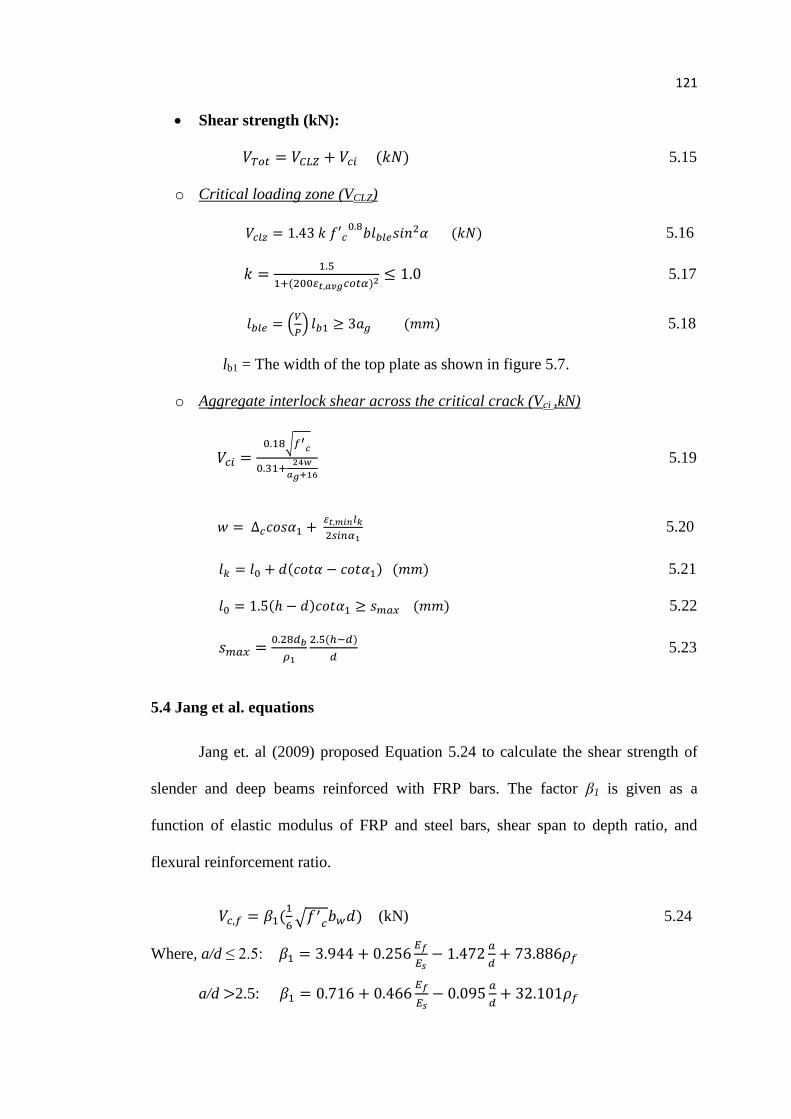
121
Shear strength (kN):
𝑉𝑇𝑜𝑡 = 𝑉𝐶𝐿𝑍 + 𝑉𝑐𝑖 (𝑘𝑁) 5.15
o Critical loading zone (VCLZ)
𝑉𝑐𝑙𝑧 = 1.43 𝑘 𝑓′𝑐0.8
𝑏𝑙𝑏𝑙𝑒𝑠𝑖𝑛2𝛼 (𝑘𝑁) 5.16
𝑘 =1.5
1+(200𝜀𝑡,𝑎𝑣𝑔𝑐𝑜𝑡𝛼)2 ≤ 1.0 5.17
𝑙𝑏𝑙𝑒 = (𝑉
𝑃) 𝑙𝑏1 ≥ 3𝑎𝑔 (𝑚𝑚) 5.18
lb1 = The width of the top plate as shown in figure 5.7.
o Aggregate interlock shear across the critical crack (Vci ,kN)
𝑉𝑐𝑖 =0.18√𝑓′
𝑐
0.31+24𝑤
𝑎𝑔+16
5.19
𝑤 = ∆𝑐𝑐𝑜𝑠𝛼1 + 𝜀𝑡,𝑚𝑖𝑛𝑙𝑘
2𝑠𝑖𝑛𝛼1 5.20
𝑙𝑘 = 𝑙0 + 𝑑(𝑐𝑜𝑡𝛼 − 𝑐𝑜𝑡𝛼1) (𝑚𝑚) 5.21
𝑙0 = 1.5(ℎ − 𝑑)𝑐𝑜𝑡𝛼1 ≥ 𝑠𝑚𝑎𝑥 (𝑚𝑚) 5.22
𝑠𝑚𝑎𝑥 =0.28𝑑𝑏
𝜌1
2.5(ℎ−𝑑)
𝑑 5.23
5.4 Jang et al. equations
Jang et. al (2009) proposed Equation 5.24 to calculate the shear strength of
slender and deep beams reinforced with FRP bars. The factor β1 is given as a
function of elastic modulus of FRP and steel bars, shear span to depth ratio, and
flexural reinforcement ratio.
𝑉𝑐,𝑓 = 𝛽1(1
6√𝑓′
𝑐𝑏𝑤𝑑) (kN) 5.24
Where, a/d ≤ 2.5: 𝛽1 = 3.944 + 0.256𝐸𝑓
𝐸𝑠− 1.472
𝑎
𝑑+ 73.886𝜌𝑓
a/d >2.5: 𝛽1 = 0.716 + 0.466𝐸𝑓
𝐸𝑠− 0.095
𝑎
𝑑+ 32.101𝜌𝑓
122
5.5 Bending moment capacity (BMC) based on ACI 440
The nominal shear force (kN) was calculated from the nominal moment (kN. m) to
get the ultimate load as follows:
𝑎 =𝐴𝑓𝑓𝑓
0.85𝑓′𝑐𝑏 (mm) 5.25
𝑓𝑓 = √(𝐸𝑓𝜀𝑐𝑢)2
4+
0.85𝛽𝑓′𝑐
𝜌𝑓𝐸𝑓𝜀𝑐𝑢 − 0.5𝐸𝑓𝜀𝑐𝑢 ≤ 𝑓𝑓𝑢 (MPa) 5.26
𝑀𝑛 = 𝐴𝑓𝑓𝑓(𝑑𝑒 −𝑎
2) 5.27
𝑉 =𝑀𝑛
𝑑 (kN) 5.28
𝑃 = 𝑉 ∗ 2 (kN) 5.29
5.6 Comparative analysis
The experimental and the analytical results of the shear strengths of the
specimens tested in this study are given and compared in table 5.1. The analytical
results shown in this table include predicted results from STM, Mihaylov’s proposed
equations, and Jang et al. proposed equations for predicting the shear strengths in
slender and deep beams. For specimens C20-R1-G3 and C20-R1-G4 in group [A]
with a/d ratio of 1.0, the analytical results predicted by the STM, Mihaylov (2016)
and Jang et al. (2009) showed good prediction of the shear strength of these corbel
specimens since the predicted results were very close to the experimental results.
However, the analytical results were conservative for C20-R1-G6.
As for corbel specimens C20-R1.5-G3, C20-R1.5-G4, and C20-R1.5-G6 in
Group [A] with a/d ratio = 1.5, the STM results were not matching the experimental
123
outcome, and this is attributed to bending mode of failure that these specimens
featured while STM predicts failure by crushing of concrete diagonal struts. Results
from other works are agreeing with STM model, therefore, all the analytical shear
results were conservative in comparison with the test results. It was also clearly
depicted in specimens C20-R1.5-G3 and C20-R1.5-G4 that the flexural cracks
penetrated through the compression zone of the corbel beam at the interface of the
column. This possibly made the two specimens fail in bending before crushing of
their diagonal struts. This also can be attributed to the specimen behaving as beams
when the shear span-to-effective depth ratio (a/d) equals to 1.5 and reinforced with
GFRP reinforcement ratios of 3 ρb and 4 ρb. When the GFRP reinforcement ratio was
increased to 6 ρb, a combined failure modes of shear and bending were acting on the
specimen C20-R1.5-G6.0 as shown in figure 4.6 (c). The shear strength results
calculated from bending moment equations in table 5.1 also confirms that specimens
C20-R1.5-G3, C20-R1.5-G4, and C20-R1.5-G6 failed by bending.

124
Table 5.1: Experimental and analytical results
DC = Crushing of the diagonal strut
BM = Failed by bending
SP = Splitting of the diagonal strut
Group a/d Specimens
Experimental
Results Analytical Shear Results (Vn), kN Ratio (Vn / Vexp )
Shear
from
Bending
Moment,
Vn (kN)
Failure
modes Pu (kN) Vu(kN) STM
Mihaylov
(2016)
Jang et. al
(2009) STM
Mihaylov
(2016)
Jang
et. al
(2009)
A
(C20)
1.0
C20-R1-G3 169.5 84.75 76 82.2 83.2 0.90 0.97 0.98 125 DC
C20-R1-G4 183.2 91.6 85 99.0 87.3 0.93 1.08 0.95 142.5 DC
C20-R1-G6 329.6 164.8 96 122.0 100.0 0.58 0.74 0.61 163.5 DC
1.5
C20-R1.5-G3 176.8 88.4 41 48.5 62.7 0.46 0.55 0.71 83.25 BM
C20-R1.5-G4 229.4 114.7 48 58.9 66.8 0.42 0.51 0.58 95 BM
C20-R1.5-G6 252.8 126.4 51 72.5 75.0 0.40 0.57 0.59 108.9 DC / BM
B
(C40)
1.0
C40-R1-G3 255.4 127.7 125 123.7 126.9 0.98 0.97 0.99 227 DC
C40-R1-G4 368.9 184.45 141 150.2 135.8 0.76 0.81 0.74 260.75 DC
C40-R1-G6 309.5 154.75 160 182.7 153.4 1.03 1.18 0.99 300.1 SP
1.5
C40-R1.5-G3 156 78 67 72.6 97.8 0.86 0.93 1.25 151.3 DC
C40-R1.5-G4 235.3 117.65 76 88.5 106.7 0.65 0.75 0.91 173.8 DC
C40-R1.5-G6 151.3 75.65 85 108.6 124.4 1.12 1.44 1.64 200.1 SP
Mean 0.757 0.875 0.912
Median 0.81 0.87 0.93
Standard deviation 0.250 0.277 0.307

125
For specimens with a/d ratio of 1.0 in group [B], the STM, Mihaylov’s
(2016) equation and Jang et al. (2009) equations provided reasonable prediction for
specimens C40-R1-G3 and C40-R1-G4 since the predicted results were all close to
the experimental results and were comparable with each other. For specimen C40-
R1-G6, it was noticed that this specimen featured splitting failure mode due to the
high amount of GFRP reinforcement and due to the concrete compressive strength
(40 MPa), which caused it to fail earlier than C40-R1-G4. In spite of that, the STM
indicated good prediction of the experimental results; while on the other hand,
Mihaylov equations (2016) over-estimated the result of specimen C40-R1-G6.
For specimens with a/d ratio 1.5 in group [B], the results predicted by the
STM and Mihaylov’s equations were in good agreement with the experimental
results for corbel specimens C40-R1-G3 and C40-R1-G4. However, the result
predicted using Jang et al. (2009) equation on specimen C40-R1-G3 was higher than
the experimental result by 25%. Specimen C40-R1.5-G6 featured splitting mode of
failure similar to specimen C40-R1-G6 due to the high amount of GFRP
reinforcement and due to the concrete compressive strength (40 MPa). It was noticed
that Mihaylov (2016) and Jang et al. (2009) equations greatly over-estimated the
experimental results of specimen C40-R1.5-G6, while on the other hand, the STM
result was slightly higher than the experimental results by 12%. The STM predicted
shear strengths of the tested GFRP-reinforced corbel specimens were compared with
analytical results from the literature. The predicted STM shear strengths displayed
comparable values to those in the literature. However, when compared with the
experimental test results, the STMs gave better shear strength predictions for GFRP-
reinforced specimens with concrete C40 and GFRP reinforcement ratio of 6 ρb than
those obtained using other methods from the literature.

126
Chapter 6: Conclusions and Recommendations
6.1 Introduction
The key objective of the current research was to examine the structural
behavior of concrete corbels fully reinforced with FRP bars, to overcome steel-
corrosion problems, and to examine the validity of strut-and-tie modelling for
predicting the capacity of GFRP-reinforced corbels. The shear capacity of double-
sided concrete corbels totally reinforced with internal GFRP bars was investigated in
this study. The research comprised of experimental program and analytical modeling.
The experimental program consisted of testing a total of twelve double-sided corbel
specimens. All specimens were over-reinforced and were divided into two groups
based on their compressive strengths. The first group, Group [A], comprised of six
specimens with concrete compressive strength C20, while the second group, Group
[B], comprised of six specimens as well with concrete compressive strength C40.
Each group was divided into two sub-groups based on their shear span-to-effective
depth ratio (a/d). Shear span-to-effective depth (a/d) ratios of 1.0 and 1.5 were
considered in the study. Each sub-group composed of three specimens with different
longitudinal GFRP reinforcement ratios, 3 ρb, 4 ρb, and 6 ρb, where ρb is the GFRP
balanced reinforcement ratio. The experimental results were analyzed for failure
modes, crack patterns, deflection response, concrete strain response, and GFRP bar
strain responses. Numerical prediction of the shear capacity of each of the tested
corbels was obtained using a proposed strut-and-tie model (STM). The validity of the
proposed STM was evaluated against the experimental results of the specimens
tested in this study and other available analytical methods in the literature. The
outcomes of the study are limited to double-sided concrete corbel over-reinforced
127
completely with longitudinal GFRP bars and having span-to-effective depth ratios of
1.0 and 1.5, GFRP reinforcement ratios of 3 ρb, 4 ρb, and 6 ρb, and concrete
compressive strengths C20 and C40. Main conclusions of this study and
recommendations for future research on the subject are presented herein.
6.2 Conclusions
The experimental and numerical results of this work induce constructing
concrete corbels reinforced totally with internal longitudinal GFRP bars to overcome
problems associated with steel corrosion. The experimental test results and the STM
predictions of the capacity of GFRP-reinforced corbels identified the following
general conclusions:
The development of arching action was confirmed by the formation of the main
parallel diagonal shear cracks, by the crack widths, and by the typical crushing
mode of failure of the concrete in diagonal compression struts formed between the
main diagonal cracks. Substantial reserve capacity was available after the
formation of the main diagonal cracks indicating internal redistribution of the
forces and formation of an arch mechanism.
The tested GFRP-reinforced corbel specimens failed in a brittle manner due to
crushing in concrete in the diagonal compression strut with the exception of five
specimens. Two of the five specimens failed by the flexural crushing of the
concrete at the top of the specimen near the loading. Another two specimens failed
by splitting of the concrete in the diagonal compression strut, and one specimen
showed simultaneous failures by bending crushing at the top of specimen near
loading and crushing of concrete in the diagonal compression strut.
128
Increasing the concrete compressive strength increases the shear strength of tested
specimens with a/d ratio of 1, with the exception of specimens C20-R1-G6 and
C40-R1-G6, and decreases the shear strength for tested specimens with the a/d
ratio of 1.5. This alternating effects of the concrete compressive strength on the
shear strength of the tested specimens is attributed to the change in the failure
modes of the specimens as the concrete compressive strength was increased from
C20 to C40. The experimental shear strengths of specimens C20-R1-G3 (C20) and
C40-R1-G3 (C40), which had the same failure mode of crushing of concrete in the
diagonal strut, are 84.75 kN and 127.7 kN, respectively. This is a 50.7% increase
in the shear strength. Whereas, specimen C40-R1-G6 (had splitting mode of
failure in the diagonal strut and a shear strength of 164.8 kN) exhibited a 6.5 %
decrease in its experimental shear strength compared to that of C20-R1-G6 (failed
in crushing of concrete in the diagonal strut and had a shear strength of 154.75
kN). This decrease in the shear strength when increasing the concrete compressive
strength from C20 to C40 was attributed to the different failure modes that these
two specimens showed. However, more tests are needed for confirming this
conclusion.
Increasing the GFRP reinforcement ratio increased the shear strengths of the
specimens in Groups [A] and [B] except specimens C40-R1-G6 and C40-R1.5-
G6. These two specimens exhibited splitting failure mode while all other
specimens of both groups exhibited concrete crushing failure mode in the strut
and/or flexural crushing of the concrete at the top of the specimens near the
loading. Increasing the GFRP reinforcement from 3 ρb to 4 ρb, from 4 ρb to 6 ρb,
and from 3 ρb to 6 ρb in Group [A] for a/d =1.0 increased the shear strength of the
tested specimens by 8%, 80%, and 94.3%, respectively. For a/d=1.5, increasing
129
the GFRP reinforcement ratio 3 ρb to 4 ρb, from 4 ρb to 6 ρb, and from 3 ρb to 6 ρb
increased the shear strength of the tested specimens by 29.8%, 10.2%, and 43%,
respectively. For Group [B], specimens with a/d =1.0 showed a 44.4% and 21.2%
increase in the shear strength of the tested specimens when the GFRP
reinforcement ratio was increased from 3 ρb to 4 ρb and from 3 ρb to 6 ρb,
respectively. However, when increasing the GFRP reinforcement from 4 ρb to 6 ρb
the shear strength of the specimen decreased by 16%. This was due to the splitting
failure mode that occurred in the specimen with concrete compressive strength
C40 and GFRP reinforcement ratio equals to 6 ρb, C40-R1-G6. Same pattern was
observed in Group [B] specimens with a/d = 1.5.
The shear strength of Group [B] specimens was highly dependent on the a/d ratio
where the shear strength increased as the a/d ratio decreased while all other
variables were held constant. For Group [A] specimens, only specimens with
GFRP reinforcement ratio of 6 ρb showed an increase in the shear strength as the
a/d ratio decreased, while the other specimens showed a decrease in the shear
strength because the specimens did not have the same failure modes as the a/d
ratio decreased.
Even though the recommended version of the Canadian Code CSA-S806-12 STM
predicted failure by diagonal strut crushing, tested specimens with concrete C20
and a/d = 1.5 experienced flexural crushing of the concrete while specimens with
concrete C40 and GFRP reinforcement ratio of 6 ρb experienced concrete splitting
failure in the diagonal strut.
Applying the STM in accordance with CSA-S806-12 provided overestimated
predictions of the shear capacity of the FRP-reinforced corbel specimens C40-R1-
G6 and C40-R1.5-G6 by 3.4% and 12.3%, respectively, more than the
130
corresponding experimentally obtained results. A factor of safety would be
recommended when utilizing the STM to predict the shear strength of GFRP-
reinforced corbels with reinforcement ratio of 6 ρb and concrete C40. Whereas,
conservative predictions of the shear capacity of the rest of specimens were
estimated by the STM.
The STM predicted shear strengths of the tested GFRP-reinforced corbel
specimens were compared with analytical results from the literature. The
predicted STM shear strengths displayed comparable values to those in the
literature. However, when compared with the experimental test results, the STMs
gave better shear strength predictions for GFRP-reinforced specimens with
concrete C40 and GFRP reinforcement ratio of 6 ρb than those obtained from the
literature.
It is recommended to use web reinforcement to control the cracks of the GFRP-
reinforced corbels.
6.3 Recommendations
Results of the current study can be considered a promising step towards
implementing GFRP bars as the only reinforcement in disturbed regions. However,
further research is required to allow the adoption of the STM technique to GFRP
reinforced concrete members. The following are recommendations for future studies:
Additional investigation of GFRP-reinforced corbels constructed with high
strength concrete is essential to determine the suitability of STM to such
members.
Finite element analysis of the specimens is required to further study the behavior
of the totally GFRP-reinforced corbels. Validated finite element models would
131
allow for further parametric studies of the variables that affect the member
strengths.
The STM techniques was employed to predict the capacity of GFRP-reinforced
corbel specimens. It is not known, however, whether the STM is applicable for
more complex disturbed regions with total GFRP reinforcement. Therefore, it is
recommended to examine the applicability of STM for more complex GFRP-
reinforced members.
Additional laboratory testing on large scale specimens are required to validate the
use of STM for totally GFRP reinforced members.
Further research is required to examine the behavior of totally GFRP reinforced
members subjected to reversed cyclic loading to ensure adequate design GFRP-
reinforced corbels located in seismic zones.
In the current study, specimens having concrete C20 and a/d = 1.5 experienced
flexural crushing of the concrete even though the STM technique predicts failure
by diagonal strut crushing. Laboratory tests of additional specimens with a/d
ratios between 1.0 and 1.5 are required for further validation of the STM at in the
analysis of GFRP reinforced members. Similarly, specimens having concrete C40,
GFRP reinforcement ratio of 6 ρb, and a/d = 1.0 and 1.5 experienced concrete
splitting failure, unlike the prediction of the STM. Likewise, laboratory tests of
additional specimens with a/d ratios between 1.0 and 1.5 are required for further
validation of the STM at in the analysis of GFRP reinforced members.
The size effect on the behavior of GFRP-reinforced concrete corbels should be
examined.
Additional investigation of different corbel shapes, such as haunched webs and
single sided, with internal FRP bars are also recommended for future studies.

132
References
Abed, F., El-Chabib, H., & AlHamaydeh, M. (2012). Shear characteristics of GFRP-
reinforced concrete deep beams without web reinforcement. Journal of
Reinforced Plastics and Composites, 31(16), 1063-1073.
ACI Committee 440 (2015). Guide for the Design and Construction of Structural
Concrete Reinforced with Fiber Reinforced Polymer (FRP) Bars, (ACI 440.
1R-15). American Concrete Institute, USA.
Alam, M. S., & Hussein, A. (2011). Experimental investigation on the effect of
longitudinal reinforcement on shear strength of fibre reinforced polymer
reinforced concrete beams. Canadian Journal of Civil Engineering, 38(3),
243-251.
Alam, M. S., & Hussein, A. (2012). Effect of member depth on shear strength of
high-strength fiber-reinforced polymer–reinforced concrete beams. Journal of
Composites for Construction, 16(2), 119-126.
Alam, M. S., & Hussein, A. (2012). Effect of member depth on shear strength of
high-strength fiber-reinforced polymer–reinforced concrete beams.Journal of
Composites for Construction, 16(2), 119-126.
Alam, M. S., & Hussein, A. (2013). Size effect on shear strength of FRP reinforced
concrete beams without stirrups. Journal of Composites for
Construction, 17(4), 507-516.
Alkhrdaji, T., Wideman, M., Belarbi, A., & Nanni, A. (2001, October). Shear
strength of GFRP RC beams and slabs. In Proceedings of the international
conference, composites in construction-CCC (pp. 409-414).
Ashour, A. F. (2006). Flexural and shear capacities of concrete beams reinforced
with GFRP bars. Construction and Building Materials, 20(10), 1005-1015.
Ashour, A. F., & Kara, I. F. (2014). Size effect on shear strength of FRP reinforced
concrete beams. Composites Part B: Engineering, 60, 612-620.
Bentz, E. C., Massam, L., & Collins, M. P. (2010). Shear strength of large concrete
members with FRP reinforcement. Journal of Composites for Construction.
Canadian Standards Association (CSA). (2012). “Design and construction of
building components with fiber-reinforced polymers.” CAN/CSA S806,
Mississauga, ON, Canada.
133
Carbon fiber rebar. (2016, August 22), Retrieved from
https://carbonfiber360.en.alibaba.com/product/1412827900-
213822296/carbon_fiber_rebar_concrete_carbon_fiber_reinforcement.html
El Refai, A., & Abed, F. (2015). Concrete Contribution to Shear Strength of Beams
Reinforced with Basalt Fiber-Reinforced Bars. Journal of Composites for
Construction, 04015082.
El-Maaddawy, T. A., & Sherif, E. S. I. (2013). Response of Concrete Corbels
Reinforced with Internal Steel Rebars and External Composite Sheets:
Experimental Testing and Finite Element Modeling. Journal of Composites
for Construction, 18(1), 04013020.
El-Sayed, A. K., El-Salakawy, E. F., & Benmokrane, B. (2006 a). Shear capacity of
high-strength concrete beams reinforced with FRP bars. ACI Structural
Journal, 103(3), 383.
El-Sayed, A. K., El-Salakawy, E. F., & Benmokrane, B. (2006 b). Shear strength of
FRP-reinforced concrete beams without transverse reinforcement. ACI
Structural Journal, 103(2), 235.
El-Sayed, A. K., El-Salakawy, E. F., & Benmokrane, B. (2012). Shear strength of
fibre-reinforced polymer reinforced concrete deep beams without web
reinforcement. Canadian Journal of Civil Engineering, 39(5), 546-555.
Farghaly, A. S., & Benmokrane, B. (2013). Shear behavior of FRP-reinforced
concrete deep beams without web reinforcement. Journal of Composites for
Construction.
FRP Rebar advantages, (2016, August 22), Retrieved from
http://www.csktechnologies.com/frp-rebars-1110280.html
FRP Rebar disadvantages, (2016, August 22), Retrieved from
http://www.virginiadot.org/business/resources/bridge15internalfrpreinforcem
ent.pdf
FRP Rebars, (2016, August 23), Retrieved from
http://www.sefindia.org/forum/viewtopic.php?p=66821
Guadagnini, M., Pilakoutas, K., & Waldron, P. (2006). Shear resistance of FRP RC
beams: experimental study. Journal of composites for construction,10(6),
464-473.
Guide, B. P. (2011). Maintaining a State of Good Repair Using Cost Effective
Investment Strategies. Report FHWA-HIF-11-042. FHWA, US Department
of Transportation.
134
Hengshui Huiyoufang FRP Products Trade Co., Ltd. (2016, August 22), Retrieved
fromhttp://kr.made-in-china.com/co_ysm8685/product_FRP-
Rebar_esuiigrgy.html
Issa, M. A., Ovitigala, T., & Ibrahim, M. (2015). Shear Behavior of Basalt Fiber
Reinforced Concrete Beams with and without Basalt FRP Stirrups.Journal of
Composites for Construction, 04015083.
Jang, H., Kim, M., Cho, J., and Kim, C. (2009). Concrete shear strength of beams
reinforced with FRP bars according to flexural ratio and shear span to depth
ratio. FRPRCS-9, Sidney, Australia
Mahmoud, K., & El-Salakawy, E. (2015). Effect of Transverse Reinforcement Ratio
on the Shear Strength of GFRP-RC Continuous Beams. Journal of
Composites for Construction, 04015023.
Mahmoud, K., & El-Salakawy, E. (2016). Size Effect on Shear Strength of Glass
Fiber-Reinforced Polymer-Reinforced Concrete Continuous Beams.ACI
Structural Journal, 113(1), 125.
Matta, F., El-Sayed, A. K., Nanni, A., & Benmokrane, B. (2013). Size effect on
concrete shear strength in beams reinforced with fiber-reinforced polymer
bars. ACI Structural Journal, 110(4), 617.
Mihaylov, B. I. (2016). Two-Parameter Kinematic Approach for Shear Strength of
Deep Concrete Beams with Internal FRP Reinforcement. Journal of
Composites for Construction, 04016094.
Nilson, A.H. (2010). Design of concrete Structures, Fourteenth Edition In SI Units.
New York, NY: McGraw Hill.
Omeman, Z., Nehdi, M., & El-Chabib, H. (2008). Experimental study on shear
behavior of carbon-fiber-reinforced polymer reinforced concrete short beams
without web reinforcement. Canadian Journal of Civil Engineering,35(1), 1-
10.
Power Bar, (2016, August 22), Retrieved from
http://www.gentleglory.com/uFiles/files/084983.pdf
Precast Concrete Connections. (2015, October 31), Retrieved from
http://www.peikko.ae/product-category
ae/cat=Precast%20Concrete%20Connections
Ramadass, S., & Thomas, J. (2011). Flexure-shear analysis of concrete beam
reinforced with GFRP bars. In Advances in FRP Composites in Civil
Engineering (pp. 321-324). Springer Berlin Heidelberg.

135
Razaqpur, A. G., Isgor, B. O., Greenaway, S., & Selley, A. (2004). Concrete
contribution to the shear resistance of fiber reinforced polymer reinforced
concrete members. Journal of Composites for Construction, 8(5), 452-460.
Sagüés, A. A. (2001). I metallurgical effects on chloride ion corrosion threshold of
steel in concrete.
Schlaich, J., Schaefer, K., and Jennewein, M. “Towards a Consistent Design of
Structural Concrete.” PCI Journal. V. 32, No. 3, May-June, 1987, pp 74-150.
The American Made Basalt Rebar - (BFRP) Concrete Reinforcement, (2016, August
22), Retrieved from http://fiberglassrebar.us/basalt-rebar/
Tomlinson, D., & Fam, A. (2014). Performance of concrete beams reinforced with
basalt FRP for flexure and shear. Journal of Composites for
Construction, 19(2), 04014036.
Transportation Research Broad (1991). Highway Deicing: Comparing salt and
Calcium Magnesium Acetate, special report 235, National Research Council,
Washington, DC.
Tureyen, A. K., & Frosch, R. J. (2002). Shear tests of FRP-reinforced concrete
beams without stirrups. ACI Structural Journal, 99(4).
Walton, S., & Bradberry, T. (2005). Feasibility of a concrete pavement continuously
reinforced by glass fibre reinforced polymer bars. In Proceedings, third
international conference on construction materials.
Wegian, F. M., & Abdalla, H. A. (2005). Shear capacity of concrete beams
reinforced with fiber reinforced polymers. Composite Structures, 71(1), 130-
138.
Zeidan, M., Barakat, M. A., Mahmoud, Z., & Khalifa, A. (2011). Evaluation of
concrete shear strength for FRP reinforced beams. In Structures Congress(pp.
1816-1826).
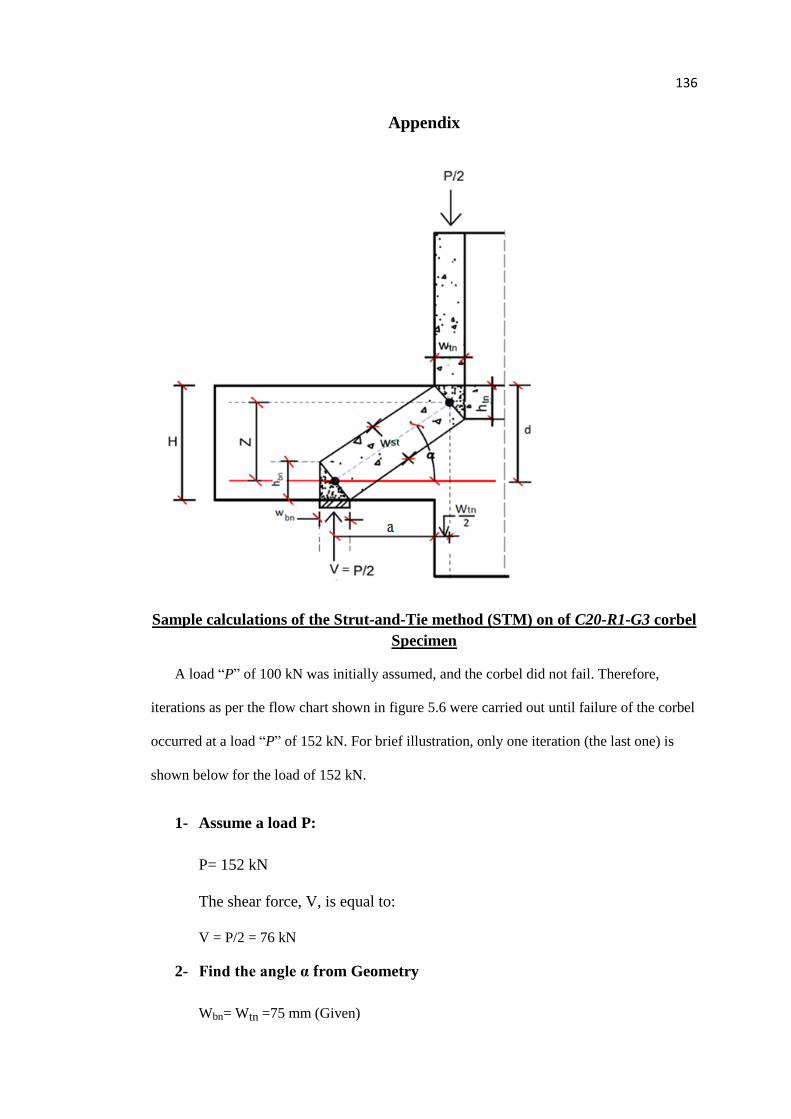
136
Appendix
Sample calculations of the Strut-and-Tie method (STM) on of C20-R1-G3 corbel
Specimen
A load “P” of 100 kN was initially assumed, and the corbel did not fail. Therefore,
iterations as per the flow chart shown in figure 5.6 were carried out until failure of the corbel
occurred at a load “P” of 152 kN. For brief illustration, only one iteration (the last one) is
shown below for the load of 152 kN.
1- Assume a load P:
P= 152 kN
The shear force, V, is equal to:
V = P/2 = 76 kN
2- Find the angle α from Geometry
Wbn= Wtn =75 mm (Given)
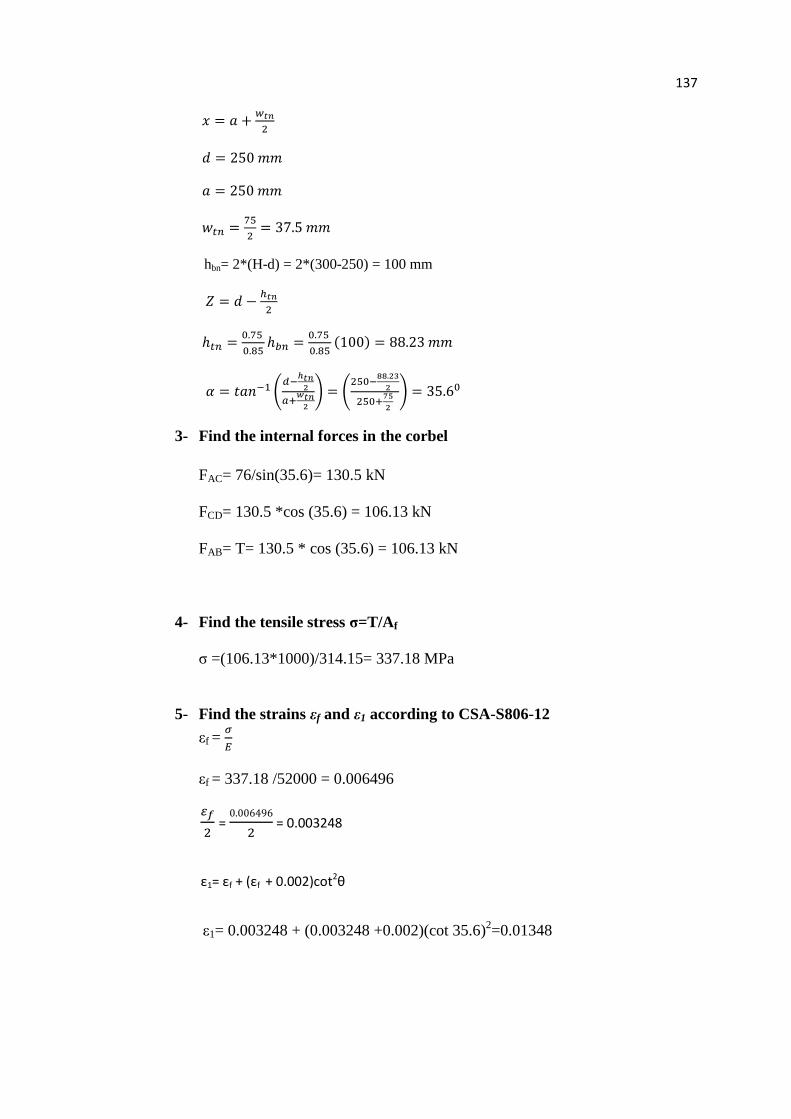
137
𝑥 = 𝑎 +𝑤𝑡𝑛
2
𝑑 = 250 𝑚𝑚
𝑎 = 250 𝑚𝑚
𝑤𝑡𝑛 =75
2= 37.5 𝑚𝑚
hbn= 2*(H-d) = 2*(300-250) = 100 mm
𝑍 = 𝑑 −ℎ𝑡𝑛
2
ℎ𝑡𝑛 =0.75
0.85ℎ𝑏𝑛 =
0.75
0.85(100) = 88.23 𝑚𝑚
𝛼 = 𝑡𝑎𝑛−1 (𝑑−
ℎ𝑡𝑛2
𝑎+𝑤𝑡𝑛
2
) = (250−
88.23
2
250+75
2
) = 35.60
3- Find the internal forces in the corbel
FAC= 76/sin(35.6)= 130.5 kN
FCD= 130.5 *cos (35.6) = 106.13 kN
FAB= T= 130.5 * cos (35.6) = 106.13 kN
4- Find the tensile stress σ=T/Af
σ =(106.13*1000)/314.15= 337.18 MPa
5- Find the strains εf and ε1 according to CSA-S806-12
εf = 𝜎
𝐸
εf = 337.18 /52000 = 0.006496
𝜀𝑓
2 =
0.006496
2 = 0.003248
ε1= εf + (εf + 0.002)cot2θ
ε1= 0.003248 + (0.003248 +0.002)(cot 35.6)2=0.01348
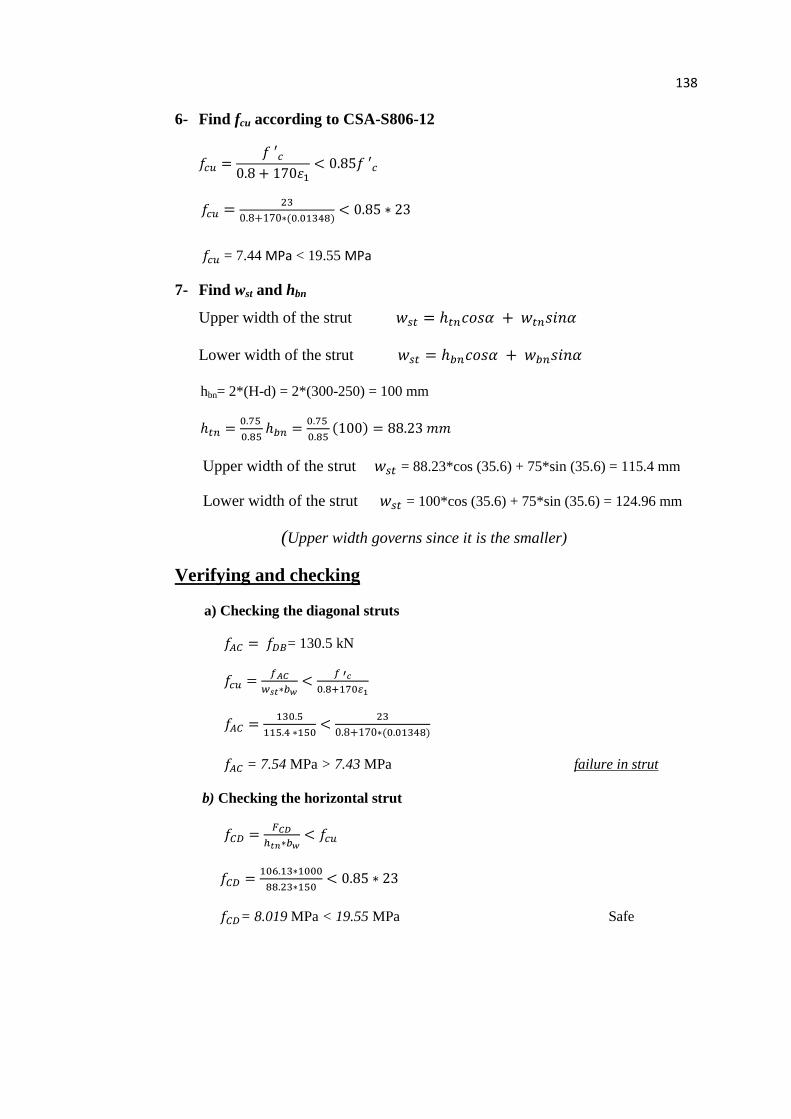
138
6- Find fcu according to CSA-S806-12
𝑓𝑐𝑢 =𝑓 ′𝑐
0.8 + 170𝜀1< 0.85𝑓 ′𝑐
𝑓𝑐𝑢 =23
0.8+170∗(0.01348)< 0.85 ∗ 23
𝑓𝑐𝑢 = 7.44 MPa < 19.55 MPa
7- Find wst and hbn
Upper width of the strut 𝑤𝑠𝑡 = ℎ𝑡𝑛𝑐𝑜𝑠𝛼 + 𝑤𝑡𝑛𝑠𝑖𝑛𝛼
Lower width of the strut 𝑤𝑠𝑡 = ℎ𝑏𝑛𝑐𝑜𝑠𝛼 + 𝑤𝑏𝑛𝑠𝑖𝑛𝛼
hbn= 2*(H-d) = 2*(300-250) = 100 mm
ℎ𝑡𝑛 =0.75
0.85ℎ𝑏𝑛 =
0.75
0.85(100) = 88.23 𝑚𝑚
Upper width of the strut 𝑤𝑠𝑡 = 88.23*cos (35.6) + 75*sin (35.6) = 115.4 mm
Lower width of the strut 𝑤𝑠𝑡 = 100*cos (35.6) + 75*sin (35.6) = 124.96 mm
(Upper width governs since it is the smaller)
Verifying and checking
a) Checking the diagonal struts
𝑓𝐴𝐶 = 𝑓𝐷𝐵= 130.5 kN
𝑓𝑐𝑢 =𝑓𝐴𝐶
𝑤𝑠𝑡∗𝑏𝑤<
𝑓 ′𝑐
0.8+170𝜀1
𝑓𝐴𝐶 =130.5
115.4 ∗150<
23
0.8+170∗(0.01348)
𝑓𝐴𝐶 = 7.54 MPa > 7.43 MPa failure in strut
b) Checking the horizontal strut
𝑓𝐶𝐷 =𝐹𝐶𝐷
ℎ𝑡𝑛∗𝑏𝑤< 𝑓𝑐𝑢
𝑓𝐶𝐷 =106.13∗1000
88.23∗150< 0.85 ∗ 23
𝑓𝐶𝐷= 8.019 MPa < 19.55 MPa Safe

139
c) Checking ties
Tall=(ffu*Af ) > T applied
Tall=(1065*314.15 ) / 1000 > T applied
Tall=334.6 kN > 106.13 kN
Safe
d) Checking top bearing nodes
𝜎 =𝑃
𝐴< (0.85 ∗ 𝑓 ′
𝑐)
𝜎 =76∗1000
150∗75< (0.85 ∗ 23)
𝜎 = 6.76 MPa < 19.55 MPa Safe
e) Checking the bottom bearing node
𝜎 =𝑃
𝐴< (0.85 ∗ 𝑓 ′
𝑐)
𝜎 =76∗1000
75∗150< (0.85 ∗ 23)
𝜎 = 6.76 MPa < 19.55 MPa Safe
f ) Checking nodes from anchorage ties
𝜎 =106.13∗1000
100∗150< (0.75 ∗ 23)
𝜎 = 7.075 MPa < 17.25 MPa Safe
The calculation sample above shows that the failure was by crushing of concrete in
the diagonal strut based on the Canadian CSA-S806-12 STM. All other specimens
analyzed by the STM showed failure by crushing of the concrete in their diagonal
struts.