
A two-sided matching decision model for supply and demand ...
20
University of Windsor University of Windsor Scholarship at UWindsor Scholarship at UWindsor Odette School of Business Publications Odette School of Business 2017 A two-sided matching decision model for supply and demand of A two-sided matching decision model for supply and demand of technological knowledge technological knowledge Yong Liu Jiangnan University Kevin Li University of Windsor Follow this and additional works at: https://scholar.uwindsor.ca/odettepub Part of the Business Commons Recommended Citation Recommended Citation Liu, Yong and Li, Kevin. (2017). A two-sided matching decision model for supply and demand of technological knowledge. Journal of Knowledge Management, 21 (3), 592-606. https://scholar.uwindsor.ca/odettepub/138 This Article is brought to you for free and open access by the Odette School of Business at Scholarship at UWindsor. It has been accepted for inclusion in Odette School of Business Publications by an authorized administrator of Scholarship at UWindsor. For more information, please contact [email protected].
-
Upload
khangminh22 -
Category
Documents
-
view
0 -
download
0
Transcript of A two-sided matching decision model for supply and demand ...

University of Windsor University of Windsor
Scholarship at UWindsor Scholarship at UWindsor
Odette School of Business Publications Odette School of Business
2017
A two-sided matching decision model for supply and demand of A two-sided matching decision model for supply and demand of
technological knowledge technological knowledge
Yong Liu Jiangnan University
Kevin Li University of Windsor
Follow this and additional works at: https://scholar.uwindsor.ca/odettepub
Part of the Business Commons
Recommended Citation Recommended Citation Liu, Yong and Li, Kevin. (2017). A two-sided matching decision model for supply and demand of technological knowledge. Journal of Knowledge Management, 21 (3), 592-606. https://scholar.uwindsor.ca/odettepub/138
This Article is brought to you for free and open access by the Odette School of Business at Scholarship at UWindsor. It has been accepted for inclusion in Odette School of Business Publications by an authorized administrator of Scholarship at UWindsor. For more information, please contact [email protected].

1
A two-sided matching decision method for supply and
demand of technological knowledge
Yong Liu
School of Business, Jiangnan University
Wuxi, Jiangsu 214122, China
Kevin W. Li*
College of Economics and Management, Fuzhou University
Fuzhou, Fujian 350116, China
and
Odette School of Business, University of Windsor
401 Sunset Ave., Windsor, Ontario, N9B 3P4, Canada
Email: [email protected]
Acknowledgments:
This work is partially funded by the National Natural Science Foundation of
China (71503103, 71572040), Natural Science Foundation of Jiangsu Province
(BK20150157); Social Science Foundation of Jiangsu Province (14GLC008); the
Fundamental Research Funds for the Central Universities (2015JDZD04), and a
Natural Sciences and Engineering Research Council of Canada (NSERC) Discovery
Grant.
_____________________
* Corresponding author. Telephone: 1 (519) 253-3000 ext 3456. Email:
kevin
Typewritten Text
Journal of Knowledge Management, 21(3), 592-606, 2017.

2
A two-sided matching decision method for supply and demand of technological
knowledge
Abstract:
Purpose – The purpose is to propose a novel prospect-based two-sided matching decision model
for matching supply and demand of technological knowledge assisted by a broker. This model
enables the analyst to account for the stakeholders’ psychological behaviours and their impact on
the matching decision in an open innovation setting.
Design/methodology/approach – The prospect theory and grey relational analysis are employed
to develop the proposed two-sided matching decision framework.
Findings – By properly calibrating model parameters, the case study demonstrates that the
proposed approach can be applied to real-world technological knowledge trading in a market for
technology (MFT) and yields matching results that are more consistent with the reality.
Research limitation/implications – The proposed model does not differentiate the types of
knowledge exchanged (established vs. novel, tacit vs. codified, general vs specialized) [Ardito et
al. 2016, Nielsen and Nielsen 2009]. Moreover, the model focuses on incorporating psychological
behaviour of the MFT participants and does not consider their other characteristics.
Practical implications – The proposed model can be applied to achieve a better matching
between technological knowledge suppliers and users in a broker-assisted MFT.
Social implications – A better matching between technological knowledge suppliers and users can
enhance the success of open innovation, thereby contributing to the betterment of the society.
Originality/value – This paper furnishes a novel theoretical model for matching supply and
demand in a broker-assisted MFT. Methodologically, the proposed model can effectively capture
market participants’ psychological considerations.
Keywords – Open innovation, Market for technology, Two-sided matching, Grey relational
analysis, Prospect theory
Paper type – Research paper
1 Introduction
In the current competitive environment, enterprises face increasing pressure to produce
innovative products and respond to customer needs and market demand expeditiously [Ivascu,
Cirjaliu, Draghici, 2016]. Nowadays, it becomes increasingly difficult for a firm to purely rely on
in-house talents for product innovation. Instead, a more efficient and convenient way is to meet
the challenge by open innovation, trading in or out technological knowledge in the market. It is
observed that open innovation and effective and expeditious transfer of technological knowledge
often result in significant economic benefit [Petruzzelli et al., 2015]. As such, more and more
enterprises count on open innovation for enhancing profitability and securing competitive
advantages [Chesbrough, 2003; Cheng & Huizingh, 2014].
A common form of open innovation is to trade technological knowledge such as patents from
markets for technology (MFTs) [Petruzzelli et al., 2015; Hansen et al., 1999]. In MFTs,
universities and research institutes are key creators or suppliers of technological knowledge, and
enterprises are potential users and adopters [Arora et al. 2014; Arora et al. 2001a, b; Arora and
Gambardella 2010]. In this market, suppliers select appropriate users as per expected benefits as a

3
result of knowledge transfer, while users often acquire technological knowledge based on their
specific needs [Gielen et al., 2003], prior ties with suppliers as well as technological knowledge
characteristics [Petruzzelli, 2011; Capaldo et al., 2016]. Success of open innovation depends on
how well enterprises collaborate with suppliers [Enkel et al. 2009; Ivascu, Cirjaliu, Draghici,
2016]. To expedite knowledge transfer and promote open innovation, governments can create
polices and regulations to reduce barriers between suppliers and users of technological knowledge
[Maas et al., 2016; Dulipovici et al., 2016; Girard, 2015]. To implement these policies, public or
private brokers are often formed to facilitate technological knowledge exchange between suppliers
and users in the MFT [Hoppe and Ozdenoren, 2005]. By providing value-added service, brokers
can also obtain some benefit. Given that finding appropriate suppliers and users in the MFT can be
conveniently structured as a typical two-sided matching problem [Gale and Shapley, 1962; Roth,
1985], this article proposes a novel decision model for matching supply and demand of
technological knowledge in a broker-assisted MFT.
2 Technological knowledge exchange under the open innovation paradigm
Technological knowledge such as patents is often a crucial asset for a firm [Petruzzelli et al.,
2015; Hansen et al., 1999]. Rapid pace of technology advancement makes it difficult for any firm
to achieve self-sufficiency in R&D, technological knowledge exchange has become a much more
effective and efficient way for suppliers and users to collaborate in R&D and implement open
innovation.
In order to handle technological knowledge exchange problems, Arora et al. [2001a, b]
proposed the concept of MFTs. Subsequently, more and more research has been carried out on this
topic and some useful results have been obtained. For example, by surveying recent research on
MFTs, Arora and Gambardella [2010] analyzed the supply and demand of technology, examined
what factors affect MFT formation and growth, and explored the dynamic interactions between
industry structure and MFTs [Arora et al. 2014]. In contrast to the traditional focus on either
external technology acquisition or exploitation, Lichtenthaler and Ernst [2007] and Lichtenthaler
[2008] took an integrative view to investigate a firm’s inward and outward technology transfers
and treated them as the key dimensions of the firm’s strategic approaches to open innovation.
Natalicchio et al. [2014] reviewed recent literature on markets for ideas (MFIs) arising from the
open innovation paradigm and furnished an overview of MFIs from three aspects: ideas,
knowledge owners, and knowledge seekers. Messeni Petruzzelli et al. [2015] investigated what
affected biotechnological firms’ patent acquisition by examining four main characteristics of the
patent.
From a matching point of view, some scholars utilized game theory and decision models to
deal with technological knowledge exchange. For instance, in the context of demand-driven
production chains in the Dutch agricultural sector, Klerkx and Leeuwis [2008] discussed the
contributions of innovation intermediaries to matching supply and demand of agricultural
knowledge and challenges that they face in their functioning. Hoppe and Ozdenoren [2005]
presented a game theoretic framework to analyze the function of a single intermediary and
competing intermediaries in matching supply and demand of new inventions. Chen et al. [2010]
put forward a two-stage decision analysis method for handling two-sided matching of
technological knowledge supply and demand. While the aforesaid methods are important tools to

4
handle technological knowledge exchange under the open innovation paradigm, they ignored the
impact of the stakeholders’ psychological behaviours on the matching of technological knowledge
supply and demand. This omission often leads to matching results that are inconsistent with what
happens in reality. This inconsistency is due to the fact that stakeholders (suppliers, users, and
brokers) typically have bounded rationality and the success of a matching pair is often affected by
perceptions and considerations that are psychological rather than economic in MFTs [Erel, 2004].
This article attempts to introduce a novel two-sided matching decision model for unbalanced
numbers of suppliers and users assisted by a single intermediary or broker. The prospect theory
proposed in [Kahneman and Tversky, 1979; Tversky and Kahneman, 1992] is employed to
characterize stakeholders’ psychological considerations and their impact on the matching decision.
The grey relational analysis [Liu and Lin, 2011] is then applied to derive positive and negative
correlation coefficients, thereby obtaining final prospect values for different stakeholders.
Optimization models are subsequently constructed to find optimal matching of suppliers and users
in terms of prospect values.
The remainder of this paper is organized as follows: The basic model is presented for
two-sided matching of technological knowledge supply and demand in Section 3. Section 4
proposes a novel framework for two-sided matching of suppliers and users in a broker-assisted
MFT by considering stakeholders’ psychological behaviours. A real-world open innovation case
study is furnished in Section 5 to illustrate how the proposed method can be applied. The paper is
concluded with some remarks in Section 6.
3 A framework for two-sided matching of technological knowledge exchange
In a MFT, three parties are often involved: suppliers, users, and an independent intermediary
or broker. Suppliers of technological knowledge are usually universities or research institutions
who own patents and other technological knowledge. Users stand for entrepreneurs, investors, or
firms who are interested in commercializing technological knowledge for perceived benefits. An
intermediary or broker is a service organization that assists in matching supply with demand of
technological knowledge based on the information provided by the two parties and charges
commissions for successful matching. In the matching process, suppliers and users first submit to
the broker relevant information on their needs and requirements, the broker then conducts
necessary decision analysis to choose potential matching pairs in the pools. The broker aims for
best matching results by maximizing its own expected profit as well as meeting the needs and
requirements of the suppliers and users to the greatest possible extent. In order to characterize
their interactions, a two-sided matching method is proposed below.
Assume that the supplier and user sets in the matching problem are denoted by
1,..., ,...,i nS S S S= and 1,..., ,...,j mD D D D= , ( 1,2,..., )iS i n= and ( 1,2,jD j = ..., )m ,
respectively, stands for the thi supplier and the
thj user of technological knowledge. Suppliers
and users often assess their potential matching partners against multiple criteria.
Assume that 1,...., ,...,k pA A A A= is the suppliers’ criterion set to evaluate potential
users. ijka ( 1,2,..., , 1, 2,..., , 1, 2,..., )i n j m k p= = = denotes Si’s evaluation value for user Dj as

5
per criterion Ak and ( 1,2,..., ,kw k p= 0kw ,1
1)p
k
k
w=
= represents the weight of criterion kA .
Then iS ’s overall assessment value of jD is obtained as
1
p
ij ijk k
k
a a w=
= (1)
Let 1,..., ,...,s qB B B B= be the users’ criterion set to assess suppliers, ijsb (i = 1, 2, …,
n; j = 1, 2, …, m, and s = 1, 2, …, q) be Dj’s evaluation value of supplier iS with respect to the
index sB , and 1
( 1,2,..., , 0, 1)q
s s s
s
s q =
= = be the weight of criterion sB . Then Dj’s
overall evaluation value of iS is derived as
1
q
ij ijs s
s
b b =
= (2)
Brokers commonly exist in the knowledge service industry. A broker often has better access
to the pools on both supply and demand sides and is thus able to achieve more efficient matching
between technological knowledge suppliers and users. By providing this service, a broker
typically collects a commission based on the realized satisfaction for the traders in a successful
matching pair. For a single broker in our model, let ijr stand for the broker’s commission for the
matching pair iS and jD .
In the context of technological knowledge exchange, a particular patent can often be licensed
to at most one user. In this case, a proper constraint should be imposed on the suppliers of
technological knowledge. On the other hand, due to high cost of licensing and limited resources, a
user typically has an upper limit on the number of technology transfers that it can accept. Based on
these considerations, a generic framework can be set up below for matching supply and demand of
technological knowledge.
Definition 1 Assume that : S D → is a matching rule. For iS S , jD D , if
( )i jS D = , then and ( , )i jS D are, respectively, called two-sided matching and a
matching pair of supply and demand of technological knowledge.
( )i jS D = represents two-sided matching of iS and jD under . Presumably, this
matching rule reflects the evaluation values of Si on Dj, Dj on Si, the commission of the broker as
well as any practical constraints on the number of technology transfers that a user can accept and
the number of users to which a supplier can sell its technological knowledge. If ( )i iS S = and

6
( )j jD D = , no matching is achieved for iS or jD under . It is apparent that if ( , )i jS D
is a matching pair under , then ( , )j iD S is also a matching pair under .
4 A two-sided matching decision model for technological knowledge exchange with
psychological considerations
The aforesaid generic framework takes stakeholders’ original evaluation values as basic
decision input in identifying appropriate matching pairs. This treatment implicitly assumes that the
decision-makers (DMs) are perfectly rational and the matching is conducted based on the best
aggregate evaluation score. However, stakeholders often consider other factors such as prior ties
and geographical distance [Petrizzelli, 2011]. In addition, stakeholders typically possess bounded
rationality and their matching decision behaviour is often affected by psychological other than
economic considerations. As such, when a matching decision is considered, raw evaluation values
certainly matter, but psychological assessments of the differences between a stakeholder’s raw
evaluation and expectation often play a critical role in the decision process. Depending on a DM’s
risk attitude, decision results under psychological influence can be quite different from what are
obtained from the expected utility theory under complete rationality.
Kahneman and Tversky [1979] and Tversky and Kahneman [1992] conceived decision
making as a two-stage process. The first stage establishes a reference point for evaluating potential
decision outcomes. When a decision outcome is better than the reference point, it would be
regarded as a “gain”; when a decision outcome is worse than the reference point, it would be
referred to as a “loss”. After recoding the decision outcomes as gains or losses, prospects can be
extracted by performing segregation, cancellation, and other operations. The second stage assesses
the prospects based on a value function that measures changes in welfare relative to the reference
point rather than the absolute magnitude of the final states [Kahneman and Tversky, 1979;
Tversky and Kahneman, 1992]. By employing the prospect theory to account for psychological
influences and expected values (prospect values) of suppliers, users, and the broker on
technological knowledge matching decision, this section proposes a novel framework for
two-sided matching of suppliers and users in a broker-assisted MFT. This method starts with
constructing prospect value matrices for the stakeholders.
4.1 Construction of prospect value matrices
Many statistical methods, such as regression analysis and principal-component analysis, are
commonly used in analyzing system behaviour. These methods typically require a large amount of
data following certain probability distributions. But in reality, many applications have limited
historical data, making it difficult to apply these methods. For instance, in the two-sided matching
decision considered here, due to the unique feature of technology innovation, it is often the case
that limited data are available for the stakeholders to make the final choice. To properly handle
this type of small sample data problems, the grey relational analysis can be a handy tool as it is
applicable to cases of various sample sizes and different distributions. The fundamental idea of
grey relational analysis is that the closeness of a relationship is judged by the similarity level of

7
the geometric patterns of sequence curves. The more similar the curves, the higher the degree of
incidence between sequences, and vice versa [Liu and Lin, 2011]. Given that suppliers, users, and
the broker typically have limited historical data, the grey relational analysis is employed here to
obtain their prospect values for making the matching decision.
First, we consider the suppliers.
4.1.1 The prospect value matrix for the suppliers
After identifying positive and negative ideal users, we will employ the grey relational
analysis to obtain suppliers’ positive and negative prospect values for users.
Definition 2 Assume that
11 1 1
1
1
,...., ,...,
= ,...., ,...,
,...., ,...,
j m
i ij im
n nj nm
a a a
A a a a
a a a
is the evaluation matrix of suppliers on
users, if
1( ) max( ) max( ,..., ,..., )j ij j ij nji
a a a a a+ = = (3)
1( ) min( ) min( ,..., ,..., )j ij j ij nji
a a a a a− = = (4)
Then ( )0 1 ,..., ,...,j mD a a a+ + + += and ( )0 1 ,..., ,...,j mD a a a− − − −= are, respectively, called
the positive and negative ideal users for the suppliers. Let ,ij ja a+ += ij ja a− −= ,
1,2,..., ; 1, 2,..., ,i n j m= = one has ( )ij n mD a+ +
= and ( )ij n m
D a− −
= .
Let ij ij ijd a a+ += − andij ij ijd a a− −= − , based on the grey relational analysis [Liu and Lin,
2011], the positive and negative correlation coefficients ij+ and
ij− of supplier iS ’s
evaluations from the positive and negative ideal users 0D+ and 0D−
are obtained as
min min max max
max max
ij iji j i j
ij
ij iji j
d d
d d
+ +
+
+ +
+=
+ (5)
min min max max
max max
ij iji j i j
ij
ij iji j
d d
d d
− −
−
− −
+=
+ (6)
where is a distinguishing coefficient and is usually set at 0.5 [Liu and Lin, 2011].
Based on the prospect theory [Kahneman and Tversky, 1979], when a DM faces definite
losses, he/she tends to be risk-seeking. Conversely, if a DM faces sure gains, he/she tends to be
risk-averse. In the matching decision process, for the suppliers of technological knowledge, if the
positive ideal users 0D+ are taken as reference points, definite losses will encourage them to seek

8
risk; if the negative ideal users 0D− are set as reference points, certain gains will induce them to
avoid risk. This analysis indicates that the positive and negative correlation coefficients can be,
respectively, taken as the basic input to determine Si’s negative and positive prospect values as
shown below:
( )
( )
ij ij
ij ij
v
v
+ −
− +
=
= −
(7)
where and stand for the concave and convex degrees of the power function in gain and
loss areas, respectively; is a risk-averse parameter of the value function; If 1 , a DM tends
to be more sensitive to losses, and the bigger the , the higher the degree of loss aversion.
Experimental data from different countries and regions indicate that, if 1 , 1 , DMs
tend to be conservative, while if 1 , 1 , DMs are more aggressive. Therefore, when the
prospect values are determined, the DMs’ risk profiles should be properly considered.
The overall prospect value ijv for iS matching with jD is thus obtained by taking into
account both the positive and negative prospect values ijv+
and ijv−
as follows:
ij ij ijv v v+ −= + (8)
This results in the prospect value matrix ij n m
P v
= for the suppliers.
4.1.2 The prospect value matrix for the users
In a similar fashion, one can determine the prospect values of the users on the suppliers.
Definition 3 Assume that
11 1 1
1
1
,...., ,...,
= ,...., ,...,
,...., ,...,
i n
j ij nj
m im nm
b b b
B b b b
b b b
is the evaluation matrix of users on
suppliers, if
1( ) max( ) max( ,..., ,..., )i ij i ij imj
b b b b b+ = = (9)
1( ) min( ) min( ,..., ,..., )i ij i ij imj
b b b b b− = = (10)
Then ( )0 1 ,..., ,...,T
i nS b b b+ + + += and ( )0 1 ,..., ,...,T
i nS b b b− − − −= are, respectively, called
the positive and negative ideal suppliers for the users of technological knowledge. Let ,ij ib b+ +=

9
ij ib b− −= , 1,2,..., ; 1, 2,..., ,i n j m= = one has ( )ij n mS b+ +
= and ( )ij n m
S b− −
= .
Similarly, let ij ij ijd b b+ += − and
ij ij ijd b b− −= − . By using the grey relational analysis
method [Liu and Lin, 2011], the positive and negative correlation coefficients between jD ’s
evaluations and 0S + and 0S −
are determined as follows:
min min max max
max max
ij iji j i j
ij
ij iji j
d d
d d
+ +
+
+ +
+=
+ (11)
min min max max
max max
ij iji j i j
ij
ij iji j
d d
d d
− −
−
− −
+=
+ (12)
where is a distinguishing coefficient and is generally set at 0.5 [Liu and Lin, 2011].
Based on the prospect theory, jD ’s positive prospect value ijv +
and negative prospect value
ijv− are computed as
( )
( )
ij ij
ij ij
v
v
+ −
− +
=
= −
(13)
Accordingly, the overall prospect value ijv for user jD is obtained as
ij ij ijv v v+ −= + (14)
which can be represented as a prospect value matrix ij m n
Q v
= for the users.
4.1.3 The prospect value matrix for the broker
In facilitating matching supply with demand of technological knowledge, as an independent
economic agent, the broker typically has its own preferences on different matching pairs. As a
profit-driven organization, after considering the prospect values of suppliers and users, it is
understandable that the broker is more willing to promote a matching pair with a higher
commission than the one with a lower commission.
Definition 4 For a matching pair ( , )i jS D , let ijr be the broker’s commission for the
matching pair and 0f be the broker’s common expected profit for any matching pair, then
0
max
ij
ij
ij
f rh
r
−= (15)
10
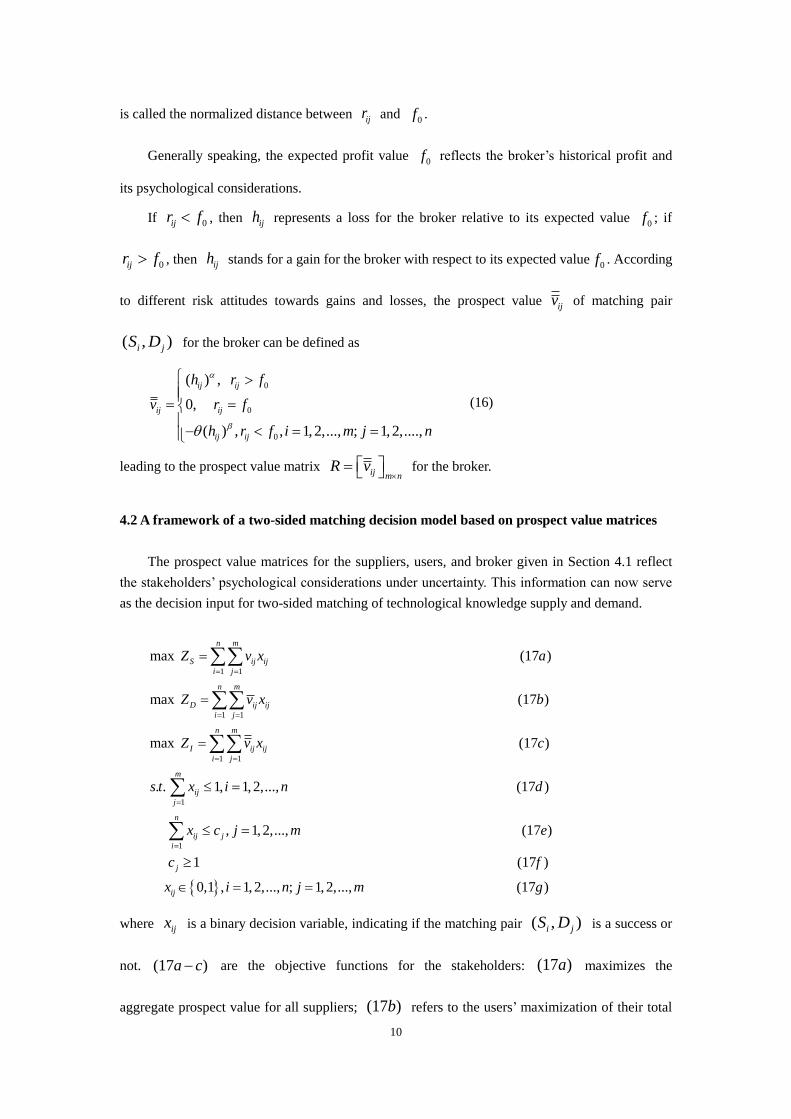
is called the normalized distance between ijr and 0f .
Generally speaking, the expected profit value 0f reflects the broker’s historical profit and
its psychological considerations.
If 0ijr f , then ijh represents a loss for the broker relative to its expected value 0f ; if
0ijr f , then ijh stands for a gain for the broker with respect to its expected value0f . According
to different risk attitudes towards gains and losses, the prospect value ijv of matching pair
( , )i jS D for the broker can be defined as
0
0
0
( ) ,
0,
( ) , , 1,2,..., ; 1,2,....,
ij ij
ij ij
ij ij
h r f
v r f
h r f i m j n
= =− = =
(16)
leading to the prospect value matrix ij m n
R v
= for the broker.
4.2 A framework of a two-sided matching decision model based on prospect value matrices
The prospect value matrices for the suppliers, users, and broker given in Section 4.1 reflect
the stakeholders’ psychological considerations under uncertainty. This information can now serve
as the decision input for two-sided matching of technological knowledge supply and demand.
1 1
1 1
max (17 )
max (17 )
max
n m
S ij ij
i j
n m
D ij ij
i j
I
Z v x a
Z v x b
Z
= =
= =
=
=
=
1 1
1
(17 )
. . 1, 1,2,..., (17 )
, 1
n m
ij ij
i j
m
ij
j
ij j
v x c
s t x i n d
x c j
= =
=
=
=
1
, 2,..., (17 )
1 (17 )
0,1 , 1,2,.
n
i
j
ij
m e
c f
x i
=
=
.., ; 1, 2,..., (17 )n j m g=
where ijx is a binary decision variable, indicating if the matching pair ( , )i jS D is a success or
not. (17 )a c− are the objective functions for the stakeholders: (17 )a maximizes the
aggregate prospect value for all suppliers; (17 )b refers to the users’ maximization of their total

11
prospect value, and (17 )c represents the broker’s maximization of its prospect value for all
matching pairs; (17 )d restricts each supplier iS to match with at most one user to reflect the
practical constraints on technology transfer. (17 )e establishes the upper limit on the number of
technology transfers that user jD may possibly accept.
The optimization model (17) has three objectives from the three parties, which can be
conveniently converted to a single objective optimization model by using the weighted average
approach as follows:
1 1 1 1 1 1 1 1
1
max (18 )
. . 1, 1,2,..., (1
n m n m n m n m
S ij ij D ij ij B ij ij ij ij
i j i j i j i j
m
ij
j
Z v x v x v x c x a
s t x i n
= = = = = = = =
=
= + + =
=
1
8 )
, 1, 2,..., (18 )
0,1 , 1,2,..., ; 1, 2,...,
n
ij j
i
ij
b
x c j m c
x i n j m
=
=
= =
(18 )d
where ij S ij D ij B ijc v v v = + + , , ,S D B are, respectively, the weight for the suppliers, users,
and the broker, reflecting their importance in the actual two-sided matching decision process.
These weights are typically determined through a three-party consultation process or unilaterally
determined by a dominating party, and 1S D B + + = .
Model (18) can be transformed to a standard assignment model that can be solved by using
the Hungarian method. It is easy to see that the feasible region is nonempty and, hence, optimal
solutions exist for (18). For such a model, if it is not too big, an optimal matching solution can be
obtained by employing different software packages such as Lingo, Matlab, and WinQB2.0.
4.3 Solution procedure
The aforesaid discussions allow us to summarize the solution procedure of the proposed
decision method for two-sided matching technological knowledge supply and demand as follows:
Step 1: Determine evaluation matrices A and B by using (1) and (2) based on the suppliers’
and users’ evaluations of the other party and criteria weights;
Step 2: Find the positive and negative ideal users and suppliers as per Definition 2 and 3, and
calculate positive and negative relational coefficients of the suppliers and users by using the grey
relational analysis method;
Step 3: Obtain prospect values and prospect matrices for the suppliers and users based on the
positive and negative relational coefficients of the suppliers and users as per Eqs. (8) and (14);
Compute the broker’s prospect values and prospect value matrix as per (16);
Step 4: Establish the multi-objective optimization model (17), and convert it to a single-
objective optimization model (18) by using the weighted average method;

12
Step 5: Solve the optimization model (18) to obtain the optimal matching pairs.
5 A case study
This case study takes Jia Yong Technology Trade Centre as a representative broker to
facilitate matching technological knowledge supply and demand in Nanjing, Jiangsu in China.
Numerous higher education and research institutions are located in Nanjing. On the one hand,
these research institutions produce a large quantity of technological knowledge, which fails to
reach right users in industry to realize its economic benefit. On the other hand, many large-scale
state-owned enterprises and numerous small and medium enterprises in the region have been
actively seeking for open innovation opportunities by acquiring technological knowledge. This
mis-match has significantly affected the commercialization of technology innovations and the
innovation capability of the enterprises [Jian and Liu, 2012]. Therefore, it has become an urgent
issue to better match suppliers and users of technological knowledge so that suppliers can
commercialize their research results and contribute to the betterment of the general society, and
users can benefit from open innovation and improve their competitiveness. In the meantime, the
broker can collect commissions by providing value-added matching services. From an open
innovation lens, this can be treated as a broker-assisted MFT.
According to statistical data, there exist 405 brokers in the MFT to facilitate effective
matching between suppliers and users in Nanjing. Jia Yong Technology Trade Center is one of
these organizations and is selected as a representative broker to illustrate how the proposed model
can incorporate different stakeholders’ psychological considerations into the two-sided matching
process. To facilitate matching the needs of enterprises (users) and technology owners (suppliers),
Jia Yong has been actively collecting relevant supply and demand information on technological
knowledge. In March 2014, the broker received matching requests from four enterprises and five
patent owners, denoted by 1 2 5( , ,..., )S S S and 1 2 4( , ,..., )D D D . The five suppliers assess the
four enterprises based on three criteria: patent technology transfer income (1A ), technological
level of the enterprise ( 2A ) and the speed of patent technology transfer (3A ). The four enterprises
evaluate the five patents on five criteria: market prospect (1B ), potential economic value ( 2B ),
patent cost (B3), technology complexity ( 4B ), and technology advancement level (5B ). After
evaluating actual needs and soliciting domain expert opinions, the three criterion weights for the
enterprises (users) and the five criterion weights for the patents (suppliers) are, respectively,
obtained as follows:
(0.45,0.30,0.25) and (0.3,0.18,0.22,0.15,0.15) .
By collecting and assessing relevant suppliers and users information, the five suppliers
furnish their evaluation on the four users based on the three criteria as shown in Table 1, and the
four users assess the five suppliers as per the five criteria as given in Table 2. Given their limited
financial resources and technological capability, the four users set up their upper limits of the
maximum number of patents that they can possibly take as 2,2,1,1, respectively. By examining its

13
pools of suppliers and users, the broker estimates its commission revenue by providing the 20
possible matching pairs as shown in Table 3 (in millions of RMB), and its expected value of each
successful matching pair is 4 million RMB.
Table 1 Evaluation values of the suppliers (patent owners) with respect to the users (enterprises)
A S/D D1 D2 D3 D4
A1 S1 0.90 0.82 0.55 0.78
S2 0.78 0.89 0.84 0.58
S3 0.85 0.69 0.76 0.80
S4 0.70 0.78 0.88 0.54
S5 0.65 0.80 0.74 0.90
A2 S1 0.86 0.78 0.64 0.82
S2 0.73 0.90 0.88 0.65
S3 0.87 0.75 0.74 0.82
S4 0.69 0.75 0.86 0.63
S5 0.57 0.82 0.76 0.88
A3 S1 0.85 0.66 0.60 0.75
S2 0.75 0.85 0.82 0.66
S3 0.88 0.84 0.79 0.65
S4 0.59 0.74 0.85 0.74
S5 0.76 0.68 0.82 0.87
Table 2 Evaluation values of the users (enterprises) with respect to the suppliers (patent owners)
B D/S S1 S2 S3 S4 S5
B1 D1 0.84 0.78 0.65 0.89 0.53
D2 0.66 0.84 0.75 0.49 0.88
D3 0.86 0.64 0.72 0.81 0.78
D4 0.65 0.78 0.85 0.80 0.65
B2 D1 0.88 0.74 0.77 0.84 0.65
D2 0.72 0.88 0.79 0.64 0.92
D3 0.84 0.76 0.66 0.88 0.74
D4 0.73 0.69 0.88 0.78 0.64
B3 D1 0.84 0.78 0.75 0.79 0.69
D2 0.78 0.82 0.74 0.65 0.88
D3 0.87 0.75 0.69 0.90 0.63
D4 0.82 0.57 0.88 0.75 0.71
B4 D1 0.88 0.72 0.62 0.77 0.64
D2 0.75 0.86 0.68 0.74 0.81
D3 0.82 0.70 0.77 0.88 0.71
D4 0.79 0.64 0.89 0.74 0.69
B5 D1 0.84 0.65 0.68 0.78 0.72
D2 0.76 0.89 0.75 0.71 0.83
D3 0.85 0.64 0.76 0.89 0.69
D4 0.78 0.68 0.85 0.72 0.65

14
Table 3 Revenue of the broker for the matching pairs
S/D( ijr ) D1 D2 D3 D4
S1 4.4 4.8 6 5.4
S2 4.3 1 4.5 5.6
S3 3.5 5 2.8 5.2
S4 5.6 6 3.4 5.3
S5 4.4 3.9 5.3 5.1
Given the aforesaid decision input, one can execute the procedures laid out in Section 4.3 as
follows.
Step 1: Given the suppliers’ evaluations of the users in Table 1 and the users’ assessments of
the suppliers in Table 2 as well as the associated criteria weights, one can obtain the overall
evaluation values based on formulas (1) and (2) as shown in Table 4.
Table 4 Mutual satisfaction evaluation values of the suppliers and users
D/S S1 S2 S3 S4 S5
D1 (0.8532,0.8755) (0.7443,0.7575) (0.8245,0.8635) (0.8245,0.6695) (0.6318,0.6535)
D2 (0.7257,0.768) (0.8533,0.883) (0.7445,0.7455) (0.6227,0.761) (0.8692,0.776)
D3 (0.8511,0.5895) (0.6948,0.847) (0.7161,0.7615) (0.8649,0.8665) (0.7158,0.766)
D4 (0.7423,0.7845) (0.6816,0.621) (0.868,0.7685) (0.7644,0.617) (0.6674,0.8865)
Step 2: Based on the overall evaluations, the positive and negative ideal users and suppliers
are, respectively, determined as follows:
0 0.8755 0.883 0.866( , , ,5 0. 65)88D+ = ;0 0.6535 0.7455 0.5895( , , ,0. 17)6D− =
0 0.8532 0.8533 0.868 0.8649,0( ., 9, )2, 86S + = ;0 0.7257 0.6816 0.7161 0.6227,0( ., , 6 )18, 3S − =
Plugging these values into formulas (5), (6), (11) and (12), the positive and negative
relational coefficients of the suppliers and users can be determined, which are omitted here for the
sake of brevity.
Step 3: To apply the prospect theory given in [Kahneman and Tversky, 1979; Tversky and
Kahneman, 1992], the three parameter values , , and must be obtained first. As mentioned
earlier, stakeholders from different geographical locations may possess distinct risk profiles,
corresponding to different parameter values. To calibrate the model with our case study,
experiments were conducted to estimate the three parameter values for , , and . To
accomplish this task, 380 scientific and technological employees and government officials in
Nanjing (180 males and 200 females) were commissioned and their opinions were solicited. Then,
an SPSS nonlinear regression model is exploited to estimate the model parameters [Kahneman and
Tversky, 1979; Tversky and Kahneman, 1992], resulting in 1.18, 1.12, 2.25 = = = . A further
chi-square test was conducted to confirm that these parameter values are greater than 1 at a

15
significant level of 1%. Compared with the parameter values in the literature [Kahneman and
Tversky, 1979; Tversky and Kahneman, 1992], these values are relatively small, indicating that
the scientific and technological employees and government officials in Nanjing tend to display
gradual sensitivity to risk according to the prospect theory. Plugging the positive and negative
relational coefficients of the suppliers and users into (7) and (13), one can calculate the positive
and negative prospect values of the suppliers and users, thereby determining their prospect value
matrices based on (8) and (14) as shown in Table 5. According to the possible revenues in Table 3
and the broker’s expected value for each successful matching pair, the prospect value matrix of the
broker is computed based on (15) and (16) and shown in Table 6.
Table 5 a. The prospect value matrix of the suppliers
D/S D1 D2 D3 D4
S1 -1.9266 -0.3060 0.3426 -0.8203
S2 -0.6120 -1.8068 -1.6519 0.2886
S3 -1.7135 -0.0394 -0.8103 -0.7102
S4 0.0681 -0.2266 -1.9765 0.3291
S5 0.2293 -0.3944 -0.8420 -1.9705
Table 5 b. The prospect value matrix of the users
D/S D1 D2 D3 D4
S1 -1.8220 -0.0054 -1.7748 -0.2270
S2 -0.4852 -1.8972 0.0036 0.1629
S3 0.1715 -0.3629 -0.0875 -1.9010
S4 -1.3154 0.3426 -1.9763 -0.7427
S5 0.3327 -1.9721 -0.3628 -0.0124
Table 6 Prospect values of the broker
D/S D1 D2 D3 D4
S1 0.0409 0.0928 0.2735 0.1796
S2 0.0292 -1.0352 0.0533 0.2102
S3 -0.1391 0.1207 -0.3710 0.1497
S4 0.2102 0.0181 -0.1707 0.1645
S5 0.0409 -0.0229 0.1645 0.1351
Step 4: Based on the prospect values of the suppliers, users and broker, a multi-objective
optimization model (17) can be constructed. According to the status and importance of the
suppliers, users and broker in the actual matching situation, the weights of the suppliers, users and
broker could be determined by consultation as 0.35, 0.45, 0.20S D B = = = , (17) can then be
converted to a single-objective optimization model (18) by using the weighted average method,
and the coefficient matrix ij n mc
is determined and shown in Table 7. To facilitate comparison

16
with the matching result without psychological behaviours, the coefficient matrix of model (18) is
obtained by directly taking the weighted average of matrices A, B in Table 4 and H by using (15),
and this matrix is displayed in Table 8.
Table 7 Coefficient matrix with psychological behaviours
S/D( ijr ) D1 D2 D3 D4
S1 -1.4860 -0.0910 -0.6240 -0.3533
S2 -0.4267 -1.6931 -0.5659 0.2164
S3 -0.5504 -0.1530 -0.3972 -1.0741
S4 -0.5261 0.0785 -1.6152 -0.1861
S5 0.2382 -1.0301 -0.4250 -0.6682
Table 8 Coefficient matrix without psychological behaviours
S/D( ijr ) D1 D2 D3 D4
S1 0.7037 0.6220 0.6560 0.6553
S2 0.6101 0.7930 0.6258 0.5774
S3 0.6310 0.6293 0.6288 0.6996
S4 0.6587 0.5532 0.7125 0.6033
S5 0.5264 0.6661 0.6335 0.6473
Step 5: Different software packages such as Lingo, Matlab13.0, and WinSQB can be applied
to solve the optimization model (18) with and without psychological considerations, and the
matching results are derived and shown in Table 9.
Table 9 Matching results with and without accounting for psychological behaviour
Two-sided matching method Matching results
without psychological behaviours (S1,D1) (S2,D2) (S3,D4) (S4,D3) (S5,D2)
with psychological behaviours __ (S2,D4) __ (S4,D2) (S5,D1)
The matching results in Table 9 demonstrate that all suppliers will be matched with a user
with (S1, D1), (S2, D2), (S3, D4), (S4, D3), and (S5, D2) being the five matching pairs if the
stakeholders’ psychological behaviours are not considered. However, once psychological
considerations are introduced via the prospect theory, matching results have been significantly
changed. As a matter of fact, none of the previous successful matching pairs survives: suppliers 1
and 3 cannot be matched with any user now. Although suppliers 2, 4, and 5 can still be matched
with users, but their matching partners differ from the previous solution without psychological
considerations. The matching results without psychological behaviours are derived based on
perfect rationality. However, stakeholders have their expected assessments on potential matching
pairs. The relative gains/losses with respect to these reference points will understandably affect the
stakeholders’ overall evaluations of the matching results. By incorporating the prospect theory
with the calibrated model parameters , , and through a field study, the final solution
properly reflects what happened in reality: Although the broker, Jia Yong Technology Trade Center,
aims to match the patents from the five research groups with the four enterprises, it fails to find
matching partners for suppliers 1 and 3 as well as user 3.
From a policy implication perspective, those stakeholders without recommended matching
partners fail to meet the expectations and needs of the other stakeholders. At the macro level,

17
national and local governments should introduce appropriate regulations and policies to promote
the exchange and cooperation between the universities, research institutions and enterprises. In so
doing, universities and research institutions can better understand the needs and expectations of
enterprises to create readily transferrable technological knowledge, and enterprises can obtain
necessary attributes of technological knowledge that is of their interests, and the brokers can have
policy and funding support to provide better matching service between universities and enterprises.
At the micro level, all stakeholders should better understand the expectations of the other parties:
the suppliers should provide more detailed information on their technology innovations, the users
should elaborate more on their specific needs and expectations, and the brokers should establish a
more convenient platform to facilitate information exchange between the users and suppliers in
order to improve matching efficiency.
The key contributions of this research are threefold: 1) It furnishes a novel theoretical model
for matching supply and demand in a broker-assisted MFT; 2) Methodologically, the proposed
model can effectively capture market participants’ psychological considerations; 3) The case study
demonstrates that, by properly calibrating model parameters, the proposed approach can be
applied to real-world technological knowledge trading in an MFT and yields matching results that
are consistent with the reality.
6 Conclusions
In the process of technological knowledge exchange, matching subjects (suppliers and users)
and the broker are typically agents with limited rationality. By employing the prospect theory and
grey relational analysis, this paper develops a two-sided matching decision framework for
matching supply and demand of technological knowledge. The proposed method is conceived to
account for stakeholders’ psychological considerations in the decision process, thereby deriving
more realistic matching results. A real-world case analysis is employed to demonstrate how the
proposed model can be applied to solve a two-sided matching problem in technological
knowledge exchange in a broker-assisted MFT. Analytical results show that this approach with
psychological considerations is able to generate matching pairs that are more consistent with what
happened in reality. This research improves and extends the applications of the two-sided
matching theory to the MFT in the open innovation paradigm.
The proposed model has its limitations. For example, it does not differentiate the types of
knowledge exchanged (established vs. novel, tacit vs. codified, general vs specialized) [Ardito et
al. 2016, Nielsen and Nielsen 2009]. Moreover, the model focuses on incorporating psychological
behaviour of the MFT participants and does not consider their other characteristics. These issues
warrant further studies in the future.
References
1. Arora, A., Belenzon, S. and Rios, L.A. (2014), “Make, buy, organize: The interplay between
research, external knowledge, and firm structure”, Strategic Management Journal, Vol. 35 No.
3, pp. 317 – 370.
2. Arora, A., Fosfuri, A. and Gambardella, A. (2001a), “Markets for Technology and their
Implications for Corporate Strategy”, Industrial and Corporate Change, Vol. 10 No. 2, pp.

18
419 – 510.
3. Arora, A., Fosfuri, A. and Gambardella, A. (2001b), Markets for Technology: The Economics
of Innovation and Corporate Strategy, MIT Press.
4. Arora, A. and Gambardella, A. (2010), “Ideas for rent: an overview of markets for
technology”, Industrial and Corporate Change, Vol. 19 No. 3, pp. 775-803.
5. Capaldo, A., Lavie, D. and Petruzzelli, A.M. (2016), “Knowledge maturity and the scientific
value of innovations: The roles of knowledge distance and adoption”, Journal of Management,
doi:10.1177/0149206314535442
6. Chen, Y., Fan, Z.P. and Li, Y.H. (2010), “A two-phase decision analysis method for two-sided
matching of technological knowledge supply and demand”, Industrial Engineering and
Management, Vol. 15 No. 6, pp. 90 – 94.
7. Chesbrough, H.W. (2003), Open innovation: The new imperative for creating and profiting
from technology. Boston, MA: Harvard Business School Press.
8. Cheng, C.C.J., and Huizingh, E.K.R.E. (2014), “When is open innovation beneficial? The role
of strategic orientation”, Journal of Product Innovation Management, Vol. 31 No. 6, pp. 1235
– 1253.
9. Chitru, S.F., Vladimir, A.G. and Paul A.S. (2013), “Two-sided matching: How corporate
issuers and their underwriters choose each other”, Journal of Applied Corporate Finance, Vol.
25 No. 2, pp.103–115.
10. Dulipovici, A. and Vieru, D. (2015), “Exploring collaboration technology use: how users’
perceptions twist and amend reality”, Journal of Knowledge Management, Vol. 19 No. 4, pp.
661 – 681.
11. Gale, D. and Shapley, L. (1962), “College admissions and the stability of marriage”,
American Mathematical Monthly, Vol. 69 No. 1, pp. 9–15.
12. Gielen, P.M., Hoeve, A. and Nieuwenhuis, L.F. (2003), “Learning entrepreneurs: learning and
innovation in small companies”, European Educational Research Journal, Vol. 2 No. 1, pp.
90 –106 .
13. Girard, N. (2015), “Knowledge at the boundary between science and society: a review of the
use of farmers’ knowledge in agricultural development", Journal of Knowledge Management,
Vol. 19 No. 5, pp. 949 - 967
14. Hansen, M.T., Nohria, N. and Tierney, T. (1999), “What’s your strategy for managing
knowledge”, Harvard Business Review, Vol. 77 No. 2, pp. 106–116.
15. Hoppe, H.C. and Ozdenoren, E. (2005), “Intermediation in innovation”, International Journal
of Industrial Organization, Vol. 23 No. 5, pp. 483 – 503.
16. Ivascu, L., Cirjaliu, B. and Draghici, A., (2016), “Business model for the university-industry
collaboration in open innovation”, Procedia Economics and Finance, Vol.39, pp. 674 – 678.
17. Jian, L.R. and Liu, Y. (2012), “Analysis of the technology innovation and technology
transformation capacity by network-based optimization pattern for regional Industry-
University in China - Taking Jiangsu Province as an example”, Kybernetes: The International
Journal of Cybernetics, Systems and Management Science, Vol. 41, No. 6, pp. 674 – 685.
18. Jou, R.C., Kitamura, R. and Weng M.C. (2008), “Dynamic commuter departure time choice
under uncertainty”, Transportation Research Part A, Vol. 42, No. 5, pp. 774–783.
19. Kahneman, D. and Tversky, A. (1979), “Prospect theory: An analysis of decision under risk”,
Econometrica, Vol. 47, No. 2, pp. 263–291.

19
20. Klerkx, L. and Leeuwis, C. (2008), “Matching demand and supply in the agricultural
knowledge infrastructure: Experiences with innovation intermediaries”, Food Policy, Vol. 33,
No. 3, pp. 260 – 276.
21. Liu, S.F. and Lin, Y. (2011), Grey Information Theory and Practical Applications, London:
Springer-Verlag.
22. Maas, J., Fenema, P.C. and Soeters, J.M.L. (2016), “ERP as an organizational innovation: Key
users and cross-boundary knowledge management”, Journal of Knowledge Management, Vol.
20, No. 3, pp. 557 – 577.
23. Petruzzelli, A.M. (2011), “The impact of technological relatedness, prior ties, and
geographical distance on university–industry collaborations: A joint-patent analysis”,
Technovation, Vol. 31, No. 7, pp. 309 – 319.
24. Petruzzelli, A.M., Natalicchio, A. and Garavelli, A.C. (2015), “Investigating the determinants
of patent acquisition in biotechnology: an empirical analysis”, Technology Analysis &
Strategic Management, Vol. 27 No. 7, pp. 840-58.
25. Petruzzelli, A.M., Rotolo D. and Albino V. (2015), “Determinants of patent citations in
biotechnology: An analysis of patent influence across the industrial and organizational
boundaries”, Technological Forecasting and Social Change, Vol.91, pp. 208 – 221.
26. Roth, A.E. (1985), “Common and conflicting interests in two-sided matching markets”,
European Economic Review, Vol. 27 No. 1, pp. 75 – 96.
27. Tversky, A. and Kahneman, D. (1992), “Advances in prospect theory: Cumulative
representation of uncertainty”, J of Risk and Uncertainty, Vol. 5 No. 4, pp. 297–323.
28. Xu, D. and Lu, J.W. (2007), “Technological knowledge, product relatedness, and patent
control: The effect on IJV survival”, Journal of Business Research, Vol. 60 No. 10, pp.
1660–1176.
29. Ardito, L., Petruzzelli, A.M. and Panniello, U. (2016), “Unveiling the breakthrough potential
of established technologies: An investigation in the aerospace industry”, Technology Analysis
& Strategic Management, Vol. 28 No. 3, pp. 916 – 934.
30. Nielsen, B.B. and Nielsen, S. (2009), “Learning and Innovation in International Strategic
Alliances: An Empirical Test of the Role of Trust and Tacitness”, Journal of Management
Studies, Vol. 46 No. 6, pp. 1031 – 1056.