BAV - DPM - final
33
BAV Course - Student Research This report is published for educational purpose by student learned in the Business Analysis and Evaluation course May 20 th , 2013 VND/USD 20,950 Ticker: HOSE - DPM Recommendation: BUY Price: 42,500VND Price Target: 71,414 VND Upside gain: 68% Forecasted summary 2009 2010 2011 2012E 2013F 2014F 2015F 2016F 2017F Net sale (million VND) 6,630, 061 6,618, 784 9,226, 534 13,321, 852 9,658, 343 7,388, 632 8,888, 524 10,248,4 69 11,324,5 58 Net income (million VND) 1,348, 306 1,703, 177 3,104, 293 3,016,8 51 2,934, 844 2,420, 633 2,894, 824 3,356,00 3 3,758,68 6 EPS (VND) 3,556 4,499 8,288 7,990 7,773 6,411 7,667 8,889 9,955 EPS Growth rate 26.5% 84.2% -3.6% -2.7% -17.5% 19.6% 15.9% 12.0% ROE (%) 24.6% 27.5% 37.7% 33.7% 29.3% 22.9% 25.0% 25.7% 25.2% ROA (%) 21.2% 23.0% 33.4% 28.5% 25.7% 20.5% 22.5% 23.3% 23.0% Investment Highlights We rate Dam Phu My (DPM) as “BUY” with price of VND in current time, expected to gain 68% higher than target price 42,500. We combinedThree- stage Discount Cash Flows ,P/E, P/B to calculate the target price. Therefore, we have recommended a rating guide in the disclosure part at the end of this report. Revenue increasedsharply in 2012: In 2012, revenue increased up to 45% due to the fact that DPM underwroteCa Mau nitrogen fertilizer. In 2013, DPM no longer underwrited DCM that lead to the reducing of sales. However,the company plans to build new three plants to be completed in 2015. As a result, revenue will be restored and increase sharplyduring 2015-2017 period. Key market data (2012) 52-Week Range 30.26 - 47.10 Avg Volume (10 days) 338,785 Market Cap 16413.16 billion Beta 1.11 Dividend yield 12% Shares 379.93 Fertilizer Industry ovietnam Fertilizer and Chemical Corporation Key Financial Data (2012) Earning per share (VND) 7,990 ROE (%) 33.7% ROA (%) 28.5% Profit margin (%) 23% Current Ratio 5.2 Quick Ratio 4.2 Debt/Asset 0.13 Debt to equity ratio 0.16
-
Upload
independent -
Category
Documents
-
view
0 -
download
0
Transcript of BAV - DPM - final

BAV Course - Student ResearchThis report is published for educationalpurpose by student learned in the BusinessAnalysis and Evaluation course
May 20th, 2013 VND/USD 20,950Ticker: HOSE - DPM Recommendation: BUY
Price: 42,500VND Price Target: 71,414 VND Upside gain: 68%
Forecasted summary 2009 2010 2011 2012E 2013F 2014F 2015F 2016F 2017FNet sale (million VND)
6,630,061
6,618,784
9,226,534
13,321,852
9,658,343
7,388,632
8,888,524
10,248,469
11,324,558
Net income (million VND)
1,348,306
1,703,177
3,104,293
3,016,851
2,934,844
2,420,633
2,894,824
3,356,003
3,758,686
EPS (VND) 3,556 4,499 8,288 7,990 7,773 6,411 7,667 8,889 9,955EPS Growth rate 26.5% 84.2% -3.6% -2.7% -17.5% 19.6% 15.9% 12.0%ROE (%) 24.6% 27.5% 37.7% 33.7% 29.3% 22.9% 25.0% 25.7% 25.2%ROA (%) 21.2% 23.0% 33.4% 28.5% 25.7% 20.5% 22.5% 23.3% 23.0%
Investment Highlights We rate Dam Phu My (DPM) as “BUY” with price of VND in current time, expected to gain 68% higher than target price 42,500. We combinedThree- stage Discount Cash Flows ,P/E, P/B to calculate the target price. Therefore, we have recommended a rating guide inthe disclosure part at the end of this report.
Revenue increasedsharply in 2012:
In 2012, revenue increased up to 45% due to the fact that DPMunderwroteCa Mau nitrogen fertilizer. In 2013, DPM no longerunderwrited DCM that lead to the reducing of sales. However,thecompany plans to build new three plants to be completed in 2015.As a result, revenue will be restored and increase sharplyduring2015-2017 period.
Key market data (2012)52-WeekRange
30.26 -47.10
Avg Volume(10 days)
338,785
Market Cap 16413.16billion
Beta 1.11Dividendyield
12%
Shares 379.93
Fertilizer Industry
Petrovietnam Fertilizer and Chemical Corporation
Key Financial Data(2012)
Earning per share (VND) 7,990ROE (%) 33.7%ROA (%) 28.5%Profit margin (%) 23%Current Ratio 5.2Quick Ratio 4.2Debt/Asset 0.13Debt to equity ratio 0.16

Business Analysis and Evaluation May 20, 2013Outstanding millionInstitutional Holdings
PVN (state owned): 61.38%Deutsche Bank AG London: 5.64%
Book valueper Share
22,234
Total debtto equity
0.16
ROA 29%ROE 33.70%
Net income reduced that not consistent with increase revenue in 2012:
Net income reduced by 3% because of the fact that cost of goods sold increased (underwritedCa Mau nitrogen fertilizer). Moreover, the input gas price in 2012 greater than 2011 by 40% , electricity, gasoline price, and others expenses also increased that contributed to decline net income. Net income, which will decline in 2 next years with decreasing in sales, will improve andincrease sharply in 2015.
Cash and cash equivalents increased rapidly in 2012:
DPM had not big investment and cash flow mainly came formoperating activities that lead to cash increase sharply, about5,600 billion VND. High cash holding ensure that DPM use forfurther investment and reinvestment, especially build new threeplants.
ROE was lower but still very high compare to competitors:
Although ROE reduced due to decline net income but sill high( about 33.7%), whereas other competitors was low (highest one notexceed 20%). DPM was very efficient in generating with the moneyshareholders have invested.
STERN RESEARCH 2
Major shareholder:PVN (state owned): 61.38%Deutsche Bank AG London:

Business Analysis and Evaluation May 20, 2013
Business DescriptionPetrovietnam Fertilizer and Chemicals Corporation (PVFCCo) is a member ofthe Vietnam National Oil and Gas Group (PVN), was established on 28th
March 2003 with 3,800 billion VND authorized charter capital. In 15th
December, 2004, PVFCCo inaugurated its main factory: Dam Phu My Factory.The factory’s located in Phu My District (Ba RiaVung Tau Province) whichcosted $ 370 million, using Danish technology and producing 800,000 tonsof urea per year. At the beginning, PVFCCo was totally a state-ownedcompany. In 15th May, 2008, it became a corporation under the control ofPVN until now. PVFCCo is the biggest nitrogenous (urea) producer inVietnam (through DPM factory’s process). Besides fertilizer processing,PVFCCo also involve in producing liquid ammonia, industrial gas,electricity, supplying fertilizer, chemicals, electricity, real estate,some other commodities and services. However, fertilizer production isstill the major source of companies’ revenue. DPM’s products currentlyaccount for more than half the market share of the fertilizer industryand was awarded Golden Rice Stuffed Vietnam and Vietnamese high qualityproduct for 9 consecutive years (2004-2012). In 29th October, 2007, PVFCCoissued their common stock to public with the code: DPM, worthed 3,800billion VND.
Industry OverviewTrend of international fertilizer marketWorld’s demand for nitrogen, phosphate, kalium is in trend with steadygrowth of argricutural production. However, the growth rate of supply ishigher than demand growth rate leading to excess supply in the future.The increase supply is due to the increase in factory amount and in theircapacity. From 2011 to 2016, 60 new urea factories will be operated inChina, Morocco, Brazil … will satisfy the increase in demand and keep the
STERN RESEARCH 3
29%
71%
Firgure 1: Equity structure
Domestic shareholder
1991
1994
1997
2000
2003
2006
2009
0
10000
20000
30000
40000
50000
Figure 2: Vietnamese rice production (1992
– 2012) (FAO)
2008 2009 2010 2011 20120
5000
100004679
6053 6754 7105 7720
2663 2464 2912 3507 3450
Figure 3: Rice export trend in 2008
- 2011 (VFA)
Volume Value

Business Analysis and Evaluation May 20, 2013supply stable (IFA, 6/2012). According to Fertecon, urea price in 2013will be around 365-435 USD/ton in Russia, Middle East, USA. (Appendix:World supply and demand for N, P, K)
China – the biggest fertilizer marketChina is currently producing and using fertilizer with largest amount inthe world. Therefore, any fluctuation in China market will affect theinternational market (also Vietnam) (33% the whole world market)
Domestic demand: expected to remain stable over timeVietnam is a typical argricutural country with about 70% populationworking as farmers. It is also known as a high and dversified demandfertilizer market. Being one of non sentitive industries, fertilizer is adefensive market. Even when economy is in downturn and affected manyindustries, the demand for fertilizer remain stable over time.The change in wheather related to three main crops and therefore, demand for fertilizerIn Vietnam, there are three main crops: Winter crop (October); Winter-Spring crop (December-January); and Summer-Autumn crop (May-June). Theproduction of Winter-Spring crop is always higher than other two.Havested area of this crop dominates nearly 40% of the total area peryear.The increase in food demand leads to the increase in fertilizer demandBecause Vietnam has young population struture and is going up rapidly(recently, is around 80 million people, estimated: 100 million in 2020),food becomes a essential demand, affect directly to fertilizer demand.Besides that, Vietnam is the largest world rice exporter (2012), thisalso affect directly fertilizer demand.The percentage of havestable landThis percentage is expected will have little changes, so the fertilizerquality is playing an important role in satisfying market demand.South is still keeping the role of largest granary in VietnamSouthern area is not only the area with largest havestable area (69%) butalso the biggest fertilizer market within the country. Besides that,Southern fertilizer manufacturers export their products, farmers tend tocare much about fertilizer quality but not quantity in order to guaranteeproduction of argricutural products. In contrast, Northern people don’tcare much about argicutural production efficiency. Hence, price but notfertilizer quality is the important competitive factor among firms. Itwould be an explanation of the reasons why high-quality fertilizer andmore expensive is mostly distributed in South.
Domestic supply: will excess demand in the futureVast of supply is from two state-owned companyThey are Vinachem and PVN. 12/15 big fertilizer companies belong toVinachem and other two companies belong to PVN (Appendix: List offertilizer company in Vietnam). According to statistics information inyear 2011, the five biggest fertilizer companies are: PVFCCo (largestmarket share), BinhDien, Lam Thao, LAS, and Nam Sao International Group.(VNR 500)Vietnam has excess supply for urea, phosphate, and NPK, we still have to import other types offertilizer (DAP, SA, K)In 2012, according to Ministry of Argricuture and Rural Development,Vietnam had surplus supply for NPK, urea, phosphate because severalfactory was beginning to operate and expansion of existing production
STERN RESEARCH 4
Figure 6: Supply anddemand for fertilizer inVietnam (Ministry of
agri. and rural develop
Firgure 5: Importedfertilizer from 2005 toNov 2012, unit: thousand
2008 2009 2010 2011 20120
5000
100004679
6053 6754 7105 7720
2663 2464 2912 3507 3450
Figure 3: Rice export trend in 2008
- 2011 (VFA)
Volume Value
North; 2960
Central; 1570
South; 4570
Firgure 4: Rice areas production

Business Analysis and Evaluation May 20, 2013scales. Especially, two factories (Ca Mau, NinhBinh) will expand theircapacity to increase total supply to be double. 65% DAP is stillimported. However, imported amount may be declined when the second DAPfactory is going to be used. Other two types of fertilizer (SA, K) arecompletely imported. China is the biggest importor to Vietnam. Whendomestic production is coming to meet and may excess domestic demand forfertilizer, imported fertilizer can be reduced soon in the future.Imitation and illegal imported fertilizerThe imitation and illegal imported fertilizer make the total real supplyhigher than recorded data.
Economic forces driving growth momentumIn short run, generally, fertilizer industry will have little changes.Entry barrier and exit barrierThe surplus supply and price risk in the world market leads to falling intotal industry profit. Investment in high quality fertilizer can bringhigher profit. But it usually requires high capital. So, the barrier tojump in and out of this industry is high.Bargaining power of suppliersFor urea is currently being produced from natural gas taking supply fromPV Gas (is also a member of PVN). PV Gas is a powerful supplier relativeto urea manufacturer (9% for nitrogen production). Therefore, PV Gas hasa strong bargaining power. In 2012, cost of gas for production is$6.43/MMBTU (increase 40% compare with 2011). Besides that, other costslike electricity, fuel, exchange rate and borrowing rate also affect theindustry.Bargaining power of buyersOn the other side, consumers will have stronger bargaining power after2012 (supply begins to dominate demand, switching cost within theindustry is not high).Government impactsIn Vietnam, price of natural gas is supported by gorvernment (about 40%less than price sold broadly). Therefore, manufacturer using natural gas(Phu My, Ca Mau) have cost advantage. Input cost for fossil coal ureawill be 50% higher than natural gas (SSI, cost of coal is $185/ton).According to Ministry of argricuture and rural development, a decree willbe issued, after that, the excess in supply can be solved.
Market trend 2013: stable in 2013, sustainable growth at 3%Manufacturers will focus in quality rather than quantity. In Vietnam,demand for urea in 2013 is stabilized about 2 million tons (Northern 500thousand tons, Central 300 thousand tons, Southern 1.2 million tons).From 2013, if Ca Mau factory and NinhBinh factory operate at full-capacity will meet enough domestic demand, even, Vietnam become ureaexporter (200 – 300 thousand tons/year). Vietnam has advantage inexporting to other countries in area like Thailand (100% import, demand:2.2 million tons/year), Myanmar (400 thousand tons/year), Campudia (250thousand tons/year), Philippines (800 thousand tons/year), Korea (700thousand tons/year)…
Competitive PositioningThe domestic supply is mostly from two state-owned corporations: Vinachemand PVN. The main product of PVFCCo is DPM urea fertilizer. Therefore, in
STERN RESEARCH 5
2003
2005
2007
2009
2011
2013
2015
0
500
1000
1500
2000
2500
3000
148147166175158187190147194190190190475209
646617765749756807801800800800
800
560760800
800280
532560
560
Figure 7: Urea domestic supply and demand (Petrovietnam)
Hà BắcPhú MỹCà MauNinh BìnhUrea demand for farmingTotal urea demand

Business Analysis and Evaluation May 20, 2013this part, we will only consider other urea or other substitutionproducts’s manufacturers as competitors against DPM (PVFCCo). In Vietnam,there are four main companies which is producing urea: PetrvietnamFertilizer and Chemicals Corporation (DPM), PetrovietnamCa Mau FertilizerCompany Limited (from natural gas); Ha Bac Nitrogenous Fertilizer andChemical Company Limited (HANICHEMCO) and NinhBinh Nitrogenous Factory(from coal). PVFCCo recently have largest market share among thesecompanies (around 55% - 2012). Before the year 2012, domestic demand forurea fertilizer was higher than supply, so fertilizer manufacturersdidn’t have to suffer difficulty in sale. But from 2013, when two newfactories (Ca Mau, NinhBinh) opperate at higher capacity, urea productionwill be increased to be double. Domestic market will have surplus insupply. PVFCCo’s revenue growth rate will be affected.
PetrovietnamCa Mau Fertilizer Company Limited (DCM)BesidePVFCCo, Ca Mau Fertilizer Company is one of the two fertilizercompanies directly under control of PVN. Before 2013, DCM factorybelonged to PVFCCo, generated its incomne into PVFCCo balance sheet. DCMand DPM factories are also using natural gas as the input for theprocesses. It is an advantage for DCM because the input cost will be lessthan 50% compared with factories using coal. Since 2012, DCM have begunto operate and recently producing 31% of the total market (560 thousandtons per year). Its capacity will increase to 760 thousand tons in 2013and 800 thousand tons (equal to DPM’s) substanablly thereafter.
NinhBinh Nitrogenous FactoryNinhBinh nitrogenous factory is one of the major economic project ofVietnam chemical industry. The factory is one of the big two factoriesthat is producing urea from coal. With DCM factory, NinhBinh factory willalso operate at full capacity (560,000 tons/year) within next two years.Being invested by 11,000 billion VND, NinhBinh factory provides ureafertilizer for Northern provinces, replaces imported fertilizer, createsprice stability and long term supply for agriculture.
Ha Bac Nitrogenous Fertilizer and Chemical Company Limited (HANICHEMCO)Ha Bac is the first nitrogenous fertilizer producer in Vietnam, undercontrol of Vinachem. The main product is urea fertilizer. Besides that,they also provide NPK, liquid and solid CO2, liquid NH3, oxygen, activatedcarbon. Ha Bac factory uses coal as input for urea manufacturing process.Its capacities are 194 in 2011, 190 from 2012 to 2014 and increasesignificantly to 475 thousand tons in 2015. Nowaday, Ha Baccompany ismanaged by Ministry of Industry and Trade.
NPK ManufacturersIn addition, farmers can also use NPK fertilizer to substitutenitrogenous fertilizer. For that reason, NPK manufacturers are consideredas competitors to PVFCCo. Demand for NPK in year 2011 is around threemillion tons, most numerous among types of fertilizer. Amount of domesticsupply can satisfy domestic demand for NPK. NPK’s components cost muchmore in total expenses. N can be bought domestically, P can be selfproduced or bought in home country, K have to be imported. Bigmanufacturers include: Lamthao Fertilizers & Chemicals (capacity: 700thousand tons), BinhDien Fertilizer Joint Stock Company (500 thousandtons), Southern Fertilizer Company (350 thousand tons). They’re all
STERN RESEARCH 6
2003
2005
2007
2009
2011
2013
2015
0
500
1000
1500
2000
2500
3000
148147166175158187190147194190190190475209
646617765749756807801800800800
800
560760800
800280
532560
560
Figure 7: Urea domestic supply and demand (Petrovietnam)
Hà BắcPhú MỹCà MauNinh BìnhUrea demand for farmingTotal urea demand
2011 20120%
20%
40%
60%
80%
100%
39%55%
10%9%
51%12%
20%4%
Firgure 8: Urea market share 2011 - 2012
PVFCCo Hà BắcNinh Bình Cà MauImport

Business Analysis and Evaluation May 20, 2013members of Vietnam National Chemical Group (Vinachem).Lamthao fertilizers& chemicals (LAFCHEMICO) (previously known as Super Phosphate Plant LamThao) was established by the VietnamGovernment. The construction startedin 8th June, 1959 in Lam Thao,Phu Tho. After 3 years of construction andinstallation, the plant was put into manufacturing operations in 24th
June, 1962. Lamthao is currently the biggest NPK manufacturer with morethan 45% capacity among other NPK manufacturers. Being stablished in1973, BinhDien Fertilizer Joint Stock Company has become the leader inNPK production in South and significantly contributed to Vietnamagriculture and rural development. Especially, within Southern provinces,BinhDiencompany always ranks first in production and also revenue.
Company AnalysisAn extraordinary event in 2012 – the increase in net income was not ashigh as the increase in revenueThere is three reasons for this. Firstly, the cost of good sold washigher because PVFCCo underwrote Ca Mau fertilizer (that is they boughtCa Mau fertilizer then distributed and sold). From 2013, PVFCCo won’tsell DCM fertilizer anymore since Ca Mau factory’ll operate seperately.Secondly, cost of natural gas (main input) increased 40% while the otherutilities (electronic, gas, transaction cost..) also increased from 5% to15%. Finally, besides normal annually tax payments, in 2012, PVFCCo hadto pay additional income tax (70 billion VND) due to the expansionproject (increase the capacity to 800,000 tons). These things areconsidered extraordinary events and will soon come to the end.
PVFCCo future strategy is to focusing on product and service qualityBecause of predicted oversupply situation, since 2010, PVFCCo haveconducted solutions to strengthen the competitive advantage of DPMfertilizer. PVFCCo maintains market share by continuing to improve thefertilizer quality. In 2012, the company used UFC-85 technology toimprove the rigidity of the urea particles, reduce probability of brokenand wet particles. PVFCCo have invested in the storage system which has atotal capacity of approximately 250,000 tons of over 20 terminalstretches from North to South. Beside that, DPM further boost salespolicy and technical assistance for farmers. Besides that, PVFCCo istrying to diversify its products. One evidence of diversification is thatthe company constantly expanding its products and services, even though,the main source of revenue is from manufacturing and supplying offertilizer.
Factory projects investmentIn 2013, PVFCCo will complete preparation for building ammoniamanufacturing (450,000 tons/year) and nitrat amon (200,000 tons/year);hydrogen peroxide factory with capacity of 20,000 tons/years. Besidesthat, the company decided to pause its three project: DAP factory(450,000 tons/year) in Marroco, two NPK factories in Phu My and Nam Dinh.It is because the change in economic condition and the tightenedgovernment policy to big state-owned business groups.
Reaching foreign marketThe market will probably fall into excess 450,000-700,000 tons supplywhile Ninh Binh Fertilizer Plant 100% capacity operation in 2015.
STERN RESEARCH 7

Business Analysis and Evaluation May 20, 2013Realizing this situation, PVFCCo chose to aim to foreign marketsespecially Southeast Asia. In 2012 PVFCCo exported about 100,000 tons ofurea fertilizer. PVFCCo opened branches and representative offices inCambodia and Myanmar. These markets depend heavily on agriculture likeVietnam. In agriculture, rice cultivation of Myanmar rice occupies about60% of the area. Viet Nam’s geographical relative to Myanmar give PVFCCothe advantage over the competitor in Middle east or Baltic when Myanmarhad to import from the Middle east or Baltic with 40-60 day period whiletransport from Vietnam just need from 3 to 5 days. In next several year,PVFCCo plan to increase its export production, become the exporter leaderin Vietnam.
Using ERP (Enterprise Resource Planning)The cost of natural gas (input of DPM fertilizer production) iscontrolled by the government. According to the decided route of naturalgas price, PVFCCo have to suffer the unavoidable increase in gas cost. Todeal with the problem, PVFCCo found out a way to reduce managementexpenses. ERP is the overall business management, multi module softwareapplication. The company most important activities are all managed byERP, includes most of things from financial management to human resourcemanagement. ERP allows improving management ability, automating sellingprocesses. From 2012, using ERP helps PVFCCo managing its management costwell.
Reducing cost of production and selling expenseThe corporation built saving program, reducing cost in order to increasethe manufacturing and consuming effeciency.
Wide but costlydistribution systemPVFCCo has built wide distribution system across the country (Appendix).This helps the company win market share, reduce the shipping cost about10 – 15 USD/ton by having location near seaport (1km - Ba Ria Vung Tau).But PVFCCo distribution system is not efficient, lack of sustainableassociation. PVFCCo also has to spend more on the distribution system.
Cost advantage compared to others using coalPVFCCo’s taking advantage from being a member of PVN. PVN promises toprovide natural gas for urea production. By this, DPM fertilizer haslower cost of production than other factories that is using coal forproduction. In the near future, because of negative wheather changes,government has plan to transfer natural gas resource for electricalproduction. Therefore, PVFCCo will suffer some difficulties in inputcost.
Strong financial resourcePVFCCo has strong financial resources. With such advantages, PVFCCo canadjust prices to maintain a competitive advantage. Indeed, PVFCCo don’thave to deal with remarkable problem with loan payment. For others (CaMau, Ninh Binh), they are under the pressure of ensuring cash flowproblem to repay investment loans, working capital loan interest paymentbesides the initial under-capacity producing condition. On the otherhand, PVFCCo machinery system has been already out of depreciation cycle,pushing its income.
STERN RESEARCH 8
Business Analysis and Evaluation May 20, 2013
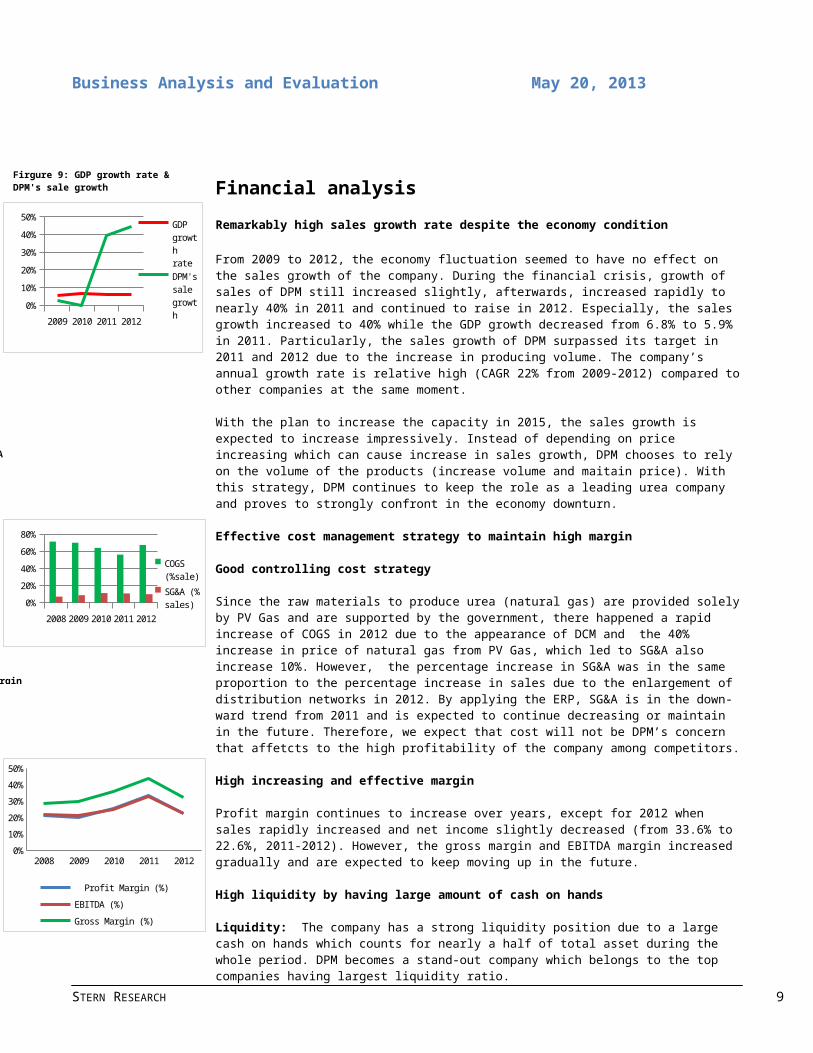
Financial analysisRemarkably high sales growth rate despite the economy condition From 2009 to 2012, the economy fluctuation seemed to have no effect on the sales growth of the company. During the financial crisis, growth of sales of DPM still increased slightly, afterwards, increased rapidly to nearly 40% in 2011 and continued to raise in 2012. Especially, the sales growth increased to 40% while the GDP growth decreased from 6.8% to 5.9% in 2011. Particularly, the sales growth of DPM surpassed its target in 2011 and 2012 due to the increase in producing volume. The company’s annual growth rate is relative high (CAGR 22% from 2009-2012) compared toother companies at the same moment.
With the plan to increase the capacity in 2015, the sales growth is expected to increase impressively. Instead of depending on price increasing which can cause increase in sales growth, DPM chooses to rely on the volume of the products (increase volume and maitain price). With this strategy, DPM continues to keep the role as a leading urea company and proves to strongly confront in the economy downturn.
Effective cost management strategy to maintain high margin
Good controlling cost strategy
Since the raw materials to produce urea (natural gas) are provided solelyby PV Gas and are supported by the government, there happened a rapid increase of COGS in 2012 due to the appearance of DCM and the 40% increase in price of natural gas from PV Gas, which led to SG&A also increase 10%. However, the percentage increase in SG&A was in the same proportion to the percentage increase in sales due to the enlargement of distribution networks in 2012. By applying the ERP, SG&A is in the down-ward trend from 2011 and is expected to continue decreasing or maintain in the future. Therefore, we expect that cost will not be DPM’s concern that affetcts to the high profitability of the company among competitors.
High increasing and effective margin
Profit margin continues to increase over years, except for 2012 when sales rapidly increased and net income slightly decreased (from 33.6% to 22.6%, 2011-2012). However, the gross margin and EBITDA margin increased gradually and are expected to keep moving up in the future.
High liquidity by having large amount of cash on hands
Liquidity: The company has a strong liquidity position due to a large cash on hands which counts for nearly a half of total asset during the whole period. DPM becomes a stand-out company which belongs to the top companies having largest liquidity ratio.
STERN RESEARCH 9
Firgure 9: GDP growth rate & DPM's sale growth
Firgure 10: COGS and SG&A
Firgure 11: DPM's key margin
2009 2010 2011 20120%10%20%30%40%50% GDP
growth rateDPM's sale growth
2008 2009 2010 2011 20120%20%40%60%80%
COGS (%sale)SG&A (% sales)
2008 2009 2010 2011 20120%10%20%30%40%50%
Profit Margin (%)EBITDA (%)Gross Margin (%)

Business Analysis and Evaluation May 20, 2013Current ratio and quick ratio are high and expected to maitain in the future while DPM uses its own cash to invest in the new factories in 2015.
Safe financial structure and potential for leverage in the future
With the nearly free-debt structure, the financial leverage was low (1.1%) and the debt-equity ratio is low (0.16 in 2012) which explains thelow leverage of DPM. Interest coverage ratio was relative high, the company took less risk due to dess debt and we also expect that the company will take advantage of this in the future. In addition to the large ammount cash on hands, the low leverage at this moment is one factor that helps DPm to maintain the leading position in the Vietnam uremarket. However, the company will take advantage of debt for future investment by using its own cash and borrow from banks as well as gain tax shield to buy the factories.
Efficienncy in using asset and generate profitability
Being one of the largestdomestic listed company in HOSE and VN30, DPM is beating all the competitors and leaves a big gap for them to catch. The company also shows an efficiency in using its asset by having highand increasing ROA, ROE in which ROA was 28.5% and ROE was 33.7% in 2012. ROAand ROE slightly decreased from 2011 due to the decrease in profit marginwhich has been explained previously. However, this is not a problem for investors to worry because this is just an extraordinary phenomenon whichis caused by the appearance of DCM in 2012 when COGS increased strongly, sales and SG&A also increased. These 2 important factors are expected to reform in 2015 when the new factories are built which leads to increase in net income.
Inventory turn-over, account receivable turn-over and payable turn-over increased over years due to the increase in volume. The days recievable outstanding was low (9 days in 2012) shows a healthy company and more ability to generate profit.
Valuation (Heading: Times New Roman 14 Bold)Valuation model applied: the combination of 2 valuation techniques, 3-stage Discounted cashflows model (FCFF) and Price Multiple Analysis (P/Eand P/B), is used to valuate DPM. In this situation, DCM is not suitablefor valuating DPM due to the unstableness in DPM’s dividend payment anddifferent direction in payment and income growth.
Being developing in Vietnamese young market, though DPM is one of thebiggest urea producers, it has strong growth over recent years comparedto other top maket capital corporations. Therefore, there is aexpectation that DPM will grow significantly to 2017 (stage 1) because ofits increase in product variety (capturing products like nitrat amon,
STERN RESEARCH 10
Firgure 12 :Cash and cash
Firgure 13: DPM's debt-equity
Firgure 14: DPM's profitability
Firgure 15: 3 stage Discounted Cashflow (2013-2017)
- 5,000,000 10,000,000 15,000,000 20,000,000
Total asset
2008 2009 2010 2011 20120
0.050.10.150.20.25
0%
10%
20%
30%
40%
Return on Assets (%)

Business Analysis and Evaluation May 20, 2013NH3), which requires 3 new factories to be completed, then enter thedeclining stage (stage 2) in the next 5 years (2017-2022) and step intothe sustainable growth stage afterwards (stage 3).
In addition, we also use the Price Multiple Analysis to valuate DPM sincethis model is appropriate for stock estimation on the Vietnam’s volatileequity market. Besides, this choice of method to derive stock targetprice always the minority investors’ preference, who have low votingproxy and no right to control the company operation. All of the reasonsabove contribute to the strong conclusion of suitable models application,which reflect truly the expectation of even controlling and non-controlling investors.
Weighting Ratio of model employed: In the environment of volatile andyoung equity market as Vietnam, fundamental analysis has a tendancy to besafer and more rationale to valuate the DPM. From that point, DCF modelis assigned the 90% for estimation, which is preferred to Price MultipleAnalysis with 10%. Moreover, the company shareholder’s structure is alsoa good criteria for the result in weight (90% Institutional share holder– 10% individual shareholder). That leads to the final weight (90 - 10)which is most rationale for our DPM valuation.
3-stage DCF Model (FCFF): the final target price of the company isestimated at VND72,374 by using the FCFF with the below assumptions aswell as facts for the next 5 years.
Sales Growth forecastEven though growth for the next two years is expected to slow down ordecrease as well (average of -25.5%), the sales revenue of thecorporation can strongly be outstanding in the following 3 years (averageof 15.4%). The reason for the decrease estimation is that there will be areduction in capacity of urea production due to the excess of domesticsupply and corporation’s large maintainance. Besides, this situation isoptimistically expected to occur for a short term and affect slightly tothe long-run growth of DPM. On the other hand, with its strong financialposition and expansion of both products and distribution network, DPM isbelieved to capture the growing demand from various fertilizer types ofVietnam market. Therefore, the sales growth is supposed to increasedramatically for 3 years after finishing the new factories constructionin 2015.
Gross MarginIn general, DPM gross margin growth is expected to be stable in the nextfuture 5 years (38%). They enjoy the highest rate of gross margin in thesector due to their strong distribution system, ability to capture thefuture different market of fertilizers, and tendency to supply someingredients to the fertilizer production themselves. It shows that DPM isseen as potencial and significantly attractive to investors.
SG&A expenses effective controlThe application of ERP system in management reveal the positive side ofcompany effectively cost controlling. It is supposed to reduce graduallyfrom 9% in 2013E to 5% in 2017F. Besides, the administrative expensemight have an slight increase due to the completion in construction of 3
STERN RESEARCH 11
Firgure 16: DPM’s forecasted SG&A and Gross margin
2,0%
10%20%30%40%50%
SG&A gross margin

Business Analysis and Evaluation May 20, 2013new factories. However, the efficiency in using ERP has a greatcontribution in controlling selling expense which leads to thediminishing in growth of SG&A as a whole.
TaxThe stable in tax rate of the corporation is resulted from the Governmentsupport in fertilizer industry and the area preference in projectedconstruction. Therefore, the tax rate is estimated to slightly changearound the 12% rate and the company might receive any other taxincentives.
CapexTo gain the market share and reach the expected revenue so that they cancompete with other large capital corporations in fertilizer industry, DPMstill continues to aggressively expand their factories as well asdistribution netork for both inside and outside the country. Thisdicision shows their rationale move in the situation of domestic ureasupply excess demand although the dramatic cost will be resulted fromthat. Especially, the outstanding increase in capital expenditure ofabout VND663 billion has been estimated and will be use for 2 mainpurposes: upgrade its distribution network and new factoriesconstruction.
Sensitivity analysisIn order to test how the percentage change in key ratio (WACC andTerminal growth rate) might affect estimated price (DCF model’s price),it is necessary to conduct the sensitivity analysisin this case.
After figuring out, the DPM’s share price reveals not to be verysensitive to the percentage change in the two key ratios above. It isclearly stated that for the worst case when the WACC is highest (17.69%)and terminal growth rate is lowest (3.9%), the estimated price is stillabout VND71.193, which is approximate to the first outcome that we have.(VND72,374) and still significantly higher than the current DPM’s shareprice. Price Multiple analysis
PeersDue to the recent highest position of DPM and being concerned as anoligopoly corporation in Vietnam fertilizer industry, it is imbalance andimpossible to compare DPM to other domestic fertilizer corporation.Specifically, DPM accounts for about 55% of this industry’s market share.Furthermore, in this case, very few corporations can obtain the very highgrowth rate (44% sales revenue growth in 2012) like DPM and are listed onthe eupity market. For that reasons, the list of peers that are in everyyoung market as Vietnam has been carried out to get the target price(figure).
Criteria for choosingThe list of peers is relulted from the criteria that we have decided interm of core business, quipvalent profitability, especially ROA and ROE,and comparable size based on their market capitalization. At the end, the
STERN RESEARCH 12
Firgure 17: DPM’s valuation outcome
Firgure 18: Price Multiple Analysis

Business Analysis and Evaluation May 20, 2013list includes 10 corporation that is used to conduct the Price MultipleAnalysis. (figure)
Target price outcomeIn conclusion, the target share price of DPM in 2013, as recommended byP/E model (VND83,096), P/B model (VND42,432), and DCF model (VND72,374)is scaled finally for the price of VND71,414. A comparison between thetarget price and current price of DPM, 68% upside gain leads to thedecision that our recommendation to DPM’ stock is obiviously a BUYrating.
STERN RESEARCH 13

BA065IU Date
Investment Risks
Operational risk:Increase in cost of gas may affect profit but not muchIn 2012, price of gas increased 40% compared to 2011 and forecastincrease 2%/year influences the profit. However, the cost of gas canchange suddenly (like 2012), DPM tries to cut expenses by utilizingEnterprise Resources Planning System efficiently. Moreover, thedepreciation expenses finished from 2010 that help DPM to save cost.Increase competition due to supply excess demandThe supply will be 2.3 million tons while 2 million in demand. DPM haveprepared to overcome this issue. In 2012, it exported 100,000 tons to thecountry’s which 100% imported such as Thailand, Campuchia, Philippines,and Myanmar…Efficiency of manufacturingAlmost machines, equipments of DPM are old, therefore, DPM has to pay thefees to maintain the efficiency of machines annually.
Exchange rate risk:The import of raw materials and input gas price that affect cash outflowThe gas price was $6.43/MMBTU, estimated increase 2%/year. Besides that,DPM has to import NPK, K, and sells in domestic market. Moreover, VietNam is lacking financial instruments hedge foreign exchange ratevolatility, so the changing of foreign exchange rate that lead tounpredictable cash outflow.
Credit risk: Possible PVFI defaultDPM has big loan from PetroVietnam Finance Investment Corporation (PVFI)about capital investment trust and the fiduciary interest income about110 billion VND. DPM has to have a provisions about it since it is hardto collect a debt.
Product quality risk:Poor quality fertilizer affects many manufacturersThe fake, poor quality fertilizer (especially from China with low price)in the market has been the significant negative to the production anddistribution business in fertilizer market. Therefore, to deal with thisissue, PVFCCo constructed quality management process in all stages. Evenmore, the product of DPM is highly valued and trusted by farmers.
14

Business Analysis and Evaluation May 20, 2013
APPENDIX
Appendix 1: PVFCCo distribution network
PVFCCo distribution network4 local companies2 subsidiaries and 1 representative office30 warehouse, total capacity: 250,000 tons129 level one licensed dealers3,000 level two licensed dealers
Appendix 2: DPM urea manufacturing and consuming
15

Business Analysis and Evaluation May 20, 2013
2004 2005 2006 2007 2008 2009 2010 2011 2012
0100200300400500600700800900
1000
Urea manufacturing Consumed urea
Appendix 3: PVFCCo revenue structure 2012
Appendix 4: World supply and demand for N, P, K
World supply and demand for N, P, K
(million metre tons) 2012 2013 2014 2015 2016
N
Agg. Demand 140.8
146.4
149.7
158.4
162.2
Agg. Supply 137.3
139.6
141.9
143.8
145.6
Demand for farming 109. 110. 112. 113. 114.
16
Urea Phu My Urea Ca MauSales of other kinds of fertilizer
Financial activities
Other revenue

Business Analysis and Evaluation May 20, 20135 8 1 2 4
Other demand 24.4 25.3 26.3 27 27.6Distribution loss 2.3 2.4 2.4 2.5 2.5Other demand 1.1 1.1 1.1 1.1 1.1Equilibrium 3.5 6.8 7.8 14.6 16.6
P
Agg. Demand 44.3 45.9 47.4 48.8 49.8Agg. Supply 42.5 43.8 44.7 45.5 46.2Demand for farming 36.7 37.6 38.3 39 39.7Other demand 5 5.3 5.5 5.6 5.6Distribution loss 0.8 0.9 0.9 0.9 0.9Equilibrium 1.8 2.1 2.7 3.3 3.6
K
Agg. Demand 40.2 43.5 45.7 48.6 52.8Agg. Supplyx 32 33.8 34.8 35.7 36.6Demand for farming 28.4 30 31 31.7 32.6Other demand 2.7 2.8 2.8 2.9 3Distribution loss 0.9 1 1 1 1.1Equilibrium 8.2 9.7 10.9 12.9 16.2
Appendix 5: List of Vietnam big fertilizer producers
List of Vietnam big fertilizer producers
Group Order
Name Main product TheoricalCapacity (tons/year)
Vinachem 1 Ninhbinh Phosphate Fertilizer Joint Stock FMP 300.000
17

Business Analysis and Evaluation May 20, 2013Company NPK 150.000
2 The Southern Fertilizer Company Superphosphate 200.000
NPK 300.0003 Lamthao Fertilizer and Chemicals Joint
Stock CompanySuperphosphate 750.000FMP 140.000
NPK 700.0004 Vandien Fused Magnesium Phosphate
Fertilizer Joint Stock CompanyFMP 270.000
NPK 150.0005 Binhdien Fertilizer Joint Stock Company NPK 500.0006 Cantho Fertilizer and Chemicals Joint
Stock CompanyNPK More than
200.0007 Habac Nitrogenous Fertilizer and Chemical
Company LimitedUrea 190.000
8 Ninhbinh Nitrogenous Fertilizer Factory Urea 560.0009 DAP 1 Company DAP 330.000
PVN 10 Petrovietnam Fertilizer and ChemicalsCorporation
Urea 800.000
11 PetrovietnamCamau Fertilizer Company Limited
Urea 800.000
Others 12 Five Star Group NPK 300.000
Syntheticfertilizer
Na
Specializedfertilizer
Na
13 Baconco NPK 200.00014 General Materials Biochemistry Fertilizer
Joint Stock CompanyNPK 360.000
15 Japan Vietnam Fertilizer Company NPK 350.000
Appendix 6: SWOT analysis
18

Business Analysis and Evaluation May 20, 2013
19
STRENGTHS* Leading in the industry with nearly 50% domestic market share; in the past, PVFCCo and its main products - DPM fertilizer has been highly appreciated by farmers and distribution partners. * Modern technology, in last 3 years, always operated at full capacity* Wide distribution system* Already out of depreciation line since 2010, that is an advantage to generate net income
WEAKNESSES* Selling price depend much on international fertilizer and fuel price* Its decision making depends on PVN* Costly distribution systemOPPOTUNITIES* Strong financail resources, sufficient cash on hand, therefore, they can protect themselves, generate, foster investment, increase production, diversify products* Under the control of a state-owned company, taking advantage of natural gas as input* Good reputaion not only for nitrogenous fertilizer but also for the other kinds of fertilizer
THREATS* Exceed supply in the future for fertilizer* In the future, government will tend to shift natural gas supply to other production* Imitaion fertilizer adversely affect PVFCCo reputation therefore its revenue

Business Analysis and Evaluation May 20, 2013
Appendix 7: DPM’s financial key ratios
Summary of Other Key Financial Ratios 2,009
2,010
2,011
2,012
Liquidity Ratios
Current Ratio 6.31
5.22
6.99
5.16
Quick Ratio 5.05
4.33
5.25
4.17
Solvency Ratios
Long-term Debt to Equity 0.04
0.04
-
0.001
Debt-equity ratio 0.15
0.19
0.11
0.16
Liabilities to Assets 0.13
0.16
0.10
0.13
Interest Coverage 96.62
227.91
125.18
2,307.77
Financial Leverage 1.13
1.18
1.16
1.16
Efficiency Ratios
Accounts Receivable Turnover 17.34
30.00
25.83
40.49
Inventory Turnover 5.53
6.83
5.67
7.72
Accounts Payable Turnover 19.66
13.79
15.34
24.96
Asset Turnover 1.15
0.96
1.10
1.34
Days Receivables Outstanding 21.04
12.17
14.13
9.02
Days Inventory Outstanding 66.03
53.45
64.39
47.30
Days Payable Outstanding 18.56
26.47
23.79
14.63
Net Days Financing Required 68.51
39.14
54.73
41.69
Profitability Ratios
Return on Assets (%) 0.21
0.23
0.33
0.29
Return on Equity (%) 0.25
0.27
0.38
0.34
Profit Margin (%) 0.20
0.26
0.34
0.23
Operating margin 0.22
0.22
0.22
0.22
EBIT margin 0.23
0.29
0.54
0.55
Gross margin 0.29
0.29
0.29
0.29
20

Business Analysis and Evaluation May 20, 2013
Appendix 8: DPM's liquidity ratios 2008-2012
2008 2009 2010 2011 2012
5.76.3
5.2
7.0
5.2
3.2
5.14.3
5.24.2
Current Ratio Quick Ratio
Appendix 9: DPM's interest coverage ratio
21
2008 2009 2010 2011 2012
48.2 96.6 227.9 125.2
2307.8 Interest Coverage

Business Analysis and Evaluation May 20, 2013
Appendix 10: Net income, Total Asset and Total Equity 2008-2017
- 2,000,000 4,000,000 6,000,000 8,000,000
10,000,000 12,000,000 14,000,000 16,000,000 18,000,000
Net incomeTotal AssetTotal Equity
Appendix 10: DPM's efficiency 2009-2012
222009 2010 2011 2012
0.0
10.0
20.0
30.0
40.0
50.0 Accounts Receivable Turnover Inventory Turnover Accounts Payable Turnover

Business Analysis and Evaluation May 20, 2013
Appendix 11: VALUATION1. Appendix:
Income statement:Income Statements
Fiscal Year 2008 2009 2010 2011 2012Net revenues 6,475,368 6,630,061 6,618,784 9,226,534 13,321,852Cost of sales 4,624,124 4,644,816 4,236,095 5,191,255 8,997,366Gross margin 1,851,244 1,985,245 2,382,689 4,035,279 4,324,486Selling, general & administrative 445,925 579,145 741,703 995,439 1,311,090Operating Income 1,405,319 1,406,100 1,640,986 3,039,840 3,013,396Financial income 143,127 181,198 343,092 526,679 568,346Other profit 6,008 10,427 13,787 7,256 15,007Profit or loss in associates 2,652 4,812 10,503 -47,697Financial expense 53,580 80,672 81,034 74,038 7,003In which: loan interest expenses 30,990 15,594 8,350 27,900 1,549Earnings before taxes 1,500,874 1,519,705 1,921,643 3,510,240 3,542,049Income taxes 115,581 168,419 214,773 369,628 474,402Net profit after taxes 1,385,293 1,351,286 1,706,870 3,140,612 3,067,647Minority interest 1,412 2,980 3,693 36,319 50,796Net income/EAT 1,383,881 1,348,306 1,703,177 3,104,293 3,016,851
23

Business Analysis and Evaluation May 20, 2013
Balance sheet:Balance Sheets
Fiscal Year 2008 2009 2010 2011 2012AssetsCash and marketable securities 942,714 2,906,125 3,748,457 4,070,457 5,629,376Receivables 573,161 191,371 249,942 464,355 193,728Inventories 1,111,309 569,253 671,349 1,160,377 1,171,461Other current assets 65,319 200,191 155,837 345,877 209,430Net property, plant &equip. 1,899,295 1,723,753 1,719,012 2,236,413 2,371,392Other LT asset 600,574 760,508 873,979 1,017,684 1,005,124Goodwill Total assets 5,192,372 6,351,201 7,418,576 9,295,163 10,580,511Liabilities and EquityAccounts payable 204,924 212,393 416,918 323,541 398,388Accured expenses 86,331 102,120 187,270 199,235 305,890Other current liabilities 179,019 298,610 319,870 341,700 691,710
24

Business Analysis and Evaluation May 20, 2013Other long-term liaibilities 12,318 228,701 264,297 18,730 19,034Other equity 3,945,489 4,303,026 4,988,676 5,642,217 7,070,024Retained earnings 777,342 1,228,173 1,288,361 2,668,824 1,975,353Treasury shares -35,053 -43,296 -83,277 -83,961 -85,447Minority interest 22,002 21,474 36,462 184,877 205,561 Total liabilities &equity 5,192,372 6,351,201 7,418,577 9,295,163 10,580,513Total Equity 4,687,778 5,487,904 6,193,759 8,227,079 8,959,929
Cashflow statement:
Statements of Cash FlowFiscal Year 2008 2009 2010 2011 2012Net Revenues 90,837 81,511 73,094 64,816 58,247
Cash flow provided by operating activity
Net income (loss) 1,383,8801,348,30
41,703,17
6 3,104,293 3,016,851
Depreciation/amortization 1,079,4101,038,12
5 687,290 190,196 212,835(Incr) decr in inventory (1,344,38 1,175,83 (103,524 (495,825) (15,326)
25

Business Analysis and Evaluation May 20, 20135) 0 )
Incr (decr) in accounts payable (340,069)
(117,519) 422,035 (27,994) 384,176
Other operating activities (104,976)(289,574
) 232,225 (646,004) (318,994)Net Cash Prov (Used) by Operations 673,860
3,155,166
2,941,202 2,124,666 3,279,542
Cash flow provided by investing activity
Capital expenditures(862,583
)(682,549
) (707,597) (347,814)(Purchase) sale of investments 568,884
2,003,009
2,490,878 771,065 2,612,734
Other investing activities (740,559)(2,102,9
90)(3,073,7
68) (775,242) (2,130,296)Net Cash Prov (Used) by Investing (171,675)
(962,564)
(1,265,439) (711,774) 134,624
Cash flow provided by financing activityProceeds from common stock sale 20,590Repurchases on common stock (35,053) (8,243) (39,981) (14,180)
Proceeds from borrowing 17,1571,141,00
0 126,130 166,651 83,579
Repayments of debt (590,191)(906,490
) (49,508) (489,153) (56,570)
Dividends, Other Distribution (944,327)(453,518
)(870,073
) (753,064) (1,881,929)Other financing activities 1 (1) - (1) -Net Cash Prov (Used) by Financing
(1,531,823)
(227,252)
(833,432)
(1,089,747) (1,854,920)
Change in Cash(1,029,63
8)1,965,35
0 842,331 323,145 1,559,246
26

Business Analysis and Evaluation May 20, 2013
2. Assumption:
Assumption 20092010 2011
2012E 2013F 2014F 2015F 2016F 2017F
Growth sales CAGR: % 3% 0%39.4
%44.4
%-
27.5%-
23.5% 20.3% 15.3% 10.5%two year average at 62% of sales (COGS) 62%SG&A decreases by applying ERP 11% 10% 9% 8% 7% 6% 5%
two year average turnover (33.2) - AR turnvover 33.2two year average turnover (6.7) - Inventory turnover 6.69two year average turnover (84) - Other curr asset turnover 42.4two year average turnover (5.2)- Net PPE turnover 5.2two year average turnover (20.1) - A/P Turnover 20.1two year average turnover (5.2) - Acc Exp Turns 5.2
Dividend payout per share 4,985
shares outstanding 377,555,209
two year average depr/net ppe (10%) 9%prior year debt rate (18%) 18%two year average tax rate (12%) 12%Terminal Growth Assumed 4%
WACC Assumed (computed in text) 0.18
27

Business Analysis and Evaluation May 20, 2013
3. Forecasted financial statementEBITDA
EBITDA 2012E 2013F 2014F 2015F 2016F 2017F
Net revenues growth as forecasted
13,321,85
2
9,658,34
3
7,388,63
2
8,888,52
4
10,248,46
9
11,324,5
58
growth sale
(0.275)
(0.235)
0.203
0.153
0.105
Cost of sales
two year average at 62%of sales
8,997,366
5,988,17
2
4,580,95
2
5,510,88
5
6,354,051
7,021,22
6
Gross margin
4,324,486
3,670,17
0
2,807,68
0
3,377,63
9
3,894,418
4,303,33
2 Selling, general & administrative
two year average at 10%of sales
1,311,090
869,251
591,091
622,197
614,908
566,228
EBITDA
3,013,396
2,800,91
9
2,216,59
0
2,755,44
3
3,279,510
3,737,10
4
Income statement:Income statement forecasted
Assumption 2012E 2013F 2014F 2015F 2016F 2017F
Operating Income3,013,39
62,800,91
92,216,59
02,755,4
433,279,5
103,737,1
04Interest and investment income constant 535,656 535,656 535,656 535,656 535,656 535,656
Interest expenseprior year debt rate (18%) 7,003 1,526 1,526 1,526 1,526 1,526
Earning before 3,542,04 3,335,05 2,750,72 3,289,5 3,813,6 4,271,2
28

Business Analysis and Evaluation May 20, 2013taxes 9 0 0 73 40 34
Income taxestwo year average tax rate (12%) 525,198 400,206 330,086 394,749 457,637 512,548
Net income3,016,85
12,934,84
42,420,63
32,894,8
243,356,0
033,758,6
86
Balance Sheet:Balance sheet 2,012 2,013E 2,014F 2,015F 2,016F 2,017F
Assets Cash and marketable securities
balance of retained cash+mkt sec
5,629,376 6,542,469 7,156,859 7,781,736 8,774,718 10,148,742
Receivables
two year average turnover (33.2)
193,728 290,914 222,549 267,727 308,689 341,101
Inventories
two year average turnover (6.69)
1,171,461 895,093 684,746 823,750 949,783 1,049,511
Other current assets
two year average turnover (84)
209,430 114,980 87,960 105,816 122,006 134,816
Net property, plant & equip.
two year average turnover (5.2)
2,371,392 2,556,115 2,645,278 2,884,151 3,223,914 3,662,704
29

Business Analysis and Evaluation May 20, 2013 Other LT assets constant 1,005,126 1,005,126 1,005,126 1,005,126 1,005,126 1,005,126 Goodwill constant
Total assets10,580,51
311,404,69
711,802,51
812,868,30
514,384,23
516,342,00
0
Liabilities and Equity
Accounts payable
two year average turnover (20.1)
398,388 308,384 220,992 267,903 311,160 401,529
Accured expenses
two year average turnover (5.2)
305,890 167,164 113,671 119,653 118,252 108,890
Other current liabilities constant 691,710 691,710 691,710 691,710 691,710 691,710
Other long-term liaibilities constant 19,034 19,034 19,034 19,034 19,034 19,034
Other Equity constant 7,070,024 7,070,024 7,070,024 7,070,024 7,070,024 7,070,024
Retained earningsfunction of earnings and dividends
1,975,353 3,028,268 3,566,972 4,579,867 6,053,941 7,930,698
Treasury shares constant (85,447) (85,447) (85,447) (85,447) (85,447) (85,447) Minority interest constant 205,561 205,561 205,561 205,561 205,561 205,561 Total liabilities & equity
10,580,513
11,404,697
11,802,518
12,868,305
14,384,235
16,342,000
30

Business Analysis and Evaluation May 20, 2013
Cashflow statementCash flow statement forecasted 2012 2013 2014 2015 2016 2017
Cash from OperationsNet income (loss) 3,016,851 2,934,844 2,420,633 2,894,824 3,356,003 3,758,686
Depreciation/amortization
two yearaverage depr/netppe (10%) 212,835 255,611 264,528 288,415 322,391 366,270
(Inc) decr in operating accounts 49,856 44,901 164,848 (149,144) (141,330) (63,943)Net Cash Prov (Used) by Operations 3,279,542 3,235,356 2,850,009 3,034,095 3,537,065 4,061,014
Cash from InvestingCapital expenditures (347,814) (440,334) (353,691) (527,288) (662,154) (805,061)Other investing activities 482,438 0 0 0 0 0Net Cash Prov (Used) by Investing 134,624 (440,334) (353,691) (527,288) (662,154) (805,061)
Cash from FinancingNet proceeds from stock trans 0 0 0 0 0 0Net proceeds from debt 27009 0 0 0 0 0Dividends, Other Distribution (1,881,929)
(1,881,929)
(1,881,929)
(1,881,929)
(1,881,929)
(1,881,929)
Net Cash Prov (Used) by Financing (1,854,920)
(1,881,929)
(1,881,929)
(1,881,929)
(1,881,929)
(1,881,929)
Change in Cash 1,559,246 913,093 614,390 624,878 992,982 1,374,024
4. Sensitivity Analysis
TERMINAL GROWTH
WACC
72,374.55 0.0390 0.0395 0.0400 0.0405 0.0410
0.1739 72,872.79 73,052.45 73,233.45 73,415.8173,599.5
4
0.1744 72,587.60 72,765.63 72,944.99 73,125.6873,307.7
3
0.1749 72,304.55 72,480.97 72,658.70 72,837.7473,018.1
3
0.1754 72,023.60 72,198.43 72,374.55 72,551.9772,730.7
20.1759 71,744.74 71,917.99 72,092.52 72,268.34 72,445.4
31

Business Analysis and Evaluation May 20, 20137
0.1764 71,467.93 71,639.64 71,812.60 71,986.8372,162.3
5
0.1769 71,193.17 71,363.34 71,534.75 71,707.4271,881.3
5
5. FCFF
6. Peer comparison
No. Company Country
Market Capital (USDmillion) ROE P/B P/E
1 China XLX Fertiliser Ltd. China 240 9.9 0.7 5.4
2 Luxi Chemical Group Co., Ltd. China 974.9 11 1.2 4.3
3 Liaoning Huajin Tongda Chemicals China 1181.2 12 1.9 12.1
4 China BlueChemical Ltd. China 3044.7 17.5 1.6 10.1
5 Chambal Fertilizers and Chemicals India 562.8 9.7 1.8 18.9
6 Rashtriya Chemicals and Fertilizers India 604.8 11.9 1.5 8.6
7 Fauji Fertilizer Bin Qasim Limited
Pakistan 176.8 12.1 0.7 8
8 Sichuan Meifeng Chemical Industry China 502.2 14.3 1.5 10.5
32
WACC CALCULATION (2013E)
Interest expense 1,549,000,000D 36,215,000,000Rd 0.04Beta 1.11
Risk premium 0.08Risk free rate 0.09
Re 0.18D/E 0.16
D/(D+E) 0.0040256136WACC 0.1754

Business Analysis and Evaluation May 20, 20139 Shandong Kingenta
Ecological China 1687.3 15 3.2 20.7
10 Hubei Yihua Chemical Industry China 1719.7 20.5 1.9 8.3Average 1069.44 13.39 1.6 10.69
DPMVietnam 653.05 33.7 1.47 4.48
33