Axial Load-Bending Moment Diagrams of Carbon FRP Wrapped Hollow Core Reinforced Concrete Columns
34
1 2 3 4 5 6 7 8 9 10 11 12 13 14 15 16 17 18 19 20 21 22 23 24 25 26 27 28 29 30 31 32 33 34 35 36 37 38 39 40 41 42 43 44 45 46 47 48 49 50 51 52 53 54 55 56 57 58 59 60 61 62 63 64 65 1 Axial Load-Bending Moment Diagrams of Carbon-FRP Wrapped Hollow Core Reinforced Concrete Columns Veysel Yazici 1 , Muhammad N.S. Hadi 2 Abstract: Hollow core reinforced concrete columns are generally preferred in use to decrease the cost and weight/stiffnesss ratio of members such as bridge columns and piles. With a simplified stress state assumption, strengthening a hollow core reinforced concrete column with FRP wrapping provides a biaxial confinement to the concrete which leads to a need of defining the effect of FRP wrapping on the strength and ductility of the hollow core reinforced concrete columns. In this study, two groups of four hollow core reinforced concrete columns (205 mm outer diameter, 56 mm hollow core diameter, and 925 mm height) were tested under concentric, eccentric (25 mm and 50 mm eccentricity) and bending loads to observe the effect of Carbon- FRP (CFRP) wrapping. All the columns had internal steel reinforcement. Half of the columns had three layers of circumferential CFRP wrapping, whereas the other half had no external confinement. Axial load-bending moment (P-M) diagrams of each group were drawn using the obtained experimental results for both groups. It was observed that, CFRP wrapped columns had higher load and moment carrying capacities than the other group. An analytical model is proposed for drawing the P-M diagram of CFRP wrapped hollow core reinforced concrete columns. CE Database subject headings: FRP; Column strengthening; Hollow sections; Eccentric Loads; Axial load-Bending moment diagram 1 Phd Candidate, School of Civil, Mining and Environmental Engineering, University of Wollongong, Wollongong NSW 2522 Australia. E-mail: [email protected] 2 Associate Professor in Structural Engineering, School of Civil, Mining and Environmental Engineering, University of Wollongong, Wollongong NSW 2522 Australia (corresponding author). E-mail: [email protected] Manuscript Click here to download Manuscript: paper_asce_hadi.doc
-
Upload
independent -
Category
Documents
-
view
0 -
download
0
Transcript of Axial Load-Bending Moment Diagrams of Carbon FRP Wrapped Hollow Core Reinforced Concrete Columns

1 2 3 4 5 6 7 8 9 10 11 12 13 14 15 16 17 18 19 20 21 22 23 24 25 26 27 28 29 30 31 32 33 34 35 36 37 38 39 40 41 42 43 44 45 46 47 48 49 50 51 52 53 54 55 56 57 58 59 60 61 62 63 64 65
1
Axial Load-Bending Moment Diagrams of Carbon-FRP Wrapped Hollow Core Reinforced Concrete Columns
Veysel Yazici1, Muhammad N.S. Hadi2
Abstract: Hollow core reinforced concrete columns are generally preferred in use to decrease
the cost and weight/stiffnesss ratio of members such as bridge columns and piles. With a
simplified stress state assumption, strengthening a hollow core reinforced concrete column with
FRP wrapping provides a biaxial confinement to the concrete which leads to a need of defining
the effect of FRP wrapping on the strength and ductility of the hollow core reinforced concrete
columns. In this study, two groups of four hollow core reinforced concrete columns (205 mm
outer diameter, 56 mm hollow core diameter, and 925 mm height) were tested under concentric,
eccentric (25 mm and 50 mm eccentricity) and bending loads to observe the effect of Carbon-
FRP (CFRP) wrapping. All the columns had internal steel reinforcement. Half of the columns
had three layers of circumferential CFRP wrapping, whereas the other half had no external
confinement. Axial load-bending moment (P-M) diagrams of each group were drawn using the
obtained experimental results for both groups. It was observed that, CFRP wrapped columns had
higher load and moment carrying capacities than the other group. An analytical model is
proposed for drawing the P-M diagram of CFRP wrapped hollow core reinforced concrete
columns.
CE Database subject headings: FRP; Column strengthening; Hollow sections; Eccentric Loads;
Axial load-Bending moment diagram
1 Phd Candidate, School of Civil, Mining and Environmental Engineering, University of Wollongong, Wollongong
NSW 2522 Australia. E-mail: [email protected]
2 Associate Professor in Structural Engineering, School of Civil, Mining and Environmental Engineering, University
of Wollongong, Wollongong NSW 2522 Australia (corresponding author). E-mail: [email protected]
ManuscriptClick here to download Manuscript: paper_asce_hadi.doc

1 2 3 4 5 6 7 8 9 10 11 12 13 14 15 16 17 18 19 20 21 22 23 24 25 26 27 28 29 30 31 32 33 34 35 36 37 38 39 40 41 42 43 44 45 46 47 48 49 50 51 52 53 54 55 56 57 58 59 60 61 62 63 64 65
2
Introduction
Hollow columns have been preferred to solid columns to reduce the cost of the structures, and to
decrease the self weight of the structures where it is technically necessary. In spite of their
widespread use, even modern design codes do not address any specific problems related to
hollow section columns (Lignola et al. 2007, Sheikh et al. 2007). In practice, hollow columns are
commonly constructed as bridge columns and piles.
It is a well known fact that the infrastructure of a country needs to be maintained either by
demolishing the insufficient structures and building new ones, or by rehabilitating the old ones
with appropriate techniques to meet the current requirements. Thus, it is highly possible that
hollow core reinforced columns will also be needed to be strengthened where necessary.
The use of Fiber Reinforced Polymer (FRP) sheets to strengthen RC columns under axial loads
has been a popular subject for the last decade or so. Its resistance to corrosion, excellent
durability to harsh environmental conditions, high strength to weight ratio, ease of installation to
existing structures, and being electromagnetically inert make this new material more suitable to
use when compared to steel (ISIS Canada 2001). Studies conducted by Nanni and Bradford
(1995), Mirmiran and Shahawy (1997), Fam and Rizkalla (2001), Li and Hadi (2003), Hadi
(2005 a,b,c), Mathys at al. (2005) have shown that ductility and strength of concrete columns are
substantially improved by wrapping FRP sheets around the columns.

1 2 3 4 5 6 7 8 9 10 11 12 13 14 15 16 17 18 19 20 21 22 23 24 25 26 27 28 29 30 31 32 33 34 35 36 37 38 39 40 41 42 43 44 45 46 47 48 49 50 51 52 53 54 55 56 57 58 59 60 61 62 63 64 65
3
Many studies have shown that FRP confinement alters the stress-strain relationship of concrete
in a different way than steel confinement (Teng et al. 2002, Samaan et al. 1998, Spoelstra and
Monti 1999, Toutanji 1999). The difference in the behavior of steel and FRP confined concrete is
due to the difference in the behaviour of steel and FRP (Figure 1). Steel is an elasto-plastic
material, that is, up to the yield load, it undergoes elastic deformation which can be recovered if
the load is removed. After the yield load, steel undergoes large deformations even if the load is
kept constant (regardless of the load increase). Thus, after the yield load, it is assumed that steel
confinement provides a constant confining stress resulting in a simplicity of stress calculations.
Unlike steel, FRP exhibits a linear deformation under tensile loading until failure. Thus, the
confinement it provides to the concrete is highly dependant on the stress level of FRP. There are
a number of equations that model the behaviour of steel confined concrete. Most of them seem to
be based on Richart et al. (1928). A number of studies, for example, Teng et al. (2002), Samaan
et al. (1998), Spoelstra and Monti (1999), Toutanji (1999) have proven that all previously
defined models for conventionally steel confined concrete need to be re-defined for FRP
confined concrete.
This paper presents the effects of FRP wrapping on axial load-bending moment (P-M) diagrams
of hollow core circular reinforced concrete columns, and results of an analytical and
experimental study conducted to draw P-M diagrams of circumferentially FRP wrapped hollow
core circular reinforced concrete columns. All columns were tested to failure by applying
concentric, eccentric, and pure bending loads. The analytical approach gave close enough results
to the test results, proving the load carrying capacities of FRP wrapped hollow core circular

1 2 3 4 5 6 7 8 9 10 11 12 13 14 15 16 17 18 19 20 21 22 23 24 25 26 27 28 29 30 31 32 33 34 35 36 37 38 39 40 41 42 43 44 45 46 47 48 49 50 51 52 53 54 55 56 57 58 59 60 61 62 63 64 65
4
reinforced concrete columns under concentric, eccentric and pure bending loads can be
sufficiently predicted.
Theoretical Considerations
Background
Although the only apparent difference from an FRP wrapped solid column seems to be the
hollow portion in the center, confinement mechanism of an FRP wrapped hollow core column
under an axial load is quite different.
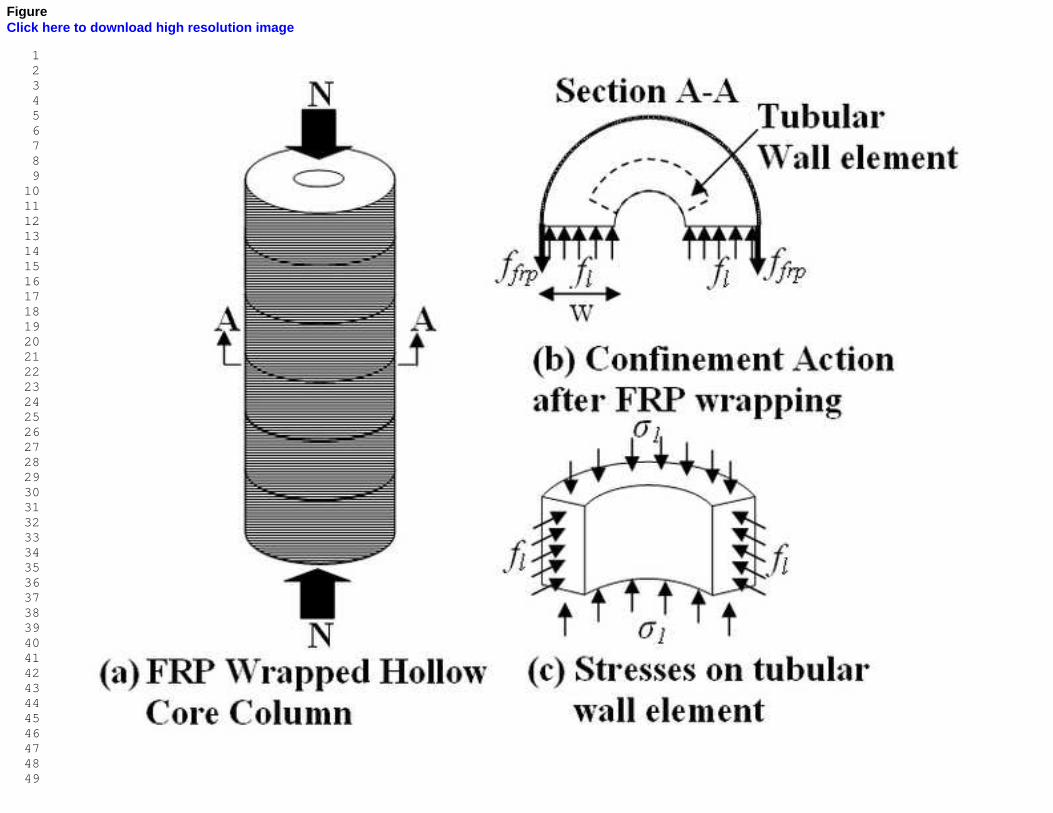
In fact, confinement stresses in hollow columns due to FRP wrapping are quite complex and
non-uniform (Lignola et al. 2008). The helical steel reinforcement is assumed to have no
confinement effect on the concrete. A constant average confining stress was assumed to develope
within the column under compressive loads due to FRP confinement only. According to this
simplified assumption, FRP wrapping at the outside face of a circular hollow core column
restrains the growth of the tube diameter as shown in Figure 2(a,b) and an average confinement
stress, fl, can be found by the following force equilibrium equation written for Section A-A:
w
tfftfwf frpfrp
lrpffrpl 22 (1)
Where w= thickness of the wall, ffrp= tensile strength of FRP in the hoop direction, fl= lateral
confining pressure, tfrp= total thickness of FRP.
The FRP applies a radial pressure to the outside face of the wall of the tube, which in turn causes
a circumferential compression stress fl in the curved tubular wall (Figure 2(c)). The
circumferential compression stress fl puts a concrete element cut out of the curved wall into

1 2 3 4 5 6 7 8 9 10 11 12 13 14 15 16 17 18 19 20 21 22 23 24 25 26 27 28 29 30 31 32 33 34 35 36 37 38 39 40 41 42 43 44 45 46 47 48 49 50 51 52 53 54 55 56 57 58 59 60 61 62 63 64 65
5
biaxial compression, with the primary stress σ1 arising from the axial load. In contrast to the
situation in a solid confined concrete section, there is no compressive confining stress acting on
the inside face of the curved wall in the radial direction (Zahn et al. 1990). Thus, according to
this constant average confinement stress assumption, any concrete element inside the column is
under biaxial state of stress as shown in Figure 3. Although biaxial state of stress for FRP
confined hollow columns may seem a simplistic assumption, it may be used to estimate the
capacity of hollow columns for a start. In fact, similar assumptions, such as constant confinement
stress, were made to determine the capacity of solid columns confined with FRP.
Although the concrete is assumed to be under biaxial confinement, its compressive strength and
deformation capability is increased. Since the FRP confined concrete stress-strain models
describe the behaviour of concrete under triaxial stress condition such as in the case of solid
columns, they are not suitable to use for biaxially confined concrete, as in the case of hollow
core columns.
To determine improved compressive strength as a result of FRP wrapping, fcc, a simplified
interaction diagram presented by Mander et al. (1988) that related fcc to the two orthogonal
stresses (fl) confining the concrete laterally was used in this study. This interaction diagram was
originally derived from the work of William and Warnke (1975).
The average confinement stress, fl can be calculated using Equation 1. Unconfined compressive
strength of concrete (fco) is determined by compression tests on the concrete. Using the curve for

1 2 3 4 5 6 7 8 9 10 11 12 13 14 15 16 17 18 19 20 21 22 23 24 25 26 27 28 29 30 31 32 33 34 35 36 37 38 39 40 41 42 43 44 45 46 47 48 49 50 51 52 53 54 55 56 57 58 59 60 61 62 63 64 65
6
biaxial state of stress on the simplified interaction diagram presented by Mander et al. (1988), the
fcc/fco value corresponding to fl/fco value can be read and fcc can be calculated.
In the same study, Mander et al. (1988) determined a general equation for the crushing strain of
concrete, εcc, under confinement.
11
co
cccocc f
fR (2)
where εco is the strain of unconfined concrete corresponding to the maximum stress. The
constant, R, was determined to be 5.0 by Mander et al. (1988) for concrete in triaxial
compression such as solid columns. Darwin and Pecknold (1977) determined an average value
3.25 for R after testing concrete panels under biaxial compression. Thus, a value of R=3.25 was
used in this study. A smaller R value gives a smaller crushing strain which implies that the stress
within the concrete reaches its maximum value, fcc, with a less deformation of concrete.
A continuous stress-strain model proposed by Mander et al. (1988) was used to express the
compressive stress in the concrete. The model is based on an equation proposed by Popovics
(1973).
rcc
c xr
rxff
1
'
(3)
where
cc
x
(4)
secEE
Er
C
C
(5)

1 2 3 4 5 6 7 8 9 10 11 12 13 14 15 16 17 18 19 20 21 22 23 24 25 26 27 28 29 30 31 32 33 34 35 36 37 38 39 40 41 42 43 44 45 46 47 48 49 50 51 52 53 54 55 56 57 58 59 60 61 62 63 64 65
7
cc
ccfE
'
sec (6)
where εc= compressive strain of concrete corresponding to axial stress fc; fcc=peak compressive
stress found from simplified interaction diagram; fco=compressive strength of unconfined
concrete. The value of εcc can be calculated by Equation 2. Ec is the modulus of elasticity for
unconfined concrete which was calculated using the equations given by AS3600 (2001) for this
particular study.
MPafEMPaffor cocco )043.0(40 '5.1' (7)
MPafEMPaffor cocco )12.0024.0(40 '5.1' (8)
where ρ= density of concrete in kg/m3 ( taken as 2400 kg/m3 in this study).
It is important to note that, the stress-strain model proposed above can also be used for
unconfined concrete just by substituting fco in place of fcc and co in place of co into Equations 2-
6, which implies that there is no confinement provided by an external FRP wrapping, and thus no
increase in the ultimate strength of the concrete. The model proposed by Mander et al. (1988)
then gives a stress-strain model for unconfined concrete under compression up to the crushing
strain (ε=0.003).
Theoretical P-M Diagrams of FRP wrapped hollow core columns
A P-M diagram is a continuous curve used to determine the axial load and bending moment
carrying capacity of a given reinforced concrete column cross section and materials. A point on
this curve may represent a concentric loading, an eccentric loading, or a pure bending load.

1 2 3 4 5 6 7 8 9 10 11 12 13 14 15 16 17 18 19 20 21 22 23 24 25 26 27 28 29 30 31 32 33 34 35 36 37 38 39 40 41 42 43 44 45 46 47 48 49 50 51 52 53 54 55 56 57 58 59 60 61 62 63 64 65
8
To draw a P-M diagram for an FRP wrapped hollow core reinforced concrete column, the
biaxially confined concrete model defined in the section above was utilized. This direct use of
stress-strain curves for uniformly confined concrete to eccentrically loaded columns implies the
assumption of a non-uniform confining pressure in an eccentrically loaded column which varies
from zero at the neutral axis position to a maximum value at the extreme compression fibre of
concrete as shown in Figure 4 (Teng et al. 2002).
The axial load capacity under concentric loading is given by
syccco AfAfN ' (9)
Where Ac= gross cross-sectional area of hollow column (mm2); fy= yield strength of longitudinal
steel reinforcement (MPa); As= total cross-sectional area of longitudinal steel reinforcement
(mm2); fcc= peak compressive stress (MPa) after FRP wrapping found from simplified interaction
diagram given by Mander et al. (1988).
For calculation of axial load capacities and moment capacities under eccentric loads and pure
bending, the cross-section of the column is assumed to be consisting of parallel finite strips with
small thicknesses for the ease of calculation (Figure 5), where b= total width of the strip (the
length on the hollow part is excluded where it intersects the hollow core), Δx= height of the strip,
k= depth of the centroid of the strip from the outermost concrete fibre. The heigth of the strips
(Δx) must be taken large enough to shorten the calculations and small enough to be close to
reflect the actual shape of the cross section. A value of 5 mm was taken as the heigth of
horizontal strips in this study
1 2 3 4 5 6 7 8 9 10 11 12 13 14 15 16 17 18 19 20 21 22 23 24 25 26 27 28 29 30 31 32 33 34 35 36 37 38 39 40 41 42 43 44 45 46 47 48 49 50 51 52 53 54 55 56 57 58 59 60 61 62 63 64 65
9
With the basic assumption that plane sections remain plane after bending, the strain in the centre
of each strip can be estimated and the corresponding stress is calculated according to the
biaxially confined concrete stress-strain model defined. For tensile strains in the concrete, the
stress will be assumed as zero since the concrete is generally assumed to have no tensile strength
in the calculations. Summation of the forces acting on the strips and the steel reinforcement adds
up to the axial load carrying capacity, and summation of the moments with respect to the
centerline of the section add up to the moment carrying capacity of the section under a given
eccentricity.
Experimental Program
The experimental part of this study involved testing two groups of four hollow core circular
reinforced concrete columns under different eccentricities and pure bending. All the columns had
a height of 925 mm. The cross section of the columns had an outer diameter of 205 mm and a
hollow part with an inner diameter of 56 mm, leaving a wall thickness (w) of 74.5 mm. The
concrete used to cast the columns had a 28 day compressive strength of 60 MPa. Longitudinal
steel reinforcement consisted of evenly distributed six N12 (12 mm diameter deformed bar) bars
which were tested to have 550 MPa tensile strength and tied inside a helical steel reinforcement.
The helical reinforcement was an R10 (10 mm diameter plain bar) helix with a 50 mm pitch
which were tested to have 300 MPa tensile strength. The steel reinforcement was placed into the
column moulds with 20 mm clearance to the outer moulds (Figure 6).
1 2 3 4 5 6 7 8 9 10 11 12 13 14 15 16 17 18 19 20 21 22 23 24 25 26 27 28 29 30 31 32 33 34 35 36 37 38 39 40 41 42 43 44 45 46 47 48 49 50 51 52 53 54 55 56 57 58 59 60 61 62 63 64 65
10
A PVC pipe having an inner diameter of 205 mm was used as the outer mould, and a 56 mm
outer diameter PVC pipe was used to form the hollow part. After setting of the concrete, the
outer moulds were removed using the previously cut joints on the PVC pipe, and the inner PVC
pipes were pulled out by means of a hydraulic jack.
In total eight specimens (subdivided into two groups denoted here as C for externally unconfined
and L for externally confined in the hoop direction by wrapping with 3 layers of lateral FRP
sheets) were cast and tested. All specimens were internally reinforced with the same amount of
steel reinforcement. The first group of four RC columns were without external confinement,
whereas the second group of four columns had three layers of CFRP sheets wrapped
circumferentially around the columns applying a wet lay-up process with epoxy resin. The CFRP
was tested according to ASTM 3039 (2006) standard in order to determine its tensile strength.
The CFRP specimens were made of three unidirectional layers of CFRP and epoxy was used to
adhere the three layers. The test revealed that the tensile strength of the three layered CFRP was
920 MPa with a corresponding maximum strain of 0.02.
One specimen from each group (Specimens C0 and L0) was tested to failure under concentric
loading, the next two specimens were tested under 25 mm (C25 and L25) and 50 mm (C50 and
L50) eccentric loading. The final specimen of each group (CB and LB) was tested under pure
bending. Table 1 shows a summary of the specimens and testing conditions for each specimen.
Compared to the column diameter (D=205 mm), 25 mm eccentricity can be assumed as a
relatively small eccentricity (e/D=0.1212). However, 50 mm eccentricity can be assumed as a

1 2 3 4 5 6 7 8 9 10 11 12 13 14 15 16 17 18 19 20 21 22 23 24 25 26 27 28 29 30 31 32 33 34 35 36 37 38 39 40 41 42 43 44 45 46 47 48 49 50 51 52 53 54 55 56 57 58 59 60 61 62 63 64 65
11
relatively large eccentricity (e/D=0.244). It was aimed to test the hollow columns under both
small and relatively large eccentricities. Eccentric loadings were applied to the columns by
means of especially designed and manufactured loading heads (Figure 7).
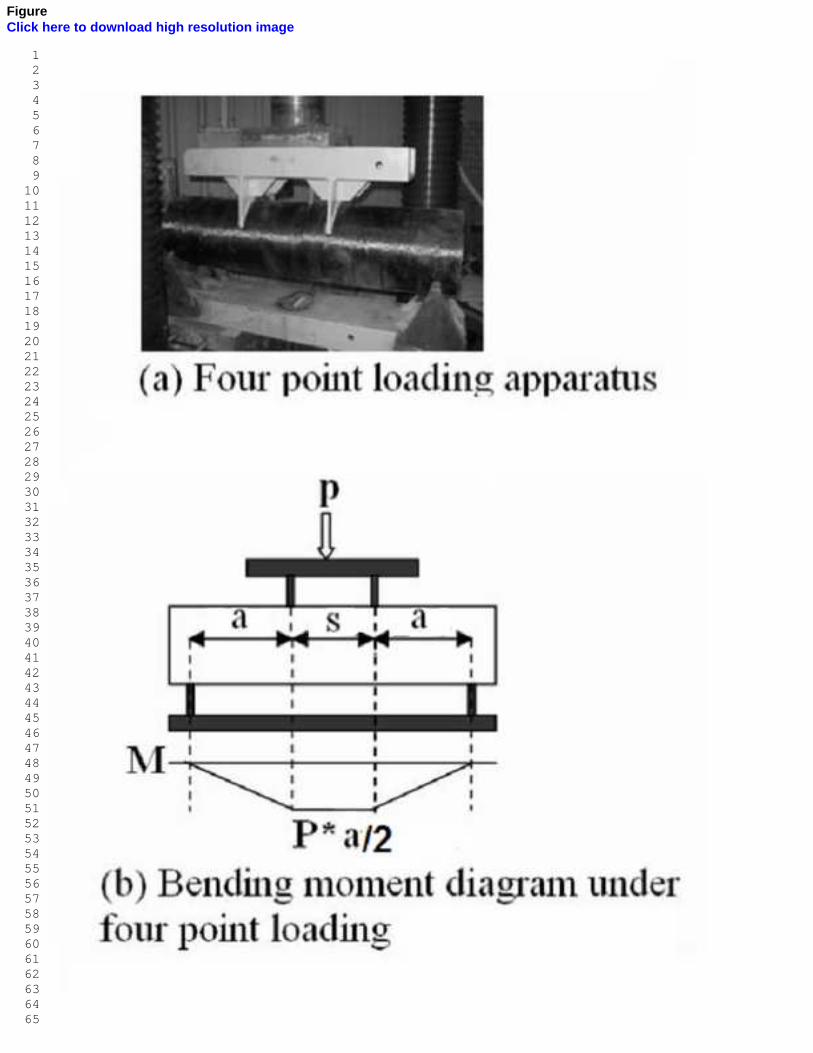
Pure bending was applied to specimens (in fact beams) CB and LB by means of a four point
loading apparatus. The method of loading and moment distribution for the Specimens CB and
LB is shown in Figure 8.
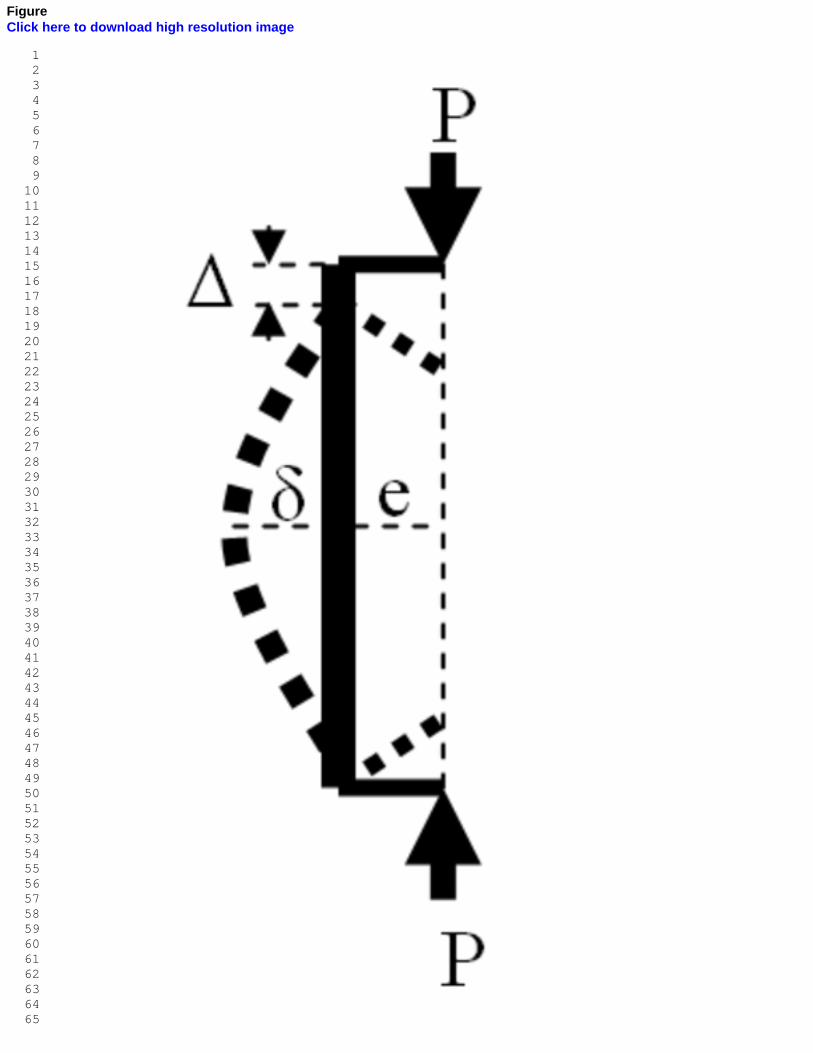
Load, P, applied to the columns was measured by the internal load cell of the loading machine.
For the axially loaded specimens, the axial deformations (Δ) of the columns were monitored by
an LVDT attached to the moving (lower) plate of the loading device. Lateral deformations of the
specimens (δ) (Figure 9) were monitored at the mid height of columns using a laser displacement
sensor.
All specimens were tested at the laboratories of the School of Civil, Mining and Environmental
Engineering at the University of Wollongong. A 500 tonne Denison compression machine was
used to test the column and beam specimens.
Experimental Results
All specimens were tested to failure. Table 2 shows a summary of testing the specimens. For 25
mm and 50 mm eccentrically loaded columns, bending moment capacities are calculated by
multiplying the maximum load capacity (Pmax) and the eccentricity. Bending moment capacities
including the secondary moments (MII) were also calculated as follows:

1 2 3 4 5 6 7 8 9 10 11 12 13 14 15 16 17 18 19 20 21 22 23 24 25 26 27 28 29 30 31 32 33 34 35 36 37 38 39 40 41 42 43 44 45 46 47 48 49 50 51 52 53 54 55 56 57 58 59 60 61 62 63 64 65
12
)(max ePM II(10)
Where Pmax = max axial load, e=eccentricity, and δ=lateral deflection at maximum load.
For specimens CB and LB, the moment capacity was calculated using the equation:
)(2
aP
M (11)
Where P is the maximum load applied to a specimen with four point apparatus, and the constant
a is the length of the shear span which is the distance between an outer loading point to the
closer inner loading point (a= 280 mm, s=270 mm in this study, see Figure 8).
Results And Discussion
Test results show that (Table 2), CFRP wrapping of hollow columns is more effective on the
axial load carrying capacity, Pmax, when the loading is concentric. Compared to the unwrapped
specimen C0, there was 50.91% increase in the axial load carrying capacity of the FRP wrapped
specimen, and 178.67% increase in the axial deflection corresponding to the maximum load (Δ).
For specimens tested under 25 mm eccentricity, L25 had a 5.03% larger axial load carrying
capacity, Pmax, than C25. The corresponding axial deformations for both specimens were similar
(2.13% greater for L25), whereas the lateral deformation capacity was 83.21% greater for L25.
For specimens tested under 50 mm eccentricity, L50 had a 22.23% larger axial load carrying
capacity than specimen C50. For the same eccentricity, axial and lateral deformation capacity
increases were much more substantial for L50, which were 105.02% and 133.71%, respectively.
Beam specimens (CB and LB) were tested under pure bending conditions. Flexural load carrying

1 2 3 4 5 6 7 8 9 10 11 12 13 14 15 16 17 18 19 20 21 22 23 24 25 26 27 28 29 30 31 32 33 34 35 36 37 38 39 40 41 42 43 44 45 46 47 48 49 50 51 52 53 54 55 56 57 58 59 60 61 62 63 64 65
13
capacity and the corresponding maximum deformation of LB were larger than CB by 58.16%
and 28.35%, respectively.
In deformation aspect, eccentrically loaded CFRP wrapped columns behaved like slender
columns in which the effect of secondary moments are considerable due to large lateral
deformations. In internally steel reinforced columns, axial load carrying capacities decrease as
the secondary moments increase. In CFRP wrapped columns P-M diagrams were modified so as
to increase both the axial load capacities and bending moment capacities at the same time.
As experimental P-M diagrams of FRP wrapped columns are different than that of the columns
having only internal steel reinforcement, the stress-strain model described in the Background
section above was used to predict the P-M diagram of both columns without external FRP
wrapping and CFRP wrapped hollow core reinforced concrete columns. The capacities under
different loading conditions were calculated using the approach described in the Theoretical P-M
Diagrams of FRP wrapped hollow core columns section above. The calculated P-M diagram and
experimental results for the specimens without external CFRP wrapping and CFRP wrapped
specimens are shown in Figure 10 and Figure 11, respectively.
When the theoretical and experimental values for the axial load (P) carrying capacity of the
specimens under concentric and eccentric loads are compared, it can be seen that the proposed
model gave closer predictions for FRP wrapped sample columns under eccentric loads (see Table
3). However, the scatter between the experimental and the theoretical value for pure bending
capacity is higher for LB (40%) (see Table 4).

1 2 3 4 5 6 7 8 9 10 11 12 13 14 15 16 17 18 19 20 21 22 23 24 25 26 27 28 29 30 31 32 33 34 35 36 37 38 39 40 41 42 43 44 45 46 47 48 49 50 51 52 53 54 55 56 57 58 59 60 61 62 63 64 65
14
For the specimens without CFRP wrapping, secondary moments were much smaller than CFRP
wrapped specimens, which reveals that CFRP wrapping significantly increased the lateral
deformation capacity of specimens under compressive loads. The axial load carrying capacities
and corresponding axial deformations were significantly increased for CFRP wrapped columns
(see Table 2).
The scatter between the experimental results and the predicted capacities imply that the assumed
biaxial state of stress is only a simplified approach and the actual confining stresses are more
complex. It can also be said that the differences may have arisen from the insufficiency of
proposed model to quantify the increase in strength and strain capacity of confined concrete
under given loading conditions.
Conclusions
A total of eight hollow core reinforced columns were tested. Strength improvement for CFRP
wrapped column under concentric load was higher than eccentrically loaded CFRP wrapped
columns. Lateral deformation capacities under eccentric loads were substantially increased after
CFRP wrapping. The results may be interpreted that, the CFRP wrapping of hollow core
reinforced concrete columns provides a better ductility under eccentric loads. Nevertheless, the
effect of secondary moments becomes more important after CFRP wrapping.
Based on the experimental results it can be concluded that although the concrete was under a
state of two dimensional stress, CFRP wrapping proved to increase both the strength and the

1 2 3 4 5 6 7 8 9 10 11 12 13 14 15 16 17 18 19 20 21 22 23 24 25 26 27 28 29 30 31 32 33 34 35 36 37 38 39 40 41 42 43 44 45 46 47 48 49 50 51 52 53 54 55 56 57 58 59 60 61 62 63 64 65
15
ductility (by increasing axial and lateral deformation capacities) of the tested column specimens.
In addition the developed theoreticall model yielded results that are comparable to the
experimental results however the scatter between the test results and predicted capacities are
quite large for some columns. The study is believed to give an insigth on the behaviour of FRP
wrapped hollow core reinforced concrete columns under various loading conditions.

1 2 3 4 5 6 7 8 9 10 11 12 13 14 15 16 17 18 19 20 21 22 23 24 25 26 27 28 29 30 31 32 33 34 35 36 37 38 39 40 41 42 43 44 45 46 47 48 49 50 51 52 53 54 55 56 57 58 59 60 61 62 63 64 65
16
Nomenclature
The following symbols are used in this paper:
Ac = gross cross-sectional area of hollow column;
As = total cross-sectional area of longitudinal steel reinforcement;
e = eccentricity;
Ec = modulus of elasticity for unconfined concrete;
fcc = improved compressive strength as a result of FRP wrapping;
ffrp = tensile strength of FRP in the hoop direction;
fy = yield strength of longitudinal steel reinforcement;
w = thickness of the hollow column wall;
fl = lateral confining pressure;
MI = Bending moment capacity excluding secondary moments;
MII = Bending moment capacity including secondary moments;
Pmax = max axial load applied to column;
tfrp = total thickness of FRP;
δ = lateral deflection at maximum load;
εc = strain of concrete;
εcc = crushing strain of concrete;
εco = strain of unconfined concrete corresponding to the maximum stress; and
ρ = density of concrete, taken as 2400 kg/m3.

1 2 3 4 5 6 7 8 9 10 11 12 13 14 15 16 17 18 19 20 21 22 23 24 25 26 27 28 29 30 31 32 33 34 35 36 37 38 39 40 41 42 43 44 45 46 47 48 49 50 51 52 53 54 55 56 57 58 59 60 61 62 63 64 65
17
References
AS 3600-2001, Australian Design Code for Concrete structures.
ASTM 3039-2006, Standard test method for tensile properties of Polymer Matrix Composite Materials.
Darwin, D., and Pecknold. D.A. (1977), “Analysis of Cyclic Loading of plane Reinforced Concrete Structures”, Computers and Structures, 7(1), 137-147.
Fam, A.Z., and Rizkalla, S.H. (2001), “Behaviour of Axially Loaded Concrete-Filled Fiber Reinforced Polymer Tubes”, ACI Structural Journal, 98(3), 280-289.
Hadi, M.N.S. (2005 a), “Behaviour of FRP Wrapped Normal Strength Concrete Columns Under Eccentric Loading”, Composite Structures, 72(1), 503-511.
Hadi, M.N.S. (2005 b), “Behaviour of FRP Strengthened Concrete Columns Under Eccentric Compression Loading”, Composite Structures, 77(1), 92-96.
Hadi, M.N.S. (2005 c), “The Behaviour of FRP Wrapped HSC Columns Under Different Eccentric Loads”, Composite Structures, 78(1), 560-566.
ISIS Canada (2001), “Design Manual No. 4: Strengthening Reinforced Concrete Structures with Externally-Bonded Fiber Reinforced Polymers”, The Canadian Network of Centers of Excellence on Intelligent Sensing for Innovative Structures, Winnipeg, Canada.
Li, J., Hadi, M.N.S. (2003), “Behaviour of Externally Confined High-Strength Concrete Columns Under Eccentric Loading”, Composite Structures, 62(1), 145-153.
Lignola, G.P., Prota, A., Manfredi, G., and Cosenza, E. (2007), “Deformability of Reinforced Concrete Hollow Columns Confined with CFRP”, ACI Structural Journal, 104(5), 629-637.
Lignola, G.P., Prota, A., Manfredi, G., and Cosenza, E. (2008), “Unified theory for confinement of RC solid and hollow circular columns”, Composites: Part B, 39 (2008) 1151–1160.
Mander, J.B., Priestley, M.J.N., and Park, R. (1988), “Theoretical Stress-strain Model for Confined Concrete”, Journal of Structural Engineering, ASCE, 114(8), 1804-1826.
Mathys,S., Toutanji, H., Audenaert, K., and Taerwe, L., (2005), “Axial Load Behaviour of Large Scale Columns Confined with Fiber Reinforced Polymer Composites”, ACI Structural Journal, 102(2), 258-267.
Mirmiran, A. and Shahawy, M. (1997), “Behaviour of Concrete Confined by Fiber Composites”, Journal of Structural Engineering, ASCE, 123(5), 583-590.

1 2 3 4 5 6 7 8 9 10 11 12 13 14 15 16 17 18 19 20 21 22 23 24 25 26 27 28 29 30 31 32 33 34 35 36 37 38 39 40 41 42 43 44 45 46 47 48 49 50 51 52 53 54 55 56 57 58 59 60 61 62 63 64 65
18
Nanni, A. and Bradford, N.M. (1995), “FRP Jacketed Concrete under Uniaxial Compression”, Cement and Building Materials, 9(2), 115-124.
Popovics, S. (1977), “A Numerical Approach to the Complete Stress-Strain Curves of Concrete”, Cement and Concrete Research, 3(5), 583-599.
Richart, F.E., Brandtzaeg, A., and Brown, R.L. (1928), “A Study of the Failure of Concrete under Combined Compressive Stresses”, Bulletin 185, University of Illinois Engineering Experimental Station, Champaign, Ill.
Samaan, M., Mirmiran,A. and Shahawy, M. (1998), “Model of Concrete Confined by Fiber Composite”, Journal of Structural Engineering, ASCE, 124(9), 1025-1031.
Sheikh, M.N, Vivier, A. And Légeron, F. (2007), “Seismic Assessment Of Hollow Core Concrete Bridge Piers”, Ninth Canadian Conference on Earthquake Engineering Ottawa, Ontario.
Spoelstra, M.R. and Monti, G. (1999), “FRP-confined concrete model”, Journal of Composites for Construction, ASCE, 3(3), 143-150.
Teng, J.G., Chen, J.F., Smith, S.T., Lam, L. (2002), “FRP-Strengthened RC structures”, John Wiley & Sons Ltd., West Sussex, England.
Toutanji, H.A. (1999), “Stress-strain characteristics of concrete columns externally confined with advanced fiber composite sheets”, ACI Materials Journal, 96(3), 397-404.
William, K.J., and Warnke, E.P. (1975), “Constitutive Model for the Triaxial Behaviour of Concrete”, IABSE Proceedings, International Association for Bridge and Structural Engineering, Zurich.
Zahn, F.A., Park, R., and Priestley, M.J.N. (1990), “Flexural Strength and Ductility of Circular Hollow Reinforced Concrete Columns without Confinement on Inside Face”, ACI Structural Journal, 87(2), 156-166.
1 2 3 4 5 6 7 8 9 10 11 12 13 14 15 16 17 18 19 20 21 22 23 24 25 26 27 28 29 30 31 32 33 34 35 36 37 38 39 40 41 42 43 44 45 46 47 48 49 50 51 52 53 54 55 56 57 58 59 60 61 62 63 64 65
19
List of Tables
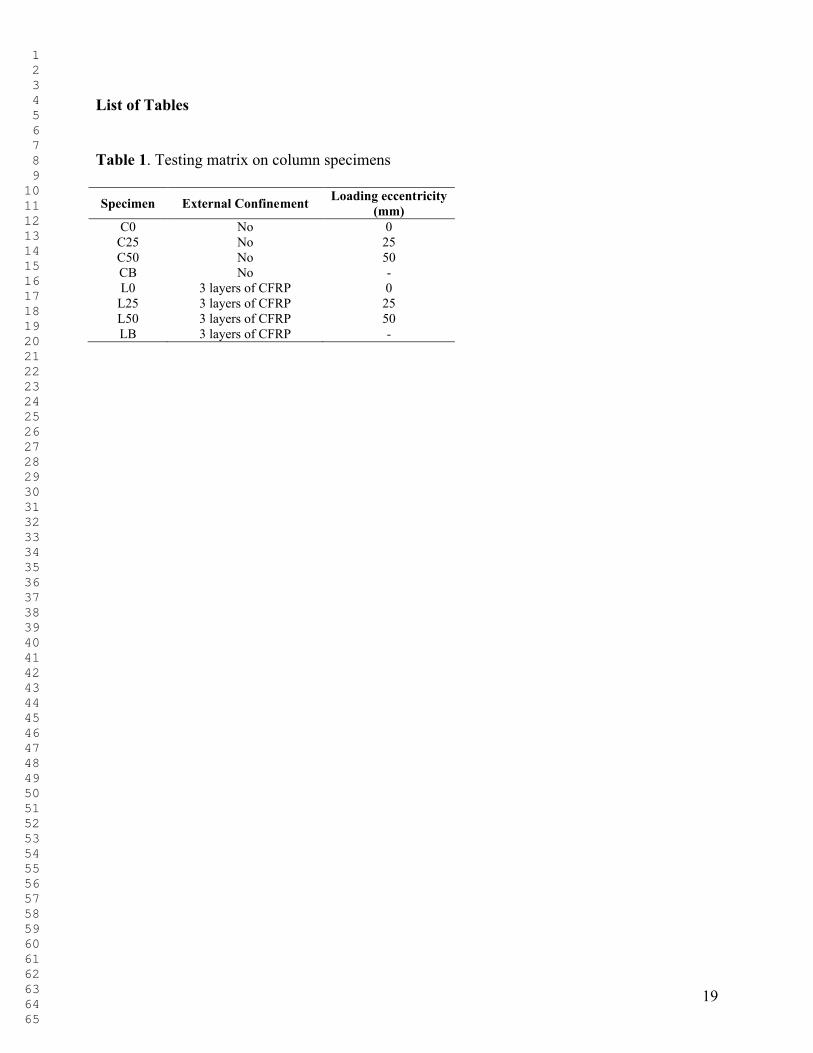
Table 1. Testing matrix on column specimens
Specimen External ConfinementLoading eccentricity
(mm)C0 No 0
C25 No 25C50 No 50CB No -L0 3 layers of CFRP 0
L25 3 layers of CFRP 25L50 3 layers of CFRP 50LB 3 layers of CFRP -

1 2 3 4 5 6 7 8 9 10 11 12 13 14 15 16 17 18 19 20 21 22 23 24 25 26 27 28 29 30 31 32 33 34 35 36 37 38 39 40 41 42 43 44 45 46 47 48 49 50 51 52 53 54 55 56 57 58 59 60 61 62 63 64 65
20
Table 2. Summary of column testing results
SpecimenMax. Load, (kN)
Axial Deflection
at max.load,Δ, (mm)
Lateral Deflection at max. load, δ, (mm)
Max. axial Load,Pmax (kN)
MI=Pmaxe(kNm)
MII=Pmax(e+δ)(kNm)
C0 2145.4 4.50 0 2145.4 0 0C25 1699.5 7.03 4.17 1699.5 42.49 49.52C50 915.7 4.38 5.34 915.7 45.78 50.67CBa 207.2 - 7.62 b 0 29.01 29.01L0 3237.7 12.54 0 3237.7 0 0
L25 1785.0 7.18 7.64 1785.0 44.63 58.26L50 1119.3 8.98 12.48 1119.3 55.97 69.93LBa 327.7 - 9.78 b 0 45.88 45.88
a Specimens CB and LB were loaded flexurally. b Lateral deflections for CB and LB are in the direction of loading, thus they do not create secondary moments.

1 2 3 4 5 6 7 8 9 10 11 12 13 14 15 16 17 18 19 20 21 22 23 24 25 26 27 28 29 30 31 32 33 34 35 36 37 38 39 40 41 42 43 44 45 46 47 48 49 50 51 52 53 54 55 56 57 58 59 60 61 62 63 64 65
21
Table 3. Comparison of Experimental and Theoretical Results for concentrically and eccentrically loaded column samples.
SpecimenExperimental
Maximum Axial Load (kN)
Theoretical Maximum Axial Load (kN)
Difference (%)
C0 2145.4 2205.8 -2.81C25 1699.5 1251.6 26.4C50 915.7 810.3 11.5L0 3237.7 2828.2 12.6
L25 1785.0 1821.8 -2.1L50 1119.3 1194.5 -6.7

1 2 3 4 5 6 7 8 9 10 11 12 13 14 15 16 17 18 19 20 21 22 23 24 25 26 27 28 29 30 31 32 33 34 35 36 37 38 39 40 41 42 43 44 45 46 47 48 49 50 51 52 53 54 55 56 57 58 59 60 61 62 63 64 65
22
Table 4. Comparison of Experimental and Theoretical Results for column samples tested under pure bending.
Specimen
Experimental Maximum Bending
Moment (kNm)
Theoretical Maximum Bending Moment
(kNm)Difference (%)
CBa 29.0 24.9 14.1LBa 45.9 27.7 40.0

1 2 3 4 5 6 7 8 9 10 11 12 13 14 15 16 17 18 19 20 21 22 23 24 25 26 27 28 29 30 31 32 33 34 35 36 37 38 39 40 41 42 43 44 45 46 47 48 49 50 51 52 53 54 55 56 57 58 59 60 61 62 63 64 65
23
List of Figures
Figure 1. Stress-strain relationship for unconfined, steel confined and FRP-confined concrete.
Figure 2 . Stresses in the wall of circular hollow core column.
Figure 3. Concrete element under biaxial compression.
Figure 4 . Stress-strain distribution for FRP wrapped hollow core reinforced concrete column.
Figure 5. Division of cross section into parallel strips.
Figure 6. Geometry of hollow core circular columns.
Figure 7. Loading heads for eccentric loading.
Figure 8. (a)Four point loading apparatus, (b) bending moment diagram.
Figure 9. Axial (Δ) and lateral (δ) deformations of column under the load applied with an eccentricity (e).
Figure 10. Calculated P-M diagram and Experimentally drawn P-M diagrams of hollow core columns without external CFRP wrapping.
Figure 11. Calculated P-M diagram and experimental P-M diagrams of CFRP wrapped hollow core columns.

1 2 3 4 5 6 7 8 9 10 11 12 13 14 15 16 17 18 19 20 21 22 23 24 25 26 27 28 29 30 31 32 33 34 35 36 37 38 39 40 41 42 43 44 45 46 47 48 49
FigureClick here to download high resolution image
1 2 3 4 5 6 7 8 9 10 11 12 13 14 15 16 17 18 19 20 21 22 23 24 25 26 27 28 29 30 31 32 33 34 35 36 37 38 39 40 41 42 43 44 45 46 47 48 49
FigureClick here to download high resolution image

1 2 3 4 5 6 7 8 9 10 11 12 13 14 15 16 17 18 19 20 21 22 23 24 25 26 27 28 29 30 31 32 33 34 35 36 37 38 39 40 41 42 43 44 45 46 47 48 49
FigureClick here to download high resolution image

1 2 3 4 5 6 7 8 9 10 11 12 13 14 15 16 17 18 19 20 21 22 23 24 25 26 27 28 29 30 31 32 33 34 35 36 37 38 39 40 41 42 43 44 45 46 47 48 49
FigureClick here to download high resolution image

1 2 3 4 5 6 7 8 9 10 11 12 13 14 15 16 17 18 19 20 21 22 23 24 25 26 27 28 29 30 31 32 33 34 35 36 37 38 39 40 41 42 43 44 45 46 47 48 49
FigureClick here to download high resolution image

1 2 3 4 5 6 7 8 9 10 11 12 13 14 15 16 17 18 19 20 21 22 23 24 25 26 27 28 29 30 31 32 33 34 35 36 37 38 39 40 41 42 43 44 45 46 47 48 49
FigureClick here to download high resolution image

1 2 3 4 5 6 7 8 9 10 11 12 13 14 15 16 17 18 19 20 21 22 23 24 25 26 27 28 29 30 31 32 33 34 35 36 37 38 39 40 41 42 43 44 45 46 47 48 49
FigureClick here to download high resolution image
1 2 3 4 5 6 7 8 9 10 11 12 13 14 15 16 17 18 19 20 21 22 23 24 25 26 27 28 29 30 31 32 33 34 35 36 37 38 39 40 41 42 43 44 45 46 47 48 49 50 51 52 53 54 55 56 57 58 59 60 61 62 63 64 65
FigureClick here to download high resolution image
1 2 3 4 5 6 7 8 9 10 11 12 13 14 15 16 17 18 19 20 21 22 23 24 25 26 27 28 29 30 31 32 33 34 35 36 37 38 39 40 41 42 43 44 45 46 47 48 49 50 51 52 53 54 55 56 57 58 59 60 61 62 63 64 65
FigureClick here to download high resolution image

1 2 3 4 5 6 7 8 9 10 11 12 13 14 15 16 17 18 19 20 21 22 23 24 25 26 27 28 29 30 31 32 33 34 35 36 37 38 39 40 41 42 43 44 45 46 47 48 49
FigureClick here to download high resolution image

1 2 3 4 5 6 7 8 9 10 11 12 13 14 15 16 17 18 19 20 21 22 23 24 25 26 27 28 29 30 31 32 33 34 35 36 37 38 39 40 41 42 43 44 45 46 47 48 49
FigureClick here to download high resolution image