THE BEHAVIOUR IN COMBINED BENDING; TORSION AND ...
304
THE BEHAVIOUR IN COMBINED BENDING; TORSION AND SHEAR OF REINFORCED CONCRETE BEAMS. by MICHAEL P. COLLINS. A thesis submitted to the Professorial Board of the University of New South Wales as partial fulfilment of the requirements for the degree of Doctor of Philosophy. 1967.
-
Upload
khangminh22 -
Category
Documents
-
view
2 -
download
0
Transcript of THE BEHAVIOUR IN COMBINED BENDING; TORSION AND ...

THE BEHAVIOUR IN COMBINED BENDING;
TORSION AND SHEAR OF REINFORCED
CONCRETE BEAMS.
by
MICHAEL P. COLLINS.
A thesis submitted to the Professorial Board of the University of New South Wales as partial fulfilment of the requirements for the degree of Doctor of Philosophy.
1967.

I hereby declare that this thesis has not been previously presented by me, either in whole or in part, for the award of an academic degree .
. .

ACKNOWLEDGEMENTS
The results of this thesis were obtained in the course of
research on combined bending, torsion and shear in reinforced
concrete members, carried out under the sponsorship of the
Australian Road Research Board. The author wishes to express
his gratitude to the Board, both for their sponsorship and
encouragement.
The author also wishes to thank Associate Professors
F .E. Archer and A.S. Hall,. the supervisors of this thesis, for
their valuable guidance throughout this project,.
Thanks are also extended to Professor F .S. Shaw, Head
of the Department of Structural Engineeril.lg, without whose
co-operation this work would not have been possible.
The author is very grateful for the technical assistance
given to him by members of the staff of the Structures
Laboratory, in particular J . M .· Whitney and J. W. Taylor.
Finally the author would like to thank Mrs. T ~ Itsikson
for tracing the diagrams in this thesis and Miss J •. Howland for
typing the manuscript.

ABSTRACT
In this project the behaviour of reinforced concrete beams
loaded in combined torsion, bending and transverse shear has been
examined Over one hundred beams were tested under known
distribution of moment, shear and torsion to study their failure
characteristics with particular reference to possible failure
modes and the effect of reinforcement. It was found that for
beams containing only longitudinal reinforcement, the effects of
flexure tend to cancel each other and hence if a conservative value
of the pure torsional strength is chosen torsion-flexure interaction
can be ignored.
For beams containing both longitudinal and transverse
reinforcement, two different types of torsion-flexure interaction
were fo nd to be possible. For beams containing equal areas of
top and bottom longitudinal steel the presence of flexure reduced
the torsional capacity. On the other hand, for beams in which the
area of tension steel exceeds that of the compression steel, the
torsional capacity was considerably increased by the presence
of moderate bending moments.
For beams containing only longitudinal reinforcement it was
found to be satisfactory to assume linear interaction between the

ultimate strengths in transverse shear and torsion. For beams
containing both longitudinal and web steel the shear-torsion
interaction behaviour was found to depend upon the section
properties of the member.
Expressions for the failure loads of rectangular reinforced
concrete beams loaded in combined bending, torsion and shear
have been derived. These expressions were obtained in the main
from a study of the equilibrium situation of the observed modes of
failure. Good agreement between the predictions of these
expressions and the experimental results was found, not only for
beams of this investigation, but also for a large number of beams
reported in the literature.
Simple, and fairly direct, ultimate strength design
procedures were developed from the analysis equations. These
procedures are presented in this thesis.

TABLE OF CONTENTS
CHAPTER 1. - INTRODUCTION
l • l Background
Page No.
1. l
1. 2 Layout and Scope 1.3
CHAPTER 2. - HISTORICAL REVIEW
2.l Introduction 2. 1
2. 2 Beams Containing only
Longitudinal Reinforcement. 2. 1
(a) Pure Torsion 2. 1
(b) Bending and Torsion 2. 5
(c) Torsion, Bending and
Transverse Shear. 2. 8
2. 3 Beam Containing Both Longitudinal
and Transverse Reinforcement. 2. 13
(a) Pure Torsion. 2. 13
(b) Bending and Torsion. 2. 21
(c) Torsion, Bending and Transverse
Shear. 2.44
3.1
3.2
3.3
3.4
3.5
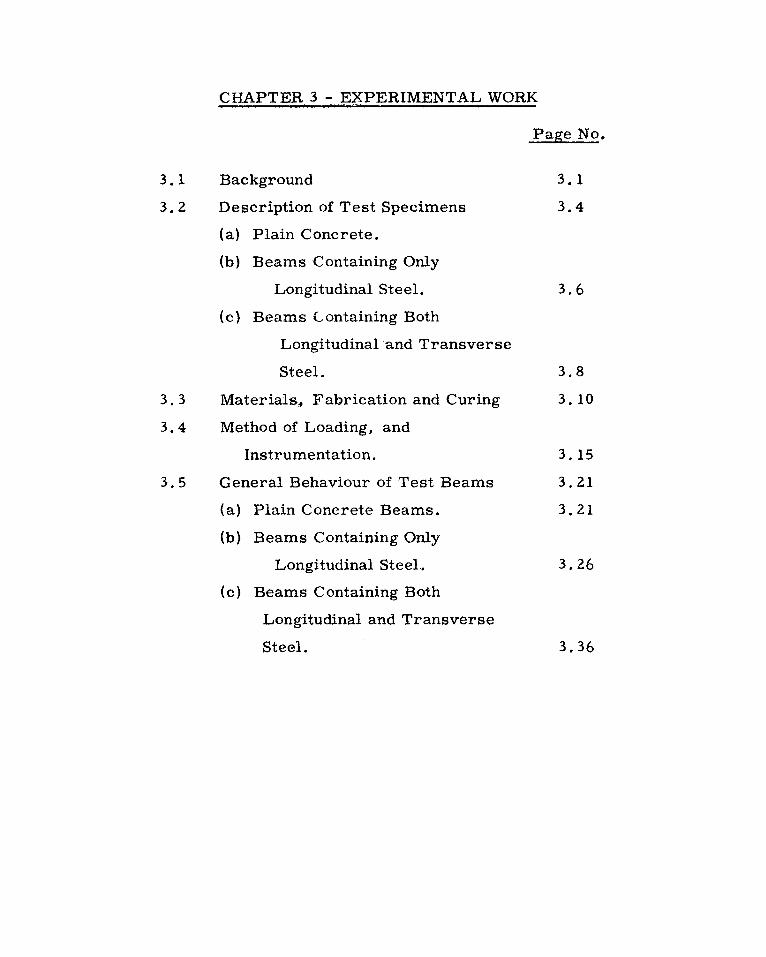
CHAPTER 3 -:. ~2-{PERIMENTAL WORK
Background
Description of Test Specimens
(a) Plain Concrete.
(b) Beams Containing Only
Longitudinal Steel.
(c) Beams Containing Both
Longitudinal and Transverse
Page No.
3.1
3.4
3.6
Steel. 3. 8
Materials. Fabrication and Curing
Method of Loading, and
Instrumentation.
General Behaviour of Test Beams
(a) Plain Concrete Beams.
(b) Beams Containing Only
Longitudinal Steel..
( c) Beams Containing Both
Longitudinal and Transverse
3.10
3. 15
3.21
3.21
3.26
Steel. 3. 36

4.1
4.2
4.3
4.4
4.5
5. 1
CHAPTER 4. - BEAMS WITHOUT WEB
REINFORCEMENT.
Page No.
Introduction. 4. 1
Beams Loaded in Pure Torsion. 4.2
Beams Loaded in Combined
Bending and Torsion. 4.12
(a) Plain Concrete Beams. 4.12
(b) Beams Containing Only
Longitudinal Reinforcement. 4.16
Beams Loaded in Combined
Transverse Shear and Torsion. 4.31
(a) Nominal Stresses at Failure 4.31
(b) Transverse Shear - Torsion
Interaction. 4.35.
_'":"f ective Shear Method. 4.40
CHAPTER 5. - WEB REINFORCED BEAMS
UNDER COMBINED TORSICN" AND FLEXURE.
Page No.
Introduction 5. 1

5.2
5.3
5.4
5.5
6.1
6.2
General Assumptions.
Analysis of Mode 1
( a) Equilibrium Equations.
(b)) Determination of Tan Q 1
(c) Determination of x1 .
(d} Simplification.
Analysis of Mode 3 •
(a) Equilibrium Equations.
(b) Determination of Tan Q3 .
Flexure - Torsion Interaction.
Page No.
5.2
5.4
5.4
5.8
5.9
5.10
5.12
5.·12
5.14
5.15
CHAPTER 6. - WEB REINFORCED BEAMS
UNDER COMBINED TRANSVERSE SHEAR
AND TORSION.
Background 6. 1
Predominantly Shear Failures. 6.2
(a) Geometry of the Failure Surface. 6.2
(b) Forces Acting at Failure. 6.8
(c) Equilibrium Equations. 6.9
(d) Simplification. 6.li

6.3
6.4
Mode 2 Failures.
(a) Equilibrium Equations
(b) Magnitude of .the Forces
(c) Determination of Tan 92.
Mode 3 Failures .
6. 14
6. 14
6.16
6.18
6. 19_
6 .5 Transverse Shear - Torsion
7.1
7.2
7 .. 3-
Interaction. 6. 20
CHAPTER 7. - EXPERIMENTAL VERIFICATION
OF THE THEORY FOR WEB REINFORCED BEAMS
Introduction.
Limitations on the Steel.
7.1
7.2
(a) Excessive Transverse Steel 7. 2
(b) Excessive Longitudinal Steel. 7. 4
(c} Longitudinal Steel out of
Proportion to the Transverse
Steel. 7._4
Interaction of Bending and Torsion. 7.7
7. 4 Ir. .·action of Transverse Shear
and Torsion-
7 .. 5 A.ccuraey of the Analysis Equations
7.9
7.14

Page No.
7.6 Simplified Analysis Procedure 7.22
CHAPTER 8. - DESIGN OF BEAMS SUBJECT
TO TORSION.
8.1 Introduction.
8. 2 Derivation of the Design Equations for
Web Reinforced Beams.
8.3
8.4
9. 1
9.2
Design Procedure.
Design Example.
CHAPTER 9. - CONCLUSIONS.
Conclusions.
Suggestions for Further Research.
Appendix A - REFERENCES.
Appendix B - EXPERIMENT AL DATA.
Appendix C - OPTIMUM VALUE OF r.
Appendix D - ANALYSIS OF TEST DATA.
8.1
8 .. 1
8.6
8.8
9. 1
9.7

LIST OF FIGURES
Figure Title Page Uo.
2. 1 A Comparison of Observed and Predicted Shear-Torsion Interaction for Beams Containing only Longitudinal Reinforcement. 2. 12
2.2 Ultimate Torque/Cracking Torque -Percentage of Reinforcement. 2.18
2.3 Torsional Strength - Amount of Transverse Reinforcement. 2.19
2.4 Interaction of Bending and Torsion as Suggested by Cowan. 2.23
2.5 Manner of Failure of Beam Loaded in Bending and Torsion. 2.24
2.6 Lessig's Mode 1 Failure Surface. 2.26 2,7 Bending-Torsion Interaction as
Predicted by the Theory of Lessig. 2.29 2.8 Accuracy of Lessig' s Theory
Versus K. 2.32 2.9 Accuracy of Lessig's Theory Versus
B!Jding-Torsion Interaction as 2.34.
2.10 Predicted by the Theory of Yu-'in. 2.38
2. 11 Bending-Torsion Failure Mode of Hollow Beams Proposed by Evans. 2.40
2. 12 Lessir's Mode 2 Failure Surface. 2.46 2. 13 Shear-Torsion Interaction for
Typical Beam as Predicted by Lessig' s Theory. 2.49

FiE 're Title Page No.
3.1 Details of Beams Containing · Longitudinal Steel. 3.7
3.2 Details of RE, RU and R Series. 3.9 3.3 Details of V. U and T Series. 3. 11 3.4 Loading Arrangement. 3.16 3.5 One point Loading Rig. 3.17 3.6 Bending Moments, Transverse Shear
Forces and Twisting Moments Produced in Test. 3.18
3.7 Rotation Gauge. 3.20 3.8 Failure View of Pure Torsional
Plain Concrete Specimen. 3.22 3·_ 9 Torque.;.Twist Curve for Plain
Concrete (Beam PI). 3.24 3.10 Torque-Twist Curve for Beam LI. 3.28 3. 11 Failure of Beam Containing Only
Longitudinal Steel Loaded Predominantly in Torsion. 3 .. 29
3.12 Failure of Beam Containing Only Longitudinal Steel Loaded Predominantly in Bending. 3,.30
3. 13 Torque-Twist Curve for Beam L2. 3.31 3. 14 The Effect of a/don Shear Failure. 3.34 3. 15 The: of a/ d on the Failure
Appearance. 3. 3 · 3. 16 ·-, the
~e at Failure. 3.3:
Figure Title Page Fo.
3.17 The Appearance of Beam S4 at Failure. 3.37
3.18 Developed Failure Surface Beam RUSA Mode 1 Failure. 3.43
3.19 Torque-Twist Curves for Beams Containing Web Reinforcement RE Series. 3.45
3.20 Developed Failure Surface Beam 36T4 Mode l Failure. 3.47
3.21 Developed Failure Surface Beam 36T4c Mode 3 Failure. 3.48
3.22 Developed Failure Surface of Beam 38TS Mode 2 Failure. 3.49
3. 23 Failure Surface of Beam 77 0 5 3.51 3.24 Torque-Twist Curves for Beams
of R Series. 3.52 3.25 The Effect of Torsion on the
Appearance of the West Sides of the Beams. 3.55
3.26 The Effect of Torsion on the Appearance of the East Sides of the Beams. 3.56
3.27 The Effect of Torsion on Appearance of the Tops of the Beams. 3.57
3.28 The Effect of Stirr:__ip Spacing on the Failure Appearance. 3.59
3.29 Strains in the West Legs of Ties. 3.60 3.30 Strain in Legs of Ties. 3.61 3.31 Strain in Top Longitudinal Bars
of Beam T5. 3.62

-:--··- ,·") Title 3=' a fie :~-r o . - --3.32 Beam T5 at Failure. 3.63 3.33 Beam T2 at Failure. 3.63 3.34 Strain in Top Longitudinal
Bars of Beam T2. 3.64
4, l Comparison of TL'-ory and Experiment for Plain Concrete Beams. 4. 11
4.2 Equilibrium Situation at a Cracked Section. 4. l 9
4.3 V,.riation of the Depth of Uncracked concrete, d •
with the Applied Moment~ 4.21 4.4 Bending-Torsion Interaction
Curves for Beams Containing only Longitudinal Steel. 4.26
4.5 Interaction of Torsion with Bending for Beams Containing only Longitudinal Steel. 4.28
416 The Average Shear Stresses 4. 34 4.7 Shear-Torsion Interaction for
:-- ,...., 't-..,_~ Car. 1g Only Longitudinal Steel. 4.37
5.1 General View of Mode 1 Failure Surface. 5.3
5.2 Forces Acting on the Mode J Failure Surface. 5.5
5.3 Forces Acting on the Mode 3 Failure surface. 5. 13

Figure Title Pa1:~_I.'Jo,
5.4 Interaction Diagram for Beams Failing in Mode 1. 5.17
5.5 Interaction Diagram for Beams Failing in Mode 3 . 5.19
• 6. 1 General View of Failure Surfaces. 6.3 6.2 Developed Failure Surfaces. 6 /.. 6.3 Values of u Versus T /Vb. 6.6 6.4 Forces Acting on Effective Shear
Failure Surface. 6.7 6.5 Accuracy of the Approximate
Equation for Predominantly Shear Failures. 6. 13
6.6 View of the Mode 2 Failure Surface. 6. 15
6.7 Shear-Torsion Interaction for Web Reinforced Beams. 6.21
7. 1 The Effect of the Nominal Shear Stress on the Accuracy of the Theory. 7.3
7.2 The Effect of the Parameter r/r 0
7.6 on the Accuracy of the Theory. 7.3 Bending-Torsion Interaction for
Web Reinforced Beams. 7.8 7.4 Bending-Torsion Interaction for
RU Series. 7.10 7.5 Shear-Torsion Interaction for V
Series. 7 .11
Figure Title Page No.
7.6 Shear-Torsion Interaction for T Series. 7.13
7.7 Frequency Histogram for the Accuracy of the Theory for Web Reinforced Beams Within Restrictions. 7.23
8.1 Eccentrically Loaded Spandrel Beam. 8.9
8.2 Design of Longitudinal Steel. 8.12
LIST OF TABLES
Table Title Page No.
z. 1 A Comparison of Experimental Results with the Theories of Nylander, Rr --nakrishnan and Vijayarangan, and Gesund and Boston. Z.9
z.z A Comparison of Experimental Results and Published Theories for Web Reinforced Beams Loaded in Bending and Torsion. 2.43
Z.3 A Comparison of Experimental Results and Published Theories for Web Reinforced Beams Loaded in Shear and Torsion. 2.51
3.1 Summary of Beams Tested. 3.3 l.Z Details of .Plain Concrete Beams. 3.5 3.3 Details of R Series. Beam
. Properties. 3.12 3_·4 Details of Steel Used. 3.14 3.5 Values of the Shear Modulus of
Elasticity for Plain Concrete Beams. 3.25
3.6 Failure Loads of Beams Containing Only Longitudinal Steel. 3.38
3.7 Experimental Results for Series RE, RU and R. 3.41
3.8 Experimental Results for Series V~ U and T. 3.53

Table Title Page No~ -4.-1 A Comparison of "Elastic"
and "Plastic" Failure Stresses. 4.4
4.2 Analysis of Pure Torsion Tests on Plain Concrete Specimens. 4.7
4.3 A Comparison of Theory and Experiment for lj3eams Containing only Longitudinal Reinforcement Loaded in Pure Torsion. 4.13
4.4 Computed Failure Stresses for Plain Concrete Rectangular Beams Subjected to Bending and Torsion. 4.17
4.5 A Comparison of the Theory with Experimental Results for Beams Containing only Longitudinal Steel Loaded in Bending and Torsion. 4.29
4.6 Nominal Shear Stress at Failure. 4.33 4.7 Percentage of Ultimate Load at
which Flexure Cracks were First Observed. 4.33
4.8 Average Shear Stress at Failure on Reduced Section. 4.36
4.9 A Comparison of the Theory with Experimental Results for Beams Containing Only Longitudinal Reinforcement Loaded in Shear and Torsion. 4. 39

Table Title Page No.
5. 1 Error Introduced By Ignoring the Last Term of Equation 5. 4 5. 11
6.1 Values of µ for Test Beams. 6.6
7. 1 Range of Parameters Covered by Available Test Data. 7.15
7.2 A Comparison of Experimental Results With the Proposed Theory for Web Reinforced Beams. 7.17

A w
al' a2
a3,a4
b
b'
=
=
=
=
=
=
=
=
NOTATION.
The cross-sectional area of longitudinal steel near the tension (bottom) face of the beam.
The cross-sectional area of longitudinal steel near the side face of the beam.
The cross-sectional area of longitudinal steel near the compression (top) face of the beam.
The cross-sectional area of one leg of hoop reinforcement.
The cover on the longitudinal steel (see Figure 3. 2).
The cover on the transverse steel ( see Figure 3. 2).
The width of the beam (minimum dimension).
The width of the hoops.
C , Cf C , = The couple, direct force and shear force c ' s acting on the compression zone.
D = The dowel force on the steel.
d
d'
d C
=
=
=
The effective height of the beam (h-a 1).
The !leight of the hoops.
The depth of the uncTf"'!ked concrete zone. ..

d 0
d3
F w
Fl
f' C
ft
f'' t G
h
jd
Kl
K2 kd
M
M u
=
=
=
=
=
= =
=
=
=
=
=
=
=
=
The distance from the shear centre of the uncracked concrete zone to the centre line of the beam.
The distance from the bottom of the beam to the centroid of the top .steel ..
A force exerted by the web steel.
A force exerted by the longitudinal steel,.
The cylinder compressive strength of the concrete.
= Tlie ·yield strength of steels AL 1, ALZ' AL3 and Aw.
The maximum principal tensile stress.
The tensile strength of the concrete.
The shear modulus of rigidity.
The height of the beam.
The level arm of the moment of resistance in flexure.
1 - kd/h.
l - b/3h.
The depth to the neutral axis.
The bending moment applied. to the section.
The computed ultimate flexural capacity of the section in the absence of torsion.

p = AL 1/bd
R = The ratio of AL3 f L 3 to AL 1 f L l .
r = A parameter relating transverse to longitudinal steel A f
b' w w s ALI fLl
r = The design value of r. 0
s = The tensile force on the steel.
s = The spacing of the hoops.
T 1: T 2, T 3 = The predicted torsional strength in modes 1, 2 and 3.
T
T'
T C
T 0
T s
V
V C
veff V
0
=
=
=
=
=
=
=
=
=
The twisting moment applied to the section.
T V 1 + 2 .:::_
The torque resisted by the concrete.
The pure torsional capacity of the section.
The torque resisted by the steel.
The transverse shear force applied to the section.
The shear capacity of tile concrete when torsion is absent.
An effective shear force.
The shear capacity of the section when torsion is absent.

=
=
T/½b2 (h-~).
V /bd-.
x 1, x2 , x3 = 'the depth to the centre of the compression zone in modes 1, 2 and 3 ..
=
=
=
6 =
4-' = O" =
't: =
µb =
The ratio of the height to the width of the section (h/b).
The ratio of the effective height to the effective ~idth of the section (h-a/b-a2).
J 1 + 2~,c
Vb/2T.
= The inclination of the compression zone to the cross-section of the beam in modes 1, 2 and 3.
The ratio of torque to moment (T/M).
The direct stress.
The shear stress.
The portion of the top face crossed by diagonal tension cracks.

1.1
CHAPTER 1
INTRODUCTION.
1. 1 Background.
The reinforced concrete frame as employed in multi- storey
building construction followed in form the earlier method of
construction incorporating load bearing brick walls and timber
floors supported on timber girders which in turn rested on timber
storey posts. In the early application of reinforced concrete to
such structures designers were slow to take full account of the
contimdty which was inherent in this form of construction, held back
no dovbt by the difficulties associated with the analysis of such
highly redundant structures.
Following the widespread dissemination of Professor
Hardy Cross's Moment Distribution method of analysis and more
recently the availability of computer methods of analyeing frames
it has become the generally accepted practice to treat the

1. 2
reinforced concrete frame as a series of continuous, alpiet plane,
frames.
Torsion, however, has generally been completely ignored
by designing engineers who have seen it as a secondary problem which
could be taken care of by the large factors of safety inherent in
flexural design methods. This attitude or a belief that insufficient
was known of the effects of torsion has been reflected in many codes
of practice which have made no reference to methods of design for
torsion. Those which have usually only proposed approximate
working stress rra thods.
In recent years interest has been reawakened in the subject
of ultimate strength methods of design and following considerable
theoretical and experimental studies methods of designing reinforced
concrete members for flexure are now fairly well established. With
the advent of these design methods which may be relied on to give
quite accurate results the tendency will be to reduce factors of safety.
Such a trend emphasises the need for a satisfactory solution to the
problem of torsion.
Reinforced concrete structures today frequently incorporate
members subject to significant torsional moments; freeways
and interchanges require members curved in plan; slabs and shells
have edge members which may be subjected to considerable torsion;
the spiral staircase is often used as a striking architectural feature.

In view of the above the necessity of understanding the behav:io -:-- '):;_
reinforced concrete members subjected to torsion is obvious.
1. 2 Aim and Scope.
An extensive investigation of the behaviour of reinforced
concrete elements subjected to torsion was iniated in t~e
Department of Str1.:ctltral Engineering, University of New So,;th
Wales at the start of 196 :, . As a first stage in this investigatio,1
isolated rectangular reinforced concrete beams were studied.
During the first two years an extensive literature survey was
conducted and the behaviour of beams subjected to combined flexvre
and torsion was studied. It is to be noted that this stage of the
investigation was conducted as a joint project with P .F. Walsh.
During the last eighteen months of the program the author devoted
his attention to beams loaded in combined bending, torsion and
transverse shear while Walsh (Ref. 1. 1) studied the deformation
properties of beams loaded in combined flexure and torsion.
The particular aim of this thes~s is to study the behaviOl,:r
of isolated rectangular beams loaded in combined torsion, bending
and transverse shear, and from this study to obtain expressions
for the ultimate load of such members. Although it is recognized
that bending mor.1.1.ent and shear force do not play independant roles
in relation to the strength of a reinforced concrete beam, the
generally accepted practice i-s, design of treating these actions

separate}_? has been followed in this work.
A subsidiary, but no less important aim of the thesis ::.s ,:o
prena:i.t relatively simple methods of design for combined acticns ir..
keeping with the results of the investigation.

CHAPTER 2
HISTORICAL REVIEW
2. 1. INTRODUCTION.
2. 1
It is the object of this chapter to summarise the results of reported
investigations into the behaviour of reinforced· concrete members subjected
to torsion, with and without other actions. In addition it is intended to
discuss the various strength theories which have been proposed and to
compare the published experimental results with predictions by these
theories.
Reinforced concrete beams may for convenience be divided into two
main groups: beams with longitudinal steel only and beams with both
longitudinal and transverse steel. This division has been maintained in
this chapter in discussing the effects of torsion.
2. 2. BEAMS CONTAINING ONLY LONGITUDINAL REINFORCEMENT.
a. Pure Torsion.
As early as 1911 it was recognized that beams reinforced with
longitudinal steel only and loaded in pure torsion fail immediately after

2.2
the appearance of the first diagonal tension crack. The twisting moment
to cause such cracking was found to be comparable with the maximum
twisting moment which can be resisted by a plain concrete section
similar to the reinforced member in all respects except for the
reinforcement. In some cases small increases in torsional strength,
with the addition of longitudinal steel, have been recorded (Ref. 2. 1).
Cowan (Ref. 2. 2) suggests that these increases can be explained if
consideration is given to the higher shear modulus of the steel which is
replacing the concrete. However tests by Young, Sagar and Hughes
(Ref. 2. 3) showed lower strengths for the reinforced sections than for
comparable plain concrete sections. This lowering of the torsional
capacity with the addition of longitudinal steel, was probably due to the
presence of stresses induced by restrained shrinkage.
While most investigators:·agree that the pure torsional strength
of a beam containing only longitudinal steel is reasonably close to
the strength of a plain concrete member, they do not agree on how the
strength of such a plain concrete beam may be calculated. It has been
generally agreed that a maximum principal stress criterion is the
appropriate failure criterion to employ. There has not, however, been
agreement as to the distribution of stress in such a member at the point
of failure.
Most of the early investigators advocated the use of the elastic
theory for computing the torsional stresses. In accordance with this
theory, the ultimate torsional moment of a rectangular concrete beam :i.s:
T = keb2 h f' , t ......... 2. 1.

where bis the width of the beam (the smaller dimension),
h is the depth
ft is the tensile strength of the concrete
and ke is a function of the ratio h/b.
2.3
Numerical values of this function have been calculated by St. Venant
(Ref. 2. 4) and published by Cowan (Ref. 2. 2) but a useful approximation
to these values is given by:
l ke = ----------2.6
3 + ......... 2. 2.
0. 45 + h/b
In 1934 Turner and Davies (Ref. 2. 5) drew attention to the fact
that the behaviour of concrete in torsion is to some degree "plastic".
This plasticity leads to a redistribution of stresses as the load
approaches its ultimate value. Turner and Davies suggested that this
effect might be allowed for, in calculating the ultimate torque, by
multiplying the elastic torque by a factor of l . 2.
Marshall (Ref. 2. 6), in 1944, and Nylander (Ref. 2. 7), in 1945.
both suggested that consistent results were best obtained if concrete wc.s
treated as an ideal plastic material. At failure the torsi.onal shear
stress would then be constant over the whole section and equal to the
ultimate tensile strength of the concrete. It followi:;, that for a
rectangular beam, the torsional strength would be given by:
T : .! b 2 (h - b) f I 2 3 2 3 t . . . . . . . . . . .

2.4
This equation can be r.ea~ranged to give:
. . . . . . . • . 2. 4.
where ~ = ½ (1 - 3h~b) . . . . . . . . . 2. 5.
Examination of equations 2. 2 and 2. 5 will show that for a wide range of
the ratio depth to breadth of a rectangular section, the ratio of kp to
ke will be 1. 66 + O. 06. This means that for all practical rectangular
beams, the ultimate torque as calculated from the plastic theory will be
1. 66 + 0. 06 times the ultimate torque as calculated from the elastic
theory.
A major problem in the use of either the elastic or the plastic
theory is the determination of the tensile strength of the concrete.
Ideally the tensile strength should be found by direct tensile test, but
the test is very troublesome and so it is rarely performed. Usually
the tensile strength is found by indirect test, either by a bending test
or a splitting test. The value of the tensile strength calculated from
such a bending or splitting test will depend upon the particular
assumption made regarding the behaviour of the concrete, e. g. linear
-elastic, non-linear elastic or plastic.
Kemp (Ref. 2. 8) in 1961, analysed the results reported in the
literature of plain concrete beams in pure torsion. He compared the
maximum tensile stress at failure, as calculated by the plastic theory,
with the compressive strength of the concrete. He concluded that a
conservative estimate of the maximum tensile stress at failure was
4~, where_f~ was the compressive strength of the concrete. In

accordance with this the torsional strength would be given by:
2 b ~ T = 2 b (h - -) f' . 3 C
. ........ 2. 6.
While it might be expected that equation 2. 6 would be less
accurate than equation 2,. 3 it has the advantage that the torsional
strength is expressed in terma of the most commonly specified
parameter of the concrete, its compressive strength.
2. 2. b. Bending and Torsion.
2.5
Except in very exceptional circumstances torsion will be
accompanied by bending in reinforced concrete construction. Very
frequently the bending moment will be much !anger than the twisting
moment and the designer may then elect to use a beam with longitudinal
steel only. It is therefore important that information regarding the
possible interaction of torsion and bending be available for such beams.
Unfortunately the problem of the behaviour and strength of beams with
longitudinal steel only subject to combined bending and torsion has
received very little attention.
Nylander (Ref. 2. 7) in 1945, conducted the first series of tests
on this type of beam. He considered that beams with an "ordinary
ratio" of reinforcement, failed by yielding of the longitudinal reinforcement.
By analysing a cracked section of a beam sustaining bending and torsion,
he deduced that the torsion was resisted partly in the uncracked concrete
zone and partly by a couple composed of a horizontal shear force in the
uncracked concrete zone and a dowel force associated with the steel.
The torsion resisted wholly by the concrete he expressed in the form J3 To,
where To is the pure torsional capacity of a plain section, and J3 is a
constant depending upon the shape of the beam and the percentage of

2.6
longitudinal reinforcement. Appropriate values of 13 for beams of
rectangular section, determined by means of test results, were given
by Nylander.
e. g. 13 = 0. 55 when d/b = 1. 5 and p = 0. 005.
He then computed the shearing stresses set up in the steel by the
remaining torque. Additionally he calculated the direct stresses in the
steel by the normal bending formula. Using the Huber-Beltramis
criterion of yield for steel given below:
f- = J f 2 + 3 l 2 , Ll X
where fx is the direct stress and 1:' the shearing stress, he obtained the
following formula for the amount of longitudinal steel required,
1 ALl =
fLl
2 + 3,T - 13To)
()..'5d .......... 2. 7.
The design equation given by Nylander rests on two main
assumptions; that a large portion (up to 85° / o) of the torque is resisted
wholly by the uncracked concrete zone and that the failure is governed by
yielding of the steel. These assumptions are not universally true.
Frequently the shear force which the steel can resist will be governed by
spalling of the concrete and not yield of the steel as has been assumed.
Furthermore, for high ratios of torsion to flexure, it is possible for a
tension crack to cross the top surface of the beam prior to failure, and
destroy the "uncracked" concrete zone.
Ramakrishnan and Vijayarangan (Ref· .. 2. 9) in 1963 published the
results of a series of tests on beams without web reinforcement. They
observed that the presence of a flexural moment did not noticably effect

2.7
the torsional strength of their beams. They concluded that the
torsional strength of such beams could be calculated by ignoring
both the longitudinal reinforcement and the applied bending moment, and by
using an elastic distribution of stress and a maximum tensile stress
criterion of failure. They proposed the following empirical
relationship for the limiting value of the tensile stress:
ft, = 2. 6 Cu 2 / 3 2.8
where Cu is the cube crushing strength of the concrete. As this
empirical relationship was based on only the few results from their
own test beams, all of which were made from the one concrete mix,
it is not surprising that good correlation between their experimental
results and their theoretical predictions '.was: obtained.
' .
Gesund and Bo~ton (Ref. 2. 10), in 1964, proposed a theory for
calculating the failure loads of the type of beams being considered here.
They analysed the case in which the torsional capacity of the beam is
governed by spalling of the concrete. They suggestoc'1 ·that.i:he torsion
failure will only be influenced by bending moment in as much as the
magnitude of the dowel force required to spall the concrete depends on
the spacing of the flexural cracks. By assuming that the dowel force on
any bar is proportional to its distance from the axis about which the
beam rotates at failure, they obtained the following formula for the
torsional capacity:
T = F (r + .! l::: r/) c c re
......... 2. 9
where F c is the dowel force on the critical bar, that is the bar at which
spalling of the concrete occurs, re is the distance of this bar from the
failure hinge and r. is the distance of the ith bar from the failure hinge. 1

2.8
To find the value of F c it is necessary to calculate the force
required to spall off a block of the concrete. The method proposed
by Gesund and Boston is a trial and error process and involves
making assumptions, not easily justified, regarding the shape of the
concrete spall, the spacing of the flexural cracks, the bond strength,
the average tensile stess in the concrete, the area of the compression
zone in the beam and the bearing-stress distribution along the bar.
In view of the number of assumptions oh which the method is
based it is not unexpected that agreement between the theory and
experimental results is only "fair". Furthermore, as the method
of calculating the failure torque is a cumbersome trial and error process
it does not commend itself as a design method.
To obtain more information about the three methods proposed
Table 2. 1 was prepared. This table contains the failure loads of all
beams, of the type under discussion, tested by previous investigators.
In this table the failure loads predicted for these beams, by the three
theories discussed above, are compared with the experimentally
determined failure loads. It can be seen that all investigators obtain
reasonable correlation only for their own test results. Both
Nylander' s and Ramakrishnan's theories give estimates of the ultimate
torque very much greater, in some cases, than the experimental values.
Gesund and Boston's theory, on the whole, seems the most satisfactory
of the three. It is considered that the standard of accuracy attained,
however, hardly iustifies the complex nature of their analysis.
2. 2. c. Torsion, Bending and Transverse Shear.
Despite the relative importance of the problem of shear force
combined with torsion and bending, very little experimental work has

TABLE 2.1
A COMPARISON OF EXPERIMENTAL RESULTS WITH THE THEORIES OF NYLANDER, RAMAKRISHNAN AND VIJARANGAN AND GESUND
AND BOSTON
Investigator Beam Failure Loads T exp/Tth
No. eor.
Torque Moment Nylander Rama- Gesund kip. in. kip. in. krishnan and
and Vija- Boston rangan
1 39.0 52.l 1. 12 0.72 1. 09 2 31. 2 52.l 0.97 0.72 0.88
Nylander 3 39.0 58.0 1. 15 0.79 1. 10 4 35. 1 58.0 1.07 0.79 0.99 5 54.6 75.7 0.85 0.86 1. 70 6 50.7 75.7 0.90 0.80 1. 61 7 50.7 110. 0 0.98 0.74 1. 51 8 54.6 110. O 1.03 0.80 1. 63 9 31. 2 58.0 1.07 0.89 0.89
10 19. 5 58.0 0.89 0.89 0.89
B4 17. 1 99.0 1. 36 1. 34 1. 34 BS 24.8 45.4 0.90 1.03 0.81
Ramakrishnan B6 10.7 108.0 1. 39 1. 39 1. 39 and C3 21. 7 111.0 1. 12 1. 06 1. 08
Vijarangan C4 20. 1 90.7 1.00 0.95 0.91 CS 23.2 105.0 1. 03 1. 01 0.99
3 58 58 1. 10 0.69 1. 09 4 64 64 0.82 0.77 1. 60 5 43 86 0.74 0.83 1. 48
Gesund 6 36 108 0.74 0.68 1. 24 and 7 59 177 1. 05 0.93 1. 31
Boston 8 49 195 1. 06 1. 02 1. 09 9 42 83 0.44 0.49 1. 50
10 39 156 0.63 0.63 1. 56
Summary Maximum 1. 39 1. 39 1. 70
Minimum 0.44 0.49 0.81
Mean 0.98 0.87 1. 23
21°/o 24°/o 0
Standard Deviation 24 /o

2 10
been carried out for beams reinforced with longitudinal
reinforcement alone. In fact Nylander (Ref. 2. 7). appears to
have been the only person who has experimentally investigated the
problem. As might be expected, he found that the effect of direct
shear force is to substantially reduce the torsional capacity of a beam.
Nylander tested a series of ten identical beams under an eccentric
concentrated load. The eccentricity of the load varied from zero, i. e.
no torsion, to infinity, i. e. pure torsion. He concluded that the load at
failure, in the case of combined shear and torsion, could be computed by
putting the combined shearing and torsional stress equal to the tensile
strength of the concrete. (In his investigation he conducted direct
tension tests to determine the tensile strength of the concrete). He
suggested that the stress due to transverse shear be computed from the
well known formula,
Vy = V
b"d' ] ......... 2. 10
and for this case he suggested that j be taken as equal to 0. 764. He
suggested further that the stress due to the torsion be calculated in
accordance with the plastic theory, i.e. :
= T ......... 2. 11 ½ b2 (h-b/3)
While Nylander's theory agrees fairly well with his test results
it ignors the complex nature of the shear failure. The theory implies
that the beam will fail in shear when the nominal shearing stress, vv,
equals the tensile strength of the c_oncrete. A. N. Talbot (Ref. 2. 11)
pointed out the fallacies of such a procedure as early as 1909. More
recently Keni (Ref. 2. 12) has shown that, for the same concrete, the

value of Vy may be of the order of 15 times greater for heavily
reinforced short beams than for long beams with a low percentage of
reinforcement.
2. 11
Kemp {Ref. 2. 8), after examining Ny lander's results, proposed
that a safe lower bound for the failure loads of the type of beams under
discussion is,
V Vo
+ = 1 ......... 2. 12.
where V is the ultimate shear for combined shear and torsion, T is the
ultimate torque for combined shear and torsion, VO is the ultimate shear
for zero torsion and T 0 is the ultimate torque for pure torsion. Of course
if VO and T O are both calculated on the basis that vv and vt equal the tensile
strength of the concrete, which is constant, then the above theory is
identical to Nylander's. However, Kemp recognized the "nominal"
nature of both these shearing stresses and so he suggested that V0 be
calculated on the basis of a nominal stress of 2/it while Tu be based C -
on 4.fo_. These values apparently were chosen to tie in with the value C
Kemp suggested for the case of pure torsion and the values currently
being used in shear design.
The available test results, i. e. Nylander's, for longitudinally
reinforced beams loaded in shear and torsion, have been plotted in
Figure 2. 1 in the form of a shear-torsion interaction diagram. It
appears that for the particular reinforcement ratio and shear span ratio
used by Nylander, the interaction between torsion and transverse
shear is approximately linear. Also plotted in Figure 2. I are the
theoretical interaction lines suggested by Nylander and Kemp. It can
be seen that for these beams both theories give safe results.

2.12
16,.--~--------~-------I I
tl\ NYLANDER S EXPERIMEN
' TAL RESULTS -• ' -.i ' . 12------t-' ----+-----+------t
~~i ~,~~,
,~ 1,-} C ,,. ·- 8 '9,. ci. ,i---..-----t-- <"'-\.~---+-------+-----~ ~~ ..
~ z 0 1/) a:: ~ ' ' 'I o-------------....--------2 4 e
TRANSVERSE SH r.·· ~R
FIG. 2.1 A COMPARISON OF OBSERVED AND PREDICTED SHEAR-TORSION INTERACT!ON FOR BEAMS CONTAINING O\ILY LONGITUDINAL STEEL.

2. 13
2. 3. BEAMS CONTAINING BOTH LONGITUDINAL AND TRANSVERSE
REINFORCEMENT.
a. Pure Torsion.
A great number of experimental investigations have been
undertaken, particularly in the past thirty years, to examine the effects
of combined longitudinal and transverse reinforcement on the torsional
capacity of concrete members.
For beams subjected to pure torsion there is agreement between
almost all investigators that, irrespective of the amount or disposition
of reinforcement, tensile cracks appear on the face of the specimens,
with an inclination to the longitudinal axis of the beam of approximately
45°, when the twisting moment reaches the value of the cracking moment
for a similar beam of plain concrete.
Once the member has cracked the torsional stiffness is reduced.
The behaviour beyond this stage and the value of the maximum twisting
moment which can be resisted then appears to depend upon the amount
and positioning of the reinforcement.
The early researchers, noting that reinforcement increased the
torsional capacity of a concrete member, proposed empirical formulae
for calculating the increased torsional resistance of reinforced members.
Turner and Davies (Ref. 2. 5) in 1934 proposed an empirical relation
which may be expressed as:
T = T (1 + 0.25p'), C
......... 2. 13.
where T is the maximum torsional capacity of the reinforced member,
Tc is the cracking torque or torsional capacity of a plain concrete
member, and p' is the percentage of reinforcement. The percentage
2. 14
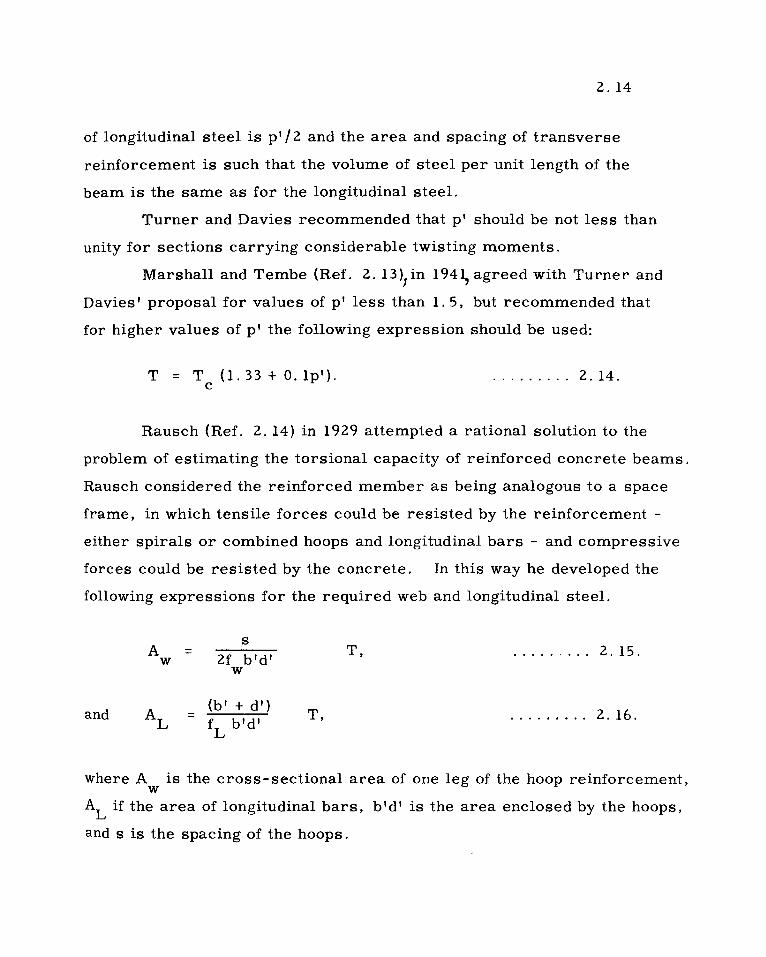
of longitudinal steel is p' / 2 and the area and spacing of transverse
reinforcement is such that the volume of steel per unit length of the
beam is the same as for the longitudinal steel.
Turner and Davies recommended that p' should be not less than
unity for sections carrying considerable twisting moments.
Marshall and Tembe (Ref. 2. 13 )1 in 1941, agreed with Turner and
Davies' proposal for values of p' less than 1. 5, but recommended that
for higher values of p' the following expression should be used:
T = T (1. 33 + O. lp'). C
. ........ 2. 14.
Rausch (Ref. 2. 14) in 1929 attempted a rational solution to the
problem of estimating the torsional capacity of reinforced concrete beams.
Rausch considered the reinforced member as being analogous to a space
frame, in which tensile forces could be resisted by the reinforcement -
either spirals or combined hoops and longitudinal bars - and compressive
forces could be resisted by the concrete. In this way he developed the
following expressions for the required web and longitudinal steel.
s A = T,
w 2f b'd' ......... 2. 15.
w
and AL (b' + d') T, = f b'd' L
......... 2. 16.
where A is the cross-sectional area of one leg of the hoop reinforcement, w
AL if the area of longitudinal bars, b' d' is the area enclosed by the hoops,
and s is the spacing of the hoops.

2 11~
In Rausch's expressions fw and fL would have represented the
permissible stresses in the transverse and longitudinal steel
respectively. However, as his treatment of the problem ignored
completely any tensile {i. e. shear) strength of the concrete, his
expressions could equally well be regarded as relations between the
steel areas and the ultimate twisting moment, with fw and fL
representing the yield strengths of the steel. Indeed Rausch in discussing
certain published test results stated that the very high twisting of the
members led him to believe that the reinforcement yielded before failure
of the members.
Rausch' s expressions are still quoted in many modern codes for
reinforced concrete constructipn: Germany, Egypt, Hungary and Poland.
Andersen {Ref. 2. 15) carried out a series of tests on beams in
pure torsion in 19 35 and 19 3 7. He employed spiral reinforcement in the
majority of his test specimens as he considered such reinforcment to be
most effective in resisting torsion. His theory of ultimate strength is
based on the assumption that the concrete resists a portion of the
ultimate moment and the remainder is resisted by the spiral reinforcement.
His approach is to assume that the shear {tension) stresses in the concrete
vary linearly from zero at the centre to a maximum, equal to the concrete
tensile strength, at some distance from the centre and beyond this point
the stress in the concrete is constant at the maximum value. The
moment of resistance of the concrete can be calculated in terms of the
parameters, tensile strength, radius of the section and distance to the
point of maximum stress. The total moment of resistance in torsion is
calculated by assuming that the section is homogeneous and that the
extreme fibre stress is the value obtained by considering the same linear

2. 16
variation as described above, reaching a maximum (higher than the
concrete strength) at the edge of the section. The moment carried
by the reinforcement then is the difference between the total moment
and the moment carried by the concrete. The expression for the
moment carried by the reinforcement is exactly the same as Rausch' s
expression for a circular cross-section.
To deal with the case of square and rectangular cross- sections
Andersen relates such sections to equivalent circular sections. He
determines the radius of the equivalent circular section by equating
the expressions for maximum shear stress for the rectangle to that of
the circle for a given twisting moment.
Cowan (Ref. 2. 16), who has written extensively on the subject of
torsion in concrete, in 1950 proposed that the torsional resistance of a
concrete beam was provided partly by the concrete and partly by the
steel. He suggested a similar formula to Rausch for calculating the
contribution of the steel, but with the numerical value 2 replaced by a
parameter :l. . Making use of the St. Venant torsion solution for a
rectangular shaft, he deduced that ;l. would vary with the ratio of
depth to width of the cross-section, but that for wide variations of this
ratio it would differ only slightly from 1. 6.
Cowan's work forms the basis of the torsion provisions of the
present Australian Building Code (Ref. 2. 17).
All of the aforementioned proposals agree in one respect in
requiring equal volumes of steel per unit length of beam in both the
longitudinal and transverse directions. It has further been suggested
that where these volumes are not equal the smaller of the two will
govern the torsional capacity.

2 .17
To investigate the above theories, an analysis has been made of
those test beams in which there was sufficient or more than sufficient
longitudinal steel to satisfy the equal volume requirement. Where the
cracking torque, T , was required for the analysis it was obtained from C
the reported test results of companion beams without web reinforcement.
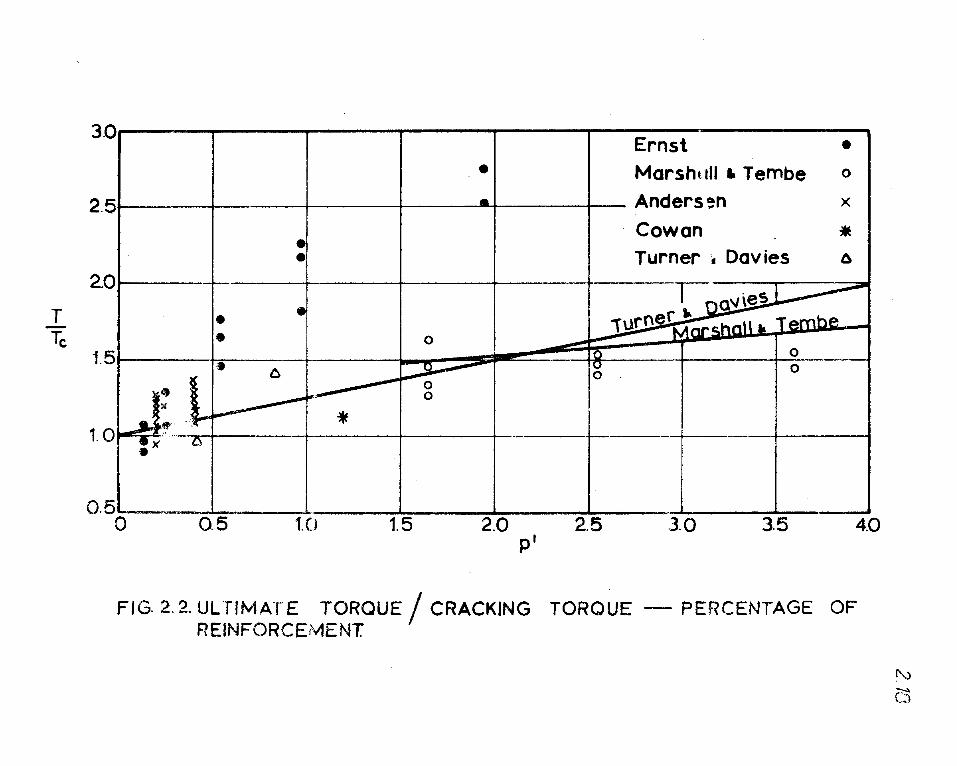
In Figure 2. 2 the ultimate torque of the test beams, expressed as
a ratio of their cracking torque, is plotted against the percentage of
reinforcement that they contained. Also plotted on this figure are the
equations suggested by Turner and Davies (Equation 2. 13) and Marshall
and Tembe (Equation 2. 14). As may be seen from Figure 2. 1, these
equations do not give estimates of the torsional capacity of reinforced
beams which agree well with the test results. Further in order ~o employ
these methods in practice, it would be necessary to estimate the
cracking torque of the beam and this can not be done with accuracy.
The theory proposed by Rausch (Equation 2. 15) is compared with
the experimental results in Figure 2. 3. In this figure the ultimate
torque of the test beams, expressed as a ratio of their cracking torque is A f
plotted against the dimensionless parameter b'd' w w which is a measure s Tc
of the amount of web steel in the section. Now Rausch's theory can be
expressed as
T T
C
= 2 b'd' A f
WW sT
C
......... 2. 16
and in Figure 2. 3 this equation is plotted. It would appear from this . A f
figure that for values of b'd' w w between 0. 5 and 1. 0, tolerable s Tc
agreement with experimental results is obtained. For higher values of
this ratio, however the theory may grossly overestimate the ultimate
T -Tc
3.0. I I I I I
Ernst • • 1 I Marsht 111 • Tembe 0
2.5f I I I ·1 I Anders,n X
Cowan * :1 I I I Turner ,. Davies 6 I I
2.0
I 1: I I 0
1.5 I ·- - I I LI ----- I I"
0
1. o...,_ - a
0.5-.-~, I I
0 0.5 1.0 1.5 2.0 2.5 3.0 3.5 4.0 p'
FIG. 2.2. ULTIMATE TORQUE/ CRACKING TORQUE - PERCENTAGE OF REINFORCEMENT
~ ~ CD

T Tc
3.0. . - - ' LEGEND:
• I Ernst • 2.51 I /l -~ I • I Marshall•Tembe o
2.01 Iv~ I-
1. 51 LJ: i I
0.50 0.5 1.0
I
I 0 0
1.5
b1d' fw Aw STt.
Andersen Cowan
I Turner a. Qavies
l 0 0
2.0 2.5
FIG. 2.3 TORSIONAL STRENGTH- AMOUNT OF
r RANS VERSE REINFORCEtv1ENT
X
• ~ -
20
t,.) ·.,
l.o

2.20
torque while for low values, that is for lightly reinforced sections,
Rausch's theory will underestimate the failure torque.
Cowan assumed that the torque on a reinforced section is
resisted partly by the concrete and partly by the steel. That is
T = T + T ......... 2. 17. C S
He obtained the following formula for the contribution of the
reinforcement to the torque:
f A T = 1. 6 b'd' ~ ......... 2. 18.
s s
where f s is the steel stress.
As Cowan was concerned with developing a working stress
design method the term f in his equation really refers to the maximum s
permissible steel stress. His method has however been used (Ref. 2. 18)
to compute the contribution of the web steel at ultimate load and for this
purpose fs would be replaced by fw, the yield strength of the steel.
Equation 2. 17 can be rearranged to give:
T T
C
T = 1 + s
T C
and substitution for T we have: s
T T
C
A f = 1 + 1. 6 b'd' w w
sT C
......... 2. 19.

2.21
This equation has been plotted on Figure 2. 3. Examination of this
figure reveals that equation 2. 19 overestimates the effect of the steel.
In the Australian Code the unconservative nature of Cowan's
formula for the "additional twisting moment due to the insertion of the
hoops" is offset by a very low estimate of the torque taken by the concrete
and by placing severe limitations on the amount of reinforcement permitted
in any section.
Andersen's method, although slightly more conservative than
Cowan' s is subiect to the same limitations. It has the additional
disadvantage of being extremely complex.
Ernst (Ref. 2. 19) in 195 7 conducted a series of tests to investigate
the effect on the torsional strength of variations in the ratio of longitudinal
to transverse reinforcement. He found that both the longitudinal and
transverse steel yielded at failure for wide variations in this ratio.
Further he found that increasing the percentage of longitudinal steel
increased the torsional capacity of the beams, even though the volume of
transverse steel per unit length was not increased. The theories outlined
above cannot account for this increase in strength.
2. 3. b. Bending and Torsion.
Beams subjected simultaneously to the combined actions of a
twisting and bending moment are of much more interest, from the
practical viewpoint, than members with torsion only. This subject has,
fortunately, received considerable attention of late years.
The first worker in this field was Cowan (Ref. 2. 20) who in
195 3 put forward a theory for reinforced concrete beams subjected to
the type of loading under discussion. He emphasized the fact that in
this theory he was concerned mainly with the behaviour up to the
"visco-elastic limit" (this point corresponds with a marked change in
the slopes of the load-deflection and torque-twist curves).

2.22
His theory therefore is not intended to refer, necessarily, to the
maximum load such members can sustain.
Cowan contends that it is necessary to distinguish between two
distinct types of failure. Under predominantly bending loads the concrete,
presumably on the top surface of the beams, crushes while under
predominantly torsional loading a cleavage failure, recognizable by the
clean appearance of the fracture, occurs. By making use of two possible
criteria of failure, a maximum principle stress criterion applying to
the cleavage failures and the internal friction theory for the crushing
failures, he concluded that "a moderate amount of bending does not
decrease the torsional strength, but on the contrary increases it"
(Ref. 2. 2). Cowan also concluded that the addition of a small amount of
torsion will reduce the bending strength only slightly. He therefore
decided that it was reasonable "to assume that no reduction in the
maximum permissible stresses is required when flexure and torsion
occur in combination". To illustrate the above conclusions Cowan drew
the diagram which is reproduced in Figure 2. 4.
It will be seen later that in the light of more recent investigations
the above statements by Cowan require modification.
In the last few years several investigators have proposed theories
to calculate the ultimate strength of beams containing web reinforcement
and loaded in combined bending and torsion. It is generally agreed that
failure of the beams takes place ,in the manner suggested in Figure 2. 5.
The beam fails when tension crrcks on three of the sides open allowing
the segments of the beam to rotate about an axis located near the
fourth side. At failure the concrete in this face crushes. In
analyzing this mechanism various investigators have made differing

--1
tz w 2'. 0 2 (!) z IV')
~ I-
BENDING MOMENT
FIG. 2. 4. COWAN1S SUGGESTED INTERACTION DIAGRAM FOR REINFORCED CONCRETE BEAMS.
I I I I
2.23
THEORETICAL INTERACTION-FU:....'.... LINE DESIGN SIMPLIFICATION - DOTTED LINE

/ ·--------------------·--·-- ,· ,,
·'
,.,
---·'
, , ..
FIG, 2. 5 MANNER OF FAILURE OF A BEAM LOADED IN BENDING AND TORSlON f\)
f\) ~

2.25
assumptions. For example the direction of the axis about which the
beam rotates has been taken as parallel to the longitudinal axis of the
beam, Gesund (Ref. 2. 21), joining the ends of the tension spiral,
Lessig (Ref. 2. 22) and Yudin (Ref. 2. 23), or at a certain angle to the
longitudinal axis of the beam, Evans (Ref. 2. 24). Attention will now be
given to the various theories produced by these, and other, differing
assumptions.
Lessig was the first worker to derive expressions for the ultimate
load of this type of beam. For the purpose of analysis she assumed that
the intersection of the failure surface with the beam faces are straight
lines and further, that the inclination of these lines on the three sides
corresponding to the tension cracks is constant. Her idealized failure
surface is shown in Figure 2. 6. This type of failure is called Mode 1 by
Lessig to distinguish it from the failure surface which she used for
combined shear and torsion and labelled Mode 2.
In her analysis, Lessig assumed that all steel traversed by the
failure crack yields. She recognized that this was not always the case
but she considered it the most common cause of failure. "Premature"
failures in which the steel does not yield are dealt with by empirical
formulae. These will be treated in detail later.
In the analysis of Mode 11 the forces in the vertical legs of the
hoops intersected by the failure crack, dowel forces and tensile stresses
in the concrete are ignored. As mentioned above, an inclined failure
hinge is assumed. This hinge has a projected length of q (see I
Figure 2. 6). Moments about this hinge are calculated for the tensile
forces in the longitudinal reinforcement and in the bottom horizontal
parts of the transverse steel. These moments are then equated to the
components of the external moments about this axis. The length of the

2.26
\ N-._.,_....-------+-------,.----\\ \
b
1 h
~ ~-------J FIG. 2.6 BENDING-TORSION FAILURE SURFACE PROPOSED
BY LESSIG. MODE 1

2.27
failure hinge which makes the external moment a minimum is then
determined. Finally the depth of the compress ion zone is found by
equating the compressive forces perpendicular to the failure surface
to the components of the tensile forces in the steel and by assuming that
stresses in the other directions will not effect the failure of the concrete.
The final expressions obtained by Lessig have been presented by
her in a number of slightly different forms. When incorporated into the
Russian Code (Ref. 2. 25) the expressions \\ere presented in the following
manner:
, ...... 2. 20.
b 2 AL l fL 1 s ( 2h + b) (-) i' + A f ...... 2. 21.
WW
but 2h + b
b
where T 1 is the failure torque in Mode 1 and a,p = T /M, the other
symbols being defined in Figure 2. 6. A full derivation of the above
equations is available in Ref. 2. 2.
Lessig does not explicitly discuss the interaction of bending and
torsion, and the form of her equations does not make it easy to discover
what she would predict. Upon examination it is found that her theory
suggests that the shape of the ''interaction curve" depends upon the
2 28
properties of the beam in question. However, for a large number of
beams, the shape predicted will be similar to that shown in Figure
2. 7. For all beams, Lessig's equations would predict that the
presence of bending decreases their torsional capacities, and the presence
of torsion their flexural capacities.
Tests by Chinenkov (Ref. 2. 26) verified that torsion does indeed
reduce a beam's flexural capacity. He reported that the following
reductions had been observed:
Ratio of loading.
T/M = 0. 1
T/M = 0.2
T/M = 0.3
T/M = 0.4
Reduction in Bending Moment at Failure.
0 - 1°/o.
7 - 19°/ 0.
23 - 2s0 /o. 29 - 33°/o.
Chinenkov concluded that Lessig's formulae predicted failure loads
agreeing well with the test results. Experimental values slightly higher
than the predicted values could, he thought, be accounted for by the tensile
stresses in the uncracked concrete which were ignored in the theory. In
connection with Lessig's assumption regarding the constant inclination of
the tension crack Chinenkov stated that this assumption did not agree with
observed facts.
It is to be noted that Lessig intended that the equations given above
should only be applied to those beams which fail by yield of both the 1
longitudinal and the transverse steel. If the theory was applied to beams
in which the reinforcement did not yield it would lead to unconservative
results. Limits must thus be placed on the amount and the distribution
of the reinforcement to exclude this case.

1-z w 2 0 2 (!) z 1-ll)
~ 1--
BENDING MOMENT
FIG. 2. 7 BENDING TORSION INTERACTION AS PREDICTED BY THE THEORY OF LESSIG.
2. 29

2.30
In the first instance the amount of reinforcement must be limited
so that the concrete near the top face of the beam will not crush before
the steel yields.
Lessig conducted a series of tests in 195 7-5 8 (Ref. 2. 2 7) in an
attempt to define this limit empirically.
She observed that even with high percentages of steel this mode of
failure rarely occurred for values of 4' in excess of 0. 2. From those
tests in which compression failure occurred she obtained the following
relation between the depth of the compression zone, xc, and the ratio
of loading,
h~: = 0.55 - 0.7fo (0~ 4'~ 0.2) ....... 2.23 2
For cases where x , from the above, was greater than or equal C
to twice the distance from the top face to the centre of the top steel, the
relation between steel areas and x would be: C
X C'
.... 2. 24.
whereas if the indicated value of x were less than twice this distance the C
steel area would then be given by:
0. 85 f I b ( 1 + 5 4' ) X . C C
. ........ 2. 25.
The number of tests on which the empirical equation 2. 23 was
based was rather limited and Lessig suggested there is a need for
further work on this aspect of the problem.

2.31
A much more common case of concrete compression failure
occurs when the ratio of twisting moment to bending moment is higher
than for the case mentioned above. In this case the concrete near the
side face crushes before the steel yields.
A number of beams tested by Lessig failed in this manner.
She assumed that the ultimate twisting moment of such a beam could be
expressed by a relation of the form:
T = K b 2 h f'. C
As K would appear dependent upon the relative values of twisting
moment and direct shear force, she examined the effect of a ratio involving
these two actions. For the type of failure being considered she concluded
that there was no correlation between this ratio and the value of K. As
K varied between 0. 07 and 0. 12 she suggested that such a compression
failure would not occur if:
T 0. 07. . ........ 2. 26.
To test the effectiveness of this limitation, i. e. its ability to
exclude unconservative results, a large number of test results ha.ve
been examined. For these results the failure torque predicted by the
theory, Tth , has been compared with the failure torque observed in eor
the tests, T , in the form of a ratio T /Tth exp. exp eor. If the value of
this ratio is less than one then the theory is unconservative. In Figure
2. 8 the ratio T /Tth has been plotted against the value of K, i. e. 2 exp eor
Tth /b h f' . The general trend of results shown in the figure suggests eor c

1.6--------,.----T"--~----T---~--'"'1"-------------, LEGEND This Invest • Chinenkov X
~
+ Ernst 0 Lessig +
1.2 .. t .... Lyalin • Yudin I -i-
- - - --+ -- --------- , CC1NOn 0 Evans e L: +I 1Gesund 0 0 Cl> .c ~
"-. 0.8 • • .. j+ I + +I + L-+- ~7- - r ·---- --- - - -+--- - - ·· -· -- · -ci. )(
I-Cl>
-0
Cl) Cl> :,
g
+ 1-------+------+-------1--- ----+------+--------1-------+---- --+--------I- -------+·--- - --- -
+
o.~: 1-- - - --- +----- - ----- +-- ·----- -------+---------- --- --1------ ·-------·-+--· -- -- -- -- -1----- - - - - -
-- +- - - ---+--- - - -+- - -- --~ - - ---+---- ---
0 0.02 0.04 0 .06 o.os 0.10 0 12 014 . 0.16 0.18 0.'20 0.22
T. Values of K = theor.
t' b2 h C
FIG 2.8 ACCURACY OF LESSIG1 S THEORY VERSUS K
I\)
w I\)

2.33
that the criterion is a satisfactory one. Thus if beams having values of K
higher than 0. 07 are ignored most of the unconservative results are
eliminated. It can also be seen from the figure that applied within the
limitation Lessig's theory gives reasonably accurate results.
Apart from excluding cases in which the total amount of
reinforcement was too great Lessig also felt that it was necessary to
exclude those cases in which the ratio of the transverse to the
longitudinal steel was inappropriate for the ratio of the loads applied to
the beam. This limitation was to ensure that both the longitudinal and
the transverse steel yield at failure.
Lessig and Lyalin (Ref. 2. 28) attempted to establish the limits of
the ratio of transverse to longitudinal steel for which yielding of both
steels could be guaranteed. They fixed limits as follows:
A f w w
o. 5 ~ A f Ll Ll
b s
( 1 + ! j 2hb + b) 6. 1 . 5. . . . . . . 2. 2 7.
Lessig further suggested that beams which do not satisfy this
restriction could be analysed by ignoring the excess guantity of
transverse or longitudinal steel.
The limits imposed by Equation 2. 27 are very severe and have the
additional disadvantage of being difficult to calculate. To investigate the
necessity for such a restriction Figure 2. 9 has been prepared. In this
figure the accuracy of the theory, i. e. the ratio T /Tth , is exp eor
compared with
a parameter R1 !o + ~ ~>-

L: 0
2.
1.
1.
1.
1.
l 1. +'
1-
0
8
6
A
2·
:)
b 0
0 A -
0 0(
u
"--o. d. 91',.J 0
X Cl)
1- 0.6 •u
0 VI Cl) :J
0. .
0 > 0. •
0 0
0
0.2
/\.
0
u~
")(.
X X
0
D
• I
- ------r-l-- -
..I.. I + I .. I • +
I I • H+ +a ., • ~ • .,. u ,.J • axo • 00 • I D I
I . I I I I
I 04 0.6 0.6 1.0
Aw fw b [ 2. Jb ] Values of R,= -------- • S 1+ 'fJ V ~b ALI f LI
FIG 2.9 ACCURACY OF LESSIG'S THEORY VERSUS R1
•o C
2.0 3.0
D
.... ---···-------
4.0 I\)
w ~

2 35
In plotting this figure those results which do not satisfy Equation 2. 26
have been eliminated.
In the preparation of Figure 2. 9 the theoretical torque has been
calculated without heed being paid to the limitations on the ratio of
transverse to longitudinal steel. As has been pointed out above, Lessig
considers that this approach is only valid when the value of R 1 lies
between 0. 5 and l. 5. Examination of Fig. 2. 9 shows that, while it is true
that the theory gives less accurate results when the value of this parameter
is less than 0. 5, the limitation imposed by Equation 2. 27 could safely be
liberalized.
Yudin (Ref. 2. 23) in 1962 criticised the method of analysis
proposed by Lessig. While he agreed in the main with the failure model
presented by Lessig (Figure 2. 6), he contended that it would be preferrable
to consider equilibrium about two axes, the longitudinal axis of the beam
and an axis perpendicular to it. This approach led him to seperate the
components of the load on the beam. The stirrups were to resist the
torsion while the longitudinal steel was primarily to resist the bending.
Further as he was mainly interested in producing design equations he
made two more simplifying assumptions. He assumed that the inclination
of the tension spiral may be taken as 45° irrespective of the ratio of the:
loads, and that the internal "lever arms" may be taken as the dimensions
of the "core'' of the cross section. Using these assumptions Yudin
obtained the following expressions for the ultimate loads: A f
T = 2 b'd' w w
2.28. s
(Note: This is the same as Rausch's formula) and
where
b' + d' c1 = 2b'
2. 36
......... 2. 29.
Gesund, Shuette, Buchanan and Gray (Ref. 2. 21) in 1964 proposed
a theory for reinforced beams subjected to combined bending and torsion.
Their approach is essentially the same as that proposed by Yudin in that
they consider moments about longitudinal and transverse axes. However,
whereas Yudin assumed that the failure crack crossed the bottom surface
of the beam at an angle of 45° Gesund et al assumed that it crossed at the -1
variable angle 9. They took the value of 9 as cot O. 5 when i.f.J ~ 0. 25 0
and 90 when 'f' <. 0. 25. Further, they assumed that the compression
"failure region" rather than being straight as assumed by Lessig and
Yudin was S- shaped and that at failure the beam pivots about the straight
central portion of the S.
The resulting expression for the maximum bending moment in the
presence of torsion is,
M= M
u ......... 2. 30.
where M is the calculated flexural capacity of the beam and: u
C = d' (h+b cot 9) 2 b'd' + (h-a )b'cot 9·
1
Gesund proposed that the torsional resistance could be taken as
the greater of two moments; one based on the consideration of dowel
forces and the other based on the premise that the hoop steel yields
before failure.

2.37
The general form of the equation which predicts the torsional
resistance by considering the effect of the dowel forces is:
T = Fe tc + r~ f Z(h~Za4) r/ -,.2:r/] J ......... 2.31
where rt is the average radius and the other terms have the meanings
given earlier in the discussion of beams without transverse steel (see
Equation 2. 9).
The general form of the other equation which predicts the
torsional resistance and which is obtained by taking moments about the
failure hinge of the forces in the vertical and bottom legs of the
transverse steel - assumed to be yielding - is:
T = A f
WW $
... 2. 32.
where 9 is the angle between the failure crack on the bottom of the beam
and the beam axis.
For the case of pure torsion it might be expected that cot 9
would be approximately unity. With cot 9 = 1 the above expression is
essentially the same as Rausch's formula.
The form of both Yudin's and Gesund's equations suggest that the
torsional strength of a beam is not effected by the addition of bending
moment, but that the flexural capacity is reduced by the presence of
twisting moment. The interaction curve predicted by these theories
would thus be similar to that shown in Figure 2. 10.
Both of these theories divide possible failures into torsional
failures and flexural failures. They conclude that the torsional failures
are not effected by bending moment nor by the amount of longitudinal

I I ' 1:- !
z w :I. 0 :I
2 38
TORSION FAILURE
BENDlNG MCf\.1ENT
FIG. 2. 10 BENDING TORSION 1NTERACTION AS PREDICTE:t) BY T~E THECPY C'F VUDIN.

2.39
steel in the beam. The first of these conclusions is contradicted by the
results of Cowan and the theory of Lessig while Ernst has shown that the
amount of longitudinal steel has a marked effect on the torsional strength.
Further they conclude that the amount of transverse steel in the bea~ does
not effect the "flexural" failures. Gesund's own results contradicted this
conclusion as when he decreased the spacing of the ties in his beams he
increased their strength in combined bending and torsion by up to 40° / o.
In 1965, Evans and Sarkar examined the case of rectangular beams
failing in combined bending and torsion. They were chiefly concerned
with hollow members but the theory proposed was applicable to solid beams.
The failure model proposed by Evans and Sarkar is shown in Figure 2. 11.
They assumed that the tension crack would form on the bottom surface at
' an angle cl:. , normal to the direction of the maximum tensile stress, and
that the crack would spread at this same angle till it was 6/ 10th of the
way up the sides, where it would change its direction to 45°. Further,
they assumed that when these cracks opened the beam would rotate about
a "compression hinge" which would form at 45° to the axis of the beam.
By equating the moments due to external forces and those due to
internal forces about this axis of rotation, and by assuming that the steel
crossed by the failure surface yields Evans set up the following equations
for the bending moment at failure:
1 [ 2 Awfw f , M = -- f' x b + A f (d-x) + -- (h-a -x)(b-2a )Cot oe I +'fl c LI LI s 3 4
- (h-Za3)(o. 6 Cot oc' + 0. 4)[ b cotoc' + h{0. 6 Cotat' + 0. 4)-b]}]
2. 33.
Where x, the depth of compression is to be found by equating the
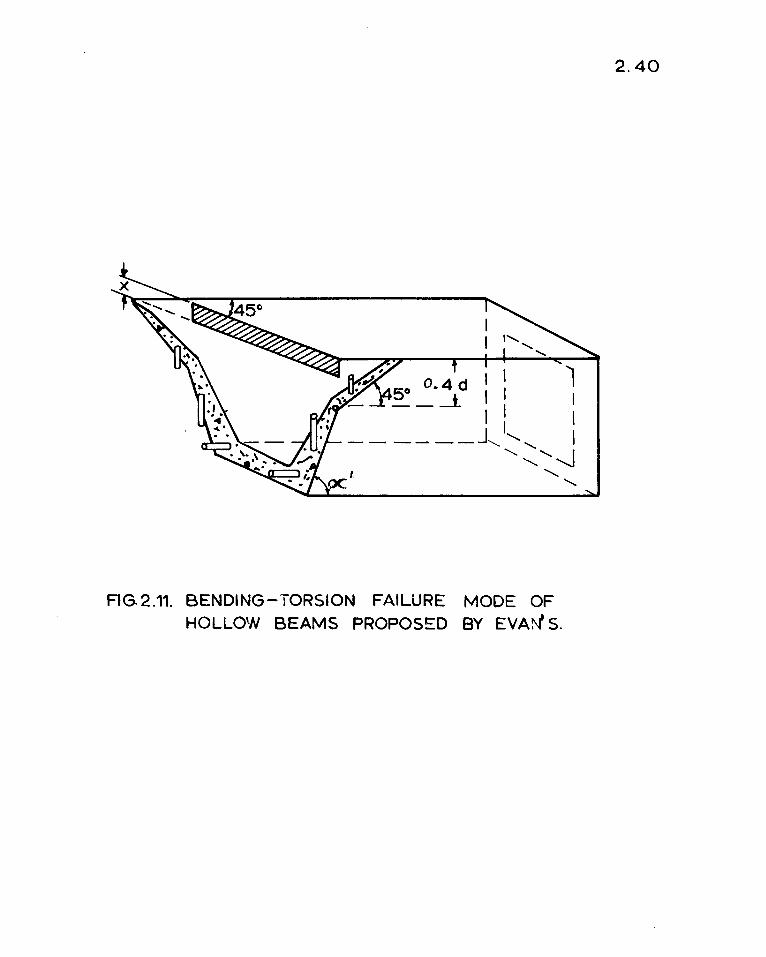
FIG.2.11. BENDING-TORSION FAILURE MODE OF HOLLOW BEAMS PROPOSED BY EVA~S.
2.40

2.41
compressive and tensile forces along a plane normal to the axis of
rotation.
Thus
x= 2
A f \\' w
-$--
f' b. C
I (b - 2a 4 ) cotcC.
I
......... 2. 34
In finding the inclination of the crack, cl:. , Evans suggested that a fully
plastic distribution of torsional shear stress and a semi-plastic
distribution of normal flexural stess;. as used by Cowan (Ref. 2. 20),
be employed. For a solid rectangular beam this leads to the following:
where
' cot<,(=
f =
1
( f + F+1 ) ......... 2. 35.
1 1. 06 (1 - 3d) ......... 2. 36.
oC.4' Evan:'s equations, like Lessig's, suggest that the presence of
bending moment will decrease the torsional capacity of the beams and that
the flexural capacity will be reduced by the application of a twisting
moment. The shape of the interaction curve predicted by these equations
will thus be similar to that shown in Figure 2. 7.
A major drawback of the above theory is the complexity of the
equations produced. Evans and Sarkar suggested that a quick though
fairly inaccurate, assessment of the strength of a beam in combined
bending and torsion would be given by:
M = M
u 1 +'\'
......... 2. 37.
It will be noted that the equation is similar in form to the equations
proposed by Yudin and Gesund.

2 42
For a theory to be considered satisfactory it should not only
predict correctly the qualitative effect of various parameters on the
strength of the beams but should also lead to accurate quantitative
predictions. To test the various theories proposed for beams loaded in
bending and torsion by this criterion Table 2. 2 has been prepared. This
table contains the results of beams containing web steel, loaded in
bending and torsion. Full details of these beams may be found in
Appendix D. As well as recording the failure loads of the beams the
table lists the parameters T / Tth for the various theories. exp eor Although only Lessig gave equations to exclude over-reinforced
beams, all the ultimate strength theories have been based on the
assumption of the steel yielding at failure. For this reason Table 2. 2
does not contain the results of any over- reinforced beams.
Examination of the table reveals that the theory of Gesund et al
gives the most satisfactory results for the beams listed. Thus the
ratio of the observed failure load to the load predicted by Gesund' s
theory has an average value of 1. 29 with a coefficient of variation of
15°/o. Further, the least conservative result is only in error by 12°/o.
The theory therefore gives an accurate and conservative estimate of the
failure loads. It must be remembered, however, that the theory
involves a tedious trial and error approach and so is too cumbersome
for use in design.
The theory of Evans and Sarkar, while still being complex,
involves less calculations than the theory of Gesund et al. Unfortunately
it often seriously overestimates the strength of a beam. Examination
of Table 2. 2 shows that for this theory the ratio T /Th has an exp t eor

TABLE 2. 2
A Comparison of Experimental Results and Published Theories for Beams
Loaded in Bending and Torsion. ,.
T /T, e:xp t;ieor Investigator Beam Torque Moment Lessig Yudin Evans Gesund
kip.in. kip.in.
R5 75.4 75.4 3.86 3.47 0.67 0.88
Cowan and R2 79.0 158.0 3.84 3.64 1.04 1.27
Armstrong Rl 43.0 258.0 1.95 1.98 1.32 1.51
Sl 82.6 206.5 2.95 2.85 1.26 1.52
S4 64.6 258.4 2.23 2.23 1.41 1.63
1 79.0 79.0 0.90* 1.07 0.79 1.02
2 102.0 102.0 0.91 1.26 0.93 1.32
3 61.0 122.0 0.93* 1.09 0.90 1.13
4 67.0 134.0 0.95 1.20 0.89 1. 25
5 49.0 147.0 0.97* 1.16 0.97 1.19
Gesund and 6 56.0 168.0 1.10 1.33 1.00 1.37
Boston 7 43.0 173.0 1.07 1.25 1.07 1.29
8 44.0 176.0 1.08 1. 27 0.97 1.31
9 60.0 120.0 1.00 1.46 0.64 1.04
10 44.0 176.0 0.84* 1.07 0.77 1.21
11 68.0 138.0 0.78* 1.12 0.76 1.18
12 53.0 213.0 0.90* 1.26 0.94 1.46
B28 0.1 48.6 486.0 1.04* 1.14 1.08 1. 23
B28 O.la 46.9 469.0 1.00 1.11 1.05 1.20
B28 0.4 146.0 365.0 1.40 1.99 0.94 1.49
B28 0.4a 139.0 347.0 1.33 1.90 0.90 1.42
t:hinenkov B28 0.4b 146.0 365.0 1.40 1.99 0.93 1. 25
828 0.4c 153.0 382.0 1.44 2 .12 0.89 1.36
B28 0.4d 125.0 313.0 1.19 1.67 0.85 1.49
B28 0.4e 132.0 330.0 1.28 1.77 0.86 1.54
Mean 1.51 1. 70 0.95 1. 29
Standard Deviation 56% 40% 19% 15%
Number of Tests 25 25 25 25

2.44
average value of 0. 95 and a coefficient of variation of 190/o. For
some beams in this table, however, the theory overestimates the failure
load by about 50° /o.
Of the four ultimate strength theories discussed, only the theory
of Yudin is simple enough for use in design (see Equations 2. 28 and 2. 29).
Unfortunately the equations proposed by Yudin, while being simple and
conservative, are not very accurate, having an average value for
T /T h of l. 70 and a coefficient of variation of 40° / o. exp t eor
If the theory offered by Yudin is the most simple available for this
type of beam, then the theory offered by Lessig is the most comprehensive.
It is therefore rather surprising that Lessig's predictions are so
inaccurate. (Average value of T / Tth = 1. 51, coefficient of exp eor
variation= 56°/o.) One of the main reasons for these inaccuracies is the
unsatisfactory nature of the limits placed on the ratio of the longitudinal
to the transverse steel (Equation 2. 27), and the necessity of ignoring
"excess" steel to satisfy these limits. Tha. analysis of those beams for
which this procedure was not necessary (beams marked with an
asterisk in Table 2. 2), yielded much more accurate results.
2. 3. c. Torsion, Bending and Transverse Shear.
As in the case of beams not containing web steel, the important
problem of beams failing in combined torsion and transverse shear has
received less attention than the simpler cases of bending and torsion and
pure torsion.
Lessig (Ref. 2. 22) was the first to suggest a theory for
calculating the ultimate load of this type of beam. She observed that
when a beam is loaded in predominantly transverse shear and torsion,
cracks appear first on the side surface of the beam on which the

2 45
principal stresses due to torsion and shear are of the same sign.
These cracks then spread to the top and the bottom surface. On the side
where the torsion and transverse shear stresses oppose each other
cracks do not appear until just prior to failure. Based on these
observations Lessig proposed an idealized failure mode, which she
called Mode 2. This failure model is shown in Figure 2. 12.
By employing similar methods to those used in analysing the Mode
1 (bending and torsion) failure surface Lessig obtained the following
expressions for the failure torque in Mode 2:
where
and
but
and
(b-az-2- ) Aw f w q2 x2 [ j T 2 = q2(1+6) h AL2 fL2 + S(2b + h) ........ 2. 38.
6
q2
q2
Vb = 2T
= JALZ fLZ s(Zb + h)
A f ' w w
£ 2b + h,
h 2 2
0.85f~(q2 +h)
..........
A f q2 2 7 -s-7-2b_w_+_h_) _J
2. 39.
.. 2. 40.
For the given ratios of loading, ~ and 6, the predicted failure torques in
both Mode 1 and Mode 2 could be calculated and the lower of the two would
be the predicted failure torque.
As in the case of the Mode 1 equations, Lessig places limits on the
ratio of transverse to longitudinal steel outside which her theory does no-I:

2.46
-t Sl-1 I I ___ L.02,
~ ,...A_1/AL2
I
I h I I I _j_------+------~
FIG. 2.12 SHEAR- TORSION FAILURE SURFACE
PROPOSED BY LESSIG. MODE 2

apply. These are:
0.5 ~ h s
2.47
1. 5. . ........ 2. 41.
From her tests, Lessig found that for beams containing only
small amounts of transverse steel, and loaded with high transverse
shear forces in combination with torsion, a more usual shear failure
occurs. She empirically related the strength of such beams to their
shear capacity in the absence of torsion, given in the Russian Code by
V 0
0. 51 f' C
A f w w
s n
where n is the number of "legs" of the stirrups.
.... 2. 42.
She concluded that the magnitude of the transverse shear at
failure when torsion was also present could be found by the relationship:
V = V
0
1. 5 l + 0
......... 2. 43.
Lessig established this empirical relationship from only a very
small number of test results and so no great confidence can be placed
in it. Actually the form of Equation 2. 43 seems unsuitable. This
equation can be rearranged to give:
V = V 0
3T b
......... 2. 44.

2.48
While, equation 2. 38 for the Mode 2 failure, can be rearranged to give:
V = 2T
0
b 2T b
......... 2. 45.
where T is the pure torsional strength of the beam in Mode 2. Equations 0
2. 44 and 2. 45 have been plotted in Figure 2. l 3 for a hypothetical beam.
It can be seen that because of the slopes of the lines, Equation 2. 44, which
is supposed to be related to predominantly shear failures, tends to be
critical when the torsion is high. On the other hand, the Mode 2
equation, which is supposed to cover torsional failures, is critical when
the shear is very high. This situation is unsatisfactory.
Yudin (Ref. 2. 23) as in the case of bending and torsion, agreed
with the basic failure mechanism proposed by Lessig, but derived his
equations from different assumptions. He suggested that for beams
loaded in combined transverse shear and torsion the twisting moment
could be replaced by an effective twisting moment T', where
T' = Vb'
T + 2 . ......... 2. 46.
The area of hoop steel required to resist the combined action would then
be:
A = w
T's 2 f b'd''
w ......... 2. 47.
Further additional longitudinal steel is required in the side face of the
beam to balance the moment about a vertical axis of the forces in the
horizontal legs of the hoops. This quantity is:

To
..... z w ~ 0 ~
(!) z ..... V)
~ .....
2.49
TRANSVERSE SHEAR FORCE Vo
FIG. 2. 13. SHEAR - TORSION INTERACTION FOR TYPICAL
BEAM AS PREDICTED BY LESSIG' S THEORY.
2.50
= T' (b' + d')
......... 2. 48.
In 1964, Yudin (Ref. 2. 29) published the results of a series of
beams, designed by his method and tested in combined transverse shear
and tors"ion He concluded that the test results of the majority of the
beams were closer to the theoretical values computed using his formulae
than to those calculated on the basis of Lessig's. Unfortunately many
of his beams violate the limits placed on Lessig's theory.
The results of all under-reinforced beams loaded in combined
bending, torsion and shear have been collected in Table 2. 3. In the
table a comparison is made between the experimentally observed
failure loads and the failure loads predicted by the theories of Lessig
and Yudin. Study of this table shows that the simpler theory of Yudin
has an average value of T /T of 1. 57 with a coefficient of exp theor
variation of 34° / o and in thus more accurate than the theory of Lessig
{Mean of T /Tth = 1. 66, coefficient of variation= 44°/o). exp eor
Those beams for which Lessig's analysis did not involve ignoring
excess steel are marked with an asterisk. It can be seen that for these
beams the predictions of Lessig are fairly accurate.

TABLE 2. 3
Comparison of Experimental Results and Published Theories for Beams
Loaded in Shear and Torsion.
T /T exp theor
Investigator Beam Torque I Moment I Shear Lessig Yudin kip.in. I
kip.in,! kips
B1112 146.0 243.0 9.24 1.51 1.21
BIII2A 151.0 261.0 10.21 1.54 1.31
B1115 156.0 416.0 15.56 1.56 1.38
BIIISA 151.0 416.0 15.52 1.47 1.36
B1116 92.0 156.0 4.07 1.14* 1.62
BIII6A 83.4 156.0 4.16 1.11* 1.56
BIIl7A 90.4 313.0 8.06 1.20* 1.55
B1117 83.4 278.0 7 .16 1.09* 1.41
Lessig B1118 114.5 191.0 4.99 1.87 2.07
BIIl8A 111.0 191.0 4.99 1.80 1.85
B1119 78.0 313.0 4.63 1. 33 1.45
BIII9A 79.0 313.0 4.99 1.80 1.85
B1119 78.0 313.0 4.63 1.33 1.45
BIII9A 79.0 313.0 4. 71 1.39 1.55
WB 53.0 132.0 6.64 2.73 3.35
WBA 57.3 143.0 7.16 2.85 3.45
B8 0.1 52.0 520.0 12.52 1.04 1.18
B8 O. lA 55.5 555.0 13.36 1.04 1.17
B7 0.2 93.8 468.0 11.30 1.69 1.28
B2 139.0 694.0 16.65 1.14* 1.33
Lyalin B2A 139.0 694.0 16.65 1.06* 1.24
B2A 139.0 694.0 16.65 1.06* 1.24
B3 194.0 486.0 17.48 1.30 1.21
B3A 194.0 486.0 17.48 1.30 1. 21
B5 194.0 972.0 23.24 1.07* 1. 25
BSA 194.0 972.0 23.24 1.16* 1.36
B6 167.0 833.0 20.19 1.14 1.34
B6A 181.0 903.0 21.88 1.24 1.46

....
2. 3 (contd.) T /T . exp ti.eor
Investigator Beam Torque Moment Shear Lessig Yudin kip.in. kip.in. kips
7 9.9 49.3 2.51 3.95 1.49
18 7.9 39.4 2.00 2. 77 1.59
Yudin 19 7.9 39.4 2.00 2. 77 1.59
21 7.9 39.4 2.00 2. 77 1.59
Mean 1.66 1.57
Standard Deviation 44% 34%
Number of Tests 29

3. 1
CHAPTER 3
EXPERIMENTAL WORK
3 .1 BACKGROUND.
It is convenient to divide the discussion of the tests into three
sections; plain concrete beams, beams containing only longitudinal
steel and beams reinforced with both longitudinal and transverse steel.
It has been pointed out in the previous chapter that while most
investigators· assume that the ''maximum stress theory" is a suitable
failure criterion for plain concrete beams subjected to torsion,
disagreement exists as to how this stress should be calculated.
Further, it has been shown that for a wide range of ratios of depth
to breadth of a rectangular section the indicated tensile strength of
concrete, calculated on the basis of the failure torque with an "elastic"
stress distribution is 1. 66 times the tensile strength calculated on the
basis of a "plastic" stress distribution. Results of pure torsion tests
on beams of rectangular cross section _only, therefore, cannot provide
sufficient evidence to support a theory of "plastic" stress distribution

3.2
as opposed to an "elastic" stress distribution. To test the
consistancy of these two theories a series of beams having different
shaped cross sections was, therefore, cast.
Although plain concrete beams are not employed in practice, study
of their behaviour is still rewarding because the failure load of such
beams, usually corresponds to the cracking load of a fully reinforced
member. Thus, to determine whether the cracking load of a concrete
section in bending and torsion, could be satisfactorily predicted by
employing a maximum stress criterion for concrete strength, together
with a "plastic" stress distribution, a series of plain concrete beams
were cast and tested in combined bending and torsion.
To collect additional information on the relationship between
cylinder compressive strength and torsional "tensile" strength, a plain
concrete specimen was cast from each batch of concrete used during
this investigation. This specimen was then tested in pure torsion.
A study of the literature in the last chapter revealed that while
a large number of investigators have tested beams containing
longitudinal steel only, in pure torsion, very few have studied the more
practical case of combined bending and torsion, and only one has tested
beams in combined transverse shear and torsion. Attention was
therefore concentrated on these two problems. Two series of beams
containing only longitudinal steel, were tested in combined bending and
torsion, while four series of beams were tested in combined transverse
shear and torsion.
Previous investigators have disagreed about the effect that
flexure has on the torsional capacity of beams containing both longitudinal
and transverse steel. It was felt that this disagreement could be
explained by the fact that different investigators had tested different

Type
Plain
Longitudinally Reinforced
Fully Reinforced
TABLE 3.1 SUMMARY OF BEAMS TESTED
Series Number of Tests Purpose of Tests
REP, RUP, 10 To compare the Elastic and (HC, Rl, SC, CRPl) Plastic theories.
p 7 To predict failure loads in combined bending and torsion.
w 5 To find the "tensile" strength of concrete in torsion.
L, LB 9 To study the behaviour in combined bending and torsion.
S, LS, Q, 29 To study the behaviour in combined (LS, L6, SLl) transverse shear and torsion.
RE, RU 17 To study the effect of the ratio of top to bottom steel on the flexure torsion interaction.
R 11 To study the effect, on the behaviour, of various reinforce-ment patterns.
V, U, T. 29 To study transverse shear-torsion interaction behaviour.
vJ
vJ

3.4
types of beams. In particular, it was thought that the ratio of top
to bottom longitudinal steel might have a marked effect on the interaction
behaviour of the beams. Two series of beams were therefore
designed to examine the effect of this ratio.
A third series of beams, containing both longitudinal and transverse
steel, were also tested in combined flexure and torsion. This series was
primarily, designed to investigate the effect on the failure behaviour of
varying the ratio of transverse to longitudinal steel. Tests of this series
also compared tied and welded reinforcement, and open and closed stirrups.
Very few results are a_yailable in the literature, of fully
reinforced beams loaded in combined transverse shear and torsion. In
particular, no experimentally g.erived interaction curve between shear
and torsion has been published. Three series of beams were, therefore,
designed and tested to remedy this deficiency.
A list of the various series of beams tested and a brief summary of
the purpose of each series is given in Table 3 .1.
3. 2 DESCRIPTION OF TEST SPECIMENS.
a. Plain Concrete.
Details of all plain concrete specimens cast are given in Table 3. 2.
For completeness Table 3. 2 also contains the failure loads of the specimens
but these need not concern us at present.
The first four specimens HC, Rl, SC and CRPl were all cast
using a concrete mix containing 3 / 811 maximum size aggregate. This
fine aggregate was chosen to facilitate the casting of the hollow cylinder.
Specimens HC; Rl and SC had been designed to test the consistencies of
the "elastic" and the ''plastic" stress distributions. These three
specimens, which were three feet long, were tested in a conventional

Beam
HC
Rl
SC
CRPl
REP2
REP4
REPC
RUP2
RUP4
RUPL
Pl
P2
P3 ,.P4
PS P6 PC
Wl
W2
W3
W4 W5
TABLE 3. 2: DETAILS OF PLAIN CONCRETE BEAMS
Size and Shape Concrete Details Failure Moments (kip-ins)
f' (p. s. i.) ft (p. s. i.) Type Torque Moment C
(Brazil)
Hollow Cylinder O.D. 7,200 640 3 / 8" aggregate 13. 6 0.0 = 611 • I.D. = 4 11 • Pan Mix.
6" x 4" Rectangle 7,200 640 13. 4 0.0
611 Dia. Solid Cylinder 7,200 640 20.0 0.0
911 x 611 Rectangle 6,300 600 23.3 36,6
9 11 x 611 Rectangle 4,600 575 Transit Mix 29.6 20,3
1011 x 6½'' Rectangle 4,600 575 Pour 1 50.5 0,0
611 Dia. Solid Cylinder 4,600 575 18. 8 0.0
911 x 6" Rectangle 3,680 516 Transit Mix 19. 0 35.7
1011 x 6½'' Rectangle 3,680 516 Pour 2 66.3 0.0
9" x 6" L-shape 311 3,680 516 19. 8 0.0 thick
9" X 611 Rectangle 7,100 - 3 / 4" aggregate 37.4 24.7
9" x 6" Rectangle 6,350 Pan Mix 25.2 39.6 -9" x 6" Rectangle 6,550 970 47.6 5.5 9" x 6" Rectangle 6,363 945 43.0 5.5 9" x 6" Rectangle 7,450 880 0.0 51. 3 9" x 6" Rectangle 7,400 - 11. 1 51. 4 6" Dia. Solid Cylinder 6,660 - 20.8 0.0
10·. 4"x6. 8" Rectangle 4,630 - Transit Mix 73.2 0.0 10" x 6. 5 11 Rectangle 4,320 - Pour 3 74.5 0.0
10. 2" x6. 9" Rectangle 4,050 - Pour 4 77.4 0.0
10" x 6 .111 Rectangle Pour 5
5,030 - Pour 6 60.5 0.0 10. 211 x5 11 Rectangle 3,560 - Pour 7 31. 9 o.o
I.,
u

3.6
torsion machine (Tinius Olsen 300 kip-inch capacity). To hold the
test specimens in the grips of the machine, steel end plates were
attached to their ends with an epoxy glue.
To enable bending and torsion tests to be carried out,
rectangular beams ten feet long were cast. Th€se beams were
tested in one of the special rigs described later in this chapter. The
P series consisted of six rectangular beams to be tested in bending and
tors:ion and one cylindrical specimen to be tested in pure torsion. All
beams of the P series were cast from nominally the same concrete.
Both the REP and the RUP series comprised three specimens; two
of rectangular section, one to be tested in bending and torsion and
one in pure torsion. The third specimen was circular or L-shaped
in section and was to be tested in pure torsion. All three specimens
of each series were cast from the one pour of concrete.
As mentioned earlier at least one pla:in concrete specimen was
cast from each batch of concrete used during the investigation. These
rectangular beams, which were four feet long, comprise the W series.
All five beams of this series were tested in pure torsion,
3. 2. b. Beams Containing Only Longitudinal Steel.
All test beams, in this group, were rectangular in section and
were ten feet long. Details of these beams are given in Figure 3 .1.
Where bending and torsion faiiures were required (bt:ams Ll, L2, L3,
L4, L7, L8, LBl and LB3) the shear spans were reinforced with 3/8"
diameter mild steel ties at 3" centre.
The L series, which was comprised of etght similar beams, was
primarily intended for the study of bending a!ld torsion failures though
two beams, LS and L6 were tested in combined shear and torsion.

, fr 6~i fT 1-r
! i II ii~ tl
2x ! Q> bars '
I I I ' I
C\I -·o 0) ..... 11= 5'' 3 x 8 <I> bars 7-:d==.-l .J. ,--!1
L, LS SERIES & SL 1
5" 1 I I L:1--:::::==- 2 >C 8 Q) bars
• I I I
S SERIES & LB3
tt 5~1 .11 , . IO
: 0 . ..... co
lb -~
Jx~<f> bars I [ , JJ; t2 2 3m bars~ 1 X4T -
LB1 &. LB2 Q SERIES
FIG- 3. 1. DETAILS OF BEAMS CONTAINING LO;,~(JITUDiNAL STEEL.
C-v
-.J

3.8
Beams of the LB series, LBl, LB2, and LB3, were also tested in
bending and torsion. This series was to study the effect on the
failure behaviour of adding top longitudinal steel.
Beams in the S series (5 beams), LS series (5 beams), and
Q series (12 beams) and beams LS, L6 and SLl were all tested in
combined transverse shear and torsion. To prevent possible anchorage
failures of beams of the Q series, 4.i x 511 x 3/4" steel plates were
welded to the ends of the longitudinal bars.
3. 2. c. Beams Containing Both Longitudinal and Transverse Steel.
All fully reinforced beams were 10" x 6½" in section and were
ten feet long.
Two series of beams, RE and RU, had been designed to study the
interaction between torsion and flexure. The first series, RE, comprised
five beams having equal top and bottom longitudinal steel. The specimens
were similar and details are given in Figure 3. 2. The second series RU,
comprised nine beams in which the area of top steel was only one quarter
of the area of the bottom longitudinal steel. Again these specimens were
all similar and details of these are shown in Figure 3. 2.
Beams of the third series, R, were designed to study the effect
on the failure behaviour of varying the ratio of transverse to
longitudinal steel, and of using open or closed stirrups. Thus the
eleven beams in this series were not all similar. Beams in this
series were given names such as 3.6T4 in which the first number
referred to the diameter of the top bars, the second the diameter of the
bottom bars and the last number the spacing of the stirrups. Further
if the third character was O rather than T it meant the specimen had
open stirrups. Thus beam 77T5 was a beam containing 7 /8" <p bars

3.9
FIG. 3.2. DETAILS OF RE, RU AND R SERIES.
---- ---·---6.5"---
10"
.t!
. -1 r-o.s~ r~-1 -_--1
jties I ---at 3•cc 10"
_l 1.6"
I 1------.
_J1.3"L i
RE SERlE?
j ~0.62" -,
RU SERIES
a~ . ! .
,-~-- -- -65"- § R SERIES
j ties
at s'CC
j ties at 4• cc
,¼•dia
1.8"
[;40'

3.10
top and bottom and closed hoops at 511 centres. Full details of beams of
the R series are given in Table 3. 3 and Figure 3. 2. c.
Three series of fully reinforced beams were tested in combined
transverse shear and torsion. Beams of the first series, V, were
designed so that in the absence of torsion they would fail in shear rather
than flexure. The seven specimens of this series were all similar and
details are given in Figure 3. 3. In the second series, U, the amount
of transverse steel was increased so that in the absence of torsion the
beams would fail in flexure. The three beams of this series were all
similar and details are given in Figure 3. 3. The six beams of the
third series, T, were primarily designed to fail in torsion. Once again
all specimens in the series were similar, details being given in Figure
3. 3.
3. 3. MATERIALS, FABRICATION AND CURING.
In the early stages of the investigation, concrete was mixed in a
six cubic ft. capacity, horizontal, non-tilting, pan-type mixer. Two
different mixes were used. For bE:ams HC, Rl, SC and CRPl a mix
containing 3 / 811 pea gravel and a fine beach sand was used. This
concrete mix had a cement factor of 8. 5 sacks per cu. yd. and a water
cement ratio of 0. 55. The second mix, which was used for beams of the
P and L series, contained 3/4" rounded river gravel, 3/8" crushed river
gravel and fine beach sand. This mix had a cement factor of 6 sacks per
cu.yd. and a water-cement ratio of 0.55. For both mixes a high early
strength cement was used.
Three 6 x 12 inch cylinders were cast along with each beam made
from the above concrete mixes. These control specimens were stored
under water and tested at the same time as their companion beams. In
some cases 4 x 8 inch cylinders were also cast. these being used for

I--/ Hoops butt weld d
r* 1081" "! e
ns~~-Ji 5• ~ - ;t,. =,::;.-----2-1:1 <I> cw5 bars , ,
• 6.5"7 LO N d .. 81 _l
~-1-----r £' 4> ties
--.1- at 4f cc
.. :..ri- .s-f 4> cw5 bars
'N a 3 cc b
~-3 {i:o~~- _u_ bars
Hoops butt welded
I t,.~ ~ -M L,-h
at 3i11 cc
bars
T
FIG. 3.3. DETAILS OF V, U AND T SERIES.

Beam al a2
36T4 1. 6 1. 3
36T4c 1. 6 1. 4
36T5. 5 1. 6 1. 4
77T5 1. 7 1. 4
7705 1.5 l. 3
77T4, 1. 7 l. 4
7704 l. 7 1. 4,
7703 1. 7 1. 6
24T3 1. 3 1. 4
38T5 1. 7 l. 6
I 3304 1.411.4 i
-:r.P....-=~::E; .3 ~ .3 L>::J:!:."7"..A..ZZ...S C>~ ~ S~:R.X~S
BEAM PROPERTIES
i Longitudinal Steel Transverse Steel I I I I
a3 a. IALl fLl AL3. fL3 s f ~- X sq.m. kips/sq. sq.m. kips/sq. ins. kips/sq.
in. in. in.
0.8 0.6 0.88 37.7 0.22 43.4 4 43.0
0.8 0 7 . ' 0.88 37.7 0.22 46.7 4 43.0
0.9 0.7 0.88 37.7 0.22 43.4 51.. 2 43.0
0.9 0.6 1. 20 38.8 1. zo 38.8 5 ~,3. 0
0. 7 0.5 1. 20 38.8 1. 20 38.8 5 (3.0
0.9 0.6 1. 20 33.8 1. 20 38.8 4 ~n. o O. 9 0.6 L 20 38.8 1. 20 38.8 4 1,3. 0
0.9 0.8 1. 20 38.8 1. 20 38.S 3 1,3. C
0.8 0.9 0.39 47.1 0.10 68.7 3 43.0
0. ~ 0.8 1. 57 38. 7. 0.22 45.2 5 -13.0
0. C 0.9 0.22 43.0 0.22 43.0 4 43.0
Type
Closed
Closed
Closed
Closed
Open
Closed
Open
Open
Closed
Closed
Open
w .N
3. 13
"Brazil" tests.
Later in the investigation it was found more convenient to
use commercial transit mixed concrete. This had the advantage that a
number of beams could be poured from the one batch of concrete and
thus the concrete strength could be held sensibly constant across any
series of beams. The aggregate used in this concrete consisted of
3/4" round river gravel, a coarse river sand and a fine beach sand.
High early strength cement was used and an air entraining agent was
added to give a slump of nominally 3 inches.
In all, seven pours of commercial concrete were used. Twelve
6" x 12" cylinders were cast from each pour, stored under water and
then tested at the same time as their companion beams. The cylinder
crushing strength of the concrete at the time of testing is recorded in
the tables along with the failure loads of the beams.
All reinforcing steel was thoroughly cleaned before assembly
into a reinforcing cage. In the case of the RE and RU series, the
transverse steel was spot welded to the longitudinal bars. All other
fully reinforced beams had their hoops tied to the longitudinal steel.
The transverse steel of the V, U and T series was formed into closed
hoops by flash-butt welding. The longitudinal steel used in series V
and U consisted of 5 / 8" diameter deformed, cold twisted bars. All
other steel used consisted of mild steel bars. Details of the steel
used in series R have already been given in Table 3. 3 and details of
the steel in the other series are given in Table 3. 4.
The beams were cast in steel forms. Two days after casting
most beams were removed from the forms and placed under water for
curing. In the case of beams of the RE, RU, LS, Sand LB series
curing took place under hessian, sand and polythene. The hessian
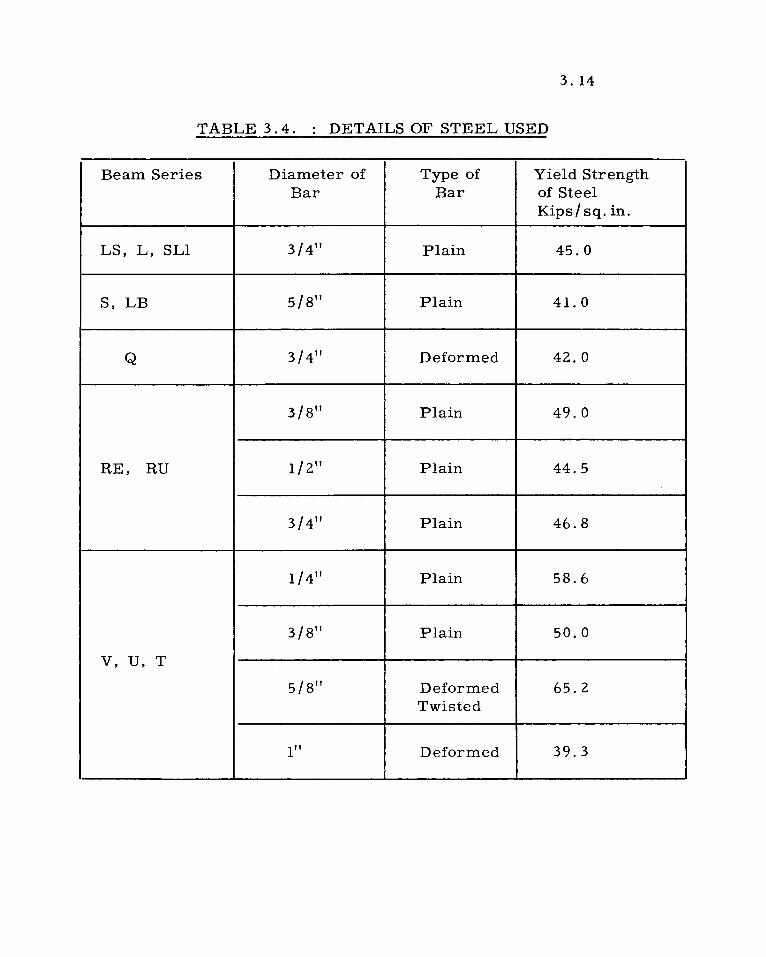
3. 14
TABLE 3.4. DETAILS OF STEEL USED
Beam Series Diameter of Type of Yield Strength Bar Bar of Steel
Kips/ sq. in.
LS, L, SLl 3/411 Plain 45.0
S, LB 5/8" Plain 41. 0
Q 3/4" Deformed 42.0
3/811 Plain 49.0
RE, RU 1/211 Plain 44.5
3/4" Plain 46.8
l / 411 Plain 58.6
3/8" Plain 50.0
V, U, T
5/8" Deformed 65.2 Twisted
l" Deformed 39.3

3. 15
and sand were kept continually damp and tests on companion cylinders
showed this method of curing to be just as efficient as ''under water".
All beams were cured for at least 28 days prior to testing,
most being removed from the water tanks just before testing. However,
beams of the V, U and T series were allowed to dry for at least six
hours prior to testing. These beams were then painted with a PVA
paint to facilitate the recording of cracks.
3. 4. METHOD OF LOADING AND INSTRUMENTATION.
The majority of beams were tested in a three-dimensional
reaction frame. Two loading schemes were employed. Figure 3. 4
indicates, diagrammatically, how the loads were applied in the first
scheme. Each beam was tested over an eight foot span, one end being
held against torsion and the other being free to twist. The bending load
was applied by means of a hydraulic jack and a spreader beam, while
the torsion was applied by another jack at the end of an outrigger arm.
The jacks were hydraulically interconnected so that during the test the
ratio of torsion to bending remained constant. This ratio could be varied
by changing either the jack sizes or the length of the outrigger. Special
roller bearings under the spreader beam and under the ends of the
specimen, ensured that the test beam was simply supported in bending
and was restrained against twisting only at the fixed end.
The second loading scheme is illustrated in Figure 3. 5. It
will be seen that in this scheme one jack is used to apply both the torsion
and the flexure. The eccentricity of this jack determines the ratio of
the twisting moment to the bending moment. As in the first system,
roller bearings under the ends of the specimen ensured that it was
simply supported in bending and restrained against twisting at only one
end.
·.,

TORSION / JACK
SUPPORT---
( 1>
- cc~ ROLLERr:=:=::0
ROLLERS
,L ~ BEARING A
BENDING JACK
PROVING
RING
~EARING D
'l>
BEAM
cc: J;' ~ ROLLERS
D
c( ,.j;:J ( D
( < f9:' BEARING C
§ =-:?'ROLLERS ~;:::
BEARING B
FIG 3.4 LOADING ARRANGEMENT --- ·---~" ..... _,. ---· .. --~- .. ---·---- ---
w ~
en

Bearing D
.,, r ~ --------Support
Torsion Bracket
FIG. 3.5 ONE POINT LOADING RIG. v-> ..... '-J

~11111111111111I~ BENDING MOMENTS
TRANSVERSE SHEAR FORCE
111111111111111 I I I I I I I I I I I I I I I I I I I I I I 11111 TWISTING MOMENTS
SCHEME I
3.18
BENDING MOMENT
TRANSVER!;,E SHEAR FORCE
1111111111111 I 1111111 TWISTING MOMENTS
SCHEME II
FIG. 3. 6. BENDING MOMENTS, TRANSVERSE SHEAR FORCES AND TWISTING MOMENTS PRODUCED IN THE TEST BEAMS.

3. 19
The bending moments, transverse shear forces and twisting
moments produced in the test beams by these two loading systems are
shown in Figure 3. 6. It will be noticed that in the first scheme the
centre portion of the test beams is subjected to only bending and torsion
while in the second scheme torsion is produced in only one half of the
beam.
In both schemes, load was applied to the beams in about ten
increments up to failure. Larger increments were applied in the
initial stages of a test anp smaller increments as the loads approached
the ultimate. The increments varied between about 15 ° / o and 5° / o
of the total load. After each increment, the load was held constant
while crack development, deflections and rotations, and for some beams
strains were recorded. The normal time to complete such a test was
about forty-five minutes.
For the earlier tests rotation measurements were obtained by
measuring the deflections, with the aid of dial gauges, at the ends of
rigid transverse arms. This method was not entirely satisfactory,
mainly because it was not possible to measure reliably the large
rotations which occur as the load approaches its ultimate value. To
overcome this difficulty a continuous recording rotation gauge was
designed. This gauge, which is similar in principle to that used by
Hsu (Ref. 3 .1), is illustrated in Figure 3. 7. The gauge made use of
the Mohr and Federhoff Precision Extensometer which is an
inductance transducer giving a multiplication factor of between 200
and 2000. This device drives the recording drum of the Mohr and
Federhoff loading equipment. The gauge consists, essentially, of a
shaft and an outrigger which was designed to convert a rotation into a
deflection.

F\G. 3 . 7

3.21
The gauge and its ancillary equipment were used as follows
to measure the angular rotation occuring in a beam. Two wooden
blocks were glued on the face of the beam a distance apart equal to
the length over which twist was to be measured. The gauge was then
screwed to one of these blocks and a steel angle to the other. The
gauge and the angle were then connected by a light brass tube, on each
end of which was a phosphor-bronze bellows. The bellows were very
stiff in torsion but extremely flexible in bending and longitudinal
extension, and acted as universal joints. The relative twist between
the two blocks was thus changed into a deflection by the gauge, this
deflection was amplified by the Precision Extensometer and recorded
on the drum of the machine. The sensitivity of the assembly was such
that a twist of 3.15 x 10⁻⁴ radians moved the pen on the recording drum
a distance of 1 cm.
During the tests of some beams, steel strains were recorded.
These were obtained by affixing SR-4 electric resistance strain gauges
to the steel, using a polyester based glue. The gauges were
waterproofed with an epo.xy resin prior to the casting of the beams.
3. 5. GENERAL BEHAVIOUR OF TEST BEAMS.
a. Plain Concrete Beams.
All plain concrete beams failed immediately on the formation
of a tensile crack. The failure crack usually had an inclination which
was normal to the direction of the principal tensile stress. Thus in
pure torsion a spiral crack at 45° to the longitudinal axis caused failure,
whilst under bending and torsion the tensile crack formed at a steeper
angle. In all cases the tensile, spiral crack had to "jump back" at
failure so that a failure surface could be formed. The appearance of
a typical failure surface is shown in Figure 3. 8. The loads at which

FAILlJR
PLAI J
VIE ./ OF PURE TORSIONAL
SP CIM _N

3.23
faHure occurred for the various beams are recorded in Table 3. 2.
For several of the plain concrete beams rotation measurements
were taken and torque-twist curves were drawn. It was found that the
curves are close to linear almost up to failure. However, a small
amount of inelastic behaviour seems evident before failure (see Figure
3. 9).
As the elastic deformations of a reinforced section are
approximately the same as those of a plain section, the stiffness of
plain. sections is of interest. In general the relationship between
the torsion applied to a section and the rotation produced in the
proportional range may be given by:-
TL = 3. 1
GJ
Where J = the elastic torsion constant of the section, i.e. 3 ¥ hb where
}/ is a function of h/b and can be found from the following table.
h/b 1.0 1.2 1.4 1.6 1.8 2.0 2.5 3.0 5.0
'If 0.141 0.166 0.187 0.204 0.217 0.229 0.249 0.264 0.291
L = the length of the beam,
and G = the shear modulus of elasticity of the concrete.
Thus one requires suitable values of G to predict the torsional
stiffness of the section. Table 3. 5 gives values of G derived from the
test results of those plain concrete beams for which rotation
measurements were available. This table indicates that a reasonable
approximation to the valu;:; of G is given by:
G = 250 (2000 + f' ) C
.......... 3. 2.

:io 11--r--r----r---.---,,. ----
30--------+-- ~ I ----+------------1
-. . & I
ci. 20 :JI: -., :::, 0-L,
10 0 J-
1 2 3 4 . -l Radians x 10
Twist over a' length
w FIG 3.9 TOROUE- TWIST CURVE FOR PLAIN CONCRETE I\)
~ ( BEAM P1 )

Beam
Pl
P2
P3
PS
REP4
RUP4
Wl
3.25
TABLE 3. 5. : VALUES OF THE SHEAR MODULUS OF ELASTICITY FOR PLAIN CONCRETE BEAMS
f' G G from C
Experimental Equation 3. 2 -p.s.i.
p.s.i. x106 p.s.i. x106
6,400 2.10 2.10
6,350 2.16 2.09
6,550 2.08 2.14
7,400 2.04 2.35
4,600 1. 71 1. 65
3,680 1. 50 1. 42
4,630 1. 86 1. 66

3.26
where both G and f' are expressed in terms of pounds per square C
inch.
3. 5. b. Beams Containing Only Longitudinal Steel.
During the earlier stages of loading, the behaviour of all beams
was essentially ''linear elastic". Consideration of the torsional
stiffness of the beams at this stage suggests that the stiffness is
unaffected by the reinforcement, and may be taken as that of a plain
concrete section. For instance the shear modulus of elasticity for
beams Ll and L2, if the reinforcement is ignored, is 1. 93 x 106 p. s. i.
and 2. 46 x 106 p. s. i. For these beams the formula given in the
previous section for plain beams, Equation 3. 2, leads to values
of 2.09 x 10⁶ p.s.i. and 2.15 x 10⁶ p.s.i. respectively.
For beams loaded in combined bending and torsion, two distinct
types of behaviour were observed. Under predominantly torsional
loading ( 'f' > 0. 5 approximately) a brittle failure occurred. This
type of failure took place in beams Ll, L3, L6, L 7, LBl, LB2 and
LB3. Cracks were visible only just before failure. The cracks were
inclined to the longitudinal axis of the beam, being approximately normal
to the direction of the principal tensile stress. Initially cracks
occurred in the lower portion of the cross section but were prevented from
opening by the bottom longitudinal steel. With increasing load the
torsional stresses probably increased more rapidly than the bending
compressive stresses following the reduction of the effective cross
section by cracking. A stage was eventually reached when an :inclined
tensile crack extended to the upper surface of the beam resulting in a
sudden drop in the torsional resistance. The torque on the section
was then resisted by dowel forces and further rotation took place at
greatly reduced loads. As the beam rotated a crushed zone became

3.27
visible on one side of the specimen. Figure 3 .10 shows the
torque-twist behaviour of a beam (Ll) failing in this manner, and
Figure 3 .11 the appearance of such a beam at failure.
If the test beam was loaded at lower ratios of torsion to
bending ( 4' < 0 . .3) a more gradual failure ensued which was similar
to a flexural failure. Beams L2 and LB failed in this manner. As
before, a cracked zone developed in the lower portion of the cross
section. In this case, however, the higher bending moment prevented
the cracks from spreading to the top surface of the beam. With increased
loading the tension cracks widened until the steel yielded, whereupon the
cracks opened further and extended upwards. Finally the concrete in
the compression zone crushed and precipitated failure. As there were
torsional stresses present, the compression zone was not normal to
the longitudinal axis of the beam. Rotation then took place about this
compression "hinge", with the two portions of the beam rotating
relative to each other. This rotation brought into play dowel forces
between the steel and the concrete and these caused segments of the
concrete to spall off. The appearance of a beam (L2) which failed in
this manner is shown in Figure 3.12. In Figure 3.13 the torque-twist
curve of this beam is given. Comparison with Figure 3 .10 shows that
beam L2 was considerably more ductile than beam Ll.
Of the four series of beams loaded in combined transverse shear
and torsion, series Q is the most instructive. Beams of this series,
unlike those of the three earlier and much smaller series, were
tested under the one point, eccentric load system of Scheme II. This
series was designed to investigate the effect on the failure behaviour
of varying both the shear span to depth ratio (a/ d) and the
eccentricity of the load. The eccentricity being expressed by its ratio

'"': C , ci .¥. -t,
so1 -,-----r---r---.---~---
501 I I :/1 II I I \ \ \ \
401 I iP I I ~:::.,, 'l.: I -----
301-1 ----;--:-,---t----~,-----+-----+-----1
5- 20 L.
~
't----1----t--------i--------4-------4-------~--- --·------··-
2 4 6 x 10·' Radians
Total Twist over 8 ft.
FIG. 3.10 TORQUE-TWIST CURVE FOR BEAM L 1
w I\) O>

.. A EA ,,A Al G O LY
TEE LOADED
0 S10

FIG 312 FAILURE OF BEAM CONTAINING ONLY LONGITUDINAL ST EEL LOADED IN PREDOMINANTLY BENDING.
330

.........
. £ d.
.::L. -() :J CT L 0 ~
70------------------------
'I ., I I soi I I / '<, ...... .._ ___ -
5or--1----Y~--+----t--==-=-_J 40
1---,.-------t----------+-----------+----------+------------·· --
5 15 x 10-=- Radians
Total Twist over 8 ft.
FIG. 3.13. TORQUE - TWIST CURVE FOR BEAM L 2.
t,J
t,J -

3.32
to the width of the beam (e/b).
Although the Q series consisted of only twelve beams,
eighteen separate tests were performed. This was possible because
for tests at low a/ d ratios only a small portion of the length of the
beam was loaded in any one test. Thus when the a/ d ratio was two,
which corresponds to a span of three feet, it was possible to perform up
to three separate tests on the ten foot length of the beam.
The effect on the failure behaviour of varying the a/ d ratio
when torsion is not present (e/b = 0. 0) is well known. At high values
of a/ d flexural cracks are prominent on the side surfaces of the beam
well before failure. These cracks, while being vertical near the bottom,
are approximately 45° to the vertical by the time they reach the middle
of the beam. With the addition of load these inclined flexural cracks
propagate, fairly rapidly, towards the load point. As failure approaches,
a horizontal crack, directed towards the adjacent support, forms at or
above the level of the longitudinal bars. The horizontal portion of the
crack commences near the point where the inclined crack intersects
the longitudinal bar. Failure is finally caused either by the compression
zone disintegrating or by a complete splitting of the concrete along the
longitudinal steel.
With low values of a/ d flexural cracks take no great part in the
failure. Some time before failure diagonal tension cracks appear In
the middle of the side surfaces of the beam. As the load :is increased
these cracks gradually spread towards both the top and the bottom of
the beam. A stage is reached when the beam resembles a tied arch,
with the longitudinal steel providing the tie. Failure finally occurs
when the diagonal crack reaches the load point and destroys the "arch".

3.33
The appearance of these two types of shear failures is
contrasted in Figure 3 .14. It is of interest that the arch action of beam
Qll (a/d = 2. 0) enabled it to sustain 12 / 3 times the shear force of beam
Ql 2 (a/ d = 4 . 1) .
The addition of torsion, as would be expected, modified the
failure behaviour. In general the failures were more sudden, with
fewer cracks forming prior to failure. Torsion tended to "open up"
the beam on the side where the torsion and shear stresses were additive
(that is the side under the eccentric load, the west side in the case of the
Q series). On the opposite side torsion held the concrete together.
The effect of small eccentricities of the load was more noticable for
small a/ d ratios. This point is demonstrated in Figure 3 .15 where the
east faces {torsion opposes the shear on these faces) of three beams
tested with the same eccentricity of load (e/b = 0. 3) but with different
a/ d ratios are shown. It will be seen that for beam Q9, tested with
a/ d equal to 5. 5, torsion has had very little effect on the appearance of
the failure (c. f. beam Ql2). On the other hand for beam Q6 (a/ d = 3. 0)
the presence of torsion has almost suppressed completely the
appearance of cracks on the east face, while for beam Qllb (a/d = 2. 0)
the torsion has actually caused crushing of the east face.
The increase in load which the beam could sustain after the
appearance of diagonal cracks was sharply reduced by the presence
of torsion. Thus with a high eccentricity of load the appearance of a
diagonal crack usually heralded failure. This point is demonstrated in
Figure 3 .16, which shows the west sides (combined torsion and shear)
of four beams loaded at the same a/ d ratio but different e/b ratios.
It will be seen that the number of cracks forming prior to failure

FIG. 3.14.
-~..;,-.. - -QI?,;,;·-- . ~
012
Q 11
THE EFFECT OF
09
Q6
•' °-, -~
e b= o.o a er= 4 .1
e a b =0.0 c1=2.0
~ Q\J SHEAR FAILURES.
e b =0.3
.ft =0.3 b
-,
a d = 5.5
---·~---
9-:3.0 d
Q 11 b ~ :0.3 , b .
.9.:2.0 d
FIG. 3 . 15. THE EFFECT OF THE RATIO
APPEARANCE.
g_ ON THE FAILURE d
l ,,
,1

012 ~=4.1 ~ =O.O b
a 5 a=4.1 ~=0.3 b
;,- ,1 Q7 o "" ' ' ,/ . ., , . " I\ . 41 / / i
cl - oi / i
.. ·. ··:,/<f ~~-LL 07a ~=4.1 ~=0.6
2p.a:::iq::ic:::=:::c;::::c:::::::::z.:::ai::::;::;;::::;==-:-=::::;::~~.,... ' '
. . ~.,,..,,-;., · 1/;· _: j ' C/7_-..J«T ' / . \ ~,, . . ' f
, ) . '
I ,,; I ':Id. =+·I . • , ' //, • I g'
- ·· I • I
~~.i......i:ii.....--:..-'7", . ...:...:....._..::..,~,.___..,.....,._,....JJ , - J
07 b=1.8
FIG. 3.16.. THE . EFFECT OF THE RATIO ~ ON THE
APPEARANCE AT FAILURE
,I
l . I
3 . 355

3.36
decreases as the value of e/b increases. Indeed, for the case of beam
Q7, (e/b = 1. 8) no cracks at all were seen before failure while for beam
Q7a (e /b = o:.6) diagonal cracks were observed only in the last increment
prior to failure.
The thirteen beams of the three earlier series (LS, S and beams
LS, L6 and LSl) were all tested under the two point load system of
Scheme I. All beams of this series were tested with a shear span to
depth ratio of about three. As was the case with beams of the Q series
tested at this value of a/ d, all specimens failed with the opening of a
tension spiral around three sides of the beam. On the fourth face, where
the torsional stresses opposed the transverse shear stresses, the ends of
the spiral were joined by an inclined crushed zone. Figure 3 .17 shows
the appearance of one of these beams at failure.
The results of all the test beams which contained only longitudinal
steel have been presented in Table 3. 6. The beams have been divided into
two groups, those tested under Scheme I (two point loading) and those
tested under Scheme II (one point loading).
3. 5. c. Beams Containing Both Longitudinal and Transverse Steel.
All beams of the RE and RU series were loaded under Scheme I.
The beams in these two series could be described as failing in one of
three modes. In each of the modes a cracked tensile zone intersected
three exterior faces of the beam in a helix while a compression zone near
the fourth face joined the two ends of this helix. The beam failed when
the steel intersected by the tensile crack yielded, allowing the beam to
rotate about an axis in the compression zone. Failure with this axis
near the top surf ace of the beams is referred to as a mode 1 failure,
near the side face as a mode 2 failure, whilst a mode 3 failure indicates
that the axis formed near the bottom surface.

-/
SIDE ON WHICH TORSION OPPOSES SHEAR
SIDE ON WHICH TORSION AND SHEAR ARE
ADDITIVE
FIG. 3.17 THE APPEARANCE OF BEAM S4 AT FAILURE
- 3,37
1 •I

TABLE 3. 6. : FAIL URE LOADS OF BEAMS CONTAINING ONLY LONGITUDINAL STEEL
3.38
PART 1. Beams subjected to two point loading.
Concrete Failure Loads
Beam fi C
Torque Moment Shear
p. s. i. kip. in. kip. in. kips.
Ll 6360 57.0 32.3 -L2 6580 60.1 205.7 -L3 7225 61.1 5.5 -L4 7260 0.0 276.0 -L7 6190 47.8 80.5 -L8 6470 49.6 263.5 -LBl 4050 54.1 141. 6 -LB2 4050 55.4 6.3 -LB3 4050 60.7 161. 5 ·-
L5 6400 43.4 144. 4 4.05
L6 6780 52.5 29.7 0.75
SLl 3300 46.2 77.3 2.20 LSl 4050 - 252.0 8.98
LS2 4050 52.5 5.2
LS3 4050 39.6 53.4 1.88
LS4 4050 25.7 117. 8 4.18
LS6 4050 37.6 101. 7 3.56
Sl 4050 41. 8 181.0 6.40
S2 4050 - 310. 0 11. 05
S3 4050 64.2 6.3 S4 4050 47.0 126.9 4.50 S5 4050 47.7 69.3 2.43

3. ; ;
TABLE 3. i
PART 2 BEAMS SUBJECTED TO ONE POINT LOADING
Beam f' Nominal Nominal Failure Loads C
a/d e/b T M V p.s.i.
kip. in. kip. in kips,
Ql 3,560 5.5 0.3 13.9 263 5.60
Q2 " 5.5 0.6 2<:1,. 1 193 4,20
Q3 " 5.5 o.o o.o 306 6.45
Q4 " 5.5 1.8 27.8 72 1. 58
Q4a " - <:>CJ 33,8 0 0,0
Q5 " 4. 1 0.3 16.5 205 5.75
Q6 II 3.0 0,3 19.4 162 6.05
Q6a " 3.0 0.6 24.4 114 4.27
Q7 " 4. 1 1.8 28.8 60 1. 71
Q7a " 4. 1 0.6 27.3 154 4.32
Q8 II 3.0 0.0 o.o 226 8.40
Q8a " 3.0 1.8 33.0 47 1. ') 0
Q9 " 5.5 0.3 18,3 237 5.
Ql0 " 2.0 1. 8 36.4 39 2.20
Qll II 2.0 0.0 o.o 225 12,55
Qlla " 2.0 0,3 26.5 72 4,05
Qllb II 2.0 0.6 27.2 180 10.05
Ql2 " 4. 1 0.0 0,0 271 7.55 ·.

3.40
In each of the test series RE and RU the first specimen was
tested with a high ratio of torsion to bending and this ratio was reduced
for each successive member of the series. The ratio (4') of torsion to
flexure is shown in Table 3. 7.
In all beams with high ratios of torsion to bending (i.e. specimens
REl, 2, 3 and RUl, 2, 3l3A), cracks were first visible on the side
surfaces. The cracks formed at about 45° to the axis and they gradually
extended, at almost constant inclination, to the top and bottom of the
member. Upon increasing the load the tensile cracks spread across the
bottom surface of the beam, and at still higher loads appeared on the top
surface. Failure of the beam ensued when the longitudinal steel yielded,
permitting opening of the tensile cracks on three sides of the beam and
rotation of the member about an axis near the fourth side.
Beams RE2 and RE3 (with equal top and bottom steel), failed by
yielding of the bottom longitudinal steel and opening of tensile cracks on
the sides and bottom of the beams. That is to say, these beams failed in
mode 1. The beams with more steel in the bottom (RUl, 2. 31 3A), on
the other hand, failed by yielding at the top steel and opening of tensile
cracks on the sides and top of the beams. This has been defined as a
mode 3 failure.
This behaviour would·. be anticipated for beams sustaining nearly
pure torsion. The maximum tensile stresses occur at the mid-he:ight
of the vertical faces (long sides of the rectangle) and initiate era.eking.
For a symmetrically reinforced beam (RE), even a small amount of
bending will cause the final failure to take the form of mode 1. If
the area of the top steel is much less than that of the bottom steel, the
top is more likely to yield and a mode 3 failure will result, with
compression at the bottom, unless counteracted by the presence of

Beam
REl
REZ RE3 RE4
RES RE4>:< REZ>:•
RUl RU3A,:< Ruz,:.,:.:
Ru3,:c,:.:
RU3A**' RU4 RU5 RU5A
RU6
RU7
36T4 36T4c,:•,:< 36T5. 5,:c,:.:
77T5
7705 77T4
7704>:C* 7703
24T3,:•*
38T5 3304
TABLE 3. 7. : EXPERIMENTAL RESULTS FOR SERIES RE, RU AND R
Experimental failure loads Observe
lp T M V Failure
(kip-ins.) (kip-ins.) (kips.) Mode
12. 90 Bl.4 -, 6.3 0.3 2 2. 61 83.4 32.0 0.9 1 1. 80 81. 5 45.3 1. 3 1 0.88 74.6 84.4 2.4 1
o. 61 66.0 108.2 3.1 1 0.28 38.0 134. 0 3.8 1 0.00 o.o 160. O 4.6 -11. 60 73.3 6.3 0.3 3
12.08 76.0 .6.3 0.3 3 1. 66 84.9 -51:1 - 3
1. 25 105.0 84.0 - 3
P.63 89.4 141. 3 - 1 0.59 85.5 145. 0 4.1 Indefinite 0.30 75.4 249.7 7.1 1 0.25 68.3 266.8 7.6 1
0. 21 59 .1 281. 2 8.0 1
0.00 0.0 304.0 8.7 -
0.26 62.6 240.4 7.5 1 1. 54 94.1 61.1 - 3 0.50 85.9 173.4 - 1
0.35 91. 6 262.4 8.2 Indefinite
0.35 96.4 278.4 8.7 Indefinite 0.48 107.6 223.4 7.0 Indefinite
0.49 99.2 201. 4 - Indefinite 0.34 74.6 218. 9 6.8 Indefinite
1. 52 70.8 46.6 - 3 0.37 89.1 216. 4 6.7 2 0.32 30.3 94.4 3.0 1
,:,: Retest. ,:,:* Shear Spans Clamped.
3.41
f' C
p.s.i.
4,600 4,600 4,600 4,600
4,600 4,600 4,600
3,680
4,630 3,680
3,610 4,630 3,680 3,680 4,400
3,610
3,680
4,400 4,340 4,630
4,630
4,630 4,630
4,630 3,830
4,340 3,830 3,830

3.42
quite high bending moments.
The specimen~ with lower ratios of torsion to bending (i. e. RE4,
5, and RU5, 6, 7) were clearly influenced primarily by flexure. Cracks
appeared first on the bottom faces of the beams. At higher loads these
cracks extended to the side surfaces where their angle changed from
almost vertical at the bottom to approximately 60° to the vertical near the
top. At still higher loads, one or more of the tension cracks began to
open. As the beam rotated, a shattered compression zone became
plainly visible on the top face. The load then began to drop of gradually,
showing that failure had occurred. With additional rotation, the main
cracks widened and horizontal 'dowel' cracks appeared about two inches
below the top face. The appearance of the failure surface at this stage
is shown in Figure 3.18. For beams of both series, the predominance
of bending forced the compression hinge to occur near the top face.
Beam REl, whose initial cracking was described previously,
failed with the compression hinge near a side face (mode 2). Usually
this type of failure is associated with the presence of shear force. In
this beam, the side cover to the main reinforcement was greater than
for the other beams of the series (1. 7 in. instead of 1. 3 in.), and the
specimen was subjected to almost pure torsion.
Beam RU4 failed in the shear span and its mode of failure was
not clearly defined. Subsequent calculation showed that the three failure
modes were nearly evenly balanced at this point. Because of this,
specimens RUZ, 3 and 3A (tested later than RU4) were provided with
additional external clamps in the shear spans to ensure their failure
in the central region.
Beams RE4, RE2 and RU3A were unloaded immediately upon their
reaching failure load. The ratio of torsion to flexure in each case was

~- . ~ - - \ ..1• • . .... -
------- - - ........-...... · _ .........
J
I" •
. "' · '
.... -~=··- -
IG. 3.18 DEVELOPED FAILURE SURFACE BEAM RU 5A
MODE 1 FAILURE.

3.44
then changed and, in the case of RU3A, the external clamps were shifted
from the shear spans to the central region. The specimens were then
reloaded. All three beams developed 'new' cracks during the reloading
and developed 'new' fracture surfaces at failure. The results of these
re-tests along with the earlier beams are given in Table 3 .. 7.
For some of the specimens of the RE series, twist measurements
were taken. Figure 3.19 shows torque-twist curves for three beams.
Each graph exhibits an initial straight portion, the slope of which
corresponds to the torsional stiffness of the uncracked section. It will
be seen that this stiffness is virtually independent of the. bending which
may be present and of the amount and distribution of the steel. If the
stiffness, GJ, is calculated on the basis that J is the elastic torsion
constant for the rectangular section (ignoring the effect of the steel), then
the slope of these curves corresponds to a value of 1. 76 x 106 p. s. i. for
G. This value agrees substantially with the value (1. 63 x 106 p. s. ::.. )
predicted by Equation 3. 2 which was obtained from tests on plain
concrete beams. It can, therefore, be concluded that the torsional
rigidity is provided almost entirely by the concrete before 'cracking'.
The load at which the beam 'cracks' (i.e. the load at which the
beam begins to lose its initial stiffness), and the behaviour of the bf':am
ai"ter this point, is seen to depend on the amount of bending present.
The three beams whose torque-twist curves are given in Figure
3 .19 all contained the same areas of steel. However, each was tE.sted
at a different ratio of torsion to bending. As would be expected, the onset
of cracking is hastened by the presence of bending. Thus, as the ratio
of torsion to bending decreases, the departure from 'uncracked'
behaviour takes place at progressively lower torques. Beam RE2, in
which the influence of bending was quite small (4' = 2. 60), exhibited

II) ., .c. u C
I
100
80
60
ci 40 .:.:.
RE 2 l '\l = 2.60) _x- -x-/
.,,,---,._- _'o'o,;--x--x-x -l~O;? I ~~x .. _<cf' __..,.x---4
¥ . \. "I _1/x ;,;.----
-------x--- -·
.,, :l u L
~
J ' /" ~~~ i ! I
20f-' I I l i
X
0 L 1 x 10-• J ~ Twist, Radians per inch
FIG. 3.19 TORQUE-TWIST CURVES FOR BEAMS CONTAINING WEB REINFORCEMENT RE SERIES
w ~ CJl

a second linear range up to failure. In other words, after cracking,
the beam settled down to a constant torsional stiffness, which was
considerably smaller than the initial stiffness. However, in beams
for which the ratio of torsion to bending was smaller {RE4 and RES),
cracking continued and the stiffness progressively decreased up to
failure. It is also of interest to note that as the ratio of torsion to
bending is decreased, the total twist of the beam before failure is
decreased.
Beams of the R series were also tested under the first loading
scheme and the results for this series are presented in Table 3. 7.
3.46
The beams in this series which contained relatively small
amounts of longitudinal steel failed in a similar manner to beams of
the RE and RU series. Thus beams 36T4, 36T5. 5 and 3304, which
were all tested predominantly in flexure failed in what has been called
mode 1 {see Figure 3. 20), while beams 36T4c and 24T3, tested under
predominantly torsion, failed in mode 3 {see Figure 3. 21). Beam ·
38T5 failed in the shear span in a typical mode 2 failure {see Figure
3. 22).
Those beams which contained large size top longitudinal bars
{77T5, 7705, 77T4, 7704 and 7703), on the other hand, failed in a
manner not previously described. All beams of this group were tested
with ~ at about 0.4. Three of these beams (7705, 7704 and 7703)
were reinforced with open stirrups, while the other two {77T5 and 77T4)
had closed ties. The two groups of beams behaved in a similar
fashion up to the point when a cleavage crack crossed the top surface
of a beam. At this point the beams with the open stirrups failed
suddenly with the opening of the top crack and the appearance of 'dowel'
cracks on the side surfaces. Beams with closed ties, on the ot'lier

,__ ____________ _
· .. . ~ / : . .
-----~---- __.___ - -·
=--=~' -~ ---~-=h..-=---- --
~--I ---~~ ... _ -~ -- ~ -~ --· - ---.-... ~
FIG. 3.2Ql DEVELOPED FAILURE SURFACE BEAM 36T 4
MODE FAILURE.
3.47
..I

\}J, s.
-r. s ,·
£"". s. .
FIG. 3.21· DEVELOPED FAILURE SURFACE OF BEAM
MODE 3 FAILURE
36T4c
t
'
3.48

3-4
9
.. ' . ~'
I ..
. .
!t .,.
,, l,
\
? y.
r ~ '\--l!)
0 f-
~
CX) ("')
• 2 <!
,I ' I
w
co I I.
1 .
l.L' L
y.
11 0
1! I'
w
I . } -
u
I ~
) {)
,
. I 0:: ::>
. f
V)
\ .I
w
w
.. ! et::
t :::,
u _
J <!
<! LL
l f L
LL 0::
.I :::,
I V
)
'I '1
0
I J
w
(\J f
0... '
·I ,·
I J
0 'I
_J
w
j "-../
w
0
.. 'lt. >
0
w
0 2
~
~ (\l
I "'
' :
M
I
.~
() •
--
I LL
·--

3.50
hand, could sustain further load after the appearance of the top crack.
The addition of this load caused the crack to gradually widen and large
'dowel' cracks would then appear on the upper parts of the side
surfaces. The appearance of such a beam at failure is shown in Figure
3.23.
In general, those beams which contained large areas of
longitudinal steel failed in a less ductile manner. Some indication of
this behaviour is given in Figure 3. 24 which shows the torque-twist
curves of two beams. Both beams were tested at similar ratios of
torsion to flexure. It will be noticed that the beams which had the
greater proportion of transverse steel and the smaller area of
longitudinal steel (beam 24T3) twisted through a much greater angle
before failure.
The fact that the transverse steel was tied to the longitudinal
steel in this series and not welded as in the earlier series, made no
appreciable difference to the behaviour of the beams. Thus beam
36T4 (tied stirrups), which was similar to Beam RU5A (welded
stirrups) and was loaded under similar conditions, exhibited a failure
crack pattern closely resembling that of beam RU5A (compare
Figures 3.18 and 3. 20).
Beams of the V, U and T series were all tested under the onf'!
point loading system (Scheme I). Various eccentricities of loads were
used, ranging 'from zero (simple shear) to infinity (pure torsion).
Values of the eccentricity used for each beam and the resulting failure
loads are recorded in Table 3. 9.
The V series was designed so that in the absence of torsion the
beams would fail in shear rather than flexure. The main purpose of

- ..... '\·- ,--.... : BOTTOM
" .' : . . .. . ,. ·. ' ' ~ ·, ·'·
. \' ::' / '_ •·. ~ ~~~,.- ---:~ --~ ¥""' -- - -~ - .-.._____,. . .. -
r. ,;: ·; :.. -~=- _;_:.,_.;: .:-:--~
·· '· · . . ... . ..... ,,.
:·;. ,,' ' ' . ·) ' ~- ' ..
• • .., , i • .i l ,- ....____,, ·. -~ . . .. l -/.. •. . ) ' . ;' . ·, ~
\ ' I - • .. - .v-~
~ - ~- f -~ .. ::::;==: ' J .
~; : • • I
I . ' ,
; :.·. .... . ·"' .
. ".. . ·~ : ·.;~ .. :::• - .,, .. ' [, · .... , .,,
. ~·
. · •. -h ., .... ~
.. . .... '¥1 _ , _ _ . ..L. _ _ • • --- ·-
!="IG. 3.23 FAILURE SURFACE OF BEAM
..
TOP
I -
77 (15""
3.51
J

II)
~ u C
100
80 I
60 I
ci. 40 ~
~--C' L.
{:!. 20
01
~
x'
j
* I
j >.<
V
/ X I
I X I
' X I
,.._
l 1 I I I
/x-~---· ... _. 36 T 4C (r=0.1381 't' = 154)
/ 1
x/ I !
- !
' I I I I
I "' • 1. 521 _J .... --x-~
2.4,. 3 (r=0-444*_ .~ ~--- ~-----L-. ----- ------ ---
~-
! I I I
Twist, Radians per inch.
FIG. 3. 24 TORQUE-TWIST CURVES FOR BEAMS OF R SERIES w CJ? I\)
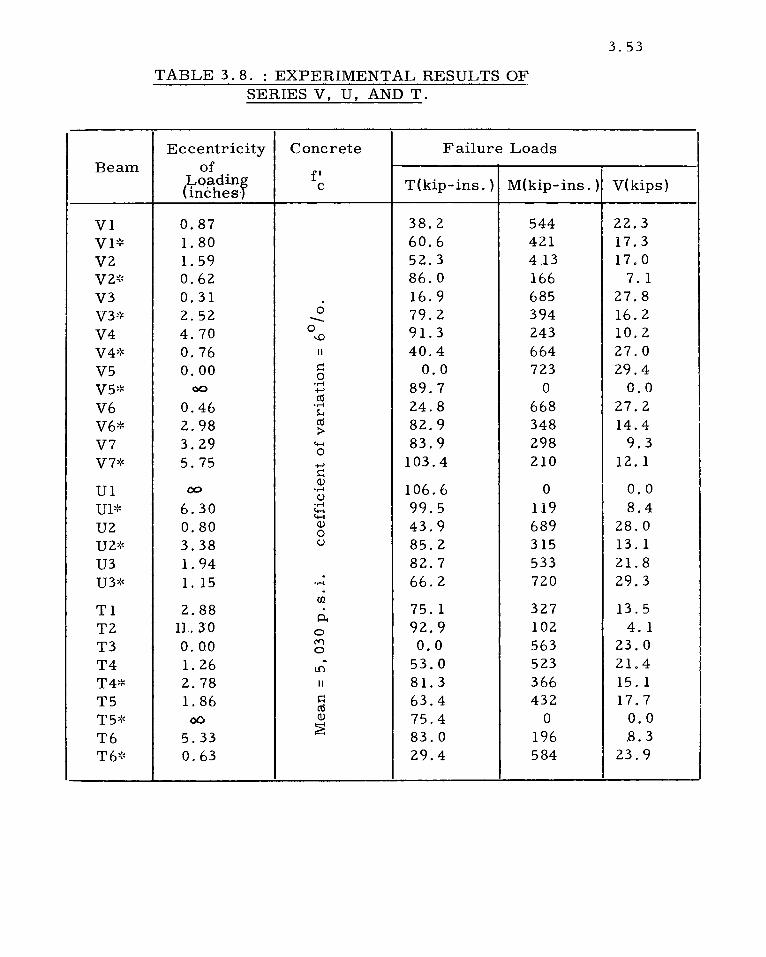
Beam
Vl v1,:c V2 v2-1., V3 y3,:,
V4 y4,:, V5 y5,:,
V6 V6':< V7 y7,:,
Ul u1,:, U2 u2,:c U3 u3,:,
Tl T2 T3 T4 T4* T5 T5,:, T6 T6,:•
TABLE 3. 8. : EXPERIMENTAL RESULTS OF SERIES V, U, AND T.
Eccentricity Concrete Failure Loads of
f' 1r;oadinr T(kip-ins.) M(kip-ins.) rn::hes· C
0.87 38.2 544 1. 80 60.6 421 1. 59 52.3 413 0.62 86.0 166 0.31 16.9 685 2.52 0 79.2 394 -4.70 0 91. 3 243 ...0
0.76 II 40. 4 664 0.00 s::: 0.0 723
0 00
•.-I 89.7 0 +-' Cll
0.46 •.-I 24.8 668 ~
2.98 Cll 82.9 348 :> 3.29 C+-1 83.9 298
0 5.75 +-' 103.4 210
s::: Q)
106.6 0 00 •.-I
CJ 6.30 •.-I 99.5 119 C+-1
C+-1
0.80 Q) 43.9 689 0
3.38 CJ 85.2 315 1. 94 82.7 533 1. 15
. 66.2 720 •.-I .
Ul 2.88 . 75.1 327
0. 11. 30 0 92.9 102 0.00 ~ 0.0 563 0
1. 26 - 53.0 523 U')
2.78 II 81. 3 366 1. 86 ~ 63.4 432
Cll oc, Q) 75.4 0
5.33 ~ 83.0 196 0.63 29.4 584
3.53
V(kips)
22.3 17.3 17.0
7. 1 27.8 16.2 10.2 27.0 29.4
0.0 27.2 14.4
9.3 12. 1
0.0 8.4
28,0 13. 1 21. 8 29.3
13.5 4. 1
23.0 21.4 15. 1 17. 7
0.0 .8. 3
23.9

3.54
this series was to study the effect of torsion on the shear failure.
The beam tested in simple shear (beam VS, ecc. = 0)
exhibited what is _usually called a "shear-compression" failure. That
is, after diagonal cracks had formed the web reinforcement and the
compression zon~ continued to carry load until the stress in the web
reinforcement reached the yield point. With further increases in load,
the additional shear force was resisted mainly by the concrete
compression zone. Failure finally occurred when the compression zone
was destroyed by the combined compressive and shear stresses.
The additior_ of torsion modified this behaviour. On the side of
the beam where the transverse shear stresses and the torsional stresses
were additive (west side) diagonal cracks appeared at lower loads and
were more prominent (see Figure 3. 25). On the east sides of the beams,
where the torsional stresses oppose the shear stresses, the angle at
which the "diagonal" cracks formed, depended on the eccentricity of the
load. Thus, if Figure 3. 26 is examined it will be seen that as the
eccentricity of _the load is increased the inclination of the cracks swings
through about 90°, from the direction of the "shear" to that of the
"torsion". Further it will be noticed, that on this side of the beams
as the eccentricity is increased the number of cracks forming prior to
failure decreases. It may also be noted that in the beams with higher
eccentricities a crack, apparently caused by "crushing", appeared at
failure on the east face.
The effect of torsion on the top faces of the beams was of some
interest.As can be seen in Figure 3. 27, the addition of torsion reduced
the amount of "crushing" on the top face. Indeed it seemed that as
the eccentricity was increased the area of crushing moved towards the
east face. In the limiting case of pure torsion a cleavage crack

1 .
·II.
J
I
' . . ,o :·· i\
,. -4..._
_ .. \· ... ·
i' .
,\, ,".~.--.r·\.;·,·--...
V5 ecc. = o.o"
'i-
V2 ecc. = 1. 5911
-~~,---·-~·,~=~~· ., .. '·-·· ... , , . l ,i V4.
V4 ecc. = 4. 10-
wnr .....
I '
.. - ··1
FIG. 3. 25 THE EFFECT OF TORSION ON THE APPEARANCE
·~ OF THE WEST SIDES OF THE BEAMS.
3.55
.)
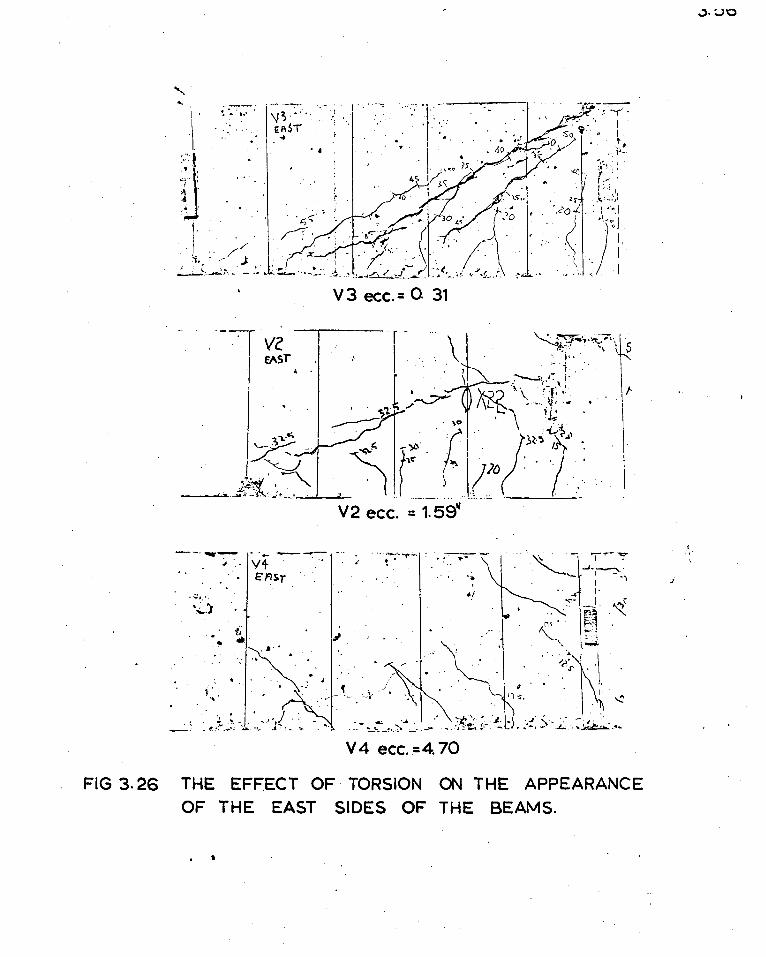
..... ..
\ ...
., . , ... .....
. . ' . ~ .
V3 ecc.= O 31
Ve. E/QT
I-
~----- ··- ---;- ·. ·, . ·;--_ .. ..,.- .. _:---_ .,.. -12:·~, -T~": . ;. ·_. V4 . . . . • £:FIS. _. . . . .· : .,. . '- .-'·,--::--:,
. . . . T , I
' •i · I· . "·· '· -.-· I C
-~.) "' . . , . ii- . . "( .. . ,<" ~-~- .
' . t• '-... ~~-~
'.· ·~ ., . . . \ . ' . '··NI l . • •• <· ',,'0-k· .· ~,,:·· . .,~~- ./ ~
. . .. ("'""' . .. . '. \ . . ' • ' ,, I • • / ' ," "\ • .,. • ,. • ~ ,,,- :
. ~ ~ ·""' -. . ... , ,.... - .... ~ - .... .... - ;I;. •. r..- ~ • ~:. ), .. '. j ~ •
-· ~'f..·, .• ..,,.l .,:...-, .. .4·: .. ':to _ ••• -~~~--. --.- .... ,1.:-1.' - - •• ,. ·- --.i.-:.. .... ~.:'I ....
V4 ecc. =4. 70
FIG 3. 26 THE EFFECT OF TORSION ON THE APPEARANCE
OF THE EAST SIDES OF THE BEAMS.
• I
.;), 00
' ,,· ',
J

... ...
~~ >~:~kw .. l" '> . 'TOi"
• ~· .. l • . , .. , .... L. , .. "'.,:, • .:r. . ~··- __ ,:: __ _
! I I.
--I i •
V 5 ecc. = o.o•
' ... I '4()..l.. c:.,,
V2 ecc. = 1. 59"
... ----- ----·
i--
l . t
L.· 14t!tL .....
-~~;&· ' :.<'· -l ; . ,: :" .
'j .' ·"",. ; .
! ,t ·- .. \ ! ·,
'j,. -
i~ \ ;'-.,: .:. ~ '..,-:_. ....~ ........ ,.,.-.....,,_.""',.,_-__,, .. , .... s-.. ..... ,-::::...., ... ,_~
-.~x:,:: -. ; . ·~~~..::
I
i
---~
' i ···-' I
V 5:t- ~cc. = Gl'0
i oP
FIG. 3. 27 THE EFFECT OF TORSION ON APPEARANCE OF .THE TOPS OF THE BEAMS.
3.57
I ,,
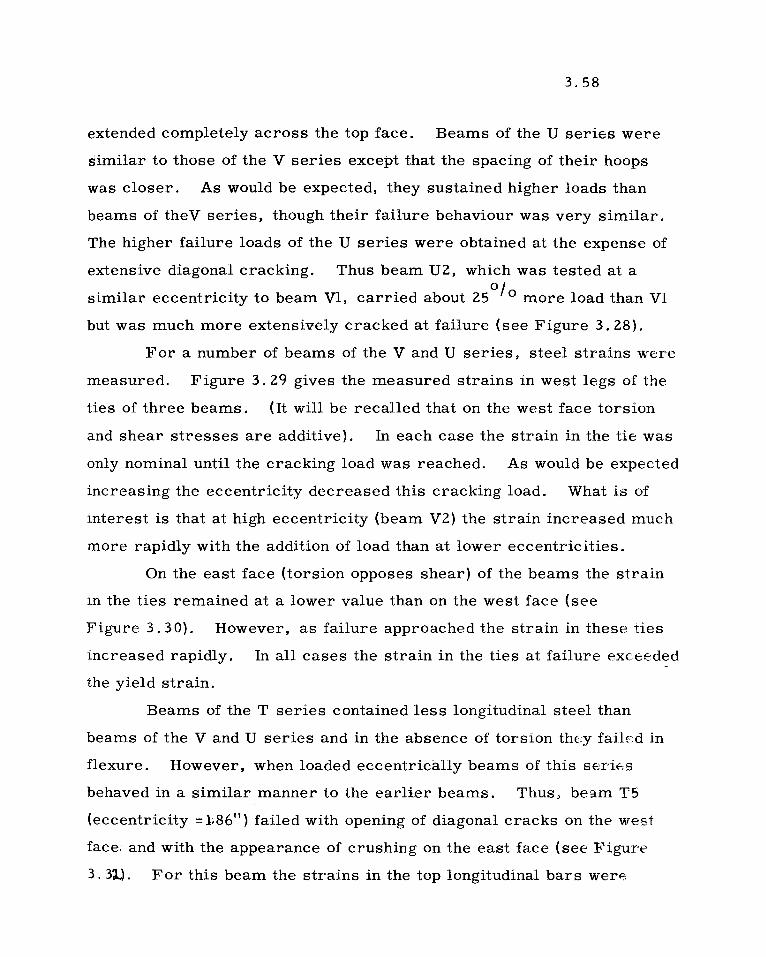
3.58
extended completely across the top face. Beams of the U series were
similar to those of the V series excej:>t that the spacing of their hoops
was closer. As would be expected, they sustained higher loads than
beams of theV series, though their failure behaviour was very similar.
The higher failure loads of the U series were obtained at the expense of
extensive diagonal cracking. Thus beam U2, which was tested at a
similar eccentricity to beam Vl, carried about 25 ° / 0 more load than Vl
but was much more extensively cracked at failure (see Figure 3. 28).
For a number of beams of the V and U series, steel strains were
measured. Figure 3. 29 gives the measured strains in west legs of the
ties of three beams. (It will be recalled that on the west face torsion
and shear stresses are additive). In each case the strain in the tie was
only nominal until the cracking load was reached. As would be expected
increasing the eccentricity decreased this cracking load. What is of
interest is that at high eccentricity (beam V2) the strain increased much
more rapidly with the addition of load than at lower eccentricities.
On the east face (torsion opposes shear) of the beams the strain
in the ties remained at a lower value than on the west face (see
Figure 3. 30). However, as failure approached the strain in these ties
increased rapidly. In all cases the strain in the ties at failure exceeded
the yield strain.
Beams of the T series contained less longitudinal steel than
beams of the V and U series and in the absence of torsion they failed in
flexure. However, when loaded eccentrically beams of this seri&s
behaved in a similar manner to the earlier beams. Thus, beam T5
(eccentricity = 1;86") failed with opening of diagonal cracks on the west
face~ and with the appearance of crushing on the east face (see Figure
3. 31.). For this beam the strains in the top longitudinal bars wer1:;

• ,>', .-1: ~
-~
V 1 ( ecc. = Q. 87) 3" spacing = 4 4
'. ' ~ . - ·-.i.~.-
/~~\=i ---1----+---'"i''-"' - ~ ---- ..r,
U2 ( ecc.= Q. 81)
spacing = 3"
FIG. J. 28 · THE EFFECT OF STIRRUP SPACING ON THE . FAILURE APPEARANCE.
3.5~
J ,, \ '
j

3. 6
0
l )( -----------------
-----------
---
-----------~
------I-
X
l -------
---------------
I -en
I C
I
C
tn \
'-w
\
.fJ
I-en
\ 0
\ '-
l1. \
u 0
\ E
-
V)
z ffi ..J
<(
a:: I-
I-en V
)
w
' ~
z
~, ~
<(
a:: ~
V)
-0
) C
\I
8 M
IC
) (!)
_L
l1.
0 IC
) 0
M
C\I
C\I
.... ( s
d!)I)
~\f3HS
3S~
3AS
N\f~
l

3.6
1
I )(
-C
0 L ~
en 0 L
u tn
E
w
-~(J')
t-\0
~
lJ.. <
( 0
0:::: t-
V)
V)
~
l.!J ...J
~
~
<(
0:::: t-V
)
0 M
M
' 8
<.!) ii:
IO
J_
0
U')
0 IO
0
IO
0 I')
C\I
C\I
--
(Sd
!')f) ~
\i3HS
3
5~
3/\S
N\i~
l

2-----------------------.--,. Ill a. ~ - 15
w u a:: ft a:: 10 <( w I V)
w V) a:: w > V) z <( a:: 1--
-1500 -10CX)
BEAM T5 ecc.= 1.as·
X
-500 +500
STRAIN (microstrains)
FIG. 3. 31 STRAIN IN TOP LONGITUDINAL BARS OF BEAM T5
+1000
3.62

3.63
FIG. 3.32 BEAM T5 AT FAILURE
FIG 3.33 BEAM T2 AT FAILURE
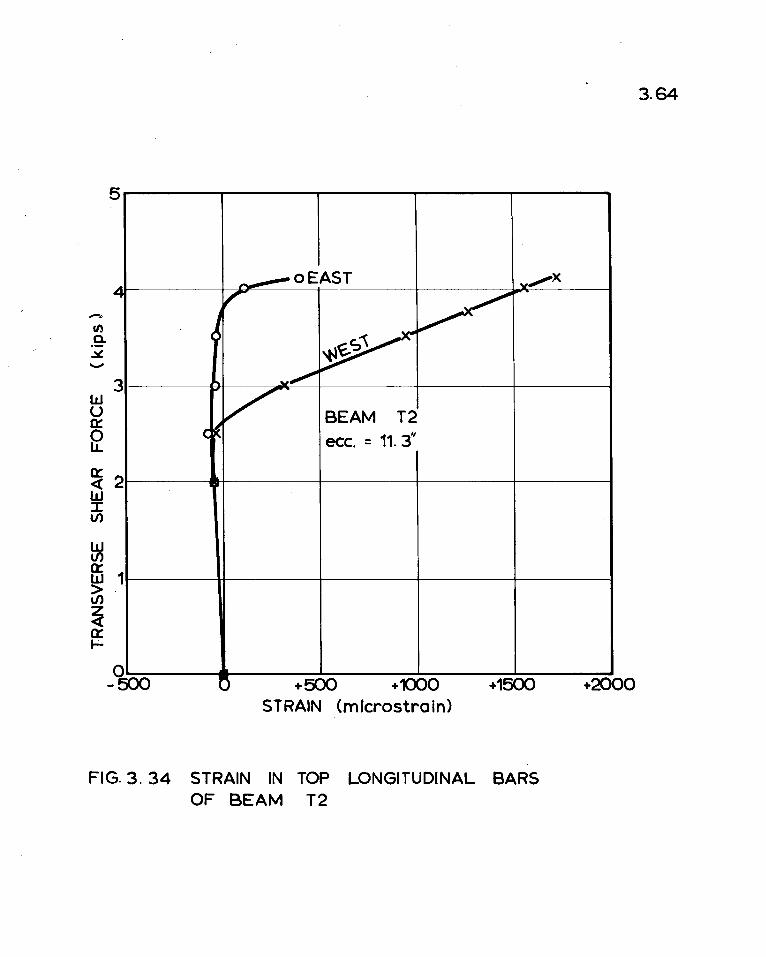
5----------------.....-----
oEAST
-en .9-~ -
3 w u BEAM T2 0:: 0 lL. ecc. = 11. 3"
~ 2 w :I: U)
w U)
ffi 1 >-\/)
~ 0:: ~
-'too +500 +1000 +15CX) STRAIN Cmlcrostrain)
FIG. 3. 34 STRAIN IN TOP LONGITUDINAL BARS OF BEAM T2
+2000
3.64

3.65
recorded and these are presented in Figure 3. 31. It will be seen that
while the bar on the east face remains in compression that on the west
face goes into tension prior to failure.
When the eccentricity of the load was further increased the beam
failed with a cleavage crack crossing the top face and extending down both
the east and the west sides of the beam. The appearance of such a beam
at failure is shown in Figure 3. 33. For this case, beam T2, both the
east and the west top longitudinal bars were in tension prior to failure
(see Figure 3. 34). This type of failure where the steel which is
normally regarded as "compression" reinforcement is actually in
tension at failure, has been called a mode 3 failure.

CHAPTER 4.
BEAMS WITHOUT WEB REINFORCEMENT.
4. 1. INTRODUCTION.
4. 1
Wherever torsional loads are significant the prudent designer will
provide web reinforcement for his beams. It might therefore be asked
what justification there is for examining· .. beams without web reinforcement
loaded in torsion.
As has been pointed out in earlier chapters, the failure torque of
a beam not containing web reinforcement corresponds closely to the
diagonal cracking load of a web reinforced member and hence it provides
a good measure of the load that can be regarded as permissible if
diagonal cracking is to be avoided.
Further, the designer must have some estimate of the failure
torque of a beam not containing web reinforcement before he can decide
that the torque is significant and web reinforcement is needed. For this
purpose the designer requires simple but conservative equations to

4.2
predict the failure loads.
4. 2. BEAMS LOADED IN PURE TORSION.
As was pointed out in Chapter 2, the ultimate strength in pure
torsion of a beam containing only longitudinal steel is comparable with
the maximum twisting moment which can be resisted by a plain concrete
section. It is appropriate, therefore, to discuss the torsional strength
of plain concrete specimens.
In order to predict the failure of a plain concrete specimen it is
necessary (a) to know the criterion of failure of the concrete (b) to know
the distribution of stress or strain over the cross-section.
In regard to (a) a number of different failure theories have been
advanced for concrete (Ref. 4.1, 4. 2, 4. 3 and 4. 4), but the problem of
predicting failure for a combined stress state is far from being solved.
For the case of a plain concrete member subjected to pure torsion,
however, the stress situation at any point in the specimen is that of pure
shear. Thus all the stress parameters commonly used in concrete
failure theories bear a constant relationship to each other. For
convenience, the failure criterion may be designated as a maximum
principal tensile stress criterion, though it should be appreciated that
the value of this limiting tensile stress for the particular biaxial stress
situation of pure torsion, may not correspond to values obtained for
other stress situations. For a particular concrete, if scale effects can
be ignored, this limiting tensile stress should be constant for all torsion
specimens.
In regard to (b) it may be said that if the stress-strain relation
ship of the concrete either in tension or compressi.on becomes non-linear,
then the relationship in shear will likewise become non-linear.

4.3
Neve 'rthele ss, the supporters of the "elastic" theory assume that the
shear stress distribution on the cross section will be that given by the
usual elastic theory applied to a homogeneous material with a completely
linear stress-strain relationship. The supporters of the "plastic"
theory adopt the other extreme point of view and assume that, near
failure, the stress-strain curve of the concrete is horizontal; that is
to say, the stress is constant irrespective of the strain. This leads to
the well-known plastic distribution of stress, in which the shear stress
is constant over the whole cross-section. Having adopted either
hypothesis, and it is impracticable to consider distributions other than
those corresponding to either elastic or plastic behaviour, it is then
possible, for a given torque and given cross-section, to calculate the
stress at any point.
The fact that the maximum principal tensile stress at failure
should be a constant for torsion specimens made from the same concrete,
can be used to investigate the suitability of the elastic and the plastic
theories. For this purpose it is not sufficient that only rectangular
beams be tested because, as was shown in Chapter 2, for this type of
beam both theories will give equally consistent results. Thus for
each concrete mix at least two different shapes of beam were tested.
The results for the plain concrete specimens tested in pure
torsion have been analysed and presented in Table 4. 1. For each
specimen the maximum principal tensile stress at failure has been
calculated, firstly on the basis of elastic stress distribution and
secondly on the basis of plastic stress distribution. It may be seen
from Table 4.1 that the stress at failure calculated on the plastic basis
is approximately constant for any one concrete. On the other hand,
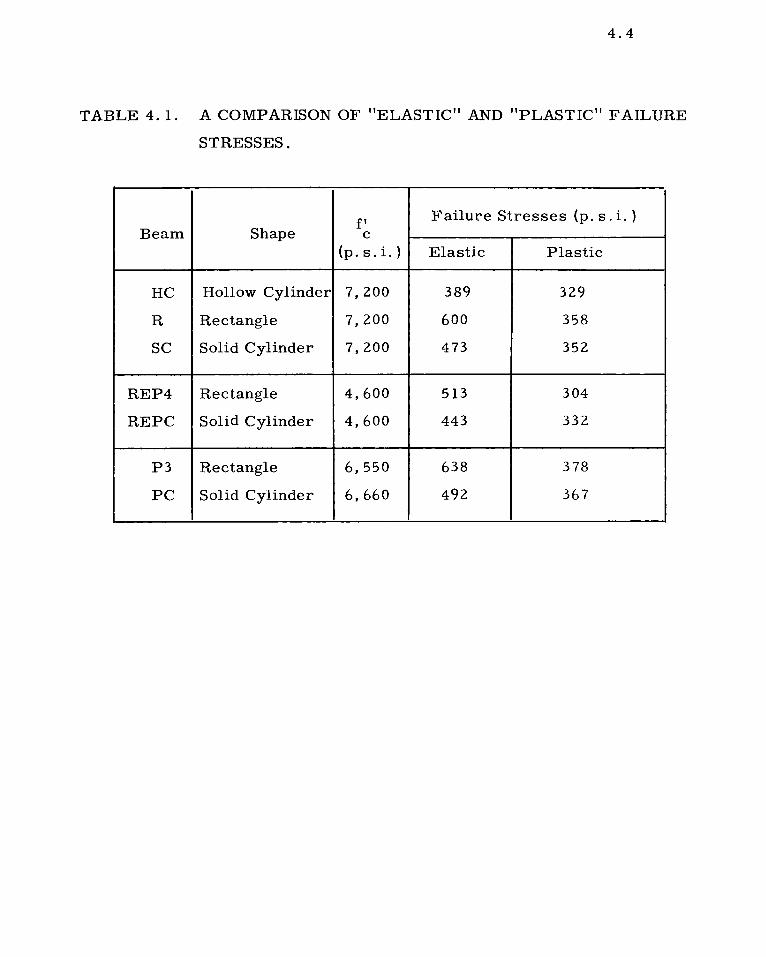
4.4
TABLE 4. 1. A COMPARISON OF "ELASTIC" AND "PLASTIC" FAILURE
STRESSES.
f' Failure Stresses (p. s. i.) Beam Shape C
(p. s. i. ) Elastic Plastic
HC Hollow Cylinder 7,200 389 329
R Rectangle 7,200 600 358
SC Solid Cylinder 7,200 473 352
REP4 Rectangle 4,600 513 304
REPC Solid Cylinder 4,600 443 332
P3 Rectangle 6,550 638 378
PC Solid Cylinder 6,660 492 367

4.5
the shape of the cross-section has a marked effect on the indicated
failure stress calculated on the elastic basis. The evidence of these
few tests therefore, clearly supports the plastic rather than the elastic
theory.
It may be concluded that a satisfactory approach for calculating
the torsional strength of plain concrete specimens is to assume that the
shear stress distribution is uniform and that the maximum
tensile stress has reached its limiting value. Thus for rectangular
sections,
...... 4. 1
where f is the limiting value of the maximum principal tensile stress. t The question of a suitable value for \ still remains. Ideally,
for each mix of concrete, f would be determined from a torsion test t
on a small specimen. This unfortunately, is not practical as it is
usual to specify the concrete by only one parameter, its compressive
strength. It is therefore more convenient to relate the value of f to t
the compressive strength e>f the concrete. It is of course recognized
that no exact or universal relationship exists between the tensile and
compressive strengths of concrete. A frequently employed approximation,
however, is that the tensile strength varies as the square root of the
compressive strength.
=
Thus an appropriate expression for f would be: t
....... 4. 2
The value of the parameter C, which defines the limiting tensile stress
for the particular biaxial stress situation of pure torsion, has been
evaluated from the results of torsi.on tests.

4.6
All available test results of plain cone rete beams tested in pure
torsion have been collected in Table 4. 2 For each specimen the
tensile stress at failure has been calculated on the basis of plastic
behaviour. Using this stress and the reported value of the cylinder
compressive strength (where cube strengths were given a conversion
factor of ·O. 8 was used) the value of C for each test result was determined.
These values are listed in Table 4. 2 and it will be seen that the average
value of this constant for the 97 test results is 5. 0 with a coefficient of
variation of 20° /o.
As the failure of beams not containing web reinforcement can take
place with little or no warning it would seem prudent to adopt a
conservative failure criterion. To this end a value of 3. 5 has been chosen
for C.
Thus,
4.3
The failure torque of a rectangular plain concrete beam may now
be obtained by substitution into Equation 4. 1. i. e.
T = 1. 75 b 2 (h - ~) K 4.4
The theoretical failure torque of each of the 80 plain rectangular
specimens has been calculated using Equation 4. 4. The theoretical
values, Tth , have been compared with the experimentally observed eor.
values, T , in both Figure 4. 1 and Table 4. 2. It will be seen from exp.
Figure 4. 1 that the correlation between experiment and theory is
satisfactory. In fact examination of Table 4. 2 will show that for these

4.7
TABLE 4.2
ANALYSIS OF PURE TORSION TESTS ON PLAIN CONCRETE SPECIMENS PART ;_ _ .. RECTANGULAR SPECIMENS
Investigator Beam Torque f' Plastic T kip. in,
C . Failure C
ex:e, p. S. L
T Stress theor.
Rl 13. 40 7200 358 4.23 1. 21 This REP4 50.50 4600 305 4.50 1. 29
Investigation RUP4 66.30 3680 400 6.60 1. 89 Wl 73.20 4630 389 5.72 1. 63 W2 74.50 4320 450 6.85 1. 96
Bach and Graf Ei0.50 2830 274 5. 15 1. 47 128.90 2830 274 5.16 1. 47
Young, Sagar and Al 13.90 1700 333 8.09 2.31 Hughes 2 20.20 1700 287 6,97 1. 99
3 37. 40 1700 448 10.88 3. 11
Turner and Davies S 1 11. 00 2400 263 5.39 1. 54 2 11.75 2400 281 5,76 1. 64
Rl 17,00 2400 318 6.51 1. 86 2 12.00 2400 224 4.59 1. 31
Andersen 3A 55,00 4100 322 5,03 L44 B 73,00 4100 311 4,86 L39
C 120,00 4100 401 6.27 L 79 4A 67,00 6900 392 4,73 L 35
B 88,00 6900 374 4.51 L 29 C 117, 00 6900 391 4.72 l, 35
Marshall and TembE 01 7.59 1430 182 4,82 L38 2 7.28 1430 174 4.62 1. 32 3 6,91 1430 165 4,39 l. 25 4 7.69 1430 184 4.88 1.39 5 8,70 2560 208 4, 13 1. 18 5 10.56 2560 253 5.01 1. 43 5 9. 24 3000 221 4,05 1. 16 8 8.70 3000 208 3.81 1. 09 8 9,22 3120 221 3.96 J. 13
10 9,22 3120 221 3.96 l. 13

4.8
Table 4.2 Contd.
Investigator Beam Torque f' Plastic T kip. in.
C . Failure C ex:e. p.s.1.
T Stress theor
Marshall and Tembe (contd.) Al 10.25 2560 274 5.43 1. 55
2 9.74 2560 260 5.16 1.47 3 10.25 2560 274 5.43 1. 55 4 10.30 2560 275 5.45 1.56 7 6.15 2560 288 5.70 1. 63 8 7.18 .2560 336 6.65 1. 90 9 9.52 2560 446 8,82 2.52
10 9.22 2560 432 8.54 2.44 11 6.86 2560 321 6.36 1. 82 12 7.06 2560 330 6.54 1. 87
Nylander I l 46.80 3580 288 4.81 1. 38 2 52.61 3580 323 5.41 1.55
II 5 41.60 3580 256 4.28 1. 22 6 36.40 3580 224 3.74 1.07
Cowan X 38.50 3390 267 4.59 1. 31 Tl 58.10 6200 461 5.86 1.67
Humphreys POA 20.20 7000 484 5.79 1. 66 B 19.40 7000 465 5.56 1. 59 C 20.10 7000 482 5.77 1. 65 D 19,70 7000 472 5.65 1. 61 E 1990 7000 477 5.71 1. 63
PROA 48.10 7000 461 5.52 1. 58 B 41 80 7000 401 4.80 1. 37 C 42,40 7000 407 4.87 1. 39
PRHA 4210 7000 404 4.83 1. 38 B 44,50 7000 427 5. 11 1.46 C 44.00 7000 422 5.05 1.44
PSOA 69.00 7000 413 4.95 1.41 B 68,40 7000 410 4.91 1.40 C 69,00 7000 413 4.95 1. 41

4.9
Table 4 .7. Contd.
Investigator Beam Torque f' Plastic T c. exE, kip. in. p.s.1. Failure C
Th Stress t eor
Humphreys PTOA 16.60 7000 461 5.51 1.57 B 15.90 7000 441 5.28 1.51 C 14.70 7000 408 4.88 1. 39
PUOA 22.20 7000 448 5.36 1. 53 B 21. 70 7000 438 5.24 L 50
C 22.60 7000 456 5.46 1. 56 RPl 28.55 6000 334 4.32 1. 23
2 26.36 6200 308 3.92 L 12 3 24.24 6350 284 3.56 L 02 4 27.44 6350 321 4.04 1. 15 5 28.04 6400 328 4. 11 1. 17 6 32,04 6400 375 4.69 1. 34 7 28.24 7180 330 3.91 1. 12 8 29.76 6500 348 4.33 1. 24 9 31. 24 6950 366 4.39 1. 25
Mean 5.20 1.48 Standard Deviation 20°/o 20°/o
No. of Tests 75 75

4. 10
PART 2. CIRCULAR SPECIMENS
Investigator Beam Torque f' Plastic T C ex:e kip. in. p.s.i. Failure C Comment
T Stress theor
This HC 13.6 7200 341 4.03 1. 15 Hollow Investiga- SC 20.0 7200 353 4.17 1. 18 Solid tion SCL 20.8 6660 367 4.51 1. 29 II
SCR 18.8 4600 332 4.90 1.40 II
lA 130.0 1780 167 3.97 1. 13 Hollow lB 140. 3 II 180 4.28 1.22 II
Graf and lC 108.2 II 139 3.30 0.95 II
Morsch 2A 216.5 II 211 5.02 1.43 Solid 2B 216.5 " 211 5.02 1.43 II
2C 173,2 II 169 4.01 1. 14 II
Miyamoto GRPl ll. 3 1821 277 6.49 1.85 Solid
Rl 25,2 2000 188 4.20 1.20 Solid R2 30.8 2100 229 5.01 1.43 II
R3 35.2 2980 262 4.81 1. 37 II
Andersen R4 29.8 3200 222 3.93 1. 12 II
R5 32.2 3590 240 4.01 1.14 II
R6 42.2 5200 314 4.37 1. 25 II
. Mean 4.52 l.59
Standard Deviation 15° /o 15 /o No. of Tests 17 17
Analysis of All Results T ex:e C
T theor
Mean l.44 5.0
Standard Deviation 20°/o 20°/o
No. of Tests 92 92

100----.-------,---------~----,---...,--~
X
0
40 • 0
• 30
-C
ci. ~ - 20
ci. ~ ,._: THIS INVESTIGATION • YOUNG, SAGAR• HUGHES O
TURNER a. DAVIES 0 10 ANDERSEN • MARSHALL It TEMBE +
NYLANDER 0 COWAN • HUMPHREYS X MIYAMOTO (!) ..
30 40 50 75
Ttheor ( kip. in.)
FIG. 4.1 COMPARISON OF THEORY AND EXPERIMENT FOR PLAIN CONCRETE BEAMS.
100

4. 12
specimens the average value of the ratio T /Th . exp t eor 1s 1. 48 with a
coefficient of variation of 20° /o.
All available test results of rectangular beams containing only
longitudinal steel have been collected in Table 4. 3. These 71 beams have
been analysed by means of Equation 4. 4, that is, they have been treated
as plain concrete beams. It will be seen from the table that in this case
the average value of T /Tth is l. 55 with a coefficient of variation of exp eor
18° / o. Comparing this value with the result obtained for plain concrete
specimens one will see that the assumption of ignoring the longitudinal
steel for members tested in pure torsion, is justified.
4. 3. BEAMS LOADED IN COMBINED BENDING AND TORSION.
a. Plain Concrete Beams.
To examine the use of the plastic theory and the maximum
principal stress criterion for predicting first cracking, several plain
concrete beams were tested in bending and torsion. The results of these
tests have been analysed in the following manner. It was assumed that at
failure the distribution of stress across the section is that corresponding
to plastic behaviour for both bending and torsion. In other words:
er = ....... 4. 5
and 2T
= b 2 (h-b/3).,
...... 4. 6
where ft is the normal stress and 'l: the shear stress. It is recognized
that a more accurate approach for calculating the bending stress would
have been to assume that the stress-strain relationship in the compression
zone is linear and in the tensile zone is parabolic. This approach was

4. 13
TABLE 43
A COMPARISON OF THEORY AND EXPERIMENT FOR BEAMS CONTAINING ONLY LONGITUDINAL REINFORCEMENT LOADED IN PURE TORSION
T /T exp theor
Investigator Beam Torque f' Plastic Eff. Shear C
kip. in. p.s.i. Eq. (4. 7 see Sect. 4. 4
156.0 2820 1. 52 1. 58 173.4 II 1. 70 1. 76 160.2 II 1. 58 1. 62 160.2 II 1. 58 1. 62 180.8 II 1. 76 1. 84
Bach and 173.4 II 1. 70 1. 76 Graf 130.0 II 1.49 1. 93
136.8 II 1. 57 2.02 136.8 II 1. 57 2.02 141.0 II 1. 61 2.09 130.0 II 1.49 1. 93 141.0 II 1. 61 2.09
Young Bl 14.0 1700 2.33 2.40 Sagar and B2 22.7 II 2.15 2.61 Hughes B3 36.7 II 2.40 3.14
Turner and S3 12.5 2400 l. 76 l. 81 Davies S7 12.0 II 1. 32 l. 70
B1 l 69.8 2100 l. 30 1. 36 2 77.l 2250 l. 39 1.45 3 80,l 2250 1.44 1.50 4 84.5 3600 l. 21 l. 25
Andersen 5 88.5 3600 1. 27 l. 31 6 97.6 3680 l. 37 1. 43 7 105.l 5000 1. 27 l. 33 8 109,2 5000 l. 32 l. 38 9 119. 9 5200 l.42 1.48
., .. ·---·

4. 14
Table 4. 3 Contd.
T /T exp theor
Investigator Beam Torque f' Plastic Eff. Shear C kip. in. p.s.i. Eq, (4, 7) see
Sect. 4. 4
lA 50.0 3900 1. 34 L 39 lB 73.0 3900 1. 43 1,62 lC 90.0 3900 1. 23 1.28
Andersen 2A 62.0 7000 1.24 L 29 2B 98.0 7000 l. 43 1. 63 2C 122.0 7000 L 25 1. 30
Bl 11. 8 2560 L 79 2.15 B2 11. 3 2560 l. 71 2.06
Marshall B3 11. 8 2560 L 79 2. 15 and Tembe Cl 11. 3 2560 1. 71 2,06
C2 11. 9 2560 1,80 2, 16 C3 10.8 2560 1. 65 1. 99
III lA 13,0 2859 1.50 L 99 III lB 13, O 2859 L 50 L 99
Nylander IV SA 15.6 3079 1. 73 2.30 IV SB 14.7 3079 1. 64 2.17
Cowan A 36.0 3380 l. 22 L52
3THU 37,6 3923 0.95 L 23 Ernst 4TRO 34,4 " 0,88 1,13
5TRO 33.8 " 0,86 1.11

4,15
Table 4.3 Contd.
T /T exp theor
Investigator Beam Torque f' Plastic Eff. Shear kip. in.
C Eq. (4. 7) p. s. L see SecL 4. 4
Pl A 19.7 7000 1. 62 1. 68 B 21. 5 II L 76 L82 C 22.2 II 1.82 L89 D 21. l II 1. 73 1.80 E 19,3 II 1. 57 1.65
Humphreys PRI A 44.8 II 1. 47 L90 B 46.l II 1. 52 1.96 C 45.8 II 1.52 L 95
PSI A 74.0 II 1. 52 2.10 B 73.5 II 1. 50 2.08 C 72.0 II 1. 4 7 2.04
PTI A 16.5 II 1. 56 2, 16 B 15.5 II 1. 4 7 2.03 C 14.9 II 1. 42 L 95
PUI A 24.7 II 1. 71 2.42 B 21, 2 II 1. 47 2.08 C 22.2 II L 53 2, 18 .
Gesund l 36.0 4379 0.91 0.95 and Boston 2 39.0 437 9 0.99 L 03
Ramakris- 28.8 3119 1.86 2,30
nan and 28.8 3099 1. 87 2,30 Vijarangan 26.l 2639 1. 83 2,28
23.2 2179 1. 79 2,23 20.l 1969 1. 63 2.03 21. 7 2000 1. 75 2,15
Mean l. 55 1.84
Standard Deviation 18°/o 22°/o
No. of Tests 71 71

4. 16
used by Cowan (Ref. 2. 20) and he obtained a factor of 4. 23 rather than
4 as used in Equation 4. 5. After both the normal and the shear stress at
failure had been calculated the maximum principal tensile stress was
found by using the well known formula,
f = t
er 2 , ....... 4. 7
The results of this analysis are presented in Table 4. 4. An
examination of the results shows that for any one concrete mix the
calculated principal tensile stress at failure is reasonably constant. It
may be concluded that the strength of a plain concrete beam loaded in
combined bending and torsion, can be calculated by employing a
maximum stress criterion for concrete strength together with a
plastic stress distribution.
b. Beams Containing Only Longitudinal Reinforcement.
Beams containing only longitudinal steel and loaded in combined
fleYUre and torsion have been observed to fail in several modes, the mode
depending in any particular case on the ratio of twisting moment to bending
moment and the section properties of the member ( Chapters 2 and 3).
In general. the sequence of events comprising failure may be
described as follows: Application of the bending moment cracks the
lower portion of the beam and reduces the effective cross-section;
further) it applies a compressive force to the uncracked concrete
?.one and a tensile force to the steel When the member is twisted
shearing stresses are induced in the uncracked concrete zone and dowel
forces on the steel If spalling of the concrete is ignored failure of th,:>
beam will be initiated either by the concrete failing under the combined
compressive and shearing stresses or by the steel yielding due to the

Beam
Pl P2 P3 P4 PS P6
TABLE 4 , 4 COMPUTED FAILURE STRESSES FOR PLAIN CONCRETE RECTANGULAR BEAMS SUBJECTED TO BENDJNG AND TCRSION
Failure Stress · Failure Stress Failure Stress
in p, s. i. in p , s .L in p . s . i.
(corrected to f' = 6 . 720 n , s ~i.)
Beam f' - 4 600 . ,.. - , p . S, l ,
Beam 1 ;, ::: 4 , f;j 0
l,;
416 423 412
REP2 340 RUP2 366
378 REP4 304 RUP4 398
403 420
mean = 409 p. s , i. mean = 322 p . s . L mean= 382 p. s. i.
mean devn . = 12p.s .i. mean devn . = 18p.s.i. mean devn . = 16p.s . i.
.i:,.
.... -J

4. 18
tensile and dowel forces.
In the following analysis we will examine the modes of failure
described above and thus attempt to determine the flexure-torsion
interaction behaviour of this type of beam.
b. (i) Equilibrium Equations.
The equilibrium situation at a cracked section of a member
subjected to a bending moment Mand a twisting moment T is
depicted in Figure 4. 2. Examination of this figure reveals that
the equilibrium equations for the section are as follows:-
M = C jd
T = T C
+ D jd
4.8
4. 9,
in which C is the compressive force on the uncracked concrete
zone, D the dowel force on the steel, T the twisting moment C
resisted in the uncracked concrete zone and jd the lever arm
for the force C about the tensile steel.
In considering failures of the concrete the conservative
assumption that D is equal to zero will be made.
Thus,
T = T . C
If the depth of the uncracked concrete zone is designated d then C
the average compressive and shear stresses in this region will
be: M
a- = "d bd J C
....... 4. 10
and
-r T if d b. = >
.!.b2 (d - £) C
2 C 3
. ...... 4. 11.
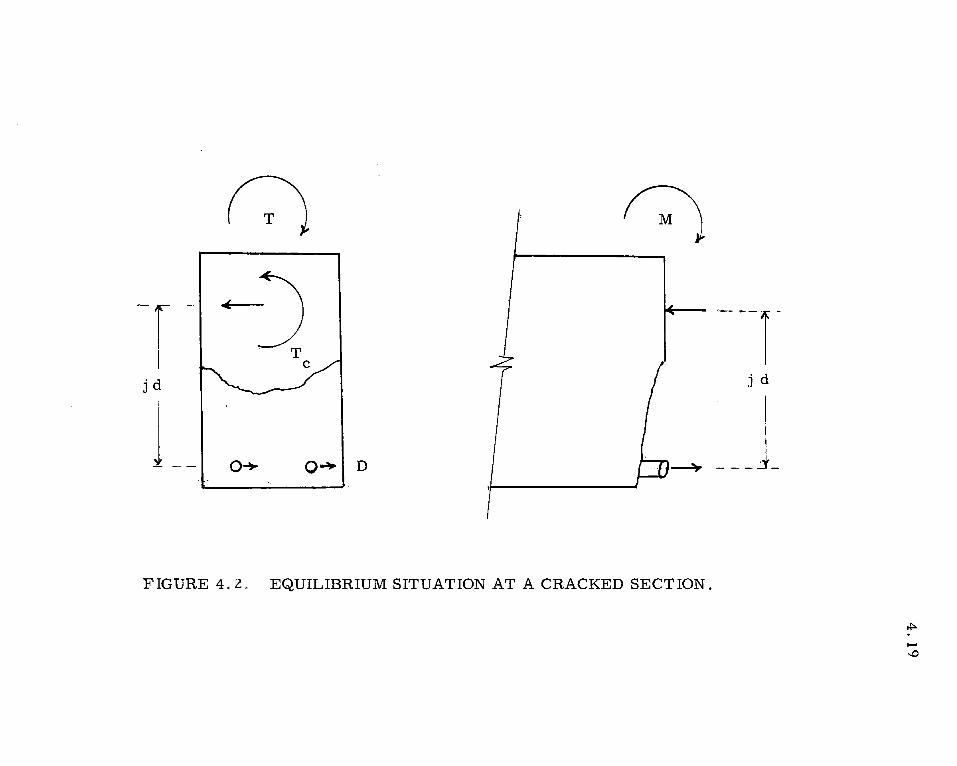
~ ~ ~r -jd
j__ ~ 0~1 D ~
FIGURE 4. 2. EQUILIBRIUM SITUATION AT A CRACKED SECTION.
---r j d
___ J_
~
......
...0

4.20
In considering failures of the steel the torsional
resistance of the uncracked concrete zone will be ignored.
Thus the dowel force on the steel is:
D = T
jd ......... 4. 12
The tensile force on the steel, S, will of course be:
M s = jd .
b. {ii) Reduction of Effective Section.
4. 13
The depth of the uncracked concrete zone will depend
upon the magnitude of the bending moment applied. It might
be expected that the depth of this zone, d , would vary with the C
applied moment, M, in a manner similar to that shown by the
full line in Figure 4. 3. Until the cracking moment is reachE-d
d is equal to the height of the beam, h. At the ultimate flexurd C
capacity, M , the depth of uncracked cone rete is very nearly u
equal to the depth to the neutral axis, kd. As a simplifying
approximation it will be assumed that d will vary in thE' mamLr· C
represented by the dotted straight line in Figure 4. 3. The
equation of this line is:
d C
M = h- -
M u
(h - kd).
b. (iii) Failure of the Concrete.
"". -.. "0 """ 4. 14.
When the ratio of torsion to flexure is high failure will be
iniated by cleavage of the concrete. Cowan (Ref. 4. l} h2.s
suggested that a suitable criterion for the cleavage fracture

4.21
"' h ' "--d '--C "-
'--. '--.
'--.
'--"-
7 !<d
_L_ 0 1.0
M -M
u
FIGURE 4. 3. VARIATION OF THE DEPTH OF UNCRACKED
CONCRETE, d , WITH THE APPLIED BENDING C
MOMENT.

4.22
of concrete is Rankine' s maximum stress theory. Due to its
simplicity this criterion will be adopted. That is, it will
be assumed that at failure the maximum principal tensile stress
will be a constant.
i. e.
- ½o- +
=
and so
= 1 +
Now from Equation 4. 1,
f t =
T 0
= f ' t
......... 4. 15
......... 4. 16.
where T is the pure torsional strength of the section. 0
Hence from Equations 4. 11 and 4. 16,
= T T
0
b h - 3
d - b C 3
and substituting for d from Equation 4. 14, C
= T
T 0
M 1 - -
M u
1 (h - kd) (h- b/3)

or
where
Kl =
K = 2
and ~ =
Similarly:
(T - = ft
=
=
1
T T
0
kd --h
1 1---3oC.
h/b.
M "d bd J C
M u
2T 0
,
b jd
1
1 M
M u
.!.b2 {h - b ) 2 3
T 0
K2
M u
Kl -M
"t and ft
When the expressions for
4.23
..... 4. 17
..... 4.18
..... 4. 19
..... 4. 20,
<r ft
are substituted
into Equation 4. 15 the following equation for torsion=flexure
interaction is obtained.
:u] j1+::: 1
~-~ M K2 ]
2 T b
= T K2 jd 0 u - K
M l
... , . 4, 21

4.24
b(iv) Failure of the Steel.
When the ratio of torsion to flexure is low failure will be
initiated by yielding of the steel. Adopting the huber-Beltramis
criterion for yield of the steel we have:
f =}cr2 + 3 ~ 2 Ll
where f L 1 is the yield strength of the steel.
Now Oi;. · the direct stress in the steel, will be:
<r = s
..... 4. 22
where S is the direct force in the steel and ALl is the area.
The shearing stress in the steel, 't' , will be
where D is the transverse force on the steel.
Thus from Equation 4. 22
= j sz + 3D2
Substituting from Equations 4. 12 and 4. 13 we have;

4.25
and so the interaction equation for this type of failure becomes;
2 ( M ) M
u +
T 2 2 3 (--2) (..l)
M T U 0
= 1
b. (v) Discussion of Torsion - Flexure Interaction.
..... 4. 23.
It is apparent from the equations derived above that the
shape of the torsion-flexure interaction diagram for a beam
containing only longitudinal steel will depend on the section
properties of the member. To illustrate this point interaction
diagrams for two different beams have been presented in
Figure 4. 4. From this figure it will be seen that for heavily
reinforced, slender beams of the type tested by Nylander, the
presence of a moderate bending moment will increase the
torsional capacity of the section. On the other hand, for lightly
reinforced, stout beams of the type tested in this investigation,
the presence of bending moment will decrease the torsional
capacity. It can be seen from Figure 4. 4 that these theoretical
predictions agree fairly well with the observed behaviour of the
test beams.
b. (vi) Simplification.
Although the above analysis was based on fairly arbitary
assumptions and ignored several possible modes of failure it
was seen to predict correctly the trend of observed experimental
results. Unfortunately the analysis equatio~s are fairly compltx
and furthermore they contain the term T (the pure torsional 0
strength of the section). If T has to be calculated large errors 0
will be introduced and so the resulting accuracy of the analys:~s

.. 0
1.2-----------
1.UI a I t::c I e I I
m 081 I I I I O • . 0.61 I I I I ~II
a!
' t-0.41 I I I I 11 .. 021 I I I I I 0.21 I I I I ~ II
O 02 04 06 0B 10 0 ....... ----...- ... --.... .- """ "".O
M/Mu M/Mu NYLANDER SERIES Ill THIS INVESTIGATION SERIES L
p = 2.69 °lo ,:1.. = 2.1 P= 1.860/o ~= 1.5
M~T o = 11. 6 M~To = 4.5
FIG. 4.4 BENDING - TORSION INTERACTION CURVES FOR BEAMS CONTAINING ONLY LONGITUDINAL STEEL.
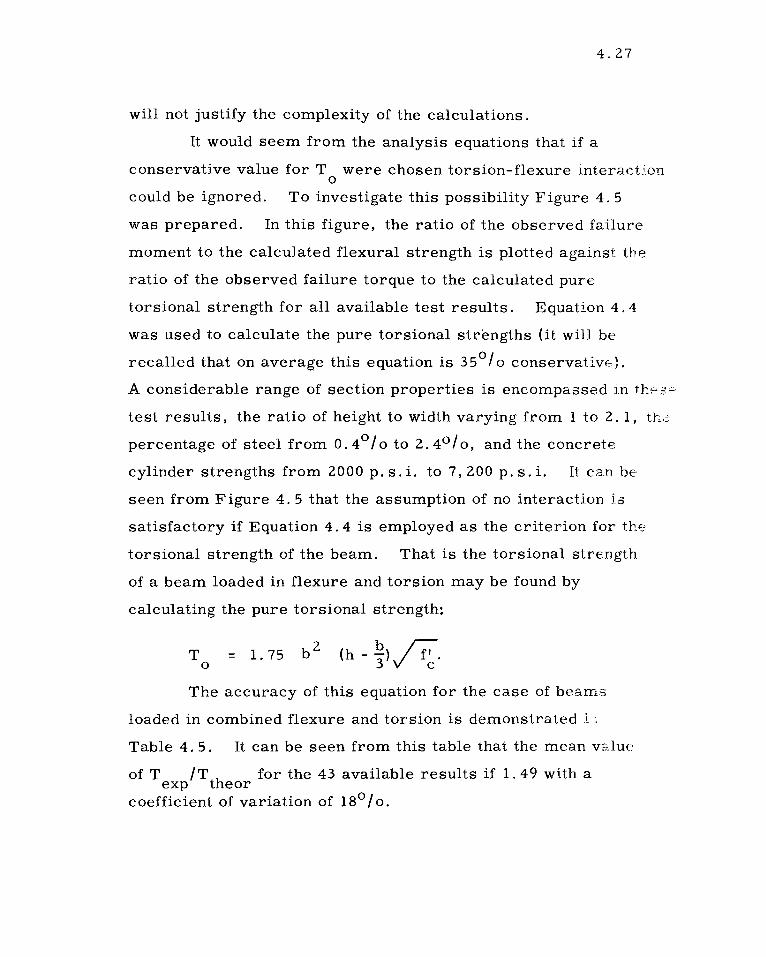
4.27
will not justify the complexity of the calculations.
It would seem from the analysis equations that if a
conservative value for T were chosen torsion-flexure interaction 0
could be ignored. To investigate this possibility Figure 4. 5
was prepared. In this figure, the ratio of the observed failure
moment to the calculated flexural strength is plotted against the
ratio of the observed failure torque to the calculated pure
torsional strength for all available test results. Equation 4. 4
was used to calculate the pure torsional strengths (it will be
recalled that on average this equation is 35° / o conservative}.
A considerable range of section properties is encompassed in the.si::,
test results, the ratio of height to width varying from 1 to 2. l, th,::
percentage of steel from 0.4°/o to 2.4°/o, and the concrete
cylinder strengths from 2000 p. s. i. to 7, 200 p. s. i. It can be
seen from Figure 4. 5 that the assumption of no interaction is
satisfactory if Equation 4. 4 is employed as the criterion for the
torsional strength of the beam. That is the torsional strength
of a beam loaded in flexure and torsion may be found by
calculating the pure torsional strength:
The accuracy of this equation for the case of beams
loaded in combined flexure and torsion is demonstrated I:
Table 4. 5. It can be seen from this table that the mean v&,lue
of T /T h for the 43 available results if 1. 49 with a exp t eor
coefficient of variation of 18 ° / o.
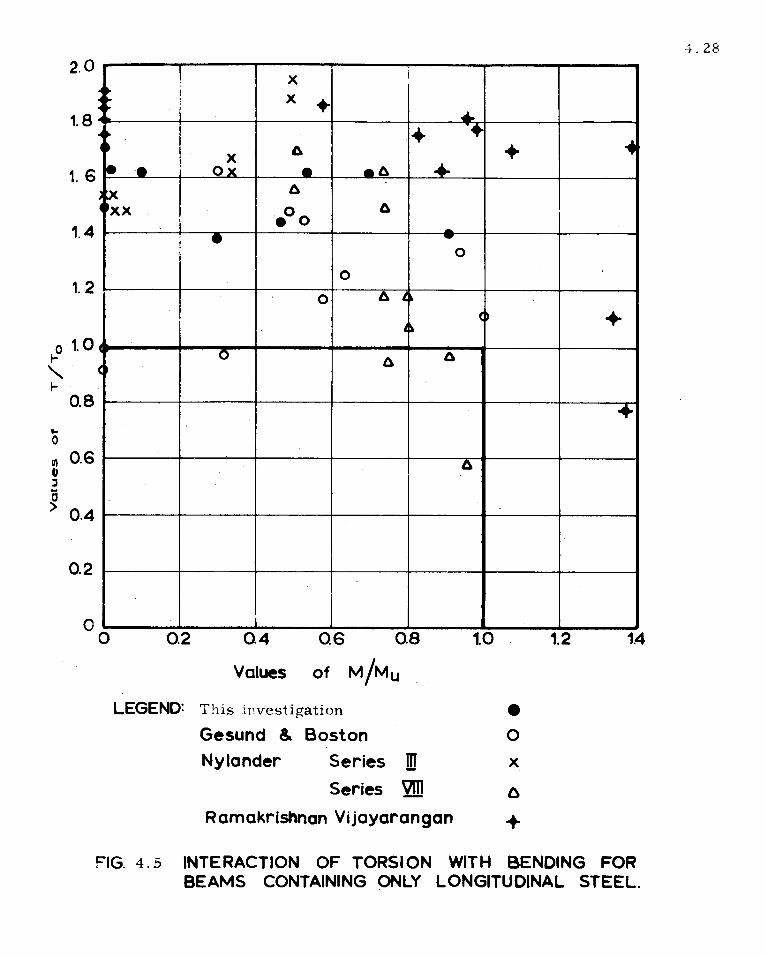
2.0
1.8
1. 6
1. 4
1. 2
0 1. 0 I-
" I-0.8
.. 0
di 0.6 Cl J
~ 0.4
0.2
0
X i
~ X ~ ...
..&..
-~ • ·+ ,. 6 + 1
X ~ • ox • •6 ...
HX 6 i txx .oo 6
-• -0
0
0 6 h
0 + ~~
0 6 6 (
• 6
I
0 1.4 0.2 0.4 06 0.8 10 1.2
Values of M/Mu
LEGEND: This investigation • Gesund & Boston 0
Nylander Series m X
Series VIII 0
Ramakrishnan Vijayarangan +
FIG. 4.5 INTERACTION OF TORSION WITH BENDING FOR BEAMS CONTAINING ONLY LONGITUDINAL STEEL.
4.28

4.29
TABLE 4. 5
A COMPARISON OF THE THEORY WITH EXPERIMENTAL RESULTS FOR BEAMS CONTAINING ONLY LONGITUDINAL STEEL LOADED IN BENDING
AND TORSION
' 'f /T exp theor.
Investigator Beam Torque Moment Plastic Eff, Shear Eq. (4. 7) see
Sect. (4,4j
Ll 57.0 32.3 1. 62 2.12 L2 60. 1 205.7 1. 68 2. 19 L3 61. 1 5.5 1. 63 2, 13 L7 47.8 80.5 1. 38 1.80
This L8 49.6 263.5 1.40 1, 83 investiga- LS2 52.5 5.2 1. 87 2.54 tion S3 64.2 6.3 1. 74 2, 19
LBl 54.l 141. 6 1.47 1.90 LB2 55.4 6.3 1.50 1.91 LB3 60.7 161. 5 1. 65 2. 14
B4 17. 1 99.0 1. 36 L52 BS 24.8 45.4 1.85 2.56 B6 10.7 108.0 1. 39 1, 39 C3 21. 7 111. O 1. 69 2,34
Ramakrishnan C4 20.l 90.7 1. 63 2.26 and CS 23.2 105.0 1. 79 2.47 Vijarangan B6 * B
23.2 108.0 1. 70 2.35
Cl * B 23.2 108.0 1. 79 ·2,48
C6 * B 21. 7 90.7 1. 75 2.42

4, 30
Table 4. 5 Cont.
T /T exp theor.
Investigator Beam Torque Moment Plastic Eff. Shear Eq. (4. 7) see
Sect. (4.4
III 2A 13.0 9.2 1.46 2.03 2B 13.0 9.2 1.46 2.03 3A 14.3 48.4 1. 65 2.28 3B 13.9 48.4 1. 60 2,22 4A 16.5 72.6 L94 2,69 4B 15.6 72,6 1.84 2.54
VII l 39.0 52.l 1. 19 L 30 2 3L 2 52.l 0.95 1.04
Nylander 3 39.l 58.0 1. 19 1. 30 4 35.2 58.0 L 07 1. 17 5 54.7 75.5 1. 70 1,86 6 50.7 75,5 L58 L 73 7 50.7 10.0 l. 51 L65 8 54.7 10.0 1. 63 L 78 9 31. 3 58.0 0.94 1. 03
10 19.5 58.0 0,96 0,96
3 58.0 58.0 l.47 L 70 4 64.0 64.0 1.62 1, 89
Gesund and 5 43.0 86,0 L49 L 74 Boston 6 36.0 108.0 1. 25 1.46
7 59.0 177.0 L 32 1.54 8 49.0 195.0 1. 10 1. 28 9 42.0 83.0 0.97 1.47
10 39.0 156,0 1. 17 L 77 --
Mean 1. 49 1.86 Standard Deviation 18°/o 0 24 /n No. of Tests 43 43
---

4.31
It may be recalled that the mean value of T / T for exp theor
rectangular beams containing only longitudinal steel and loaded
in pure torsion was 1. 55 + 18° / o. Comparison of these
values supports the assumption that on average the effect of
flexure on the torsional strength can be ignored.
4. 4. BEAMS LOADED IN COMBINED TRANSVERSE SHEAR AND
TORSION.
4. 4a. Nominal Stresses at Failure.
It has generally been assumed that a maximum principal stress
approach accounts satisfactorily for the strength of beams loaded in
combined transverse shear and torsion. Further, the sum of the
nominal transverse shear stress, V , and the torsional shear stress, V
Vt, has been taken as a measure of the diagonal tension and as such
has been related to the cylinder strength of the concrete, f 1 • The Q C
series of tests described in the previous chapter may be used to
investigate this approach.
For each beam of the Q series the nominal transverse shear
stress at failure was calculated from the usual formula: V
vv = bd'
while the torsional shear stress at failure was calculated from the
plastic theory, i. e.
T b
(h - -) 3
The value of V v + Vt for each beam was then tabulated against the nom:Ln.al
values of the shear span to depth ratio and the eccentricity to width rs:.t:.'.),

4.32
The results of this analysis are presented in Table 4. 6.
Examination of Table 4. 6 reveals that the value of the nominal
shear stress at failure (Vt + V v)' depends upon the value of the two
parameters a/ d and e/b. Thus although all beams of the Q series were
cast from the one batch of concrete (f' was sensibly constant), the value of C
V t + V v varied from 14 7 p. s. i. to 491 p. s. i. as the ratios of loading were
changed. Hence, to obtain consistent results from a "nominal shear
stress" design approach, the limiting value of the stress must be relatr.d
to the values of a/ d and e/b (or M/Vd and T /Vb) as well as to the value
off'. C
The increase in the value of the nominal shear stress at failure
with increasing e/b ratios and decreasing a/d ratios might be explained
by the fact that as e/b increases and a/ d decreases the moment on the
section at failure will be smaller and so flexural cracking will be reduced.
In support of this explanation Table 4. 7 lists the percentage of the
ultimate load at which flexural cracking was observed. It will be seen
that this percentage varies in the same manner as the nominal shear
stress.
Another explanation for the large variation in the nominal stress
at failure is that Vt + V vis the average combined shear stress over only
one portion of the cross-section. Thus if Figure 4. 6 ia examined it
will be seen that while V + V is the average intensity of shear stress t V
over one area of the section, other areas are at intensities Vt - V v
and/ Vt 2 + V v 2 . It is improbable that the maximum value V·t· applying
to only portion of the section would govern failure. On the other hand
it is possible that a more realistic approach would be to consider an
average intensity of shear stress. In view of the effects of flexural

A 2.0 3.0 4. 1 5.5 b
Qll Q8 Ql2 Q3
0.0 287 192 172 147
Qllb Q6 Q5 Ql Q9
0.3 491 324 289 275
Qlla Q6a Q7a Q2
0.6 346 331 361 327
Ql0 Q8a Q7 Q4
1. 8 399 358 315 303
oO Q4a 324
TABLE 4. 6. NOMINAL SHEAR STRESS
(V + V) AT FAILURE (p. s. i.) V t
~ 2.0 3.0 4.1 5.5 b
0.0 72°/c 77°/o 47°/o 40°/o
0.3 70°/o 75°/o 62°/o 61°/o
0.6 100°/o 95°/o 94°/o 75°/o
1. 8 1000/o 100°/o 100°/o 85°/o
oQ 100°/o
TABLE 4. 7. PERCENTAGE OF
ULTIMATE LOAD AT WHICH FLEXURE
CRACKS WERE FIRST OBSERVED.
.i:,.
v-l v-l

vt
vt
V t
TORSION
vt V V
V V
TRANSVERSE
SHEAR
FIGURE 4. 6. THE AVERAGE SHEAR STRESSES.
Vt +Vv
V 2 V
/v/+vv2
V - V t V
TORSION PLUS
TRANSVERSE SHEAR
~
\.,)
~

4.35
cracking it is reasonable to consider the average intensity of shear
stress in relation to the reduced section bd where d is given by C C
Equation 4. 14.
Provided that Vt is larger than V v' the overall average
intensity of shear stress is given by:
V av
=
!.bz/v 2 + V 2 a t V
bd C
where in this case,
and
V = V
V bd
C
T b - -) 3
if d C
..... 4. 24.
> b.
In Table 4. 8 the values of V at failure for the Q series of av
beams are listed. Comparison of these values with those given in
Table 4. 6 shows that for this series of beams the values of V at av
failure are much more consistent than the values of V v + Vt.
4. 4. b. Transverse Shear - Torsion Interaction.
While the above discussion suggests that a design procedure
might be formulated in which the value of the limiting shear stress would
be related to the values of a/ d and e/b, a simpler and more satisfactory
procedure can be developed if an empirical interaction between transverse
shear and torsion is employed.
The experimentally observed shear-torsion interaction behaviour
is shown in Figure 4. 7, where the ratio of failure torque to pure

TABLE 4. 8. AVERAGE SHEAR STRESS (V ) AT FAILURE av
ON REDUCED SECTION. (p .. s .. i..)
~ b 2.0 3.0 4. 1 5.5
0.0 457 312 336 358
0.3 505 327 377 435
0.6 315 303 417 443
1.8 385 ·355 325 320
oO 324
4.36

4 .. 37
1.2--------------~---..---------..... Nylander A This
Investigation I -·-c
0 I aa ~-- · -·-I
I !_ -i-I
I 7
06 _._ I _,_
I
~~ I -r
06
Q4 -I
02'1-----+-----h-----h------~----+--------~
QL----"'-----....L----~---~~--~~--~ 0.2 04 06 06 1.0 1.2 y_ v.
FIG. 4. 7. SHEAR TORSION INTERACTION FOR BEAMS CONTAINING ·ONLY LONGITUDINAL STEEL.

4. 38
torsional strength is plotted against the ratio of failure shear to the "pure"
shear strength. For the results plotted both the pure torsional and shear
strengths (T and V ) were determined from tests on companion 0 0
specimens. The range of parameters covered by the results plotted
in this figure is a/d varied from 2. 0 to 5. 4, h/b from l. 5 to 2. 1,
percentage of steel from l. 4° / o to 5. 1 ° / o, and concrete cylinder strengths
from 3, 000 p. s. i. to 6, 800 p. s. i.
It is evident from Figure 4. 7 that the assumption of linear
interaction between transverse shear and torsion will lead to satisfactory
results.
Hence,
T T
0
+ V V
0
= 1 ......... 4. 25
Before the strength of a beam loaded in combined transverse shear
and torsion can be calculated it is necessary to know the values of both
T and V . If T is calculated using Equation 4. 4, and V is obtained 0 0 0 0
from the A. C. I. equation (Reference 4. 6) that is:
V = (l.9r;;-o JI~ + 2,500 ~) bd M
........ 4. 26
then the results presented in Table 4. 9 are obtained. From this table
it can be seen that for the available results the parameter T /Tth exp eor
has an average value of l. 93 and a coefficient of variation of 15°/o.
This result reflects the conservative nature of both Equation 4. 4 and 4. 26.

4.39
TABLE 4.9
A COMPARISON OF THE THEORY WITH EXPERIMENTAL RESULTS FOR BEAMS CONTAINING ONLY LONGITUDINAL REINFORCEMENT LOADED
IN SHEAR AND TORSION
T /T exp theor
Investigator Beam Torque Shear M Plastic Eff. Shear -kip. in. kips. Vd eq. (4. 8) see
Sect. 4. 4
LS 43.4 4.0 4.52 1. 75 2.01 L6 52.5 0.8 5.01 1.54 1. 86 SLl 46.2 2.2 4.45 2.21 2.53 LS3 39.6 1. 9 3.74 1. 71 2.00 LS4 25.7 4.2 3.71 1. 59 1. 77
This LS6 37.6 3.6 3.76 1. 91 2. 19 investiga- Sl 41.8 6.4 3.07 1. 93 2.08 tion S4 47.0 4.5 2.97 1. 67 1.80
SS 47.7 2.4 3.10 1. 60 1. 77 Ql 13. 9 5.6 5.37 1. 68 1. 87 Q2 24. 1 4.2 5.25 1. 89 2.21 Q4 27.8 1. 6 5.21 1. 57 1. 94 Q4A 27.3 4.3 4.07 2.04 2.37 QS 16.5 5.7 4.07 1.80 2.00 Q6 19.4 6.0 3.06 1. 95 2. 15 Q6A 24.4 4.3 3.05 1. 87 2.12 Q7 28.8 1. 7 4.01 1. 63 1. 98 Q7A 27.3 4.3 4.07 2.04 2.37 Q8A 33.0 1.8 2.98 1. 83 2. 16 Q9 18.3 5.0 5.42 1. 77 2.02 Ql0 36.4 2.2 2.03 2.04 2.28 QllA 26.5 4.0 2.03 1.88 2.06 QllB 27.2 10.0 2.05 2.91 3.09 IV2A 6.9 4.3 4.4 2.34 2.66
2B 6.8 4.1 4.4 2.25 2.56 Nylander 3A 10.3 2.5 4.4 2.07 2.55
3B 12.7 2. 1 4.4 2.15 2.74 4A 13.4 1. 6 4.4 2.01 2.60 4B 13. 6 1. 6 4.4 2.00 2.61
Mean 1. 93 2.22 Standard Deviation 15°/o 16°/o No. of Tests 29 29

4.40
4. 5. EFFECTIVE SHEAR METHOD.
Although the equations derived above are relatively simple to use,
there are advantages to be gained by recasting them in a different form.
In particular it is convenient to relate the torsional strength, T , to the 0
shear strength, V . 0
Thus we may write,
or
T 0
C
=
=
V b 0
C
V b 0
T 0
........ 4. 27
........ 4. 28.
The shear-torsion interaction equation can now be written as:
V + CT b
= V . 0
....... 4. 29
This equation means that the torque on a member loaded in combined
bending, torsion and shear can be replaced by an equivalent shear
force of magnitude CT /b. Design is then carried out for the applied
bending moment and the effective shear force by the usual methods.
For the design of rectangular sections it is possible to derive
a simple approximation for C.
The A.C.I. Code (316-63) gives the following simplified
expression for V : 0
V = 2bdfi:_ 0 C

Hence,
Equation 4. 4 gives the expression for T as: 0
2 bA T = 1. 75 b (h - -) f' . 0 3 . C
C =
=
2bd~. b
1. 75 b 2 (h - ~) /-;;;
1. 14 d
(h - b) 3
4.41
If dis taken as 0. 9h and it is recalled that d:.. = h/b, the
above equation can be written as:
C = 1. 03
1 (1 - -)
30.:
......... 4. 30
For design purposes it would be more convenient if C were a
constant and hence as a conservative simplification we will take
C = 1. 6
which corresponds approximately with the case oC. = 1.
The expression for the pure torsional strength now becomes:
......... 4. 31.
When this equation is used to analyse beams tested in pure
torsion, the results presented in the last column of Table 4. 3 are
obtained. It will be seen that the average value of T /Tth for exp eor

4.42
the 75 tests listed is 1. 84 with a coefficient of variation of 22°/o. For
bending and torsion tests the mean value of T /Tth is 1. 86 with a exp eor coefficient of variation of 24°/o (see Table 4.4).
When C is taken as 1. 6, the equation for the shear-torsion
interaction becomes:
V + 1. 6T b
= V. 0
......... 4. 32.
In the last column of Table 4. 9 the values of T / Tth exp eor,
obtained by using the above equation are listed. It will be seen that
for these tests this parameter has an average value of 2. 22 and a
coefficient of variation of 16 ° / o.
As would be expected use of the constant value for C leads to
conservative results. However, it is felt that the resulting equations
are sufficiently accurate for design office use and they do have the
great advantage of simplicity.

CHAPTER 5
WEB REINFORCED BEAMS UNDER COMBINED
TORSION AND FLEXURE. THEORY.
5. 1. INTRODUCTION.
5.1
There is universal agreement among workers in the field, that
combinations of longitudinal and transverse steel increase the torsional
capacity of beams. Advantage may be taken of this fact to reduce the
overall dimensions of beams subjected to torsion in combination with
flexure.
In recent years several investigators have proposed theories to
calculate the ultimate strength of beams of this type. It is generally
agreed that failure of the beams takes place when tension cracks on
three sides open, allowing the segments of the beam to rotate about
a "hinge" located near the fourth side. The assumptions, concerning
the shape of the failure surface, made by the various investigators have
been discussed in Chapter 2.

5.2
5. 2. GENERAL ASSUMPTIONS.
Observation of the failure behaviour of web reinforced beams,
and study of the failure surfaces proposed by previous investigators
led to the adoption of the idealized failure mechanism shown in Figure
5. 1. The compression "hinge" of this failure mechanism has been taken
as a straight line joining the ends of the fracture surface and making an
angle of 9 with the normal cross section. Furthermore, it has been
assumed that the intersection of the fracture surface with the face
opposite the compression zone is a straight line whose inclination may
be defined by a spiral joining the ends of the compression zone.
Following Lessig, failure with the compression zone occurring
near the top face is referred to as a Mode l failure, whilst a Mode 2
failure indicates that this zone forms near a side face. This latter
type of failure normally occurs only in the presence of transverse shear
force and so it will not be dealt with in this chapter. In the present
investigation some specimens developed the compression hinge near the
bottom surface and failures of this type have been labelled Mode 3.
Expressions for the failure loads in both Mode 1 and Mode 3, will
now be derived. It should be noted, that in this analysis it will be assumed
that both the longitudinal, and the transverse steel yield at failure.
Under certain circumstances it is possible for the beam to fail without
yielding of the steel. It is therefore necessary to place limitations on
the theory to exclude this type of beam. These limitations will be
considered in Chapter 7.
Dowel forces are ignored in this analysis, and the contribution
of the tensile stresses in the concrete is also omitted. These
approximations lead to satisfactory results except for beams in which the

:---,,
:~. ---
-:., '
...,_. .
. -
, • <:;J
'. • •
• •
• J
• -
-~
--
• •1
._
• .,,.
"-A
,
: . -
\ : '
' .... •--':
. ••'4
) -." ..
-~--:.
"J. \
' •1
,)
--,I•;--
I·•
•
-< , •
• .-,
, ._p,..
' /
• I
I \
• .• 4
"/. ·,
,, ··.,.
''q
__ .
~
\ - ...:
' . -·
I '
..J..-'-.
-,
'\ •
• , I
/ •
, ~
: '-.
,I
I
5-3
w
u ~
a:: ::, V
)
z 0 V) ~
0 I-
(!) z 0 z w
CD
0 w
N
_J
<l
w
0 lO
(!)
lL

amount of transverse steel is very small. For such beams the theory
will frequently lead to a low estimate of the torsional capacity. This
deficiency in the theory will be referred to again in a later chapter.
5. 3. ANALYSIS OF MODE 1.
5.4
A general view of the first mode of failure is shown in Figure 5. 2.
In this figure an attempt has been made to represent the forces acting at
failure. Among the forces shown are, the force exerted by the web
steel on the sides, F , and the bottoms, F ·b, as well as the force ws w
exerted by the bottom longitudinal steel, F 1 b. The direct stresses
acting on the concrete "compression" zone have been represented by a
force, Cf, acting at a point labelled Owhich is a distance of x 1 from the
top surface. The shear stresses acting have been represented by a shear
force, C , and a couple, C , which acts in the plane of the compression S C
zone.
The length of beam which the failure surface occupies is equal to
b tan 91 (see Figure 5. 2). Some portion of this length will separate
the two forces exerted by the side branches of the web steel. This
portion will be called '?/. b tan 9 1.
For the simplicity, it is assumed that the bottom branches of the
stirrups are at the same level as the main longitudinal steel. Thus both
force F 1 b and F wb are a distance (d - x 1) from point O.
5. 3. a. Equilibrium Equations.
The sum of the moments of the external and the internal forces
about a transverse axis is equal to zero. For convenience the transverse
axis passing through point O will be chosen.

\b tan e,
\ \
b
I Fws 1 , •. ~ X
\ \
"C -l h
I Fib I
FIG. 5.2 FORCES ACTING ON THE MODE 1 FAILURE SURFACE.
M
-A,:-
OJ OJ

5.6
Thus,
M + Cc sin '\ - F lb ( d - x l) + F ws '/ . b. tan Q l = 0. . .. 5. 1.
The sum of the moments of the external and the internal forces
about a longitudinal axis is equal to zero. Once more the axis through
point O will be chosen.
Thus,
T - Cc cos e1 - Fwb (d-x1) - Fws b' = 0. . .. 5. 2.
where b' is the width of the hoops.
Eliminating Cc from Jlquations 5. l and 5. 2, and rearranging we
have:
+ F sin e1 (b' -Zf.L). ws
. .. 5. 3.
Now if both sides of equation 5. 3 are divided by cos e1 then the
expression becomes:
M + T.t = (F lb+ F wb· t) (d-x1) + F ws·t. (b' - 2{b) ... 5.4.
where, for convenience:

5.7
As the bottom longitudinal steel is assumed to be yielding,
where ALI is the area of the steel and fLl is its yield stress ..
If A is the cross-sectional area of one leg of the hoop w
reinforcement, f is its yield stress and s is the spacing of the hoops, w
then the force in the bottom branches of the transverse steel per unit
length of the beam would be A f / s. Now the length of the beam over WW
which these branches are intercepted by the failure surface may be taken
as:
Thus
b' 2h+ b
F = wb
b. t.
A f w w
s
b' bt 2h+ b"
If the relationship between transverse steel and longitudinal steel is
expressed by a parameter r where A f
w w r =
s
then Equation 5. 5 be comes
where
r F =
wb 1 + 2oC
oC = h/b.
b' ......... 5. 6.
Similarly the force in the side branches of the web steel is given by
F = ws
r 1 + ~
h b'

5.8
Now the length of the beam separating the two forces exerted by
the side branches of the web steel may be taken· as:
". b. t b+h
= b + 2h. b. t.
'2(. b = l + oC
l + 2oc. b.
From the above Equation 5. 4 can be rewritten as:
+ r
l+2oC.... h b'"
2 1+oc.. ALl fLl. t (b'- 1+2a:.· b).
If o/. = T /M .this equation can be rearranged to give:
T (1/"1 + t) AL/Ll (d-xl)
r = l + 1 + 2d:.
For convenience we may write:
2 T = A f (d - x) l + X. t
Ll Ll 1 + t 'I'
r where X =
l + ?<$.. h (1 -
d - x 1
5. 3. b. Determination of Tan 91.
~+
... 5. 7.
1 + (I;. 1 + 20C.
... 5. 8.
The inclination, Q 1, of the hinge will be such as to make the failure
load a minimum. This means that:
dT dt
= 0.

Therefore:
(..!.. + t) ""
For Equation 5. 9 to be satisfied:
( !. + t} 2
X.2t-(l+X.t) \fl
and so:
1 J (!.)2 + 1
t = - - + X "' "'
d dt
= o.
( 1 + xt2) - (1+xt2)
5.9
d 1 -(- + t) dt 'fl
. . . . . . . . . 5. 9.
......... 5. 10.
When this value is substituted into Equation 5. 7, the failure
torque for a Mode 1 failure is obtained as:
1 - "'). . .... 5.ll.
5. 3. c. Determination of x 1 .
= 0 .
The depth to the compression resultant, x 1 depends on the
distribution of the stress in the compression zone as well as the depth of
the zone. This depth, in turn depends on the strength of the concrete in
combined shear and compression. Because of the complexity and
indeterminacy of the factors involved, an accurate formulation for the
value of x 1 is not possible.
Fortunately it is not necessary that the value of x 1 should be
known exactly, as even considerable variation in this value will have
little effect upon the failure torque. Thus, in the interests of simplicity,
it has been arbitrarily assumed that the depth to the compression

5.10
resultant may be taken as the same as· it would be in pure flexure.
If M is the calculated ultimate capacity of the member in u
simple flexure, i. e.
Equation 5. 11 reduces to:
5. 4. d. Simplification.
1 + X
1 'f' ). .. ... 5. 12.
Of the three variables which determine the torsional strength of
a beam, Mu, X and t , X is the most arduous to calculate being given
by the expression:
(1 - 1 + (I:.. 1 + 2c:C
To simplify this expression we may make the conservative assumption that:
r X = 1 + 2oC. '
Equation 5. 12 now reduces to:
T 1 = 2r ( J (.~.) 2 + 1 : 20C:. M 1+2<C .,.
u
1 'f').
..... 5. 13.
. ... 5.14.
To demonstrate the order of the conservative error introduced by
Equation 5. 13, Table 5. 1 has been prepared. In this table the failure
torque calculated by using the simple expression for X, Equation 5. 13,
is compared with the failure torque calculated using the more complex
expression for X, Equation 5. 8,

5 (I
TABLE 5.1. Error Introduced by Ignoring the Last Term of
Equation 5. 4.
Beam Properties. b
1.25 11 = T(l 3)
<X r h T(8)
4' --d-x
1
1.2 0.97
0.25 0.075 1.4 0.97
1
1. 2 0.94
1.00 0.150
1.4 0.92
1. 2 0.93
0.25 0.100
1.4 0.92
2
1.2 0.90
1.00 0.175
1.4 0.88

5.12
by means of a ratio T{l 3) / T(S)' From Table 5. 1 it can be seen that
for a wide range of practical beams use of the more simple expression
will introduce a conservative error of about 10° /o. It may be noted
that the simplification introduced by Equation 5. 13 could have been
accomplished by ignoring the last term of the equilibrium expression
(Equation 5. 4).
5.4. ANALYSIS OF MODE 3.
A general view of the third mode of failure is shown in Figure
5. 3. Shown in this figure are the forces in the top longitudinal steel,
Flt , and the top branches of the web steel, F wt. Also shown are the
forces acting in the concrete compression zone and the side branches
of the stirrups.
5. 4. a. Equilibrium Equations.
The sum of the moments of the external and internal forces about
a transverse axis passing through point O is equal to zero. Thus
where d3 is the distance from the bottom of the beam to the centroid
of the top steel.
The sum of the moments of the forces about a longitudinal axis
through point O is equal to zero.
T - Cc cos 93 - Fwt (d3-x3 ) - Fws b' = 0. . .... 5, 16.
Eliminating C from Equations 5. 15 and 5. 16 we have:. C

T
-9-
b --~. . ' , y. ·. r- tt ' . - F \. . .
wt"" \.•. ,_......,,, r A' ' .. " D
' • ~ •\ ._ I • . ... \,, .. • :"c,_- ' ""-_ _,• • .._• I
• ,,,. " - "' ~ C .,. _,
h
FIG. 5.3 FORCES ACTING ON TrlE MODE 3 FAILURE SURFACE.
_..._
i< i
u ---
OJ -w

5. 14
+ F sin 8 3 (b' -1,b). . ..... 5. 17. ws
As in the case of Mode 1, the last term in this equation will be
ignored.
Now if Flt R ::
Fib ;:
then equation 5. 1 7 can be recast as:
r 2 R + 1 + 2ce tan 83
tan 8 3 - 1/'I' ...... 5. 18.
5.4. b. Determination of Tan 83.
The inclination, 8 3, of the hinge will be such as to make the
failure torque a minimum. If dT/dtan83 is equated to zero it is
found that T is a minimum when:
1 tan 8 :: -
3 o/ + J (~)2 + R(l+20C: )
r ....... 5. 19.
When this value is substituted into Equation 5. 18, the failure torque
for a Mode 3 failure is obtained as:
2r ( j (!)2 + (1 + 24C)R + .!.) T 3 :: ALl fLl (d3 - x3) 1+2~ f r 'f-'
...... 5. 20.

As a simplifyiµ.g assumption we will take:
Therefore Equation 5. 20 reduces to:
= 2r
1+2~
5. 15
... 5. 21.
For a given value of \.\J and known beam dimensions, the two
torques T 1 and T 3 can be computed from Equations 5. 14 and 5. 21. The
smaller of these two values will usually be the twisting moment at
failure if transverse shear force is absent. In general the strength
of a beam will be governed by the Mode 1 failure. Only in the case of
beams tested under high ratios of torsion to flexure and containing less
top than bottom longitudinal steel will the Mode 3 equation be critical.
5. 5. FLEXURE - TORSION INTERACTION.
For the purpose of studying interaction behaviour, Equation
5. 14 may be recast.
If it is recalled that 4' = T / M and, X = r / l + 2<C, Equation
5. 14 can be written as:
... 5. 22.
where M 1 is the failure moment associated with T 1
On rearranging and squaring to eliminate the radical sign the

5. 16
following relation is obtained:
M + 4x -1 ... x o Mu - "2: = . ... 5. 23.
Now if T is taken as the torsional capacity in Mode 1 when 0
M = 0, it can be seen from Equation 5. 21 that:
... 5. 24.
or M = T /2/x. U 0
Substituting for M in the first term of Equation 5. 23 and u
dividing both sides of the equation by 4X we have:
T ( __! )2 T
0
+ - 1 = 0. ... 5. 25.
In Figure 5. 4 the theoretical interaction behaviour of beams
for which Mode 1 is critical is shown. It can be seen that the theory
predicts substantial decreases in the flexural capacity with the application
of torsion and vice versa.
Contrary to the above, Cowan and Armstrong (Ref. 5. 1) found
that for their test beams the addition of bending moment increased the
torsional capacity. It is considered that this type of interaction is
peculiar to beams which have been designed primarily for flexure (that
is, containing more bottom than top longitudinal steel), but have been

0 1-
.............. I-
5.17
1. \------,------,-------:-----~----,
2 I ( I'( + M = 1
To/ Mu
0.
0.4L------+------+---~
Q2L-----1-----l-----+-----+------+-t
0.2 0.6 0.8 1.0
Fl3. 5.4 INTERACTION DIAGRAM FOR BEAMS FAILING tN MODE 1.

5.18
tested under predominantly torsional loads. For this type of beam a
Mode 3 failure will be critical. In this mode, failure is initiated by
yielding of the weaker top longitudinal steel. A moderate bending moment
opposes this action and thus increases the torsional capacity of the beam.
A larger bending moment will cause yielding of the bottom longitudinal
steel, that is, the beam will fail in Mode 1. It is to be noted that since
the Mode 1 failure mechanism for such a beam involves the yielding of
a larger area of longitudinal steel than does the Mode 3 failure, the
torsional capacity will still be greater than the pure torsional strength of
the beam, which is governed by the Mode 3 failure.
The Mode 3 equation can be written as:
= +
Again rearranging terms and squaring to eliminate the radical
sign the following relations is obtained:
M3 - 4 X M
u - 4 X R = 0.
Substituting for M and dividing by 4 X we have: u
T (-3/
M u
- R = 0.
... 5. 26.
. .. 5. 27.
It can be seen from this equation that the shape of the interaction
curve will depend on the value of R (the ratio of the top to the bottom
longitudinal steel). In Figure 5. 5 the interaction curves for R = I, R = ½ and R = ¾ have been drawn. Also plotted on this figure is the Mode I

5. 19
1.2---------------,------,---......,
02---------+---------+-----t--1
02 0.8
FIG. 5.5 INTERACTION DIAGRAM FOR BEAMS WHICH MAY FAIL IN MODE 3.
1.0

5.20
interaction curve. It is evident from Figure 5. 5 that if R(. I the beam is
governed by the Mode 3 equation for low values of M/M and so in this u
range bending increases the torsional capacity. Application of larger
bending moments will cause the Mode 1 equation to become critical.
Once this critical point is passed, corresponding to a change from a
Mode 3 to a Mode l failure, the torsional capacity decreases with
increasing bending moment.
Study of the two relevant equations (5. 25 and 5. 27) reveals that this
transition point will occur when:
l M M u
= ... 5. 21.

6. l
CHAPTER 6
WEB - REINFORCED BEAMS UNDER COMBINED
TRANSVERSE SHEAR AND TORSION. THEORY.
6. l BACKGROUND.
Torsion will almost invariably occur in association with
transverse shear. It is of some importance, therefore, to study the
failure behaviour of beams loaded in combined transverse shear and
torsion.
In the absence of torsion the mode of shear failure most likely
to occur in web-reinforced beams of normal design is the so - called
"shear-compression" failure.
The sequence of events occurring in this failure mechanism
has been described by ACI-ASCE Committee 326 as follows. (Ref.
4. 5 ):
"As the external load increases after diagonal cracking, the
web reinforcement and the compression zone continue to carry shear
until the stress in the web reinforcement has reached the yield point.

6.2
Further increase in external shear must then be resisted by the
compression zone alone. Failure occurs when the compression zone
is destroyed by the combined compression and shear stresses. "
Experiments conducted during this investigation (c. f. Chapter
3) have shown that the presence of torsion modifies this failure behaviour.
In the case of beams loaded in simple shear (T /Vb = 0), the
compression zone forms near to and parallel to the top face of the beam,
the diagonal tension cracks form only on the side faces of the beam,
while the tension crack on the bottom face is perpendicular to the
longitudinal axis of the beam (see Figure 6. 1. a.).
When the beam is loaded in combined transverse shear and
torsion at low eccentricities (T /Vb low), the compression zone moves
towards the side face of the beam on which the torsional and transverse
shear stresses oppose (see Figure 6. 1. b). The torsion also causes
diagonal cracking on both the top and the bottom faces of the beam.
When the eccentricity of the load is further increased (T /Vb
high) the compression zone covers all of the side face of the beam
while diagonal tension cracks cover the other three sides (see
Figure 6. 1. c.). This mode of failure has been described previously
( Chapter 2 and 3) and labelled Mode 2.
In the limiting case of pure torsion (T /Vb = oO ) it is possible
that the compression zone will form near the bottom surface of the
beam. This type of failure has been labelled Mode 3.
6. 2. PREDOMINANTLY SHEAR FAILURES.
a. Geometry of the Failure Surface.
The assumed shape of the failure surface for the case of
predominantly shear failures is shown in Figure 6. 2. Also shown on
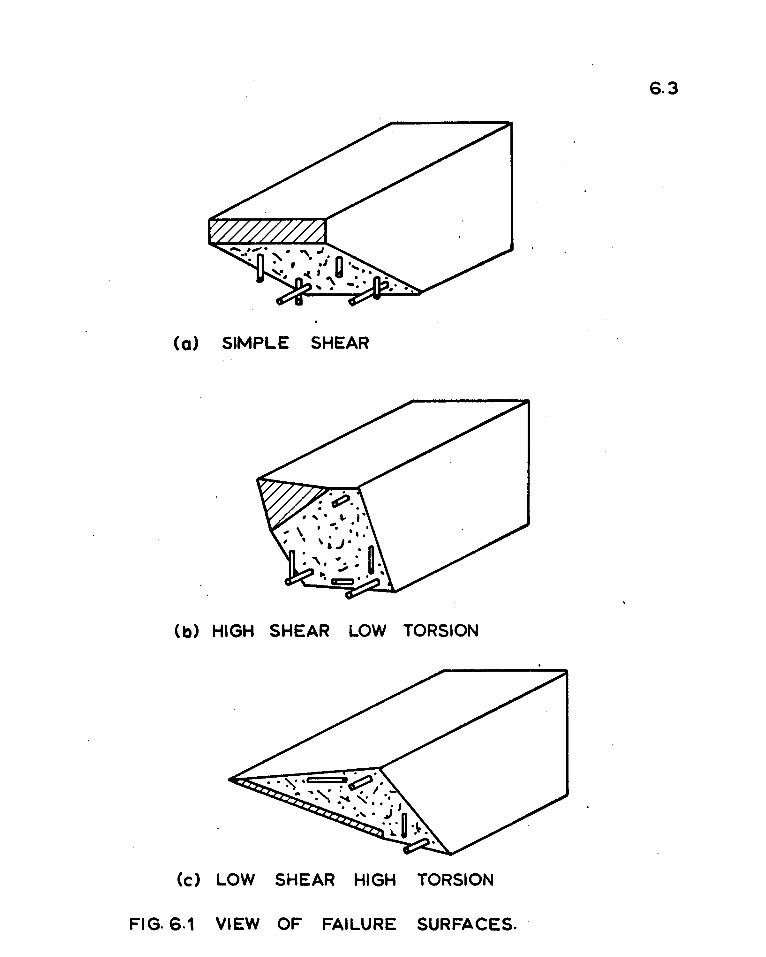
(a) SIMPLE SHEAR
(b) HIGH SHEAR LOW TORSION
(c) LOW SHEAR HIGH TORSION
FIG. 6.1 VIEW OF FAILURE SURFACES. ·
6.3

BOTTOM
EAST (T - V)
TOP
WEST
{T + V)
SIMPLE SHEAR
(a)
HIGH SHEAR PLUS
TORSION
(b)
FIGURE 6. 2. DEVELOPED FAILURE SURFACES.
Ebr
HIGH TORSION PLUS
SHEAR
( C)
0'
,i:i,.

6.5
this figure are the developed failure surfaces for the case of "simple"
shear and for a Mode 2 failure.
In Figure 6. 2, #,lJ is the portion of the top face crossed by
diagonal tension cracks, ·72, d is the portion of the side face crossed by
the compression zone, while c b is the projection of the bottom crack
onto the longitudinal axis of the beam. All three parameters, µ, "'1,
and £,. , will vary from O to 1 as the ratio T /Vb increases.
In Table 6. 1 the values ofµ for the three series of web reinforced
beams tested in this investigation have been listed. In Figure 6. 3 these
values have been plotted against the values of the ratio T /Vb. From
this diagram it can be seen that a reasonable approximation toµ would
be:
µ = T/Vb
µ = l
(T/Vb .t::.. 1)
(T/Vb ~ 1)
. . . . . . . . . 6. I.
It will arbitarily be assumed that 1l. and c. will vary in the same manner
asµ.
Thus
'l, = t = µ = T /Vb (T /Vb < 1) ........ 6. 2
~ = t,, = µ = l (T/Vb~ 1).
An end view of the failure surface is shown in Figure 6. 4. In
this figure the "shear centre" of the uncracked concrete zone has been
labelled O, and the distance of this point from the centre line of the beam
has been called d . 0
For the case of simple shear this distance will he
equal to zero while for high values of T /Vb it will be some portion of b/ 2, 2 b
say 3 2· We will assume that d varies in the same manner as µb. 0

TABLE 6.1. VALUES OFµ FOR TEST BEAMS.
Beam
Vl
Vl* V2
V2* V3
V3*
V4 V4*
V5
V5*
µ o.5 ~--
0
0
FIGURE 6. 3.
T
vb µ
0.26 0.6
0.54 0.9 0.48 0.6
1. 86 1.0
0.09 0.2 0.75 0.9
1. 37 1.0 0.23 0.5
0 0
(P 1.0
0.25 0.50
Beam
V6
V6* V7
V7*
Ul
Ul*
U2
U2*
U3
U3*
T
vb
0.14
0.88 1.40
1. 31
00
1. 82
0.24 1.00
0.58
0.35
0.75
T Vb
T VALUES OFµ VERSUS Vb.
µ Beam
0.2 Tl
1.0 TZ 1.0 T3
1.0 T4
1.0 T4* 1.0 T5
0.8 T5* 1. 0 T6
0.8 T6* 0.8
1. 0
6.6.
T
vb µ
0.85 1.0
3.50 1.0 0 0.0
0.38 0.5
0.83 1.0 0.28 0.6 00 1.0 1. 54 1.0
0.19 0.1
1. 25 1.50

8 ~d J V I 07 I
F b < w
d'
---J
FIGURE 6.4. FORCES ACTING ON EFFECTIVE
SHEAR FAIL URE SURF ACE.
6.7

6.8
Thus,
d 2 b T b T (..'.I. < 1). = 2 . = 3 . 0 3 Vb Vb Vb
. ...... 6. 3.
d b (
T :;;?:, 1). =
0 3 Vb
6.2.b. Forces Acting at Failure.
In Figure 6. 4 the forces acting on the failure surface have been
represented. (For convenience, that side of the beam on which the
shear stresses due to torsion and those due to transverse shear are
additive , has been called the west side.) Amongthe forces shown in
Figure 6. 4 are, the force exerted by the web steel on the west side,
F , the east side, F , the top, F t' and the bottom, F b' as well ww we w w as the transverse shear V , and the torque T , taken by the uncracked
C C
concrete zone.
If it is assumed that at failure the web steel crossed by the
failure surface will be yielding and if it is recalled that A is the crossw
sectional area of one leg of the web steel, f is its yield stress and s is w
the spacing, then the force exerted by the web steel on any one side of
the beam per unit length would be:
A f /s. w w
Thus if the length of the failure surface on each side is obtained
from Figure 6. 2, it can be seen that:

F = WW
A f w w s
6.9
. d
F = we
A f w w . d (1 - µ) ........ 6.4 s
F = F = wt wb
A f w w s
µb.
In the limiting case of simple shear American and Australian
design procedures relate the shear carried by the concrete, V , to co
the shear capacity of a beam not containing web reinforcement. It
would seem reasonable, therefore, to relate V and T to the load carrying C C
capacity of such a beam. In Chapter 4 it was shown that a conservative
estimate of the strength of this type of beam was:
V + 1. 6T b
= V. 0
Hence for the case of a web reinforced beam we have:
V + C
1. 6T C
b = V co
6. 2. c. Equilibrium Equations.
........ 6. 5.
The sum of the moments of the external and internal forces
about a longitudinal axis of the beam is equal to zero. For conveniencP.
the axis passing through point O will be chosen (see Figure 6. 4).
Thus,
T + d V - T = 0. 0 C

Hence,
T =T+d V-e o
A f w w s
6.10
....... 6. 6.
Substituting forµ and d , for the case of T /Vb < 1, Equation 6. 6 becomes: 0
T T + b T V - A: f w . bd [ dd I + ~ + .! b I - .! C = 3 • Vb 3 2 b 3 .1:..J .1:..
Vb Vb
6. 7.
d' b' If d and b are both taken as equal to 0. 85 then Equation 6. 7 becomes:
T C
4 = -T -
~
A f w w s
bd G- 94 _ o. 3 3
T ..•. (Vb <.. 1)
T Vb.
........ 6. 8.
The sum of the internal and external forces in the vertical
direction is equ~l to zero.
Thus,
V - V - F - F = 0. C we WW
Substituting for F and F , we ww
V = V C
+ 2 A f
w w . d -s /J
But from Equation 6. 5,
1.6 T C
b
A f w w s
........ 6. 9.
d.

Hence,
V=V +2 co
A f w w d -s
1. 6 T C
b - µ
A f w w
s
6. 11
d. 6. 10.
The shear capacity of the section in the absence of torsion, V , is 0
given by the shear capacity of the concrete plus the shear capacity of the
web reinforcement as given by the truss-analogy.
That is,
V 0
= V + 2 co
A f w w
s
Equation 5. 10 thus becomes: I. 6 T
V = Vo--b~-c - µ.
d.
A f w w s
d. ........ 6. 11.
When the expression for T as given by Equation 6. 8 is substituted into C
the above equation it becomes:
+ I. 6 A f
w w s
d T
(1.32 - 0.33 Vb)
(.!. < 1) Vb .
T Vb
This Equation can be rearranged to give:
A f T T w w (1.31 -1 + 1. 6
s. V 0.33 Vb) Vb
V 0 =
V 1 + 2. 1
T 0
Vb
T (Vb < l). . ......... 6. 12

T By a similar process it is found that for Vb ~ 1,
V V
0
=
A f d 1 + 1. 58 w w
sV 0
T 1. 53 + 1. 6 Vb
6. 2. d. Simplification.
6. 12
........ 6. 13.
The use of the above expressions for the design of beams is A f
considerably complicated by the presence of the parameter w w d, s V
0
as this implies that the torsion- shear interaction behaviour depends on
the amount of web steel in the beam.
Equations 6. 12 and 6. 13 have been plotted in Figure 6. 5 for three Aw fwd
values of the parameter s V , namely O. 3 (curve a), O. 2 (curve b) 0
and 0. 1 (curve c). These values will encompass most web reinforced
beams covered by normal design practice. Also plotted in Figure 6. 5
is the equation:
V V
0
+ 1.6T bV
0
= 1. ........ 6. 14.
It can be seen from the figure, that for the regions where a predominantly
shear failure is likely (high values of V /V ) this equation is a reasonable 0
approximation to the more complex expressions derived above.
Use of Equation 6. 14 for the case of predominantly shear failures
has the additional advantage that then the expression for beams
containing web steel would be of the same form as that for beams with
only longitudinal steel (Equation 4. 32).

6.13
1.0 I
I ·I
j
0. 8.
V+ 1. 6T = I V bV
0 0
0.6
~I 0 I
~:> I ~ ,.a
I 0.4
.J
I T
I = I Vb
0.2
I I
/
0 0.2 0.4 0.6 0.8 I. 0
V V
0
FIGURE 6. 5. ACCURACY OF THE APPIDXIMATE EQUATION FOR
PREDOMINANTLY SHEAR FAILURES.

6. 14
That is,
V+ 1.6T =V b 0
........ 6. 15.
6. 3. MODE 2 FAILURES.
A general view of the second mode of failure is shown in Figure
6. 6. Shown in this figure are the forces in side longitudinal steel,
F 1 s' the top and bottom branches of the web steel, F wt' the side branches
of the web steel, F , and the forces in the concrete compression zone, ws
C , Cf and C . S C
The length of beam which the failure surface occupies is equal to
h tan 92 {see Figure 6. 6) and some portion of this length will separate
the two forces exerted by the top and bottom branches of the web steel.
This portion will be called 't h tan 9 2 .
In the following analysis the same assumptions as were used in
the analysis of Mode 1 and Mode 3 will be employed.
6. 3. a. Equilibrium Equations.
The sum of the moments about a longitudinal axis through point
O is equal to zero.
Thus:
......... 6. 16.

b
T Fis
-A-h
Fwt
I•_ h tan 91 ~
FIG. 6.6 VIEW OF THE MODE 2 FAILURE en _,a
UI

6. 16
The sum of the moments about a vertical axis through point O is
equal to zero.
Thus,
have:
........ 6. 17.
Eliminating C from Equations 6. 16 and 6. 17 and rearranging, we C
+ F wt sin 92 {d' - 'i h),
6. 18.
As in the case of Mode 1 and Mode 3, the last term in this
equation is negligible and will be ignored. Equation 6. 18 thus becomes:
x2 {l-2b) = {Flscot92+Fws){b-a2-x2) .
. . . . . . . . 6. 19.
As x2 will be much smaller than 2b it would be reasonable to make the
conservative assumption that the term xz is negligible. 2b
So Equation 6. 19 becomes:
........ 6. 20.
6. 3. b. Magnitude of the Forces.
As in the analysis of this mode it has been assumed that the
steel crossed by the failure surface yields the magnitude of F ls will

6.17
be:
........ 6. 21.
where AL2 is the area and fL 2 the yield stress of the longitudinal steel
near the side face.
For most beams we may take:
= ½ (1 + R) ALI fLl. . ....... 6. 22.
where R = AL3 fL3
ALI fLl
Now the length of the beam over which the side branches of the
transverse steel are intercepted by the failure surface may be taken as
d' 2 b+h. h. tan 92 .
Thus,
F ws
= A f
w w s
It is assumed that:
d' b' =
h b
= cJ:...
and if it is recalled that
r = A f
w w s
d' h 2 b+h
b'
........ 6. 23.

then Equation 6. 23 may be recast to give:
F = ws
oC. r tan Q 2
2 ALI fLl. 1 + oC
6. 18
. ...... 6. 24.
If the above expressions for F and F 1 are substituted into the ws s
equilibrium expression (Equation 6. 20) the following expression
is obtained:
or
T(l+o)=
where Vb
6 = 2T .
r.oC. 2
l+r:£
r .oe. Q 2 tan 2
1 +~
6.3.c. Determination of Tan 9 2
....... 6. 25.
The inclination, Q 2 , of the failure hinge will be such as to make
the failure loads a minimum.
This means that:
d + r.oC. t 9 ]
. 2 an 2_ 1 +-cC.
It is found that Equation 6. 26 is satisfied when:
j 2 l+-tan 9 = ___!!:_
2 r oC. 1 + R
2
= 0. .... 6. 26.
....... 6. 27.

6. 19
When this expression is substituted into Equation 6. 25, we obtain the
following expression for the Mode 2 failure torque~
r oC. .. . 6. 28. T 2 (1 + 6) = ALI fLI (b - a2 - xzj
It will be convenient to assume that:
2 . 2( 1 + R).
1 + cc.
If it is recalled that:
h - a 1 = A. ,....
then Equation 6. 28 can be rearranged to give:
1 =
1 + 6
6. 4. MODE 3 FAILURES.
J 2(l+R)r 2 + oe..
......... 6. 29.
...... 6. 30.
With very high eccentricities of load it is possible for a Mode 3
failure to occur. In the previous chapter it was shown that the torsional
strength of a beam failing in this mode increases rapidly with the ratio
of moment to torque. When shear is present the moment varies along the
length of the beam and some difficulty may arise in estimating the flexural
moment acting on the failure mechanism. As all the specimens tested
in this investigation were simply supported in bending and subjected to
constant torque along the shear span an explicit formula for this
situation will be derived.

6.20
The length of beam which a Mode 3 failure surface occupies is
equal to b. tan 93 . As the strength of the beam in this mode is increased
with increasing moment the failure will occur as near to the support as
possible. It therefore follows that the distance of the centre of the
failure surface from the support will be½ b tan 93 . The moment at this
point will be of magnitude V. ½ b tan 0 3 and so the value of the ratio T / M
will be:
4' T = V ½ b tan 93
1 = 6. tan 93·
......... 6. 31.
This value for ~ can be substituted into the equilibrium
equation for the Mode 3 failure (Equation 5. 18). Following the same
steps as before the equation for the failure torque is obtained. This is:
= _2_ ~ 1 - 6 ./ l+20f ....... 6. 32.
6. 5. TRANSVERSE SHEAR - TORSION INTERACTION.
For the purpose of studying interaction behaviour, the Mode 2
equation may be recast. Thus Equation 6. 30 can be written as:
V 2T + -b
= 2M
u b ~) 2(1 + R) r
2 + ~ .
Likewise the Mode 3 equation can be written:
2T b
- V = 4M
u b
j r. R 1 + 20C..
..... 6. 33.
........ 6. 34.

6.21
EFFECTIVE
SHEAR MODE -~
TRANSVERSE SHEAR
FIGURE 6. 7. SHEAR-TORSION INTERACTION FOR WEB REINFORCED
BEAMS.

6.22
It will be recalled that the equation for effective shear failures was
V + 1.6 T b
= V. 0
....... 6. 35.
For any given beam the right hand sides of the above equations
will be constants, and so it can be seen that the shear-torsion interaction
behaviour will be made up of three linear parts. To demonstrate this
point the interaction diagram for a typical beam has been given in Figure
6. 7. It has been assumed that in the absence of torsion this beam will
fail in shear (Mode 1 not critical) and in pure torsion the beam will
fail in Mode 3 (R < 1). It will be seen that the shear-torsion interaction
diagram is composed of three straight lines. These correspond to
Equations 6. 33, 6. 34 and 6. 35.

CHAPTER 7
EXPERIMENTAL VERIFICATION OF THE THEORY
FOR WEB REINFORCED BEAMS
7. l. INTRODUCTION.
7.1
Reliance can be placed on any theory only if experimental
verification can be supplied. In this chapter a comparison will be made
between the behaviour predicted by the equations derived in the last two
chapters and the observed behaviour of test beams. An appropriate
method of making this comparison is to examine the ratio of maximum
load obtained in any test to the load predicted by the theory presented in
earlier chapters e. g. T /T h . This ratio should ideally be exp t eor
greater than or equal to unity. For this purpose the results obtained
in this investigation as well as those reported in the literature will be
employed. A brief summary of all experimental results is given in
Appendix B.
In the derivation of the analysis equations it was assumed that
web steel crossed by the failure surface yielded at failure. Further, in

7.2
the case of Mode 1, 2 or 3 it was assumed that the longitudinal steel
also yielded. If the beam contains excessive amounts of steel7 failure
may occur before yield of the steel and in this case the analysis equations
may lead to unconservative results. Limits must therefore be placed
on the range of validity of the theory to exclude these cases.
7. 2. LIMITATIONS ON THE STEEL.
a. Excessive Transverse Steel.
If the amount of web steel is increased a stage is eventually
reached where crushing of the concrete on the sides of the beam precedes
yielding of the reinforcement. In the case of transverse shear without
torsion this limit is often expressed in terms of the nominal shear stress.
e.g.
V bd
It is suggested that an appropriate limit for the case of combined
transverse shear and torsion would be:-
veff bd
= V + 1.6 T/b ~ bd -r 8~ ........ 7. l
In Figure 7. 1 the parameter T /Tth , which is a measure of exp eor V
the accuracy of the theory, is plotted against eff bd~
C
(The values of T /Tth for the various beams are listed in Appendix D). exp eor
It can be seen that for high values of the nominal "shear" stress, that is
for excessively reinforced beams, the theory predicts failure loads in
excess of the experimental values. Further it can be seen that if the

c.:
2.0
1. . I
1.
1.0
I
I
2 .c. a ._... B
" ci. X
I-CJ
• • + ' + . . _, -t-. _;~
• X I 11 ~ ex • • o. •
..... • 1·
• ,-
• I
'* -1- • + . •. J ~ .,,,._!_, .. _ ~-: ~ j
·~¼. I I •• a-;-:-a .... 0 ••••
0. _,, THIS INVESTIGATION • EVANS e
ERNST 0 YUDIN -L I
GESUND ET AL • LYALIN * CHINENKOV X COWAN 0 LESSIG +
t I -i- -i-
I I _i_i_
.
• . .,.
• +
• + + 1+
• +
00 2 4 6 8 10
VALUES· OF Vetf.
bd.J?;"
f
+ • -~ ~ .... • • ••• • I • • ..
• + •
+
12
FIG. 7, 1 · THE EFFECT OF THE NOMINAL SHEAR STRESS ON THE ACCURACY OF THE THEORY.
14
=" C,J

7.4
limitation implied by Equation 7. 1 is employed the majority of the
unconservative results are eliminated.
7. 2. b. Excessive Longitudinal Steel.
Lessig (Ref. 2. 27) reported that test specimens containing
excessive amounts of longitudinal reinforcement failed prior to yield of
the reinforcement, with crushing of the concrete near the top surface.
Consideration of the equilibrium of forces in the longitudinal direction
suggests that an appropriate criterion to eliminate this type of failure
would be the criterion often used in flexural design. That is:
ALI fLl - AL3 fL3
bd f' C
f' 0.4. . ....... 7. 2.
All beams tested during this investigation were designed to
satisfy the above criterion.
7. 2. c. Longitudinal Steel out of Proportion to the Transverse Steel.
In the development of the analysis equations for Modes 1, 2 and 3
it was assumed that both the longitudinal and the transverse steel yielded
at failure. However, tests in which the strains of the steel have been
measured (Ref. 2. 19 and 2. 28) show that for low values of the ratio
"amount of transverse steel" to "amount of longitudinal steel" (a
measure of this ratio is the parameter r) the longitudinal steel may not
yield. An investigation must thus be made of the range of r for which
the equations for Modes 1, 2 and 3 will be valid. As this range will
depend on the factors o:., and 'tJ a parameter r O incorporating these
factors is introduced. The value of the parameter r corresponds to 0
a desirable design value of the ratio r for given values of c;:. and 'Y . The value of r may be calculated from the equation below.
0

r = 0 4 +
1 4
4' Jl+2oc
The derivation of this equation is given in Appendix C.
7.5
....... 7. 3
In Figure 7. 2 the parameter T /Tth is plotted against r/r exp eor o
where r is the actual value of r for the test beam and r is the optimum 0
value of r as given by Equation 7. 3. Only those beams which were
governed by Modes l, 2 or 3 were used in the preparation of this figure
( see Appendix D). Further Figure 7. 2 does not include results of tests
where failure may have been initiated by crushing of the concrete (i. e.
those beams not satisfying Equations 7. 1 or 7. 2).
It will be noticed that for low values of r / r there is a wide 0
scatter of experimental points, but the theory is still generally conservative.
In this range, corresponding to beams with relatively small amounts of
transverse steel, the idealised modes of failure are no longer applicable.
Factors ignored in the development of the analysis equations, such as
tensile stresses in the concrete and dowel forces exerted by the steel,
are now of considerable importance. As the errors thus introduced
offset the usually smaller error involved in the assumption that the
longitudinal steel yields, the analysis equations still give usable, if not
completely reliable, results. For values of r/r greater than 0. 9, the 0
theory is both consistent and accurate. It is concluded that the
analysis equations should only be applied when:
r r
0
0.9. . ...... 7.4.

2.0 I ~ 1-
0
0 . I 0
~ 1-, • • 1.61 • l X0..!~- e • I X~ I .. ~ I L 0 4) s:;
,-!' 1.21 • o 010 o'it- x •• I ·><xr • I ' I -I •
" . . _,
<Z>~ §) I 0 ... _ 0 I 0 ~ Q ~ 1.0
~4' I I eol I I+ 1· + 08
~ V)
~ 0.41 j I ~, THIS INVESTIGATION • EVANS (:)
ERNSt· 0 YUDIN I -i-
,._jd GESUND ET AL • LYALIN • CHINENKOV X COWAN 0 LESSIG +
0 :--, 05 1.0 1.5 2.0 2.5 3.0 15 4.0 0)
VALUES OF ~/r0
FIG. 7., 2 THE EFFECT OF THE PARAMETER r/rtJ ON THE ACCURACY OF THE THEORY.

7.7
7. 3. INTERACTION OF BENDING AND TORSION.
For any theory of combined bending and torsion to be considered
satisfactory one should require, in addition to values of T / Tth ~ 1, exp eor ~
that the theory correctly predicts the effect of flexure on
torsional strength.
In Chapter 5 it was shown that for the most common mode of
failure (Mode 1) the flexure-torsion interaction equation predicted by
the proposed theory was:
M + M
u = 1. ....... 7. 5.
This form of interaction is illustrated in Figure 7. 3, where a
comparison has been made with the available experimental results for
which Mode 1 was critical (see Appendix D). The tests reported in
Figure 7. 3 are those which were subjected to uniform bending and
torsion along the failure length and which satisfy the restrictions
imposed on the theory (Equations 7. l, 7. 2 and 7. 4). It can be seen
from the figure that the theoretical interaction curve forms a
satisfactory lower bound to the experimental results. In particular
it can be observed that the theory correctly predicts the substantial
decrease in flexural capacity induced by the application of torsion and
vice versa,
Beams which contain more bottom than top longitudinal steel
(R ~ 1) and which are loaded predominantly in torsion, may fail in
the manner referred to as a Mode 3 failure. The interaction equation
for this type of failure was derived in Chapter 5 as :
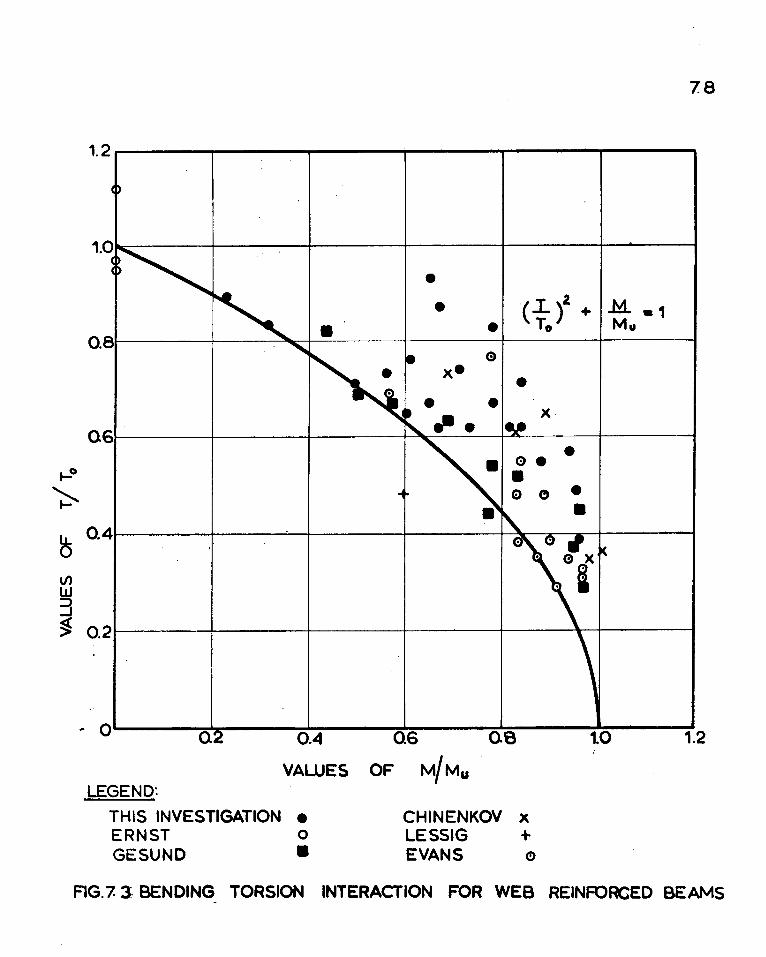
7.8
1.2--------------i.-----------~--~
• • {J_ t + .M. • 1
• To M11 0.8
(:) x• • • X
06 • ~o
~ • • ~
0.4
V) w 3 ~ 0.2
~ 0 a 0.4 06 08 1.0 1.2
VALUES OF M/Mu LEGEND:
THIS INVESTIGATION • CHINENKOV X ERNST 0 LESSIG + GESUND • EVANS (!)
FIG.7. 3- BENDING TORSION INTERACTION FOR WEB REINFORCED BEAMS

q )2
0
M M
u
7.9
= R. ....... 7. 6
This equation predicts that for this type of failure the torsional
capacity will be increased by the presence of flexural moment.
To test the above equation a series of test beams which contained
more bottom than top longitudinal steel (RU series) were tested. The
results of these tests are compared with the theoretical expression in
Figure 7. 4. It is seen from the figure that for beams of this type the
ultimate twisting moment is increased by the addition of bending moment
up to some critical value as predicted by the Mode 3 equation. Further
that the portion of the torsion-bending interaction diagram corresponding
to Mode 3 behaviour forms a lower bound to the test results.
7. 4. INTERACTION OF TRANSVERSE SHEAR AND TORSION.
In the previous chapter it was shown that for a beam which in the
absence of torsion fails in transverse shear, and which has less top than
bottom longitudinal steel, the theoretical shear-torsion interaction
diagram is composed of three straight lines ( see Figure 6. 7).
To compare the theoretical predictions with an experimentally
obtained interaction diagram the V series of beams was tested. The
results for the series of tests have been plotted in Figure 7. 5, the
ordinates representing the twisting moment T and the abscinae the
shear force V. The three straight lines corresponding with the
theoretical torsion-shear interaction for these beams have also been
drawn on this graph. It will be seen from this figure that as these
beams contained less top than bottom longitudinal steel they failed
in Mode 3 (Equation 6. 34) when loaded predominantly in torsion. Further

1°20
100
80
i:: ..... . .e- 60
,!rid -E-4
40
20
G)
0 40 80 120 160 200 M (kip. in.)
FIGURE 7. 4. BENDING-TORSION INTERACTION FOR RU SERIES.
240 280 320 -...J -0

100
80 I / - 1V1Ul.JJ:!, > ~
I I 60
-i::
•r-1
p.. •r-1 ..!:tl 40 -E-t
20 I I
0 5
~ I
I
I
10
01 ,; ..,
MOOE 2
~i
I EFFECT!'
MODE
I
15
V (kips.)
-
.7'. 0
- - -
I
20
FIGURE 7.5. SHEAR-TORSION INTERACTION FOR V SERIES.
0
"l ®
25 30
-.J
......
......

7. 12
as they failed in transverse shear in the absence of torsion the effective
shear mode was critical for low values of torsion. (In plotting Equation
6. 35 the observed value of V was employed.) It can be seen from 0
Figure 7. 5 that the observed interaction behaviour agrees fairly well
with the theoretical predictions.
If a beam fails in flexure rather than transverse shear when
torsion is absent, then for low values of torsion the failures will be
flexure-torsion (Mode l) rather than shear-torsion failures. The
flexure-torsion interaction equation has been given in the previous
section as:
+ M M
u = 1,
where T is the pure torsional strength in Mode 1. 0
Because of the loading arrangement used, i. e. one and two
point loading1it is possible, for the beams tested in this investigation,
to relate the moment applied to the transverse shear force.
Thus,
M = V. a
where a is the shear span. The flexure-torsion interaction equation
can thus now be changed to a shear-torsion interaction equation.
+ V. a M
u = 1. . . . . . . . 7. 7.
Equation 7. 7 has been plotted in Figure 7. 6 for the T series of
beams (these beams failed in flexure in the absence of torsion). Also
plotted in this figure are the Mode 3 and Mode 2 equations for these

7. 13
100
0
0 80
60
s:: •.-t
. 0..
•.-t 40 .!:I.:
~
20
MODE l-4-
0 5 10 15 20 25
V (kips.)
FIGURE 7. 6. SHEAR-TORSION INTERACTION FORT SERIES.

7. 14
beams, as well as the observed test results. It will be seen that the
equations correctly predict the trend of the experimental results.
7. 5. ACCURACY OF THE ANALYSIS EQUATIONS.
In the preceding sections of this chapter it was shown that the
theory presented in Chapters 5 and 6 could accurately predict flexure
torsion and shear-torsion interaction behaviour. Further it could be
seen {c.f. Figure 7.1 and 7. 2) that within the restrictions imposed the
accuracy of the theory was not significantly effected by the amount of
web steel in the section or by the ratio of longitudinal to transverse
steel. The theory must therefore be regarded as satisfactory in
predicting the qualitative effect of various parameters on the behaviour
of the beams .
To test the "quantitative" accuracy of the theory, advantage has
been taken of the large number of test results reported in the literature.
In fact, in this analysis no distinction will be made between the results
of this investigation and the results reported in the literature.
A summary of the available test data is presented in Appendix
B. The range of parameters encompassed by the 249 test results
listed in this appendix is given in Table 7. 1. All of these test results
have been analysed by equations derived in Chapters 5 and 6 and a summary
of this analysis is given in Appendix D.
The equations employed in the analysis were:-

7. 15
TABLE 7.1. RANGE OF PARAMETERS COVERED BY AVAILABLE
TEST DATA.
Parameter Minimum Maximum
h/b 1.0 2.4
f' 680 p. s. i. 8,500 p. s. i. C
ALlfL1-AL3fL3 0.0 1.0
bd f' C
r 0.10 5.89
r 0
veff
bd~ 1.1 13.5
C
4-' 0.02 oO
6 0.0 4. 1

Mode l Eqµation (c. f. Equation 5. 14.)
2 r =
l + 20C. +
Mode 2 Equation (c.f. Equation 6.30)
1 + 2oC r
= 1
1 + 6 oC J 2(1 + R)r
(3 2+0C
Mode 3 Equation (c. f. Equation 5. 21)
2 r =
1 + 2oC.
or (c. f. Equation 6. 32)
= I: 6 / I:·: Effective Shear Equation (c. f. Equation 6.)
V + 1. 6 T
=V b 0
or bV
T 0
= 1. 6 + 26
1 - -) 'Y
7.16
...... 7. 8.
...... 7. 9.
...... 7. 10.
...... 7.11.
...... 7. 12.
Those test results which satisfied all of the restrictions imposed on
the theory (Equations 7. 1, 7. 2 and 7. 4) have been presented in Table 7. 2.
The table has been subdivided into three sections; pure torsion, bending
and torsion, and bending, torsion and shear. When the failure load was

TABLE 7. 2
A COMPARISON OF EXPERIMENTAL RESULTS WITH THE PROPOSED THEORY FOR WEB REINFORCED BEAMS
PART 1 - PURE TORSION
Investigator Beam Torque Moment Shear T
exp
7. 17
Mode kip. in. kip. in. kips T
theor
3TR15 61. 7 0.0 (). () 1. 12 l
Ernst 3TR30 76.0 0.0 0.0 0.97 1
4TR30 85.0 0.0 0.0 0.95 1
Evans HBl 44. l 0.0 0.0 1. 15 3
BKl 121. 0 0.0 0.0 0.98 2 Lessig BKlA 104.0 0.0 0.0 0.87 2
-Mean 1.01
Standard Deviation 10°/o
No. of Tests 6

7. 18
PART 2. BENDING AND TORSION
Investigator Beam Torque Moment Shear T
Mode ~ kip. in. kip. in. kips. T
theor
R4. 20 59.9 331. 0 0.0 1. 15 l
R4.24 56.5 264.0 0.0 0.96 l R3. 20 50.7 252.0 0.0 1.08 1
R3. 24 53.7 230.0 0.0 L 03 1
R3. 30 61. 6 207.0 0.0 1. 02 l
R2. 24 44.2 205.0 0.0 1. 24 1
Walsh R2.30 49.7 176.0 0.0 1. 18 1 R2. 38 53.4 138. O 0.0 1. 06 I
Rl. 30 41. 8 146.0 0.0 1. 07 1 REI 81. 4 6.3 0.0 0.88 2 RE2 83.5 32.0 0.0 1. 01 I
RE3 81. 5 45.0 0.0 1. 01 ]
RE4 74.6 84.4 0.0 1. 12 l
RE5 66.0 108.2 0.0 L 16 l
RE4* 38.0 134. 0 0.0 1. 10 1
RU3 105.0 84.0 0.0 1.26 3 This RU3A 89.4 149.3 0.0 1.00 1
Investigation RUZ 84.9 51. 1 0.0 1. 11 3 RU5 75.4 249.7 0.0 1. 17 1
RU5A 68.3 266.8 0 .. 0 1. 14 1
RU6 59.1 281.2 0.0 l. 15 l 36T4 62.6 240.4 0.0 1. 21 1 36T4C 94.1 61. 1 0.0 1. 23 3 36T5. 5 85.9 173. 4 0.0 1. 32 1
77T5 91. 6 262.4 0.0 1. 31 l
77T4 107.6 223.4 0.0 1. 26 l 24T3 70.8 46.6 0.0 0.92 2
1 79.0 79.0 o.o 1. 07 1
2 102.0 102.0 0.0 1. 01 1
3 61. O 122.0 0.0 1.06 1
Gesund 4 67.0 134.0 0.0 0.96 i d
Schuette 5 49.0 147.0 0.0 1.08 l
Buchanan 6 56.0 168.0 0.0 1. 08 l
and 7 43.0 173.0 0.0 1. 14 1
Gray 8 44.0 176. O 0.0 1. 05 1
11 68.0 138.0 0.0 0.98 J 12 53.0 213.0 0.0 L 06 I

7. 19
PART 2. BENDING AND TORSION (contd.)
Investigator Beam Torque Moment Shear T
Mode ~ kip. in. kip. in. kips. T
theor
HB2 33.9 66.8 0.0 1. 25 l HB3 20.4 75.3 0.0 1. 10 1 HB4 15.7 81. 6 0.0 1.05 l HB5 13.2 81. 5 0,0 l. 06 1
Evans HB8 21.4 79.6 0.0 1.05 1 and HB9 18.3 85.l 0.0 0.98 1
Sarkar HBl0 17.3 91. 3 o.o 0.99 ]
HBll 14. l 94.0 o.o 0.99 l HB14 41. 7 82.1 0.0 1. 03 1 HB15 29.9 111. 0 0.0 1.11 l HB16 23.5 129.0 0.0 1.05 1 HB17 19.4 137.0 o.o 1. 06 l
B28 0. l 48.6 486.0 0.0 1. 12 1 B28 0. lA 46.9 469.0 0.0 1.09 l
Chinenkov B28 0. 2 83.4 417.0 o.o 1. 14 I B28 0. 2A 83.4 417.0 o.o 1. 23 1 B28 0. 4F 139.0 347.0 o.o l. 15 I
Lessig BU6 69.5 173.6 0.0 0.87 1
Mean 1. 10
Standard Deviation 9°/o
No. of Tests 55

7.20
PART 3. SHEAR AND TORSION
Investigator Beam Torque Moment Shear T Mode ex:e
kip. in. kip. in. kips T theor
RU4 85.5 145.0 4. 13 1.21 3V
Walsh Rl. 30A 42.6 97.l 4. 13 0.89 VEF R3. 20B 59.0 78.9 3.41 1. 19 3V
V3 16.9 685.0 27.80 1. 65 VEF V6 24.8 668.0 27.20 1. 72 VEF
This U2 43.9 689.0 28.00 L53 VEF
Investigation U3* 66.2 720.0 29.30 1.80 VEF T4 53.0 523.0 21. 40 1.54 2 T5 63.4 432.0 17.70 1. 52 2 T6* 29.4 584.0 23.90 l. 36 VEF
6 4.6 45.7 2.32 l. 01 l 10 5.9 59.0 3.00 1. 31 l
Yudin 11 14.3 71. 7 3.65 l. 66 l 12 11. l 55.7 2.83 1.29 l 13 11. l 55.7 2.83 1. 29 1 22 6.5 32.6 l. 66 1. 28 1
BIII5 156.0 416.0 15.56 1. 40 2 BIII5A 151. 0 416.0 15.52 1. 33 1 BIII6 92.0 156.0 4.07 1. 31 l BIII6A 83.4 156.0 4.16 1. 27 1
Lessig BIII7A 90.4 313.0 8.06 1. 37 1 Blll7 83.4 278.0 7.16 1. 24 I BIII9 78.0 313.0 4.63 1. 50 1 BIT 19A 79.0 313.0 . 4.71 1. 59 1

PART 3. SHEAR AND TORSION (contd.)
Investigator Beam
B8 O. 1 B8 O. IA B8 O. 2A B8 O. 4A B7 O. 2 B7 O. 2A BlO 0. 2 BlO O. 2A Bl
Lyalin BlA B2 B2A B3 B3A BS BSA B6 B6A
Torque Moment Shear kip. in. kip. in. kips
52.0 520.0 12.52 55.5 555.0 13.36 97.0 486.0 11. 69
139. 0 347.0 8.38 93.8 468.0 11. 30 90.2 451.0 10.87
104.0 521.0 12.53 104.0 521. 0 12.53 90.3 452.0 10.82 90.3 452.0 12.75
139.0 694.0 16.65 139.0 6~4.0 16.65 194.0 486.0 17.48 194.0 486.0 17.48 194.0 972.0 23.24 194.0 972.0 23.24 167.0 833.0 20. 19 181. 0 903.0 21.88
Mean
Standard Deviation
No. of Tests
Summary of All Tests
Mean
Standard Deviation
No. of Tests
L 18 0
15 /o
103
7.21
T ModE ~
T theor
1.11 1 1.11 1 1. 20 1 1. 16 VEF 1. 31 VEF 1. 22 VEF 1. 26 l 1. 23 l 1. 33 l 1. 29 l 1. 29 l 1. 22 1 1. 25 VEF 1.24 VEF 1.22 l 1. 31 l 1. 31 1 1. 43 l
1. 33
13°/o
42

7.22
governed by Equation 7. 8 the mode has been designed as 1, similarly 2, 3,
3V and VEF refer to Equations 7. 9, 7. 10, 7. 11 and 7. 12 respectively.
It can be seen from the first part of Table 7. 2 that good agreement
between the experimental results and the predicted failure loads is
obtained for beams tested in pure torsion. The values of T /Tth exp eor
have a mean of 1. 01 and a coefficient of variation of 10°/o.
Examination of Table 7. 2 shows that the proposed theory accurately
predicts the ultimate strength of members loaded in combined bendbg and
torsion. For this case T / Tth has a mean of 1. 10 and a coefficient exp eor
of variation of 9°/o.
For the case of combined bending torsion and shear the mean value
of T /Tth is 1. 33 and the coefficient of variation 13° / o. To a large exp eor
extent this result reflects the conservative nature of the A. C. I. equations
which were used to predict the simple shear strength. When a more
accurate expression for the shear capacity of web reinforced beams is
derived and becomes generally accepted, the accuracy of the theory for
shear combined with torsion and flexure can be improved.
In Figure 7. 7 a frequency histogram of the accuracy of the theory,
for the 103 web reinforced beams which satisfy the restrictions, has been
drawn. It may be concluded from this figure that the proposed theory is
sufficiently accurate for safe and efficient design of structural members
to resist combined torsion, bending and shear loads.
7. 6. SIMPLIFIED ANALYSIS PROCEDURE.
In the following chapter the analysis equations will be rearranged
into a form suitable for rapid design. Considerable simplification of the
design procedure results if the equation relating to Mode 2 failures is

Q. ::,
15
e 10 (!)
C
II) ~ II)
t! 0
~ E ::, z
5
0
-- -
~
-
---I
0.8 1.0
Mean
Standard Devn.
- N8 of Tests
- ,-
-
1.2
Texp./ Ttheor.
-
n n 1.4 1.6
7.23
1.18 15 °/o 103
-n n
1.8
FIG. ,. 7 FREQUENCY HISTOGRAM FOR THE ACCURACY OF
THE THEORY FOR WEB REINFORCED BEAMS
WITHIN RESTRICTIONS

7.24
TABLE 7. 3. THE EFFECT OF IGNORING THE MODE 2 EQUATION.
T /T exp theor.
Investigator Beam l* 2*
This Investigation. REI 0.88 0.85
24T3 0.92 0.90
T4 1. 54 1. 50
T5 1. 52 1. 45
Lessig BII 15 1. 40 1. 35
l* Equations 7.8, 7.9, 7.10, 7.11 and 7.12 used
in evaluating T h t eor.
2* Equations 7. 8, 7. 10, 7. 11 and 7. 12 used.

7.25
ignored. If Table 7. 2 is examined it will be seen that the occurence of
Mode 2 failures is rare. Further if these beams are analysed by
ignoring the Mode 2 equation little loss of accuracy results. This
result can be seen in Table 7. 3, where the values of T IT h exp t eor,
for those beams failing in Mode 2, have been calculated in two ways;
by using all four equations and by using only the three equations pertaining
to Modes 1, 3 and Effective Shear.
In view of this result the Mode 2 equation will not be considereed
in the development of the design method.

CHAPTER 8
DESIGN OF BEAMS SUBJECT TO TORSION
8.1. INTRODUCTION.
8. 1
The theory developed in the foregoing chapters can be used to design
beams subjected to combined bending, torsion and shear. For this purpose
it is advantageous to rearrange some of the equations. In particular, the
form of the equations dealing with the analysis of beams containing web
steel and loaded in bending and torsion is not suitable for design. With
some modification and re-arrangement, however, straight forward design
procedures result.
8. 2. DERIVATION OF DESIGN EQUATIONS FOR WEB REINFORCED
BEAMS.
Provided that sufficient top longitudinal steel is present the failure
torque of a web reinforced beam loaded in bending and torsion is given by

8.2
Equation 5.14. That is
T Zr cJ <!>2 1 + 2d'. 1
= + - -) M 1 + 2~ r 'fl
. . . . . 8. 1 u
A f b'
where w w
r = s ALlfLl
..... 8. 2
The given bending moment and torque (i.e. T and 'V are known)
can be resisted by many different beams. As is usual in de sign a choice
is first made of some parameters, and the remaining dimensions are then
determined to satisfy the basic equations.
The parameter r may be chosen from within a wide range of values.
This means, physically, that there is a good deal of choice as to how the
load is shared between the longitudinal and the web steel. The design
can be considerably simplified, however, if r is chosen as an "optimum
value" r , w.hich gives something approaching a minimum volume of steel 0
(see Appendix C). This value is given by:
1 r =
0 4 + 4/(q, ../1 + 20: ) . ..... 8. 3
If this value is substituted for r in Equation 8. 1 and if for
convenience we write A 2 = 1 + 2oC. then we obtain:
~D -~ T 1 ( !. )2 4A
4 A 2 -- = + -- + M
2~...2 'I' ~ u + 4' -
1 =
:l ~ .!. ~
1 M =T(.i\.+-)
u 'f'
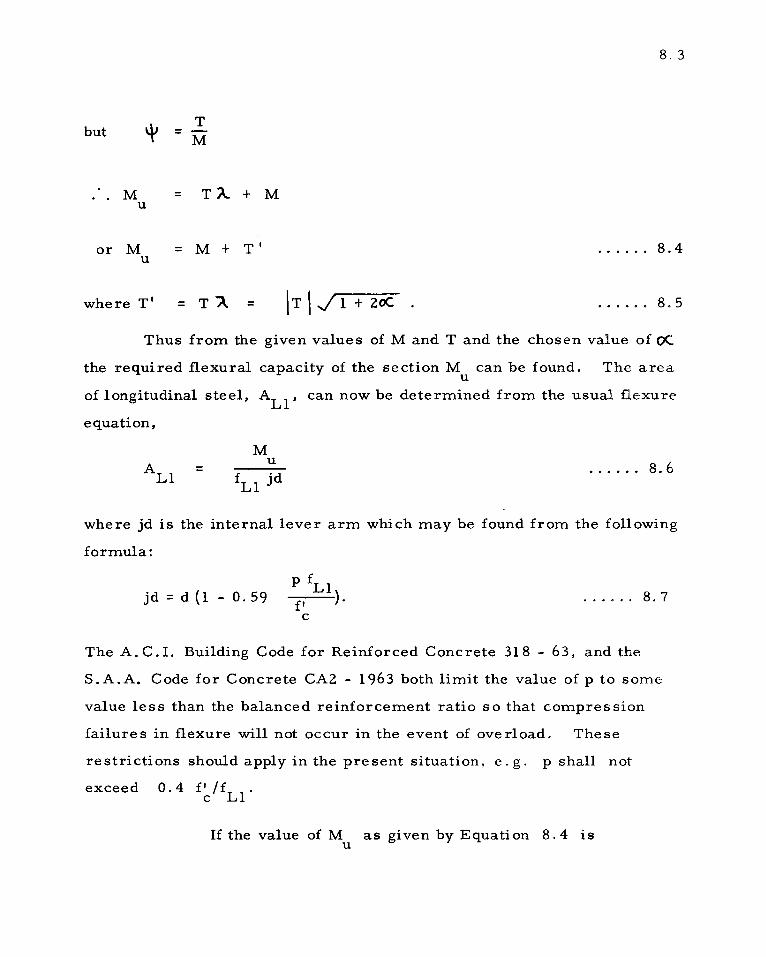
but T
= M
M = T:il. + M u
or M u
where T'
= M + T'
= T-;\. =
8. 3
...... 8. 4
. . . . . . 8. 5
Thus from the given values of M and T and the chosen value of OC.
the required flexural capacity of the section M can be found. The area u
of longitudinal steel, ALI, can now be determined from the usual flexure
equation,
M u
= . . . . . . 8. 6
where jd is the internal lever arm which may be found from the following
formula:
jd = d (1 - o. 59 p fLl ft ) . ...... 8. 7
C
The A.C.I. Building Code for Reinforced Concrete 318 - 63, and the
S.A.A. Code for Concrete CA2 - 1963 both limit the value of p to some
value less than the balanced reinforcement ratio so that compression
failures in flexure will not occur in the event of overload. These
restrictions should apply in the present situation, e. g. p shall not
exceed O. 4 f~/ fLl.
If the value of M as given by Equation 8. 4 is u

substituted into Equation 8. 6 we obtai.n:
M =
T' + fLl jd
8.4
8.8
A certain ratio of transverse to longi.tuclinal steel has already
been chosen (r = r ) and thi.s rati.o fixes the amount of transverse steel 0
required.
Wi.th r = r , r given by Equation 8. 2 and r by Equation 8. 3, the 0 0
following relation is obtained:
A f w w b'
= s
=
=
But from Equation 8. 8:
A f b' w w = s ALl fLl
and so:
A T's = w 4b' jd f
w
1
4 + _!_ If.I>.
T ;t 4(T + M)
T' 4(M + T').
T'
4 ALl fLl jd ,
....... 8. 9
Top longitudinal steel must be provided. It may be required to
prevent a Mode 3 failure, and : f not a nominal amount must in any case
be provided to support the hoops.
In Chapter 5 it was shown that the transi.tion from a Mode 1 to a
Mode 3 failure occurs when:

M M
u = ¼ (1 - R).
Thus a Mode 3 failure will not be critical if:
R;;, l _ 2M M
u
and M = M + T' u
= 1 2M
=
For design purposes:
hence
AL3 =
M + T'
T' - M
M+·T1
T' - M
jd fLl l
8.5
. • . . . . 8. 1 0
To prevent a shear and torsion failure it is necessary to design

the beam to resist an effective shear of:
V eff = V + 1.6T
b
If the A.C.I. code is employed this means:
V + 1. 6T b
= 2 bdµ_ + C
8 bd_r-;;: C
2A f w w
s d
where A is the area of one leg of the hoop reinforcement. w
8.6
...... 8. 11
Little information is available to assist the designer who wishes to
use bent-up bars to provide the shear strength. In fact, as far as the
writer is aware, no tests have ever been performed on beams loaded in
shear and torsion which contain bent;...up bars. However, a reasonable
approach would be to calculate the shear capacity of bent up bars which
are being employed and then to design stirrups for the remaining transvers~
shear together with the twisting moment expressed as an effective shear
force 1. 6 T /b.
8. 3. DESIGN PROCEDURE.
The design of a beam either with or without web reinforcement and
loaded in torsion combined with bending and shear may be carried out in
the following manner. T, M and V are the desired ultimate capacities in
torsion, flexure and shear.

Rule 1.
Rule 2.
Rule 3.
and
where
Rule 4.
8.7
The beam must be proportioned to resist an effective shear
force V eff where:
V eff 1. 6.T
= V + b .
If web reinforcement is not required to satisfy Rule 1, i.e.
if V eff ~ 2 bd f~, ~t is necessary to provide only
sufficient bottom longitudinal steel to resist M. That is:
M =
fLl jd.
If web reinforcement is required to satisfy Rule 1, then both
top and bottom longitudinal steel must be supplied:
= T' +M
fLl jd
T' - M
fLl jd
If web reinforcement is required to satisfy Rule l then a
minimum amount must be provided. This minimum is

or
given by the greater of:
A w
T 1·s =
A = w
4b' Jdf w
where A is the area of one leg of the hoop reinforcement. w
8. 4. DESIGN EXAMPLE.
8.8
The use of the above rules will be illustrated in a de sign example.
A spandrel beam, which is fully restrained at both ends, is
eccentrically loaded by a secondary beam. Figure 8.1 shows the
bending moments, twisting moments and transverse shear forces
present in the beam when the desired ultimate. load of 40 kips is acting
at an eccentricity of 5 inches.
It is desired to use a web reinforced beam and for the purposes
of this example the following choices have been made,
f' C
= 3, 0 00 p. s. i.
= f = 33,500p.s.i. w
It will be assumed that the width of the beam is 10 11 •
Rule 1.
Rule 2.
veff = V + 1. 6T
b
= 36 kips.
= 20+ 160 10
As web steel is being used Rule 2 does not apply.

~ <
1,440 kip. in.
40 kips.
l 24 1-011
1,440 kip.in.
BENDING MOMENTS
J 8.9
1,440 kip. in.
~::mJIIIJJIJJ[IIJlllll!lj. · , .
111111111111111 r 1111 ~~~. in.
TWISTING MOMENTS ..
~ps _ 11111111111111 1 11111 I _ . .. I I 111 I 1111111 I I l I I I [ 20 kips·
TRANSVERSE SHEAR
FIGURE 8.1. ECCENTRICALLY LOADED SPANDREL BEAM.

Rule 3.
Footnote:
Try h/b = d: = 2
= 224 kip. in.
Thus the greatest value of:
M + T' = 1440 + 224
= 1663 kip. in.
If p is chosen as 0. 015 (see footnote) then:
= (1-0.59.l(0.015JC33.5) = j 3
2 Now bd =
=
M + T'
p.j. fLl
1663 0.015x0.9x33.5
0.90.
= 3,680 in 3 .
Thus if b = 1011 , d = 19.5 11 and soh = 21.5 11 •
ThereforeoC.= h/b = 21.5/10 =2.15.
We now recalculate T' using the more exact value of d:..
T' = l 00 J 5. 30 = 230 kip. in.
Thus T' + M = 230 + 1440 = 1670 kip.in.
8.10
The value of p employed in the ultimate strength method of design for
flexure can vary within wide limits. In choosing any particular vah .. e-,
attention should be giv;en to the effect on deflections as well as economy.
In general it will be found economical to employ a value of p somewhat
greater than that indicated for balanced design by the permissible: stress
method (Ref. 8.1).

2 and so bd
Hence b = Now,
ALI
Similarly:
1670 =
1663 X
1011 and d =
=
=
T' +M
fLl jd
T' + M 588
T' - M 588
8.11
3680 = 3,700 in3
19.511 are satisfactory.
T' + M ....... 33.5JC 0. 9 J( 19.5
To proportion the areas of longitudinal steel we thus require the
values of T' + Mand T' - M. When consideration is given to
the change of sign of M at the point of contraflexure we obtain
the effective moment envelope shown in Figure 8. 2. This
diagram may be used in the calculation of the minimum
quantities of longitudinal steel {in both top and bottom faces)
necessary to resist the combined flexure and torsion.
At the mid-point of the beam:
T' + M = 1670 kip.in.
1670 hence ALl = = 2. 84 sq.in.
588
say 2 -1 11 4' + 2 - 7 /811 cj> bars in the lower face. Only
nominal areas of top steel are required at this position as
T' - Mis less than zero.
At the supports:
T ' - M = 1 6 7 0 kip. in.
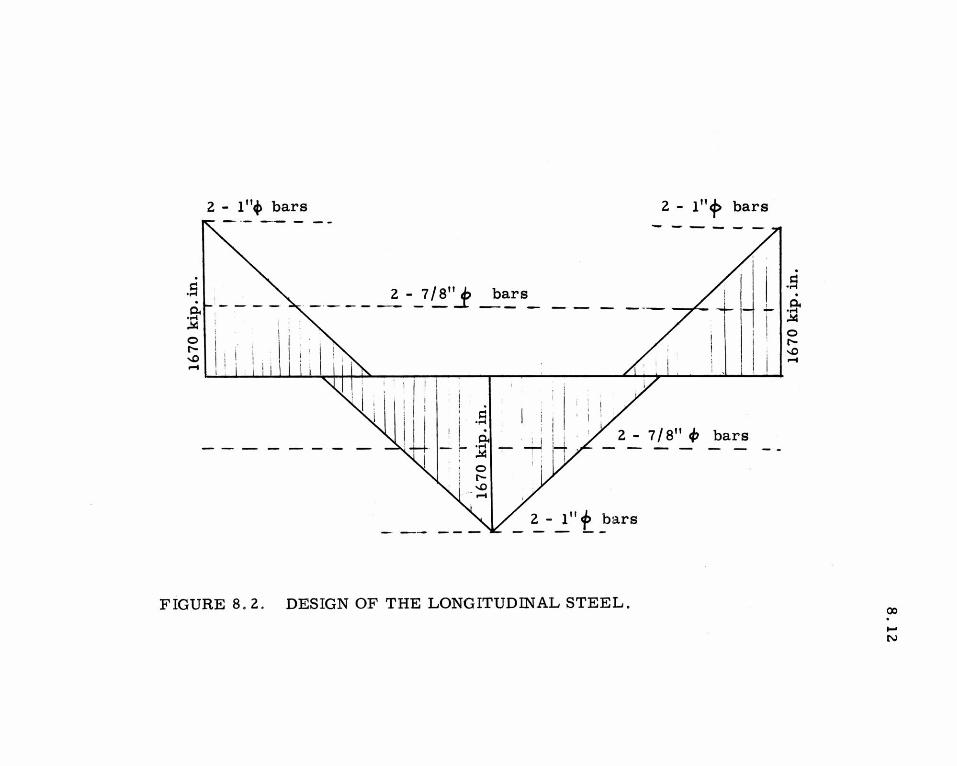
f I
~ I
-G,-1
~, I I
N ~I
ro I
.0
. -e-1
~' I I
'u1
'dp
{ 0 L 9 I
ml
~I
.o I ~
~I
r-I
I
NI
N "-----'-
---_
__
.
fl ro .o I
:_9- I
-----
___ _
J_ .. -- -
··-·.
-I
I'll s., ~
.0
I
-9-I
:...1
8.
12
. ....l µ:l µ:l ~
en. ....l c:t: ~
0 ::> ~ -0 z 0 ....l ril ::r: ~ ~
0 z 0 - en. µ:l 0 . N
. 0
0
µ:l 0:: ::> 0 -~

Rule 4.
8.13
hence 2 - 1114> + 2 - 7 / 811 c:I> bars are required in the top
face with only nominal areas of steel in the lower face of the
beam. Bond and anchorage requirements will of course
influence the curtailment of longitudinal reinforcement.
A w T'
= s 4 b' jd f
w
taking b' = 8. 511 , we have
A w
s
or
A w s
= 230 4x 8.5x 0.9x 19.5 x 33.5
= 0 .. 0118 inl /in.
=
= p6 - 2Jtl0xl9.5>< 0.055] 2 l 19.5"33.5
0 0 3 . 2,. = .. 11 1n 1n.
i.e. not critical.
Hence
A w s
= 0. 0118 in2/in.
Say 3/ 8 11 ; ties at 9'' c. c.

8.14
Check V eff } 8 bd0c
36 l' 8d0~19.5,c0.055 = 86kips.
i.e. not critical.
This final check is made to ensure that the cross-section
of the beam is sufficiently large that a concrete compression
failure will not occur in the web under combined torsion and
shear.

9.1
CHAPTER 9
CONCLUSIONS.
9.1 CONCLUSIONS.
In this research project the behaviour of reinforced
concrete beams loaded in torsion, combined bending and torsion
and combined bending, torsion and transverse shear has been
examined. Analysis equations for the prediction of the ultimate
load of rectangular beams have been derived and a simple method
of design for these beams has been presented.
In particular the following conclusions were reached:
1. Beams reinforced with only longitudinal steel and loaded
in pure torsion fail immediately after the appearance of
the first diagonal crack at torques comparable with the

9.2
maximum twisting moment which can be resisted by a
plain concrete member.
2. A conservative estimate of the torsional capacity of a plain
concrete member may be obtained by assuming that the
shear stress is constant over the full section and that
failure occurs when this stress reaches a value of 3. sjr~. 3. Whether the presence of bending will increase or decrease
the torsional Cl\pacity of a beam containing only longitudinal
steel depends on the section properties of the member.
Flexural cracking will reduce the effective section re&is'fing
the torque but the flexural compressive stresses in the
uncracked concrete zone will increase the ability of this
zone to resist torsi~n. Heavily reinforced, slender beams
will have only a small portion of their cross_; section
destroyed by flexural cracks and hence flexure may increase
the torsional capacity of such beams. On the other hand.
lightly reinforced, squat beams will be extensively cracked
by flexure and hence their torsional capacity will be
reduced.
4. Because the effects of flexure tend to cancel each other,
if a conservative value for the pure torsional strength is
chosen, torsion-flexure interaction for beams containing
only longitudinal steel can be ignored.

9.3
5. The value of the nominal shear stress at failure for
beams containing only longitudinal reinforcement and loaded
in combined transverse shear and torsion, depends upon the
loading ratios. The value of the failure stress increases
with increasing values of the ratio T /Vb and decreasing
values of the ratio M/Vd.
6. While a design procedure might be formulated in which the
value of the limiting shear stress is related to the loading
ratios, it is found that a simpler and more satisfactory
procedure results if linear interaction between the strengths
in transverse shear and torsion is assumed.
7. Prior to the failure of any fully reinforced (i. e. containing
both longitudinal and transverse steel) member sustaining
torsion and bending,· a tensile crack developes forming a
warped surface which intersects three exterior faces of
the beam in a helix; the compression zone on the fourth
face joins the two ends of the helix and is consequently
inclined to the axis of the beam. At failure the steel
crossed by the tensile crack yields, permitting rotation
of the member about an axis in the compression zone.
Following Lessig (Ref. 2. 22), failure with the
compression zone occuring near the top face is ref erred
to as a Mode 1 failure, whilst a Mode 2 failure indicates

9.4
that this zone forms near a side face. In the present
investigation some specimens developed the compression
hinge near the bottom surface and failures of this type
have been labelled Mode 3.
8. Two different types of interaction between bending ~nd torsion
for beams containing both longitudinal and transverse steel
are possible. For beams in which the areas of top and
bottom steel are equal the presence of bending moment
reduces the torsional capacity. On the other hand for
beams in which the area of tension steel e:x;ceeds that of
the compression steel, the torsional capacity is
considerably increased by the presence of bending moment
'1p to a certain limiting value of the bending moment. For
bending moments beyond this limit the torsion capacity -6
decrease(\.
This interaction behaviour can be well explained by
considering the failure modes. For beams having
symmetrical reinforcement a Mode 1 failure will always
be :rr..Dre critical than a Mode 3 failure. For this reason
the beam will al ways fail in either Mode 1 or 2 and in
these modes the presence of flexure reduces the torsional
capacity.
On the other hand, when beams containing less top

9.5
than bottom longitudinal steel are loaded at high ratios of
torsion to bending, a Mode 3 failure will be critical. In
this mode failure is init.ted by the yielding of the top
longitudinal steel. A moderate bending moment tends to
oppose this action and thus increases the torsional capacity
of the beam. A larger bending moment will cause yielding
of the bottom longitudinal steel; that is, the beam will
fail in Mode 1 .
9. In the absence of torsion the mode of shear failure most
likely to occur in web-reinforced beams of normal design is t
the so-called "shear-compression" failure. In this mode
the compression zone forms near to and parallel to the
top face of the beam, the diagonal tension cracks form
only on the side faces of the beam (all stirrups crossed by
the diagonal cracks yield), while the tension crack on the
bottom face is perpendicular to the longitudinal axis of the
beam.
When the beam is loaded in combined transverse shear
and torsion at low eccentricities (T/Vb low), the
compression zone moves towards the side face of the beam
on which the torsional and transverse shear stresses
oppose. The torsion also causes diagonal cracking on
both the top and bottom faces of the beam. This type of

9.6
failure is referred to as an Effective [' 1-.f:'ar tlu:".'e ..
When the eccentricity of the load is further increased
the compression zone covers all of the side face of the
beam while diagonal tension cracks cover the other three
sides (Mode 2 failure).
At very high eccentricities it is possible that the
compression zone will form near the bottom surface of the
beam ( Mode 3 failure).
10. Expressions for the failure loads of fully reinforced beams
loaded in combined bending and torsion or combined
bending, torsion and transverse shear have been derived.
These expressions were obtained in the main from a study
of the equilibrium sit;,ation of the modes of failure
described above. Good agreement between the predictions
of these expressions and the experimental resl'lts was found,
not only for the beams of this investigation, b: t also for a
large number of beams reported in the literature.
11. In the derivation of the analysis equations for web reinforced
beams it was assumed that web steel crossed by the failure
surface yielded at failure. Further in the case of Modes
1, 2 and 3 it was assumed thc,t the longitudinal steel also
yielded. If the beam contains excessive amounts of steel
failure may occur before the yield of the steel and in this

9.7
case the analysis equations may lead to unconservative
results. Empirical limitations must therefore be placed
on the range of validity of the theory to exclude these
cases.
I 2. It is possible to develop simple ultimate strength design
procedures from the analysis equations. Such a method
has been presented in this thesis.
9. 2 SUGGESTIONS FOR FURTHER RESEARCH.
As was stated in the introduction, the main aim of this
thesis was to study the behaviour of isolated rectangular beams
loaded in combined torsion, bending and transverse shear, and
from this study to obtain expressions for the ultimate strength of
such members. As a result of the completion of this work,
several topics now suggest themselves for further study. In
particular the ultimate strength of reinforced concrete grillages
and three dimensional frames in which torsion will almost always
occur in combination with flexure, might now be examined. Work
on this problem would derive some assistance from Walsh'n
study (Ref. I. I) of the stiffness of rectangular beams loaded in
bending and torsion. Another practical problem which could now
be studie J in some detail is ·. · behaviour of edge beams in
reinforced concrete slabs. A study of the failure characteristics
of these beams would reveal the effects of beam- slab interaction and
to what extent the edge beams may be treated as isolated rectangular
beams.

A.I.
APPENDIX A
REFERENCES.
1.1 Walsh, P.F.
"The Strength and Stiffness of Rectangular Reinforced Concrete
Beams in Combined Bending and Torsion".
Ph.D. Thesis, University of New South Wales, 1967.
2. 1 Bach, C. and Graf, 0.
"Tests on the Resistance of Plain and Reinforced Concrete
to Torsion".
Deutscher Ausschuss fur Eisenbeton, Berlin, Heft 16, 1912
(in German).
2. 2 Cowan, H. J.
"Reinforced and Prestressed Concrete in Torsion".
Edward Arnold, London, 1965.
2. 3 Young, C.R., Sagar, W. L., and Hughes, C. A.
"Torsional Strength of Rectangular Sections of Concrete,
Plain and Reinforced".
University of Toronto, School of Engineering,
Bulletin No. 3, 1922.
2. 4 Todhunter, I and Pearson, K.
"A History of the Theory of Elasticity and of the Strength
of Materials".
Dover Publications, New York, 1960.

A.2.
2. 5 Turner, L. and Davies, V. C.
"Plain and Reinforced Concrete in Torsion with Particular
Reference to Reinforced Concrete Beams".
The Institution of Civil Engineers, London,
Selected Engineering Papers. No. 165, 1934.
2. 6 Marshall, W. T.
"The Torsional Resistance of Plastic Materials with Special
Reference to Concrete".
Concrete and Constructional Engineering (London)
Vol. 39, No. 4, April 1944.
2. 7 Nylander, H.
"Torsion and Torsional Restraint by Concrete Structures".
Statens Kommittee for Byggnadsforskning, Stockholm.
Bulletin No. 3, 1945 (Swedish with English summary).
2. 8 Kemp, E. L., Sozen, M.A., and Siess, C .P.
"Torsion in Reinforced Concrete".
University of Illinois, Civil Engineering Studies,
Structural Research Series No. 226, Sept. 1961.
2. 9 Ramakrishnan, V. and Vijayarangan, B.
"The Influence of Combined Bending and Torsion on
Rectangular Beams without Web Reinforcement".
The Indian Concrete Journal, Vol. 37, No. 11, Nov. 1963.

A.3.
2. 10 Gesund, H. and Boston, L.A.
"Ultimate Strength in Combined Bending and Torsion of
Concrete Beams Containing only Longitudinal Reinforcement".
Journal of the American Concrete Institute,
Proceedings. Vol. 61, No. 11, Nov. 1964.
2. 11 Talbot, A.N.
"Reinforced Concrete Wall Footings and Column Footings".
University of Illinois Engineering Experiment Station,
Bulletin No. 67, March, 1913.
2. 12 Kani, G .N.
"The Riddle of Shear and its Solution".
Journal of the American Concrete Institute,
Proceedings, Vol. 61, No. 4, April, 1964.
2.13 Marshall, W.T. and Tembe, N.R.
"Experiments on Plain and Reinforced Concrete in Torsion".
Structural Engineer, London, Vol. 19, No. 11,
Nov. 1941,
2. 14 Rausch, E.
"Berechnung des Eisenbetons gegen Verdrehung".
Berlin, Julius Springer, 1929. (in German).
2. 15 Andersen, P.
"Rectangular Concrete Sections Under Torsion".
Journal of the A.C.I. Proceedings, Vol. 34, No. 1, 1937.

A.4.
2. 16 Cowan, H.J.
"Elastic Theory for the Torsional Strength of Rectangular
Reinforced Beams".
Magazine of Concrete Research, Vol. 2, No. 4, July, 1950.
2. 17 Standards Association of Australia.
"SAA Code for Concrete in Buildings".
A.S. CA2 - 1963.
2. 18 Zia, P.
"Torsional Strength of Prestressed Concrete Members".
Journal of the A.C.I. Proceedings, Vol. 58, April, 1961.
2. 19 Ernst, G. C .
"Ultimate Torsional Properties of Rectangular Reinforced
Concrete Beams".
Journal of the A.C.I., Proc. Vol. 54, No. 4, Oct. 1957.
2.20 Cowan, H.J.
"The Strength of Plain, Reinforced and Prestressed Concrete
Under the Action of Combined Stresses with Particular
Reference to the Combined Bending and Torsion of Rectangular
Sections" .
Magazine of Concrete Research Vol. 5, No. 14, Dec. 1953.
2.21 Gesund, H., Schuette, F.J., Buchanan, G.R. and
Gray, G.A.
"Ultimate Strength in Combined Bending and Torsion of
Concrete Beams Containing Both Longitudinal and Transverse
Reinforcement".
Journal of the A.C.I. Proceedings, Vol. 61, No. 12, Dec. 1964.

A.5.
2. 22 Lessig, N .N.
"Determination of the Load Bearing Capacity of Reinforced
Concrete Elements with Rectangular Cross-section Subjected
to Flexure and Torsion".
Concrete and Reinforced Concrete Institute, Moscow,
Work No. 5, 1959, pp 5-28.
Translated by Margaret Corbin as "Foreign Literature
Study No. 371 11 Portland Cement Association, Research
and Development Laboratories, Skokie. III.
2.23 Yudin, V.K.
"The Determination of the Load Carrying Capacity of
Rectangular Reinforced Concrete Sections Subject to
Combined Torsion and Bending".
Concrete and Reinforced Concrete Institute, Moscow,
Work No. 6, 1962, pp 265-8 (in Russian).
2. 24 Evans, R.H., and Sarkar, S.
"A Method of Ultimate Strength Design of Reinforced Concrete
Beams in Combined Bending and Torsion".
The Structural Engineer, Vol. 43, _No. 10, Oct. 1965.
2. 25 State Committee on Construction of the U. S.S. R. Council
of Ministers.
"Structural Standards and Regulations".
State Publishing Office for Literature on Structural Engineering,
Architecture and Structural Materials, Moscow, 1962,
(in Russian).

2.26
2.27
2.28
A.6.
Chinenkov, Y . V.
"Study of the Behaviour of Reinforced Concrete Elements
in Combined Flexure andTorsion".
Concrete and Reinforced Concrete Institute, Moscow,
Work No. 5, 1959, pp 29-53.
Translated by Margaret Corbin as "Foreign Literature
Study No. 370'.'. ·Portland Cement Association Research and
Development Laboratories, Skokie, III.
Lessig, N. N.
"Study of Cases of Failure of Concrete in Reinforced Concrete
Elements with Rectangular Cross-section Subjected to Combined
Flexure and Torsion".
"Design of Reinforced Concrete Structures,"
Edited by A.A. Gvozdev, Moscow, 1961, 322 pp.
Translated by Margaret Corbin as "Foreign Literature
Study No. 398". Portland Cement Association, Research
and Development Laboratories, Skokie, III.
Lyalin, I. M.
"Experimental Studies of the Behaviour of Reinforced Concrete
Beams with Rectangular Cross-section Subjected to the Comblned
Action of Transverse Force, Flexural and Torsional Moment".
Concrete and Reinforced Concrete Institute, Moscow, W c,rk
No. 5, 1959, pp 54-77.
Translated by Margaret Corbin as "Foreign Literature
Study No. 402". Portland Cement Association Research
and Development Laboratories, Skokie, III.

2.29
A. 7.
Yudin, V.K.
"Behaviour of Reinforced ConcreiE Beams with Rectangular
Cross-sections Subjected to Flexure and Torsion". Concrete
and Reinforced Concrete Institute, Moscow, Work No. 1, 1964,
pp 30 - 35. Translated by Margaret Corbin as "Foreign
Literature Study No. 402". Portland Cement Association,
Research and Development Laboratories.
3.1 Hsu, T.T.C., and Mattock, A.H.
"A Torsion Test Rig".
Journal of the P.C.A. Research and Development Laboratories.
Vol. 7, No. 1, Jan. 1965.
4. 1 Cowan, H. J.
"Strength of Reinforced Concrete Under the Action of Combined
Stresses and the Representation of the Criterion of F ailun-
by a Space Model".
Nature (London), Vol. 169, 1952, p. 663.
4. 2 Bresler, B., and Pister, K.
"Strength ofConcrete Under Combined Stresses".
Journal of the A.C.I. Proceedings, Vol. 55, Sept. 1958.
4. 3 Richart, F., Brandtzaeg, A., and Brown, R. L.
"A Study of the Failure of Concrete under Combined Compressiv2
Stresses".
University of Illinois Engineering Experiment Station,
Bulletin No. 195, Nov. 1928.
4. 4 Guralnick, S. A.
"Strength of Reinforced Concrete Beams".
American Society of Civil Engineers, Transactions,
Vol. 125, Part I, 1960, p. 603.

A.8.
4. 5 ACI - ASCE Committee 326, Shear and Diagonal Tension.
"Shear and Diagonal Tension - Pt. 2".
Journal of the A.C.I. Proceedings, Vol. 59, Feb. 1962.
5. l Cowan, H.J. and Armstrong, S.
"Experiments on the Strength of Reinforced and Prestressed
Concrete Beams and of Concrete Encased Steel Joists in
Combined Bending and Torsion".
Magazine of Concrete Research, Vol. 7, No. 19, March, 1955.
8. l Archer, F. E.
"Economics of Reinforced Concrete Designed by the Ultimate
Load Method" .
Constructional Review, Sydney, Nov. 1956.

APPENDIX B
This appendix contains a summary of all the experimental data
used in the comparisons of theory and experiment in Chapters 2 and 6
for beams with web reinforcement. Further details of these test results
can be found in the references cited in Appendix A. A discussion of the
test results of this investigation is, of course, given in Chapter 3.
In the table the concrete strengths have been expressed in terms of the
cylinder compressive strength. Where the investigator specified the
concrete used by its cube strength a conversion factor of O. 8 has been
employed.

APPENDIX B. EXPERIMENTAL DATA
Geometry (inches) Web Steel Longitudinal Steel Failure Loads
I Beam h b al a2 A f s ALl fLl R f' T M V +-' .... rn o w w C
kip. kip. kips (I) +-' No. sq. in. k.s.i . in. sq. in. k. s. i p. s. i. :> co i::::: tlD in. in.
~El 10.0 6.5 l .6 1.7 0.110 49.0 3.00 0.392 44.0, 1.000 4599 81.4 6.3 0.18 RE2 l'l.() 6.5 1.6 1.3 o.110 49.0. 3.00 0.392 44.0 1.000 4599 83.5 32.0 0.92 RE3 l'J.l"I 6.5 1.6 1.3 0.110 49.0 3.C'O 0.392 44.0, 1.000 4599 81.5 45.0 1.28 RE4 1 1 • n 6.5 1.6 1.3 n.110 49.(' 3.00 0.392 44.0 l .ooo 4599 74.6 84.4 3.26 RE5 10.() 6.5 1 .6 1.3 0.110 49.C 3.CO 0.392 44.0 1.000 4599 66.0 108.2 3.0 7 R E4>< 10.n 6.5 1.6 1.3 0.110 49.C" 3.00 0.392 44.0 1.000 4599 38.0 134.0 3.86 RUl 1n.o 6.5 1.0 1.4 0 .110 49.C 4.CO o. 880 46.8 0.239 3679 73.3 6.3 0. 18 RU3t* l ,,_ 0 6.5 1.0 1.4 0.110 49.r 4.00 0.880 46.8 0.239 4629 76.0 o.3 0. l CJ RUZ 10.0 6.5 1.8 l. 4 0.110 49.C" 4.00 C.880 46.8 0.239 3h19 84.9 51.l o.o RU3 1n.n 6.5 l .8 l .4 C'.110 49.0 4.CO o. 880 46. 8 0.239 3679 105.0 84.0 0 .0
i::::: RU3A 10.0 6.5 1.8 1.4 0.110 49.C 4.00 0.880 46.8 0.239 4629 89.4 149.3 o.o 0 ..... RU4 10. rt 6.5 1.8 1.4 0.110 49.0 4.00 0.880 46.8 0.239 3679 85.5 145.0 4.13 +-' co RU5 l "· r, 6.5 1.8 1.4 0.110 49.C 4.00 o. 880 46.8 0.239 3679 75.4 249.7 7.15 0.0 ..... RU5A 10.0 6.5 1.8 1.4 0.110 49.(" 4.CO 0.880 46.8 0 .239 4399 68.3 266.8 7.80 +-' rn RU6 1n.e 6.5 1.8 1.4 n.110 49.r 4.00 ('. 880 46.8 0.239 3679 59.l 281.2 7.95 (I)
:> 36T4 ll"\.O 6.5 1.6 1.3 0.110 43.0 4.0C c. 880 37.7 0.295 4399 62.6 240.4 7. 53 i::::: ..... 36T4C 10. 0 6. 5 1.6 1. 4 0.110 43.(' 4.00 o. 880 37.7 0.309 4339 94.l 6 l. l o.o rn 36T5.5 1n.n 6.5 1.6 1 .4 0.110 43.0 5. 50 0.880 37. 7 0.295 4629 85.9 173.4 o.o .....
..c: 77T5 10.0 6.5 1.7 1.4 f).110 43.n s.co 1.200 37.7 1.000 4629 91.6 262.4 o.o ~ 77T4 1'1.0 6.5 1.7 l. 4 0.110 43.0 4.00 1.200 37.7 1.000 4629 107 .6 223.4 o.o 24T3 11'.'.0 6.5 1.3 1.4 o. 110 43.r 3.00 0.392 4 7. l o. 372 4339 70.8 46.6 a.o 38T5 1r,.n 6.5 1.7 1.6 0.110 43.0 5.00 1. 5 70 38.7 o.156 3829 80.l 216.4 6. 73
tlJ N

Expected page number is not in the original print copy.

APPENDIX B. EXPERIMENTAL DATA
Geometry (inch,es) Web Steel Longitudinal Steel Failure Loads I
h b al a2 A f s ALl fLl R f' T M V +-' s... Cll 0 Beam w w C
kip. kip. kips Q) +-' sq. in. k. s. i. in. sq. in. k. s. i~ p. s. i. > (1j No. in . in. ..5 -~
Vl 1n.o 6.5 1.5 1.3 0.049 58.6 4.75 1.840 65.2 0.333 5029 38.2 544.Q 22.30 Vl* 10.0 6.5 1.5 1.3 0.049 58.6 4.75 1. 840 65.2 0.333 5029 60.6 421.0 17.30 V2 10.n 6.5 1.5 1.3 0.049 58.6 4. 75 1.840 65.2 0.333 5029 52 •. 3 413.0 11.00 V2* 10.0 6.5 1.5 1.3 0.049 58.6 4.75 1. 840 65.2 0.333 5029 86.0 166.0 7.11.) V3 10.0 6.5 1.5 1.3 0.049 58.6 4.75 1. 840 65.2 0.333 5029 16.9 685.0 27.80 VJ* l(l.'l 6.5 1.5 1.3 0.049 58.6 4.75 1.840 65.2 0.333 5029 79. 2 394.0 16.20 v,. 10.(' 6.5 1.5 1.3 0.049 58.6 4.75 1.840 65.2 0.333 5029 91.3 243.0 10.20
~ V4* 10.0 6.5 1.5 1.3 0.049 58.6 4.75 1. 840 65.2 0.333 5029 40.4 664.0 27.vO 0 V5* 10.'l 6.5 1.5 1.3 0.049 58.6 4. 75 1.840 65.2 0.333 5029 89. 7 o.o o.o •.-1 +-' V6 10.r, 6.5 1.5 1.3 0.049 58.6 4.75 1.840 65.2 0.333 5029 24.8 668.0 21.20 (1j bD V6=~ 10.f' 6.5 1.5 1.3 0.049 58.6 4. 75 1. 840 65. 2 0.333 5029 82.9 348.0 14.40 •.-1 +-'
V7 1 (). 0 6.5 1.5 1. 3 0.049 58.6 4.75 1.840 65.2 0.333 5029 83.9 298.D 9.30 Cll Q)
V7t: 10.n 6.5 1.5 1.3 0.049 58.6 ~.75 1.840 b5.2 C.333 5029 103.4 210.0 12.10 > ~ Ul 10.0 6.5 1.5 1.3 0.049 58.6 3.CO 1.840 65.2 o. 333 5029 106.6 o.o o.o H
Cll Ul* 10.0 6.5 1.5 1.3 'l.049 58.6 3.CO 1.840 65.2 o.333 5029 99. 5 199.0 8 .40 •.-1
..c:: U2 10.0 6.5 1.5 1.3 0.049 58.6 3.C'O 1.840 65.2 0.333 5029 43.9 689.0 28 .. 0Q ~ U2* 10.0 6.5 1.5 1.3 0.049 58.6 3.CO 1.840 65. 2 0.333 5029 85.2 315.0 13.10
U3 1 '). 0 6.5 1.5 1.3 0.049 58.6 3.00 1.840 65.2 0.333 5029 82. 7 533.0 21.80 U3* 10.0 6.5 1.5 1.3 0.049 58.6 3.CO 1.840 65.2 0.333 5029 66.2 120.0 29.3G Tl 1n.o 6.5 1.2 1.1 0.049 58.6 3.62 1.570 39.3 0.140 5029 75.l 327.0 13.50 T2 10.0 6.5 1.2 1.7 0.049 58.6 3.62 1.570 39.3 0.140 5029 92.9 102.0 4,.10 T4 10.0 6.5 1.2 1.7 ').049 58.6 3.62 1.570 39.3 o.; 140 · 5029 53.0 523.0 21.40 T4* H>.;O 6 .5 1.2 ·l. 7 0.049 58.6 3.62 1.570 39.3 0.140 5029 81.3 366.0 15.10 T5 10.0 6.5 1.2 1.7 0.049 58.6 3.62 l.570 39.3 0.140 5029 63.'t 432.0 17.70 T5* 10.0 6.5 1.2 1.7 0.049 58.6 3. 62 1.570 39.3 0.140 5029 75.4 o.o Q.O T6 l'l.'l 6.5 1.2 1.7 o.;049 58.6 3.62 1.570 39.3 0.140 5029 8l.O 196.0 8.30 T6* 10., 6.5 1.2 1.1 0.049 58.6 ~-62 1.570 39.3 0.140 5029 29.4 584.Q 23.90
t:d . ""

APPENDIX B. EXPERIMENTAL DATA
Geometry (inches) Web Steel
I +-' ~ h b al az A f s 00 0 Beam w w Q) +-' > ro No. sq. in. k. s. i . in. i::: b.O
>--< ......
R4.2(' l'l." 5. I) l.5 1.2 1).049 58.6 2. 59 R4.24 10.0 5.0 1.5 1.2 0.049 58.6 2.25 R3.2() 10.0 5. ') 1.5 1.1 0.049 58.6 3.12 R3.24 l'l.O 5. r) 1.5 1. 1 0.049 58.6 2.12 R3.31" 1n.r 5.,., 1 .5 l. 1 o.r49 58.6 2. 38 R2.24 1r.o 5. I') 1.7 1.2 0.049 58.6 3.80 RZ.30 10.') 5.0 1.7 1.2 0.049 58.6 3.32 RZ.38 l r,. n 5.1") 1. 7 1.2 0.049 58.6 2.84 R l. 30 11). 0 5. 'l 1.2 1.2 0.049 58.6 3.95 R4A l"l. ') 5.l'l 1.5 1.2 0.049 58.6 3. 22 R48 1,.,. "I 5."'l l .5 1.2 0.049 58.6 3.22 R4.2~A 11).n. s.o l .5 1.2 o.r,49 73.6 2.00 R4.2')8 10.r, 5.0 1.5 1.2 ().049 73.6 2.00 R4.24A 11).0 5.0 l .5 1.2 0.049 58.6 2.00 R3A l"l. 0 5.0 1.5 l. l "-049 73.6 3.00
.c:: R3B 1,. ('\ 5.0 1.5 l. l 0.049 73.6 3.00 00 R3.2"A l r').,., 5.0 1 .5 1.1 1).049 58.6 2. 50
r-1 R3.20B 11').n 5.(' 1.5 1. 1 0.049 58.6 2.50 ro
~ R3.24A 1 , • () 5.n 1.5 l. l O.t:'49 73.6 2. 50 R3.24B 1 "'· n 5.'l 1.5 1. 1 0.049 73.6 2. 50 R3.3CA 1". 0 5.0 1.5 1.1 0.049 73.6 2.00 R3.30B 10.0 5.0 1.5 1.1 0.049 73.6 2.00 R2A 1 I). 0 5.0 l. 7 1.2 l').049 58.6 3.00 R2B l'>.0 5.1') 1.7 1.2 0.049 58.6 3.CO R2.24A 10.0 5.1) 1.1 1.2 0.049 58.6 3.30 R2.30A 10.0 5.0 1.7 1.2 r).049 73.6 ~-00 R2.308 10.0 s.o 1.7 1.2 0.049 73.6 3.00 R2.38A 10.0 5.0 1.1 1.2 0.049 73.6 2. 50 R2.38B 10.0 5.0 1.7 1.2 0.049 73.6 ~.50 Rl.30A 10.1" s.o 1.2 1.2 0.049 58.6 3. 14 Rl.30B 10.n 5.0 1.2 1.2 0.049 58.6 r3. 14
Longitudinal Steel
ALI fLl f' R C
sq. in. k.s.i p.s.i.
1. 420 40.6 0.155 3474 1. 420 40.6 0.155 3034 1.220 40.6 o. 180 3444 1.220 40.6 0.180 3157 1.220 40.6 0.180 3414 0.830 42.4 0.265 3239 0.830 42.4 0.265 3314 0.830 42. 4 0.265 3474 0.710 41.3 o. 310 3279 1.420 40.6 0.155 2954 1.420 40.6 0.155 2954 1.420 40.6 0.155 3474 1.420 40.6 0.155 3474 1.420 40.6 0.155 3034 1.220 40.6 0.180 2919 1.220 40.6 0.180 2919 1.220 40.6 0.180 3444 1.220 40.6 0.180 3444 1.220 40.6 0.180 3157 1.220 40.6 0.180 3157 1.220 40.6 0.180 3414 1.220 40.6 0.180 3414 0.830 42.4 0.265 3199 0.830 42.4 0.265 3199 0.830 42.4 0.265 3239 0.830 42.4 0.265 3314 o. 830 42.4 0.265 3314 0.830 42.4 0.265 3474 0.830 42.4 0.265 3474 o. 710 41.3 0.310 3279 0.110 41.3 0.310 3279
Failure Loads
T M kip. kip. in. in.
59.9 331.0, 56.5 264.0 50.7 252.0 53. 7 230.0 61.6 201.0 44.2 205.0 49.7 176.0 53.4 138.0 41.8 146.0 50.5 92.l 51.6 166.0 72.0 220.0 70.8 151.0, 62.l 255.0 57.6 92.1 51.5 166.0 61.7 183.0 59.0 78.9 56. 5 92.9 54.9 158.0 62.2 203.0, 63.4 86.8. 55.7 111.0 50.q 78.7 62.3 140.0 50.3 104.Q 50.6 71.8 54.6 120.0 48.8 70.7 42.6 97.l 40.9 61.8
V kips
o.o o .• o o .• o o .• o o.o o.o o.o o.o o.o 3.94 6.92 9.08 6.30 8.21 3 .• 94 6.92 7.60 3.41 3.97 6.57 8.39 3.73 4.71 3.42 5.85 4.43 3.13 5.08 3.08 4.13 2.73
to
~

APPENDIX B. EXPERIMENTAL DATA
Geometry (inches) Web Steel Longitudinal Steel Failure Loads I
+-' ~ h b al a2 A . f s ALl fLl R fl T M V . 00 0 w w C Q) +-' Beam kip. kip. kips > Cll sq. in. k . .s·. j : . in. sq. in. k.s.i p.s.i. ~ Ol) No. in. in. - •ri
13 TR 3 12.0 6.0 1.3 1.0 0.049 55.5 l4.00 0.220 53.6 1.000 3922 34.3 o.o o .• o 13TR7 12.0 6.0 1.3 1.0 0.049 55.5 1.00 0.220 53,.6 1.000 3922 49. 7 o.o o .• o t3TR15 12.0 6.0 1.3 1.0 0.049 55.5 4.00 0.220 53.6 1.000 3922 61.7 o.o o.o BTR30 12.0 6.0 1.3 1 .o. 0.049 55.5 2.00 0.220 53.6 1.000 3922 76.0 o.o o.o ~TR3 12.0 6.0 1.4 1.1 0.049 55.5 14.00 0.390 41.0 1.000 3922 35.0 o.o o.o
+-' 4TR 7 12.0 6.() 1.4 1.1 O.C'49 55.5 1.00 0.390 41.0 1.000 3922 54.8 o.o o..o 00 ~ 4TR15 12.r 6.0 1.4 1.1 0~049 55.5 4.00 0.390 41.0 1.000 3922 74.0 o.o o.o i...
l4TR30 12.0 6.0 1.4 1.1 0.049 55.5 2.00 0.390 41.0 1.000 3922 85.0 o.o o.o ~ 5TR3 12.0 6.'l 1 .4 1.2 0.049 55.5 14.00 0.610 48.6 1.000 3922 43.0 o.o. o.o 15 TR7 12.0 6.() 1.4 1.2 0.049 55.5 1.co 0.610 48.6 1.000 3922 59.7 o.o o.o 5TR15 12.0 6.0 1 .4 1.2 0.049 55.5 4.co 0.610 48.6 1.000 3922 76.5 o.o o •. o 5TR3f'l 12.0 6.".) 1.4 1.2 0.049 55.5 2.00 0.610 48.6 1.000 3922 92.6 o.o o~o R3 9.0 6.0 o.a o.a 0.049 20.8 4.00 0.580 48.5 0.672 7699 71.8 o.o OAO
s:: R.5 9.0 6.0 o.a o.a o.;049 20.8 4.00 0.580 48.5 0.672 8500 75.4 75.lt o.o Cll R2 9.0 6.0 o.a o.;a 0.049 20.8 4.00 0.580 48.5 0.672 7299 79.0 158.0 o.o ~ Rl 9.0 6.0 o.a o.a 0.049 20.8 4.00 0.580 48.5 0.672 7299 43.0 258.0 o .• o 0 u Sl 9.0 6.0 o.a o.a 0.049 20.a 3.00 0.580 48.5 0.672 7199 82.6 206.5 o .• o
54 9.0 6.0 0.8 o.a 0.049 20.8 3.00 0.580 48.5 0.672 6969 64.6 258.4 Q.O 1 a.o a.o 1.5 1.5 0.110 50.0 5.00. o.5ao 51.0 0.672 5029 79.0 79.0 o.o 2 8. f) a.o 1.5 1.5 0.110 50.0 2.00 o.580 51.0 0.672 5299 102.0 102.0 0 .,o
,. 3 a.o 8.0 1.5 1.5 0.110 50.0 5.00 o. 580 51.0 0.672 5309 61.0 122.0 o.o .
rl 4 a.o 8.0 1.5 ·1 .5 0.110 50.0 2.00 0.580 51.Q 0.672 4679 67.0 134.0 0,.0
Cll 5 a.o 8.0 1.5 1.5 0.110 50.0 5.00 o.sso 51.0 0.672 4239 49.0 147.0 0..0 +-' 6 a.o a.o 1.5 1.5 0.110 50.;0 2.00 0.580 51.0. 0.672 405() 56.0 168.0 o..o Q)
'O 7 a. f\ 8.0 1.5 1.5 0.110 50~0 5.00 0.580 51.0 0.672 5279 43.0 173.0 0..0 ~ 8 0.0 8.o 1.5 1.5 0.110 50.0 2.00 o.sao 51.0 0.672 5739 44.0 176.0 o.o ;::l 00 9 12.0 6.0 2.0 1.8 0.110 50.0 a.co 0.580 51. 0. 0.672 4859 60.0 120.0 o.o Q)
c., Ito 12.0 6.0 2.0 1.a 0.110 50.0 a.co o. 580 51.0 0.672 3899 44.0 176.0 0..0 b. 1 12.0 6.0 2.0 , 1 .a 0.110 50.0 4.00 0.580 51.0 0.672 4859 68.0 138.0 o •. o
12 12.n 6.0 2.0 1.a 0.110 50.0 4.00 0.580 51.0 0.672 3899 53.0 213.0 o,.o
tj

APPENDIX B. EXPERIMENTAL DATA.
Geometry (inches) Web Steel Longitudinal Steel Failure Loads I
+-' ~ h b al a2 A f s ALl fLl R f' T M V ·~ 0 Beam w w C ' +-' kip. kip. kips > ro
No. sq. in. k. s. i in. sq. in. k.s.i p.s.i. i:: b.O in. in. i-j "M
BKl 11.8 7.9 1.0 1.2 0.122 49.l tt. 90 0.560 34.5 1.000 2009 121.0 o.o o.o BKlA 12.r, 8.1 1.0 1.4 0.122 49.l 4.90 0.560 34.5 1.000 1569 104.0 o.o o • .o BK2 12.0 7.9 1.4 1.2 0.122 49. l 3.90. 0.630 46.5 1.000 1709 147.8 o.o o.o BK2A 11.e 7.9 1.2 1.2 0.122 49.1 3.90. 0.630 46.5 1.000 1849 153.0 o.o o .• o BK3 15.8 6.7 1 .o 1.4 0.122 49. 1 4.90 0.630 46.5 1.000 190,9 175.5 o.o o.o BK3A 15.8 6.7 l.Cl 1.4 0.122 49. l 4.90 0.630 46.5 1.000 1569 149.3 o.o o..o BU4 12.0 8.1 1.4 1.6 0.122 49.1 14.90 l .940 54.0 0.273 909 111.0 556.0 a.o BU4A 11. 8 7.9 1.2 1.4 0.122 49.l ~-90 1.940 54.0 0.273 909 104.0 522.0 o.o BU5 11.8 7.9 1.2 l. 4 0.122 49. 1 14.90 0.990 49.7 1.000 679 69.5 86.8 o.o BUSA 11.8 7.9 1 .o 1.4 0.122 49.1 ~.90 0.990 49.7 1.000 714 67.6 174.0 o.o BU6 11.8 7.9 l .o l .4 0.122 49. 1 14.90 0.630 46.5 1.000 750 69.5 173.6 o.o BU6A 12.0 7.9 1.1 1.4 0.122 49.1 ~-90 0.630 46.5 1.000 789 73.0 104.2 o.o 8117 12.n 6. l 1.4 1.4 0.122 40.0 3.90 l.900 55.5 0 .. 163 1429 62.5 625.0 22.95 8117A 11.a 6.1 1.2 1. 4 0.122 40.0 3.90 1.900 55.5 0.163 1659 62.5 625.0 22.95 B118 12.2 5.9 1.6 1.2 0.122 40.0 3.90 0.980 50.0 0.347 1509 74.0 382.0 14.50 B1l8A 11.8 5.9 1.2 1.3 0.122 40.0 3.90 0.980 50.0 0.347 1779 74.0 382.0 14.35 B119 11.8 6.1 1.2 1.3 0.122 40.0 3.90 0.980 50.0 0.347 1559 88.6 157.0 6.04
b.O BI I 9A 11.8 6.1 1.2 1.4 0.122 40.0 3.90 0.980 50.0 0.347 1729 94.0 156.0 6.07 "M Ul BII 10 11.8 8.1 1 .o 1.3 0.122 40.0. 3.90 0.980 50.0 0.347 1639 137.0 3't8.0 12 .. 99 Ul Cl) B II ll')A 11.8 7.9 1.2 1.2 o. 122 40.0 3.90. 0.980 50.0 o.347 180.9 125.0 313.0 11.77 ~ B1111 12.0 7.9 1.2 1.1 0.122 40.0 f).90 0.980 50.0 0.347 1599 122.0 156.0 6.12
BllllA 11.8 7.9 1.4 1.1 0.122 40.0 3.90 0.980 50.0 0.347 1659 115.0 156.0 6.14 8[112 12.,:, 7.9 1.4 1.2 0.078 51.5 3.90 1.250 84.5 0.176 2779 146.0 243.0 9.24 B 1112A 12.0 7.9 1.2 1.2 0.078 51.5 3.90 1.250 84.5 0.176 2779 151.0 261.0 10.21 B1113 11.8 6.1 1.2 1.4 0.121 45.5 3.90. l.900 55.5 0.189 2129 93.5 520.0 19.16 81113A 11.6 6.1 1.2 1.4 0.121 45.5 3.90 1.900 55. 5 0.189 2579 125.0 625.0 23.16 81114 11.8 5.9 1.2 1.8 0 .121 45.5 3.90 1.900 55.5 o.1a9 2379 83.2 416.0 15.51 8 II 14A 12.n 5.9 1.2 2.0 0.121 45.5 3.90 1.900 55.5 o.1a9 2649 113.0 572.0 21.26 81115 12.2 7.9 1.2 1.6 0.121 45.5 3.90 o. 980 49.5 0.418 2539, 156.0 416.0 15.56 81115A 12.0 7.9 1.2 1.4 · 0.121 45.5 3.90 0.980 49.5 0.418 2759 151. 0 416.0 15.52 B 1116 12. 4 6.1 1.0 1.4 0.122 42.5 3.90 0.350 58.0 1.000 3259 92.0 156.0 4.07 81116A 12.0 6. l 1.0 1.4 0.122 42.5 3.90 0.350 58.0 1.000 3549 83.4 156.0 4.14
to

APPENDIX B. EXPERIMENTAL DATA
Geometry (inches) Web Steel Longitudinal Steel Failure Loads I
+-' S-1 h b al a2 A f s ALl fLl R fl T M V Ul 0 (IJ +-' Beam w w
in. C
kip. > ctl kip. kips i:: 00 No. sq. in. k. s. i sq. in. k. s. i p.s.i. - -~ in. in.
B1l17A 12.2 6.1 1.2 1.4 0.122 42.5 3.90 0.622 50.6 1.000 3969 90.4 31.3.0 8.06 B1117 12.2 6.1 1 .2 1.4 0.122 42.5 3.90 0.622 50.5 1.000 3799 83.4 278.0 7. 16 BI 118 12.2 6.1 1.~ 1. 4 o.rs9 41.5 B.90 0.933 50.5 0.667 3509 114.5 191.0 4.99 BIIlBA 12.2 6. 1 1 • ,, 1.2 0.('59 41.5 6.90 0.933 50.5 0.667 3699 111.0 191.0 4.99 B1119 12.0 6.1 o.a 1.4 0.059 41.5 6.90 0.622 50.5 1.000 3389 78.0 313.0 .4.63
00 BI 119A 12.ii 5.9 1.(1 1. 4 r.059 41. 5 3. 90 0.622 50.5 1.000 3589 79.0 313.0 4.71 -~ Ul Bil?(l 12.2 7.9 2.4 1 .4 n.122 42.5 3.90 1.592 49.0 0.240 1489 125.0 313.0 11.77 Ul (1) B ll 2"A 12.0 7.9
2 ·" 1.4 0.122 42.5 3.90 1.592 49.0 0.240 1609 130.2 339.0 12.69
~ 81121 12.0 7.9 2.('I 1.9 0.122 42.5 3.90 1. 592 49.0 0.240 1549 120.8 313.0 11.77 B1121A 12.2 7.9 2.0 1.6 0.122 42.5 3.90 l. 592 49.0 0.240 1629 99.0 313.0 11.78 11 B 11. 8 6.5 2.r, 1.2 0.('44 32.7 6.10 0.622 56.5 1.000 24Q9 41.7 206.5 10.20 l[BA 11.8 7. 1 2.3 1.2 0.044 32.7 6.10 0.622 56.5 1.000 28.89 57.3 2u6.5 10 .17 WB 11.8 6.1 2. ('. 1.2 0.044 32.7 6.10 0.622 56.5 1.000 2409 53.0 132.0 6.64 WBA 11.a 6.4 2.n 1.2 0.044 32.7 &.10 0.622 56.5 1.000 2889 57.3 143.0 7.16
B28 f'. l 11.e 7.9 1.4 1 .4 0.060 41.f' 3. 20 0.995 54.0 1.000 1223 48.6 486.0 o .• o 828 O.lA 12.0 7.9 1.4 l .4 0.060 41.C 3.20 0.995 52.5 1.000 1223 ·46.9 469.0 o .. o B28 n.2 12.2 7.9 1.4 1 .4 0.060 41.C 3.20 1.030 52.3 1.000 1023 83.4 417.0 o.o B28 n.2A 12.0 7.9 1.6 1.4 0.060 41.0 3.20 0.995 53.3 1.000 1223 83.4 417.0 o.o B2 8 r.4 12.('I 7.9 1.6 1.4 0.060 41.0 3.20 1.050 52.3 1.000 2783 146.0 365.0 o.o
> B28 r.4A 12.r 7.9 1.6 1 .4 O.C60 41.0 3.20 1.050 52.3 1.000 2783 13.9.O 347.0 o.o 0 ..!t: B28 r.4B 12. f' 7.9 1.6 1 .4 0.060 41.C 3.20 1.040 52.3 1.000 4319 · llt6.0 365.0 o.o i:: (1) B28 f'.4C 11.B 7.9 1.3 1.4 O.r"60 41.C 3.20 1.080 55.0 1.000 4319 153.0 .382.0 o.o i:: B28 0.4D 11.B 7.9 1 .4 l .4 0.060 41.(' 3.20 1.010 52.5 l .ooo. 2271 125.0 313.0 o •. o -~ ..s:: u B28 r.4E 12.0 7.9 1.4 1.4 0.060 40.C 3.20 l. 030 . 52.5 1.000 2271 132.0 330.0 o.o
828 C'.4F 11.8 7.9 1.4 1.4 0.121 40.C 3.20 1.050 53.0 1.000 2271 139.0 34 7 .0. o..o
to -.J

APPENDIX B. EXPERIMENTAL DATA
· Geometry (inc~_es) Web Steel Longitudinal St~el F allure Loads I
+> M h b al a2 K' f: s ALl fLl R f' T M V OJ 0 Beam ~1ti w w r• C kip. kip. kips
No. sq. in. k.s.i ~ 1n. sq. in. k. s. i p.s.i. .s.~ I in. in. 88 K 12.2 7.9 1.4 1.; 4 o. 07 9 44.5 13, 20 . 1.010 54.5 1.000 1359 125.0 o.n o..o 88 KA 12.2 7.9 1.4 1.4 0.019 44.5. 13.20: 1.010 54.5 1.000 2399 153.0 o.o Q.G 88 0.1 12.2 7.9 1.4 1.4 0.019 44.5 3.20: o.9ao 54.5 1.000 1759 52.0 520.0 12.52
· 88 O.lA 12.2 1.9 1.4 1.4 0.019 44.5 3.20. 1.030 55.8 1.000. 1759 ss.s 555.0 13.36 88 0.2 11.e 1.9 1.4 1.4 0.079 44.5 3.20 1.000 56.2 1.000. 1535 90.0 451.Q 10.85 88 0.2A 12.2 7.9 1.4 1.4 o.;019 44.5 3.20. 1.040 52.0 1.000 1759 97.0 486 .. 0 l·l.69
B8 0.4 12.2 7.9 1.4 1.4 0.079 44.5 3.20 1.040 56.4 1.000 1727 132.0 347.0 8.42 88 0.4A 12.0 7.9 1.4 1.4 0.079 44.5 3.20. 1.030 57.6 1.000 ·. 2223 139.0 347.0 8.38 87 0.2 12.0 1.q 1 •. 4 l .4 o.os9 4,l.6 3.20 1.040 55.1 1.000 153151 93.8 468.0 11.30 87 ·o .2A 12.0 7.9 1.4 1.4 0.059 41.6 3.20. 1.010 55 .• 5 · 1.000 1927 90.;2 451.0 1().,.87 810 0.2 12.0 7.9 1.4 1.4 0.111 40.8 3.20 1.020 5.2.5 1.000, 2215 104.0 521.0 l2.53 8tO·o.2A 12.2 7.9 1 .4 1.4 0.111 40.8 3.20. 1.020 53.0 1.000 - 2399 104-0 521.O 12..53 81 · 7.9 8.7 1.4 1 .4 0.074 63.5 3.20 1.440 53.3 1.000 4087 90.3 452..Q lG.82 BIA 7.9 8.1 "1-.4 1·;4 · o---tt-~ -6¼..-- 1 • .zo - 1.490 55.0 1_.000. 3935 90~3 452.Q 12 •. 75 82 11.a 8.7 1.4 1 .4 0.074 63.; 5 , 3. 20 l.490' 47.8 1.000 .· 4087 119.0 694.O 16-.65 BZA 11.e 8.1 1.4 1.4 0.074 63.5 3.20: 1.460 531110 l.;'QOO · 4095 · 139.0 694.0 16.65 83 11.a 8.7 1.4 l .·4 0.014 63.5 3.20 • 1.440 51.Q 1.000 3927 194.0 486.0 17.48 83A i.1.a 8.7 1 .4 1.4 0.074 63.5 1.20 1.490 51.0 1.000: 3921 194.0 486.0 11.48 85 15.7 8.7 1.4 1.4 0.074 63.5 3.20 · 1.460 54.6 1-.:000 370~ · 19!t.O 972.0 23.24 = 85A 15.7 8.1 1 .4 .l.4 0.074 63.5 3.21): 1.480 48.8 1.000 4135 194.0 972.0 23~_24 •.-1
ci! 86 15.7 6.7 1.4 1.4 0.074 63.5 3.20. 1.460 47.lt 1.:000 .· 4215 · 167.Q 833 •. 0 20..19 ~ 86A 15.7 6.7 1.4 1.4 0.014 63.5 3.20 · 1.460 47.0 1.000 .. 41)5 181.0 903.O. U.88 ...:i
87 11.8 7.9 1.4 1.4 0.270 37.0. 4 .. to : · 1.060 47.0 1.000 2655 221.0 o.o 4).;Q 87A 11.e 7.5 1.2 1.2 o..;21O 37.0. 4·.10: 1.060 47.0 1.-000 2655 20&.o o.o o.o' 88 11.8 1.5 1.2 1.2 0.010 68.l 4.10, 1.010 49.2 1.000. 2591 1S6.0 156.0 3.83 88A 11.e 1.9 1.4 1.4 · 0,010 68.7 4.to · 1.060 47.0 1.:000 - 2615 156.0 156.0 3.63 89 9.1 5.9
1 ·"' 1.4 0.015 50.7 4.10. 1.000 so.a 1.000: 1023- 39.0 '2G&.A 10.QS
89A 9.1 .5.9 1.4 l .4 0~015 50.7 4.10 - 1.010 52.6 1.000 1087 1t1.o 235.0.. 11:.39 B10. 9. 1 7.1 1.4 1.4 0.015 50.7 4.10; 1.060 47.G 1.000. 967 36.,4 182.0 8.82 BlOA 9.1 5.9 1 .4 :1.4 0.075 5C>.7 4.10. 1.060 47.0 1.000. lOil. ltl.8 209.0, m.13 811 9.1 5.9 1.4. 1.,.. 0.075 50.7 ,..10 0.101 57.3 1.000 1,055 ·36.6 209.0 10.10 811A 9.1 5.9 l.4 1 _,. 0.:015 so.1 1t.10 0.670 Slt.7 1.000. 1119 36.t6 209..0 16.lG 812 9. 1 5.9 1.4 1.4 O'J0l5 50.7 1t.1O 0.682 56.0. 1.000, 887 . 21t.2 1&.4 3.1a 812A 9.1 5.9 1.4 l _,. O.;O75 so.1 4.10 - ()~682 56.0. 1.000 921 Jl;.z, lOt-"4 s.01
' tt'. . ' 0

APPENDIX B. EXPERIMENTAL DATA
Geometry (inches} Web Steel Longitudinal Steel Failure Loads I t/l ~ h b al a2 A f s ALl fLl R f' T M V Q) .8 !Beam w w . in. C
~ ~ SQ. in. k.s.i sq. in. k. s. i p.s.i. kip. kip. kips
No . 1n. 1n. ...... ...... 1 6.3 3.5 1 .o 1.0 n.031 64.0 5.90 0.244 49. 8 0.422 1351 1.2 36.2 1.84 2 6.3 3.5 1.n 1.0 o.o 31 64.0 5.90 0.244 49.8 0.422 1351 1.2 36.2 1.84 6 6.3 3.5 1.r 1.0 0.031 64.r 5.90 0.244 49.8 0.422 1351 4.6 45.7 2.32 7 6.3 3.5 1.0 1.c 0.031 64.0 5.90 0.244 49.8 0.422 1351 9.9 49.3 2 .. 51
1 ri , 6.3 3.5 1.0 1.0 0.031 64.0 5.90 o.244 49.8 0.422 1351 5.9 59.0 3 .• oo 3 6.3 3.5 1.r 1.0 0.031 r64.C 2.95 0.244 49.8 0.422 1351 11. 9 59.4 3.02 4 6.3 3.5 l. C 1 .o O.f'31 i64.0 2.95 0.244 49.8 0.422 1351 11.9 59.4 3.02 A 6.3 3.5 1.0 1.0 O.f-31 64.0 2. 95 0.244 49.8 0.422 1351 13. l 65.3 3.32
::::: CJ I 6.3 . 3.5 1.n 1.n o .r 31 :64.o 2.95 0.244 49.8 0.422 1351 13. l 65.3 3.32 ...... "Cl 11 1.0 0.031 64.r 3.94 0.312 49.8 1.000 2319 14. 3 71.7 3.65 ;:I · 6.3 3.5 1.2 >i 121 6.3 3.5 1.2 l .o O.C'31 64.0 3.94 0.312 49.6 1.000 2319 11.1 55.7 2,.83
13 6.3 3.5 1.2 1.0 o.o 31 64.0 3.94 0.312 49.8 1.000 2319 11. 1 55.7 2.83 17 6.3 3.5 1.2 1.0 0.031 64.0 7.87 0.312 49.8 0 .500 _ 2175 7.2 36.0 1.83 18 6.3 3.5 1.2 1.0 0.031 64.0 1. 87 0.312 49.8 0.500 2175 7.9 39.4 2.00 1 g 6.3 3.5 1.2 1.0 0.031 64.0 7.87 0.312 49.a 0.500 2175 7. 9 39.lt 2.00 2,:, 6. 3 3.5 1.2 1.0 0.031 64.0 7.87 0.312 49.8 o.soo 2175 9.1 45.7 2.32 21 6.3 3.5 1.2 l .o 0.031 64.0 7.87 0.312 49.S: 0.500 2175 7.9 39.4 2.00 22 6.3 3.5 1.c 1.0 0.031 64.0 7.87 0.156 49.8 2.000 2175 6.5 32.6 l.b6 -HBl o.a
1o.a 7.6 6. 1 0.049 46.(' 4.00 0.220 59.0 0.759 6919 44.l o.o o.o
HB2 7.6 6. l 0.0 1 0.a 0.049 46.0 4.00 0.220 59.0 0.759 6463 33.9 66.8 o.o HB3 7.5 6.0 o.a-·0.0 0.('149 46.(l 4.CO 0.220 59.0 o. 759 6359 20.4 75.3 o.o
s... HB4 7.7 6.1 o.a o.a 0.(149 46.0 4.00 0.220 59.0, 0. 759 7000 15.7 81.6 o .• o Cll ~ HB5 7.5 6.0 o.a 0.8 0.049 46.0 4.00 0.220 59.0 0.759 6063 13.2 81.5 o..o s... Cll HB7 9.0 6.1) 0.8 0.0 0.049 40.8 4.00 0.220 54.5 0.895 5119 36.l o.o o.o
(/) HB8 9.0 6.0 o.a 0.8 0.049 40.8 4.00 o. 220 54.5 Q.895 5099 21.4 79.6 o.o 'O
::::: H89 9.0 6.0 o.a o.e 0.049 46.0 4.00 o. 22() 59.0 0~759 4031 18.3 85.1 o.o Cll HB 10 9.1 6.0 0.8 o.8 0.049 46.0 4.00 0.220 59.0 0.759 6439 17.3 , 91.3 o.o t/l
HB 11 9. ') 6.0 0.0 o.e 0~049 46.0 4.00 0.220 59.0 o.759 5199 14.1 94.0 o.o ::::: Cll HB 13 12.0 6.0 o.a o.a 0 .() 49 40.8 4.00 0.220 54.5 0.895 5159 51.3 o.o o.o ::> ~ HB 14 12.1 6.0 o.8 0.8 0.049 46.0 4.(0 0.220 59.0 0.759 5199 41.7 82.l o.o
HB 15 12.0 6.0 0.0 0 .8. 0.049 40.8 4.00 0.220 54.5 0.895 5159 29.9 111.0 o.o HB 16 12.1 6.0 o.a o.a 0.049 46.0 4.00 0.220 59.0 0.759 4031 23.5 129.0 o.o HB 17 12.0 6.0 o.8 0.8 I O.C,49 46.C, 4.00 0.220 59.0. 0.759 6439 19. 4 137.0 O.O'
b:: ,c

C.1.
APPENDIX C.
OPTIMUM VALUE OF r.
The total volume of reinforcement per unit length of beam is
given by:
= C l AL l ( 1 + kr) . . . . . . A. 1
where 2
( l+R)b ..... A.2
and
c 1 = l+R.
For a given size of beam both C 1 and k are constant if the ratio
of top to bottom steel remains constant. The area of steel ALI to
prevent the most common type of failure, mode l, is, from Equation
5. 14,
2r [/ 1 2 1 + 2 oc. ALI = T 1' (h-al - xl) 1+2oC. ('1_,) + r
When this is substituted for ALI' equation (Al) becomes:
W=C 2
where c 2 is a constant.
..... A . .3
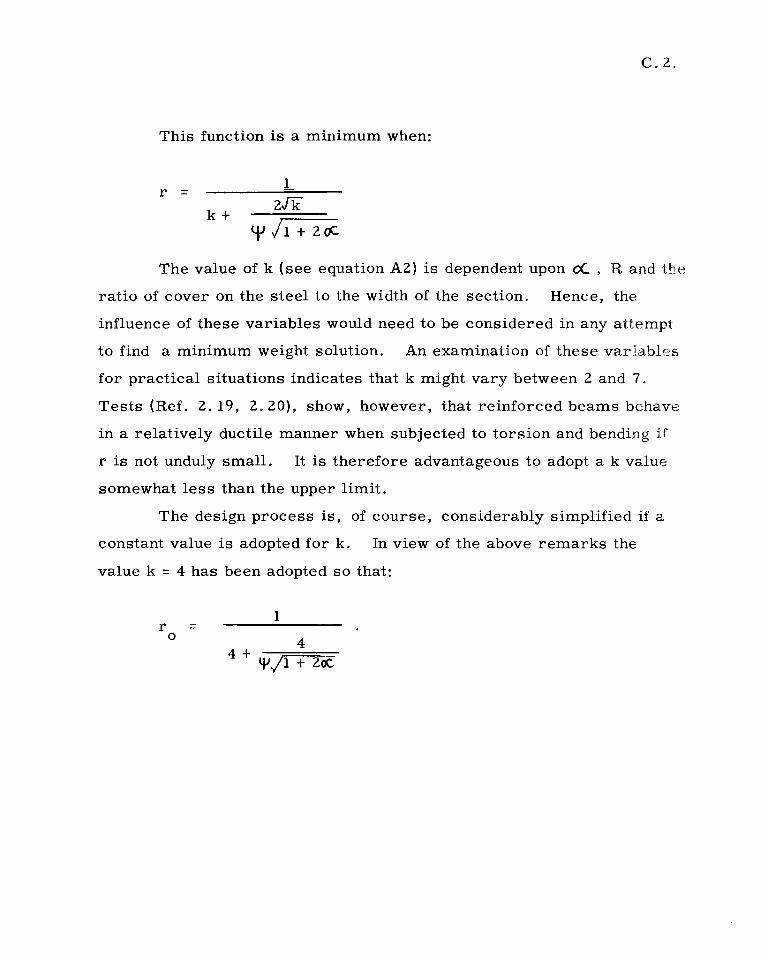
C. 2.
This function is a minimum when:
1 r =
k+
The value of k ( see equation A2) is dependent upon <X... , R and the
ratio of cover on the steel to the width of the section. Hence, the
influence of these variables would need to be considered in any attempt
to find a minimum weight solution. An examination of these variables
for practical situations indicates that k might vary between 2 and 7.
Tests (Ref. 2. 19, 2. 20), show, however, that reinforced beams behave
in a relatively ductile manner when subjected to torsion and bending if
r is not unduly small. It is therefore advantageous to adopt a k value
somewhat less than the upper limit.
The design process is, of course, considerably simplified if a
constant value is adopted for k. In view of the above remarks the
value k = 4 has been adopted so that:
r = 0
1
4 4+
(J}fl + Zoe

D.l.
APPENDIX D.
The experimental data listed in Appendix B have been analysed,
and the results of the analysis are presented in this appendix. The
failure loads of each beam have been expressed in terms of the three
ratios T / T , M/ M and V /V . T is the pure torsional strength of the 0 U O 0
beam as calculated from the theory set out in Chapter 5 {see Equation
5. 24). M is the calculated flexural strength and V is the shear capacity U 0
of the beam as given by the A. C. I. code.
The parameters r/r , pf /f' and V ff/bd (7;., which are listed 0 y C e C
in the table, are related to the restrictions on the theory discussed in
Chapter 7.
i. e.
r/r t 0.9 {D. 1) 0
pf /f-' :t> 0.40 {D. 2) y C
V eff/bd /f~ 1>- 8. {D. 3).
Beams which do not satisfy the above requirements have been
included in the table, but they have been marked with the letters R, P
and V if they violate the limits set out in equations {D. 1), {D. 2) and
{D. 3) respectively.
For each beam the theoretical failure torque has been calculated
in four ways, from the Modes 1,2 and 3 equations and from the effective
shear formula. These values have been expressed in the table as the
ratios T /Tth . Also listed in the table is the critical value of exp eor
T /Tth and its associated mode. exp eor
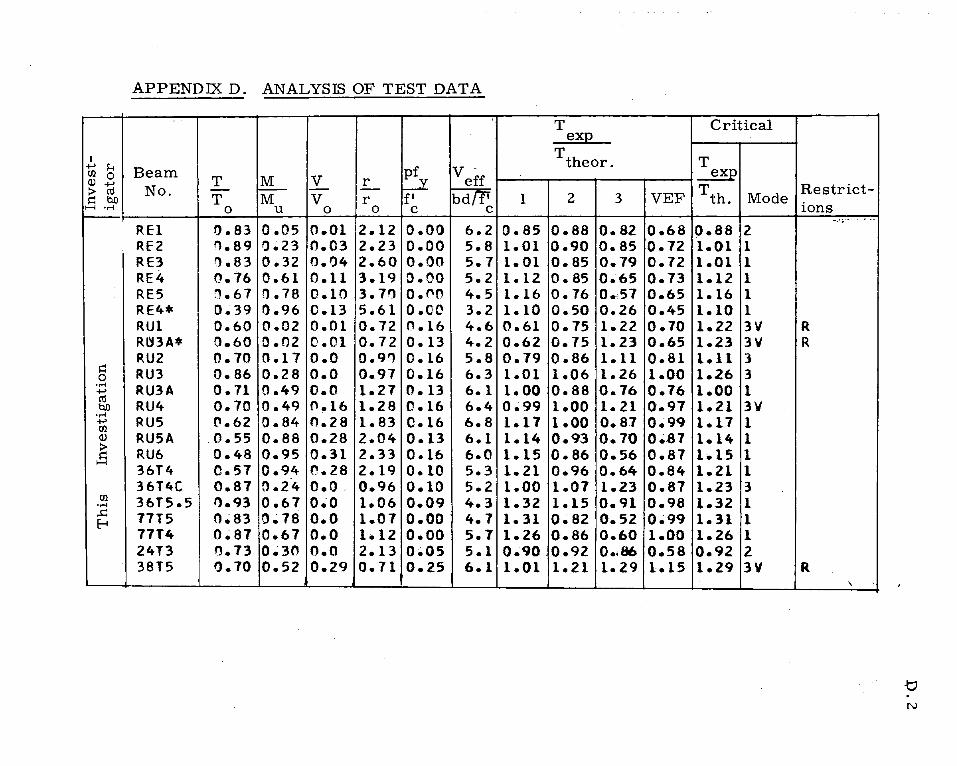
APPENDIX D. ANALYSIS OF TEST DATA
T Critical ex:e
I T T +-' ~ pf V -· theor.
Ul 0 Beam T M V ~
Cl) +-' No.
r :J. eff Tth. Restrict-> ro - I- - -
~ 00 T M V r f' bdfI': 1 2 3 VEF Mode H •.-I 0 u 0 0 C C ions
-.;•-,;'~'••·I••
REl 0.83 0.05 0.01 2.12 o.oo 6.2 0~85 o.aa o. 82 0.68 0.88 2 RE2 0.89 0.23 0.03 2.23 o.oo 5.8 1.01 0.90 0.85 0.72 1.01 1 RE3 I) .83 0.32 0.04 2.60 o.oo 5.7 1.01 0.85 0.79 0.72 1.01 1 RE4 o.16 0.61 0.11 3.19 o.oo 5.2 1.12 o. 85 0.65 0.73 1.12 1 RE5 n.67 0.78 0.10 3.7'l O.f'O 4.5 1.16 o. 76 o.s1 0.65 1.16 1 RE4* 0.39 0.96 0.13 5.61 o.oo 3.2 1.10 0.50 0.26 0 • .45 1.10 1 RUl 0.60 0.02 0.01 0.12 0.16 4.6 0.61 0.15 1.22 o. 70 1.22 3V R R~3A* 0.60 0.02 0.01 0.72 0.13 4.2 0.62 0.75 1.23 0.65 1.23 3V R RU2 0.10 0.11 o.o 0.9'l 0.16 5.8 0.19 0.86 1.11 0.81 1.11 3
~ RU3 0.86 o.za o.o 0.97 0.16 6.3 1.01 1.06 1.26 1.00 1.26 3 0 ...... RU3A o. 71 0.49 o.o 1.21 0.13 6.1 1.00 o.ae 0.76 0.76 1.00 1 +-' ro RU4 0.70 0.49 0~16 1.28 0.16 6.4 0~99 1.00 1. 21 0.97 1.21 3V 00 ...... RU5 0.62 0.84 0.28 1.83 0.16 6.8 1.11 1.00 0.87 0~99 1.11 1 +-'
Ul (I.) RU5A 0.55 0.88 0.28 2.04 0.13 6.1 1.14 0.93 0.10 0~87 1.14 l ~ RU6 0.48 0.95 0.31 2.33 0.16 6.0 1.15 0.86 0.56 0.87 1.15 1
H 36T4 o.57 0.94 0.28 2.19 o. 10 5.3 1.21 0.96 0.64 0~84 1.21 1 36T4C 0.87 0.24 o.o 0.96 0.10 5.2 1.00 1.01 1.23 0.87 1.23 3
Ul 36T5.5 0.93 0.67 o.;o 1.06 0.09 4.3 1.32 1.15 0.;91 0.98 1.32 l ...... ..c: 77T5 0~83 o.;1e 0~0 1.01 o.oo 4. 7 1.31 o.;a2 0.52 o.;99 1.31 1 ~
7714 0.87 0.67 o.o 1.12 o.oo 5.7 1.26 0.86 0.60 1.00 1.26 1 24T3 0.73 o.;30 o.o 2.13 o.;os 5.1 0.90. 0.92 0.;86 0.58 0.92 2 38T5 0.70 0.52 0.29 o. 71 0.25 6.1 1.01 1.21 1.29 1.15 1.29 3V R
'
-t:,
N

APPENDIX D. ANALYSIS OF TEST DATA
I +' ~ pf v-00 0 Beam T M V r eff (l) +' - __J_ > c,j No. T M V r fl bd/F s:: 0.0
1--l •H 0 u 0 0 C C
Vl 0.30 0.65 1 .15 0.11 0.29 4.9 Vl* 0.47 0.50 0.89 0.43 0.29 4.9 V2 0.41 0.49 0.88 0.47 0.29 4.9 V2* 0.67 0.2n 0.37 0.19 0.29 5.0 V3 0.13 0.82 1. 44 2.02 0.29 4.9 V3* 0.61 0.47 0.84 0.33 0.29 4.9 V4 0.71 0.29 0.53 0.22 C.29 4.9 V4* 0.31 ').79 1.40 0.88 0.29 4.9 V5* r,. 1() o.o o.n 0.10 0.29 4.5 V6 () .19 o.ao 1.41 l .3 8 0.29 4.9
s:: V6* 0.64 () .41 o.74 0.30 0.29 4.9 0 V7 0.65 0.35 0.49 0.26 0.29 4.8 •H +' V7* o.ao 0.25 0.61 0.19 o. 29 5. 1 c,j bD Ul 0.66 o.o o.o 0.15 0.29 5.9 •H +'
0.33 0.3') 00 Ul* 0.61 0.24 n.29 6.5 (l)
> U2 0.21 0.82 1.11 1.33 0.29 6.5 s:: U2* 0.53 0.38 0.52 0.43 0.29 6.5 -00 U3 0.51 0.63 0.86 0.64 0.29 6.5 •H ..c:: U3* 0.41 0.86 1.16 0.97 0.29 6.5 E-t Tl 0.65 0.69 0.59 0.11 0.18 5.3
T2 0.80 0.22 0.18 0.38 0.1a 4.1 T4 0.46 1.11 0.93 1.44 0.18 5.5 T4• 0.70 0.78 0.66 0.79 0.18 5.3 T5 0.55 0.92. 0.11 1.01 0.18 5.4 TS* 0.65 o.o o.o. 0.24 0.18 3.0 T6 0.12 0.42 0.36 0.53 0.1a 5.1 T6* 0.25 1.24 1.04 2.65 0.18 5.7
T exp
T theor.
1 2 3
p. 76 1.04 0.13 p. 78 1.10 0.36 p~ 72 l .01 0.28 IQ.77 1.03 0.90 o. 84 1.01 0.02 K).89 1.24 0.57 ~.87 1.11 0.87 p.90 1.21 0.12 ~- 70 0.84 1. 21 o. 84 1.07 o.os ~.88 1.22 0.65 p.85 1.01 0.12 0.94 1.34 1.07 0.66 o.ao 1.14 ~- 74 0.95 0.11 p.90 1.01 0.09 p.15 0.96 0.51 p.92 1.15 o. 35 l .02 1.21 0.18 1.08 1.50 0.64 0.92 1.34 1.63 1.21 1.54 -o.18 1.19 1.64 0.66 1. 17 1.52 0.31 p.65 0.95 1.51 Q.96 1.38 1.15 1.29 1.35 o.os
VEF
1.64 1.67 1.54 1.46 l.65 l.85 1.69 1.91 1.24 1.12 1.80 1.58 1.88 1.11 1.30 1.53 · l .34, l.66 1.ao 1.39 1.1a. 1.~· 1.53 1.45 0.86 1.25 1.36
Critical - .
T ~
Tth. Mode
1.64 VEF 1.67 VEF 1.54 VEF 1.46 VEF 1.65 VEF 1.85 VEF 1.69 VEF l.91 VEF 1.24 VEF 1.12 VEF 1.80 VEF 1.sa VEF 1.88 VEF 1.14 3 1.30 VEF 1. 53 VEF 1.34 VEF 1.66 VEF 1.80 VEF 1.50 2 11-63 3V t."54 2 1.64 2 1.52 2 1.55 3 1.38 2 1.36 VEF
Restrict-ions
R R R R
R R R R
R R R R R
R R
R R
R
R R
t, ~

T Critical
I r.-+-' ~ pf V theor. T rJl 0 M V Q) +-' Beam T r LY.. eff , ex:e Restrict-> C1I No. T M V f' . bd/1' 1 2 3 VEF Tth. Mode i::: bJ) r 1-1 •r-4 0 u 0 0 C ., C ions
R4.20 0.61 0.82 o.;o 1.01 0.32 6.7 1.15 0.79 0.42 0.96 1.15 1 R4.24 o.;54 0.65 o.o 1.04 0.37 8.1 0.96 0.69 0.40 0.97 0.97 VEF V R3.20 0.62 o. 73 o.o 0.91 0.21 6.0 1.oe 0.78 0.46 0.81 1.08 l R3.24 n.61 0.66 o.o 0.94 0.29 7.0 1.02 0.11 0.48 0.90 1.02 l R3.30 0.65 0.60 o.o 0.93 0.21 7.8 1.02 0.82 0.59 0.99 1.02 l R2.24 0.71 0.84 o.o 1.1'0 0.18 4.9 1.24 o.;94 o.so o.;e4 1.24 1 R2.30 0.74 0.11 o.o 0.97 o. 18 5.7 1. 18 0.88 0.61 0.85 1.18 1 R2.38 ,. 73 0.56 (' .o 0.94 0.11 6.7 1.06 0.87 0.69 o.8a 1.06 1 t
Rl.30 0.67 0.65 o.o 0.97 0.13 5.0 1 .07 o.;a3 o.54 o.76 1.01 1 R4A 0.58 0.23 0.21 0.43 0.38 a.o o. 70 0.89 1.09 1.09 1.09 l3V R R4B 0.59 0.41 0.37 0.57 0.38 9.0 0.83 1.01 o.;92 1.21 1.21 \IEf V R °k4.20A 0.58 0.55 0.45 1.13 0.32 13.1 0.91 0.98 0.9.3 1.60 1.60 VEF V R4.208 0.57 0.37 0.31 0.93 0.32 11.2 o.79 o.;90 l.M 1.44 1.44 VEf V R4.24A 0.56 0.63 0.44 1.01 0.37 12.5 0.96 0.96 o. 88 1.50 1.50 VEF V R3A 0.61 n.21 0.21 0.63 C'l.31 8.9 0.76 0.90 1. 10 1.22 1.22 VEF V R R3B 0.55 0.48 0.38 0.90 0.31 ll.l 0.84 0.92 0.79 1.21 1.21 VEF V ; R3.20A 0.67 0.53 0.38 0.82 0.21 9.9 0.98 1.11 1.01 1.37 1.37 VEF V R
..c:: R3.21)8 0.64 0.23 0.11 0.56 0.21 7.5 0.76 0.93 1.19 1.12 1.19 3V R rJl R3.24A 0.55 0.21 0.21 0.11 0.29 9.4 0.10 0.81 0~98 1.15 1.·1s VEF V R ..... C1I R3.24B 0.53 0.4:6 (\.34 1.01 0.29 11.6 o. 81 0.87 0.81 1.26 1.26 VEF V ~ R3.30A 0.54 0.59 0.42 1.36 0.21 12.5 0.91 0.91 0.1s 1.42 1.42 VEF V
R3.30B 0.55 0.25 0.19 0.89 0.21 9.5 0.69 o.ao 1.02 1.21 1.21 VEF V R R2A 0.79 0.45 0~25 0.78 0.19 8.4 1.05 1.14 1.14 1.21 1.21 VEF V R R2B 0.12 0.32 0.18 0.10 0 .19 1.1 0.90 l .01 1. 10 1.06 1.-10 3\1 R R2.24A 0.93 o.s1 0.31 0.75 0.18 8.1 1.25 1.36 1.30 1.37 1~37 VEF V R R2.30A 0.63 0.42 0.23 1.00 0.18 9.4 0.88 0.92 0.90 1.oa 1.08 VEF V R2.30B 0.64 0.29 0.16 0.85 o. 18 8.3 o.so o.aa 0.99 1.02 1.02 VEF V R ' R2.38A 0.62 0.48 0.26 1.24 0.11 10. 1 0.91 0.92 0.87 1.16 1.16 VEf V RZ.388 0.56 0.28 0.16 1.03 o. 17 9.0 0.12 0.11 0.86 0.96 0.96 VEF V
. Rl.30A 0.61 0.43 0.21 0.96 0.13 7.5 0.86 0.94 o. 77 0.89 0.94 2 IU.308 0.59 0.21 o. 14 1).79 0.13 7.4 0. 74 o.as o. 82 0.19 o.as 2 R
t5 VJ
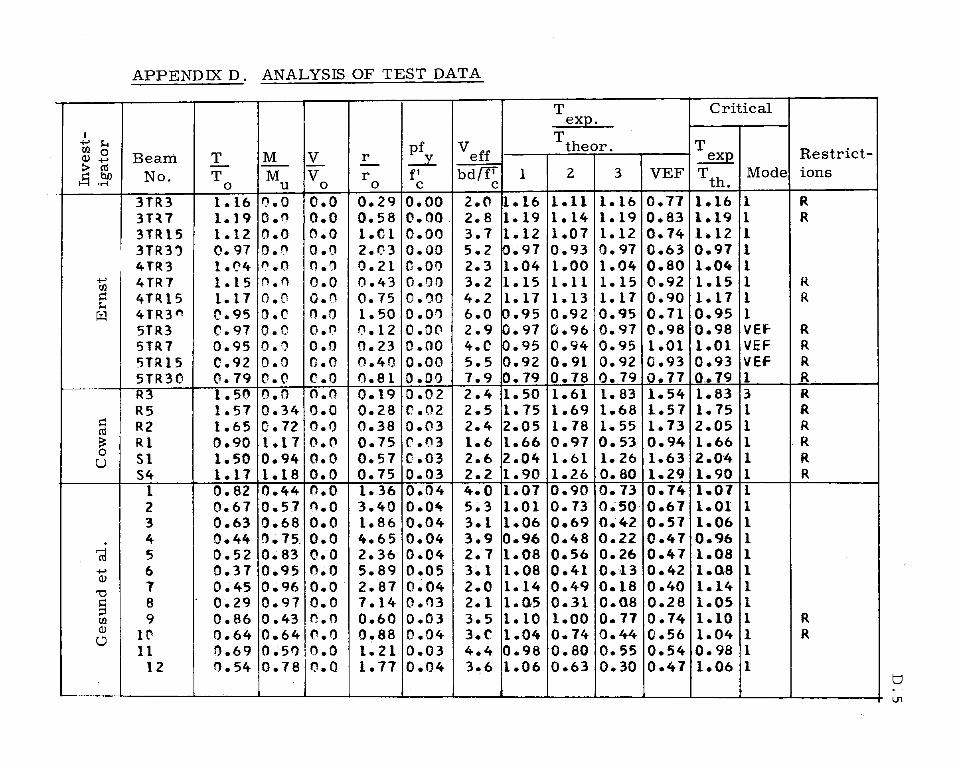
APPENDJX D. ANALYSIS OF TEST DATA
I I I I I T I Critical ~-I T +-' H pf veff theor.
T exp I I Restrict-C/l 0 M V a, +-' Beam T r :.J.... > ctl No. T M V f' bd/"f' 1 2 3 VEF Th Mode ions i::: bD r
1-t .,-1 0 u 0 0 C C t . 3TR3 1.16 ,, • 0 o.o 0.29 o.oo 2.0 1.16 1.11 1.16 0.77 1.16 1 1: 3T~7 1. 19 o.o o.o 0.58 o.oo. 2. 8 1.19 1.14 1.19 0.83 1.19 1 3TR15 1.12 n.o o.o l .o l o.oo 3.7 1.12 l .07 1.12 o,. 74 1.12 1 3TR3'J o. 97 o.o o.o 2.03 o.oo 5.2 0.97 0.93 0.97 0.63 0.97 1 4TR3 l .('4 n.o o.o 0.21 o.oo 2.3 1.04 l .oo 1.04 o.so 1.0,. l
+-' 4TR1 1.15 o.n o.o 0.43 o.oo 3.2 1.15 1.11 1.15 0.92 1.15 1 1: C/l i::: 4TR15 1. l 7 o.o o.o 0.1s 0.00 4.2 1.17 1.13 1.11 0.90 1.11 l H
µ:J 4 TR3 f' 0.95 o.c o.o 1.50 o.o, 6.0 (l.95 0.92 0.95 0.11 0.95 l 5TR3 C.97 o.c o.ii 0.12 0 .00 2.9 0.97 0.96 0.97 0.98 0.98 VEf R 5TR7 0.95 o.o o.o 0.23 o.oo 4.0 0.95 0.94 0.95 1.01 1.01 VEF R 5TR15 C.92 o.o o.o 0.40 o.oo 5.5 0.92 0.91 0.92 0.93 0.93 VEf R 5TR30 0.19 c.o c.o 0.81 o.oo 7.9 0.79 0.78 0.79 0.11 0.79 1 R
~·· R3 1.50 o.o o.o 0.19 0.02 2.4 1.50 1.61 1. 83 1.54 1.83 3 R R5 1.57 0.34 o.o 0.28 c.02 2.5 1. 75 1.69 1.68 l.57 1.75 1 R
@ I R2 1.65 0. 72 o.o 0.38 Q.03 2.4 2.05 1.78 1. 55 1.73 2.05 1 R
51 Rl 0.90 1.1 7 o.o 0.75 0.03 1.6 1.66 0.97 o. 53 0.94 1.66 1 .R Sl 1.50 0.94 o.o 0.57 0.03 2.6 2.04 1.61 1. 26 1.63 2.0,4 1 R S4 1.11 1.18 o.o 0.75 0.03 2.2 1.90 1.26 o. 80 1.29 1.90 1 R
1 0.82 0.44 o.o 1.36 0.04 4.0 1.07 0.90 o. 73 0.14 1.01 1 2 0.67 0.51 o.o 3.40 0.04 5.3 1.01 o. 73 0.50 0.67 1.01 1 3 0.63 0.68 o.o 1.86 0.04 3.1 1.06 0.69 0~42 0.57 1.06 1
. 4 0.44 o. 75. o.o 4.65 0.04 3.9 0.96 0.48 0.22 0.47 0.96 1 .---I 5 0.52 o. 83 o.o 2.36 0.04 2.7 1.08 o.56 0.26 0.47 1.08 1 ctl +-' 6 0.37 0.95 o.o 5.89 0.05 3. 1 1.08 0.41 0.,13 0.42 1.oa 1 a,
"Cl 7 0~45 0.96 o.o 2.87 0.04 2.0 1.14 0.49 0.18 0~40 1.14 1 i::: 8 0.29 0.97 o.o 7.14 0.03 2.1 1.05 0.31 o.oa 0.28 1.os 1 ;:::s
9 0.86 0.43 n.o 0.60 Q.03 3.5 1.10 1.00 0.11 0.74 1.10 1 1: C/l a, 1~ 0.64 0.64 r.o 0.88 0.04 3.C 1.04 o.74 0.44 0.56 1.04 1 0
11 0.69 0.5') o.o 1. 21 0.03 4.4 0.98 o.80 o.ss 0.54 0.98 l 12 0.54 0.78 o.o 1.11 0.04 3.6 l .06 0.63 0.30 0.47 1.06 1
t,
U1

APPENDIX D. ANALYSIS OF TEST DATA
T Critical ex:e.
I T +-' ~ pf T 00 0 Beam T M V veff theor.
Q,) +-' r :...J... ex:e :> co - -bd{fi
Restrict-i:: b.O No. T Ml\ V r f' 1 2 3 VEF Tth. Mode >-< •.-1
0 0 0 C C ions
BKl I). 97 o.c 0. I) l .65 o.oo 6.6 0.97 0.98 0.97 o.80 0.98 2 BKlA n.a4 o.o n.o 1.59 o.oo 6.7 0.84 0.87 0.84 0.73 0.87 2 BK2 r).93 o.o o.o l. 36 o.oo 9.3 0.93 0.91 0.93 1 .oa 1.08 VEF V BK2A r).95 C'.O o.o 1.36 o.oo 9.1 0.95 0.94 o. 95 1.08 1. 08 VEf V BK3 1.15 o.o r.o 0.82 o.oo 8.2 1.15 1.19 1.15 1.21 1.21 VEf V R BK3A r,.98 0.0 o.o 0.82 I).CO 9.0 0.98 1.01 0.98 1.13 1.13 VEF V R BU4 1).76 1.03 ". I) 1.03 0.97 5.9 1.43 0.98 0.49 1.06 1.43 l p
BU4A l"I. 70 0.97 c.o l.C7 1. 0:) 6.2 1.34 C.90 0.45 1.04 1.34 l p
BU5 0.38 ".:I .19 o.o 1.c2 o.oo 13.3 0.48 0.39 0.30 0.81 0.81 VEF V BUSA n.35 C-.36 ,, • 0 1.43 o.oo 10 .4 o.sa 0.37 0.22 0.75 0.1s VEF V BU6 0.48 0.60 n.o 2.29 o.oo 6.9 0.87 o.so 0.26 0.1s 0.87 1 BU6A n.51 0.36 o.o 1.74 o.oo 8.5 o. 72 C,.52 0.36 o.76 o. 76 VEF V B117 !).61 1. 2 9 1.11 1.23 o. 95 9.3 1.53 1.73 0.28 2.01 2.01 VEF V p
Bll7A 1.54 1.16 1.09 1.23 0.82 9.5 1.37 1.57 0.24 1.87 1.87 VEF V p b.O 8118 0.55 0.87 0.75 1.57 n.34 12 .6 1.13 1.02 0.39 1.78 1.78 VEF V •.-1 00 B118A n.s3 0.83 0.68 l. 5 2 G.29 12.0 1.09 1.05 0.38 1.63 1.63 VEF V 00 Q,) B 119 "-61 0.34 0.30 0.87 0.32 12. 4 0.81 0.93 o. 82 1.43 l .43 VEF V R ~ BII9A 0.66 0.34 r.2a 0.81 0.29 ll.3 0.85 1.02 0.91 1.43 l .43 VEF V R
BI 111 t'.68 0.12 C.46 1.56 c.22 9.6 1.13 1.18 0.71 1.41 1.41 VEF V 81 Il OA 0.66 0.68 0.41 1.54 0.21 9.6 1.oa 1 .09 0.10 1.30 1.30 VEF V 81111 0.62 0.33 0.22 1.15 0.23 10. l o. 81 0.88 0.85 1.13 1.13 VEF V 8111111 0.62 ('1.35 n.23 1.18 0.23 1c. o 0.82 o.aa 0.83 1.10 1.10 VEF V BI 112 0.60 C.25 ,,.29 0.46 0~37 7 .1 O.74 0.95 1.01 1.23 1.23 VEF R 81112A 0.59 C.26 0.32 0.47 O.37 7.1 0.74 0.97 1.04 1.21 1.21 VEF R 81113 0.62 ').11 o.ao 0.85 o. 62 10.6 1.12 1.38 0.54 1.83 l. 83 VEF V R p B II 13A 0.74 0.83 0.90 0.19 0. 52 11.0 1.21 1.58 0.74 2.17 2.11 VEF V R p 81114 0.6") '1.58 0.64 n.61 0.57 8.9 0.96 il.40 0.62 1.56 1.56 VEF V R p BI 114A 0.78 C.72 0.81 0.54 0.51 8.3 1.22 1 1.91 o.ao l.98 1.98 VEF V R p B1115 o.ao O.0a 0.44 1.59 0. 13 1.1 1.35 1.40 o. 75 1.35 1.40 2 81115A ,.,.._ 76 0.89 0.43 1.74 n.12 1.1 1.33 1.30 0.70 1.29 1.33 l
' 81116 0.89 0.11 n.13 l .98 o.oo 5.4 1.31 l .08 0.11 0.89 1.31 l j B1l16A n.a2 0.74 r.13 2.08 0.0() 5. l 1.21 1.01 0.70 0.81 1.21 l ,____ -
tl O'

APPENDIX D. ANALYSIS OF TEST DATA
T Critical eXQ,
I pf. veff T T
+> s.. Beam T M V r theor. eXQ Ul 0 :..J... Restrict-Q) +> No. T M V r f' bd/F .l 2 3 VEF T Mode > cd ions i::: bi> 0 u 0 0 C C th.
- •r-1
81117A 0.74 0.97 0.24 1.85 0~00 5.5 1.37 0.98 0.54 0.94 1.37 l BI 117 0.68 0.87 0.22 1. 81 o.oo 5.7 1.24 0.90 o.so .Q.88 1.24 1 81118 1.11 0.40 0.22 0.40 0.07 5.5 1.33 1.47 1.18 1.56 1. 56 VEF R 81118A 1.03 0.40 0.22 0.44 0.06 5.5 1.25 1.31 1.09 1.51 1. 51 VEF R
bi> B1119 0.90 0.96 0.21 0.96 o.oo 4.2 1. 50 . 1.16 o.74 1.15 1. 50 l •r-1 Ul 81119A 0.98 0.98 0.22 0.90 o.oo 4.2 1. 59 1.23 o. 80 1.22 1.59 1 R Ul Q) 81120 0.75 0.61 0.49 0.96 0.51 10.5 1.11 1.19 0.96 1.55 1.55 VEF \i p ~ 81120A 0.70 0.59 0.50 0.99 0.47 10.6 1.05 1.16 o. 81 1.54 1.54 VEF \I p
81121 o. 72 1).56 0.47 0~83 (1.48 8.9 1.06 1.30 0.91 1.46 1.46 \IEF \j R p 81121A 0.49 0.49 0.45 1.03 0.45 10.1 o.so 0.90 0.53 1.22 1.22 VEF \i p
118 0.81 0.69 0.90 0.45 o.oo 3.6 1.21 1.35 o.54 1.81 1.81 VEF R IIBA 1. r,2 0~69 0.84 0.42 o.oo 3.3 1. 42 1.48 0.13 1.91 1.91 VEF R WB 1.12 0.45 0.60 0.21 o.oo 3.7 1.36 1.43 0.91 1.87 1.87 VEF R WBA 1. 11 0.47 0.61 0.29 o.oo 3.5 1.37 1.44 0.90 1.e2 1.82 VEF R
828 0.1 0.36 1.01 o.o 1.82 o.no 3.0 1.12 0.37 0.12 Q.46 1.12 1 828 O.lA 0.35 0~98 o.o 1.86 o.oo 3.0 1.09 o .• 35 0.11 0.43 1.09 1 828 0.2 0.61 0.82 o.o 1.05 o.oo 5.4 1.14 0.61 0~32 0.11 1.14 1
> 828 0.2A 0.65 0.89 o.o 1.01 o.oo 4.8 1.21 0.64 0.34 .0.79 1.23 1 0 ~ 828 "~4 1.10 0.74 o.o 0.;67 o.oo 4.5 1.53., 1.08 0.19 1.22 1.53 1 R i::: 828 0.4A 1.os 0.11 o.o' 0.67 o.oo 4.5 1.46 1.03 0.1s 1.16 1.46 l R Q)
i::: 828 0.48 1.04 0.11 o.o 0.67 o.oo . 3. 8 1. 't5 1.02 0~ 75 1.13 1.45 l R •r-1 .Cl 828 0 .4C 1.06 0.68 o.o o.59 o.oo 3.9 1.45 1.01 0.11 1.11 1.45 1 R u
828 0.40 0.94 0.66 o.o 0.69 o.oo 4.9 1.11 0.95 0.67 1.oa 1.33 l R 828 0.4E 0.98 0.;66 o.o o.;66 o.oo 4.9 1.37 0.99 0.11 1.14 1.37 1 R B28 0.4F 0.73 0.:69 o.o 1.30 o.oo 6.2 1.15 0.13 0.46 0.90 1.15 1
a -.J

APPENDIX D. ANALYSIS OF TEST DATA
t ~ pf veff 00 0 Beam T M V r Cl) +" ~ > ~ No. T M V r f' bd/f' .E •.-I 0 u 0 0 C . C
B8 K 0.69 o.o o.o o.so o.oo 9.4 88 KA "l.84 o.o o.o 0.50 o.oo 7.6 B8 O.l 0.29 1.r,4 0.44 3.08 o.oo 5.8 88 O.lA 0.30 1.03 ("l.47 2.86 o.oo 6.2 88 ,.2 n. 51 0.89 0.42 1.73 o.o 8.1 88 O.ZA n.54 0.96 0.41 1.78 o.oo 7.3
88 D.4 '!.70 J.63 1.31) 1.09 o.oo a.a B8 0.4A ~.75 0.64 0.27 1 .05 o.oo 8.0 B 7 '.'l. 2 0.62 0.88 0.49 1.13 o.oo 7.1 87 0.2A 0.61 0.87 0.45 1.16 o.oo 6.5 810 n.2 0.51 1.06 0.40 2.45 o.oo 6.8 810 0.2A 0.50 1.03 o.37 2.42 o.oo 6.6 B1 0.53 l .13 0.41 2.04 o.oo 5.7
i::: BlA 0.52 1.08 0.48 1.91 o.oo 6.4 •.-I r-1
B2 o.ss 1 .06 0.39 1.98 o.oo 5.7 Cl! >,
B2A rt.53 0.98 0.39 1.83 o.oo 6.0 ~ 83 0.74 0.70 0.41 1.22 o.oo 7.5 83A o.74 0.10 0.41 1.23 o.oo 7.5 85 0.59 0.95 0.40· 1.60 o.oo 6.4 BSA 0.60 1.03 0.40 1.76 o.oo 5.6 B6 0.11 0.93 0.41 1.23 o.oo 7.4 86A o.;11 1.02 0.44 1.24 o.oo 7.4 87 n.as o.o o.o. 1.35 o.oo 12.4 87A o.ao o.o n.o · 1.21 o.oo 13.5 88 0.86 0.32 0.12 0.84 o.oo· a.2 BSA 0.90 0.35 0.11 0.;89 o.oo 1.1 89 0.44 0.65 o. 86 1.14 o.o 12.4 B9A o.;so 0.66 0.95 0.98 o.oo 12.1 B10, o.;34 0.58 0.65 1.49 o.oo 10.9 8HM 0.48 0.67 0.87 1.11 o.oo 12.4 811 0-41. 0.82 0.86 1.44 o.oo 12.0 BllA o.so. 0.91 0.83 1.59 o.oo 11.7 B12 0.32 o.;32 0.35 1.03 o.oo 12.9 812A 0.42 0.43 0.46 1.06 o.oo 12. 7
T exQ.
T . theor.
. l 2 3
0.69 0~&9 0.69 o. 84 0.84 0.84 1. 11 0.57 o.oa 1. 11 0.58 o.oa 1.12 0.75 0.21 1.20 o.eo 0.28 1.09 0.88 0.53 1.13 o.93 0.57 1.20 0.92 0.33 1.19 0.90 0.32 1.26 0.75 0.21 1.23 0.73 0.26 1.33 o.ao 0.25 1.29 0.84 0.21 1.29 0.83 0.26 1.22 o. 81 0.25 1.11 1.03 0.47 1.11 1.03 0;1t1 1.22 o.aa 0.28. 1.31 o.;91 0.29 1.31 1.00 0.42 1.43. 1.09 0.46 o.as o.as Q..;85 0.80 o.ao o.ao 1.03 0.93 0.1a 1.09 o.;-99 0.'82 0.87 o.eo 0.22 0.93 0.89 0.21 0.74 0.64 0.16 0.91 0.84 o.;25 1.04 0.89 o.; 22 1.13 0.93 0.22 0.52 0.49 0.20 0.68 0.63 0.25
VEF
1.01 0.98 0.81 0.86 1.13 1.09 1.24 1.16 1.31 1.22 1.01 1.00 1.03 1.11 0.99 0.99 1.25 1.24 1.02 1.01 1.21 1.32 1.32 1.35 1.15 1.01 1.11 2.01 1.25 1.8ft 1-.10, 1.65 0.95 1.22
Critical
T exo
T Mode th.
1.01 VEF V 0.98 VEF 1.11 1 1.11 l 1.13 VEF V 1.20 1 1.24 VEF V 1.16 VEF 1.31 VEF 1.22 VEF 1.26 l 1.23 1 1.33 l 1.29 l 1.29 1 1.22 1 1.2s VEF 1.24 VEF 1.22 l 1.31 1 1.31 l 1.43 l 1.32 VEF .v 1.35 VEF V 1.15 VEF V 1.09 l 1.11 VEF V 2.01 VEF V 1.25 VEF V 1.84 VEF V 1.10 VEF V 1.65 VEF V 0.95 VEF V 1.22 VEF V
Restrict-ions
R R
R R
t:r 00

APPENDIX D. ANALYSIS OF TEST DATA
T Critical eXQ
I T +-' ~ pf veff theor. T fl.l 0 Beam T M V r ":.J_ exp Cl) +-' - Restrict-::,. co No. T M V r f' bd/F 1 2 3 VEF T Mode s:::: bJ)
1-1 ..... 0 u 0 0 C C th. ions
l n.59 0.69 n.37 0.85 n.2a 1.0 1.03 1.oa o. 50 1.02 1.08 2 R 2 0.59 0.69 0.37 0.85 0.28 7.0 1.03 1 .08 o.so 1.02 1.08 2 R 6 0.37 t).87 C.46 1 .43 0.28 6.4 1.01 0.89 0.15 0.88 1.01 l 1 0.81 0.94 n.so 0.85 0.28 1.0 1.41 1.48 0.69 1 .40 1.48 2 R
10 0.48 1.13 0.60 1.44 0.28 6.4 1.31 1.15 0.19 1.13 1.31 1 3 0.68 1.14 0.55 1.69 0.20 8.5 1.46 1.25 0.59 1.55 1.55 VEF \I 4 n.68 1.14 0.55 1.69 0.28 8.5 1.46 1 .25 0.59 1.55 1.55 VEF \
s:::: 8 0.75 1.25 0.61 1.69 0.28 8.5 1.60 1.38 0.65 1.11 1.11 VEF \
..... 9 r-.75 1.25 ('.61 1.69 0.20 8.5 1.60 1.38 ~.65 1. 71 1.11 VEf \ "Cl ;:::s 11 0.91 1.16 C.53 1.co o.oo 7.1 1.66 1.36 ,.so 1.48 1.66 1 >i 12 0~71 0.90 r.41 1 .("(\ o.oo 7.1 1.29 1.05 0.39 1.15 1.29 l
13 0.11 0.90 0.41 1.00 o.oo 7.1 1.29 1.05 0.39 1.15 1.29 l 17 0.66 0.59 0.42 0.5".l 0.20 5.2 1.02 1.13 0.52 1.11 1.11 VEF R 18 0.12 ').65 0.46 o.so 0.20 5.2 1.12 1.24 o.. S.7 1.29 1.29 VEF R 19 0.72 0.65 0.46 0.50 o. 20 s.2 1.12 1.24 0.57 1.29 1.29 VEF R 2!" n.e3 0.75 0.53 0.50 o. 20 5.2 1.29 1.43 0.65 1.49 1.49 VEF R 21 0.72 0.65 0.46 0.50 o. 20 5.2 1.12 1.24 0.57 1.29 1.29 VEF R 22 0.10 o. 89 ().38 1.0, o. 19 4.2 1.20 0~88 0.32 1.05 1.28 l HBl 1.00 o.o c.o 0.92 0.01 2.9 1.00 1.06 1.15 0.81 1.15 3 HB2 0.11 0.78 o.o 1.89 0.01 2.1 1.25 0.82 0.51 0.63 1.25 1 HB3 0.48 ('~89 0 .r, 2.68 0.01 1.5 1.10 o.so 0.21 0.40 1.10 1
~ HB4 0.35 0.94 o.o 3.47 0.01 1.1 1.05 0.37 0.12 0.28 1.05 l
co HB5 0.31 0.97 o.o 3.88 0.01 1.1 1.06 0.33 0.09 0.26 1.06 l ~ HB7 0.81 o.o o.o 0.87 o.oo 3.2 0~ 81 0.82 o. 86 0.65 0.86 3 R ~ co HB8 0~48 0.83 o.o 2.48 o.oo 1.5 1.05 0.49 0.22 0.38 1.05 1 U)_
"Cl HB9 'l.38 o.83 o.o 3.00 0.02 1.6 0.98 0.39 0.15 0.32 0.98 1 s:::: HBlO 0~35 0.87 o.o 3.28 0.01 1.2 0.99 0.36 0.13 0.27 0.99 l co fl.l HBll 0.29 0.91 o.o 3.91 0.01 1.1 0.99 0.10 0~08 0.24 0.99 l s:::: HB13 0.94 o.o o.o 0.87 o.oo 2.9 0.94 0.93 0.99 0.67 0.99 3 R co ::,. H814 0.69 0.57 o.o 1.10 0.01 2.2 1.03 0.10 o.so 0.50 1.03 1
ri1 H615 0.55 0.84 o.o 2.31 o.oo 1.5 1.11 0.54 0.21 0.39 1.11 1 HB16 0.39 0.90 o.o 3.11 0.01 1. 4 1.05 0.40 0.15 0.30 1.05 1 HB17 0.32 0.96 o.o 3.75 0.01 0.9 1.06 0.13 o. 10 0.23 1.0-6 1 t,
"'


![05-03ChapGere[1] | Bending | Beam (Structure) - xdocs.net](https://static.fdokumen.com/doc/165x107/6323c1d9be5419ea700ebf89/05-03chapgere1-bending-beam-structure-xdocsnet.jpg)