Experimental assessment of vertical shear force and bending ...
12
HAL Id: hal-02884241 https://hal.archives-ouvertes.fr/hal-02884241 Submitted on 8 Oct 2020 HAL is a multi-disciplinary open access archive for the deposit and dissemination of sci- entific research documents, whether they are pub- lished or not. The documents may come from teaching and research institutions in France or abroad, or from public or private research centers. L’archive ouverte pluridisciplinaire HAL, est destinée au dépôt et à la diffusion de documents scientifiques de niveau recherche, publiés ou non, émanant des établissements d’enseignement et de recherche français ou étrangers, des laboratoires publics ou privés. Distributed under a Creative Commons Attribution| 4.0 International License Experimental assessment of vertical shear force and bending moment in severe sea conditions B. Horel, Benjamin Bouscasse, Arnaud Merrien, Guillaume de Hauteclocque To cite this version: B. Horel, Benjamin Bouscasse, Arnaud Merrien, Guillaume de Hauteclocque. Experimental assessment of vertical shear force and bending moment in severe sea conditions. 38th International Conference on Ocean, Offshore & Arctic Engineering, Jun 2019, Glasgow, United Kingdom. pp.V003T02A031, 10.1115/OMAE2019-96272. hal-02884241
-
Upload
khangminh22 -
Category
Documents
-
view
1 -
download
0
Transcript of Experimental assessment of vertical shear force and bending ...
HAL Id: hal-02884241https://hal.archives-ouvertes.fr/hal-02884241
Submitted on 8 Oct 2020
HAL is a multi-disciplinary open accessarchive for the deposit and dissemination of sci-entific research documents, whether they are pub-lished or not. The documents may come fromteaching and research institutions in France orabroad, or from public or private research centers.
L’archive ouverte pluridisciplinaire HAL, estdestinée au dépôt et à la diffusion de documentsscientifiques de niveau recherche, publiés ou non,émanant des établissements d’enseignement et derecherche français ou étrangers, des laboratoirespublics ou privés.
Distributed under a Creative Commons Attribution| 4.0 International License
Experimental assessment of vertical shear force andbending moment in severe sea conditions
B. Horel, Benjamin Bouscasse, Arnaud Merrien, Guillaume de Hauteclocque
To cite this version:B. Horel, Benjamin Bouscasse, Arnaud Merrien, Guillaume de Hauteclocque. Experimental assessmentof vertical shear force and bending moment in severe sea conditions. 38th International Conferenceon Ocean, Offshore & Arctic Engineering, Jun 2019, Glasgow, United Kingdom. pp.V003T02A031,�10.1115/OMAE2019-96272�. �hal-02884241�

EXPERIMENTAL ASSESSMENT OF VERTICAL SHEAR FORCE AND BENDING MOMENT IN SEVERE SEA CONDITIONS
Boris Horel Ecole Centrale Nantes, LHEEA res. dept. (ECN
and CNRS) Nantes, France
Benjamin Bouscasse Ecole Centrale Nantes, LHEEA res. dept. (ECN
and CNRS) Nantes, France
Arnaud Merrien Ecole Centrale Nantes, LHEEA res. dept. (ECN
and CNRS) Nantes, France
Guillaume de Hauteclocque Bureau Veritas Paris, France
ABSTRACT Recent studies have benchmarked the prediction of wave
vertical bending moment (VBM) of ship in waves [1][2], and found significant scatter among the numerical codes.
Unfortunately, experimental data in extreme waves, that are relevant to ship design, are not often easily accessible, nor completely fitted to rigorous comparison to numerical codes. Then, the improvement of numerical tools and the modelling of ship’s internal loads still requires accurate experimental data measured in steep waves (ratio wave height H to wavelength λ, H/λ=0.1) where the ship behavior and loads are modified by non-linearities.
Thus, in order to validate simulation codes, which underlies rules requirement, and to establish criteria that makes ships safer to sail in severe sea conditions, experiments are carried out in the 50m×30m×5m hydrodynamic and ocean engineering tank of Ecole Centrale Nantes. A 1/65th scaled model of a 6750-TEU containership is used. The ship is moored and several combinations of wavelength and wave height are tested.
While segmented hulls are commonly instrumented with strain gauges, the present experiments are performed on a segmented hull with a 6DOF sensor located close to the amidship. This setting allows for a very stiff model which dramatically reduces the hydro-elastic effects. According to previous study [1], the position of the sensor is chosen where the bending moment is supposed to reach a maximum value. The model motion is measured through a Qualisys IR tracking system and accelerometers are located on the fore and aft of the beam.
Also, each of the 9 segments is equipped with a 3DOF dynamometer to measure the hydrodynamic loads on the hull. This allows for recovering the hydrodynamic loads on the segments and then to compute the shear force and bending moment discretized all over the ship length. A comparison is therefore possible with the 6DOF sensor. Details of the computations are given in the paper.
A particular attention is paid to the reproducibility and repeatability of the tests. The innovative experimental setup and the measured data are presented in the paper. Based on previous studies [3], the effects of the non-linearities are also discussed.
INTRODUCTION While hull girder loads have been a research topic for long [4], recent studies have shown that its assessment in extreme wave by numerical code is still a challenge [1]. Given the importance of vertical wave bending moment in ship structure, this is a call a more comprehensive and systematic validation of numerical codes on extreme waves.
Existing model test campaigns involving segmented model often involves, purposely [5], or not [6], [1], some hydro-elastic effects. While those data bring valuable knowledge, the hydro-elastic effect makes rigorous comparison with simulation quite a challenge. Additionally, if steep wave are sometimes investigated, they are rarely as high as the one underlying the rules requirement [7], and data are not always fully available.
The objective of the current paper is to describe a model test campaign hopefully filling that gap. The objective is twofold: obtaining physical information on the phenomena that occur in steep waves and building a validation database for the computation of the wave bending moment in extreme waves. In
1
this paper, time series and RAO of the experimental results will be presented according to the wave steepness.
Since experiments where performed using a segmented-hull model equipped with force sensors, the hydrodynamic loads, the shear force and the bending moment discretized all over the ship length is recovered.
Based on the previously mentioned studies, model tests were performed in order to assess the non-linearity of bending moment and in particular, the possibility to separate the non-linear effect from the hydro-elasticity. Then, the key features of the presented model test campaign are the rigidity of the model and the high wave steepness.
NOMENCLATURE Bwl Waterline breadth (m) Δ Displacement of the ship G Gravity acceleration (m/s²) H Wave height from trough to crest (m) KG Vertical position of the center of gravity from
baseline (m) Ix,y,z Moment of inertia in roll, pitch and yaw (kg.m-2) Ixy,yz,xz Product of inertia (kg.m-2) LCG Longitudinal position of the center of gravity from
transom (m) Lpp Length between perpendiculars (m) mbi Mass of the upper part of a segment (kg) mhi Mass of the lower part of a segment (kg) λ Wavelength (m) Tm Mean draft (m) VBM Vertical bending moment xint Longitudinal position of the intersegment from
transom (m)
EXPERIMENTAL SETTINGS
Facility All the experiments were carried out in the hydrodynamic
and ocean engineering tank of the Ecole Centrale Nantes. The basin dimensions are 50m long, 30m wide and 5m deep. It is equipped with a segmented wavemaker composed of 48 flaps allowing for generating directional waves and complex irregular sea states.
In this paper, the heights of the generated regular waves are taken in a range from 0.023m to 0.577m and the wave periods are taken in a range from 1.13s to 2.66s corresponding to wavelength to ship length ratios from 0.5 to 2.5.
Model Previous campaigns have been performed along the years
using segmented hull with the objective to measure structural response to wave-induced loads [8][9]. In the present work, a 1/65th scaled model of a 6750-TEU containership is used. This hull is the same than the hull used in previous work from Kim and Kim [1]. However, the stiffness is carefully chosen in order to design a very rigid model. To do so, a preliminary study, using Homer, was performed aiming to identifying from which natural frequency of the beam ωr the
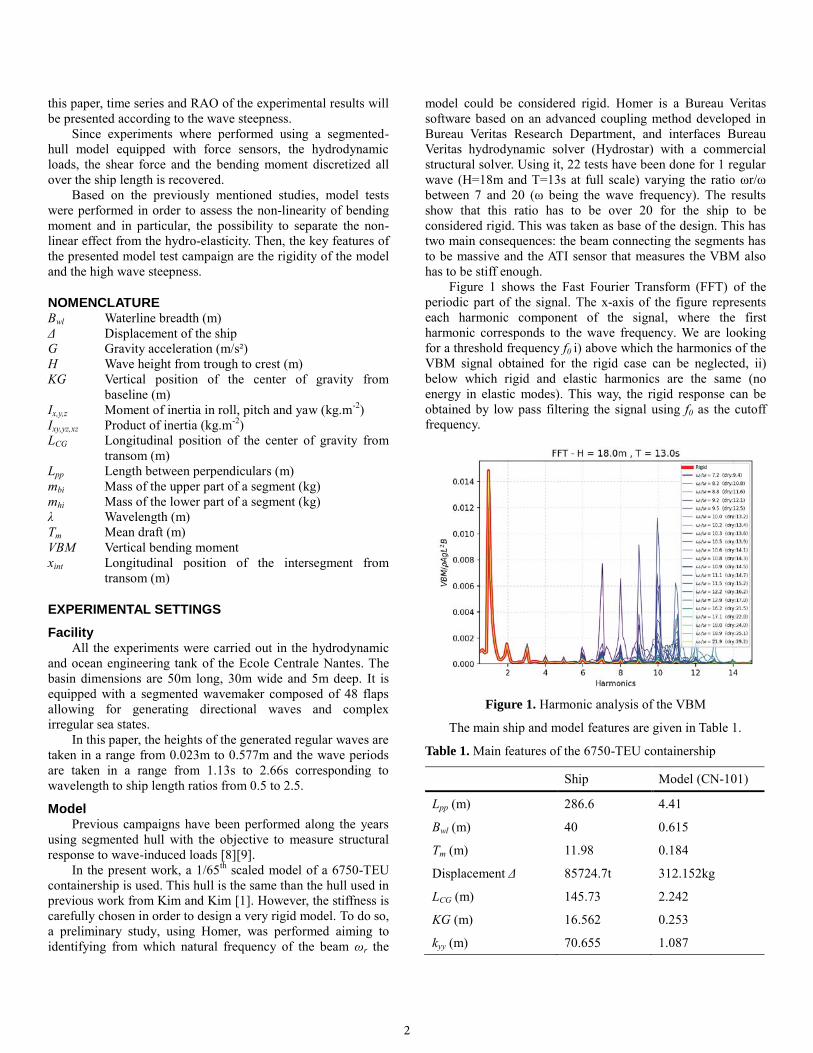
model could be considered rigid. Homer is a Bureau Veritas software based on an advanced coupling method developed in Bureau Veritas Research Department, and interfaces Bureau Veritas hydrodynamic solver (Hydrostar) with a commercial structural solver. Using it, 22 tests have been done for 1 regular wave (H=18m and T=13s at full scale) varying the ratio ωr/ω between 7 and 20 (ω being the wave frequency). The results show that this ratio has to be over 20 for the ship to be considered rigid. This was taken as base of the design. This has two main consequences: the beam connecting the segments has to be massive and the ATI sensor that measures the VBM also has to be stiff enough.
Figure 1 shows the Fast Fourier Transform (FFT) of the periodic part of the signal. The x-axis of the figure represents each harmonic component of the signal, where the first harmonic corresponds to the wave frequency. We are looking for a threshold frequency f0 i) above which the harmonics of the VBM signal obtained for the rigid case can be neglected, ii) below which rigid and elastic harmonics are the same (no energy in elastic modes). This way, the rigid response can be obtained by low pass filtering the signal using f0 as the cutoff frequency.
Figure 1. Harmonic analysis of the VBM
The main ship and model features are given in Table 1.
Table 1. Main features of the 6750-TEU containership
Ship Model (CN-101)
Lpp (m) 286.6 4.41
Bwl (m) 40 0.615
Tm (m) 11.98 0.184
Displacement Δ 85724.7t 312.152kg
LCG (m) 145.73 2.242
KG (m) 16.562 0.253
kyy (m) 70.655 1.087
2

As can be seen in Figure 2, the model is composed with 9 hull’s segments attach to a rigid beam. Each of the segments is equipped with a 3 degrees of freedom (DOF) dynamometer located between the hull and the beam whose aim is to measure the hydrodynamic loads on the segmented hull of the model. This allows for recovering the hydrodynamic loads on the segments and then to compute the shear force and bending moment all over the ship length.
In the design stage, the computer assisted design (CAD) tools give an estimation of the mass distribution of the model. The measured total mass of each segment is presented in Figure 3.
From this figure, it can be noticed that the heaviest segments are located close to the amidship. The explanation is that the 6DOF ATI sensor that measures the shear force and bending moment in the rigid beam is located at the intersegment between segments 4 and 5.
Figure 3. Mass distribution of the model
Since each segment is composed with one hull element and one beam element, it has its own mechanical properties, i.e. mass, center of gravity and inertia. These features are given in Table 2.
Table 2. Features of each segment of the model
Segment Mass (kg) LCG (m) xint (m) Iyy (kg.m²)
S1 (Stern) 31.749 0.455 0.718 1.805
S2 32.913 0.897 1.128 1.474
S3 25.975 1.332 1.538 0.722
S4 43.854 1.841 1.995 1.470
S5 40.441 2.146 2.452 1.489
S6 39.974 2.655 2.862 1.557
S7 34.666 3.092 3.272 1.367
S8 33.553 3.496 3.682 1.273
S9 (Bow) 29.027 4.009 - 1.959
Instrumentation Segmented hulls are commonly instrumented with strain
gauges. In our study, the originality is the use of a 6DOF sensor located at amidship. The main longitudinal beam is therefore equipped with a Force/Torque 6DOF sensor ATI omega 191 whose mass is 31.148kg and whose geometry is presented in Figure 4. This sensor position is chosen according to neutral axis and where the maximum bending moment was measured in the experiments of Kim et al. [1].
Figure 4. ATI sensor
Figure 2. Segmented hull
3
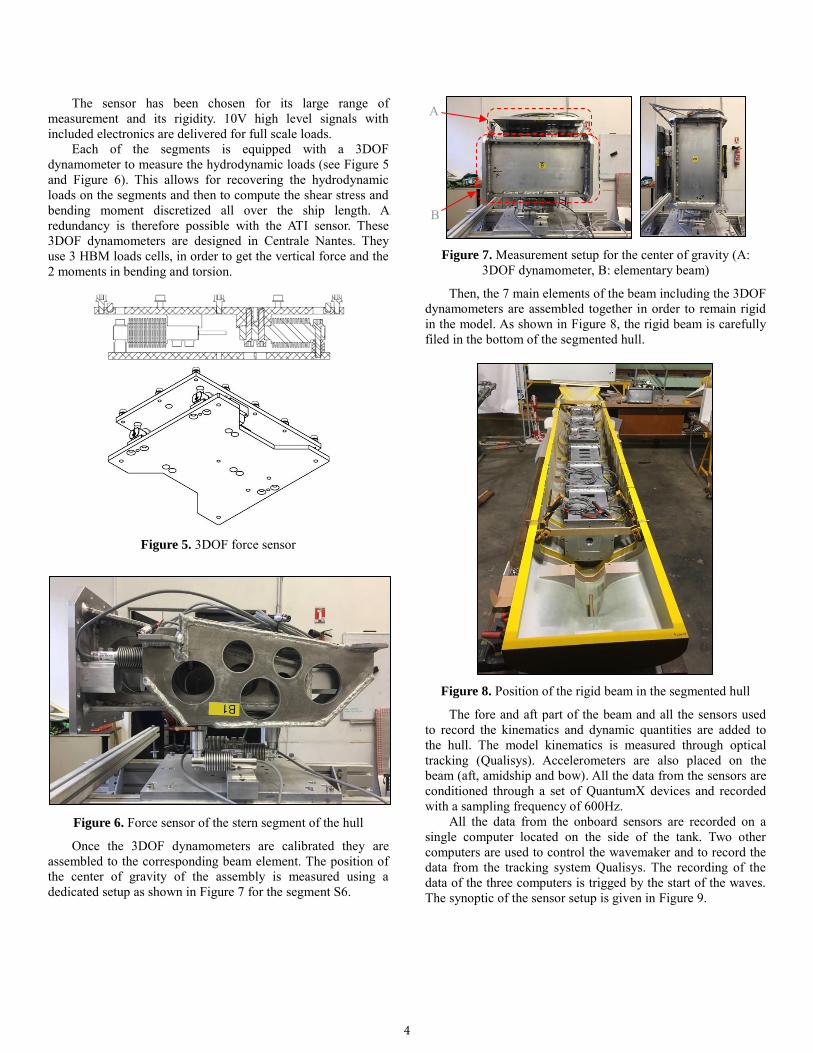
The sensor has been chosen for its large range of measurement and its rigidity. 10V high level signals with included electronics are delivered for full scale loads.
Each of the segments is equipped with a 3DOF dynamometer to measure the hydrodynamic loads (see Figure 5 and Figure 6). This allows for recovering the hydrodynamic loads on the segments and then to compute the shear stress and bending moment discretized all over the ship length. A redundancy is therefore possible with the ATI sensor. These 3DOF dynamometers are designed in Centrale Nantes. They use 3 HBM loads cells, in order to get the vertical force and the 2 moments in bending and torsion.
Figure 5. 3DOF force sensor
Figure 6. Force sensor of the stern segment of the hull
Once the 3DOF dynamometers are calibrated they are assembled to the corresponding beam element. The position of the center of gravity of the assembly is measured using a dedicated setup as shown in Figure 7 for the segment S6.
Figure 7. Measurement setup for the center of gravity (A: 3DOF dynamometer, B: elementary beam)
Then, the 7 main elements of the beam including the 3DOF dynamometers are assembled together in order to remain rigid in the model. As shown in Figure 8, the rigid beam is carefully filed in the bottom of the segmented hull.
Figure 8. Position of the rigid beam in the segmented hull
The fore and aft part of the beam and all the sensors used to record the kinematics and dynamic quantities are added to the hull. The model kinematics is measured through optical tracking (Qualisys). Accelerometers are also placed on the beam (aft, amidship and bow). All the data from the sensors are conditioned through a set of QuantumX devices and recorded with a sampling frequency of 600Hz.
All the data from the onboard sensors are recorded on a single computer located on the side of the tank. Two other computers are used to control the wavemaker and to record the data from the tracking system Qualisys. The recording of the data of the three computers is trigged by the start of the waves. The synoptic of the sensor setup is given in Figure 9.
A
B
4
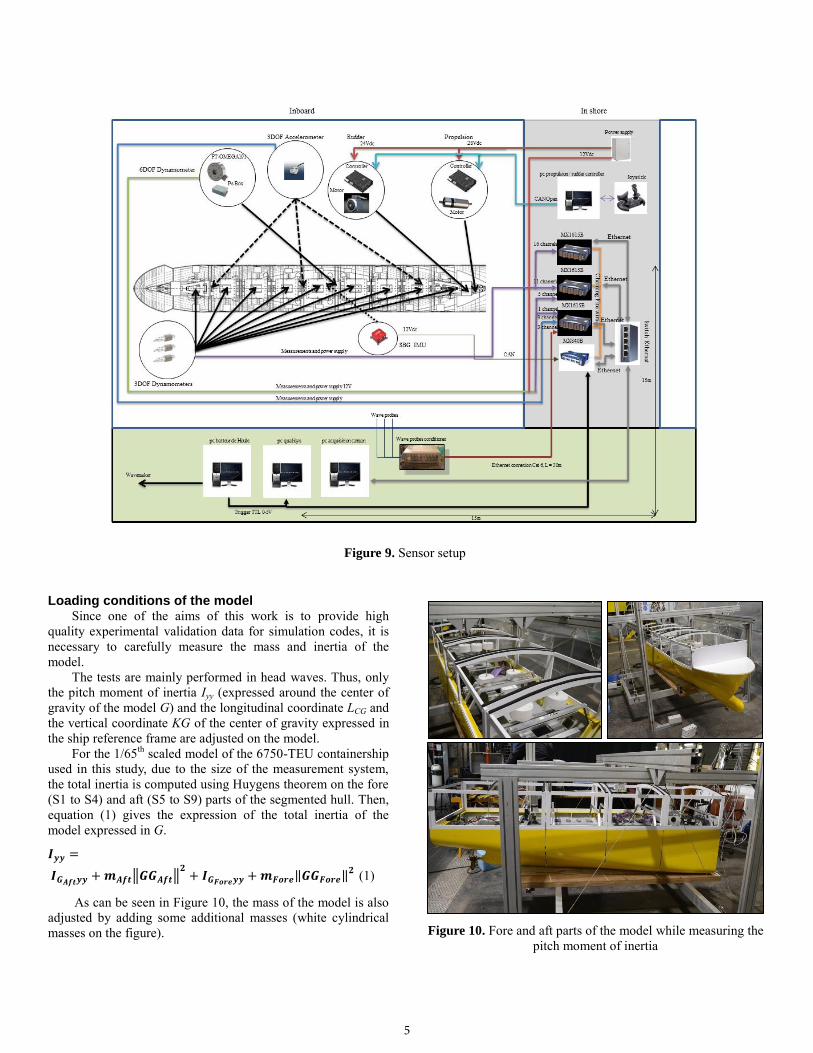
Loading conditions of the model Since one of the aims of this work is to provide high
quality experimental validation data for simulation codes, it is necessary to carefully measure the mass and inertia of the model.
The tests are mainly performed in head waves. Thus, only the pitch moment of inertia Iyy (expressed around the center of gravity of the model G) and the longitudinal coordinate LCG and the vertical coordinate KG of the center of gravity expressed in the ship reference frame are adjusted on the model.
For the 1/65th scaled model of the 6750-TEU containership used in this study, due to the size of the measurement system, the total inertia is computed using Huygens theorem on the fore (S1 to S4) and aft (S5 to S9) parts of the segmented hull. Then, equation (1) gives the expression of the total inertia of the model expressed in G.
𝑰𝒚𝒚 =
𝑰𝑮𝑨𝒇𝒕𝒚𝒚 + 𝒎𝑨𝒇𝒕‖𝑮𝑮𝑨𝒇𝒕‖𝟐+ 𝑰𝑮𝑭𝒐𝒓𝒆𝒚𝒚 + 𝒎𝑭𝒐𝒓𝒆‖𝑮𝑮𝑭𝒐𝒓𝒆‖
𝟐 (1)
As can be seen in Figure 10, the mass of the model is also adjusted by adding some additional masses (white cylindrical masses on the figure). Figure 10. Fore and aft parts of the model while measuring the
pitch moment of inertia
Figure 9. Sensor setup
5

After adjusted the mass and inertia of each part, the aft and fore parts of the model are assembled. In order to ensure that the hull of the model is waterproof, some thin medical tape is glued at the intersegments. Also some transparent film is added on the top part of the model.
Moorings setup Mooring lines where used to maintain the mean ship
position. The targeted natural period Tx of the moored ship at full
scale is about 95 seconds, which should be soft enough to avoid any modification in VBM response. Then, the moorings are chosen in order to reach such a value at model scale. The configuration of the mooring lines is presented in Figure 11. 4 lines are attached to the model: 2 at the bow and 2 at the transom. The angle α is the angle between the longitudinal direction xm of the model and the mooring line direction xmoor. Its value is 45 degrees for each line.
Figure 11. Mooring lines configuration
For such a mooring configuration without excitation force and assuming that damping forces are negligible, the 1 DOF equation of motion in surge can be written as follows:
(𝑚 + 𝐴𝑥𝑥)�̈� + 𝐾𝑀𝑥 = 0 (2)
Then, the total longitudinal stiffness KM of the moorings in x0 direction can be computed from the previous equation where Axx is the added mass of the model in surge and Txm is the natural period in surge at model scale.
𝐾𝑀 = (𝑚 + 𝐴𝑥𝑥) (2𝜋
𝑇𝑥𝑚)
2
(3)
Each mooring line is calibrated for having a mean stiffness value kmoor around 56N.m-1, meaning that k1=k2=k3=k4=kmoor.The value of kmoor is chosen from the previous value of the total stiffness KM and from the mooring lines configuration, i.e. 4 lines with α=45deg. The elongation Δ𝑙 of one line along the xmoor axis can be expressed as a function of the elongation Δ𝑥of the line along the x0 axis.
Δ𝑙 =Δ𝑥 cos 𝛼 (4)
The corresponding variation of force Δ𝐹𝑥 of one mooringline along the x0 axis can be written as follows:
Δ𝐹𝑥 = −𝑘𝑚𝑜𝑜𝑟Δ𝑙 cos 𝛼 = −𝑘𝑚𝑜𝑜𝑟Δ𝑥 cos2 𝛼 (5)
Since there are 4 mooring lines, the total force variation due to the moorings along the longitudinal axis of the tank is 4 times Δ𝐹𝑥 of one mooring line. Then, knowing the value of theglobal stiffness KM from (3), the stiffness of each line can be computed from the expression (6).
𝑘𝑚𝑜𝑜𝑟 =𝐾𝑀
4 cos2 𝛼 (6)
Once each line is calibrated, it is set up in the tank in order to be attached to the model.
FORCES ALONG THE SHIP
General formulation When looking at the instrumentation presented above, it
can be noticed that only one sensor is measuring the vertical shear force and bending moment: the ATI sensor. Even if this sensor is really accurate, it gives information about internal forces only at the amidship section.
Previous method based on 2D hydroelasticity analysis has been used to evaluate the rogue wave induced loads on a ship [10]. Since in this study the model is rigid, an analytical method is developed and implemented in order to evaluate the longitudinal distribution of the shear force and bending moment along the segmented hull, taking into account the accelerations and the values of the 3DOF dynamometers.
As presented in Figure 12, the segmented hull is considered to be composed with 9 segments. The rigidity of the model is assumed to be given only by the rigid beam (b1 to b9).
Figure 12. Structural model of the segmented hull
The formulation used in the prediction of dynamical motions is based on a 6 degrees of freedom dynamical model deriving from the Newton’s second law. Knowing the total
6

force components (X, Y, Z, K, M and N), the accelerations of the model can be predicted by solving the following general differential equations:
𝑋 = 𝑚[�̇� + 𝑞𝑤 − 𝑟𝑣 − 𝑥𝐺(𝑞2 + 𝑟2) + 𝑦𝐺(𝑝𝑞 − �̇�) +𝑧𝐺(𝑝𝑟 + �̇�)] (7)
𝑌 = 𝑚[�̇� + 𝑟𝑢 − 𝑝𝑤 − 𝑦𝐺(𝑟2 + 𝑝2) + 𝑧𝐺(𝑞𝑟 − �̇�) +𝑥𝐺(𝑞𝑝 + �̇�)] (8)
𝑍 = 𝑚[�̇� + 𝑝𝑣 − 𝑞𝑢 − 𝑧𝐺(𝑝2 + 𝑞2) + 𝑥𝐺(𝑟𝑝 − �̇�) +𝑦𝐺(𝑟𝑞 + �̇�)] (9)
𝐾 = 𝐼𝑥�̇� − 𝐼𝑥𝑦(�̇� − 𝑟𝑝) − 𝐼𝑧𝑥(�̇� + 𝑝𝑞) + (𝐼𝑧 − 𝐼𝑦)𝑞𝑟 +
𝐼𝑦𝑧(𝑟2 − 𝑞2) + 𝑚[𝑦𝐺(�̇� + 𝑝𝑣 − 𝑞𝑢) − 𝑧𝐺(�̇� + 𝑟𝑢 −
𝑝𝑤)] (10) 𝑀 = 𝐼𝑦�̇� − 𝐼𝑦𝑧(�̇� − 𝑝𝑞) − 𝐼𝑥𝑦(�̇� + 𝑞𝑟) + (𝐼𝑥 − 𝐼𝑧)𝑟𝑝 +
𝐼𝑧𝑥(𝑝2 − 𝑟2) + 𝑚[𝑧𝐺(�̇� + 𝑞𝑤 − 𝑟𝑣) − 𝑥𝐺(�̇� + 𝑝𝑣 −
𝑞𝑢)] (11) 𝑁 = 𝐼𝑧�̇� − 𝐼𝑧𝑥(�̇� − 𝑞𝑟) − 𝐼𝑦𝑧(�̇� + 𝑟𝑝) + (𝐼𝑦 − 𝐼𝑥)𝑝𝑞 +
𝐼𝑥𝑦(𝑞2 − 𝑝2) + 𝑚[𝑥𝐺(�̇� + 𝑟𝑢 − 𝑝𝑤) − 𝑦𝐺(�̇� + 𝑞𝑤 −
𝑟𝑣)] (12)
with:
𝑶𝒎𝑮 = [
𝑥𝐺
𝑦𝐺
𝑧𝐺
] (13)
𝑝 = −sin 𝜃 �̇� + �̇� (14) 𝑞 = sin𝜑 cos 𝜃 �̇� + cos𝜑 �̇� (15) 𝑟 = cos 𝜑 cos 𝜃 �̇� − sin𝜑 �̇� (16)
Previous equations are expressed in the model reference frame and the three rotations yaw ψ, pitch θ and roll φ angles are Tait-Bryan angles.
In first approximation, assuming that the moorings do not influenced the motions of the model, the total external forces Fext applied on the segmented model are expressed as the superposition of two main components: gravity (FGrav) and hydrodynamics (FHydro).
𝑭𝒆𝒙𝒕 = 𝑭𝑮𝒓𝒂𝒗 + 𝑭𝑯𝒚𝒅𝒓𝒐 (17)
with:
𝑭𝒆𝒙𝒕 =
[ 𝑋𝑌𝑍𝐾𝑀𝑁]
(𝑶𝒎,𝒙𝒎 ,𝒚𝒎,𝒛𝒎)
(18)
Force components In order to compute the previous-mentioned force
components due to gravity and hydrodynamics, each segment of the segmented hull is independently studied. The segments are all composed with an upper and a lower part, respectively the beam (bi) and the hull (hi). Between these two parts is located the 3 DOF dynamometer (ci).
The total force components acting on the lower part of a segment Si is expressed as the superposition of three force
components: the gravity on the hull (Phi), the hydrodynamics on the hull (𝑭𝑯𝒚𝒅𝒓𝒐/𝒉𝒊
) and the force exerted by the beam bi on thehull hi (𝑭𝒃𝒊/𝒉𝒊
).Knowing the force components on the lower part of the
segment and the 6 components of the acceleration 𝜞, the dynamics of the hull hi is calculated as follows:
𝒎𝒉𝒊𝜞 = 𝑷𝒉𝒊
+ 𝑭𝑯𝒚𝒅𝒓𝒐/𝒉𝒊+ 𝑭𝒃𝒊/𝒉𝒊
(19)
Since the model is fully instrumented with sensors, the components of the acceleration 𝜞 are known from the values of the accelerometers. The components of the force 𝑭𝒃𝒊/𝒉𝒊
areknown from the value of the 3DOF dynamometer. Then, for each segment, the hydrodynamic forces acting on the hull can be fully identified.
The problem is simplified by taking into account only the force components in the vertical plane that involve flexion in the beam. Then, to assess the vertical shear force Qz and bending moment Mfy in the intersegment Xint between the segments n and n+1 (with 1≤n≤8), the system to solve is as follows:
(𝑄𝑧
𝑀𝑓𝑦) = ∑ [(
𝑚𝑖[�̇� − 𝑥𝐺𝑖�̇� − 𝑞𝑢]
𝐼𝑦𝑖�̇�) − (
𝑍𝑖
𝑀𝑖)]𝑛
𝑖=1 − (0
𝑥𝑋𝑖𝑄𝑧)
(20)
with:
(𝑍𝑖
𝑀𝑖) = (
𝑍𝐹𝐻𝑦𝑑𝑟𝑜/ℎ𝑖− (𝑚𝑏𝑖
+ 𝑚ℎ𝑖)𝑔 cos 𝜃
𝑀𝐹𝐻𝑦𝑑𝑟𝑜/ℎ𝑖+ 𝑥𝐺𝑖(𝑚𝑏𝑖
+ 𝑚ℎ𝑖)𝑔 cos 𝜃
) (21)
𝑮𝒊𝑮 = [
𝑥𝐺𝑖
𝑦𝐺𝑖
𝑧𝐺𝑖
] (22)
𝑿𝒊𝒏𝒕𝑮 = [
𝑥𝑋𝑖
𝑦𝑋𝑖
𝑧𝑋𝑖
] (23)
The formulation 21 was implemented and tested with a large range of experimental data.
EXPERIMENTAL RESULTS
Test configurations In order to evaluate the influence of the wave
nonlinearities on the measured shear force and bending moment, several wave configurations were tested. In this paper, only results with regular head waves are presented.
Prior to the tests with the segmented model of the 6750-TEU containership, the waves generated by the wavemaker were calibrated using several wave probes that were set up in the tank.
For regular waves, the averaged values of the measured wave heights from the wave probe that was located close to the amidship are given in Table 3. The column where the values are red corresponds to the target values for the design of ships.
7

Table 3. Measured wave height (m)
λ/Lpp
0,5 0,75 1 1,25 1,5 1,75 2 2,25 2,5
H/λ
0.01 0,023 0,035 0,046 0,058 0,069 0,081 0,092 0,104 0,115
0.021 0,047 0,070 0,094 0,117 0,141 0,164 0,188 0,211 0,235
0.038 0,084 0,126 0,168 0,210 0,252 0,293 0,335 0,377 0,419
0.052 0,115 0,173 0,231 0,288 0,346 0,404 0,462 0,519 0,577
0.071 0,154 0,231 0,308 0,385 0,462 0,538 - - -
0.091 0,192 0,288 0,385 0,481 0,577 - - - -
0.105 0,231 0,346 0,462 0,577 - - - - -
From table above, it can be notices that the maximum wave height that was tested is around 0.6 meters at model scale, meaning a wave height close to 39 meters at full scale. Such a sea state is quite impossible to encounter for a ship at sea. However experimental data recorded in severe sea states give valuable information to validate the simulation codes in terms of structural loads and global behavior of the ship in waves.
Figure 13. Experimental setup in extreme waves
Time series of the VBM As can be seen in Figure 14 to Figure 16, the raw data from
the ATI sensor where recorded with a very low level of noise.
Figure 14. Comparison between the measured and the filtered signal for λ=Lpp and H/λ=0.01
Figure 15. Comparison between the measured and the filtered signal for λ=Lpp and H/λ=0.052
Figure 16. Comparison between the measured and the filtered signal for λ=Lpp and H/λ=0.105
In the previous figures, the slamming phenomenon tends to generate some vibrations in the beam that can be seen in the time evolution of the vertical bending moment. However, these are high frequency vibrations that can be filtered without corrupting the rigid motion of the ship. A nonlinear behavior of the VBM can also be observed.
Most of the tests were repeated a minimum of 2 times, but one test particularly was performed 12 times. The test condition is λ/Lpp=1 and H/λ=0.052 which is around the center of the full test matrix. This test was performed every day as the second test and the campaign has been performed in two different period of the year so the uncertainty about the mooring setup and other installation bias is considered.
All runs are plotted together in Figure 17 for a portion of the interval. In this plot the time has been slightly offset in order to adjust for the slightly different longitudinal position of the hull in the tank at the start of each test. These small differences are caused by the mooring system which is detached and attached every day and consequently the initial position changed. The maximum time shift applied has been 0.05s which is 3% of the wave period. The bending moment shown in Figure 17 is the direct measurement by the sensor and is unfiltered. Some differences may be shown on the pitch angle, but all maxima are within 3% from the mean value of all maxima.
8

Figure 17. Comparison of the 12 results obtained for repeatability of the measured signals: pitch (top) and bending
moment at the sensor position (bottom)
Response Amplitude Operator (RAO) An approach for computing the numerator of the RAOs
from the nonlinear experimentally measured signals is to compute the coefficients cn of the Fourier series for the motions, forces and moments. Same could be done for the denominator, but here, the choice is made to consider theoretical value H/2 as the reference for the wave. For very small steepness, the linear wave is recovered and the RAO computed from c1 is the traditional linear operator.
Comparisons of the operators obtained in heave, pitch and vertical bending moment (VBM) in sagging are presented in Figure 18 to Figure 20. In our study, the loadcase and the hull of the ship are the same than in previous work from Kim et al. [1]. Then, our experimental results are compared with their previous results.
Figure 18. Comparison of heave RAO between the present study and results from Kim (2016)
Figure 19. Comparison of pitch RAO between the present study and results from Kim (2016)
Figure 20. Comparison of VBM RAO between the present study and results from Kim (2016)
The RAOs we obtained agree well with the mean numerical results presented in Kim et al. [1].
For large wavelengths, the values of the heave and pitch RAOs show some irregularities. Since those tests have been repeated several times and give the same result, these irregularities do not seem to be the result of a single outlier.
For the vertical bending moment whose estimation is the main objective of the present study, it can be noticed that results agree well, and the previous and present experimental data give really close results.
The evolution of the vertical bending moment (VBM) with increasing wave steepness is presented in Figure 21.
9
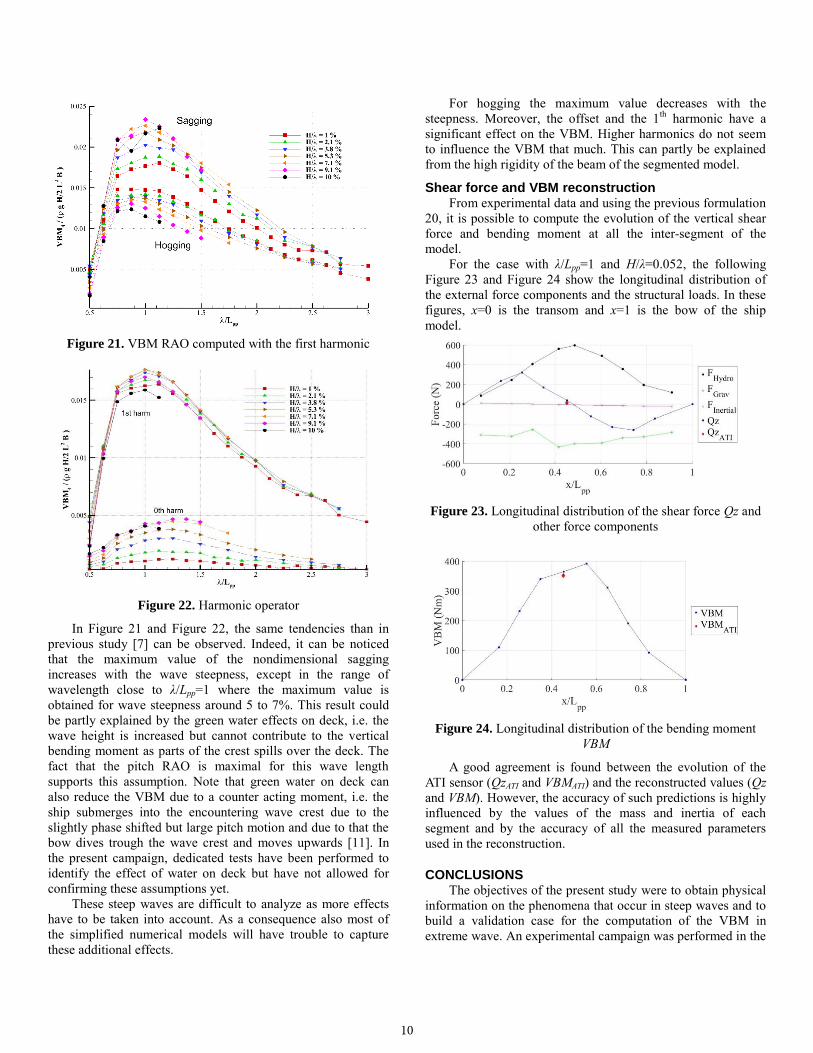
Figure 21. VBM RAO computed with the first harmonic
Figure 22. Harmonic operator
In Figure 21 and Figure 22, the same tendencies than in previous study [7] can be observed. Indeed, it can be noticed that the maximum value of the nondimensional sagging increases with the wave steepness, except in the range of wavelength close to λ/Lpp=1 where the maximum value is obtained for wave steepness around 5 to 7%. This result could be partly explained by the green water effects on deck, i.e. the wave height is increased but cannot contribute to the vertical bending moment as parts of the crest spills over the deck. The fact that the pitch RAO is maximal for this wave length supports this assumption. Note that green water on deck can also reduce the VBM due to a counter acting moment, i.e. the ship submerges into the encountering wave crest due to the slightly phase shifted but large pitch motion and due to that the bow dives trough the wave crest and moves upwards [11]. In the present campaign, dedicated tests have been performed to identify the effect of water on deck but have not allowed for confirming these assumptions yet.
These steep waves are difficult to analyze as more effects have to be taken into account. As a consequence also most of the simplified numerical models will have trouble to capture these additional effects.
For hogging the maximum value decreases with the steepness. Moreover, the offset and the 1th harmonic have a significant effect on the VBM. Higher harmonics do not seem to influence the VBM that much. This can partly be explained from the high rigidity of the beam of the segmented model.
Shear force and VBM reconstruction From experimental data and using the previous formulation
20, it is possible to compute the evolution of the vertical shear force and bending moment at all the inter-segment of the model.
For the case with λ/Lpp=1 and H/λ=0.052, the following Figure 23 and Figure 24 show the longitudinal distribution of the external force components and the structural loads. In these figures, x=0 is the transom and x=1 is the bow of the ship model.
Figure 23. Longitudinal distribution of the shear force Qz and other force components
Figure 24. Longitudinal distribution of the bending moment VBM
A good agreement is found between the evolution of the ATI sensor (QzATI and VBMATI) and the reconstructed values (Qz and VBM). However, the accuracy of such predictions is highly influenced by the values of the mass and inertia of each segment and by the accuracy of all the measured parameters used in the reconstruction.
CONCLUSIONS The objectives of the present study were to obtain physical
information on the phenomena that occur in steep waves and to build a validation case for the computation of the VBM in extreme wave. An experimental campaign was performed in the
10

hydrodynamic and ocean engineering tank of Ecole Centrale Nantes on a 6750-TEU containership to investigate the effect of increasing wave steepness on the motions, loads and vertical bending moment.
The segmented ship model had the same geometry used for a previous benchmark study and was designed for having the central beam as rigid as possible. The sensor positions were chosen to have redundant measurement ensuring a certain accuracy.
In this paper, time series and RAO of the motions and the VBM have been presented. Further analysis of these experimental results will allow to better understand the extreme loading of ships. Besides, in addition to previous studies, this provides a valuable reference dataset to validate simulation tools in extreme wave.
ACKNOWLEDGMENTS This work was performed within the industrial Chair
agreement between Ecole Centrale Nantes and Bureau Veritas. The authors want to thank the reviewers for their
constructive comments on the paper. Experiments were carried out in the hydrodynamic and
ocean engineering tank of Ecole Centrale Nantes thanks to L. Davoust and the technical staff of the laboratory.
REFERENCES [1] Y. Kim and J.-H. Kim. Benchmark study on motions and
loads of a 6750-teu containership. Ocean Engineering, 119:262-273, 2016.
[2] Q. Derbanne, G. Storhaug, V. Shigunov, G. Xie, G. Zheng. Rule formulation of vertical hull girder wave loads based on direct computation. Proceedings of PRADS2016, 2016.
[3] S.E. Hirdaris, Y. Lee, G. Mortola, A. Incecik, O. Turan, S.Y. Hong, B.W. Kim, K.H. Kim, S. Bennett, S.H. Miao, P.Temarel. The influence of nonlinearities on the symmetric hydrodynamic response of a 10,000TEU Containership. Ocean Engineering, 111:166-178, 2016.
[4] I. Watanabe, M. Ueno, H. Sawada. Effects of Bow Flare Shape to the Wave Loads of a container ship. Read at the Autumn Meeting of the Society of Naval Architects of Japan, Nov. 1989.
[5] J. De Lauzon, A. Benhamou, S. Malenica et al.. Numerical simulations of WILS experiments. The Twenty-fifth International Ocean and Polar Engineering Conference, 2015.
[6] S. Rajendran, N. Fonseca, C. Guedes Soares. Prediction of extreme motions and vertical bending moments on a cruise ship and comparison with experimental data. Ocean Engineering 127, 368-386, 2016.
[7] G.F. Clauss, M. Klein, M. Dudek. Influence of the Bow Shape on Loads in High and Steep Waves. Proceedings of
the ASME 2010 29th International Conference on Ocean, Offshore and Arctic Engineering, OMAE2010, Shanghai, China, June 6-11, 2010.
[8] J. Ramos, A. Incecik, C. Guedes Soares. Experimental study of slam-induced stresses in a containership. Marine Structures, 13:25-51, 2000.
[9] J. Yue, Y. Guo, L. Peng. Design and Make of a Segmented Ship Model for Vertical Bending Moment Measurement. OMAE2018-78610, Wuhan University of Technology, Wuhan, China, 2018.
[10] S. Denchfield, D.A. Hudson, P. Temarel, W. Bateman, S.E. Hirdaris. Evaluation of Rogue Wave Induced Loads using 2D Hydroelasticity Analysis. Hydroelasticity in Marine Technology, University of Southampton, UK, 2009.
[11] G.F. Clauss, M. Klein. Experimental investigation on the vertical bending moment in extreme sea states for different hulls. Ocean Engineering 119:181–192, 2016.
11


![05-03ChapGere[1] | Bending | Beam (Structure) - xdocs.net](https://static.fdokumen.com/doc/165x107/6323c1d9be5419ea700ebf89/05-03chapgere1-bending-beam-structure-xdocsnet.jpg)