
Automated identification of neural correlates of continuous variables
7
Journal of Neuroscience Methods 242 (2015) 65–71 Contents lists available at ScienceDirect Journal of Neuroscience Methods jo ur nal ho me p age: www.elsevier.com/locate/jneumeth Computational Neuroscience Automated identification of neural correlates of continuous variables Ian Daly a,∗ , Faustina Hwang a , Alexis Kirke b , Asad Malik a , James Weaver a , Duncan Williams b , Eduardo Miranda b , Slawomir J. Nasuto a a Brain Embodiment Lab, School of Systems Engineering, University of Reading, Reading, UK b Interdisciplinary Centre for Computer Music Research, Plymouth University, Plymouth, UK h i g h l i g h t s • A new method for identifying EEG correlates of continuous independent variables. • Our method outperforms canonical correlation analysis and common spatial patterns. • When applied to real EEG during music it finds known correlates of music tempo. • The method also identifies novel neural correlates of music induced emotion. a r t i c l e i n f o Article history: Received 29 October 2014 Received in revised form 16 December 2014 Accepted 17 December 2014 Available online 26 December 2014 Keywords: Feature selection Eigen-decomposition Neural correlates Electroencephalogram (EEG) a b s t r a c t Background: The electroencephalogram (EEG) may be described by a large number of different feature types and automated feature selection methods are needed in order to reliably identify features which correlate with continuous independent variables. New method: A method is presented for the automated identification of features that differentiate two or more groups in neurological datasets based upon a spectral decomposition of the feature set. Furthermore, the method is able to identify features that relate to continuous independent variables. Results: The proposed method is first evaluated on synthetic EEG datasets and observed to reliably identify the correct features. The method is then applied to EEG recorded during a music listening task and is observed to automatically identify neural correlates of music tempo changes similar to neural correlates identified in a previous study. Finally, the method is applied to identify neural correlates of music-induced affective states. The identified neural correlates reside primarily over the frontal cortex and are consistent with widely reported neural correlates of emotions. Comparison with existing methods: The proposed method is compared to the state-of-the-art methods of canonical correlation analysis and common spatial patterns, in order to identify features differentiating synthetic event-related potentials of different amplitudes and is observed to exhibit greater performance as the number of unique groups in the dataset increases. Conclusions: The proposed method is able to identify neural correlates of continuous variables in EEG datasets and is shown to outperform canonical correlation analysis and common spatial patterns. © 2015 Elsevier B.V. All rights reserved. 1. Introduction The electroencephalogram (EEG) is a method for measur- ing changes in electro-potential in the cortex related to the activation levels of cortical neuronal populations (Niedermeyer and Silva, 2005). It is a popular method for studying neuro- electrophysiological correlates of cognitive processes and behaviour. ∗ Corresponding author. Tel.: +44 1183788609. E-mail address: [email protected] (I. Daly). The EEG has a high temporal resolution and a wide spectral range and may, therefore, be described by a very large number of features. These include, for example, the band power within specific frequency ranges, amplitudes over specific regions of the cor- tex, or measures of interactions between different spatial regions (Rahman et al., 2012). However, EEG has very poor signal to noise ratio (SNR), which often means that many repeated trials are required before cognitively relevant information emerges from the background noise present in the signal (Niedermeyer and Silva, 2005). Due to practical limits on the numbers of repetitions of cogni- tive events participants in cognitive experiments may perform, an http://dx.doi.org/10.1016/j.jneumeth.2014.12.012 0165-0270/© 2015 Elsevier B.V. All rights reserved.
Transcript of Automated identification of neural correlates of continuous variables
C
A
IDa
b
h
••••
a
ARR1AA
KFENE
1
iaaeb
h0
Journal of Neuroscience Methods 242 (2015) 65–71
Contents lists available at ScienceDirect
Journal of Neuroscience Methods
jo ur nal ho me p age: www.elsev ier .com/ locate / jneumeth
omputational Neuroscience
utomated identification of neural correlates of continuous variables
an Dalya,∗, Faustina Hwanga, Alexis Kirkeb, Asad Malika, James Weavera,uncan Williamsb, Eduardo Mirandab, Slawomir J. Nasutoa
Brain Embodiment Lab, School of Systems Engineering, University of Reading, Reading, UKInterdisciplinary Centre for Computer Music Research, Plymouth University, Plymouth, UK
i g h l i g h t s
A new method for identifying EEG correlates of continuous independent variables.Our method outperforms canonical correlation analysis and common spatial patterns.When applied to real EEG during music it finds known correlates of music tempo.The method also identifies novel neural correlates of music induced emotion.
r t i c l e i n f o
rticle history:eceived 29 October 2014eceived in revised form6 December 2014ccepted 17 December 2014vailable online 26 December 2014
eywords:eature selectionigen-decompositioneural correlateslectroencephalogram (EEG)
a b s t r a c t
Background: The electroencephalogram (EEG) may be described by a large number of different featuretypes and automated feature selection methods are needed in order to reliably identify features whichcorrelate with continuous independent variables.New method: A method is presented for the automated identification of features that differentiate two ormore groups in neurological datasets based upon a spectral decomposition of the feature set. Furthermore,the method is able to identify features that relate to continuous independent variables.Results: The proposed method is first evaluated on synthetic EEG datasets and observed to reliably identifythe correct features. The method is then applied to EEG recorded during a music listening task and isobserved to automatically identify neural correlates of music tempo changes similar to neural correlatesidentified in a previous study. Finally, the method is applied to identify neural correlates of music-inducedaffective states. The identified neural correlates reside primarily over the frontal cortex and are consistentwith widely reported neural correlates of emotions.Comparison with existing methods: The proposed method is compared to the state-of-the-art methods of
canonical correlation analysis and common spatial patterns, in order to identify features differentiatingsynthetic event-related potentials of different amplitudes and is observed to exhibit greater performanceas the number of unique groups in the dataset increases.Conclusions: The proposed method is able to identify neural correlates of continuous variables in EEGdatasets and is shown to outperform canonical correlation analysis and common spatial patterns.© 2015 Elsevier B.V. All rights reserved.
. Introduction
The electroencephalogram (EEG) is a method for measur-ng changes in electro-potential in the cortex related to thectivation levels of cortical neuronal populations (Niedermeyer
nd Silva, 2005). It is a popular method for studying neuro-lectrophysiological correlates of cognitive processes andehaviour.∗ Corresponding author. Tel.: +44 1183788609.E-mail address: [email protected] (I. Daly).
ttp://dx.doi.org/10.1016/j.jneumeth.2014.12.012165-0270/© 2015 Elsevier B.V. All rights reserved.
The EEG has a high temporal resolution and a wide spectralrange and may, therefore, be described by a very large number offeatures. These include, for example, the band power within specificfrequency ranges, amplitudes over specific regions of the cor-tex, or measures of interactions between different spatial regions(Rahman et al., 2012). However, EEG has very poor signal to noiseratio (SNR), which often means that many repeated trials arerequired before cognitively relevant information emerges from the
background noise present in the signal (Niedermeyer and Silva,2005).Due to practical limits on the numbers of repetitions of cogni-tive events participants in cognitive experiments may perform, an
6 scienc
ifo
lptfwba
retimermha
aecam
cfipnHeb
oaatc
Ctva
2
2
vcaa
1
23
4
6 I. Daly et al. / Journal of Neuro
nvestigative researcher is often faced with a very large potentialeature space and a very small number of trials. Thus, identificationf reliable task-related features is a considerable challenge.
A number of approaches may be taken to tackle this prob-em. Where particular cognitive processes within the EEG arehase-locked to the trial commencement time and stationary, aime-averaging approach may be adopted to attempt to identifyeatures related to specific neural correlates. However, in caseshere physiological responses are not phase-locked (for example
and-power measures Pfurtscheller and Lopes da Silva, 1999) anpproach from machine learning may be adopted (Alpaydin, 2004).
One such approach which has gained considerable traction inecent years is common spatial patterns (CSP), which is based uponigen-decomposition of the covariance matrices of each group inhe dataset (Koles et al., 1990). This method was used originallyn the brain-computer interface (BCI) (Wolpaw et al., 2002) com-
unity to identify optimal features for separating two groups ofvents in the EEG and has since gained growing popularity for aange of uses, for example, identifying neural activity related tootor imagery (Friedrich et al., 2012). Extensions of the method
ave also been proposed for multiple group cases (Grosse-Wentrupnd Buss, 2008).
However, while CSP is able to identify features which may bepplied to optimally separate discrete groups of tasks, it is lessffective in the case of continuous variables. Thus, in the case oforrelation studies, where neural correlates are sought relating to
continuous independent variable, it may not be the most suitableethod.An alternative approach, which may be applied in this case is
anonical correlation analysis (CCA) (Knapp, 1978). CCA attempts tond relationships between sets of independent variables, for exam-le between two or more time series, and may be used to identifyeural correlates of continuous variables (Hardoon et al., 2004).owever, CCA is only able to identify sets of variables which lin-arly correlate with the independent variables and, therefore, maye limited in its applications (Hardoon et al., 2004).
To tackle these problems with CSP and CCA we have devel-ped an alternative automated feature selection method that isble to identify neural correlates of continuous independent vari-bles. The proposed method is based upon eigen-decomposition ofhe coarse-grained (rescaled) combined matrix of features and theontinuous independent variable.
We first describe the method. We then compare the method toSP and CCA on a synthetic test dataset before using it to attempto find feature sets which correspond to a continuous independentariable in a study of neural correlates of music-induced emotionsnd neural correlates of music perception.
. Methods
.1. Proposed method
The proposed method aims to identify features which co-ary with an independent variable by first redistributing, thenoarse-graining, performing principal component analysis (PCA),nd clustering the set of available features. This can be summarizeds follows.
. Prepare the data set by first uniformly redistributing the valueseach feature takes.
. Then coarse-grain the values each feature takes across all trials.
. Calculate a covariance matrix from the coarse-grained featurematrix to measure relationships within the dataset.
. Perform principal component analysis (PCA) to identify direc-tions of maximum variance.
e Methods 242 (2015) 65–71
5. Calculate the participation index, sort and extract the top q indexvalues. These index the features of interest.
For a data set D ∈ RM×N of N trials, each trial may be represented
by M features. Features may describe the data in a number of dif-ferent ways, for example, representing them in the time and/orfrequency domains. A feature vector comprises the values of thatfeature for all trials in the dataset D. A feature vector is defined as
F i = [Di,1, . . ., Di,N], i ∈ [1, . . ., M], (1)
where i denotes the i’th feature in the data set. An additional vectoris concatenated to the set of feature vectors, resulting in a total ofM + 1 feature vectors. This additional vector will contain the val-ues taken by the continuous independent variable across the Ntrials. We will refer to this additional variable as the independentcovariate vector.
In order to improve the robustness of the selection of featuresrelated to the independent covariate vector, the range of valuesin the set of all feature vectors is uniformly redistributed over therange 1, . . ., u, where u denotes the number of unique values in theindependent covariate vector, and coarse-grained into u partitions.This is done by first z-scoring the coordinates of each feature vectorto a mean of zero and a standard deviation of 1.
To improve the robustness of the feature selection in subsequentsteps, the complementary error function (1 – the error function) isthen applied to the normalised feature vectors (Hunter and Regan,1972). Consequently, this allows us to use PCA to identify featuresin the data. Finally, the coarse graining is completed by affine-mapping the entries in each feature vector so that they fall intothe range 1, . . ., u and rounding the values in the feature vectorin order to ensure that the number of discrete values taken by themembers of each feature vector is equal to u. This is done by divid-ing the values within each feature vector by the maximum value inthe feature vector, multiplying them by u, and adding 1.
This results in a set of coarse-grained feature vectorsF i = [Di,1, . . ., Di,N], where Di,n, n ∈ 1, . . ., N, i ∈ 1, . . ., (M + 1)denotes the coarse-grained value of feature i, trial n.
It is now possible to identify informative features by employingtechniques related to finding clusters in multivariate datasets. Oneof the clusters obtained as a result will contain the independentcovariate vector. The elements of this grouping therefore definethe features that are most closely related to it. Thus, these featuresare taken to be the features that optimally relate to the independentcovariate vector.
To this end we adapted a form of spectral clustering introducedin (Allefeld et al., 2007). The (M + 1) × (M + 1) covariance matrix ˙is calculated from the coarse-grained collection of feature vectors.Eigen decomposition is applied to the covariance matrix ̇ to finda set of eigenvalues and eigenvectors defined as
˙Vk = �kVk (2)
where �k denotes the eigenvalues and Vk the eigenvectors.Eigenvalues are then sorted in descending order and the q eigen-
values in the top 5th percentile are identified. The correspondingeigenvectors explain the majority of the variance in the set of fea-ture vector projections onto the linear subspace spanned by theseeigenvectors V = [vi,k], k ∈ [1, . . ., q], ∀i ∈ [1, . . ., (M + 1)].
The Participation Index ( PI) (defined in (Allefeld et al., 2007))provides a measure of the involvement of each feature vector ineach cluster
PIi,k = �k ∗ v2i,k, ∀i = [1, . . ., (M + 1)], ∀k = [1, . . ., q], (3)
where the eigenvalues �k and their corresponding eigenvectorshave been pre-sorted in descending order of eigenvalue.
We first inspect the column of PI corresponding to the inde-pendent covariate vector (PI(M+1),:). The largest PI in this column
scienc
imco
sitv
2
m1b
dtag
w
pelo
2
cmwtdti
aYftte
2
ocopE
wtwmit
Fr
real EEG recorded via the International 10/20 system for elec-trode placement). Datasets were generated with numbers ofgroups of trials ranging between 2-20 and the performance of
0 0.1 0.2 0.3 0.4 0.5 0.6 0.7 0.8 0.9 1.00.3
0.4
0.5
0.6
0.7
0.8
0.9
1
Time (s)
Acc
urac
y
CSPCCAProposed method
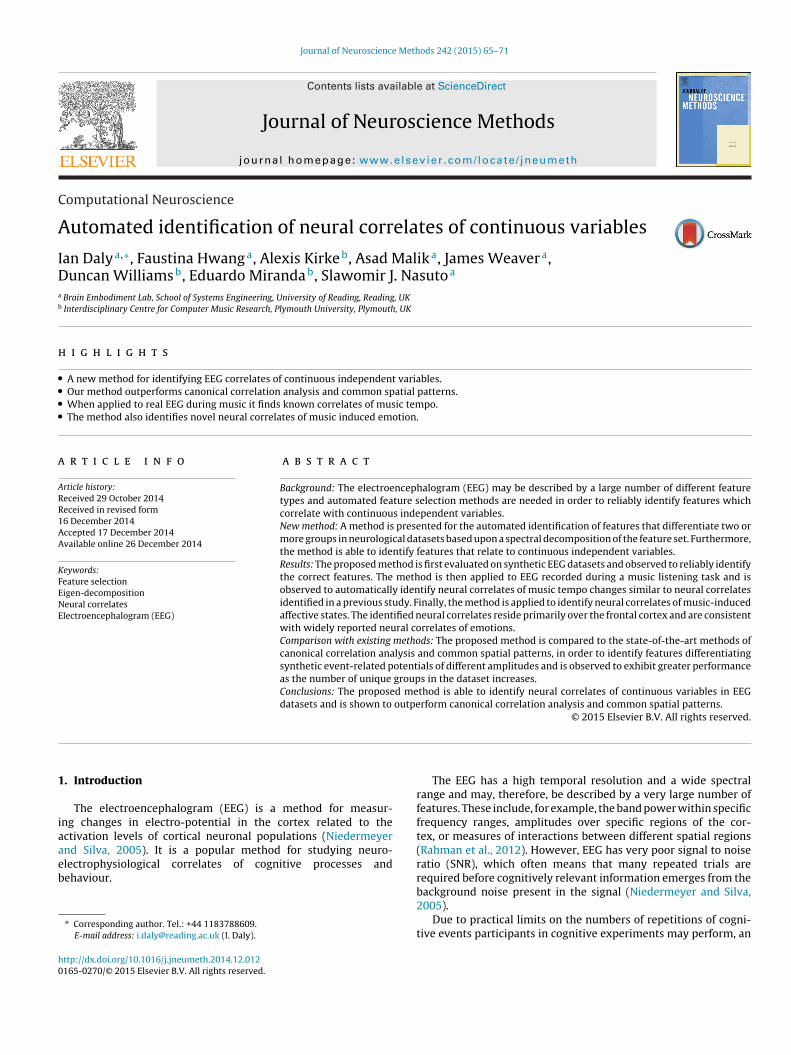
Fig. 1. Classification accuracy over time for artificial ERPs (2 groups) with featuresselected via our method, common spatial patterns (CSP), and canonical correla-tion analysis (CCA). The dashed line indicates the level of statistically significantclassification accuracy (p < 0.05).
0 5 10 150.75
0.8
0.85
0.9
0.95
1
R
CSPCCAProposed
I. Daly et al. / Journal of Neuro
ndexes an eigenvector indicating the cluster of feature vectorsost involved with the independent covariate vector. Thus, the
orresponding feature vectors in this cluster represent a good setf features that relate to the independent covariate vector.
Therefore, the final set of selected features are identified byelecting the top q PIs from the row PI:,˛, where ̨ denotes thendex of the largest PI in the column PI(M+1),:. These indexes iden-ify the optimal set of features relating to the independent covariateector and, hence, the set of identified features.
.2. Common spatial patterns
Common spatial patterns attempt to identify a spatial filter thataximally separates data between two or more groups (Koles et al.,
990). They have been used for many applications, primarily inrain–computer interfacing (BCI) research (Hwang et al., 2013).
For sets of features X1 ∈ Rt2×n and X2 ∈ R
t2×n corresponding toifferent conditions, where n is the number of samples and t1 and
2 denote the number of trials in each group, CSP attempts to find filter (w ∈ R
n×n)T such that the variance ratio between the tworoups is maximised. This is defined as
= argmaxw
||X1w||2||X2w||2 . (4)
The solution is found by solving the generalised eigenvalueroblem on w. The eigen-decomposition is used to identify theigenvectors and eigenvalues of the covariance matrices. Theargest eigenvector may then be used as a filter, denoting elementsf the dataset that separate the groups.
.3. Canonical correlation analysis
Canonical correlation analysis (CCA) attempts to find linearombinations of two vectors of random variables such that theyaximally correlate with one another. For example, in the casehere one of the vectors contains just one random variable and
he other several random variables, the single random variable mayenote an independent covariate and CCA could be used to identifyhe set of random variables which maximally correlate with thisndependent covariate (Hardle and Simar, 2007).
Given two column vectors of random variables X = (x1, . . ., xn)′
nd Y = (y1, . . ., yn)′, a covariance matrix is defined as �XY = cov(X,). CCA then seeks two vectors a and b for which the correlationunction is p = corr(a′X, b′Y). These vectors then give weightings tohe relative correlation of each random variable in X and Y. Hence,hey may be used to select optimal sub-sets of random variables inither X and/or Y (Hardoon et al., 2004).
.4. Comparison
Artificial event-related potentials (ERPs) were used to compareur proposed method to CSP and CCA. An ERP is a phase-lockedhange in amplitude of the EEG that occurs in response to a stimulusr event. ERPs may be used to study a wide variety of cognitiverocesses and are amongst the most studied phenomena in theEG (Handy, 2005).
For the synthetic dataset, we simulated an EEG componenthose amplitude correlated with an independent covariate, where
he number of values that the independent covariate could takeas varied. Thus, we sought to evaluate the performance of theethods for datasets containing trials with n different amplitudes
n the ERPs. The amplitude of the ERPs correlated with the value of
he independent covariate vector.EEG data was generated via a neural mass model (David andriston, 2003) simulating 100 trials recorded from 19 EEG electrodeecording channels of length 1 s each at a sample rate of 125 Hz.
e Methods 242 (2015) 65–71 67
The dataset of 100 trials was split into groups of trials with equalnumbers of trials per group, and the number of groups was variedbetween 2 and 20 (e.g. in the case of 2 groups, each group con-tained 50 trials). In the case that of 100 trials not evenly splittinginto the desired number of groups, uniformly drawn trials wereremoved from the dataset until an even split of trials across groupswas possible.
ERPs were simulated by increasing the amplitude of the syn-thetic EEG between 0.2 s and 0.8 s by a gain-adjusted Gaussianfunction. The gain increased the amplitude of the ERPs as a functionof the value of the independent covariate vector. Thus, syntheticERPs added to group 10 were larger in amplitude than syntheticERPs added to group 9. Thus, the added ERP component was a func-tion of the independent covariate and amenable to identification viathe proposed method, CSP, and CCA.
ERPs were added to channels 14, 15, and 16 (channelscorresponding to positions P3, Pz, and P4 in the case of a
Classes
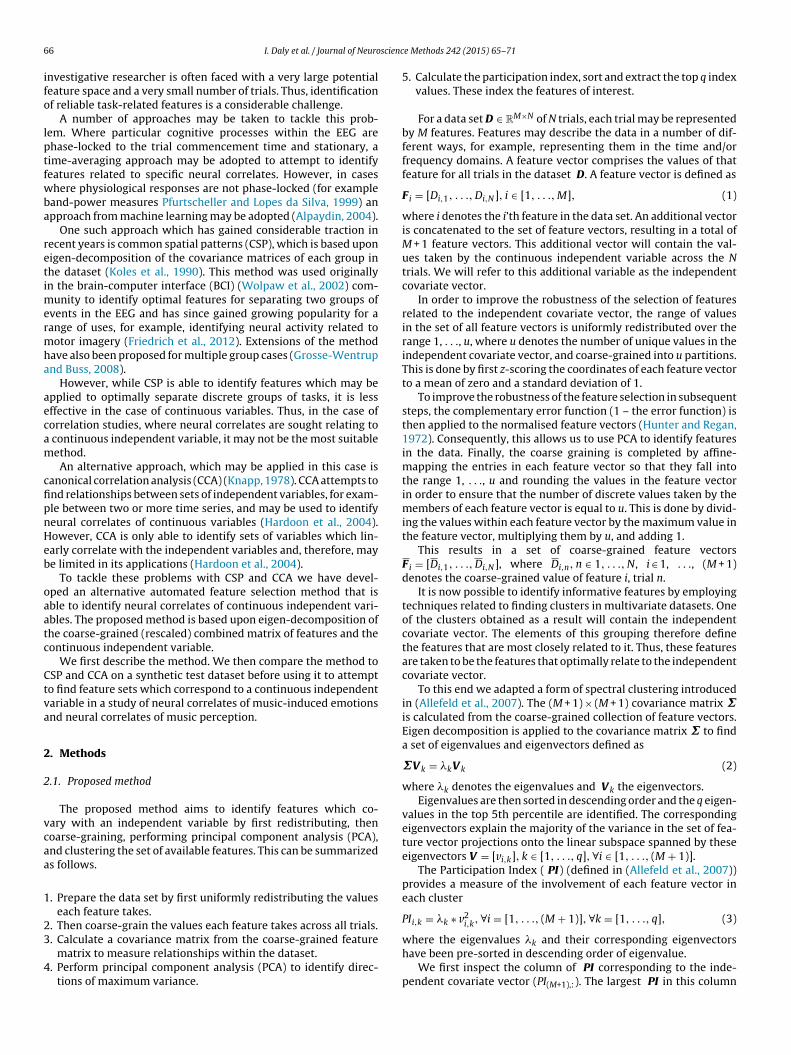
Fig. 2. Correlation between the features selected by each of the methods and the val-ues of the independent covariate vector as a function of the number of unique valuesin the independent covariate. The shaded lines represent ±2 standard deviations.
68 I. Daly et al. / Journal of Neuroscience Methods 242 (2015) 65–71
(a) Ground truth, 2 class (b) Ground truth, 10 class (c) Ground truth, 20 class
(d) CS P, 2 class (e ) CS P, 10 class (f ) CS P, 20 class
(g) CCA, 2 class (h ) CCA, 10 class (i ) CCA, 20 class
(j) Prposed method, 2 class (k) Proposed method, 10 class (l) Proposed method, 20 class
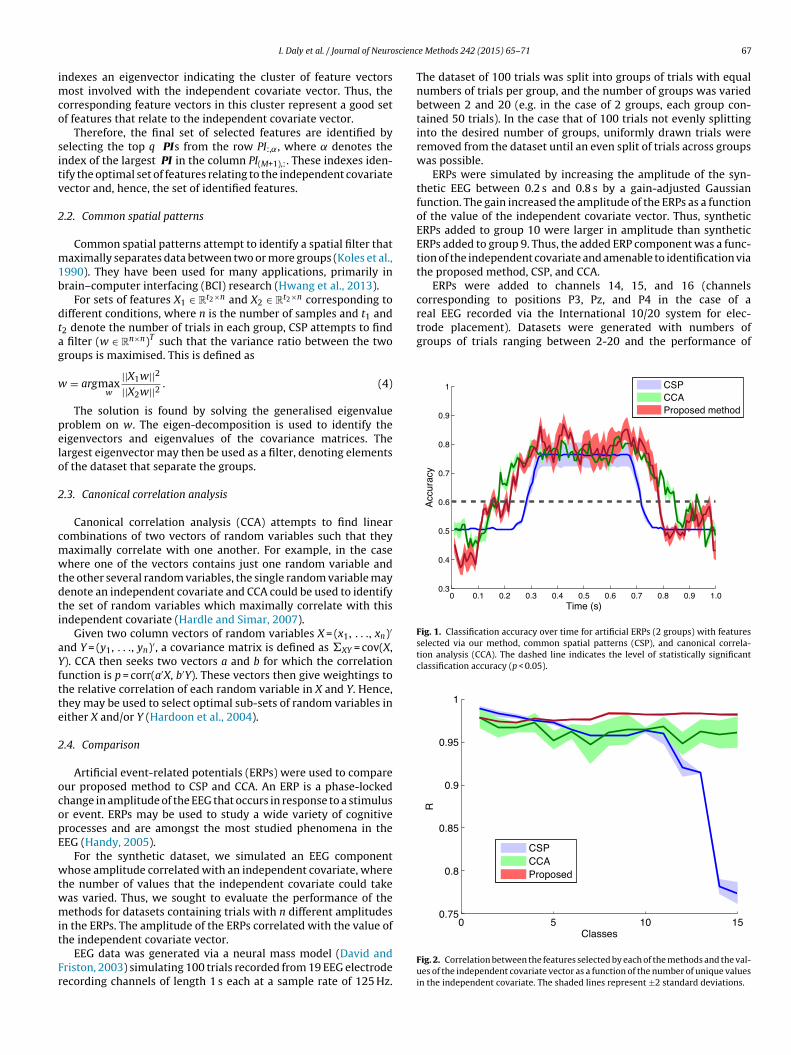
Fig. 3. Topographic scalp maps of channels selected via the CSP and CCA feature selection methods and our proposed method for 2, 10, and 20 groups (classes) of ERPsi illust
ed
suit(tli
Lt
ndicated by unique values in the independent covariate vector. Ground truth maps
ach of the feature selection methods was evaluated for eachataset.
In the case of two groups of EEG trials, performance was mea-ured via a linear discriminant analysis (LDA) classifier, which wassed to attempt to differentiate trials via the amplitude of the
dentified features. In the case of more than 2 unique values inhe independent covariate the correlation between the filteredselected) EEG features and the independent covariate was usedo evaluate the performance of the methods. The higher the corre-ation the better the match between the selected features and the
ndependent covariate.The method (our proposed method, CSP, or CCA) and theDA classifier is trained and tested in a 10 × 10 cross foldrain and validation scheme. This allows us to measure the
rate which channels have had simulated ERPs added.
variance of performance of each of the methods against oneanother.
2.5. Application
A number of neural correlates of the participant-reportedinduced emotions and neural correlates of properties of musicalstimuli, such as tempo, have been reported elsewhere (Daly et al.,2014, 2014). Here we use our proposed method to first automati-cally identify some of these neural correlates and second, to search
for further, previously unidentified, neural correlates of music-induced affective states.EEG was first cleaned of artefacts by visual inspection followedby supervised independent component analysis. Further details can
science Methods 242 (2015) 65–71 69
bec1nwao
1
2
3
3
titOapainrCp=0
staoa
tttct
catoevv
tbmm
3
lr
(a) Neural correlates identified by the proposed method
(b) Manually identified correlates
I. Daly et al. / Journal of Neuro
e found in Daly et al. (2014). Band-power features were thenxtracted from the EEG from a frequency window of width 2 Hzentred at 10 Hz. Time series of the band-power values of length
s were extracted from all 19 channels (recorded as per the inter-ational 10/20 system) and down-sampled to 100 Hz. Our methodas then applied to search for band-power features across all avail-
ble channels and time points that maximally correlate with eachf the following properties:
. Each of the participant-reported ratings of induced affectivestates (pleasantness, energy, tension, anger, fear, happiness, sad-ness, and tenderness).
. The tempo of the music (measured in beats per minute), esti-mated via the approach described in Ellis (2007).
. Results
.1. Comparison
When considering the two class case, features corresponding toime intervals during which class-dependent EEG has distinct activ-ty are identified by each method, which allows the artificial ERPso be classified with statistically significant accuracies (p < 0.01).ur method achieved a peak accuracy of 0.869 (± 0.004), while CSPchieved a peak accuracy of 0.765 (± 0.021), and CCA achieved aeak accuracy of 0.826 (± 0.001). A 1x3 ANOVA with factor ‘Method’nd levels ‘Proposed’, ‘CSP’, and ‘CCA’ was used to determine if theres a significant effect on peak accuracy of the method used. A sig-ificant effect is found F(2, 27) = 183.91, p < 0.001. Post-hoc t-testseveal significant differences between the proposed method andSP (p < 0.01) and the proposed method and CCA(p < 0.01). The pro-osed method has the highest peak accuracy (mean = 0.872, STD.
0.005), while CCA (mean = 0.827, STD. = 0.001) and CSP (mean =.756, STD. = 0.028) have lower peak accuracies.
Additionally, our proposed method achieved a longer period ofignificant classification accuracy and was detected earlier in therial. This is illustrated in Fig. 1, in which our proposed methodchieves significant classification from 0.2 s to 0.7 s, while CSPnly achieves significant accuracy from 0.3 s to 0.7 s, and CCA alsochieves significant accuracies from 0.2 s to 0.7 s.
In the case of additional numbers of unique values being addedo the independent covariate vector, the ability of each of the fea-ure selection methods to identify good feature sets is measured byhe correlation between the selected features and the independentovariate vector. Fig. 2 illustrates how this correlation changes ashe number of unique values increases from 2 through to 15.
In the case of between 2 and 5 unique values in the independentovariate vector the performance of the methods is broadly equiv-lent. However, as the number of unique values increases above 6he performances of CSP and CCA both exhibit some decline, whileur method marginally increases in performance. It is also inter-sting to note that our proposed method has considerably lowerariance than either CCA or CSP, with CSP exhibiting the largestariance in performance.
The EEG channels which are selected as optimally separatinghe groups of trials are illustrated in Fig. 3. Note that as the num-er of groups increases the precision of the CSP method decreasesarkedly, while the channels selected by CCA and our proposedethod both remain unchanged.
.2. Application
Our proposed method was also used to identify neural corre-ates of musical tempo and participant-reported induced affectiveesponses to music. First, neural correlates of tempo were sought
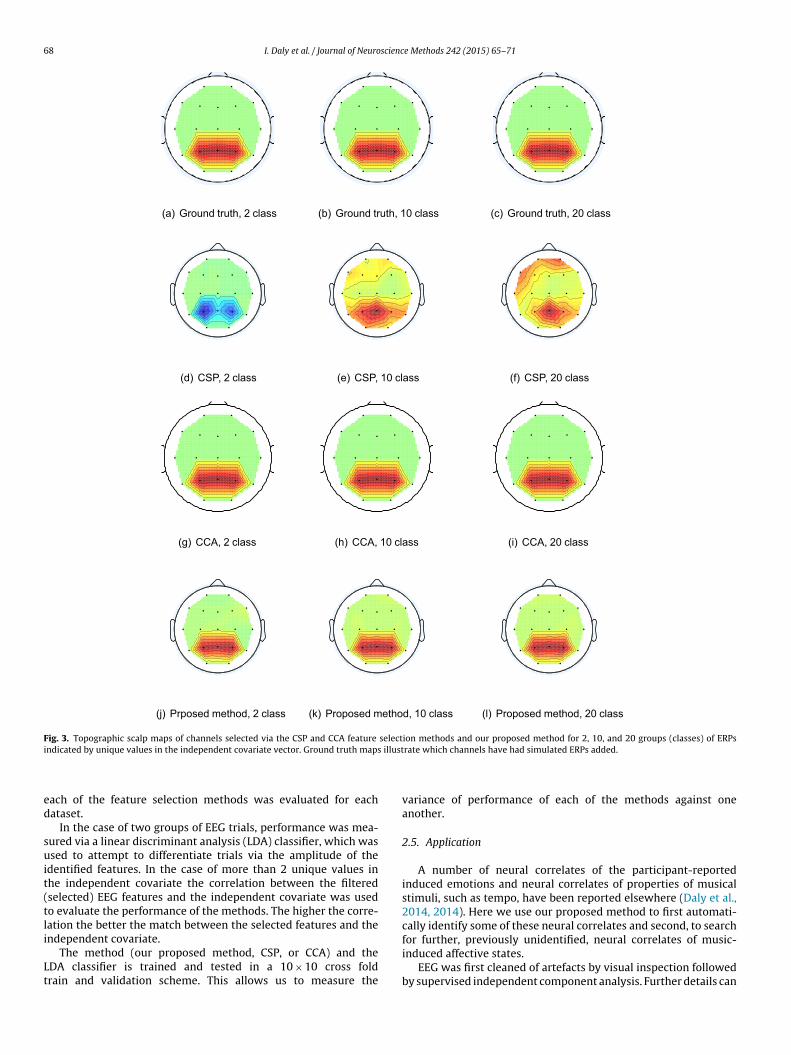
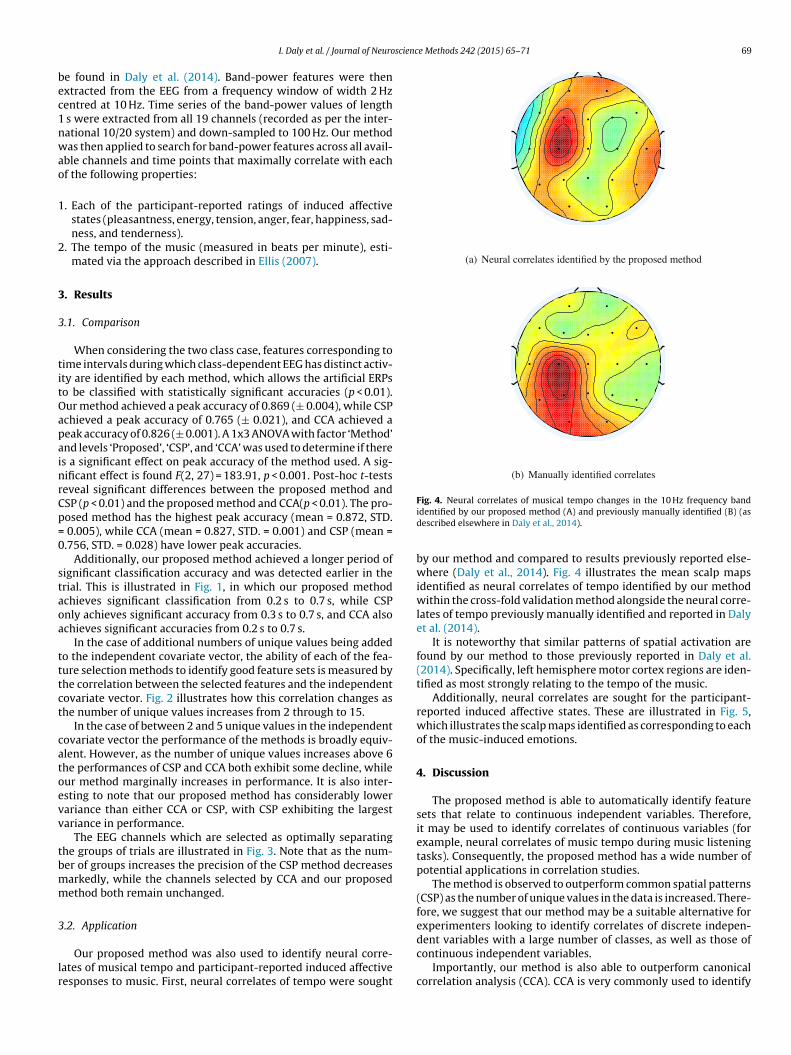
Fig. 4. Neural correlates of musical tempo changes in the 10 Hz frequency bandidentified by our proposed method (A) and previously manually identified (B) (asdescribed elsewhere in Daly et al., 2014).
by our method and compared to results previously reported else-where (Daly et al., 2014). Fig. 4 illustrates the mean scalp mapsidentified as neural correlates of tempo identified by our methodwithin the cross-fold validation method alongside the neural corre-lates of tempo previously manually identified and reported in Dalyet al. (2014).
It is noteworthy that similar patterns of spatial activation arefound by our method to those previously reported in Daly et al.(2014). Specifically, left hemisphere motor cortex regions are iden-tified as most strongly relating to the tempo of the music.
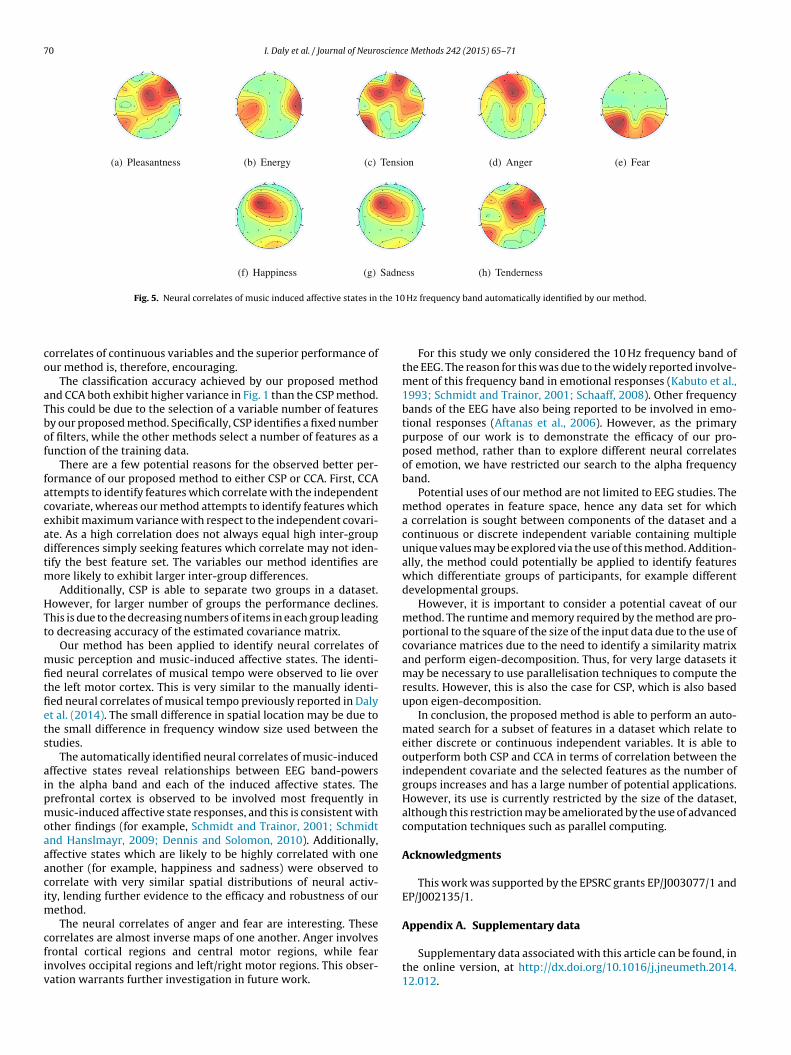
Additionally, neural correlates are sought for the participant-reported induced affective states. These are illustrated in Fig. 5,which illustrates the scalp maps identified as corresponding to eachof the music-induced emotions.
4. Discussion
The proposed method is able to automatically identify featuresets that relate to continuous independent variables. Therefore,it may be used to identify correlates of continuous variables (forexample, neural correlates of music tempo during music listeningtasks). Consequently, the proposed method has a wide number ofpotential applications in correlation studies.
The method is observed to outperform common spatial patterns(CSP) as the number of unique values in the data is increased. There-fore, we suggest that our method may be a suitable alternative forexperimenters looking to identify correlates of discrete indepen-
dent variables with a large number of classes, as well as those ofcontinuous independent variables.Importantly, our method is also able to outperform canonicalcorrelation analysis (CCA). CCA is very commonly used to identify
70 I. Daly et al. / Journal of Neuroscience Methods 242 (2015) 65–71
(a) Pleasantness (b) Energy (c) Tension (d) Anger (e) Fear
(f) Happiness (g) Sadness (h) Tenderness
the 10
co
aTbof
faceadtm
HTt
mfitfiets
aipmoaaacim
cfiv
Fig. 5. Neural correlates of music induced affective states in
orrelates of continuous variables and the superior performance ofur method is, therefore, encouraging.
The classification accuracy achieved by our proposed methodnd CCA both exhibit higher variance in Fig. 1 than the CSP method.his could be due to the selection of a variable number of featuresy our proposed method. Specifically, CSP identifies a fixed numberf filters, while the other methods select a number of features as aunction of the training data.
There are a few potential reasons for the observed better per-ormance of our proposed method to either CSP or CCA. First, CCAttempts to identify features which correlate with the independentovariate, whereas our method attempts to identify features whichxhibit maximum variance with respect to the independent covari-te. As a high correlation does not always equal high inter-groupifferences simply seeking features which correlate may not iden-ify the best feature set. The variables our method identifies are
ore likely to exhibit larger inter-group differences.Additionally, CSP is able to separate two groups in a dataset.
owever, for larger number of groups the performance declines.his is due to the decreasing numbers of items in each group leadingo decreasing accuracy of the estimated covariance matrix.
Our method has been applied to identify neural correlates ofusic perception and music-induced affective states. The identi-
ed neural correlates of musical tempo were observed to lie overhe left motor cortex. This is very similar to the manually identi-ed neural correlates of musical tempo previously reported in Dalyt al. (2014). The small difference in spatial location may be due tohe small difference in frequency window size used between thetudies.
The automatically identified neural correlates of music-inducedffective states reveal relationships between EEG band-powersn the alpha band and each of the induced affective states. Therefrontal cortex is observed to be involved most frequently inusic-induced affective state responses, and this is consistent with
ther findings (for example, Schmidt and Trainor, 2001; Schmidtnd Hanslmayr, 2009; Dennis and Solomon, 2010). Additionally,ffective states which are likely to be highly correlated with onenother (for example, happiness and sadness) were observed toorrelate with very similar spatial distributions of neural activ-ty, lending further evidence to the efficacy and robustness of our
ethod.The neural correlates of anger and fear are interesting. These
orrelates are almost inverse maps of one another. Anger involvesrontal cortical regions and central motor regions, while fearnvolves occipital regions and left/right motor regions. This obser-ation warrants further investigation in future work.
Hz frequency band automatically identified by our method.
For this study we only considered the 10 Hz frequency band ofthe EEG. The reason for this was due to the widely reported involve-ment of this frequency band in emotional responses (Kabuto et al.,1993; Schmidt and Trainor, 2001; Schaaff, 2008). Other frequencybands of the EEG have also being reported to be involved in emo-tional responses (Aftanas et al., 2006). However, as the primarypurpose of our work is to demonstrate the efficacy of our pro-posed method, rather than to explore different neural correlatesof emotion, we have restricted our search to the alpha frequencyband.
Potential uses of our method are not limited to EEG studies. Themethod operates in feature space, hence any data set for whicha correlation is sought between components of the dataset and acontinuous or discrete independent variable containing multipleunique values may be explored via the use of this method. Addition-ally, the method could potentially be applied to identify featureswhich differentiate groups of participants, for example differentdevelopmental groups.
However, it is important to consider a potential caveat of ourmethod. The runtime and memory required by the method are pro-portional to the square of the size of the input data due to the use ofcovariance matrices due to the need to identify a similarity matrixand perform eigen-decomposition. Thus, for very large datasets itmay be necessary to use parallelisation techniques to compute theresults. However, this is also the case for CSP, which is also basedupon eigen-decomposition.
In conclusion, the proposed method is able to perform an auto-mated search for a subset of features in a dataset which relate toeither discrete or continuous independent variables. It is able tooutperform both CSP and CCA in terms of correlation between theindependent covariate and the selected features as the number ofgroups increases and has a large number of potential applications.However, its use is currently restricted by the size of the dataset,although this restriction may be ameliorated by the use of advancedcomputation techniques such as parallel computing.
Acknowledgments
This work was supported by the EPSRC grants EP/J003077/1 andEP/J002135/1.
Appendix A. Supplementary data
Supplementary data associated with this article can be found, inthe online version, at http://dx.doi.org/10.1016/j.jneumeth.2014.12.012.
scienc
R
A
A
A
D
D
D
D
E
F
G
H
H
H
I. Daly et al. / Journal of Neuro
eferences
ftanas LI, Reva NV, Savotina LN, Makhnev VP. Neurophysiological correlatesof induced discrete emotions in humans: an individually oriented anal-ysis. Neurosci Behav Physiol 2006;36(2):119–30, http://dx.doi.org/10.1007/s11055-005-0170-6 http://www.ncbi.nlm.nih.gov/pubmed/16380825
llefeld C, Müller M, Kurths J. Eigenvalue decomposition as a generalizedsynchronization cluster analysis. Int J Bifurc Chaos 2007;17(10):3493–7,http://dx.doi.org/10.1142/S0218127407019251.
lpaydin E. Introduction to machine learning. Cambridge, MA: MIT Press; 2004http://books.google.com/books?id=1k0-WroiqEC&pgis=1
aly I, Malik A, Hwang F, Roesch E, Weaver J, Kirke A, et al. Neural correlates ofemotional responses to music: an EEG study. Neurosci Lett 2014;573:52–7,http://dx.doi.org/10.1016/j.neulet.2014.05.003.
aly I, Hallowell J, Hwang F, Kirke A, Malik A, Roesch E, et al. Changes in music tempoentrain movement related brain activity. In: Proceedings of the EMBC; 2014.
avid O, Friston K. A neural mass model for MEG/EEG: coupling and neuronaldynamics. NeuroImage 2003;20:1743–55.
ennis TA, Solomon B. Frontal EEG and emotion regulation: electro- corticalactivity in response to emotional film clips is associated with reduced moodinduction and attention interference effects. Biol Psychol 2010;85(3):456–64,http://dx.doi.org/10.1016/j.biopsycho.2010.09.008.
llis DPW. Beat tracking by dynamic programming. J New Music Res2007;36(1):51–60, http://dx.doi.org/10.1080/09298210701653344.
riedrich EV, Scherer R, Neuper C. The effect of distinct mental strategies onclassification performance for brain–computer interfaces. Int J Psychophysiol2012;84(1):86–94.
rosse-Wentrup M, Buss M. Multiclass common spatial patterns and informationtheoretic feature extraction. IEEE Trans Bio-Med Eng 2008;55(8):1991–2000,http://dx.doi.org/10.1109/TBME.2008.921154 http://www.ncbi.nlm.nih.gov/pubmed/18632362
andy TC. Event-related potentials: a methods handbook. Cambridge, MA: MITPress; 2005 http://books.google.com/books?hl=en&lr=&id=OQyZEfgEzRUC&pgis=1
ardle W, Simar L. Applied multivariate statistical analysis. Berlin, Heidel-berg: Springer Berlin Heidelberg; 2007, http://dx.doi.org/10.1007/978-3-540-72244-1 http://www.springerlink.com/index/
ardoon DR, Szedmak S, Shawe-Taylor J. Canonical correlation analysis: an overviewwith application to learning methods. Neural Comput 2004;16(12):2639–64,
e Methods 242 (2015) 65–71 71
http://dx.doi.org/10.1162/0899766042321814 http://www.ncbi.nlm.nih.gov/pubmed/15516276
Hunter DB, Regan T. A note on the evaluation of the complementaryerror function. Math Comput 1972;26(118):539, http://dx.doi.org/10.1090/S0025-5718-1972-0303685-4.
Hwang H-J, Kim S, Choi S, Im C-H. EEG-based brain–computer interfaces(BCIs): a thorough literature survey. Int J Hum–Comput Int 2013;29(12).,http://dx.doi.org/10.1080/10447318.2013.780869, 130429122442009.
Kabuto M, Kageyama T, Nitta H. EEG power spectrum changes due to listening topleasant music and their relation to relaxation effects. Nihon eiseigaku zasshiJpn J Hyg 1993;48(4):807–18 http://www.ncbi.nlm.nih.gov/pubmed/8254987
Knapp TR. Canonical correlation analysis: a general parametric significance-testingsystem. Psychol Bull 1978;85(2):410–6.
Koles ZJ, Lazar MS, Zhou SZ. Spatial patterns underlying population differencesin the background EEG. Brain Topogr 1990;2(4):275–84, http://dx.doi.org/10.1007/BF01129656 http://link.springer.com/
Niedermeyer E, Silva FHLD. Electroencephalography: basic principles, clinical appli-cations, and related fields. Philadelphia, PA: Lippincott Williams & Wilkins;2005.
Pfurtscheller G, Lopes da Silva F. Event-related EEG/MEG synchronization anddesynchronization: basic principles. Clin Neurophysiol 1999;110(11):1842–57,http://dx.doi.org/10.1016/S1388-2457(99)00141-8.
Rahman M, Ma W, Tran D, Campbell J. A comprehensive survey of the featureextraction methods in the EEG research. In: Xiang Y, Stojmenovic I, ApduhanBO, Wang G, Nakano K, Zomaya A, editors. Algorithms and architectures forparallel processing, vol. 7440 of Lecture notes in computer science. Berlin,Heidelberg: Springer Berlin Heidelberg; 2012. p. 274–83, http://dx.doi.org/10.1007/978-3-642-33065-0 http://www.springerlink.com/index/
Schaaff K. EEG-based emotion recognition. Universitat Karlsruhe; 2008http://www.citeulike.org/user/maxweizhao/article/6542875
Schmidt B, Hanslmayr S. Resting frontal EEG alpha-asymmetry predicts theevaluation of affective musical stimuli. Neurosci Lett 2009;460(3):237–40,http://dx.doi.org/10.1016/j.neulet.2009.05.068.
Schmidt LA, Trainor LJ. Frontal brain electrical activity (EEG) distinguishes
valence and intensity of musical emotions. Cogn Emot 2001;15(4):487–500,http://dx.doi.org/10.1080/02699930126048.Wolpaw JR, Birbaumer N, McFarland DJ, Pfurtscheller G, Vaughan TM. Brain-computer interfaces for communication and control. Clin Neurophysiol2002;113:767–91.