ATWIMA NWABIAGYA DISTRICT - :: Ghana Statistical Service ::
75
ATWIMA NWABIAGYA DISTRICT
-
Upload
khangminh22 -
Category
Documents
-
view
2 -
download
0
Transcript of ATWIMA NWABIAGYA DISTRICT - :: Ghana Statistical Service ::
ATWIMA NWABIAGYA DISTRICT

ii
Copyright © 2014 Ghana Statistical Service
iii
PREFACE AND ACKNOWLEDGEMENTS
No meaningful developmental activity can be undertaken without taking into account the
characteristics of the population for whom the activity is targeted. The size of the population
and its spatial distribution, growth and change over time, in addition to its socio-economic
characteristics are all important in development planning.
A population census is the most important source of data on the size, composition, growth
and distribution of a country’s population at the national and sub-national levels. Data from
the 2010 Population and Housing Census (PHC) will serve as reference for equitable
distribution of national resources and government services, including the allocation of
government funds among various regions, districts and other sub-national populations to
education, health and other social services.
The Ghana Statistical Service (GSS) is delighted to provide data users, especially the
Metropolitan, Municipal and District Assemblies, with district-level analytical reports based
on the 2010 PHC data to facilitate their planning and decision-making.
The District Analytical Report for the Atwima Nwabiagya is one of the 216 district census
reports aimed at making data available to planners and decision makers at the district level. In
addition to presenting the district profile, the report discusses the social and economic
dimensions of demographic variables and their implications for policy formulation, planning
and interventions. The conclusions and recommendations drawn from the district report are
expected to serve as a basis for improving the quality of life of Ghanaians through evidence-
based decision-making, monitoring and evaluation of developmental goals and intervention
programmes.
For ease of accessibility to the census data, the district report and other census reports
produced by the GSS will be disseminated widely in both print and electronic formats. The
report will also be posted on the GSS website: www.statsghana.gov.gh.
The GSS wishes to express its profound gratitude to the Government of Ghana for providing
the required resources for the conduct of the 2010 PHC. While appreciating the contribution
of our Development Partners (DPs) towards the successful implementation of the Census, we
wish to specifically acknowledge the Department for Foreign Affairs, Trade and
Development (DFATD) formerly the Canadian International Development Agency (CIDA)
and the Danish International Development Agency (DANIDA) for providing resources for
the preparation of all the 216 district reports. Our gratitude also goes to the Metropolitan,
Municipal and District Assemblies, the Ministry of Local Government, Consultant Guides,
Consultant Editors, Project Steering Committee members and their respective institutions for
their invaluable support during the report writing exercise. Finally, we wish to thank all the
report writers, including the GSS staff who contributed to the preparation of the reports, for
their dedication and diligence in ensuring the timely and successful completion of the district
census reports.
Dr. Philomena Nyarko
Government Statistician
iv
TABLE OF CONTENTS
PREFACE AND ACKNOWLEDGEMENTS ..................................................................... iii
LIST OF TABLES ................................................................................................................. vi
LIST OF FIGURES .............................................................................................................. vii
ACRONYMS AND ABBREVIATIONS ............................................................................ viii
EXECUTIVE SUMMARY ................................................................................................... ix
CHAPTER ONE: INTRODUCTION ...................................................................................1 1.1 Introduction .................................................................................................................1 1.2 Physical Characteristics...............................................................................................1
1.3 Political Administration ..............................................................................................3 1.4 Social and Cultural Structure ......................................................................................4 1.5 Economy......................................................................................................................5 1.6 Census Methodology, Concepts and Definitions ........................................................6
1.7 Organization of the Report ........................................................................................12
CHAPTER TWO: DEMOGRAPHIC CHARACTERISTICS ..........................................13 2.1 Introduction ...............................................................................................................13 2.2 Population Size and Distribution ..............................................................................13
2.3 Age-Sex Structure .....................................................................................................14 2.4 Fertility, Mortality and Migration .............................................................................15
CHAPTER THREE: SOCIAL CHARACTERISTICS ....................................................19 3.1 Introduction ...............................................................................................................19 3.2 Household Size, Composition and Structure.............................................................19
3.3 Marital Status ............................................................................................................20 3.4 Nationality .................................................................................................................24
3.5 Religious Affiliation ..................................................................................................25 3.6 Literacy and Education..............................................................................................25
CHAPTER FOUR: ECONOMIC CHARACTERISTICS ...............................................30 4.1 Introduction ...............................................................................................................30 4.2 Economic Activity Status ..........................................................................................30 4.3 Occupation ................................................................................................................32
4.4 Industry......................................................................................................................32 4.5 Employment Status ...................................................................................................33 4.6 Employment Sector ...................................................................................................34
CHAPTER FIVE: INFORMATION COMMUNICATION TECHNOLOGY ..............35 5.1 Introduction ...............................................................................................................35 5.2 Ownership of Mobile Phones ....................................................................................35 5.3 Use of the Internet .....................................................................................................35
5.4 Household Ownership of Computers ........................................................................36
CHAPTER SIX: DISABILITY ...........................................................................................37 6.1 Introduction ...............................................................................................................37 6.2 Population with Disability and Type of Disability ...................................................37 6.3 Disability and Economic Activity .............................................................................38 6.4 Disability and Educational Attainment .....................................................................39
v
CHAPTER SEVEN: AGRICULTURAL ACTIVITIES ...................................................32 7.1 Introduction ...............................................................................................................32 7.2 Households in Agriculture ........................................................................................32 7.3 Type of Farming Activity ..........................................................................................32
CHAPTER EIGHT: HOUSING CONDITIONS ...............................................................34 8.1 Introduction ...............................................................................................................34 8.2 Housing Stock and Household Population ................................................................34 8.3 Type of Dwelling, Holding and Tenancy Arrangements ..........................................34 8.4 Main Construction Material for Outer Walls ............................................................35
8.5 Main construction Material for Floors ......................................................................36 8.6 Main Construction Material for Roofing ..................................................................36 8.7 Room Occupancy ......................................................................................................37 8.8 Type of Occupied Dwelling Units ............................................................................37 8.9 Main Source of Lighting ...........................................................................................38
8.10 Main Source of Cooking Fuel ...................................................................................39 8.11 Main Source of Water for Drinking and for Other Domestic Use ............................39 8.12 Bathing and Toilet Facilities .....................................................................................41
8.13 Method of Waste Disposal ........................................................................................41
CHAPTER NINE: SUMMARY OF FINDINGS, CONCLUSIONS AND POLICY
IMPLICATIONS ...................................................................................................................43 9.1 Introduction ...............................................................................................................43 9.2 Summary of Findings ................................................................................................43 9.3 Policy Implications ....................................................................................................46
9.4 Conclusion .................................................................................................................46
REFERENCES .......................................................................................................................48
APPENDICES ........................................................................................................................49
LIST OF CONTRIBUTORS ................................................................................................54
vi
LIST OF TABLES
Table 2.1: Population of the district by age, sex and type of locality .....................................13
Table 2.2: Reported total fertility rate, general fertility rate and crude birth rate by district .15
Table 2.3: Female population 12 years and older by age, children ever born, children
surviving and sex of child .....................................................................................16
Table 2.4: Total Population, deaths in households, crude death rate and cause of deaths .....16
Table 2.5: Sex of deceased and specific death rate .................................................................17
Table 2.6: Birthplace by duration of residence of migrants ....................................................18
Table 3.1: Household size, number of households and average household size ....................19
Table 3.2: Household population by composition and sex .....................................................20
Table 3.3: Household population by structure and sex ...........................................................20
Table 3.4: Persons 12 years and older by sex, age-group and marital status ..........................21
Table 3.5: Persons 12 years and older by sex, marital status and level of education .............23
Table 3.6: Persons 12 years and older by sex, marital status and economic activity status ...24
Table 3.7: Population by nationality and sex ..........................................................................24
Table 3.8: Population by religion and sex ..............................................................................25
Table 3.9: Population 11 years and older by sex, age and literacy status ...............................26
Table 3.10:Population 3 years and older by level of education, school attendance and sex ...29
Table 4.1: Population 15 years and older by activity status and sex ......................................30
Table 4.2: Employed population 15 years and older by sex, age and activity status..............31
Table 4.3: Employed population 15 years and older by occupation and sex ..........................32
Table 4.4: Employed population 15 years and older by industry and sex ..............................33
Table 4.5: Employed population 15 years and older by employment status and sex .............34
Table 4.6: Employed population 15 years and older by employment sector and sex .............34
Table 5.1: Population 12 years and older by mobile phone ownership, internet facility
usage and sex ........................................................................................................35
Table 6.1: Population by type of locality, disability type and sex ..........................................37
Table 6.2: Persons 15 years and older with disability by economic activity status and sex ...39
Table 6.3: Population 3 years and older by sex, disability type and level of education .........30
Table 7.1: Households by agricultural activities and locality .................................................32
Table 7.2: Distribution of livestock and keepers ....................................................................33
Table 8.1: Stock of houses and households by type of locality ..............................................34
Table 8.2: Ownership status of dwelling by sex of household head and type of locality .......35
Table 8.3: Main construction material for outer wall of dwelling unit by type of locality ....35
Table 8.4: Main construction materials for the floor of dwelling unit by type of locality .....36
Table 8.5: Main construction material for roofing of dwelling unit by type of locality .........36
Table 8.6: Household size and number of sleeping rooms occupied in dwelling unit ...........37
Table 8.7: Type of occupied dwelling unit by sex of household head and type of locality ...38
Table 8.8: Main source of lighting of dwelling unit by type of locality .................................38
Table 8.9: Main source of cooking fuel, and cooking space used by households ..................39
Table 8.10: Main source of water of dwelling unit for drinking and other domestic
vii
purposes ...............................................................................................................40
Table 8.11: Toilet facilities used by households ......................................................................41
Table 8.12: Method of solid and liquid waste disposal by type of locality .............................42
Table A1: Household composition by type of locality ..........................................................49
Table A2: Distribution of households engaged in tree growing or crop farming by type
of crop and population engaged ............................................................................50
Table A3: Population by sex, number of households and houses in the 20 largest ...............52
communities ...........................................................................................................52
Table A4: Population by age group in the 20 largest communities ........................................53
LIST OF FIGURES
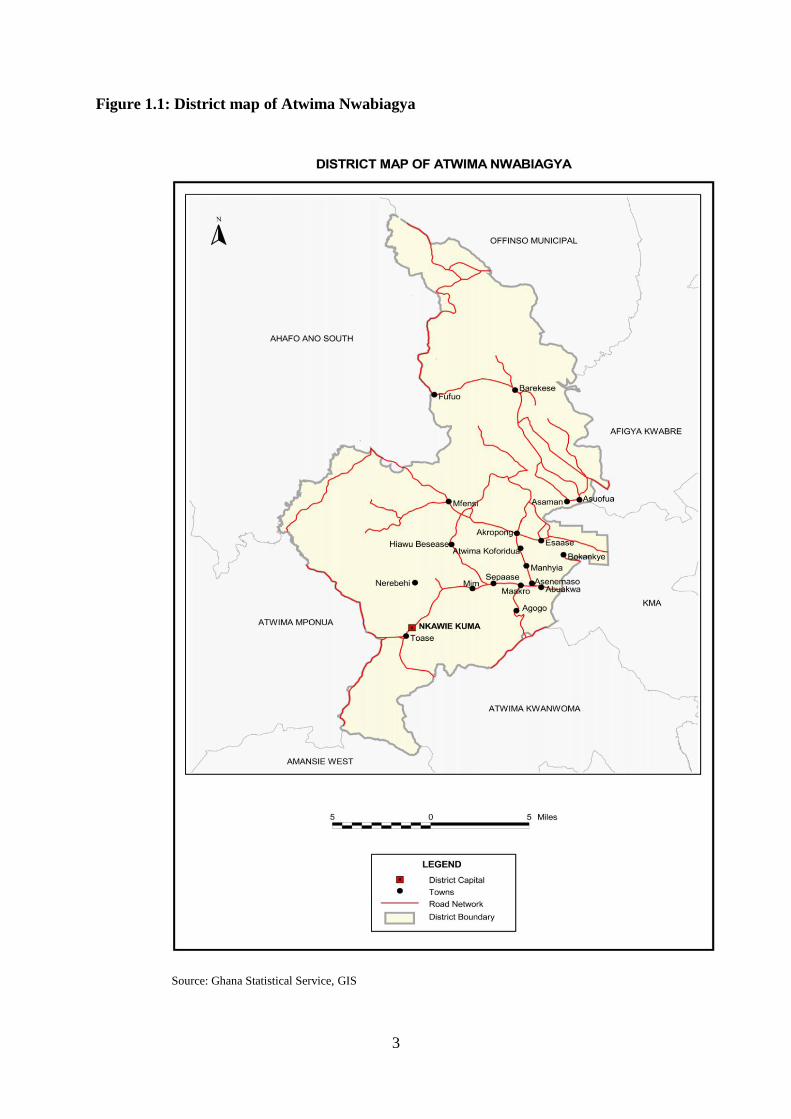
Figure 1.1: The district map and the neighboring districts ........................................................3
Figure 2.1: Population pyramid ..............................................................................................14
Figure 2.2: Reported age specific death rates by sex ..............................................................17
Figure 3.1: Percentage of population 12 years and older by marital status ............................21
viii
ACRONYMS AND ABBREVIATIONS
CBRs Crude Birth Rate
CIDA Canadian International Development Agency
CHIPS Community Health Planning Services
DANIDA Danish International Development Agency
ECOWAS Economic Community of West African States
GSS Ghana Statistical Service
ICT Information and Communication Technology
JHS Junior High School
JSS Junior Secondary School
KVIP Kumasi Ventilation Improved Pit
MDGs Millennium Development Goals
PHC Population and Housing Census
PhD Doctor of Philosophy
PWD Persons with disabilities
Sec Secondary
SHS Senior High School
SSS Senior Secondary School
UN United Nations
UNDP United Nations Development Programme
Voc Vocational
Tech Technical
WC Water Closet
ix
EXECUTIVE SUMMARY
Introduction
The district census report is the first of its kind since the first post-independence census was
conducted in 1960. The report provides basic information about the district. It gives a brief
background of the district, describing its physical features, political and administrative
structure, socio-cultural structure and economy. Using data from the 2010 Population and
Housing Census (2010 PHC), the report discusses the population characteristics of the District,
fertility, mortality, migration, marital status, literacy and education, economic activity status,
occupation, employment; Information Communication Technology (ICT), disability,
agricultural activities and housing conditions. The key findings of the analysis are as follows
(references are to the relevant sections of the report):
Population size, structure and composition
The population of the Atwima Nwabiagya District is 149,025 with majority (68.5%) of the
population living in rural localities. Females constitute more than half (51.7%) of the
population of the district resulting in a sex ratio of 93.3. Further analysis of the data indicate
that the district has a youth population with the population less than 15 years constituting more
than one third (38.8%) of the total population. Due to the high percentage of the young people
in the district, the dependency ratio is 73.8.
Fertility, mortality and migration
The Total Fertility Rate (TFR) for the district 3.4 which slightly higher than the regional
average of (3.3). The General Fertility Rate (GFR) is 99.9 births per 1000 women aged 15-49
years which is higher than the regional average of 96.4. The Crude Birth Rate (CBR) is 27.0 per
1000 population and the Crude Death Rate for the district is 5.89 per 1000. More than half
(51.2%) of the total population of the district are migrants. The majority (64.7%) of the
migrants where born elsewhere in the Ashanti Region. For those born in other regions, Brong
Ahafo Region tops the list (27%).
Household size, composition and structure
The District has a household population of 146,076 with a total number of 35,205 households.
The average household size in the district is 4.1 persons. Children of head of household
constitute the largest proportion (42.9%) of household members, with head of households
forming about one fourth (24.1%) of household members. With respect to the sexes, male heads
constitute a higher proportion (30.6%) than females (18.1%).
Marital status
More than one third (38.6%) of the population aged 12 years and older in the District are
married with 43.5 percent indicating they have never been married. Close to one tenth of the
population under consideration indicated they are in consensual unions. Very small
proportions indicated they are divorced, separated or widowed. Only about five percent of
the population aged 12 years and older are in some form of marital relationship (married or
living together).
x
Nationality
The majority (96.2%) of the population in the district are Ghanaians by birth. The population
with dual nationality and naturalized Ghanaians constitute smaller proportions. Non-
Ghanaians constitute less than two percent of the population of the District. A similar
distribution is observed for both males and females.
Literacy and education
Of the population aged 11 years and older in the District, 80.5 percent are literate. Among the
literate population, the majority (67.4 %) are literate in English and Ghanaian language.
Only a small proportion (0.2%) of the population is literate in English and French, with 12.5
percent literate in Ghanaian language only.
School attendance
More than one third (45.2%) of the population currently in school in the District are in
primary schools, with close to one fifth (18.6%) in Junior High Schools. For those who have
attended school in the past, 36.7 percent of females and 30.7 percent of males have attained
JHS/JSS education. There are relatively smaller proportions of males (2.1%) and females
(2.0%) who have attained post middle/secondary education.
Economic activity status and employment
A little over two thirds (68.7%) of the population aged 15 years and older are economically
active. Out of this, 92.2 percent are employed, 94.2 percent worked, while 5.7 percent did not
work but had job to go back to (5.5%) or did voluntary work without pay (0.2%). Females
are more likely to be economically not active (33.0%) than males.
Occupation and industry of employment
In terms of occupation of the employed population, majority (23.6) are engaged as service
and sales workers. The second commonest (23.6%) occupation of the employed in the district
is skilled agricultural, forestry and fishery. The major industry engaging majority of the
workers in the district is wholesale and retail trade, followed by agriculture, forestry and
fishing.
Employment status and sector
The majority (60.8%) of the employed population in the district are self-employed without
employees with about one fifth (21.0%) being employees. With regards to sector of
employment, the private informal sector is the largest employer in the district, employing
84.8 percent of the population followed by the public sector with 7.0 percent.
Information Communication Technology
Of the population 12 years and older, 58.6 percent have mobile phones. Males who own
mobile phones constitute 51.5 percent as compared to 48.5 percent of females. A little over
two percent of the population 12 years and older use internet facilities in the municipality.
About four percent of households own desktop/laptop computer in the Municipality out of
which 85.2 percent are urban households. Less than one tenth (7.9%) of the population aged
12 years and older in the district use the internet facilities. The percentage of males using
internet in the district (64.5%) is higher than females (35.5%). The majority of households in
the district do not have computers as only 8.9 percent of households reported as having a
xi
desktop or laptop computer (s). Male headed household are more likely to have a computer
(71.8%) than female headed households (28.2%) in the district.
Disability
About 2.1 percent of the district’s total population has one form of disability or the other. Of
the PWDs in the district, females form the majority of 51.8 percent. Sight is the main
disability (33.6%) in the district. This followed by persons with physical disabilities (27.6%).
The pattern of female dominance over males cut across most of the disabilities (intellectual,
emotional and hearing).
Agriculture
More than one third (35.6%) of household in the district are engaged in agriculture. In terms
of locality, the proportion of households engaged in agriculture is 21.7 percent and 42.1
percent for urban and rural households respectively.
Housing
The housing stock of Atwima Nwabiagya district is 16,532 representing 2.8 percent of the
total number of houses in the Ashanti Region. The average number of persons per house is 6.
The majority (70.2%) of houses in the district are located in rural areas.
Housing type, tenancy arrangement and ownership of dwelling units
There are two main types of dwelling units in the district, i.e., separate house (29.9%) and
compound house (51.1%). The majority (41.2%) of dwelling units are owned by household
members. About one third (30.8%) of dwelling units in the district are owned by other
private individuals.
Material for construction of outer wall, floor and roof
The most common construction material for outer walls of dwelling units in the district is
cement block/concrete 78.7%). Cement/concrete is also the main (80.5%) material used in
the construction of floors of dwelling units in the district. Metal sheets are the main roofing
materials, constituting more than 90 percent (96.5 %) of dwelling units in the district.
Room occupancy
One room constitutes the highest percentage (66.4%) of sleeping rooms occupied by
households in dwelling units in the district. Thirteen percent of households with 10 or more
members occupy single rooms.
Utilities and household facilities
The two main sources of lighting for dwelling units in the district are electricity (70.6%) and
flashlight/torch (18.5%). The main source of fuel for cooking for most households in the
district is charcoal (50.2%) followed by wood (22.7%). Close to one fifth (19.4%) of
households use gas for cooking. The main sources of drinking water for majority of
households in the district are; borehole (29.8%), public stand pipes (23.1%), pipe borne
inside dwelling (16.5%) and protected wells (16.1%).
The most common toilet facility used by households in the District is public toilet (WC,
KVIP, Pit, Pan) representing 42.2 percent followed by pit latrine (24.2%). About six percent
xii
of the population in the district have no toilet facility, and therefore defecate in the bush, field
or beach.
Waste disposal
The most widely method of solid waste disposal is by public dump in the open space
accounting for 66.5 percent. About 4.1 percent of households dump their solid waste
indiscriminately with 9.2 percent of households dumping their solid waste in public dump
(containers). House to house waste collection accounts for only 6.5 percent. For liquid waste
disposal, throwing waste onto the compound (36.9%) and onto the street (33.2%) are the two
most common methods used by households in the district. Only 2.5 percent of liquid waste is
disposed-off using the sewerage system.
1
CHAPTER ONE
INTRODUCTION
1.1 Introduction
Atwima Nwabiagya District was carved out of the former Atwima District in 2004 by the
Legislative Instrument 1738.
1.1.2 Mission Statement
The Atwima Nwabiagya District Assembly was created to facilitate the improvement of the
quality of life of the people within the assembly’s jurisdiction, through equitable provision of
services for the total development of the district, within the context of good governance.
1.1.1 Vision
The vision of the assembly is to be a leader in effective and efficient local governance and to
provide the required development infrastructure and services, for a desirable and interesting
district to live and work.
1.2 Physical Characteristics
1.2.1 Location and size of the district
The Atwima Nwabiagya District lies approximately on latitude 6o
32’N and 6o
75’N and
between longitude 1o 45’ and 2
o 00’ West. It is one of the 30 political and administrative
districts in Ashanti Region. It is situated in the western part of the region and shares common
boundaries with Ahafo Ano South and Atwima Mponua Districts to the West, Offinso
Municipal to the North, Amansie–West and Atwima Kwanwoma Districts to the South, and
Kumasi Metropolis and Afigya Kwabre Districts to the East. It covers an estimated area of
294.84 sq. km. The district capital is Nkawie.
1.2.2 Topography and drainage
The District has an undulating topography with an average height of 77 metres above sea
level. There are highlands with varied steep and gentle slopes. The highest points in the
district can be found in the Barekese and Tabere areas. There are a number of valleys with
out- flowing streams, which provide opportunities for rice, sugarcane and vegetable
cultivation.
The Offin and Owabi are the main rivers which drain the surface area of the district. There
are however, several streams in the district such as Kobi and Dwahyen. Two major dams,
Owabi and Barekese have been constructed across the Owabi and the Offin rivers
respectively. These dams supply pipe borne water to the residents of Kumasi and its environs
including some settlements in the district.
2
1.2.3 Climate
The District lies within the wet semi-equatorial zone marked by double maximum rainfall
ranging between 170cm and 185cm per annum. The major rainfall season is from mid-March
to July and minor season is between September and mid-November. Rainfall in the district is
not distributed evenly throughout the year. Its density and pattern are also becoming
unpredictable and this poses considerable risk to rain-fed agriculture. The District need to
incorporate soil and water conservation measures into its agricultural policies and practices to
ensure all year round crop cultivation and bumper yield. Temperature is fairly uniform
ranging between 27ºC (August) and 31ºC (March) and a mean relative humidity of between
87 - 91 per cent. The lowest relative humidity usually occurs in February/April when it
averages between 83 -87 in the morning and 48-67 in the afternoon.
1.2.4 Vegetation
The vegetation found in the district is predominantly semi-deciduous forest. The vegetation
type has largely been disturbed by human activities (logging, farming, bush fires etc), thus,
depriving it of its original valuable floral species of tropical hardwoods as well as faunal
diversity. However, there are some forest reserves that have been deliberately earmarked
for biodiversity conservation in the District. These include the Owabi Water Works Forest
Reserves and Barekese Water Works Forest Reserve, which serve as water shed protection
for the Offin and Owabi rivers. In addition part of the Gyemena Forest Reserve is located in
the district.
1.2.5 Soils
The predominant soils in the District are the Kumasi-Asuansi/Nta-Offin Compound
Associations and the Bekwai-Nzema/Oda Complex Associations. They are suitable for
cultivation of tree and arable crops such as cocoa, citrus, oil palm, mangoes, guava, avocado,
maize, cassava, yams, cocoyam, plantain, pawpaw, groundnuts, pineapple and ginger. The
soil at the base of the valley is good for the cultivation of rice, sugarcane and vegetables.
Residential activities and sand winning have currently taken most of these good agriculture
lands. Proper land use planning and zoning are required to protect soils which are suitable
for agriculture.
1.2.6 Geology and minerals
The District is underlain by the Lower Birimian rocks, which consist of phyllites,
greywaches, achists and gneiss, and the Cape Coast granite. Both the Lower Birimian and
the Cape Coast granite are of considerable economic importance since they do bear Gold, and
good clay deposit for ceramics and brick making. The Cape Coast Granite is a good potential
for the building and road construction industry. The district should continue to provide the
right business environment for the full-scale and sustainable exploitation of these rocks,
which are mostly found around Asakraka, Nerebehi, Mfensi, Tabere, Ntensere and Barekese,
to create jobs and also provide sources of revenue for the district’s development.
3
Figure 1.1: District map of Atwima Nwabiagya
Source: Ghana Statistical Service, GIS
4
1.3 Political Administration
1.3.1 Governance
The District Assembly is the highest decision making body at the local level. The district has
two constituencies namely Atwima Nwabiagya South and Atwima Nwabiagya north. The
District Assembly has 8 Sub-Committees that report to an Executive Committee and to the
General Assembly where major decisions are made. There are fifty five (55) assembly
members, 38 of them are elected, and are responsible for the 38 electoral areas whiles another
17 are appointed by the Central Government.
1.3.2 District sub-structures
Below the District Assembly are the district Sub-structures. There are six (6) Area Councils
namely Abuakwa, Nkawie-Toase, Adankwame, Afari, Akropong and Barekese and eighty-
eight (88) unit committees. These sub-structures execute functions such as resource
identification/mobilization, registration of births and deaths, mobilization of communities to
undertake local development activities. Measures such as the provision of funding, office
accommodation, and means of transport, training and logistics are required to make these
structures function effectively and contribute to the development of the district.
1.4 Social and Cultural Structure
1.4.1 Culture
The predominant cultural practice in the district is the Asante culture. The main language
spoken in the district is Twi, and the most preferred food is fufu. It is prepared with cassava
and plantain or cocoyam and it is served with soup. Others include boiled plantain/cocoyam
served with ‘kontonmire’ or garden eggs stew and roasted plantain/cocoyam that is served
with roasted groundnuts. The cloth is the main traditional attire; it is worn by both male and
female to social gatherings like funerals, church, festivals, wedding and naming ceremonies.
The main dance is Adowa, Kete, and Nwomkro. There are traditional groups in the district,
which perform (sing and dance) during occasional celebrations.
Funerals, puberty rites, festivals (Akwasidae and Awukudae) are important cultural practices
of the people in the district. The Akwasidae and Awukudae festivals are celebrated every
forth night.
Tuesdays and Fridays are the main sacred days of the people in the district. Some
communities take advantage of these days to carry out community development activities.
The sacred days are opportunities for the promotion of self-help development activities in the
rural communities of the district.
Measures such as cultural education campaigns, construction of cultural village and others
are required to promote and preserve the cultural values of the people in the district.
1.4.2 Health care facilities/services
The district has only one (1) Hospital, four (4) Health Centres, six (6) Private Maternity
Homes and four (4) private clinics, which are located in Abuakwa, Akropong, Nkawie,
Toase, Dabaa, Afari, Adankwame and Barekese. The hospital is located at Nkawie/Toase.
Rural communities such as Kobeng, Wurapong, Bankyease, Abira and Amakye-Bare have
been provided with Community Health Planning Services (CHPS) compounds.
5
1.4.3 Educational facilities
There are one hundred and eighty-one (181) kindergarten/nursery schools, one hundred and
eighty-three (183) primary schools, one hundred and twenty three (123) Junior High Schools,
and five (5) Senior High Schools in the district. There are also four (4) Vocational schools
and one (1) Theological University in the district. These schools comprised of public and
private educational institutions that provide human resources development opportunities for
children and the youth in the district.
1.5 Economy
The economy of Atwima Nwabiagya District can be classified under four broad categories
namely agriculture, industry, trading and services. The service industry employs 31.7 percent
of the labour force, followed by trade/commerce which employs 25.9 percent, agriculture,
(22.8%) and lastly industry employing (19.6%). Although the district is sixty eight percent
rural and thirty two percent urban, generally it would be expected that agriculture dominates
the economy, however it should be noted that most of the settlements are closer to the
urbanized communities and so are mostly engaged in services and trade activities.
1.5.1 Agriculture
The main types of agricultural activities in the district are crop farming and livestock rearing.
Fishing is also done, but on a very limited scale. This sector of the economy provides the
food and nutrient needs of the population.
1.5.2 Industry
The district’s manufacturing sector is dominated by dressmaking, carpentry, metal
fabrication, distillation of alcoholic beverages (Akpeteshie) leather works, ceramics,
quarrying, baking, wood processing(saw mill) and batik/tie and dye making.
These businesses are mostly micro and small-scale enterprises with no permanent employees.
The owners usually rely on apprentices to undertake their activities.
1.5.3 Trade and commerce
About twenty three percent of the working population in the district is engaged in
trading/commercial activities (buying and selling).
Types of trading/commercial activities found in the district include trading in foodstuffs,
provisions, spare parts, alcoholic and non-alcoholic beverages, building materials, cooked
foods, wood/ wood products, plastic products, chemicals, fuel and lubricants. Most of the
traders are small scale retailers, and apart from a few who trade in defined market places,
most trading activities in the district are still located alongside major roads, water ways and
residential neighborhoods, thus creating some environmental and sanitation problems. These
commercial activities sometimes attract children of school going age to attach little
importance to schooling.
There are 3 main markets in the district. These are located at Barekese, Abuakwa and
Nkawie. The Abuakwa market operates daily, whiles the Nkawie and Barekese markets
operates both daily and weekly.
6
1.5.4 Services
The district has a number of businesses, which are engaged in the provision of different
services to people within and outside the district. Important services available in the District
include: hairdressing /barbering, traditional catering (chop bar), automobile repairs, radio/TV
repairs, refrigerator/air-condition repairs, mobile phone repairs, transportation, Information
and communication among others.
1.5.5 Tourism
Tourism potentials exist in the district. The Owabi and Barekese dams continue to attract a
large number of tourists into the district. Major forests reserves such as Gyamera Forest
Reserve and the Owabi and Barekese Water Works Forest Reserve, Komfo Anokye
footprints at Nkakom, are some of the notable tourist potentials in the district. The district can
also boast of the presence of an Agriculture Fair site located at Nkawie. It has conference,
restaurant and bar facilities. Other important tourist sites in the district are caves located at
Barekese, where the ‘Golden Stool is believed to have been hidden at the time the British
wanted to seize it. It is also believed to be the place where war guns of the Asantes were
stored in the olden days.
1.5.6 Financial institutions
There are three commercial banks in the district. These are: Ghana Commercial Bank Ltd.
located at Nkawie, AtwimaMponua Rural Bank located at Toase with branches at Abuakwa
and Akropong, Nwabigya Rural Bank located at Barekese, with a branch at Abuakwa.
1.5.7 Communication
There are four (4) Post Offices in the district. These are located at Toase, Abuakwa,
Akropong and Barekese. Towns with direct telephones lines are Nkawie, Toase, Abuakwa,
Akropong, Barekese and Asuofua. Telecommunication companies such as MTN, Tigo,
Expresso, Airtel and Vodafone provide mobile service in most parts of the district.
The district has no FM radio station; however, signals of all the FM stations located in
Kumasi are received in most parts of the district. Signals from GTV, TV3, TV Africa, Viasat
1 and Metro TV are also available in most parts of the district. There are also 5 internet cafes
located at Nkawie, Abuakwa and Asuofua. These facilities provide important means through
which information can be obtained for effective development of the district. Efforts must
therefore be made to ensure that the communication service providers improve and sustain
the quality of services they provide.
1.6 Census Methodology, Concepts and Definitions
The 2010 Population and Housing Census of Ghana followed the essential concepts and
definitions of a modern Population and Housing Census as recommended by the United
Nations (UN). It is important that the concepts, definitions and recommendations are adhered
to since they form the basis upon which Ghana could compare her data with those of other
countries.
The concepts and definitions in this report cover all sections of the 2010 Population and
Housing Census questionnaires (PHC1A and PHC1B). The sections were: geographical
location of the population, Household and Non-household population, Literacy and
Education, Emigration, Demographic and Economic Characteristics, Disability, Information
7
Communication Technology (ICT), Fertility, Mortality, Agricultural Activity and Housing
Conditions.
The concepts and definitions are provided to facilitate understanding and use of the data
presented in this report. Users are therefore advised to use the results of the census within the
context of these concepts and definitions.
Region
There were ten (10) administrative regions in Ghana during the 2010 Population and Housing
Census as they were in 1984 and 2000.
District
In 1988, Ghana changed from the local authority system of administration to the district
assembly system. In that year, the then existing 140 local authorities were demarcated into
110 districts. In 2004, 28 new districts were created; this increased the number of districts in
the country to 138. In 2008, 32 additional districts were created bringing the total number of
districts to 170. The 2010 Population and Housing Census was conducted in these 170
administrative districts (these are made-up of 164 districts/municipals and 6 metropolitan
areas). In 2012, 46 new districts were created to bring the total number of districts to 216.
There was urgent need for data for the 46 newly created districts for planning and decision-
making. To meet this demand, the 2010 Census data was re-programmed into 216 districts
after carrying out additional fieldwork and consultations with stakeholders in the districts
affected by the creation of the new districts.
Locality
A locality was defined as a distinct population cluster (also designated as inhabited place,
populated centre, settlement) which has a NAME or LOCALLY RECOGNISED STATUS. It
included fishing hamlets, mining camps, ranches, farms, market towns, villages, towns, cities
and many other types of population clusters, which meet the above criteria. There were two
main types of localities, rural and urban. As in previous censuses, the classification of
localities into ‘urban’ and ‘rural’ was based on population size. Localities with 5,000 or more
persons were classified as urban while localities with less than 5,000 persons were classified
as rural.
Population
The 2010 Census was a “de facto” count and each person present in Ghana, irrespective of
nationality, was enumerated at the place where he/she spent the midnight of 26th September
2010.
Household
A household was defined as a person or a group of persons, who lived together in the same
house or compound and shared the same house-keeping arrangements. In general, a
household consisted of a man, his wife, children and some other relatives or a house help who
may be living with them. However, it is important to remember that members of a household
are not necessarily related (by blood or marriage) because non-relatives (e.g. house helps)
may form part of a household.
8
Head of Household
The household head was defined as a male or female member of the household recognised as
such by the other household members. The head of household is generally the person who has
economic and social responsibility for the household. All relationships are defined with
reference to the head.
Household and non-household population
Household population comprised of all persons who spent the census night in a household
setting. All persons who did not spend the census night in a household setting (except
otherwise stated) were classified as non-household population. Persons who spent census
night in any of the under listed institutions and locations were classified as non-household
population:
(a) Educational Institutions
(b) Children's and Old People’s Homes
(c) Hospitals and Healing Centres
(d) Hotels
(e) Prisons
(f) Service Barracks
(g) Soldiers on field exercise
(h) Floating Population: The following are examples of persons in this category:
i. All persons who slept in lorry parks, markets, in front of stores and offices,
public bathrooms, petrol filling stations, railway stations, verandas,
pavements, and all such places which are not houses or compounds.
ii. Hunting and fishing camps.
iii. Beggars and vagrants (mentally sick or otherwise).
Age
The age of every person was recorded in completed years disregarding fractions of days and
months. For those persons who did not know their birthdays, the enumerator estimated their
ages using a list of district, regional and national historical events.
Nationality
Nationality is defined as the country to which a person belongs. A distinction is made
between Ghanaians and other nationals. Ghanaian nationals are grouped into Ghanaian by
birth, Ghanaian with dual nationality and Ghanaian by naturalization. Other nationals are
grouped into ECOWAS nationals, Africans other than ECOWAS nationals, and non-
Africans.
9
Ethnicity
Ethnicity refers to the ethnic group that a person belonged to. This information is collected
only from Ghanaians by birth and Ghanaians with dual nationality. The classification of
ethnic groups in Ghana is that officially provided by the Bureau of Ghana Languages and
which has been in use since the 1960 census.
Birthplace
The birthplace of a person refers to the locality of usual residence of the mother at the time of
birth. If after delivery a mother stayed outside her locality of usual residence for six months
or more or had the intention of staying in the new place for six or more months, then the
actual town/village of physical birth becomes the birthplace of the child.
Duration of residence
Duration of residence refers to the number of years a person has lived in a particular place.
This question is only asked of persons not born in the place where enumeration took place.
Breaks in duration of residence lasting less than 12 months are disregarded. The duration of
residence of persons who made multiple movements of one (1) year or more is assumed to be
the number of years lived in the locality (town or village) since the last movement.
Religion
Religion refers to the individual’s religious affiliation as reported by the respondent,
irrespective of the religion of the household head or the head’s spouse or the name of the
person. No attempt was made to find out if respondents actually practiced the faith they
professed.
Marital status
Marital status refers to the respondent’s marital status as at Census Night. The question on
marital status was asked only of persons 12 years and older. The selection of the age limit of
12 years was based on the average age at menarche and also on the practice in some parts of
the country where girls as young as 12 years old could be given in marriage.
Literacy
The question on literacy referred to the respondent's ability to read and write in any language.
A person was considered literate if he/she could read and write a simple statement with
understanding. The question on literacy was asked only of persons 11 years and older.
Education
School Attendance
Data was collected on school attendance for all persons three (3) years and older. School
attendance refers to whether a person has ever attended, was currently attending or has never
attended school. In the census, school meant an educational institution where a person
received at least four hours of formal education.
Although the lower age limit of formal education is six years for primary one, eligibility for
the school attendance question was lowered to three years because pre-school education has
become an important phenomenon in the country.
10
Level of Education
Level of education refers to the highest level of formal school that a person ever attended or
was attending. This information was obtained for persons 3 years and older.
Activity status
Activity status refers to economic or non-economic activity of respondents during the 7 days
preceding census night. Information on type of activity was collected on persons 5 years and
older. A person was regarded as economically active if they:
a. Worked for pay or profit or family gain for at least 1 hour within the 7 days preceding
Census Night. This included persons who were in paid employment or self-
employment or contributing family workers.
b. Did not work, but had jobs to return to.
c. Were unemployed.
The economically not active were persons who did not work and were not seeking for work.
They were classified by reasons for not being economically active. Economically not active
persons included homemakers, students, retired persons, the disabled and persons who were
unable to work due to their age or ill-health.
Occupation
This referred to the type of work the person was engaged in at the establishment where he/she
worked. This was asked only of persons 5 years and older who worked 7 days before the
census night, and those who did not work but had a job to return to as well as those
unemployed who had worked before. All persons who worked during the 7 days before the
census night were classified by the kind of work they were engaged in. The emphasis was on
the work the person did during the reference period and not what he/she was trained to do.
For those who did not work but had a job to return to, their occupation was the job they
would go back to after the period of absence. Also, for persons who had worked before and
were seeking for work and available for work, their occupation was on the last work they did
before becoming unemployed. If a person was engaged in more than one occupation, only
the main one was considered.
Industry
Industry referred to the type of product produced or service rendered at the respondent’s work
place. Information was collected only on the main product produced or service rendered in
the establishment during the reference period.
Employment status
Employment status refers to the status of a person in the establishment where he/she currently
works or previously worked. Eight employment status categories were provided: employee,
self-employed without employees, self-employed with employees, casual worker,
contributing family worker, apprentice, domestic employee (house help). Persons who could
not be classified under any of the above categories were classified as “other”.
11
Employment sector
This refers to the sector in which a person worked. The employment sectors covered in the
census were public, private formal, private informal, semi-public/parastatal, NGOs and
international organizations.
Disability
Persons with disability were defined as those who were unable to or were restricted in the
performance of specific tasks/activities due to loss of function of some part of the body as a
result of impairment or malformation. Information was collected on persons with visual/sight
impairment, hearing impairment, mental retardation, emotional or behavioural disorders and
other physical challenges.
Information Communication Technology (ICT)
ICT questions were asked for both individuals and households. Persons having mobile
phones refer to respondents 12 years and older who owned mobile phones (irrespective of the
number of mobile phones owned by each person). Persons using internet facility refers to
those who had access to internet facility at home, internet cafe, on mobile phone or other
mobile device. Internet access is assumed to be not only via computer, but also by mobile
phones, PDA, game machine and digital television.
Households having personal computers/laptops refer to households who own desktops/laptop
computers. The fixed telephone line refers to a telephone line connecting a customer’s
terminal equipment (e.g. telephone set, facsimile machine) to the public switch telephone
network.
Fertility
Two types of fertility data were collected: lifetime fertility and current fertility. Lifetime
fertility refers to the total number of live births that females 12 years and older had ever had
during their life time. Current fertility refers to the number of live births that females 12-54
years old had in the 12 months preceding the Census Night.
Mortality
Mortality refers to all deaths that occurred in the household during the 12 months preceding
the Census Night. The report presents information on deaths due to accidents, violence,
homicide and suicide. In addition, data were collected on pregnancy-related deaths of
females 12-54 years.
Agriculture
The census sought information on household members who are engaged in agricultural
activities, including the cultivation of crops or tree planting, rearing of livestock or breeding
of fish for sale or family consumption. Information was also collected on their farms, types of
crops and number and type of livestock.
Housing conditions and facilities
The UN recommended definition of a house as “a structurally separate and independent place
of abode such that a person or group of persons can isolate themselves from the hazards of
climate such as storms and the sun’’ was adopted. The definition, therefore, covered any type
12
of shelter used as living quarters, such as separate houses, semi-detached houses,
flats/apartments, compound houses, huts, tents, kiosks and containers.
Living quarters or dwelling units refer to a specific area or space occupied by a particular
household and therefore need not necessarily be the same as the house of which the dwelling
unit may be a part.
Information collected on housing conditions included the type of dwelling unit, main
construction materials for walls, floor and roof, holding/tenure arrangement, ownership type,
type of lightening, source of water supply and toilet facilities. Data was also collected on
method of disposal of solid and liquid waste.
1.7 Organization of the Report
This report is in nine chapters which gives detailed information analysis on the characteristics
of the population of the Atwima Nwabiagya District based on the 2010 PHC. The first
chapter provides a brief overview of the district. Chapter Two discusses the Demographic
characteristics of the Population. In Chapter three, Social Characteristics such as household
composition, size and headship are analyzed. Other social issues also discussed include
marital status, nationality, religious affiliation, literacy and education.
Chapter four is devoted to the analysis of the economic characteristics of the population and
provides information on the economic activity status, employment status and the employment
sector. Chapter five discussed information communication technology thoroughly.
Chapter six is dedicated to the analysis of data on disability. The chapter examines the data
on persons living with disabilities (PWDs), giving information on types of disabilities within
the district by socio-demographic characteristics such as age-sex, residence, education,
marriage and locality of persons living with disability.
Agricultural activities are discussed in chapter seven; this is also one of the subjects covered
for the first time in the national census. Detailed information was collected on the types of
farming activities and the households in agriculture.
Chapter Eight discusses data on stock of houses, types of dwelling, holding and tenancy
Arrangements. The analysis on housing conditions were also based on information on
housing characteristics namely construction materials used for the building – walls, floor and
roof – room occupancy, access to utilities and household facilities. The ninth chapter offers a
summary of the key findings and the policy implications from the analyses in the previous
chapters and the conclusion.
13
CHAPTER TWO
DEMOGRAPHIC CHARACTERISTICS
2.1 Introduction
Demography deals with the composition of the population. It includes the size, structure and
distribution of the population and the changes in them as a result of migration, fertility and
mortality. The objective of this chapter is to analyze the population size, distribution by type
of locality, age-sex structure, fertility, migration and mortality in Atwima Nwabiagya District,
using the 2010 Population and Housing Census data.
2.2 Population Size and Distribution
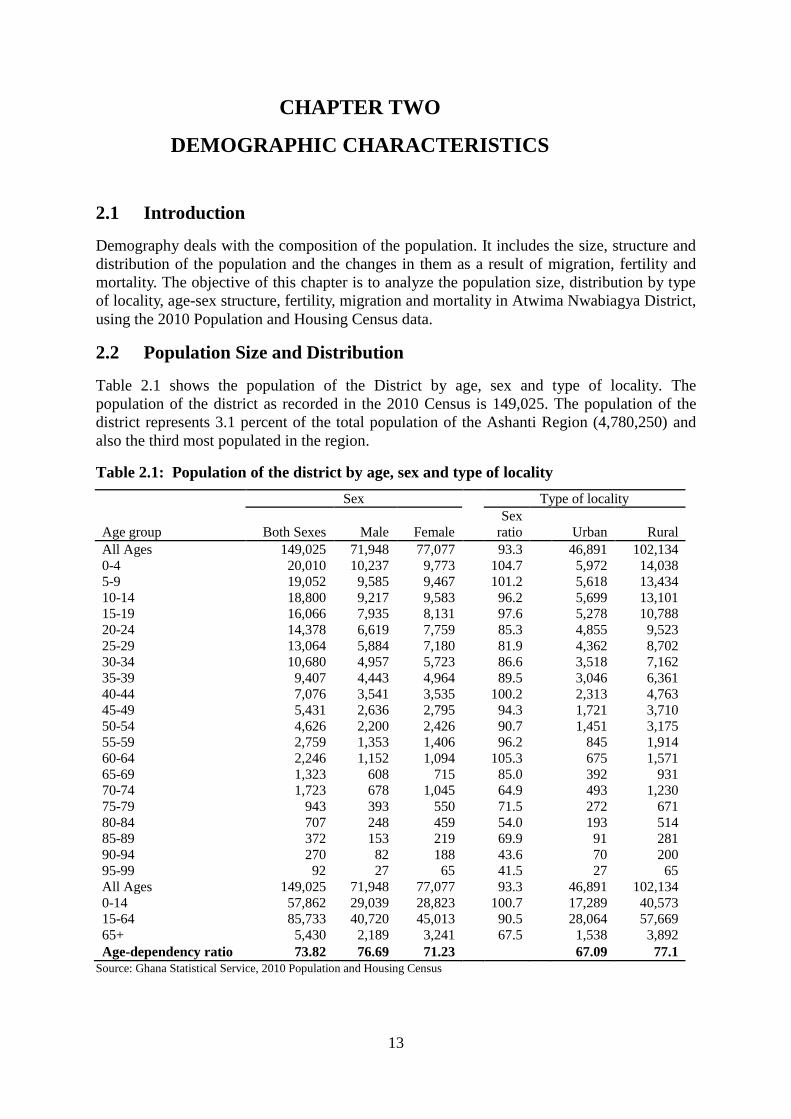
Table 2.1 shows the population of the District by age, sex and type of locality. The
population of the district as recorded in the 2010 Census is 149,025. The population of the
district represents 3.1 percent of the total population of the Ashanti Region (4,780,250) and
also the third most populated in the region.
Table 2.1: Population of the district by age, sex and type of locality
Age group
Sex Type of locality
Both Sexes Male Female
Sex
ratio Urban Rural
All Ages 149,025 71,948 77,077
93.3
46,891 102,134
0-4 20,010 10,237 9,773
104.7
5,972 14,038
5-9 19,052 9,585 9,467
101.2
5,618 13,434
10-14 18,800 9,217 9,583
96.2
5,699 13,101
15-19 16,066 7,935 8,131
97.6
5,278 10,788
20-24 14,378 6,619 7,759
85.3
4,855 9,523
25-29 13,064 5,884 7,180
81.9
4,362 8,702
30-34 10,680 4,957 5,723
86.6
3,518 7,162
35-39 9,407 4,443 4,964
89.5
3,046 6,361
40-44 7,076 3,541 3,535
100.2
2,313 4,763
45-49 5,431 2,636 2,795
94.3
1,721 3,710
50-54 4,626 2,200 2,426
90.7
1,451 3,175
55-59 2,759 1,353 1,406
96.2
845 1,914
60-64 2,246 1,152 1,094
105.3
675 1,571
65-69 1,323 608 715
85.0
392 931
70-74 1,723 678 1,045
64.9
493 1,230
75-79 943 393 550
71.5
272 671
80-84 707 248 459
54.0
193 514
85-89 372 153 219
69.9
91 281
90-94 270 82 188
43.6
70 200
95-99 92 27 65
41.5
27 65
All Ages 149,025 71,948 77,077
93.3
46,891 102,134
0-14 57,862 29,039 28,823
100.7
17,289 40,573
15-64 85,733 40,720 45,013
90.5
28,064 57,669
65+ 5,430 2,189 3,241
67.5
1,538 3,892
Age-dependency ratio 73.82 76.69 71.23 67.09 77.1
Source: Ghana Statistical Service, 2010 Population and Housing Census
14
Majority (68.5%) of the population in the district live in rural areas. The proportion of
children, i.e. persons aged 0-14 years constitute more than one third (38.8%) to the entire
population of the district. The percentage (40%) of the youth (0-14 years) in rural localities is
higher than that for urban localities (36.8%).
2.3 Age-Sex Structure
The distribution of the population by sex indicates that females constitute 51.7 percent of the
population. This, therefore, gives a sex ratio of 93.3, which implies that there are 93 males for
every 100 females in the district. Table 2.1 further shows the dominance of females in all the
age groupings except for the age groups of 0-4, 5-9, 40-44, and 60-64 which recorded sex
ratios of 104.7, 101.2, 100.2 and 105.3 respectively. From figure 2.1, it can be seen that the
district has a youthful population which consists of a large proportion in the age groups
below 15 and only a small proportion above 65 years.
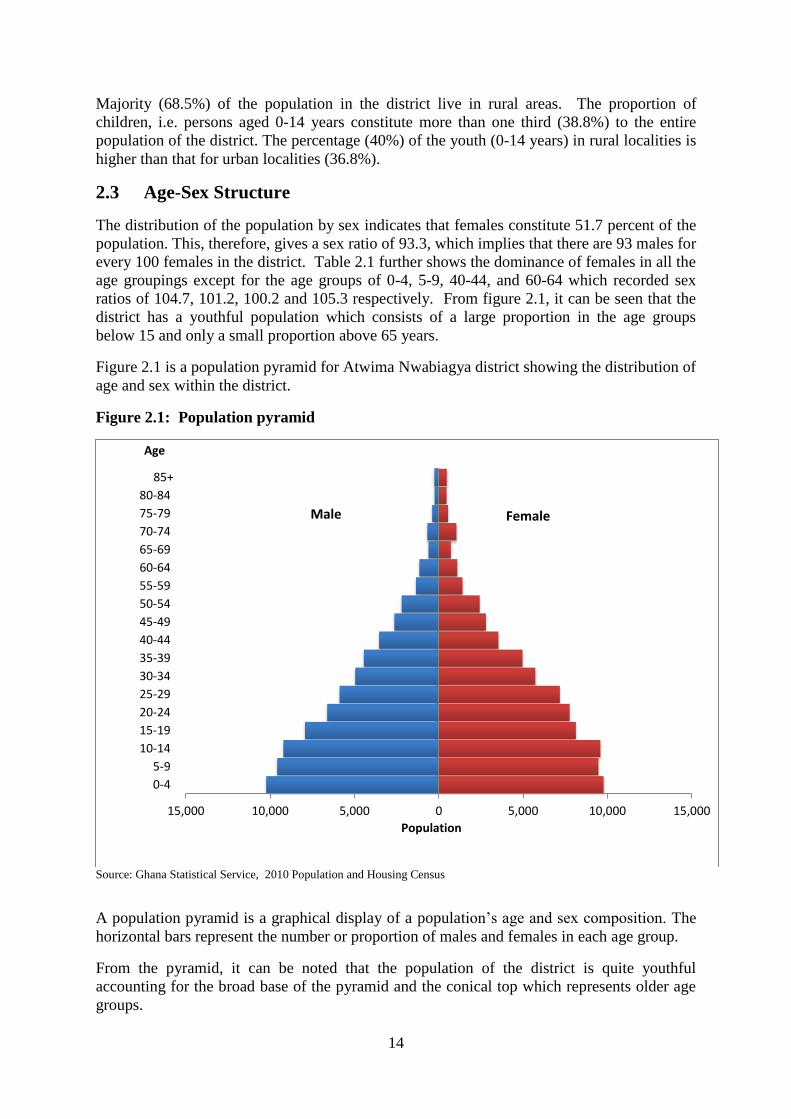
Figure 2.1 is a population pyramid for Atwima Nwabiagya district showing the distribution of
age and sex within the district.
Figure 2.1: Population pyramid
Source: Ghana Statistical Service, 2010 Population and Housing Census
A population pyramid is a graphical display of a population’s age and sex composition. The
horizontal bars represent the number or proportion of males and females in each age group.
From the pyramid, it can be noted that the population of the district is quite youthful
accounting for the broad base of the pyramid and the conical top which represents older age
groups.
15,000 10,000 5,000 0 5,000 10,000 15,000
0-4
5-9
10-14
15-19
20-24
25-29
30-34
35-39
40-44
45-49
50-54
55-59
60-64
65-69
70-74
75-79
80-84
85+
Population
Age
Female Male
15
The pyramid shows a decline in population in the various groups as the age’s progress.
However this is not the situation with females between the ages of 10-14 and the age group of
70-74 (males and females). These two age groups recorded higher population figures
comparative to the age groups below them. This situation could be probably due to the
incidence of age misreporting for the single years of 10 and 70.
2.3.1 Age dependency ratio
Table 2.1 again shows that the total dependency ratio (ratio of persons in the dependent ages
to those in the working age population) in Atwima Nwabiagya District is 73.82, which is
higher than the national ratio of 76.0. A high dependency ratio is negative since it means that
there are more non-working people being looked after by the working population. The
dependency ratio of the rural population is much higher (77.10) than that of the urban
population (67.09).
2.4 Fertility, Mortality and Migration
The size, age-sex composition and distribution of a population is determined by fertility,
mortality and migration, which in demography, are the three components of population
change. Information on these three variables is important for planning and socio-economic
development of the district.
2.4.1 Fertility
Fertility refers to the number of live births women have. The Total Fertility Rate (TFR) is the
average number of children that would be born to a woman by the time she completes child
bearing if she were to pass through all her childbearing years conforming to the current age
specific fertility rates. Table 2.2 shows that the total number of women of childbearing age
(15-49 age groups) in the district is 48,066 with a total of 4,031 births in the last 12 months
preceding the census. The Total Fertility Rate (TFR) for the district is 3.36 and General
Fertility Rate is 99.9 births per 1,000 women aged 15-49 years. The table further indicates
that the Crude Birth Rate (CBR) in the district is 27.0 per 1,000 populations.
Table 2.2: Reported total fertility rate, general fertility rate and crude birth
rate by district
District Population
Number
of women
15-49
years
Number
of births
in last 12
months
Total
Fertility
Rate
General
Fertility
Rate
Crude
Birth
Rate
All Districts 4,780,380 1,527,854 124,429 3.26 96.4 26.0
Atwima Nwabiagya 149,025 48,066 4,031 3.36 99.9 27.0
Source: Ghana Statistical Service, 2010 Population and Housing Census
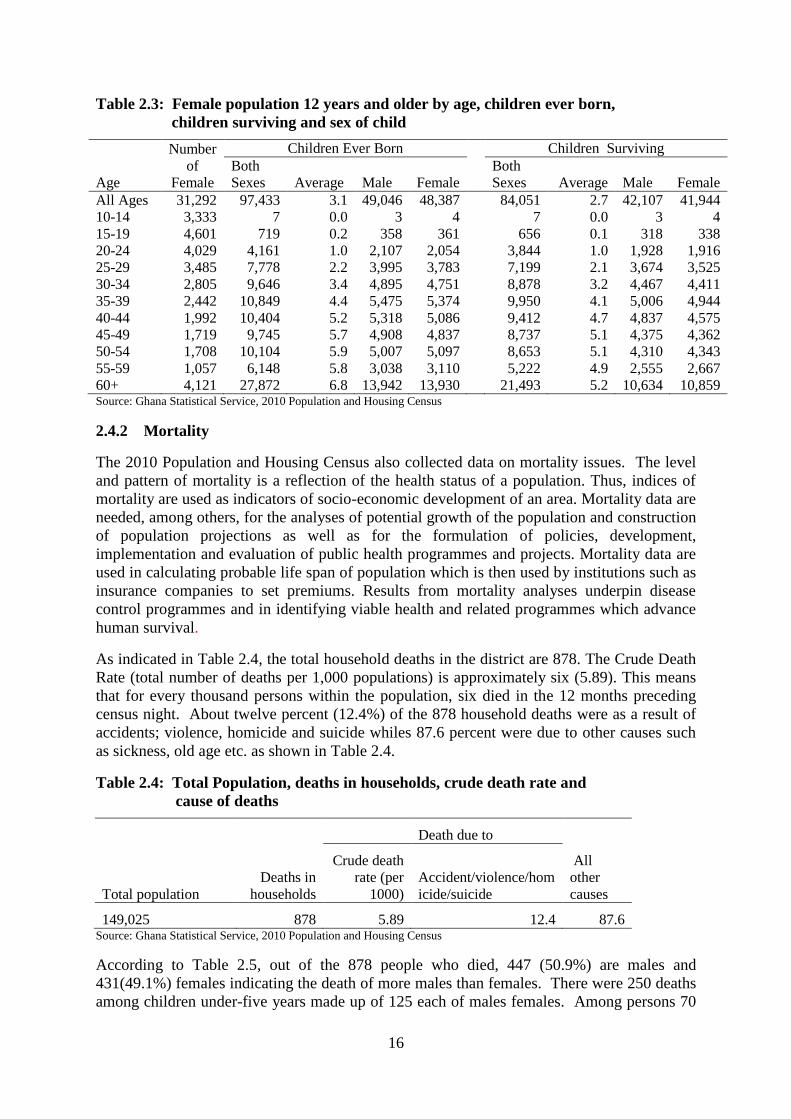
Table 2.3 shows that the average number of children ever born by female 12 years and older
is approximately three. Age group 12-14 recorded no children ever born. However, females
in the age group 60 and older have approximately 7 children, with an average of 5 children
surviving. Female aged 30-34 recorded an average of 3.4 children ever born and an average
of 3.2 children surviving.
16
Table 2.3: Female population 12 years and older by age, children ever born,
children surviving and sex of child
Age
Number
of
Female
Children Ever Born Children Surviving
Both
Sexes Average Male Female
Both
Sexes Average Male Female
All Ages 31,292 97,433 3.1 49,046 48,387
84,051 2.7 42,107 41,944
10-14 3,333 7 0.0 3 4
7 0.0 3 4
15-19 4,601 719 0.2 358 361
656 0.1 318 338
20-24 4,029 4,161 1.0 2,107 2,054
3,844 1.0 1,928 1,916
25-29 3,485 7,778 2.2 3,995 3,783
7,199 2.1 3,674 3,525
30-34 2,805 9,646 3.4 4,895 4,751
8,878 3.2 4,467 4,411
35-39 2,442 10,849 4.4 5,475 5,374
9,950 4.1 5,006 4,944
40-44 1,992 10,404 5.2 5,318 5,086
9,412 4.7 4,837 4,575
45-49 1,719 9,745 5.7 4,908 4,837
8,737 5.1 4,375 4,362
50-54 1,708 10,104 5.9 5,007 5,097
8,653 5.1 4,310 4,343
55-59 1,057 6,148 5.8 3,038 3,110
5,222 4.9 2,555 2,667
60+ 4,121 27,872 6.8 13,942 13,930 21,493 5.2 10,634 10,859 Source: Ghana Statistical Service, 2010 Population and Housing Census
2.4.2 Mortality
The 2010 Population and Housing Census also collected data on mortality issues. The level
and pattern of mortality is a reflection of the health status of a population. Thus, indices of
mortality are used as indicators of socio-economic development of an area. Mortality data are
needed, among others, for the analyses of potential growth of the population and construction
of population projections as well as for the formulation of policies, development,
implementation and evaluation of public health programmes and projects. Mortality data are
used in calculating probable life span of population which is then used by institutions such as
insurance companies to set premiums. Results from mortality analyses underpin disease
control programmes and in identifying viable health and related programmes which advance
human survival.
As indicated in Table 2.4, the total household deaths in the district are 878. The Crude Death
Rate (total number of deaths per 1,000 populations) is approximately six (5.89). This means
that for every thousand persons within the population, six died in the 12 months preceding
census night. About twelve percent (12.4%) of the 878 household deaths were as a result of
accidents; violence, homicide and suicide whiles 87.6 percent were due to other causes such
as sickness, old age etc. as shown in Table 2.4.
Table 2.4: Total Population, deaths in households, crude death rate and
cause of deaths
Total population
Deaths in
households
Death due to
All
other
causes
Crude death
rate (per
1000)
Accident/violence/hom
icide/suicide
149,025 878 5.89 12.4 87.6 Source: Ghana Statistical Service, 2010 Population and Housing Census
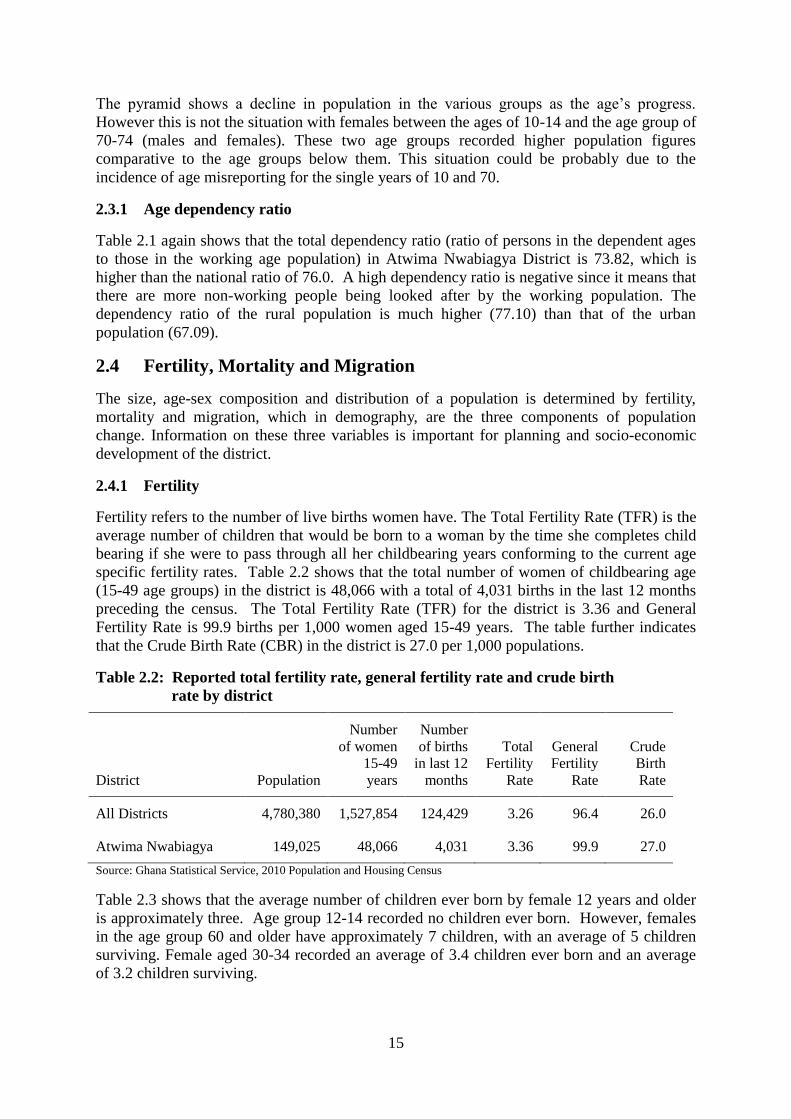
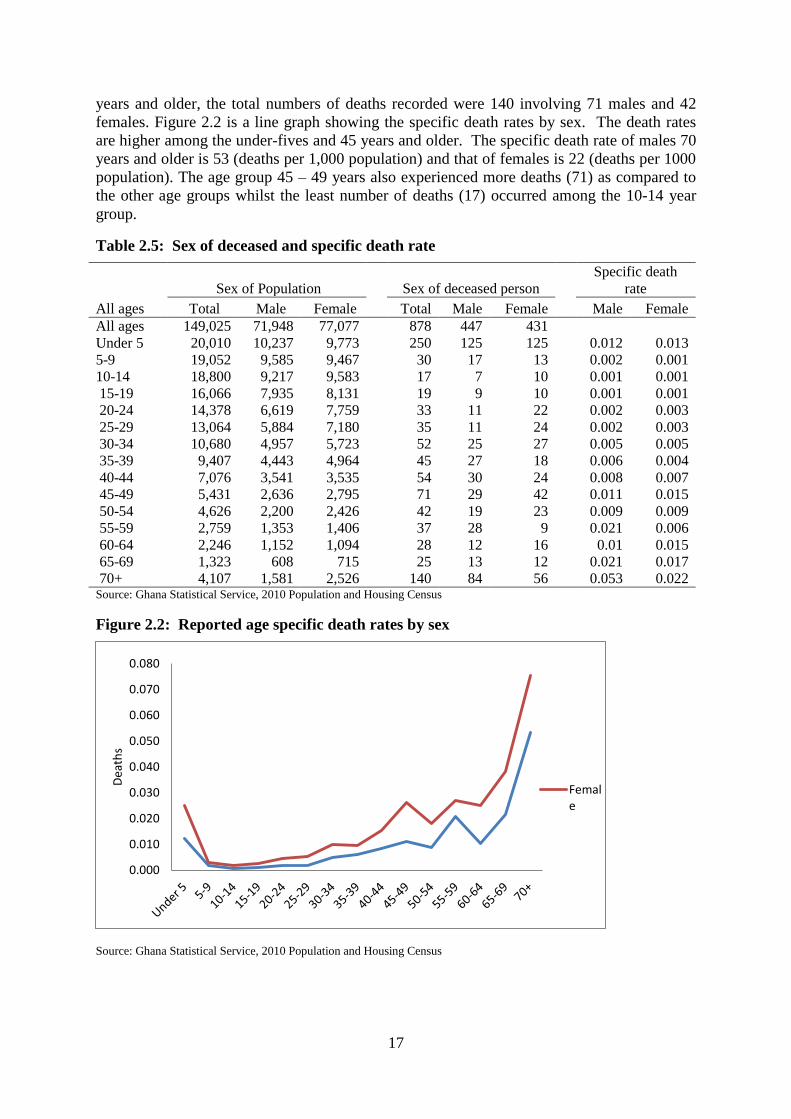
According to Table 2.5, out of the 878 people who died, 447 (50.9%) are males and
431(49.1%) females indicating the death of more males than females. There were 250 deaths
among children under-five years made up of 125 each of males females. Among persons 70
17
years and older, the total numbers of deaths recorded were 140 involving 71 males and 42
females. Figure 2.2 is a line graph showing the specific death rates by sex. The death rates
are higher among the under-fives and 45 years and older. The specific death rate of males 70
years and older is 53 (deaths per 1,000 population) and that of females is 22 (deaths per 1000
population). The age group 45 – 49 years also experienced more deaths (71) as compared to
the other age groups whilst the least number of deaths (17) occurred among the 10-14 year
group.
Table 2.5: Sex of deceased and specific death rate
All ages
Sex of Population
Sex of deceased person
Specific death
rate
Total Male Female Total Male Female Male Female
All ages 149,025 71,948 77,077
878 447 431
Under 5 20,010 10,237 9,773
250 125 125
0.012 0.013
5-9 19,052 9,585 9,467
30 17 13
0.002 0.001
10-14 18,800 9,217 9,583
17 7 10
0.001 0.001
15-19 16,066 7,935 8,131
19 9 10
0.001 0.001
20-24 14,378 6,619 7,759
33 11 22
0.002 0.003
25-29 13,064 5,884 7,180
35 11 24
0.002 0.003
30-34 10,680 4,957 5,723
52 25 27
0.005 0.005
35-39 9,407 4,443 4,964
45 27 18
0.006 0.004
40-44 7,076 3,541 3,535
54 30 24
0.008 0.007
45-49 5,431 2,636 2,795
71 29 42
0.011 0.015
50-54 4,626 2,200 2,426
42 19 23
0.009 0.009
55-59 2,759 1,353 1,406
37 28 9
0.021 0.006
60-64 2,246 1,152 1,094
28 12 16
0.01 0.015
65-69 1,323 608 715
25 13 12
0.021 0.017
70+ 4,107 1,581 2,526 140 84 56 0.053 0.022 Source: Ghana Statistical Service, 2010 Population and Housing Census
Figure 2.2: Reported age specific death rates by sex
Source: Ghana Statistical Service, 2010 Population and Housing Census
0.000
0.010
0.020
0.030
0.040
0.050
0.060
0.070
0.080
Dea
ths
Female
18
2.4.3 Migration
Migration can be defined as the geographic movement of people across a specific boundary
for the purpose of establishing a new permanent or semi-permanent residence. Thus, it is a
change in usual place of residence. Data on birthplace and place of enumeration provide
information on migratory movements of the population.
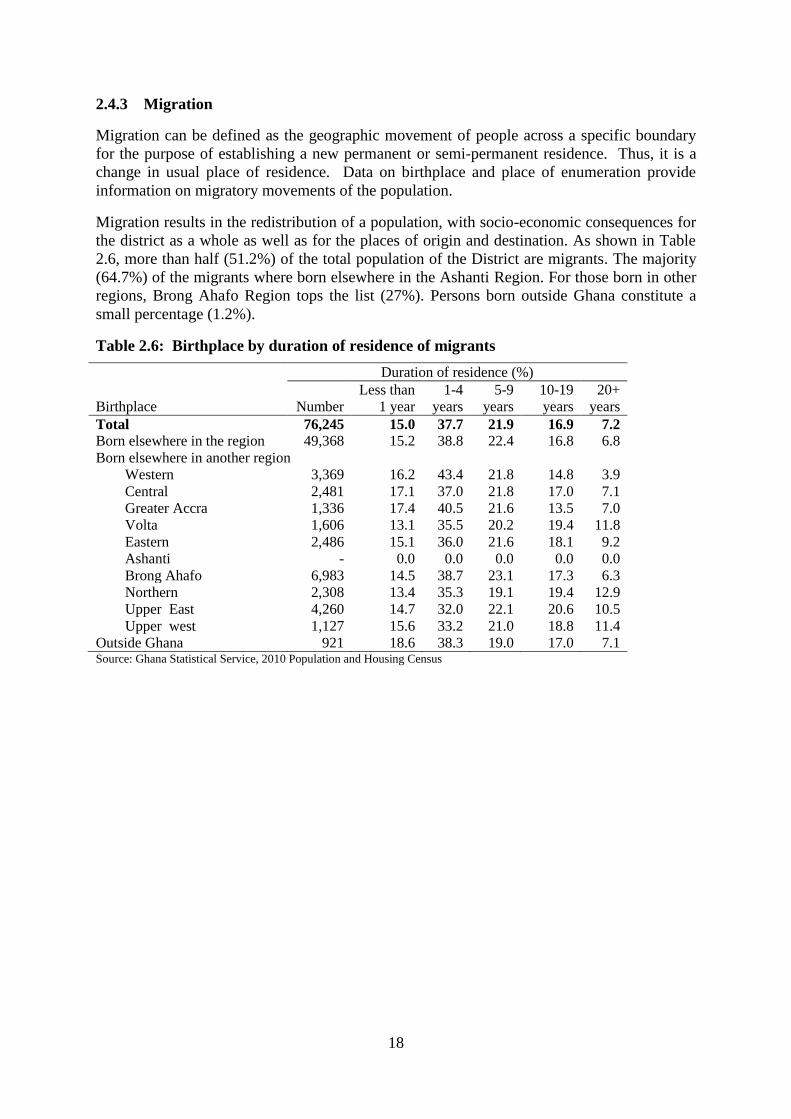
Migration results in the redistribution of a population, with socio-economic consequences for
the district as a whole as well as for the places of origin and destination. As shown in Table
2.6, more than half (51.2%) of the total population of the District are migrants. The majority
(64.7%) of the migrants where born elsewhere in the Ashanti Region. For those born in other
regions, Brong Ahafo Region tops the list (27%). Persons born outside Ghana constitute a
small percentage (1.2%).
Table 2.6: Birthplace by duration of residence of migrants
Birthplace
Duration of residence (%)
Number
Less than
1 year
1-4
years
5-9
years
10-19
years
20+
years
Total 76,245 15.0 37.7 21.9 16.9 7.2
Born elsewhere in the region 49,368 15.2 38.8 22.4 16.8 6.8
Born elsewhere in another region
Western 3,369 16.2 43.4 21.8 14.8 3.9
Central 2,481 17.1 37.0 21.8 17.0 7.1
Greater Accra 1,336 17.4 40.5 21.6 13.5 7.0
Volta 1,606 13.1 35.5 20.2 19.4 11.8
Eastern 2,486 15.1 36.0 21.6 18.1 9.2
Ashanti - 0.0 0.0 0.0 0.0 0.0
Brong Ahafo 6,983 14.5 38.7 23.1 17.3 6.3
Northern 2,308 13.4 35.3 19.1 19.4 12.9
Upper East 4,260 14.7 32.0 22.1 20.6 10.5
Upper west 1,127 15.6 33.2 21.0 18.8 11.4
Outside Ghana 921 18.6 38.3 19.0 17.0 7.1 Source: Ghana Statistical Service, 2010 Population and Housing Census
19
CHAPTER THREE
SOCIAL CHARACTERISTICS
3.1 Introduction
The composition and structure of the Ghanaian household are a reflection of the social
structure of the society. In Ghana as well as most parts of Africa, the main types of family
ties that inform household formation are the nuclear and extended family systems. The
nuclear family system consists of the father, mother and children (adopted and/or
biological).The extended family also consists of the nuclear family, and parents, siblings, and
other relatives.
In this chapter, social characteristics such as household composition, size and headship are
analyzed. Other social issues also discussed include marital status, nationality, religious
affiliation, literacy and education. The study of the characteristics of households in any
population provides information on living arrangements which have implications for housing
and the use of space (2010 Population and Housing Census Analytical Report, 2013).
3.2 Household Size, Composition and Structure
3.2.1 Household size
A household consists of a man, his wife, children and some other relatives or a house-help
who may be living with them. It is, however, important to state that membership of a
household does not necessarily depend on blood ties. The total number of persons who
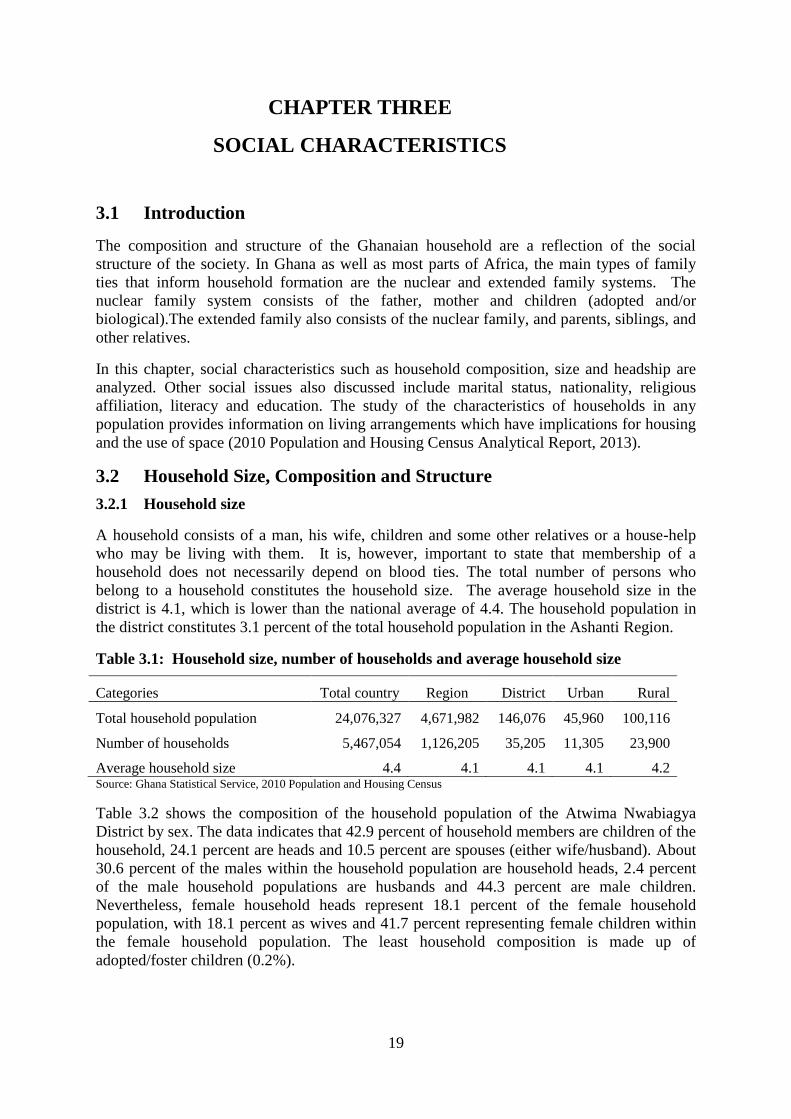
belong to a household constitutes the household size. The average household size in the
district is 4.1, which is lower than the national average of 4.4. The household population in
the district constitutes 3.1 percent of the total household population in the Ashanti Region.
Table 3.1: Household size, number of households and average household size
Categories Total country Region District Urban Rural
Total household population 24,076,327 4,671,982 146,076 45,960 100,116
Number of households 5,467,054 1,126,205 35,205 11,305 23,900
Average household size 4.4 4.1 4.1 4.1 4.2 Source: Ghana Statistical Service, 2010 Population and Housing Census
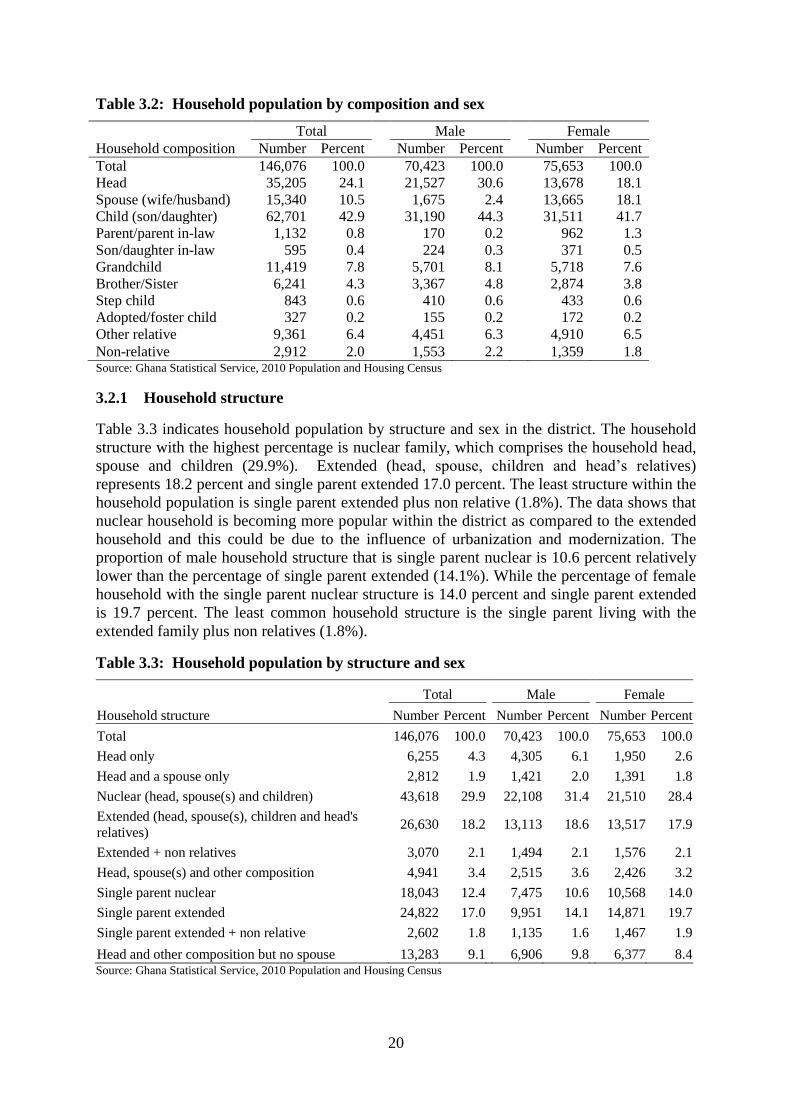
Table 3.2 shows the composition of the household population of the Atwima Nwabiagya
District by sex. The data indicates that 42.9 percent of household members are children of the
household, 24.1 percent are heads and 10.5 percent are spouses (either wife/husband). About
30.6 percent of the males within the household population are household heads, 2.4 percent
of the male household populations are husbands and 44.3 percent are male children.
Nevertheless, female household heads represent 18.1 percent of the female household
population, with 18.1 percent as wives and 41.7 percent representing female children within
the female household population. The least household composition is made up of
adopted/foster children (0.2%).
20
Table 3.2: Household population by composition and sex
Household composition
Total Male Female
Number Percent Number Percent Number Percent
Total 146,076 100.0
70,423 100.0
75,653 100.0
Head 35,205 24.1
21,527 30.6
13,678 18.1
Spouse (wife/husband) 15,340 10.5
1,675 2.4
13,665 18.1
Child (son/daughter) 62,701 42.9
31,190 44.3
31,511 41.7
Parent/parent in-law 1,132 0.8
170 0.2
962 1.3
Son/daughter in-law 595 0.4
224 0.3
371 0.5
Grandchild 11,419 7.8
5,701 8.1
5,718 7.6
Brother/Sister 6,241 4.3
3,367 4.8
2,874 3.8
Step child 843 0.6
410 0.6
433 0.6
Adopted/foster child 327 0.2
155 0.2
172 0.2
Other relative 9,361 6.4
4,451 6.3
4,910 6.5
Non-relative 2,912 2.0 1,553 2.2 1,359 1.8 Source: Ghana Statistical Service, 2010 Population and Housing Census
3.2.1 Household structure
Table 3.3 indicates household population by structure and sex in the district. The household
structure with the highest percentage is nuclear family, which comprises the household head,
spouse and children (29.9%). Extended (head, spouse, children and head’s relatives)
represents 18.2 percent and single parent extended 17.0 percent. The least structure within the
household population is single parent extended plus non relative (1.8%). The data shows that
nuclear household is becoming more popular within the district as compared to the extended
household and this could be due to the influence of urbanization and modernization. The
proportion of male household structure that is single parent nuclear is 10.6 percent relatively
lower than the percentage of single parent extended (14.1%). While the percentage of female
household with the single parent nuclear structure is 14.0 percent and single parent extended
is 19.7 percent. The least common household structure is the single parent living with the
extended family plus non relatives (1.8%).
Table 3.3: Household population by structure and sex
Household structure
Total Male Female
Number Percent Number Percent Number Percent
Total 146,076 100.0
70,423 100.0
75,653 100.0
Head only 6,255 4.3
4,305 6.1
1,950 2.6
Head and a spouse only 2,812 1.9
1,421 2.0
1,391 1.8
Nuclear (head, spouse(s) and children) 43,618 29.9
22,108 31.4
21,510 28.4
Extended (head, spouse(s), children and head's
relatives) 26,630 18.2
13,113 18.6
13,517 17.9
Extended + non relatives 3,070 2.1
1,494 2.1
1,576 2.1
Head, spouse(s) and other composition 4,941 3.4
2,515 3.6
2,426 3.2
Single parent nuclear 18,043 12.4
7,475 10.6
10,568 14.0
Single parent extended 24,822 17.0
9,951 14.1
14,871 19.7
Single parent extended + non relative 2,602 1.8
1,135 1.6
1,467 1.9
Head and other composition but no spouse 13,283 9.1 6,906 9.8 6,377 8.4 Source: Ghana Statistical Service, 2010 Population and Housing Census
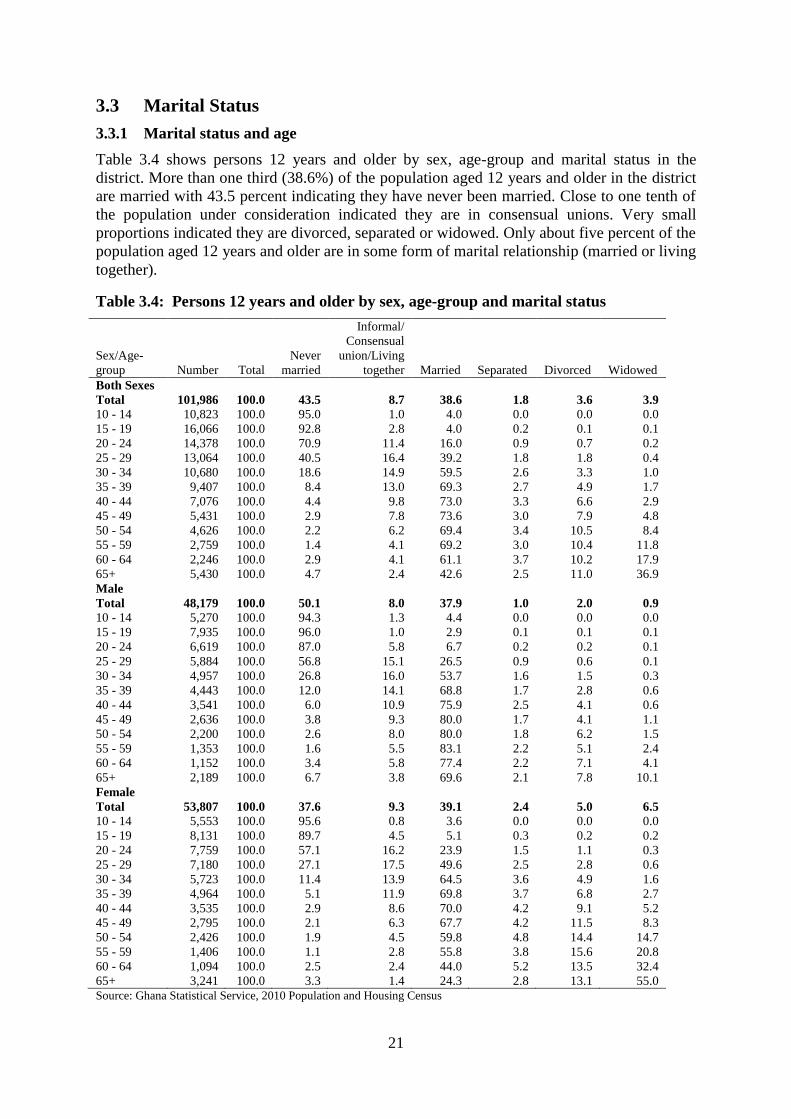
21
3.3 Marital Status
3.3.1 Marital status and age
Table 3.4 shows persons 12 years and older by sex, age-group and marital status in the
district. More than one third (38.6%) of the population aged 12 years and older in the district
are married with 43.5 percent indicating they have never been married. Close to one tenth of
the population under consideration indicated they are in consensual unions. Very small
proportions indicated they are divorced, separated or widowed. Only about five percent of the
population aged 12 years and older are in some form of marital relationship (married or living
together).
Table 3.4: Persons 12 years and older by sex, age-group and marital status
Sex/Age-
group Number Total
Never
married
Informal/
Consensual
union/Living
together Married Separated Divorced Widowed
Both Sexes
Total 101,986 100.0 43.5 8.7 38.6 1.8 3.6 3.9
10 - 14 10,823 100.0 95.0 1.0 4.0 0.0 0.0 0.0
15 - 19 16,066 100.0 92.8 2.8 4.0 0.2 0.1 0.1
20 - 24 14,378 100.0 70.9 11.4 16.0 0.9 0.7 0.2
25 - 29 13,064 100.0 40.5 16.4 39.2 1.8 1.8 0.4
30 - 34 10,680 100.0 18.6 14.9 59.5 2.6 3.3 1.0
35 - 39 9,407 100.0 8.4 13.0 69.3 2.7 4.9 1.7
40 - 44 7,076 100.0 4.4 9.8 73.0 3.3 6.6 2.9
45 - 49 5,431 100.0 2.9 7.8 73.6 3.0 7.9 4.8
50 - 54 4,626 100.0 2.2 6.2 69.4 3.4 10.5 8.4
55 - 59 2,759 100.0 1.4 4.1 69.2 3.0 10.4 11.8
60 - 64 2,246 100.0 2.9 4.1 61.1 3.7 10.2 17.9
65+ 5,430 100.0 4.7 2.4 42.6 2.5 11.0 36.9
Male
Total 48,179 100.0 50.1 8.0 37.9 1.0 2.0 0.9
10 - 14 5,270 100.0 94.3 1.3 4.4 0.0 0.0 0.0
15 - 19 7,935 100.0 96.0 1.0 2.9 0.1 0.1 0.1
20 - 24 6,619 100.0 87.0 5.8 6.7 0.2 0.2 0.1
25 - 29 5,884 100.0 56.8 15.1 26.5 0.9 0.6 0.1
30 - 34 4,957 100.0 26.8 16.0 53.7 1.6 1.5 0.3
35 - 39 4,443 100.0 12.0 14.1 68.8 1.7 2.8 0.6
40 - 44 3,541 100.0 6.0 10.9 75.9 2.5 4.1 0.6
45 - 49 2,636 100.0 3.8 9.3 80.0 1.7 4.1 1.1
50 - 54 2,200 100.0 2.6 8.0 80.0 1.8 6.2 1.5
55 - 59 1,353 100.0 1.6 5.5 83.1 2.2 5.1 2.4
60 - 64 1,152 100.0 3.4 5.8 77.4 2.2 7.1 4.1
65+ 2,189 100.0 6.7 3.8 69.6 2.1 7.8 10.1
Female
Total 53,807 100.0 37.6 9.3 39.1 2.4 5.0 6.5
10 - 14 5,553 100.0 95.6 0.8 3.6 0.0 0.0 0.0
15 - 19 8,131 100.0 89.7 4.5 5.1 0.3 0.2 0.2
20 - 24 7,759 100.0 57.1 16.2 23.9 1.5 1.1 0.3
25 - 29 7,180 100.0 27.1 17.5 49.6 2.5 2.8 0.6
30 - 34 5,723 100.0 11.4 13.9 64.5 3.6 4.9 1.6
35 - 39 4,964 100.0 5.1 11.9 69.8 3.7 6.8 2.7
40 - 44 3,535 100.0 2.9 8.6 70.0 4.2 9.1 5.2
45 - 49 2,795 100.0 2.1 6.3 67.7 4.2 11.5 8.3
50 - 54 2,426 100.0 1.9 4.5 59.8 4.8 14.4 14.7
55 - 59 1,406 100.0 1.1 2.8 55.8 3.8 15.6 20.8
60 - 64 1,094 100.0 2.5 2.4 44.0 5.2 13.5 32.4
65+ 3,241 100.0 3.3 1.4 24.3 2.8 13.1 55.0
Source: Ghana Statistical Service, 2010 Population and Housing Census
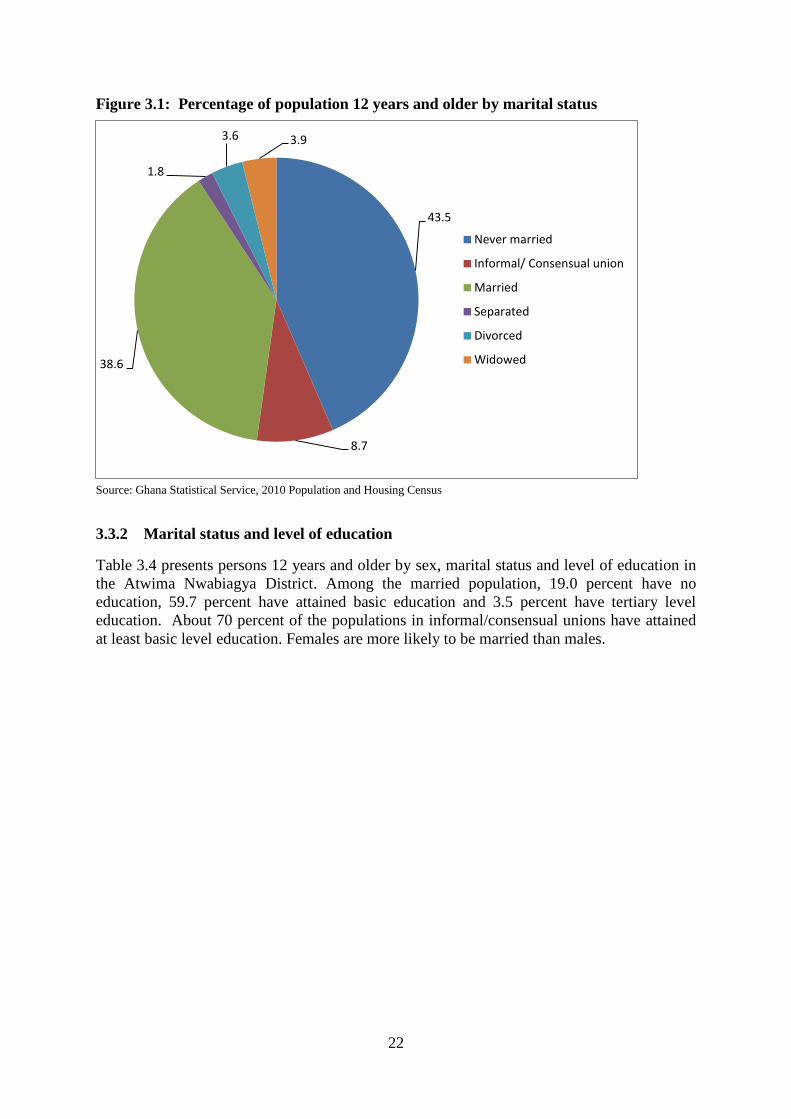
22
Figure 3.1: Percentage of population 12 years and older by marital status
Source: Ghana Statistical Service, 2010 Population and Housing Census
3.3.2 Marital status and level of education
Table 3.4 presents persons 12 years and older by sex, marital status and level of education in
the Atwima Nwabiagya District. Among the married population, 19.0 percent have no
education, 59.7 percent have attained basic education and 3.5 percent have tertiary level
education. About 70 percent of the populations in informal/consensual unions have attained
at least basic level education. Females are more likely to be married than males.
43.5
8.7
38.6
1.8
3.6 3.9
Never married
Informal/ Consensual union
Married
Separated
Divorced
Widowed
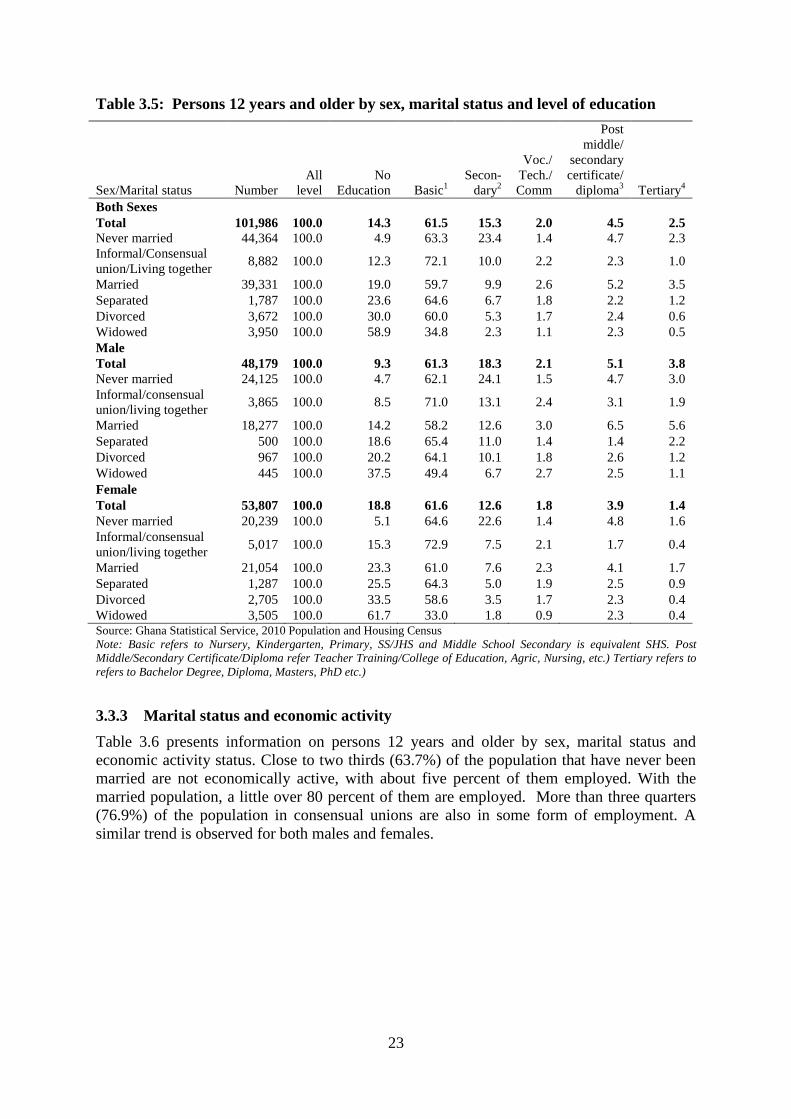
23
Table 3.5: Persons 12 years and older by sex, marital status and level of education
Sex/Marital status Number
All
level
No
Education Basic1
Secon-
dary2
Voc./
Tech./
Comm
Post
middle/
secondary
certificate/
diploma3 Tertiary
4
Both Sexes
Total 101,986 100.0 14.3 61.5 15.3 2.0 4.5 2.5
Never married 44,364 100.0 4.9 63.3 23.4 1.4 4.7 2.3
Informal/Consensual
union/Living together 8,882 100.0 12.3 72.1 10.0 2.2 2.3 1.0
Married 39,331 100.0 19.0 59.7 9.9 2.6 5.2 3.5
Separated 1,787 100.0 23.6 64.6 6.7 1.8 2.2 1.2
Divorced 3,672 100.0 30.0 60.0 5.3 1.7 2.4 0.6
Widowed 3,950 100.0 58.9 34.8 2.3 1.1 2.3 0.5
Male
Total 48,179 100.0 9.3 61.3 18.3 2.1 5.1 3.8
Never married 24,125 100.0 4.7 62.1 24.1 1.5 4.7 3.0
Informal/consensual
union/living together 3,865 100.0 8.5 71.0 13.1 2.4 3.1 1.9
Married 18,277 100.0 14.2 58.2 12.6 3.0 6.5 5.6
Separated 500 100.0 18.6 65.4 11.0 1.4 1.4 2.2
Divorced 967 100.0 20.2 64.1 10.1 1.8 2.6 1.2
Widowed 445 100.0 37.5 49.4 6.7 2.7 2.5 1.1
Female
Total 53,807 100.0 18.8 61.6 12.6 1.8 3.9 1.4
Never married 20,239 100.0 5.1 64.6 22.6 1.4 4.8 1.6
Informal/consensual
union/living together 5,017 100.0 15.3 72.9 7.5 2.1 1.7 0.4
Married 21,054 100.0 23.3 61.0 7.6 2.3 4.1 1.7
Separated 1,287 100.0 25.5 64.3 5.0 1.9 2.5 0.9
Divorced 2,705 100.0 33.5 58.6 3.5 1.7 2.3 0.4
Widowed 3,505 100.0 61.7 33.0 1.8 0.9 2.3 0.4 Source: Ghana Statistical Service, 2010 Population and Housing Census
Note: Basic refers to Nursery, Kindergarten, Primary, SS/JHS and Middle School Secondary is equivalent SHS. Post
Middle/Secondary Certificate/Diploma refer Teacher Training/College of Education, Agric, Nursing, etc.) Tertiary refers to
refers to Bachelor Degree, Diploma, Masters, PhD etc.)
3.3.3 Marital status and economic activity
Table 3.6 presents information on persons 12 years and older by sex, marital status and
economic activity status. Close to two thirds (63.7%) of the population that have never been
married are not economically active, with about five percent of them employed. With the
married population, a little over 80 percent of them are employed. More than three quarters
(76.9%) of the population in consensual unions are also in some form of employment. A
similar trend is observed for both males and females.
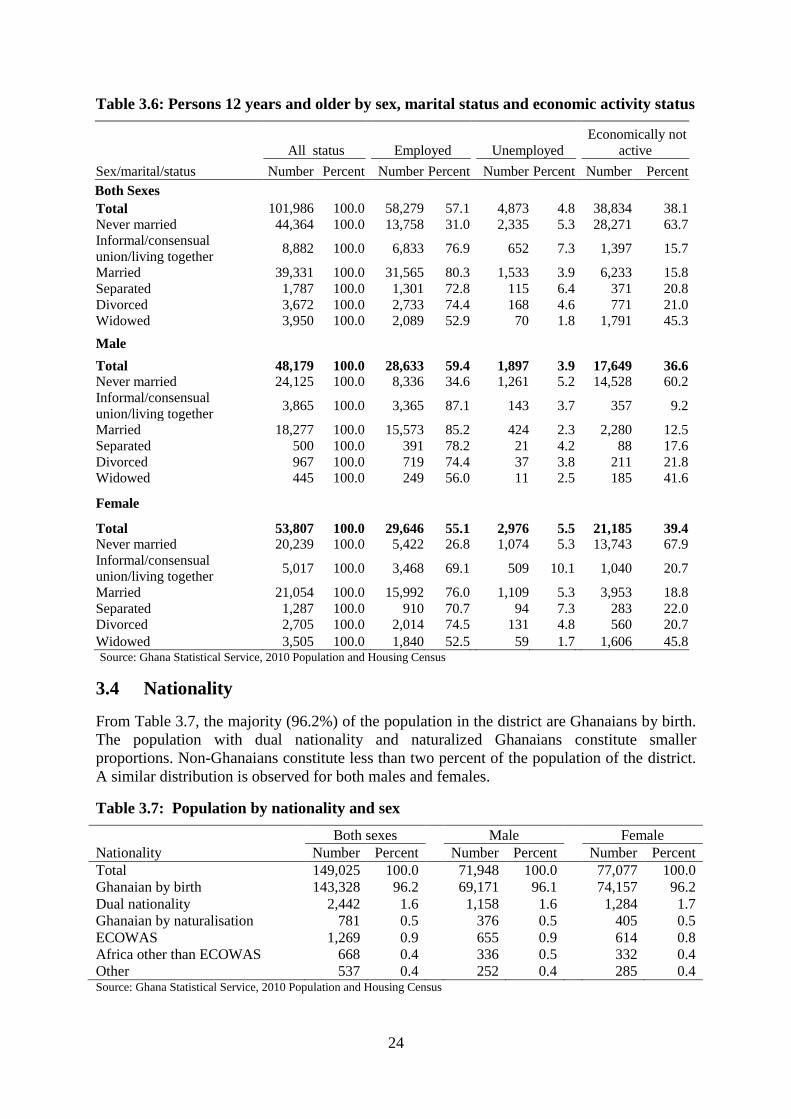
24
Table 3.6: Persons 12 years and older by sex, marital status and economic activity status
Sex/marital/status
All status Employed
Unemployed Economically not
active
Number Percent Number Percent Number Percent Number Percent
Both Sexes
Total 101,986 100.0
58,279 57.1
4,873 4.8
38,834 38.1
Never married 44,364 100.0
13,758 31.0
2,335 5.3
28,271 63.7
Informal/consensual
union/living together 8,882 100.0
6,833 76.9
652 7.3
1,397 15.7
Married 39,331 100.0
31,565 80.3
1,533 3.9
6,233 15.8
Separated 1,787 100.0
1,301 72.8
115 6.4
371 20.8
Divorced 3,672 100.0
2,733 74.4
168 4.6
771 21.0
Widowed 3,950 100.0
2,089 52.9
70 1.8
1,791 45.3
Male
Total 48,179 100.0
28,633 59.4
1,897 3.9
17,649 36.6
Never married 24,125 100.0
8,336 34.6
1,261 5.2
14,528 60.2
Informal/consensual
union/living together 3,865 100.0
3,365 87.1
143 3.7
357 9.2
Married 18,277 100.0
15,573 85.2
424 2.3
2,280 12.5
Separated 500 100.0
391 78.2
21 4.2
88 17.6
Divorced 967 100.0
719 74.4
37 3.8
211 21.8
Widowed 445 100.0
249 56.0
11 2.5
185 41.6
Female
Total 53,807 100.0
29,646 55.1
2,976 5.5
21,185 39.4
Never married 20,239 100.0
5,422 26.8
1,074 5.3
13,743 67.9
Informal/consensual
union/living together 5,017 100.0
3,468 69.1
509 10.1
1,040 20.7
Married 21,054 100.0
15,992 76.0
1,109 5.3
3,953 18.8
Separated 1,287 100.0
910 70.7
94 7.3
283 22.0
Divorced 2,705 100.0
2,014 74.5
131 4.8
560 20.7
Widowed 3,505 100.0 1,840 52.5 59 1.7 1,606 45.8 Source: Ghana Statistical Service, 2010 Population and Housing Census
3.4 Nationality
From Table 3.7, the majority (96.2%) of the population in the district are Ghanaians by birth.
The population with dual nationality and naturalized Ghanaians constitute smaller
proportions. Non-Ghanaians constitute less than two percent of the population of the district.
A similar distribution is observed for both males and females.
Table 3.7: Population by nationality and sex
Nationality
Both sexes Male Female
Number Percent Number Percent Number Percent
Total 149,025 100.0
71,948 100.0
77,077 100.0
Ghanaian by birth 143,328 96.2
69,171 96.1
74,157 96.2
Dual nationality 2,442 1.6
1,158 1.6
1,284 1.7
Ghanaian by naturalisation 781 0.5
376 0.5
405 0.5
ECOWAS 1,269 0.9
655 0.9
614 0.8
Africa other than ECOWAS 668 0.4
336 0.5
332 0.4
Other 537 0.4 252 0.4 285 0.4 Source: Ghana Statistical Service, 2010 Population and Housing Census
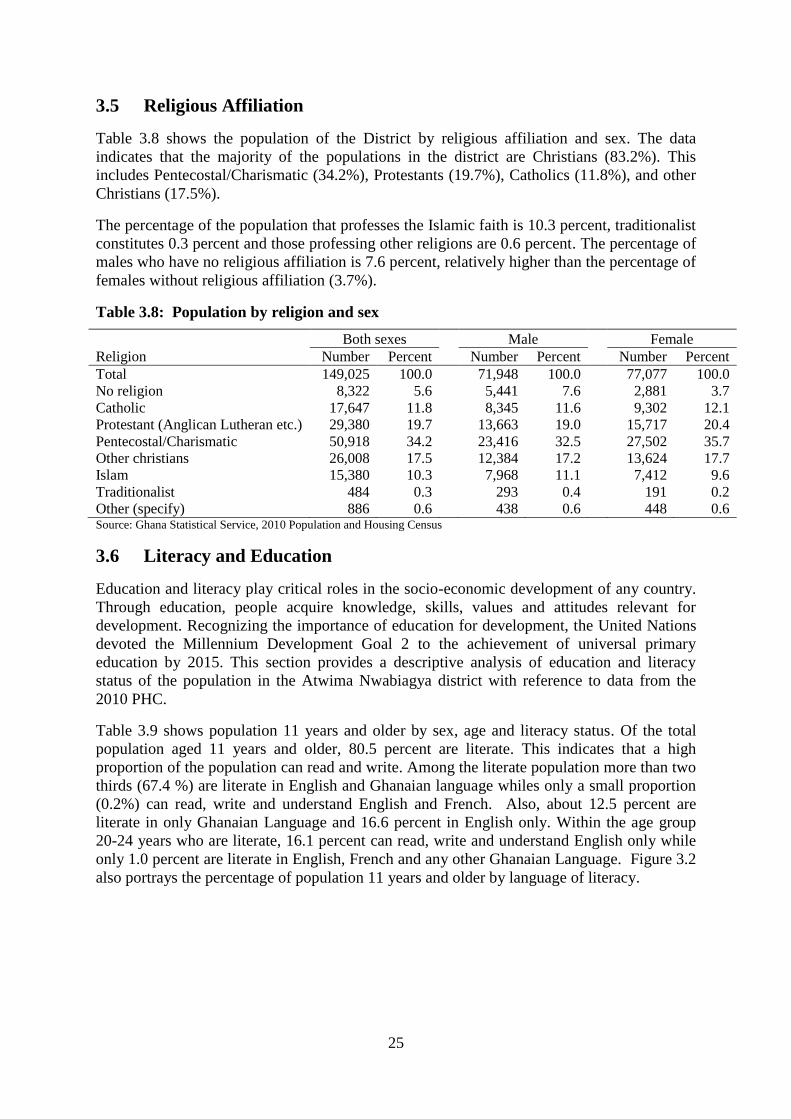
25
3.5 Religious Affiliation
Table 3.8 shows the population of the District by religious affiliation and sex. The data
indicates that the majority of the populations in the district are Christians (83.2%). This
includes Pentecostal/Charismatic (34.2%), Protestants (19.7%), Catholics (11.8%), and other
Christians (17.5%).
The percentage of the population that professes the Islamic faith is 10.3 percent, traditionalist
constitutes 0.3 percent and those professing other religions are 0.6 percent. The percentage of
males who have no religious affiliation is 7.6 percent, relatively higher than the percentage of
females without religious affiliation (3.7%).
Table 3.8: Population by religion and sex
Religion
Both sexes Male Female
Number Percent Number Percent Number Percent
Total 149,025 100.0
71,948 100.0
77,077 100.0
No religion 8,322 5.6
5,441 7.6
2,881 3.7
Catholic 17,647 11.8
8,345 11.6
9,302 12.1
Protestant (Anglican Lutheran etc.) 29,380 19.7
13,663 19.0
15,717 20.4
Pentecostal/Charismatic 50,918 34.2
23,416 32.5
27,502 35.7
Other christians 26,008 17.5
12,384 17.2
13,624 17.7
Islam 15,380 10.3
7,968 11.1
7,412 9.6
Traditionalist 484 0.3
293 0.4
191 0.2
Other (specify) 886 0.6 438 0.6 448 0.6 Source: Ghana Statistical Service, 2010 Population and Housing Census
3.6 Literacy and Education
Education and literacy play critical roles in the socio-economic development of any country.
Through education, people acquire knowledge, skills, values and attitudes relevant for
development. Recognizing the importance of education for development, the United Nations
devoted the Millennium Development Goal 2 to the achievement of universal primary
education by 2015. This section provides a descriptive analysis of education and literacy
status of the population in the Atwima Nwabiagya district with reference to data from the
2010 PHC.
Table 3.9 shows population 11 years and older by sex, age and literacy status. Of the total
population aged 11 years and older, 80.5 percent are literate. This indicates that a high
proportion of the population can read and write. Among the literate population more than two
thirds (67.4 %) are literate in English and Ghanaian language whiles only a small proportion
(0.2%) can read, write and understand English and French. Also, about 12.5 percent are
literate in only Ghanaian Language and 16.6 percent in English only. Within the age group
20-24 years who are literate, 16.1 percent can read, write and understand English only while
only 1.0 percent are literate in English, French and any other Ghanaian Language. Figure 3.2
also portrays the percentage of population 11 years and older by language of literacy.
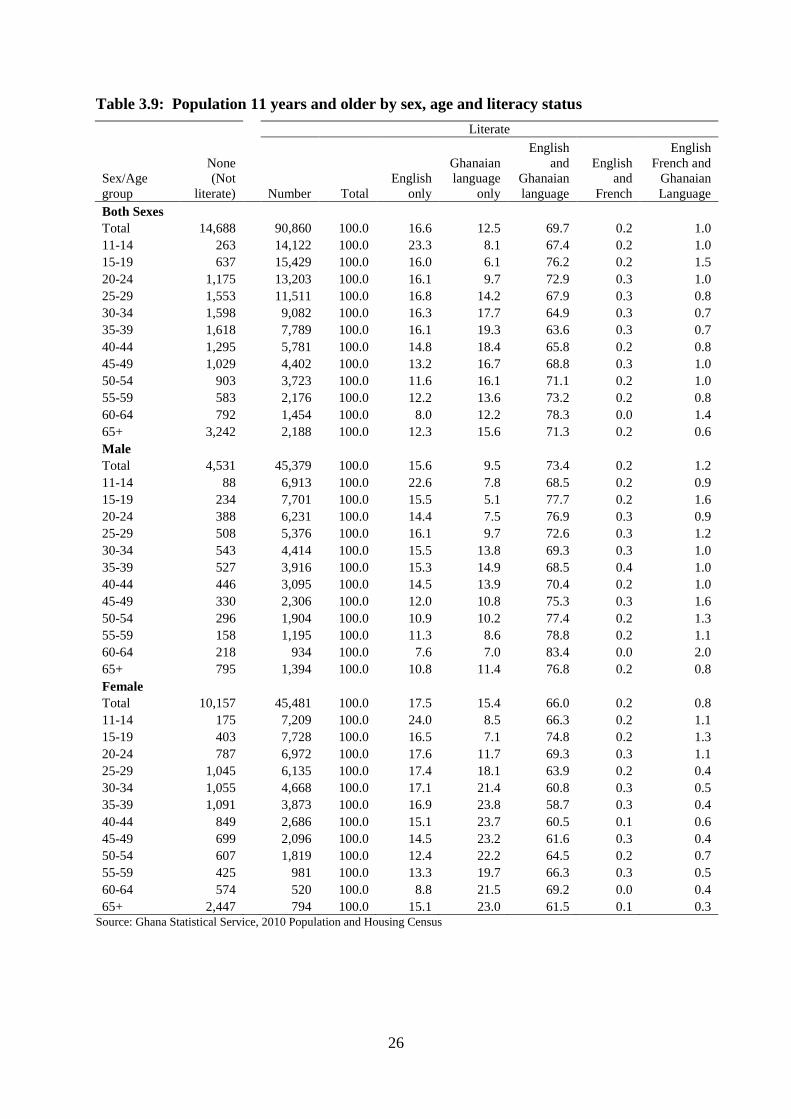
26
Table 3.9: Population 11 years and older by sex, age and literacy status
Literate
Sex/Age
group
None
(Not
literate) Number Total
English
only
Ghanaian
language
only
English
and
Ghanaian
language
English
and
French
English
French and
Ghanaian
Language
Both Sexes
Total 14,688
90,860 100.0 16.6 12.5 69.7 0.2 1.0
11-14 263
14,122 100.0 23.3 8.1 67.4 0.2 1.0
15-19 637
15,429 100.0 16.0 6.1 76.2 0.2 1.5
20-24 1,175
13,203 100.0 16.1 9.7 72.9 0.3 1.0
25-29 1,553
11,511 100.0 16.8 14.2 67.9 0.3 0.8
30-34 1,598
9,082 100.0 16.3 17.7 64.9 0.3 0.7
35-39 1,618
7,789 100.0 16.1 19.3 63.6 0.3 0.7
40-44 1,295
5,781 100.0 14.8 18.4 65.8 0.2 0.8
45-49 1,029
4,402 100.0 13.2 16.7 68.8 0.3 1.0
50-54 903
3,723 100.0 11.6 16.1 71.1 0.2 1.0
55-59 583
2,176 100.0 12.2 13.6 73.2 0.2 0.8
60-64 792
1,454 100.0 8.0 12.2 78.3 0.0 1.4
65+ 3,242
2,188 100.0 12.3 15.6 71.3 0.2 0.6
Male
Total 4,531
45,379 100.0 15.6 9.5 73.4 0.2 1.2
11-14 88
6,913 100.0 22.6 7.8 68.5 0.2 0.9
15-19 234
7,701 100.0 15.5 5.1 77.7 0.2 1.6
20-24 388
6,231 100.0 14.4 7.5 76.9 0.3 0.9
25-29 508
5,376 100.0 16.1 9.7 72.6 0.3 1.2
30-34 543
4,414 100.0 15.5 13.8 69.3 0.3 1.0
35-39 527
3,916 100.0 15.3 14.9 68.5 0.4 1.0
40-44 446
3,095 100.0 14.5 13.9 70.4 0.2 1.0
45-49 330
2,306 100.0 12.0 10.8 75.3 0.3 1.6
50-54 296
1,904 100.0 10.9 10.2 77.4 0.2 1.3
55-59 158
1,195 100.0 11.3 8.6 78.8 0.2 1.1
60-64 218
934 100.0 7.6 7.0 83.4 0.0 2.0
65+ 795
1,394 100.0 10.8 11.4 76.8 0.2 0.8
Female
Total 10,157
45,481 100.0 17.5 15.4 66.0 0.2 0.8
11-14 175
7,209 100.0 24.0 8.5 66.3 0.2 1.1
15-19 403
7,728 100.0 16.5 7.1 74.8 0.2 1.3
20-24 787
6,972 100.0 17.6 11.7 69.3 0.3 1.1
25-29 1,045
6,135 100.0 17.4 18.1 63.9 0.2 0.4
30-34 1,055
4,668 100.0 17.1 21.4 60.8 0.3 0.5
35-39 1,091
3,873 100.0 16.9 23.8 58.7 0.3 0.4
40-44 849
2,686 100.0 15.1 23.7 60.5 0.1 0.6
45-49 699
2,096 100.0 14.5 23.2 61.6 0.3 0.4
50-54 607
1,819 100.0 12.4 22.2 64.5 0.2 0.7
55-59 425
981 100.0 13.3 19.7 66.3 0.3 0.5
60-64 574
520 100.0 8.8 21.5 69.2 0.0 0.4
65+ 2,447 794 100.0 15.1 23.0 61.5 0.1 0.3 Source: Ghana Statistical Service, 2010 Population and Housing Census
27
3.6.1 Population by level of education and school attendance
Table 3.10 indicates the population three years and older by level of education, school
attendance and sex of the district. The data shows that 45.2 percent are currently in primary
school, followed by JSS/JHS (18.6%). For those who have attended school in the past, 36.7
percent of females and 30.7 percent of males have attained JHS/JSS education. There are
relatively smaller proportions of males (2.1%) and females (2.0%) who have attained post
middle/secondary education. The table also indicates that females (17.9%) dominate males
(10.1%) in the population who have attained primary education in the past.
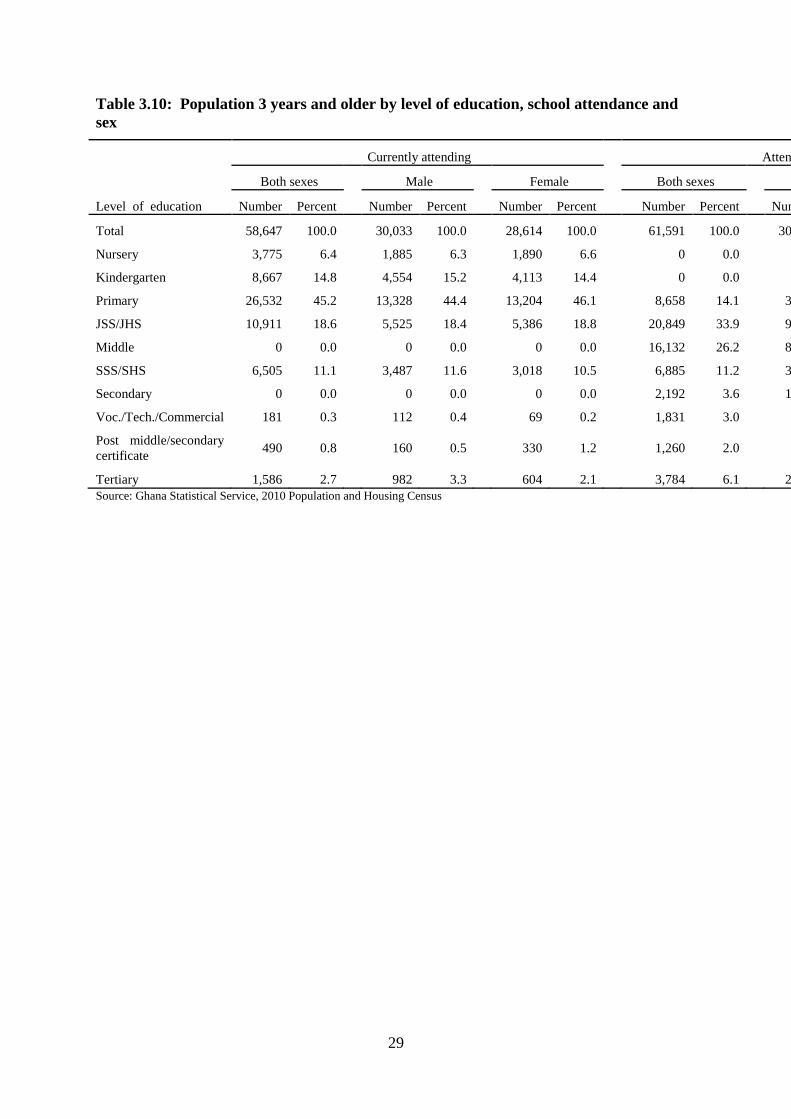
29
Table 3.10: Population 3 years and older by level of education, school attendance and
sex
Level of education
Currently attending Attended in the past
Both sexes
Male
Female
Both sexes
Male
Female
Number Percent Number Percent Number Percent Number Percent Number Percent Number Percent
Total 58,647 100.0
30,033 100.0
28,614 100.0
61,591 100.0
30,219 100.0
31,372 100.0
Nursery 3,775 6.4
1,885 6.3
1,890 6.6
0 0.0
0 0.0
0 0.0
Kindergarten 8,667 14.8
4,554 15.2
4,113 14.4
0 0.0
0 0.0
0 0.0
Primary 26,532 45.2
13,328 44.4
13,204 46.1
8,658 14.1
3,045 10.1
5,613 17.9
JSS/JHS 10,911 18.6
5,525 18.4
5,386 18.8
20,849 33.9
9,348 30.9
11,501 36.7
Middle 0 0.0
0 0.0
0 0.0
16,132 26.2
8,422 27.9
7,710 24.6
SSS/SHS 6,505 11.1
3,487 11.6
3,018 10.5
6,885 11.2
3,815 12.6
3,070 9.8
Secondary 0 0.0
0 0.0
0 0.0
2,192 3.6
1,508 5.0
684 2.2
Voc./Tech./Commercial 181 0.3
112 0.4
69 0.2
1,831 3.0
921 3.0
910 2.9
Post middle/secondary
certificate 490 0.8
160 0.5
330 1.2
1,260 2.0
632 2.1
628 2.0
Tertiary 1,586 2.7 982 3.3 604 2.1 3,784 6.1 2,528 8.4 1,256 4.0
Source: Ghana Statistical Service, 2010 Population and Housing Census
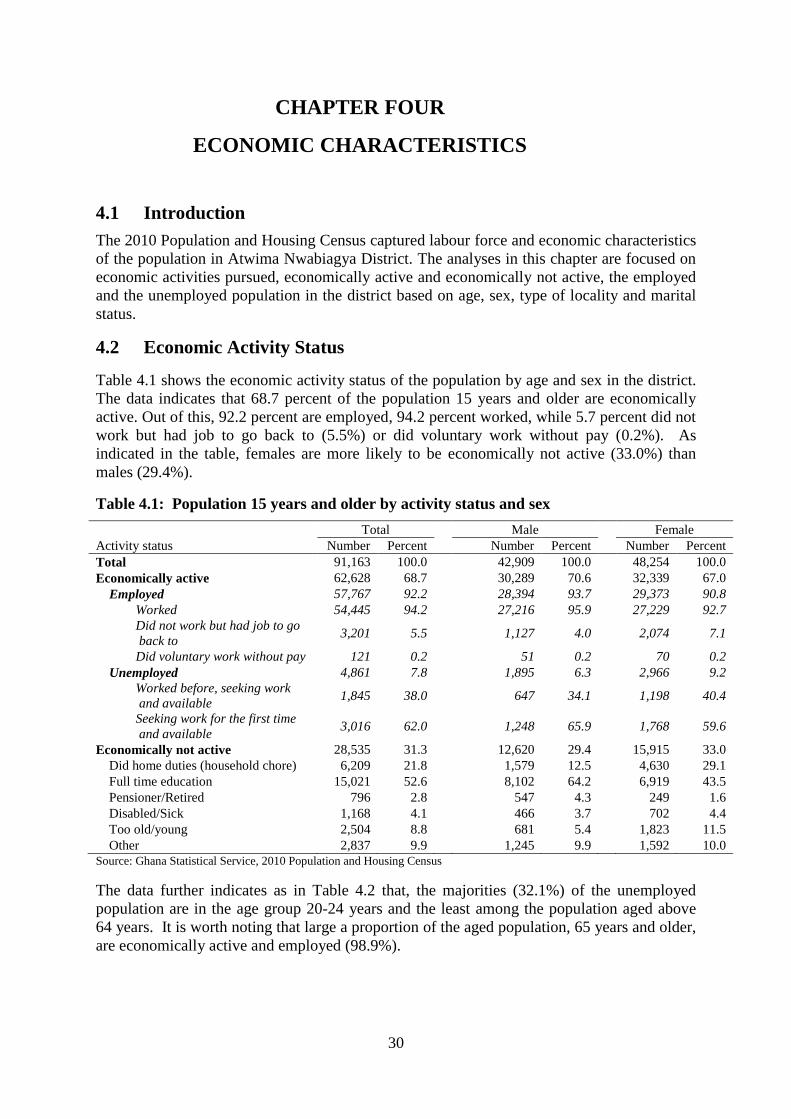
30
CHAPTER FOUR
ECONOMIC CHARACTERISTICS
4.1 Introduction
The 2010 Population and Housing Census captured labour force and economic characteristics
of the population in Atwima Nwabiagya District. The analyses in this chapter are focused on
economic activities pursued, economically active and economically not active, the employed
and the unemployed population in the district based on age, sex, type of locality and marital
status.
4.2 Economic Activity Status
Table 4.1 shows the economic activity status of the population by age and sex in the district.
The data indicates that 68.7 percent of the population 15 years and older are economically
active. Out of this, 92.2 percent are employed, 94.2 percent worked, while 5.7 percent did not
work but had job to go back to (5.5%) or did voluntary work without pay (0.2%). As
indicated in the table, females are more likely to be economically not active (33.0%) than
males (29.4%).
Table 4.1: Population 15 years and older by activity status and sex
Activity status
Total Male Female
Number Percent Number Percent Number Percent
Total 91,163 100.0
42,909 100.0
48,254 100.0
Economically active 62,628 68.7
30,289 70.6
32,339 67.0
Employed 57,767 92.2
28,394 93.7
29,373 90.8
Worked 54,445 94.2
27,216 95.9
27,229 92.7
Did not work but had job to go
back to 3,201 5.5
1,127 4.0
2,074 7.1
Did voluntary work without pay 121 0.2
51 0.2
70 0.2
Unemployed 4,861 7.8
1,895 6.3
2,966 9.2
Worked before, seeking work
and available 1,845 38.0
647 34.1
1,198 40.4
Seeking work for the first time
and available 3,016 62.0
1,248 65.9
1,768 59.6
Economically not active 28,535 31.3
12,620 29.4
15,915 33.0
Did home duties (household chore) 6,209 21.8
1,579 12.5
4,630 29.1
Full time education 15,021 52.6
8,102 64.2
6,919 43.5
Pensioner/Retired 796 2.8
547 4.3
249 1.6
Disabled/Sick 1,168 4.1
466 3.7
702 4.4
Too old/young 2,504 8.8
681 5.4
1,823 11.5
Other 2,837 9.9 1,245 9.9 1,592 10.0
Source: Ghana Statistical Service, 2010 Population and Housing Census
The data further indicates as in Table 4.2 that, the majorities (32.1%) of the unemployed
population are in the age group 20-24 years and the least among the population aged above
64 years. It is worth noting that large a proportion of the aged population, 65 years and older,
are economically active and employed (98.9%).
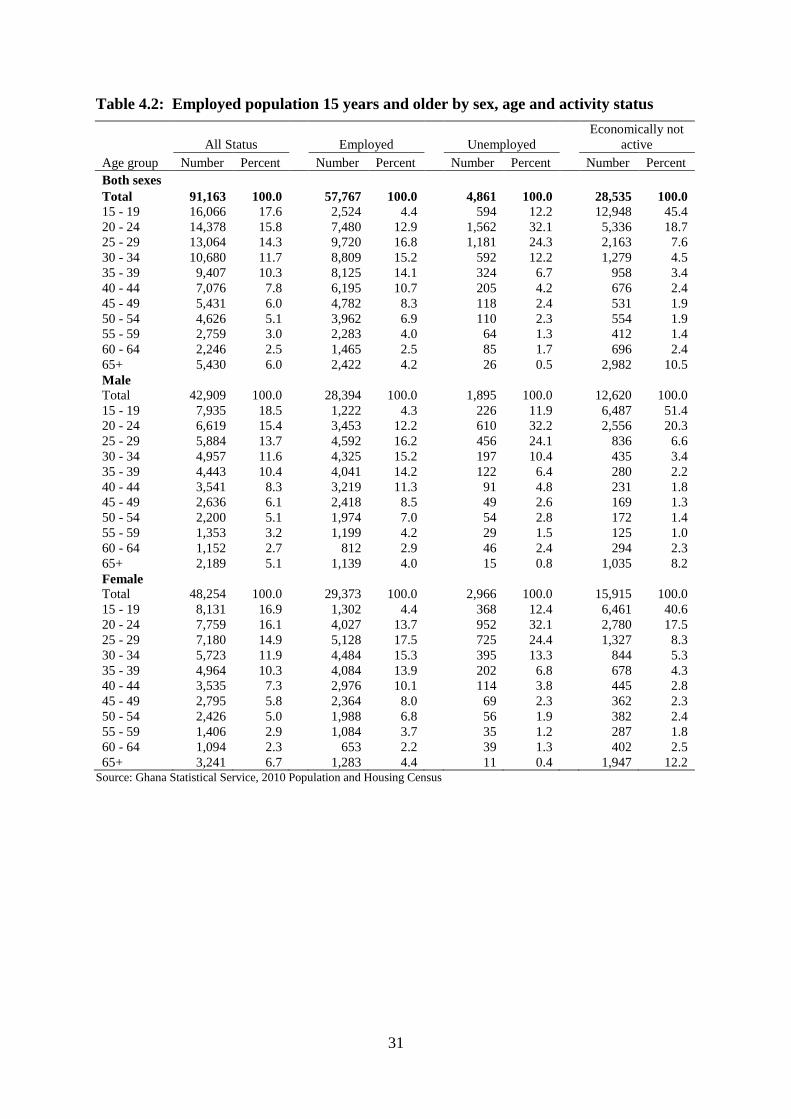
31
Table 4.2: Employed population 15 years and older by sex, age and activity status
Age group
All Status
Employed
Unemployed
Economically not
active
Number Percent Number Percent Number Percent Number Percent
Both sexes
Total 91,163 100.0
57,767 100.0
4,861 100.0
28,535 100.0
15 - 19 16,066 17.6
2,524 4.4
594 12.2
12,948 45.4
20 - 24 14,378 15.8
7,480 12.9
1,562 32.1
5,336 18.7
25 - 29 13,064 14.3
9,720 16.8
1,181 24.3
2,163 7.6
30 - 34 10,680 11.7
8,809 15.2
592 12.2
1,279 4.5
35 - 39 9,407 10.3
8,125 14.1
324 6.7
958 3.4
40 - 44 7,076 7.8
6,195 10.7
205 4.2
676 2.4
45 - 49 5,431 6.0
4,782 8.3
118 2.4
531 1.9
50 - 54 4,626 5.1
3,962 6.9
110 2.3
554 1.9
55 - 59 2,759 3.0
2,283 4.0
64 1.3
412 1.4
60 - 64 2,246 2.5
1,465 2.5
85 1.7
696 2.4
65+ 5,430 6.0
2,422 4.2
26 0.5
2,982 10.5
Male
Total 42,909 100.0
28,394 100.0
1,895 100.0
12,620 100.0
15 - 19 7,935 18.5
1,222 4.3
226 11.9
6,487 51.4
20 - 24 6,619 15.4
3,453 12.2
610 32.2
2,556 20.3
25 - 29 5,884 13.7
4,592 16.2
456 24.1
836 6.6
30 - 34 4,957 11.6
4,325 15.2
197 10.4
435 3.4
35 - 39 4,443 10.4
4,041 14.2
122 6.4
280 2.2
40 - 44 3,541 8.3
3,219 11.3
91 4.8
231 1.8
45 - 49 2,636 6.1
2,418 8.5
49 2.6
169 1.3
50 - 54 2,200 5.1
1,974 7.0
54 2.8
172 1.4
55 - 59 1,353 3.2
1,199 4.2
29 1.5
125 1.0
60 - 64 1,152 2.7
812 2.9
46 2.4
294 2.3
65+ 2,189 5.1
1,139 4.0
15 0.8
1,035 8.2
Female
Total 48,254 100.0
29,373 100.0
2,966 100.0
15,915 100.0
15 - 19 8,131 16.9
1,302 4.4
368 12.4
6,461 40.6
20 - 24 7,759 16.1
4,027 13.7
952 32.1
2,780 17.5
25 - 29 7,180 14.9
5,128 17.5
725 24.4
1,327 8.3
30 - 34 5,723 11.9
4,484 15.3
395 13.3
844 5.3
35 - 39 4,964 10.3
4,084 13.9
202 6.8
678 4.3
40 - 44 3,535 7.3
2,976 10.1
114 3.8
445 2.8
45 - 49 2,795 5.8
2,364 8.0
69 2.3
362 2.3
50 - 54 2,426 5.0
1,988 6.8
56 1.9
382 2.4
55 - 59 1,406 2.9
1,084 3.7
35 1.2
287 1.8
60 - 64 1,094 2.3
653 2.2
39 1.3
402 2.5
65+ 3,241 6.7 1,283 4.4 11 0.4 1,947 12.2 Source: Ghana Statistical Service, 2010 Population and Housing Census
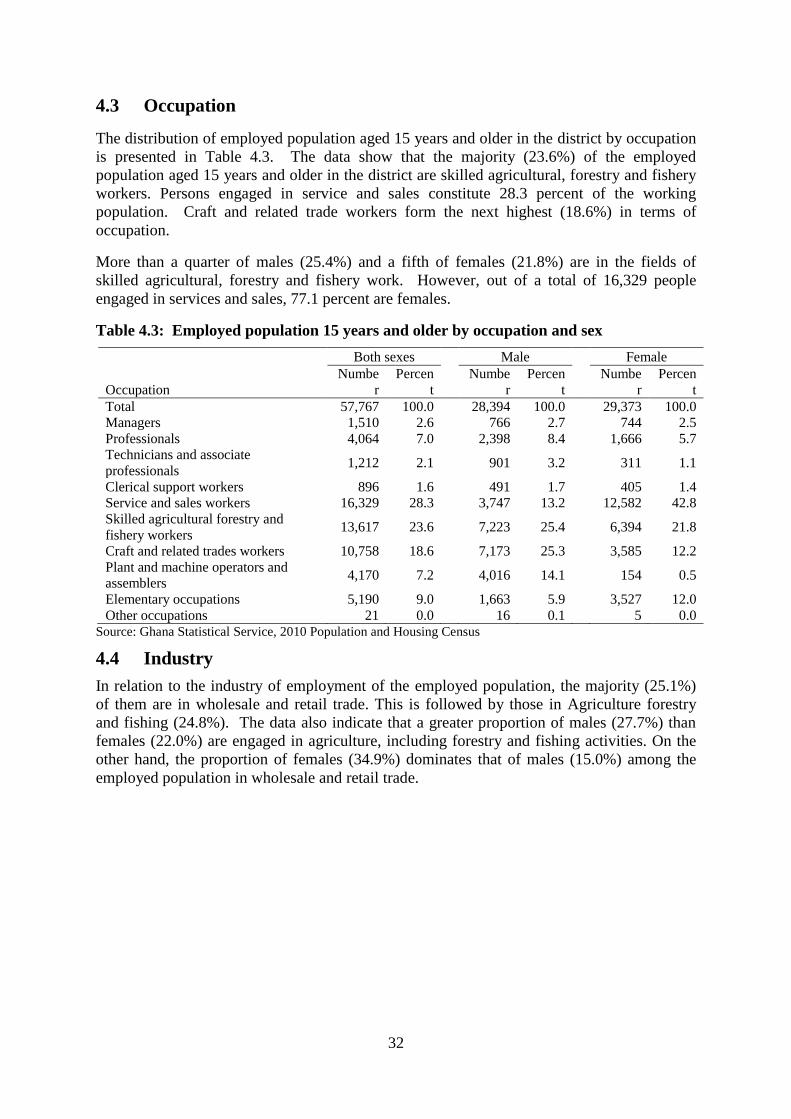
32
4.3 Occupation
The distribution of employed population aged 15 years and older in the district by occupation
is presented in Table 4.3. The data show that the majority (23.6%) of the employed
population aged 15 years and older in the district are skilled agricultural, forestry and fishery
workers. Persons engaged in service and sales constitute 28.3 percent of the working
population. Craft and related trade workers form the next highest (18.6%) in terms of
occupation.
More than a quarter of males (25.4%) and a fifth of females (21.8%) are in the fields of
skilled agricultural, forestry and fishery work. However, out of a total of 16,329 people
engaged in services and sales, 77.1 percent are females.
Table 4.3: Employed population 15 years and older by occupation and sex
Occupation
Both sexes Male Female
Numbe
r
Percen
t
Numbe
r
Percen
t
Numbe
r
Percen
t
Total 57,767 100.0
28,394 100.0
29,373 100.0
Managers 1,510 2.6
766 2.7
744 2.5
Professionals 4,064 7.0
2,398 8.4
1,666 5.7
Technicians and associate
professionals 1,212 2.1
901 3.2
311 1.1
Clerical support workers 896 1.6
491 1.7
405 1.4
Service and sales workers 16,329 28.3
3,747 13.2
12,582 42.8
Skilled agricultural forestry and
fishery workers 13,617 23.6
7,223 25.4
6,394 21.8
Craft and related trades workers 10,758 18.6
7,173 25.3
3,585 12.2
Plant and machine operators and
assemblers 4,170 7.2
4,016 14.1
154 0.5
Elementary occupations 5,190 9.0
1,663 5.9
3,527 12.0
Other occupations 21 0.0 16 0.1 5 0.0
Source: Ghana Statistical Service, 2010 Population and Housing Census
4.4 Industry
In relation to the industry of employment of the employed population, the majority (25.1%)
of them are in wholesale and retail trade. This is followed by those in Agriculture forestry
and fishing (24.8%). The data also indicate that a greater proportion of males (27.7%) than
females (22.0%) are engaged in agriculture, including forestry and fishing activities. On the
other hand, the proportion of females (34.9%) dominates that of males (15.0%) among the
employed population in wholesale and retail trade.
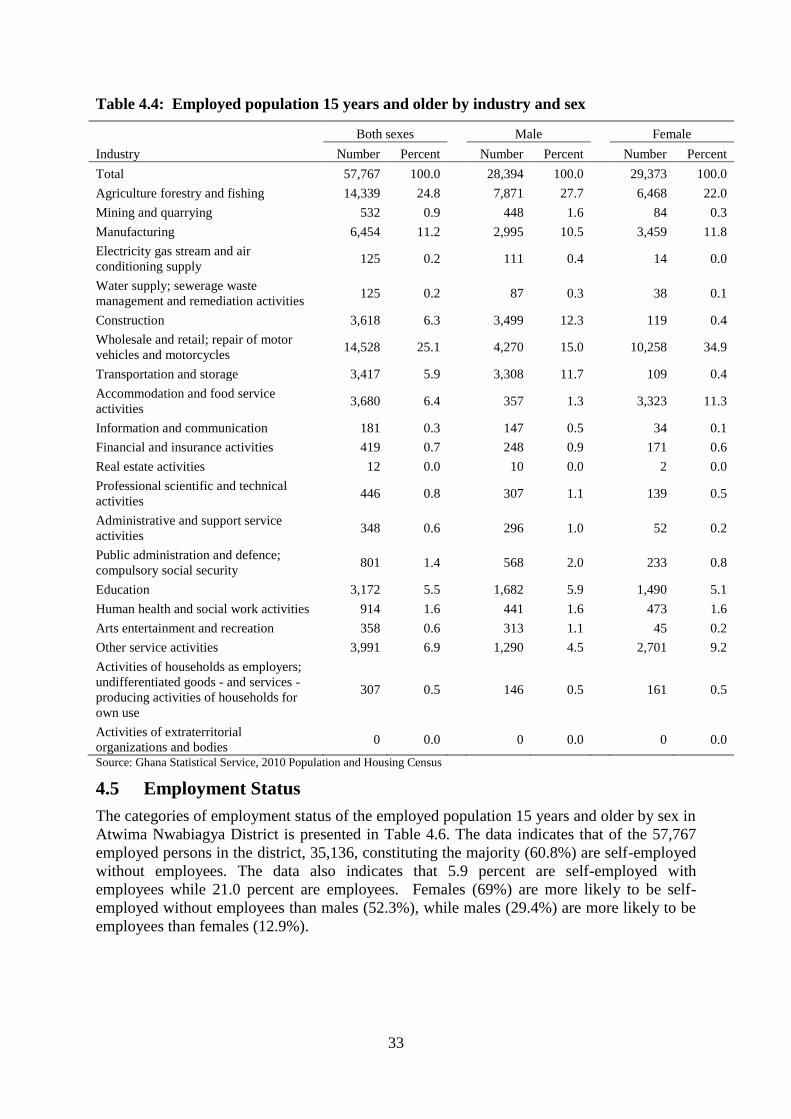
33
Table 4.4: Employed population 15 years and older by industry and sex
Industry
Both sexes Male Female
Number Percent Number Percent Number Percent
Total 57,767 100.0
28,394 100.0
29,373 100.0
Agriculture forestry and fishing 14,339 24.8
7,871 27.7
6,468 22.0
Mining and quarrying 532 0.9
448 1.6
84 0.3
Manufacturing 6,454 11.2
2,995 10.5
3,459 11.8
Electricity gas stream and air
conditioning supply 125 0.2
111 0.4
14 0.0
Water supply; sewerage waste
management and remediation activities 125 0.2
87 0.3
38 0.1
Construction 3,618 6.3
3,499 12.3
119 0.4
Wholesale and retail; repair of motor
vehicles and motorcycles 14,528 25.1
4,270 15.0
10,258 34.9
Transportation and storage 3,417 5.9
3,308 11.7
109 0.4
Accommodation and food service
activities 3,680 6.4
357 1.3
3,323 11.3
Information and communication 181 0.3
147 0.5
34 0.1
Financial and insurance activities 419 0.7
248 0.9
171 0.6
Real estate activities 12 0.0
10 0.0
2 0.0
Professional scientific and technical
activities 446 0.8
307 1.1
139 0.5
Administrative and support service
activities 348 0.6
296 1.0
52 0.2
Public administration and defence;
compulsory social security 801 1.4
568 2.0
233 0.8
Education 3,172 5.5
1,682 5.9
1,490 5.1
Human health and social work activities 914 1.6
441 1.6
473 1.6
Arts entertainment and recreation 358 0.6
313 1.1
45 0.2
Other service activities 3,991 6.9
1,290 4.5
2,701 9.2
Activities of households as employers;
undifferentiated goods - and services -
producing activities of households for
own use
307 0.5
146 0.5
161 0.5
Activities of extraterritorial
organizations and bodies 0 0.0 0 0.0 0 0.0
Source: Ghana Statistical Service, 2010 Population and Housing Census
4.5 Employment Status
The categories of employment status of the employed population 15 years and older by sex in
Atwima Nwabiagya District is presented in Table 4.6. The data indicates that of the 57,767
employed persons in the district, 35,136, constituting the majority (60.8%) are self-employed
without employees. The data also indicates that 5.9 percent are self-employed with
employees while 21.0 percent are employees. Females (69%) are more likely to be self-
employed without employees than males (52.3%), while males (29.4%) are more likely to be
employees than females (12.9%).
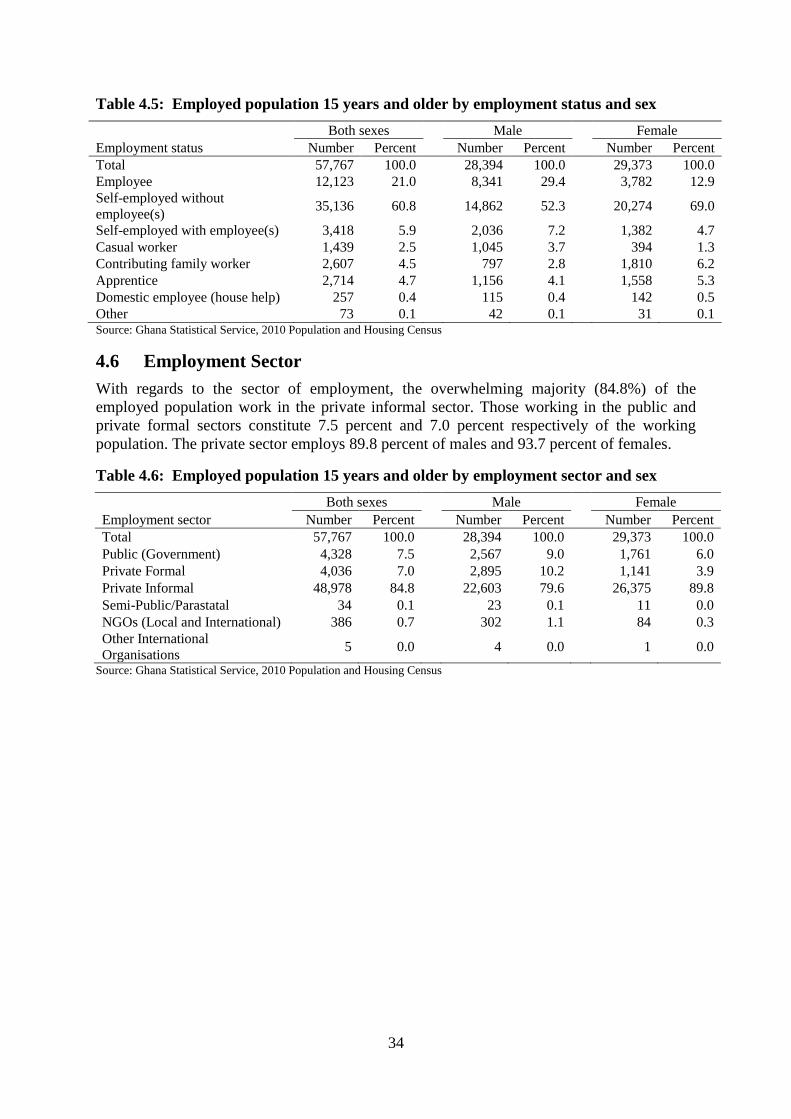
34
Table 4.5: Employed population 15 years and older by employment status and sex
Employment status
Both sexes Male Female
Number Percent Number Percent Number Percent
Total 57,767 100.0
28,394 100.0
29,373 100.0
Employee 12,123 21.0
8,341 29.4
3,782 12.9
Self-employed without
employee(s) 35,136 60.8
14,862 52.3
20,274 69.0
Self-employed with employee(s) 3,418 5.9
2,036 7.2
1,382 4.7
Casual worker 1,439 2.5
1,045 3.7
394 1.3
Contributing family worker 2,607 4.5
797 2.8
1,810 6.2
Apprentice 2,714 4.7
1,156 4.1
1,558 5.3
Domestic employee (house help) 257 0.4
115 0.4
142 0.5
Other 73 0.1 42 0.1 31 0.1 Source: Ghana Statistical Service, 2010 Population and Housing Census
4.6 Employment Sector
With regards to the sector of employment, the overwhelming majority (84.8%) of the
employed population work in the private informal sector. Those working in the public and
private formal sectors constitute 7.5 percent and 7.0 percent respectively of the working
population. The private sector employs 89.8 percent of males and 93.7 percent of females.
Table 4.6: Employed population 15 years and older by employment sector and sex
Employment sector
Both sexes Male Female
Number Percent Number Percent Number Percent
Total 57,767 100.0
28,394 100.0
29,373 100.0
Public (Government) 4,328 7.5
2,567 9.0
1,761 6.0
Private Formal 4,036 7.0
2,895 10.2
1,141 3.9
Private Informal 48,978 84.8
22,603 79.6
26,375 89.8
Semi-Public/Parastatal 34 0.1
23 0.1
11 0.0
NGOs (Local and International) 386 0.7
302 1.1
84 0.3
Other International
Organisations 5 0.0 4 0.0 1 0.0
Source: Ghana Statistical Service, 2010 Population and Housing Census
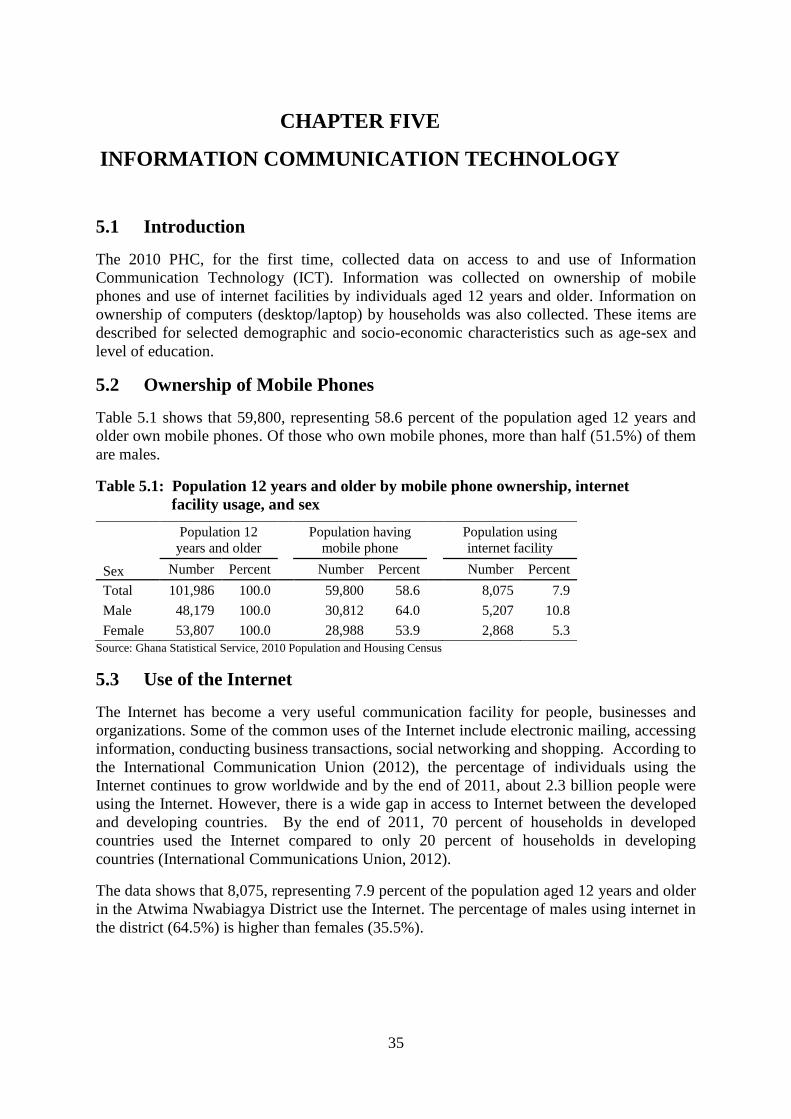
35
CHAPTER FIVE
INFORMATION COMMUNICATION TECHNOLOGY
5.1 Introduction
The 2010 PHC, for the first time, collected data on access to and use of Information
Communication Technology (ICT). Information was collected on ownership of mobile
phones and use of internet facilities by individuals aged 12 years and older. Information on
ownership of computers (desktop/laptop) by households was also collected. These items are
described for selected demographic and socio-economic characteristics such as age-sex and
level of education.
5.2 Ownership of Mobile Phones
Table 5.1 shows that 59,800, representing 58.6 percent of the population aged 12 years and
older own mobile phones. Of those who own mobile phones, more than half (51.5%) of them
are males.
Table 5.1: Population 12 years and older by mobile phone ownership, internet
facility usage, and sex
Sex
Population 12
years and older
Population having
mobile phone
Population using
internet facility
Number Percent Number Percent Number Percent
Total 101,986 100.0 59,800 58.6 8,075 7.9
Male 48,179 100.0 30,812 64.0 5,207 10.8
Female 53,807 100.0 28,988 53.9 2,868 5.3
Source: Ghana Statistical Service, 2010 Population and Housing Census
5.3 Use of the Internet
The Internet has become a very useful communication facility for people, businesses and
organizations. Some of the common uses of the Internet include electronic mailing, accessing
information, conducting business transactions, social networking and shopping. According to
the International Communication Union (2012), the percentage of individuals using the
Internet continues to grow worldwide and by the end of 2011, about 2.3 billion people were
using the Internet. However, there is a wide gap in access to Internet between the developed
and developing countries. By the end of 2011, 70 percent of households in developed
countries used the Internet compared to only 20 percent of households in developing
countries (International Communications Union, 2012).
The data shows that 8,075, representing 7.9 percent of the population aged 12 years and older
in the Atwima Nwabiagya District use the Internet. The percentage of males using internet in
the district (64.5%) is higher than females (35.5%).
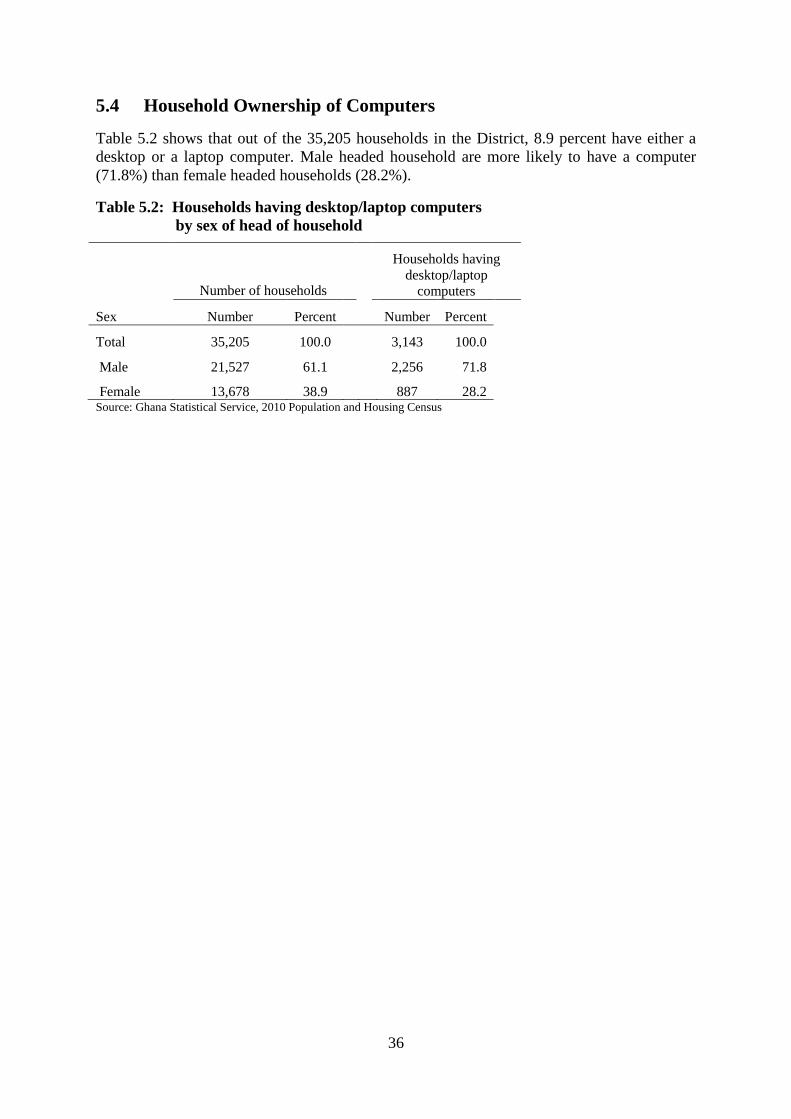
36
5.4 Household Ownership of Computers
Table 5.2 shows that out of the 35,205 households in the District, 8.9 percent have either a
desktop or a laptop computer. Male headed household are more likely to have a computer
(71.8%) than female headed households (28.2%).
Table 5.2: Households having desktop/laptop computers
by sex of head of household
Sex
Number of households
Households having
desktop/laptop
computers
Number Percent Number Percent
Total 35,205 100.0
3,143 100.0
Male 21,527 61.1
2,256 71.8
Female 13,678 38.9 887 28.2 Source: Ghana Statistical Service, 2010 Population and Housing Census
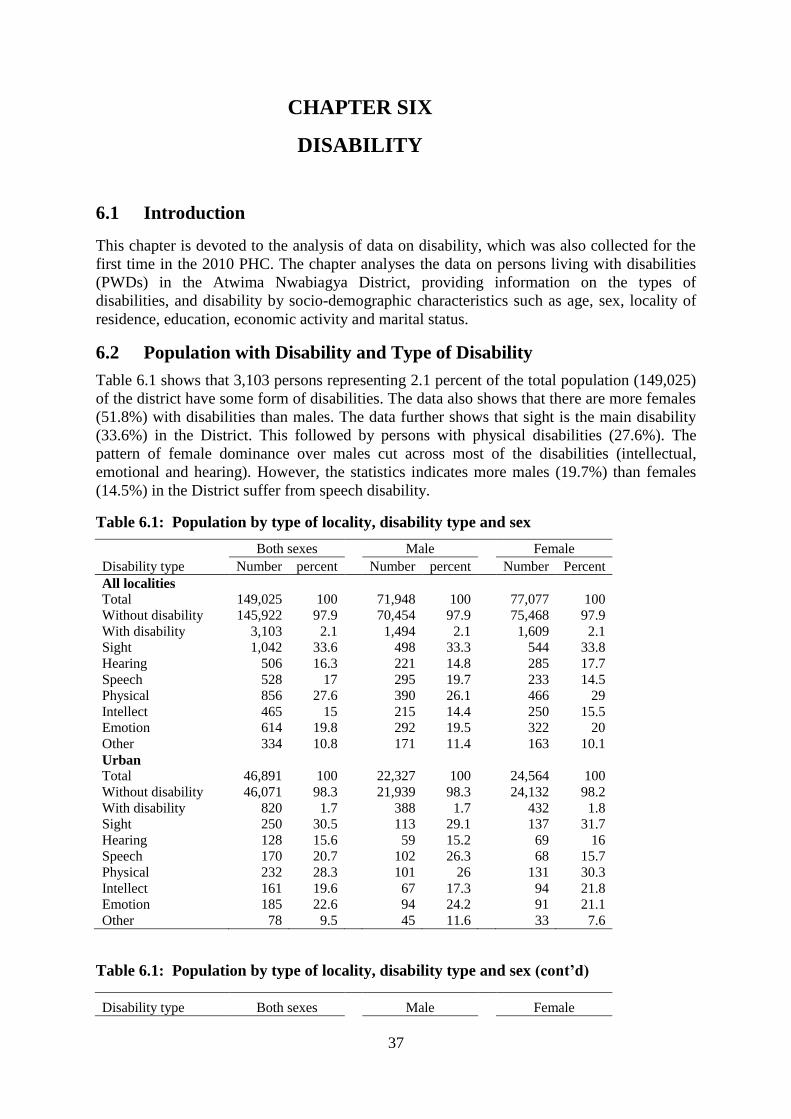
37
CHAPTER SIX
DISABILITY
6.1 Introduction
This chapter is devoted to the analysis of data on disability, which was also collected for the
first time in the 2010 PHC. The chapter analyses the data on persons living with disabilities
(PWDs) in the Atwima Nwabiagya District, providing information on the types of
disabilities, and disability by socio-demographic characteristics such as age, sex, locality of
residence, education, economic activity and marital status.
6.2 Population with Disability and Type of Disability
Table 6.1 shows that 3,103 persons representing 2.1 percent of the total population (149,025)
of the district have some form of disabilities. The data also shows that there are more females
(51.8%) with disabilities than males. The data further shows that sight is the main disability
(33.6%) in the District. This followed by persons with physical disabilities (27.6%). The
pattern of female dominance over males cut across most of the disabilities (intellectual,
emotional and hearing). However, the statistics indicates more males (19.7%) than females
(14.5%) in the District suffer from speech disability.
Table 6.1: Population by type of locality, disability type and sex
Disability type
Both sexes Male Female
Number percent Number percent Number Percent
All localities
Total 149,025 100
71,948 100
77,077 100
Without disability 145,922 97.9
70,454 97.9
75,468 97.9
With disability 3,103 2.1
1,494 2.1
1,609 2.1
Sight 1,042 33.6
498 33.3
544 33.8
Hearing 506 16.3
221 14.8
285 17.7
Speech 528 17
295 19.7
233 14.5
Physical 856 27.6
390 26.1
466 29
Intellect 465 15
215 14.4
250 15.5
Emotion 614 19.8
292 19.5
322 20
Other 334 10.8
171 11.4
163 10.1
Urban Total 46,891 100
22,327 100
24,564 100
Without disability 46,071 98.3
21,939 98.3
24,132 98.2
With disability 820 1.7
388 1.7
432 1.8
Sight 250 30.5
113 29.1
137 31.7
Hearing 128 15.6
59 15.2
69 16
Speech 170 20.7
102 26.3
68 15.7
Physical 232 28.3
101 26
131 30.3
Intellect 161 19.6
67 17.3
94 21.8
Emotion 185 22.6
94 24.2
91 21.1
Other 78 9.5 45 11.6 33 7.6
Table 6.1: Population by type of locality, disability type and sex (cont’d)
Disability type Both sexes Male Female
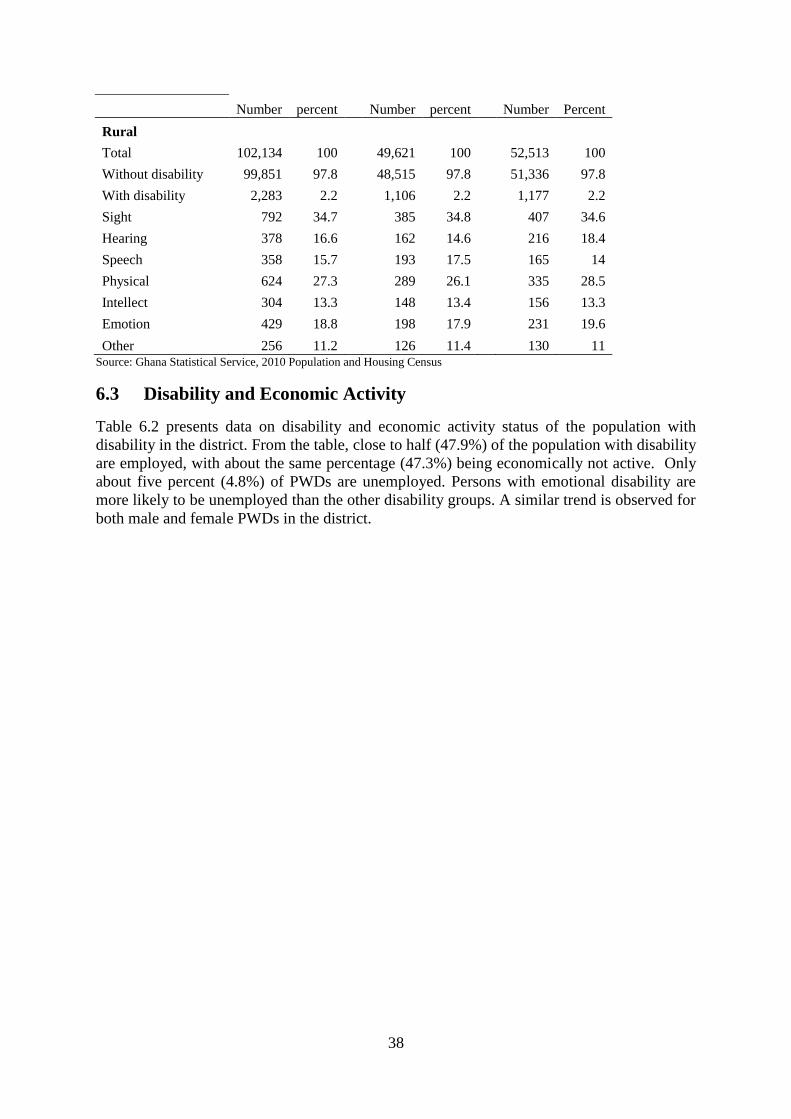
38
Number percent Number percent Number Percent
Rural
Total 102,134 100
49,621 100
52,513 100
Without disability 99,851 97.8
48,515 97.8
51,336 97.8
With disability 2,283 2.2
1,106 2.2
1,177 2.2
Sight 792 34.7
385 34.8
407 34.6
Hearing 378 16.6
162 14.6
216 18.4
Speech 358 15.7
193 17.5
165 14
Physical 624 27.3
289 26.1
335 28.5
Intellect 304 13.3
148 13.4
156 13.3
Emotion 429 18.8
198 17.9
231 19.6
Other 256 11.2 126 11.4 130 11 Source: Ghana Statistical Service, 2010 Population and Housing Census
6.3 Disability and Economic Activity
Table 6.2 presents data on disability and economic activity status of the population with
disability in the district. From the table, close to half (47.9%) of the population with disability
are employed, with about the same percentage (47.3%) being economically not active. Only
about five percent (4.8%) of PWDs are unemployed. Persons with emotional disability are
more likely to be unemployed than the other disability groups. A similar trend is observed for
both male and female PWDs in the district.
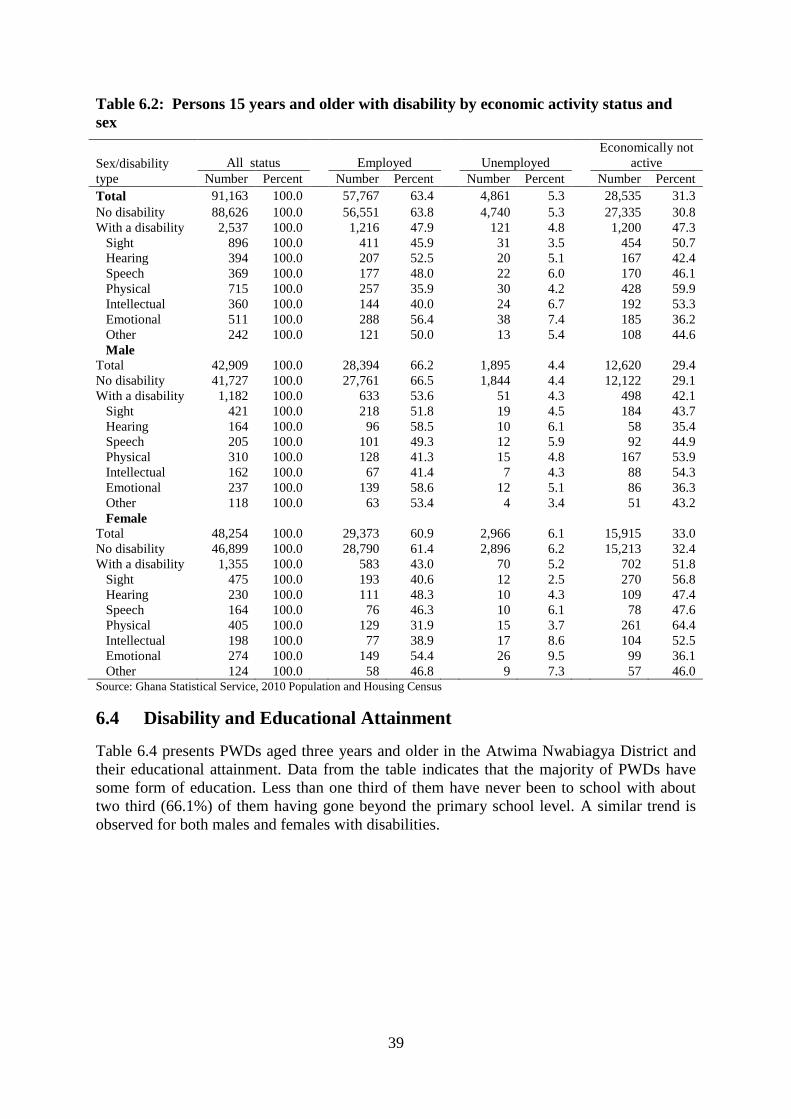
39
Table 6.2: Persons 15 years and older with disability by economic activity status and
sex
Sex/disability
type
All status Employed
Unemployed
Economically not
active
Number Percent Number Percent Number Percent Number Percent
Total 91,163 100.0
57,767 63.4
4,861 5.3
28,535 31.3
No disability 88,626 100.0
56,551 63.8
4,740 5.3
27,335 30.8
With a disability 2,537 100.0
1,216 47.9
121 4.8
1,200 47.3
Sight 896 100.0
411 45.9
31 3.5
454 50.7
Hearing 394 100.0
207 52.5
20 5.1
167 42.4
Speech 369 100.0
177 48.0
22 6.0
170 46.1
Physical 715 100.0
257 35.9
30 4.2
428 59.9
Intellectual 360 100.0
144 40.0
24 6.7
192 53.3
Emotional 511 100.0
288 56.4
38 7.4
185 36.2
Other 242 100.0
121 50.0
13 5.4
108 44.6
Male
Total 42,909 100.0
28,394 66.2
1,895 4.4
12,620 29.4
No disability 41,727 100.0
27,761 66.5
1,844 4.4
12,122 29.1
With a disability 1,182 100.0
633 53.6
51 4.3
498 42.1
Sight 421 100.0
218 51.8
19 4.5
184 43.7
Hearing 164 100.0
96 58.5
10 6.1
58 35.4
Speech 205 100.0
101 49.3
12 5.9
92 44.9
Physical 310 100.0
128 41.3
15 4.8
167 53.9
Intellectual 162 100.0
67 41.4
7 4.3
88 54.3
Emotional 237 100.0
139 58.6
12 5.1
86 36.3
Other 118 100.0
63 53.4
4 3.4
51 43.2
Female
Total 48,254 100.0
29,373 60.9
2,966 6.1
15,915 33.0
No disability 46,899 100.0
28,790 61.4
2,896 6.2
15,213 32.4
With a disability 1,355 100.0
583 43.0
70 5.2
702 51.8
Sight 475 100.0
193 40.6
12 2.5
270 56.8
Hearing 230 100.0
111 48.3
10 4.3
109 47.4
Speech 164 100.0
76 46.3
10 6.1
78 47.6
Physical 405 100.0
129 31.9
15 3.7
261 64.4
Intellectual 198 100.0
77 38.9
17 8.6
104 52.5
Emotional 274 100.0
149 54.4
26 9.5
99 36.1
Other 124 100.0 58 46.8 9 7.3 57 46.0 Source: Ghana Statistical Service, 2010 Population and Housing Census
6.4 Disability and Educational Attainment
Table 6.4 presents PWDs aged three years and older in the Atwima Nwabiagya District and
their educational attainment. Data from the table indicates that the majority of PWDs have
some form of education. Less than one third of them have never been to school with about
two third (66.1%) of them having gone beyond the primary school level. A similar trend is
observed for both males and females with disabilities.
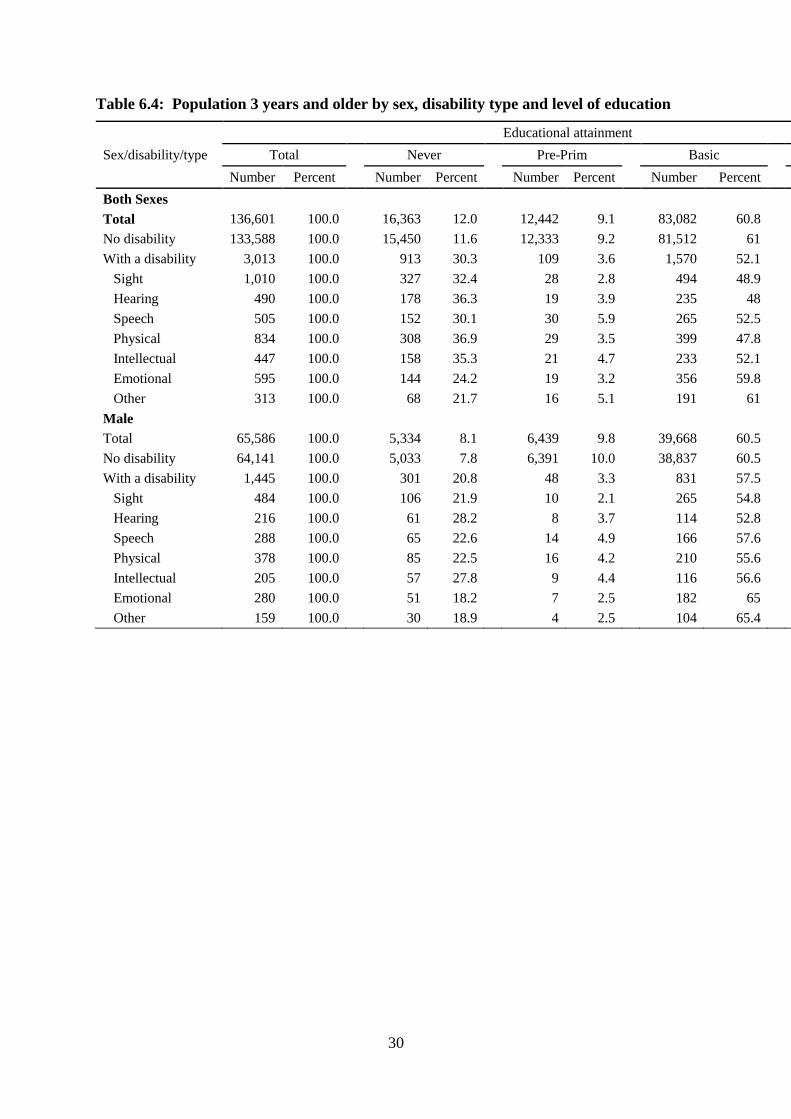
30
Table 6.4: Population 3 years and older by sex, disability type and level of education
Sex/disability/type
Educational attainment
Total Never Pre-Prim Basic Sec/SHS and higher
Number Percent Number Percent Number Percent Number Percent Number Percent
Both Sexes
Total 136,601 100.0
16,363 12.0
12,442 9.1
83,082 60.8
24,714 18.1
No disability 133,588 100.0
15,450 11.6
12,333 9.2
81,512 61
24,293 18.2
With a disability 3,013 100.0
913 30.3
109 3.6
1,570 52.1
421 14.0
Sight 1,010 100.0
327 32.4
28 2.8
494 48.9
161 15.9
Hearing 490 100.0
178 36.3
19 3.9
235 48
58 11.8
Speech 505 100.0
152 30.1
30 5.9
265 52.5
58 11.5
Physical 834 100.0
308 36.9
29 3.5
399 47.8
98 11.8
Intellectual 447 100.0
158 35.3
21 4.7
233 52.1
35 7.8
Emotional 595 100.0
144 24.2
19 3.2
356 59.8
76 12.8
Other 313 100.0
68 21.7
16 5.1
191 61
38 12.1
Male
Total 65,586 100.0
5,334 8.1
6,439 9.8
39,668 60.5
14,145 21.6
No disability 64,141 100.0
5,033 7.8
6,391 10.0
38,837 60.5
13,880 21.6
With a disability 1,445 100.0
301 20.8
48 3.3
831 57.5
265 18.3
Sight 484 100.0
106 21.9
10 2.1
265 54.8
103 21.3
Hearing 216 100.0
61 28.2
8 3.7
114 52.8
33 15.3
Speech 288 100.0
65 22.6
14 4.9
166 57.6
43 14.9
Physical 378 100.0
85 22.5
16 4.2
210 55.6
67 17.7
Intellectual 205 100.0
57 27.8
9 4.4
116 56.6
23 11.2
Emotional 280 100.0
51 18.2
7 2.5
182 65
40 14.3
Other 159 100.0
30 18.9
4 2.5
104 65.4
21 13.2
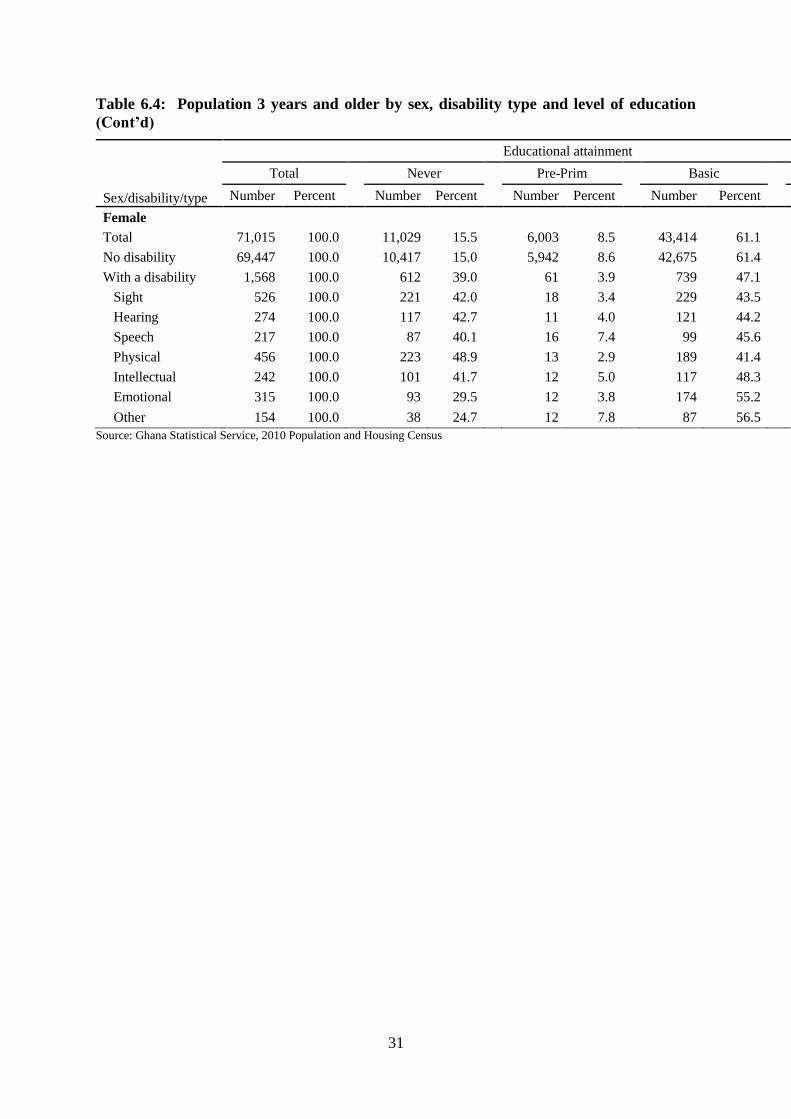
31
Table 6.4: Population 3 years and older by sex, disability type and level of education
(Cont’d)
Sex/disability/type
Educational attainment
Total Never Pre-Prim Basic Sec/SHS and higher
Number Percent Number Percent Number Percent Number Percent Number Percent
Female
Total 71,015 100.0
11,029 15.5
6,003 8.5
43,414 61.1
10,569 14.9
No disability 69,447 100.0
10,417 15.0
5,942 8.6
42,675 61.4
10,413 15.0
With a disability 1,568 100.0
612 39.0
61 3.9
739 47.1
156 9.9
Sight 526 100.0
221 42.0
18 3.4
229 43.5
58 11.0
Hearing 274 100.0
117 42.7
11 4.0
121 44.2
25 9.1
Speech 217 100.0
87 40.1
16 7.4
99 45.6
15 6.9
Physical 456 100.0
223 48.9
13 2.9
189 41.4
31 6.8
Intellectual 242 100.0
101 41.7
12 5.0
117 48.3
12 5.0
Emotional 315 100.0
93 29.5
12 3.8
174 55.2
36 11.4
Other 154 100.0 38 24.7 12 7.8 87 56.5 17 11
Source: Ghana Statistical Service, 2010 Population and Housing Census
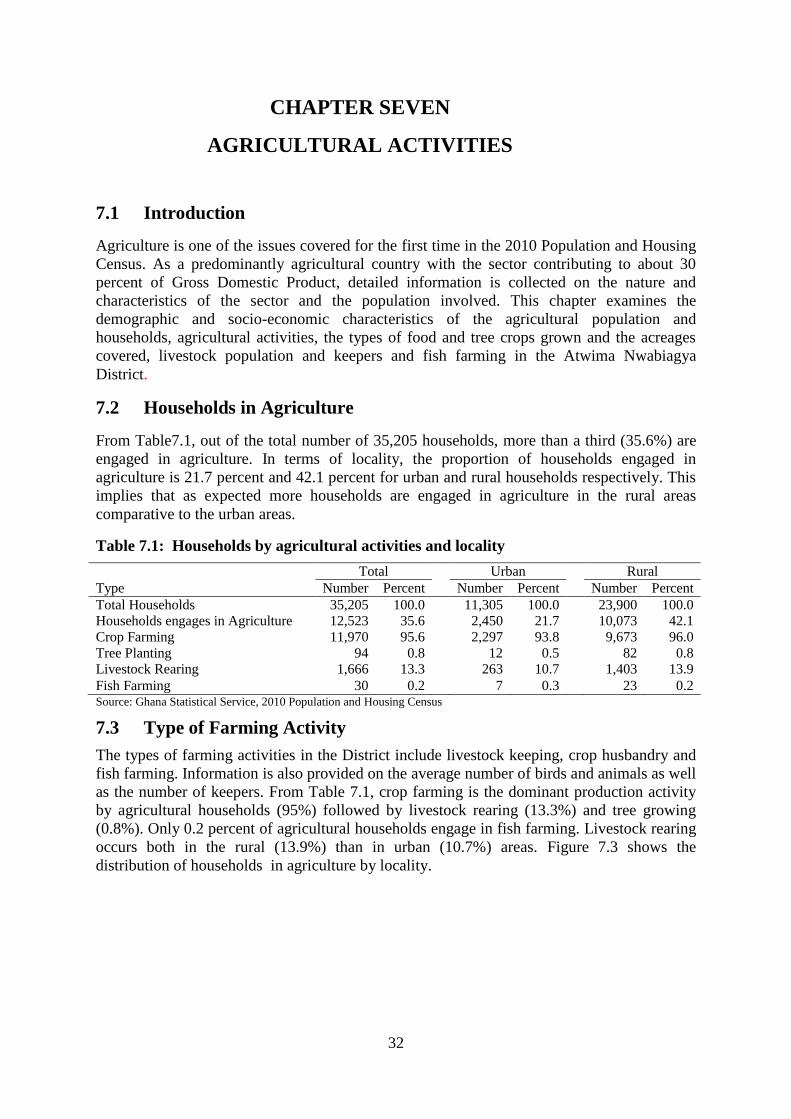
32
CHAPTER SEVEN
AGRICULTURAL ACTIVITIES
7.1 Introduction
Agriculture is one of the issues covered for the first time in the 2010 Population and Housing
Census. As a predominantly agricultural country with the sector contributing to about 30
percent of Gross Domestic Product, detailed information is collected on the nature and
characteristics of the sector and the population involved. This chapter examines the
demographic and socio-economic characteristics of the agricultural population and
households, agricultural activities, the types of food and tree crops grown and the acreages
covered, livestock population and keepers and fish farming in the Atwima Nwabiagya
District.
7.2 Households in Agriculture
From Table7.1, out of the total number of 35,205 households, more than a third (35.6%) are
engaged in agriculture. In terms of locality, the proportion of households engaged in
agriculture is 21.7 percent and 42.1 percent for urban and rural households respectively. This
implies that as expected more households are engaged in agriculture in the rural areas
comparative to the urban areas.
Table 7.1: Households by agricultural activities and locality
Type
Total Urban Rural
Number Percent Number Percent Number Percent
Total Households 35,205 100.0
11,305 100.0
23,900 100.0
Households engages in Agriculture 12,523 35.6
2,450 21.7
10,073 42.1
Crop Farming 11,970 95.6
2,297 93.8
9,673 96.0
Tree Planting 94 0.8
12 0.5
82 0.8
Livestock Rearing 1,666 13.3
263 10.7
1,403 13.9
Fish Farming 30 0.2 7 0.3 23 0.2 Source: Ghana Statistical Service, 2010 Population and Housing Census
7.3 Type of Farming Activity
The types of farming activities in the District include livestock keeping, crop husbandry and
fish farming. Information is also provided on the average number of birds and animals as well
as the number of keepers. From Table 7.1, crop farming is the dominant production activity
by agricultural households (95%) followed by livestock rearing (13.3%) and tree growing
(0.8%). Only 0.2 percent of agricultural households engage in fish farming. Livestock rearing
occurs both in the rural (13.9%) than in urban (10.7%) areas. Figure 7.3 shows the
distribution of households in agriculture by locality.
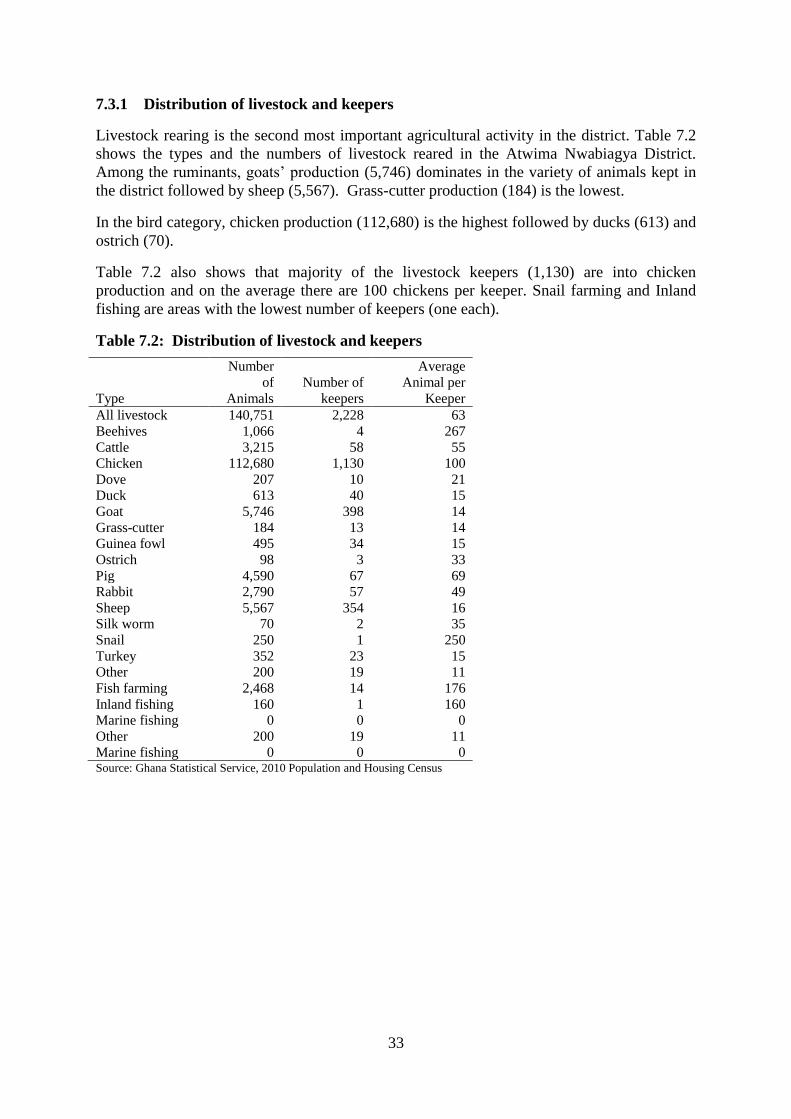
33
7.3.1 Distribution of livestock and keepers
Livestock rearing is the second most important agricultural activity in the district. Table 7.2
shows the types and the numbers of livestock reared in the Atwima Nwabiagya District.
Among the ruminants, goats’ production (5,746) dominates in the variety of animals kept in
the district followed by sheep (5,567). Grass-cutter production (184) is the lowest.
In the bird category, chicken production (112,680) is the highest followed by ducks (613) and
ostrich (70).
Table 7.2 also shows that majority of the livestock keepers (1,130) are into chicken
production and on the average there are 100 chickens per keeper. Snail farming and Inland
fishing are areas with the lowest number of keepers (one each).
Table 7.2: Distribution of livestock and keepers
Type
Number
of
Animals
Number of
keepers
Average
Animal per
Keeper
All livestock 140,751 2,228 63
Beehives 1,066 4 267
Cattle 3,215 58 55
Chicken 112,680 1,130 100
Dove 207 10 21
Duck 613 40 15
Goat 5,746 398 14
Grass-cutter 184 13 14
Guinea fowl 495 34 15
Ostrich 98 3 33
Pig 4,590 67 69
Rabbit 2,790 57 49
Sheep 5,567 354 16
Silk worm 70 2 35
Snail 250 1 250
Turkey 352 23 15
Other 200 19 11
Fish farming 2,468 14 176
Inland fishing 160 1 160
Marine fishing 0 0 0
Other 200 19 11
Marine fishing 0 0 0 Source: Ghana Statistical Service, 2010 Population and Housing Census
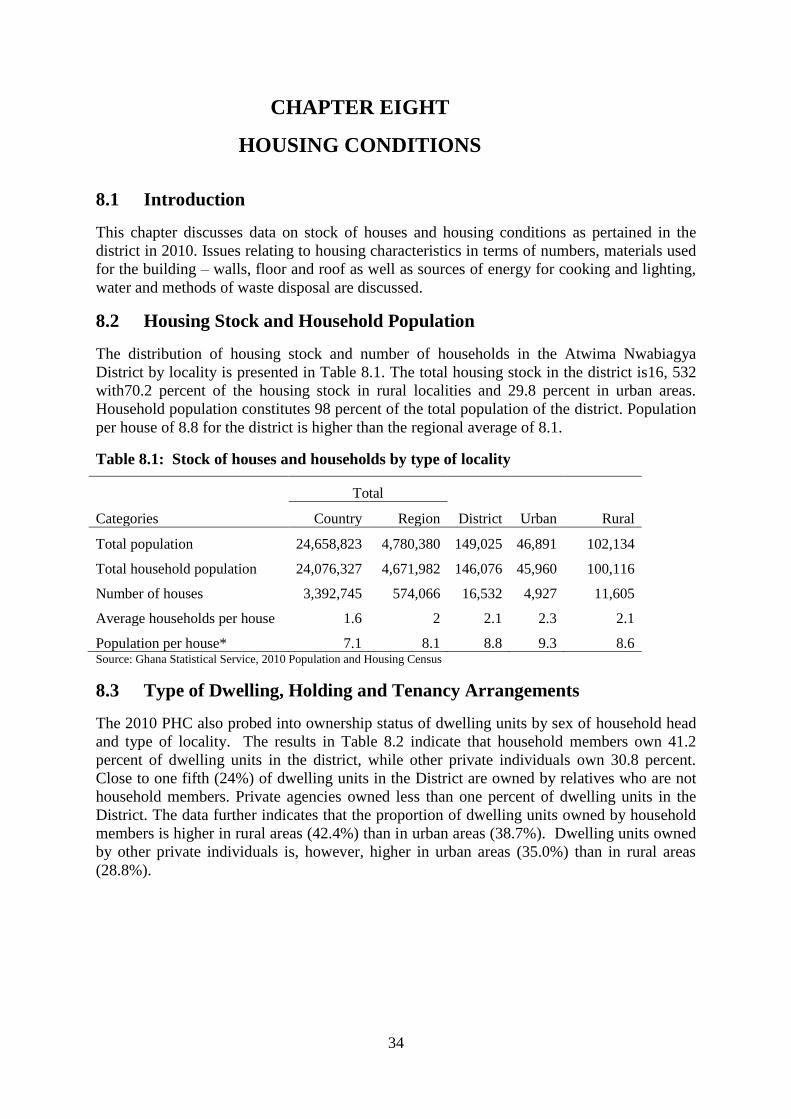
34
CHAPTER EIGHT
HOUSING CONDITIONS
8.1 Introduction
This chapter discusses data on stock of houses and housing conditions as pertained in the
district in 2010. Issues relating to housing characteristics in terms of numbers, materials used
for the building – walls, floor and roof as well as sources of energy for cooking and lighting,
water and methods of waste disposal are discussed.
8.2 Housing Stock and Household Population
The distribution of housing stock and number of households in the Atwima Nwabiagya
District by locality is presented in Table 8.1. The total housing stock in the district is16, 532
with70.2 percent of the housing stock in rural localities and 29.8 percent in urban areas.
Household population constitutes 98 percent of the total population of the district. Population
per house of 8.8 for the district is higher than the regional average of 8.1.
Table 8.1: Stock of houses and households by type of locality
Categories
Total
District Urban Rural Country Region
Total population 24,658,823 4,780,380 149,025 46,891 102,134
Total household population 24,076,327 4,671,982 146,076 45,960 100,116
Number of houses 3,392,745 574,066 16,532 4,927 11,605
Average households per house 1.6 2 2.1 2.3 2.1
Population per house* 7.1 8.1 8.8 9.3 8.6 Source: Ghana Statistical Service, 2010 Population and Housing Census
8.3 Type of Dwelling, Holding and Tenancy Arrangements
The 2010 PHC also probed into ownership status of dwelling units by sex of household head
and type of locality. The results in Table 8.2 indicate that household members own 41.2
percent of dwelling units in the district, while other private individuals own 30.8 percent.
Close to one fifth (24%) of dwelling units in the District are owned by relatives who are not
household members. Private agencies owned less than one percent of dwelling units in the
District. The data further indicates that the proportion of dwelling units owned by household
members is higher in rural areas (42.4%) than in urban areas (38.7%). Dwelling units owned
by other private individuals is, however, higher in urban areas (35.0%) than in rural areas
(28.8%).
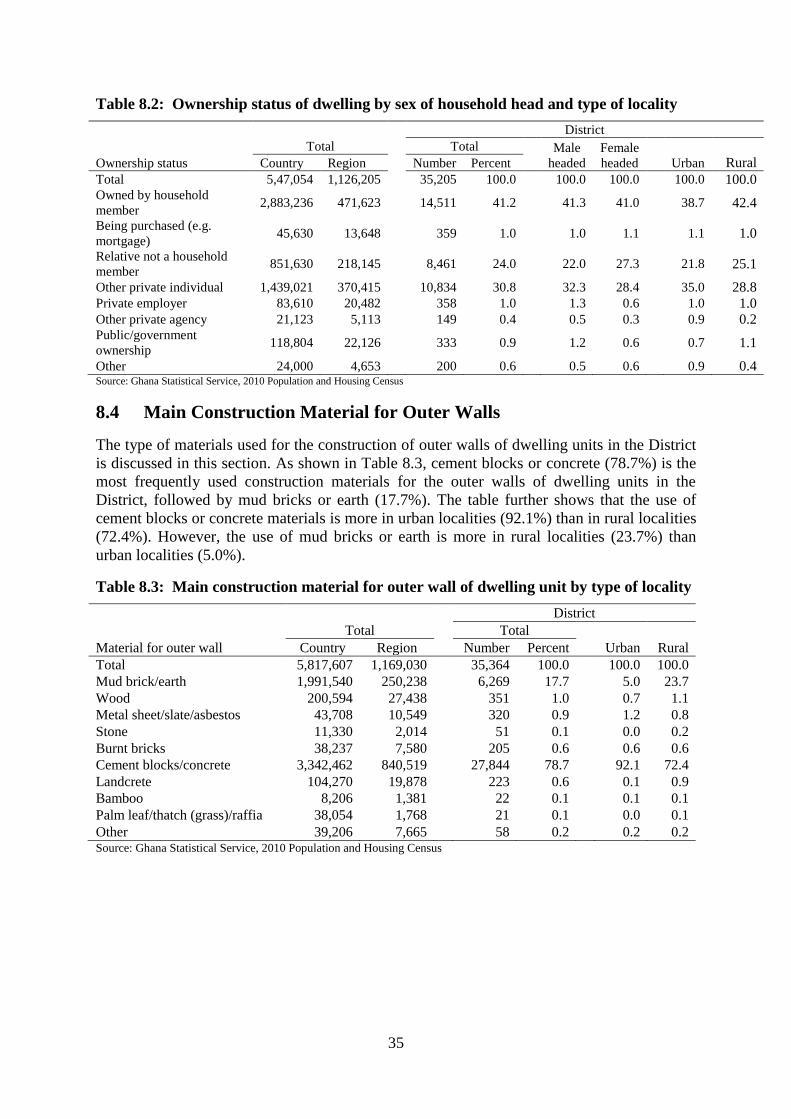
35
Table 8.2: Ownership status of dwelling by sex of household head and type of locality
Ownership status
Total
District
Total
Male
headed
Female
headed Urban Rural Country Region
Number Percent
Total 5,47,054 1,126,205
35,205 100.0
100.0 100.0
100.0 100.0
Owned by household
member 2,883,236 471,623
14,511 41.2
41.3 41.0
38.7 42.4
Being purchased (e.g.
mortgage) 45,630 13,648
359 1.0
1.0 1.1
1.1 1.0
Relative not a household
member 851,630 218,145
8,461 24.0
22.0 27.3
21.8 25.1
Other private individual 1,439,021 370,415
10,834 30.8
32.3 28.4
35.0 28.8
Private employer 83,610 20,482
358 1.0
1.3 0.6
1.0 1.0
Other private agency 21,123 5,113
149 0.4
0.5 0.3
0.9 0.2
Public/government
ownership 118,804 22,126
333 0.9
1.2 0.6
0.7 1.1
Other 24,000 4,653 200 0.6 0.5 0.6 0.9 0.4 Source: Ghana Statistical Service, 2010 Population and Housing Census
8.4 Main Construction Material for Outer Walls
The type of materials used for the construction of outer walls of dwelling units in the District
is discussed in this section. As shown in Table 8.3, cement blocks or concrete (78.7%) is the
most frequently used construction materials for the outer walls of dwelling units in the
District, followed by mud bricks or earth (17.7%). The table further shows that the use of
cement blocks or concrete materials is more in urban localities (92.1%) than in rural localities
(72.4%). However, the use of mud bricks or earth is more in rural localities (23.7%) than
urban localities (5.0%).
Table 8.3: Main construction material for outer wall of dwelling unit by type of locality
Material for outer wall
Total
District
Total
Urban Rural Country Region Number Percent
Total 5,817,607 1,169,030
35,364 100.0
100.0 100.0
Mud brick/earth 1,991,540 250,238
6,269 17.7
5.0 23.7
Wood 200,594 27,438
351 1.0
0.7 1.1
Metal sheet/slate/asbestos 43,708 10,549
320 0.9
1.2 0.8
Stone 11,330 2,014
51 0.1
0.0 0.2
Burnt bricks 38,237 7,580
205 0.6
0.6 0.6
Cement blocks/concrete 3,342,462 840,519
27,844 78.7
92.1 72.4
Landcrete 104,270 19,878
223 0.6
0.1 0.9
Bamboo 8,206 1,381
22 0.1
0.1 0.1
Palm leaf/thatch (grass)/raffia 38,054 1,768
21 0.1
0.0 0.1
Other 39,206 7,665 58 0.2 0.2 0.2 Source: Ghana Statistical Service, 2010 Population and Housing Census
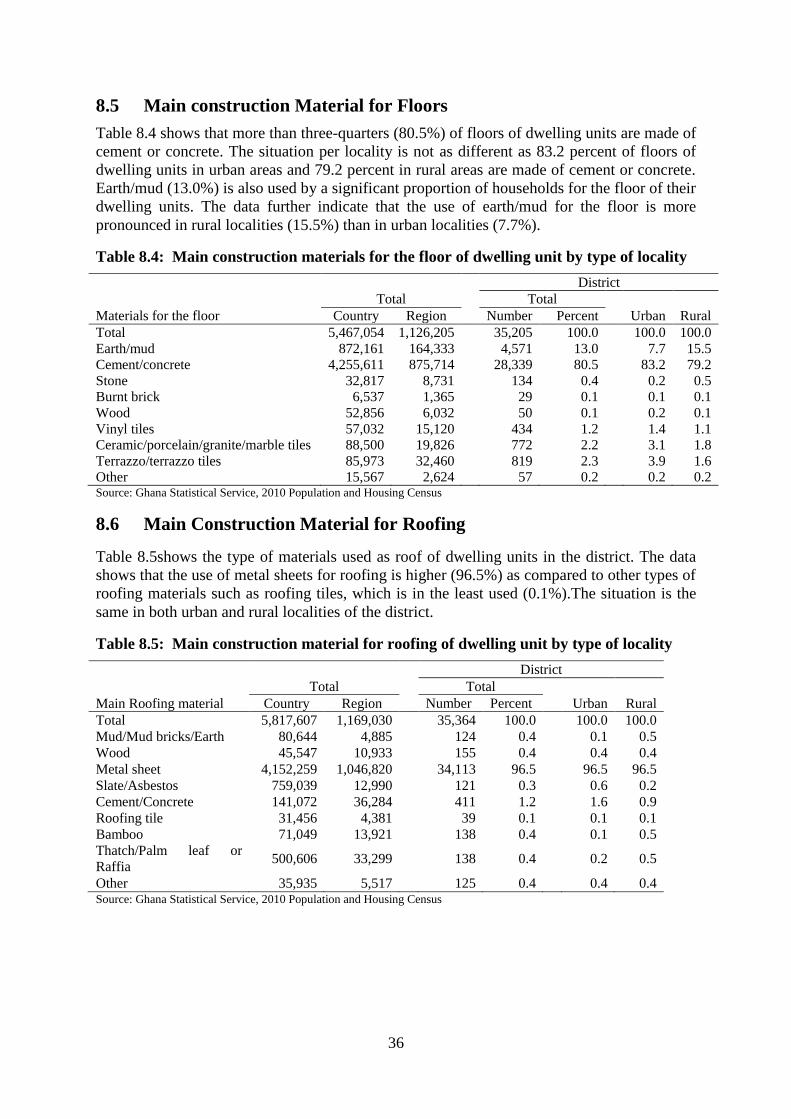
36
8.5 Main construction Material for Floors
Table 8.4 shows that more than three-quarters (80.5%) of floors of dwelling units are made of
cement or concrete. The situation per locality is not as different as 83.2 percent of floors of
dwelling units in urban areas and 79.2 percent in rural areas are made of cement or concrete.
Earth/mud (13.0%) is also used by a significant proportion of households for the floor of their
dwelling units. The data further indicate that the use of earth/mud for the floor is more
pronounced in rural localities (15.5%) than in urban localities (7.7%).
Table 8.4: Main construction materials for the floor of dwelling unit by type of locality
Materials for the floor
Total
District
Total
Urban Rural Country Region Number Percent
Total 5,467,054 1,126,205
35,205 100.0
100.0 100.0
Earth/mud 872,161 164,333
4,571 13.0
7.7 15.5
Cement/concrete 4,255,611 875,714
28,339 80.5
83.2 79.2
Stone 32,817 8,731
134 0.4
0.2 0.5
Burnt brick 6,537 1,365
29 0.1
0.1 0.1
Wood 52,856 6,032
50 0.1
0.2 0.1
Vinyl tiles 57,032 15,120
434 1.2
1.4 1.1
Ceramic/porcelain/granite/marble tiles 88,500 19,826
772 2.2
3.1 1.8
Terrazzo/terrazzo tiles 85,973 32,460
819 2.3
3.9 1.6
Other 15,567 2,624 57 0.2 0.2 0.2 Source: Ghana Statistical Service, 2010 Population and Housing Census
8.6 Main Construction Material for Roofing
Table 8.5shows the type of materials used as roof of dwelling units in the district. The data
shows that the use of metal sheets for roofing is higher (96.5%) as compared to other types of
roofing materials such as roofing tiles, which is in the least used (0.1%).The situation is the
same in both urban and rural localities of the district.
Table 8.5: Main construction material for roofing of dwelling unit by type of locality
Main Roofing material
Total
District
Total
Urban Rural Country Region Number Percent
Total 5,817,607 1,169,030
35,364 100.0
100.0 100.0
Mud/Mud bricks/Earth 80,644 4,885
124 0.4
0.1 0.5
Wood 45,547 10,933
155 0.4
0.4 0.4
Metal sheet 4,152,259 1,046,820
34,113 96.5
96.5 96.5
Slate/Asbestos 759,039 12,990
121 0.3
0.6 0.2
Cement/Concrete 141,072 36,284
411 1.2
1.6 0.9
Roofing tile 31,456 4,381
39 0.1
0.1 0.1
Bamboo 71,049 13,921
138 0.4
0.1 0.5
Thatch/Palm leaf or
Raffia 500,606 33,299
138 0.4
0.2 0.5
Other 35,935 5,517 125 0.4 0.4 0.4 Source: Ghana Statistical Service, 2010 Population and Housing Census
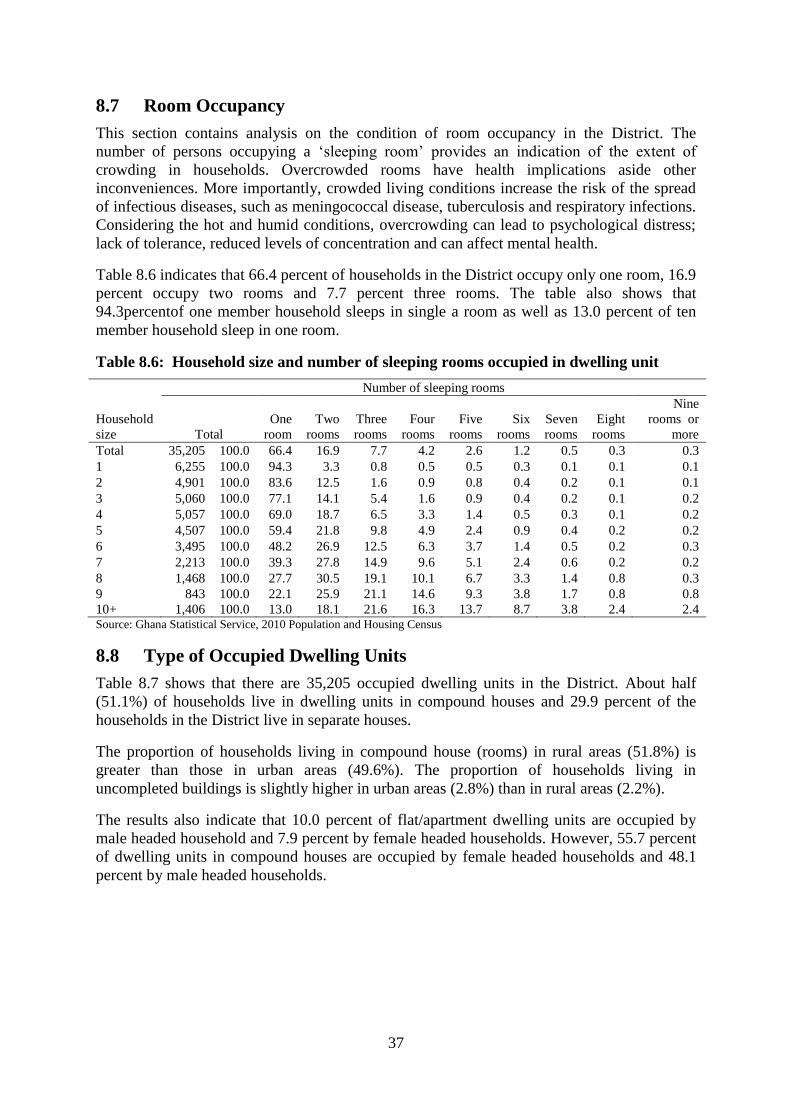
37
8.7 Room Occupancy
This section contains analysis on the condition of room occupancy in the District. The
number of persons occupying a ‘sleeping room’ provides an indication of the extent of
crowding in households. Overcrowded rooms have health implications aside other
inconveniences. More importantly, crowded living conditions increase the risk of the spread
of infectious diseases, such as meningococcal disease, tuberculosis and respiratory infections.
Considering the hot and humid conditions, overcrowding can lead to psychological distress;
lack of tolerance, reduced levels of concentration and can affect mental health.
Table 8.6 indicates that 66.4 percent of households in the District occupy only one room, 16.9
percent occupy two rooms and 7.7 percent three rooms. The table also shows that
94.3percentof one member household sleeps in single a room as well as 13.0 percent of ten
member household sleep in one room.
Table 8.6: Household size and number of sleeping rooms occupied in dwelling unit
Household
size
Number of sleeping rooms
Total
One
room
Two
rooms
Three
rooms
Four
rooms
Five
rooms
Six
rooms
Seven
rooms
Eight
rooms
Nine
rooms or
more
Total 35,205 100.0 66.4 16.9 7.7 4.2 2.6 1.2 0.5 0.3 0.3
1 6,255 100.0 94.3 3.3 0.8 0.5 0.5 0.3 0.1 0.1 0.1
2 4,901 100.0 83.6 12.5 1.6 0.9 0.8 0.4 0.2 0.1 0.1
3 5,060 100.0 77.1 14.1 5.4 1.6 0.9 0.4 0.2 0.1 0.2
4 5,057 100.0 69.0 18.7 6.5 3.3 1.4 0.5 0.3 0.1 0.2
5 4,507 100.0 59.4 21.8 9.8 4.9 2.4 0.9 0.4 0.2 0.2
6 3,495 100.0 48.2 26.9 12.5 6.3 3.7 1.4 0.5 0.2 0.3
7 2,213 100.0 39.3 27.8 14.9 9.6 5.1 2.4 0.6 0.2 0.2
8 1,468 100.0 27.7 30.5 19.1 10.1 6.7 3.3 1.4 0.8 0.3
9 843 100.0 22.1 25.9 21.1 14.6 9.3 3.8 1.7 0.8 0.8
10+ 1,406 100.0 13.0 18.1 21.6 16.3 13.7 8.7 3.8 2.4 2.4 Source: Ghana Statistical Service, 2010 Population and Housing Census
8.8 Type of Occupied Dwelling Units
Table 8.7 shows that there are 35,205 occupied dwelling units in the District. About half
(51.1%) of households live in dwelling units in compound houses and 29.9 percent of the
households in the District live in separate houses.
The proportion of households living in compound house (rooms) in rural areas (51.8%) is
greater than those in urban areas (49.6%). The proportion of households living in
uncompleted buildings is slightly higher in urban areas (2.8%) than in rural areas (2.2%).
The results also indicate that 10.0 percent of flat/apartment dwelling units are occupied by
male headed household and 7.9 percent by female headed households. However, 55.7 percent
of dwelling units in compound houses are occupied by female headed households and 48.1
percent by male headed households.
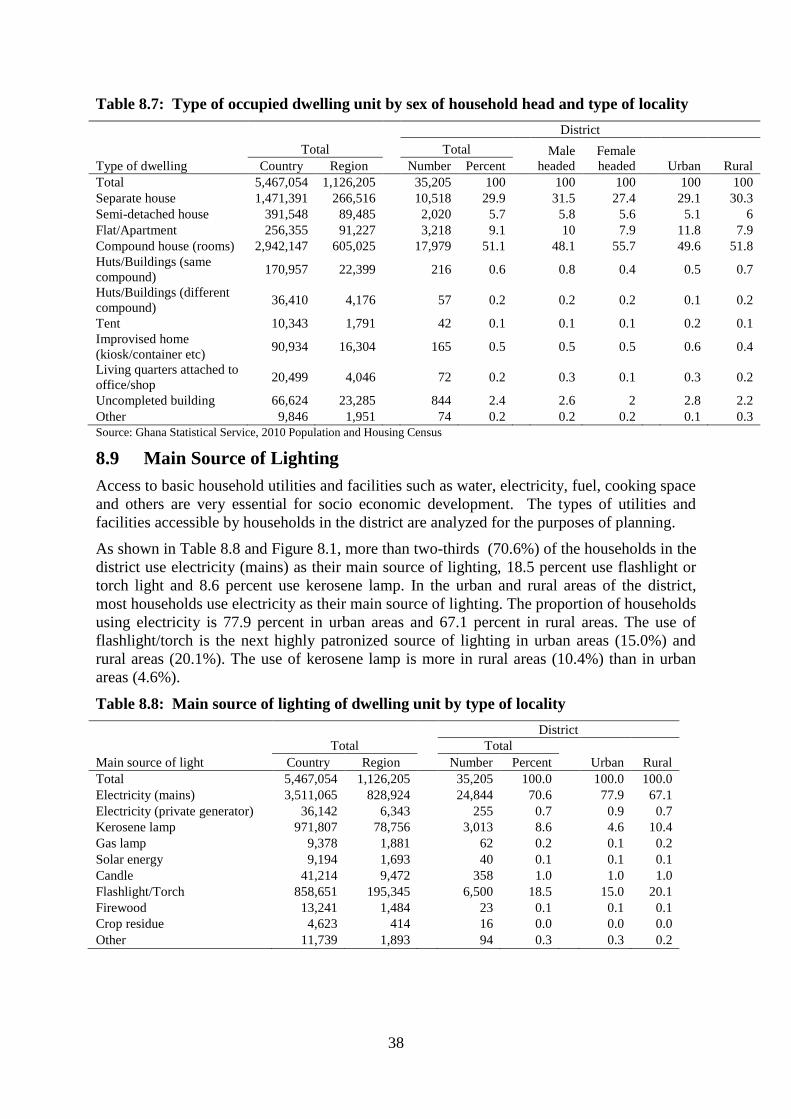
38
Table 8.7: Type of occupied dwelling unit by sex of household head and type of locality
Type of dwelling
Total
District
Total
Male
headed
Female
headed Urban Rural Country Region Number Percent
Total 5,467,054 1,126,205
35,205 100
100 100
100 100
Separate house 1,471,391 266,516
10,518 29.9
31.5 27.4
29.1 30.3
Semi-detached house 391,548 89,485
2,020 5.7
5.8 5.6
5.1 6
Flat/Apartment 256,355 91,227
3,218 9.1
10 7.9
11.8 7.9
Compound house (rooms) 2,942,147 605,025
17,979 51.1
48.1 55.7
49.6 51.8
Huts/Buildings (same
compound) 170,957 22,399
216 0.6
0.8 0.4
0.5 0.7
Huts/Buildings (different
compound) 36,410 4,176
57 0.2
0.2 0.2
0.1 0.2
Tent 10,343 1,791
42 0.1
0.1 0.1
0.2 0.1
Improvised home
(kiosk/container etc) 90,934 16,304
165 0.5
0.5 0.5
0.6 0.4
Living quarters attached to
office/shop 20,499 4,046
72 0.2
0.3 0.1
0.3 0.2
Uncompleted building 66,624 23,285
844 2.4
2.6 2
2.8 2.2
Other 9,846 1,951 74 0.2 0.2 0.2 0.1 0.3
Source: Ghana Statistical Service, 2010 Population and Housing Census
8.9 Main Source of Lighting
Access to basic household utilities and facilities such as water, electricity, fuel, cooking space
and others are very essential for socio economic development. The types of utilities and
facilities accessible by households in the district are analyzed for the purposes of planning.
As shown in Table 8.8 and Figure 8.1, more than two-thirds (70.6%) of the households in the
district use electricity (mains) as their main source of lighting, 18.5 percent use flashlight or
torch light and 8.6 percent use kerosene lamp. In the urban and rural areas of the district,
most households use electricity as their main source of lighting. The proportion of households
using electricity is 77.9 percent in urban areas and 67.1 percent in rural areas. The use of
flashlight/torch is the next highly patronized source of lighting in urban areas (15.0%) and
rural areas (20.1%). The use of kerosene lamp is more in rural areas (10.4%) than in urban
areas (4.6%).
Table 8.8: Main source of lighting of dwelling unit by type of locality
Main source of light
Total
District
Total
Urban Rural Country Region Number Percent
Total 5,467,054 1,126,205
35,205 100.0
100.0 100.0
Electricity (mains) 3,511,065 828,924
24,844 70.6
77.9 67.1
Electricity (private generator) 36,142 6,343
255 0.7
0.9 0.7
Kerosene lamp 971,807 78,756
3,013 8.6
4.6 10.4
Gas lamp 9,378 1,881
62 0.2
0.1 0.2
Solar energy 9,194 1,693
40 0.1
0.1 0.1
Candle 41,214 9,472
358 1.0
1.0 1.0
Flashlight/Torch 858,651 195,345
6,500 18.5
15.0 20.1
Firewood 13,241 1,484
23 0.1
0.1 0.1
Crop residue 4,623 414
16 0.0
0.0 0.0
Other 11,739 1,893 94 0.3 0.3 0.2
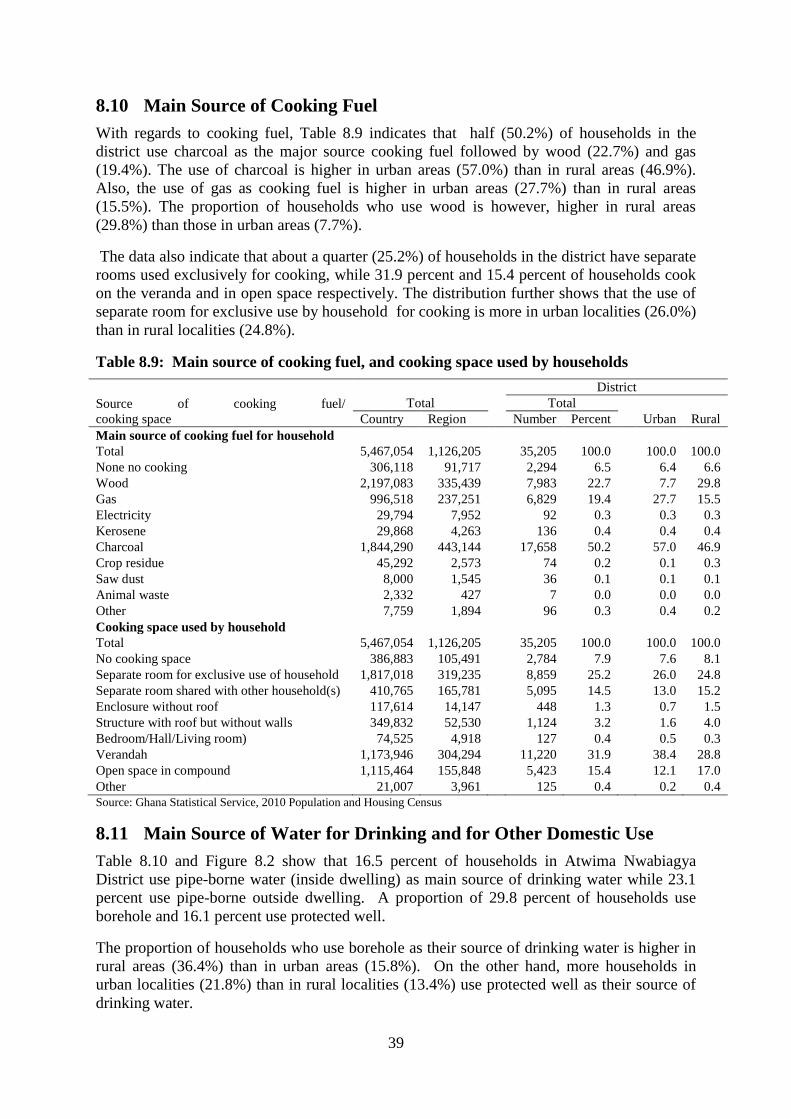
39
8.10 Main Source of Cooking Fuel
With regards to cooking fuel, Table 8.9 indicates that half (50.2%) of households in the
district use charcoal as the major source cooking fuel followed by wood (22.7%) and gas
(19.4%). The use of charcoal is higher in urban areas (57.0%) than in rural areas (46.9%).
Also, the use of gas as cooking fuel is higher in urban areas (27.7%) than in rural areas
(15.5%). The proportion of households who use wood is however, higher in rural areas
(29.8%) than those in urban areas (7.7%).
The data also indicate that about a quarter (25.2%) of households in the district have separate
rooms used exclusively for cooking, while 31.9 percent and 15.4 percent of households cook
on the veranda and in open space respectively. The distribution further shows that the use of
separate room for exclusive use by household for cooking is more in urban localities (26.0%)
than in rural localities (24.8%).
Table 8.9: Main source of cooking fuel, and cooking space used by households
Source of cooking fuel/
cooking space
Total
District
Total
Urban Rural Country Region Number Percent
Main source of cooking fuel for household
Total 5,467,054 1,126,205
35,205 100.0
100.0 100.0
None no cooking 306,118 91,717
2,294 6.5
6.4 6.6
Wood 2,197,083 335,439
7,983 22.7
7.7 29.8
Gas 996,518 237,251
6,829 19.4
27.7 15.5
Electricity 29,794 7,952
92 0.3
0.3 0.3
Kerosene 29,868 4,263
136 0.4
0.4 0.4
Charcoal 1,844,290 443,144
17,658 50.2
57.0 46.9
Crop residue 45,292 2,573
74 0.2
0.1 0.3
Saw dust 8,000 1,545
36 0.1
0.1 0.1
Animal waste 2,332 427
7 0.0
0.0 0.0
Other 7,759 1,894
96 0.3
0.4 0.2
Cooking space used by household
Total 5,467,054 1,126,205
35,205 100.0
100.0 100.0
No cooking space 386,883 105,491
2,784 7.9
7.6 8.1
Separate room for exclusive use of household 1,817,018 319,235
8,859 25.2
26.0 24.8
Separate room shared with other household(s) 410,765 165,781
5,095 14.5
13.0 15.2
Enclosure without roof 117,614 14,147
448 1.3
0.7 1.5
Structure with roof but without walls 349,832 52,530
1,124 3.2
1.6 4.0
Bedroom/Hall/Living room) 74,525 4,918
127 0.4
0.5 0.3
Verandah 1,173,946 304,294
11,220 31.9
38.4 28.8
Open space in compound 1,115,464 155,848
5,423 15.4
12.1 17.0
Other 21,007 3,961 125 0.4 0.2 0.4
Source: Ghana Statistical Service, 2010 Population and Housing Census
8.11 Main Source of Water for Drinking and for Other Domestic Use
Table 8.10 and Figure 8.2 show that 16.5 percent of households in Atwima Nwabiagya
District use pipe-borne water (inside dwelling) as main source of drinking water while 23.1
percent use pipe-borne outside dwelling. A proportion of 29.8 percent of households use
borehole and 16.1 percent use protected well.
The proportion of households who use borehole as their source of drinking water is higher in
rural areas (36.4%) than in urban areas (15.8%). On the other hand, more households in
urban localities (21.8%) than in rural localities (13.4%) use protected well as their source of
drinking water.
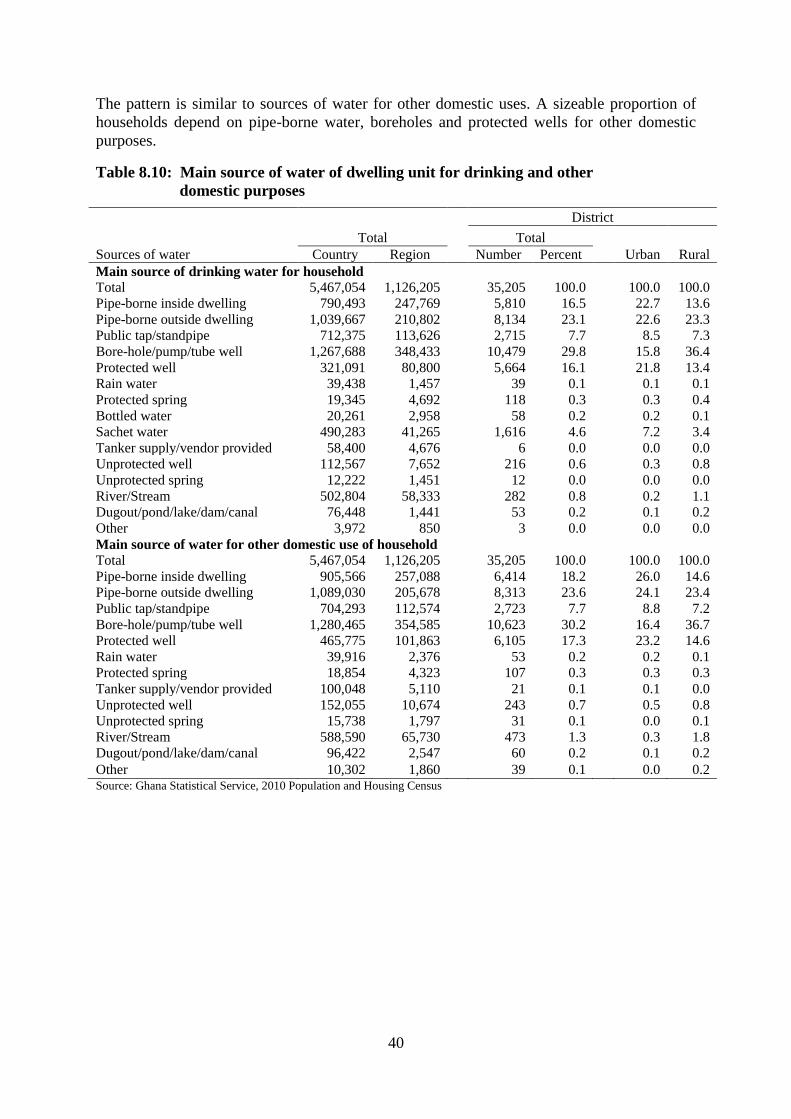
40
The pattern is similar to sources of water for other domestic uses. A sizeable proportion of
households depend on pipe-borne water, boreholes and protected wells for other domestic
purposes.
Table 8.10: Main source of water of dwelling unit for drinking and other
domestic purposes
Sources of water
Total
District
Total
Urban Rural Country Region Number Percent
Main source of drinking water for household
Total 5,467,054 1,126,205
35,205 100.0
100.0 100.0
Pipe-borne inside dwelling 790,493 247,769
5,810 16.5
22.7 13.6
Pipe-borne outside dwelling 1,039,667 210,802
8,134 23.1
22.6 23.3
Public tap/standpipe 712,375 113,626
2,715 7.7
8.5 7.3
Bore-hole/pump/tube well 1,267,688 348,433
10,479 29.8
15.8 36.4
Protected well 321,091 80,800
5,664 16.1
21.8 13.4
Rain water 39,438 1,457
39 0.1
0.1 0.1
Protected spring 19,345 4,692
118 0.3
0.3 0.4
Bottled water 20,261 2,958
58 0.2
0.2 0.1
Sachet water 490,283 41,265
1,616 4.6
7.2 3.4
Tanker supply/vendor provided 58,400 4,676
6 0.0
0.0 0.0
Unprotected well 112,567 7,652
216 0.6
0.3 0.8
Unprotected spring 12,222 1,451
12 0.0
0.0 0.0
River/Stream 502,804 58,333
282 0.8
0.2 1.1
Dugout/pond/lake/dam/canal 76,448 1,441
53 0.2
0.1 0.2
Other 3,972 850
3 0.0
0.0 0.0
Main source of water for other domestic use of household
Total 5,467,054 1,126,205
35,205 100.0
100.0 100.0
Pipe-borne inside dwelling 905,566 257,088
6,414 18.2
26.0 14.6
Pipe-borne outside dwelling 1,089,030 205,678
8,313 23.6
24.1 23.4
Public tap/standpipe 704,293 112,574
2,723 7.7
8.8 7.2
Bore-hole/pump/tube well 1,280,465 354,585
10,623 30.2
16.4 36.7
Protected well 465,775 101,863
6,105 17.3
23.2 14.6
Rain water 39,916 2,376
53 0.2
0.2 0.1
Protected spring 18,854 4,323
107 0.3
0.3 0.3
Tanker supply/vendor provided 100,048 5,110
21 0.1
0.1 0.0
Unprotected well 152,055 10,674
243 0.7
0.5 0.8
Unprotected spring 15,738 1,797
31 0.1
0.0 0.1
River/Stream 588,590 65,730
473 1.3
0.3 1.8
Dugout/pond/lake/dam/canal 96,422 2,547
60 0.2
0.1 0.2
Other 10,302 1,860 39 0.1 0.0 0.2 Source: Ghana Statistical Service, 2010 Population and Housing Census
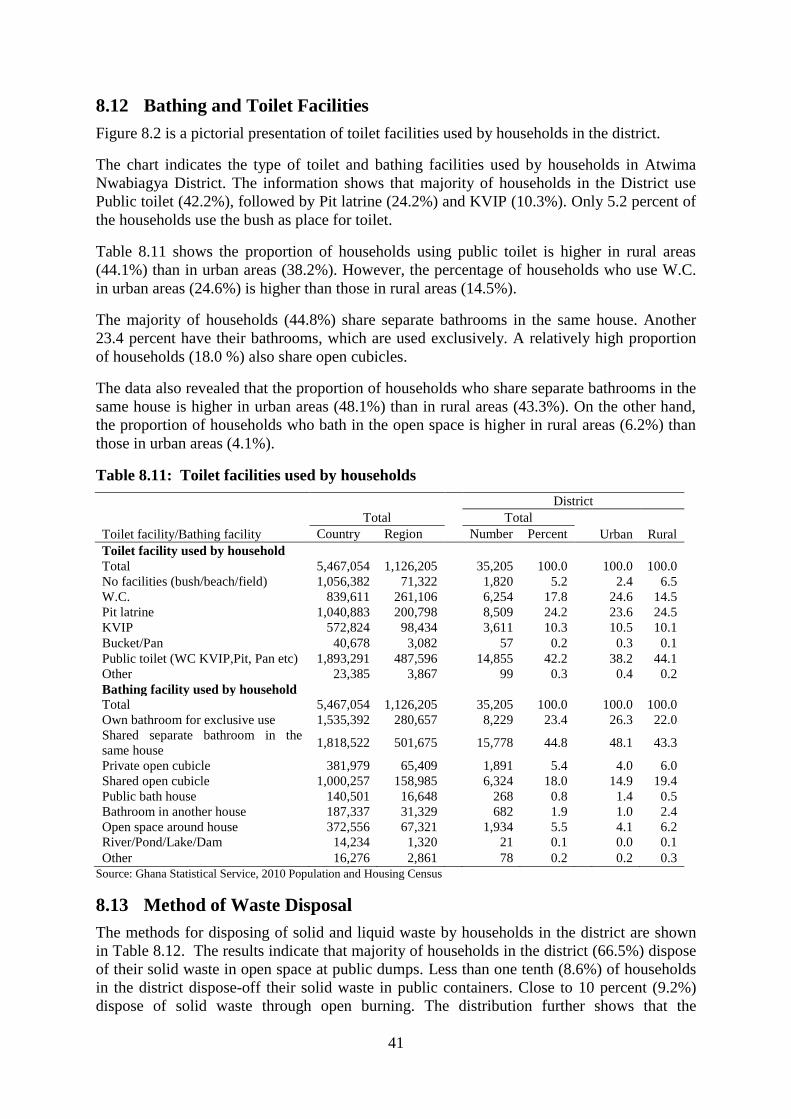
41
8.12 Bathing and Toilet Facilities
Figure 8.2 is a pictorial presentation of toilet facilities used by households in the district.
The chart indicates the type of toilet and bathing facilities used by households in Atwima
Nwabiagya District. The information shows that majority of households in the District use
Public toilet (42.2%), followed by Pit latrine (24.2%) and KVIP (10.3%). Only 5.2 percent of
the households use the bush as place for toilet.
Table 8.11 shows the proportion of households using public toilet is higher in rural areas
(44.1%) than in urban areas (38.2%). However, the percentage of households who use W.C.
in urban areas (24.6%) is higher than those in rural areas (14.5%).
The majority of households (44.8%) share separate bathrooms in the same house. Another
23.4 percent have their bathrooms, which are used exclusively. A relatively high proportion
of households (18.0 %) also share open cubicles.
The data also revealed that the proportion of households who share separate bathrooms in the
same house is higher in urban areas (48.1%) than in rural areas (43.3%). On the other hand,
the proportion of households who bath in the open space is higher in rural areas (6.2%) than
those in urban areas (4.1%).
Table 8.11: Toilet facilities used by households
Toilet facility/Bathing facility
Total
District
Total
Urban Rural Country Region Number Percent
Toilet facility used by household
Total 5,467,054 1,126,205
35,205 100.0
100.0 100.0
No facilities (bush/beach/field) 1,056,382 71,322
1,820 5.2
2.4 6.5
W.C. 839,611 261,106
6,254 17.8
24.6 14.5
Pit latrine 1,040,883 200,798
8,509 24.2
23.6 24.5
KVIP 572,824 98,434
3,611 10.3
10.5 10.1
Bucket/Pan 40,678 3,082
57 0.2
0.3 0.1
Public toilet (WC KVIP,Pit, Pan etc) 1,893,291 487,596
14,855 42.2
38.2 44.1
Other 23,385 3,867
99 0.3
0.4 0.2
Bathing facility used by household
Total 5,467,054 1,126,205
35,205 100.0
100.0 100.0
Own bathroom for exclusive use 1,535,392 280,657
8,229 23.4
26.3 22.0
Shared separate bathroom in the
same house 1,818,522 501,675
15,778 44.8
48.1 43.3
Private open cubicle 381,979 65,409
1,891 5.4
4.0 6.0
Shared open cubicle 1,000,257 158,985
6,324 18.0
14.9 19.4
Public bath house 140,501 16,648
268 0.8
1.4 0.5
Bathroom in another house 187,337 31,329
682 1.9
1.0 2.4
Open space around house 372,556 67,321
1,934 5.5
4.1 6.2
River/Pond/Lake/Dam 14,234 1,320
21 0.1
0.0 0.1
Other 16,276 2,861 78 0.2 0.2 0.3
Source: Ghana Statistical Service, 2010 Population and Housing Census
8.13 Method of Waste Disposal
The methods for disposing of solid and liquid waste by households in the district are shown
in Table 8.12. The results indicate that majority of households in the district (66.5%) dispose
of their solid waste in open space at public dumps. Less than one tenth (8.6%) of households
in the district dispose-off their solid waste in public containers. Close to 10 percent (9.2%)
dispose of solid waste through open burning. The distribution further shows that the
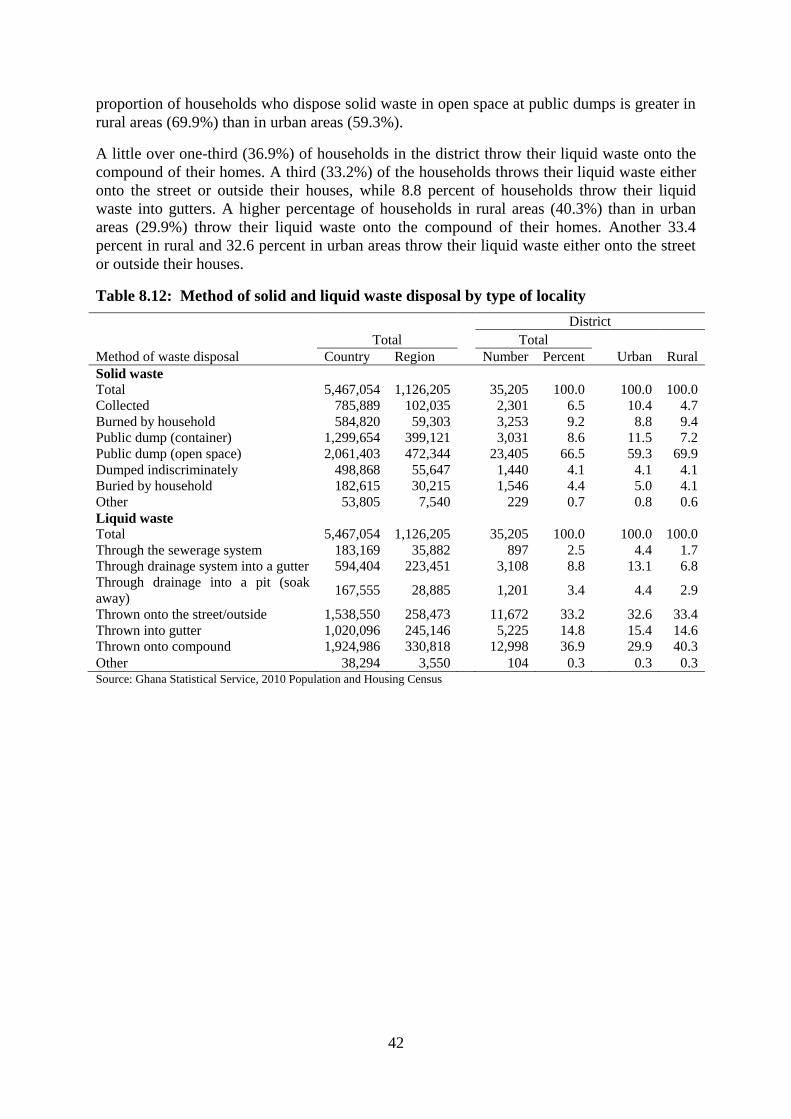
42
proportion of households who dispose solid waste in open space at public dumps is greater in
rural areas (69.9%) than in urban areas (59.3%).
A little over one-third (36.9%) of households in the district throw their liquid waste onto the
compound of their homes. A third (33.2%) of the households throws their liquid waste either
onto the street or outside their houses, while 8.8 percent of households throw their liquid
waste into gutters. A higher percentage of households in rural areas (40.3%) than in urban
areas (29.9%) throw their liquid waste onto the compound of their homes. Another 33.4
percent in rural and 32.6 percent in urban areas throw their liquid waste either onto the street
or outside their houses.
Table 8.12: Method of solid and liquid waste disposal by type of locality
Method of waste disposal
Total
District
Total
Urban Rural Country Region Number Percent
Solid waste
Total 5,467,054 1,126,205
35,205 100.0
100.0 100.0
Collected 785,889 102,035
2,301 6.5
10.4 4.7
Burned by household 584,820 59,303
3,253 9.2
8.8 9.4
Public dump (container) 1,299,654 399,121
3,031 8.6
11.5 7.2
Public dump (open space) 2,061,403 472,344
23,405 66.5
59.3 69.9
Dumped indiscriminately 498,868 55,647
1,440 4.1
4.1 4.1
Buried by household 182,615 30,215
1,546 4.4
5.0 4.1
Other 53,805 7,540
229 0.7
0.8 0.6
Liquid waste
Total 5,467,054 1,126,205
35,205 100.0
100.0 100.0
Through the sewerage system 183,169 35,882
897 2.5
4.4 1.7
Through drainage system into a gutter 594,404 223,451
3,108 8.8
13.1 6.8
Through drainage into a pit (soak
away) 167,555 28,885
1,201 3.4
4.4 2.9
Thrown onto the street/outside 1,538,550 258,473
11,672 33.2
32.6 33.4
Thrown into gutter 1,020,096 245,146
5,225 14.8
15.4 14.6
Thrown onto compound 1,924,986 330,818
12,998 36.9
29.9 40.3
Other 38,294 3,550 104 0.3 0.3 0.3 Source: Ghana Statistical Service, 2010 Population and Housing Census
43
CHAPTER NINE
SUMMARY OF FINDINGS, CONCLUSIONS AND
POLICY IMPLICATIONS
9.1 Introduction
The 2010 Population and Housing Census (PHC), the fifth in the history of modern census-
taking in the country, derived its basic features from the United Nations Principles and
Recommendations (2010) for countries taking part in the 2010 round of population and
housing census and experiences from previous censuses. Following the publication of the
results of the 2000 census, the Ghana Statistical Service produced an analytical report which
provided insight into the information collected and helped to disseminate results from the
census beyond the statistics which were produced.
The compilation of a district analytical report of a population census is being done for the
first time in Ghana. The report is produced with the aim of providing useful information from
the 2010 PHC results about the districts for planners, researchers and policy makers as well
as the general public.
As with previous censuses, the 2010 PHC collected data on basic demographic and socio-
economic characteristics such as, age-sex, relationship to head of household, marital status,
ethnicity, religion, literacy, education, economic characteristics and housing. For the first
time data was collected on Information, Communication, Technology (ICT), disability,
emigration, maternal mortality and agriculture. Although censuses are organized in every ten
years, the results form the basis of wide range activities such as planning, policy-making and
research.
9.2 Summary of Findings
This section summaries the findings from the data relating to the demographics, social
,economic, information technology, disability, agricultural activities and housing conditions
characteristics and their policy implication and interventions for the Atwima Nwabiagya
District.
9.2.1 Population size, composition and distribution
The population of the Atwima Nwabiagya District as recorded in the 2010 PHC is 149,025
with majority (68.5%) of the population living in rural localities. Females constitute more
than half (51.7%) of the population of the district resulting in a sex ratio of 93.3. Further
analysis of the data indicate that the district has a youth population with the population less
than 15 years constituting more than one third (38.8%) of the total population. Due to the
high percentage of the young people in the district, the dependency ratio is 73.8.
9.2.2 Fertility, mortality and migration
The total fertility rate for the District is 3.4 which lower than the national average of 4.4.
Crude death rate (CDR) is 5.89. Out of the total population of the District, 76,245 are
migrants from other regions outside Ashanti and outside Ghana. The difference indicates that
44
the proportion of migrants (51.1%) is slightly higher than the indigenous population (48.9%)
resident in the district as at the time of the 2010 census.
9.2.3 Literacy and education
A high percentage (80.5%) of the population in the District are literate (can read and write in
one or more of the language categories). Among the literate population more than two thirds
(67.4 %) are literate in English and Ghanaian language whiles less than one percent (0.2%)
can read and write in English and French. About 12 percent are literate in only Ghanaian
Language and 16.6 percent in English only.
With respect to current school attendance, more than one third (45.2%) of the population
currently in school are in primary school. Those in primary and JSS/JHS (18.6%) altogether
constitute about two thirds of the population currently in school. For those who have attended
school in the past, 36.7 percent of females and 30.7 percent of males have attained JHS/JSS
education.
9.2.4 Economic characteristics
More than two thirds (68.7%) of the population aged 15 years and older in the District are
68.7 percent of the population 15 years and older are economically active. Of the
economically active population, 92.2 percent are employed out which 94.2 percent actually
worked within the reference period (7days preceding the census night), while 5.7 percent did
not work but had job to go back to (5.5%) or did voluntary work without pay (0.2%). Males
are more likely to be economically active (70.6 %) than males (67.0%). The majority (23.6%)
of the employed population are skilled agricultural, forestry and fishery workers. Persons
engaged in service and sales constitute 28.3 percent of the working population. Craft and
related trade workers form the next highest (18.6%) in terms of occupation.
In relation to the industry of employment of the employed population, the majority (25.1%)
of them are in wholesale and retail trade. This is followed by those in Agriculture forestry
and fishing (24.8%). The majority (60.8%) of the employed population are self-employed
without employees. Females (69%) are more likely to be self-employed without employees
than males (52.3%), while males (29.4%) are more likely to be employees than females
(12.9%).
The overwhelming majority (84.8%) of the employed population work in the private informal
sector. Those working in the public and private formal sectors constitute 7.5 percent and 7.0
percent respectively of the working population. The private sector employs 89.8 percent of
males and 93.7 percent of females.
9.2.5 Disability
About two percent of the populations in the district have some form of disability. There are
more females (29.0%) than males (26.1%) suffering from physical disability. The majority of
PWDs live in rural localities within the district. Visual or sight impairment is the most
common type of disability among PWDs in both urban (30.5%) and rural (34.7%) areas,
followed by physical disability of 28.3 percent in urban areas and 27.3 percent in rural areas.
More than half of PWDS have attained basic level (Primary, JSS/JHS and middle school)
education.
45
9.2.6 Ownership and usage of ICT equipment
Use of mobile phones is common in the District with close to 59 percent of person’s aged 12
years and older using mobile phones. Majority of mobile phone users are males. With
regards to the usage of the Internet, 7.9 percent of the population aged 12 years and older use
internet facilities. As in the case of ownership of mobile phones, the majority of internet users
in the District are males. Close to one tenth of households in the district own desktop or
laptop computer. Male-headed households are more likely to own a computer than female-
headed households.
Agriculture
More than one third (35.6%) of households in the District are engaged in agricultural
activities. In terms of locality of residence, a higher percentage (42.1%) of rural households is
into agriculture than urban (21.7%).
9.2.7 Housing characteristics
The availability and nature of housing stock has implications for the quality of life of the
people (Ghana National Development Commission, 2010; Gordon, Nandy, Pantazis,
Pemberton, and Townsend, 2003).
More than half (51.1%) of households in the District live in compound houses. The majority
(41.2%) of dwelling units are owned by household members, with about one third owned by
other private individual not a household member. The most common material used for outer
walls (78.7%) and floors (80.5%) of dwelling units in the District is cement blocks or
concrete. The use of mud bricks or earth for outer walls is more common in rural localities
(23.7%) than urban (5.0%). The predominant material used for roofing is metal sheet,
representing 96.5 percent of roofs in the District.
More than two thirds (70.6%) of households in the district use electricity (mains) as their
main source of fuel for lighting. However, close to one fifth (18.5%) of the households use
flashlight/torch as their main source of lighting. In the case of cooking fuel, the majority
(50.2%) of households use charcoal. Households using wood as their main source of cooking
fuel account for a little over one fifth (22.7%) of the total number of households in the
District. The use of gas is also popular among households in the District as close to 20
percent of households use gas as their main source of fuel for cooking.
With regards to drinking water for households, the majority (29.8%) of households obtain
their drinking mainly from boreholes. Quite a sizeable proportions also get their drinking
water mainly from pipe-borne outside the dwelling unit (23.1%), pipe-borne inside the
dwelling unit (16.5%) and from protected wells (16.1%). Similar proportions are observed for
water for other domestic purposes.
The majority (42.2%) of households use public toilets as their main toilet facility. The second
most common toilet facility for households in the District is pit latrine. Less than one fifth of
households use W.C. as their main toilet facility.
46
9.3 Policy Implications
The various observed socio-demographic and economic characteristics present challenges as
well as opportunities. The challenges include creating employment for the young and fairly
well educated population and dealing with the low proportion of the population in both urban
and rural areas having access to ICT. The opportunities include taking advantage of the large
proportion of the youthful population that are economically active and engaging them to
produce more goods and services to enhance the development of the district.
Given the relatively high proportion of migrant population in the District as against the
indigenous population, the Assembly need to create and implement a development plan that
will increase the stock of facilities and infrastructure in the District to meet the growing
demand. This implies building more classroom blocks and providing at least Community
Health Planning Services (CHPS) compounds in the rural areas as well as equipping the
health posts in urban areas with adequate logistics.
As a measure to lower infant mortality in the district, there is the need for maternal and health
services including family planning to be strengthened especially in the rural areas where such
cases are high. Again the provision and equipping of the CHPS compounds would help in the
achievement of the Millennium Development goals 4 and 5 which are health indicators on
child and maternal mortality.
The inclusion of disability in the 2010 PHC has provided opportunity to assess the social,
demographic, social and economic characteristics of PWDs. The results should inform the
development authorities to respond to the Disability Act. For instance, the low level of
education among persons with disability would need to be factored into the programme for
achieving MDG 2. These are people who are likely to be left behind in the development
process. In the Ghana Human Development Report (UNDP, Ghana, 2007), for instance,
PWDs were classified under others (with the elderly who had no access to family care and
pension) and those with mental disabilities put under health. The results present a challenge
which would have to be addressed in a more comprehensive manner. It will also be useful for
the module on PWDs to be repeated in subsequent censuses.
The use of ICT for interaction, communication and business has become critical in this
modern age. There should be a conscious effort to promote ICT in the district based on the
information available from the census data. This means connecting all communities in the
district to the national electricity grid, opening more internet cafes and providing training for
people on the use of ICT.
Water and Sanitation policy to regulate littering of the environment is necessary to help
reduce the outbreak of cholera and diarrhea cases in the District. This implies providing
suitable dumpsites in the district and engaging the services of waste collection companies to
carry out daily waste collection and management in all communities.
The results also pose a challenge for the ministry of health to come out with policies and
programmes that could reduce mortality among infants and the youth population in the
District.
9.4 Conclusion
The results of the census and its analyses have provided basic information for assessing
education, health and sanitation components of the Millennium Development Goals in the
District.
47
More than half of the self-employed persons are without employees, implying the dominance
of single person enterprises in the district. A much higher proportion of females (42.8%) than
males (13.2%) are engaged as service and sales workers.
There should be a conscious effort on the part of Government to create an enabling
environment for the smooth development of all sectors of the economy. The results also point
to the need for government to extend adequate assistance to the private sector to sustain their
operations and contribute to the development of the District.
48
REFERENCES
Ghana Statistical Service, 2013 ‘2010 Population and Housing Census: National Analytical
Report’ GSS, May 2013.
Ghana Statistical Service 2013, Greater Accra Regional Census Report
Oppong Aboagye,E, 2010, Understanding Population Revised Edition.
UNDP, Ghana, 2007, Human Development Report
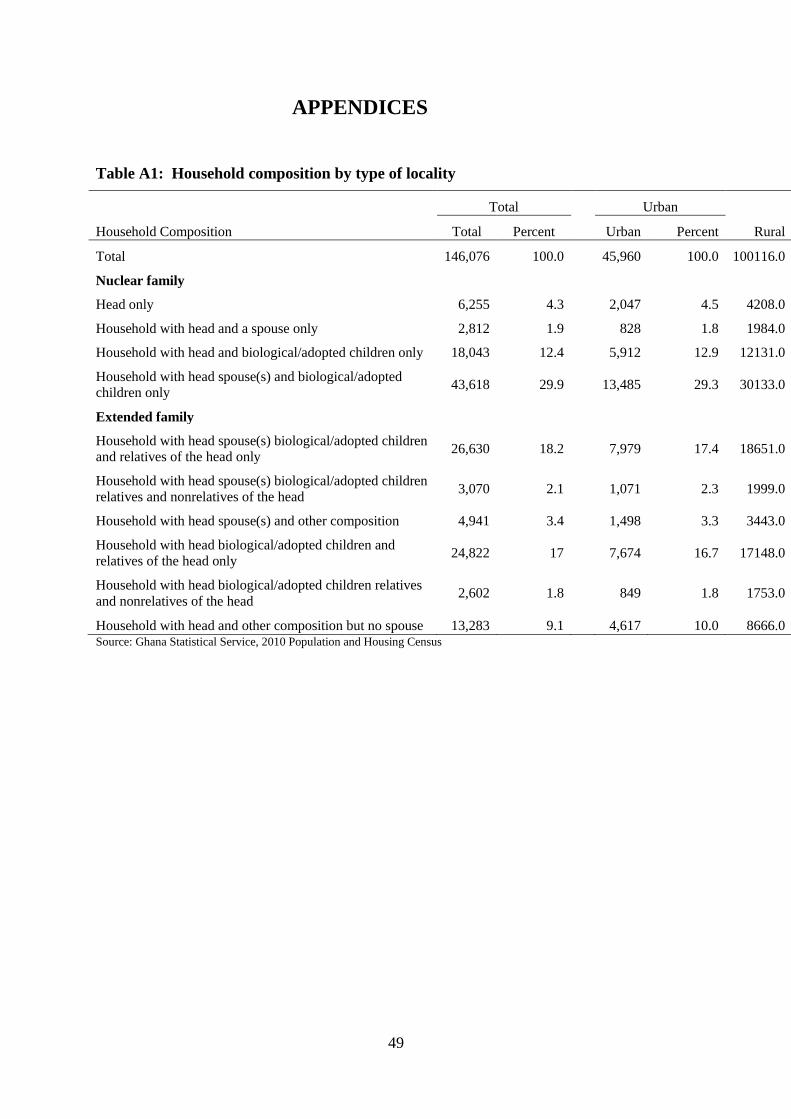
49
APPENDICES
Table A1: Household composition by type of locality
Household Composition
Total Urban
Rural Percent Total Percent Urban Percent
Total 146,076 100.0
45,960 100.0 100116.0 100.0
Nuclear family
Head only 6,255 4.3
2,047 4.5 4208.0 4.2
Household with head and a spouse only 2,812 1.9
828 1.8 1984.0 2.0
Household with head and biological/adopted children only 18,043 12.4
5,912 12.9 12131.0 12.1
Household with head spouse(s) and biological/adopted
children only 43,618 29.9
13,485 29.3 30133.0 30.1
Extended family
Household with head spouse(s) biological/adopted children
and relatives of the head only 26,630 18.2
7,979 17.4 18651.0 18.6
Household with head spouse(s) biological/adopted children
relatives and nonrelatives of the head 3,070 2.1
1,071 2.3 1999.0 2.0
Household with head spouse(s) and other composition 4,941 3.4
1,498 3.3 3443.0 3.4
Household with head biological/adopted children and
relatives of the head only 24,822 17
7,674 16.7 17148.0 17.1
Household with head biological/adopted children relatives
and nonrelatives of the head 2,602 1.8
849 1.8 1753.0 1.8
Household with head and other composition but no spouse 13,283 9.1 4,617 10.0 8666.0 8.7 Source: Ghana Statistical Service, 2010 Population and Housing Census
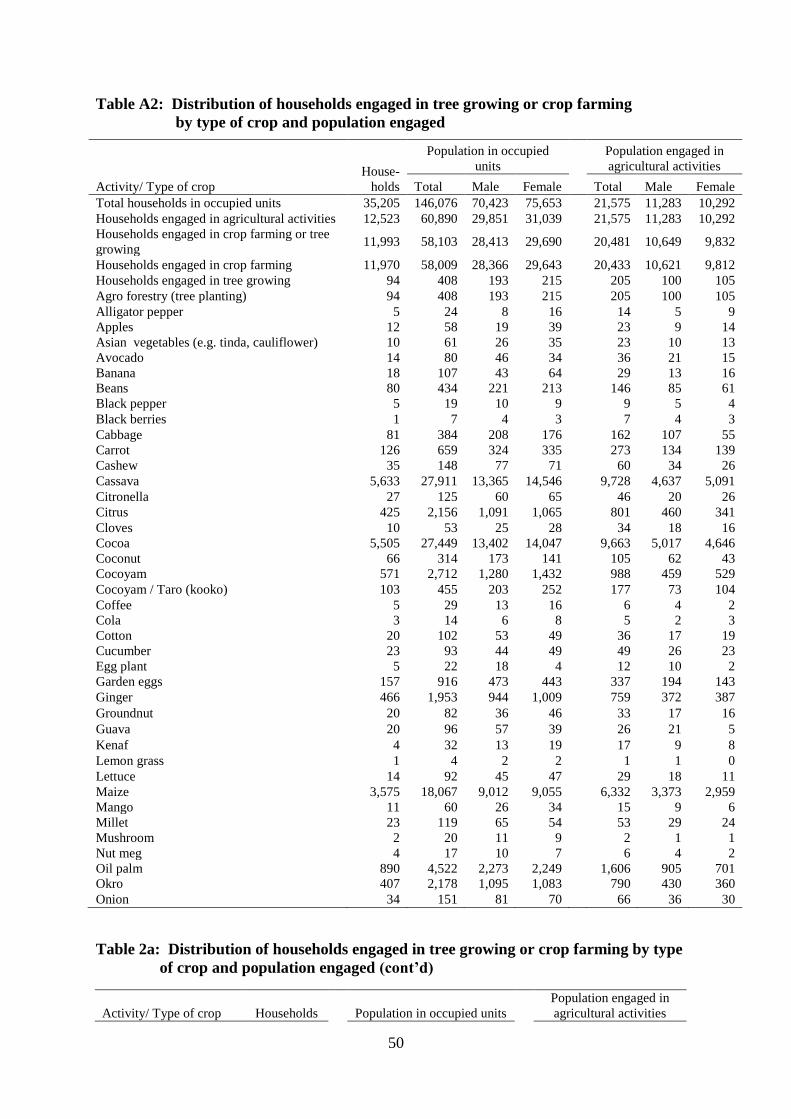
50
Table A2: Distribution of households engaged in tree growing or crop farming
by type of crop and population engaged
Activity/ Type of crop
House-
holds
Population in occupied
units Population engaged in
agricultural activities
Total Male Female Total Male Female
Total households in occupied units 35,205 146,076 70,423 75,653
21,575 11,283 10,292
Households engaged in agricultural activities 12,523 60,890 29,851 31,039
21,575 11,283 10,292
Households engaged in crop farming or tree
growing 11,993 58,103 28,413 29,690
20,481 10,649 9,832
Households engaged in crop farming 11,970 58,009 28,366 29,643
20,433 10,621 9,812
Households engaged in tree growing 94 408 193 215
205 100 105
Agro forestry (tree planting) 94 408 193 215
205 100 105
Alligator pepper 5 24 8 16
14 5 9
Apples 12 58 19 39
23 9 14
Asian vegetables (e.g. tinda, cauliflower) 10 61 26 35
23 10 13
Avocado 14 80 46 34
36 21 15
Banana 18 107 43 64
29 13 16
Beans 80 434 221 213
146 85 61
Black pepper 5 19 10 9
9 5 4
Black berries 1 7 4 3
7 4 3
Cabbage 81 384 208 176
162 107 55
Carrot 126 659 324 335
273 134 139
Cashew 35 148 77 71
60 34 26
Cassava 5,633 27,911 13,365 14,546
9,728 4,637 5,091
Citronella 27 125 60 65
46 20 26
Citrus 425 2,156 1,091 1,065
801 460 341
Cloves 10 53 25 28
34 18 16
Cocoa 5,505 27,449 13,402 14,047
9,663 5,017 4,646
Coconut 66 314 173 141
105 62 43
Cocoyam 571 2,712 1,280 1,432
988 459 529
Cocoyam / Taro (kooko) 103 455 203 252
177 73 104
Coffee 5 29 13 16
6 4 2
Cola 3 14 6 8
5 2 3
Cotton 20 102 53 49
36 17 19
Cucumber 23 93 44 49
49 26 23
Egg plant 5 22 18 4
12 10 2
Garden eggs 157 916 473 443
337 194 143
Ginger 466 1,953 944 1,009
759 372 387
Groundnut 20 82 36 46
33 17 16
Guava 20 96 57 39
26 21 5
Kenaf 4 32 13 19
17 9 8
Lemon grass 1 4 2 2
1 1 0
Lettuce 14 92 45 47
29 18 11
Maize 3,575 18,067 9,012 9,055
6,332 3,373 2,959
Mango 11 60 26 34
15 9 6
Millet 23 119 65 54
53 29 24
Mushroom 2 20 11 9
2 1 1
Nut meg 4 17 10 7
6 4 2
Oil palm 890 4,522 2,273 2,249
1,606 905 701
Okro 407 2,178 1,095 1,083
790 430 360
Onion 34 151 81 70
66 36 30
Table 2a: Distribution of households engaged in tree growing or crop farming by type
of crop and population engaged (cont’d)
Activity/ Type of crop Households
Population in occupied units
Population engaged in
agricultural activities
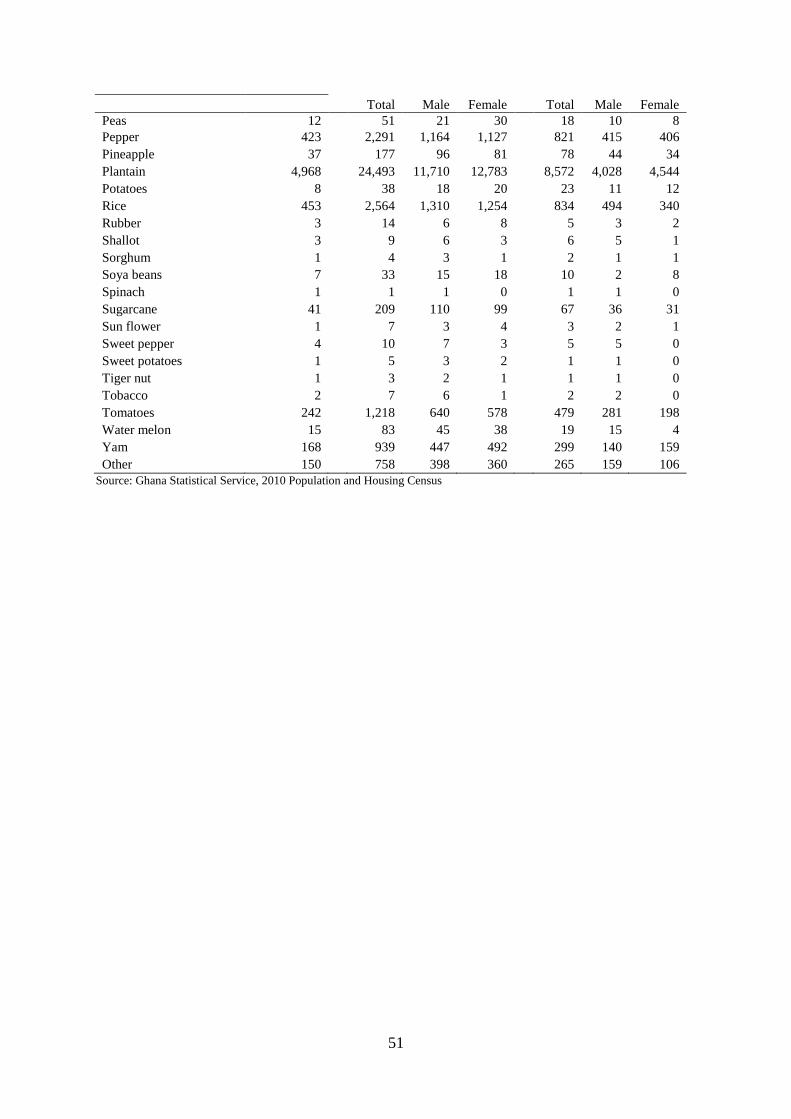
51
Total Male Female Total Male Female
Peas 12
51 21 30
18 10 8
Pepper 423
2,291 1,164 1,127
821 415 406
Pineapple 37
177 96 81
78 44 34
Plantain 4,968
24,493 11,710 12,783
8,572 4,028 4,544
Potatoes 8
38 18 20
23 11 12
Rice 453
2,564 1,310 1,254
834 494 340
Rubber 3
14 6 8
5 3 2
Shallot 3
9 6 3
6 5 1
Sorghum 1
4 3 1
2 1 1
Soya beans 7
33 15 18
10 2 8
Spinach 1
1 1 0
1 1 0
Sugarcane 41
209 110 99
67 36 31
Sun flower 1
7 3 4
3 2 1
Sweet pepper 4
10 7 3
5 5 0
Sweet potatoes 1
5 3 2
1 1 0
Tiger nut 1
3 2 1
1 1 0
Tobacco 2
7 6 1
2 2 0
Tomatoes 242
1,218 640 578
479 281 198
Water melon 15
83 45 38
19 15 4
Yam 168
939 447 492
299 140 159
Other 150 758 398 360 265 159 106
Source: Ghana Statistical Service, 2010 Population and Housing Census
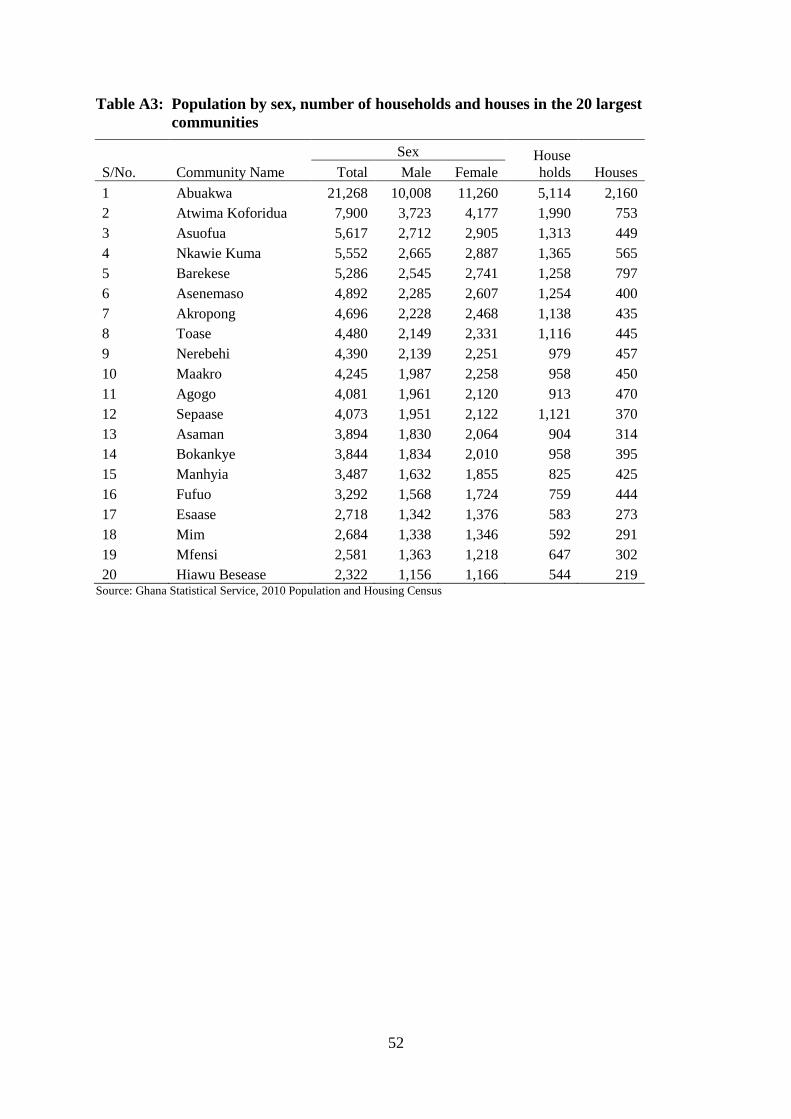
52
Table A3: Population by sex, number of households and houses in the 20 largest
communities
S/No. Community Name
Sex House
holds Houses Total Male Female
1 Abuakwa 21,268 10,008 11,260 5,114 2,160
2 Atwima Koforidua 7,900 3,723 4,177 1,990 753
3 Asuofua 5,617 2,712 2,905 1,313 449
4 Nkawie Kuma 5,552 2,665 2,887 1,365 565
5 Barekese 5,286 2,545 2,741 1,258 797
6 Asenemaso 4,892 2,285 2,607 1,254 400
7 Akropong 4,696 2,228 2,468 1,138 435
8 Toase 4,480 2,149 2,331 1,116 445
9 Nerebehi 4,390 2,139 2,251 979 457
10 Maakro 4,245 1,987 2,258 958 450
11 Agogo 4,081 1,961 2,120 913 470
12 Sepaase 4,073 1,951 2,122 1,121 370
13 Asaman 3,894 1,830 2,064 904 314
14 Bokankye 3,844 1,834 2,010 958 395
15 Manhyia 3,487 1,632 1,855 825 425
16 Fufuo 3,292 1,568 1,724 759 444
17 Esaase 2,718 1,342 1,376 583 273
18 Mim 2,684 1,338 1,346 592 291
19 Mfensi 2,581 1,363 1,218 647 302
20 Hiawu Besease 2,322 1,156 1,166 544 219 Source: Ghana Statistical Service, 2010 Population and Housing Census
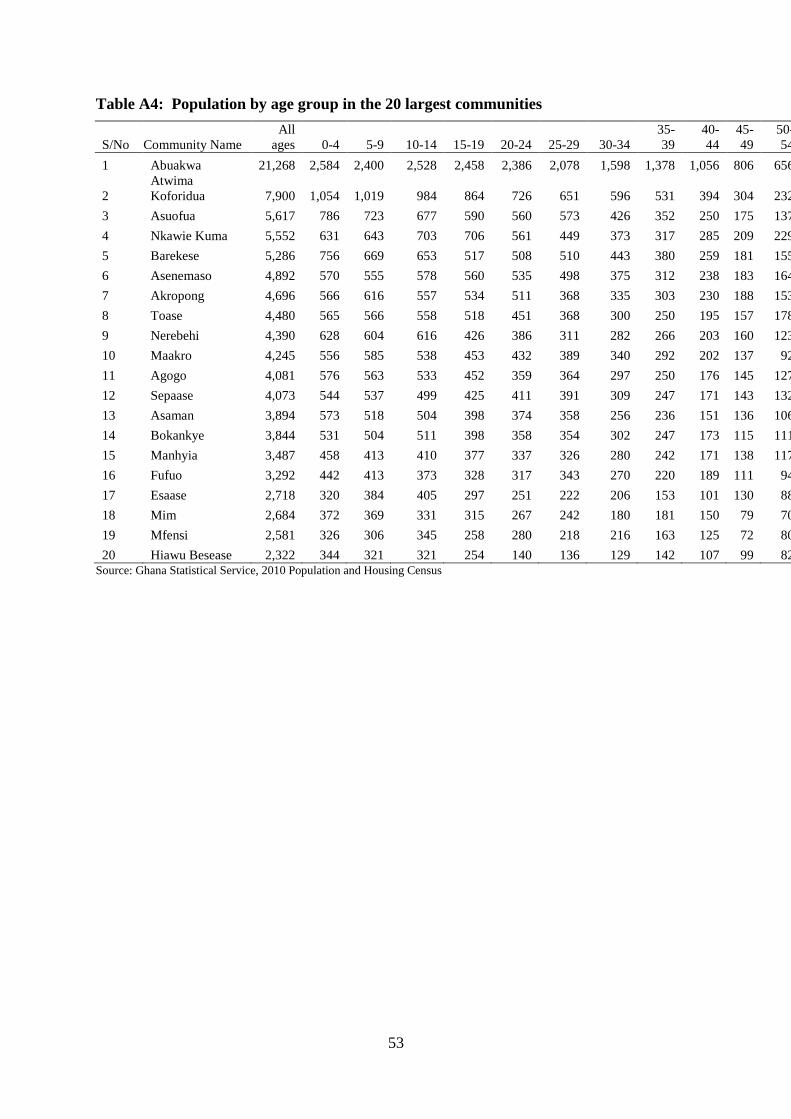
53
Table A4: Population by age group in the 20 largest communities
S/No Community Name
All
ages 0-4 5-9 10-14 15-19 20-24 25-29 30-34
35-
39
40-
44
45-
49
50-
54
55-
59
60-
64
65-
69
70-
74 75+
1 Abuakwa 21,268 2,584 2,400 2,528 2,458 2,386 2,078 1,598 1,378 1,056 806 656 399 297 158 211 275
2
Atwima
Koforidua 7,900 1,054 1,019 984 864 726 651 596 531 394 304 232 135 112 68 105 125
3 Asuofua 5,617 786 723 677 590 560 573 426 352 250 175 137 86 79 51 67 85
4 Nkawie Kuma 5,552 631 643 703 706 561 449 373 317 285 209 229 116 107 60 68 95
5 Barekese 5,286 756 669 653 517 508 510 443 380 259 181 155 84 56 39 26 50
6 Asenemaso 4,892 570 555 578 560 535 498 375 312 238 183 164 84 80 42 49 69
7 Akropong 4,696 566 616 557 534 511 368 335 303 230 188 153 96 85 39 47 68
8 Toase 4,480 565 566 558 518 451 368 300 250 195 157 178 106 81 45 53 89
9 Nerebehi 4,390 628 604 616 426 386 311 282 266 203 160 123 95 74 44 76 96
10 Maakro 4,245 556 585 538 453 432 389 340 292 202 137 92 64 42 36 43 44
11 Agogo 4,081 576 563 533 452 359 364 297 250 176 145 127 62 48 34 38 57
12 Sepaase 4,073 544 537 499 425 411 391 309 247 171 143 132 72 58 37 35 62
13 Asaman 3,894 573 518 504 398 374 358 256 236 151 136 106 83 49 31 60 61
14 Bokankye 3,844 531 504 511 398 358 354 302 247 173 115 111 56 51 33 37 63
15 Manhyia 3,487 458 413 410 377 337 326 280 242 171 138 117 71 52 26 27 42
16 Fufuo 3,292 442 413 373 328 317 343 270 220 189 111 94 50 56 32 28 26
17 Esaase 2,718 320 384 405 297 251 222 206 153 101 130 88 46 38 15 23 39
18 Mim 2,684 372 369 331 315 267 242 180 181 150 79 70 33 22 20 27 26
19 Mfensi 2,581 326 306 345 258 280 218 216 163 125 72 80 46 51 22 29 44
20 Hiawu Besease 2,322 344 321 321 254 140 136 129 142 107 99 82 58 56 24 48 61 Source: Ghana Statistical Service, 2010 Population and Housing Census
54
LIST OF CONTRIBUTORS
Project Secretariat
Dr. Philomena Nyarko, Government Statistician
Mr. Baah Wadieh, Deputy Government Statistician
Mr. David Yenukwa Kombat, Acting Census Coordinator
Mr. Sylvester Gyamfi, DISDAP Project Coordinator
Mrs. Abena A. Osei-Akoto, Data Processing
Mr. Rochester Appiah Kubi Boateng, Data Processing
Mrs. Jacqueline Anum, Data Processing
Mrs. Samilia Mintah, Data Processing
Mr. Yaw Misefa, Data Processing
Mr. Ernest Enyan, Data Processing
Mr. Emmanuel George Ossei, Regional Statistician
Ms. Hanna Frempong Konadu, Formatting/Typesetting
Ms. Aurelia Hotor, Formatting/Typesetting
Writers
Mrs. Ruth Agyeiwaa Badu
Mr. Damain A. Atintono
Consultant
Mr. Edmund Ayesu
Editor/ Reviewers
Prof. N.N.N. Nsowah-Nuamah
Mr. David Yenukwa Kombat
Mr. Vitus Bobruonu