Water quality trends in the Tarkwa gold-mining district, Ghana
14
Water quality trends in the Tarkwa gold-mining district, Ghana Jerry S.Kuma Paul L. Younger Abstract A detailed hydrochemical investigation has been undertaken to establish whether mining has adversely affected streams in the Tarkwa gold- mining district and, if so, to what extent. The results show that streams that pass through mining areas and receive mine water exhibit significant spatial and temporal variations in their major ion hydrochemistry. Water analyses of perceived pristine areas reveal that the study area has undergone silicate weathering, but in mining areas, carbonate weathering was inferred. The inconsistency is attributed to the chemistry of mine waters discharging into receiving streams. This is supported by the average pH values of 6.48 for pristine streams and 7.74 for those affected by mine water. Trace element analysis did not show significant changes from the norm except for discharges from a spoil heap, which exhibited hydrochemical characteristics consistent with acid mine drainage. Saturation indices determined for the water samples reflect the sandstone–quartzite– phyllite lithology and intense weathering regime of the area as a result of the humid tropical climate. Re ´sume ´ Une e ´tude hydrochimique de ´taille ´e a e ´te ´ re ´alise ´e pour savoir si les ope ´rations minie `res avaient pollue ´ les cours d’eau du district minier aurife `re de Tarkwa, et si oui de quelle fac ¸on. Les re ´sultats de l’e ´tude montrent que les cours d’eau qui traversent les secteurs d’exploitation et rec ¸oivent des eaux minie `res pre ´sentent des mine ´ralisations significativement variables le long de leurs parcours ainsi qu’au cours du temps. Les analyses d’eau de zones reconnues comme non affecte ´es par l’exploi- tation minie `re montrent des alte ´rations silicate ´es alors que des alte ´rations carbonate ´es sont reconnues dans les zones minie `res. L’explication de ces re ´sul- tats re ´side dans la composition chimique des eaux minie `res rejoignant les cours d’eau. En effet la valeur moyenne de pH est de 6,5 pour les cours d’eau non affecte ´s par l’exploitation minie `re et de 7,7 pour ceux qui sont affecte ´s par les eaux de mine. L’analyse des e ´le ´ments trace n’a pas montre ´ de variations particulie `res sauf pour des eaux issues d’une verse a ` ste ´riles qui pre ´sentaient des caracte ´ristiques hydro- chimiques te ´moignant du processus de drainage acide minier. Les indices de saturation de ´termine ´s sur les e ´chantillons d’eau rendent compte du cont- exte ge ´ologique ou ` sont pre ´sents des gre `s, des quartzites et des phyllites ainsi que du cadre cli- matique tropical humide. Keywords Ghana Gold mining Trends Water quality Mots cle ´s Mines d’or Qualite ´ des eaux Ghana Introduction Mineral mining has been going on in Ghana since the 15th century, mainly in the south-west (Junner 1935: Fig. 1). Declining mineral production from the 1970s necessitated the Government of Ghana launching a min- erals revitalisation programme in the mid-1980s with the help of the International Monetary Fund (IMF), the World Bank and other commercial banks (Sraku-Lartey 1993). This programme brought more than $3 billion dollars of investment to the mining and allied industries. Rapid growth in mineral production followed and in 1998 alone, Ghana produced more than 2.5 million ounces of gold, representing 90% of its mineral exports and accounting for more than 40% of the country’s foreign exchange earnings. The economy of Tarkwa (south-west Ghana) and its sur- rounding areas has been built on mineral mining for Received: 23 April 2003 / Accepted: 13 January 2004 Published online: 24 April 2004 ª Springer-Verlag 2004 J. S. Kuma Dept. of Geol. Engineering, Western University College, P.O. Box 237, Tarkwa, Ghana E-mail: [email protected] Fax: +44-23336220306 P. L. Younger Dept. of Civil Engineering, University of Newcastle-upon-Tyne, NE1 7RU, UK DOI 10.1007/s10064-004-0227-8 Bull Eng Geol Env (2004) 63:119–132 119
-
Upload
independent -
Category
Documents
-
view
3 -
download
0
Transcript of Water quality trends in the Tarkwa gold-mining district, Ghana

Water quality trends in the Tarkwagold-mining district, GhanaJerry S.Kuma Æ Paul L. Younger
Abstract A detailed hydrochemical investigationhas been undertaken to establish whether mininghas adversely affected streams in the Tarkwa gold-mining district and, if so, to what extent. The resultsshow that streams that pass through mining areasand receive mine water exhibit significant spatialand temporal variations in their major ionhydrochemistry. Water analyses of perceivedpristine areas reveal that the study area hasundergone silicate weathering, but in mining areas,carbonate weathering was inferred. Theinconsistency is attributed to the chemistry ofmine waters discharging into receiving streams.This is supported by the average pH values of 6.48for pristine streams and 7.74 for those affected bymine water. Trace element analysis did not showsignificant changes from the norm except fordischarges from a spoil heap, which exhibitedhydrochemical characteristics consistent with acidmine drainage. Saturation indices determined forthe water samples reflect the sandstone–quartzite–phyllite lithology and intense weathering regime ofthe area as a result of the humid tropical climate.
Resume Une etude hydrochimique detaillee a eterealisee pour savoir si les operations minieresavaient pollue les cours d’eau du district minieraurifere de Tarkwa, et si oui de quelle facon. Lesresultats de l’etude montrent que les cours d’eau quitraversent les secteurs d’exploitation et recoiventdes eaux minieres presentent des mineralisations
significativement variables le long de leurs parcoursainsi qu’au cours du temps. Les analyses d’eau dezones reconnues comme non affectees par l’exploi-tation miniere montrent des alterations silicateesalors que des alterations carbonatees sont reconnuesdans les zones minieres. L’explication de ces resul-tats reside dans la composition chimique des eauxminieres rejoignant les cours d’eau. En effet la valeurmoyenne de pH est de 6,5 pour les cours d’eau nonaffectes par l’exploitation miniere et de 7,7 pourceux qui sont affectes par les eaux de mine. L’analysedes elements trace n’a pas montre de variationsparticulieres sauf pour des eaux issues d’une verse asteriles qui presentaient des caracteristiques hydro-chimiques temoignant du processus de drainageacide minier. Les indices de saturation determinessur les echantillons d’eau rendent compte du cont-exte geologique ou sont presents des gres, desquartzites et des phyllites ainsi que du cadre cli-matique tropical humide.
Keywords Ghana Æ Gold mining Æ Trends ÆWater quality
Mots cles Mines d’or Æ Qualite des eaux Æ Ghana
Introduction
Mineral mining has been going on in Ghana since the15th century, mainly in the south-west (Junner 1935:Fig. 1). Declining mineral production from the 1970snecessitated the Government of Ghana launching a min-erals revitalisation programme in the mid-1980s with thehelp of the International Monetary Fund (IMF), the WorldBank and other commercial banks (Sraku-Lartey 1993).This programme brought more than $3 billion dollars ofinvestment to the mining and allied industries. Rapidgrowth in mineral production followed and in 1998 alone,Ghana produced more than 2.5 million ounces of gold,representing 90% of its mineral exports and accountingfor more than 40% of the country’s foreign exchangeearnings.The economy of Tarkwa (south-west Ghana) and its sur-rounding areas has been built on mineral mining for
Received: 23 April 2003 / Accepted: 13 January 2004Published online: 24 April 2004ª Springer-Verlag 2004
J. S. KumaDept. of Geol. Engineering,Western University College,P.O. Box 237, Tarkwa, GhanaE-mail: [email protected]: +44-23336220306
P. L. YoungerDept. of Civil Engineering,University of Newcastle-upon-Tyne,NE1 7RU, UK
DOI 10.1007/s10064-004-0227-8 Bull Eng Geol Env (2004) 63:119–132 119

several centuries and, since the late 1980s, three surfacegold mining companies have been in operation: GhanaAustralian Goldfields (GAG), Teberebie Goldfields Limited(TGL) and Goldfields Ghana Limited (GGL). The Envi-ronmental Protection Agency (EPA) has the appropriatepowers to perform regulatory and monitory functionsefficiently. The environmental concerns of the people inthe area have been high due to the many issues that
accompany mining developments in relatively well-popu-lated areas. This seemed to be the reason why, in August1998, the government held a 2-day seminar in Tarkwaentitled, ‘‘Mining and the environment — public con-cerns’’; where all stake holders in the mineral industry,including communities affected by mining, discussed howmining could be conducted in a sustainable manner.However, environmental issues in general and water inparticular still remain thorny in the Tarkwa area and thiswas not helped when two dams belonging to TGL and GGLpartially failed in June 1997 and October 2001, respec-
120 Bull Eng Geol Env (2004) 63:119–132
Fig. 1Simplified geological map of south-west Ghana showing the locationof the major gold mines Adapted from Eisenlohr and Hirdes (1992)
J. S. Kuma Æ P. L. Younger

tively, releasing cyanide-rich water into the Awunabengand Essuman streams (Fig. 2). Dzigbodi-Adzimah (1996)has discussed the environmental effects of mining inGhana while Kortatsi (2000) addressed water-qualityissues in relation to mining in the Tarkwa district. Thepaper by Kortatsi (2000) can be described as exploratory.Akabzaar (2000) focused on social and general environ-mental issues and generated a well-publicised debate. Theneed for a comprehensive water-quality assessment in thedistrict has become necessary to inform all concerned.This paper investigates the spatial and temporal changesthat the water environment in the Tarkwa area is experi-encing. Suggestions for effective monitoring of the waterenvironment have been made.
The study area
PhysiographyA tropical and humid climate pertains in the Tarkwa area,which is located in the transition zone between the Rain
Forest and Moist Semi-deciduous Forest in Ghana (Dick-son and Benneh 1988). A double maxima rainfall regime isexperienced with average annual rainfall of over1,750 mm. The major wet season is from April to July andSeptember to November is the minor wet season. Dailytemperatures are between 28–33 �C and relative humidityvaries from 83 to 91%. The relief is moderate and a generaldecrease in altitude to the south is the norm in the area.The landscape is defined by a series of parallel ridges andvalleys due to pitching fold and dip-and-scarp slopes,which are orientated along the general NE-SW trend of therocks (Whitelaw 1929). Located in the Ankobra Riverbasin, the study area is bordered to the west by thesoutherly flowing Ankobra River. The Huni and BonsaRivers are major tributaries to the Ankobra and demarcatethe northern and southern extremities of the study area.
Geology and hydrogeologyRocks of the Tarkwaian outcrop in a NE–SW-trending beltand are considered to be molassic facies derived from theolder Birimian System (Junner et al. 1942; Fig. 2). Ingeneral, the Tarkwaian consists of subrounded to suban-gular, coarse, poorly sorted, immature sediments typical ofa braided stream environment, which have been meta-
Bull Eng Geol Env (2004) 63:119–132 121
Fig. 2Geological map of the study area showing water sampling points.Adapted from Junner et al. (1942)
Water quality trends in the Tarkwa gold-mining district

morphosed to low-grade green-schist facies (Kesse 1985).In the direction of younging, the Tarkwaian consists of theKawere Group, Banket Series, Tarkwa Phyllite and HuniSandstone (Table 1). Hypabyssal felsic to basic igneousrocks intrude the Tarkwaian in the Tarkwa area andcommonly form conformable to slightly transgressive sills,with a small number of dykes.Numerous faults and joints are present in the area with themost prominent joints trending in an ESE–WNW direc-tion; NW–SE and N–S trends are also present. Two typesof faults are identified. The strike-parallel faults are closelyassociated with folding and occur as upthrusts. The othergroup is dip-parallel and is frequently recognised asbreaks in the topography (Hirdes and Nunoo 1994).Due to the depositional environment and structuraldevelopment of the area, considerable variation in thethickness of the individual beds is expected. Therefore,aquifers with dual porosity, limited areal extent and stor-age properties would be anticipated, with local ground-water flow the prevalent system in the Tarkwa area.
Field and laboratory methods
Three aspects of the water regime in the study area wereidentified for investigation:
1. Dry weather (low flow) water samples were collectedfrom streams at sampling intervals of about 3 km toallow any spatial variations in water chemistry to beidentified. Minimum dilution of stream flow fromprecipitation was recorded during this period.
2. Temporal variability in stream chemistry was investi-gated by means of weekly gauging and sampling of fourstreams for 1 year. The determinants were discharge,pH, temperature, alkalinity, Eh, Cl–, SO4
2– and TDS.More detailed hydrochemical sampling, comprisingmajor, minor and some trace elements, was conductedon a 4-weekly basis. The Awunabeng, Bediabewu,Essuman and Anyuiafutu Streams were all gauged closeto their discharge into the Bonsa and Huni Rivers.
3. Springs and shallow wells give more direct samples ofgroundwater, but boreholes are the most reliablesource. The lack of depth-sampling equipment meantthat ‘bulk’ groundwater samples were taken. The aver-age depth of the boreholes was 60 m. Best practice for
sampling wells fitted with pumps has been discussed byYounger (1994).
Field determinations of temperature, pH, Eh, alkalinityand DO were conducted at each water-sampling site usingportable HACH instruments and reagents. The HACHdigital titration kit afforded measurement of alkalinity.Also, field filtering of all water samples through 0.45 lmfilters was effected before collection. Samples for cationand metal analysis were preserved in the field by acidifi-cation using nitric acid. Almost all major, minor and traceelements were analysed using a Palintest Photometer 5000with the appropriate reagents. A HACH Sension2 portablemeter enabled the determination of sodium.Twenty water samples were analysed in the UK using ionchromatography, atomic absorption spectrometry (AAS)and inductively coupled plasma mass spectrometry (IC-PMS) so that Cr, Cu, Co, Pb, Cd, Hg, CN and As could alsobe analysed in addition to the routine elements. Streamdischarge was measured with the VALEPORT BFM002meter. The investigations were conducted in the year 2000and the dry weather sampling restricted to the end ofJanuary to the middle of March. A total of 251 watersamples were collected and analysed.
Results and interpretation
As the three categories of water investigated come fromthree different regimes with respect to the water environ-ment, they were analysed separately in order to identifypeculiar characteristics associated with each. However,where it is possible to draw inferences (parallels) betweenthem, this is pointed out.
Dry weather major ion hydrochemical analysisAll 94 low-flow water samples are presented in the Piperdiagram in Fig. 3, which reveals diversity in their indi-vidual major ion chemistries. In order to observe spatialhydrogeochemical trends the samples are grouped intothree categories.
Springs, shallow wells and hand-pump wellsThe Piper plot in Fig. 4 reveals that most of the waters plotaround the boundary between the ‘temporarily hard water’region and the zone where water has no dominant ion
122 Bull Eng Geol Env (2004) 63:119–132
Table 1Stratigraphic sequence of theTarkwaian in the Tarkwa area.After Junner et al. (1942). Rocknames in italics form the mainconstituent of each unit and theconglomerates are interlayeredwith quartzites
System Series Thickness Composite lithology(m)
Tarkwaian systemin Tarkwa
Huni Sandstone 1,370 Sandstones,grits and quartzites withbands of phyllite
Tarkwa Phyllite 120–400 Huni sandstone transitional bedsand greenish-grey phyllitesand schists
Banket Series 120–600 Tarkwa phyllite transitional bedsand sandstones, quartzites, gritsbreccias and conglomerates
Kawere Group 250–700 Quartzites, grits, phyllites andconglomerates
J. S. Kuma Æ P. L. Younger

species (see Piper 1944). The rest of the samples plot closeto the boundary between the saline region and the field inwhich waters with no dominant species plot, i.e. in thevery slightly saline zone. In general, Na–Ca is the domi-nant cation pair and HCO3–Cl the anion pair.Some of the water samples may have been affected by bothmine and urban influences. Samples TS84, TS105 andTS141 were taken from shallow domestic wells open at thetop; the use of domestic utensils to draw water has affectedits chemistry. Sample TS29 was from an issue just behind a
waste dump where acid mine waters have been found.Sample TS70 was from the Teberebie concession whereNa-SO4 chemical facies have been identified whereassample TS301 was taken from a hand-pump well locatedon phyllite, which might be influenced by mine waters or adyke. The mean HCO3/SiO2 ratio for these samples, minusthose suspected to be otherwise influenced by externalfactors, is 1.74 and their pH and TDS are 5.76 and141 mg/L, respectively.
Stream samples from ‘pristine’ areasMost of the stream samples can be classified into twohydrochemical zones: where water has an intermediatechemical character, i.e. no cation–anion pair exceeds 50%,and the fresh water facies (Fig. 5). The waters are of theNa–Ca–Mg-HCO3–SO4 and Ca–Na-HCO3 chemical facies,respectively. As water samples were collected during thedry period, there are some locations where the stream haddried up and so samples were taken where local commu-nities draw water, i.e. in holes dug on the stream-bed. Insuch cases, domestic utensils are used with the attendantpossibility of the deposition of NaCl. Samples TS46, TS96and TS106, taken from such localities, show relatively highNa levels. The mean HCO3/SiO2 ratio is 2.85 while pH andTDS are 6.48 and 110 mg/L, respectively.
Mine waters and mine water-influenced stream samplesThirty-nine samples fall into this category and four hyd-rochemical facies are identified in Fig. 6. The first groupplots in the Ca-SO4 facies category and is linked to acidicleachates from waste rock piles. Such waters are typical ofmine waters worldwide that have been affected by pyriteoxidation (e.g. Younger 1995; Banks et al. 1997). Theaverage pH of the 37 samples was 3.54 and the TDS684 mg/L. Although the pH of two samples excluded in theaveraging (TS21 and TS23) was 6.23 and above, the rela-tively high Ca, SO4, Na and Cl values suggest a change in
Bull Eng Geol Env (2004) 63:119–132 123
Fig. 4Piper plot for springs, shallow open-top wells and hand-pump wells
Fig. 3Piper trilinear plot for all dry weather samples
Fig. 5Piper plot of stream water in pristine areas
Water quality trends in the Tarkwa gold-mining district

their original water chemistry as a result of pyrite oxida-tion and/or leaching with NaCN.Group two comprises water with an intermediate chemicalcharacter, i.e. Ca–Na-SO4–HCO3 facies. These sampleswere taken south of the spoil heaps and may reflect mix-tures of Ca-SO4 pyrite oxidation waters with otherwise‘pristine’ waters (Na–Ca–Mg-HCO3–SO4 facies). Groupthree is of the Ca–Na-HCO3 facies water type and is linkedwith fresh water. These samples were taken from streamsbefore they entered mine territory or before joiningstreams carrying mine water discharges.The fourth group was identified as the Na-SO4–HCO3
facies type and comprised samples taken in the Awunab-eng and Bediabewu streams after they had passed throughmined areas and, hence, were receiving mine-water dis-charges. Their water chemistry ranged from slightly salineto saline; the highest Na value (373.6 mg/L) being in asample taken from a tributary of the Bediabewu flowingfrom the TGL concession. The mean HCO3/SiO2 ratio forthis fourth group was 11.42, with elevated pH and TDSvalues of 7.74 and 536 mg/L, respectively. The HCO3/SiO2
ratio and TDS are high compared with previous analysesand suggest the terrain is undergoing carbonate weath-ering.Heap leach technology is employed to extract gold in thethree mines. Lime (CaO) is applied to the ore in order toraise the pH to between 10.5 and 11.0, followed by disso-lution of gold using sodium cyanide (NaCN) solution.Although the prepared ore is heaped onto plastic linedpads and stringent controls are in place to prevent thissolution entering the wider environment, Acquah (1992)suggests that between 45–450 L/day of sodium cyanidesolution per hectare possibly leaks out of such ‘closed’systems. High sodium ion levels (which remain aftercyanide destruction) are also observed in tailings ponds,which may leak out of their containment into the
groundwater. It is, therefore, reasonable to suggest that theelevated levels of pH, TDS, Na+, Ca2+, SO4
2– and HCO3/SiO2 are directly a result of mine-water chemistry.
Other IonsNitrate (NO3
–) levels in streams and groundwaters in theTarkwa area are generally low, between 0.0 and 5.3 mg/L,with the majority below 1.0 mg/L. However, nitrate con-centrations in streams carrying mine discharges arehigher. Two streams, which receive mine discharges fromTGL (samples TS65, TS66, TS69 and TS71), gave values of31.0, 38.0, 58.0, 60.0 mg/L, respectively. The reason forthese high values is not known, but they could be a directresult of mineral processing (nitrate might be formed byoxidation of ammonia-based explosives and/or cyanide).According to Hem (1992), NO3
– concentrations in excessof 44 mg/L may cause methemoglobinaemia in children.Although it is reported in the literature that farm animalsproduce nitrogenous organic waste, which is concentratedin places where large numbers of animals are confined,there are no pens of housed animals in these areas.Phosphate (PO4
3–) concentrations were low, with themajority of the water samples having a value of 0.0;however, in a few areas, concentrations of up to 2.90 mg/Lwere recorded. The low phosphate values suggest that thenitrate is not from animal wastes. Samples TS22 and TS34gave values of 5.7 and 11.4 mg/L, respectively; both pointsare mine discharges. Bromine is present in natural wateras bromide (Br–). The bromide concentrations were gen-erally low, between 0.0 to 1.06 mg/L, with most of theconcentrations being less than 0.40 mg/L. Levels of NH3-Nwere also very low (0.0–0.04 mg/L) in the Tarkwaian wa-ters. The colour intensity of the water from the hand-pump wells and springs was very low (0–10 mg/L), butvaried from a few tens to 800 mg/L in the streams. Thehigh colour intensity values are generally due to decayedvegetation.
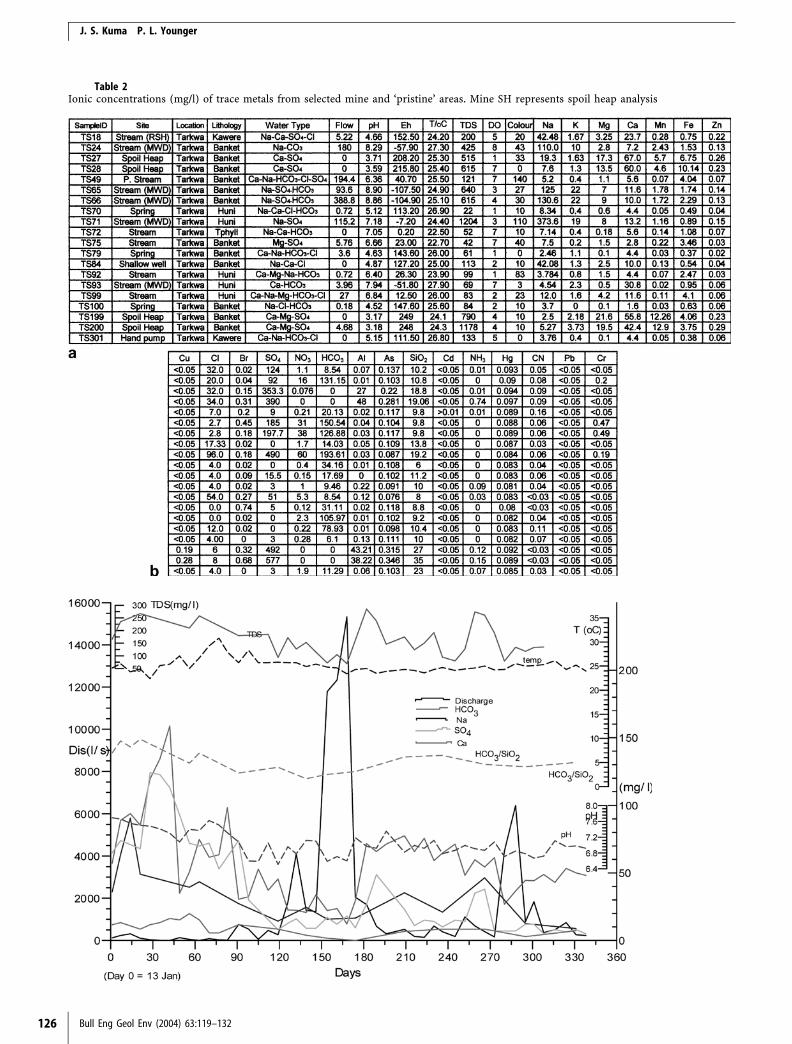
Trace metalsTwenty water samples were sent to the University ofNewcastle-upon-Tyne Water Resources Laboratory foranalyses for Fe, Cd, Cu, Cr, Pb, As, CN and Hg. Thesesamples were taken from both areas: i.e. those perceived tobe pristine and those from mine water discharge areas, sothat differences in the ionic concentrations between thetwo groups could be compared. Edmunds and Smedley(1996) observed that a decrease in pH of one unit may leadto an increase of more than one order of magnitude ofsome metals. Table 2 shows that water samples with highermetallic concentrations are associated with the spoil heap.Waters affected by mine discharges show only marginallyhigher heavy ion concentrations compared with samplesfrom pristine streams, which are within World HealthOrganisation (WHO) limits.
Major ion chemistry at stream-gauging pointsThe graphs and Piper diagrams of the streams gauged arepresented in Figs. 7, 8, 9, 10, 11, 12, 13 and 14. The graphsshow weekly variations in stream discharge, temperature,pH, HCO3
–, SO42– and TDS, and monthly plots of Ca2+,
124 Bull Eng Geol Env (2004) 63:119–132
Fig. 6Piper plot for water samples taken from mining areas
J. S. Kuma Æ P. L. Younger

Na+ and HCO3/SiO2. As expected, low flow conditionscoincided with high ionic concentrations and vice-versa.
Awunabeng and Bediabewu gauging pointsThe characteristics of these two streams are similar(Figs. 7 and 8) and hence they are discussed together.During low flow, the ionic concentrations of the streamwater are lower at the head of the streams compared withtheir respective gauging points. Although such differencesare to be expected, it is thought that extraneous effects arelargely responsible, particularly as the relatively pristineAbompini Stream shows only minor variation in ionicconcentrations along its course at low flow (Fig. 2 andTable 3). The degree of ionic increase for the Awunabengand Bediabewu Streams is probably due to their tributar-ies, which receive mine discharges, although domesticeffluent may also be partly responsible.The mean HCO3/SiO2 ratio and pH during low-flow con-ditions are 14.85 and 7.68 for Awunabeng and 7.33 and7.46 for Bediabewu. These characteristics are not observedfor the relatively pristine Abompini Stream where a meanHCO3/SiO2 ratio of 1.4 and a pH of 6.45 is calculated alongits course during low flow. The average pH of the streamsthat have not passed through mining areas or receivedmine waters during low flow is 6.54. The possible expla-nation for these differences is that the mine water chem-istry has increased pH, HCO3, SO4, Na and Ca, probablydue to the method of ore processing discussed above.During low flow, the maximum ionic concentrations ofHCO3, SO4, Na and Ca were, respectively, 193.7, 170.0,
203.0 and 18.13 mg/L for the Awunabeng stream and158.4, 134.0, 93.6 and 19.86 mg/L for Bediabewu. Thelowest ionic concentrations observed for the two streamscoincided with the highest discharge in June. During July–August (days 190–270) and late November to December(from day 315), the lull in rainfall resulted in an increase inionic concentrations, although they were not as high asduring January to March. The temperature of thesestreams ranged from 23.9–28.1 �C: the higher values gen-erally being related to the low flow months.Piper diagrams for the Awunabeng and BediabewuStreams have been plotted in Figs. 9 and 10. Water fromboth streams plot in the slightly saline group with SO4+Cl>HCO3 and Na+K>Mg+Ca. The hydrochemical facies forAwunabeng and Bediabewu are Na-SO4–HCO3 and Na–Ca-HCO3–SO4, respectively. TDS for the year for Awunabengranged between 73–412 mg/L, with a mean of 192 mg/L,and 69–285 mg/L for Bediabewu, with a mean of 162 mg/L.The TDS values were low, but higher than the AbompiniStream for the same (low flow) period. The field occupiedby the streams on the diamond plots shows that thepositions for the Awunabeng are closer than those for theBediabewu. This may be due to a significant and moreconsistent amount of mine water flowing into the Awun-abeng and/or more fresh-water discharge diluting theBediabewu. In addition, the Awunabeng is generally moreconcentrated in Na + K compared with the Bediabewu.Seasonal trends are observed in both Piper plots. In thecation plots, increasing Na+ values (i.e. plots towards theNa+ corner in the direction of the arrow) depict pro-gressing low flow conditions for both the Awunabeng andBediabewu streams. However, in the anion plot, an alter-nating direct and inverse relation is observed between the
Bull Eng Geol Env (2004) 63:119–132 125
Fig. 7Discharge and some chemical characteristics of Awunabeng Stream
Water quality trends in the Tarkwa gold-mining district
126 Bull Eng Geol Env (2004) 63:119–132
Table 2Ionic concentrations (mg/l) of trace metals from selected mine and ‘pristine’ areas. Mine SH represents spoil heap analysis
J. S. Kuma Æ P. L. Younger

HCO3– and SO4
2– ions throughout the year. Starting fromJanuary, a direct relation is observed through the low-flowperiod to the peak rainy month of June, after which aninverse relation is observed with HCO3
– greater than SO42–
from day 195 to day 240. Following this, a direct and thenan inverse relationship is observed between the pairs ofions (Figs. 7 and 8). These observations pertain to both theAwunabeng and Bediabewu Streams. Thus, no clear trendis manifest in the anion triangle although the ions plot in aroughly straight line parallel to the HCO3
––SO42– side of
the triangle because of the much lower chloride concen-trations measured all year round.
Essuman gauging pointIonic concentrations in this stream are not as elevated asthose in the Bediabewu and Awunabeng Streams (Fig. 11).In addition, with the exception of the HCO3
– ion, the indirectrelation between discharge and ionic concentrations ofSO4
2–, Na+ and Ca2+ is not evident. The sodium ion is onlyslightly modulated throughout the year whereas the SO4
2–
concentration behaves similarly (e.g. between days 70 and120). At the beginning of this period, HCO3
–, SO42– and pH
all increase in direct correlation with a rise in discharge dueto rainfall. (Due to the scale, small amounts of dischargemeasured from day 70 are not seen on the graph.) AlthoughHCO3
– and pH values decrease again before the flow peaks,a sustained rise in the value of SO4
2– is observed. Thisphenomenon indicates heterogeneous solute source areas inthe catchment. One possible explanation could be that thepH and HCO3
– initially rise as the impounded process wateris released from the GGL Mine to coincide with the rainfall.Subsequently, SO4
2– rises as pH and HCO3– fall. It may also
be due to stream runoff over an outcropping dyke withdisseminated pyrite, which, during the preceding dry
weather, had been oxidised and, with the torrent, is flusheddownstream increasing SO4
2– and reducing pH and HCO3–
in the process. A rather vague direct relation exists betweenpH and HCO3
– throughout the year.The mean HCO3/SiO2 ratio is distinctly higher during lowflow, but still only 3.15. TDS values for the year rangebetween 51 and 160 mg/L with a mean of 97 mg/L. Themean annual pH is 6.75 with a low flow average of 6.77.Figure 12 shows that water from the Essuman is mainlyfresh, but close to the 50% cation boundary, i.e. Ca–Na–HCO3 chemical facies. The plot in the cation triangle is moreor less parallel to the Ca–Na axis where the anion triangle isaligned to the HCO3
––SO42– axis, but more concentrated in
the HCO3– corner. However, the plotted points do not reveal
any seasonal trend. Although the water type is generally inthe potable water domain (Davis and DeWiest 1991), traceand other metal ion concentrations need to be investigatedbefore it is accepted for human consumption withouttreatment. This is because a significant number of itstributaries pass through the GGL Mines and the dammedprocessing water discharges directly into a tributary.
Anyuiafutu gauging pointThe ionic concentrations in this stream are much lowercompared with the other three large streams (Fig. 13). Thisstream has no tributaries passing through a mine. Thechemical characteristics are in line with those expected, i.e.ionic concentrations increase during low flow conditions,but in a subdued way especially with Ca2+ and Na+ ions. Abetter defined direct relation is observed between pH andHCO3
– throughout the period of investigation. The meanHCO3/SiO2 ratio at low flow is 1.48 and the average annualTDS is 93 mg/L with a range of 42–143 mg/L.The Piper plot for Anyuiafutu (Fig. 14) shows approxi-mately equal concentrations of the major cations andalmost equal concentrations of SO4
2– and Cl, i.e. the water
Bull Eng Geol Env (2004) 63:119–132 127
Fig. 9Piper plot for water samples from Awunabeng gauging site Fig. 10
Piper plot for water samples from Bediabewu gauging site
Fig. 8Discharge and some chemical characteristics of Bediabewu Stream
b
Water quality trends in the Tarkwa gold-mining district

is of Na–Ca–Mg-Cl–SO4 chemical facies. The low HCO3–
concentration is probably due to aerobic microbial respi-ration in the soil, resulting in a low annual pH of 6.27.Considering that both the Essuman and the Anyiuafututraverse the same lithological unit (Huni Sandstone), itwould be expected that both would exhibit broadly similarhydrochemical facies. Whereas most of the water in the
Essuman flows through mine territory and some tribu-taries receive mine water, this is not so with the Anyuia-futu. In view of its size, the Anyuiafutu is likely to bereceiving only near-surface groundwater, which wouldexplain its low pH values and low HCO3
– concentrations.However, the pH of the Essuman is higher than average,probably due to mine process water discharges.
Saturation indicesThe WATEQ4F (Ball and Nordstrom 1991) computer codewas used to investigate dissolved species distribution andcalculate the saturation indices (SI) of mineral sources inthe water. The SI of a mineral =[log10(IAP/Ksp)], whereIAP is the ion activity product or the product of theactivities of the ions in solution and Ksp is the solubilityproduct (Hounslow 1995). It indicates whether mineralsanalysed in the water are in equilibrium, under-saturatedor over-saturated.All the waters sampled were in equilibrium with respectto quartz, chalcedony and cristobalite (with the exceptionof those from hand-pump wells, where quartz was over-saturated). About 95% of the water analysed was over-saturated with respect to diaspore [Al(OOH)+H2O],gibbsite [Al(OH)3] and kaolinite [Al2Si2O5(OH)4] and allsamples analysed for iron were over-saturated with re-spect to goethite (FeOOH). In general, these indices re-flect the sandstone–quartzite–phyllite lithology andintense weathering regime of the area, as a result of thehumid tropical climate leading to, for example, the con-version of feldspar to kaolinite. The silica concentrations,coupled with quite low to neutral pH values, suggest thatvery low concentrations of Al would result in kaolinitesaturation.
128 Bull Eng Geol Env (2004) 63:119–132
Fig. 12Piper plot for water samples from Essuman gauging site
Fig. 11Discharge and some chemical characteristics of Essuman Stream
J. S. Kuma Æ P. L. Younger

Discussion and conclusions
Quantification of chemical influencesIt is an accepted fact the world over that mining results inenvironmental changes (e.g. Bowell et al. 1995; Farrell andKratzing 1996; Younger 2000). The degree to which these
changes differ from baseline values determines how envi-ronmentally unfriendly the mining has been. This can bedefined in terms of whether a significant impact has oc-curred (in the present study with regards to water qualityalone). The definition of what constitutes a ‘significantimpact’ is a problem in itself. On the basis of the obser-vation by Edmunds and Smedley (1996, see section ontrace metals), an order of magnitude departure from theexpected or baseline is taken as identifiable or significantin this context. It is assumed that streams that do notreceive discharges from the mines do not depart in anyappreciable way from the expected and, therefore, fit thebaseline. The value of one order of magnitude need not beabove the limits set by the Environmental ProtectionAgency (EPA) or World Health Organisation (WHO), butshows that an identifiable change in ionic concentrationhas occurred. Table 4 shows the simple way in which theimpacts are ranked. Table 5 depicts average concentra-tions of ions in pristine areas against the maximum con-centrations of the ions analysed with comments followingthe proposed grading system.
Variations in water qualitySpatial and temporal variations of major and minor ions inthe waters have been observed, which are considered to becaused by both natural and anthropogenic effects. Thespatial variations in water chemistry were afforded by dryweather sampling, which revealed that mine water dis-charge into receiving water courses has, in most cases,significantly changed the hydrochemistry of the streams.This spatial change is superimposed on the temporalvariations because of the higher ionic concentrationswhich occur during the dry season. The magnitude of
Bull Eng Geol Env (2004) 63:119–132 129
Fig. 14Piper plot for water samples from Anyuiafutu gauging site
Fig. 13Discharge and some chemical characteristics of Anuiafutu Stream
Water quality trends in the Tarkwa gold-mining district

temporal variations in ionic concentrations in the studyarea has been identified in the subdued changes observedin the Anyuiafutu Stream (Fig. 13) and from the magni-tude of the ionic concentrations obtained from theApompini Stream during low flow (Table 3). Both streamsare considered pristine because they receive no mine waterand other anthropogenic effects are minimal. Table 6summarises the water properties investigated. Some of theimportant conclusions arrived at are as follows:
1. Dry weather water analyses of perceived pristine areasshow that HCO3/SiO2 is below 5; a value that implies thearea has undergone silicate weathering. However,streams passing through mining territory and thosethat receive mine water (Awunabeng and Bediabewustreams) show HCO3/SiO2 ratios greater than 10, sug-gesting carbonate weathering. This apparent inconsis-tency in the weathering regime in the study area isattributable to the effect of mine water chemistry on thereceiving streams. This difference is also highlighted inthe average pH of 7.74 for streams receiving mine waterfrom GAG and TGL compared with 6.48 in water frompristine areas. Leakage of spent heap leach pad liquorsor seepage from tailing impoundments into thegroundwater may explain these results as the lithologyin the mines is not different from that in the immediatevicinity.
2. The deductions from (1) above are applicable tostreams fed with mine water from the GAG and TGLconcessions. Mine water from the GGL discharges intothe Essumang Stream, whose chemical facies is Ca–Na-HCO3. The study found no major chemical change inthis stream, suggesting that no leakage of unprocessedmine water discharges into it. However, a serious spillof cyanide-rich processing effluents breached a GGLtailings dam in October 2001, introducing cyanide intothe River Essuman. This may have changed the hyd-rochemistry of both the soil and stream since this study.
3. The residence time of groundwater before emergence instreams is relatively short, as inferred from the meanTDS of 110 mg/L for pristine areas. Ionic concentrationin the groundwater is also low.
4. All the waters sampled are in equilibrium with respectto quartz, chalcedony and cristobalite. About 95% ofthe water analysed was over-saturated with respect todiaspore, gibbsite and kaolinite, and all samples anal-ysed for iron were over-saturated with respect to goe-thite. These saturation indices reflect the sandstone–quartzite–phyllite lithology and intense weathering re-gime of the area as a result of the humid tropical cli-mate.
The major streams in the Tarkwa gold-mining districthave been affected by the mining. However, investigationsof groundwaters from hand-pump wells do not show anyidentifiable impacts on their hydrochemistry in the district(Kuma 2003). Communities living in the district have beenprovided with hand-pump wells to protect them fromdrinking contaminated stream water. In order to monitorand manage groundwater resources in the area, the com-munity, through the District Assembly working with theEPA, should install independent monitoring wells for
130 Bull Eng Geol Env (2004) 63:119–132
Table 3Low ionic concentrations for the locations sampled along the Abompini stream. All the water samples were taken on 01.02.2000 and thesampling points have been arranged sequentially downstream. With the exception of pH, all units are in mg/L
Sample ID pH Na K Ca Mg HCO3 Cl SO4 TDS
TS48 6.32 5.8 0.0 5.6 0.8 10.9 6.0 9.6 99TS49 6.36 5.2 0.4 5.6 1.1 20.1 7.0 9.0 71TS52 6.54 3.4 0.2 4.4 0.6 13.7 2.6 6.0 63TS51 6.56 3.9 0.0 6.6 0.4 11.9 7.0 7.3 52
Table 4Scheme to quantify chemical impacts in the Tarkwa district
Order of magnitude change inwater quality
Impact
(mg/L)<1 Normal1 or > Identifiable/significant2 or > Serious3 or > Very serious
Table 5Comparison of the maximum concentration of ions in streams withthe average from pristine areas. Square brackets are concentrations ofspoil heap drainage, if they are significantly different from thestreams. Units of TDS is mg/L. 7.53/14.85 refers to annual/low flowfigures
Ion Pristineareas
Max. conc.(spoil heap)
Remarks
(mg/L) (mg/L)
pH 6.48 8.40 (3.09) Serious (very serious)HCO3 32.3 183 (0) SignificantSO4 9.5 450 (890) SeriousCl 5.0 96 SignificantNa 7.04 373 SeriousK 1.16 22 SignificantMg 2.36 12.5 (47.5) SignificantCa 5.98 57 (112.5) Significant (serious)NO3 0.47 60 SeriousPO4 0.66 11.4 SeriousAl 0.02 0.18 (105) Significant (very serious)Mn <1.00 (17.8) Normal (significant)Fe 1.68 5.25(10.1) Normal (significant)Zn 0.06 0.22 SignificantAs 0.102 0.281 NormalCu <0.05 <0.05 (0.28) Normal (significant)Cr <0.05 0.49 SignificantCN 0.063 0.090 NormalPb <0.05 <0.05 Normal
J. S. Kuma Æ P. L. Younger

periodic groundwater water quality assessment. Thesewells would also be invaluable for other hydrologicalinformation such as recharge estimation and groundwatertracing.
References
Acquah PC (1992) Emerging trends in gold ore processing andsome related environmental issues in Ghana. In: Peters JW,Kesse GO, Acquah PC (eds) Regional trends in African geology.Proceedings of the 9th International Geological Conference,Accra, 2–7th November 1992. Geological Society of Africa
Akabzaar TM (2000) Boom and dislocation: the environmentaland social impacts of mining in the Wassa west district ofGhana. Third World Network: Africa, Ghana
Ball JW, Nordstrom DK (1991) Users manual for WATEQ4F, withrevised thermodynamic database and test cases for calculatingspeciation of major, trace, and redox elements in natural waters.US Geological Survey Open File Report 91-183. Menlo Park, CA,USA
Banks D, Younger PL, Arnesen RT, Iversen ER, Banks SB (1997)Mine-water chemistry: the good, the bad and the ugly. EnvironGeol 32(3):157–74
Bowell RJ, Warren A, Minjera HA, Kimaro N (1995) Environ-mental impacts of former gold mining on the Orangi river,Serengeti NP, Tanzania. Biogeochemistry 28:131–160
Davis SN, Dewiest RJM (1991) Hydrogeology, reprint edn. KriegerPublishing Company, Florida, USA
Dickson KB, Benneh G (1988) A new geography of Ghana.Longman, London, UK
Dzigbodi-Adzimah K (1996) Environmental concerns of Ghana’sgold booms: past present and future. Ghana Mining J 2(1):21–26
Edmunds WM, Smedley PL (1996) Groundwater geochemistryand health: an overview. In: Fuge JD, McCall GJH (eds) Envi-ronmental geochemistry and health. Geol Soc Spec Publ 113:91–105
Eisenlohr BN, Hirdes W (1992) The structural development of theEarly Proterozoic Birimian and Tarkwaian rocks in southwestGhana, West Africa. J Afr Earth Sci 14:313–325
Farrell TP, Kratzing DC (1996) Environmental effects. In: Uni-versity of New South Wales, Environmental management in theAustralian minerals and mining industries. University of NewSouth Wales, pp 14–45
Hem JD (1992) Study and interpretation of the chemical char-acteristics of natural water. US Geological Survey Water-SupplyPaper 2254
Hirdes W, Nunoo B (1994) The Proterozoic paleoplacers at Tar-kwa Gold Mine, SW Ghana: sedimentology, mineralogy andprecise age dating of the main reef and west reef, and bearing ofthe investigations on source area aspects. BGR Geol Jb, D100,Hannover
Hounslow AW (1995) Water quality data; analysis and interpre-tation. Lewis Publishers, New York
Junner NR (1935) Gold in the Gold Coast. Gold Coast Geol SurvMem 4
Junner NR, Hirst T, Service H (1942) The Tarkwa Goldfield. GoldCoast Geol Surv Mem 6
Kesse GO (1985) The mineral and rock resources of Ghana.Balkema, Rotterdam
Kortatsi BK (2000) The impact of mining on groundwater qualityin the Tarkwa area, Ghana. In Sililo O (ed) Groundwater: pastachievements and future challenges. Proceedings of the XXXIAH Congress on Groundwater, Cape Town, South Africa, 26November to 1 December 2000
Bull Eng Geol Env (2004) 63:119–132 131
Tab
le6
Sum
mar
yo
fm
ean
chem
ical
char
acte
rist
ics
of
wat
erin
the
Tar
kw
aar
ea
Dry
wea
ther
wat
erch
emis
try
(sp
atia
lva
riat
ion
)St
ream
gau
ged
wat
erch
emis
try
(tem
po
ral
vari
atio
n)
Spri
ng
and
bo
reh
ole
Pri
stin
ear
eas
Min
ew
ater
infl
u-
ence
dar
eas
Aw
un
aben
gB
edia
bew
uE
ssu
man
An
yuia
futu
Fac
ies
typ
eN
a–C
a–H
CO
3–
Cl
(a)
Na–
Ca–
Mg–
HC
O3–
SO4
(a)
Na–
SO4–
HC
O3
(b)
Ca–
SO4
Na–
SO4–
HC
O3
Na–
Ca–
HC
O3–
SO4
Ca–
Na–
HC
O3
Na–
Ca-
Mg–
Cl–
SO4
(b)
Ca–
Na–
HC
O3
HC
O3/S
iO2
1.74
2.85
(a)
11.4
27.
53/1
4.85
5.29
/7.3
32.
40/3
.15
0.90
/1.4
8(b
)0
pH
5.76
6.48
(a)
7.74
7.09
/7.6
87.
04/7
.46
6.75
/6.7
76.
27/6
.58
(b)
3.54
TD
S14
111
0(a
)53
619
2/34
816
2/22
793
/97
93/1
16(b
)68
4
Water quality trends in the Tarkwa gold-mining district

Kuma JS (2004) Is groundwater in the Tarkwa gold mining dis-trict of Ghana potable? J Environ Geol 45:391–400
Piper AM (1944) A graphic procedure in the geochemical inter-pretation of water analysis. Am Geophys Union Trans 25:914–923
Sraku-Lartey K (1993) Production and economic trends in theminerals industry in Ghana. In: Tsidzi KEN (ed) Proceedings ofthe National Seminar on Current Developments in the MineralsIndustry of Ghana. 6–7 May 1993, Kumasi, Ghana
Whitelaw OAL (1929) Geological and mining features of theTarkwa–Aboso Goldfield. Gold Coast Geol Surv Mem 1
Younger PL (1994) Low-cost groundwater quality investigationmethods: an example from the Bolivian Altiplano. In: Nash H,McCall GJH (eds) Groundwater quality. Chapman and Hall,London, pp 55–64
Younger PL (1995) Hydrogeochemistry of mine waters flowingfrom abandoned coal workings in County Durham. Q J Eng Geol28:S101–S113
Younger PL (2000) Holistic remedial strategies for short- andlong-term water pollution from abandoned mines. Trans InstMineral Metall (Sect A: Mineral Technol) 109:A210–218
132 Bull Eng Geol Env (2004) 63:119–132
J. S. Kuma Æ P. L. Younger