Study on impacts of artisanal gold and diamond mining on ...
98
Study on impacts of artisanal gold and diamond mining on livelihoods and the environment in the Sangha Tri-National Park (TNS) landscape February 2009 Tieguhong Julius Chupezi 1 , Verina Ingram 2 , Jolien Schure 3 Consultant Scientist, CIFOR Associate Professional Officer, CIFOR CIFOR, Yaoundé, Cameroon
-
Upload
khangminh22 -
Category
Documents
-
view
0 -
download
0
Transcript of Study on impacts of artisanal gold and diamond mining on ...

Study on impacts of artisanal gold and diamond mining on livelihoods and the environment in the
Sangha Tri -National Park (TNS) landscape
February 2009
Tieguhong Julius Chupezi1, Verina Ingram2, Jolien Schure 3
Consultant Scientist, CIFOR
Associate Professional Officer, CIFOR
CIFOR, Yaoundé, Cameroon

© 2009 by CIFOR, Central Africa Office All rights reserved. Cover photos by Julius Chupzei Published by Center for International Forestry Research Jl. CIFOR, Situ Gede, Sindang Barang, Bogor Barat 16680, Indonesia Tel.: +62 (251) 622622; Fax: +62 (251) 622100 E-mail: [email protected] Web site: http://www.cifor.cgiar.org

Impacts of mining on livelihoods and environment in the TNS landscape
i
Table of Contents
Acknowledgements.........................................................................................................................................1 List of Tables....................................................................................................................................................3 List of Figures ..................................................................................................................................................4 1. Executive Summary ..........................................................................................................................5 2. Introduction......................................................................................................................................9 3. Methodology ..................................................................................................................................10
3.1 Study site ....................................................................................................................................... 10 3.1.1 Environmental context TNS ........................................................................................................ 12 3.1.2 Social context TNS....................................................................................................................... 13 3.1.3 Importance of the TNS Landscape ......................................................................................... 13
2.1 Data collection methods ............................................................................................................... 16 3.2 Data entry and analysis ................................................................................................................. 16
Aggregations ........................................................................................................................................ 17 Logistic regression analysis .................................................................................................................. 18 Test of income inequality and the role of mining income................................................................... 18
3.3 Definitions ......................................................................................................................................19 4. Results ............................................................................................................................................20
4.1 Country mining sector overviews .......................................................................................... 20 4.1.1. Cameroon............................................................................................................................... 20
4.1.2 Central African Republic ............................................................................................................ 23 4.1.3 Republic of Congo ..........................................................................................................................25
4.1.4 Artisanal mining institutions .................................................................................................. 25 4.1.4 Livelihoods impacts of artisanal mining...................................................................................... 29
National economic impacts ............................................................................................................. 30 Employment creation....................................................................................................................... 30 Infrastructure development ............................................................................................................ 30 Educational and healthcare improvements..................................................................................... 30
4.1.5 Environmental impacts of artisanal mining ........................................................................... 31 4.1.6 Environment and livelihoods ................................................................................................. 32
4.2 Stakeholder consultations ......................................................................................................................33 Conservator of Lobeke National Park (LNP), Cameroon...................................................................... 33 Divisional Delegate of Mines ............................................................................................................... 33 Divisional Delegate of Environment .................................................................................................... 34 Bio-monitoring and socio-economic officers, Dzanga -Sangha Project................................................ 34 Senior Divisional Officer, Sangha-Mbaere ........................................................................................... 35 Village Perceptions............................................................................................................................... 35
4.3 Field results ........................................................................................................................................ 35 4.3.1 Biodata of artisanal miners in the TNS ....................................................................................... 35
Gender of miners ............................................................................................................................. 37 Ethnic affinity ................................................................................................................................... 38 Marital status ................................................................................................................................... 39

Impacts of mining on livelihoods and environment in the TNS landscape
ii
Education ......................................................................................................................................... 41 4.3.2 Mining operations in the TNS ..................................................................................................... 42
Labour .............................................................................................................................................. 43 Quantification of mineral production per month............................................................................ 43 Costs of Production materials .......................................................................................................... 46 Mining revenues, costs and net incomes ........................................................................................ 48 Control and regulations ................................................................................................................... 50 Functioning of markets .................................................................................................................... 52 Price trends and ambiguities ........................................................................................................... 52 Fiscal regimes ................................................................................................................................... 54
4.3.2 Environmental impacts ............................................................................................................... 56 3.3.3 Safety and health ........................................................................................................................ 59 3.3.4 Processing and production tools ................................................................................................ 60 3.3.5 Alternative sources of income .................................................................................................... 61 3.3.6 Use of mining income ................................................................................................................. 64
3.4 Problems and Opportunities of artisanal mining in the TNS ............................................................. 66 3.4.1 Problems ..................................................................................................................................... 66
3.4.2 Opportunities .................................................................................................................................. 67 3.4.3 Aggregated data.............................................................................................................................. 69 Gini Coefficients ....................................................................................................................................... 70 Logistic regression results ........................................................................................................................ 70
4. Conclusions.....................................................................................................................................72 5. Recommendations .........................................................................................................................74 6. Bibliography....................................................................................................................................75 Appendices
Appendix 1a: Tukey test for comparison of means of other revenue sources- Cameroon .................... 78 Appendix 1b: Tukey test for comparison of means of other revenue sources – Central African Republic.................................................................................................................................................................. 78 Appendix 2a: Tukey test for multiple comparisons of means of uses of mining revenues –Cameroon . 80 Appendix 2b: Tukey test for multiple comparisons of means of uses of mining revenues -CAR............ 81 Appendix 3: Resource persons contacted and addresses ....................................................................... 82 Appendix 4: Questionnaire to miners ...................................................................................................... 84 Appendix 5: Questionnaire to organizations and partners ..................................................................... 91 Appendix 6: Terms of Reference.............................................................................................................. 93

CIFOR-IUCN Landscapes Livelihoods Impacts of mining on livelihoods and environment in the TNS landscape
1
Acknowledgements
This research was realised with the support and assistance of local organisations and individuals. Thanks to Mr Victor Amougou of CEFAID-Cameroon and Mr Mathias Heinze, GTZ-Bayanga for assistance in locating mining sites, data collection on the Cameroonian side of the TNS and with transport logistics. Data analysis and maps were produced with assistance of Eric Kamgnia, Bruno Bokoto, Philippe Roth and Kamiss Amiss. Thaks to our field enumerators: Eloi Djenda Kouatadiba, Bruno Brachka, Moupen Joseph, Kondji Appolinaire and William M. Valuable information was provided by Senior Divisional Officer of Sangha Mbaere Division; the conservator of Lobeke National Park, Albert Mounga Abana; the Divisional Delegate of Mines, Lahandi Yetnang Prosper; the Divisional Delegate of Environment, Emanga Emanga; the president of the Federation of miners FEDAMINE Modigui Keneye Guy Simplice and the president of GIC/Mineur Boumba, Ngwerium Japhael. We also thank the chiefs of Zega, Mboy, Nguingueli and Ngola villages for collaboration.
Exchange Rate at 30-01-2009
Communauté Financière Africaine Francs BEAC 1.0 CFA
=
United States Dollars 0.00196388 USD
509.195 CFA 1.0 USD

CIFOR-IUCN Landscapes Livelihoods Impacts of mining on livelihoods and environment in the TNS landscape
2
List of acronyms
ASM………... Artisanal and Small-scale Mining BECDOR……Bureau d’Évaluation et de Contrôle de Diamant et d’Or CAPAM……. Support and Promotion Framework of mining activities in Cameroon CAR…………Central African Republic CASM……… Collaborative Group on Small-scale Mining CEFAID……. Centre pour l’Education, la Formation et l’Appui aux Initiatives de Développement au Cameroun. CIFOR………Centre for International Forestry Research CRJP………...Council for Responsible Jewellery Practices DRC…………Democratic Republic of Congo EITI………….Extractive Industries Transparency Initiative GDP………… Gross Domestic Products GTZ………… German Technical Corporation ICMM……….International Council for Minerals and Metals IIED…………International Institute for Environment and Development ILO…………. International Labour Organisation IUCN-PACO.. World Conservation Union-West and Central African Programme LLS………… .Livelihoods and Landscape Strategy LSM………....Large-Scale Mining MINIFI……...Ministry of Finance MINIMIDT…Ministry of Industry, Mines and Technological Development MMSD ……...Mining, Minerals and Sustainable Development MINEF……...Ministry of Environment and Forestry MINEP……...Ministry of Environment and Nature Protection MINFOF… ....Ministry of Forestry and Wildlife NTFP………..Non-timber forest products PJM…………Professional Jeweler RoC………....Republic of Congo SPSS………...Statistical package for social sciences STD…………Standard Deviation SAESSCAM...Service d’Assistance et d’Encadrement du Small-Scale Mining or Service for the assistance and organisation of small-scale mining TNS………….Sangha Tri-national Park UNCTA D……United Nations Convention on Trade and Development UNEP………..United Nations Environment Programme UNESCO…… United Nations Environment Programme USGSMRP…..United States Geological Survey Mineral Resources Programme WDC………...World Diamond Council WGC………...World Gold Council WWF………...Worldwide Fund for Nature

CIFOR-IUCN Landscapes Livelihoods Impacts of mining on livelihoods and environment in the TNS landscape
3
List of Tables Table 1: Small-scale miners in Sangha Trinational Park area by country and by village ....................... 36 Table 2: Small-scale miners in Sangha Trinational Park area by mining sites........................................ 36 Table 3: Distribution of Small- scale miners in Sangha Trinational Park area into diggers and divers. .. 37 Table 4: Small-scale miners in Sangha Trinational Park area by gender ................................................ 37 Table 6: Small-scale miners in Sangha Tri-national Park area by marital status .................................... 39 Table 7: Small-scale miners in Sangha Tri-national Park area by nationality per country ..................... 39 Table 8: Small-scale miners in Sangha Tri-national Park area by nationality by country ...................... 40 Table 9: Small-scale miners in Sangha Tri-national Park area by age per country ................................. 40 Table 10: Social characteristics of small-scale miners in Sangha Tri- national Park area by country ..... 41 Table11: Small-scale miners in Sangha Tri-national Park area by education level per country ............. 41 Table 12: Small-scale miners in Sangha Tri-national Park area by initiator per country ........................ 42 Table 13: Small-scale miners in Sangha Tri-national Park area by location of mining site per country 42 Table 14. Small-scale miners in Sangha Tri-national Park area by number of labourers and by country43 Table 15: Characterization of gold and diamond production in Sangha Tri-national Park area ............. 45 Table 16: Class distribution of gold and diamond production in Sangha Tri-National Park area ........... 46 Table 17: Characteristics of mining materials and costs in Sangha Tri-national Park area. ................... 47 Table 18: Origin of gold and diamond buyers around the Sangha Tri-national Park .............................. 47 Table 19: Towns/cities from which customers of artisanal miners in the Sangha Tri-national Park area originate by country. ................................................................................................................................ 48 Table 20: Characteristics of income among small-scale miners in Sangha Tri-national Park area......... 48 Table 21: Characteristics of benefit flows to artisanal miners in Sangha Tri-national Park area............ 49 Table 22: Mining control agents in the Sangha Tri-national Park area ................................................... 50 Table 23: Reaction of artisanal miners to control agents in Sangha Tri-national Park area.................... 50 Table 24: Artisanal miners and distance to mining sites in Sangha Tri-national Park area .................... 51 Table 25: Source of capital for artisanal miners in the Sangha Tri- national Park ................................... 52 Table 26: Main buyers of products of artisanal miners in Sangha Tri-national Park area ...................... 52 Table 27: Price trends/variability for gold and diamond in Sangha Tri- national Park area. ................... 53 Table 28: Support and Promotion Framework of mining activities in Cameroon (CAPAM) price reference for Diamond in 2007 ................................................................................................................................ 53 Table 29: Perceptions on the payment of mining tax in the Sangha Tri-national Park area.................... 54 Table 30: Opinion of miners on trends of benefits flows in Sangha Tri-national Park area ................... 55 Table 31: Reasons for changes in benefit flows in the Sangha Tri-national Park area ........................... 55 Table 32: Artisanal miners’ perception on possibility of mineral exhaustion in the Sangha Tri-national Park area. .......................................................................................................................................................... 56 Table 33: Present and past production trends of diamond/gold compared in the Sangha Tri-national Park area ........................................................................................................................................................... 56 Table 34: Opinions on present and past production trends of diamond/gold compared in the Sangha Tri-national Park area..................................................................................................................................... 57 Table 35: Vision of artisanal mining business in the Sangha Tri-national Park area .............................. 57 Table 36: Artisanal miners’ perception on negative environmental impacts of mining in the Sangha Tri-national Park area..................................................................................................................................... 58 Table 37: Environmental impacts of artisanal mining stated by artisanal miners in the Sangha Tri- national Park area................................................................................................................................................... 58 Table 38: Safety and protection measures used by artisanal miners in the Sangha Tri-national Park area.59 Table 39: Treatment measures used by artisanal miners in the Sangha Tri-national Park area. ............. 59 Table 40: Perceptions on the use of current mining equipment in the Sangha Tri-national Park area.... 60

CIFOR-IUCN Landscapes Livelihoods Impacts of mining on livelihoods and environment in the TNS landscape
4
Table 41: Number of other activities performed by artisanal miners around the Sangha Tri- national Park 61 Table 42: Perception of artisanal miners on the best alternative activities outs ide mining in the Sangha Tri-national Park area..................................................................................................................................... 61 Table 43: One way ANOVA tests for differences among other sources of revenue (Cameroon above and Central African Republic below) ............................................................................................................. 62 Table 44: Characteristics of annual incomes from activities outside mining in the Sangha Tri- national Park area. .......................................................................................................................................................... 63 Table 45: Number of basic needs met by using income from artisanal mining in the Sangha Tri-national Park .......................................................................................................................................................... 64 Table 46: One way ANOVA tests for differences among uses of mining revenues- (Cameroon above and Centra l African Republic below) ............................................................................................................. 65 Table 47: Proportion of mining income used for meeting specific household needs (%) ....................... 65 Table 48: Problems faced by artisanal miners in the Sangha Tri- national Park area .............................. 67 Table 49: Opportunities cited by artisanal miners for resolving the problems they face in the Sangha Tri-national Park area..................................................................................................................................... 68 Table 50: Opportunities for government to resolve the problems faced by artisanal miners in the Sangha Tri-national Park area............................................................................................................................... 68 Table 51: Types of government support in the artisanal mining sector in the Sangha Tri-national Park area.................................................................................................................................................................. 69 Table 52: Characteristics of miners’ income sources in the Sangha Tri-national Park area ................... 70 Table 53: Results of logistic regression analysis for mining dependency in the Sangha Tri-national Park area. .......................................................................................................................................................... 71 List of Figures Figure 1: Map of the Sangha Trinational Park (TNS) Landscape ........................................................... 11 Figure 2: Artisanal mining sites in the Sangha Tri-national Park landscape ........................................... 14 Figure 3: Map of the Cameroon mining areas ................................................Erreur ! Signet non défini. Figure 4: Artisanal Mining Poverty Trap…………………………………………………………... 32 Figure 5: Open mines in the Sangha Tri-national Park (TNS), Congo Basin.......................................... 34 Figure 6: Small-scale mining at Badengue mining site with a scale for weighing gold.......................... 44 Figure 7: Diamond pellets (left) and Gold pellets (right) ........................................................................ 45 Figure 8: Mean annual incomes from mining and other sources in the Sangha Tri-national Park area .. 64 Figure 9: Proportion of mining income used for basic needs around TNS Park .................................... 66

CIFOR-IUCN Landscapes Livelihoods Impacts of mining on livelihoods and environment in the TNS landscape
5
1. Executive Summary Gold and diamond mining together constitute more than half of all mineral exploitation worldwide. Africa hosts 30 percent of the world’s natural mineral wealth and has the largest percentage of the world’s poor. The worlds 10 to 15 million artisanal miners produce 25% of the world’s gold. While mineral exploitation contributes to the livelihoods of many, but also generally leaves an impact on the environment which may ultimately be detrimental to livelihoods. The impacts on both the environment and livelihoods are of particular concern in important landscapes, such as the Sangha Tri-National Park (TNS) covering Cameroon, the Central African Republic and the Republic of Congo. This report on the impact of artisanal gold and diamond mining in the Sangha Tri-National Park (TNS) results from a joint initiative of the Centre for International Forestry Research (CIFOR) and the World Conservation Union, Central and West African Office (IUCN-PACO). The Sangha Tri-National Park (TNS) covers the Lobeke National Park in Cameroon, the Ndouable-Ndoki National Park in the Republic of Congo (RC) and the Dzanga-Ndoki National Park and the Dzanga-Sangha Dense Special Reserve in the Central African Republic (CAR). Artisanal mining and other economic activities taking place in and around the park are critical to sustain people but can equally threaten the valuable TNS landscape. Artisanal and small-scale miners in these countries have limited rights typical of artisan l miners, and often expose themselves to harsh working and living conditions in a high-risk context. Nonetheless, involvement in this activity continues to expand. Artisanal and small-scale mining is both poverty driven and poverty alleviating and its continuing attraction is the opportunity it provides to many to secure their household’s survival, however minimalist.The main purpose of this study is to understand how artisanal mining affects livelihoods and the environment in the TNS landscape. It contributes to a general knowledge and policy gap about the nature of artisanal and small-scale mining (ASM). Specifically, the study offers recommendations that support poverty reduction by addressing key issues in small- scale mining activities in the context of sustainable management of the Sangha Tri-National landscape. The research methodology consisted of a literature review, interviews with 131 (63 gold and 68 diamond) miners on household, mining and environmental aspects of their activities, discussions with stakeholders and field visits to 17 mining sites (13 in Cameroon and 4 in CAR) located within 50 km of the TNS. Data was analyzed using twelve parameters to calculate annual production, costs, gross and net revenues, and aggregate of observed values. Miners were dichotomized by their level of dependency on artisanal mining. Coefficients, of which one includes ‘absolute miners’ income’ and the second is based upon ‘absolute incomes excluding mining’, have been developed and were compared in order to reveal whether mining incomes contribute to reducing inequality. Artisanal and small scale mining (ASM) is of particular importance in developing countries and worldwide there are 100 million people, 10 to 15 million of which are artisanal miners, depend on the exploitation of minerals for their livelihoods. The gold and diamond sector are responsible for about 60 percent of all artisanal mining. In general, the ASM sector has a low level of financial investment and technical inputs and is very labor intensive, with low levels of mechanization, production and efficiency. Miners generally gain a small income from mining and are simultaneously engaged in other activities such as subsistence agriculture. Besides the revenues that provide direct income for artisanal miners, governments play an important role in re -distributing mineral exploitation revenues (from royalties, taxes, license fees) to essential government services. This demands ‘good governance’ and appropriate policies, regulations and fiscal regimes in the country. Those laws and regulations are also crucial in defining the rights of miners and communities, setting standards for environmental impact assessment and mitigation

CIFOR-IUCN Landscapes Livelihoods Impacts of mining on livelihoods and environment in the TNS landscape
6
measures, and requiring financial and social obligations for new mining operations. All of this co-determines the eventual outcomes of mining in terms of national economic impacts, employment creation, infrastructure development, improvements in health and educational systems and environmental impacts. The countries of this study, Cameroon and the Central African Republic, both have mineral sectors characterized by artisanal and small scale mining activities. On an international and regional level, small-scale mining receives little attention. On a national level, in both countries, mining falls under a legal framework structured by a Mining code, Tax code and Environmental code. Cameroon now faces a dynamic sector with new diamond deposits being discovered and industrial exploration permits being granted. One challenge recognized by provisions of the 2001 Mining Code, is to mitigate problems related to small-scale mining (ASM) and large-scale mining (LSM) operations on the same site. In 2003, the Support and Promotion Framework of Mining Activities organization (CAPAM) was created to facilitate, assist and promote small-scale mining and aid up-scaling to large-scale mining operations. The CAR, with no industrial mining due to a history of political instability in combination with the land-locked geography and minimal infrastructure, recently developed investor friendly regulation in the form of the 2004 Mining Code. This codifies the issuing and renewal of artisanal mining permits. CAR has significant artisanal diamond production with a special administrative unit Bureau d’evaluation et de Control de Diamond et d’Or (BECOR) overseeing the market, producing statistics and issuing licenses to diamond diggers and 160 collecting agents who to sell to the two purchasing offices in Bangui. The CAR is member of the Kimberley Process, an international diamond certification scheme aiming to stop the trade of ‘conflict diamonds’. Interviews with key actors (such as the park conservators, government representatives in charge of mines, forest and the environment, and representatives of international non-governmental organizations) and villages meetings provide insights into the problems of artisanal mining activities in and near the TNS landscape. Key issues for the artisanal mining sector include:
• Lack of organization and technology of the sector • Lack of information and awareness on the mining codes • The buffer zone of the Lobeke National park attributed to mining operators under research permit
titles • Miners operate within the interior of the reserve (especially in the northern section of the Szanga-
Ndoki National park in CAR and the southern part of Lobeke National Park in Cameroon) • Miners do not capitalize the economic value of their revenues (no saving culture/ reinvestment) • Lack of environmental impact assessment of activities carried out and information with miners on
more environmentally friendly exploitation techniques. This leads to water and soil pollution, disturbing of fish breeding grounds, increase of infrastructure into the forest environment, un-recovered exploited mining pits and poaching of wild animals.
Two types of miners were observed: ‘diggers ’ who dig shallow pits and ‘divers’ who scoop sand and soil from the Sangha River. Although from diverse ethnic groups, the majority (95% Cameroon and 87% in CAR) of miners are permanently based in the local towns and villages. Over 50% in both countries are between 25 and 35 years old, although in Car slightly older, probably related to the longer history of artisanal mining. Miners had on average been engaged in mining for 26 years, In CAR no women were leading mining activities whereas in Cameroon 13% of miners were women. However, in both countries, most miners are married, and assisted by (family) labor, involving many women and children. Education among the miners is generally low with over 70% of the miners attaining primary school level or having no formal education at all.

CIFOR-IUCN Landscapes Livelihoods Impacts of mining on livelihoods and environment in the TNS landscape
7
Mining is the principal activity for 79% and 88% of miners in Cameroon and CAR respectively, although often combined with between one to six other activities. Agriculture is the second important source of income followed by non-timber forest product gathering in Cameroon and fishing in CAR. The dependency of artisanal miners on mining activities in the TNS landscape was found to be significant. Ethnic group, education level and time spent on mining were the main explanatory variables with significant effect on mining. Other variables, such as number of wives, mineral mined and occupation as miner (full or part-time) showed a positive, though not significant, relationship with dependency. All minerals mined in the region are sold unprocessed by the small-scale miners. Generally, artisanal miners are not organized. Although the prices for gold rose in recent years, mimicking global price increases, miners have no bargaining power and remain ‘price takers’ with their sponsors or traders at the regional markets. Variability in the price of diamonds is enormous, as miners possess no methods or tools to analyze weight or quality and therefore calculate unit prices. Most miners sell to individual buyers; 67% in Cameroon and 94% in CAR. In Cameroon, the Government run CAPAM initiative has brought a level of structure to the market and provided equipment and technical assistance to small-scale miners since 2006. The mean annual net income from gold and diamonds – after reduction of costs for production materials, labor and transport - were 575,338 CFA and 812, 644 CFA (1,130 and 1,596 US$) respectively in Cameroon. On the CAR side of the TNS, diamond miners obtained an average annual net income of 368,084 CFA (723 US$). Whilst these incomes are all above the standard poverty line measure of $2 a day (Cameroon gold miners at 3.1 US$, diamonds miners 4.37 US$ and 1.8 US US$ for CAR diamond miners), they still constitute low incomes. The variation in the level of incomes however between miners is enormous, ranging considerable profit to significant losses, with net losses of up to 1,032,450 CFA (2028 US$) in CAR. At least 3510 people (517 miners and their dependents; average of 5.3 in Cameroon and 8.1 in CAR), loosely based around four main villages, are dependent upon mining incomes from the TNS Landscape. Mining incomes were spent on six basic needs in Cameroon and CAR, primarily food (of which alcoholic drinks represented 20%), with considerable parts goes to education of children, purchases of clothes, drugs, construction of houses and purchase of radios and televisions. It is clear that mining income in the TNS can be used to increase the possibility of meeting the Millennium Development Goals of reducing poverty and meeting basic needs. The role of the government in the artisanal mining sector was more obvious in the CAR because labor taxes are collected from a little over 56% of the miners. Small scale miners pay an annual tax of 2000 CFA Francs while the head of sites paid an annual tax of 30050 CFA Francs. Collectors or buyers normally pay an annual tax of up to 1100 000 CFA Francs. In Cameroon small-scale miners do not pay tax although the mining code has the provision of an annual tax payment. Environmental impacts from artisanal mining in the TNS Landscape appear to be temporal, of limited size short term and of low significance. The majority of mining takes place along streams, so that direct but temporal and insignificant impacts include temporal diversions, siltation and sedimentation of streams. Only limited felling of trees or land clearance was observed, which is mainly short term. Land tended to be cleared for the period of mining, often temporal or seasonal, and then abandoned, with no or little farming activities taking place in the mining areas. The indirect effects of working in the forest areas, leading to timber and non timber forest products is, particularly bush meat and medicinal plants, appear limited as only up to 21% (Cameroon) and 28% (CAR) of respondents indicated these as a secondary or alternative activity. Whilst NTF Ps, hunting and fishing were also classified as important alternative sources of income, they provided a lower contribution to annual incomes than farming. In both Cameroon and CAR over 53%

CIFOR-IUCN Landscapes Livelihoods Impacts of mining on livelihoods and environment in the TNS landscape
8
of the artisanal miners stated that gold and diamond are infinite resources and 67% of the miners believed that mining had no negative environmental impacts. Stakeholders who stated that they were aware of environmental impacts mentioned the issues of: unfilled open mines and water contamination or diversion of streams. In Cameroon, 20% of the miners indicated that they (also) mine inside the reserve, in contrast to only 1 (out of 32 miners) in CAR. The miners do not report any use of mercury or cyanide for gold extraction. The problems of the small scale miners in the TNS region were cited to include lack of food and medicines, harassment by conservation agents, dishonesty of sponsors, low production, harsh government laws and actions, lack of mineral detecting and exploitation materials, prices changes and lack of start up capitals. In Cameroon, the most crucial problems included lack of detecting and exploitation tools, lack of food/medicines at sites and low production. In the CAR, the two most crucial problems were low production and lack of detecting and exploitation equipment. In conclusion , poor governance and informality characterize the artisanal mining sector in the Sangha Tri-National Park landscape. Mining provides a considerable income for over 3000 miners and their dependents and pays for important basic needs. However it leaves others with close to nothing or debts. Miners in the TNS landscape cited a number of opportunities for resolving their problems including assistance to get obtain tools and legal papers. Recommendations for key stakeholders: regional government, ministries, non-governmental organizations, private sector and development agencies, are: 1) Stakeholders could enhance livelihoods and minimize environmental impacts by harmonizing strategies
relevant to the mining sector, and discussing areas of conflicting interests - particularly the relations between small- scale and large-scale mining activities, and mining activities in timber concessions and protected areas. This would enable the environmental services of the TNS landscape to be taken more into consideration in development planning.
2) The implementation of the Mining Code and resource governance strategies in the three countries sharing the TNS areas should be harmonized in order to tackle issues about ASM in and near the TNS and trans-boundary trafficking. This requires sound knowledge of the key actions that could improve resource governance, increase transparency among collectors or buyers and methods to reduce bureaucratic bottlenecks as well as corruption.
3) Artisanal miners need to be informed about the mining laws and how to operate legally and to access
mining titles. Sensitization campaigns, collaboration between government departments and NGOs with access to mining sites, could be vehicles to achieve this.
4) Improved knowledge of mining techniques, tools, valuation and miners bargaining power could result
in improved and less variability in incomes. This could be achieved by supporting miners to organizing themselves, creating forums for information exchange and sharing experiences on production, processing, financial management and market skills.
5) Improving artisanal and small scale miners livelihoods by supporting them to diversify incomes with
alternative activities such as NTFP gathering, farming and livestock rearing.
6) Promote development policies that stimulate environmentally sound mining practices in the TNS region, such as maintaining chemical free mining practices,

CIFOR-IUCN Landscapes Livelihoods Impacts of mining on livelihoods and environment in the TNS landscape
9
2. Introduction This study was commissioned to the Centre for International Forestry Research (CIFOR) by the World Conservation Union, Central and West African Office (IUCN-PACO) to research on the impacts of artisanal gold and diamond mining on livelihoods and the environment in the Sangha Tri-national Park (TNS) area (shared by Cameroon, the Central African Repub lic and the Republic of Congo), as part of a multi-partnership project termed Landscape and Livelihoods Strategy (LLS). The project is led by IUCN-PACO with the overall aim to contribute to the sustainable management of the Sangha Tri-national landscape and to put in place activities that can lead to poverty reduction for adjoining populations. Economic activities that form major sources of livelihoods to the local people as well as highly threatening the TNS landscape include logging, poaching, fishing, collection and sale of non-timber forest products, slash-and-burn agriculture and artisan gold and diamond mining (Tieguhong and Ndoye, 2007). Gold is a precious mineral found in appreciable quantities in all the six countries of the Congo Basin (Equatorial Guinea, Gabon, RoC, DRC, CAR and Cameroon). In all these countries excepting Equatorial Guinea, proven appreciable quantities of diamonds have also been found (Reed and Miranda, 2007). The main uses or applications of gold are in electronics, dentistry, decorative plating of jewellery, watchcases, pens and pencils, spectacle frames and bathroom fittings, decoration of china glass and store of value. The main applications of diamonds include jewellery, industrial fittings and machinery. Available information on the management of natural resources in the Congo Basin is at best qualitative and the scale to which individual or collective activities affect the landscape and the lives of the people is poorly understood, rendering appropriate conservation/development policy and decision-making to resolve them difficult (Tieguhong and Zwolinski, 2008). Such is the case with artisanal and small-scale gold and diamond mining in the TNS region in particular and central Africa at large. For example, according to MINEF (1996), irrational exploitation of mineral resources in Cameroon could be attributed to four direct and immediate causes including inadequate knowledge on the state of the resource, poor management and control of the trade chain, inadequate exploitation techniques and the inexistence of favourable conditions that can trigger the development of the sector. There is a lack of knowledge on the nature and importance of artisanal and small-scale mining (ASM) around the world and basic statistics on the number of miners, health and safety and the environmental situation are not available (MMSD, 2002). However, research on ASM gradually starts to develop and contributes to an understanding of how the sector can better contribute to sustainable development (MMSD, 2002).. Dublin and Taylor (1996) emphasized the need for making management decisions from sound data, which forms the major reasoning behind this study. Indicators to this end include the definition of the number of villagers, networks and their profiles, an estimation of the income generated by locals; a proper mapping of the areas being exploited leading to a better understanding of the environmental and livelihoods impacts of ASM. Therefore, the objective of this research was to elicit information on the problems, functioning and prospects for better artisanal mining arrangements and to provide recommendations that can meet future needs for a socially equitable and environmentally friendly small-scale mining. In this light, all artisanal miners could have equitable access to the resource in an organized marketing system under better governance arrangements.
Supprimé: problem of information gap, consequential to a great
Supprimé: because
Supprimé: hard to measure
Commentaire [JS1]: hard to measure/ not available ?
Supprimé: artisanal and small-scale mining
Supprimé: (
Supprimé: )
Supprimé: is to develop an

CIFOR-IUCN Landscapes Livelihoods Impacts of mining on livelihoods and environment in the TNS landscape
10
3. Methodology
3.1 Study site This research was conducted in the Sangha Tri-national Park (TNS) landscape in Cameroon, the Republic of Congo (RC) and the Central African Republic (CAR).

CIFOR-IUCN Landscapes Livelihoods Impacts of mining on livelihoods and environment in the TNS landscape
11
The Sangha Tri-national Landscape is spread over three countries: Cameroon, the Central African Republic (CAR) and the Republic of Congo (Figure 1). The Congolese section of the Landscape extends over the administrative departments of Sangha and Likouala. It covers 21,470 km² and includes Nouabale-Ndoki National Park (PNNN) plus five forest manageme nt units (UFAs) which cover an overall area of 17,280 km² and form the buffer zone of the national park. In the north, the area is delimited by the UFA of Mokabi; in the south by the UFAs of Pokola and Toukoulaka; in the east by the UFA of Loundoungou and in the west by that of Kabo. In the west, Nouabale-Ndoki National Park borders on Dzanga-Ndoki National Park and Dzanga -Sangha Special Reserve in CAR. Th e CAR section covers 4,644 km2 and includes Dzanga-Ndoki National Park and Dzanga-Sangha Special Reserve. The Cameroonian section is centered on Lobéké National Park.
Figure 1: Map of the Sangha Trinational Park (TNS) Landscape
CIFOR-IUCN Landscapes Livelihoods Impacts of mining on livelihoods and environment in the TNS landscape
12
3.1.1 Environmental context TNS The entire Landscape is located on plateaus broken up by alluvial plains. Altitude varies between 330 and 600 m in the Republic of Congo and reaches nearly 700 m in CAR. The Landscape contains the headwaters of four major rivers draining the north of the Congo River. Those of the Mabale, the Likouala and the Ndoki rivers are in PNNN; that of the Ibenga River is located in the UFA of Mokabi.The average annual precipitation is about 1,450 to 1,600 mm, with a dry season lasting an average of two to three months and is centered on January-February, with August the rainiest month. The vast majority (93%) of the Landscape is composed of highly biodiverse dense rainforest, with some semi-caducifoliated terra firma forests rich in species such as Terminalia superba (limba), Sterculiaceae, in particular Triplochyton scleroxylon (ayous), and Ulmaceae. It also contains forests with a monodominance of Gilbertiodendron dewevrei and Marantaceae. 5.6% of the Landscape is inundated, mixed swamp forests with riparian forests of Uapaca heudelotii and raffia palm groves. These forests are punctuated with grassy clearings and bais 0.3% of total area, as well as lakes, rivers and streams. In the areas that have been logged, rattan forests are growing. Less than 0.6% is forest cultivation mosaic. In the Congolese section more than 1,700 species have been inventoried. Among the trees several species appear on the IUCN Red List: Autranellacongolensis , Pericopsis elata (afrormosia), Diospyros crassifl ora (ebony) and Swartzia fi stuloides (paorosa or African tulip wood). In addition, all the species of the genera Entandrophragma and Khaya that have been logged are considered vulnerable, as are other commercial species: Aningeria altissima(anigre), Mansonia altissima, Pausinystalia macroveras (tsanya) and Gambeya pulpuchra (longhi). with PNNN is a sanctuary for all these species, but is dependtn upon sustainable management of the surrounding concessions in order not to lose these important resources. The Landscape is also exceptionally rich in its biodiversity of fauna, In the CAR sector, 105 species of land mammals have been identified, in particular: the African forest elephant Loxodonta africana cyclotis; sixteen species of primates, among them the gorilla Gorilla gorilla, the chimpanzee Pan troglodytes and at least six small nocturnal species; fourteen species of ungulates, including the bongo antelope Tragelaphus euryceros (a species that is declining rapidly in Central Africa and is very rare in East Africa); and fourteen species of carnivores, including the leopard Panthera pardus and the spotted neck otter Lutra maculicollis. The hippopotamus Hippopotamus amphibius still has a significant population along the Sangha River. Over 428 species of brids have been recovered in the Congolese section, 379 in the CAR section and 350 in the Cameroonian section. A significant population of the Dja River warbler Bradypterus grandis , a species endemic to the marshes of Rhynchospora of Lower-Guinea, exists in Lobéké National Park; this species is also known in the marshes of PNNN. An as of yet un-described species of night jar Caprimulgus sp. has been found in Lobéké National Park and PNNN. A new species of Turdidae, Stiphrornis sanghae, was described in 1999 in Dzanga -Sangha and has not yet been found elsewhere. Reptiles found in this Landscape are typical for the region and include the Nile crocodile Crocodylus niloticus, the slender-snouted crocodile Crocodylus cataphractus, the dwarf crocodile Osteolaemus tetraspis (an endangered species), the Nile monitor lizard Varanus ornatus, the softshell turtle Trionyx triunguis , the African rock python Python sebae, the royal python Python regius,the coiled Gabon viper Bitis gabonica and th green mamba Dendroaspis jamesoni. Fish species are little known, despite their importance for local populations. In the Cameroonian portion of the Sangha Basin, more than 200 species of fish have been identified, and the whole basin has nearly 300 identified species. The Sangha is a very dynamic environment because of silting and seasonal fluctuations

CIFOR-IUCN Landscapes Livelihoods Impacts of mining on livelihoods and environment in the TNS landscape
13
that influence reproduction, the feeding regime and the distribution of the fish. Among the most remarkable families in the areas of the flooded or floodplain forests are the Alestiidae with Hydrocynus goliath, the Aplocheilidae, the Cichlidae with the genus Tilapia, the Claroteidae with the genus Auchenoglanis, the Cyprinidae with the genuses Labeo and Barbus, the Mochokidae with the genus Synodontis , the Malapteruridae with the electric catfi sh Malapterurus sp. and the Schilbeidae. (CBFP 2006).
3.1.2 Social context TNS The Landscape has in general a very low population density, estimated at 0.7 inhabitants/km², although this varies. In CAR, population is estimated at 5,977 inhabitants in the protected areas of Dzanga Sangha, with an average density of 1.2 inhabitants/km². These inhabitants are distributed along the Bayanga-Lindjombo-Bomandjokou and Bayanga-Yobé axes in the interior of Dzanga Sangha Special Reserve. The urban and industrial area of Bayanga houses 60% of this population with high density areas to the north of the Salo reserve, a major industrial logging site. In Congo, density averages 1.5 inhabitants/km² and around PNNN, population is centrered around permanent villages established along the Sangha and around the logging bases of Kabo and Pokola, and the Mokabi UFA, with the Pokola Consesison the largest population center in the region with 13,417 inhabitants, representing the greatest potential impact on the national park and its environs. As the logging company CIB has developed the infrastructure of Pokola between 1999 and 2003, population has increased by 11% per year. In this region, however, there has been a decrease in populations due to emigration toward the large population centers of Pokola and Kabo. Two dominant indigenous ethnic groups inhabit the landscape area include Bantus (predominantly farmers) and pygmies (predominantly forest-centred hunter-gatherers) (Jackson, 2004). The pygmies and Bantus are popularly known as Baka and Bangando/Bakwele in southeast of Cameroon and Ba’aka/Bayaka and Bilos in south-western CAR respectively (Jackson, 2004). Both in Cameroon and CAR, the pygmies are known as prior occupants of forest lands and have a distinctive social structure, lifestyle and livelihood strategy intimately dependent on natural resources (Tieguhong and Ndoye, 2007). Apart from indigenous populations many people from various ethnic backgrounds also inhabit the region. Mining villages such as Souanke and Punga (Boloko, Golana and Pandama mining sites) exist in the north-western part of the Republic of Congo but are over 50 km from the TNS and thus were not visited during this study. Mining sites visited were all located in Cameroon and Central African Republic (Figure 2).
3.1.3 Importance of the TNS Landscape The TNS Landscape contains vast extents of different types of intact, pristine forests with high ecological integrity, a rare phenomenon in the Congo Basin and worldwide. It provides habitats for some of the largest intact communities of large mammals in Africa being particularly important for forest elephants and great apes. The presence of bais, environments much sought after by many mammals and birds, is an essential asset. The forests of the Landscape have been recognized as critical for conservation in Africa and as one of the priority areas for forest conservation in the northwest Congolese forests ecoregion. There are major opportunities for conservation with protected areas covering 21.5% of the whole landscape (752,000 ha) and cross-border cooperation agreements signed in 2000 by the three countries involved with a view to improve conservation of the protected areas. The governments and international organizations such as WWF, IUCN and UNESCO actively engaged in the conservation of the protected areas and moves towards sustainable management of the buffer zones in two of the three countries.

CIFOR-IUCN Landscapes Livelihoods Impacts of mining on livelihoods and environment in the TNS landscape
14
Mining zones Figure 2: Artisanal mining sites in the Sangha Tri-national Park landscape

CIFOR-IUCN Landscapes Livelihoods Impacts of mining on livelihoods and environment in the TNS landscape
15
Figure X Map with current logging concessions XX GFW

CIFOR-IUCN Landscapes Livelihoods Impacts of mining on livelihoods and environment in the TNS landscape
16
2.1 Data collection methods The methods to collect data and results presented in this report included: v Interviews with a 24% sample of miners guided by questionnaires (Appendix 1) with artisanal
miners and semi-structured interviews conducted with stakeholders (Appendix 2) on general perceptions on the types, trends of mining processes and other income portfolios, perceptions on environmental degradation, benefit flows, characteristics of mining and its governance;
v consultation meetings and focus group discussions with local administrations, TNS park officials, village chiefs, counsellors and other local stakeholders;
v documentary analysis or desk reviews of literature of published mining permits, national laws and regulations, documents produced by support and mining organisations.
v consultation of unpublished reports from government ministries (MINFOF, MINEP, MINIMIDT-CAPAM) and local NGOs;
v informal discussions with staff of stakeholder organisations on the social and environmental impacts of small-scale mining covering sources of conflicts, problems and risks to the sustainability of their activities and definition of the 4 main interview villages;
v Field visits (in Cameroon and CAR) to current mines located within 50 km of the borders of the TNS area for observation, mapping and photographic documentation.
To elicit relevant information from respondents on the extent that revenues from mining activities were used to meet basic household needs, respondents were asked to score individual uses of mining revenues on a scale ranging from zero to ten (0-10), with 10 implying that mining income was used to meet just one basic need while zero implied that a specified need was not met using mining income. The scores were converted into percentages by the interviewer.
3.2 Data entry and analysis Data analysis was done in three phases: data entry, checking and correcting; the calculation of descriptive statistics and finally performing the logistic regression analysis. Field data entry was done in the CPros version 3.0 typing mask and later transferred using Stat-Transfer version 5.0 into SPSS version 12.0 for analysis. STATA version 8.0 was used for the logistic regression analysis. Information provided by partners and field organizations was recorded as their perceptions and later used to cross-check data provided by artisanal miners. Twelve equations were derived and used in the calculation of annual quantities of minerals, annual costs of production, gross and net revenues as well as in the aggregation of observed values. Monthly income *12 for all seasons miners Annual gross mining income = (Eq.1) Monthly income *6 for dry/raining seasons miners Quantity/trip*No. of trips/month *12 for all seasons miners (Eq.2) Annual quantity of mineral=

CIFOR-IUCN Landscapes Livelihoods Impacts of mining on livelihoods and environment in the TNS landscape
17
Quantity/trip*No. of trips/month *6 for dry season miners Annual net mining income = Annual gross mining income - Annual mining cost--- ( Eq.3) Annual mining cost = Annual material cost + Annual transport cost + Annual tax cost + Annual labour cost------------------------------------------------(Eq. 4)
1
Annual material cost = ( cos ) /( )n
i ii
material t l i f e s p a n=
∑ ----------------(Eq. 5)
Annual tax cost was fixed among all miners that paid labourers’ tax (2000 CFAF) or chief of site’s tax of 30050 FCFA in CAR. No miner in Cameroon acknowledged having paid any tax to government, thus there was no tax costs in Cameroon. Total monthly transport cost *12 for all season miners Annual transport cost = (Eq. 6) Total monthly transport cost *6 for dry seasons miners Total number of paid workers*amount of pay per day*30*12 for all season miners Annual labour cost = (Eq. 7) Total number of workers*amount of pay per day*30*6 for dry/raining season miners Aggregations
131 131
1 1
Total miners' income = (income from mining)+ (income from other sources)i ii i= =∑ ∑ --------- (Eq.8)
8
1
( )ii
Income fromothersources othersources=
= ∑ --------------------------------------- (Eq. 9)
Where other sources include: NTFPs gathering, fishing, farming, hunting, livestock rearing, paid labour, trading and others.
131
1
Total income from natural sources = (income from NTFPs+ hunting + fishing + mining) ii =
∑ (Eq. 10)
Total income from mining*100%
Relative mining income = Total miners' income (Eq. 11)
Total income from natural sources*100%Relative income from natural sources =
Total miners' income (Eq. 12)
An analysis of variance (ANOVA) level one test was used to test for differences among two or more independent groups. The mean incomes was separated from other livelihood parameters and ranked using the multiple comparison Tukey test at 5% level of significance. Similar tests and rankings were conducted to separate the means of the uses to which miners spend their mining income.

CIFOR-IUCN Landscapes Livelihoods Impacts of mining on livelihoods and environment in the TNS landscape
18
Logistic regression analysis In order to apply the logit model, miners were dichotomized into those that were highly dependent on artisanal mining and those that were of lower dependency on the same. For this study it was supposed that a miner in any of the studied villages was dependent on mining if the proportion of his/her total mining income was more than the calculated average gold/diamond mining income in studied villages for Cameroon or Central African Republic. According to Masozera and Alavalapati (2004) and Gujarati (1995), by dichotomizing the income of natural resource users into high and low dependencies, policies and strategies to reduce or improve their dependenc y on those resources can be better designed. The model used to estimate miners’ dependency was specified as follows: In [Pi/(1-pi)] = ß0 + ß1X1i + ß2X2i +……+ ßkXki where subscript i denotes the i-th observation in the sample, p is the probability of the outcome, ß0 is the intercept term, and ß1, ß2,…., ßk are the coefficients associated with each explanatory variables X1, X2……Xk (Tieguho ng and Zwolinski, 2008; Vedeld et al ., 2007; Anderson et al., 2006; Dewi et al., 2005; Masozera and Alavalapati, 2004; Bahuguna, 2000; Gujarati, 1995). The explanatory variables used to explain miners’ dependency were: country where mineral is being mined, mining village, number of wives for miners, number of dependents, gender, education, ethnic affinity, time in mining activity (years), occupation as miner (full-time or part-time) and other sources of income . Test of income inequality and the role of mining income A test determine how mining income could narrow or widen the gap between the rich and the poor in the region , taking into account environmental resources – was performed by calculating Gini coefficients (Vedeld et al., 2004) was used to test inequality associated with dependence on mining income. The Gini coefficient of absolute total miners’ income was calculated as:
1 12
| |
2
n n
i ji j
AI
AI AIG
n µ= =
−=
∑∑
Where n is the sample size and µ is the sample average. So the Gini coefficient for income inequality is simply the relative mean difference between all possible income pairs i and j in the sample. If we construct a new variable “absolute non-mining income (ANMI)”, that is, absolute income from all sources other than mining, such that: ANMI = AI – AMI then we can calculate another Gini coefficient for absolute incomes excluding mining income:
1 12
| |
2
n n
i ji j
ANMI
ANMI ANMIG
n µ= =
−=
∑∑
A comparison of these two Gini coefficients will reveal whether, and to what extent, mining incomes contribute to reducing inequality (Vedeld et al., 2004). If GANMI > GAI, then it implies that mining incomes help reduce income inequality in the region, else the reverse holds true. For instance, Aryal (2002) finds GAI in his study at Budongo, Uganda to increase from 0.55 to 0.61 when forest income is excluded (Vedeld et al., 2004).

CIFOR-IUCN Landscapes Livelihoods Impacts of mining on livelihoods and environment in the TNS landscape
19
3.3 Definitions Surface mine means an excavation in the earth conducted above ground (open-pit mine) for the purpose of opening-up, proving or producing any mineral from a natural deposit. It includes all facilities belonging to or used in connection with the mine (Walle and Jennings, 2001). Risk means the likelihood that something will occur, causing injury or damage to the health of people and hazard means the potential to cause injury or damage to the health of people (Walle and Jennings, 2001). Artisanal and small-scale mining (ASM) broadly refers to mining by individuals, groups, families, or cooperatives with minimal or no mechanisation, often in the informal (illegal) sector of the market (Hentschel et al, 2002). No universally accepted definition of ASM has been established and in some countries a distinction is made between ‘artisanal mining’ (that is purely manual) and ‘small-scale mining’ (that is more mechanised and on a larger scale). For example, in Mali, Niger and Burkina Faso, small- scale mining is differentiated from artisanal mining by the presence of permanent installations established once the existence of an ore body is confirmed (Hentschel et al, 2000). However, in this report, the two terms are used interchangeably. Large-scale mining (LSM) refers to the major companies as well as to mid-tier and junior-level companies, or any formal company that complies with international performance standards (CASM 2008). Formal miners in this report are understood as those that are orgainsed into groups and/or follow procedures in the ir mining activities while informal miners do not follow any procedure and are unorganised, acting individually, either in the exploitation or marketing of their products. Legal miners are those that have documents backed by the law or mining code of their country while illegal miners do not have any legal document that supports their mining operations.

CIFOR-IUCN Landscapes Livelihoods Impacts of mining on livelihoods and environment in the TNS landscape
20
4. Results The results are categorized into country overviews of the sector and impacts from literature reviews, stakeholder consultation and the interview based field data.
4.1 Country mining sector overviews Artisanal mining is a nature -dependent activity and has evolved differently in countries where minerals occur due to differences in governance and legal systems in place as well as on the existence or absence of national development and political will to promote the sector. This section provides an overview of the artisanal mining sector in Cameroon, Congo and CAR.
4.1.1. Cameroon Cameroon’s major natural resource is petroleum, which provides 50% of export revenues.
Geologically, Cameroon is characterized by Archaean basement, Proterozoic volcano – sedimentary packages (similar to that of the auriferous Birimian Belt of West Africa) and several late stage intrusive phases. Cameroon has extensive bauxite reserves at Minim – Martap and Ngaouanda, located in the north, but requires substantial infrastructure development in order to exploit them. These two deposits have an estimated combined resource of 1 100 Mt of bauxite. China’s Gansu Corporation has intentions to develop a 2 000 Mt bauxite deposit which would provide bauxite to Cameroon’s largest aluminium smelter at Edea. Currently the Edea smelter obtains bauxite from Guinea. Alucam is Cameroon's largest company, and its aluminium smelter is producing and exporting some 90,000 t/y of aluminium from bauxite imported from Guinea. The Mbalam Iron Ore Project is located in close proximity to the Belinga Iron Ore Project in Gabon being developed by the China National Machinery and Equipment Import and Export Corporation ("CMEC"). The Mbalam and Belinga Projects form part of an emerging iron ore province - extending through the Republic of Cameroon, the Congo Republic and Gabon.
Before independence, the artisanal mining sector was organised and contributed up to 20% to the national economy. After independence, the activity continued but remained uncoordinated and subjected to smuggling and exploitation of local actors. Numerous artisanal gold mining sites are known (producing around 1500 kg/year), but it appears that no modern exploration methods have been used to locate Cameroon’s primary gold potential (Mbendi 2008). The resources mined in Cameroon are limited, with annual artisanal production of around 20,000 to 45 000 oz/year of gold and 12,000 ct of diamonds, and various building materials. The government is currently examining the assistance it gives to the artisanal mining sector. To date no primary gold deposits have been successfully located. However, work carried out by the BRGM suggests that gold mineralisation is related to the volcano-sedimentary belts characteristic of the Birimian belt in Niger, Burkina Faso and Mali.

CIFOR-IUCN Landscapes Livelihoods Impacts of mining on livelihoods and environment in the TNS landscape
21
Alluvial gold production is derived purely from elluvial and alluvial workings. The result had been a contradictory production of significant wealth and extreme poverty of the population concerned as well as very limited contrib ution of the sector to national economies. For example, despite the richness of Cameroonian basement, solid mining in 1997/98 fiscal year contributed only 4.8 billion CFA Francs or 0.08% to the GDP of the country (Sale, 2003). The absence of a coherent and driving operational strategic code was blamed for the relegation of the mining sector in favour of agriculture and other sectors as pillars of development. However, in Cameroon today things are taking a U-turn with regards to revamping and reorganising the mining sector. The government is currently examining the assistance it gives to the artisanal mining sector (Gweth, 2003).
As of April 2008, Cameroon had no industrial mining exploitation permits. In 2008 it was reported Lom River Gold Corp (formerly Lorica Resources Inc) from Canada has an option to prospect gold in south eastern Cameroon (Mbendi 2008) and in 2001 3 exploration licenses for gold were valid (Akonolinga 2009). Cameroon’s undeveloped mineral resources include bauxite, cobalt, gold, granite, iron ore, nickel, and rutile. Strong metal and industrial mineral prices since 2003 have encouraged companies to develop mines. The southeast region and nearby regions in Gabon, Republic of Congo, and Central African Republic have few producing mineral deposits and few with near-term production potential. Alluvial gold is artisanally exploited from stream gravels in parts of Cameroon, Gabon, Congo, and Central African Republic.
Strong metal and industrial mineral prices since 2003 have encouraged companies to develop mines. The southeast region and nearby regions in Gabon, Republic of the Congo, and Central African Republic have few producing mineral deposits and few with near-term production potential. Alluvial gold is artisan ally
Commentaire [JS2]: This is confusing sentence following the first phrase. Did the industries all arrive after April 2008 or after 2003?
Supprimé: the

CIFOR-IUCN Landscapes Livelihoods Impacts of mining on livelihoods and environment in the TNS landscape
22
exploited from stream gravels in parts of Cameroon, Gabon, Congo, and Central African Republic. However, the U.S. Geological Survey’s 2002 estimate for total gold production from all four countries combined is less than 1,600 kilograms (Wikipedia, 2008).
The Korean company C&K Mining in collaboration with CAPAM, has explored and proven a huge potential of diamond deposits (estimated volume of 740 million carats) at Mobilong, East Province,. Despite that this being about five times the world’s production; Cameroon has not yet been globally recognised as a country of significant diamond production (Gweth 2008). Almost all artisanal mining sites in Cameroon are covered by industrial mining research permits. In 2003 there were only 2 of such permits but today there are over 70 exploration permits (Gweth 2008). However, the local miners at Mobilong are wary of the presence of C&K Mining Company as they are afraid that they could be evicted when the company starts mining operations. In response to this, the 2001 Mining Code of Cameroon makes provision for resolving problems related to small-scale mining (ASM) and large-scale mining (LSM) operations at the same site.
Cameroon Mineral Policy and regulation Cameroon’s geological and mining sector has two objectives. The scientific objective, under the responsibility of the Ministry of Scientific and Technical Research, which oversees a variety of research institutes in the areas of geology and geophysics, hydrology, and energy. The industrial objective, promoted by the Ministry of Industries, Mines and Technological Development (MINIMIDT), which also has the responsibility for the national geological survey through the Direction of Mines and Geology (still divided in two departments, for Geology and for Mines). In terms of fiscal Regime and Commercial Legislation in Cameroon, mining activities are carried out in a legal framework involving the following laws: Mining Code under the ministries Industry, Mines and technological Development; the tax code including customs, labour and investment codes under the Ministry of Finance; and the Environmental Code under the Ministry of the Environment and Nature Protection. The legal framework for Cameroon’s companies follows French law. The Mining Code consists in a law (1964) which regulates mineral substances, and another law (1978) which defines taxes, royalties and mining taxes. The latter was supposed to define the fiscal framework for mining, but this did not happen quickly until 2001 when the New Mining Code was promulgated (Law No. 1 of April 2001) with the help of the World Bank. This new Law includes fiscal laws necessary for the regulation of this sector with provisions for investors to negotiate on a case by case basis for the establishment of mining companies. This has reduced administrative burdens and increases the evaluation of investment opportunities for which decisions must be made quickly. The advantages embedded in the new code are a reduction in the role of the State in mining operations as well as its discretionary powers, and at the same time an increase in its role as a supervisor and regulator of the mining sector. Environmental aspects are also properly addressed by the new code. According to the code, all mineral resources belong to the State. Prospecting, exploration and mining activities for any mineral deposit are regulated by permits, including: quarry, prospecting/research, exploration, exploitation and mining concession permits (Republic of Cameroon, 2001). These permits have various objectives, property rights, validity and delivery authorities. According to the Investment Code, a Cameroon company must be established, with more than 35% of capital owned by Cameroon citizens, before investments are allowed in the country’s activities. National subsidiaries are allowed (Mbendi, 2005). In Cameroon, traditional administrative structures after independence controlled the small-scale mining sector. This historically faced immerse number of difficulties that led to a drastic reduction of the contribution of the sector to national incomes. In order to circumvent the difficulties embedded in the 1964

CIFOR-IUCN Landscapes Livelihoods Impacts of mining on livelihoods and environment in the TNS landscape
23
mining code, the 2001 mining code made it possible to allow for the set up of an autonomous unit to play the role of facilitation, assistance, promotion of small-scale mining and favouring prospects for evolution towards large-scale mining. This unit, created in 2003 in Cameroon is called CAPAM (Support and Promotion Framework of mining activities in Cameroon).
4.1.2 Central African Republic The Central African Republic (CAR) economy is small and dominated by agriculture and forestry. Over 70% of the small population of 3.7 million live in rural areas and exist by subsistence farming. The agricultural sector accounts for over 50% of the GDP of US$1.5bn estimated for 2005. The GDP real growth rate is estimated at 2.5% for 2005. Export earnings are dominated by diamond sales (40%) and forestry revenues (16%), and are estimated at US$0.13bn for 2004. The CAR has commenced with restructuring and the upgrading of its infrastructure. The country receives economic aid from France and the European Union recently granted the government US$65.5m to rehabilitate a section of the main road linking the capital, Bangui, and the Cameroonian border town of Garoua-M'Boulay to the west (CIA 200). The CAR’s mineral industry is relatively small due to a historical lack of exploration and mining investment. The country has attracted little interest until recently, due to its remote locality and international explora tion being focused on larger countries with well known mineral industries such as Angola and the DRC. A large number of international companies have recently taken up concessions in the country and are currently exploring the CAR for diamonds, gold and petroleum products. These companies include De Beers Group, Axmin Inc, UraMin Inc, Pan Africa Resources PLC, GEM Mining Ltd and Energem Resources Inc. Lack of infrastructure coupled with the fact that the country is landlocked has hindered development in the mineral industry. Artisanal mining in the CA) is of diamonds and gold occurs mostly in the regions of Berbérati, Upper Kotto, and Sangha. Since 1962, 98% of diamonds and 100% of gold were produced in this fashion. Diamonds were discovered in alluvial deposits in various parts of the country in 1935 and 1947. Production, which reached 609,360 carats in 1968, was estimated at 530,000 carats in 2000, 75% of gem quality. Sizable quantities were smuggled out of the country. About 60% of the nation's diamonds came from the upper Sangha region. Gold production, which began in 1930 and peaked at 521 kg in 1980, fell to 26 kg in 1982; it was 100 kg in 2000. Diamonds and gold were still mined in alluvial deposits, by about 40,000 artisanal miners, primarily in the Bandas and the Bogoin-Boali greenstone belts (Encyclopedia of the Nations, 2008). The CAR mining sector is dominated by diamonds and gold, but also includes small tonnages of industrial minerals. Diamond production rose to an estimated 350,000cts in 2004, primarily sourced from alluvial deposits in the north of the country. The country produced 7kg of gold in 2004. 400000 to 800,000 carats of diamond, worth some 50 billion CFA Francs annually is officially produced by the artisanal and small-scale miners. The CAR is the tenth largest producer of diamonds in the world in revenue terms and diamonds account for some 54% of the country’s export earnings (Forster and Bill, 1992). The CAR is well known for its good quality diamonds, ranked 5th in the world in terms of quality (Mbendi 2008). The government keeps statistics concerning diamond production and trading through the Bureau d’Évaluationet de Contrôle de Diamant et d’Or (BECDOR). BECDOR was established in 1982 to oversee the internal diamond market and to valuate official exports. It also maintains a database concerning all diamond production in the country. It estimates that there are approximately 50,000 licensed diamond

CIFOR-IUCN Landscapes Livelihoods Impacts of mining on livelihoods and environment in the TNS landscape
24
diggers, or ‘creuseurs’, in the CAR. The artisanal miners sell their production to about 160 certified collecting agents who, in turn, sell this production to two purchasing offices located in Bangui. As in the diamond industry, the CAR’s gold production is produced by artisanal mining activities. Official production is estimated to be about 100 kg, but estimates are that actual production is around 2 tons a year. Gold production is derived almost entirely from alluvial operations. The CAR has two greenstone belts (the Bandas and Bogoin Boali belts) exposed which have attracted most of the artisanal activity, producing around on ton of gold /year (Mbendi 2008). Due to years of rampant fraud, however, at least twice that amount has arrived in Antwerp, Belgium, the world diamond trading capital, from CAR every year. The mining sector in the CAR contributes less than 5% to national GDP, although this figure is suspected, due to the amount of smuggling taking place (Mbendi 2005). Diamond mining was the country's leading industry and top export commodity in 2002. Mining accounted for about 4% of GDP and 40%–50% of export earnings. The Geology of the CAR is only poorly known, and in conjunction with historic geopolitical risk, explains why the country has been devoid of primary exploration. Other than small- scale exploitation of alluvial diamonds and gold during colonial period, artisanal production of gold has simply been quasi-ignored (Forster and Bill, 1992). The CAR is a member of the Kimberley Process diamond certification scheme. The CAR is a member of the Kimberley Process diamond certification scheme. This process, initiated by the World Diamond Council and the United Nations, and implemented by a United Nations vote in 2003, requires the certification of all diamonds mined and upon every transfer of ownership of the diamonds. The process was implemented to combat the sale of the so-called “blood or conflict diamonds” which were used to fund armed conflict, rebel activities, overthrow of legitimate governments and the trade in armaments, especially prevalent in Sierra Leone, Angola and the DRC. Mining Code of CAR The mining sector is under the responsibility of the Ministry of Mines and Energy, after having been attached directly to the Presidency. A General Directorate for Mineral Resources implements the laws and policies regarding permits, and processes requests prior to their submission to the government for approval. The Mining Code regulates mining activities. All mining licenses in the country were suspended in 2003, following the overthrow of the government. After being criticized by many experts in the sector for its inflexibility, unattractive fiscal policy and excessive administration powers, the Mining Code of 1961 was revised in 2004 and promulgated by Ordinance No. 04.001 (CAR, 2004). Licenses were re-instated in 2004 along with the issue of a new mining code. The new Code includes more flexible and attractive provisions on fiscal policies that can help deregulate the mining sector and encourage the development of a competitive mining sector. As in Cameroon, the new Mining Code aimed at attracting foreign investors in support of the development of the mining sector. All mineral resources in the ground or at the surface are the property of the State but any person may be granted access to them.. They are classified into ‘quarry’ (construction minerals including sand, gravel and stone) and ‘mine’ (all other mineral substances). In the new Mining Code, permits for exploration and mining fall under six categories including artisanal mine, prospecting, exploration type A, exploration type B, mining, and mine concession (Mbendi, 2008). These permits serve different purposes, subjected to various surface areas, validity and delivery authorities. All these permits provide for exclusive rights on the defined property. They can be sold or transferred with the authorisation of the Ministry of Mines. When a deposit is discovered, the right to mine is guaranteed to the owner of the exploration permit. A major factor in the mining sector in the CAR is the importance of fraud and of the financial dependence of artisanal miners upon collector agents (Mbendi, 2008).

CIFOR-IUCN Landscapes Livelihoods Impacts of mining on livelihoods and environment in the TNS landscape
25
The new mining code has an established mining policy targeting the removal of the influence of the State on mining operations, and the creation of favourable conditions for investors (CAR, 2004). The strategic approaches to achieving these are by implementing fiscal incentives (e.g. tax exemption on equipment during exploration), and establishing an organisation responsible for geological exploration and mining that will be responsible for the discovery of new deposits and for prospecting campaigns (CAR, 2004). The issuance and renewal of artisanal mining permits is well codified in the new Mining Code of CAR.
4.1.3 Republic of Congo Congo’s main mineral industry is focused on petroleum products, with petroleum contributing 60% of the Congo’s foreign exchange earnings annually. The Congo has base metal, gold, iron ore and phosphate potential. Works carried out by geologists from Ashanti Goldfields have discovered primary gold mineralization at the Mougongo prospect that covers the newly identified 180 km long Mayombe Belt. Trace showings of alluvial diamonds have been located near the border with the Central African Republic. Portuguese based Escom have apparently secured diamond exploration rights in the northern Congolese region of Likouala. The license covers 6 000 km2, with exploration work beginning in late 2001 (Mbendi 2008). In November 2000, Arena Gold Resources Inc. of Canada signed an agreement, subject to completion of its due diligence evaluation, to acquire a minimum 15% interest in the Yangadou gold mine in the Sangha Region from S.E.M.I., S.A., which was a Congo (Brazzaville) corporation (Arena Gold Resources Inc., 2000). Mining is important, with oil, diamonds, and potash the principal mineral exports, but in 2004 diamond exports to most world markets were banned when the diamonds were not certified as legitimately mined because the Republic of Congo was excluded from the Kimberly Process in 2004 amid allegations that most of its diamond exports were in fact being smuggled out of the neighbouring DRC; it was re-admitted to the group in 2007 (Kimberly Process 2004, 2007). Mining code of the Republic of Congo
The prospecting, research, exploitation, circulation and transformation of all mineral substances in the Republic of Congo are protected by Law No. 4-2005 of 11 April 2005, coined as the Mining Code of the country (Republic of Congo, 2005). Investment in the mining sector is governed by the Investment Code of 1992 and the Hydrocarbon Law 24/94 of August 23, 1994, which regulates the terms of production-sharing agreements. In general, mining is carried out by the state or through state-owned joint ventures under the auspices of the Ministry in charge of mines. According to Article 3 of the Mining Code; mineral and fossil substances are subdivided into seven categories. The fifth category concerns precious substances such as gold and diamonds. According to the United States Geological Survey Mineral Resources Programme, on average the Republic of Congo produces 10kg of gold per annum (USGSMRP, 2008). Articles 39-44 of the Mining Code of the Republic of Congo cover clauses governing the artisanal mining sector in the country. This includes procedures to get artisanal mining permits on an annual basis.
4.1.4 Artisanal mining institutions The mining sector has evolved over the years with not only national governments developing laws and regulations but also an increase of the influence of regional and internationa l organisations. National initiatives In the Congo Basin, only Cameroon and the Democratic Republic of have been able to set up nationally supported structures to help facilitate better performance of the small-scale mining sector. In Cameroon, traditional administrative structures after independence controlled the small-scale mining sector. This historically faced immerse number of difficulties that led to a drastic reduction of the contribution of the
Supprimé: of national

CIFOR-IUCN Landscapes Livelihoods Impacts of mining on livelihoods and environment in the TNS landscape
26
sector to national incomes. In order to circumvent the difficulties embedded in the 1964 mining code, the 2001 mining code made it possible to allow for the set up of an autonomous unit to play the role of facilitation, assistance, promotion of small-scale mining and favouring prospects for evolution towards large-scale mining. This unit, created in 2003 in Cameroon is called CAPAM (Support and Promotion Framework of mining activities in Cameroon). A sister autonomous government agency in the central African sub-region is SAESSCAM (Service d’Assistance et d’Encadrement du Small-Scale Mining or Service for the assistance and organisation of small-scale mining) found in the Democratic republic of Congo. SAESSCAM was created in March 2003 with mandate to:
• promote the emergence of a middle class Congolese in the small-scale mining sector; • ensure training and the provision of technical and financial aid to mining cooperatives and operators
in the small-scale mining sector, in order to enforce their managerial capacities. • ensure the monitoring of market channels and flows from exploitation sites to sale points for
official marketing circuits • recover after sales government taxes and other dues • sensitise on safety measures at exploitation sites as well as ensure their strict application; • participate in the creation of mining funds and their management to promote the small and medium-
scale mining operations (Matip, 2003). Regional initiatives to promote the small-scale mining sector are more pronounced in West, Eastern and Southern Africa. An example of such an initiative is the Community Artisanal and Small-scale Mining (CASM) initiative under the auspices of the World Bank. This initiative was created to increase networking and exchange of information and good practice between ASM stakeholders as well as serve as an important coordination role between ASM assistance projects and donor funding (MMSD, 2002). Central African countries are free to benefit from this initiative but the fruits are yet to bear in the region. In the Congo Basin, on a national level, only Cameroon and the Democratic Republic of Congo (With the in 2003 founded Service for the assistance and organisation of small-scale mining (SAESSCAM)) have been able to set up nationally supported structures to help facilitate better performance of the small-scale mining sector. The countries facing many similar issues would probably benefit from sharing lessons and actions on a regional level as is especially relevant for cross-border landscapes such as the TNS. A plethora of international organisations exist in the mining sector perhaps mostly tackling issues governing large-scale mining rather than dispersed small-scale mining activities. Examples include: The International Labour Organisation (ILO)’s Convention on Safety and Health in Mines, 1995 (No. 176) covers all mines and provides the minimum safety standards against which all changes to mine operations should be measured. The Convention sets out procedures for reporting and investigating accidents and dangerous occurrences in mines. Governments that ratify it undertake to adopt legislation for its implementation, including the designation of the competent authority to monitor and regulate various aspects of safety and health in mines. Guidelines can be found in ILO’s Code of practice on safety and health in open cast mines (Walle and Jennings, 2001). The International Council on Mining and Metals (ICMM) is a multi-partnership organisation with stated principles that commits corporate members to implement them under the Sustainable development framework, including leading global standards, public reporting, independent assurance and sharing good practice. (http://www.icmm.com/sd_framework.php) The World Gold Council (WGC) is global advocate for gold and is committed to playing a key role in the development of responsible gold mining industry. WGC is a member of the International Council on
Supprimé: Central African countries are free to benefit from this initiative but the fruits are yet to bear in the region.

CIFOR-IUCN Landscapes Livelihoods Impacts of mining on livelihoods and environment in the TNS landscape
27
Mining and Metals (ICMM) with commitment to its princ iples that seeks to improve sustainable development performance (http://www.icmm.com/icmm_principles.php). The World Diamond Council (WDC) has similar mandates to those of WGC. The Council for Responsible Jewellery Practices (CRJP) has the objective to promote ethical, social and environmental practices throughout the diamond and gold jewellery supply chain, from mine to retail (http://www.responsiblejewellery.com/what.html). The Kimberley Process was initiated by African diamond-producing countries in May 2000 to develop an international certification scheme for rough diamonds in order to prevent conflict diamonds from entering legitimate markets (Kimberly Process 2004). This process, supported by the World Diamond Council and the United Nations, and implemented by a United Nations vote in 2003, requires the certification of all diamonds mined and upon every transfer of ownership of the diamonds. The Process brings together a broad range of international stakeholders in the diamond trade, including government officials, industry representatives and non- governmental organisations. Participants officially launched the Kimberley Process Certification Scheme (KPCS) on January 1, 2003. Under the scheme, Participants are required to export rough diamonds in tamper-resistant containers and provide certificates validating that their diamond exports are conflict- free. Participants are also prohibited from importing/exporting rough diamonds from/to countries not implementing the Scheme. The process was implemented to combat the sale of the so-called “blood or conflict diamonds” which were used to fund armed conflict, rebel activities, overthrow of legitimate governments and the trade in armaments, especially prevalent in Sierra Leone, Angola and the Democratic Republic of Congo (DRC). At present, Côte d’Ivoire is the only country under embargo by the United Nations for the export of conflict diamonds since December 2005.The CAR, DRC, Gabon and Republic of Congo are currently participants in the Process and in 2007 Cameroon affirmed her intention to join the Kimberley Process.
Extractive Industries Transparency International (EITI) founded in 2002 with the overall mandate to encourage governments to voluntarily disclose the revenues they receive from oil, gas, and mining operations, with revenues verified by reports of company payments to governments. EITI starts by gaining consent from host governments for reporting on government revenues and payments by companies. For the most part, implementing countries have called for disclosure of company payments aggregated for all reporting companies (EITI Fact sheet, 2008). This meets the primary purpose of transparency initiatives, to help ensure that governments use their revenues to benefit the citizens of the country. It is worth emphasizing that the implementation of EITI in Cameroon concerns only oil. In many countries rich in natural resources, revenue ge nerated by extractive industries has not always served to develop and improve the living standards of the entire population: on the contrary it is associated to poverty, conflicts and corruption (EITI, 2008). This is often as a result of rack of transparency and non-respect of the obligation to account for the use of all payments made by the enterprises exploiting these natural resources for the government. The Extractive Industries Transparency Initiative (EITI) aims to make up for this deficit in governance based on the following six guiding principles:
1. All payments into government coffers in terms of oil, gas and mining exploitation, and ail revenue received by the government from enterprises of the extractive industries sector are regularly communicated to the general public in an accessible and explicit form.
2. In the absence of an auditing of payments and revenue, a reliable independent audit is ordered, in conformity with international norms.
3. Payments and revenue are reconciled by a reliable independent administrator, who expresses his opinion on the conciliation of figures and the eventual discordance.
Supprimé:

CIFOR-IUCN Landscapes Livelihoods Impacts of mining on livelihoods and environment in the TNS landscape
28
4. This approach extends to all the enterprises, including State corporations.
5. The civil society takes an active part in designing, monitoring and assessing this process and contributes in the public debate.
6. The government and the contracting parties elaborate a financially viable work schedule with the help of international financial institutions. This schedule is accompanied by measurable targets, an implementation schedule and an evaluation of potential constraints in terms of capacities (EITI, 2008).
Cameroon is currently a candidate country of EITI and has until March 2010 to undertake validation. Other countries in the sub-region that have achieved the EITI candidate status include Gabon, the Republic of Congo and the Democratic Republic of Congo. The Cameroon government ’s objectives for joining are tight to those of EITI including:
• Enhancing governance in the management of resources derived from extractive industries; • Reducing poverty and the foreign debt package of Cameroon (Service of the Prime Minister, 2008;
http://www.eitransparency.org/Cameroon).
The mining industry has been a key to the development of many civilisations, underpinning the iron and bronze ages, the industrial revolution and the infrastructure of today's information age. ASM takes place throughout the world but more widespread in developing countries in Africa, Asia, Oceania, and central and South America (Hentschel et al., 2000) Today more than 100 million people worldwide dependent directly or indirectly on artisanal mining for their livelihoods (CASM, 2008). The worlds 10 to 15 million artisanal miners produce 25% of the world’s gold, the rest being produced by large scale mining companies (UNIDO 2009). Artisanal miners exploit over 40 different minerals but gold and diamond make up about 60% of all artisanal mining. For instance in DRC and Sierra Leone, artisanal gold and diamond mining make up 75% of national mining sector production (CASM, 2008).
The main socio-economic characteristics of ASM include:
v Low levels of income in economies characterised by low level of earnings
v Provision of accessible livelihoods to poor and marginalised people
v Alluvial mining along rivers
v Requires little start-up time, capital and technical inputs
v Frequently labour-intensive, employing semi-skilled or unskilled workforce
v Low levels of mechanisation, production, productivity, recovery and efficiency
v Simultaneous engagement in other activities such as subsistence agriculture and other low-income livelihoods (CASM, 2008).
However, as an instrument for discovering industrial mining deposits, the small-scale mines are testimonies for the existence of mineral resources, with alluvial production often close to primary sources for industrial discoveries. Moreover, the small-scale mining operations are appropriate activities for marginal deposits, where industrial exploitation might not be economically feasible (Gweth 2003). Over the past 10–15 years, governments and donor organisations have implemented an array of technology, support-related, sustainable livelihoods and poverty-reduction projects for ASM. In the majority of cases,

CIFOR-IUCN Landscapes Livelihoods Impacts of mining on livelihoods and environment in the TNS landscape
29
however, these interventions have failed to facilitate improvements in the industry's productivity and raise the living standards of the sector's subsistence operators. Hilson (2005) argues that a poor understanding of the demographics of target populations has precipitated such outcomes and that strengthened policy and assistance in the sector, should be on the basis of more precise data on the number of people operating in ASM regions, their origins and ethnic backgrounds, ages, and educational levels. This can be achieved by carrying out basic and localized census work before promoting ambitious sector-specific projects aimed at improving working conditions in the industry.
4.1.4 Livelihoods impacts of artisanal mining Africa produces more than 60 metal and mineral products and is a major producer of several of the world’s most important minerals and metals including Gold and Diamonds. Although under explored, Africa hosts about 30% of the planet's mineral reserves, including 40% of gold, 60% cobalt and 90% of the world's precious gems and mineral reserves. In terms of contributions to livelihoods and incomes of African people, the revenues generated from diamonds and gold mining has transformed and continues to transform the lives of many people. The revenues generated not only increase the overall standard of living, but also fund essential government services such as health, education and development programs (Diamondfacts, 2006). Given good governance and appropriate laws, these benefits can be achieved. Countries such as Botswana, Namibia and South Africa offer ongoing proof that diamond revenues can create sizeable benefits to the economy in countries where they are sourced. These benefits are also evident in their rankings on the United Nations Human Development Index (HDI), a comparative measure of poverty, literacy, education, life expectancy, childbirth, and other factors for countries worldwide (Diamondfacts, 2006).
Counties in the Congo Basin and the TNS region in particular are not investing in large scale exploitation of mining. Gold and diamond are two major minerals exploited in the TNS region, basically on an artisanal scale. In Cameroon, gold mining started in 1933 with production of about 20 tons between 1934 and 1984, giving an average annual production of 300 kg worth some two billion CFA Francs (Lang 2007). In the East Province of Cameroon an estimated 100 kg of gold is produced per month by some 10000 small- scale miners, mostly channelled through informal circuits (Sale, 2003). Official figuresby the department of mines and geological research are much lower with an estimated quanity of 500 kg of gold annually produced by artisanal miners in Cameroon (Lang 2007). With regards to diamonds, there exist the 700 km borders of Cameroon-Central African Republic that has significant indices of diamond with monthly production evaluated at 800 carats in 1993, despite inadequate experience of Cameroonians in the diamond exploitation activity (Gweth, 2003). In most countries in central Africa, gold and diamond mining remain artisanal, albeit revenue contributions to local and national economies. This can still bring significant quantities though, as for instance in the Central African Republic, where between 400 and 800 thousand carats of rough diamond, valued at 50 billion CFA Francs is produced each year by artisans (Matip, 2003). Apart from cash income to local and national economies small-scale mining is labour intensive and could form a major purveyor of employment, thus reducing rural unemployment rates. Aside socio-economics contributions, artisan mining often precedes large-scale mining because the former provides the indicator for industrial prospecting for significant deposits (Gweth, 2003). This opens a window for possible conflicts in a social context if the small and the large-scale miners have to operate at the same site. The 2001 Mining Code of Cameroon differentiates between small and large scale mining but at the same time gives provisions for the two to operate at the same site. The reasons include the fact that small-scale mines cannot go beyond 30 m depth while the industrial can go up to 4000 m as in South Africa (Sale, 2003). Another reason is that the code recognises the fact that local miners were born or have been residing in the areas for decades, with several families dependent on the activity for livelihoods.
Supprimé: Another estimate
Supprimé:
Supprimé: shows that some
Supprimé: is produced

CIFOR-IUCN Landscapes Livelihoods Impacts of mining on livelihoods and environment in the TNS landscape
30
At the beginning of this century, mining constituted a major source of hope for many poor African countries, paradoxically characterised by rich resource base and very poor populations (Sale, 2003; CASM 2008). National economic impacts The creation of a sustainable future for Africa may lie in its ability to develop and maximize its natural resources (Commission for Africa, 2005; Diamondfacts, 2006). Diamond Facts, owned by the diamond industry and a PR instrument to inform consumers about what's being done about 'conflict diamonds'. , estimates that 65% of the world's diamonds, worth approximately $8.4 billion a year, are sourced in African countries, contributing to economic growth. In Cameroon, solid mining in 1997/98 fiscal year contributed only 4.8 billion CFA Francs or 0.08% to the GDP of the country (Sale, 2003). In CAR, diamond mining was the country's leading industry and top export commodity in 2002. Mining accounted for about 4% of GDP and 40%–50% of export earnings (Forster and Bill, 1992). Diamonds account for 76% of Botswana's export revenue, 45% of the government revenue and 33% of the gross domestic product (GDP) (approximately US$3 billion). Since the discovery of diamonds in Botswana in 1966, the GDP annual growth rate has averaged 7%. Botswana has one of the fastest growing economies in the world, due in large part to diamonds. In Namibia, diamonds represent approximately 10% of GDP, 40% of export revenue and 7% of the government's annual revenue. In 2006, Namibia produced approximately $700 million dollars of diamonds. South Africa produced more than $1.5 billion in diamonds in 2006 and corporate social development projects receive millions of dollars of investments by diamond mining companies in South Africa. The Sierra Leone exported approximately $142 million worth of diamonds in 2005 (Diamondfacts, 2006). Employment creation Artisanal mining is an attractive employment option for many in rural areas; the barriers to entry are minimal (low technology and little capital is needed and activity levels are dynamic as precious minerals are often inversely correlated with economic opportunity and periods of economic crisis. The diamond industry provides livelihoods for millions of people around the globe. For instance, employment figures in a few countries in Africa include Democratic Republic of Congo (750 000), Zimbabwe (350 000), Tanzania (600 000), Mali (300 000), Burkina Faso (150 000), Botswana (38000) and Cameroon (20 000-30 000 with deliberate plans for reaching 60 000 with the implementation of CAPAM (Gweth, 2003; Matip 2003). About 80 000 autonomous artisanal miners form the base for the mining activity in CAR (Encyclopedia of the Nations, 2008). These employment opportunities allow thousands of Africans to make a salary, obtain healthcare, create a better home environment and provide education for their children. Infrastructure development The revenues generated from the diamond trade also help build the countries they are in. For example, in 1966, there were only 3 miles of tarred road in Botswana. Today, there are nearly 4,000, as well as a public transportation system. There is now a country-wide digital telephone network in Botswana, consisting of several thousand miles of fibre optic cable. Now that travel and communications have improved, the people in Botswana have better access to better employment opportunities, healthcare facilities, schools, and cities. Educational and healthcare improvements
Educational opportunities have increased with increase in mining revenues, with examples from Botswana and South Africa highlighting the potential for either direct state distribution of reve nues or large scale mining industry contributing to educational and healthcare infrastructure. An estimated 5 million people

CIFOR-IUCN Landscapes Livelihoods Impacts of mining on livelihoods and environment in the TNS landscape
31
have access to appropriate healthcare globally thanks to revenue from diamonds African countries with formal diamond mining do well in terms of human development; among the countries include South Africa, Botswana and Namibia (Diamondfacts, 2006).
4.1.5 Environmental impacts of artisanal mining The environmental impacts of small-scale mining have been studied worldwide. A literature review indicates that the main impacts are deforestation and land degradation; open pits- causing animal traps and health hazards, also acting as stagnant water collection areas in excavated areas which are abandoned by the miners, providing breeding ground for mosquitoes, mercury use for gold amalgamation, inefficient extraction, dust, noise, underground and long-term hazards (Hentschel, 2000; 2002, Labonne and Gilman 1999, USAID 2000, UNESC 2003). Concerns about the impact of mining on forests and protected areas (CSAM 2001, World Rainforest Movement 2002) have focused on increasing levels of mining activity in sensitive areas, uncontrolled and not organized, often meaning political abuse and manipulation, and self determination of mining and environmental practice with typical results of ad hoc development and exploitation, sedimentation and contamination of water catchment, negligent use of Hg and the lack of reclamation. Artisanal mining operations are always located close to, and are supported by water bodies. Absolute dependence on the use of large amounts of water in mining operations dictates that mining operations are located as close to water sources as possible and in some cases at the water source. Alluvial ore is a result of river deposition and is therefore part of a river system. The reliance on water for mineral concentration results in accelerated evaporation of surface water, drainage of wetlands and the siltation of rivers and dams in countries like Mozambique, South Africa and Zimbabwe (Shoko, 2003). One of the most significant environmental impacts is derived from the use of mercury (Hg). It is a pollutants causing growing concern because of the long-term impacts on ecosystems and human health. Artisanal and small-scale mining in contrast to other sectors where mercury utilization is decreasing remains a dangerous source of mercury pollution (UNIDO 2009). Despite the risks, it is a preferred method employed by artisanal gold miners, although the general population is unaware of the capricious nature of mercury and artisanal mining activities. Moreover, individuals in positions of political or economic influence tend to be negatively biased towards artisanal mining and government policies do not effectively address the realities of these activities. Affected communities have consequently been ignored, and mistrust towards outside parties is high. Not surprisingly, miners are suspicious of unlikely to employ externally derived solutions to reduce mercury emissions (Meiga & Hinton 2002).
Mining is a geographically concentrated activity which results in a number of negative impacts on the immediate and often times in distant areas. These effects include water and air pollution, river and dam siltation as well as loss of biodiversity (deforestation, over-fishing and poaching). For instance, there are today a number of extinct and threatened species within the Zambezi Basin (Shoko, 2003).

CIFOR-IUCN Landscapes Livelihoods Impacts of mining on livelihoods and environment in the TNS landscape
32
4.1.6 Environment and livelihoods The link between environment and livelihoods has long been made, and is illustrated in Figure 4;
Figure 4: Artisanal Mining Poverty Trap
Large numbers of miners
with limited assets5 and entitlements chasing limited and marginal resources
Low income and lack of investment opportunities
Low productivity Inadequate and inappropriate technology
Environmental degradation, health and safety hazards
Adapted from UNESC 2003
. Labonne and Gilman (1990) note that poverty results from a denial of choices and opportunities and implies living on marginal and vulnerable environment as well as further exhausting this environment. Most rural poverty is exacerbated by a lack of access to sufficient productive resources of good quality, in this instance land, good soils and water. A key to livloihood improvement is ensuring that the natural resource base that the poor use is maintained and even improved. Sustainable livelihood strategies imply that the economic needs of individuals and communities are integrated into the maintenance and improvement of the environment. Poverty is multidimensional and the approaches to reduce it have to be similarly multidimensional, inclusive of the political, economic, social and environmental dimensions. Therefore, the reduction of poverty requires opportunities by which the poor can do more for themselves in all these sectors. The major challenge of devising pro-poor policies for artisanal miners is to interact and understand the perception of the poor and gain their trust to achieve a real and lasting ownership of the development process. The task is also to help the poorest miners to gain access to productive resources and appropriate knowledge of their use. In the case of artisanal mining, where there is access to resources, the challenge is
5 These assets are of a natural (e.g. land or access to and rights to land) and social
(e.g. human and social capital) nature.

CIFOR-IUCN Landscapes Livelihoods Impacts of mining on livelihoods and environment in the TNS landscape
33
to improve organization and techniques and channel some of the resulting proceed and income to sp ur alternative sustainable productive activities. In some rural communities there is an over reliance on mining as the sole potential economic engine. Given the latter, there is a currently unfulfilled potential opportunity to invest income generated from mining into other productive livelihood activities, inclusive of mining upscaling which may contribute towards poverty reduction. Furthermore, among the poor artisanal communities, women and children contribute significantly to household income, yet they are often the main victims of poverty since their contribution is not acknowledged in economic and social terms.
4.2 Stakeholder consultations This sections details the results of the interviews with held with key players in the field from the national parks, government representatives and delegates in charge of mines, forest and the environment and representatives of international non-governmental organisations. Conservator of Lobeke National Park (LNP), Cameroon According to the conservator of the LNP in Cameroon major problems faced in the artisanal mining sector include: v Informal exploitation of minerals by the locals v Rudimentary tools v Lack of organization of the sector v Lack of environmental impact assessment of activities carried out v Singular objective that drives small-scale miners to quickly get minerals with no further
considerations to efficient working materials or technologies. According the conservator, the best way to deal with thethe problems in the artisanal mining sector would be to organize the miners and to formalize their activities. On the part of government, the conservator believes that instead of giving all research permits to individuals that are not indigenous to the region, organized local groups could access prospecting permits and betrained on environmental issues. The role of government in improving the small-scale mining sector is very important and decisions do not need to be taken unilaterally by one arm of the government but by all government departments that interact with the environment. These include: MINFOF, MINEP, MINIMIDT, economic operators and conservation NGOs. The conservator was not aware of any programme/project around the Lobeke National park that was helping the small-scale mining sector to become more environmentally and socially efficient. However, he was fully aware that the entire buffer zone of the park has been attributed by the government to mining operators under research permit titles. An example was the Boulou Permit (Permis Boulou) awarded in November 2008 in the southern segment of the park covering 991.5 km2 and including about 19840 ha segment in the park. Divisional Delegate of Mines The delegate of mines for the Boumba and Ngoko Division in Cameroon, believed that with his high level of experience in the mining sector, he believes that small-scale miner do not want to follow the rules and regulators governing the sector because this could cost them only 5000 FCFA per year. However, he believes the sector is socially important for the livelihoods of the local miners to meet daily needs. He reiterated that the major drawback to local miners capitalizing the economic value of their revenue from mining is that they do not have a saving culture. Most local miners spend over 40% of their money on alcoholic drinks. According to him the local miners are not aware of the provisions in the mining code. He
Supprimé: get out of
Supprimé: are

CIFOR-IUCN Landscapes Livelihoods Impacts of mining on livelihoods and environment in the TNS landscape
34
believed that the re was a great need to sensitize miners on the code, legalize the operations of miners. The government and funding partners were better placed to sponsor sensitisation programmes on the mining code of Cameroon. Divisional Delegate of Environment According to the divisional delegate of the Ministry of Environment and nature Protection (MINEP) in Cameroon, the problems besetting the small-scale mining sector are numerous and could be grouped under environmental, economic, social, legal and technical. He pinpointed the need to organize the trade chain, sensitize small-scale miners on the mining code and train them on more environmentally friendly exploitation techniques. He acknowledged the existence of CAPAM as an organisation that is trying to bring sanity in the sector in the region in terms of organisation and commercialization of minerals extracted. The work of CAPAM is yielding fruits around Mboy with the formation of common initiative groups (eight of them recently registered), unions and federation of common initiative groups. The long-term vision for the sector rests on putting in place sustainable management systems in terms of organization, exploitation and management of financial revenues. With regards to possible environmental impact of small-scale mining the delegate mentioned water pollution and diversion of stream courses, soil depression associated with haphazard excavations and poaching of wild animals. He recommended that the alternatives to mining could be agriculture and livestock rearing, which could be rendered economically viable with outside supports.
Bio-monitoring and socio-economic officers, Dzanga-Sangha Project The bio- monitoring officer of the Dzanga -Sangha Project in CAR attested that mining activities in the Ngola and Nola segment of the Sangha River led to a drastic reduction of daily catch. He asserted that this could be associated with the disr uption of breeding grounds for fish in distributaries and river banks. The multiplication of forest routes, derooting of trees intrusion of domestic crops in the forest milieu were also quoted as potentially harmful to the forest environment. The socio-economic officer mentioned the increase in the number of the people living in the forest as a major social problem because children leaving there are complete cut off from the opportunities of have access to modern education and healthcare. A major environmental impact observed was the open mines that were never refilled after mining operations (Figure 4).
Figure 5: Open mines in the Sangha Tri-national Park (TNS), Congo Basin With respect to Environmental risk, the rarity of gold and particularly diamonds outside the reserved area is pushing some miners towards the interior of the reserve. This was more pronounced in the northern section of the Dzanga-Ndoki National park in CAR and the southern part of Lobeke National park in Cameroon.

CIFOR-IUCN Landscapes Livelihoods Impacts of mining on livelihoods and environment in the TNS landscape
35
Senior Divisional Officer, Sangha-Mbaere Mining and diamond mining in particular contributes enormously to the economy of households in the Sangha -Mbaere Division in CAR. No one can tell how important this can be because economic estimates have not been conducted and many operators are informal. With regards to the activities of the TNS project, the study is timely and welcome. Village Perceptions Perceptions from village meetings revealed issues related to organisation, practices outside mining and the role of traditional rights and fetishism in artisanal mining. Each mining site is headed by an elected chief of site (chef de chantier), who is usually the oldest or the most experienced at the site. He has some mining rights and exercises leadership at the camp. For example, the chief of diamond mining site in Ngola (CAR) is informally entitled to 25% of proceeds from sales. Formally, the chief pays an annual tax to government worth 30050 FCFA. This observation is in accordance with Werthmann (2003), who pinpointed that formal and informal modes of power and legitimacy intersect to control small-scale mining operations. Although the chief is elected by other miners to represent them, his leadership typically reflects prestige, violence and garnering of personal wealth. Most mining camps have agricultural crops planted; some cases livestock (most fowls, goats and sheep) are reared. Livestock is particularly important for making sacrifices to receive good luck from the gods of diamonds. In addition to mining other activities such as the collection of non-timber forest products, hunting to meet protein needs and trade in basic commodities such as soap, cigarettes, palm oil, salt, alcoholic drinks are common among miners. Carrying out fetish practices and sacrifices was particular reported for diamond miners in both Cameroon and CAR. For gold mining, these practices less reported. Three types of sacrifices were mentioned: gravel washing sacrifices, women sacrifices and children sacrifices using fowls and sheep/goats. ‘Gravel washing sacrifice’ involve s the slaughter of a big cock or goat/sheep on the soil dug from an excavation before the washing to search for diamond begins. With regards to ‘Women sacrifices’, women party over-night (dancing, eating and drinking) to appease the gods of diamonds and this forms the force of women in diamond discovery the following day. If the gods are satisfied, the following day, a lot is seen, else nothing. If nothing is found, children sacrifice is conducted. Theses practices are particularly organised in Ngola, Central African Republic. In this case, small sugary gifts (puff-puff, sweets and candies) are bought for children to enjoy themselves in the early hours of the morning before mining expeditions are conducted.
4.3 Field results
4.3.1 Biodata of artisanal miners in the TNS A total of 131 artisanal miners, 63 gold and 68 diamond miners, were interviewed during this study in Cameroon and Central African Republic. In Cameroon, most of the miners interviewed had permanent or temporary residence in Zega and Mboy, while in the Central African Republic most of them had their base or supply centres at Nguenguili and Ngola (Table 1).

CIFOR-IUCN Landscapes Livelihoods Impacts of mining on livelihoods and environment in the TNS landscape
36
Table 1: Small-scale miners in Sangha Trinational Park area by country and by village Country Village name Frequency Percentage by country (%) Overall percentage (%)
Cameroon Zega 63 63.64 48.09 Mboy 36 36.36 27.48 Total 99 100.00 75.57
Central African Republic Nguenguili 11 34.38 8.40 Ngola 21 65.63 16.03 Total 32 100.00 24.43
Total 131 - 100.00 A total of 17 mining sites were visited, 13 located in Cameroon and four in Central African Republic. In Cameroon, both gold and diamond miners were interviewed while in Central African Republic only diamond miners were within the limits of the study area (Table 2). Table 2: Small-scale miners in Sangha Trinational Park area by mining sites
Country Mineral mined
Mining site Head of site Date
Created
N Percentage by country (%)
Total number of miners
Cameroon Gold Cola
Bombo Faustin 1998 14 14.14 37
Bad engue - 1999 9 9.09 10
Houho Ngwerium
Japhael 2007 11 11.11 20
Johvah Jire - - 14 14.14 23 Mokopaka - - 9 9.09 35 Bongoli - - 6 6.06 36
Diamond Nompenda
Melelo Simeon 1970 5 5.05 10
Papam Abah 1968 4 4.04 8 Montsombe Bandi Victor 1963 7 7.07 15
Mobilong Mekonji George 1970 8 8.08 20
Lingui Mpaye Fabien
- 3 3.03 6
Momekok Kokono Anatol 1976 7 7.07 18
Kolongo Ndewa Antoine
- 2 2.02 4
Total 99 100.00 242 Central African Republic
Diamond Ngola
Madingo Dieudonne - 21 65.63 180
Boto - - 5 15.63 10 Motokobilo Luc Achille 1994 4 12.50 80 Mabouli - - 2 6.25 5
Total 32 100.00 275
Total 131 - 517

CIFOR-IUCN Landscapes Livelihoods Impacts of mining on livelihoods and environment in the TNS landscape
37
At least an estimated 3510 people (517 miners and their dependents, average of 5.3 in Cameroon and 8.1 in CAR) are dependent upon mining incomes from the TNS Landscape. The rainy season is not very convenient for most miners. Just about a third of the total miners were found on mining sites and students were completely absent because the study was conducted during the schooling period. The total number of miners found at the 17 sites was 517. Some details were given on some mining sites with regards to their histories, size and leadership. For example, Cola as a mining site was opened in 1998, headed by Nguerium Japhael on the Mekia stream. The name Cola is associated with the presence of many cola trees at the site. The area of the site is estimated at 150 m long by 15 m wide giving 2250 m2. The Bandengue site was sampled in 1998 but activities started in 1999, under the direction of Nguerium Japhael. Badengue is the name of the stream where mining takes place, 200 m along the stream and 30 m wide, giving an area of about 6000 m2. Houho is a new site, known to be more productive than others. It became operational in 2008 covering an area of 8000 m2. According to Nguerium Japhael, experience deepens the ability to detect zones rich in minerals. The length of time miners had been engaged in mining ranged from 2 to 46 years, with an average of 26. Two types of artisanal miners were observed during this study including divers and diggers. Diggers are those who dig the soil to get their minerals and divers are those who dive into the Sangha River to scoop sand and soil (at the bottom) to get their diamond. All gold miners were diggers while diamond mining in Central African Republic included both diggers and divers (Table 3). Table 3: Distribution of Small- scale miners in Sangha Trinational Park area into diggers and divers.
Country Mining type Mineral mined Total
Gold Diamond
Cameroon
Diggers 63 (63.64%) 36 (36.36%) 99 (100.00%) Total 63 (63.64%) 36 (36.36%) 99 (100.00%)
Central African Republic
Diggers 0 20 (62.50%) 20 (62.50%) Divers 0 12 (37.50%) 12 (37.50%) Total 0 32 (100.00%) 32 (100.00%)
Total 63 (48.09%) 68 (51.91%) 131 (100.00%)
Gender of miners There was high gender disparity observed in diamond mining in CAR as no woman was found to lead mining activities. A traditional belief of local miners in CAR is that diamond mining is naturally mystical and can render women sterile. In Cameroon the share of women in diamond mining was 5%. In the Cameroonian gold mining about 8% of the miners were women (Table 4). Table 4: Small-scale miners in Sangha Trinational Park area by gender
Country Sex Mineral mined
Total Gold Diamond
Cameroon
Male 55 (55.56%) 31(31.31%) 86 (86.87%) Female 8 (8.08%) 5 (5.05%) 13 (13.13%) Total 63 (63.64%) 36 (36.36%) 99 (100.00%)
Central African Republic
Male 0 (0.00%) 32 (100.00%) 32 (100.00%)
Female 0 (0.00%) 0 (0.00%) 0 (0.00%)
Total 0 (0.00%) 32 (100.00%) 32 (100.00%)
* Figures in brackets ( ) represent proportion of total sample.
Supprimé: n Cameroon
Supprimé: 13.13
Supprimé: gold
Supprimé: .
Supprimé: As in the case of CAR, no woman was at the helm of diamond mining in Cameroon
Supprimé: Traditional belief of local miners in CAR is that diamond mining is naturally mystical and can render women sterile.

CIFOR-IUCN Landscapes Livelihoods Impacts of mining on livelihoods and environment in the TNS landscape
38
Ethnic affinity Artisanal miners at mining sites originated from diverse ethnic backgrounds in both Cameroon and CAR, 24 ethnic groups in the former and eight ethnic groups in the latter. The higher diversity in Cameroon is a reflection of the over 250 ethnic groups in the country, contrary to a fewer number in CAR. In the Cameroon segment of the TNS, indigenous people (Baka, Bimo and Bangando) represented 46.46% of the artisanal miners while the corresponding figure for indigenes in CAR (Baaka and Sangha-Sangha) was 68.75%. Four major immigrant ethnic groups on the Cameroonian segment were Mpiemo of CAR (9.09%), Foulbe or Haoussa (8.08%), Kako (7.07%) and Mvongmvong (4.04%). On the CAR segment, the Bilos, Bogongo and Ngondi ethnic groups constituted the main immigrants (Table 5). Table 5: Small-scale miners in Sangha Trinational Park area by ethnic groups Country Ethnic group Frequency Percentage by country (%) Overall percentage (%)
Cameroon
Banda 1 1.01 0.76 Bamoun 1 1.01 0.76 Bassa 1 1.01 0.76 Manzah 1 1.01 0.76 Kako 7 7.07 5.34 Bimo 19 19.19 14.50 Mezimi 3 3.03 2.29 Ngondi 2 2.02 1.53 Bangando 5 5.05 3.82 Mpiemo (CAR) 9 9.09 6.87 Ngombe(DRC) 1 1.01 0.76 Yakoma 1 1.01 0.76 Foulbe/Haousa 8 8.08 6.11 Bakare 1 1.01 0.76 Eton/Beti 3 3.03 2.29 Bambara (Malian) 1 1.01 0.76 Bororo 2 2.02 1.53 Voko 1 1.01 0.76 Baya 1 1.01 0.76 Baka 22 22.22 16.79 Mvongmvong 4 4.04 3.05 Badjoue 2 2.02 1.53 Ashanti (Ghanian) 2 2.02 1.53 Yamba 1 1.01 0.76 Total 99 100.00 75.57
Central African Republic
Ngondi 2 6.25 1.53 Yakoma 1 3.13 0.76 Baya 1 3.13 0.76 Baaka 8 25.00 6 .11 Bilo 3 9.38 2.29 Sangha-Sangha 14 43.75 10.69 Bossangoa 2 6.25 1.53 Bogongo 1 3.13 0.76 Total 32 100.00 24.43 Total 131 - 100.00

CIFOR-IUCN Landscapes Livelihoods Impacts of mining on livelihoods and environment in the TNS landscape
39
Marital status Marriage was found to be an important social value for artisanal miners in the region as about 97% and 71% of miners in CAR and Cameroon respectively were married. A total of 109 wives was reported for the 131 artisanal miners with variation from zero to two wives, mean of 0.83 wives (std=0.50). Having wives implied producing children as the 131 miners were found to have 433 children (mean=3.31; std=2.82). Apart from the artisanal miners having wives and children, the overall household size (including other relatives), considered as all dependent on the miner was appreciably higher totalling 785 persons (mean=5.99; std=3.82) for the 131 miners. In Cameroon a more youthful mining population was observed with over 21% singles (Table 6). This could be attributed to far longer walking distances to mining sites in Cameroon compared to CAR. The consequence is that young miners could become independent miners earlier in Cameroon than in CAR. Table 6: Small-scale miners in Sangha Tri-national Park area by marital status Country Marital status Frequency Percentage by country (%) Overall percentage (%)
Cameroon
Married 70 70.71 53.44 Single 21 21.21 16.03 Divorce 2 2.02 1.53 Widow 6 6.06 4.58
Total 99 100.00 75.57 Central African Republic
Married 31 96.88 23.66 Single 1 3.13 0.76
Total 32 100.00 24.43
Total 131 100.00 Nationality of miners In Cameroon, about 82% of miners were of Cameroonian nationality while the rest were of other African nationalities, notably Central Africans (14.14%), Ghanaians (2.02%), Malians and Congolese (1.01% each) (Table 7). Table 7: Small-scale miners in Sangha Tri-national Park area by nationality per country Country Nationality Frequency Percentage by country (%) Overall percentage (%)
Cameroon
Cameroonian 81 81.82 61.83 Central African 14 14.14 10.69 Congolese 1 1.01 0.76 Ghanaian 2 2.02 1.53 Malian 1 1.01 0.76
Total 99 100.00 75.57 Central African Republic
Cameroonian 1 3.13 0.76 Central African 31 96.88 23.66
Total 32 100.00 24.43
Total 131 - 100.00
Most miners were part-timers as about 78% and 69% were in that category in Cameroon and CAR respectively (Table 8). The seemly low proportion of full-time miners suggests their diversification of income and livelihood strategies.

CIFOR-IUCN Landscapes Livelihoods Impacts of mining on livelihoods and environment in the TNS landscape
40
Table 8: Small-scale miners in Sangha Tri-national Park area by nationality by country Country Occupation as miner Frequency Percentage by country (%) Overall percentage (%)
Cameroon Full-time 22 22.22 16.79 Part-t ime 77 77.78 58.78
Total 99 100.00 75.57 Central African Republic
Full-time 10 31.25 7.63 Part-t ime 22 68.75 16.79
Total 32 100.00 24.43
Total 131 - 100.00
In terms of age categories of miners, 75.75% and 78.03% artisanal of miners in Cameroon and CAR respectively were younger than 45 years. Although the oldest artisanal miner was found in Cameroon, overall CAR had a higher proportion of miners older than 45 years (Table 9). Table 9: Small-scale miners in Sangha Tri-national Park area by age per country
Country Age group Frequency Percentage by country (%) Overall percentage (%)
Cameroon
[15 ; 25[ 17 17.17 12.98 [25 ; 35[ 17 17.17 12.98 [35 ; 45[ 41 41.41 31.30 [45 ; 55[ 20 20.20 15.27 [55 ; 65[ 2 2.02 1.53 [65 ; 75] 2 2.02 1.53
Total 99 100.00 75.57
Central African Republic
[15 ; 25[ 6 18.75 4.58 [25 ; 35[ 9 28.13 6.87 [35 ; 45[ 10 31.25 7.63 [45 ; 55[ 4 12.50 3.05 [55 ; 65[ 3 9.38 2.29
Total 32 100.00 24.43
Total 131 - 100.00
The age of miners varied from 17 to 75 years in Cameroon and 15 to 60 years in CAR. The mean mining age in Cameroon was 37.16 years (std =11.16) aga inst 35.84 years (std = 11.77) for CAR. Miners in Cameroon had a mean number of children of 2.87(std = 2.34) against 4.44 (std = 3.68) in CAR. Although some miners had two wives, the mean number of wives per person was one. Miners were found to have a high number of dependents with mean of 5.3 (std = 3.39) in Cameroon and 8.13 (std = 4.32) in CAR. This is very typical in most villages in the region where cousins, mother-in-laws, nephews and nieces, brother and sisters often become permanent visitors in the houses of relatives who work hard to become financially independent. This is particularly interesting because the ratio of the total number of dependents to the total number of children (supposed direct responsibility of the miner) of miners was 1.74 in CAR and 1.85 in Cameroon. This suggests the income of miners need to be huge to pull them out of poverty or dependents need to generate income from other sources to increase the overall household income in order to uplift living standards. The mean number of years as miners was conspicuously higher in CAR (17.34 years; std = 9.71) than in Cameroon (9.54 years; std = 7.11) (Table 10). This could be associated with the longer mining experience in CAR than in Cameroon, especially with respect to diamond mining. Migration,

CIFOR-IUCN Landscapes Livelihoods Impacts of mining on livelihoods and environment in the TNS landscape
41
frequent discovery of new sites, higher commodity prices, easier access and lack of alternative livelihood activities could also define the longer reliance on artisanal mining in CAR. Table 10: Social characteristics of small-scale miners in Sangha Tri- national Park area by country
Country Variables Frequency Minimum Maximum Sum Mean Std
deviation
Cameroon
Age 99 17 75 - 37.16 11.16 Number of children 99 0 10 284 2.87 2.34
Number of wives 99 0 2 - 0.76 0.52 Total number of dependents
99 0 15 525 5.30 3.39
Number of years as miner
99 0.04 31 - 9.54 7.11
Central African Republic
Age 32 15 60 - 35.84 11.77 Number of children
32 0 14 149 4.66 3.68
Number of wives 32 0 2 - 1.06 0.35 Total number of dependents
32 2 17 260 8.13 4.32
Number of years as miner 32 3 51 - 17.34 9.71
Education In both Cameroon and CAR, over 70% small-scale miners had primary or no former education, with less than 9.0% having gone through higher schooling. For most of those that reported having been to primary school over 45% in Cameroon and 62% in CAR could barely write their names. Table11: Small-scale miners in Sangha Tri-national Park area by education level per country Country Education Frequency Percentage by country (%) Overall percentage (%)
Cameroon
No formal education/SIL/CP/CE1
34 34.34 25.95
Primary 45 45.45 34.35 Secondary 12 12.12 9.16 High school 7 7.07 5.34 University 1 1.01 0.76 Total 99 100.00 75.57
Central African Republic
No formal education/SIL/CP/CE1
4 12 .50 3.05
Primary 20 62.50 15.27 Secondary 6 18.75 4.58 High school 2 6.25 1.53
Total 32 100.00 24.43
Total 131 - 100.00

CIFOR-IUCN Landscapes Livelihoods Impacts of mining on livelihoods and environment in the TNS landscape
42
4.3.2 Mining operations in the TNS Among the artisanal miners interviewed, mining was a principal activity for 78.79% and 87.50% of miners in Cameroon and CAR respectively. These miners were initiated in the activity by their parents, local friends or outsiders. The role of parents in transmitting mining skills to their children was more obvious in CAR (59.38%) than Cameroon (25.25%). Local friends and outsiders played a leadership role in impacting mining skills to Cameroonian artisanal miners (Table 12). This was more obvious in Mboy, where most miners claimed they were trained on the diamond mining activity by people from CAR, who currently constitute an appreciable proportion of miners in the Cameroonian segment of the TNS. Table 12: Small-scale miners in Sangha Tri-national Park area by initiator per country
Country Initiator into mining Frequency Percentage by country (%) Overall percentage (%)
Cameroon
Parents 25 25.25 19.08 Local friends 43 43.43 32.82 Outsiders 31 31.31 23.66
Total 99 100.00 75.57 Central African Republic
Parents 19 59.38 14.50 Local friends 12 37.50 9.16 Outsiders 1 3.13 0.76
Total 32 100.00 24.43
Total 131 - 100.00
It was realized mining could form a good avenue for local people to become auto-employed. From the miners interviewed, over 70% and 63% in Cameroon and CAR were respectively working for themselves. Working in groups or cooperatives was a rare experience, except with the recently introduced CAPAM project in the Mboy region of Cameroon that is still taking roots. About 29% in Cameroon and 37% in CAR were working for sponsors, who take care of the purchase of materials, food and medicines for their workers. The location of mining sites in TNS area was found to be dynamic and turned to be more stable outside reserved areas with about 80% and 97% of miners carrying out their activities outside protected areas (Table 13). Table 13: Small-scale miners in Sangha Tri-national Park area by location of mining site per country
Country Location of mining site Frequency Percentage by country (%) Overall percentage (%)
Cameroon
Inside the reserve 4 4.04 3.05 Outside 79 79.80 60.31 Both 16 16.16 12.21
Total 99 100.00 75.57 Central African Republic
Inside the reserve 1 3.13 0.76 Outside 31 96.88 23.66
Total 32 100.00 24.43
Total 131 - 100.00

CIFOR-IUCN Landscapes Livelihoods Impacts of mining on livelihoods and environment in the TNS landscape
43
Labour In Cameroon, 59.6% of the miners interviewed were being assisted by labourers with mean of two labourers (std = 1.37) per miner. All miners in CAR were assisted by 1.0 to 8.0 labourers with mean number of 3.94 (std = 2.08). This gave a total of 117 and 126 labourers for the 59 and 32 small- scale miner-employers in Cameroon and CAR respectively. Family labour constituted the major source of labour in both Cameroon and CAR represent ing 84.62% and 64.29% in respective countries. Child labour was common as children represented 34.19% of labour force in Cameroon and 24.60% in CAR. According to Jennings (1999), hundreds of thousands of children work in small-scale mines, with a study in a few countries showing some 250,000 children working fulltime or part-time. The consequence is enormous in terms of exposure to risks and possibly jeopardizing long-term development – both physical and socio-economic (Jennings, 1999). Men were generally assisted by women for their mining activities with over 57% of labourers made up of women in Cameroon and 21% in CAR (Table 14). Table 14. Small-scale miners in Sangha Tri-national Park area by number of labourers and by country
Country Variables Frequency Minimum Maximum Sum Mean Std
deviation
Cameroon
Number of labourers
59 1 6 117
(100.00) 1.98 1.37
Family labour 58 1 5 99 (84.62) 1.71 1.14 Hired labour 10 1 4 18 (15.38) 1.80 1.03 Children >15 years 23 1 3 40 (34.19) 1.74 0.86
Adults 58 1 5 77 (65.81) 1.33 0.76 Men 28 1 4 50 (42.74) 1.79 0.99 Women 57 1 3 67 (57.26) 1.18 0.43
Central African Republic
Number of labourers 32 1 8
126 (100.00) 3.94 2.08
Family labour 22 1 8 81 (64.29) 3.68 2.19 Hired labour 11 1 8 45 (35.71) 4.09 2.12 Children >15 years
15 1 4 31 (24.60) 2.07 0.96
Adults 30 1 8 95 (75.40) 3.17 2.12 Men 29 1 8 99 (78.57) 3.41 1.68 Women 15 1 4 27 (21.43) 1.80 0.86
(..) represent proportion of total labour per category. Quantification of mineral production per month Getting data on the weight of gold or diamond produced by artisanal miners in the TNS region suffered from two major difficulties: the first was applicable to both minerals in both countries involving weak retentive memories of miners (complete lack of production data) on the quantity they produce per month. To counter this, miners were asked to state the average quantities they could exploit per trip and the possible number of trips per month. The second difficulty was more applicable to the quantification of diamond pieces or dust particles discovered. No miner knew exactly how to measure his produce in terms of carats (the conventional measuring unit for diamonds) or the definition of its quality and shapes that command various market prices. As for gold it was easier to state the quantity in grams as there were common ways of weighing their produce (Figure 5).

CIFOR-IUCN Landscapes Livelihoods Impacts of mining on livelihoods and environment in the TNS landscape
44
Figure 5: Small-scale mining at Badengue mining site with a scale for weighing gold On average a gold digger was observed to produce 18.4 g (std=9.7) per month with variation from a minimum of 4 g to a maximum of 43 g per month. It was estimated that the 63 gold diggers in the southern part of the Lobeke National park could produce up to 1159 g per month or 13908 g per annum. Extrapolating this figure to the total number of small-scale gold miners (about 161 in number) in the six gold mining sites in the area gave a total of 35543 g (35.543 kg) of gold per annum. With regards to diamond, a mean of 9.22 (std=9.12) pieces or pellets of diamond could be discovered per miner per month in Mboy mining sites in Cameroon, ranging from a minimum of two pellets to a maximum of 40 pieces per month. This could sum up to 332 pellets for the 36 miners interviewed or 747 pellets per month for the estimated 81 miners at the seven mining sites visited. The 81 miners counted could have been an underestimation because the miners asserted that just about a third of the m were active during the rainy season, the period during which data was collected. Moreover, all the school children were absent because the study was conducted during schooling periods. In the case of CAR, a minimum of one pellet and a maximum of 60 pellets per month were observed with a mean of 16 pieces (std=14.17) and sum of 512 pellets per month for 32 miners interviewed (Table 15). This could translate to 4400 pellets for the 275 small-scale diamond miners in just four sites in CAR. In the northwestern part of the Dzanga -Ndoki national Park around River Lobe, Kamiss (2006) visited 15 diamond mining sites and found the total number of miners to be 362 but no other information was collected on those that were actual miners, labourers, women assisting their husbands, children and the estimated quantities of diamond exploited per given period. Figure 7 below shows some pellets of diamond and gold exploited in the TNS region.

CIFOR-IUCN Landscapes Livelihoods Impacts of mining on livelihoods and environment in the TNS landscape
45
Figure 7: Diamond pellets (left) and Gold pellets (right) Table 15: Characterization of gold and diamond production in Sangha Tri-national Park area
Country Mineral Frequency Minimum Maximum Sum Mean Std deviation
Cameroon Gold (g) 63 4 43 1159 18.40 9.70
Diamond (pieces)
36 2 40 332 9.22 9.12
Central African Republic
Diamond (pieces)
32 1 60 512 16.00 14.17
The above analysis was found to be very encouraging that at least a miner can earn some income per month from mining either gold or diamond. However, it failed to give further details on the distribution of chances of getting all produce per trip or once per month or nothing at all. For gold miners, it was found that over 83 percent of them go t less than 30 g per month while just about 6.4% get over 40 g of gold per month. Similarly, about 92% diamond diggers in Cameroon could hardly get over 20 pieces of diamond per month, while less than 10% could get over 30 pieces per month. In CAR, it seemed more likely to exploit more pieces of diamonds per month than in Cameroon (Table 16). This could be associated to natural factors of availability or the higher experience of miners in CAR over those in Cameroon.

CIFOR-IUCN Landscapes Livelihoods Impacts of mining on livelihoods and environment in the TNS landscape
46
Table 16: Class distribution of gold and diamond production in Sangha Tri-Nationa l Park area Country Mineral Quantities class (g) Frequency Percentage by
country (%) Cumulative percentage
Cameroon
Gold
[0 ; 5[ 2 3.17 3.17 [5 ; 10[ 9 14.29 17.46 [10 ; 15[ 15 23.81 41.27 [15 ; 20[ 10 15.87 57.14 [20 ; 25[ 10 15.87 73.02 [25 ; 30[ 9 14.29 87.30 [30 ; 35[ 4 6.35 93.65 [40 ; 45[ 4 6.35 100.00
Total 63 100.00 -
Diamond (pieces)
[0 ; 5[ 15 41.67 41.67 [5 ; 10[ 8 22.22 63.89 [10 ; 15[ 6 16.67 80.56 [15 ; 20[ 4 11.11 91.67 [30 ; 35[ 1 2.78 94.44 [35 ; 40[ 1 2.78 97.22 [40 ; 45[ 1 2.78 100.00
Total 36 100.00 -
Central African Republic
Diamond (pieces)
[0 ; 5[ 8 25.00 25.00 [5 ; 10[ 4 12.50 37.50 [10 ; 15[ 5 15.63 53.13 [15 ; 20[ 4 12.50 65.63 [20 ; 25[ 5 15.63 81.25 [25 ; 29[ 2 6.25 87.50 [30 ; 35[ 1 3.13 90.63 [40 ; 45[ 1 3.13 93.75 [50 ; 55[ 1 3.13 96.88 [55 ; 60] 1 3.13 100.00
Total 32 100.00 -
Costs of Production materials Material costs for artisanal mining could be divided into short and long-term costs. Short-term costs were valuated on a monthly basis. This basically covered food and medicines used at mining sites. The long-term costs were prorated over the life span of working materials ranging from one year to ten years. A typical artisanal miner can spend up to 26000 CFA Francs on food and medicines per month forming the highest source of expenditure. The long-term capital cost items such as motor pumps worth some 250 000 CFA Francs are the most difficult to obtain by most artisanal miners as most of them still bail off water from their mining pits manually. However, once acquired, alluvial mining becomes less strenuous and annual costs may be reduced to 25 000 CFA Francs given a 10 years life span (Table 17).
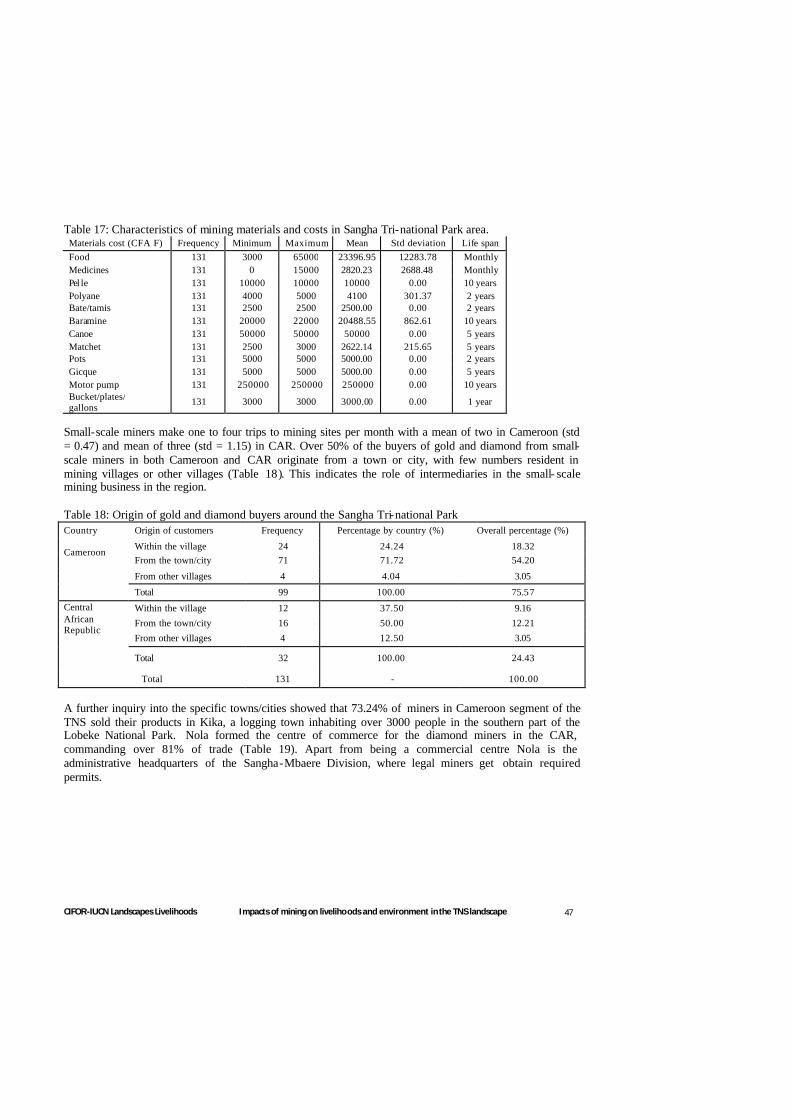
CIFOR-IUCN Landscapes Livelihoods Impacts of mining on livelihoods and environment in the TNS landscape
47
Table 17: Characteristics of mining materials and costs in Sangha Tri-national Park area. Materials cost (CFA F) Frequency Minimum Maximum Mean Std deviation Life span Food 131 3000 65000 23396.95 12283.78 Monthly Medicines 131 0 15000 2820.23 2688.48 Monthly Pel le 131 10000 10000 10000 0.00 10 years Polyane 131 4000 5000 4100 301.37 2 years Bate/tamis 131 2500 2500 2500.00 0.00 2 years Baramine 131 20000 22000 20488.55 862.61 10 years Canoe 131 50000 50000 50000 0.00 5 years Matchet 131 2500 3000 2622.14 215.65 5 years Pots 131 5000 5000 5000.00 0.00 2 years Gicque 131 5000 5000 5000.00 0.00 5 years Motor pump 131 250000 250000 250000 0.00 10 years Bucket/plates/ gallons
131 3000 3000 3000.00 0.00 1 year
Small-scale miners make one to four trips to mining sites per month with a mean of two in Cameroon (std = 0.47) and mean of three (std = 1.15) in CAR. Over 50% of the buyers of gold and diamond from small-scale miners in both Cameroon and CAR originate from a town or city, with few numbers resident in mining villages or other villages (Table 18). This indicates the role of intermediaries in the small- scale mining business in the region. Table 18: Origin of gold and diamond buyers around the Sangha Tri-national Park Country Origin of customers Frequency Percentage by country (%) Overall percentage (%)
Cameroon
Within the village 24 24.24 18.32 From the town/city 71 71.72 54.20
From other villages 4 4.04 3.05
Total 99 100.00 75.57
Central African Republic
Within the village 12 37.50 9.16
From the town/city 16 50.00 12.21
From other villages 4 12.50 3.05
Total 32 100.00 24.43
Total 131 - 100.00
A further inquiry into the specific towns/cities showed that 73.24% of miners in Cameroon segment of the TNS sold their products in Kika, a logging town inhabiting over 3000 people in the southern part of the Lobeke National Park. Nola formed the centre of commerce for the diamond miners in the CAR, commanding over 81% of trade (Table 19). Apart from being a commercial centre Nola is the administrative headquarters of the Sangha-Mbaere Division, where legal miners get obtain required permits.

CIFOR-IUCN Landscapes Livelihoods Impacts of mining on livelihoods and environment in the TNS landscape
48
Table 19: Towns/cities from which customers of artisanal miners in the Sangha Tri-national Park area originate by country. Country If city/town specify Frequency Percentage by country (%) Overall percentage (%)
Cameroon
Kika 52 73.24 59.77 Yokadouma 7 9.86 8.05 Yaounde 12 16.90 13.79
Total 71 100.00 81.61 Central African Republic
Nola 13 81.25 14.94 Salo 3 18.75 3.45
Total 16 100.00 18.39
Total 87 - 100.00
On average small- scale miners in the Cameroon segment of the TNS spend 3065 CFA Francs (std = 2168) to get their mineral to the market per month. On the CAR side, miners spend on average 3840 CFA francs (std = 2379) to ge t their products to the market. This is a little higher than in Cameroon because most miners in CAR go to Nola that involves the use of paid transportation, while in Cameroon, most go to Kika with more trekking done and lower transportation costs incurred. It is important to note that only those who spent some money on transportation to get their minerals to the market were considered, 62.63% of miners for Cameroon and 78% for CAR. Mining revenues , costs and net incomes Annual gross income from ASM in the TNS region varied from a minimum of 96 000 CFA Francs to a maximum of 2 400 000 CFA Francs for Gold miners and 74 000 CFA Francs to 2 520 000 CFA francs for diamond miners in Cameroon. Mean annual net income from exploiting and selling gold and diamond were 575338 CFA Francs (std = 461913) and 812644 CFA Francs (std = 676487) respectively in Cameroon. On the CAR side of the TNS, ASM diamond miners got mean annual net income of 368084 CFA Franc s (std = 904427) (Table 20). The fact that the stand deviation is about three times the mean is a clear indication of the enormous gap in income from mining in CAR, with some miners getting huge sums and others relatively nothing. Table 20: Characteristics of income among small-scale miners in Sangha Tri-national Park area
Country Mineral Variables Frequency Minimum Maximum Mean Std
deviation
Cameroon
Gold
Annual gross income
63 96000 2400000 887823.81 526268.24
Annual total cost 63 74000 962000 312485.71 175905.56 Annual net benefit 63 -38000 2092000 575338.10 461912.66
Diamond
Annual gross income 36 36000 2520000 1212666.67 706437.66
Annual total cost 36 99000 758000 400022.22 157529.34 Annual net benefit
36 -404000 1966000 812644.44 676486.78
Central African Republic
Diamond
Annual gross income
32 9600 3000000 1082456.25 837885.20
Annual total cost 32 136950 2832450 714371.88 657104.57 Annual net benefit
32 -1032450 2517550 368084.38 904426.74

CIFOR-IUCN Landscapes Livelihoods Impacts of mining on livelihoods and environment in the TNS landscape
49
As indicated in Table 20 above, while some miners were actually making money from the business, some were actually losing significant sums of money with net loss of up to 1032450 CFA Francs in CAR and over 400000 CFA Francs in Cameroon. While losing money most of those in this category had hopes that one day they shall have the luck to find sizeable minerals to cover their costs. Further analysis showed that a little over 9.0% of miners had negative net mining benefit in Cameroon and the corresponding proportion for CAR was 43.75%. Losses ranged from 2000 CFAF to 404000 CFAF with mean of 152711 CFAF (std=145588 CFAF) in Cameroon. Higher losses were observed among miners in the CAR with mean of 364 400 CFAF (std=273732 CFAF). It was found that 46.5% and 34.38% of miners got net benefit that was less than the mean for all those with positive net mining income in Cameroon and CAR respectively. Those that made benefits greater than the mean positive net mining income were represented by 44.44% and 21.88% in Cameroon and CAR respectively (Table 21). For these miners, respective mean mining incomes in Cameroon and CAR were 1 180 646 CFAF (std=338 562) and 1 752 007 (std=704 430). Table 21: Characteristics of benefit flows to artisanal miners in Sangha Tri-national Park area
Country Variables N Percent (%)
Min (CFAF)
Max (CFAF)
Sum (CFAF)
Mean (CFAF)
Std deviation
Cameroon
Those with negative net mining benefit
9 9.09 -404000 -2000 -1374400 -152711 145588
Net mining benefit is less than mean of those with positive mining benefit
46 46.46 28000 726400 14927500 324511 230391
Net mining benefit is great than mean those with positive mining benefit
44 44.44 748000 2092000 51948400 1180646 338562
Those with positive total net benefit
90 90.91 28000 2092000 66875900 743066 517134
Total 99 100.00 -404000 2092000 65501500 661631 558203
Central African Republic
Those with negative net mining benefit
14 43.75 -1032450 -38950 -5101600 -364400 273732
Net mining benefit is less than mean of those with positive mining benefit
11 34.38 93050 699050 4616250 419659 214193
Net mining benefit is great than mean those with positive mining benefit
7 21.88 970750 2517550 12264050 1752007 704430
Those with positive total net benefit
18 56.25 93050 2517550 16880300 937794 805489
Total 32 100.00 -1032450 2517550 11778700 368084 904427

CIFOR-IUCN Landscapes Livelihoods Impacts of mining on livelihoods and environment in the TNS landscape
50
The Cost of hired labour per day varied from 250-500 CFA Francs in Cameroon with mean of 350 CFA francs (std=122.47). In CAR daily rates were slightly higher varying from 450-1500 CFA Francs with mean of 990 CFA francs (std=317). Control and regulations When artisanal miners were asked whether they usually experience any body disturbing them during mining operations, 91% and 66% in Cameroon and CAR respectively stated no disturbances of any kind. Those that mentioned having been disturbed occasionally were mostly in CAR (34%) and only 9% in Cameroon. Further questioning on the control agents or individuals led to the disclosure of government agents, conservation agents and individual buyers as main sources of harassment. Government agents formed the major source of harassment in CAR but conservation agents played a lead role in Cameroon in checking miners (Table 22). Table 22: Mining control agents in the Sangha Tri-national Park area Country Control agents Frequency Percentage by country (%) Overall percentage (%)
Cameroon
Government agents 1 11.11 5.00 Conservation agents 6 66.67 30.00 Individual buyers 2 22.22 10.00 Total 9 100.00 45.00
Central African Republic
Government agents 10 90.91 50.00 Individual buyers 1 9.09 5.00
Total 11 100.00 55.00
Total 20 - 100.00
The role of government in the artisanal mining sector in the region was more obvious in CAR because taxes are collected from miners unlike in Cameroon. Individual buyers have a role to play in controlling miners through sponsorship of mining activities. The miners in turn need to be honest to sell products discovered to the sponsor; else harassment results in a situation where the miner sells to another buyer. In the case of harassment, most miners in Cameroon run away (22%), bribe the controllers (11%), speak angrily to them (33%), or simply stay quiet (33.33%). With the case of CAR, artisanal miners either speak angrily to controllers (64%) or simply produce their papers for those that operate legally (36%) (Table 23) Table 23: Reaction of artisanal miners to control agents in Sangha Tri-national Park area
Country Reaction to control agents Frequency Percentage by country (%)
Overall percentage (%)
Cameroon
Run away 2 22.22 10.00 Bribe them 1 11.11 5.00 Speak to them angrily 3 33.33 15.00 Do nothing 3 33.33 15.00 Total 9 100.00 45.00
Central African Republic
Speak to them angrily 7 63.64 35.00 Show your legal papers 4 36.36 20.00 Total 11 100.00 55.00
Total 20 - 100.00
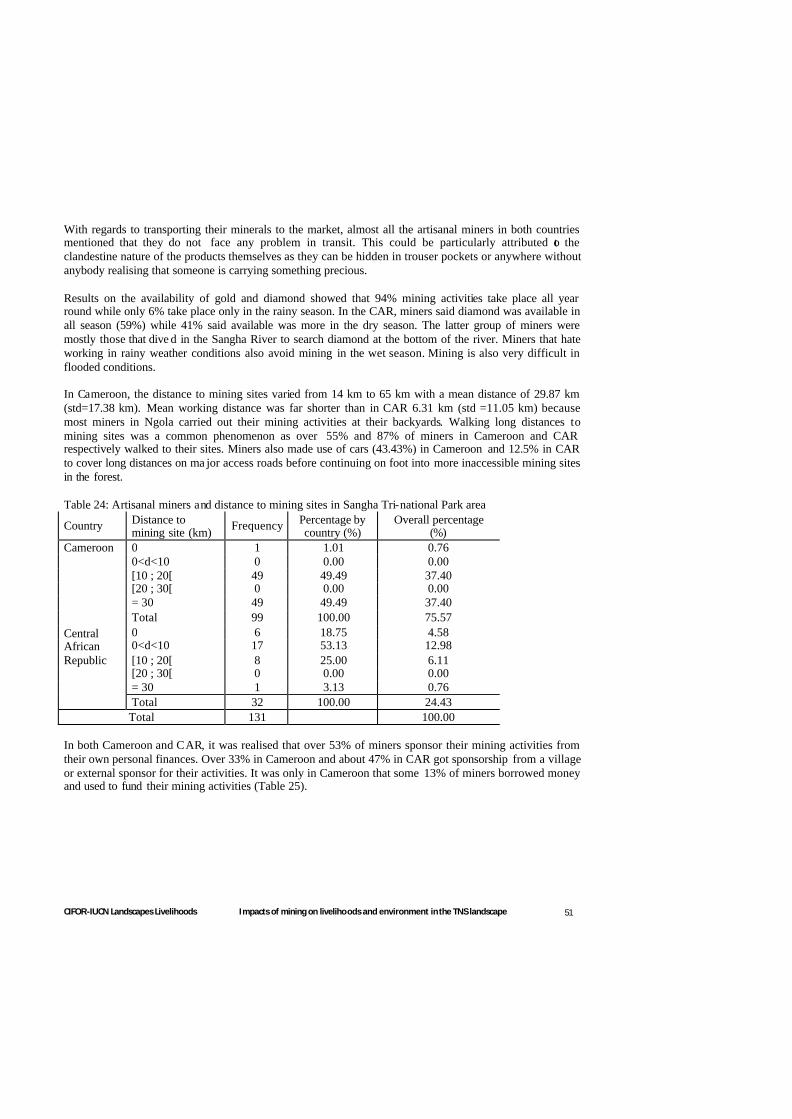
CIFOR-IUCN Landscapes Livelihoods Impacts of mining on livelihoods and environment in the TNS landscape
51
With regards to transporting their minerals to the market, almost all the artisanal miners in both countries mentioned that they do not face any problem in transit. This could be particularly attributed to the clandestine nature of the products themselves as they can be hidden in trouser pockets or anywhere without anybody realising that someone is carrying something precious. Results on the availability of gold and diamond showed that 94% mining activities take place all year round while only 6% take place only in the rainy season. In the CAR, miners said diamond was available in all season (59%) while 41% said available was more in the dry season. The latter group of miners were mostly those that dive d in the Sangha River to search diamond at the bottom of the river. Miners that hate working in rainy weather conditions also avoid mining in the wet season. Mining is also very difficult in flooded conditions. In Cameroon, the distance to mining sites varied from 14 km to 65 km with a mean distance of 29.87 km (std=17.38 km). Mean working distance was far shorter than in CAR 6.31 km (std =11.05 km) because most miners in Ngola carried out their mining activities at their backyards. Walking long distances to mining sites was a common phenomenon as over 55% and 87% of miners in Cameroon and CAR respectively walked to their sites. Miners also made use of cars (43.43%) in Cameroon and 12.5% in CAR to cover long distances on ma jor access roads before continuing on foot into more inaccessible mining sites in the forest. Table 24: Artisanal miners and distance to mining sites in Sangha Tri-national Park area
Country Distance to mining site (km) Frequency Percentage by
country (%) Overall percentage
(%) Cameroon
0 1 1.01 0.76 0<d<10 0 0.00 0.00 [10 ; 20[ 49 49.49 37.40 [20 ; 30[ 0 0.00 0.00 = 30 49 49.49 37.40 Total 99 100.00 75.57
Central African Republic
0 6 18.75 4.58 0<d<10 17 53.13 12.98 [10 ; 20[ 8 25.00 6.11 [20 ; 30[ 0 0.00 0.00 = 30 1 3.13 0.76 Total 32 100.00 24.43 Total 131 100.00
In both Cameroon and CAR, it was realised that over 53% of miners sponsor their mining activities from their own personal finances. Over 33% in Cameroon and about 47% in CAR got sponsorship from a village or external sponsor for their activities. It was only in Cameroon that some 13% of miners borrowed money and used to fund their mining activities (Table 25).

CIFOR-IUCN Landscapes Livelihoods Impacts of mining on livelihoods and environment in the TNS landscape
52
Table 25: Source of capital for artisanal miners in the Sangha Tri- national Park Country Source of capital Frequency Percentage by country (%) Overall percentage (%)
Cameroon
Self finances 54 54.55 41.22 Village sponsor 13 13.13 9.92 External sponsor 19 19.19 14.50 Borrowed money 13 13.13 9.92
Total 99 100.00 75.57
Central African Republic
Self finances 17 53.13 12.98 Village sponsor 8 25.00 6.11 External sponsor 7 21.88 5.34 Total 32 100.00 24.43
Total 131 - 100.00
Artisanal mining takes place within a market system that is worth examining in the section follows. Functioning of markets Generally the market for artisanal miners is not organised. Most miners sell to individual collectors, 66.67% in Cameroon and 93.75% in CAR. The role of an organisation involved in the market system was more obvious in Cameroon, under the Government controlled initiative CAPAM. Sponsors also served as collectors of minerals from their workers at arbitrary take-it or leave -it prices. However, this was more prevalent in Cameroon (23.23%) than in CAR (6.25%) (Table 26). Table 26: Main buyers of products of artisanal miners in Sangha Tri-national Park area Country Buyers Frequency Percentage by country (%) Overall percentage (%)
Cameroon
Individual collector 66 66.67 50.38 Organisation 10 10.10 7.63
Sponsor 23 23.23 17.56
Total 99 100.00 75.57
Central African Republic
Individual collector 30 93.75 22.90
Sponsor 2 6.25 1.53
Total 32 100.00 24.43
Total 131 - 100.00
As early discussed, most of the buyers are resident in cities or towns such as Kika, Yokadouma, Nola and Yaounde. As always the case with absentee intermediaries, most miners come to buy the products with pre-determined prices and the miners have no bargaining power given their widely dispersed nature. In short artisanal miners in the TNS region are price takers. Price trends and ambiguities Global commodity prices for gold and diamo nd have more than doubled in recent years. The question answered by this research was whether such increases had trickled down to the artisanal miners at the grassroots of the trade chain. This research results showed that in reality the prices of gold have almost doubled with a minimum current stated price per gram of 6500 CFA Francs and maximum of 9500 CFA Francs. This compares favourably with the price five years ago of 3500-5000 FCFA. However, with regards to diamonds in both Cameroon and CAR, price variability was enormous with no obvious way of reasoning out unit prices (Table 27).

CIFOR-IUCN Landscapes Livelihoods Impacts of mining on livelihoods and environment in the TNS landscape
53
Table 27: Price trends/variability for gold and diamond in Sangha Tri- national Park area. Country Variables Mineral Frequency Minimum Maximum Mean
Std deviation
Cameroon
Current price per unit (XAF)
Gold 63 6500 9500 8468.25 438.78
Unit price 5 years ago (XAF)
Gold 63 3500 5000 4079.37 241.07
Current price per unit (XAF) Diamond 17 10000 350000 97264.71 101265.76
Price per unit 5 years ago(XAF)
Diamond 17 5000 450000 93676.47 110206.19
Central African Republic
Current price per unit (XAF)
Diamond 32 20000 350000 138437.50 77755.17
Unit p rice 5 years ago (XAF)
Diamond 32 20000 600000 197968.75 124264.67
These ambiguities in pricing of diamonds became too evident at the early implementation of CAPAM in Cameroon. In 2007, the response was that diamonds produced were channeled to the central CAPAM project office for sale according an approved price list (Table 28). This approach still faced several setbacks and in 2008 the purchase of diamonds from artisanal miners by CAPAM was suspended by the Minister in charge of mines. CAPAM as at the time of data collection for this study in November 2008 was only purchasing gold from artisanal miners. Table 28: CAPAM price reference for Diamonds in 2007
Size of diamond Equivalent weight (in carats)
Price per carat (in FCFA) Value of diamond without defects (First grade)
Observations
Select 0.01 to 0.25 5000 to 35000
On the basis of defects (broken, full, colour)
Mixed Mixed 0.25 to 0.50 35000 to 90000 On the basis of defects (broken, full, colour)
Firmly Mixed
0.50 to 0.90 90000 to 150000 On the basis of defects (broken, full, colour)
Carat
0.90 to1 150000 to 250000 On the basis of defects (broken, full, colour)
1 to 2 250000 to 350000 On the basis of defects (broken, full, colour)
2 to 2.50 400000 to 450000 Price negotiable
On the basis of defects (broken, full, colour)
2.50 to 3 450000 to 650000 Price negotiable On the basis of defects (broken, full, colo ur)
3 to 4 700000 to 800000 Price negotiable On the basis of defects (broken, full, colour)
4 to 6 1 000 000 Price negotiable On the basis of defects (broken, full, colour)
> 6 > 1 000 000 Price negotiable On the basis of defects (broken, full, colour)
Source: CAPAM, 2007.

CIFOR-IUCN Landscapes Livelihoods Impacts of mining on livelihoods and environment in the TNS landscape
54
Even though there was a stated range of unit prices, prices paid to small-scale miners were still negotiable based on defined characteristics or defects (broken, full or coloured). Unfortunately, no single miner today knows precisely these characteristics or the defects or the best colour that commands the best price. Moreover, no small- scale miner has the scale for measuring the quality or weight. These are determined arbitrarily by the buyers -middlemen, generally known as collectors. The foundation of cartels in the diamond business is rooted within these practices, with consequences for the small-scale miner’s prices and bargaining power. Small-scale miners that work for sponsors generally did not know the unit price of their minerals. For instance, as for the source of capital for their activities, sponsored miners were ignorant of the level of business capital, claiming they were fed and paid to carry out their job. The perception of some small-scale miners at the Mobilong site associated with the intervention of CAPAM differed. At the beginning most of them had no capital but now some of them have capital of up to 300000 CFA Francs, and is one way they can assess the impact of assistance given to them by CAPAM. Fiscal regimes Artisanal mining in the TNS region is basically informal and illegal, particularly on the Cameroonian side, where nobody confirmed having paid an annual fee or tax of any category or being in possession of legal mining permits. However, in the CAR a little over 56%of artisanal miners pay the labourers’ tax and possess an annual mining card (Table 29). Table 29: Perceptions on the payment of mining tax in the Sangha Tri-national Park area
Country Any tax paid? Frequency Percentage by country (%) Overall percentage (%)
Cameroon
No 99 100.00 75.57
Total 99 100.00 75.57 Central African Republic
Yes 18 56.25 13.74 No 14 43.75 10.69
Total 32 100.00 24.43
Total 131 - 100.00
In Cameroon no tax was mentioned as being paid by small-scale miners although the Mining Code of Cameroon has the provision for an annual tax payment. According to the Divisional Delegate for Mines, Boumba and Ngoko, small-scale miners are required by Law to pay an annual tax of not more than 5000 CFA Francs. A major challenge in Cameroon is to help the small-scale miners to formalize their activities. In CAR, small-scale miners (labourers) were observed to pay an annual tax of 2000 CFA Francs while the head of sites paid an annual tax of 30050 CFA Francs. Collectors or buyers normally pay an annual tax of up to 1100 000 CFA Francs. There is no organised sale of products in the TNS because each miner sells individually to buyers. Artisanal miners (74%) in Cameroon believed that in comparison to the past, the current situation of mining in the region is better than say five years ago. This is contrary to what was observed in CAR where artisanal miners stated that the current situation was worse than five years ago (Table 30).

CIFOR-IUCN Landscapes Livelihoods Impacts of mining on livelihoods and environment in the TNS landscape
55
Table 30: Opinion of miners on trends of bene fits flows in Sangha Tri-national Park area
Country Comparison of present and past situations
Frequency Percentage by country
(%) Overall percentage
(%)
Cameroon
More 67 73.63 54.47 Less 20 21.98 16.26 Same 4 4.40 3.25 Total 91 100.00 73.98
Central African Republic
More 5 15.63 4.07 Less 26 81.25 21.14 Same 1 3.13 0.81 Total 32 100.00 26.02
Total 123 - 100.00
For most miners in Cameroon, benefit flows from mining were better now than five years ago and 74% quoted price increase as the major reason. Government suspension of purchase offices that led to a fall in prices as in CAR was a major reason behind the drop in the flow of benefits to artisanal miners This difference with CAR may also be explained by the increasing gold price (and taking gold only into consideration for Cameroon (Table 31) Table 31: Reasons for changes in benefit flows in the Sangha Tri-national Park area
Country Trend Reasons responsible for an increase/decrease Frequency
Percentage by trend (%)
Percentage by reason (%)
Cameroon
Increase
More experience 9 10.98 8.65 Good price 61 74.39 58.65 Help from family/hire labour 7 8.54 6.73
New site discovered 4 4.88 3.85 New materials bought 1 1.22 0.96 Total 82 100.00 78.85
Decrease
Government suspension 15 68.18 14.42 Impoverishment of site/Overexploitation
2 9.09 1.92
Lack materials 5 22.73 4.81
Total 22 100.00 21.15 Total 104 100.00
Central African Republic
Increase
More experience 2 33.33 6.45 Good price 2 33.33 6.45 Help from family/hire labour
1 16.67 3.23
New site discovered 1 16.67 3.23 Total 6 100.00 19.35
Decrease
Fall in prices 13 52.00 41.94 Government suspension 4 16.00 12.90 Impoverishment of site/Overexploitation 5 20.00 16.13
Lack materials 3 12.00 9.68 Total 25 100.00 80.65
Total 31 - 100.00

CIFOR-IUCN Landscapes Livelihoods Impacts of mining on livelihoods and environment in the TNS landscape
56
4.3.2 Environmental impacts In both Cameroon and CAR over 53% artisanal miners believe that gold and diamond are infinite resourc es. However, more artisanal miners in CAR (47%) were conscious of the possibility of diamond exhaustion at their sites compared to those in Cameroon (17%) (Table 32). Table 32: Artisanal miners’ perception on possibility of mineral exhaustion in the Sangha Tri-national Park area.
Country Any thought on mineral exhaustion?
Frequency Percentage by country (%)
Overall percentage (%)
Cameroon
Yes 17 17.17 12.98 No 82 82.83 62.60 Total 99 100.00 75.57
Central African Republic
Yes 15 46.88 11.45 No 17 53.13 12.98
Total 32 100.00 24.43
Total 131 - 100.00
The notion of infinite resources by most artisanal miners in Cameroon was more justifiable when about 72% of them stated that they were producing more minerals now compared to the past, 5-10 years ago. However, in CAR over 81% of diamond diggers said they were getting lesser quantity now than 5-10 years ago (Table 33). Table 33: Present and past production trends of diamond/gold compared in the Sangha Tri-national Park area
Country Present production compared to the past (5-10 years ago)
Frequency Percentage by country (%)
Overall percentage (%)
Cameroon
More 71 71.72 54.20 Less 24 24.24 18.32 The same as before 4 4.04 3.05 Total 99 100.00 75.57
Central African Republic
More 4 12.50 3.05 Less 26 81.25 19.85 The same as before 2 6.25 1.53
Total 32 100.00 24.43
Total 131 - 100.00
Mixed reasons were given for the decrease or increase in the production of gold and diamond in the TNS. Most miners in Cameroon stated that increased production was associated with three main reasons: increase in prices (19.77%), the use of hired labour (23.26%), and the purchase of new tools (16.28%). Other reasons included support from government agencies and more experience achieved over the years. For those who mentioned a decrease in production, the most important reasons were associated with more people entering into the business that lead to over-exploitation and lesser amount of money per unit time. On the CAR side, very few people mentioned the increase in income as a reason for increased production but many mentioned over-exploitation and lack of external supports as major reasons for the decrease in production (Table 34).

CIFOR-IUCN Landscapes Livelihoods Impacts of mining on livelihoods and environment in the TNS landscape
57
Table 34: Opinions on present and past production trends of diamond/gold compared in the Sangha Tri-national Park area
Country Please give your opinion Frequency Percentage by
country (%) Overall
percentage (%)
Cameroon
Increasingly gives more money 17 19.77 15.60 Increasing give less money 9 10.47 8.26 Support from government agencies 4 4.65 3.67 Lack of supports 9 10.47 8.26 More people digging/Overexploitation 8 9.30 7.34 New materials bought 14 16.28 12.84 Hire labour 20 23.26 18.35 Experience 9 10.47 8.26 No buyers 4 4 .65 3.67 Total 86 100.00 78.90
Central African Republic
Increasingly gives more money 1 4.35 0.92 Increasing give less money 3 13.04 2.75 Lack of supports 7 30.43 6.42 Fetish/sacrifice practices 2 8.70 1.83 More people digging/overexploitation 9 39.13 8.26 New materials bought 1 4.35 0.92
Total 23 100.00 21.10
Total 109 100.00
From these results one could conclude a greater optimism among artisanal miners in Cameroon than those in CAR as about 65% of them in Cameroon had the vision that production would be better in the next 10-20 years. On the contrary in CAR most of them (72%) were pessimistic about future production increases (Table 35). This could be one of the reasons why more Central Africans were found in Cameroon as artisanal miners than the reverse was the case. Table 35: Vision of artisanal mining business in the Sangha Tri-national Park area
Country Vision of mining business in 10-20 years.
Frequency Percentage by country (%)
Overall percentage (%)
Cameroon
Better 64 64.65 48.85 Same 20 20.20 15.27 Less 15 15.15 11.45
Total 99 100.00 75.57 Central African Republic
Better 4 12.5 3.05 Same 5 15.625 3.82 Less 23 71.875 17.56
Total 32 100 24.43
Total 131 - 100.00
Apart from eliciting perceptio ns on trends of production, artisanal miners were asked to give their impressions on the link between their activity and the environment. About 68% and 66% of miners in Cameroon and CAR respectively were of the opinion that mining had no negative environme ntal impacts

CIFOR-IUCN Landscapes Livelihoods Impacts of mining on livelihoods and environment in the TNS landscape
58
(Table 36). This could be associated with mere ignorance of what environmental impacts actually meant to them or simply because they were afraid to be criminalised. For the over 32% that were aware of one or more environmental impacts of mining 45% and 58% in Cameroon CAR respectively stated that unfilled open mines was a crucial issue related to the environment. Table 36: Artisanal miners’ perception on negative environmental impacts of mining in the Sangha Tri-national Park area.
Country Perception on negative environmental impact Frequency
Percentage by country (%)
Overall percentage (%)
Cameroon
Yes 32 32.32 24.43 No 67 67.68 51.15 Total 99 100.00 75.57
Central African Republic
Yes 11 34.38 8.40 No 21 65.63 16.03
Total 32 100.00 24.43
Total 131 - 100.00
Water contamination or diversion of streams was mention by 35% of environmentally conscious miners in Cameroon compared to 25% in CAR. Water contamination could be in the form of siltation and sedimentation in disturbed water courses and hardly because of the use of chemicals. Poaching, soil contamination and biodiversity loss were the less cited environmental consequences of mining in the TNS region (Table 37). Poaching could be a problem because most of the miners depended appreciably on bushmeat for the daily protein needs. Unless for endemic species around water courses, due to the small surface areas generally covered, the impact of artisanal mining might be minimal on biodiversity loss. The elicitations of the small-scale miners was in conformity with those of conservation specialists that artisanal mining could not threaten biodiversity of the region or disrupt logging activities because their activities were limited along water courses (hardly more than 50 m wide or hardly over 10000 m2 in surface area). It is important to caution in this report that environmental impacts could be small with fewer artisanal miners but if the ir number increases continuously to alarming proportions, the future overall impacts could be appreciable and comparable to those inflicted by large -scale miners. Table 37: Environmental impacts of artisanal mining stated by artisanal miners in the Sangha Tri- national Park area.
Country Possible environmental impacts
Frequency Percentage by country (%)
Overall percentage (%)
Cameroon
Water contamination 17 34.69 27.87 Air contamination 2 4.08 3.28 Open mines 23 46.94 37.70 Biodiversity loss 6 12.24 9.84 Soil contamination 1 2.04 1.64 Total 49 100.00 80.33
Central African Republic
Air contamination 3 25.00 4.92 Biodiversity loss 1 8.33 1.64 Open mines 7 58.33 11.48 Poaching 1 8.33 1.64
Total 12 100.00 19.67
Total 61 - 100.00

CIFOR-IUCN Landscapes Livelihoods Impacts of mining on livelihoods and environment in the TNS landscape
59
3.3.3 Safety and health According to Walle and Jennings (2001) occupational safety and health (OSH) are important issues for the world’s 13 million or so small-scale miners – many of whom work in surface mines – and their communities. Progress in dealing with diseases and accidents affecting small-scale miners will require a better understanding of the risks and hazards and of the practices and measures to prevent them. Better data would be required to improve programmes to be targeted, covering small-scale miners under OSH regulations (Walle and Jennings, 2001). In both Cameroon and CAR, over 73% of artisanal mines do not use any protective equipment at mining sites, albeit located in distance places inside the forest with numerous risks and dangers. Physical risks and dangers as well as those associated with water borne diseases (miners stay in dirty water for several hours), sexually transmitted diseases and the deadly HIV AIDS virus are of little concern to the artisanal miners. A few miners in Cameroon build solid huts for protection against animals (10.7%) and some use mosquito nets against malaria infecting mosquitoes (16%). In CAR, the only protection measure used by 17.65% miners was to establish huts in open areas, free of trees and heavy branches (Table 38). In most cases miners believed that God was their protector. Table 38: Safety and protection measures used by artisanal miners in the Sangha Tri-national Park area.
Country Protection from harmful elements Frequency
Percentage by country (%)
Overall percentage (%)
Cameroon
No protection 41 73.21 56.16 Build solid huts 6 10.71 8.22 Use mosquito nets 9 16.07 12.33
Total 56 100.00 76.71 Central African Republic
No protection 14 82.35 19.18 Cut all big trees 3 17.65 4.11
Total 17 100.00 23.29
Total 73 - 100.00
In the TNS region, it would be important to seek the support of the International Labour Organisation (ILO) to address safety and health issues. When artisanal miners in the TNS region are sick, they often use both modern medicines and herbal remedies to cure themselves. This is true for 77% and 66% of miners in Cameroon and CAR respectively. Forest herbs formed the sole source of remedy for 22% of artisanal miners in Cameroon and 28% in CAR. Miners that depended solely on modern drugs for their treatment were rare (Table 39). Table 39: Treatment measures used by artisanal miners in the Sangha Tri-national Park area.
Country Treatment when sick
Frequency Percentage by country (%)
Overall percentage (%)
Cameroon
Drug store 1 1.01 0.76 Forest herbs 22 22.22 16.79 Both 76 76.77 58.02 Total 99 100.00 75.57
Central African Republic
Drug store 2 6.25 1.53 Forest herbs 9 28.13 6.87 Both 21 65.63 16.03
Total 32 100.00 24.43
Total 131 - 100.00

CIFOR-IUCN Landscapes Livelihoods Impacts of mining on livelihoods and environment in the TNS landscape
60
The above results testify the role of medicinal remedies in the lives of small-scale miners. None of the small-scale miners in the study area uses mercury or cyanide for the extraction of their minerals. However, they need to have certain skills and a good knowledge of possible hazards and risks in the region. With these achieved, risks can be eliminated, minimised, controlled at source or miners may use personal protective equipment.
3.3.4 Processing and production tools All minerals mined in the region are sold unprocessed by the small-scale miners. When miners were asked whether the equipment currently used were appropriate for their activities, over 60% of them in both countries confirmed that the equipment were efficient (Table 40). This could be associated with a complete lack of knowledge on modern or more efficient equip ment rather than their satisfaction with the status-quo. Table 40: Perceptions on the use of current mining equipment in the Sangha Tri-national Park area.
Country Efficiency of current equipment used Frequency
Percentage by country (%)
Overall percentage (%)
Cameroon
Yes 50 75.76 57.47 No 16 24.24 18.39
Total 66 100.00 75.86 Central African Republic
Yes 13 61.90 14.94 No 8 38.10 9.20
Total 21 100.00 24.14
Total 87 - 100.00
The efficiency of current tools used was further confirmed when about 89% of miners in Cameroon and 97% in CAR stated that extraction methods have remained the same over the years. Most of those that mentioned a certain level of change (11%) were located in Cameroon (Mboy), where a government agency called CAPAM ha s been providing equipment and technical assistance to small-scale miners since 2006. At Mobilong CAPAM gives motor- pumps to artisanal miners free of charge, which they could have hired at the cost of 5000 FCFA per day. Under the CAPAM market facilitation aspect, in 2006 be the structure channelled 50 kg of gold and 300 carat of diamonds. One part of this money goes into a revolving fund; other part goes for material amortisation and a third part of about 3% for gold and 8% for diamond is used to pay value-added tax. 50% of the tax is put into the public treasury, 15% to the local council (Mairie), 10% to local populations and 25% to monitoring and control organ. According to the small-scale miners in Cameroon, the ma in reasons behind the changes in extraction methods were associated with government support (70%), increase in personal capital (10%) and sponsorship by outsiders (20%). In CAR, the singular reason mentioned to be responsible for the change in extraction methods was the increase in personal capital that led to the purchase of motorised boats and pumps.
Supprimé: All the
Supprimé: do not
Commentaire [JS3]: how can this be explained? how and where is the gold then extracted from the ore?

CIFOR-IUCN Landscapes Livelihoods Impacts of mining on livelihoods and environment in the TNS landscape
61
3.3.5 Alternative sources of income When artisanal miners were asked about other livelihood activities they carry outside mining, 92% and 93% in Cameroon and CAR respectively mentioned they had others things they do apart from mining. These artisanal miners carried out one to six activities with a mean of 3 activities in Cameroon (std=1.29) and a mean of 2.5 activities in CAR (std=1.41). It was realized that in both countries, 90% artisanal miners carry out one to four activities in addition to mining (Table 41) Table 41: Number of other activities performed by artisanal miners around the TNS Park
Country Number of others activities Frequency
Percentage by country (%)
Overall percentage (%)
Cameroon
1 15 16.30 12.30 2 24 26.09 19.67 3 19 20.65 15.57 4 24 26.09 19.67 5 9 9.78 7.38 6 1 1.09 0.82
Total 92 100.00 75.41 Central African Republic
1 10 33.33 8.20 2 7 23.33 5.74 3 4 13.33 3.28 4 6 20.00 4.92 5 3 10.00 2.46
Total 30 100.00 24.59 Total 122 100.00
Among the activities mentioned, artisanal miners stated the best two alternative activities outside mining were agriculture (43% in Cameroon, 83% in CAR); NTFP gathering (23% in Cameroon, 10% in CAR) (Table 42) Table 42: Perception of artisanal miners on the best alternative activities outside mining in the TNS Park
Country Best alternative activity to mining
Frequency Percentage by country (%)
Overall percentage (%)
Cameroon
NTFP gathering 21 22.58 17.21 Fishing 1 1.08 0.82 Farming 40 43.01 32.79 Hunting 7 7.53 5.74 Livestock rearing 4 4.30 3.28 Paid labour 4 4.30 3.28 Trading 15 16.13 12.30 Others 1 1.08 0.82 Total 93 100.00 76.23
Central African Republic
NTFP gathering 3 10.34 2.46 Fishing 1 3.45 0.82 Farming 24 82.76 19.67 Hunting 1 3.45 0.82
Total 29 100.00 23.77
Total 122 100.00

CIFOR-IUCN Landscapes Livelihoods Impacts of mining on livelihoods and environment in the TNS landscape
62
A further inquiry into economics of the income generated from activities outside mining showed that eight other income portfolios were relevant to artisanal miners in Cameroon and five for those in CAR. In both countries, ANOVA tests showed significant differences among the means of the different sources of income at 5% level (Table 43). Appreciable annual income came from agriculture and non-timber forest products but more specialised activities such as paid labour and trade gave higher mean incomes although comparable to the former. Table 43: One way ANOVA tests for differences among other sources of revenue (Cameroon above and Central African Republic below)
ANOVAa
amount
2,10E+11 7 2,996E+10 15,353 ,0005,05E+11 259 19512816567,15E+11 266
Between GroupsWithin GroupsTotal
Sum ofSquares df Mean Square F Sig.
country = Cameroona.
ANOVAa
amount
1,05E+11 4 2,633E+10 4,282 ,0044,24E+11 69 61496497665,30E+11 73
Between GroupsWithin GroupsTotal
Sum ofSquares df Mean Square F Sig.
country = Central African Republica.
For the 131 artisanal miners interviewed in Cameroon and CAR, the annual income generated from other activities amounted to over 20.5 million CFA Francs. In both countries agriculture was the most important source of income for miners, seconded by NTFP gathering in Cameroon and fishing in CAR, associated with the expertise of Central Africans in fishing in the Sangha River and the fact that some miners were divers. A Tukey rank test (Appendix 1a) showed that in Cameroon, income from farming, trade, paid labour and NTFP gathering were not different from each other but they were significantly higher than income from hunting, fishing and livestock rearing. A similar test (Appendix 1b) conducted for CAR showed that income from farming was significantly higher than income from NTFP gathering but was not different from income from fishing, livestock and hunting (Table 44). The distribution of mean annual incomes is illustrated in Figure 8.
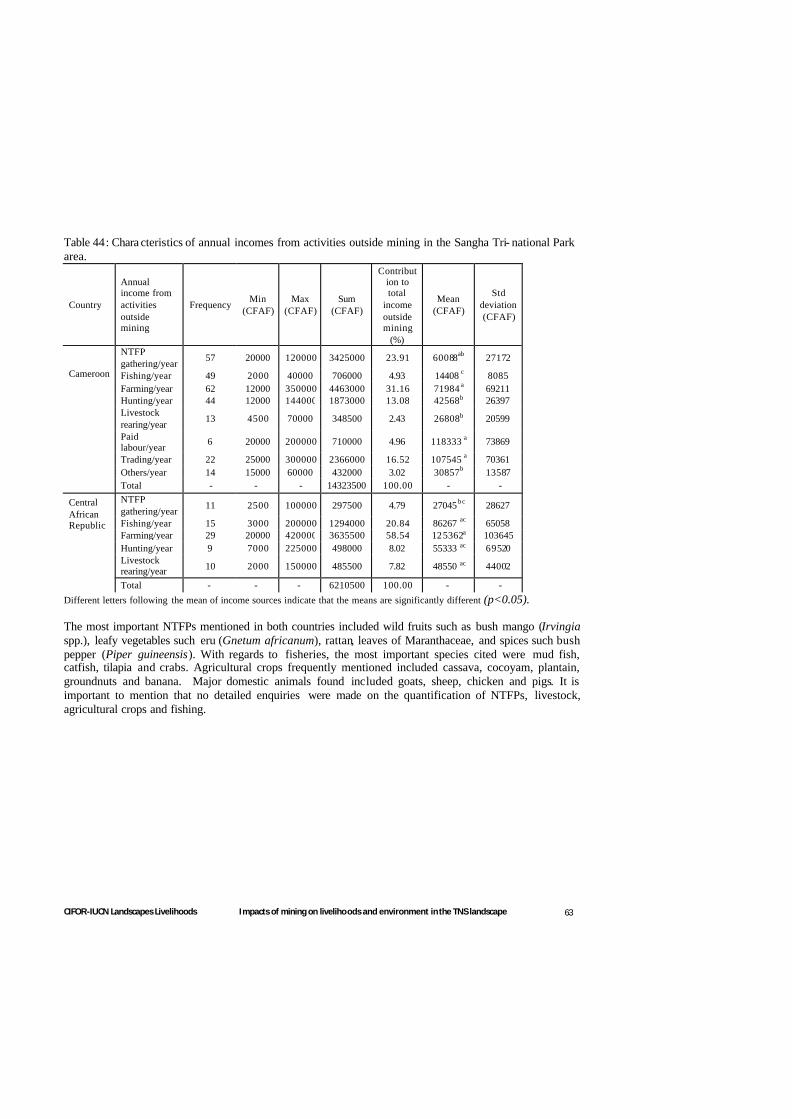
CIFOR-IUCN Landscapes Livelihoods Impacts of mining on livelihoods and environment in the TNS landscape
63
Table 44: Chara cteristics of annual incomes from activities outside mining in the Sangha Tri- national Park area.
Country
Annual income from activities outside mining
Frequency Min
(CFAF) Max
(CFAF) Sum
(CFAF)
Contribution to total
income outside mining
(%)
Mean (CFAF)
Std deviation (CFAF)
Cameroon
NTFP gathering/year
57 20000 120000 3425000 23.91 60088ab 27172
Fishing/year 49 2000 40000 706000 4.93 14408 c 8085 Farming/year 62 12000 350000 4463000 31.16 71984 a 69211 Hunting/year 44 12000 144000 1873000 13.08 42568b 26397 Livestock rearing/year
13 4500 70000 348500 2.43 26808b 20599
Paid labour/year
6 20000 200000 710000 4.96 118333 a 73869
Trading/year 22 25000 300000 2366000 16.52 107545 a 70361 Others/year 14 15000 60000 432000 3.02 30857b 13587 Total - - - 14323500 100.00 - -
Central African Republic
NTFP gathering/year
11 2500 100000 297500 4.79 27045bc 28627
Fishing/year 15 3000 200000 1294000 20.84 86267 ac 65058 Farming/year 29 20000 420000 3635500 58.54 125362a 103645 Hunting/year 9 7000 225000 498000 8.02 55333 ac 69520 Livestock rearing/year 10 2000 150000 485500 7.82 48550 ac 44002
Total - - - 6210500 100.00 - -
Different letters following the mean of income sources indicate that the means are significantly different (p<0.05). The most important NTFPs mentioned in both countries included wild fruits such as bush mango (Irvingia spp.), leafy vegetables such eru (Gnetum africanum), rattan, leaves of Maranthaceae, and spices such bush pepper (Piper guineensis). With regards to fisheries, the most important species cited were mud fish, catfish, tilapia and crabs. Agricultural crops frequently mentioned included cassava, cocoyam, plantain, groundnuts and banana. Major domestic animals found included goats, sheep, chicken and pigs. It is important to mention that no detailed enquiries were made on the quantification of NTFPs, livestock, agricultural crops and fishing.

CIFOR-IUCN Landscapes Livelihoods Impacts of mining on livelihoods and environment in the TNS landscape
64
0.00
100000.00
200000.00
300000.00
400000.00
500000.00
600000.00
700000.00
Min
ing
inco
me
NT
FP
gath
erin
g/ye
ar
Fis
hing
/yea
r
Far
min
g/ye
ar
Hun
ting/
year
Live
stoc
kre
arin
g/ye
ar
Pai
dla
bour
/yea
r
Tra
ding
/yea
r
Oth
ers/
year
Mining income and others sources of revenue
Mea
n r
even
ue
(CF
A F
ran
cs)
Cameroon Central African Republic
Figure 9: Mean annual incomes from mining and other sources in the Sangha Tr i-national Park area
3.3.6 Use of mining income Earning an income from mining was considered as important as how the income earned was utilised. To this, artisanal miners were asked to mention the uses to which the y spend their income from mining. Interestingly, all the miners used their mining income to meet at least two basic needs and at most six. In both Cameroon and CAR, over 90% of the miners used their income to meet 4-6 basic needs (Table 45). These basic needs included: education of children, health and drugs, purchase of radios/TV, food, clothes and construction of houses. Table 45: Number of basic needs met by using income from artisanal mining in the Sangha Tri-national Park
Country Number of basic needs Frequency Percentage by country (%)
Overall percentage (%)
Cameroon
2 1 1.02 0.77 3 7 7.14 5.38 4 23 23.47 17.69 5 37 37.76 28.46 6 30 30.61 23.08
Total 98 100.00 75.38
Central African Republic
3 2 6.25 1.54 4 13 40.63 10.00 5 11 34.38 8.46 6 6 18.75 4.62
Total 32 100.00 24.62
Total 130 100.00
Considering the numerous uses of income from mining, ANOVA level one tests showed that there were significant differences among the various uses in both countries (Table 46).

CIFOR-IUCN Landscapes Livelihoods Impacts of mining on livelihoods and environment in the TNS landscape
65
Table 46: One way ANOVA tests for differences among uses of mining revenues- (Cameroon above and Central African Republic below)
ANOVAa
percent
57875,599 5 11575,120 89,654 ,00060552,085 469 129,109118427,7 474
Between GroupsWithin GroupsTotal
Sum ofSquares df Mean Square F Sig.
country = Cameroona.
ANOVAa
percent
20823,609 5 4164,722 24,923 ,00023227,425 139 167,10444051,034 144
Between GroupsWithin GroupsTotal
Sum ofSquares df Mean Square F Sig.
country = Central African Republica.
The Tukey rank test (Appendix 2a&b) revealed the needs that were actually different from each other, as well as those that received the same attention. For instance, in both Cameroon and CAR, the purchase of food was the most important use of income from mining. It is important to note that alcoholic drinks represented over 20% of food costs mentioned by most miners. In Cameroon, income used for children’s education was the second most important use. The third most important use was for the purchase of clothes, and in the fourth position was for purchase of drugs, construction of houses and the purchase of radios and television (information and technology). Similarly, in CAR, the education of children, purchase of drugs, information tools and clothes were ranked together after food (Table 47). Table 47: Proportion of mining income used for meeting specific household needs (%)
Country Variables Frequency Relative frequency (%)
Minimum (%)
Maximum (%)
Mean (%)
Std deviation
Cameroon
Education 64 64.65 5 50 26.30b 12.91 Drugs 86 86.87 5 40 12.07 cd 6.90 Information 47 47.47 5 45 10.23d 8.05 Food 96 96.97 5 80 39.99a 18.91 Clothes 97 97.98 4 45 16.29c 7.42 Construction 85 85.86 5 40 11.75 cd 6.70
Central African Republic
Education 27 84.38 5 51 17.81b 11.41 Drugs 29 90.63 5 40 10.34b 7.06 Information 11 34.38 2 40 10.18b 10.73 Food 31 96.88 5 75 43.39a 19.51 Clothes 31 96.88 5 60 18.94b 12.07 Construction 16 50.00 5 45 16.56b 10.01
Different letters following the mean of basic needs indicate that the means are significantly different (p<0.05).

CIFOR-IUCN Landscapes Livelihoods Impacts of mining on livelihoods and environment in the TNS landscape
66
From the above results, it is clear that mining income in the TNS can be used to increase the possibility of meeting the millennium development goals of reducing poverty and hunger; improving health, information and communication, and as well as building infrastructure such as better shelter for all. An illustration of the proportion on mining income used to meet basic needs by artisanal miners in the TNS is shown in Figure 9.
0
5
10
15
20
25
30
35
40
45
50
Edu
catio
n
Dru
gs
Info
rmat
ion
Food
Clo
thes
Con
stru
ctio
n
Uses of mining revenue
Pro
po
rtio
n o
f rev
enu
e u
sed
(%)
Cameroon Central African Republic
Figure 10: Proportion of mining income used for basic needs around TNS Park
3.4 Problems and Opportunities of artisanal mining in the TNS
3.4.1 Problems The problems of the small scale miners in the TNS region were cited to include lack of food and medicines, harassment by conservation agents, dishonesty of sponsors, low production, harsh government laws and actions, lack of mineral detecting and exploitation materials, prices changes and lack of start up capitals. In Cameroon, the most crucial problems that represented 75.68% of citations included lack of detecting and exploitation tools, lack of food/medicines at sites and low production. In the CAR, the most two crucial problems constituted over 65.7% of the citations including low production and lack of detecting and exploitation equipment (Table 48).

CIFOR-IUCN Landscapes Livelihoods Impacts of mining on livelihoods and environment in the TNS landscape
67
Table 48: Problems faced by artisanal miners in the Sangha Tri- national Park area Country Major problems faced Frequency Percentage by
country (%) Overall
percentage (%)
Cameroon
Low production 22 19.82 15.17 Harsh government law/Closure of sale offices
18 16.22 12.41
Lack of detecting and exploitation materials
32 28.83 22.07
Lack of food and medicines at site 30 27.03 20.69 Dishonest sponsors 8 7.21 5.52 Start up capital 1 0.90 0.69
Total 111 100.00 76.55
Central African Republic
Low production 9 26.47 6.21 Harsh government law 2 5.88 1.38 Lack of detecting and exploitation materials
13 38.24 8.97
Lack of food and medicines at site 2 5.88 1.38 Fall in price 2 5.88 1.38 Start up capital 6 17.65 4.14
Total 34 100.00 23.45 Total 145 - 100.00
These problems identified show similar characteristics as the visualization of the ASM sector by Hentchel et al. (2002) with the illustration of the most common issues involving government related, trade related and exploitation related problems. The consequence pictured in this model is a vicious circle of informality and the effects of inefficient tax administration including dependency on intermediaries, unfavourable sale conditions, poverty and dependency on mining activity.
3.4.2 Opportunities The question that remains to be answered is whether intervention of any type and scale can help break the vicious cycle of informality and dependencies to enable the small-scale miners earn more equitable income from mining. To these, the small-scale miners in the TNS region cited a number of opportunities for resolving their problems including assistance to get working tools (48.9% in Cameroon and 36.4% in CAR) and legal papers (23% in Cameroon and 30% in CAR) (Table 49).
Supprimé: results
Supprimé: are in agreement with
Supprimé: the
Commentaire [JS4]: include this graph?
Supprimé:

CIFOR-IUCN Landscapes Livelihoods Impacts of mining on livelihoods and environment in the TNS landscape
68
Table 49: Opportunities cited by artisanal miners in TNS landscape for resolving problems Country Opportunities for resolving problems Frequency Percentage by
country (%) Overall
percentage (%)
Cameroon
Assistance to get working materials 55 48.67 37.67 Assistance to get legal papers 26 23.01 17.81 Open sale agencies in village 10 8.85 6.85
Fix prices 6 5.31 4.11 Create cooperatives 9 7.96 6.16
Training on modern mining techniques
7 6.19 4.79
Total 113 100.00 77.40 Central African
Republic
Assistance to get working materials 12 36.36 8.22 Assistance to get legal papers 10 30.30 6.85 Open sale agencies in village 4 12.12 2.74
Fix prices 1 3.03 0.68 Create cooperatives 6 18.18 4.11
Total 33 100.00 22.60
Total 146 - 100.00
The interesting aspect was that for miners who were aware of the need for a mineral detecting tool (called tester), none of them could state the price of the tool. Some mentioned a price range of between one and five million CFA Francs for a tester. The miners however, cited the cost of motor-pumps (used to bail out water from mines) at 200000 to 250000 CFA Francs. Over 65% of miners in both Cameroon and CAR believed that the government should or could help them get working tools as well as ensure sensitisation on the mining code. The issue of mining code was more apparent because about 25% of the artisanal miners called for greater transparency in the sector with related reduction in costs of obtaining legal papers and fixation of prices (Table 50). Table 50: Opportunities for government to solve problems faced by artisanal miners in TNS area
Country What the government can do to solve problems
Frequency Percentage by country (%)
Overall percentage (%)
Cameroon
Sensitize miners on code 16 13.45 10.19 Reduce costs of obtaining papers
9 7.56 5.73
Assist miners to get materials 64 53.78 40.76 Open transparent sale offices 16 13.45 10.19 Insure sponsor respect engagements
5 4.20 3.18
Fix/increase prices 9 7.56 5.73
Total 119 100.00 75.80 Central African Republic
Sensitize miners on code 13 34.21 8.28 Assist miners to get materials 15 39.47 9.55 Open transparent sale offices 6 15.79 3.82 Fix/increase prices 4 10.53 2.55
Total 38 100.00 24.20
Total 157 - 100.00
A major related issue was the fact that about 62% and 81% of the artisanal miners in Cameroon and CAR were respectively not aware of the mining code and could not comment on its efficiency and enforcement in the field. With regards to convenience in obtaining legal mining papers, 64% and 67% of miners in

CIFOR-IUCN Landscapes Livelihoods Impacts of mining on livelihoods and environment in the TNS landscape
69
Cameroon and CAR respectively said it was not easy to go through the process of obtaining them. Controversially, most of those who said it was easy to have legal papers never actually had them at the time of this research, a proof of the difficulties of obtaining legal documents by artisanal miners in the TNS region. For the few that had legal papers in CAR, they mentioned that the additional benefit they had over those who did not was basically the freedom to exploit and sell their minerals. They stated that government and NGO supports were not available to support them in their legal operations. In terms of government support to the ASM in the TNS region, 67% and 53% of miners in Cameroon and CAR respectively mentioned the complete absence of any form of support. However, 29% in Cameroon mentioned of education and technical training, which was really the case with diamond miners in the Mboy region under the CAPAM project. In the CAR side, education and technical training represented 40% of the support from government (Table 51). Table 51: Types of government support in the artisanal mining sector in the Sangha Tri-national Park area
Country Kinds of government support or programs Frequency Percentage by
country (%) Overall
percentage (%) Cameroon
Education 1 1.01 0.76 Technical training 28 28.28 21.37 Exploration equipment 4 4.04 3.05 No support 66 66.67 50.38 Total 99 100.00 75.57
Central African Republic
Education 9 28.13 6.87 Technical training 4 12.50 3.05 Exploration equipment 2 6.25 1.53 No support 17 53.13 12.98 Total 32 100.00 24.43
Total 131 - 100.00 Despite the seemingly negative image given by the artisanal miners on government supports in the sector, over 42% of them in Cameroon still believed that the government was the leader in trying to improve the sector. Some 20% of the miners believed that individual investors were taking the lead to improve the sector while 38% believed that things were static in the sector in Cameroon. Corresponding responses in CAR were 80% for government leadership, 8% for individual leader and 12% for no improvement efforts of any kind.
3.4.3 Aggregated data Despite the high diversity of income sources for most artisanal miners in the TNS region, mining still conspicuously contributed to their annual income representing over 82% in Cameroon and 65% in CAR. While some artisanal miners were actually making money, others were seriously losing income. This could be associated with the peculiar problems of the sector. Overall income from natural sources (mining, NTFP gathering, hunting and fishing) represented about 90% and 77% in Cameroon and CAR respectively (Table 52). This is indicative of the high level of artisanal miners’ dependency on the environment for their livelihoods in the TNS region.

CIFOR-IUCN Landscapes Livelihoods Impacts of mining on livelihoods and environment in the TNS landscape
70
Table 52: Characteristics of miners’ income sources in the Sangha Tri-national Park area
Country Variables Frequency Minimum (CFAF)
Maximum (CFAF)
Sum (CFAF)
Contribution to total miners’
income (%)
Mean (CFAF)
Std deviation (CFAF)
Cameroon
Total income from other sources
99 0 550000 14323500 17.94
144681.82 117670.10
Total income from natural sources
99 -390000 2132000 71505500
89.58 722277.78 550352.11
Total mining income
99 -404000 2092000 65501500
82.06
661631.31 558202.62
Total miners' income 99 -370000 2462000 79825000
100.00 806313.13 567263.23
Central African Republic
Total income from other sources
32 0 770000 6210500 34.52
194078.13 155859.23
Total income from natural sources
32 -957450 2517550 13868200
77.09 433381.25 882567.97
Total mining income
32 -1032450 2517550 11778700
65.48
368084.38 904426.74
Total miners' income
32 -767450 2767550 17989200 100.00 562162.50 914797.12
Gini Coefficients The Gini coefficient is a measure of statistical dispersion most prominently used as a measure of inequality of income distribution or inequality of wealth distribution. It is defined as a ratio with values between 0 and 1: A low Gini coefficient indicates more equal income or wealth distribution, while a high Gini coefficient indicates more unequal distribution. 0 corresponds to perfect equality (everyone having exactly the same income) and 1 corresponds to perfect inequality (where one person has all the income, while everyone else has zero income). Results from the calculation of Gini coefficients to measure income inequality among artisanal miners in the TNS region showed an absolute income Gini of 0.50 and an absolute non-mining income Gini coefficient of 0.43. The implication of this result is that poverty gap between the rich and the poor miners widens in-so-far as both groups continue mining under the prevailing organisational set up and governance structures. This result could be pertinent only for the mining households (the focus of this analysis) because other studies conducted in the region for all rural households showed that forest environmental income actually helps to reduce income inequality in the region (Tieguhong, 2008). A similar result was found by Aryal (2002) in Uganda where forest income was actually helping to reduce income inequality amongst the people adjoining the Budongo Forest. Logistic regression results Logistic regression is a model used to predict the probability of occurrence of an event by fitting data to a logistic curve . It makes use of several predictor variables that may be either numerical or categorical. The logistic regression conducted to test the dependency of artisanal miners on mining activities in the TNS region was found to be significant (p<0.05). The likelihood ratio test showed that the regression model was significant and the model predicted the dependent variable 79.74% correctly. In this model ethnic group, education level and time in mining were the main explanatory independent variables with significant effect

CIFOR-IUCN Landscapes Livelihoods Impacts of mining on livelihoods and environment in the TNS landscape
71
on mining dependency (Table 53). Ethnicity was a major factor in earning a higher income from artisanal mining. As expected, migrant miners with skills, capital and better education and experience could get more benefits from artisanal mining than say the indigenous Bangandos and Baaka/Baka pygmies. These different outcomes for different groups could predominantly prevail where the governance and organisation of the sector are still very poor and informal, causing possible marginalization of minorities and the sustenance of the vicious circle of dependency and poverty (Hentchel et al., 2002). Table 53: Results of logistic regression analysis for mining dependency in the Sangha Tri-national Park area.
Independent variables Coef. Std. Err.
z P>z 95% Conf. Interval
Lower bound Upper bound
Country 2.392 1.519 1.570 0.115 -0.585 5.368
Village -1.437 0.836 -1.720 0.086** -3.076 0.202
Mineral mined 1.412 0.960 1.470 0.141 -0.469 3.293
Number of wives 0.501 0.464 1.080 0.28 -0.410 1.411 Total number of dependant -0.045 0.064 -0.700 0.481 -0.170 0.080
Ethnic group -0.092 0.032 -2.860 0.004* -0.155 -0.029
Education level 0.531 0.234 2.270 0.023* 0.072 0.989
Occupation as miner 0.103 0.485 0.210 0.831 -0.847 1.053
Time in mining (years) 0.056 0.027 2.040 0.04* 0.002 0.109
Cons -2.534 1.750 -1.450 0.148 -5.963 0.896
Number of obs = 131
Log likelihood = -79.740339
Prob > chi2 = 0.0293
* variables significant at 5% **variable significant at 10% The analysis showed that ethnicity was a major factor in earning a higher income from artisanal mining. As expected, migrant miners with skills, access to capital, better education and experience could get higher income from artisanal mining, than say the indigenous Bangandos and Baaka/Baka pygmies. This situation prevails where the governance and organisation of the sector are still low and informal. This permits marginalization of minorities and sustains a vicious circle of dependency and poverty (Hentchel et al ., 2002).

CIFOR-IUCN Landscapes Livelihoods Impacts of mining on livelihoods and environment in the TNS landscape
72
4. Conclusions Many countries in Africa are blessed with abundant natural resources, which basically sustain millions of people and national economies. Those resources also have the potential to drive economic growth and human development – but this potential is not often realised (Commission for Africa, 2005). Natural resources-dependent countries in Africa have very poor records in human development indices because the benefits from those resources do not trickle down to the critical mass. This is typically true for countries of the Congo Basin, where millions of people live in abject poverty and squalor but with abundant forest, minerals, wildlife, and fishery resources at the ir backyards. Recent World Bank supported strategies in the region had been to make use of available natural resources to stimulate economic growth. The result has been woefully disappointing with most people still remaining poor and a few elites greedily grasping all the windfalls. This is generally associated with poor governance structures punctuated by corruption, lack of transparency and the sideline of the poor in participating and benefiting from growth. According to the report of the Commission for Africa (2005) where incomes are unequal most of the benefits from growth goes to the wealthy. As evident from the results of this study, poor governance and informality characterise the natural resource sector typical of the artisanal mining of gold and diamond in the Sangha Tri-national Park area. The consequence is a possible reduction (though not fully measured by this research) in the contribution of the ASM sector to the livelihoods of the people of the region. Aside generalities, the livelihoods and environmental impacts of artisanal mining in the TNS region were glaring in this study. The socio-economic and livelihoods impacts could be stated in terms of employment, income, provision of greater opportunities for education, health and shelter. For example, some 517 artisanal miners were found in 17 mining sites in the TNS. Of these, the 131 miners that were interviewed had 875 dependants including 433 children. This translates into some 3453 dependants including 1709 children for the entire mining population of 517 persons. Mean annual net income from exploiting and selling gold and diamond were 575338 CFA Francs (std = 461913) and 812644 CFA Francs (std = 676487) respectively in Cameroon. On the CAR side of the TNS, ASM diamond miners obtained mean annual net mining income of 368084 CFA Francs (std = 904427) (Table 20). The fact that the stand deviation was about three times the mean was a clear indication of the enormous gap in mining income distribution in CAR, with some miners getting huge sums and others relatively nothing. This implies that while some miners were actually making money from artisanal mining activities, some were actually losing significant sums of money with net loss of up to 1032450 CFA Francs in CAR and over 400000 CFA Francs in Cameroon. For miners with significant gains greater than the mean mining benefit (44.4% in Cameroon and 21.9% in CAR), respective net annual mining incomes in Cameroon and CAR were 1 180 646 CFAF (std=338 562) and 1 752 007 (std=704 430). However, the game of chance or luck seemed to keep losers in continuous hopes that one day they shall find sizeable minerals to cover their costs. The livelihoods implication for income earned from mining was that most artisanal miners spent their income from mining to meet at least two basic needs and at most six. In both Cameroon and CAR, over 90% of the miners used their income to meet 4-6 basic needs including education of children, health and drugs, purchase of radios/TV, food, clothes and construction of houses. Meeting these needs fall within the expectations of realising some of the most important United Nation Millennium Development Goals (MDGs). However, the fact that appreciable proportions of miners were actually losing income implied that

CIFOR-IUCN Landscapes Livelihoods Impacts of mining on livelihoods and environment in the TNS landscape
73
artisanal mining could also be treated as a risky business in alleviating poverty under prevailing socio-economic and institutional arrangements. In terms of environmental impacts, the present scale and conduct of artisanal mining in the TNS region do not significantly threaten environmental values but could be the case in future following the influx of large-scale mining operators and possible increase in the number of artisanal miners associated with increasing populations, improved extraction methods, better market outlets and profit making. Environmental impacts from artisanal mining in the TNS Landscape appear to be temporal, of limited size short term and of low significance. The majority of mining takes place along streams, so that direct but temporal and insignificant impacts include temporal diversions, siltation and sedimentation of streams. Only limited felling of trees or land clearance was observed, which is mainly short term. Land tended to be cleared for the period of mining, often temporal or seasonal, and then abandoned, with no or little farming activities taking place in the mining areas. The indirect effects of working in the forest areas, leading to timber and non timber forest products exploitation, particularly bush meat and medicinal plants, appear limited as only up to 21% (Cameroon) and 28% (CAR) of respondents indicated these as a secondary or alternative activity. Whilst NTFPs, hunting and fishing were also classified as important alternative sources of income, they provided a lower contribution to annual incomes than farming. In both Cameroon and CAR over 53% of the artisanal miners stated that gold and diamond are infinite resources and 67% of the miners believed that mining had no negative environmental impacts. Stakeholders who stated that they were aware of environmental impacts mentioned the issues of: unfilled open mines and water contamination or diversion of streams. In Cameroon, 20% of the miners indicated that they (also) mine inside the reserve, in contrast to only 1 (out of 32 miners) in CAR. The miners do not report any use of mercury or cyanide for gold extraction. A vivid conclusion from the above understanding is that for the ASM sector to make the expected contribution to poverty alleviation in the region there would be a great need for deliberate efforts to break the vicious circles that reinforce each other and shackle the sector. This would involve tackling informality in production and trade, increasing access to mining titles by the poor, improving information flows on mining codes at the grassroots and assisting in the provision of basic tools to boost start-up capital. Deliberate government or external supported programmes would serve to organize the sector and inform stakeholders on the benefits of formal businesses, big or small. In this light, the current contributions of mining incomes to meeting the basic needs of the people would expectedly increase within a more environmentally friendly and better governance arrangement. Performance of this kind would carter for possible environmental impacts of small-scale mining such as water pollution and diversion of stream courses, soil depression associated with haphazard excavations and poaching of wild animals. Moreover, alternative activities to mining such as NTFP gathering, farming and livestock rearing, could be rendered economically viable with outside supports, thus increasing incomes and reducing regional poverty. Therefore, development policies that can stimulate environmentally sound mining practices in the TNS region and at the same time reduce poverty would entail informing and assisting the poorest miners in the opportunities for practis ing legal mining, improving health and safety standards, and education of the critical mass.

CIFOR-IUCN Landscapes Livelihoods Impacts of mining on livelihoods and environment in the TNS landscape
74
5. Recommendations Overall, the major recommendations made in this report target all intervening stakeholders including the regional governments including all concerned ministerial departments, non-governmental organisations, business entities and development agencies. The first recommendation is that parties collaborate and harmonise strategies concerning the artisanal and large scale mining sector. This will enable potentially conflicting activities such as timber and mining concessions occupying the same space, large-scale and small-scale miners in the same area, mining in parks etc to be managed. Secondly, although the existing mining codes for the three countries sharing the TNS area elaborate the country specific context s, for a trans-boundary areas such as TNS, harmonization and monitoring of trafficking of products could be beneficial for all countries. This would require a sound research and synthesis of the key issues that can improve resource governance, increase transparency among collectors or buyers and reduce bureaucratic bottlenecks as well as corruption. Thirdly, raising awareness and capacity of miners on the need to operate lega lly and the process to do this is the first steps towards a more formal, organized sector with a more enabling institutional and regulatory environment could assist the development of more sustainable livelihood activities. The role of local NGOs, familiar with mining sites located 15-30 km in the forest, in collaboration with local government structures in sensitisation campaigns could be beneficial. A forum for information exchange as well as sharing experiences on production, processing and market skills, training miners on financial management and valuing minerals would be beneficial activities. Fourthly, specific on the ground research is needed to determine if the level of impacts is as low as observed and recorded during this short study. This would involve longer periods of field work and observation and use of satellite imagery and confirmation about the use of mercury or other chemicals.

CIFOR-IUCN Landscapes Livelihoods Impacts of mining on livelihoods and environment in the TNS landscape
75
6. Bibliography Arena Gold Resources Inc., 2000, Acquisition of an interest in the Yangadou Mine: Arena Gold Resources
Inc. press release, November 15, 1 p. Akonolinga 2009. SERAK S.A. Société d’exploitation rutile d’Akonolinga,
http://www.akonolinga.net/pages/uk/mining_uk.htm, 30 January 20099 American University, 2009, Sierra Leone Mining and Environment Case, Washington Dc,
http://www.american.edu/ted/LEONE.HTM Aryal B. 2002. Are trees for the poor? A study from Budongo Forest, Uganda. MSc Thesis. NLH. Bahuguna V.K. 2000. Forests in the economy of the rural poor: An estimation of the dependency level.
Ambio, 29 (3):126-129. CAR. 2004. Ordinance No.04.001 Portant Code Minier de la Republique Centrafricaine. 41pp. CASM. 2008. Mining Together Large-Scale Mining Meets Artisanal Mining: A Framework for Action. Indaba. South Africa. 65 pp. CBFP (2006). The Forests of the Congo Basin: state of the forest 2006. Brazzaville, Congo Basin Forest
Partnership (CBFP). Communities And Small-scale Mining (CASM) 2001. Artisanal Mining:Force for or Obstacle to
Biodiversity Conservation ? Africa Biodiversity Collaborative Group Discussions December 19, 2001 http://www.frameweb.org/CommunityBrowser.aspx?id=2054
Cavendish W. 2003. How do forests support, insure and improve the livelihoods of the rural poor? A research note. CIFOR. Bogor. Indoneisa.
CBFP (2006). The Forests of the Congo Basin: state of the forest 2006. Brazzaville, Congo Basin Forest Partnership (CBFP).
CIA Central Intelligence Agency 2009. World Fact books.https://www.cia.gov/library/publications/the-world-factbook/
Commission for Africa. 2005. Our Common Interest. Report of the Commission for Africa. March. 462 pp. De Koning R., Tieguhong J.C. and V. Amougou. 2007. Cross-border trade and conservation in the Sangha
River region (Cameroon, Central African Republic and Republic of Congo). Nature & Faune 22 (2): 17-24.
Diamond Facts. 2006. Human Development Index http://www.diamondfacts.org/difference/index.html http://www.diamondfacts.org/difference/hdi_popup.html
Divisional officer of Boumba&Ngoko Division. 2008. Mot d’ouverture de monsieur le préfet du département de la Boumba et Ngoko. Atelier de lancement de LLS dans le TNS. Yokadouma, 21-22 Mai 2008. 4pp.
Dublin, H.T.and Taylor, R.D. 1996. Making management decisions from data. In: Studying Elephants (Ed. K Kangwana) AWF Technical Handbook No. 7. African Wildlife Foundation, Nairobi. Pp 10 – 19.
EITI. 2008. EITI Business Guide. How companies can support implementation. Dave Prescott (Ed.). EITI and IBLF. 40 pp. EITI Factsheet. 2008. The EITI sets a global standard for managing revenues from natural resources. EITI International Secretariat. August. 4pp. Encyclopedia of the Nations. 2008. Africa: Central African Republic Mining. http://www.nationsencyclopedia.com/Africa/Central-African-Republic-MINING.html. Cited 23 December 2008.

CIFOR-IUCN Landscapes Livelihoods Impacts of mining on livelihoods and environment in the TNS landscape
76
Forster J. and Bill J.H. 1992. Passendro Gold Project: AXMIN identifies a new gold belt in the Central African Republic. 15pp.
GEF (Global Environment Facility). 2006. The role of local benefits in global environmental programs. GEF Evaluation Office. Evaluation Report No. 30. ISBN: 1-933992-01-8. pp. 3-10.
Gweth P.N. 2008. Le pays multiplie les efforts pour faire connaitre ses richesses minières. Cameroon. 8-Octobre 2008. XINHUA. www.jeuneafrique.com. Cited 28 November 2008.
Gweth P.N. 2003. Fundamental reasons at the base of the creation of CAPAM. Coordinator’s letter. Information Review for the Promotion of Mining Activities in Cameroon (Bimonthly). Yaounde. Pp. 5-11.
Hentschel T, Hruschka F. and Priester M. 2003. Artisanal and small-scale mining: challenges and opportunities. IIED. London. 82 pp.
Hentschel T, Hruschka F. and Priester M. 2002. Global report on artisanal & small-scale mining. IIED and WBCSD. MMSD. London. 67pp.
Hilson G., 2005. Strengthening artisanal mining research and policy through baseline census activities, Natural Resources Forum, Volume 29 Issue 2, Pages 144 - 153
Jackson D. 2004. Implementation of international commitments on traditional forest related knowledge: Indigenous peoples’ experiences in Central Africa. FPP. 100 pp.
Jennings N.S 1999. Child labour in small-scale mining: examples from Niger, Peru and Philippines. SAP 2.78/WP.137. ILO. Geneva.
Kamis A. 2006. Rapport de mission d’identification et de localisation des campements miniers le long de la riviere Lobe. Projet Dzanga-Sangha. Bayanga. 6pp.
Kimberly Process 2007. Kimberly Process Communiqué. Kimberly Process (08-11 2007). http://www.answers.com/topic/congo. Accessed 03/02/09. Kimberly Process 2004. Kimberly Process Removes the Republic of Congo from the List of Participants. Kimberly Process (09-07-2004). http://www.answers.com/topic/congo. Accessed 03/02/09. Labonne B., Gilman J., 1999.Towards building sustainable livelihoods in the artisanal mining1
communities. Tripartite Meeting on Social and Labour Issues in Small-scale mines, ILO, Geneva, 17-21 May 1999
Lang C. 2007. L’Or Camerounais mal exploite. Le Messager. http://www.cameroon-info.net/cmi_show_news.php?id=19684 Cited 10/11/08.
Matip O. 2003. The small-scale mine and the large mine: necessary cohabitation. Information Review for the Promotion of Mining Activities in Cameroon (Bimonthly). Yaounde. PP. 24-28.
Mbendi 2008. Cameroon: Overview of Mining in Cameroon. http://www.mbendi.co.za/indy/ming/af/cmr/p0005.htm Cited 30 December 2008.
Mbendi 2008. Central African Republic:Overview of Mining in Central African Republic http://www.mbendi.co.za/indy/ming/af/cr/p0005.htm Cited 30 December 2008.
MINEF. 2004. Plan d’Aménagement du Parc National de Lobeke. 81pp. MINEF. 1996. Plan National de gestion de l’environnement. Analyses Sectorielles. Volume II. PNGE.
Yaounde. MMSD (Mining, Minerals and Sustainable Development). 2002. Report of the Workshop on Artisanal and
Small-scale mining. IIED. London. 19-20 November 2001. PJM. 2004. Congo Brazzaville admits to diamond trafficking. June 2004. http://www.professionaljeweler.com/archives/news/2004/061504story.html Accessed 02/02/09 Reed E. and Miranda M. 2007. Assessment of the Mining Sector and Infrastructure Development in the Congo Basin Region. WWF Washington, DC USA. 27 pp.

CIFOR-IUCN Landscapes Livelihoods Impacts of mining on livelihoods and environment in the TNS landscape
77
Republic of Cameroon. 2001. Loi No. 001-2001 du 16 Avril 2001 portant Code Minier de la République du Cameroun. 18 pp.
Republic of Congo. 2005. Loi No. 4-2005 du 11 Avril 2005 portant Code Minier de la République du Congo. Brazzaville. 52 pp.
Service of the Prime Minister. 2008. Extractive Industries Transparency Initiative (EITI) in Cameroon. Plan of action. http://www.spm.gov.cm/showdoc.php?id_docs=321&lang=fr&tpl=1 Shoko D. S. M. 2003. Small- scale mining and alluvial gold panning within the Zambezi Basin : an ecological time bomb and tinderbox for future conflicts among riparian states. 17 pp. http://www.sadc-usa.net/reference/protocol/h20prot.html. Cited 29/12/08. Sunderland T.C.H., Ehringhaus C. and B. M. Campbell. 2008. Comment. Conservation and development in
tropical forest landscapes: a time to face the trade-offs. Environmental Conservation 34 (4): 276-279. Tieguhong J.C. 2008. Ecotourism for sustainable development: Economic valuation of recreational
potentials of protected areas in the Congo Basin. Unpublished PhD Thesis. University of KwaZulu-Natal, Pietermaritzburg, South Africa. 258 pp.
Tieguhong J.C. and J. Zwolinski. 2008. Unrevealed economic benefits from forests in Cameroon. Paper presented at the IUFRO Conference (IUFRO Unit 4.05.00 – Managerial economics and Accounting) in Ljubljana, Slovenia. 22 - 24 May 2008. Tieguhong J.C. and Ndoye O. 2007. The impact of timber harvesting in forest concessions on the
availability of Non-Wood Forest Products (NWFP) in the Congo Basin. FAO Forest Harvesting Case Study 23. ISBN: 978-92-5-105709-4.
UNIDO, Mining, environment and development, http://www.natural-resources.org/minerals/cd/unido.htm 30 January 2009
USAID Environmental Guidelines 2000, Part III: Micro- and Small Enterprises United Nations Economic And Social Council 2003, Economic Commission For Africa, Third meeting of
the committee on sustainable development, 7-10 October 2003, Addis Ababa, Ethiopia, reports on selected themes in natural resources development in Africa: artisanal and small-scale mining and technology challenges in Africa
USGSMRP, 2008. Brazzaville Fact Sheet. Gold Produc tion for Congo Brazzaville. http://www.datavillage.com/facts/Brazzaville.html. Accessed 03/02/09 Vedeld, P.; Angelsen, A.; Bojo, J.; Sjaastad, E.; Berg, G.K. 2007. Forest environmental incomes and the
rural poor. Forest Policy and Economics 9: 869–879. Vedeld P., Angelsen A. Sjaastad E. and Berg G.K. 2004. Counting on the environment: Forest incomes and
the rural poor. Environment Department Paper # 98. World Bank. 95 pp. Veiga M.,Hinton J., 2002. Abandoned artisanal gold mines in the Brazilian Amazon: A legacy of mercury
pollution, Natural Resources Forum, Volume 26 Issue 1, Pg 15 - 26 Walle M and Jennings N. 2001. Safety and health in small-scale surface mines. A Handbook.Working
Paper (WP.168). ILO. Geneva. 48 pp. Werthmann K. 2003. The President of the gold diggers: Sources of power in a gold mine in Burkina Faso. Ethnos, Vol. 68 (1): 95 – 111. Wikipedia 2008. Mining in Cameroon. http://en.wikipedia.org/wiki/Mining_in_Cameroon. Cited 10/12/08. World Bank 2003. Implementation Completion Report: Report No: 26746 (Tf-20957; Tf-28673) on a
grant in the amount of US$ 6 million to the Republic of Cameroon for a Biodiversity Conservation And Management Project. September 11. 44 pp.
World Rainforest Movement, 2002. Bulletin Nº 54, January 2002, http://www.wrm.org.uy/bulletin/54/CAR.html 30 January 2009
Appendices

CIFOR-IUCN Landscapes Livelihoods Impacts of mining on livelihoods and environment in the TNS landscape
78
Appendix 1a: Tukey test for comparison of means of other revenue sources- Cameroon
Multiple Comparisons a
Dependent Variable: amountTukey HSD
45679,556* 8605,526 ,000 19382,0181 71977,0939-11896,152 8105,880 ,824 -36666,8262 12874,522917519,537 8864,554 ,500 -9569,5606 44608,635633280,027 13576,88 ,222 -8209,4099 74769,4639
-58245,614* 18959,08 ,048 -116182,4597 -308,7684-47457,735* 11087,27 ,001 -81339,2175 -13576,253029230,576 13176,13 ,344 -11034,2057 69495,3586
-45679,556* 8605,526 ,000 -71977,0939 -19382,0181-57575,708* 8443,599 ,000 -83378,4122 -31773,0032-28160,019* 9174,387 ,048 -56195,9327 -124,1044-12399,529 13781,17 ,986 -54513,2634 29714,2053-103925,17* 19105,91 ,000 -162310,7105 -45539,6297-93137,291* 11336,52 ,000 -127780,4448 -58494,1377-16448,980 13386,54 ,923 -57356,7530 24458,793811896,152 8105,880 ,824 -12874,5229 36666,826257575,708* 8443,599 ,000 31773,0032 83378,412229415,689* 8707,445 ,019 2806,7001 56024,678245176,179* 13474,82 ,020 3998,6066 86353,7507
-46349,462 18886,13 ,220 -104063,3874 11364,4627-35561,584* 10962,07 ,029 -69060,4478 -2062,719341126,728* 13070,94 ,038 1183,3714 81070,0848
-17519,537 8864,554 ,500 -44608,6356 9569,560628160,019* 9174,387 ,048 124,1044 56195,9327
-29415,689* 8707,445 ,019 -56024,6782 -2806,700115760,490 13944,39 ,950 -26852,0128 58372,9919
-75765,152* 19223,97 ,003 -134511,4711 -17018,8319-64977,273* 11534,38 ,000 -100225,0645 -29729,481011711,039 13554,50 ,989 -29710,0265 53132,1044
-33280,027 13576,88 ,222 -74769,4639 8209,409912399,529 13781,17 ,986 -29714,2053 54513,2634
-45176,179* 13474,82 ,020 -86353,7507 -3998,6066-15760,490 13944,39 ,950 -58372,9919 26852,0128-91525,641* 21801,66 ,001 -158149,0919 -24902,1901-80737,762* 15452,94 ,000 -127960,2247 -33515,2997-4049,4505 17013,99 1,000 -56042,3232 47943,422158245,614* 18959,08 ,048 308,7684 116182,4597103925,17* 19105,91 ,000 45539,6297 162310,710546349,462 18886,13 ,220 -11364,4627 104063,387475765,152* 19223,97 ,003 17018,8319 134511,471191525,641* 21801,66 ,001 24902,1901 158149,091910787,879 20344,73 ,999 -51383,3820 72959,139687476,190* 21554,37 ,002 21608,4176 153343,963447457,735* 11087,27 ,001 13576,2530 81339,217593137,291* 11336,52 ,000 58494,1377 127780,444835561,584* 10962,07 ,029 2062,7193 69060,447864977,273* 11534,38 ,000 29729,4810 100225,064580737,762* 15452,94 ,000 33515,2997 127960,2247
-10787,879 20344,73 ,999 -72959,1396 51383,382076688,312* 15102,05 ,000 30538,1192 122838,5042
-29230,576 13176,13 ,344 -69495,3586 11034,205716448,980 13386,54 ,923 -24458,7938 57356,7530
-41126,728* 13070,94 ,038 -81070,0848 -1183,3714-11711,039 13554,50 ,989 -53132,1044 29710,02654049,45055 17013,99 1,000 -47943,4221 56042,3232-87476,190* 21554,37 ,002 -153343,9634 -21608,4176-76688,312* 15102,05 ,000 -122838,5042 -30538,1192
(J) activityFishingFarmingHuntingLivestock rearingPaid labourTradingOthersNTFP gatheringFarmingHuntingLivestock rearingPaid labourTradingOthersNTFP gatheringFishingHuntingLivestock rearingPaid labourTradingOthersNTFP gatheringFishingFarmingLivestock rearingPaid labourTradingOthersNTFP gatheringFishingFarmingHuntingPaid labourTradingOthersNTFP gatheringFishingFarmingHuntingLivestock rearingTradingOthersNTFP gatheringFishingFarmingHuntingLivestock rearingPaid labourOthersNTFP gatheringFishingFarmingHuntingLivestock rearingPaid labourTrading
(I) activityNTFP gathering
Fishing
Farming
Hunting
Livestock rearing
Paid labour
Trading
Others
MeanDifference
(I-J) Std. Error Sig. Lower Bound Upper Bound95% Confidence Interval
The mean difference is significant at the .05 level.*.
country = Cameroona.
Appendix 1b: Tukey test for comparison of means of other revenue sources – Central African Republic

CIFOR-IUCN Landscapes Livelihoods Impacts of mining on livelihoods and environment in the TNS landscape
79
Multiple Comparisonsa
Dependent Variable: amountTukey HSD
-59221,212 31129,34 ,326 -146421,3471 27978,9228-98316,614* 27768,97 ,006 -176103,6300 -20529,5989-28287,879 35247,04 ,929 -127022,5890 70446,8314-21504,545 34264,03 ,970 -117485,6536 74476,562759221,212 31129,34 ,326 -27978,9228 146421,3471
-39095,402 24940,60 ,523 -108959,5178 30768,713230933,333 33064,65 ,882 -61688,0348 123554,701537716,667 32014,71 ,764 -51963,5874 127396,920798316,614* 27768,97 ,006 20529,5989 176103,630039095,402 24940,60 ,523 -30768,7132 108959,517870028,736 29922,42 ,145 -13790,5586 153848,029976812,069 28757,99 ,069 -3745,3902 157369,528128287,879 35247,04 ,929 -70446,8314 127022,5890
-30933,333 33064,65 ,882 -123554,7015 61688,0348-70028,736 29922,42 ,145 -153848,0299 13790,55866783,33333 36031,37 1,000 -94148,4626 107715,129321504,545 34264,03 ,970 -74476,5627 117485,6536
-37716,667 32014,71 ,764 -127396,9207 51963,5874-76812,069 28757,99 ,069 -157369,5281 3745,3902-6783,3333 36031,37 1,000 -107715,1293 94148,4626
(J) activityFishingFarmingHuntingLivestock rearingNTFP gatheringFarmingHuntingLivestock rearingNTFP gatheringFishingHuntingLivestock rearingNTFP gatheringFishingFarmingLivestock rearingNTFP gatheringFishingFarmingHunting
(I) activityNTFP gathering
Fishing
Farming
Hunting
Livestock rearing
MeanDifference
(I-J) Std. Error Sig. Lower Bound Upper Bound95% Confidence Interval
The mean difference is significant at the .05 level.*.
country = Central African Republica.

CIFOR-IUCN Landscapes Livelihoods Impacts of mining on livelihoods and environment in the TNS landscape
80
Appendix 2a: Tukey test for multiple comparisons of means of uses of mining revenues –Cameroon
Multiple Comparisonsa
Dependent Variable: percentTukey HSD
14,22711* 1,87579 ,000 8,8595 19,594816,06283* 2,18273 ,000 9,8168 22,3088
-13,69271* 1,83363 ,000 -18,9397 -8,445710,00822* 1,82985 ,000 4,7720 15,244414,54393* 1,88049 ,000 9,1628 19,9250
-14,22711* 1,87579 ,000 -19,5948 -8,85951,83572 2,06113 ,949 -4,0623 7,7337
-27,91982* 1,68705 ,000 -32,7474 -23,0922-4,21889 1,68294 ,124 -9,0347 ,5969
,31683 1,73787 1,000 -4,6562 5,2898-16,06283* 2,18273 ,000 -22,3088 -9,8168
-1,83572 2,06113 ,949 -7,7337 4,0623-29,75554* 2,02284 ,000 -35,5440 -23,9671
-6,05462* 2,01941 ,034 -11,8332 -,2760-1,51890 2,06541 ,977 -7,4292 4,391413,69271* 1,83363 ,000 8,4457 18,9397
27,91982* 1,68705 ,000 23,0922 32,747429,75554* 2,02284 ,000 23,9671 35,544023,70092* 1,63582 ,000 19,0200 28,381928,23664* 1,69228 ,000 23,3941 33,0792
-10,00822* 1,82985 ,000 -15,2444 -4,77204,21889 1,68294 ,124 -,5969 9,03476,05462* 2,01941 ,034 ,2760 11,8332
-23,70092* 1,63582 ,000 -28,3819 -19,02004,53572 1,68818 ,080 -,2951 9,3665
-14,54393* 1,88049 ,000 -19,9250 -9,1628-,31683 1,73787 1,000 -5,2898 4,65621,51890 2,06541 ,977 -4,3914 7,4292
-28,23664* 1,69228 ,000 -33,0792 -23,3941-4,53572 1,68818 ,080 -9,3665 ,2951
(J) itemsHealth, buy drugsInformations, radio/TVBuy foodBuy clothes
Constructions/OthersEducation of childrenInformations, radio/TVBuy foodBuy clothesConstructions/OthersEducation of childrenHealth, buy drugsBuy food
Buy clothesConstructions/OthersEducation of childrenHealth, buy drugsInformations, radio/TVBuy clothesConstructions/OthersEducation of childrenHealth, buy drugs
Informations, radio/TVBuy foodConstructions/OthersEducation of childrenHealth, buy drugsInformations, radio/TVBuy foodBuy clothes
(I) itemsEducation of children
Health, buy drugs
Informations, radio/TV
Buy food
Buy clothes
Constructions/Others
MeanDifference
(I-J) Std. Error Sig. Lower Bound Upper Bound95% Confidence Interval
The mean difference is significant at the .05 level.*.
country = Cameroona.

CIFOR-IUCN Landscapes Livelihoods Impacts of mining on livelihoods and environment in the TNS landscape
81
Appendix 2b: Tukey test for multiple comparisons of means of uses of mining revenues -CAR
Multiple Comparisonsa
Dependent Variable: percentTukey HSD
7,46999 3,45705 ,263 -2,5205 17,4605
7,63300 4,62388 ,567 -5,7295 20,9954-25,57228* 3,40286 ,000 -35,4061 -15,7384-1,12067 3,40286 ,999 -10,9545 8,7132
1,25231 4,07836 1,000 -10,5336 13,0383-7,46999 3,45705 ,263 -17,4605 2,5205
,16301 4,57749 1,000 -13,0654 13,3914-33,04227* 3,33956 ,000 -42,6932 -23,3914
-8,59066 3,33956 ,111 -18,2416 1,0603-6,21767 4,02569 ,636 -17,8514 5,4161-7,63300 4,62388 ,567 -20,9954 5,7295
-,16301 4,57749 1,000 -13,3914 13,0654-33,20528* 4,53671 ,000 -46,3158 -20,0948-8,75367 4,53671 ,389 -21,8642 4,3569
-6,38068 5,06313 ,806 -21,0125 8,251125,57228* 3,40286 ,000 15,7384 35,406133,04227* 3,33956 ,000 23,3914 42,6932
33,20528* 4,53671 ,000 20,0948 46,315824,45161* 3,28343 ,000 14,9629 33,940326,82460* 3,97925 ,000 15,3251 38,3241
1,12067 3,40286 ,999 -8,7132 10,95458,59066 3,33956 ,111 -1,0603 18,24168,75367 4,53671 ,389 -4,3569 21,8642
-24,45161* 3,28343 ,000 -33,9403 -14,9629
2,37298 3,97925 ,991 -9,1266 13,8725-1,25231 4,07836 1,000 -13,0383 10,53366,21767 4,02569 ,636 -5,4161 17,8514
6,38068 5,06313 ,806 -8,2511 21,0125-26,82460* 3,97925 ,000 -38,3241 -15,3251-2,37298 3,97925 ,991 -13,8725 9,1266
(J) itemsHealth, buy drugsInformations, radio/TVBuy food
Buy clothesConstructions/OthersEducation of childrenInformations, radio/TV
Buy foodBuy clothesConstructions/Others
Education of childrenHealth, buy drugsBuy food
Buy clothesConstructions/OthersEducation of children
Health, buy drugsInformations, radio/TVBuy clothesConstructions/Others
Education of childrenHealth, buy drugsInformations, radio/TV
Buy foodConstructions/OthersEducation of children
Health, buy drugsInformations, radio/TVBuy food
Buy clothes
(I) itemsEducation of children
Health, buy drugs
Informations, radio/TV
Buy food
Buy clothes
Constructions/Others
MeanDifference
(I-J) Std. Error Sig. Lower Bound Upper Bound95% Confidence Interval
The mean difference is significant at the .05 level.*.
country = Central African Republica.

CIFOR-IUCN Landscapes Livelihoods Impacts of mining on livelihoods and environment in the TNS landscape
82
Appendix 3: Resource persons contacted and addresses
Contacts Organisation Address Senior Divisional Officer
Sangha Mbaere Division
Divisional officer SDO Ouesso, Congo Divisional officer SDO Nola, Central African Republic First Assistant ASDO I Yokadouma, Cameroon Ntep Gweth Paul CAPAM
Yaounde Coordinator Yaounde Tel: 99641821
Fobisin Godlove MINEP Yaounde
Chief of Service Training and Partnership. Email: [email protected]
Emanga Emanga MINEP Delegate of MINEP, Boumba et Ngoko Division Tel: 96166355 / 79426499. Email: [email protected]
Lahandi Yetnang Prosper
MINIMIDT Yokadouma
Delegate of MINES, Boumba et Ngoko Division Tel: 99824145
Amougou Victor CEFAID Coordinator, Tel: 99290212 Email: [email protected]
Louis Defo WWF WWF-Jengi, Yokadouma B.P: 6776 Yaoundé ; Tel: 99 93 09 69 Email: [email protected]
Zackary Nzooh WWF WWF-Jengi, Yokadouma Albert Mounga Abana
MINFOF Conservator, Lobeke National Park. Tel: 96197727
Bilandi Marot Jean-Baptiste
MINFOF Ecogarde Lobeke Naional park, Forestry and Wildlife Office, Kika
Alfred Bagueka Assobo
MINFI Yaounde
EITI National Coordinator Tel: 9913615 Email: [email protected]
Kamis Ami GTZ-Bayanga Responsable programme socio-economique, PDS/GTZEmail: [email protected]
Philippe Roth GTZ-Bayanga [email protected] Bruno Brachka WCS-Bayanga Email: [email protected] Mathias Heinze GTZ-Bayanga Coordinator, Email: [email protected] Ngwerium Japhael. SEMBOUNG Bertrant MINEP /
DDBN MINEP, Boumba and Ngoko Division. Tel: 96144964 Email:[email protected]
Lahandi Yetnang Prosper
MINEP Divisional Delegate of Environment
Ali Lavabandi Singa Barthelemy
Chief Ngola Village
Chief Nguingueli Chief Zega Mondigi Pierre Chief Mboy Kondji Appolinaire CES Mboy

CIFOR-IUCN Landscapes Livelihoods Impacts of mining on livelihoods and environment in the TNS landscape
83
Contacts Organisation Address representative
Modigui Keneye Guy Simplice
President of Federation
FEDAMINE-Mobilong, Mboy
Emanga Emanga Federation of miners FEDAMINE
FEDAMINE, President
Moupen Joseph CAPAM Delegate
Mboy
Djenda Eloi K. Rural counsellor
Mouloundou Rural Council
Ngwerium Japhael coordinator GIC/MINEUR de Boumba, Kika Albert Mounga Abana; MINIMDT Divisional Delegate of Mines Ayessi Joseph MINIMIDT Department of Mines

CIFOR-IUCN Landscapes Livelihoods Impacts of mining on livelihoods and environment in the TNS landscape
84
Appendix 4: Questionnaire to miners
Study on Impacts of Artisan gold and diamond mining on livelihoods and the environment in the Sangha
Tri-National Park (TNS) Research Questionnaire Form
This questionnaire is to elicit information on the problems, func tioning and prospects for better artisan mining arrangements. Feel free to express your feelings and ideas because your opinion may go a long way to providing solutions that meet future needs for an equitable and environmentally friendly small- scale mining. In this light, all artisan miners would have equitable access to the resource in an organized marketing system. Section I: Biodata of Respondents 1) Country 1=Cameroon, 2=CAR, 3=Congo
2) Village 1=Zega, 2=Mboy, 3=Nguenguili, 4=Ngola
3) Chantier
1=Cola, 2=Bandengue, 3=Ngola, 4=Mobilong, 5=Houho, 6=Johvah Jire, 7=Mokopaka, 8=Bougoli, 9=Boto, 10=Motokobilo, 11=Mabauli, 12=Nompenda, 13=Papam, 14=Montsombe, 15=Lingui, 16=Momekok, 17=Kolongo
4) Mineral mined 1=Gold, 2=Diamond
5) Mining type 1=Diggers, 2=Divers
6)Miner’s name
7) Sex 1=Male, 2=Female
8)Number of children
9) Age
10) Ethnic group
1=Banda, 2=Bamoun, 3=Bassa, 4=Manzah, 5=Kako, 6=Bimo, 7=Mezimi, 8=Ngondi, 9=Bangando, 10=Mpiemo, 11=Ngombe, 12=Yakoma, 13=Foulbe/Haousa, 14=Bakare, 15=Beti, 16=Bambara, 17=Bororo, 18=Voko, 19=Baya, 20=Baka, 21=Mvongmvong, 22=Badjoue, 23=Ashanti, 24=Yamba, 25=Baaka, 26=Bilo, 27=Sangha-Sangha, 28=Bossangoa, 29=Bogongo, 30, Baya
11) Education 0=No formal education/SIL/CP/CE1, 1=Primary(CE2,CM1,CM2), 2=Secondary, 3=High school, 4=University
12) Marital status 1=Married, 2=Single, 3=Divorce, 4=Widow
13) Number of wives
14) Total number of dependants
14) Number of years as miner
15) Nationality 1=Cameroonian, 2=CAR, 3=Congolese, 4=Ghanaian, 5=Malian
16) Occupation as miner 1=Full-time, 2=Part -time
Section II: Mining activity proper

CIFOR-IUCN Landscapes Livelihoods Impacts of mining on livelihoods and environment in the TNS landscape
85
1) Is mining your principal activity? 1=Yes, 2=No
2) Who initiated you into mining? 1=Parents, 2=Local friends, 3=Outsiders
3) How long have you been mining?
4) Do you do mining for yourself? 1=Yes, 2=No (if yes, go to 6)
5) If no, who are you working for? 1=Parents, 2=Friends, 3=Sponsors
6) Where do you normally carry out your mining? 1=Inside the reserve, 2=Outside, 3=Both
7) How many workers do you have?
7.1) Family labour
7.2) Hired labour
7.3) Children (less than 15 years)
7.4) Adults
7.5) Men
7.6) Women
8) How many trips do you go mining per month?
9) What quantity of gold/diamond do you get per trip?
10) Where do your customers come from? 1= Within the village, 2= From the town/city, 3= From other villages
10.1) If in town/city, specify 1=Kika, 2=Yokadouma, 3=Nola, 4=Salo, 5=Yaounde
11) On average how much do you spend per month to get your minerals to the market?
12) On average how much do you earn per month from selling your mineral?
13) Do you usually encounter anybody disturbing you from mining?
1=Yes, 2=No
13.1) If yes, who are they? 1=Government agent, 2=Conservation agent, 3=Individual buyers/collectors
14) What is usually your reaction? 1=Run away, 2=Bribe them, 3=Speak to
them angrily, 4=Do nothing, 5=Show legal papers
15) Availability of minerals 1=All seasons, 2=Dry season, 3=Rainy season
16) How do you see mining in the next 10-20 years? 1=Better, 2=Same, 3=Less
17) Distance to mining area (km)
18) Main means of transport 1=By foot, 2=By car/canoe, 3=By motorbike
19) Source of capital: 1=Self finances, 2= Village sponsor, 3=

CIFOR-IUCN Landscapes Livelihoods Impacts of mining on livelihoods and environment in the TNS landscape
86
External sponsor,4= Borrowed money
20) Specify amount and live span of items above with cost you money
Items Amount Live span Pele Polyane Bate/tamis Baramine Canoe Matchet Pots Gicque Motor pump Food Medicines Bucket/plates/bidon
Section III: Functioning of Markets
1) To whom do you sell? 1=Individual collector, 2=Organisation,
3=Sponsor
2) and where? 1=In the village, 2=In town/city, 3=In another village
3) Current price per unit
4) Price per unit 5 years ago
5) What was your capital at beginning of the business?
6) And what is it now?
7) How do you transport your mineral to here? 1=By foot, 2=By car/canoe, 3=By
motorbike
8) What is your transport cost?
9) If you hire some labor, how much do you pay per day?
10) What problems do you face in transit? 1=Government agent, 2=Conservation
agent, 3=Thieves/robbers, 4=No problem 11) Do you pay any tax? 1=Yes, 2=No
9.1) If yes what type of tax? 1=Laborers’ tax, 2=Head of chantiers’ tax, 3=Collector tax
9.2) And how much?

CIFOR-IUCN Landscapes Livelihoods Impacts of mining on livelihoods and environment in the TNS landscape
87
12) How many trips do you make per month?
13) Market organization/ sell of product? o you pay any tax?
1=Individually, 2=Group, 3=Cooperative
14) About how much profit do you currently make per month?
15) How much did you used to make in the past?
16) How do you compare the present and past situations?
1=More, 2=Less, 3=Same
17) What can be the reasons responsible for an increase/decrease in the profits you make?
1=More experience, 2=Good price, 3=Help from family/hired labor, 4=New site discovered, 5=Fall in prices, 6=Gov’t suspension/no sale office, 7=Impoverishment of site, 8=Mishaps, 9=Lack of materials, 10=Fetish/sacrifice, 11=New materials bought, 12=Overexploitation
Section IV: Conservation of environment 1) Have you ever thought that one-day these minerals could get finished?
1=Yes, 2=No
2) Are you getting more gold/diamond now than say five-ten years ago?
1=More, 2=Less, 3=The same as before
3) What do you think is the reason for the increase or decrease?
1=Increasing give more money, 2=Increasing give less money, 3=Confrontation with agencies, 4=Support from gov’t agencies, 5=Lack of supports, 6= Fetish/sacrifice, 7=Impoverishment of site, 8= New materials bought/new site, 9=Too much water and rain, 10= Help from family/hired labor, 11=Experience, 12=No buyers
4) How do you see mining business in the next 10-20 years?
1=Better, 2=Same, 3=Less
5) Do you think mining has some negative environmental impacts?
1=Yes, 2=No
6) If ‘Yes’ above, please, check possible impacts
1= Water contamination, 2= Air contamination, 3= biodiversity loss, 4= Soil contamination , 5= Open

CIFOR-IUCN Landscapes Livelihoods Impacts of mining on livelihoods and environment in the TNS landscape
88
mines
7) How do you protect yourself from harmful elements such as wild animals, fallen branches?
1=No protection, 2=Build solid huts, 3=Use mosquito nets
8) How do you treat yourself when sick?
1= Drug store, 2= Forest herbs, 3=Both
9) Do you use cyanide or mercury for your extraction activities?
1= Yes, 2= No
10) If yes, explain how you protect yourself
Section V: Processing of minerals
1) In what form do you sell your gold/diamond?
1=Cleaned/polished, 2= Unprocessed
2) How do you process your mineral? Briefly describe
3) List the equipment used
4) Do you think the equipment are good enough for your activity?
1= Yes, 2= No
5) If no, list other equipment you know could be more efficient
6) Have you always used the same extraction or processing methods or have they changed?
1=Changed, 2=Same
7) Have you always used the same extraction or processing methods or have they changed?
1=Changed, 2=Same
8) If they have changed, what are some of the reasons for this change?
1=Gov’t/sponsor support, 2=Conservation support, 3= Increase in capital, 5= Outside sponsor

CIFOR-IUCN Landscapes Livelihoods Impacts of mining on livelihoods and environment in the TNS landscape
89
Section VI: Alternatives to mining
1) Apart from the sale of minerals is there any other thing you do?
1=Yes, 2= No
2. If yes, what other activities do you do apart from mining and about how much do you earn from such activities per week, per month or per year? Activity Tick the case Per week Per month Per year NTFP gathering Fishing Farming Hunting Livestock rearing Paid labour Trading Others
3) According to you what is the best alternative activity to mining:
1= NTFP gathering, 2= Fishing, 3= Farming, 4= Hunting, 5= Livestock rearing, 6= Paid labour, 7= Trading, 8= Others
4. Has money from gold/diamond sales helped you in achieving any of the following? Item Mark the applied item Proportion used* Remarks Education of children Health, buy drugs Information, radio/TV Buy food Buy clothes House construction Use ten stones as total amount of money from gold/diamond per month and divide it among the items listed. SECTION VII: Problems/possibilities associated with mining (production, processing, trade, legal)
1) In your own opinion, what are the major problems faced in this mining activity?
1=Low production, 2=Harsh government law, 3=Lack of detecting/exploiting equipment, 4=Fall in price, 5=Fall in prices 6=Lack of organization, 7=closure of buying offices , 8=Lack start -up capital

CIFOR-IUCN Landscapes Livelihoods Impacts of mining on livelihoods and environment in the TNS landscape
90
2) How do you think these problems can be resolved?
1=Assistance to get working materials, 2=All miners should have legal papers, 3=Assistance to get legal papers/materials, 4=Open sale office in villages, 5=Training on modern mining techniques, 6=Fix prices, 7=Create cooperatives
3) What do you think the government can do to solve these problems?
1=Sensitize miners on code, 2=Reduce cost of mining papers, 3=Assist miners to get legal papers/materials, 4=Open transparent sale office in villages, 5=Training on modern min ing techniques, 6=Fix prices, 7=Create cooperatives
4) Are there national laws that govern mining practices?
1=Yes, 2= No, 3=Unaware
5) If there are laws, are they properly enforced?
1=Yes, 2= No, 3= I don’t know
6) What kinds of government support or programs are available for you as a miner in the formal sector?
1= Education, 2= Technical training, 3= Exploration equipment, 4= Marketing of products, 5= No support
7) Is it easy to have all government papers for mining operations?
1=Yes, 2= No
8) If Yes, do you have legal mining documents? 1=Yes, 2= No
9) If you have legal papers what are the benefits you have received being part of the formal sector?
1=Freedom to exploit and sell, 2=Support from government, 3=Support from conservation agencies, 4=No benefits
10) Who have been the leaders of the efforts to improve the gold mining sector?
1=Government, 2=Development agencies, 3=Conservation agencies, 4=Individual sponsors, 5=No improvements
11) Other information you would like to share with me today?

CIFOR-IUCN Landscapes Livelihoods Impacts of mining on livelihoods and environment in the TNS landscape
91
Appendix 5: Questionnaire to organizations and partners
Study on Impacts of Artisan gold and diamond mining on livelihoods and the environment in the Sangha Tri-National Park (TNS)
Research Questionnaire Form This questionnaire is to elicit information on the problems, functioning and prospects for better artisan mining arrangements in the Sangha region. Feel free to express your feelings and ideas because your opinion may go a long way to providing solutions that meet the needs for an environmentally subtle and socio-economically equitable small-scale mining in the future. In this light, all artisan miners would be more environmentally responsible and have equitable access to the resource in an organized marketing system. Section I: 1). Organization...………2). Country segment--------------- 3). Mineral mined…………… SECTION II Problems and Possibilities Associated with production & Trade on minerals 3). In your own opinion, what are the major problems/obstacles faced in artisan mining (social, economic, environmental, legal/regulatory, institutional, technical)? …………………………………………………………………………………………………………………………………………………………………………………………………………………………………………………………………………………………….. 4). How do you think these problems can be resolved? ……………………………………………………………………………………………………………………………………………………………………………………………………………………………………………………………………………………………… 5). What do you think the government can do to help solve these problems? ................................................................................................................................................................................................................................................................................................ 6). Your experience in the gold/diamond mining sector: high, low, medium 7). Do you know any projects or programs that have helped the ASM sector to become more efficient socially and environmentally? Yes………or No……………….. 8). If ‘Yes’ to question 7 above, please, list the projects and their contributions …………………………………………………………………………………………………………………………………………………………………………………………….. 9). Are the projects/programs effective? Please, explain how: ……………………………………………………………………………………………………………………………………………………………………………………………… 10. What local measures are used to encourage/enforce efficient mining? ------------------------------------------------------------------------------------------------------------------------------------------------------------------------------------------------------------------------------------------- 11. What equipment do local miners use in mining?---------------------------------------------------------------------------------------------------------------------------------------------------------

CIFOR-IUCN Landscapes Livelihoods Impacts of mining on livelihoods and environment in the TNS landscape
92
12. Is there clear government policy for small mining sector or are small scale miners incorporated in the formal sector? a)Yes------- b) No---------- 13. Briefly explain how miners are organized ---------------------------------------------------------------------------------------------------------------------------------------------------------------------------------------------------------------------------------------------------------------------------- 14. Do you think miners are conscious of the negative impacts from their activities? How has this process evolved? ---------------------------------------------------------------------------------------------------------------------------------------------------------------------------------------- 15. Are legislation and regulations effective in small-scale mining sector? What is your opinion about the application of the laws? -------------------------------------------------------------------------------------------------------------------------------------------------------------------------------------------------------------------------------------------------------------------------------- 16. Are regulations being properly enforced? Yes…………No………………………….. 17. Which actors drive possible improvements in the mining sector?-------------------------------------------------------------------------------------------------------------------------------------- 18. If ‘Yes’ to question 17, what type of support, education, or incentives have miners received after incorporation? 19. What entails a successful formalization of the artisanal mining sector?------------------------------------------------------------------------------------------------------------------------------- 20. What are the necessary conditions for achieving success? ............................................................................................................................................................................................................................................................................................... 21. Long-term vision for a sustainable artisanal and small-scale mining sector? ……………………………………………………………………………………………………………………………………………………………………………………………… 22. Suggestions to others working to formalize and improve the artisanal and small-scale mining sector in other communities or other countries in the region and beyond? …………………………………………………………………………………………………………………………………………………………………………………………….. 23. Any other viable alternative livelihoods for the miners? Are they being sought out? -------------------------------------------------------------------------------------------------------------------------------------------------------------------------------------------------------- 24. Some statistics to share pertaining to the artisanal and small-scale mining? ------------------------------------------------------------------------------------------------------------------------ 25. Is there any other information you would like to share with me today? ------------------------------------------------------------------------------------------------------------------------------------------------------------------------------------------------------------------------------------------ 26. Please, check the possible environmental impacts of small scale mining a) biodiversity loss---b) water pollution----c) disruption of logging----d) soil depression--- e) air pollution----- f). others (please specify ----------------------------------------------------- )
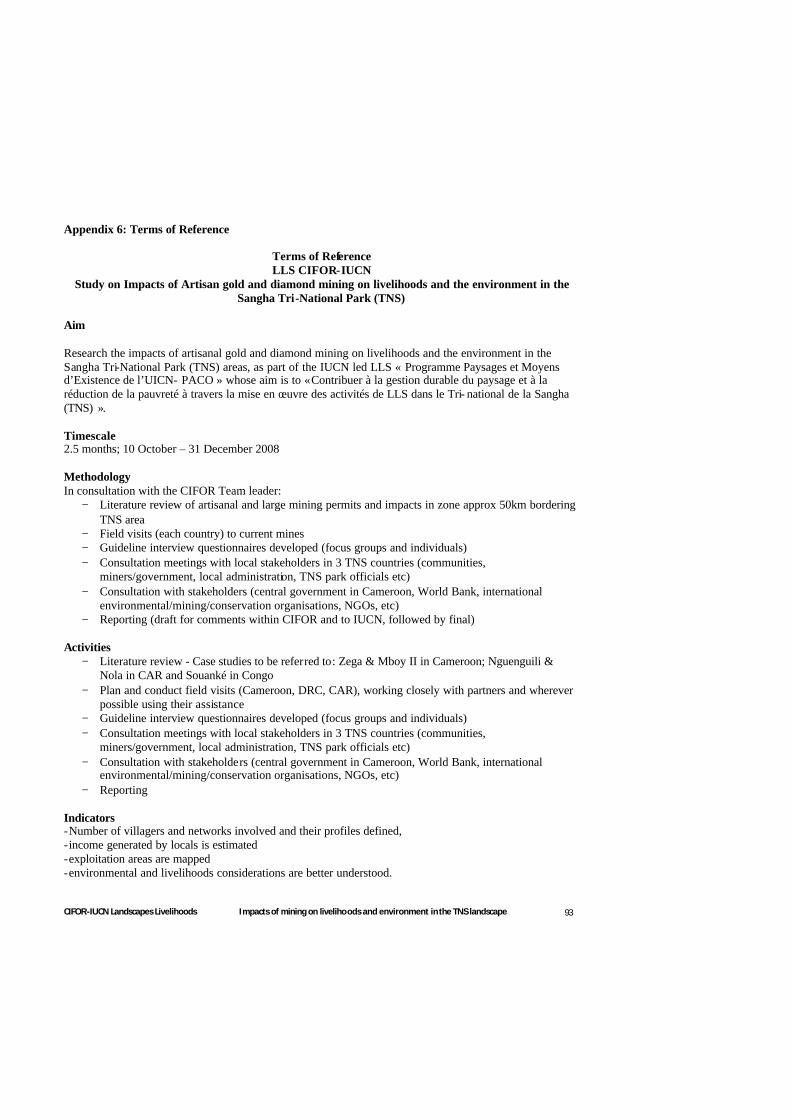
CIFOR-IUCN Landscapes Livelihoods Impacts of mining on livelihoods and environment in the TNS landscape
93
Appendix 6: Terms of Reference
Terms of Reference LLS CIFOR-IUCN
Study on Impacts of Artisan gold and diamond mining on livelihoods and the environment in the Sangha Tri-National Park (TNS)
Aim Research the impacts of artisanal gold and diamond mining on livelihoods and the environment in the Sangha Tri-National Park (TNS) areas, as part of the IUCN led LLS « Programme Paysages et Moyens d’Existence de l’UICN- PACO » whose aim is to « Contribuer à la gestion durable du paysage et à la réduction de la pauvreté à travers la mise en œuvre des activités de LLS dans le Tri- national de la Sangha (TNS) ». Timescale 2.5 months; 10 October – 31 December 2008 Methodology In consultation with the CIFOR Team leader:
− Literature review of artisanal and large mining permits and impacts in zone approx 50km bordering TNS area
− Field visits (each country) to current mines − Guideline interview questionnaires developed (focus groups and individuals) − Consultation meetings with local stakeholders in 3 TNS countries (communities,
miners/government, local administration, TNS park officials etc) − Consultation with stakeholders (central government in Cameroon, World Bank, international
environmental/mining/conservation organisations, NGOs, etc) − Reporting (draft for comments within CIFOR and to IUCN, followed by final)
Activities
− Literature review - Case studies to be referred to: Zega & Mboy II in Cameroon; Nguenguili & Nola in CAR and Souanké in Congo
− Plan and conduct field visits (Cameroon, DRC, CAR), working closely with partners and wherever possible using their assistance
− Guideline interview questionnaires developed (focus groups and individuals) − Consultation meetings with local stakeholders in 3 TNS countries (communities,
miners/government, local administration, TNS park officials etc) − Consultation with stakeholders (central government in Cameroon, World Bank, international
environmental/mining/conservation organisations, NGOs, etc) − Reporting
Indicators -Number of villagers and networks involved and their profiles defined, -income generated by locals is estimated -exploitation areas are mapped -environmental and livelihoods considerations are better understood.

CIFOR-IUCN Landscapes Livelihoods Impacts of mining on livelihoods and environment in the TNS landscape
94
Partners World Bank TNS partners – particularly WWF, GTZ and WCS, CED for local transport arrangements Local NGOs Extractive Industries Transparency International (EITI) Local miners and authorities Output Verifications - List of partners and stakeholders identified and contacts made (provided in Annexes) - Typology of actors specified - Guideline interview questionnaires developed (focus groups and individuals) in consultation with CIFOR team leader - Baseline quantitative information is generated on;
• Location (mapping), number, type of current artisanal mines in the TNS area • Socio-economic baseline information: Name and number of communities involved, numbers of
people directly and indirectly employed (detailing gender, ethnicity, age and occupations) and average monthly and annual incomes (detailing % of average incomes, frequency, reliability) PSM=Professional stranger methodology to be adopted with locals
• Mapping of location, number, type of proposed or potential artisanal and large scale mines in the TNS area
• Assessment of current direct and cumulative environmental and social (livelihood) impacts from small scale and large scale mining on TNS Park (from community and stakeholder reports, observation, assessment)
• Prediction of potential future direct and cumulative environmental and social (livelihood) impacts
• Recommendation for mitigation measures, actions/points of attention - Draft Table of Contents (consultation with the CIFOR team leader) - Draft report - Incorporation of comments from stakeholders and LLS partners, particularly IUCN - Final Report