Atmospheric CO 2 modeling at the regional scale: Application to the CarboEurope Regional Experiment
8
Atmospheric CO 2 modeling at the regional scale: Application to the CarboEurope Regional Experiment C. Sarrat, 1 J. Noilhan, 1 P. Lacarre `re, 1 S. Donier, 1 C. Lac, 1 J. C. Calvet, 1 A. J. Dolman, 2 C. Gerbig, 3 B. Neininger, 4 P. Ciais, 5 J. D. Paris, 5 F. Boumard, 5 M. Ramonet, 5 and A. Butet 6 Received 5 October 2006; revised 27 November 2006; accepted 12 February 2007; published 16 June 2007. [1] The CarboEurope Regional Experiment Strategy (CERES) experiment took place in May and June 2005 in France and offers a comprehensive database on atmospheric CO 2 and boundary layer processes at the regional scale. One ‘‘golden’’ day of CERES is interpreted with the mesoscale atmospheric model Meso-NH coupled on-line with the Interactions between Soil, Biosphere and Atmosphere, CO 2 -reactive (ISBA-A-gs) surface scheme, allowing a full interaction of CO 2 between the surface and the atmosphere. The rapid diurnal cycle of carbon coupled with water and energy fluxes is parameterized including, e.g., plant assimilation, respiration, anthropogenic emissions, and sea fluxes. During the analyzed day, frequent vertical profiles and aircraft transects revealed high spatial and temporal variabilities of CO 2 concentrations within the boundary layer at the regional scale: a 10-ppm gradient of CO 2 -mixing ratio is observed during the day by the aircraft measurements. The Meso-NH model proved able to simulate very well the CO 2 concentration variability as well as the spatial and temporal evolution of the surface fluxes and the boundary layer in the domain. The model is used to explain the CO 2 variability as a result of two complementary processes: (1) the regional heterogeneity of CO 2 surface fluxes related to the land cover (e.g., winter crops versus a pine forest) and (2) the variability of mesoscale circulation across the boundary layer: development of the sea breeze in the western part of the domain and dominating wind flow in the eastern part of the domain. Citation: Sarrat, C., et al. (2007), Atmospheric CO 2 modeling at the regional scale: Application to the CarboEurope Regional Experiment, J. Geophys. Res., 112, D12105, doi:10.1029/2006JD008107. 1. Introduction [2] The atmospheric carbon dioxide (CO 2 ) measurements provide key information to improve our understanding on the terrestrial carbon budget. An important issue of the carbon cycle is to improve the retrieval of sources and sinks by inverse modeling [Rayner et al., 1999; Bousquet et al., 1996; Gurney et al., 2002]. [3] At the regional scale, vegetation carbon uptake and ecosystem respiration, in combination with diurnal varia- tions in vertical mixing, result in a pronounced diurnal cycle of CO 2 in the atmospheric boundary layer (ABL). Even at the continental scale, Denning et al. [1996] or Chevillard et al. [2002] showed the importance of the diurnal cycle of biospheric exchanges and of regional transport to take into account the short-term variations in the CO 2 concentrations. [4] Preliminary studies with high resolution mesoscale models are reported by, e.g., Nicholls et al. [2004] and Denning et al. [2003], who showed that the mesoscale Regional Atmospheric Modeling System (RAMS) model, coupled with the biospheric SiB-2 model, was able to retrieve the CO 2 flux and concentration measurements made on a tall tower at various heights. The study of Geels et al. [2004] describes a mesoscale CO 2 simulation to investigate the CO 2 synoptic variability with a relatively large spatio- temporal resolution (daily, 1° 1°). [5] In order to improve our knowledge and the models at the regional scale, a regional experiment has been executed in 2005 in the southwest of France: CarboEurope Regional Experiment Strategy (CERES), within the frame of the Euro- pean project CarboEurope-IP. Campaigns on regional CO 2 have been held before {Regional Assessment and Monitoring of the Carbon Balance within Europe (RECAB), COCA, Schmitgen et al. [2004], COBRA, Gerbig et al. [2003]}, but JOURNAL OF GEOPHYSICAL RESEARCH, VOL. 112, D12105, doi:10.1029/2006JD008107, 2007 Click Here for Full Articl e 1 Centre National de Recherches Me ´te ´orologiques/Groupe d’e ´tudes de l’Atmosphe `re Mete ´orlogique, Me ´te ´o France, Toulouse, France. 2 Vrije University, Amsterdam, Netherlands. 3 Max Planck Institute for Biochemistry, Jena, Germany. 4 MetAir, Menzingen, Switzerland. 5 Le Laboratoire des Sciences du Climat et l’Environnement, Gif sur Yvette, France. 6 Service des Avions Franc ¸ais Instrumente ´s pour la Recherche en Environnement Me ´te ´o France, Toulouse, France. Copyright 2007 by the American Geophysical Union. 0148-0227/07/2006JD008107$09.00 D12105 1 of 8
-
Upload
independent -
Category
Documents
-
view
3 -
download
0
Transcript of Atmospheric CO 2 modeling at the regional scale: Application to the CarboEurope Regional Experiment
Atmospheric CO2 modeling at the regional scale:
Application to the CarboEurope Regional
Experiment
C. Sarrat,1 J. Noilhan,1 P. Lacarrere,1 S. Donier,1 C. Lac,1 J. C. Calvet,1 A. J. Dolman,2
C. Gerbig,3 B. Neininger,4 P. Ciais,5 J. D. Paris,5 F. Boumard,5 M. Ramonet,5
and A. Butet6
Received 5 October 2006; revised 27 November 2006; accepted 12 February 2007; published 16 June 2007.
[1] The CarboEurope Regional Experiment Strategy (CERES) experiment took place inMay and June 2005 in France and offers a comprehensive database on atmospheric CO2
and boundary layer processes at the regional scale. One ‘‘golden’’ day of CERES isinterpreted with the mesoscale atmospheric model Meso-NH coupled on-line with theInteractions between Soil, Biosphere and Atmosphere, CO2-reactive (ISBA-A-gs) surfacescheme, allowing a full interaction of CO2 between the surface and the atmosphere. Therapid diurnal cycle of carbon coupled with water and energy fluxes is parameterizedincluding, e.g., plant assimilation, respiration, anthropogenic emissions, and sea fluxes.During the analyzed day, frequent vertical profiles and aircraft transects revealed highspatial and temporal variabilities of CO2 concentrations within the boundary layer atthe regional scale: a 10-ppm gradient of CO2-mixing ratio is observed during the day bythe aircraft measurements. The Meso-NH model proved able to simulate very well theCO2 concentration variability as well as the spatial and temporal evolution of the surfacefluxes and the boundary layer in the domain. The model is used to explain the CO2
variability as a result of two complementary processes: (1) the regional heterogeneity ofCO2 surface fluxes related to the land cover (e.g., winter crops versus a pine forest) and(2) the variability of mesoscale circulation across the boundary layer: development ofthe sea breeze in the western part of the domain and dominating wind flow in theeastern part of the domain.
Citation: Sarrat, C., et al. (2007), Atmospheric CO2 modeling at the regional scale: Application to the CarboEurope Regional
Experiment, J. Geophys. Res., 112, D12105, doi:10.1029/2006JD008107.
1. Introduction
[2] The atmospheric carbon dioxide (CO2) measurementsprovide key information to improve our understanding onthe terrestrial carbon budget. An important issue of thecarbon cycle is to improve the retrieval of sources and sinksby inverse modeling [Rayner et al., 1999; Bousquet et al.,1996; Gurney et al., 2002].[3] At the regional scale, vegetation carbon uptake and
ecosystem respiration, in combination with diurnal varia-tions in vertical mixing, result in a pronounced diurnal cycleof CO2 in the atmospheric boundary layer (ABL). Even at
the continental scale, Denning et al. [1996] or Chevillardet al. [2002] showed the importance of the diurnal cycle ofbiospheric exchanges and of regional transport to take intoaccount the short-term variations in the CO2 concentrations.[4] Preliminary studies with high resolution mesoscale
models are reported by, e.g., Nicholls et al. [2004] andDenning et al. [2003], who showed that the mesoscaleRegional Atmospheric Modeling System (RAMS) model,coupled with the biospheric SiB-2 model, was able toretrieve the CO2 flux and concentration measurements madeon a tall tower at various heights. The study of Geels et al.[2004] describes a mesoscale CO2 simulation to investigatethe CO2 synoptic variability with a relatively large spatio-temporal resolution (daily, 1� � 1�).[5] In order to improve our knowledge and themodels at the
regional scale, a regional experiment has been executed in2005 in the southwest of France: CarboEurope RegionalExperiment Strategy (CERES), within the frame of the Euro-pean project CarboEurope-IP. Campaigns on regional CO2
have been held before {Regional Assessment and Monitoringof the Carbon Balance within Europe (RECAB), COCA,Schmitgen et al. [2004], COBRA, Gerbig et al. [2003]}, but
JOURNAL OF GEOPHYSICAL RESEARCH, VOL. 112, D12105, doi:10.1029/2006JD008107, 2007ClickHere
for
FullArticle
1Centre National de Recherches Meteorologiques/Groupe d’etudes del’Atmosphere Meteorlogique, Meteo France, Toulouse, France.
2Vrije University, Amsterdam, Netherlands.3Max Planck Institute for Biochemistry, Jena, Germany.4MetAir, Menzingen, Switzerland.5Le Laboratoire des Sciences du Climat et l’Environnement, Gif sur
Yvette, France.6Service des Avions Francais Instrumentes pour la Recherche en
Environnement Meteo France, Toulouse, France.
Copyright 2007 by the American Geophysical Union.0148-0227/07/2006JD008107$09.00
D12105 1 of 8
CERES has a longer temporal coverage (6 weeks) and a muchdenser sampling of both atmospheric concentrations and ofecosystem fluxes [Dolman et al., 2006].[6] This paper summarizes a high-resolution modeling
study of an episode of the CERES campaign. This is aso-called ‘‘golden’’ day that presents unexpected regionaldistribution of CO2 concentrations with strong hetero-geneities in the ABL.[7] In order to separate the contribution of the different
physical processes (fluxes versus transport processes) involvedin controlling the spatiotemporal CO2 evolution, the distribu-tion of atmospheric CO2 this day is simulated with a highresolution mesoscale meteorological and transport model.[8] After a description of the experimental and modeling
configurations, the modeling results, in comparison with theobservations, are discussed and used to explain the roles ofmesoscale circulations and surface exchanges in the region-al pattern of CO2, in particular the contrasts between forestand crop covered landscapes.
2. The CarboEurope Regional ExperimentStrategy: CERES
[9] The CarboEurope Regional Experiment Strategy(CERES) campaign took place in the southwest of France
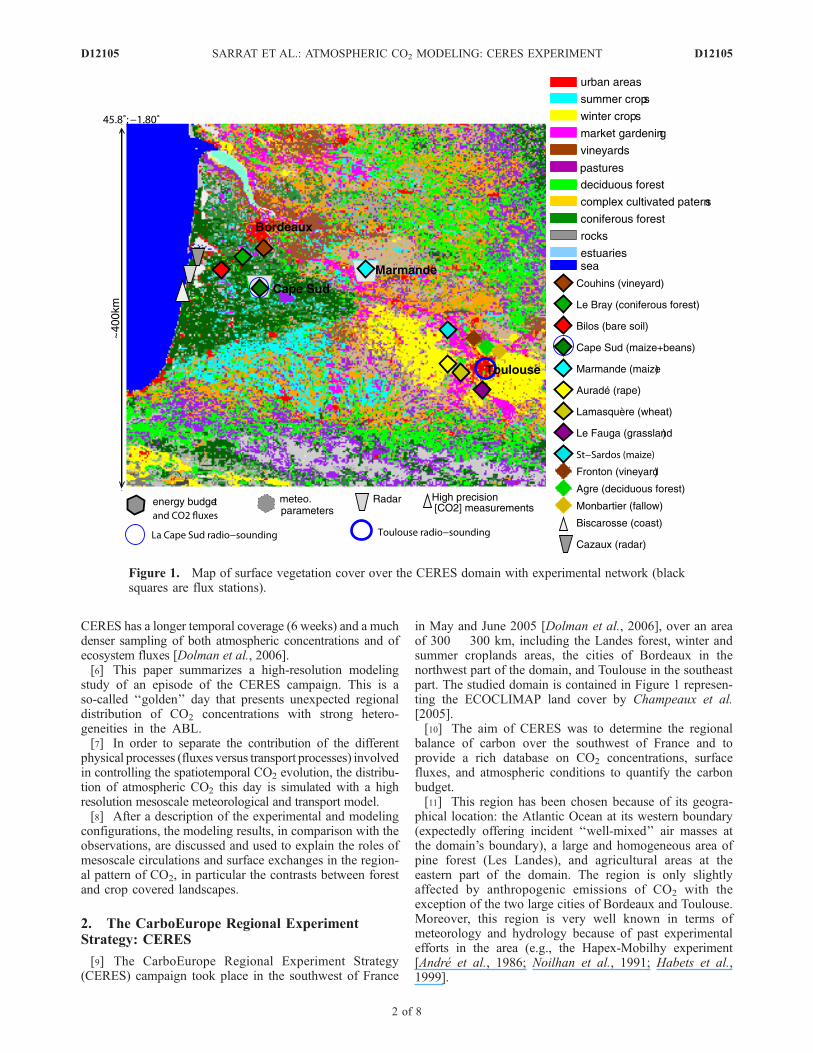
in May and June 2005 [Dolman et al., 2006], over an areaof 300 � 300 km, including the Landes forest, winter andsummer croplands areas, the cities of Bordeaux in thenorthwest part of the domain, and Toulouse in the southeastpart. The studied domain is contained in Figure 1 represen-ting the ECOCLIMAP land cover by Champeaux et al.[2005].[10] The aim of CERES was to determine the regional
balance of carbon over the southwest of France and toprovide a rich database on CO2 concentrations, surfacefluxes, and atmospheric conditions to quantify the carbonbudget.[11] This region has been chosen because of its geogra-
phical location: the Atlantic Ocean at its western boundary(expectedly offering incident ‘‘well-mixed’’ air masses atthe domain’s boundary), a large and homogeneous area ofpine forest (Les Landes), and agricultural areas at theeastern part of the domain. The region is only slightlyaffected by anthropogenic emissions of CO2 with theexception of the two large cities of Bordeaux and Toulouse.Moreover, this region is very well known in terms ofmeteorology and hydrology because of past experimentalefforts in the area (e.g., the Hapex-Mobilhy experiment[Andre et al., 1986; Noilhan et al., 1991; Habets et al.,1999].
Figure 1. Map of surface vegetation cover over the CERES domain with experimental network (blacksquares are flux stations).
D12105 SARRAT ET AL.: ATMOSPHERIC CO2 MODELING: CERES EXPERIMENT
2 of 8
D12105
[12] A total of 10 eddy covariance flux stations gavecontinuous measurements of energy, water, and CO2 fluxesover different types of vegetation (maize, winter crops suchas wheat and rapeseed, forest, grassland, vineyard, beans,and clear-cut). A central site was based in La Cape Sud inLes Landes forest, with energy and CO2 flux measurements,intensive radio-sounding launches during Intensive Obser-vation Period (IOP), and an ultrahigh frequency (UHF)radar for wind measurement (Figure 1). A secondary sitewas based in Marmande, in the center of the domaindominated by cropland, which included a tower equippedto measure CO2 concentrations at five levels up to 20 m. A50-m tower was based in the Atlantic Ocean shoreline inBiscarosse to measure continuously the CO2 concentrations.[13] Four research aircraft were operated during IOP.
These instrumented aircraft sampled the horizontal andtemporal heterogeneities of the CO2 distribution and fluxesat the regional scale in the morning and afternoon. Theaircraft also sampled the heterogeneity in and above theABL, executing vertical profiles above the different sites(La Cape Sud, Marmande, and shoreline). The in situ CO2
measurements used in this study come from the Piper-Aztecand the Eco-Dimona aircraft. In the Piper-Aztec, the CO2 is
measured by infrared absorption (CONDOR system), andaboard the Eco-Dimona, the measurements were madeusing a closed-path licor, an open path licor, and flaskanalysis. CO2 in situ data have been adjusted to match themeasurements of simultaneously collected flask samples bythe two aircraft and thus are not regarded as independentmeasurements.[14] This study focuses on 26 and 27 May (hereafter
referred as may-26 and may-27) because this period isintensively documented. Anticyclonic weather conditionsprevailed (clear sky, high temperatures, and light winds),which favored the development of breeze circulations.
3. The Modeling Configuration
[15] The simulation is performed with the Meso-NHatmospheric model [Lafore et al., 1998] coupled on-linewith the ISBA surface scheme [Noilhan and Planton, 1989]in its carbon interactive mode [Calvet et al., 1998]. Meso-NH is a nonhydrostatic mesoscale atmospheric modelallowing two-way nesting simulations. The chosen confi-guration for Meso-NH is composed of two nested domainsat 10-km resolution for the larger one (width, 900 � 900 km)
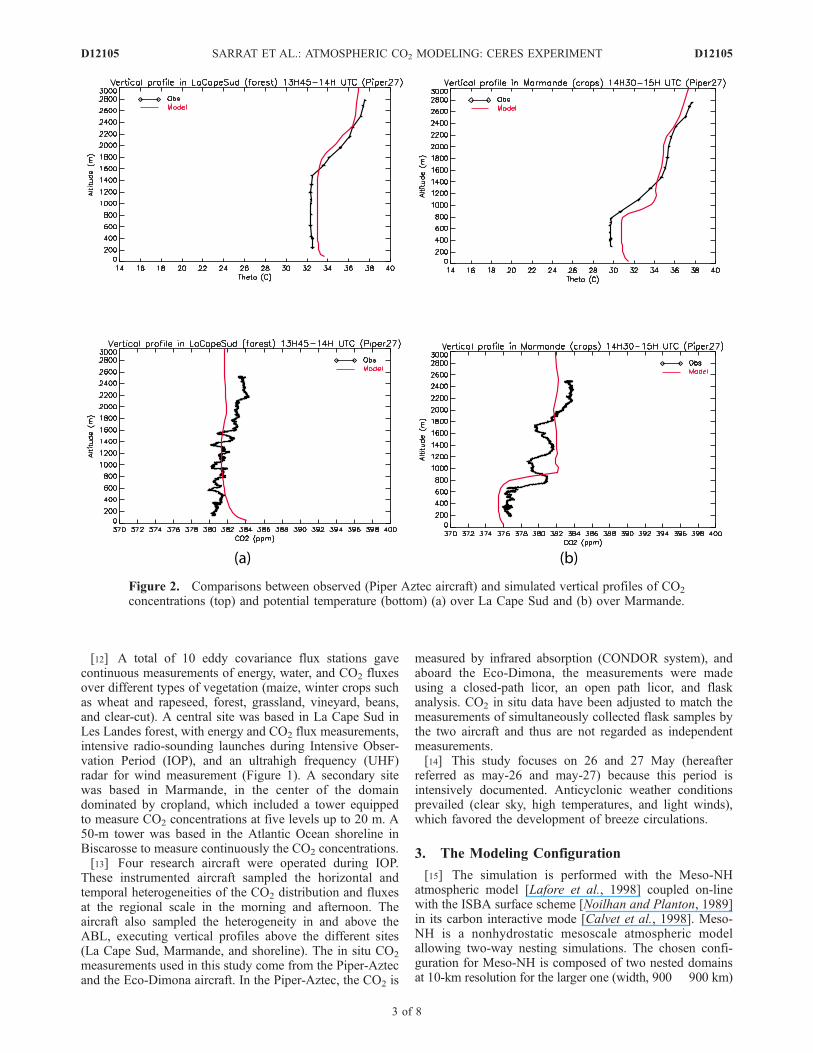
Figure 2. Comparisons between observed (Piper Aztec aircraft) and simulated vertical profiles of CO2
concentrations (top) and potential temperature (bottom) (a) over La Cape Sud and (b) over Marmande.
D12105 SARRAT ET AL.: ATMOSPHERIC CO2 MODELING: CERES EXPERIMENT
3 of 8
D12105
and 2-km resolution for the small one (width, 320 � 320 kmincluded in Figure 1). The vertical grid, which is composedof 57 levels, has a higher resolution close to the surface,with 20 levels between 0 and 1000 m, in order to obtain adetailed description of the ABL. The simulation of theCERES IOP2 starts on may-26 at 1800 Coordinated Uni-versal Time (UTC) and continues until may-28 at 0000 UTC.The model is initialized and forced at the lateral boundariesevery 6 hours by the European Centre for Medium-RangeWeather Forecasting (ECMWF) large-scale analyses foratmospheric and surface variables (the initialized soil mois-ture was found close to the observations). The CO2 con-centrations are initialized with a homogeneous verticalprofile all over the domain at 1800 UTC on may-26, issuedfrom aircraft observations. At the lateral boundaries, a zero-gradient condition is applied for CO2. The surface energyand CO2 fluxes are computed on-line by the surface model,ISBA-A-gs, including vegetation assimilation and respira-tion [Calvet et al., 1998]. A tile approach is used to take fulladvantage of the 1-km resolution vegetation database. Theland cover is from the ECOCLIMAP database [Champeauxet al., 2005; Masson et al., 2003]. It contains 62 types ofcover and discriminates winter crops from summer crops(see Figure 1). The oceanic CO2 fluxes are estimatedaccording to Takahashi et al. [1997] using simulated winds
for air-sea gas exchanges. The anthropogenic sources comefrom the 10-km resolution inventory of the Stuttgart Uni-versity [Dolman et al., 2006].
4. Results
[16] The studied day (may-27) is warm; air temperature inMarmande reaches 31.82�C. In the morning, the anti-cyclonic conditions drive a weak southeasterly wind atlow levels. During the afternoon, the Piper Aztec flew overthe Landes forest to Marmande and landed in Toulouse.During the flight, two vertical profiles were made: the firstone over the forest (La Cape Sud) at 1400 UTC and thesecond one over the maize cropland (Marmande) half anhour later. These observed vertical profiles are illustrated inFigure 2, together with the simulated ones (all the modelingresults are provided by the 2-km resolution model). Thevertical profile of potential temperature is well reproducedby the model over both sites: the boundary layer height is1600 m in La Cape Sud and only 800 m in Marmande, bothin data and model. The differences of ABL height are due tolarge differences in the surface sensible heat flux, inagreement with observations (not shown). The sensible heatflux is high over the forest, whereas in the eastern agricul-tural area, the sensible heat flux is lower. In the agriculturalarea, the latent heat flux is high where the winter crops arefully developed and low in the summer crop areas (mainlymaize) dominated by bare ground at this period of the year.For this land cover, the sensible heat is reduced because ofhigh heat storage in the ground.[17] The temperature vertical profile discrepancies
between the model and the observations do not exceed2�C in and above the ABL.[18] The comparisons between observed and simulated
CO2 mixing ratio vertical profiles over La Cape Sud can beconsidered in good agreement in the well-mixed ABL evenif there is a 4-ppm discrepancy near the surface. Theobservations indicate that there is a net CO2 sink near thesurface (inferred from the gradient in CO2, Figure 2a), butthe model results show an opposite gradient. In the model,because of an excessive ecosystem respiration, the net CO2
in the afternoon tends to be slightly overestimated. This is acomponent of the surface scheme which needs to beimproved, particularly the dependence between the eco-system respiration and the surface temperature. In Mar-mande, the comparisons are in good agreement in all theABL. These observed profiles at the two sites are wellmixed in the ABL with a sharp gradient at the cappinginversion, stronger in the Marmande case.[19] What is remarkable in these two punctual observa-
tions is that the mean CO2 mixing ratios in the boundarylayer are different at the two sites: 377 ppm in Marmandeand 381 ppm in La Cape Sud, that is to say a significantdifference between these two selected sites separated by70 km only.[20] These differences in CO2 concentrations are even
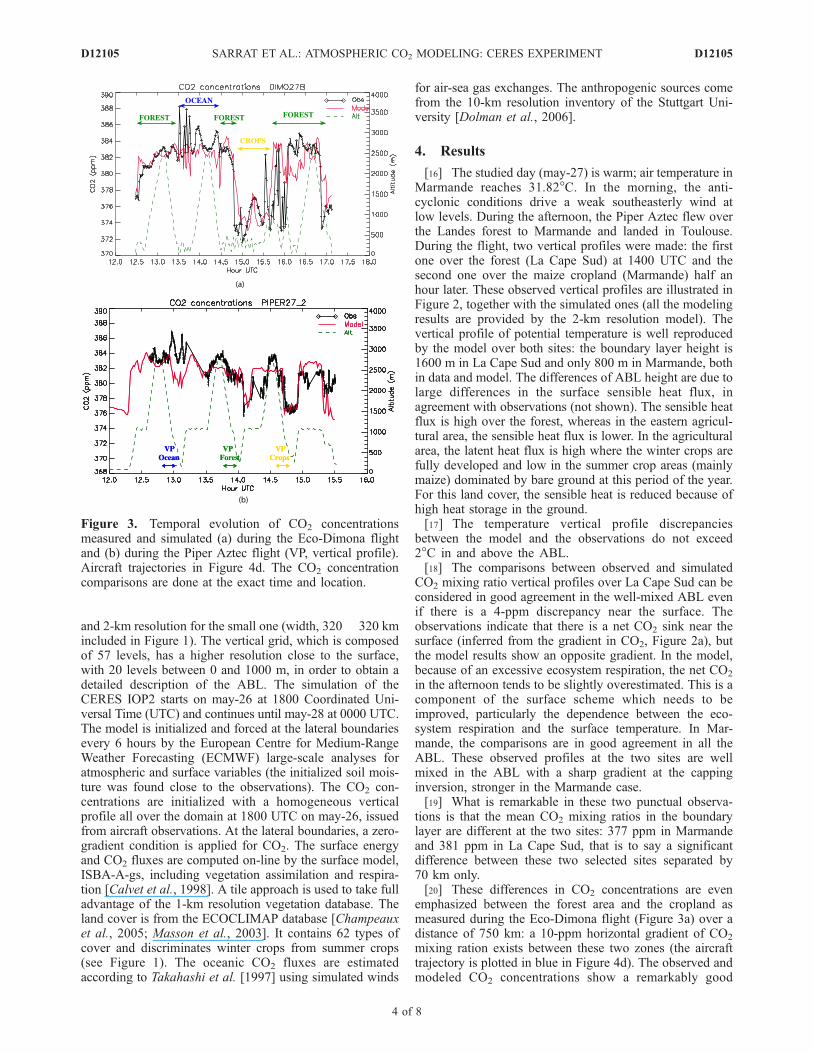
emphasized between the forest area and the cropland asmeasured during the Eco-Dimona flight (Figure 3a) over adistance of 750 km: a 10-ppm horizontal gradient of CO2
mixing ration exists between these two zones (the aircrafttrajectory is plotted in blue in Figure 4d). The observed andmodeled CO2 concentrations show a remarkably good
Figure 3. Temporal evolution of CO2 concentrationsmeasured and simulated (a) during the Eco-Dimona flightand (b) during the Piper Aztec flight (VP, vertical profile).Aircraft trajectories in Figure 4d. The CO2 concentrationcomparisons are done at the exact time and location.
D12105 SARRAT ET AL.: ATMOSPHERIC CO2 MODELING: CERES EXPERIMENT
4 of 8
D12105
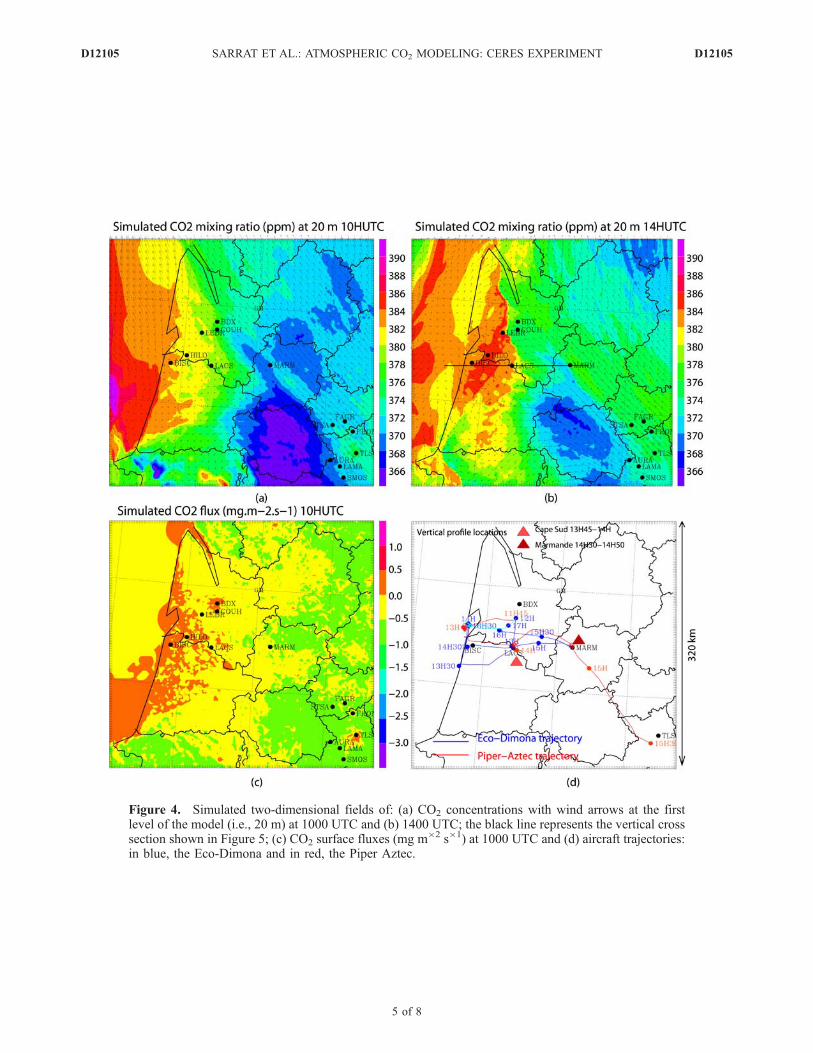
Figure 4. Simulated two-dimensional fields of: (a) CO2 concentrations with wind arrows at the firstlevel of the model (i.e., 20 m) at 1000 UTC and (b) 1400 UTC; the black line represents the vertical crosssection shown in Figure 5; (c) CO2 surface fluxes (mg m�2 s�1) at 1000 UTC and (d) aircraft trajectories:in blue, the Eco-Dimona and in red, the Piper Aztec.
D12105 SARRAT ET AL.: ATMOSPHERIC CO2 MODELING: CERES EXPERIMENT
5 of 8
D12105
agreement in the ABL, and this is during the 5 hours of theflight path. The model is able to reproduce the CO2 spatialand temporal heterogeneity at the regional scale. In fact,when the aircraft flies over the forested area or near the oceanshoreline, i.e., between 1230 and 1500 UTC, the air sampledis rich in CO2 (up to 386–388 ppm), and when it flies overthe agricultural area, i.e., between 1500 and 1530 UTC overMarmande, the air is more depleted, with mixing ratios ofdown to 372 ppm, measured and also simulated.[21] The CO2 gradient between the forest and the agri-
cultural area is also sampled by the Piper Aztec aircraft(Figure 3b) on a larger horizontal distance. The CO2 con-centrations slowly decrease from the western part of thedomain to the eastern part on a distance of 200 km, both inthe model and in the observations. Once again, the modelreproduces the slight variations of CO2 at the scale of a fewhundred kilometers.[22] This CO2 difference between these two ecosystems
are due to several processes occurring during this day. Themesoscale modeling is an efficient tool to clearly show that,during the morning, the dominant wind direction in theCERES region is from southeast (see Figure 4a). Thesoutheast of the domain is mainly cultivated with wintercrops (yellow on the map, Figure 1). This vegetation typeassimilates a larger amount of CO2 compared to othervegetation types. The uptake of CO2 in the morning andin the afternoon is higher in this area than anywhere else asseen in Figure 4c. The winter crop uptake creates a CO2
depletion (well shown in Figure 4b) in the shallow morningABL that is advected to the northwest toward Marmande.On the other hand, in the beginning of the afternoon, a seabreeze is developing and penetrates a few tens of kilometersinland from the southwest. Over the forest, high CO2
concentration is associated with the wind convergence
between the westerly sea breeze and a southeast wind inthe eastern part (Figure 4b).[23] The CO2 gradient between the forest and the agri-
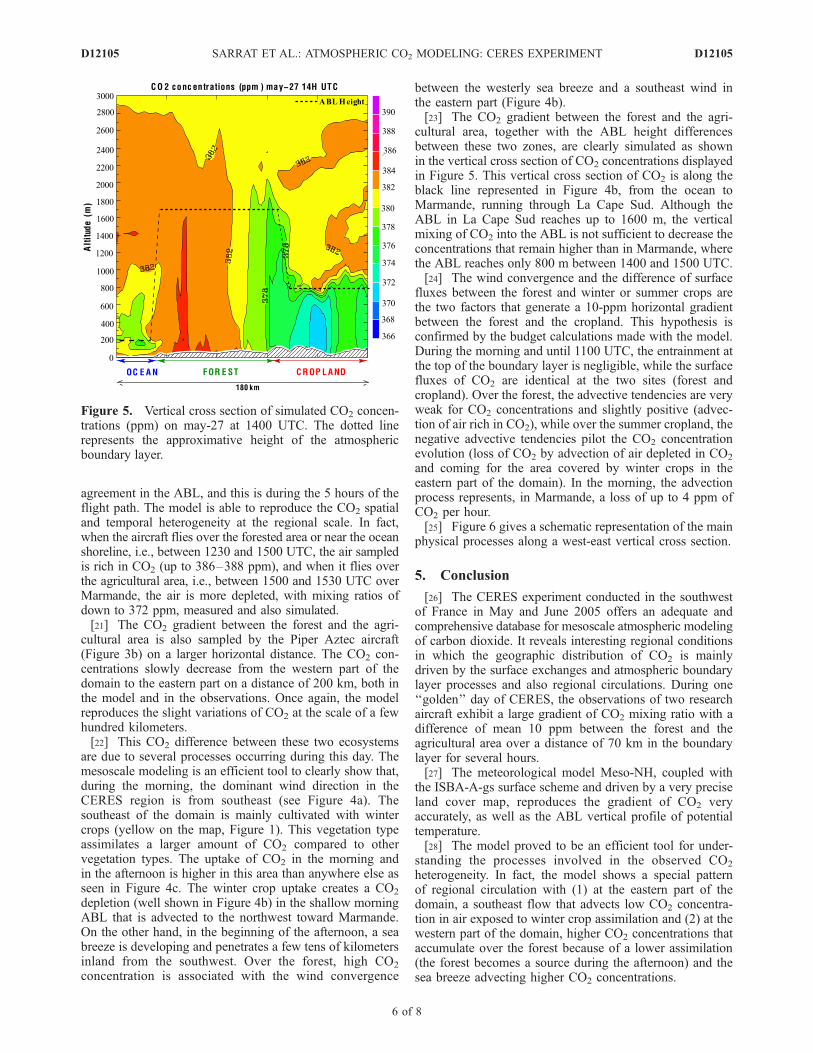
cultural area, together with the ABL height differencesbetween these two zones, are clearly simulated as shownin the vertical cross section of CO2 concentrations displayedin Figure 5. This vertical cross section of CO2 is along theblack line represented in Figure 4b, from the ocean toMarmande, running through La Cape Sud. Although theABL in La Cape Sud reaches up to 1600 m, the verticalmixing of CO2 into the ABL is not sufficient to decrease theconcentrations that remain higher than in Marmande, wherethe ABL reaches only 800 m between 1400 and 1500 UTC.[24] The wind convergence and the difference of surface
fluxes between the forest and winter or summer crops arethe two factors that generate a 10-ppm horizontal gradientbetween the forest and the cropland. This hypothesis isconfirmed by the budget calculations made with the model.During the morning and until 1100 UTC, the entrainment atthe top of the boundary layer is negligible, while the surfacefluxes of CO2 are identical at the two sites (forest andcropland). Over the forest, the advective tendencies are veryweak for CO2 concentrations and slightly positive (advec-tion of air rich in CO2), while over the summer cropland, thenegative advective tendencies pilot the CO2 concentrationevolution (loss of CO2 by advection of air depleted in CO2
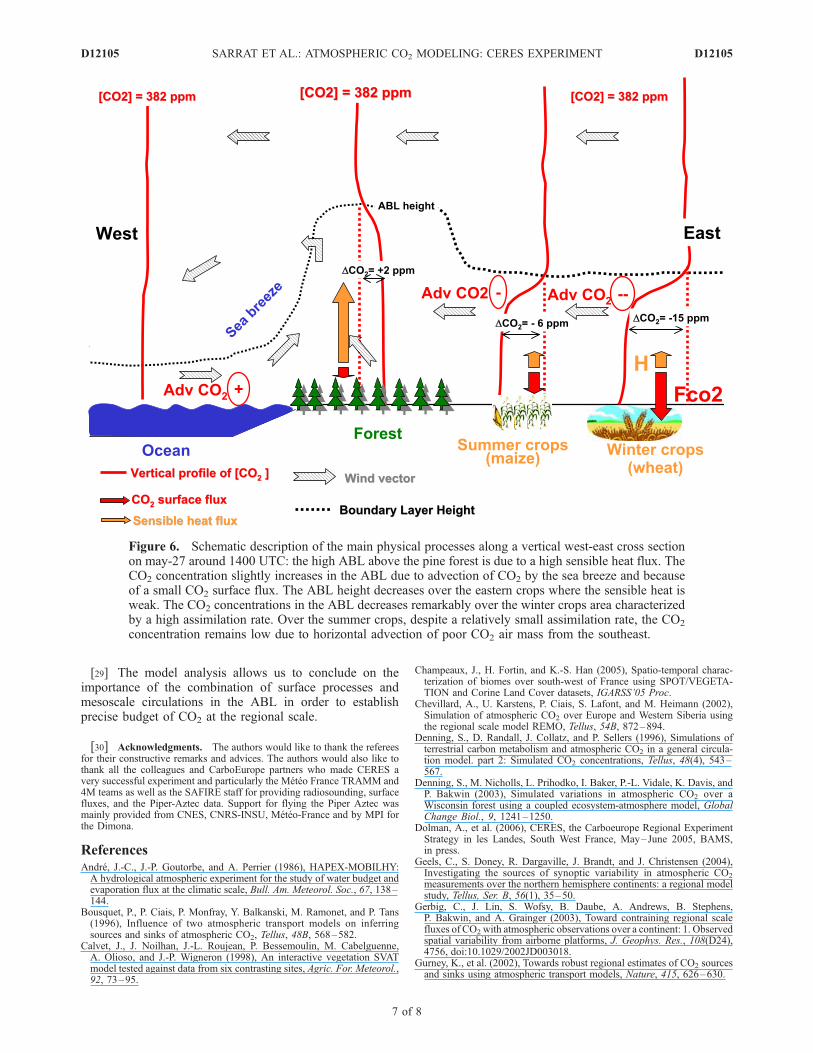
and coming for the area covered by winter crops in theeastern part of the domain). In the morning, the advectionprocess represents, in Marmande, a loss of up to 4 ppm ofCO2 per hour.[25] Figure 6 gives a schematic representation of the main
physical processes along a west-east vertical cross section.
5. Conclusion
[26] The CERES experiment conducted in the southwestof France in May and June 2005 offers an adequate andcomprehensive database for mesoscale atmospheric modelingof carbon dioxide. It reveals interesting regional conditionsin which the geographic distribution of CO2 is mainlydriven by the surface exchanges and atmospheric boundarylayer processes and also regional circulations. During one‘‘golden’’ day of CERES, the observations of two researchaircraft exhibit a large gradient of CO2 mixing ratio with adifference of mean 10 ppm between the forest and theagricultural area over a distance of 70 km in the boundarylayer for several hours.[27] The meteorological model Meso-NH, coupled with
the ISBA-A-gs surface scheme and driven by a very preciseland cover map, reproduces the gradient of CO2 veryaccurately, as well as the ABL vertical profile of potentialtemperature.[28] The model proved to be an efficient tool for under-
standing the processes involved in the observed CO2
heterogeneity. In fact, the model shows a special patternof regional circulation with (1) at the eastern part of thedomain, a southeast flow that advects low CO2 concentra-tion in air exposed to winter crop assimilation and (2) at thewestern part of the domain, higher CO2 concentrations thataccumulate over the forest because of a lower assimilation(the forest becomes a source during the afternoon) and thesea breeze advecting higher CO2 concentrations.
Figure 5. Vertical cross section of simulated CO2 concen-trations (ppm) on may-27 at 1400 UTC. The dotted linerepresents the approximative height of the atmosphericboundary layer.
D12105 SARRAT ET AL.: ATMOSPHERIC CO2 MODELING: CERES EXPERIMENT
6 of 8
D12105
[29] The model analysis allows us to conclude on theimportance of the combination of surface processes andmesoscale circulations in the ABL in order to establishprecise budget of CO2 at the regional scale.
[30] Acknowledgments. The authors would like to thank the refereesfor their constructive remarks and advices. The authors would also like tothank all the colleagues and CarboEurope partners who made CERES avery successful experiment and particularly the Meteo France TRAMM and4M teams as well as the SAFIRE staff for providing radiosounding, surfacefluxes, and the Piper-Aztec data. Support for flying the Piper Aztec wasmainly provided from CNES, CNRS-INSU, Meteo-France and by MPI forthe Dimona.
ReferencesAndre, J.-C., J.-P. Goutorbe, and A. Perrier (1986), HAPEX-MOBILHY:A hydrological atmospheric experiment for the study of water budget andevaporation flux at the climatic scale, Bull. Am. Meteorol. Soc., 67, 138–144.
Bousquet, P., P. Ciais, P. Monfray, Y. Balkanski, M. Ramonet, and P. Tans(1996), Influence of two atmospheric transport models on inferringsources and sinks of atmospheric CO2, Tellus, 48B, 568–582.
Calvet, J., J. Noilhan, J.-L. Roujean, P. Bessemoulin, M. Cabelguenne,A. Olioso, and J.-P. Wigneron (1998), An interactive vegetation SVATmodel tested against data from six contrasting sites, Agric. For. Meteorol.,92, 73–95.
Champeaux, J., H. Fortin, and K.-S. Han (2005), Spatio-temporal charac-terization of biomes over south-west of France using SPOT/VEGETA-TION and Corine Land Cover datasets, IGARSS’05 Proc.
Chevillard, A., U. Karstens, P. Ciais, S. Lafont, and M. Heimann (2002),Simulation of atmospheric CO2 over Europe and Western Siberia usingthe regional scale model REMO, Tellus, 54B, 872–894.
Denning, S., D. Randall, J. Collatz, and P. Sellers (1996), Simulations ofterrestrial carbon metabolism and atmospheric CO2 in a general circula-tion model. part 2: Simulated CO2 concentrations, Tellus, 48(4), 543–567.
Denning, S., M. Nicholls, L. Prihodko, I. Baker, P.-L. Vidale, K. Davis, andP. Bakwin (2003), Simulated variations in atmospheric CO2 over aWisconsin forest using a coupled ecosystem-atmosphere model, GlobalChange Biol., 9, 1241–1250.
Dolman, A., et al. (2006), CERES, the Carboeurope Regional ExperimentStrategy in les Landes, South West France, May–June 2005, BAMS,in press.
Geels, C., S. Doney, R. Dargaville, J. Brandt, and J. Christensen (2004),Investigating the sources of synoptic variability in atmospheric CO2
measurements over the northern hemisphere continents: a regional modelstudy, Tellus, Ser. B, 56(1), 35–50.
Gerbig, C., J. Lin, S. Wofsy, B. Daube, A. Andrews, B. Stephens,P. Bakwin, and A. Grainger (2003), Toward contraining regional scalefluxes of CO2 with atmospheric observations over a continent: 1. Observedspatial variability from airborne platforms, J. Geophys. Res., 108(D24),4756, doi:10.1029/2002JD003018.
Gurney, K., et al. (2002), Towards robust regional estimates of CO2 sourcesand sinks using atmospheric transport models, Nature, 415, 626–630.
Figure 6. Schematic description of the main physical processes along a vertical west-east cross sectionon may-27 around 1400 UTC: the high ABL above the pine forest is due to a high sensible heat flux. TheCO2 concentration slightly increases in the ABL due to advection of CO2 by the sea breeze and becauseof a small CO2 surface flux. The ABL height decreases over the eastern crops where the sensible heat isweak. The CO2 concentrations in the ABL decreases remarkably over the winter crops area characterizedby a high assimilation rate. Over the summer crops, despite a relatively small assimilation rate, the CO2
concentration remains low due to horizontal advection of poor CO2 air mass from the southeast.
D12105 SARRAT ET AL.: ATMOSPHERIC CO2 MODELING: CERES EXPERIMENT
7 of 8
D12105
Habets, F., J. Noilhan, C. Golaz, J. Goutorbe, P. Lacarrere, E. Leblois,E. Ledoux, E. Martin, C. Ottle, and D. Vidal (1999), The ISBA surfacescheme in a macroscale hydrological model applied in the Hapex-Mobilhyarea, J. Hydrol., 217, 75–96.
Lafore, J., et al. (1998), The Meso-NH atmospheric simulation system.Part I: Adiabatic formulation and control simulations, Ann. Geophys.,16, 90–109.
Masson, V., J. Champeaux, F. Chauvin, C. Meriguet, and R. Lacaze (2003),A global database of land surface parameters at 1 km resolution for use inmeteorological and climate models, J. Clim., 16, 1261–1282.
Nicholls, M., A. S. Denning, L. Prihodko, P.-L. Vidale, I. Baker, K. Davis,and P. Bakwin (2004), A multiple-scale simulation of variations in atmo-spheric carbon dioxide using a coupled biosphere-atmospheric model,J. Geophys. Res., 109(D18), D18117, doi:10.1029/2003JD004482.
Noilhan, J., and S. Planton (1989), A simple parametrization of land surfaceprocesses for meteorological models, Mon. Weather Rev., 117, 536–549.
Noilhan, J., P. Lacarrere, and P. Bougeault (1991), An experiment with andadvanced surface parametrization in a mesobeta-scale model, Mon.Weather Rev., 119(10).
Rayner, P., I. Enting, R. Francey, and R. Langenfelds (1999), Reconstruc-ting the recent carbon cycle from atmospheric CO2, d
13C and O2/N2
observations, Tellus, Ser. B, 51(2), 213–232.
Schmitgen, S., H. Gei, P. Ciais, B. Neininger, Y. Brunet, M. Reichstein,D. Kley, and A. Volz-Thomas (2004), Carbon dioxide uptake of aforested region in southwest France derived from airborne CO2 andCO measurements in a quasi-lagrangian experiment, J. Geophys. Res.,109(D14), D14302, doi:10.1029/2003JD004335.
Takahashi, T., R. Feely, R. R.W. ans Wanninkhof, D. Chipman, S. Sutherland,and T. Takahashi (1997), Global air-sea flux of CO2: An estimate based onmeasurements of sea-air pCO2 difference, Proc. Natl. Acad. Sci. USA, 94,8292–8299.
�����������������������A. Butet, Service des Avions Francais Instrumentes pour la Recherche en
Environnement, Meteo France, Toulouse, France.F. Boumard, P. Ciais, J. D. Paris, and M. Ramonet, Le Laboratoire des
Sciences du Climat et l’Environnement, Gif sur Yvette, France.J. C. Calvet, S. Donier, C. Lac, P. Lacarrere, J. Noilhan, and C. Sarrat,
CNRM/GAME, Meteo France, 42, avenue Gaspard Coriolis, 31057,Toulouse, France. ([email protected])A. J. Dolman, Vrije University, Amsterdam, Netherlands.C. Gerbig, Max Planck Institute for Biochemistry, Jena, Germany.B. Neininger, MetAir, Menzingen, Switzerland.
D12105 SARRAT ET AL.: ATMOSPHERIC CO2 MODELING: CERES EXPERIMENT
8 of 8
D12105