Characterization of trace gases measured over Alberta oil ...
PHYSICAL REVIEW D 67, 072003 ~2003!
Energy spectra of atmospheric muons measured with the CAPRICE98 balloon experiment
M. Boezio, V. Bonvicini, P. Schiavon, A. Vacchi, and N. ZampaUniversity of Trieste and Sezione INFN di Trieste, Via A. Valerio 2, I-34147 Trieste, Italy
D. Bergstrom, P. Carlson, T. Francke, P. Hansen, and E. MocchiuttiRoyal Institute of Technology (KTH), AlbaNova University Center (SCFAB), S-10691 Stockholm, Sweden
M. SuffertCentre des Recherches Nucle´aires, BP20, F-67037 Strasbourg Cedex, France
M. Hof, J. Kremer, W. Menn, and M. SimonUniversitat Siegen, 57068 Siegen, Germany
M. Ambriola, R. Bellotti, F. Cafagna, F. Ciacio, M. Circella, and C. N. De MarzoUniversity of Bari and Sezione INFN di Bari, Via Amendola 173, I-70126 Bari, Italy
P. Papini, S. Piccardi, P. Spillantini, and E. VannucciniUniversity of Firenze and Sezione INFN di Firenze, Largo E. Fermi 2, I-50125 Firenze, Italy
S. Bartalucci and M. RicciINFN–Laboratori Nazionali di Frascati, Via E. Fermi 40, CP 13, I-00044 Frascati, Italy
M. Casolino, M. P. De Pascale, A. Morselli, P. Picozza, and R. SparvoliUniversity of Roma ‘‘Tor Vergata’’ and Sezione INFN di Roma II, Via della Ricerca Scientifica 1, I-00133 Roma, Italy
J. W. Mitchell, J. F. Ormes, S. A. Stephens, and R. E. StreitmatterCode 661, NASA/Goddard Space Flight Center, Greenbelt, Maryland 20771
U. Bravar and S. J. StochajR. L. Golden Particle Astrophysics Lab, Box 3 PAL, New Mexico State University, Las Cruces, New Mexico 88003
~Received 14 February 2003; published 24 April 2003!
The measurement of the atmospheric muon spectrum is currently of great interest because of the study ofatmospheric neutrinos and the claim of neutrino oscillations made in 1998 by the Super-Kamiokande Collabo-ration. A measurement of the muon flux is an indirect measure of the neutrino flux. Therefore, it can be usedto improve the calculation of the atmospheric neutrino flux, which in turn can be compared with the observedneutrino rates in underground detectors. This article reports a new measurement of them1 andm2 spectra atseveral atmospheric depths in the momentum ranges 0.3–20 GeV/c and 0.3–40 GeV/c, respectively. The datawere collected by the balloon-borne experiment CAPRICE98 during the ascent of the payload on 28 May 1998from Fort Sumner, N. M. The experiment used the NMSU-WIZARD/CAPRICE 98 balloon-borne magnetspectrometer equipped with a gas ring imaging Cherenkov detector and a silicon-tungsten calorimeter.
DOI: 10.1103/PhysRevD.67.072003 PACS number~s!: 96.40.Tv, 14.60.Ef, 14.60.Pq
nttier-ri
oillautets
e-utticed,outxt ofcon-giesayo-xes
or-
I. INTRODUCTION
The energy spectrum of atmospheric muons is curreof great interest because of the potential to cross-checkresults from simulations of the propagation of cosmic raysthe atmosphere. In these simulations, the correlation betwthe muon flux and the neutrino flux is of particular impotance. The recent detailed studies of atmospheric neutinteractions by the Super-Kamiokande@1#, Soudan-2@2#, andMACRO Collaborations@3# give strong support for neutrinooscillations. These results, however, are not based on cparisons with the absolute flux. The parameters of osctions depend on the absolute production spectrum of nenos which can be checked by measuring the atmosphmuon flux. The majority of the Super-Kamiokande even
0556-2821/2003/67~7!/072003~15!/$20.00 67 0720
lyhenen
no
m--
ri-ric,
the ‘‘sub-GeV’’ events, have neutrino energies typically blow 1 GeV, corresponding to typical muon momenta of abo3 GeV/c. At Super-Kamiokande, where the geomagnecutoff is about 12 GV rigidity, these neutrinos are generaton the average, by incident protons of energy of ab10–20 GeV@4#. In addition to the importance of muon flumeasurements for the neutrino oscillation results, a testhe simulation at these energies provides the degree offidence such simulations can have at much higher ener@5#. Experiments such as the Akeno Giant Air Shower Arr~AGASA!, HiRes, and Auger use air shower simulation prgrams to calculate secondary atmospheric particle flu~e.g., see@6#!.
There are three major factors that are of special imp
©2003 The American Physical Society03-1

ssrith
u-h
dde
byhg
s iec
fea
Rrot
ernll
or
tht
mdp
th
atinen
ntcsoa
om
exec
ons
. It38epthd
ns,lei;
m,
eter
ntlidr
sh-
ndnt;
ldtofof
re-he
ive
ol-
BOEZIO et al. PHYSICAL REVIEW D 67, 072003 ~2003!
tance for the calculation of the neutrino flux:~1! the incidentcosmic-ray flux,~2! the hadronic production model, and~3!geomagnetic and solar modulation effects. In 1996, Gaiet al. @7# compared different calculations of the atmospheneutrino flux and concluded that there are differences atlevel of 30%. In a more recent study Gaisser and Honda@8#and, separately, Gaisser@4#, conclude that the estimated netrino flux for the Super-Kamiokande experiment, using tsame hadronic model~codeTarget 2.1!, varies by about 10%for different measured incident cosmic-ray spectra. For atailed discussion of the incident cosmic-ray flux, the reamay refer to the recent CAPRICE98 results@9# and it may bementioned that below 10 GV the incident flux is affectedthe periodic solar activity and the geomagnetic field. Tsame authors@4,8# also compared the neutrino flux usindifferent hadronic interaction models. Here the differencethe neutrino flux around 1 GV are larger, about 20%. Accerator data on the yield of pions from proton-nuclei interations do not cover the full phase space. Results from difent experiments, many performed in the 1960s or 1970s,often not consistent. However, a recent experiment at CEHARP @10#, measures, in a systematic way, the particle pduction over almost the full phase and should be ablesubstantially improve the situation. In addition to the unctainties in the flux, most simulations use a one-dimensioapproach in which the secondaries are assumed to be coear with the incident cosmic-ray particle~for a discussion ofthe effects of this approximation, see@4#!.
The flux of muons in the atmosphere increases with atmspheric depth, reaches a maximum around an altitude cosponding to atmospheric depths of 100–200 g/cm2 ~e.g., see@11#!, and then decreases with depth. The location ofmaximum and the rate of decrease depend weakly onenergy. Muon measurements should therefore be perforover a broad range of altitudes and energies. In the lastcade a few measurements of atmospheric muons wereformed by various groups@12–15#. Recently, we have alsopresented muon flux measurements obtained withCAPRICE94 instrument@11#, capable of measuringm1 inthe momentum range 0.3–2 GeV/c and m2 in the range0.3–40 GeV/c. In this paper we present new results onmospheric muon fluxes obtained with the CAPRICE98strument. This modified spectrometer allowed measuremof m1 andm2, both over large ranges of 0.3–20 GeV/c and0.3–40 GeV/c, respectively. The CAPRICE98 instrumealso measured the cosmic-ray hydrogen and helium spe@9# and these can be used as input for shower simulationorder to reduce the overall systematic uncertainties assated directly with the spectrometer. Data on the muon fluxthe ground were collected in 1997 with the present spectreter and have been published@16#.
In this paper, the detector system of the CAPRICE98periment is described in Sec. II, the data analysis is in SIII and IV, and the results are given in Sec. V.
II. THE EXPERIMENT
The CAPRICE98 spectrometer was flown by ballofrom Ft. Sumner, N. M., (34.28° north latitude, 104.14° we
07200
erce
e
e-r
e
nl--r-re
N,-o-alin-
-re-
eheede-er-
e
--ts
trainci-t-
-s.
t
longitude!, on 28 May 1998@17#. After three hours of bal-loon ascent, the payload reached an altitude of 36 kmfloated for more than 20 h between altitudes from 36 tokm corresponding to an average residual atmospheric dof 5.5 g/cm2. At this float altitude, the spectrometer collectedata on the flux of various cosmic particles: antiprotoelectrons, positrons, hydrogen, deuterium and helium nucmost of these results have been published@9,18–20#. Theinstrument, shown in Fig. 1, consisted, from top to bottoof a ring imaging Cherenkov~RICH! detector, a time-of-flight ~TOF! system, a superconducting magnet spectromequipped with drift chambers~DCs!, and a silicon-tungstenimaging calorimeter. The major change in this instrumefrom that of CAPRICE94 is the replacement of the soRICH detector@21#, which had a threshold Lorentz factogL51.5, by a gas RICH detector with a much higher threold of gL'19.
We give here a few details of the new RICH detector abriefly summarize the rest of the detectors of the instrumethe reader may refer to the earlier publications@17,22–27#.
A. The gas RICH detector
The RICH detector@22–24# consisted of a 1 m tall gasradiator, filled with high purity C4F10 gas. The detectorthreshold at float wasgL518.8, corresponding to a threshofor muons of about 2 GeV/c and for protons of abou18 GeV/c. During the ascent of the balloon, the pressurethe gas was slightly different, giving an average thresholdgL519.3. The Cherenkov light produced in the gas wasflected by a spherical mirror, located at the bottom of tvessel, onto a multiwire proportional chamber~MWPC!filled with ethane to which was added the photosensitagent TMAE ~tetrakis-dimethyl-amino-ethylene! @23#. Thephotoelectron signals from the multiwire chamber were clected by 838 mm2 pads in the 51351 cm2 pad plane. An
FIG. 1. A schematic view of the CAPRICE98 detector.
3-2
.
d
e
t-
ENERGY SPECTRA OF ATMOSPHERIC MUONS . . . PHYSICAL REVIEW D 67, 072003 ~2003!
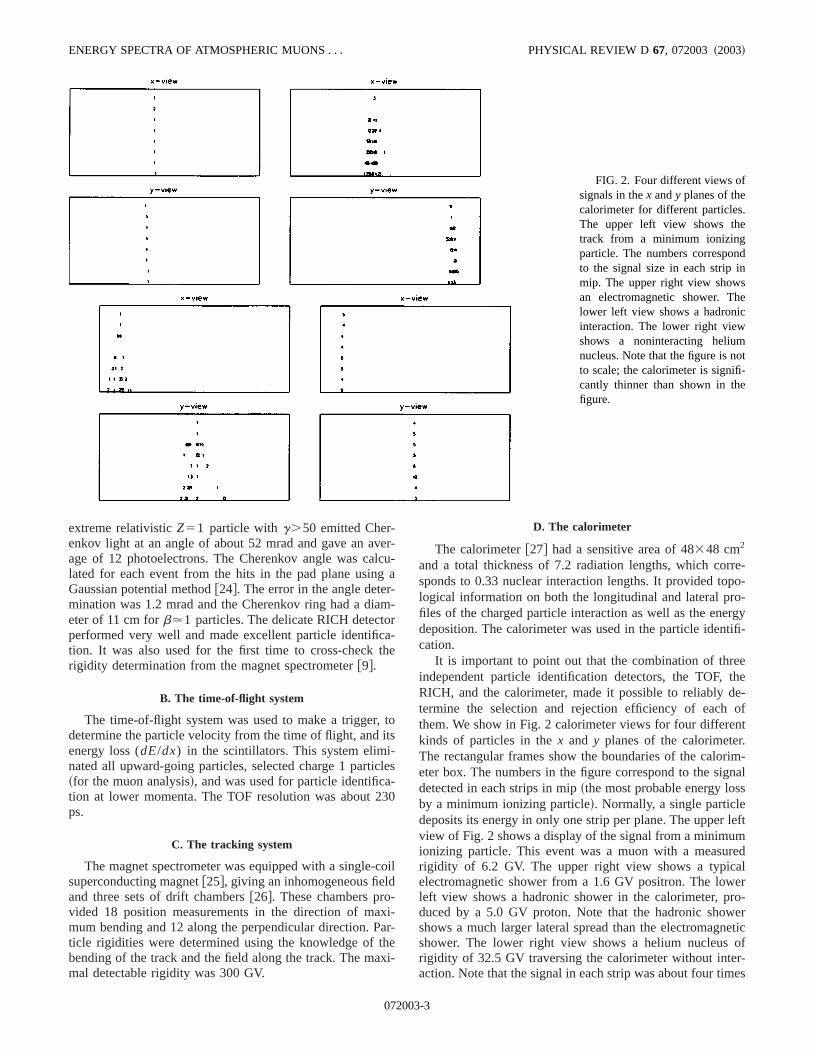
FIG. 2. Four different views ofsignals in thex andy planes of thecalorimeter for different particlesThe upper left view shows thetrack from a minimum ionizingparticle. The numbers corresponto the signal size in each strip inmip. The upper right view showsan electromagnetic shower. Thlower left view shows a hadronicinteraction. The lower right viewshows a noninteracting heliumnucleus. Note that the figure is noto scale; the calorimeter is significantly thinner than shown in thefigure.
velcg-mra
th
tits-cl-3
cod-xa
hex
re-po-o-rgytifi-
ethee-of
nt.rim-nals
leftmredler
ro-ereticofr-es
extreme relativisticZ51 particle withg.50 emitted Cher-enkov light at an angle of about 52 mrad and gave an aage of 12 photoelectrons. The Cherenkov angle was calated for each event from the hits in the pad plane usinGaussian potential method@24#. The error in the angle determination was 1.2 mrad and the Cherenkov ring had a diaeter of 11 cm forb.1 particles. The delicate RICH detectoperformed very well and made excellent particle identifiction. It was also used for the first time to cross-checkrigidity determination from the magnet spectrometer@9#.
B. The time-of-flight system
The time-of-flight system was used to make a trigger,determine the particle velocity from the time of flight, andenergy loss (dE/dx) in the scintillators. This system eliminated all upward-going particles, selected charge 1 parti~for the muon analysis!, and was used for particle identification at lower momenta. The TOF resolution was about 2ps.
C. The tracking system
The magnet spectrometer was equipped with a single-superconducting magnet@25#, giving an inhomogeneous fieland three sets of drift chambers@26#. These chambers provided 18 position measurements in the direction of mamum bending and 12 along the perpendicular direction. Pticle rigidities were determined using the knowledge of tbending of the track and the field along the track. The mamal detectable rigidity was 300 GV.
07200
r-u-a
-
-e
o
es
0
il
i-r-
i-
D. The calorimeter
The calorimeter@27# had a sensitive area of 48348 cm2
and a total thickness of 7.2 radiation lengths, which corsponds to 0.33 nuclear interaction lengths. It provided tological information on both the longitudinal and lateral prfiles of the charged particle interaction as well as the enedeposition. The calorimeter was used in the particle idencation.
It is important to point out that the combination of threindependent particle identification detectors, the TOF,RICH, and the calorimeter, made it possible to reliably dtermine the selection and rejection efficiency of eachthem. We show in Fig. 2 calorimeter views for four differekinds of particles in thex and y planes of the calorimeterThe rectangular frames show the boundaries of the caloeter box. The numbers in the figure correspond to the sigdetected in each strips in mip~the most probable energy losby a minimum ionizing particle!. Normally, a single particledeposits its energy in only one strip per plane. The upperview of Fig. 2 shows a display of the signal from a minimuionizing particle. This event was a muon with a measurigidity of 6.2 GV. The upper right view shows a typicaelectromagnetic shower from a 1.6 GV positron. The lowleft view shows a hadronic shower in the calorimeter, pduced by a 5.0 GV proton. Note that the hadronic showshows a much larger lateral spread than the electromagnshower. The lower right view shows a helium nucleusrigidity of 32.5 GV traversing the calorimeter without inteaction. Note that the signal in each strip was about four tim
3-3
lee
aemrlyanekois
uraiThasthmn
niz
amo
s
-ast
etheon
by
estheb-
cleon if-
outem-ns,ck-e,re-the
retete
rh a
BOEZIO et al. PHYSICAL REVIEW D 67, 072003 ~2003!
larger than that produced by a minimum ionizing partic~upper left event!, due to the large ionization loss for thdoubly charged particle.
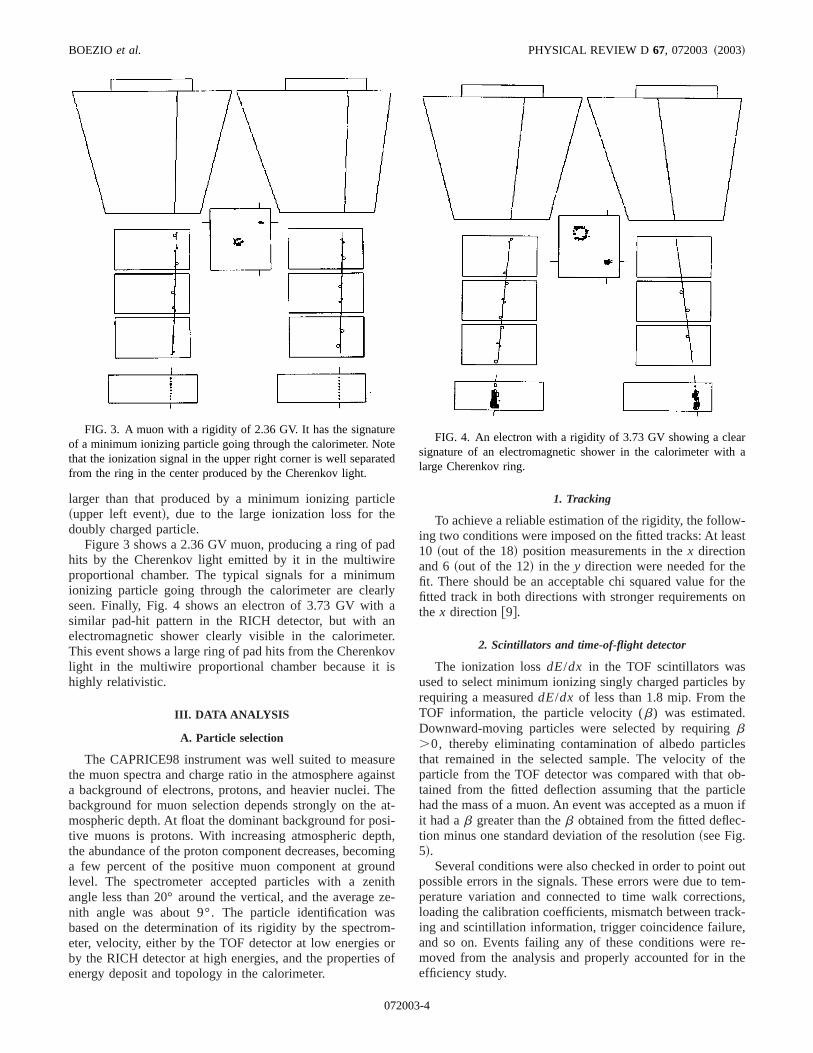
Figure 3 shows a 2.36 GV muon, producing a ring of phits by the Cherenkov light emitted by it in the multiwirproportional chamber. The typical signals for a minimuionizing particle going through the calorimeter are cleaseen. Finally, Fig. 4 shows an electron of 3.73 GV withsimilar pad-hit pattern in the RICH detector, but with aelectromagnetic shower clearly visible in the calorimetThis event shows a large ring of pad hits from the Cherenlight in the multiwire proportional chamber because ithighly relativistic.
III. DATA ANALYSIS
A. Particle selection
The CAPRICE98 instrument was well suited to measthe muon spectra and charge ratio in the atmosphere aga background of electrons, protons, and heavier nuclei.background for muon selection depends strongly on themospheric depth. At float the dominant background for potive muons is protons. With increasing atmospheric depthe abundance of the proton component decreases, becoa few percent of the positive muon component at groulevel. The spectrometer accepted particles with a zeangle less than 20° around the vertical, and the averagenith angle was about 9°. The particle identification wbased on the determination of its rigidity by the spectroeter, velocity, either by the TOF detector at low energiesby the RICH detector at high energies, and the propertieenergy deposit and topology in the calorimeter.
FIG. 3. A muon with a rigidity of 2.36 GV. It has the signatuof a minimum ionizing particle going through the calorimeter. Nothat the ionization signal in the upper right corner is well separafrom the ring in the center produced by the Cherenkov light.
07200
d
r.v
enstet-i-,ingdthe-
s-rof
1. Tracking
To achieve a reliable estimation of the rigidity, the following two conditions were imposed on the fitted tracks: At le10 ~out of the 18! position measurements in thex directionand 6~out of the 12! in the y direction were needed for thfit. There should be an acceptable chi squared value forfitted track in both directions with stronger requirementsthe x direction @9#.
2. Scintillators and time-of-flight detector
The ionization lossdE/dx in the TOF scintillators wasused to select minimum ionizing singly charged particlesrequiring a measureddE/dx of less than 1.8 mip. From theTOF information, the particle velocity (b) was estimated.Downward-moving particles were selected by requiringb.0, thereby eliminating contamination of albedo particlthat remained in the selected sample. The velocity ofparticle from the TOF detector was compared with that otained from the fitted deflection assuming that the partihad the mass of a muon. An event was accepted as a muit had ab greater than theb obtained from the fitted deflection minus one standard deviation of the resolution~see Fig.5!.
Several conditions were also checked in order to pointpossible errors in the signals. These errors were due to tperature variation and connected to time walk correctioloading the calibration coefficients, mismatch between traing and scintillation information, trigger coincidence failurand so on. Events failing any of these conditions weremoved from the analysis and properly accounted for inefficiency study.
d
FIG. 4. An electron with a rigidity of 3.73 GV showing a cleasignature of an electromagnetic shower in the calorimeter witlarge Cherenkov ring.
3-4
koo
tioe,w
it
d
ov
ht
ar
berthee-
tion
843
anduce
ce,ord-
par-kovolu-ig-
e theonslec-
lint
T
gle
ENERGY SPECTRA OF ATMOSPHERIC MUONS . . . PHYSICAL REVIEW D 67, 072003 ~2003!
3. The RICH detector
The RICH detector was used to measure the Cherenangle of the particle and thereby its velocity. The Cherenkangle was reconstructed from the geometrical distributionthe signals in the pad plane. The quality of the reconstrucdepended on the number of pads used in the fit. Therefororder to have a reliable Cherenkov angle reconstruction,used a condition based on the effective number of pads hthe pad plane (ne f f) given by
ne f f5
S (i
npads
v i D 2
(i
npads
v i2
,
wherev i is the weight of the Cherenkov angle of the pai~see@23#!.
ne f f is related to~but not the same as! the number of padshit due to Cherenkov light and therefore to the numberphotoelectrons (Nph), which is related to the Cherenkoangle (uc) through
Nph5N0LZ2sin2uc5a sin2uc , ~1!
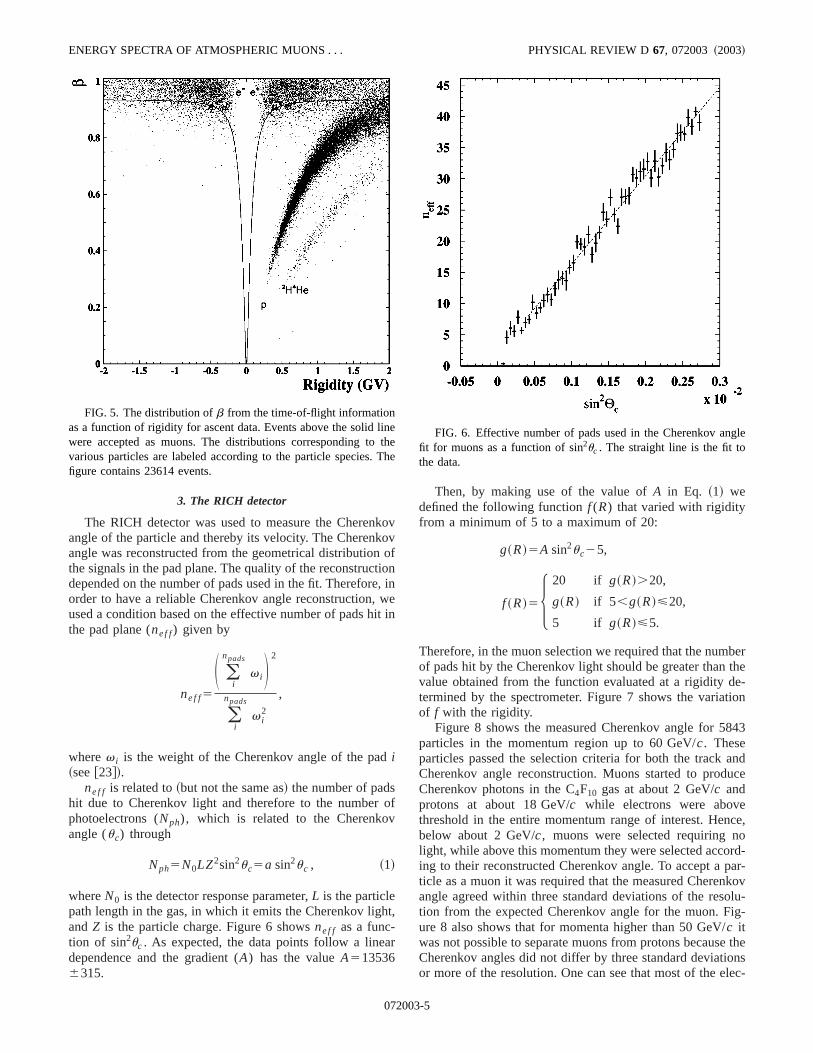
whereN0 is the detector response parameter,L is the particlepath length in the gas, in which it emits the Cherenkov ligandZ is the particle charge. Figure 6 showsne f f as a func-tion of sin2uc . As expected, the data points follow a linedependence and the gradient (A) has the valueA5135366315.
FIG. 5. The distribution ofb from the time-of-flight informationas a function of rigidity for ascent data. Events above the solidwere accepted as muons. The distributions corresponding tovarious particles are labeled according to the particle species.figure contains 23614 events.
07200
ovvfninein
f
,
Then, by making use of the value ofA in Eq. ~1! wedefined the following functionf (R) that varied with rigidityfrom a minimum of 5 to a maximum of 20:
g~R!5A sin2uc25,
f ~R!5H 20 if g~R!.20,
g~R! if 5 ,g~R!<20,
5 if g~R!<5.
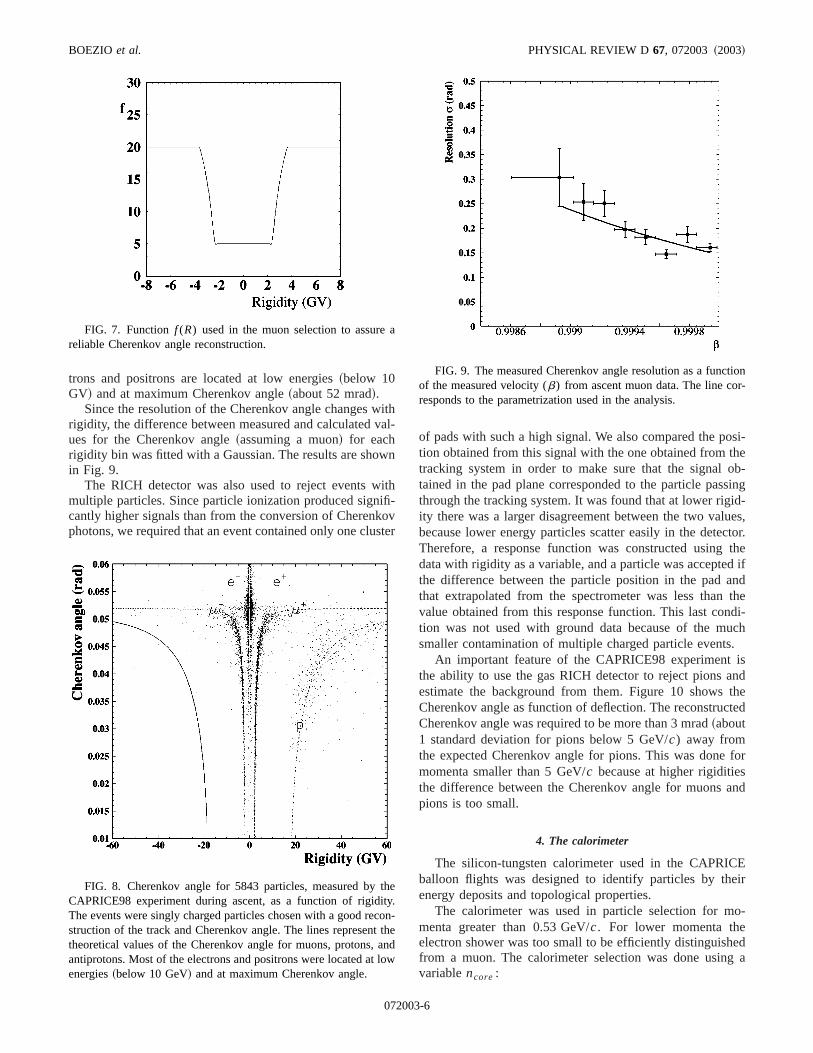
Therefore, in the muon selection we required that the numof pads hit by the Cherenkov light should be greater thanvalue obtained from the function evaluated at a rigidity dtermined by the spectrometer. Figure 7 shows the variaof f with the rigidity.
Figure 8 shows the measured Cherenkov angle for 5particles in the momentum region up to 60 GeV/c. Theseparticles passed the selection criteria for both the trackCherenkov angle reconstruction. Muons started to prodCherenkov photons in the C4F10 gas at about 2 GeV/c andprotons at about 18 GeV/c while electrons were abovethreshold in the entire momentum range of interest. Henbelow about 2 GeV/c, muons were selected requiring nlight, while above this momentum they were selected accoing to their reconstructed Cherenkov angle. To accept aticle as a muon it was required that the measured Cherenangle agreed within three standard deviations of the restion from the expected Cherenkov angle for the muon. Fure 8 also shows that for momenta higher than 50 GeV/c itwas not possible to separate muons from protons becausCherenkov angles did not differ by three standard deviatior more of the resolution. One can see that most of the e
ehehe
FIG. 6. Effective number of pads used in the Cherenkov anfit for muons as a function of sin2uc . The straight line is the fit tothe data.
3-5
iva
w
itifikos
osi-heob-singid-ues,ctor.the
d ifndthedi-uch.isndtheted
forsand
Eeir
o-
edg a
a
thitycot talo
tionr-
BOEZIO et al. PHYSICAL REVIEW D 67, 072003 ~2003!
trons and positrons are located at low energies~below 10GV! and at maximum Cherenkov angle~about 52 mrad!.
Since the resolution of the Cherenkov angle changes wrigidity, the difference between measured and calculatedues for the Cherenkov angle~assuming a muon! for eachrigidity bin was fitted with a Gaussian. The results are shoin Fig. 9.
The RICH detector was also used to reject events wmultiple particles. Since particle ionization produced signcantly higher signals than from the conversion of Cherenphotons, we required that an event contained only one clu
FIG. 7. Functionf (R) used in the muon selection to assurereliable Cherenkov angle reconstruction.
FIG. 8. Cherenkov angle for 5843 particles, measured byCAPRICE98 experiment during ascent, as a function of rigidThe events were singly charged particles chosen with a good restruction of the track and Cherenkov angle. The lines representheoretical values of the Cherenkov angle for muons, protons,antiprotons. Most of the electrons and positrons were located atenergies~below 10 GeV! and at maximum Cherenkov angle.
07200
thl-
n
h-vter
of pads with such a high signal. We also compared the ption obtained from this signal with the one obtained from ttracking system in order to make sure that the signaltained in the pad plane corresponded to the particle pasthrough the tracking system. It was found that at lower rigity there was a larger disagreement between the two valbecause lower energy particles scatter easily in the deteTherefore, a response function was constructed usingdata with rigidity as a variable, and a particle was acceptethe difference between the particle position in the pad athat extrapolated from the spectrometer was less thanvalue obtained from this response function. This last contion was not used with ground data because of the msmaller contamination of multiple charged particle events
An important feature of the CAPRICE98 experimentthe ability to use the gas RICH detector to reject pions aestimate the background from them. Figure 10 showsCherenkov angle as function of deflection. The reconstrucCherenkov angle was required to be more than 3 mrad~about1 standard deviation for pions below 5 GeV/c) away fromthe expected Cherenkov angle for pions. This was donemomenta smaller than 5 GeV/c because at higher rigiditiethe difference between the Cherenkov angle for muonspions is too small.
4. The calorimeter
The silicon-tungsten calorimeter used in the CAPRICballoon flights was designed to identify particles by thenergy deposits and topological properties.
The calorimeter was used in particle selection for mmenta greater than 0.53 GeV/c. For lower momenta theelectron shower was too small to be efficiently distinguishfrom a muon. The calorimeter selection was done usinvariablencore :
e.n-
hendw
FIG. 9. The measured Cherenkov angle resolution as a funcof the measured velocity (b) from ascent muon data. The line coresponds to the parametrization used in the analysis.
3-6
f
ecn
eheis
byean-r-
eth5eee60in
et
onect a
H
sen-is
sthhf
heom
ENERGY SPECTRA OF ATMOSPHERIC MUONS . . . PHYSICAL REVIEW D 67, 072003 ~2003!
ncore5(j 51
2
(i 51
8
nhit~ i , j !i ,
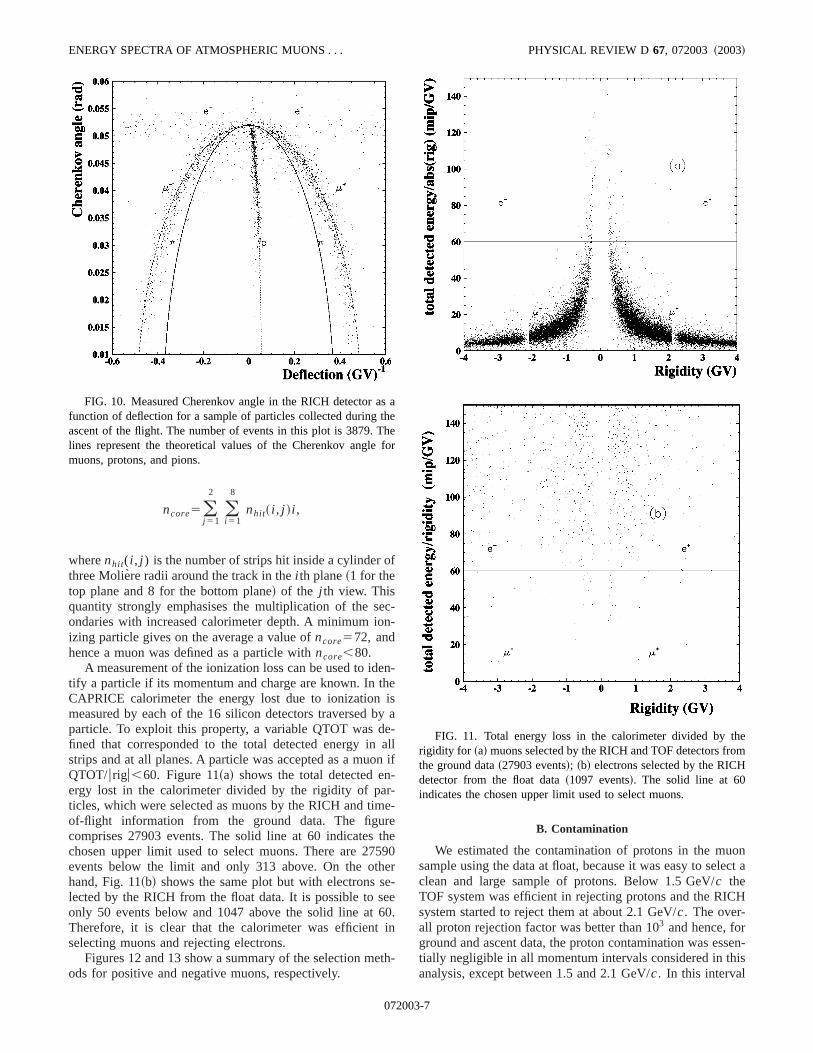
wherenhit( i , j ) is the number of strips hit inside a cylinder othree Moliere radii around the track in thei th plane~1 for thetop plane and 8 for the bottom plane! of the j th view. Thisquantity strongly emphasises the multiplication of the sondaries with increased calorimeter depth. A minimum ioizing particle gives on the average a value ofncore572, andhence a muon was defined as a particle withncore,80.
A measurement of the ionization loss can be used to idtify a particle if its momentum and charge are known. In tCAPRICE calorimeter the energy lost due to ionizationmeasured by each of the 16 silicon detectors traversedparticle. To exploit this property, a variable QTOT was dfined that corresponded to the total detected energy instrips and at all planes. A particle was accepted as a muoQTOT/urigu,60. Figure 11~a! shows the total detected energy lost in the calorimeter divided by the rigidity of paticles, which were selected as muons by the RICH and timof-flight information from the ground data. The figurcomprises 27903 events. The solid line at 60 indicateschosen upper limit used to select muons. There are 27events below the limit and only 313 above. On the othhand, Fig. 11~b! shows the same plot but with electrons slected by the RICH from the float data. It is possible to sonly 50 events below and 1047 above the solid line atTherefore, it is clear that the calorimeter was efficientselecting muons and rejecting electrons.
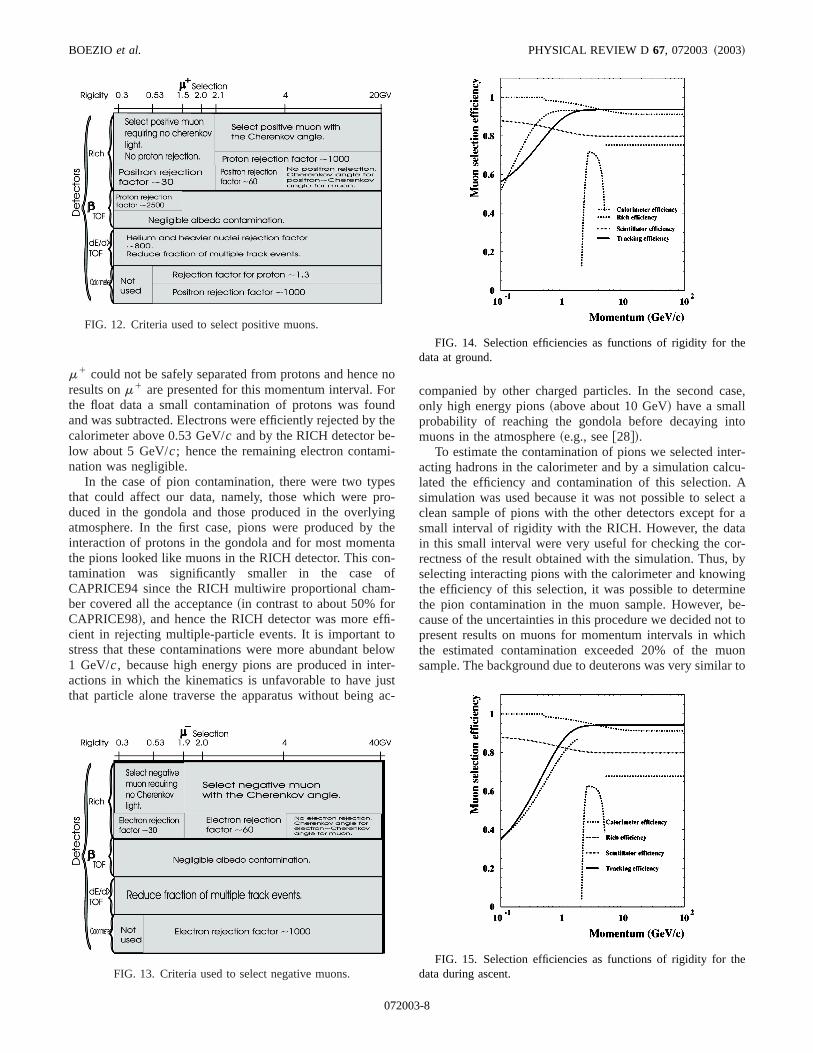
Figures 12 and 13 show a summary of the selection mods for positive and negative muons, respectively.
FIG. 10. Measured Cherenkov angle in the RICH detector afunction of deflection for a sample of particles collected duringascent of the flight. The number of events in this plot is 3879. Tlines represent the theoretical values of the Cherenkov anglemuons, protons, and pions.
07200
--
n-
a-llif
e-
e90r-e.
h-
B. Contamination
We estimated the contamination of protons in the musample using the data at float, because it was easy to selclean and large sample of protons. Below 1.5 GeV/c theTOF system was efficient in rejecting protons and the RICsystem started to reject them at about 2.1 GeV/c. The over-all proton rejection factor was better than 103 and hence, forground and ascent data, the proton contamination was estially negligible in all momentum intervals considered in thanalysis, except between 1.5 and 2.1 GeV/c. In this interval
aeeor
FIG. 11. Total energy loss in the calorimeter divided by trigidity for ~a! muons selected by the RICH and TOF detectors frthe ground data~27903 events!; ~b! electrons selected by the RICHdetector from the float data~1097 events!. The solid line at 60indicates the chosen upper limit used to select muons.
3-7
eonth-i-
eroint
ntno-
rffitoelteusa
ase,
to
ter-cu-A
ct ar aar-by
inginebe-t to
ichuonr to
e
e
BOEZIO et al. PHYSICAL REVIEW D 67, 072003 ~2003!
m1 could not be safely separated from protons and hencresults onm1 are presented for this momentum interval. Fthe float data a small contamination of protons was fouand was subtracted. Electrons were efficiently rejected bycalorimeter above 0.53 GeV/c and by the RICH detector below about 5 GeV/c; hence the remaining electron contamnation was negligible.
In the case of pion contamination, there were two typthat could affect our data, namely, those which were pduced in the gondola and those produced in the overlyatmosphere. In the first case, pions were produced byinteraction of protons in the gondola and for most momethe pions looked like muons in the RICH detector. This cotamination was significantly smaller in the caseCAPRICE94 since the RICH multiwire proportional chamber covered all the acceptance~in contrast to about 50% foCAPRICE98!, and hence the RICH detector was more ecient in rejecting multiple-particle events. It is importantstress that these contaminations were more abundant b1 GeV/c, because high energy pions are produced in inactions in which the kinematics is unfavorable to have jthat particle alone traverse the apparatus without being
FIG. 12. Criteria used to select positive muons.
FIG. 13. Criteria used to select negative muons.
07200
norde
s-g
hea-f
-
owr-tc-
companied by other charged particles. In the second conly high energy pions~above about 10 GeV! have a smallprobability of reaching the gondola before decaying inmuons in the atmosphere~e.g., see@28#!.
To estimate the contamination of pions we selected inacting hadrons in the calorimeter and by a simulation callated the efficiency and contamination of this selection.simulation was used because it was not possible to seleclean sample of pions with the other detectors except fosmall interval of rigidity with the RICH. However, the datin this small interval were very useful for checking the corectness of the result obtained with the simulation. Thus,selecting interacting pions with the calorimeter and knowthe efficiency of this selection, it was possible to determthe pion contamination in the muon sample. However,cause of the uncertainties in this procedure we decided nopresent results on muons for momentum intervals in whthe estimated contamination exceeded 20% of the msample. The background due to deuterons was very simila
FIG. 14. Selection efficiencies as functions of rigidity for thdata at ground.
FIG. 15. Selection efficiencies as functions of rigidity for thdata during ascent.
3-8
tly
ur
teonrehr
den
cecoe
-nd,
e-a
e
s in
s in
ENERGY SPECTRA OF ATMOSPHERIC MUONS . . . PHYSICAL REVIEW D 67, 072003 ~2003!
that of protons. Helium and heavier nuclei were efficienrejected by thedE/dx selection.
C. Efficiency determination
In order to accurately determine the fluxes of the variotypes of particles, the efficiency of each detector was cafully studied using ground, ascent, and flight data. To demine the efficiency of a given detector, a data set of muwas selected by the remaining detectors. The numbemuons correctly identified by the detector under test dividby the number of events in the data set is the efficiency. Tprocedure was repeated for each detector for a numbediscrete rigidity bins. Using these, the efficiency of eachtector was parametrized to allow an interpolation amobins. This parametrization could introduce systematic untainties on the total efficiency since the parameters wererelated. Thus, the error on the final efficiency was obtainusing the error matrix of the fit for each detector.
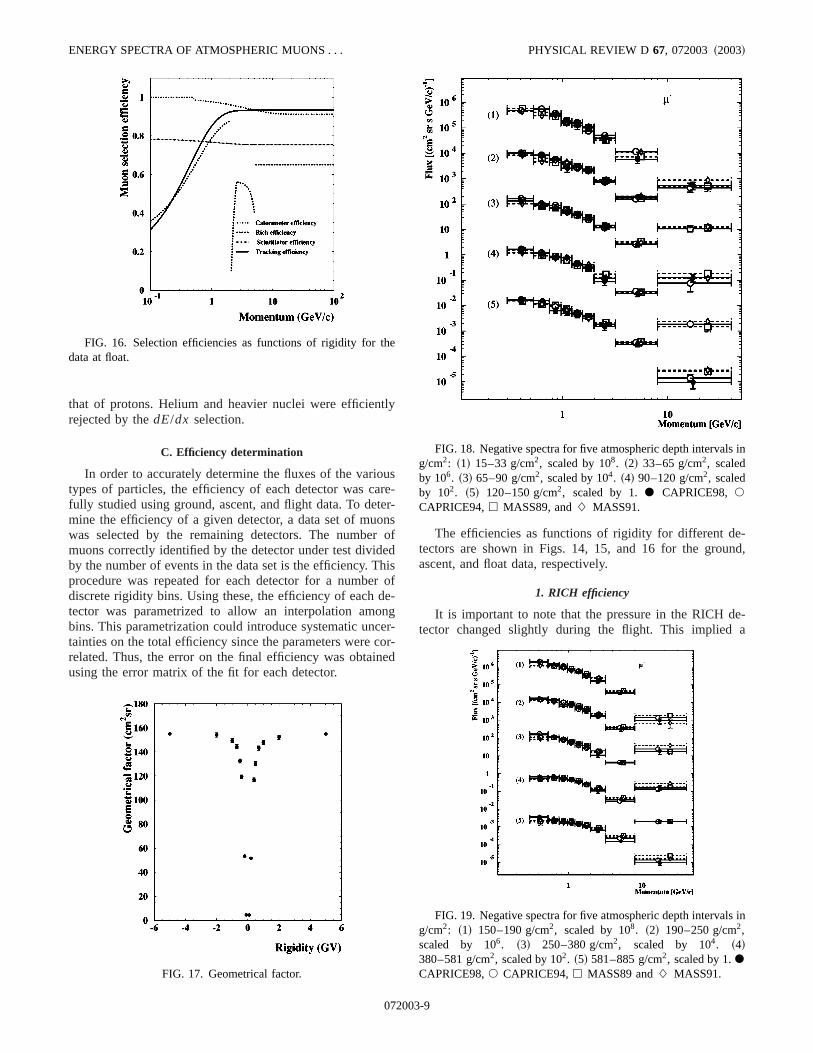
FIG. 16. Selection efficiencies as functions of rigidity for thdata at float.
FIG. 17. Geometrical factor.
07200
se-r-sofdisof-gr-r-d
The efficiencies as functions of rigidity for different detectors are shown in Figs. 14, 15, and 16 for the grouascent, and float data, respectively.
1. RICH efficiency
It is important to note that the pressure in the RICH dtector changed slightly during the flight. This implied
FIG. 18. Negative spectra for five atmospheric depth intervalg/cm2: ~1! 15–33 g/cm2, scaled by 108. ~2! 33–65 g/cm2, scaledby 106. ~3! 65–90 g/cm2, scaled by 104. ~4! 90–120 g/cm2, scaledby 102. ~5! 120–150 g/cm2, scaled by 1.d CAPRICE98, s
CAPRICE94,h MASS89, andL MASS91.
FIG. 19. Negative spectra for five atmospheric depth intervalg/cm2: ~1! 150–190 g/cm2, scaled by 108. ~2! 190–250 g/cm2,scaled by 106. ~3! 250–380 g/cm2, scaled by 104. ~4!380–581 g/cm2, scaled by 102. ~5! 581–885 g/cm2, scaled by 1.dCAPRICE98,s CAPRICE94,h MASS89 andL MASS91.
3-9
heaat
undectesti-ns.r ofas-
um15,ipleosi-
i
i
al
al
BOEZIO et al. PHYSICAL REVIEW D 67, 072003 ~2003!
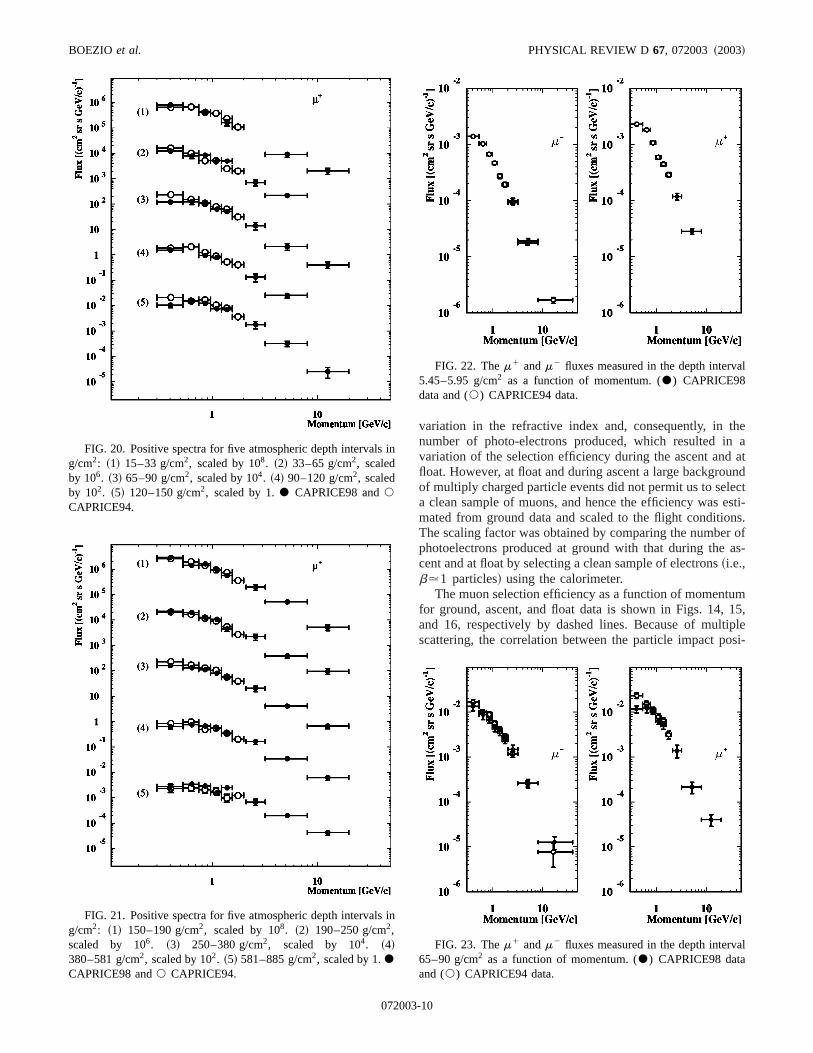
FIG. 20. Positive spectra for five atmospheric depth intervalsg/cm2: ~1! 15–33 g/cm2, scaled by 108. ~2! 33–65 g/cm2, scaledby 106. ~3! 65–90 g/cm2, scaled by 104. ~4! 90–120 g/cm2, scaledby 102. ~5! 120–150 g/cm2, scaled by 1.d CAPRICE98 ands
CAPRICE94.
FIG. 21. Positive spectra for five atmospheric depth intervalsg/cm2: ~1! 150–190 g/cm2, scaled by 108. ~2! 190–250 g/cm2,scaled by 106. ~3! 250–380 g/cm2, scaled by 104. ~4!380–581 g/cm2, scaled by 102. ~5! 581–885 g/cm2, scaled by 1.dCAPRICE98 ands CAPRICE94.
07200
variation in the refractive index and, consequently, in tnumber of photo-electrons produced, which resulted invariation of the selection efficiency during the ascent andfloat. However, at float and during ascent a large backgroof multiply charged particle events did not permit us to sela clean sample of muons, and hence the efficiency wasmated from ground data and scaled to the flight conditioThe scaling factor was obtained by comparing the numbephotoelectrons produced at ground with that during thecent and at float by selecting a clean sample of electrons~i.e.,b.1 particles! using the calorimeter.
The muon selection efficiency as a function of momentfor ground, ascent, and float data is shown in Figs. 14,and 16, respectively by dashed lines. Because of multscattering, the correlation between the particle impact p
n
n
FIG. 22. Them1 andm2 fluxes measured in the depth interv5.45–5.95 g/cm2 as a function of momentum. (d) CAPRICE98data and (s) CAPRICE94 data.
FIG. 23. Them1 andm2 fluxes measured in the depth interv65–90 g/cm2 as a function of momentum. (d) CAPRICE98 dataand (s) CAPRICE94 data.
3-10
he/vei
4.
s
ota
n
iono
ncr,ertoen
he
onscy
alere
.
ndon-ee-thened
ly,e-enta.
ingdenttheod,ofhe
theec-e-
ex-
all
er
l
ENERGY SPECTRA OF ATMOSPHERIC MUONS . . . PHYSICAL REVIEW D 67, 072003 ~2003!
tion in the RICH detector and the extrapolation from ttracker was decreasing with momenta below about 1 GeVc,and consequently so was the selection efficiency. Howethis condition was not used for the ground data, resultinga higher selection efficiency, as can be seen from Fig. 1
The efficiency drops to almost zero at;2 GeV/c wheremuons start to produce Cherenkov light, as they werelected requiring no light below;2 GeV/c. Above this mo-mentum, the selection is done by Cherenkov angle recstruction and the efficiency increases, reaching a consvalue above 5 GeV/c. Between 3 and 5 GeV/c the effi-ciency decreases because of the additional selection cotion used in this momentum range to reject pions.
2. TOF efficiency
The flight data were not free from some contaminatfrom multiple charged particles produced by interactionscosmic rays in the payload structure. Hence, the efficiecould not be estimated directly from these data. Howevewas found that the performance of the TOF system concing the energy loss selection did not vary from groundfloat data. Thus, the efficiency of this condition was obtainfrom the more statistically significant ground data. In cotrast, it was found that the efficiency of theb selection var-ied during the flight. However, by using the condition on t
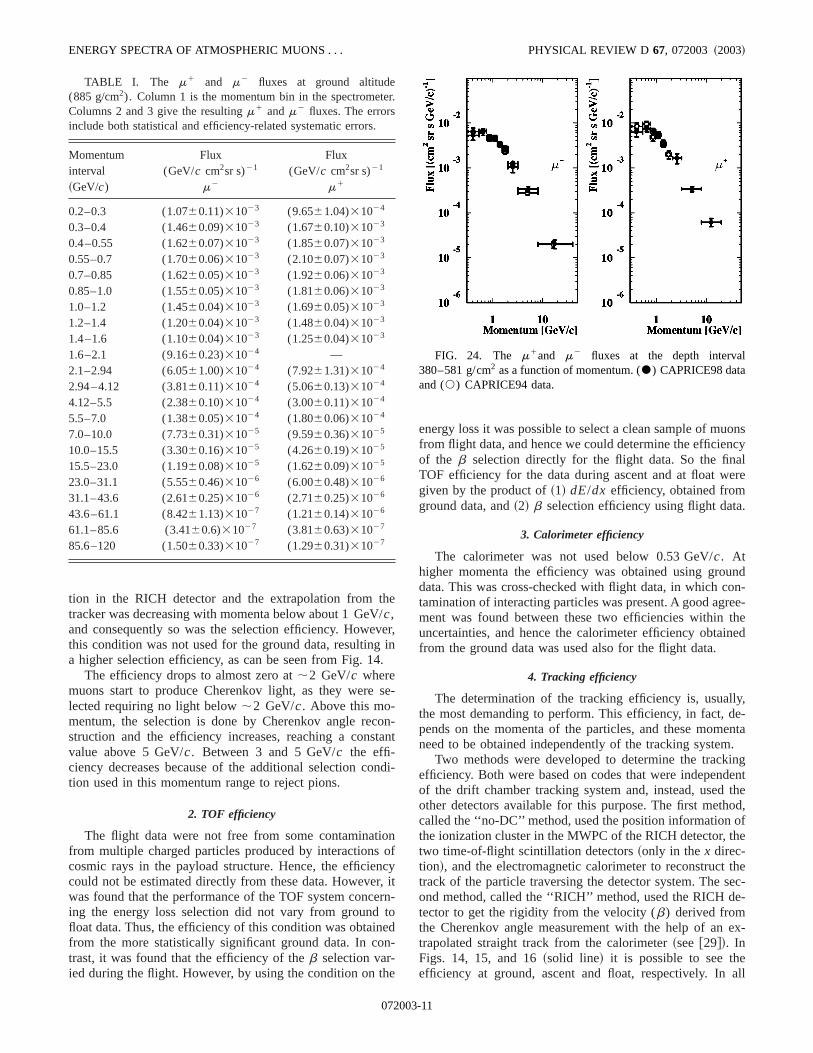
TABLE I. The m1 and m2 fluxes at ground altitude(885 g/cm2). Column 1 is the momentum bin in the spectrometColumns 2 and 3 give the resultingm1 andm2 fluxes. The errorsinclude both statistical and efficiency-related systematic errors.
Momentum Flux Fluxinterval (GeV/c cm2sr s)21 (GeV/c cm2sr s)21
~GeV/c) m2 m1
0.2–0.3 (1.0760.11)31023 (9.6561.04)31024
0.3–0.4 (1.4660.09)31023 (1.6760.10)31023
0.4–0.55 (1.6260.07)31023 (1.8560.07)31023
0.55–0.7 (1.7060.06)31023 (2.1060.07)31023
0.7–0.85 (1.6260.05)31023 (1.9260.06)31023
0.85–1.0 (1.5560.05)31023 (1.8160.06)31023
1.0–1.2 (1.4560.04)31023 (1.6960.05)31023
1.2–1.4 (1.2060.04)31023 (1.4860.04)31023
1.4–1.6 (1.1060.04)31023 (1.2560.04)31023
1.6–2.1 (9.1660.23)31024 —2.1–2.94 (6.0561.00)31024 (7.9261.31)31024
2.94–4.12 (3.8160.11)31024 (5.0660.13)31024
4.12–5.5 (2.3860.10)31024 (3.0060.11)31024
5.5–7.0 (1.3860.05)31024 (1.8060.06)31024
7.0–10.0 (7.7360.31)31025 (9.5960.36)31025
10.0–15.5 (3.3060.16)31025 (4.2660.19)31025
15.5–23.0 (1.1960.08)31025 (1.6260.09)31025
23.0–31.1 (5.5560.46)31026 (6.0060.48)31026
31.1–43.6 (2.6160.25)31026 (2.7160.25)31026
43.6–61.1 (8.4261.13)31027 (1.2160.14)31026
61.1–85.6 (3.4160.6)31027 (3.8160.63)31027
85.6–120 (1.5060.33)31027 (1.2960.31)31027
07200
r,n
e-
n-nt
di-
fyitn-
d-
energy loss it was possible to select a clean sample of mufrom flight data, and hence we could determine the efficienof the b selection directly for the flight data. So the finTOF efficiency for the data during ascent and at float wgiven by the product of~1! dE/dx efficiency, obtained fromground data, and~2! b selection efficiency using flight data
3. Calorimeter efficiency
The calorimeter was not used below 0.53 GeV/c. Athigher momenta the efficiency was obtained using groudata. This was cross-checked with flight data, in which ctamination of interacting particles was present. A good agrment was found between these two efficiencies withinuncertainties, and hence the calorimeter efficiency obtaifrom the ground data was used also for the flight data.
4. Tracking efficiency
The determination of the tracking efficiency is, usualthe most demanding to perform. This efficiency, in fact, dpends on the momenta of the particles, and these momneed to be obtained independently of the tracking system
Two methods were developed to determine the trackefficiency. Both were based on codes that were indepenof the drift chamber tracking system and, instead, usedother detectors available for this purpose. The first methcalled the ‘‘no-DC’’ method, used the position informationthe ionization cluster in the MWPC of the RICH detector, ttwo time-of-flight scintillation detectors~only in thex direc-tion!, and the electromagnetic calorimeter to reconstructtrack of the particle traversing the detector system. The sond method, called the ‘‘RICH’’ method, used the RICH dtector to get the rigidity from the velocity (b) derived fromthe Cherenkov angle measurement with the help of antrapolated straight track from the calorimeter~see@29#!. InFigs. 14, 15, and 16~solid line! it is possible to see theefficiency at ground, ascent and float, respectively. In
.
FIG. 24. The m1and m2 fluxes at the depth interva380–581 g/cm2 as a function of momentum. (d) CAPRICE98 dataand (s) CAPRICE94 data.
3-11
:
BOEZIO et al. PHYSICAL REVIEW D 67, 072003 ~2003!
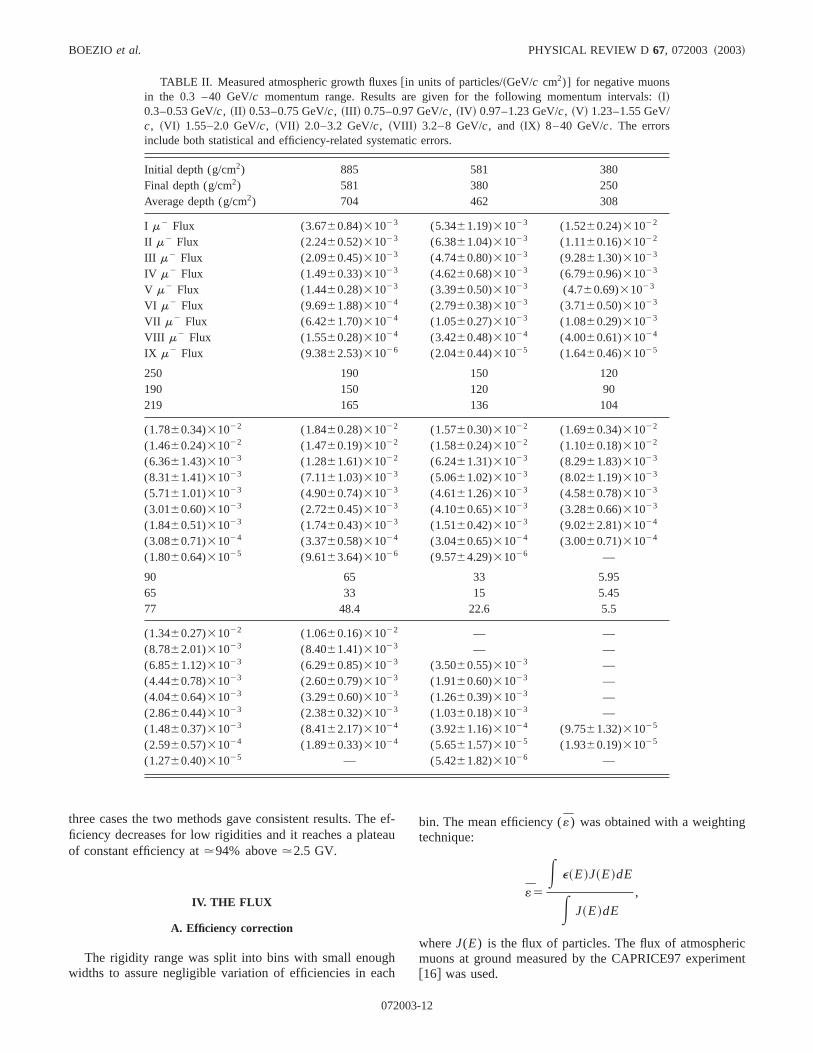
TABLE II. Measured atmospheric growth fluxes@in units of particles/~GeV/c cm2)] for negative muonsin the 0.3 –40 GeV/c momentum range. Results are given for the following momentum intervals~I!0.3–0.53 GeV/c, ~II ! 0.53–0.75 GeV/c, ~III ! 0.75–0.97 GeV/c, ~IV ! 0.97–1.23 GeV/c, ~V! 1.23–1.55 GeV/c, ~VI ! 1.55–2.0 GeV/c, ~VII ! 2.0–3.2 GeV/c, ~VIII ! 3.2–8 GeV/c, and ~IX ! 8–40 GeV/c. The errorsinclude both statistical and efficiency-related systematic errors.
Initial depth (g/cm2) 885 581 380Final depth (g/cm2) 581 380 250Average depth (g/cm2) 704 462 308
I m2 Flux (3.6760.84)31023 (5.3461.19)31023 (1.5260.24)31022
II m2 Flux (2.2460.52)31023 (6.3861.04)31023 (1.1160.16)31022
III m2 Flux (2.0960.45)31023 (4.7460.80)31023 (9.2861.30)31023
IV m2 Flux (1.4960.33)31023 (4.6260.68)31023 (6.7960.96)31023
V m2 Flux (1.4460.28)31023 (3.3960.50)31023 (4.760.69)31023
VI m2 Flux (9.6961.88)31024 (2.7960.38)31023 (3.7160.50)31023
VII m2 Flux (6.4261.70)31024 (1.0560.27)31023 (1.0860.29)31023
VIII m2 Flux (1.5560.28)31024 (3.4260.48)31024 (4.0060.61)31024
IX m2 Flux (9.3862.53)31026 (2.0460.44)31025 (1.6460.46)31025
250 190 150 120190 150 120 90219 165 136 104
(1.7860.34)31022 (1.8460.28)31022 (1.5760.30)31022 (1.6960.34)31022
(1.4660.24)31022 (1.4760.19)31022 (1.5860.24)31022 (1.1060.18)31022
(6.3661.43)31023 (1.2861.61)31022 (6.2461.31)31023 (8.2961.83)31023
(8.3161.41)31023 (7.1161.03)31023 (5.0661.02)31023 (8.0261.19)31023
(5.7161.01)31023 (4.9060.74)31023 (4.6161.26)31023 (4.5860.78)31023
(3.0160.60)31023 (2.7260.45)31023 (4.1060.65)31023 (3.2860.66)31023
(1.8460.51)31023 (1.7460.43)31023 (1.5160.42)31023 (9.0262.81)31024
(3.0860.71)31024 (3.3760.58)31024 (3.0460.65)31024 (3.0060.71)31024
(1.8060.64)31025 (9.6163.64)31026 (9.5764.29)31026 —
90 65 33 5.9565 33 15 5.4577 48.4 22.6 5.5
(1.3460.27)31022 (1.0660.16)31022 — —(8.7862.01)31023 (8.4061.41)31023 — —(6.8561.12)31023 (6.2960.85)31023 (3.5060.55)31023 —(4.4460.78)31023 (2.6060.79)31023 (1.9160.60)31023 —(4.0460.64)31023 (3.2960.60)31023 (1.2660.39)31023 —(2.8660.44)31023 (2.3860.32)31023 (1.0360.18)31023 —(1.4860.37)31023 (8.4162.17)31024 (3.9261.16)31024 (9.7561.32)31025
(2.5960.57)31024 (1.8960.33)31024 (5.6561.57)31025 (1.9360.19)31025
(1.2760.40)31025 — (5.4261.82)31026 —
eea
hc
icent
three cases the two methods gave consistent results. Thficiency decreases for low rigidities and it reaches a platof constant efficiency at.94% above.2.5 GV.
IV. THE FLUX
A. Efficiency correction
The rigidity range was split into bins with small enougwidths to assure negligible variation of efficiencies in ea
07200
ef-u
h
bin. The mean efficiency («) was obtained with a weightingtechnique:
«5
E e~E!J~E!dE
E J~E!dE
,
whereJ(E) is the flux of particles. The flux of atmosphermuons at ground measured by the CAPRICE97 experim@16# was used.
3-12

ENERGY SPECTRA OF ATMOSPHERIC MUONS . . . PHYSICAL REVIEW D 67, 072003 ~2003!
TABLE III. Measured atmospheric growth fluxes@in units of particles/ (GeV/c cm2)] for positive muonsin the 0.3–20 GeV/c momentum range. Results are given for the following momentum intervals:~I! 0.3–0.53GeV/c, ~II ! 0.53–0.75 GeV/c, ~III ! 0.75–0.97 GeV/c, ~IV ! 0.97–1.23 GeV/c, ~V! 1.23–1.55 GeV/c, ~VI !1.55–2.1 GeV/c, ~VII ! 2.1–3.2 GeV/c, ~VIII ! 3.2–8 GeV/c, and~IX ! 8–20 GeV/c. The errors include bothstatistical and efficiency-related systematic errors.
Initial depth (g/cm2) 885 581 380Final depth (g/cm2) 581 380 250Average depth (g/cm2) 704 462 308
I m1 Flux (2.8160.74)31023 (6.2061.31)31023 (1.5860.25)31022
II m1 Flux (3.4660.65)31023 (7.4461.13)31023 (1.3060.17)31022
III m1 Flux (2.8860.53)31023 (6.6560.95)31023 (1.1060.14)31022
IV m1 Flux (1.5860.34)31023 (5.5760.75)31023 (7.9361.05)31023
V m1 Flux (2.4760.37)31023 (3.4260.51)31023 (5.7360.77)31023
VI m1 Flux — — —VII m1 Flux (6.8361.89)31024 (1.6660.41)31023 (2.0160.51)31023
VIII m1 Flux (1.9860.31)31024 (3.4260.48)31024 (4.0860.62)31024
IX m1 Flux (4.2860.89)31025 (6.1961.25)31025 (6.7161.51)31025
250 190 150 120190 150 120 90219 165 136 104
(2.2060.39)31022 (2.8860.36)31022 (1.0760.24)31022 (1.5660.30)31022
(1.9660.29)31022 (1.4260.19)31022 (1.5060.23)31022 —(1.2560.20)31022 (1.6160.18)31022 (1.2560.23)31022 (9.4361.51)31023
(1.0560.16)31022 (9.5161.20)31023 (7.5361.26)31023 (7.7261.18)31023
(4.4460.91)31023 (5.5360.80)31023 (6.9761.05)31023 —— — — —
(2.2060.62)31023 (1.9960.51)31023 (1.8260.59)31023 (1.3260.46)31023
(3.8760.80)31024 (5.1360.72)31024 (3.2060.80)31024 (2.5960.56)31024
(9.5762.41)31025 (5.1161.38)31025 (2.5361.14)31025 —
90 65 33 5.9565 33 15 5.4577 48.4 22.6 5.5
(1.1760.21)31022 (1.2160.19)31022 (7.9561.52)31023 —(1.2260.26)31022 (7.7561.61)31023 — —(1.1060.17)31022 (8.3961.00)31023 (4.2360.86)31023 —(6.3560.94)31023 (5.0560.67)31023 — —(5.1261.00)31023 (4.9660.57)31023 (1.6060.43)31023 —
— — — —(1.3960.43)31023 (7.0762.04)31024 — (1.1960.16)31024
(2.1360.61)31024 (2.1960.36)31024 (9.1062.05)31025 (2.8660.290.34)31025
(4.0461.18)31025 — (2.0460.58)31025 —
toeed
cn
atatwohecu-al-
rlok-esr is
B. Energy loss corrections
When particles traverse the gondola and the detecdown to the level of the spectrometer, they lose energy duionization. The width of the momentum bin was correctfor these ionization losses.
C. Dead time and geometrical factor
The live time (Tli ve) was calculated by multiplying theeffective exposure time by the fractional live time. The frational live time was given by two scalers in the payload: o
07200
rsto
-e
continually running and the other running only when the dacquisition system was not busy. The ratio between thesescalers is the fractional live time of the experiment. For tmuons in the atmosphere, the fractional live time was callated for every interval of time during the ascent of the bloon ~the intervals of time are related to the altitude!.
The geometrical factor was obtained with Monte Catechniques@30#; the simulation implemented the same tracfitting algorithm used in the analysis to trace particlthrough the spectrometer. The resulting geometrical factopresented in Fig. 17.
3-13
ay
le
naersffi
theth0%ctinto
ithetria
theedesra
thn
sictri
a
le Ial inc-
ionnt
rome
A-
mi-–8.two
tethas
ofteis-8,uoncs
edata
–heheal-ishnd
ion
euldthe
.
BOEZIO et al. PHYSICAL REVIEW D 67, 072003 ~2003!
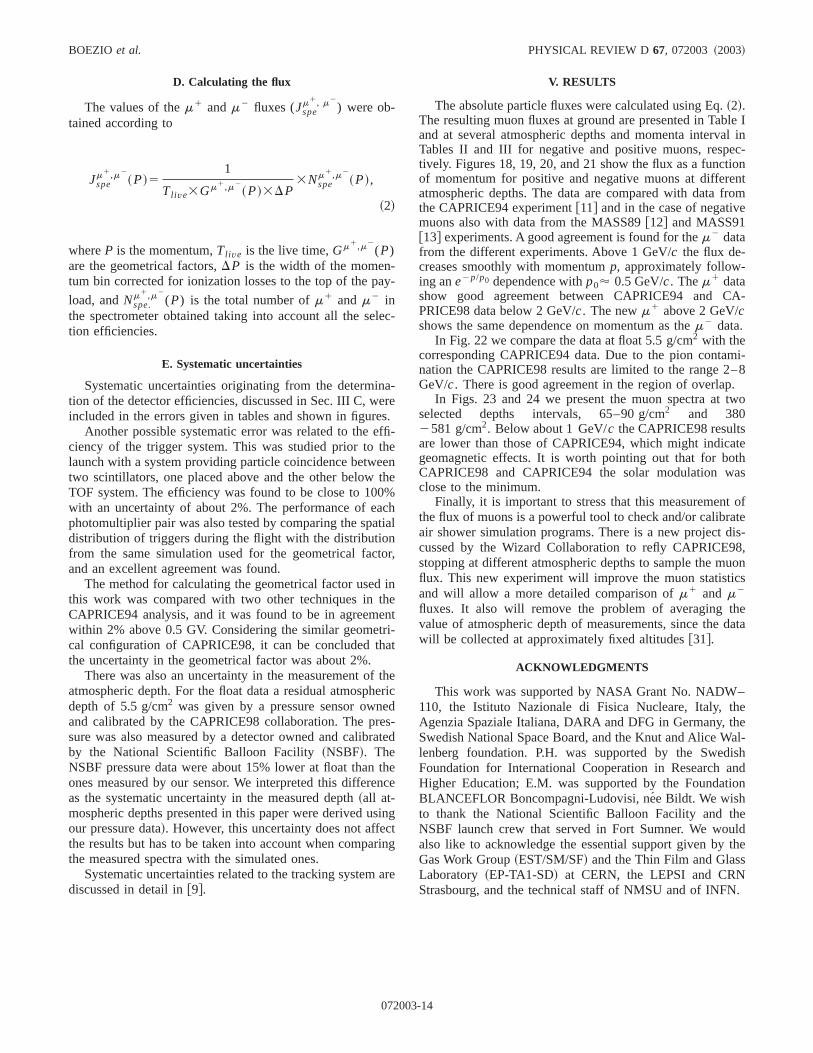
D. Calculating the flux
The values of them1 andm2 fluxes (Jspem1, m2
) were ob-tained according to
Jspem1,m2
~P!51
Tli ve3Gm1,m2~P!3DP
3Nspem1,m2
~P!,
~2!
whereP is the momentum,Tli ve is the live time,Gm1,m2(P)
are the geometrical factors,DP is the width of the momen-tum bin corrected for ionization losses to the top of the p
load, andNspe.m1,m2
(P) is the total number ofm1 andm2 inthe spectrometer obtained taking into account all the setion efficiencies.
E. Systematic uncertainties
Systematic uncertainties originating from the determition of the detector efficiencies, discussed in Sec. III C, wincluded in the errors given in tables and shown in figure
Another possible systematic error was related to the eciency of the trigger system. This was studied prior tolaunch with a system providing particle coincidence betwetwo scintillators, one placed above and the other belowTOF system. The efficiency was found to be close to 10with an uncertainty of about 2%. The performance of eaphotomultiplier pair was also tested by comparing the spadistribution of triggers during the flight with the distributiofrom the same simulation used for the geometrical facand an excellent agreement was found.
The method for calculating the geometrical factor usedthis work was compared with two other techniques inCAPRICE94 analysis, and it was found to be in agreemwithin 2% above 0.5 GV. Considering the similar geomecal configuration of CAPRICE98, it can be concluded ththe uncertainty in the geometrical factor was about 2%.
There was also an uncertainty in the measurement ofatmospheric depth. For the float data a residual atmosphdepth of 5.5 g/cm2 was given by a pressure sensor ownand calibrated by the CAPRICE98 collaboration. The prsure was also measured by a detector owned and calibby the National Scientific Balloon Facility~NSBF!. TheNSBF pressure data were about 15% lower at float thanones measured by our sensor. We interpreted this differeas the systematic uncertainty in the measured depth~all at-mospheric depths presented in this paper were derived uour pressure data!. However, this uncertainty does not affethe results but has to be taken into account when compathe measured spectra with the simulated ones.
Systematic uncertainties related to the tracking systemdiscussed in detail in@9#.
07200
-
c-
-e.-
ene
hal
r,
nent-t
eric
-ted
ece
ng
ng
re
V. RESULTS
The absolute particle fluxes were calculated using Eq.~2!.The resulting muon fluxes at ground are presented in Taband at several atmospheric depths and momenta intervTables II and III for negative and positive muons, respetively. Figures 18, 19, 20, and 21 show the flux as a functof momentum for positive and negative muons at differeatmospheric depths. The data are compared with data fthe CAPRICE94 experiment@11# and in the case of negativmuons also with data from the MASS89@12# and MASS91@13# experiments. A good agreement is found for them2 datafrom the different experiments. Above 1 GeV/c the flux de-creases smoothly with momentump, approximately follow-ing ane2p/p0 dependence withp0' 0.5 GeV/c. Them1 datashow good agreement between CAPRICE94 and CPRICE98 data below 2 GeV/c. The newm1 above 2 GeV/cshows the same dependence on momentum as them2 data.
In Fig. 22 we compare the data at float 5.5 g/cm2 with thecorresponding CAPRICE94 data. Due to the pion contanation the CAPRICE98 results are limited to the range 2GeV/c. There is good agreement in the region of overlap
In Figs. 23 and 24 we present the muon spectra atselected depths intervals, 65–90 g/cm2 and 3802581 g/cm2. Below about 1 GeV/c the CAPRICE98 resultsare lower than those of CAPRICE94, which might indicageomagnetic effects. It is worth pointing out that for boCAPRICE98 and CAPRICE94 the solar modulation wclose to the minimum.
Finally, it is important to stress that this measurementthe flux of muons is a powerful tool to check and/or calibraair shower simulation programs. There is a new project dcussed by the Wizard Collaboration to refly CAPRICE9stopping at different atmospheric depths to sample the mflux. This new experiment will improve the muon statistiand will allow a more detailed comparison ofm1 and m2
fluxes. It also will remove the problem of averaging thvalue of atmospheric depth of measurements, since thewill be collected at approximately fixed altitudes@31#.
ACKNOWLEDGMENTS
This work was supported by NASA Grant No. NADW110, the Istituto Nazionale di Fisica Nucleare, Italy, tAgenzia Spaziale Italiana, DARA and DFG in Germany, tSwedish National Space Board, and the Knut and Alice Wlenberg foundation. P.H. was supported by the SwedFoundation for International Cooperation in Research aHigher Education; E.M. was supported by the FoundatBLANCEFLOR Boncompagni-Ludovisi, ne´e Bildt. We wishto thank the National Scientific Balloon Facility and thNSBF launch crew that served in Fort Sumner. We woalso like to acknowledge the essential support given byGas Work Group~EST/SM/SF! and the Thin Film and GlassLaboratory ~EP-TA1-SD! at CERN, the LEPSI and CRNStrasbourg, and the technical staff of NMSU and of INFN
3-14
rind
ic,
ic
y,://
ev.
y,e/
l
ENERGY SPECTRA OF ATMOSPHERIC MUONS . . . PHYSICAL REVIEW D 67, 072003 ~2003!
@1# Y. Fukudaet al., Phys. Rev. Lett.81, 1562~1998!.@2# W. W. M. Allison et al., Phys. Lett. B391, 491 ~1997!; ibid.
449, 137 ~1999!.@3# M. Ambrosioet al., Phys. Lett. B434, 451 ~1998!.@4# T. Gaisser, hep-ph/0209195.@5# P. Carlson, P. Hansen, and S. Sciutto, ‘‘Flux of Atmosphe
Muons: Comparison between AIRES Simulation aCAPRICE98 Data’’~in preparation!.
@6# S. J. Sciutto, inProceedings of the 27th International CosmRay Conference, Hamburg ~Schaltungsdienst Lange, Berlin2001!, Vol. 1, p. 237.
@7# T. K. Gaisseret al., Phys. Rev. D54, 5578 ~1996!; see alsoNucl. Phys. B~Proc. Suppl.! 77, 133 ~1999!; M. Honda,ibid.77, 140 ~1999!.
@8# T. Gaisser and M. Honda, hep-ph/0203272.@9# M. Boezio et al., Astropart. Phys. ~to be published!,
astro-ph/0212253.@10# G. Barret al., in Proceedings of the 27th International Cosm
Ray Conference, Hamburg@6#, Vol. 1, p. 1585.@11# M. Boezioet al., Phys. Rev. Lett.82, 4757~1999!; Phys. Rev.
D 62, 032007~2000!.@12# R. Bellotti et al., Phys. Rev. D53, 35 ~1996!.@13# R. Bellotti et al., Phys. Rev. D60, 052002~1999!.@14# S. Coutuet al., Phys. Rev. D62, 032001~2000!.@15# T. Sanukiet al., Phys. Lett. B541, 234 ~2002!.@16# J. Kremeret al., Phys. Rev. Lett.83, 4241~1999!.@17# M. L. Ambriola et al., Nucl. Phys.B78, 32 ~1999!.@18# M. Boezioet al., Adv. Space Res.27, 669 ~2001!.
07200
c
@19# M. Circella et al., Adv. Space Res.27, 755 ~2001!.@20# M. Boezio et al., Astrophys. J.56, 787 ~2001!; D. Bergstrom
et al., Astrophys. J. Lett.534, L177 ~2000!.@21# P. Carlsonet al., Nucl. Instrum. Methods Phys. Res. A349,
577 ~1994!; G. Barbiellini et al., ibid. 371, 169 ~1996!.@22# T. Franckeet al., Nucl. Instrum. Methods Phys. Res. A433, 87
~1999!.@23# D. Bergstrom et al., Nucl. Instrum. Methods Phys. Res. A463,
161 ~2001!.@24# D. Bergstrom, Licentiat Thesis, Royal Institute of Technolog
Stockholm, 2000, available electronically at httpwww.particle.kth.se/group_docs/admin/theses.html#lic
@25# R. L. Goldenet al., Nucl. Instrum. Methods148, 179 ~1978!.@26# M. Hof et al., Nucl. Instrum. Methods Phys. Res. A345, 561
~1994!.@27# M. Bocciolini et al., Nucl. Instrum. Methods Phys. Res. A370,
403 ~1996!; ibid. 333, 77 ~1993!; M. Ricci et al., in Proceed-ings of the 26th International Cosmic Ray Conference, SaltLake City ~University of Utah Press, Salt Lake City, 1999!,Vol. 5, p. 49.
@28# G. D. Badhwar, S. A. Stephens, and R. L. Golden, Phys. RD 15, 820 ~1977!.
@29# D. Bergstrom, Ph.D. Thesis, Royal Institute of TechnologStockholm, 2001, available at http://www.particle.kth.sgroup_docs/admin/theses.html#phd
@30# J. D. Sullivan, Nucl. Instrum. Methods95, 5 ~1971!.@31# M. Circella et al., in Proceedings of the 27th Internationa
Cosmic Ray Conference, Hamburg@6#, Vol. 1, p. 1251.
3-15
Copyright © 2022 FDOKUMEN