Assessment of venous thromboembolism risk and the benefits of thromboprophylaxis in medical patients
Upload
independentCategory
view
6download
0
Int. J. Environ. Res. Public Health 2012, 9, 4311-4320; doi:10.3390/ijerph9124311
International Journal of
Environmental Research and Public Health
ISSN 1660-4601 www.mdpi.com/journal/ijerph
Communication
The Association between Cardiovascular Disease Risk and Parental Educational Level in Portuguese Children
Michael J. Duncan 1,*, Susana Vale 2, Maria Paula Santos 2, José Carlos Ribeiro 2 and
Jorge Mota 2
1 Sport and Exercise Applied Research Group, Faculty of Health and Life Sciences, Coventry
University, Priory Street, Coventry CV11 5FB, UK 2 Research Centre in Physical Activity Health and Leisure, Faculty of Sports Sciences and Physical
Education, University of Porto, Porto 4200-450, Portugal;
E-Mails: [email protected] (S.V.); [email protected] (M.P.S.);
[email protected] (J.C.R.); [email protected] (J.M.)
* Author to whom correspondence should be addressed; E-Mail: [email protected];
Tel.: +44-24-7688-8613.
Received: 4 September 2012; in revised form: 19 November 2012 / Accepted: 20 November 2012 /
Published: 27 November 2012
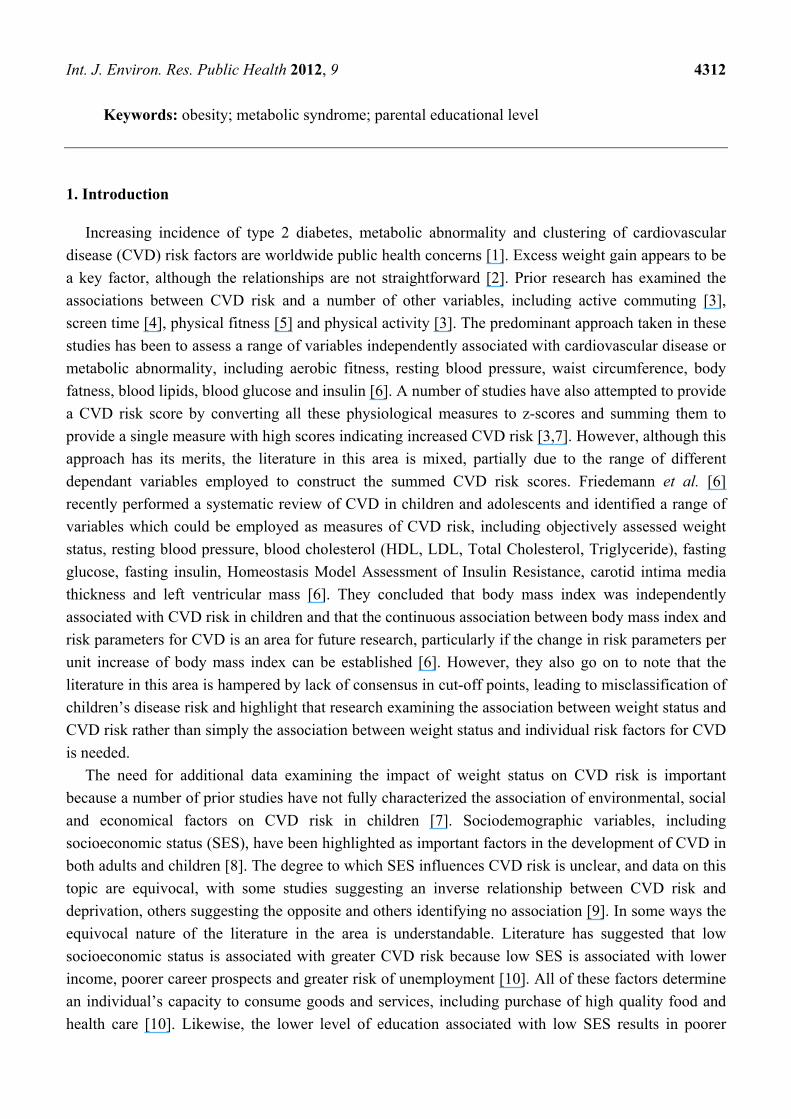
Abstract: The aim of this study was to examine any differences in cardiovascular disease
(CVD) risk in Portuguese children split by parental educational level. A cross-sectional
school-based study was conducted in 2011 on 359 Portuguese children (202 girls and 157
boys) aged 10 to 17 years (mean age ± SD = 13.9 ± 1.98 years). Height and body mass were
assessed to determine body mass index (BMI). Parental education level (PEL) was used as a
surrogate for socioeconomic status (SES). Capillary blood sampling was used to determine:
Total Cholesterol (TC), Triglycerides (TG), Fasting Glucos (GLUC), High and Low
Density Lipoprotein (HDL/LDL). These measurements were combined with measures of
systolic blood pressure and cardiorespiratory fitness as z-scores. CVD risk was constructed by
summing the z-scores. Analysis of covariance, controlling for BMI, indicated that CVD
risk was significantly different across PEL groups (p = 0.01), with CVD risk score being
significantly lower in low (p = 0.04) and middle (p = 0.008) PEL groups, compared to high
PEL. Moreover, the covariate, BMI was also significant (p = 0.0001, β = 0.023),
evidencing a significant positive association between BMI and CVD risk, with higher BMI
associated with greater CVD risk. In Portuguese children, significantly greater CVD risk was
found for children of high PEL, while higher BMI was associated with greater CVD risk.
OPEN ACCESS
Int. J. Environ. Res. Public Health 2012, 9 4312
Keywords: obesity; metabolic syndrome; parental educational level
1. Introduction
Increasing incidence of type 2 diabetes, metabolic abnormality and clustering of cardiovascular
disease (CVD) risk factors are worldwide public health concerns [1]. Excess weight gain appears to be
a key factor, although the relationships are not straightforward [2]. Prior research has examined the
associations between CVD risk and a number of other variables, including active commuting [3],
screen time [4], physical fitness [5] and physical activity [3]. The predominant approach taken in these
studies has been to assess a range of variables independently associated with cardiovascular disease or
metabolic abnormality, including aerobic fitness, resting blood pressure, waist circumference, body
fatness, blood lipids, blood glucose and insulin [6]. A number of studies have also attempted to provide
a CVD risk score by converting all these physiological measures to z-scores and summing them to
provide a single measure with high scores indicating increased CVD risk [3,7]. However, although this
approach has its merits, the literature in this area is mixed, partially due to the range of different
dependant variables employed to construct the summed CVD risk scores. Friedemann et al. [6]
recently performed a systematic review of CVD in children and adolescents and identified a range of
variables which could be employed as measures of CVD risk, including objectively assessed weight
status, resting blood pressure, blood cholesterol (HDL, LDL, Total Cholesterol, Triglyceride), fasting
glucose, fasting insulin, Homeostasis Model Assessment of Insulin Resistance, carotid intima media
thickness and left ventricular mass [6]. They concluded that body mass index was independently
associated with CVD risk in children and that the continuous association between body mass index and
risk parameters for CVD is an area for future research, particularly if the change in risk parameters per
unit increase of body mass index can be established [6]. However, they also go on to note that the
literature in this area is hampered by lack of consensus in cut-off points, leading to misclassification of
children’s disease risk and highlight that research examining the association between weight status and
CVD risk rather than simply the association between weight status and individual risk factors for CVD
is needed.
The need for additional data examining the impact of weight status on CVD risk is important
because a number of prior studies have not fully characterized the association of environmental, social
and economical factors on CVD risk in children [7]. Sociodemographic variables, including
socioeconomic status (SES), have been highlighted as important factors in the development of CVD in
both adults and children [8]. The degree to which SES influences CVD risk is unclear, and data on this
topic are equivocal, with some studies suggesting an inverse relationship between CVD risk and
deprivation, others suggesting the opposite and others identifying no association [9]. In some ways the
equivocal nature of the literature in the area is understandable. Literature has suggested that low
socioeconomic status is associated with greater CVD risk because low SES is associated with lower
income, poorer career prospects and greater risk of unemployment [10]. All of these factors determine
an individual’s capacity to consume goods and services, including purchase of high quality food and
health care [10]. Likewise, the lower level of education associated with low SES results in poorer
Int. J. Environ. Res. Public Health 2012, 9 4313
knowledge regarding healthy choices in relation to nutrition and physical activity [11], all of which
might contribute to elevated CVD risk in this population. Conversely, authors have suggested that in
developing countries or affluent countries that high SES is associated with increased CVD risk [12].
This is in part due to greater ability to purchase higher density foods [12] and lower levels of physical
activity or increased sedentary behaviours, particularly video game play and television viewing [4,13].
Recent research by Buchan et al. [14] identified that the different independent risk factors for CVD
were associated with SES in different ways, depending on the risk factor being examined. They noted
that high fat diets, low levels of physical activity elevated C-Reactive protein and higher levels of
blood cholesterol were the factors most likely to be associated with CVD risk, irrespective of SES, but
that elevated CVD risk is seen in both high and low SES adolescents who exhibit poor nutritional
behavior and low levels of physical activity [14].
The equivocal nature of the extant data relating to differences in CVD risk between socioeconomic
status groups is not unexpected, as this association varies depending on the societal structure in place,
the overall economic development of the geographical area being examined, as well as other cultural
factors that may impact on a particular SES group in any particular country [7,9,11,15]. It is likely that
any relationship between SES and CVD risk is dynamic and will vary across countries. While there is
considerable information in relation to the United States [8] and the United Kingdom [15], fewer data
are available for other countries, including Portugal [16]. However, the majority of studies have
evidenced that in developed countries low SES is associated with greater CVD risk [8,15], unlike low
or middle income countries, where the reverse is true [12]. As CVD begins in childhood [17], there is
need to understand how factors such as SES impact on these disease processes specific to individual
countries of geographical areas so preventive interventions can be targeted. The aim of this study was
to examine any SES differences in CVD risk in Portuguese children.
2. Methods
2.1. Participants
A total of four secondary schools in the Porto district were invited to participate in this study.
Details on the study design and sampling strategy are reported elsewhere [18]. Following informed
consent, 359 adolescents (202 girls and 157 boys) aged 10 to 17 years (mean age ± SD = 13.9 ± 1.98 years)
participated in the study following ethics approval by the faculty and the Portuguese Foundation for
Science and Technology ethics committees.
2.2. Anthropometric Measures
Height (to the nearest millimeter) and body mass (to the nearest 0.1 kg) were assessed using a
stadiometre (Holtain Ltd., Crymmych, Pembrokeshire, UK) and weight scale (Seca 708 portable
digital beam scale, Hamburg, Germnay) with participants in bare feet and lightly dressed. Body mass
index (BMI) was determined in kg/m2 units.
Int. J. Environ. Res. Public Health 2012, 9 4314
2.3. Blood Sampling
Capillary blood samples of participants were taken from the earlobe after at least 12 hours fasting to
obtain values of plasmatic total cholesterol (TC), high density lipoprotein cholesterol (HDL),
triglycerides (TG), and fasting glucose (GLUC). Low density lipoprotein (LDL) was estimated using
the Friedewald equation [19]. The blood samples were assayed using a Cholestech LDX® Analyser
(Cholestech Corporation, Hayward, CA, USA) as this analyser is valid for population-based screening
of cardiovascular risks factors [20].
2.4. Blood Pressure
Blood pressure (BP) was measured using the Dinamap (BP8800) adult/pediatric and neonatal vital
signs monitors (GE Healthcare, Little Chalfont, UK). Measurements were taken in seated posture after
at least 5 min rest. Two measurements were taken and the mean of these two measurements was used
for statistical analysis following procedures established previously [21].
2.5. Measurement of Cardiorespiratory Fitness
Cardiorespiratory fitness (CRF) was predicted using the multistage 20 m shuttle-run test [22] due to
its significant correlation with VO2max (r = 0.80) in young people [23]. Participants were familiarized
with the procedure for each test before recording data and received verbal encouragement from the
investigators throughout with VO2 max being estimated from the number of shuttles performed.
2.6. Cardiovascular Risk Score
Given the lack of a universal definition for CVD risk in children and adolescents [24] we decided to
compute a continuous risk score from the following measurements: TC; GLU; HDL; LDL; TG and
systolic blood pressure (SBP). For each of these variables, a z-score was computed as the number of
SD units from the sample mean after normalization of the variables, i.e., z = ([value – mean]/SD). The
HDL-C z-score was multiplied by –1 to indicate higher CVD risk with increasing value. z scores by
age were computed for all risk factors. Then, CVD risk was constructed by summing the z scores of all
individual risk factors. A lower CVD risk score is indicative of a better overall CVD risk factor profile.
The basis for the construction for the CVD risk score was based on prior studies which have used a
similar methodology of combining measures independently related to CVD risk and combining these
as z-scores, similar to the idea proposed by Andersen et al. [25]. However, different authors have used
a different combination of measures in constructing their CVD risk scores [3,7,15,18,25]. As there is
no current consensus as to which variables best relate to CVD risk the process described above was
based on using variables identified by Friedemann et al. [6] as being directly related to CVD risk in
children.
2.7. Socioeconomic Status
Parent’s educational level (PEL) was employed as a proxy for SES, using categories based on the
Portuguese Educational System: (1) 9 years education or less—subsecondary level; (2) 10–12 years
Int. J. Environ. Res. Public Health 2012, 9 4315
education—secondary level and (3) College/Master/Doctoral degree—higher education level. These
three levels were classified as low, middle and high levels of education, similar to procedures that have
previously been applied in the Portuguese context [26,27].
2.8. Statistical Analysis
A 2 (gender) by 3 (PEL) ways analysis of covariance (ANCOVA), controlling for BMI and CRF
was used to examine any differences in CVD risk score across gender and SES groups whilst
controlling for weight status and cardiorespiratory fitness. In the present study BMI was used as a
covariate in the analysis as BMI has been associated with CVD risk in children independent of the
other variables assessed in this study. The use of ANCOVA in the analysis also enables any
differences between CVD risk between PEL groups to be analysed controlling for any impact of
weight status, whilst at the same time enabling the association between the dependant variable (CVD
risk) and the covariate to be determined [28]. Separate repeated measures ANOVAs were also
employed for individual variables within the CVD risk score to examine whether there were any
differences in these variables between PEL groups. Where any significant differences were detected
Bonferroni post-hoc multiple comparisons were used to assess where the differences lay. Statistical
significance was set at 0.05 and the Statistical package for Social Sciences (SPSS, Version 18, SPSS
Inc., Chicago, IL, USA) was used for all analysis.
3. Results
Results from the ANCOVA for CVD Risk indicated that there were no higher order interactions and
there was no significant gender main effect (p > 0.05). There was a significant main effect for PEL
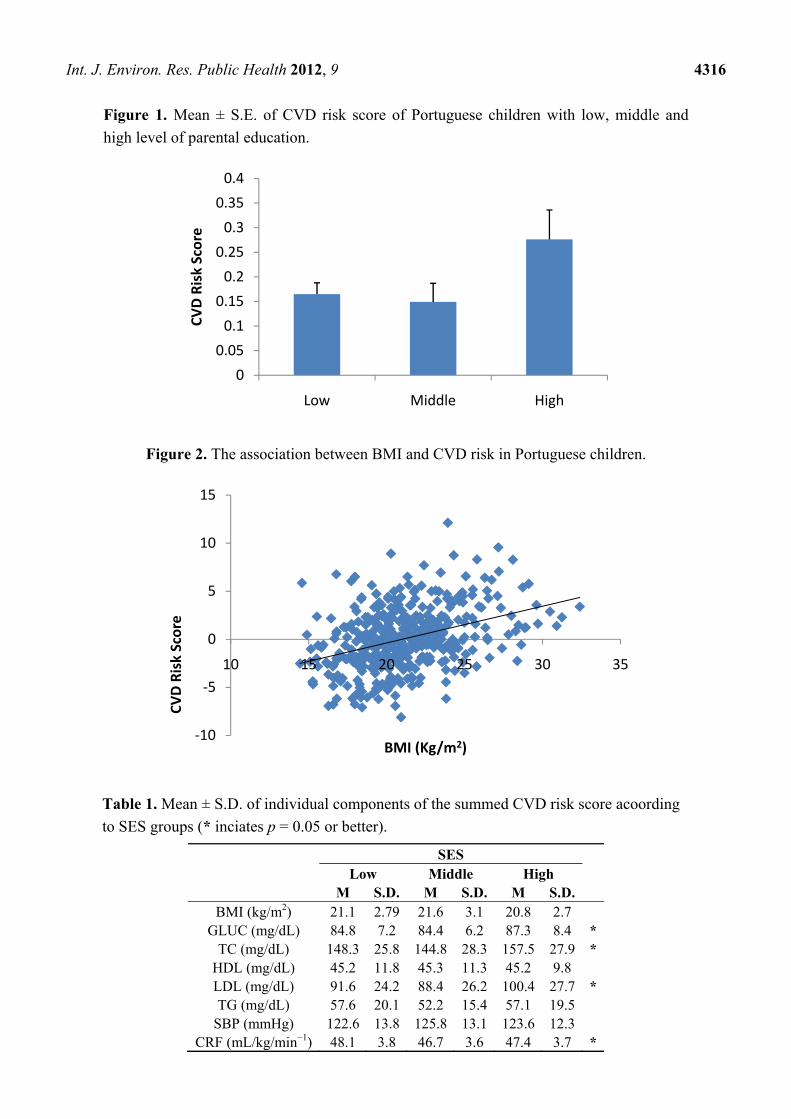
(p = 0.019). Bonferroni post hoc multiple comparisons indicated that CVD risk score was significantly
lower in low (p = 0.024) and middle (p = 0.005) PEL compared to high PEL (see Figure 1). There was
no significant difference in CVD risk score between low and middle PEL (p > 0.05). Moreover, the
covariate, BMI was also significant (p = 0.0001, β = 0.023) evidencing a significant positive
association between BMI and CVD risk with higher BMI associated with greater CVD risk (see Figure 2).
CRF was not significant as a covariate (p > 0.05). Mean ± S.D. of individual components of the
summed CVD risk score acoording to PEL groups is presented in Table 1. Repeated measures
ANOVAs for each of the component variables that compried the CVD risk score also indicated
significantly higher TC in High PEL compared to middle PEL Level children (p = 0.02). LDL was also
significantly higher in the high PEL compared to the low (p = 0.045) and middle (p = 0.015) PEL
group. The same trend was also evident for GLUC with values being significantly higher in high PEL
children compared to low (p = 0.045) and middle PEL (p = 0.039) children. Values for CRF were also
significantly lower for children from middle PEL compared to those from a low PEL (p = 0.027).
Int. J. Environ. Res. Public Health 2012, 9 4316
Figure 1. Mean ± S.E. of CVD risk score of Portuguese children with low, middle and
high level of parental education.
Figure 2. The association between BMI and CVD risk in Portuguese children.
Table 1. Mean ± S.D. of individual components of the summed CVD risk score acoording
to SES groups (* inciates p = 0.05 or better).
SES Low Middle High M S.D. M S.D. M S.D.
BMI (kg/m2) 21.1 2.79 21.6 3.1 20.8 2.7 GLUC (mg/dL) 84.8 7.2 84.4 6.2 87.3 8.4 *
TC (mg/dL) 148.3 25.8 144.8 28.3 157.5 27.9 * HDL (mg/dL) 45.2 11.8 45.3 11.3 45.2 9.8 LDL (mg/dL) 91.6 24.2 88.4 26.2 100.4 27.7 * TG (mg/dL) 57.6 20.1 52.2 15.4 57.1 19.5
SBP (mmHg) 122.6 13.8 125.8 13.1 123.6 12.3 CRF (mL/kg/min−1) 48.1 3.8 46.7 3.6 47.4 3.7 *
0
0.05
0.1
0.15
0.2
0.25
0.3
0.35
0.4
Low Middle High
CVD
Ris
k Sc
ore
-10
-5
0
5
10
15
10 15 20 25 30 35
CVD
Ris
k Sc
ore
BMI (Kg/m2)
Int. J. Environ. Res. Public Health 2012, 9 4317
4. Discussion
This study presents data on PEL differences in CVD risk in Portuguese children and adolescents.
The results of this study suggest that PEL impacts CVD risk in this population. Making the assumption
that PEL is a reflection of SES, the current data support assertions made previously using a variety of
other means to determine SES [9], but refute conclusions made by other authors [15]. SES is a
dynamic variable that changes over time and across countries and environments and it is therefore
likely that any effect of SES on CVD risk (or other health indices) needs to be considered in the
context of the location where such data were gathered. In this instance, children with parents who had
a higher education level exhibited higher CVD risk. This is contrary to studies from the US [8], which
reported lower SES to be related to greater CVD risk. However, the current results are congruent with
studies from Brazil [29,30]. Such SES differences are largely attributable to lifestyle factors such as
consumption of more energy dense diets and higher BMI, leading to increased CVD abnormality [8].
Moreover, food availability (in both quantity and quality) at extremes of SES is also a consideration in
terms of the data presented here with higher risk being seen in high SES and low SES (although not
statistically significant) children in this study.
The covariate “BMI” was also significantly associated with CVD risk in the present study. This
finding is not surprising and the association between measures of overweight/obesity and CVD risk
have been reported previously [7]. Furthermore, BMI has been established as an independent risk
factor for CVD in children and prior research suggested it should be analysed alongside, but separate
to other measures of CVD risk [6]. Thuis the current study not only evidences the association between
BMI and CVD risk in Portuguese children and adolescents, but evidences that there are differences in
CVD risk scores between PEL groups when weight status is controlled for within statistical analysis.
However, the data presented here are cross sectional and this limits our ability to determine
causality. There is also a need to understand how SES might influence other variables, including
physical activity, in relation to CVD risk in young people. The present study is therefore limited
because no information other than SES, weight status and physical fitness was used. This should be
considered a limitation and future studies should also look to assess or control for confounding
variables in the SES-CVD relationship, such as diet and physical activity. This study was exploratory
in nature and additional research is needed which examines a wider range or variables including
dietary and physical activity practices of Portuguese children from different SES groups is needed to
more fully understand how SES influences CVD risk. Moreover, a CVD risk score was calculated in
the present study using summed z-scores from a range of variables independently related to
cardiovascular disease in children. This approach was taken following procedures previously used to
indentify CVD risk in children [3,7,18]. However, the most appropriate range of measures best placed
to capture CVD risk in children as a continuous variable is not currently known [6,14]. Furthermore, it
may have been useful to have employed recognized cut-off points for related disease states (e.g.,
metabolic syndrome using NCEP cut-points) in this analysis. However, this approach would have not
enabled use of a continuous risk score. We therefore acknowledge that the CVD risk presented here is
a reflection of the measures combined to create the score. Although the use of a continuous CVD risk
score has been recommended [6] future research would be welcome which determines which
combination of variables best reflect overall CVD risk in children and/or uses other established cut-offs

Int. J. Environ. Res. Public Health 2012, 9 4318
to illustrate the CVD risk-SES relationship. Finally, the use of parental education level, although used
by prior studies [26] as a proxy for SES, is not without criticism and future researchers would benefit
from incorporating multiple indices of SES into one scale in order to provide a more sensitive measure
of SES than that used in the current study. Although prior studies on Portuguese children and
adolescents have used this method [13,17] and the acknowledgement that there is no gold standard for
the assessment of SES in young people [31], the use of parental education as a measure of SES infers
child SES based on their parent’s estimated SES. This method also ignores a number of other key
variables related to SES, and others [32] have suggested that more precise measures of child and
adolescent SES may be better based on indices of multiple deprivation rather than relying solely on
one variable such as is the case in the present study. Furthermore, the method of establishing SES in
the current study might also explain some of the findings with children of highly educated parents
presenting higher CVD risk, presumably due to a high education leading to greater income and thus
more ability to purchase higher density food, greater access to motorized personal transport and
electronic equipment associated with sedentary behavior. We do however acknowledge that this
suggestion is speculative and further research would be needed to substantiate these claims.
5. Conclusions
This study examined the impact of PEL on CVD risk in Portuguese children. In this study,
significantly greater CVD risk was found for children of high PEL after controlling for weight status
and cardiorespiratory fitness. Thus, health related interventions are needed which target this group
specifically. Further research is needed to elucidate the lifestyle variables that result in this difference
risk in Portuguese children.
Conflict of Interest
The authors declare no conflict of interest.
References
1. Weiss, R.; Caprio, S. The metabolic consequences of childhood obesity. Best Pract. Res. Clin.
Endocrinol. Metab. 2005, 19, 405–419.
2. Pontiroli, A.E. Type 2 diabetes mellitus is becoming the most common type of diabetes in school
children. Acta Diabetol. 2004, 41, 85–90.
3. Andersen, L.B.; Wedderkopp, N.; Kristensen, P.; Moller, N.C.; Froberg, K.; Cooper, A.R.
Cycling to school and cardiovascular risk factors: A longitudinal study. J. Phys. Act. Health 2011,
8, 1025–1033.
4. Hardy, L.L.; Denney-Wilson, E.; Thrift, A.P.; Okely, A.D.; Baur, L.A. Screen time and metabolic
risk factors in adolescents. Arch. Pediatr. Adolesc. Med. 2010, 164, 643–649.
5. Wedderkopp, N.; Froberg, K.; Steen Hansen, H.; Riddoch, C.; Bo Andersen, L. Cardiovascular
risk factors cluster in children and adolescents with low physical fitness: The European Youth
Heart Study (EYHS). Ped. Exerc. Sci. 2003, 15, 419–427.
Int. J. Environ. Res. Public Health 2012, 9 4319
6. Friedemann, C.; Henegan, C.; Mahtani, K.; Thompson, M.; Perera, R.; Ward, A.M.
Cardiovascular disease risk in healthy children and its association with body mass index:
Systematic review and meta analysis. BMJ 2012, 345, e4759, doi: 10.1136/bmj.e4759.
7. Moreira, C.; Santos, R.; Vale, S.; Santos, P.C.; Abreu, S.; Marques, A.I.; Soares-Miranda, L.;
Mota, J. Ability of different measures of adiposity to identify high metabolic risk in adolescents.
J. Obes. 2011, 2011, 578106:1–578106:5, doi: 10.1155/2011/578106.
8. Karlamangla, A.S.; Stein Merkin, S.; Crimmins, E.M.; Seeman, T.E. Socio-economic and ethnic
disparities in cardiovascualr risk in the United States, 2001–2006. Ann. Epidemiol. 2010, 20, 617–628.
9. Shrewsbury, V.; Wardle, J. Socio-economic status an adiposity in childhood: A systematic review
of crossectional studies. Obesity 2008, 16, 25–84.
10. Elovainio, M.; Ferrie, J.E.; Singh-Manoux, A.; Shipley, M.; Batty, D.G.; Head, J.; Hamer, M.;
Jokela, M.; Virtanen, M.; Brunner, E.; Marmot, M.G.; Kivimaki, M. Socioeconomic differences
in cardiometabolic factors: Social causation or health-related selection? Evidence from the
Whitehall II cohort study, 1991–2004. Am. J. Epidemiol. 2011, 174, 779–789.
11. Goodman, E.; McEwen, B.S.; Huang, B.; Dolan, L.M.; Adler, N.E. Social inequalities in
biomarkers of cardiovascular risk in adolescence. Psychosom. Med. 2005, 67, 9–15.
12. Ezeamama, A.E.; Viali, S.; Tuitele, J.; McGarvey, S.T. The influence of socioeconomic factors on
cardiovascular disease risk factors in the context of economic development in the Samoan
archipelago. Soc. Sci. Med. 2006, 63, 2533–2545.
13. Santos, M.P.; Esculcas, C.; Mota, J. The relationship between socioeconomic status and
adolescents organised and nonorganised physical activities. Ped. Exerc. Sci. 2004, 16, 210–218.
14. Buchan, D.S.; Ollis, S.; Thomas, N.E.; Young, J.D.; Cooper, S.M.; Malina, R.M.; Cockcroft, J.B.;
Baker, J.S. Prevalence of traditional and novel markers of cardiovascular disease risk in Scottish
adolescents: Socioeconomic effects. Appl. Physiol. Nutr. Metab. 2012, 37, 829–839.
15. Voss, L.D.; Hosking, J.; Metcalf, B.S.; Jeffery, A.N; Fremeaux, A.E.; Wilkin, T.J. Metabolic risk
in contemporary children is unrelated to socio-economic status: Longitudinal study of a UK urban
population (EarlyBird 42). Pediatr. Diabetes 2010, doi: 10.1111/j.1399-5448.2009.00634.x.
16. Santos, R.; Santos, P.; Ribeiro, J.; Mota, J. Physical activity and other lifestyle behaviors in
a Portuguese sample of adults: Results from the Azorean physical activity and health study.
J. Phys. Act. Health 2009, 6, 750–759.
17. Andersen, L.B.; Harro, M.; Sardinha, L.B.; Froberg, K.; Ekelund, U.; Brage, S.; Anderssen, S.A.
Physical activity and clustered cardiovascular risk in children: A crossectional study (The
European Youth Heart Study). Lancet 2006, 368, 299–304.
18. Mota, J.; Vale, S.; Martins, C.; Gaya, A.; Moreira, C.; Santos, R.; Ribeiro, J.C. Influence of muscle
fitness test performance on metabolic risk factors among adolescent girls. Diabetol. Metab. Syndr.
2010, 2, doi: 10.1186/1758-5996-2-42.
19. Friedewald, T.; Levy, R.I.; Frederickson, D.S. Estimation of the concentration of low-density
lipoprotein cholesterol in plasma, without use of the preparative ultracentrifuge. Clin. Chem.
1972, 18, 499–502.
20. Radespiel-Troger, M.; Rauh, R.; Mahlke, C.; Gottschalk, T.; Muck-Weymann, M. Agreement of
two different methods for measurement of heart rate variability. Clin. Auton. Res. 2003, 13, 99–102.
Int. J. Environ. Res. Public Health 2012, 9 4320
21. Ribeiro, J.C.; Guerra, S.; Oliveira, J.; Teixeira-Pinto, A.; Twisk, J.; Duarte, J.; Mota, J. Physical
activity and biological risk clustering in pediatric population. Prev. Med. 2004, 39, 546–601.
22. Meredith, M.D.; Welk, G.J.; Cooper Institute for Aerobics Research. Fitnessgram/Activitygram
Test Administration Manual, 3rd ed.; Human Kinetics: Champaign, IL, USA, 2007, pp. 38–39.
23. Vincent, S.D.; Barker, R.; Clarke, M.; Harrison, J. A comparison of peak heart rates elicited
by the 1-mile run/walk and the progressive aerobic cardiovascular endurance run.
Am. Alliance Health Phys. Educ. Recreat. Dance 1999, 70, 75–78.
24. Steinberger, J.; Daniels, S.R.; Eckel, R.H.; Hayman, L.; Lustig, R.H.; McCrindle, B.;
Mietus-Snyder, M.L. Progress and challenges in metabolic syndrome in children and adolescents:
A scientific statement from the American Heart Association Atherosclerosis, Hypertension, and
Obesity in the Young Committee of the Council on Cardiovascular Disease in the Young; Council
on Cardiovascular Nursing; and Council on Nutrition, Physical Activity, and Metabolism.
Circulation 2009, 119, 628–647.
25. Andersen, L.B.; Wedderkopp, N.; Hansen, H.; Cooper, A.; Froberg, K. Biological cardiovascular
risk factors cluster in Danish children and adolescents: The European Youth Heart Study (EYHS)
Prev. Med. 2003, 37, 363–367.
26. Aires, L.; Silva, G.; Martins, C.; Santos, M.P.; Ribeiro, J.; Mota, J. Influence of activity patterns
in fitness during youth. Int. J. Sports Med. 2012, 33, 325–329.
27. Mota, J.; Silva, G. Adolescent’s physical activity: Association with socio-economic status and
parental participation among a Portuguese sample. Sport Ed. Soc. 1999, 4, 193–199.
28. Field, A. Discovering Statistics Using SPSS; Sage Publications: London, UK, 2010.
29. Gerber, Z.R.S.; Zielinsky, P. Fatores de risco de aterosclerose na infância: Um estudo
epidemiológico. Arq. Bras. Cardiol. 2009, 69, 231–236.
30. Costanzi, C.B.; Halpern, R.; Rech, R.R.; Bergmann, M.L.; Alli, L.; Mattos, A.P. Associated
factors in high blood pressure among schoolchildren in a middle size city, southern Brazil.
J. Pediatrics 1997, 85, 335–340.
31. Shropshire, J.; Carroll, B. Family variables and children’s physical activity: Influence of parental
exercise and socio-economic status. Sport Ed. Soc. 1997, 2, 96–116.
32. Lawlor, D.A.; Ebrahim, S.; Davey-Smith, G. Socioeconomic position in childhood and adulthood
and insulin resistance: Cross sectional survey using data from British women’s heart and health
study. BMJ. 2002, 325, 805.
© 2012 by the authors; licensee MDPI, Basel, Switzerland. This article is an open access article
distributed under the terms and conditions of the Creative Commons Attribution license
(http://creativecommons.org/licenses/by/3.0/).
Copyright © 2022 FDOKUMEN