ASSESSMENT OF SURFACE WATER QUALITY USING MULTIVARIATE STATISTICAL TECHNIQUES IN THE TERENGGANU...
11
Malaysian Journal of Analytical Sciences, Vol 19 No 2 (2015): 338 - 348 338 ASSESSMENT OF SURFACE WATER QUALITY USING MULTIVARIATE STATISTICAL TECHNIQUES IN THE TERENGGANU RIVER BASIN (Penilaian Kualiti Air Permukaan Menggunakan Teknik Statistik Multivariat bagi Lembangan Sungai Terengganu) Aminu Ibrahim 1 *, Hafizan Juahir 1 , Mohd Ekhwan Toriman 1 , Adamu Mustapha 2 , Azman Azid 1 , Hamza A Isiyaka 1 1 East Coast Environmental Research Institute Universiti Sultan Zainal Abidin, 21300 Terengganu, Malaysia 2 Kano State University of Science and Technology, Wudil 3244 Kano, Nigeria *Corresponding author: [email protected] Received: 23 November 2014; Accepted: 11 January 2015 Abstract Multivariate Statistical techniques including cluster analysis, discriminant analysis, and principal component analysis/factor analysis were applied to investigate the spatial variation and pollution sources in the Terengganu river basin during 5 years of monitoring 13 water quality parameters at thirteen different stations. Cluster analysis (CA) classified 13 stations into 2 clusters low polluted (LP) and moderate polluted (MP) based on similar water quality characteristics. Discriminant analysis (DA) rendered significant data reduction with 4 parameters (pH, NH 3 -NL, PO 4 and EC) and correct assignation of 95.80%. The PCA/FA applied to the data sets, yielded in five latent factors accounting 72.42% of the total variance in the water quality data. The obtained varifactors indicate that parameters in charge for water quality variations are mainly related to domestic waste, industrial, runoff and agricultural (anthropogenic activities). Therefore, multivariate techniques are important in environmental management. Keywords: cluster analysis, discriminant analysis, principal component analysis,water quality, Terengganu river basin Abstrak Teknik multivariat statistik termasuk analisis kelompok, analisis diskrminan, dan analisis komponen prinsipal/analisis faktor telah digunakan untuk mengkaji perubahan dan pencemaran sumber ruang di lembangan sungai Terengganu sepanjang 5 tahun pemantauan parameter kualiti air di 13 tiga belas stesen yang berbeza. Analisis kelompok (CA)mengkelaskan 13 stesen ke dalam 2 kelompok iaitu rendah tercemar (LP) dan sederhana tercemar (MP) berdasarkan ciri-ciri kualiti air yang sama. Analisis diskriminan (DA) menberikan pengurangan data penting kepada 4 parameter (pH, NH 3 -NL, PO 4 dan kekonduksian) dan penandaan betul adalah 95.80%. PCA/FA diaplikasikan kepada set data, menghasilkan lima faktor terpendam menyumbang kepada 72.42% daripada jumlah varians bagi data kualiti air. Varifaktor yang diperolehi menunjukkan bahawa terdapat parameter yang bertanggungjawab terhadap perubahan kualiti air terutamanya yang berkaitan dengan sisa domestik, perindustrian, aliran dan pertanian (aktiviti antropogenik). Oleh itu, teknik multivariat adalah penting dalam pengurusan alam sekitar. Kata kunci: analisis kelompok, analisis diskriminan, analisis komponen principal, kualiti air, lembangan sungai Terengganu Introduction Water quality has turned into one of the major ecological concerns overall and is affected by common and anthropogenic unsettling influence, for example, wastewater, overflow effluents, land recovery, air testimony and environmental change [1]. Surface waters are helpless against contamination as a consequence of common
Transcript of ASSESSMENT OF SURFACE WATER QUALITY USING MULTIVARIATE STATISTICAL TECHNIQUES IN THE TERENGGANU...

Malaysian Journal of Analytical Sciences, Vol 19 No 2 (2015): 338 - 348
338
ASSESSMENT OF SURFACE WATER QUALITY USING MULTIVARIATE
STATISTICAL TECHNIQUES IN THE TERENGGANU RIVER BASIN
(Penilaian Kualiti Air Permukaan Menggunakan Teknik Statistik Multivariat bagi Lembangan
Sungai Terengganu)
Aminu Ibrahim1*, Hafizan Juahir
1, Mohd Ekhwan Toriman
1, Adamu Mustapha
2, Azman Azid
1,
Hamza A Isiyaka1
1East Coast Environmental Research Institute
Universiti Sultan Zainal Abidin, 21300 Terengganu, Malaysia 2Kano State University of Science and Technology, Wudil 3244 Kano, Nigeria
*Corresponding author: [email protected]
Received: 23 November 2014; Accepted: 11 January 2015
Abstract
Multivariate Statistical techniques including cluster analysis, discriminant analysis, and principal component analysis/factor
analysis were applied to investigate the spatial variation and pollution sources in the Terengganu river basin during 5 years of
monitoring 13 water quality parameters at thirteen different stations. Cluster analysis (CA) classified 13 stations into 2 clusters
low polluted (LP) and moderate polluted (MP) based on similar water quality characteristics. Discriminant analysis (DA)
rendered significant data reduction with 4 parameters (pH, NH3-NL, PO4 and EC) and correct assignation of 95.80%. The
PCA/FA applied to the data sets, yielded in five latent factors accounting 72.42% of the total variance in the water quality data.
The obtained varifactors indicate that parameters in charge for water quality variations are mainly related to domestic waste,
industrial, runoff and agricultural (anthropogenic activities). Therefore, multivariate techniques are important in environmental
management.
Keywords: cluster analysis, discriminant analysis, principal component analysis,water quality, Terengganu river basin
Abstrak
Teknik multivariat statistik termasuk analisis kelompok, analisis diskrminan, dan analisis komponen prinsipal/analisis faktor
telah digunakan untuk mengkaji perubahan dan pencemaran sumber ruang di lembangan sungai Terengganu sepanjang 5 tahun
pemantauan parameter kualiti air di 13 tiga belas stesen yang berbeza. Analisis kelompok (CA)mengkelaskan 13 stesen ke dalam
2 kelompok iaitu rendah tercemar (LP) dan sederhana tercemar (MP) berdasarkan ciri-ciri kualiti air yang sama. Analisis
diskriminan (DA) menberikan pengurangan data penting kepada 4 parameter (pH, NH3-NL, PO4 dan kekonduksian) dan
penandaan betul adalah 95.80%. PCA/FA diaplikasikan kepada set data, menghasilkan lima faktor terpendam menyumbang
kepada 72.42% daripada jumlah varians bagi data kualiti air. Varifaktor yang diperolehi menunjukkan bahawa terdapat
parameter yang bertanggungjawab terhadap perubahan kualiti air terutamanya yang berkaitan dengan sisa domestik,
perindustrian, aliran dan pertanian (aktiviti antropogenik). Oleh itu, teknik multivariat adalah penting dalam pengurusan alam
sekitar.
Kata kunci: analisis kelompok, analisis diskriminan, analisis komponen principal, kualiti air, lembangan sungai Terengganu
Introduction
Water quality has turned into one of the major ecological concerns overall and is affected by common and
anthropogenic unsettling influence, for example, wastewater, overflow effluents, land recovery, air testimony and
environmental change [1]. Surface waters are helpless against contamination as a consequence of common
Aminu Ibrahim et al: ASSESSMENT OF SURFACE WATER QUALITY USING MULTIVARIATE
STATISTICAL TECHNIQUES IN THE TERENGGANU RIVER BASIN
339
techniques, namely, disintegration, precipitation data, weathering of crustal materials and anthropogenic exercises
such as urban, industrial, horticultural exercises [2, 3, 4]. Lately, more consideration has been paid to surface water
quality as a result of its solid linkage with human prosperity [5, 6]. The nature of stream anytime reflects a few
significant impacts, including the lithology of the bowl, environmental inputs, and climatic conditions [7] and
represented by both characteristic procedure and anthropogenic impacts [8].
In any area not yet influenced by human activity, the variability in natural water quality depends on upon the mix of
the accompanying environmental factors [9]: the occurrence of highly dissolvable or easily weathered minerals of
which the request of weathering is halite, gypsum, calcite, dolomite, pyrite, olivine; the separation to the coastline;
the rainfall or river runoff; the occurrence of peat swamps, wetlands and squashes which discharges extensive
amounts of disintegrated natural matter, and different elements incorporate the surrounding temperature, thickness
of weathered rocks, natural soil spread.
Thus, wastewater from agriculture, industries and urban exercises and frequently common techniques, for example,
disintegration and weathering debases water quality and debilitate their utilization for drinking, mechanical,
farming, entertainment or different purposes [10]. Clean stream water is a crucial product for the prosperity of
human social orders, and harm of inland aquatic system was one of the most genuine natural issues of the most
recent century [11]. Since, river water forms the principle inland water asset for residential, industrial and farming
purposes, it is basic to deflect and control rivers contamination [12] and to have certified data on water quality for
successful administration.
Characterization of the spatial variety and source allotment of water quality parameters can deliver an enhanced
understanding of the ecological circumstance and aid strategy producers to plan needs for practical water
administration [13]. The level of water quality is dictated by the substance of physical, concoction and natural
parameters accessible in it. Relationship between two parameters may cause to builds or abatement in the amassing
of others. This affiliation or relationship is normally attained using multivariate factual methods [14, 15, 16].
However, the application of various multivariate statistical methods were used such as cluster analysis (CA),
discriminant analysis (DA), principal component analysis (PCA) and factor analysis (FA) to interpret and revealed
useful information from huge complicated data about water quality studies [2, 23]. Many studies have been carried
out related to these methods they include: Assessment of Xianjing Watershed China using multivariate Zang et al
[6] also Zhoa and Chui [17] used PCA and CA to identify the latent pollution source and classify the sampling
stations. Similarly, Juahir et el [18] used multivariate methods such as CA, DA, PCA and FA to assess surface water
quality of Kinta River, Malaysia. Moreover, multivariate techniques including CA, DA, PCA and FA were used by
Shrestha and Kazama [7] to assess the water quality data set having 12 parameters of 13 stations of Fuji river basin
from 1992-2002 to get temporal and spatial variations and identify latent pollution sources.
In the present study multivariate statistical techniques CA, DA, PCA/FA were applied to assess the spatial variation
in the river water quality data sets of Terengganu River Basin. The objectives of the study are to fish out similarities
of the sampling sites as well as water quality parameters using cluster and discriminant analyses. However, the
study also identifies the possible pollution sources relating to spatial variation of the water quality data for
Terengganu River Basin. The results of this study are required to be useful to streamline stream observing arrange
and give a significant instrument in creating evaluation techniques for compelling water quality administration.
Materials and Methods
Study Area
Terengganu river basin is located (40
41̍ – 50
20’N, 102031 ̍– 103
0 9 ̍ E), East Coast Peninsular Malaysia. It has a
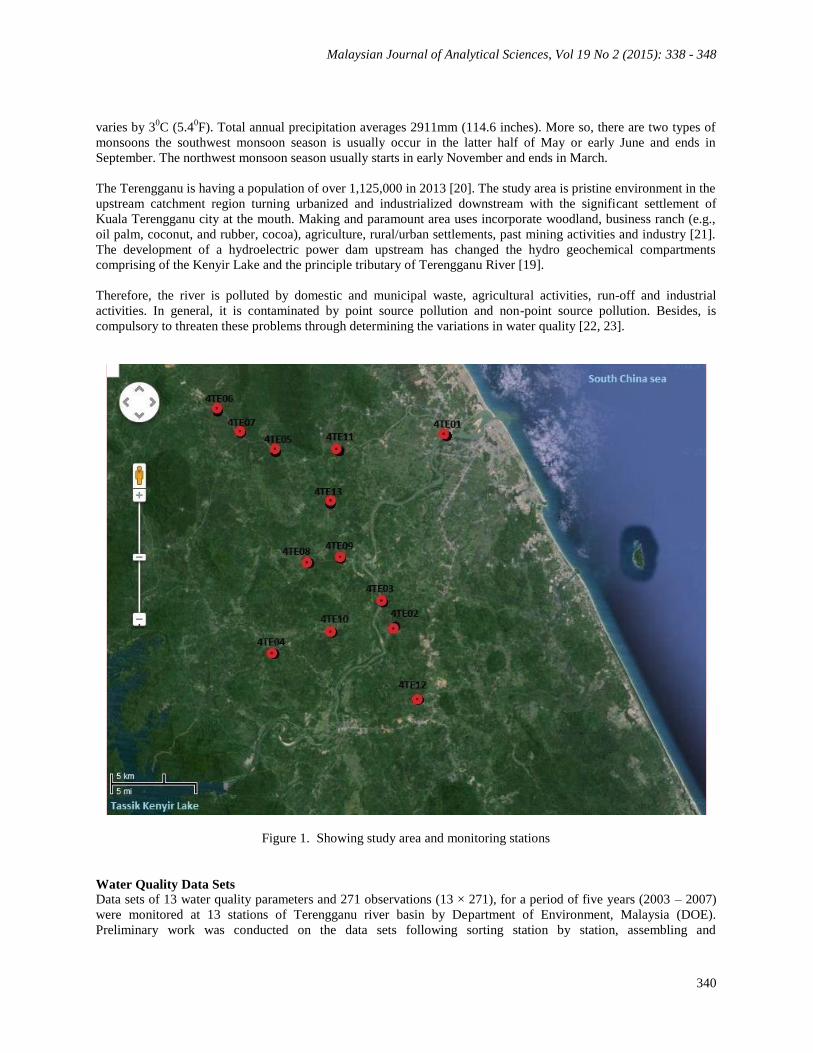
length of 100 km and a total catchment area of approximately 500 km2 [19]. Terengganu River basin where
included Nerus River, Telemong River, Bereng River, and Pueh River. It originates from Lake Kenyir flows
through Kuala Terengganu and flows into South China Sea (Figure 1).
The climate is tropical rainforest climate (Koppen Geiger Classification: Af), with no dry or cold season as it is
constantly moist (throughout the year). The annual average temperature is 26.70
C (800F) and average monthly
Malaysian Journal of Analytical Sciences, Vol 19 No 2 (2015): 338 - 348
340
varies by 30C (5.4
0F). Total annual precipitation averages 2911mm (114.6 inches). More so, there are two types of
monsoons the southwest monsoon season is usually occur in the latter half of May or early June and ends in
September. The northwest monsoon season usually starts in early November and ends in March.
The Terengganu is having a population of over 1,125,000 in 2013 [20]. The study area is pristine environment in the
upstream catchment region turning urbanized and industrialized downstream with the significant settlement of
Kuala Terengganu city at the mouth. Making and paramount area uses incorporate woodland, business ranch (e.g.,
oil palm, coconut, and rubber, cocoa), agriculture, rural/urban settlements, past mining activities and industry [21].
The development of a hydroelectric power dam upstream has changed the hydro geochemical compartments
comprising of the Kenyir Lake and the principle tributary of Terengganu River [19].
Therefore, the river is polluted by domestic and municipal waste, agricultural activities, run-off and industrial
activities. In general, it is contaminated by point source pollution and non-point source pollution. Besides, is
compulsory to threaten these problems through determining the variations in water quality [22, 23].
Figure 1. Showing study area and monitoring stations
Water Quality Data Sets
Data sets of 13 water quality parameters and 271 observations (13 × 271), for a period of five years (2003 – 2007)
were monitored at 13 stations of Terengganu river basin by Department of Environment, Malaysia (DOE).
Preliminary work was conducted on the data sets following sorting station by station, assembling and
Aminu Ibrahim et al: ASSESSMENT OF SURFACE WATER QUALITY USING MULTIVARIATE
STATISTICAL TECHNIQUES IN THE TERENGGANU RIVER BASIN
341
transformation. Data transformation additionally aids to standardize the entire information set so as to satisfy the
supposition of bunch and element examination [24]. Non numerical variables were subjected to transformation.
The parameters monitored are dissolved oxygen (DO), biological oxygen demand (BOD), Chemical oxygen
demand (COD), Suspended solid (SS), pH, ammoniacal nitrogen (NH3-NL), temperature (T), conductivity (EC),
turbidity (Tur), nitrate (NO3), phosphate (PO4), E coli, and coliform. The data sets were administered to multivariate
statistical techniques viz: cluster analysis (CA), discriminant analysis (DA) and principal component analysis
PCA/FA [23, 25,26]. All statistical calculation was done through Microsoft office EXCEL 2007 and XLSTAT
2014.
Cluster Analysis
CA is a system connected to gathering the information into groups or classes. The point is to create a set of clusters
where by the item in the same cluster are like one another however unique in relation to those in different groups.
Hierarchical agglomerate cluster is the most widely recognized methodology, which gives instinctive closeness
relationship between any one example and the whole information set, and is regularly outlined by a dendogram (tree
diagram) [27].
In this study hierarchical agglomerative CA was performed on the normalized data set by ward method, using
Squared Euclidean distance as a measure of similarity. More so, the result of cluster (dendogram) gives a visual
synopsis of grouping procedures, demonstrating a picture of the clusters and their vicinity with a lessening in
dimensionality of the starting information [7].
Discriminant Analysis
Discriminant analysis (DA) is utilized to characterize cases into downright needy qualities. It is utilized to focus
variables that segregate between regularly happening gatherings [18]. Also it develops a discriminant function (DF)
for each group using the raw data [28]. This is calculated as equation 1 below:
F (Gi) = Ki + ∑jn =1 WijPij (1)
where i is the number of groups, (G) Ki, the constant inherent to each group, n the number of parameters used to
classify a set of data into a given group and wj is the weight coefficient assigned by DF analysis (DFA) to a given
parameter (Pj) [ 23, 28, 29, 30].
DA depict the connections between two or more pre specified groups of examining substances focused around a set
of two or additionally segregating variables. In any case, DA was performed on the first information utilizing the
standard, forward stepwise and back ward stepwise modes. These were utilized to create DFs to survey spatial
varieties in the river water quality. The stations (spatial) are the grouping (dependent) variables, while all the 11
measured water quality parameters are independents variables. DA develops a discriminant capacity (DF) for each
one group given a few quantitative (independent) variables and straight out (dependent) variables [18, 23].
Principal Component Analysis
The PCA is intended to change the original variables into new, uncorrelated variables (axis), known as essential
components, which are direct consolidation of the original variables. It gives a goal method for discovering lists of
this sort so that the variety in the information set can be represented as succinctly as could reasonably be expected
[31]. PCA gives data on the significant parameter that portray most of the information set, managing information
diminishment with least loss of unique data. The principal component (PC) can be expressed as equation 2 below:
Zij = ai1x1j + ai2x2j + ai3x3j + --------- + aimxmj (2)
where z is the component score, a is the component loading, x the measured value of variable, i is the component
number, j the sample number of variables.
Malaysian Journal of Analytical Sciences, Vol 19 No 2 (2015): 338 - 348
342
FA follows after vital part examination. The fundamental motivation behind FA is to abatement the commitment of
less noteworthy variables to illuminate significantly a greater amount of the information structure originating from
the PCA. This can be accomplished through rotating the pivot characterized by PCA as indicated by settled
standards to build new variables, otherwise called varifactors (VF).
Principal component analysis utilized standardized variables to evacuate noteworthy PCs to further diminishing the
commitment of variables with minor noteworthiness; these PCs were subjected to varimax rotation (raw) producing
VFs [6, 25, 23, 26, 31, 33, 34]. The FA can be expressed as equation 3 below:
zji = af1f1i + af2f2i + af3f3i + ------------- + afmfmi + efi (3)
where z is the measured variable, a is the factor loading, f is the factor score, e the residual term accounting for
errors or source of variation, i is the sample number and m the total number of factors.
Results and Discussion
The descriptive statistics of the river water quality data of Terengganu River Basin shows that coliform, e-coli,
conductivity and turbidity possess the highest concentration of mean. Table 1 illustrates the concentration of each
parameter.
Table 1. Descriptive statistic of the river water quality data
Variables Minimum Maximum Mean Standard Deviation
DO (mg/l) 1.8 8.33 6.374 1.230
BOD (mg/l) 1.0 142 2.768 9.849
COD (mg/l) 15.0 329 24.339 22.937
SS (mg/l) 0.5 104 44.057 84.754
pH (mg/l) 3.2 8.8 6.683 0.787
NH3-NL (mg/l) 0.01 10 0.306 0.900
TEMP (Deg) 24 82 27.560 3.753
COND ((mg/l) 0 979 67.100 112.155
TUR (NUT) 0 626 53.502 82.405
NO3 (mg/l) 0.005 1.3 0.183 0.145
PO4 (mg/l) 0.005 1.3 0.037 0.100
E-Coli (cfu/100ml) 0 4100 3454.356 6282.769
Coliform (cfu/100ml) 0 9700 40802.659 100941.724
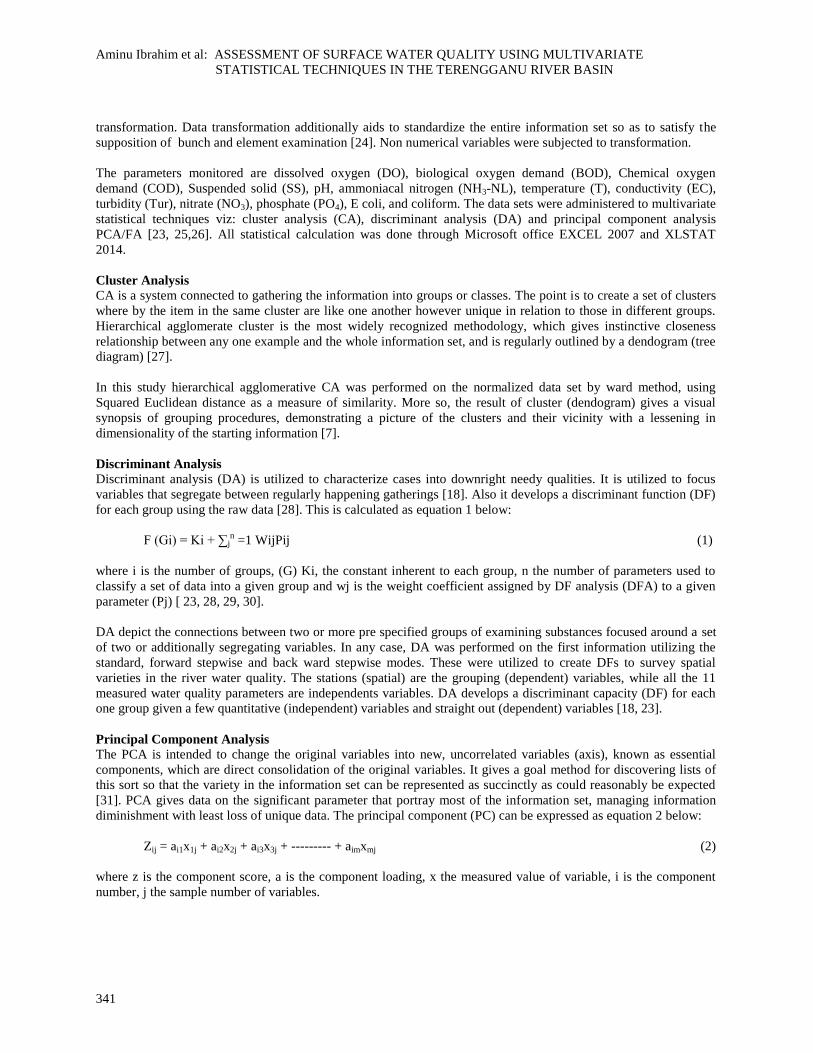
Spatial similarities and Monitoring Stations Grouping CA classify 13 monitoring stations in to two statistically significant clusters at (Dlink/Dmax) × 100 in a convincing
way as the stations in these groups have similar and natural back ground of the water quality characteristics.The
output of the cluster analysis is dispensed in dendogram Figure 2. Dendogram gives the picture of the clusters
describing the spatial variation in the water. Grouped stations of each clusters is shown in Figure 2.
Aminu Ibrahim et al: ASSESSMENT OF SURFACE WATER QUALITY USING MULTIVARIATE
STATISTICAL TECHNIQUES IN THE TERENGGANU RIVER BASIN
343
Figure 2. Dendogram showing the clusters of the monitoring stations
Cluster 1 (stations 4TE01, 4TE02, 4TE03, 4TE04, 4TE05, 4TE06, 4TE07, 4TE08, 4TE09, 4TE10, 4TE12 and
4TE13) correspond to low polluted sites (LP). These stations are located in the upstream only station 4TE01 at
downstream site but they have similar characteristics and natural background. Moderate development in that area
resulted in land use activities application not completely been engaged. Hence the impact of human beings activities
on the reverie environment is relatively low at this cluster, which makes the river water quality under preserves.
Cluster 2 (station 4TE11) correspond to moderate polluted sites (MP) located at the downstream. In this site land
use activities were fully practiced. Hence the station has dense population coupled with settlements, commercial
activities, industrial and horticulture which attributed to the contamination of the sites. More so, the station receives
pollution from horticulture (rubber plantation, palm oil plantation and Pedi plantation), domestic wastewater, and
industries.
The result of cluster analysis method shows it’s useful in presenting valid classification of surface water in the entire
area and also will make it necessary to construct spatial sampling strategy for future in a good form, which can
lessen the monitoring stations and corresponding coasts [7].
Discriminant Analysis
DA was used in the study to identify the variables which discriminate between two clusters in the river water
quality. Indeed, DA via standard, forward stepwise mode and backward stepwise mode, the validity of spatial
classification using standard mode where 13 parameters are incorporated and give 97.42%.
The Wilks Lambda value test for the standard mode gives a 0.473 and P < 0.0001. The null hypothesis stated that
the means of vectors of the 2 clusters (LPS and MPS) are equal. The alternative hypothesis, alongside, states that at
least one of means of vector is different from another. Since the computed P – value is lower than the significance
level of alpha = 0.05, one should reject a null hypothesis and accept the alternative hypothesis. The risk of rejecting
the null hypothesis while it is true is lower than 0.01%. Thus, the 2 clusters are indeed different from one another.
Malaysian Journal of Analytical Sciences, Vol 19 No 2 (2015): 338 - 348
344
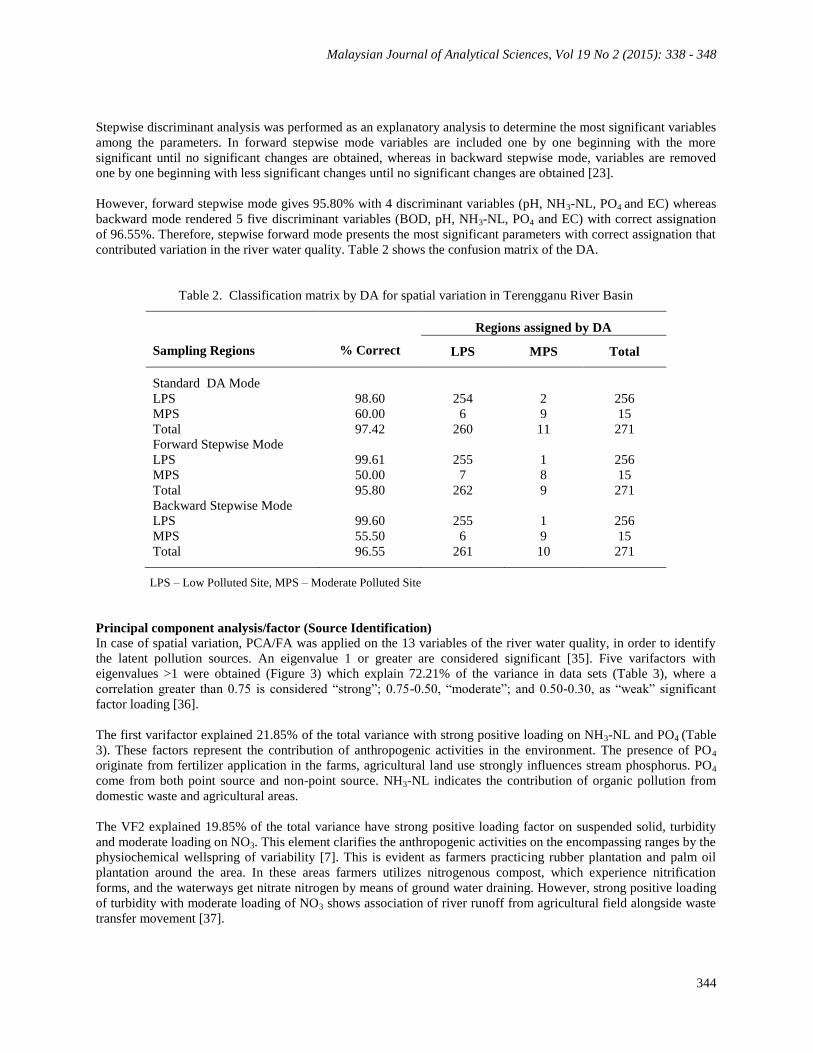
Stepwise discriminant analysis was performed as an explanatory analysis to determine the most significant variables
among the parameters. In forward stepwise mode variables are included one by one beginning with the more
significant until no significant changes are obtained, whereas in backward stepwise mode, variables are removed
one by one beginning with less significant changes until no significant changes are obtained [23].
However, forward stepwise mode gives 95.80% with 4 discriminant variables (pH, NH3-NL, PO4 and EC) whereas
backward mode rendered 5 five discriminant variables (BOD, pH, NH3-NL, PO4 and EC) with correct assignation
of 96.55%. Therefore, stepwise forward mode presents the most significant parameters with correct assignation that
contributed variation in the river water quality. Table 2 shows the confusion matrix of the DA.
Table 2. Classification matrix by DA for spatial variation in Terengganu River Basin
Sampling Regions
% Correct
Regions assigned by DA
LPS MPS Total
Standard DA Mode
LPS 98.60 254 2 256
MPS 60.00 6 9 15
Total 97.42 260 11 271
Forward Stepwise Mode
LPS 99.61 255 1 256
MPS 50.00 7 8 15
Total 95.80 262 9 271
Backward Stepwise Mode
LPS 99.60 255 1 256
MPS 55.50 6 9 15
Total 96.55 261 10 271
LPS – Low Polluted Site, MPS – Moderate Polluted Site
Principal component analysis/factor (Source Identification)
In case of spatial variation, PCA/FA was applied on the 13 variables of the river water quality, in order to identify
the latent pollution sources. An eigenvalue 1 or greater are considered significant [35]. Five varifactors with
eigenvalues >1 were obtained (Figure 3) which explain 72.21% of the variance in data sets (Table 3), where a
correlation greater than 0.75 is considered “strong”; 0.75-0.50, “moderate”; and 0.50-0.30, as “weak” significant
factor loading [36].
The first varifactor explained 21.85% of the total variance with strong positive loading on NH3-NL and PO4 (Table
3). These factors represent the contribution of anthropogenic activities in the environment. The presence of PO4
originate from fertilizer application in the farms, agricultural land use strongly influences stream phosphorus. PO4
come from both point source and non-point source. NH3-NL indicates the contribution of organic pollution from
domestic waste and agricultural areas.
The VF2 explained 19.85% of the total variance have strong positive loading factor on suspended solid, turbidity
and moderate loading on NO3. This element clarifies the anthropogenic activities on the encompassing ranges by the
physiochemical wellspring of variability [7]. This is evident as farmers practicing rubber plantation and palm oil
plantation around the area. In these areas farmers utilizes nitrogenous compost, which experience nitrification
forms, and the waterways get nitrate nitrogen by means of ground water draining. However, strong positive loading
of turbidity with moderate loading of NO3 shows association of river runoff from agricultural field alongside waste
transfer movement [37].

Aminu Ibrahim et al: ASSESSMENT OF SURFACE WATER QUALITY USING MULTIVARIATE
STATISTICAL TECHNIQUES IN THE TERENGGANU RIVER BASIN
345
Figure 3. Scree plot showing the eigenvalues
Table 3. Factor loadings after Varimax rotation
Variables VF1 VF2 VF3 VF4 VF5
DO -0.407 0.283 -0.145 0.011 0.600
BOD 0.070 0.037 0.975 0.056 -0.018
COD 0.119 0.101 0.966 0.084 -0.015
SS -0.064 0.784 0.146 0.087 -0.058
pH 0.074 -0.073 0.035 0.029 0.883
NH3-NL 0.837 -0.076 0.219 0.040 -0.224
Temperature -0.120 -0.453 0.010 0.018 -0.334
Conductivity 0.488 -0.011 0.063 -0.022 -0.671
Turbidity -0.057 0.808 0.171 0.107 0.017
NO3 -0.046 0.626 -0.126 0.169 0.044
PO4 0.887 -0.007 0.041 -0.053 0.075
E-coli -0.017 -0.018 0.289 0.847 0.029
Coliform -0.007 0.200 -0.061 0.883 0.013
Eigenvalue 2.840 2.581 1.493 1.292 1.182
Variability % 21.847 19.852 11.484 9.940 9.090
Cumulative% 21.847 41.699 53.183 63.123 72.213
Bold indicate strong and moderate factor loading
0
20
40
60
80
100
0
0.5
1
1.5
2
2.5
3
F1 F2 F3 F4 F5 F6 F7 F8 F9 F10 F11 F12 F13
Cu
mu
lati
ve v
aria
bili
ty (
%)
Eige
nva
lue
Axis (Parameters)
Scree plot

Malaysian Journal of Analytical Sciences, Vol 19 No 2 (2015): 338 - 348
346
VF3 described 11.84% of the total variance had a strong positive loading on BOD and COD. These factors
explained the effects of organic pollution and reflect strong influence of anthropogenic activities in the area,
probably from domestic waste and industrial waste. VF4 account for 9.94% of the total variance and has a strong
loading on E-coli and coliform. This factor is strongly related to waste from domestic and municipal in the area. The
loading for factor 5 was 9.090% of the total variance had strong loading on pH and moderate loading on DO. This
factor resulted due to the anaerobic conditions in the river from the strong loading of dissolved organic matter which
leads in the formation of organic acids.
Conclusion
In this study multivariate statistical analysis were successfully applied to explore and identify the spatial variation
and potential pollution sources in the river basin. CA grouped 13 sampling stations into 2 clusters LP and MP based
on similar water quality characteristics. Following the result authorities and decision makers can develop optimal
strategy in which sampling stations can be reduced. DA revealed significant data reduction as it gives four
parameters (pH, NH3-NL, PO4 and EC) with 95.80% correct assignation. The PCA resulted in five varifactors with
total variance of 72.21% in which the major sources of pollution are related to anthropogenic activities. Therefore,
multivariate techniques are important in environmental management.
Acknowledgement
The author will like to thanks the department of Environment Malaysia (DOE) and the entire staff of East Coast
Environmental Research Institute University Sultan Zainal Abidin for their support.
References
1. Reza, R. & Singh, G. (2010). Heavy Metal Contamination and its Indexing Approach for River Water.
International Journal of Environmental Science and Technology, 7(4): 785-792.
2. Sundaray, S.K., Panda, U.C., Nayak B. B. & Bhatta D. (2006). Multivariate statistical techniques for the
evaluation of spatial and temporal variations in water quality of the Mahanadi river-estuarine system (India)--a
case study.Environmental Geochemistry and Health, 28(4): 317-330.
3. Carpenter, S.R., Caraco, N.F., Correll, D.L., Howarth, R.W., Sharpley, A.N. & Smith, V. H. (1998). Nonpoint
pollution of surface waters with phosphorus and nitrogen.Ecology Application, 8: 559–568.
4. Jarvie, H. P., Whitton, B. A., & Neal, C. (1998). Nitrogen and phosphorus in east coast British rivers:
speciation, sources and biological significance. Science of the Total Environment, 211: 79–109
5. Filik I. C., Emiroglu, O., Ilhan, S., Arslan, N., Yilmaz, V. & Ahiska, S. (2008). Application of multivariate
statistical techniques in the assessment of surface water quality in Ulubat Lake. Turkey. Environmental
Monitoring and Assessment, 144: 269-276.
6. Zhang, Y., Guo, F., Meng, W. & Wang, X. (2009). Water quality assessment and source identification of
Daliao river basin using multivariate statistical methods. Environmental Monitoring and Assessment, 152: 105-
121.
7. Shrestha, S. & Kazama, F. (2007). Assessment of surface water quality using multivariate statistical
techniqueas: Fuji river basin Japan. Environnmental Modeling and Software, 22(4): 464-475.
8. Pejman, A. H., Bidhendi, G. R., Karbassi, A. R., Mehrdadi, N. & Bidendi, M.E. (2009). Evaluation of spatial
and seasonal variations in surface water quality using multivariate statistical techniques.International Journal
of Environmental Science and Technology, 6(3): 467-476.
9. Mayback & Helmer, (1998). The quality of rivers from pristine statge to global pollution.Palaeogr,
palaeclamatol, palaeoecol. (Global planet sect) 75, 283-309.
10. Kuppusamy M. R. & Giridhar V. V. (2006). Factor analysis of water quality characteristics including trace
metal speciation in the coastal environmental system of Chennai Ennore. Environment International, 32 (2):
174-179.
11. Tanriverdi, C., Alp, A., Demirkiran, A. R. & Ucjarde, F. (2010). Assessment of surface water quality of the
Ceyhan River basin, Turkey.Environmental Monitoring & Assessment,167, 175-184.
12. Simeonova, P., Simeonova, V. & Andreev, G. (2003). Environmetric analysis of the Struma River water
quality. Central European journal of Chemistry, 2: 121-126.

Aminu Ibrahim et al: ASSESSMENT OF SURFACE WATER QUALITY USING MULTIVARIATE
STATISTICAL TECHNIQUES IN THE TERENGGANU RIVER BASIN
347
13. Huang, J., Ho, M. & Du, P. (2011). Assessment of temporal and spatial variation of coastal water quality and
source identification along Macau Peninsular.Stochastic Environmental Research and Risk Assessment, 25:
353-361.
14. Ifabiyi, I.P. (1997). Variation in Water Gravity with Rainfall Incidences: A Case Study of Ogbe Stream Ile-Ife,
Ife. Res. Publications Geogr, 6(1&2): 139-144.
15. Jaji M.O., Bamgbose, O., Odukoya O.O. & Arowolo T.A. (2007). Water Quality Assessment of Ogun River,
South West Nigeria. Environment Monitoring Assessment, 133: 473-482.
16. Mazlum, N., Ozer, A. & Mazlum, S. (1999). Interpretation of water quality data by principal components
analysis.Turkish Journal of Environmental Science, 23: 19-26.
17. Zhao, Z. & Cui, F. (2009). Multivariate statistical analysis for the surface water quality of the Luan River,
China.Journal of Zhejiang University Science A, 10(1): 142-148.
18. Juahir, H., Zain, M.S., Yosoff, M.K., Ismail, T.T.H., Samah, A.M.A., Toriman, M.E. & Moktar, M. (2010b).
Spatial assessment of Langtan River Basin (Malaysia) using environmentric techniques. Environment
Monitoring Assessment, 173: 625-641.
19. Noor, A.S. & Khawar, S., (2010). Geochemical baselines of major, minor and trace elements in the tropical
sediments of the Terengganu River Basin Malaysia. International Journal of Sediment Research, 25: 340-354.
20. Malaysia population census Department of Statistic population of Terengganu (2014). Online access on
www.statitics.gov.my/portal/index.php?option=com
21. Kuala Terengganu city Council (MBKT), (2014). Online access on http://mbkt.terengganu.gov.my/jadual-pbt
22. Tobiszewski, M., Tsakovski, S., Simeonov, V. & Namiesnik, J. (2010). Surface water quality assessment by the
use of combination of multivariate statistical classification and expert information.Chemosphere,80: 740-746.
23. Singh, K.P., Malik, A., Mohan, D. & Sinha, S. (2004). Multivariate statistical techniques for the evaluation
of spatial and temporal variations in water quality of Gomti River (India): a case study. Water Research, 38:
3980-3992.
24. Voudouris, K., Panagopoulos, A. & Koumantakis, J. (2000). Multivariate statistical analysis in the assessment
of hydrochemistry of the Northern Korinthia Prefecture Alluvial Aquifer System (Paloponnese, Greece).
Natural Resources Research, 9: 135-146.
25. Simeonova, P., Simeonova, V. & Andreev, G. (2003). Environmetric analysis of the Struma River water quality
central.European journal of Chemistry, 2: 121-126.
26. Singh, K.P., Malik, A. & Sinha, S. (2005). Water quality assessment and apportionment of pollution sources of
Gomti river (India) using multivariate statistical techniques: a case study. Analytical Chemical Acta 538, 355-
374.
27. McKenna Jr., J.E. (2003). An enhanced cluster analysis program with bootstrap significance testing for
ecological community analysis. Environmental Modeling & Software, 18 (3): 205-220.
28. Jornson, R.A. & Wichern, D.W. (1992). Applied Multivariate Statistical Analysis, 3rd
edn, Prentice – Hall lut.,
New Jersey.
29. Lattin, J., Carroll, D. & Green, P. (2003). Analyzing Multivariate Data. New York: Duxbury.
30. Wunderlin, D.A., Diaz, M.P., Ame, M.V., Pesce, S.F., Hued, A.C. & Bistoni, M.A. (2001). Pattern recognition
techniques for the evaluation of spatial and temporal variations in water quality. A case study: Suquia river
basin (Cordoba, Argentina). Water Research, 35(12): 2881-2894.
31. Brumelis, G., Lapina, L., Nikodemus, O. & Tabors, G. (2000). Use of an artificial model of monitoring data to
aid interpretation of principal component analysis. Environmental modelling and software, 15(8): 755-763.
32. Helena, B., Pardo, R., Vega, M., Barrado, E., Fernandex, J.M. & Fernendex, L. (2000). Temporal evolution of
ground water composition in an alluvial aquifer composition in an alluvial aquifer (Pisuegariver, Spain) by
principal component analysis.Water Research, 34: 807-816.
33. Abdul-Wahab, S.A., Bakheit, C.S. & Al-Alawi, S.M. (2005). Principal component and multiple regression
analysis in modeling of ground-level ozone and factors affecting its concentrations. Environmental Modelin &
Software, 20(10): 1263-1271.
34. Love, D., Hallbauer, D., Amos, A. & Hranova, R. (2004). Factor analysis as a tool in groundwater quality
management: two southern African case studies. Physics & Chemistry of the Earth, 29: 1135-1143.
35. Kim, J.O. & Mueller, C.W. (1987). Introduction to factor analysis: what it is and how to do it. Quantitative
Applications in the Social Sciences Series. Sage University Press, Newbury Park.

Malaysian Journal of Analytical Sciences, Vol 19 No 2 (2015): 338 - 348
348
36. Liu, C.W., Lin, K.H. & Kuo, Y.M. (2003). Application of factor analysis in the assessment of groundwater in a
Blackfoot disease area in Taiwan.Science of the Total Environment, 313(1-13): 77-89.
37. Yang, Y.H., Zhou, F., Guo, H.C., Sheng, H., Liu, H., Dao, X. & He, C.J. (2010). Analysis of spatial and
temporal water pollution patterns in Lake Dianchi using multivariate statistical methods. Environmental
Monitoring and Assessment, 170: 407-416.