Current Status of Herbal Medicines in Chronic Liver Disease ...
Upload
independentCategory
view
5download
0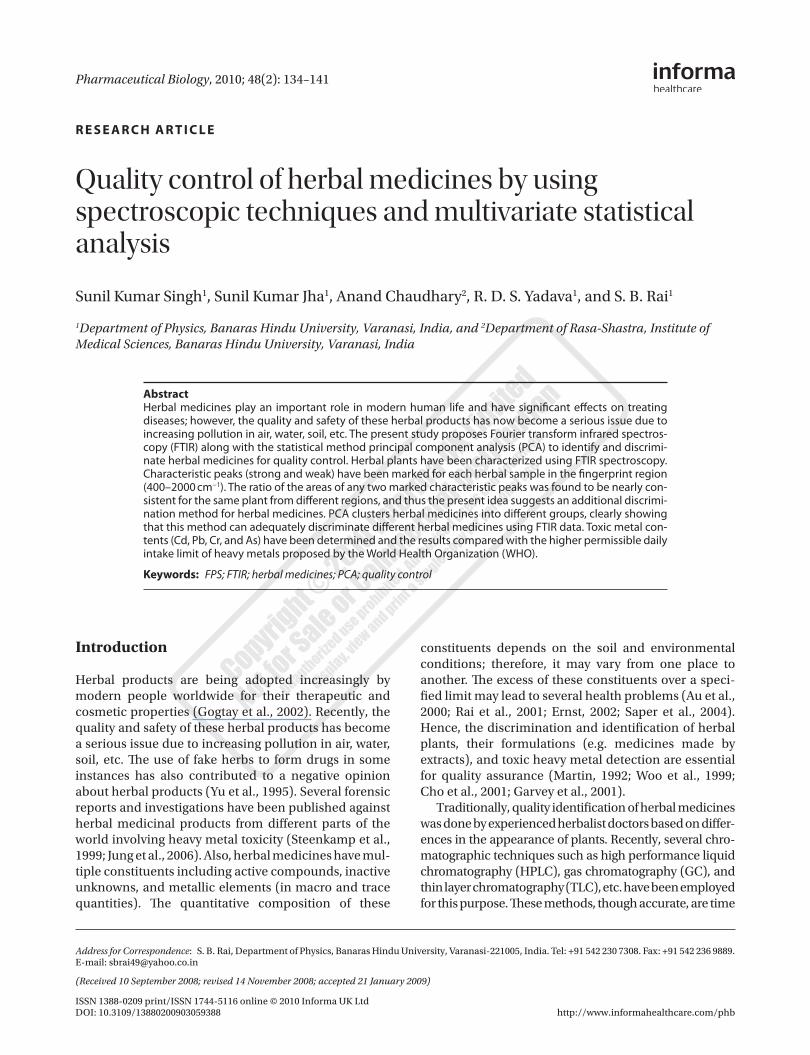
Pharmaceutical Biology, 2010; 48(2): 134–141
R E S E A R C H A R T I C L E
Quality control of herbal medicines by using spectroscopic techniques and multivariate statistical analysis
Sunil Kumar Singh1, Sunil Kumar Jha1, Anand Chaudhary2, R. D. S. Yadava1, and S. B. Rai1
1Department of Physics, Banaras Hindu University, Varanasi, India, and 2Department of Rasa-Shastra, Institute of Medical Sciences, Banaras Hindu University, Varanasi, India
Address for Correspondence: S. B. Rai, Department of Physics, Banaras Hindu University, Varanasi-221005, India. Tel: +91 542 230 7308. Fax: +91 542 236 9889. E-mail: [email protected]
(Received 10 September 2008; revised 14 November 2008; accepted 21 January 2009)
Introduction
Herbal products are being adopted increasingly by modern people worldwide for their therapeutic and cosmetic properties (Gogtay et al., 2002). Recently, the quality and safety of these herbal products has become a serious issue due to increasing pollution in air, water, soil, etc. The use of fake herbs to form drugs in some instances has also contributed to a negative opinion about herbal products (Yu et al., 1995). Several forensic reports and investigations have been published against herbal medicinal products from different parts of the world involving heavy metal toxicity (Steenkamp et al., 1999; Jung et al., 2006). Also, herbal medicines have mul-tiple constituents including active compounds, inactive unknowns, and metallic elements (in macro and trace quantities). The quantitative composition of these
constituents depends on the soil and environmental conditions; therefore, it may vary from one place to another. The excess of these constituents over a speci-fied limit may lead to several health problems (Au et al., 2000; Rai et al., 2001; Ernst, 2002; Saper et al., 2004). Hence, the discrimination and identification of herbal plants, their formulations (e.g. medicines made by extracts), and toxic heavy metal detection are essential for quality assurance (Martin, 1992; Woo et al., 1999; Cho et al., 2001; Garvey et al., 2001).
Traditionally, quality identification of herbal medicines was done by experienced herbalist doctors based on differ-ences in the appearance of plants. Recently, several chro-matographic techniques such as high performance liquid chromatography (HPLC), gas chromatography (GC), and thin layer chromatography (TLC), etc. have been employed for this purpose. These methods, though accurate, are time
ISSN 1388-0209 print/ISSN 1744-5116 online © 2010 Informa UK LtdDOI: 10.3109/13880200903059388
AbstractHerbal medicines play an important role in modern human life and have significant effects on treating diseases; however, the quality and safety of these herbal products has now become a serious issue due to increasing pollution in air, water, soil, etc. The present study proposes Fourier transform infrared spectros-copy (FTIR) along with the statistical method principal component analysis (PCA) to identify and discrimi-nate herbal medicines for quality control. Herbal plants have been characterized using FTIR spectroscopy. Characteristic peaks (strong and weak) have been marked for each herbal sample in the fingerprint region (400–2000 cm−1). The ratio of the areas of any two marked characteristic peaks was found to be nearly con-sistent for the same plant from different regions, and thus the present idea suggests an additional discrimi-nation method for herbal medicines. PCA clusters herbal medicines into different groups, clearly showing that this method can adequately discriminate different herbal medicines using FTIR data. Toxic metal con-tents (Cd, Pb, Cr, and As) have been determined and the results compared with the higher permissible daily intake limit of heavy metals proposed by the World Health Organization (WHO).
Keywords: FPS; FTIR; herbal medicines; PCA; quality control
http://www.informahealthcare.com/phb

Quality control of herbal medicines 135
consuming and involve laborious sample preparation steps (Mao & Xu, 2006). It is therefore desirable to develop a rapid, simple, and accurate analytical method for herb identification and quality assessment.
The present article proposes a procedure for the identification of herbal products (plants or medicines) by combining molecular spectroscopy with multivari-ate statistical analysis. In the present work it was not attempted to identify the individual organic compounds present in the herbs, which is a time consuming, costly procedure, but several of the main bands present in the herbal sample in the mid-infrared (IR) region (the so-called fingerprint region of the spectra, 400–2000 cm−1) were marked. These marked bands were used for the comparison of herbal plants and their medicinal formu-lations. The areas of the peaks of the marked bands were measured, and the ratio of the areas of two marked peaks of a specific sample from different parts of the country was calculated for comparison. The quantitative method of comparison proposed by Zou et al. (2005) was applied for the comparison of crude herbal samples and their formulations. Further, Fourier transform infrared (FTIR) spectral data for a large number of herbal samples were processed by principal component analysis (PCA) to cluster herbal medicines into different groups, to dis-criminate different herbal medicines even though they might be from different places. Finally, the toxic heavy metal (Pb, Cd, and Cr) content in these herbal drugs was also determined using atomic absorption spectroscopy (AAS), while the arsenic (As) content was determined using inductively coupled plasma atomic emission spectroscopy (ICP-AES). The concentrations of the vari-ous metals were compared with the maximum permis-sible daily intake limits for heavy metals prescribed by the World Health Organization (WHO).
Materials and methods
Plant materials
Herbal plants were collected from different parts of India (Varanasi, Ahmedabad, Jaipur, and Mumbai). These selected cities are in different climatic zones of India. Herbal plants Arjuna [Terminalia arjuna L. (Combretaceae)], Tulsi [Ocimum sanctum L. (Lamiaceae)], Aawala [Emblic myrobalan Burm. (Phyllanthaceae)], Aswagandha [Withania somnif-era L. (Solanaceae)], Vaasa [Adhatoda vasica Nees. (Acanthaceae)], Meethi Neem [Murraya koenigi L. (Rutaceae)], and Bitter Neem [Azadirachta indica L. (Meliaceae)] were selected for this purpose, as these are some of the most common herbal medicines from India that are frequently used for herbal therapy (Khanna et al., 1986; Sharma 1993). Samples were collected in
the month of November and their identification was verified by Dr. Anand Chaudhary, an expert in herbal medicines at the Institute of Medical Sciences, Banaras Hindu University (BHU), Varanasi, India. Samples col-lected were processed (method given below) and used directly for the experimental work. Commercial samples (in the form of tablets, capsules, and powder) under the same vernacular names from various companies (Zandu Pharmaceuticals, Gyan Herbal Home, Himalaya Drug, and Nagarjuna Pharmaceuticals) were also collected from the local market of Varanasi, India.
Methods
Raw herbal samples were washed in fresh running water to eliminate dust, dirt, and possible parasites, and then they were washed again with deionized water. Commercial tablets were first cleaned in order to remove the outer coating. Both types of samples were dried and powdered using a mortar and pestle. For quantitative similarity, crude herbal samples (reference samples) were collected from the Ayurvedic Garden of BHU, Varanasi, India, and formulations (tablets and capsules) with the same vernacular names from the local market.
For FTIR analysis, a powder sample and KBr were mixed at an appropriate ratio (1:50) and pellets were prepared applying the same pressure to keep the thick-ness of the pellet constant. The utmost care was taken to obtain the same concentration of sample each time in every pellet. FTIR spectra were recorded in the 400–2000 cm−1 spectral region with a FTIR spectropho-tometer (Spectrum RX-I; PerkinElmer). The spectra were collected at a resolution of 4 cm−1. Each spectrum was the average of 10 scans.
PCA analysis was done by taking the FTIR spectrum at discrete wave number points over the 500–1800 cm−1 region of the spectrum at intervals of 100 cm−1. In all, the spectra of five herbal medicinal plants (Terminalia arjuna, Ocimum sanctum, Emblic myrobalan, Withania somnifera, and Adhatoda vasica) and a total of 17 sam-ples were considered. A 17 × 14 data matrix was formed by taking 17 samples along rows and 14 wave number points along columns. The different samples along the rows were arranged as follows: rows numbered 1–3 rep-resented Terminalia arjuna, 4–7 represented Withania somnifera, 8–10 represented Adhatoda vasica, 11–13 represented Emblic myrobalan, and 14–17 represented Ocimum sanctum. The matrix elements in the data matrix were the % transmission values. The data were normalized by mean centering with respect to the col-umn means.
For elemental analysis, first, digestion of the sample was done. All the chemicals (HCl (Qualigens, 36.5%), HNO
3 (Merck, 65%), and HClO
4 (Rankem, 73%)) used
were of analytical grade. All the glassware was soaked
136 Sunil Kumar Singh et al.
with aqua regia (HCl:HNO3, 3:1) for 2 h (Levine et al.,
2005). The completely dried sample (1 g) was digested in concentrated nitric acid and perchloric acid (3:1) until a clear solution with white fumes was obtained. After adequate cooling, the solution was reconstituted to the desired volume, i.e. 25 mL, with deionized water in a test tube. Quantitative estimation of heavy metals was done finally by using an atomic absorption spectrophotometer (Model no. 2380; PerkinElmer) and an inductively cou-pled plasma atomic emission spectrometer (PS-3000, UV-DRE; Leeman Labs Inc., USA).
Results and discussion
FTIR analysis for fingerprint spectra
FTIR spectra of the herbal samples and their formulations were recorded in the fingerprint region, 400–2000 cm−1, in
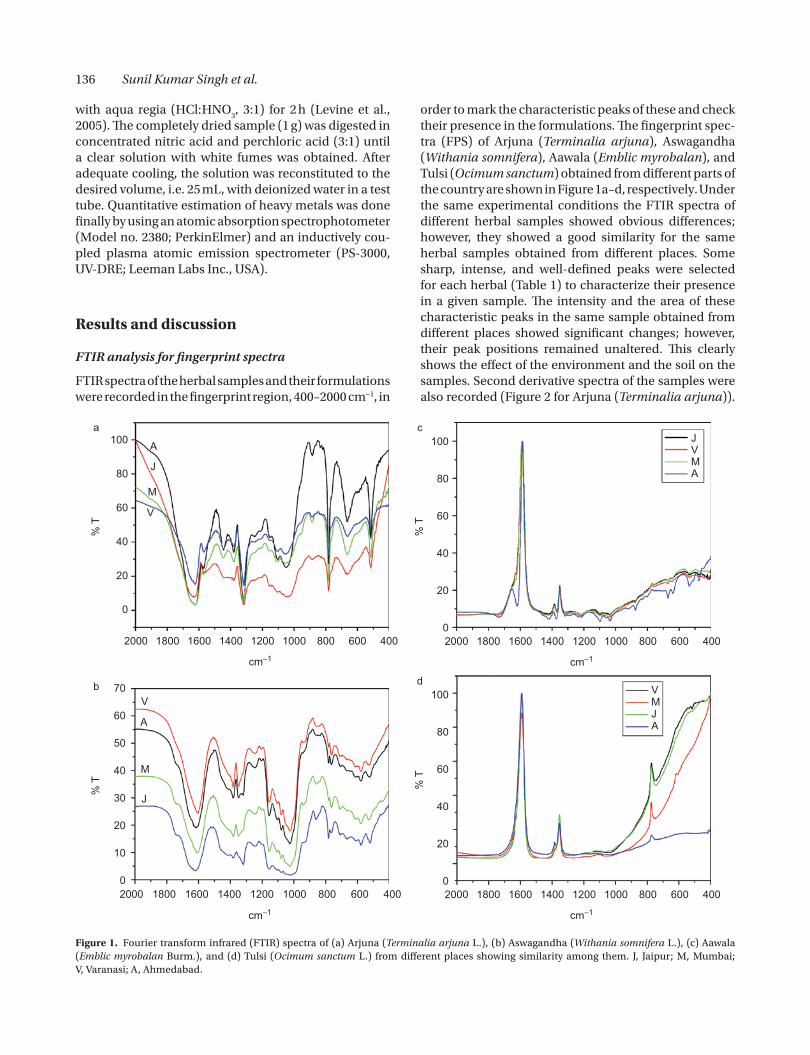
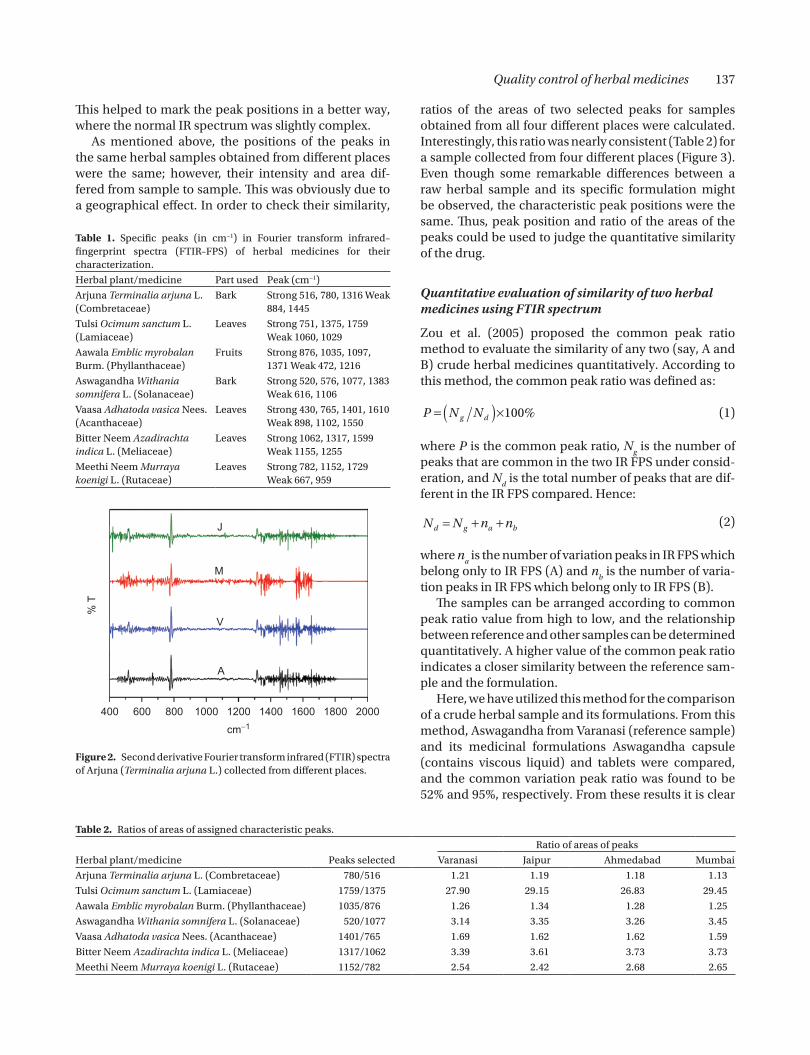
order to mark the characteristic peaks of these and check their presence in the formulations. The fingerprint spec-tra (FPS) of Arjuna (Terminalia arjuna), Aswagandha (Withania somnifera), Aawala (Emblic myrobalan), and Tulsi (Ocimum sanctum) obtained from different parts of the country are shown in Figure 1a–d, respectively. Under the same experimental conditions the FTIR spectra of different herbal samples showed obvious differences; however, they showed a good similarity for the same herbal samples obtained from different places. Some sharp, intense, and well-defined peaks were selected for each herbal (Table 1) to characterize their presence in a given sample. The intensity and the area of these characteristic peaks in the same sample obtained from different places showed significant changes; however, their peak positions remained unaltered. This clearly shows the effect of the environment and the soil on the samples. Second derivative spectra of the samples were also recorded (Figure 2 for Arjuna (Terminalia arjuna)).
100
80
60
40
20
0
% T
% T
A
J
M
V
A
J
MV
2000 1800 1600 1400 1200 1000 800 600 400
cm−1
2000 1800 1600 1400 1200 1000 800 600 400
cm−1
a c
0
10
20
30
40
50
60
70
% T
A
J
M
V
2000 1800 1600 1400 1200 1000 800 600 400
cm−1
b
100
80
60
40
20
0
% T
AJMV
2000 1800 1600 1400 1200 1000 800 600 400
cm−1
d100
80
60
40
20
0
Figure 1. Fourier transform infrared (FTIR) spectra of (a) Arjuna (Terminalia arjuna L.), (b) Aswagandha (Withania somnifera L.), (c) Aawala (Emblic myrobalan Burm.), and (d) Tulsi (Ocimum sanctum L.) from different places showing similarity among them. J, Jaipur; M, Mumbai; V, Varanasi; A, Ahmedabad.
Quality control of herbal medicines 137
This helped to mark the peak positions in a better way, where the normal IR spectrum was slightly complex.
As mentioned above, the positions of the peaks in the same herbal samples obtained from different places were the same; however, their intensity and area dif-fered from sample to sample. This was obviously due to a geographical effect. In order to check their similarity,
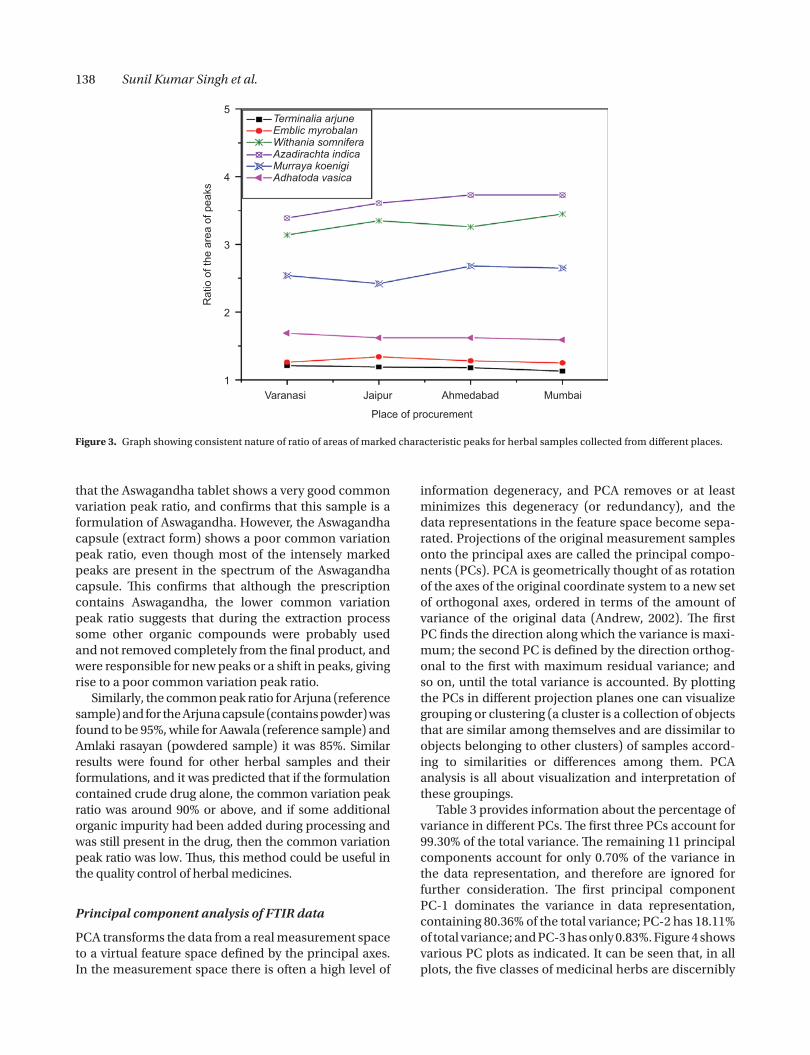
ratios of the areas of two selected peaks for samples obtained from all four different places were calculated. Interestingly, this ratio was nearly consistent (Table 2) for a sample collected from four different places (Figure 3). Even though some remarkable differences between a raw herbal sample and its specific formulation might be observed, the characteristic peak positions were the same. Thus, peak position and ratio of the areas of the peaks could be used to judge the quantitative similarity of the drug.
Quantitative evaluation of similarity of two herbal medicines using FTIR spectrum
Zou et al. (2005) proposed the common peak ratio method to evaluate the similarity of any two (say, A and B) crude herbal medicines quantitatively. According to this method, the common peak ratio was defined as:
P N Ng d= × %( ) 100
(1)
where P is the common peak ratio, Ng is the number of
peaks that are common in the two IR FPS under consid-eration, and N
d is the total number of peaks that are dif-
ferent in the IR FPS compared. Hence:
N N n nd g a b= + +
(2)
where na is the number of variation peaks in IR FPS which
belong only to IR FPS (A) and nb is the number of varia-
tion peaks in IR FPS which belong only to IR FPS (B).The samples can be arranged according to common
peak ratio value from high to low, and the relationship between reference and other samples can be determined quantitatively. A higher value of the common peak ratio indicates a closer similarity between the reference sam-ple and the formulation.
Here, we have utilized this method for the comparison of a crude herbal sample and its formulations. From this method, Aswagandha from Varanasi (reference sample) and its medicinal formulations Aswagandha capsule (contains viscous liquid) and tablets were compared, and the common variation peak ratio was found to be 52% and 95%, respectively. From these results it is clear
% T
A
J
M
V
200018001600140012001000800600400
cm−1
Figure 2. Second derivative Fourier transform infrared (FTIR) spectra of Arjuna (Terminalia arjuna L.) collected from different places.
Table 2. Ratios of areas of assigned characteristic peaks.
Herbal plant/medicine Peaks selected
Ratio of areas of peaks
Varanasi Jaipur Ahmedabad Mumbai
Arjuna Terminalia arjuna L. (Combretaceae) 780/516 1.21 1.19 1.18 1.13
Tulsi Ocimum sanctum L. (Lamiaceae) 1759/1375 27.90 29.15 26.83 29.45
Aawala Emblic myrobalan Burm. (Phyllanthaceae) 1035/876 1.26 1.34 1.28 1.25
Aswagandha Withania somnifera L. (Solanaceae) 520/1077 3.14 3.35 3.26 3.45
Vaasa Adhatoda vasica Nees. (Acanthaceae) 1401/765 1.69 1.62 1.62 1.59
Bitter Neem Azadirachta indica L. (Meliaceae) 1317/1062 3.39 3.61 3.73 3.73
Meethi Neem Murraya koenigi L. (Rutaceae) 1152/782 2.54 2.42 2.68 2.65
Table 1. Specific peaks (in cm−1) in Fourier transform infrared–fingerprint spectra (FTIR–FPS) of herbal medicines for their characterization.
Herbal plant/medicine Part used Peak (cm−1)
Arjuna Terminalia arjuna L. (Combretaceae)
Bark Strong 516, 780, 1316 Weak 884, 1445
Tulsi Ocimum sanctum L. (Lamiaceae)
Leaves Strong 751, 1375, 1759 Weak 1060, 1029
Aawala Emblic myrobalan Burm. (Phyllanthaceae)
Fruits Strong 876, 1035, 1097, 1371 Weak 472, 1216
Aswagandha Withania somnifera L. (Solanaceae)
Bark Strong 520, 576, 1077, 1383 Weak 616, 1106
Vaasa Adhatoda vasica Nees. (Acanthaceae)
Leaves Strong 430, 765, 1401, 1610 Weak 898, 1102, 1550
Bitter Neem Azadirachta indica L. (Meliaceae)
Leaves Strong 1062, 1317, 1599 Weak 1155, 1255
Meethi Neem Murraya koenigi L. (Rutaceae)
Leaves Strong 782, 1152, 1729 Weak 667, 959
138 Sunil Kumar Singh et al.
that the Aswagandha tablet shows a very good common variation peak ratio, and confirms that this sample is a formulation of Aswagandha. However, the Aswagandha capsule (extract form) shows a poor common variation peak ratio, even though most of the intensely marked peaks are present in the spectrum of the Aswagandha capsule. This confirms that although the prescription contains Aswagandha, the lower common variation peak ratio suggests that during the extraction process some other organic compounds were probably used and not removed completely from the final product, and were responsible for new peaks or a shift in peaks, giving rise to a poor common variation peak ratio.
Similarly, the common peak ratio for Arjuna (reference sample) and for the Arjuna capsule (contains powder) was found to be 95%, while for Aawala (reference sample) and Amlaki rasayan (powdered sample) it was 85%. Similar results were found for other herbal samples and their formulations, and it was predicted that if the formulation contained crude drug alone, the common variation peak ratio was around 90% or above, and if some additional organic impurity had been added during processing and was still present in the drug, then the common variation peak ratio was low. Thus, this method could be useful in the quality control of herbal medicines.
Principal component analysis of FTIR data
PCA transforms the data from a real measurement space to a virtual feature space defined by the principal axes. In the measurement space there is often a high level of
information degeneracy, and PCA removes or at least minimizes this degeneracy (or redundancy), and the data representations in the feature space become sepa-rated. Projections of the original measurement samples onto the principal axes are called the principal compo-nents (PCs). PCA is geometrically thought of as rotation of the axes of the original coordinate system to a new set of orthogonal axes, ordered in terms of the amount of variance of the original data (Andrew, 2002). The first PC finds the direction along which the variance is maxi-mum; the second PC is defined by the direction orthog-onal to the first with maximum residual variance; and so on, until the total variance is accounted. By plotting the PCs in different projection planes one can visualize grouping or clustering (a cluster is a collection of objects that are similar among themselves and are dissimilar to objects belonging to other clusters) of samples accord-ing to similarities or differences among them. PCA analysis is all about visualization and interpretation of these groupings.
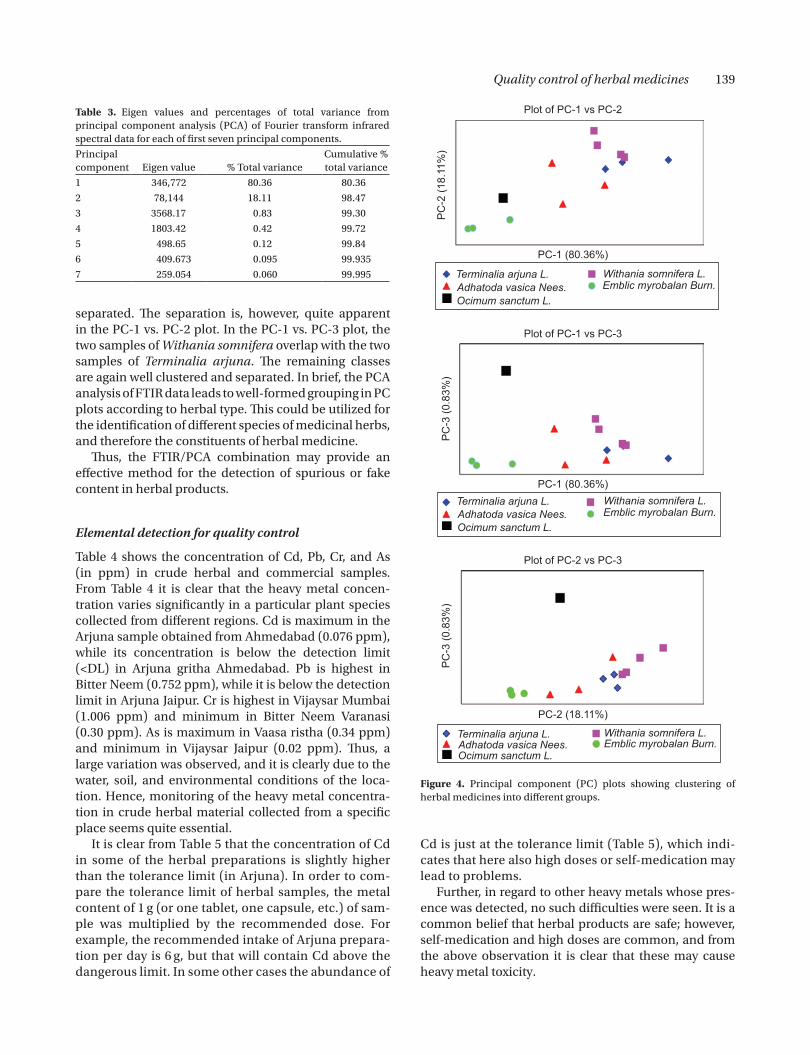
Table 3 provides information about the percentage of variance in different PCs. The first three PCs account for 99.30% of the total variance. The remaining 11 principal components account for only 0.70% of the variance in the data representation, and therefore are ignored for further consideration. The first principal component PC-1 dominates the variance in data representation, containing 80.36% of the total variance; PC-2 has 18.11% of total variance; and PC-3 has only 0.83%. Figure 4 shows various PC plots as indicated. It can be seen that, in all plots, the five classes of medicinal herbs are discernibly
5
4
3
2
1
Rat
io o
f the
are
a of
pea
ks
Terminalia arjuneEmblic myrobalanWithania somniferaAzadirachta indica
Adhatoda vasicaMurraya koenigi
Varanasi Jaipur Ahmedabad Mumbai
Place of procurement
Figure 3. Graph showing consistent nature of ratio of areas of marked characteristic peaks for herbal samples collected from different places.
Quality control of herbal medicines 139
separated. The separation is, however, quite apparent in the PC-1 vs. PC-2 plot. In the PC-1 vs. PC-3 plot, the two samples of Withania somnifera overlap with the two samples of Terminalia arjuna. The remaining classes are again well clustered and separated. In brief, the PCA analysis of FTIR data leads to well-formed grouping in PC plots according to herbal type. This could be utilized for the identification of different species of medicinal herbs, and therefore the constituents of herbal medicine.
Thus, the FTIR/PCA combination may provide an effective method for the detection of spurious or fake content in herbal products.
Elemental detection for quality control
Table 4 shows the concentration of Cd, Pb, Cr, and As (in ppm) in crude herbal and commercial samples. From Table 4 it is clear that the heavy metal concen-tration varies significantly in a particular plant species collected from different regions. Cd is maximum in the Arjuna sample obtained from Ahmedabad (0.076 ppm), while its concentration is below the detection limit (<DL) in Arjuna gritha Ahmedabad. Pb is highest in Bitter Neem (0.752 ppm), while it is below the detection limit in Arjuna Jaipur. Cr is highest in Vijaysar Mumbai (1.006 ppm) and minimum in Bitter Neem Varanasi (0.30 ppm). As is maximum in Vaasa ristha (0.34 ppm) and minimum in Vijaysar Jaipur (0.02 ppm). Thus, a large variation was observed, and it is clearly due to the water, soil, and environmental conditions of the loca-tion. Hence, monitoring of the heavy metal concentra-tion in crude herbal material collected from a specific place seems quite essential.
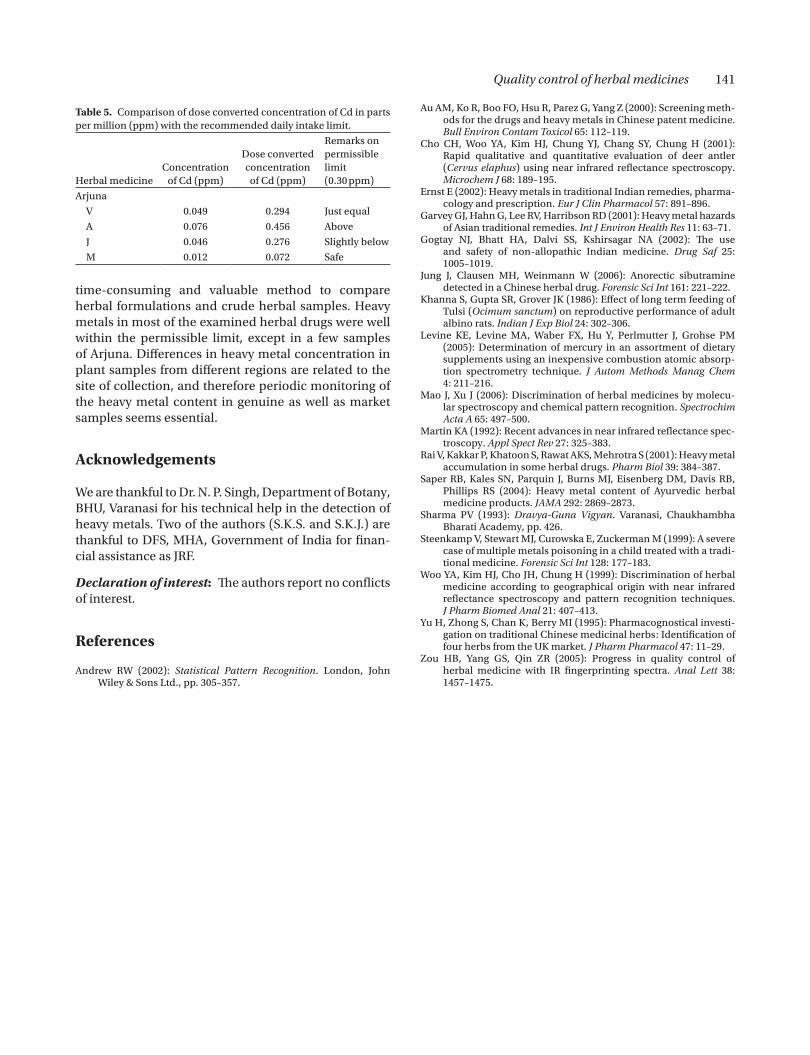
It is clear from Table 5 that the concentration of Cd in some of the herbal preparations is slightly higher than the tolerance limit (in Arjuna). In order to com-pare the tolerance limit of herbal samples, the metal content of 1 g (or one tablet, one capsule, etc.) of sam-ple was multiplied by the recommended dose. For example, the recommended intake of Arjuna prepara-tion per day is 6 g, but that will contain Cd above the dangerous limit. In some other cases the abundance of
Cd is just at the tolerance limit (Table 5), which indi-cates that here also high doses or self-medication may lead to problems.
Further, in regard to other heavy metals whose pres-ence was detected, no such difficulties were seen. It is a common belief that herbal products are safe; however, self-medication and high doses are common, and from the above observation it is clear that these may cause heavy metal toxicity.
Plot of PC-1 vs PC-2
Plot of PC-1 vs PC-3
Plot of PC-2 vs PC-3
PC-1 (80.36%)
Terminalia arjuna L.Adhatoda vasica Nees.Ocimum sanctum L.
Withania somnifera L.Emblic myrobalan Burn.
PC-1 (80.36%)Terminalia arjuna L.Adhatoda vasica Nees.Ocimum sanctum L.
Withania somnifera L.Emblic myrobalan Burn.
PC-2 (18.11%)
PC
-3 (0
.83%
)P
C-3
(0.8
3%)
PC
-2 (1
8.11
%)
Terminalia arjuna L.Adhatoda vasica Nees.Ocimum sanctum L.
Withania somnifera L.Emblic myrobalan Burn.
Figure 4. Principal component (PC) plots showing clustering of herbal medicines into different groups.
Table 3. Eigen values and percentages of total variance from principal component analysis (PCA) of Fourier transform infrared spectral data for each of first seven principal components.
Principal component Eigen value % Total variance
Cumulative % total variance
1 346,772 80.36 80.36
2 78,144 18.11 98.47
3 3568.17 0.83 99.30
4 1803.42 0.42 99.72
5 498.65 0.12 99.84
6 409.673 0.095 99.935
7 259.054 0.060 99.995

140 Sunil Kumar Singh et al.
Conclusions
Herbal plants/medicines can be identified clearly by the characteristic peaks of their FTIR spectra. FTIR–FPS
along with PCA analysis was found to be an excellent technique to discriminate different herbal plants/medicines for quality control. The quantitative simi-larity method was found to be a mathematical, less
Table 4. Heavy metal concentration (in ppm) in crude herbal/commercial Ayurvedic medicines.
Herbal medicine Cd Pb Cr As
Arjuna
V 0.049 ± 0.012 0.425 ± 0.038 0.105 ± 0.012 0.09 ± 0.003
A 0.076 ± 0.117 0.500 ± 0.042 0.070 ± 0.008 0.03 ± 0.002
J 0.046 ± 0.012 <DL 0.072 ± 0.008 0.08 ± 0.015
M 0.012 ± 0.000 0.423 ± 0.048 0.098 ± 0.008 0.12 ± 0.018
Powder* 0.035 ± 0.027 0.496 ± 0.046 0.246 ± 0.021 0.20 ± 0.033
Gritha* <DL 0.098 ± 0.008 0.195 ± 0.016 0.11 ± 0.008
Aawala
V 0.024 ± 0.003 0.265 ± 0.024 0.056 ± 0.003 0.07 ± 0.010
A 0.030 ± 0.002 0.210 ± 0.0016 0.101 ± 0.014 0.16 ± 0.032
J 0.033 ± 0.006 0.140 ± 0.012 0.095 ± 0.008 0.13 ± 0.021
M ND ND ND ND
Aswagandha
V 0.027 ± 0.002 0.030 ± 0.005 0.170 ± 0.013 0.15 ± 0.025
A 0.026 ± 0.003 0.110 ± 0.013 0.058 ± 0.006 0.24 ± 0.026
J 0.012 ± 0.002 0.230 ± 0.034 0.071 ± 0.007 0.06 ± 0.008
M 0.019 ± 0.004 0.260 ± 0.021 0.186 ± 0.01 0.27 ± 0.018
Tablet* 0.008 ± 0.001 0.010 ± 0.003 0.241 ± 0.042 0.28 ± 0.031
Powder* 0.032 ± 0.006 0.410 ± 0.033 .164 ± 0.009 0.09 ± 0.016
Capsule* < DL 0.060 ± 0.013 0.085 ± 0.013 0.12 ± 0.018
Tulsi
V 0.012 ± 0.002 0.286 ± 0.029 0.159 ± 0.009 ND
A 0.017 ± 0.003 0.330 ± 0.019 0.120 ± 0.011 0.03 ± 0.000
J 0.016 ± 0.002 0.396 ± 0.032 0.325 ± 0.038 ND
M 0.008 ± 0.001 0.460 ± 0.056 0.094 ± 0.010 ND
Vaasa
V 0.028 ± 0.005 0.060 ± 0.005 0.045 ± 0.004 0.18 ± 0.035
A 0.021 ± 0.002 0.110 ± 0.001 0.152 ± 0.018 0.22 ± 0.032
J 0.024 ± 0.002 0.096 ± 0.008 0.086 ± 0.016 0.14 ± 0.021
M ND ND ND ND
Vaasa ristha* 0.008 ± 0.001 0.560 ± 0.042 0.125 ± 0.018 0.34 ± 0.041
Vrihat Vaasavaleh* 0.032 ± 0.004 0.390 ± 0.026 0.428 ± 0.062 0.23 ± 0.034
Bitter Neem
V 0.001 ± 0.000 0.380 ± 0.000 0.030 ± 0.006 0.23 ± 0.041
A 0.033 ± 0.004 0.440 ± 0.033 0.091 ± 0.006 0.08 ± 0.000
J 0.022 ± 0.003 0.098 ± 0.009 0.050 ± 0.003 0.27 ± 0.035
M 0.006 ± 0.001 0.752 ± 0.082 0.056 ± 0.008 0.31 ± 0.048
Neem tablet* 0.009 ± 0.000 0.438 ± 0.037 0.248 ± 0.032 0.09 ± 0.006
Mithi Neem
V 0.024 ± 0.003 0.390 ± 0.032 0.044 ± 0.002 ND
A 0.012 ± 0.002 0.540 ± 0.075 0.086 ± 0.003 ND
J 0.003 ± 0.000 0.350 ± 0.071 0.108 ± 0.009 ND
M 0.016 ± 0.002 0.429 ± 0.048 0.156 ± 0.012 ND
Vijaysar
V 0.010 ± 0.002 0.098 ± 0.008 0.562 ± 0.073 ND
A 0.010 ± 0.002 0.684 ± 0.058 0.538 ± 0.054 0.08 ± 0.012
J <DL 0.536 ± 0.102 0.502 ± 0.036 0.02 ± 0.007
M 0.060 ± 0.012 0.087 ± 0.007 1.006 ± 0.206 ND
Values are mean ± SD for n = 3.V, Varanasi; A, Ahmedabad; J, Jaipur; M, Mumbai; ND, not detected; DL, detection limit. *Commercial sample.
Quality control of herbal medicines 141
time-consuming and valuable method to compare herbal formulations and crude herbal samples. Heavy metals in most of the examined herbal drugs were well within the permissible limit, except in a few samples of Arjuna. Differences in heavy metal concentration in plant samples from different regions are related to the site of collection, and therefore periodic monitoring of the heavy metal content in genuine as well as market samples seems essential.
Acknowledgements
We are thankful to Dr. N. P. Singh, Department of Botany, BHU, Varanasi for his technical help in the detection of heavy metals. Two of the authors (S.K.S. and S.K.J.) are thankful to DFS, MHA, Government of India for finan-cial assistance as JRF.
Declaration of interest: The authors report no conflicts of interest.
References
Andrew RW (2002): Statistical Pattern Recognition. London, John Wiley & Sons Ltd., pp. 305–357.
Au AM, Ko R, Boo FO, Hsu R, Parez G, Yang Z (2000): Screening meth-ods for the drugs and heavy metals in Chinese patent medicine. Bull Environ Contam Toxicol 65: 112–119.
Cho CH, Woo YA, Kim HJ, Chung YJ, Chang SY, Chung H (2001): Rapid qualitative and quantitative evaluation of deer antler (Cervus elaphus) using near infrared reflectance spectroscopy. Microchem J 68: 189–195.
Ernst E (2002): Heavy metals in traditional Indian remedies, pharma-cology and prescription. Eur J Clin Pharmacol 57: 891–896.
Garvey GJ, Hahn G, Lee RV, Harribson RD (2001): Heavy metal hazards of Asian traditional remedies. Int J Environ Health Res 11: 63–71.
Gogtay NJ, Bhatt HA, Dalvi SS, Kshirsagar NA (2002): The use and safety of non-allopathic Indian medicine. Drug Saf 25: 1005–1019.
Jung J, Clausen MH, Weinmann W (2006): Anorectic sibutramine detected in a Chinese herbal drug. Forensic Sci Int 161: 221–222.
Khanna S, Gupta SR, Grover JK (1986): Effect of long term feeding of Tulsi (Ocimum sanctum) on reproductive performance of adult albino rats. Indian J Exp Biol 24: 302–306.
Levine KE, Levine MA, Waber FX, Hu Y, Perlmutter J, Grohse PM (2005): Determination of mercury in an assortment of dietary supplements using an inexpensive combustion atomic absorp-tion spectrometry technique. J Autom Methods Manag Chem 4: 211–216.
Mao J, Xu J (2006): Discrimination of herbal medicines by molecu-lar spectroscopy and chemical pattern recognition. Spectrochim Acta A 65: 497–500.
Martin KA (1992): Recent advances in near infrared reflectance spec-troscopy. Appl Spect Rev 27: 325–383.
Rai V, Kakkar P, Khatoon S, Rawat AKS, Mehrotra S (2001): Heavy metal accumulation in some herbal drugs. Pharm Biol 39: 384–387.
Saper RB, Kales SN, Parquin J, Burns MJ, Eisenberg DM, Davis RB, Phillips RS (2004): Heavy metal content of Ayurvedic herbal medicine products. JAMA 292: 2869–2873.
Sharma PV (1993): Dravya-Guna Vigyan. Varanasi, Chaukhambha Bharati Academy, pp. 426.
Steenkamp V, Stewart MJ, Curowska E, Zuckerman M (1999): A severe case of multiple metals poisoning in a child treated with a tradi-tional medicine. Forensic Sci Int 128: 177–183.
Woo YA, Kim HJ, Cho JH, Chung H (1999): Discrimination of herbal medicine according to geographical origin with near infrared reflectance spectroscopy and pattern recognition techniques. J Pharm Biomed Anal 21: 407–413.
Yu H, Zhong S, Chan K, Berry MI (1995): Pharmacognostical investi-gation on traditional Chinese medicinal herbs: Identification of four herbs from the UK market. J Pharm Pharmacol 47: 11–29.
Zou HB, Yang GS, Qin ZR (2005): Progress in quality control of herbal medicine with IR fingerprinting spectra. Anal Lett 38: 1457–1475.
Table 5. Comparison of dose converted concentration of Cd in parts per million (ppm) with the recommended daily intake limit.
Herbal medicineConcentration
of Cd (ppm)
Dose converted concentration
of Cd (ppm)
Remarks on permissible limit (0.30 ppm)
Arjuna
V 0.049 0.294 Just equal
A 0.076 0.456 Above
J 0.046 0.276 Slightly below
M 0.012 0.072 Safe

Copyright of Pharmaceutical Biology is the property of Taylor & Francis Ltd and its content may not be copied
or emailed to multiple sites or posted to a listserv without the copyright holder's express written permission.
However, users may print, download, or email articles for individual use.
Copyright © 2022 FDOKUMEN