
Multivariate statistical tools for the evaluation of proteomic 2D-maps: recent achievements and...
14
Current Proteomics, 2007, 4, 53-66 53 1570-1646/07 $50.00+.00 ©2007 Bentham Science Publishers Ltd. Multivariate Statistical Tools for the Evaluation of Proteomic 2D-maps: Recent Achievements and Applications Emilio Marengo * , Elisa Robotti and Marco Bobba Department of Environmental and Life Sciences, University of Eastern Piedmont, Via Bellini 25/G, 15100 Alessandria, Italy Abstract: Two dimensional polyacrylamide gel electrophoresis (2D-PAGE) maps represent an unavoidable tool in many fields connected with proteome research, such as development of new diagnostic assays or new drugs. Unfortunately the information contained in the maps is often so complex that its recognition and extraction usually requires complex statisti- cal treatments. Statistics accompanies many phases of 2D-PAGE maps management - from the spot revelation to maps matching, as well as the extraction and rationalisation of useful information. This review describes and reports the most recent achievements in the field of statistical tools applied to proteome research by two-dimensional gel electrophoresis (2D-GE). The first section is devoted to briefly describe the theoretical aspects of the multivariate methods mostly adopted in this field such as Principal Component Analysis, Cluster Analysis, Classification methods, Artificial Neural Networks. The most recent applications are then described explaining the analysis of spot volume datasets from standard differential analysis as well as the direct analysis of 2D maps images. Applications are also reported about the use of mul- tivariate tools in the analysis of DNA and RNA profiles. Key Words: Principal component analysis, classification methods, linear discriminant analysis, soft-independent model of class analogy, image analysis, moment functions, fuzzy logic, spot volume data. INTRODUCTION Two dimensional gel-electrophoresis (2D-GE) has un- dergone a rapid development in the last few years for the separation and analysis of protein extracts in many fields of proteomic research, e.g. clinical chemistry, botany, microbi- ology, toxicology, food security and control. In spite of be- ing a very powerful tool for protein analysis, 2D-GE is char- acterised by low reproducibility, particularly due to the com- plexity of the specimen and instrumental technique adopted to obtain the final electrophoretic maps. The same limitation also limits one-dimensional (1D) gel electrophoresis (Righ- etti et al., 2001). The complexity of the sample covering a wide range of properties, structures and molecular weights contributes to the complexity of the final map. In addition, the instrumental technique itself (from sample preparation to the electrophoretic run) can further affect reproducibility of 2D-GE. These limitations of 2D-GE made it mandatory to use the dedicated software packages to analyse the information con- tained in two-dimensional maps (2D-maps) allowing to take into consideration in some way the intrinsic uncertainty of the technique. Many software became available in the last few years for the comparison of 2D-maps (PDQuest, Pro- genesis, Melanie, Z3, Phoretix, Z4000, etc.) (Anderson et al., 1981; Mahon et al., 2001; Rubinfeld et al., 2003). All com- mercial solutions available present advantages and disadvan *Address correspondence to this author at the Department of Environmental and Life Sciences - University of Eastern Piedmont - Via Bellini 25/G - 15100 Alessandria, Italy; Tel: +39 0131 360272; Fax: +39 0131 360250; E-mail: [email protected] tages (Almeida et al., 2005; Campostrini et al., 2005; Molloy et al., 2003; Moritz et al., 2003; Raman et al., 2002; Rosen- gren et al., 2003; Voss et al., 2000; Wheelock et al., 2005) but they are almost all based on a multi-step procedure per- forming the analysis of sets of 2D-maps from the digitalised images of the gels themselves, obtained by laser densitome- try, phosphor imaging and via a CCD camera. The analysis of digitalised images involves several steps (described here with particular reference to the PDQuest system (Garrels et al., 1979, 1984, 1989): 1) Scanning: it turns each gel image into pixel data and each pixel is characterised by x-y coordinates indicating its position on the 2D-image and a Z value corresponding to its signal intensity (optical density value - OD). 2) Filtering images: a pre-processing step eliminating noise, background effects, specks and imperfections. 3) Automated spot detection: a step identifying the spots present on each gel independently. The operator has to select: the faintest spot (to set the sensitivity and mini- mum peak value); the smallest spot (to set the size scale parameter); the largest spot (to set the maximum size of the spots to be detected). A final smoothing is applied to remove spots close to the background level. Spots are lo- cated on the gel image (i.e. each spot is identified by x-y coordinates indicating its position), substituted by ideal Gaussian distributions and quantified by the sum of the OD values within each Gaussian distribution. 4) Matching of protein profile: sets of 2D-gels can be edited and matched to one another in a “match set”. Each spot is matched to the same spot in all of the other gels of the set
-
Upload
independent -
Category
Documents
-
view
0 -
download
0
Transcript of Multivariate statistical tools for the evaluation of proteomic 2D-maps: recent achievements and...
Current Proteomics, 2007, 4, 53-66 53
1570-1646/07 $50.00+.00 ©2007 Bentham Science Publishers Ltd.
Multivariate Statistical Tools for the Evaluation of Proteomic 2D-maps: Recent Achievements and Applications
Emilio Marengo*, Elisa Robotti and Marco Bobba
Department of Environmental and Life Sciences, University of Eastern Piedmont, Via Bellini 25/G, 15100 Alessandria,
Italy
Abstract: Two dimensional polyacrylamide gel electrophoresis (2D-PAGE) maps represent an unavoidable tool in many
fields connected with proteome research, such as development of new diagnostic assays or new drugs. Unfortunately the
information contained in the maps is often so complex that its recognition and extraction usually requires complex statisti-
cal treatments. Statistics accompanies many phases of 2D-PAGE maps management - from the spot revelation to maps
matching, as well as the extraction and rationalisation of useful information. This review describes and reports the most
recent achievements in the field of statistical tools applied to proteome research by two-dimensional gel electrophoresis
(2D-GE). The first section is devoted to briefly describe the theoretical aspects of the multivariate methods mostly
adopted in this field such as Principal Component Analysis, Cluster Analysis, Classification methods, Artificial Neural
Networks. The most recent applications are then described explaining the analysis of spot volume datasets from standard
differential analysis as well as the direct analysis of 2D maps images. Applications are also reported about the use of mul-
tivariate tools in the analysis of DNA and RNA profiles.
Key Words: Principal component analysis, classification methods, linear discriminant analysis, soft-independent model of class analogy, image analysis, moment functions, fuzzy logic, spot volume data.
INTRODUCTION
Two dimensional gel-electrophoresis (2D-GE) has un-
dergone a rapid development in the last few years for the
separation and analysis of protein extracts in many fields of
proteomic research, e.g. clinical chemistry, botany, microbi-
ology, toxicology, food security and control. In spite of be-
ing a very powerful tool for protein analysis, 2D-GE is char-
acterised by low reproducibility, particularly due to the com-
plexity of the specimen and instrumental technique adopted
to obtain the final electrophoretic maps. The same limitation
also limits one-dimensional (1D) gel electrophoresis (Righ-
etti et al., 2001). The complexity of the sample covering a
wide range of properties, structures and molecular weights
contributes to the complexity of the final map. In addition,
the instrumental technique itself (from sample preparation to
the electrophoretic run) can further affect reproducibility of
2D-GE.
These limitations of 2D-GE made it mandatory to use the
dedicated software packages to analyse the information con-
tained in two-dimensional maps (2D-maps) allowing to take
into consideration in some way the intrinsic uncertainty of
the technique. Many software became available in the last
few years for the comparison of 2D-maps (PDQuest, Pro-
genesis, Melanie, Z3, Phoretix, Z4000, etc.) (Anderson et al.,
1981; Mahon et al., 2001; Rubinfeld et al., 2003). All com-
mercial solutions available present advantages and disadvan
*Address correspondence to this author at the Department of Environmental
and Life Sciences - University of Eastern Piedmont - Via Bellini 25/G -
15100 Alessandria, Italy; Tel: +39 0131 360272; Fax: +39 0131 360250;
E-mail: [email protected]
tages (Almeida et al., 2005; Campostrini et al., 2005; Molloy
et al., 2003; Moritz et al., 2003; Raman et al., 2002; Rosen-
gren et al., 2003; Voss et al., 2000; Wheelock et al., 2005)
but they are almost all based on a multi-step procedure per-
forming the analysis of sets of 2D-maps from the digitalised
images of the gels themselves, obtained by laser densitome-
try, phosphor imaging and via a CCD camera. The analysis
of digitalised images involves several steps (described here
with particular reference to the PDQuest system (Garrels et
al., 1979, 1984, 1989):
1) Scanning: it turns each gel image into pixel data and each
pixel is characterised by x-y coordinates indicating its
position on the 2D-image and a Z value corresponding to
its signal intensity (optical density value - OD).
2) Filtering images: a pre-processing step eliminating noise,
background effects, specks and imperfections.
3) Automated spot detection: a step identifying the spots
present on each gel independently. The operator has to
select: the faintest spot (to set the sensitivity and mini-
mum peak value); the smallest spot (to set the size scale
parameter); the largest spot (to set the maximum size of
the spots to be detected). A final smoothing is applied to
remove spots close to the background level. Spots are lo-
cated on the gel image (i.e. each spot is identified by x-y
coordinates indicating its position), substituted by ideal
Gaussian distributions and quantified by the sum of the
OD values within each Gaussian distribution.
4) Matching of protein profile: sets of 2D-gels can be edited
and matched to one another in a “match set”. Each spot is
matched to the same spot in all of the other gels of the set
54 Current Proteomics, 2007, Vol. 4, No. 1 Marengo et al.
under investigation. For this purpose, landmarks are
needed. Reference spots are used by PDQuest to align
and position match set members for matching. The iden-
tification of the landmarks sets some parameters account-
ing for distortions existing among the gels to be com-
pared.
5) Normalisation: it is applied to the maps to compensate
gel-to-gel variations due to sample preparation and load-
ing as well as staining and destaining procedures etc.
6) Differential analysis: it allows the comparison of differ-
ent sets of 2D-maps i.e. control and diseased samples.
Within each group of 2D-maps, a “sample group” is cre-
ated containing the average values of all the spots identi-
fied. The comparison of the groups is carried out on
“sample groups” to find differentially expressed proteins.
Usually, only spots showing a two-fold variation are ac-
cepted as significantly changed (100% variation). This
procedure allows to avoid differences due to the large
experimental error rather than actual systematic varia-
tions.
7) Statistical analysis: it is applied to identify the differen-
tially expressed proteins. Statistical analysis is usually
based on Student’s t-test (p<0.05).
Since the final result of the overall procedure appears to
depend on the accuracy of the software package adopted, the
choice of the most suitable analysis software is critical. Thus
the step of image analysis adds another source of uncertainty
to the final result.
Commercial software packages are certainly powerful
tools for 2D-maps analysis but they present two main disad-
vantages. The first one is related to human interference (in-
troduced mainly in steps 2 and 3) and the second one is re-
lated to the problem of replicas. The comparison of groups
of 2D-maps (i.e. control and diseased or control and drug
treated) is usually performed on the basis of the “sample
group” obtained for each class. In this way, single replicas
are not considered and the information about the reproduci-
bility of the maps is not taken into proper consideration.
In summary, the large number of spots present on each
map and the low reproducibility of 2D gel-electrophoresis
makes it worse to achieve a clear classification of samples
and difficult to use 2D-PAGE maps for diagnostic/pro-
gnostic purposes or for drug-design studies. Mainly for these
reasons, many papers have recently appeared in literature
making use of robust multivariate statistical tools for the
evaluation of sets of 2D-maps. The multivariate methods
developed can be applied both to spot volume datasets com-
ing from the differential analysis carried out by classical
software packages or to the direct analysis of 2D-PAGE im-
ages.
This review reports the more recent applications of mul-
tivariate tools to the analysis of spot volume datasets (or to
profiles of DNA and RNA fragments) as well as to the
analysis of 2D-maps images. First, a section is devoted to
give insight on the theoretical aspects of the most wide-
spread multivariate tools applied in proteomics. Later, a sec-
tion is devoted to some applications of artificial neural net-
works.
THEORY
Principal Component Analysis
PCA (Massart et al., 1988; Vandeginste et al., 1998) is a
multivariate pattern recognition method representing the
objects, described by the original variables, into a new refer-
ence system given by new variables called Principal Compo-
nents (PCs). Each PC is calculated so that it explains the
maximum possible amount of residual variance contained in
the original dataset. The PCs are calculated hierarchically.
The first one explains the maximum variance and the second
one carries the maximum residual variance and so on. In this
way, experimental noise and random variations are collected
in the last PCs (this is true if experimental noise represents a
minor contribution with respect to systematic variations). In
addition, PCs show other important features: they are related
to the original reference system since they represent a linear
combination of the original variables; they are orthogonal to
each other thus containing independent sources of informa-
tion; their hierarchical structure makes a dimensionality re-
duction of the original dataset possible considering only few
PCs accounting for the most significant amount of variance.
The results of PCA provide two main tools for data
analysis: the scores (the co-ordinates of the samples in the
new reference system) and the loadings (the weights of the
original variables on each PC). The analysis of score and
loading plots (score and loadings represented on the space
given by two PCs at a time) allows to reach two main tar-
gets: a) the identification of groups of samples (score plot)
showing a similar or opposite behaviour (samples grouped
together or in opposite positions with respect to the origin of
the axes); b) the identification of the reasons (loading plot)
for the similarities and diversities identified within the sam-
ples. Therefore, PCA is a very powerful visualisation tool
which allows the representation of multivariate datasets by
means of only few PCs identified as the most relevant.
Cluster Analysis
Cluster analysis techniques are unsupervised pattern rec-
ognition methods that allow to identify the existence of
groups of samples or variables in a dataset through the inves-
tigation of the relationships between the objects or the vari-
ables. The most used clustering methods belong to the ag-
glomerative hierarchical methods (Massart et al., 1983,
1988; Vandeginste et al., 1998) where the objects are
grouped (linked together) on the basis of a measure of their
similarity. The most similar objects or groups of objects are
linked first. The final result is a graph (dendrogram) where
the objects are represented on the X axis and are connected
at decreasing levels of similarity along the Y axis.
The results of hierarchical clustering methods depend on
the specific measure of similarity and on the linking method
adopted so, different methods are usually applied to have a
general idea of the number of groups present. Clustering
techniques can be applied both to the original variables and
Multivariate Tools in 2D-maps Evaluation Current Proteomics, 2007, Vol. 4, No. 1 55
to the results of PCA (scores of the significant PCs) thus
achieving a clustering of the samples eliminating the contri-
bution of experimental error and exploiting only useful
sources of variation.
Classification Methods
Several multivariate supervised classification methods
are available in literature; linear discriminant analysis
(LDA), soft-independent model of class analogy (SIMCA)
and partial least squares discriminant analysis (PLS-DA) will
be briefly described below since they have recently been
exploited for classification purposes in proteomic datasets.
Linear Discriminant Analysis
LDA (Eisenbeis et al., 1972; Klecka et al., 1980) is a
Bayesian classification method performing the classification
of the samples present in a dataset considering its multivari-
ate structure.
In Bayesian classification methods, an object x is as-
signed to the class g for which the posterior probability
P(g/x) is maximum:
=
k
k
g
xkfP
xgfPxgP
)/(
)/()/(
where Pg is the prior probability of class g; Pk is the prior
probability of class k (k g); )/( xgf is the probability
density function of class g; )/( xkf is the probability den-
sity function of class k.
Each class is usually described by a Gaussian multivari-
ate probability distribution:
))()(2/1(
2/12/
1
||)2()|( gig
Tgi cxScx
g
p
ge
S
Pxgf =
where Pg is the prior probability of class g; Sg is the covari-
ance matrix of class g; cg is the centroid of class g; p is the
number of descriptors.
The argument of the exponential function is the Mahala-
nobis distance between object x and the centroid of the class
g and it takes into consideration the class covariance struc-
ture (i.e. its shape) since it contains the covariance matrix.
Each object is classified in class g if the so-called discrimi-
nant score is minimum:
D(g | x) = (xi cg )T Sg
1 (xi cg ) + ln | Sg | 2 lnPg
In LDA, the covariance matrix of each class is approxi-
mated with the pooled (between the classes) covariance ma-
trix and all the classes are considered as having a common
shape (i.e. a weighted average of the shape of the classes
present).
The variables contained in the LDA model discriminating
the classes present in the dataset can be chosen by a stepwise
algorithm, selecting iteratively the most discriminating vari-
ables. As already mentioned for Cluster Analysis, LDA can
be performed on both the original variables or on principal
components.
Soft-Independent Model of Class- Analogy
SIMCA classification method (Wold, 1976) is based on
PCA. Each class is described by its relevant PCs. The sam-
ples of each class are contained in the so-called SIMCA
boxes defined by the relevant PCs of each class. Describing
each class by its relevant PCs corresponds to classify the
samples not taking into account the experimental uncertainty
and spurious information. This method is also useful when
small datasets are analysed (more variables than objects)
since it performs a substantial dimensionality reduction.
SIMCA classification starts with a previous PCA calcu-
lated on each class independently with the identification of
the relevant PCs for each class: they define the so-called
class model.
The classification rule of object i is based on a Fisher’s
F-test so that object i is classified in class g if:
2
2
g
ig
rsd
rsd< ))1)((2,1,( == gggg AnApApcriticF
where rsdig is the residual standard deviation of object i on
class g; rsdg is the residual standard deviation of class g;
Fcritic is the critical value of F defining the SIMCA box; is
the significance level (usually set at 0.05, corresponding to a
probability level of 95%); 1, 2 are the degrees of freedom
of the numerator and denominator of the F-test respectively.
SIMCA gives some important statistics useful for a deep
analysis of the classification performed. The Modelling
Power (MP) of each variable on each class model is a meas-
ure of the weight that each variable presents on each class
model, i.e. the ability of the variable of describing and char-
acterising the corresponding class, defined as:
vc
vc
vcsd
rsdMP = 1
where sdvc is the standard deviation of variable v on class c;
rsdvc is the residual standard deviation of variable v of the
objects of class c from the model of their own class.
The modelling power ranges from 0 (variable irrelevant
on the definition of the class model) to 1.
The Discrimination Power (DP) is instead a measure of
the ability of each variable to discriminate between two
classes (c and g) at a time. The greater the discrimination
power, the more a variable weights on the classification of
an object in class c or g. It is defined as:
vgvc
vgcvcg
vcrsdrsd
rsdrsdDP
22
22
+
+=
where rsd2
vcg is the square residual standard deviation of
variable v of the objects of class c from the model of class g;
( ,v1=p–Ag,v2=(p–Ag)(ng –Ag –1))
56 Current Proteomics, 2007, Vol. 4, No. 1 Marengo et al.
rsd2
vgc is the square residual standard deviation of variable v
of the objects of class g from the model of class c; rsd2
vc is
the square residual standard deviation of variable v of the
objects of class c from the model of their own class; rsd2
vg is
the square residual standard deviation of variable v of the
objects of class g from the model of their own class.
The discrimination power is defined positive, but can
assume positive or negative values (it is not limited e.g. from
0 to 1).
Partial Least Squares – Discriminant Analysis (PLS-DA)
Partial Least Squares (PLS) (De Noord et al., 1994; Kle-
inbaum et al., 1988; Martens et al., 1989) is a multivariate
regression method allowing to establish a relationship be-
tween one or more dependent variables (Y) and a group of
descriptors (X). X- and Y-variables are modelled simultane-
ously to find the latent variables (LVs) in X that will predict
the latent variables in Y and at the same time account for the
largest possible information present in X. So, in this case the
latent variables are selected on the basis of explaining con-
temporarily both descriptors and predictors. These latent
variables are similar to the principal components calculated
from PCA - the first one accounts for the largest amount of
information followed by the other components that account
for the maximum residual variance. As for PCs, the last LVs
are mostly responsible for random variations and experimen-
tal error. The optimal number of LVs, i.e. modelling infor-
mation in X useful to predict the response Y but avoiding
overfitting, is determined on the basis of the residual vari-
ance in prediction. Cross-validation techniques are adopted
for evaluating the predictive ability and select the optimal
number of latent variables.
PLS was contrived to model continuous responses but it
can be applied even for classification purposes by establish-
ing an appropriate Y related to the belonging of each sample
to a class. In this case it is called Partial Least Squares – Dis-
criminant Analysis (PLS-DA). In the case of proteomic data,
one response variable for each group of samples is usually
adopted. Each response variable is assigned a 1 value for the
samples belonging to the corresponding class and a 0 value
for the samples belonging to the other classes.
Artificial Neural Networks
Artificial Neural Networks (ANNs) (Zupan and Gastei-
ger, 1993) are mathematical algorithms that allow to solve
complex problems by simulating the human brain function-
ing. Back-Propagation Artificial Neural Networks (BP-
ANNs) are mainly dedicated to model the behaviour of com-
plex systems where they usually provide better results than
Ordinary Least Squares (OLS) especially when non-linear
relationships are present. The main problem connected with
their application is due to the big risk of overfitting which
must be handled with particular care.
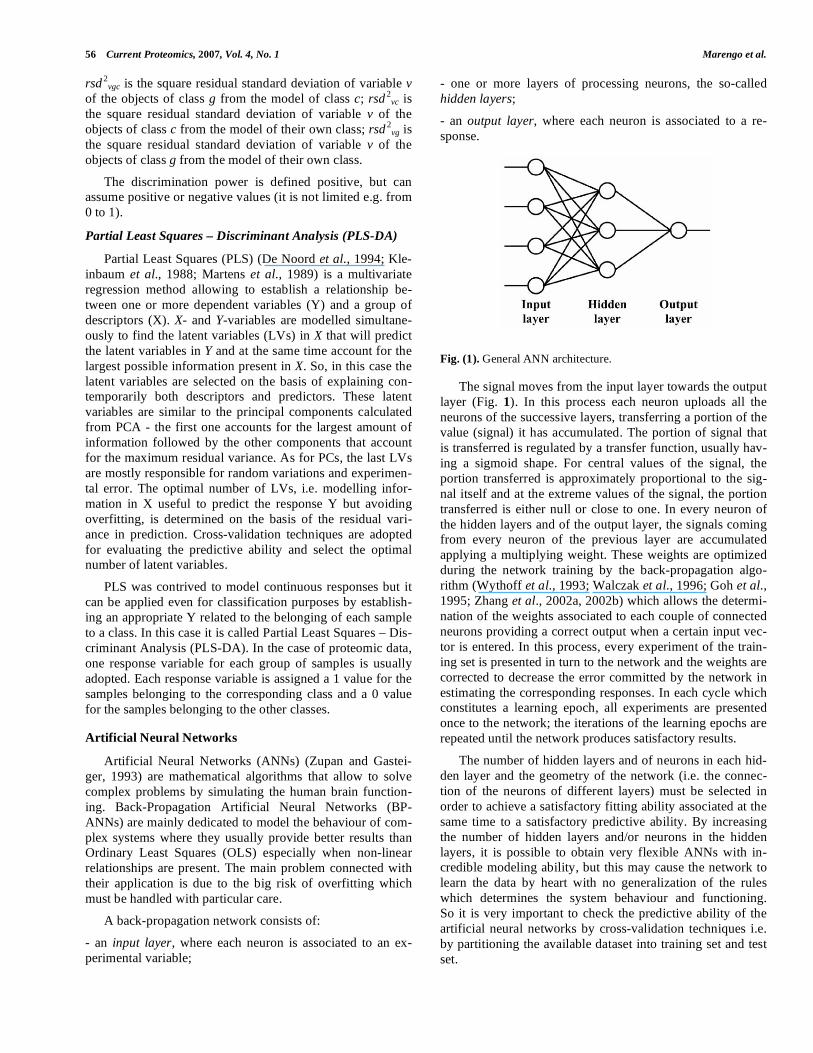
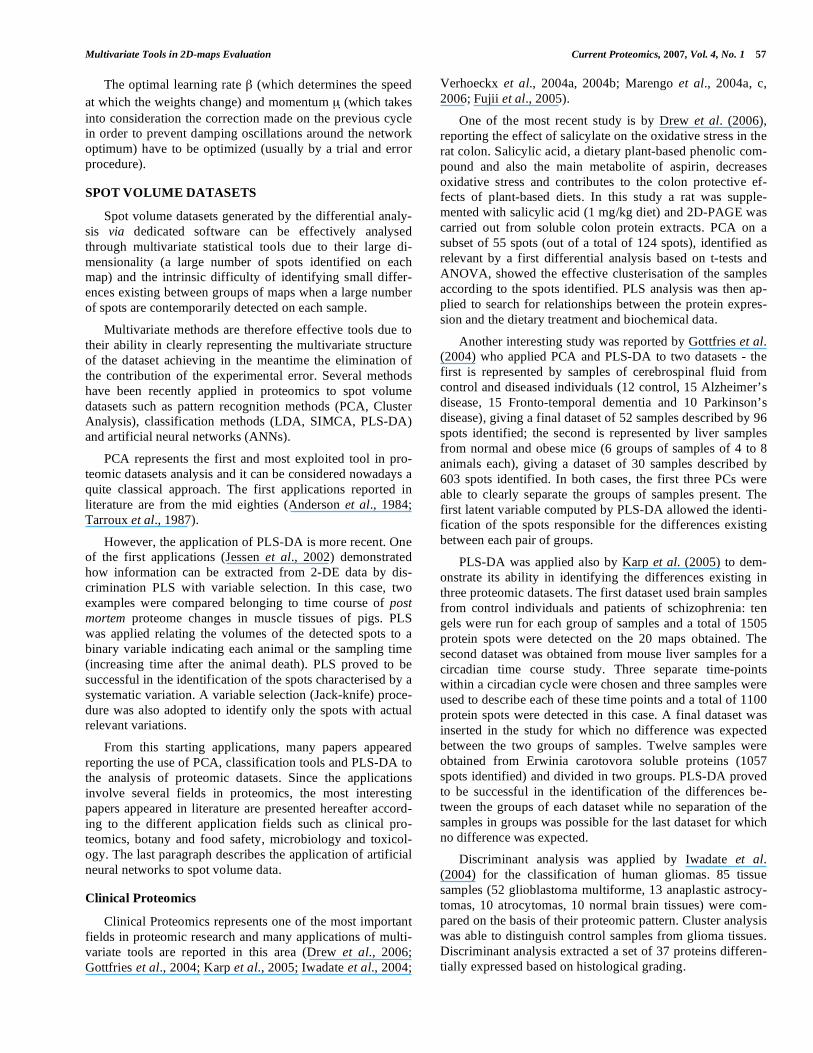
A back-propagation network consists of:
- an input layer, where each neuron is associated to an ex-
perimental variable;
- one or more layers of processing neurons, the so-called
hidden layers;
- an output layer, where each neuron is associated to a re-
sponse.
Fig. (1). General ANN architecture.
The signal moves from the input layer towards the output
layer (Fig. 1). In this process each neuron uploads all the
neurons of the successive layers, transferring a portion of the
value (signal) it has accumulated. The portion of signal that
is transferred is regulated by a transfer function, usually hav-
ing a sigmoid shape. For central values of the signal, the
portion transferred is approximately proportional to the sig-
nal itself and at the extreme values of the signal, the portion
transferred is either null or close to one. In every neuron of
the hidden layers and of the output layer, the signals coming
from every neuron of the previous layer are accumulated
applying a multiplying weight. These weights are optimized
during the network training by the back-propagation algo-
rithm (Wythoff et al., 1993; Walczak et al., 1996; Goh et al.,
1995; Zhang et al., 2002a, 2002b) which allows the determi-
nation of the weights associated to each couple of connected
neurons providing a correct output when a certain input vec-
tor is entered. In this process, every experiment of the train-
ing set is presented in turn to the network and the weights are
corrected to decrease the error committed by the network in
estimating the corresponding responses. In each cycle which
constitutes a learning epoch, all experiments are presented
once to the network; the iterations of the learning epochs are
repeated until the network produces satisfactory results.
The number of hidden layers and of neurons in each hid-
den layer and the geometry of the network (i.e. the connec-
tion of the neurons of different layers) must be selected in
order to achieve a satisfactory fitting ability associated at the
same time to a satisfactory predictive ability. By increasing
the number of hidden layers and/or neurons in the hidden
layers, it is possible to obtain very flexible ANNs with in-
credible modeling ability, but this may cause the network to
learn the data by heart with no generalization of the rules
which determines the system behaviour and functioning.
So it is very important to check the predictive ability of the
artificial neural networks by cross-validation techniques i.e.
by partitioning the available dataset into training set and test
set.
Multivariate Tools in 2D-maps Evaluation Current Proteomics, 2007, Vol. 4, No. 1 57
The optimal learning rate (which determines the speed
at which the weights change) and momentum μ (which takes
into consideration the correction made on the previous cycle
in order to prevent damping oscillations around the network
optimum) have to be optimized (usually by a trial and error
procedure).
SPOT VOLUME DATASETS
Spot volume datasets generated by the differential analy-
sis via dedicated software can be effectively analysed
through multivariate statistical tools due to their large di-
mensionality (a large number of spots identified on each
map) and the intrinsic difficulty of identifying small differ-
ences existing between groups of maps when a large number
of spots are contemporarily detected on each sample.
Multivariate methods are therefore effective tools due to
their ability in clearly representing the multivariate structure
of the dataset achieving in the meantime the elimination of
the contribution of the experimental error. Several methods
have been recently applied in proteomics to spot volume
datasets such as pattern recognition methods (PCA, Cluster
Analysis), classification methods (LDA, SIMCA, PLS-DA)
and artificial neural networks (ANNs).
PCA represents the first and most exploited tool in pro-
teomic datasets analysis and it can be considered nowadays a
quite classical approach. The first applications reported in
literature are from the mid eighties (Anderson et al., 1984;
Tarroux et al., 1987).
However, the application of PLS-DA is more recent. One
of the first applications (Jessen et al., 2002) demonstrated
how information can be extracted from 2-DE data by dis-
crimination PLS with variable selection. In this case, two
examples were compared belonging to time course of post
mortem proteome changes in muscle tissues of pigs. PLS
was applied relating the volumes of the detected spots to a
binary variable indicating each animal or the sampling time
(increasing time after the animal death). PLS proved to be
successful in the identification of the spots characterised by a
systematic variation. A variable selection (Jack-knife) proce-
dure was also adopted to identify only the spots with actual
relevant variations.
From this starting applications, many papers appeared
reporting the use of PCA, classification tools and PLS-DA to
the analysis of proteomic datasets. Since the applications
involve several fields in proteomics, the most interesting
papers appeared in literature are presented hereafter accord-
ing to the different application fields such as clinical pro-
teomics, botany and food safety, microbiology and toxicol-
ogy. The last paragraph describes the application of artificial
neural networks to spot volume data.
Clinical Proteomics
Clinical Proteomics represents one of the most important
fields in proteomic research and many applications of multi-
variate tools are reported in this area (Drew et al., 2006;
Gottfries et al., 2004; Karp et al., 2005; Iwadate et al., 2004;
Verhoeckx et al., 2004a, 2004b; Marengo et al., 2004a, c,
2006; Fujii et al., 2005).
One of the most recent study is by Drew et al. (2006),
reporting the effect of salicylate on the oxidative stress in the
rat colon. Salicylic acid, a dietary plant-based phenolic com-
pound and also the main metabolite of aspirin, decreases
oxidative stress and contributes to the colon protective ef-
fects of plant-based diets. In this study a rat was supple-
mented with salicylic acid (1 mg/kg diet) and 2D-PAGE was
carried out from soluble colon protein extracts. PCA on a
subset of 55 spots (out of a total of 124 spots), identified as
relevant by a first differential analysis based on t-tests and
ANOVA, showed the effective clusterisation of the samples
according to the spots identified. PLS analysis was then ap-
plied to search for relationships between the protein expres-
sion and the dietary treatment and biochemical data.
Another interesting study was reported by Gottfries et al.
(2004) who applied PCA and PLS-DA to two datasets - the
first is represented by samples of cerebrospinal fluid from
control and diseased individuals (12 control, 15 Alzheimer’s
disease, 15 Fronto-temporal dementia and 10 Parkinson’s
disease), giving a final dataset of 52 samples described by 96
spots identified; the second is represented by liver samples
from normal and obese mice (6 groups of samples of 4 to 8
animals each), giving a dataset of 30 samples described by
603 spots identified. In both cases, the first three PCs were
able to clearly separate the groups of samples present. The
first latent variable computed by PLS-DA allowed the identi-
fication of the spots responsible for the differences existing
between each pair of groups.
PLS-DA was applied also by Karp et al. (2005) to dem-
onstrate its ability in identifying the differences existing in
three proteomic datasets. The first dataset used brain samples
from control individuals and patients of schizophrenia: ten
gels were run for each group of samples and a total of 1505
protein spots were detected on the 20 maps obtained. The
second dataset was obtained from mouse liver samples for a
circadian time course study. Three separate time-points
within a circadian cycle were chosen and three samples were
used to describe each of these time points and a total of 1100
protein spots were detected in this case. A final dataset was
inserted in the study for which no difference was expected
between the two groups of samples. Twelve samples were
obtained from Erwinia carotovora soluble proteins (1057
spots identified) and divided in two groups. PLS-DA proved
to be successful in the identification of the differences be-
tween the groups of each dataset while no separation of the
samples in groups was possible for the last dataset for which
no difference was expected.
Discriminant analysis was applied by Iwadate et al.
(2004) for the classification of human gliomas. 85 tissue
samples (52 glioblastoma multiforme, 13 anaplastic astrocy-
tomas, 10 atrocytomas, 10 normal brain tissues) were com-
pared on the basis of their proteomic pattern. Cluster analysis
was able to distinguish control samples from glioma tissues.
Discriminant analysis extracted a set of 37 proteins differen-
tially expressed based on histological grading.
58 Current Proteomics, 2007, Vol. 4, No. 1 Marengo et al.
PCA was applied to identify the differences due to
macrophage maturation in the U937 human lymphoma cell
line (Verhoeckx et al., 2004a). PCA was able to identify the
variations between samples belonging to different macro-
phage maturation times; usual t-tests identified a smaller
number of biomarkers. A similar application of the multi-
variate procedure (Verhoeckx et al., 2004b) involves the
characterisation of anti-inflammatory compounds.
Some studies by Marengo et al. (2004a, c, 2006) make
use of PCA coupled to both cluster analysis and classifica-
tion tools to identify the differences between groups of maps.
The first paper (Marengo et al., 2004a) describes the study of
two different cell lines of control and drug-treated pancreatic
ductal carcinoma cells. A total of 435 spots was identified
from 18 samples. The first three PCs calculated by PCA al-
lowed the clear separation of the four groups of samples. The
results were further confirmed by cluster analysis.
The other two studies (Marengo et al., 2004c, 2006) de-
scribe the use of SIMCA to the classification of proteomic
maps. The first application (Marengo et al., 2006) showed
PCA effectiveness in the identification of the differences
between adrenal glands proteomic profiles belonging to
healthy and diseased nude mice. SIMCA was applied for the
classification of the samples in the two classes and it was
able to correctly classify all the samples (the first PC in the
SIMCA model of each class) and allowed the identification
of the most discriminating spots (analysis of the discriminat-
ing powers). 84 polypeptide chains were found to be up- or
down-regulated out of a total of 700 spots detected. A simi-
lar approach was followed by the same authors for compar-
ing the phenotypic expression of mantle cell lymphoma
GRANTA-519 and MAVER-1 cell lines (Marengo et al.,
2004c). Even in this case, PCA and SIMCA were able to
correctly classify the samples present and to identify the rea-
sons responsible for the differences identified.
Finally, Fujii et al. (2005) studied the histological sub-
types of lymphoid neoplasms over 42 cell lines from human
lymphoid neoplasms. Different statistical methods were used
to identify the discriminating spots: (i) Wilcoxon or
Kruskal–Wallis tests to find the spots whose intensity was
significantly (p<0.05) different among the cell line groups,
(ii) statistical-learning methods to prioritize the spots accord-
ing to their contribution to the classification, and (iii) unsu-
pervised classification methods to validate the classification
robustness by the selected spots. 31 spots resulted to be sig-
nificant and 24 were also identified by mass spectrometry.
Botany and Food Safety
Two of the first applications of multivariate techniques to
proteomic datasets in botany and in the field of food quality
and control were by Dewettinck et al. (1997) and Alika et al.
(1995). In these applications, the samples were not described
by the spot volumes (the authors applied SDS-PAGE) but by
the volume profile along the SDS strip. The study by Dewet-
tinck et al. (1997) reported the use of PCA and discriminant
analysis for the comparison of SDS-PAGE profiles of four
Belgian cheeses (Passendale, Wijnendale, Nazareth and Oud
Brugge compared to other international brands) with differ-
ent grades of maturity. PCA was able to separate Nazareth
and Oud Brugge and in a minor way Passendale and Wi-
jnendale. Discriminant Analysis allowed the correct classifi-
cation of the four samples.
Another study by Alika et al. (1995), was devoted to the
characterisation of 27 maize accessions (Bendel State, Nige-
ria) through the different band mobility of maize zein protein
in SDS-PAGE, coupled to PCA and cluster analysis. Cluster
analysis identified five clusters while PCA separated the
accessions with yellow kernels from those with early matur-
ity. Moreover, samples from the same geographical area
were grouped together.
More recently two different studies were done by
Tuomainen et al. (2006) and Lilley et al. (2006). Tuomainen
et al. (2006) reported the application of PCA to the spot vol-
umes of three plant accessions (Thlaspi caerulescens) at
various metal (Zn and Cu) exposures in order to verify metal
hyper-accumulation in plants. PCA was applied to verify the
separation of the protein profiles of the three plant acces-
sions at various metal exposures and to detect groups of pro-
teins responsible for the differences. PCA allowed a clear
separation of the samples according to the type of accession
while the effects of metal exposures were less pronounced.
48 spots were identified as relevant in the differentiation of
the groups of samples. The possible roles of some of the pro-
teins in heavy metal accumulation and tolerance were also
discussed. On the contrary, Lilley et al. (2006) reported the
use of methods for quantitative proteomics for the charac-
terisation of plant organelle.
Another interesting application in the field of food qual-
ity and control is by Kjaersgard et al. (2006) who studied the
change in the proteomic profile of cod muscle samples dur-
ing different storage conditions. The authors studied 11 stor-
age conditions including the storage temperature (studied at
two levels), the storage period (studied at 4 levels) and the
chill storage period (studied at 5 levels). Each sample was
replicated twice on different batches. The application of
PCA allowed the separation of the samples according to the
frozen storage time while no information emerged about the
other two parameters. PLS-DA with variable selection (jack-
knife procedure) was then applied to identify the spots rele-
vant for the differentiation of the samples according to the
storage time.
Finally, Olias et al. (2006) investigated whether dry-
cured hams from two European countries can be distin-
guished using SDS-PAGE. The dataset consisted of 37
commercial hams (19 Spanish, 18 French). 4 protein frac-
tions were extracted from each sample (each fraction ana-
lysed in triplicate lanes). The complete extraction process
was carried out in duplicate. In total, 118 gels were analyzed.
The inter-gel registration was carried out using a genetic
algorithm (GA). Feature selection was also performed using
a GA to pass subsets of features to the LDA routine. Cross-
validated classification success rates were 84, 91, 81 and
85%, respectively for the four fractions. SDS-PAGE proved
to be a sufficiently quantitative method and the authors con-
Multivariate Tools in 2D-maps Evaluation Current Proteomics, 2007, Vol. 4, No. 1 59
cluded that it can be potentially used to verify the regional
speciality dry-cured hams.
Microbiology
Some of the first applications of PCA and cluster analysis
to the study of DNA and RNA fragments of several biologi-
cal systems in the field of microbiology were done by Couto
et al. (1995), Johansson et al. (1995) and Boon et al. (2002).
The study by Boon et al. (2002) reported the diversity of
bacterial groups of activated sludge samples that received
waste water from four different types of industry by PCR-
DGGE. Statistical analysis and Shannon diversity index
evaluation of the band patterns were used to identify the dif-
ferences between the samples. Cluster analysis, multidimen-
sional scaling and PCA clearly clustered two of the four ac-
tivated sludge types separately.
Other applications were from the group of Gadea (1999,
2000) who studied the immunological diagnosis of hydatido-
sis. The first study (Gadea et al., 2000) reported the applica-
tion of discriminant techniques to serological patterns ob-
tained by Enzyme-linked Immuno-electro-Transfer Blotting
(EITB) and by conventional immunological tests in order to
differentiate the residual antibody patterns present in healed
hydatidosis from the ones present in active hydatidosis. Dis-
criminant analysis of the serological patterns obtained by
EITB and conventional serology correctly classified 92.54%
of patients (93.3% if patients are differentiated according to
the time elapsed since surgery). This method detected the
presence of active hydatidosis in 95.6% of patients for whom
abdominal ultrasonography had confirmed the presence of
active hydatid cysts. The global specificity was 88.9%.
A previous study from the same authors (Gadea et al.,
1999) reported a similar case where the method was applied
to 67 patients, 25 with active hydatid cysts (24 hepatic and 1
pulmonary) and 42 without a history of hydatid disease and
was compared with the results obtained by conventional
serology. IETB and discriminant analysis were more
sensitive than conventional serological diagnosis and
detected 100% of patients with an active hepatic hydatid cyst
with a 100% specificity. However, this method failed to
detect an uncomplicated hyaline pulmonary hydatid cyst.
Kovarova and co-workers (1998, 2000) and De Moor and
co-workers (2003) carried out some of the first applications
of multivariate tools to microarray data. More recently, Cor-
rea et al. (2007) evaluated the effect of plant variety and
Azospirillum brasilense inoculation on the microbial com-
munities colonizing roots and leaves of tomato plants. Mi-
crobial communities of the rhizoplane and phyllosphere were
analysed by DGGE of PCR-amplified 16S rRNA, sixty days
after planting. Differences on the bacterial communities be-
tween the two tomato types were detected by PCA of the
DGGE fingerprints.
Webster et al. (2007) investigated the structure and com-
position of microbial communities inhabiting the soft coral
Alcyonium antarcticum across three differentially contami-
nated sites within McMurdo Sound (Antarctica). Microbial
communities were revealed at all sites using culture-based
analysis, DGGE, 16S rRNA gene clone-library analysis and
FISH. Multivariate analysis of DGGE band patterns and
PCA of quantitative FISH data revealed no distinct differ-
ences in community composition between differentially con-
taminated sites. The study (the first investigation of micro-
bial communities associated with Antarctic soft corals) sug-
gests that spatially stable microbial associations exist across
an environmental impact gradient.
Another application was by Shoji et al. (2006) who esti-
mated the microbial community in a biological phosphorus
removal process under different electron acceptor conditions
by PCR-DGGE and PCA. A lab-scale sequencing batch re-
actor fed with municipal wastewater was operated under
anaerobic-aerobic, anaerobic-anoxic-aerobic and anaerobic-
anoxic conditions. The results obtained from 16S rRNA-
based PCA showed that little oxygen supply caused the dete-
rioration of aerobic bacteria, including aerobic polyphos-
phate-accumulating organisms (PAOs). Moreover, it also
reflects the existence of nitrate-utilizing denitrifiers.
Other two applications were by Licht et al. (2006) and
Fry et al. (2006). The study by Licht et al. (2006) reported
the effects of selected carbohydrates on composition and
activity of the intestinal microbiota. Five groups of eight rats
were fed a western type diet containing cornstarch (reference
group), sucrose, potato starch, inulin or oligofructose. Prin-
cipal Component Analysis of profiles of the faecal microbi-
ota obtained by DGGE of PCR amplified bacterial 16S
rRNA genes as well as of Reverse Transcriptase-PCR ampli-
fied bacterial 16S rRNA, resulted in different phylogenetic
profiles for each of the five animal groups. Even though su-
crose and cornstarch are both easily digestible and are not
expected to reach the large intestine, the DGGE band pat-
terns obtained indicated that these carbohydrates indeed af-
fected the composition of bacteria in the large gut. Also the
two fructans resulted in completely different molecular fin-
gerprints of the faecal microbiota, indicating that even
though they are chemically similar, different intestinal bacte-
ria ferment them.
The second study by Fry et al. (2006), reported the rela-
tionship between prokaryotic community composition and
biogeochemical processes in deep subseafloor sediments
from the Peru Margin, by PCA on DGGE band patterns.
Toxicological Studies
Several studies have been carried out reporting the use of
multivariate tools in toxicology. Kleno et al. (2004) studied
the mechanism of action of hydrazine toxicity in rat liver
samples by PCA and PLS. PCA was carried out on a dataset
of 30 samples (5 animals x 3 doses of hydrazine x 2 times
after the administration) described by 431 spots revealed on
the 2D maps. PC1 was responsible for sample differentiation
according to the 3 dose levels while PC4 allowed the separa-
tion of the two times after the administration but only for the
largest dose level. Since the loadings analysis did not pro-
duce a clear identification of the most discriminating spots, a
PLS-DA model was applied to model the dose level of hy-
drazine (variable selection according to Jack-knifing). PLS
allowed the identification of the spots responsible for the
60 Current Proteomics, 2007, Vol. 4, No. 1 Marengo et al.
differences between the samples according to the dose level
administered. The results proved that some spots identified
by PLS were not considered relevant by standard t-tests.
Amin et al. (2004), Heijne et al. (2003) and Anderson et
al. (1996) applied PCA to toxicological studies. The study
by Amin et al. (2004) was on gene expression profile played
by three nephrotoxicants (cisplatin, gentamicin and puromy-
cin) on rats, as a function of time after the initial administra-
tion. PCA and cluster analysis allowed the separation of the
samples according to dose and time of administration and
renal toxicity. The study by Heijne et al. (2003) reported the
acute hepatotoxicity induced in rats by administration of
bromobenzene. Control and treated samples could have been
effectively separated by PCA for both protein and gene ex-
pression profiles. Some of the significant proteins (found to
change upon bromobenzene treatment) were also identified
by mass spectrometry. Finally, Anderson et al. (1996) inves-
tigated the effects of five peroxisome proliferators on the
protein profile in the livers of treated mice at 5- and 35-day
time points. PCA was carried out on a set of a total of 107
liver protein spots: the first PC was identified as a global
measure of peroxisome proliferation by its correlation with
enzymatic peroxisomal -oxidation, while PC2 separated the
samples on the basis of time of exposure.
Another study was done by Perrot et al. (2001) reporting
the use of PCA to compare the protein expression of gel-
entrapped Escherichia coli cells exposed to a cold shock at
4°C with those of exponential- and stationary-phase free
floating cells. The authors covered a total of 10 different
incubation conditions, replicating each experiment 3 times
and running each gel in duplicate. PCA was carried out on
the 203 spots identified as significantly higher than those
corresponding to the synthesis at 37°C using the average
spot intensities for each experimental condition adopted.
PCA pointed out that the protein response of immobilized
cells after the cold shock is significantly different from those
of exponential- and stationary-phase free-floating organisms.
The analysis of the loadings identified 9 families of proteins.
Application of Artificial Neural Networks (ANNs)
More recently, some papers have appeared in literature
reporting the use of ANNs to the study of proteomic spot
volume datasets (Ramadan et al., 2005; Izawa et al., 2006;
Bloom et al., 2007).
The first application was by Ramadan et al. (2005) who
applied PLS and Back-Propagation Artificial Neural Net-
works for the estimation of soil properties. The two multi-
variate calibration methods were applied to microbial com-
munity DNA to predict soil properties (%Sand, %Silt,
%Clay, %Nitrogen, %Organic Carbon, DNA) in environ-
mental soil samples. The microbial community DNA was
extracted from 48 environmental soil samples and each sam-
ple was replicated in order to obtain a total of 256 DNA band
patterns. Each band pattern was described by a total of 320
variables (volumes along the band pattern). The samples
were divided into two groups: 171 samples for the training
set and 85 for the test set. PLS did not provide the best re-
sults (R2 < 0.80). ANN performed better than PLS (5 neu-
rons in the hidden layer) but they performed even better if
ANN is carried out on the first 39 PCs (R2 > 0.85).
Another application (Izawa et al., 2006) used artificial
neural networks to the recognition of culture state by two-
dimensional gel electrophoresis. Proteomic technologies
were applied to the examination of nutrient components in
culture broth. Natural nutrients are often used in fermenta-
tion processes such as in the production of baker's yeast,
alcoholic beverages, amino acids, and pharmaceuticals. The
catabolic activities of the microorganisms in these processes
vary with the species used. A total of 23 gels were run: 7
from control E. Coli, 10 belonging to Fe-deficient E. Coli, 6
belonging to Mg-deficient E. Coli. More than 300 spots were
identified on each final map. A three-layers ANN was used:
357 neurons in the input layer (i.e. one neuron for each spot),
100 neurons in the hidden layer and 3 neurons in the output
layer (one neuron for each culture state). Leave-one-out
cross-validation was adopted. Sensitivity analysis allowed
the identification of about 20 spots as significant for the
identification of the correct culture state of each sample.
The recent study by Bloom et al. (2007) reported the use
of ANNs for the discrimination of six common types of ade-
nocarcinoma. 2D-GE was used to analyze the proteomic
expression pattern of 77 similarly appearing (histomorphol-
ogy) adenocareinomas from 6 different types of sites of ori-
gin which were ovary, colon, kidney, breast, lung and stom-
ach. Discriminating sets of proteins were identified and used
to train an ANN, with leave-one-out cross validation. Differ-
ent ANN structures were investigated by limiting the number
of input neurons from 60 to 600 (input neurons were associ-
ated to differentially expressed spots ranked according to
their significance in standard t-tests). The best accuracy was
reached with an ANN architecture giving a final number of
227 spots relevant for classification. Some spots were identi-
fied as relevant for different classes of samples while other
spots were identified as relevant only for one class.
The great number of applications of PCA, PLS and other
multivariate tools in proteomics gives a clear idea of the im-
portance of multivariate methods in this field. In fact, such
techniques are able to identify a larger number of variables
(spots) relevant for the discrimination between the classes of
samples compared to the classical t-tests usually carried out
by standard software packages.
IMAGE ANALYSIS
An alternative to the analysis of spot volume datasets is
the direct analysis of proteomic 2D-maps images that can
also represent an alternative to the use of standard software
packages. Some methods are available in literature for the
analysis of 2D-maps images not based on the standard ap-
proach presented in the introduction. These methods are not
yet so much widespread to be included in common software
packages. The different approaches present in literature de-
scribe the use of ANNs, fuzzy logic principles and the calcu-
lation of mathematical moments. Such procedures represent
the frontier in bioinformatics and some of them are yet under
Multivariate Tools in 2D-maps Evaluation Current Proteomics, 2007, Vol. 4, No. 1 61
further development. The main principles related to these
methods will be presented below together with a review of
the most interesting applications present in literature.
Fuzzy logic
As already pointed out in the introduction, 2D gel-
electrophoresis is affected by a low reproducibility leading to
differences recorded even among replicas of the same elec-
trophoretic run. The differences can consist of changes in
spots position, size and shape. The description of the posi-
tion of each spot in terms of x-y coordinates is therefore dif-
ficult to accomplish. Marengo et al. (2003 b, c, d, 2004b)
proposed a procedure allowing to take into consideration the
information about the uncertainty in spot position and shape,
exploiting fuzzy logic principles coupled to multivariate sta-
tistical tools. The procedure develops in four main steps:
1) Image digitalization. Each map image is turned into a
grid of a given step containing in each cell the optical
density (OD) ranging from 0 to 1. The contribution to the
signal due to the background is eliminated by turning the
values below a selected threshold (e.g. 0.3/0.4) into 0.
2) Image de-fuzzyfication. The effect due to the destaining
protocol is eliminated turning the digitalised image into a
grid of binary values: 0 corresponds to a cell where no
signal is detected and 1 to a cell where a value above the
threshold is present.
3) Image re-fuzzyfication. The information about the spatial
uncertainty eliminated in step 2 together with the contri-
bution due to the destaining protocol, is reintroduced
here. Each cell containing a 1 value is substituted by a 2-
D probability function (2-D Gaussian function). The
probability of finding a signal in cell xi, yj when a signal
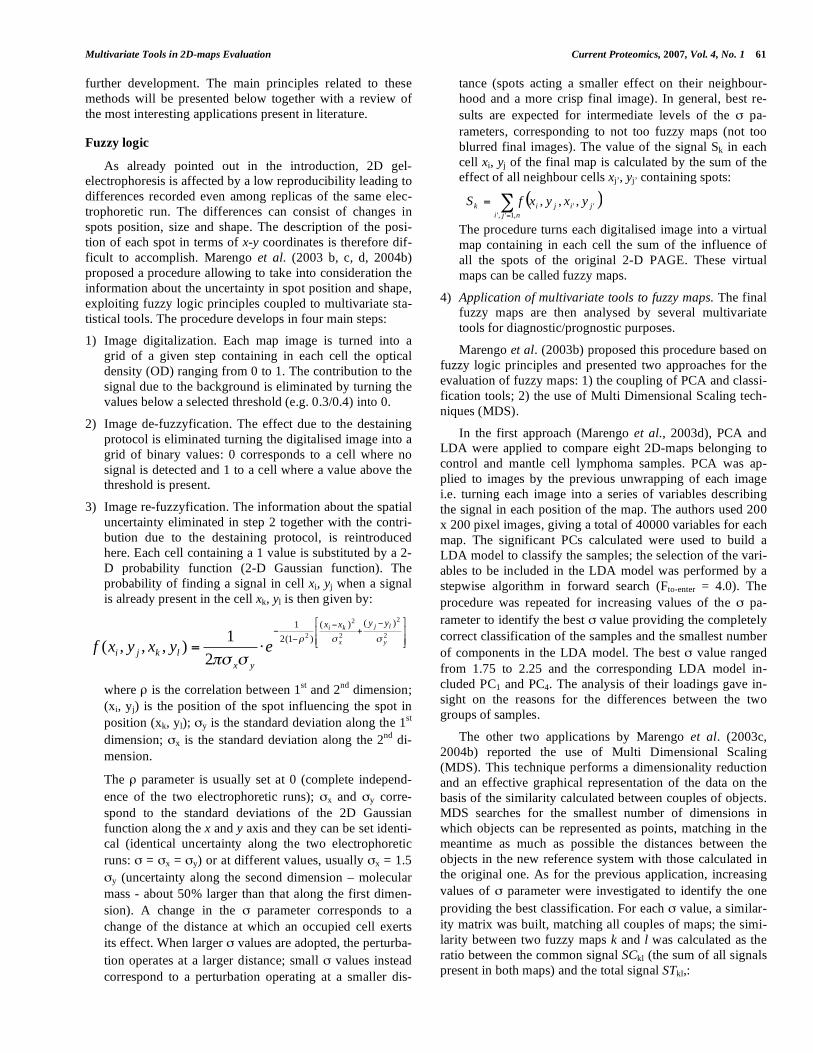
is already present in the cell xk, yl is then given by:
+
=2
2
2
2
2
)()(
)1(2
1
2
1),,,( y
lj
x
kiyyxx
yx
lkji eyxyxf
where is the correlation between 1st and 2
nd dimension;
(xi, yj) is the position of the spot influencing the spot in
position (xk, yl); y is the standard deviation along the 1st
dimension; x is the standard deviation along the 2nd
di-
mension.
The parameter is usually set at 0 (complete independ-
ence of the two electrophoretic runs); x and y corre-
spond to the standard deviations of the 2D Gaussian
function along the x and y axis and they can be set identi-
cal (identical uncertainty along the two electrophoretic
runs: = x = y) or at different values, usually x = 1.5
y (uncertainty along the second dimension – molecular
mass - about 50% larger than that along the first dimen-
sion). A change in the parameter corresponds to a
change of the distance at which an occupied cell exerts
its effect. When larger values are adopted, the perturba-
tion operates at a larger distance; small values instead
correspond to a perturbation operating at a smaller dis-
tance (spots acting a smaller effect on their neighbour-
hood and a more crisp final image). In general, best re-
sults are expected for intermediate levels of the pa-
rameters, corresponding to not too fuzzy maps (not too
blurred final images). The value of the signal Sk in each
cell xi, yj of the final map is calculated by the sum of the
effect of all neighbour cells xj’, yj’ containing spots:
( )=
=nji
jijik yxyxfS,1','
'' ,,,
The procedure turns each digitalised image into a virtual
map containing in each cell the sum of the influence of
all the spots of the original 2-D PAGE. These virtual
maps can be called fuzzy maps.
4) Application of multivariate tools to fuzzy maps. The final
fuzzy maps are then analysed by several multivariate
tools for diagnostic/prognostic purposes.
Marengo et al. (2003b) proposed this procedure based on
fuzzy logic principles and presented two approaches for the
evaluation of fuzzy maps: 1) the coupling of PCA and classi-
fication tools; 2) the use of Multi Dimensional Scaling tech-
niques (MDS).
In the first approach (Marengo et al., 2003d), PCA and
LDA were applied to compare eight 2D-maps belonging to
control and mantle cell lymphoma samples. PCA was ap-
plied to images by the previous unwrapping of each image
i.e. turning each image into a series of variables describing
the signal in each position of the map. The authors used 200
x 200 pixel images, giving a total of 40000 variables for each
map. The significant PCs calculated were used to build a
LDA model to classify the samples; the selection of the vari-
ables to be included in the LDA model was performed by a
stepwise algorithm in forward search (Fto-enter = 4.0). The
procedure was repeated for increasing values of the pa-
rameter to identify the best value providing the completely
correct classification of the samples and the smallest number
of components in the LDA model. The best value ranged
from 1.75 to 2.25 and the corresponding LDA model in-
cluded PC1 and PC4. The analysis of their loadings gave in-
sight on the reasons for the differences between the two
groups of samples.
The other two applications by Marengo et al. (2003c,
2004b) reported the use of Multi Dimensional Scaling
(MDS). This technique performs a dimensionality reduction
and an effective graphical representation of the data on the
basis of the similarity calculated between couples of objects.
MDS searches for the smallest number of dimensions in
which objects can be represented as points, matching in the
meantime as much as possible the distances between the
objects in the new reference system with those calculated in
the original one. As for the previous application, increasing
values of parameter were investigated to identify the one
providing the best classification. For each value, a similar-
ity matrix was built, matching all couples of maps; the simi-
larity between two fuzzy maps k and l was calculated as the
ratio between the common signal SCkl (the sum of all signals
present in both maps) and the total signal STkl,:
62 Current Proteomics, 2007, Vol. 4, No. 1 Marengo et al.
(=
=ni
l
i
k
ikl SSSC,1
,min
(=
=ni
l
i
k
ikl SSST,1
,max
where n is the number of cells in the grid. Skl ranges from 0
(two completely different maps) to 1 (identical maps). In
both the applications, the optimal values, could be effec-
tively identified.
Moment Functions
Moment functions have been widely used in image
analysis in applications related to invariant pattern recogni-
tion, object classification, pose estimation, image coding and
reconstruction (Zenkouar et al., 1997; Yin et al., 2002; Hu et
al., 1962; Teague, 1980; Li et al., 1991). A set of moments
computed from a digital image represents global characteris-
tics of the image shape and provides a lot of information
about different types of geometrical features of the image.
Among moment functions, the first to be applied to images
were geometric moments since they are quite easy to com-
pute. Other moment functions were then introduced for im-
age processing as orthogonal moments, rotational moments
and complex moments which are useful tools in the field of
pattern recognition and can be used to describe the features
of objects such as the shape, area, border, location and orien-
tation. Naturally each moment function has its own advan-
tages in specific applications.
The most widespread moments are the orthogonal ones,
e.g. Legendre (Chong et al., 2004; Mukundan et al., 1995;
Zhou et al., 2002) and Zernike moments (Wee et al., 2004;
Kan et al., 2002; Khotanzad et al., 1990) that can attain a
zero value of redundancy measure in a set of moment func-
tions so that these orthogonal moments correspond to inde-
pendent characteristics of the image. Moments with orthogo-
nal base functions can be used to represent the image by a set
of mutually independent descriptors with a minimum amount
of redundant information. Orthogonal moments have some
important properties: they are more robust than non-
orthogonal moments in presence of noise in the image; they
allow the analytical reconstruction of an image intensity
function from a finite set of moments using the inverse mo-
ment transform.
Among orthogonal moments, Legendre moments are the
most widespread and can be implemented as feature descrip-
tors for 2D-PAGE maps classification. The main advantages
arising from the use of Legendre moments to cluster maps
derive from the possibility to obtain invariance to translation,
scale effects and rotation. The original maps can be used for
classification without any further pre-treatment. Due to the
large number of calculated moments, some moments are
present that are not related to the purpose of classification
and for them methods for variable selection should be ap-
plied (i.e. Stepwise Linear Discriminant Analysis).
The Legendre polynomials form a complete orthogonal
set inside the unit circle. Moments with the Legendre poly-
nomials as kernel functions were first introduced by Teague
(1980). The kernel of Legendre moments are products of
Legendre polynomials defined along rectangular image co-
ordinate axes inside a unit circle. The two-dimensional Leg-
endre moments of order ( )qp + of an image intensity map
( )yxf , are defined as:
Lpq =2p +1( ) 2q +1( )
4Pp1
1
1
1
(x) Pq (y) f (x, y)dxdy;
x, y 1, 1[ ],
where Legendre polynomial, )(xPp , of order p is given
by:
Pp x( ) = 1( )p k
21
2 pp + k( )!xk
p k
2!p + k
2!k!k=0
p
p k=even
The recurrence relation of Legendre polynomials, )(xPp ,
is:
Pp x( ) =2p 1( ) xPp 1 x( ) p 1( )Pp 2 x( )
p,
where ( ) 10 =xP , ( ) xxP =1 and 1>p . Since the region of
definition of Legendre polynomials is the interior of [ ]1 ,1 ,
a square image of NN pixels with intensity function
( )jif , , ( )1,0 Nji , is scaled in the region
1,1 << yx .
Legendre moments can be expressed in discrete form as:
Lpq = pq Pp xi( )j=0
N 1
i=0
N 1
Pq yj( ) f i, j( ) ,
where the normalizing constant is:
pq =2p +1( ) 2q +1( )
N 2
ix and
jy denote the normalized pixel coordinates in the
range [ ]1 ,1 :
11
2=
N
ixi
and 11
2=
N
jy j
The reconstruction of the image function from the calcu-
lated moments can be performed by the following inverse
transformation:
( ) ( ) ( )jqip
p
p
q
q
pq xPxPjif= =
=max max
0 0
,
The study by Marengo et al. (2005a) reports an interest-
ing application of Legendre moments to a set of 2D-PAGE
)
)
Multivariate Tools in 2D-maps Evaluation Current Proteomics, 2007, Vol. 4, No. 1 63
maps belonging to two different cell lines of control (un-
treated) and drug-treated pancreatic ductal carcinoma cells.
The Legendre moments were used as discriminant variables
to obtain the correct classification of the 18 samples. Each
digitalised 2D-map was described by a 200x200 matrix of
pixels (whose value ranges from 0 to 1, according to the cor-
responding staining intensity). Moments up to a maximum
order of 100 were computed from each image. The final
dataset was described by 18 samples and 10201 variables.
LDA was applied with variable selection according to the
stepwise algorithm in forward search (Fto-enter = 4.0). The
results showed that only six Legendre moments were neces-
sary in order to correctly classify the 18 samples.
Other Methods
Schultz et al. (2004), together with the application of
PCA and PLS to spot volume data, applied PCA to the
analysis of gel images after their digitalisation and unwrap-
ping. The choice of the alignment procedure for the sets of
gels proved to be determinant for the final result. PCA
proved to be effective in the identification of the groups of
maps present.
Pietrogrande and co-workers (2002, 2003, 2005, 2006)
developed a method for evaluating spot overlapping in 2D-
PAGE maps based on the quantitative theory of peak over-
lapping previously developed and extended to 2-D separa-
tions (Pietrogrande et al., 2002, 2003). The map is divided
into many strips in order to obtain 1-D separations on which
the statistical procedure can be applied. Several important
informations can be extracted such as the number of proteins
present, the model describing distribution of interdistance
between adjacent spots in both separation dimensions and
the presence of repeated interdistances in spot positions in
the maps. The regularities suggest specific protein modifica-
tions. In a more recent paper (Pietrogrande et al., 2005), the
same authors apply a mathematical method based on the
study of the 2-D autocovariance function (2D-ACVF) com-
puted on an experimental digitized map. The first part of the
2D-ACVF allows the estimation of the number of proteins
present in the sample and of the separation performance.
Moreover, the 2D-ACVF plot is a powerful tool in identify-
ing order in the spot position and singling it out from the
complex separation pattern. The results allow to obtain spe-
cific information such as sample complexity, separation per-
formance and identification of spot trains related to post-
translational modifications.
Another study was reported by Marengo et al. (2003a)
who applied three-way PCA to the identification of the dif-
ferences among groups of 2D-maps. Three-way PCA was
preceded by data transformation to scale all the samples and
make them comparable. For this purpose, maximum scaling
was selected and the digitalized 2-D PAGE maps were
scaled one at a time to the maximum value for each map.
This method was successfully applied to datasets of human
lymph-nodes and rat sera allowing the identification of the
main differences existing among the sets of 2D-maps.
A more recent application uses Fast Fourier Transform to
cluster proteomics data (Bensmail et al., 2005). This work
presents new algorithms to cluster and derive meaningful
patterns of expression from mass-spectrometry proteomic
signals. Raw data were processed and transformed from a
real space data-expression to a complex space data-
expression using discrete Fourier transformation. Then a
thresholding approach was applied to denoise and reduce the
length of each spectrum. Bayesian clustering was applied to
the reconstructed data. The method provided very good re-
sults and was compared to other algorithms: K -means, Ko-
honen self-organizing maps, linear discriminant analysis.
CONCLUSIONS
As already pointed out in the introduction, the main dis-
advantages of 2D-GE are represented by the low reproduci-
bility of the technique and the large complexity of the signal
(complex 2D-maps with a large number of spots). The dif-
ferent methods presented here are useful to take into account
one or both these aspects.
First of all, a decision must be made in selecting methods
for the analysis of spot volume datasets or methods for the
direct analysis of 2D-map images. In the case of spot volume
datasets, each multivariate method applied is always sub-due
to the first step of differential analysis carried out by dedi-
cated software packages. In this case, the contribution due to
human interference in the differential analysis is not avoided
but it can be almost eliminated or at least taken into account
in the subsequent multivariate analysis. PCA, PLS-DA and
other robust multivariate tools allow to extract the most sys-
tematic amount of information by means of only the first
PCs calculated thus eliminating human interference and ran-
dom variations that are contained in the last PCs. This is true
even for SIMCA that exploits the principles of PCA and for
LDA when applied to the significant PCs. Therefore, the use
of multivariate tools to spot volume datasets allows the ef-
fective treatment of the complexity characterising 2D-PAGE
maps. Regarding the low reproducibility of the technique,
several methods presented are more or less effective accord-
ing to their abilities of being robust to random variations in
the data. However, this approach does not completely avoid
human interference.
Different considerations can be given for methods for
image analysis. They obviously appear complex but they
take into proper consideration both the low reproducibility of
the technique and the large complexity of the signal to be
processed. Moreover, they avoid the first pre-treatment by
standard software packages, thus limiting human interfer-
ence.
A final conclusion can be drawn about the relevance to
proteomics of the two types of methods reported here. Ap-
proaches based on spot volume dataset appear more immedi-
ate in the identification of the possible biomarkers i.e. spots
characterised by significant differences between groups of
samples. On the other hand, methods based on image analy-
sis appear very promising for what regards the development
of automatic tools for clinical diagnosis and in this perspec-
tive, it is the authors’ opinion that they represent the most
interesting applications.
64 Current Proteomics, 2007, Vol. 4, No. 1 Marengo et al.
ABBREVIATIONS
1D = One-dimensional
2-D ACVF = Two-Dimensional AutoCoVariance Function
2D = Two-dimensional
2D-GE = Two-Dimensional-Gel Electrophoresis
2D-PAGE = Two-Dimensional-Polyacrylamide Gel Electrophoresis
ANN = Artificial Neural Networks
ANOVA = ANalysis Of VAriance
BP-ANN = Back-Propagation Artificial Neural Networks
CCD = Charge-Coupled Device
DGGE = Denaturing Gradient Gel Electrophoresis
DNA = DeoxyriboNucleic Acid
DP = Discrimination Power
EITB = Enzyme-linked Immuno-electro Transfer Blotting
FISH = Fluorescent In Situ Hybridisation
GA = Genetic Algorithm
LDA = Linear Discriminant Analysis
LV = Latent Variable
MDS = Multi Dimensional Scaling
MP = Modelling Power
OD = Optical Density
OLS = Ordinary Least Squares
PAOs = Polyphosphate-Accumulating Organisms
PC = Principal Component
PCA = Principal Component Analysis
PCR-DGGE = Polymerase Chain Reaction-Denaturing Gradient Gel Electrophoresis
PLS-DA = Partial Least Squares Discriminant Analysis
RNA = RiboNucleic Acid
SDS-PAGE = Sodium Dodecyl Sulphate – Polyacryla-mide Gel Electrophoresis
SIMCA = Soft-Independent Model of Class Analogy
REFERENCES
Alika, J.E., Akenova, M.E. and Fatokun C.A. (1995). Variation among maize (Zea mays L) accessions of Bendel State, Nigeria - Numerical
analysis of zein protein band patterns. Genet. Resour. Crop. Ev. 42: 393-9
Almeida, J.S., Stanislaus, R., Krug, E. and Arthur, J.M. (2005). Normalisa-tion and analysis of residual variation in two-dimensional gel electro-
phoresis for quantitative differential proteomics. Proteomics 5: 1242-9 Amin, R.A., Vickers, A.E., Sistare, F., Thompson, K.L., Roman, R.J.,
Lawton, M., Kramer, J., Hamadeh, H.K., et al. (2004). Identification of putative gene-based markers of renal toxicity. Environ. Health Persp.
112: 465-79
Anderson, N.L., EsquerBlasco, R., Richardson, F., Foxworthy, P. and
Eacho, P. (1996). The effects of peroxisome proliferators on protein abundances in mouse liver. Toxicol. Appl. Pharm. 137: 75-89.
Anderson, N.L., Hofmann, J.P., Gemmell, A. and Taylor, J. (1984). Global approaches to quantitative analysis of gene-expression patterns ob-
served by use of two-dimensional gel electrophoresis. Clin. Chem. 30: 2031-6.
Anderson, N.L., Taylor, J., Scandora, A.E., Coulter, B.P. and Anderson, N.G. (1981). The TYCHO System for computer analysis of two-
dimensional gel electrophoresis patterns. Clin. Chem. 27: 1807-20. Bensmail, H., Golek, J., Moody, M.M., Semmes, J.O., Haoudi, A. (2005) A
novel approach for clustering proteomics data using Bayesian fast Fou-rier transform. Bioinformatics 21: 2210-24
Bloom, G.C., Eschrich, S., Zhou, J.X., Coppola, D. and Yeatman, T.J. (2007). Elucidation of a protein signature discriminating six common
types of adenocarcinoma. Int. J. Cancer 120: 769-75. Boon, N., De Windt, W., Verstraete, W. and Top, E.M. (2002). Evaluation
of nested PCR-DGGE (denaturing gradient gel electrophoresis) with group-specific 16S rRNA primers for the analysis of bacterial commu-
nities from different wastewater treatment plants. FEMS Microbiol. Ecol. 39: 101-12.
Campostrini, N., Areces, L.B., Rappsilber, J., Pietrogrande, M.C., Dondi, F., Pastorino, F., Ponzoni, M. and Righetti, P.G. (2005) Spot overlapping
in two-dimensional maps: a serious problem ignored for much too long. Proteomics 5: 2385-95.
Chong, C., Raveebdram, P. and Mukundan, R. (2004). Translation and scale invariants of Legendre moments. Pattern Recogn. 37: 119-29.
Correa, O.S., Romero, A.M., Montecchia, M.S. and Soria, M.A. (2007). Tomato genotype and Azospirillum inoculation modulate the changes in
bacterial communities associated with roots and leaves. J. Appl. Micro-biol. 102: 781-6.
Couto, M.M.B., Vogels, J.T.W.E., Hofstra, H., Husiintveld, J.H.J. and Van-dervossen, J.M.B.M. (1995). Random amplified polymorphic DNA and
restriction enzyme of PCR amplified RDNA in taxonomy – 2 Identifi-cation techniques for food-borne yeasts. J. Appl. Bacteriol. 79: 525-35.
De Moor, B., Marchal, K., Mathys, J. and Moreau, Y. (2003). Bioinformatics: Organisms from Venus, technology from Jupiter, algo-
rithms from Mars. Eur. J. Control 9: 237-78. De Noord, O.E. (1994) Multivariate calibration standardization. Chemometr.
Intell. Lab. Syst. 25: 85–97. Dewettinck, K., Dierckx, S., Eichwalder, P. and Huyghebaert, A. (1997).
Comparison of SDS-PAGE profiles of four Belgian cheeses by multi-variate statistics. Lait 77: 77-89.
Drew, J.E., Padidar, S., Horgan, G., Duthie, G.G., Russell, W.R., Reid, M., Duncan, G. and Rucklidge, G.J. (2006). Salicylate modulates oxidative
stress in the rat colon: A proteomic approach. Biochem. Pharmacol. 72: 204-16.
Eisenbeis, R.A. (Ed.) (1972). Discriminant Analysis and Classification Procedures: Theory and Applications, Lexington, USA
Fry, J.C., Webster, G., Cragg, B.A., Weightman, A.J. and Parkes, R.J. (2006). Analysis of DGGE profiles to explore the relationship between
prokaryotic community composition and biogeochemical processes in deep subseafloor sediments from the Peru Margin. FEMS Microbiol.
Ecol. 58: 86-98. Fujii, K., Kondo, T., Yokoo, H., Yamada, T., Matsuno, Y., Iwatsuki, K. and
Hirohashi, S. (2005). Protein expression pattern distinguishes different lymphoid neoplasms. Proteomics 5: 4274-86.
Gadea, I., Ayala, G., Diago, M.T., Cunat, A. and Garcia de Lomas, J. (1999). Immunological diagnosis of human cystic echinococcosis: Util-
ity of discriminant analysis applied to the enzyme-linked immunoelec-trotransfer blot. Clin. Diagn. Lab. Immun. 6: 504-8.
Gadea, I., Ayala, G., Diago, M.T., Cunat, A. and Garcia de Lomas, J. (2000). Immunological diagnosis of human hydatid cyst relapse: Utility
of the enzyme-linked immunoelectrotransfer blot and discriminant analysis. Clin. Diagn. Lab. Immun. 7: 549-52.
Garrels, J.I. (1979). Two dimensional gel electrophoresis and computer analysis of proteins synthesized by clonal cell lines. J. Biol. Chem. 254:
7961-77. Garrels, J.I. (1989). The QUEST system for quantitative analysis of two-
dimensional gels. J. Biol. Chem. 264: 5269-82. Garrels, J.I., Farrar, J.T., Burwell IV, C.B., in: Celis, J.E. and Bravo, R.
(Eds.) (1984). Two-Dimensional Gel Electrophoresis of Proteins. Aca-demic Press, Orlando, FA, USA pp. 38-91.
Goh, A.T.C. (1995). Backpropagation Neural Networks for modelling com-plex systems. Artif. Intell. Engin. 9: 143-51.
Multivariate Tools in 2D-maps Evaluation Current Proteomics, 2007, Vol. 4, No. 1 65
Gottfries, J., Sjogren, M., Holmberg, B., Rosengren, L., Davidsson, P. and
Blennow, K. (2004). Proteomics for drug target discovery. Chemometr. Intell. Lab. Syst. 73: 47-53.
Heijne, W.H.M., Stierum, R.H., Slijper, M., van Bladeren, P.J. and van Ommen, B. (2003). Toxicogenomics of bromobenzene hepatoxicity: a
combined transcriptomics and proteomics approach. Biochem. Pharma-col. 65: 857-75.
Hu, M.K. (1962) Visual pattern recognition by moment invariants. IRE Transac. Inform. Theory 8: 179-87.
Iwadate, Y., Sakaida, T., Hiwasa, T., Nagai, Y., Ishikura, H., Takiguchi, M. and Yamaura, A. (2004). Molecular classification and survival predic-
tion in human gliomas based on proteome analysis. Cancer Res. 64: 2496-501.
Izawa, N., Kishimoto, M., Konishi, M., Omasa, T., Shioya, S. and Ohtake, H. (2006). Recognition of culture state using two-dimensional gel elec-
trophoresis with an artificial neural network. Proteomics 6: 3730-8. Jessen, F., Lametsch, R., Bendixen, E., Kjaersgard, I.V.H. and Jorgensen,
B.M. (2002). Extracting information from two-dimensional electropho-resis gels by partial least squares regression. Proteomics 2: 32-5.
Johansson, M.L., Quednau, M., Ahrne, S. and Molin, G. (1995). Classifica-tion of lactobacillus-plantarum by resctriction-endonuclease analysis of
total chromosomal DNA using conventional agarose-gel electrophore-sis. Int. J. Syst. Bacteriol. 45: 670-5.
Kan, C. and Srinath, M.D. (2002). Invariant character recognition with Zernike and orthogonal Fourier-Mellin moments. Pattern Recogn. 35:
143-54. Karp, N.A., Griffin, J.L. and Lilley, K.S. (2005). Application of partial least
squares discriminant analysis to two-dimensional difference gel studies in expression proteomics. Proteomics 5: 81-90.
Khotanzad, A. and Hong, Y.H. (1990). Invariant image recognition by Zernike moments. IEEE T. Pattern Anal. 12: 489-97.
Kjaersgard, I.V.H., Norrelykke, M.R. and Jessen, F. (2006). Changes in cod muscle proteins during frozen storage revealed by proteome analysis
and multivariate data analysis. Proteomics 6: 1606-18. Klecka, W.R. (Ed.) (1980). Discriminant Analysis, Sage Publications, Bev-
erly Hills, USA Kleinbaum, D., Kupper, L. and Muller, K. (1988). Applied Regression
Analysis and Other Multivariate Methods, 2nd ed., Pws-Kent, Boston Kleno, T.G., Leonardsen, L.R., Kjeldal, H.O., Laursen, S.M., Jensen, O.N.
and Baunsgaard, D. (2004). Mechanisms of hydrazine toxicity in rat liver investigated by proteomics and multivariate data analysis. Pro-
teomics 4: 868-80. Kovarova, H., Hajduch, M., Korinkova, G., Halada, P., Krupickova, S.,
Gouldsworthy, A., Zhelev, N. and Strnad, M. (2000). Proteomics ap-proach in classyfing the biochemical basis of the anticancer activity of
the new olomoucine-derived synthetic cyclin-dependent kinase inhibi-tor, bohemine. Electrophoresis 21: 3757-64.
Kovarova, H., Radzioch, D., Hajduch, M., Sirova, M., Blaha, V., Macela, A., Stulik, J. and Hernychova, L. (1998). Natural resistance to intracel-
lular parasites: A study by two-dimensional gel electrophoresis coupled with multivariate analysis. Electrophoresis 19: 1325-31.
Li, B.C. and Shen, J. (1991). Fast computation of moment invariants. Pat-tern Recogn. 24: 807-13.
Licht, T.R., Hansen, M., Poulsen, M. and Dragsted, L.O. (2006). Dietary carbohydrate source influences molecular fingerprints of the rat faecal
microbiota. BMC Microbiol. 6: Art. No. 98. Lilley, K.S. and Dupree, P. (2006). Methods of quantitative proteomics and
their application to plant organelle characterization. J. Exp. Bot. 57: 1493-9.
Mahon, P. and Dupree, P. (2001) Quantitative and reproducible two-dimensional gel analysis using Phoretix 2D Full. Electrophoresis 22:
2075-85. Marengo, E., Bobba, M., Robotti, E. and Liparota, M.C. (2005). Use of
Legendre moments for the fast comparison of 2D-PAGE maps images. J. Chromatogr. A 1096: 86-91.
Marengo, E., Leardi, R., Robotti, E., Righetti, P.G., Antonucci, F. and Cec-coni, D. (2003). Application of three-way principal component analysis
to the evaluation of two-dimensional maps in proteomics. J. Prot. Res. 2: 351-60.
Marengo, E., Robotti, E., Bobba, M., Liparota, M.C., Antonucci, F., Rus-tichelli, C., Zamò, A., Chilosi, M., et al. (2006). Characterisation of the
proteomic profiles of two human lymphoma cell lines by two-dimensional gel-electrophoresis and multivariate statistical tools. Elec-
trophoresis 27: 484-94. Marengo, E., Robotti, E., Cecconi, D., Scarpa, A. and Righetti, P.G. (2004).
Identification of the regulatory proteins in human pancreatic cancers
treated with Trichostatin-A by 2D-PAGE maps and Multivariate Statis-
tical Analysis. Anal. Bioanal. Chem. 379: 992-1003. Marengo, E., Robotti, E., Cecconi, D., Scarpa, A. and Righetti, P.G. (2004).
Application of fuzzy logic principles to the classification of 2D-PAGE maps belonging to human pancreatic cancers treated with Trichostatin-
A. Proceedings of 2004 IEEE International Conference on Fuzzy Sys-tems, Budapest, Hungary, 1: 359-64.
Marengo, E., Robotti, E., Gianotti, V. and Righetti P.G. (2003). A new approach to the statistical treatment of 2D-Pages in proteomics using
fuzzy logic. Ann. Chim. Rome 93: 105-16. Marengo, E., Robotti, E., Gianotti, V., Righetti, P.G., Domenici, E. and
Cecconi, D. (2003). A new integrated statistical approach to the diag-nostic use of proteomic two-dimensional maps. Electrophoresis 24:
225-36. Marengo, E., Robotti, E., Righetti, P.G. and Antonucci, F. (2003). A new
approach based on fuzzy logic and Principal Component Analysis for the classification of 2D-maps in health and disease: application to lym-
phomas. J. Chromatogr. A 1004: 13-28. Marengo, E., Robotti, E., Righetti, P.G., Campostrini, N., Pascali, J. and
Ponzoni, M. (2004). Study of Proteomic changes associated with healthy and tumoral murine samples in Neuroblastoma by Principal
Component Analysis and classification methods. Clin. Chim. Acta 345: 55-67.
Martens, H. and Naes, T. (1989). Multivariate Calibration, Wiley, London Massart, D.L., Kaufman, L., in: Elving, P.J. and Winefordner, J.D. (Eds.)
(1983). The interpretation of Analytical Chemical Data by the Use of Cluster Analysis, Wiley, New York, USA
Massart, D.L., Vandeginste, B.G.M., Deming, S.M., Michotte, Y. and Kaufman, L. (1988). Chemometrics: a textbook, Amsterdam: Elsevier
Molloy, M.P., Brzezinski, E.E., Hang, J., McDowell, M.T. and VanBogelen, R.A. (2003). Overcoming technical variation and biological variation in
quantitative proteomics. Proteomics 3: 1912-9. Moritz, B. and Meyer, H.E. (2003). Approaches for the quantifications of
protein concentration ratios. Proteomics 3: 2208-20. Mukundan, R. and Ramakrishnan, K.R. (1995). Fast computation of legen-
dre and zernike moments. Pattern Recogn. 28: 1433-42. Olias, R., Maldonado, B., Radreau, P., Le Gall, G., Mulholland, F.,
Colquhoun, I.J. and Kemsley, E.K. (2006). Sodium dodecyl sulphate-polyacrylamide gel electrophoresis of proteins in dry-cured hams: Data
registration and multivariate analysis across multiple gels. Electropho-resis 27: 1288-99.
Perrot, F., Hebraud, M., Charlionet, R., Junter, G.A. and Jouenne, T. (2001). Cell immobilisation induces changes in the protein response of Esch-
ierichia Coli K-12 to a cold shock. Electrophoresis 22: 2110-9. Pietrogrande, M.C., Marchetti, N., Dondi, F. and Righetti, P.G. (2002). Spot
overlapping in two-dimensional polyacrylamide gel electrophoresis separations: A statistical study of complex protein maps. Electrophore-
sis 23: 283-291. Pietrogrande, M.C., Marchetti, N., Dondi, F. and Righetti P.G. (2003). Spot
overlapping in two-dimensional polyacrylamide gel electrophoresis maps: Relevance to proteomics. Electrophoresis 24: 217-24.
Pietrogrande, M.C., Marchetti, N., Tosi, A., Dondi, F. and Righetti P.G. (2005). Decoding two-dimensional polyacrylamide gel electrophoresis
complex maps by autocovariance function: A simplified approach use-ful for proteomics. Electrophoresis 26: 2739-48.
Pietrogrande, M.C., Marchetti, N., Dondi, F. and Righetti P.G. (2006). De-coding 2D-PAGE complex maps: Relevance to proteomics. J. Chroma-
togr. B 833: 51-62. Ramadan, Z., Hopke, P.K., Johnson, M.J. and Scow, K.M. (2005). Applica-
tion of PLS and Back-Propagation Neural Networks for the estimation of soil properties. Chemometr. Intell. Lab. Syst. 75: 23-30.
Raman, B., Cheung, A. and Marten, M.R. (2002). Quantitative comparison and evaluation of two commercially available, two-dimensional elec-
trophoresis image analysis software packages, Z3 and Melanie. Elec-trophoresis 23: 2194-202.
Righetti, P.G., Stoyanov, A. and Zhukov, M. (2001). The proteome revis-ited: theory and practice of the relevant electrophoretic steps, Elsevier,
Amsterdam Rosengren, A.T., Salmi, J.M., Aittokallio, T., Westerholm, J., Lahesmaa, R.,
Nyman, T.A. and Nevalainen, O.S. (2003). Comparison of PDQuest and Progenesis software packages in the analysis of two dimensional
electrophoresis gels. Proteomics 3: 1936-46. Rubinfeld, A., Keren-Lehrer, T., Hadas, G. and Smilansky, Z. (2003). Hier-
archical analysis of large-scale two-dimensional gel-electrophoresis ex-periments. Proteomics 3: 1930-5.
66 Current Proteomics, 2007, Vol. 4, No. 1 Marengo et al.
Schultz, J., Gottlieb, D.M., Petersen, M., Nesic, L., Jacobsen, S. and Son-
dergaard, I. (2004). Explorative data analysis of two-dimensional elec-trophoresis gels. Electrophoresis 25: 502-11.
Shoji, T., Nittami, T., Onuki, M., Satoh, H. and Mino, T. (2006). Microbial community of biological phosphorus removal process fed with munici-
pal wastewater under different electron acceptor conditions. Water Sci. Technol. 54: 81-9.
Tarroux, P., Vincens, P. and Rabilloud, T. (1987). HERMeS: A second generation approach to the automatic analysis of two-dimensional elec-
trophoresis gels. Part V: Data analysis. Electrophoresis 8: 187-99. Teague, M.R. (1980). Image analysis via the general theory of moments. J.
Opt. Soc. Am. 70: 920-30. Tuomainen, M.H., Nunan, N., Lehesranta, S.J., Tervahauta, A.I., Hassinen,
V.H., Schat, H., Koistinen, K.M., Auriola, S., et al. (2006). Multivariate analysis of protein profiles of metal hyperaccumulator Thlaspi caerules-
cens accessions. Proteomics 6: 3696-706. Vandeginste, B.G.M., Massart, D.L., Buydens, L.M.C., De Jong, S., Lewi,
P.J. and Smeyers-Verbeke, J. (1998). Handbook of Chemometrics and Qualimetrics: Part B, Amsterdam: Elsevier.
Verhoeckx, K.C.M., Bijlsma, S., de Groene, E.M., Witkamp, R.F., van der Greef, J. and Rodenburg, R.J.T. (2004). A combination of proteomics,
principal component analysis and transcriptomics is a powerful tool for the identification of biomarkers for macrophage maturation in the U937
cell line. Proteomics 4: 1014-28. Verhoeckx, K.C.M., Bijlsma, S., Jespersen, S., Ramaker, R., Verheij, E.R.,
Witkamp, R.F., van der Greef, J. and Rodenburg, R.J.T. (2004). Characterization of anti-inflammatory compounds using transcriptom-
ics, proteomics, and metabolomics in combination with multivariate data analysis. Int. Immunopharmacol. 4: 1499-514.
Voss, T. and Haberl, P. (2000). Observations on the reproducibility and matching efficiency of two-dimensional electrophoresis gels: conse-
quences for comprehensive data analysis. Electrophoresis 21: 3345-50.
Walczak, B. (1996). Neural networks with robust backpropagation learning
algorithm. Anal. Chim. Acta 322: 21-9. Webster, N.S. and Bourne, D. (2007). Bacterial community structure associ-
ated with the Antarctic soft coral, Alcyonium antarcticum. FEMS Mi-crobiol. Ecol. 59: 81-94.
Wee, C., Paramesran, R. and Takeda, F. (2004). New computational meth-ods for full and subset Zernike moments. Inform. Sciences 159: 203-20.
Wheelock, A.M. and Buckpitt, A.R. (2005). Software-induced variance in two-dimensional gel electrophoresis image analysis. Electrophoresis
26: 4508-20. Wold, S. (1976). Pattern recognition by means of disjoint principal compo-
nents models. Pattern Recogn. 8: 127-39. Wythoff, B.J. (1993). Backpropagation neural networks - A tutorial.
Chemometr. Intell. Lab. Syst. 18: 115-55. Yin, J., Rodolfo De Pierro, A. and Wei, M. (2002). Analysis for the recon-
struction of a noisy signal based on orthogonal moments. Appl. Math. Comput. 132: 249-63.
Zenkouar, H. and Nachit, A. (1997). Images compression using moments method of orthogonal polynomials. Mat. Sci. Eng. B 49: 211-5.
Zhang, L. and Subbarayan, G. (2002). An evaluation of back-propagation neural networks for the optimal design of structural systems: Part I.
Training procedures. Comput. Method Appl. M. 191: 2873-86. Zhang, L. and Subbarayan, G. (2002). An evaluation of back-propagation
neural networks for the optimal design of structural systems: Part II. Numerical evaluation. Comput. Method Appl. M. 191: 2887-904.
Zhou, J.D., Shu, H.Z., Luo, L.M. and Yu, W.X. (2002). Two new algo-rithms for efficient computation of Legendre moments. Pattern Recogn.
35: 1143-52. Zupan, J. and Gasteiger, J. (1993). Neural network for chemist: an introduc-
tion. Wiley: New York.
Received: May 1, 2007 Revised: July 10, 2007 Accepted: July 10, 2007