ACHIEVEMENTS AND CHALLENGES po korekcie 2
251
Edited by Andrzej Chochół & Jerzy Szakiel GLOBAL CHALLENGE COMMODITY SCIENCE IN RESEARCH AND PRACTICE ACHIEVEMENTS AND CHALLENGES OF COMMODITY SCIENCE IN THE AGE OF GLOBALIZATION
-
Upload
khangminh22 -
Category
Documents
-
view
0 -
download
0
Transcript of ACHIEVEMENTS AND CHALLENGES po korekcie 2

I S B N 9 7 8 - 8 3 - 9 3 8 9 0 9 - 0 - 3 ( p r i n t e d v e r s i o n )I S B N 9 7 8 - 8 3 - 9 3 8 9 0 9 - 4 - 1 ( h t m l )
E d i t e d b y A n d r z e j C h o c h ó ł & J e r z y S z a k i e l
GLOBALCHALLENGE
CO
MM
OD
ITY
SC
IEN
CE
IN
RE
SE
AR
CH
AN
D P
RA
CT
ICE
AC
HIE
VEM
ENTS
AN
D C
HA
LLEN
GES
OF
CO
MM
OD
ITY
SCIE
NC
E IN
TH
E A
GE
OF
GLO
BA
LIZ
ATIO
N
COMMODITY SCIENCE IN RESEARCH AND PRACTICE
ACHIEVEMENTS AND CHALLENGES
OF COMMODITY SCIENCE IN THE AGE OF GLOBALIZATION
1_COMMODITY SCIENCE.indd 1 03/09/2014 14:59:09

1
COMMODITY SCIENCE IN RESEARCH AND PRACTICE
ACHIEVEMENTS AND CHALLENGES
OF COMMODITY SCIENCE IN THE AGE OF GLOBALIZATION
Edited by Andrzej Chochół and Jerzy Szakiel
Polish Society of Commodity Science
International Society of Commodity Science and Technology
Faculty of Commodity Science Cracow University of Economics

2
Editors: Andrzej Chochół, Jerzy Szakiel All published papers have been reviewed before publishing Reviewers of Commodity Science in Research and Practice series: Jadwiga Adamczyk, Wacław Adamczyk, Andrzej Chochół, Agnieszka Cholewa-Wójcik, Joanna Dziadkowiec, Tadeusz Fijał, Dariusz Firszt, Andrzej Gajewski, Marta Gollinger-Tarajko, Łukasz Jabłoński, Piotr Kafel, Agnieszka Kawecka, Małgorzata Lisińska-Kuśnierz, Małgorzata Miśniakiewicz, Paweł Nowicki, Stanisław Popek, Anna Prusak, Joanna Ptasińska-Marcinkiewicz, Renata Salerno-Kochan, Grzegorz Suwała, Jerzy Szakiel, Jarosław Świda, Paweł Turek The monograph has not been amended or proofread and editors are not responsible for the language used by chapter’s Authors (in chapters). Suggested citation: Author A., 2014, Title of the paper, in: A. Chochół, J. Szakiel (eds.) Commodity Science in Research and Practice – Achievements and challenges of commodity science in the age of globalization, Polish Society of Commodity Science, Cracow, pp. xx-xx. ISBN: 978-83-938909-0-3
© Copyright by Polish Society of Commodity Science, Cracow University of Economics, Cracow 2014
ISBN 978-83-938909-0-3 (printed version)
ISBN 978-83-938909-4-1 (html)
Year of publishing: 2014 Number of pages: 248
Publisher Polish Society of Commodity Science Sienkiewicza 4, 30-033 Cracow, Poland

3
Contents
Foreword ............................................................................................................. 5
Wacław Adamczyk, Artur Jachimowski AN EFFECT OF THE TREATMENT PROCESS ON DRINKING WATER QUALITY IN CRACOW .................................................................... 7
Gabriella Arcese, Serena Flammini, Maria Claudia Lucchetti, Olimpia Martucci THE EVOLUTION OF OPEN INNOVATION IN LARGE FIRMS ................21
Yuriy Belkin, Alexey Goncharov, Marina Polozhishnikova THE AUTOMATED EXPRESS TECHNOLOGIES OF LOT IDENTIFICATION OF SPIRITS FOR ITS SAFETY AND AUTHENTICITY ....................................................................................33
Paolo Bogoni, Lorenzo Pallini, Barbara Campisi, Paola Masotti ITALY’S ROLE IN THE EUROPEAN NATURAL GAS MARKET .............39
Jae Kyung Cho, Hyo-Jung Kim, Hyo-Young Shim A STUDY ON CONVERGENCE EDUCATION PROGRAM DEVELOPMENT TO BUILD UP CREATIVE·PERSONALITY: FOCUSED ON “MAKING SMART DEVICE” - PROGRAM FOR SECONDARY EDUCATION ..................................................................51
Maria Vittoria Contini, Maurizio Doro, Giovanni Maria Ruggiu,. Alessio Tola ENERGY AND ENVIRONMENTAL PLANNING: THE CASE OF THE MUNICIPALITY OF SASSARI ........................................................63
Anna Gacek, Przemysław Szopa, Jacek Czerniak THE STUDY OF BIOINDICATORS AS PROXIES OF ENVIRONMENTAL POLLUTION............................................................77
Robert Gajewski, Joaquin Ferrer, Miguel A. Martínez, Alberto Zapatero, Natalia Cuesta, Andrzej Gajewski FOOTWEAR CARBON FOOTPRINT IN FOOTWEAR INDUSTRY (CO2SHOE) .......................................................................................................87
Moran Galil, Tamar Gavrieli and Gideon Oron COMBINED TECHNOLOGICAL, ENVIRONMENTAL AND ECONOMIC CONSIDERATIONS IN GREY WATER REUSE VIA ANALYTIC HIERARCHY PROCESS (AHP) .........................................99
Teodoro Gallucci, Vera Amicarelli, and Giovanni Lagioia IS LITHIUM A STRATEGIC MINERAL? A REVIEW ................................109
Raluca Mariana Grosu, Andrea Simona Săseanu IMMIGRANT ENTREPRENEURSHIP - A CHALLENGE TO COMMODITY SCIENCE IN THE AGE OF GLOBALISATION ..........119

4
Susanne Gruber EDUCATING DIPLOMATS IN COMMODITY SCIENCES AT THE K. K. CONSULAR-ACADEMY ..................................................... 131
Mariola Jastrzębska RECYCLING OF GLASS POLYESTER WASTE ........................................ 143
Vladimir Kiselev, Yulija Syaglova, Larisa Pljushcheva COMPETITIVE ADVANTAGE OF THE GOODS ....................................... 153
Federica de Leo; Pier Paolo Miglietta; Slađana Pavlinović ECONOMICS ANALYSIS OF MARINE FISHERIES AND MARICULTURE IN CROATIA AND TRADE BALANCE WITH ITALY .................................................................................................. 163
Anatoliy Mazaraki, Grygoriy Pugachevskyi COMMODITY SCIENCE IN THE AGE OF GLOBALIZATION ................ 175
Roberto Merli, Ilaria Massa, Maria Claudia Lucchetti
HIGH FREQUENCY TRADING: TECHNOLOGY, REGULATION AND ETHICAL ISSUES ................................................................................ 179
Helena Panfil-Kuncewicz, Andrzej Kuncewicz, Anna Lis
THE EFFECT OF GAS COMPOSITION IN MODIFIED ATMOSPHERE PACKAGING ON THE SHELF LIFE OF PORTIONED RIPENED CHEESE ........................................................... 193
Michele Preziosi, Roberto Merli, Ayse Agar EVOLUTION OF EUROPEAN BIOFUELS POLICY: ADDRESSING SUSTAINABILITY AND INDIRECT LAND-USE CHANGE ..................... 201
Joanna Ptasińska-Marcinkiewicz COW’S MILK - PRODUCTION, CONSUMPTION AND HEALTH PROMOTING COMPOUNDS ....................................................................... 213
Hyo-Young Shim, Jong-Chan Park A STUDY ON THE CREATIVE DESIGN EDUCATION METHOD BY APPLYING DESIGN METHODOLOGY: FOCUSING ON MIDDLE SCHOOL DESIGN EDUCATION PROGRAM ............................................. 225
Magdalena Wojnarowska THE APPLICATION OF INTEGRATED PRODUCT POLICY IN ENTERPRISES .......................................................................................... 237

5
Foreword
Rerum cognoscere causas at valorem...Rerum cognoscere causas at valorem...Rerum cognoscere causas at valorem...Rerum cognoscere causas at valorem...
There are several strong and renowned commodity centres in Poland, including those located in Kraków, Poznań, Gdynia, Radom and Olsztyn. They show some diversification by their structures and specific operational conditions as well as local requirements. Such differences are observed also among foreign commodity science centres.
This book contains achievements in commodity science presented by the various world scientific centres that demonstrate their specificity. It gather the most recent results of investigations and analyses that can be an excellent inspiration for creative scientific research as well as the source of practical and theoretical knowledge. The monograph entitled ”Achievements and Challenges of Commodity Science in the Age of Globalization” is one of eight books belonging to the series “Commodity Science in Research and Practice”.
The scientific analyses it contains enable true orientation in contemporary trends not only theoretical and practical, but also methodical in some cases. Certainly, the central idea of the majority of presented papers is striving for product and service quality, especially in the era of highly developed globalisation. Such care should be the main aim of all people connected with this scientific discipline.
We are convinced that any reader professionally involved in quality issues can find in this monograph a number of valuable topics and reading it became an intellectual adventure.
Andrzej Chochół
Jerzy Szakiel

6

7
Wacław Adamczyk, Artur Jachimowski AN EFF ECT OF THE TR EATM ENT P ROC ESS ON DRINKING WATER Q UALITY IN CRAC OW
AN EFFECT OF THE TREATMENT PROCESS ON DRINKING WATER QUALITY IN CRACOW
Wacław Adamczyk, Artur Jachimowski
Department of Technology and Ecology of Products, Faculty of Commodity Science, Cracow University of Economics,
[email protected], [email protected]
Introduction
The appropriate water preparation before end-use for consumption by humans or industrial and household purposes is ensured by the water treatment processes. The present technological knowledge allows even contaminated water to be purified. However economic aspects point out taking in water of the best quality. When selecting technological systems the type of substances to be removed from water. The most common contaminants being removed include (Kowal, Świderska-Bróż 2003):
– substances causing turbidity and colour;
– substances of natural and anthropogenic origin;
– substances deteriorating water taste and odour;
– heavy metals and iron and manganese compounds;
– dissolved gases, e.g. hydrogen sulphide, carbon dioxide;
– minerals causing salinity and hardness;
– any microbes and pathogenic organisms.
To determine a water treatment method it is necessary to set at first place the amount of water to be taken in and its quality. In this case water quality assessment consists in determining the water physicochemical, bacteriological and biological parameters. The determination of water composition and variability facilitates the designing an appropriate technological system. The selection of a technology enabling production of water that meets the drinking water requirements is the main condition. In recent years the increasing requirements of water intended for human consumption are observed. This is connected with amending of domestic regulations resulting from the accession of Poland to the European Union and adoption of the Community requirements. These changes impose an increase of water treatment

8
technology efficiency both in newly established and existing plants (Kowal, Świderska-Bróż 2003, Sozański, Jeż-Walkowiak 1995).
The quality of water intended for human consumption is established in annexes to the ordinance of the Minister of Health of 29 March 2007 (Dz. U. No. 61, item 417) and the ordinance of the Minister of Health of 20 April 2010 (Dz. U. No. 72, item 466 amending the above (Rozporządzenie Ministra Zdrowia z dnia 29 Marca 2007, Rozporządzenie Ministra Zdrowia z dnia 20 Kwietnia 2010). However, the provisions in force in the EU Member States are established in the Directive 98/83/EC of the European Council of 25 December 1998.
Water intended for drinking has an allowable physicochemical composition and meets all bacteriological requirements set forth in the above ordinance if appropriate purification processes are used.
The aim of this paper id to determine an effect of water treatment technology on its quality at 4 Water Treatment Plants of the Municipal Water Supply and Sewage Plant in Cracow. For this purpose an analysis of selected physicochemical and bacteriological parameters of raw water before treatment and drinking water after treatment determined in the years 2008 – 2012 was used.
Characteristics of water treatment processes in individual plants
Drinking water for the Cracow agglomeration is produced at 4 water treatment plants and the largest one is the Raba Plant taking in water from the Dobczyce Reservoir. The smallest and also the oldest one is the ZUW Bielany. The block diagram of water treatment technological processes at water treatment plants of Bielany, Dłubnia, Rudawa and Raba are presented in Figure1.
The Rudawa Water Treatment Plant is one of the first three plants in Poland where water treatment technology is based on coagulation and rapid filtration. For preoxidation of organic compounds, sodium permanganate (Carusol) is dosed in raw water before coagulation. At the coagulation stage aluminium polychloride (PAX 16) is used. Then water is subjected to rapid mixing in 4 basins and slow mixing in 8 basins. From the slow mixing basins water passes through a perforated concrete baffle to 8 settling tanks where the process of sedimentation from suspension occurs. Water free of suspension flows to 12 rapid sand filters and then to 6 activated carbon filters. After filtering water is disinfected with chlorine dioxide produced on the basis of 25% sodium chlorite and 32% hydrochloric acid. The treated water is pumped into two drinking water cumulative wells and into distribution pipelines. The use of chlorine dioxide instead of chlorine prevents formation of chemical compounds deteriorating the water organoleptic properties.

9
Figure 1. Schematic diagram of water treatment processes at Cracow plants
Source: own research
Slow filters
After-coagulation clarifier
Sand filters
After-coagulation clarifier
Sand filters
After-coagulation clarifier
Sand filters
SANKA Presedimentation tank
Presedimentation tank
Chlorine
Chlorine
ClO2
ClO2
Activated carbon dosing
PAX Polyelectrolyte
DŁUBNIA
Coagulation
Disinfection
Disinfection
RUDAWA PODKAMYK RES.
Coagulation
PAX
Carbon filters
Disinfection
DOBCZYCE RES.
Ozonization Activated carbon dosing
PAX Polyelectrolyte
Coagulation
Disinfection
Drinking water
Drinking water
Drinking water
Drinking water

10
The water treatment technology used at the ZUW Bielany is based on slow filtration, where slow sand filters are the basic water treatment facilities on the first technological line. At the first stage water is fed into the special basins, where is filtered through a 10 meter deep layer of gravels and sands, leaving suspensions and other contaminants on the surface. Such mechanically purified water is taken in once again to 100 wells from which a siphon system fed it to the pure water pumping station for ozonization and disinfection with chlorine gas. Than water is pumped into the municipal water supply network. In 2011 the chlorination unit at the Bielany plant was highly modernized and chlorine gas used previously was replaced by electrolytically produced sodium hyperchlorite.
In turn, the water treatment process at the ZUW Raba is conducted in parallel in the two systems: Raba I and Raba II. In the first system water taken in directly from the intake undergoes rapid mixing, where depending on the degree of contamination can be subjected to coagulation; then from centrifuge chambers through a horizontal sedimentation tanks reaches the rapid sand filters. Such purified water flows into the pure water reservoirs to be chlorinated and then is ready for consumption. The Raba II is a more modern technological process producing water of better quality. The three facilities (rapid mixing, centrifuge chambers and clarifiers) were replaced by accelerators. There are 4 accelerators working at the Dobczyce plant that direct water directly on the filters. Then, the water undergoes disinfection and afterwards is supplied through the water supply system.
The water treatment technology applied at the ZUW Dłubnia, like in the case of the ZUW Rudawa consists in coagulation periodically enhanced with the aluminium coagulant (PAX-16). The next process step is sedimentation based on the modern sediment sweeping out system. Further the water undergoes temporal adsorption in powdered activated carbon and filtration in rapid sand filters, and disinfection with chlorine dioxide produced on site from hydrochloric acid and sodium chlorite (www.mpwik.krakow.pl accessed 25 February 2014, http://www.sni.edu.pl/proj/wodadlakrak/zuw.htm accessed 25 February 2014, ZUW Rudawa MPWiK S.A. 2011).
Material and methods
The physicochemical and bacteriological analyses of raw and drinking waters were made in the years 2008 – 2012. For chlorates, chlorites and aluminium the analysis covered the years 2007 – 2012. The results were made available by the Central Laboratory at the MPWiK S.A. in Cracow. The surface water taken in and treated by 4 Krakow Water Treatment Plants (ZUW). The water came from the rivers: Rudawa, Dłubnia, Sanka and Dobczyce Reservoir. The water samples before treatment were taken every

11
month on a weekly basis, and after treatment every three days. Based on the obtained results the monthly averages were calculated (Centralne Laboratorium MPWiK S.A. 2013). The selected indicators were determined according to Register of test methods at the MPWiK S.A. in Cracow (Centralne Laboratorium MPWiK S.A. 2011).
For the selected indicators the basic statistical parameters such as the mean, minimum and maximum values, standard deviation and variability coefficient were determined. In addition, the Person linear correlation coefficient at the significance level p ≤ 0.05 to evaluate the strength of correlation between water physicochemical parameters.
Results
In this paper the relationship between drinking water and raw water for the following water cleanliness (quality) indicators: pH, alkalinity and chemical oxygen demand (permanganate index).
The highest pH values were found in waters coming from the Dobczyce Reservoir, where the mean value was 8.08 pH, and the results varied from 7.81 to 8.52 pH, a the lowest ones - in Sanka , the mean was 7.91 pH. The highest pH, like for raw water, was characteristic of water treated at the ZUW Raba, where the mean was 7.85 pH, and pH varied between 7.67 and 8.05 pH. The lowest pH value was reported at the ZUW Bielany, where the mean was 7.49 pH.
The strongest relationship (R=0.676) between pH for drinking water and raw water was found at the ZUW Raba, slightly lower at the ZUW Rudawa (R=0.594). The remaining water showed no pH correlation (Fig. 2).
The highest water alkalinity was found in water taken in from the ZUW Dłubnia, where the mean was 5.1 mmol·dm-3, and varied from 4.7 to 5.5 mmol·dm-3. The lowest indicator was recorded in the River Raba – 2.2 mmol·dm-3, and varied between 1.5 and 2.7 mmol·dm-3. Like in the case of raw water, the highest general alkalinity was observed at the ZUW Dłubnia of the mean slightly lower – 4.9 mmol·dm-3, and changing between 4.1 and 5.2 mmol·dm-3. However,, the lowest values were found at the ZUW Raba – the mean of 2.2 mmol·dm- 3. The indicator varied between 1.6 and 2.6 mmol·dm3.
The strongest correlation between the alkalinity of drinking water and raw water was characteristic of water from the ZUW Raba (R=0.869). The lowest value was recorded at the ZUW Rudawa (R=0.820). The water taken in from the ZUW Dłubnia showed no correlation for this indicator (R=0.167) (Fig.3).

12
Figure 2. Correlation between pH for drinking water and raw water Source: own research based on the MPWiK data
The chemical oxygen demand (COD) calls also permanganate index reached the highest value in raw water from the River Sanka, where the mean was 4.5 mg·dm-3, and the results varied between 2.6 and 10.0 mg·dm-3, while the lowest values were determined in Dłubnia with the mean of 1.6 mg·dm-3.
For drinking water the highest COD values were found at the ZUW Bielany (1.3 mg·dm-3), varying between 0,7 and 3,1 mg·dm-3. The lowest values were recorded at the ZUW Dłubnia (0.2 mg·dm-3), varying from 0 to 0.8 mg·dm-3.
The strongest correlation between COD for drinking water and untreated water was characteristic of the ZUW Rudawa (R=0.540). At other plants no correlation for permanganate index was found (Fig. 4).
Fig. 2a. ZUW Rudawa Fig. 2b. ZUW Raba
Fig. 2d. ZUW Bielany
Rys. 2. Związek między odczynem pH wody pitnej a
Fig. 2c. ZUW Dłubnia

13
Figure 3. Correlation between alkalinity of drinking water and raw
water Source: own research based on the MPWiK analyses
Chlorites (ClO2-) and chlorates (ClO3-) were present in treated waters
in trace amounts. The highest concentrations occurred in waters disinfected with chlorine dioxide, i.e. the Rudawa and Dłubnia plants (Fig. 5 and Fig. 6). For ZUW the mean concentration of ClO3
- was 0.09 mg·dm-3, while the results varied from 0.04 to 0.18 mg·dm-3. The mean concentration of ClO2
- in these waters was 0.25 mg·dm-3 , and this indicator varied between 0.09 and 0.52 mg·dm-3. The mean concentration of chlorates at the ZUW Rudawa – 0.08 mg·dm-3 and the results varied from 0.03 to 0.14 mg·dm-3. The chlorite concentrations varied between 0.07 and 0.46 mg·dm-3 and the mean value was 0.28 mg·dm-3. For the ZUW Raba and Bielany, the concentrations of both indicators in most analyses were below 0.01 mg·dm-3.
Fig. 3a. ZUW Rudawa
Fig. 3d. ZUW Bielany Fig. 3c. ZUW Dłubnia
Fig. 3b. ZUW Raba

14
Figure 4. Correlation between permanganate index for drinking water
and raw water Source: own research based on the MPWiK analyses
Figure 5. Variation of chlorite concentration in treated water at ZUW
Rudawa and Dłubnia in the years 2007 – 2012 Source: own research based on the MPWiK analyses
0,00
0,10
0,20
0,30
0,40
0,50
0,60
0 12 24 36 48 60 72
chlo
ritie
s m
g/dm
-3
month
ZUW Rudawa
ZUW Dłubnia
Fig. 4a. ZUW Rudawa Fig. 4b. ZUW Raba
Fig. 4c. ZUW Dłubnia Fig. 4d. ZUW Bielany

15
Figure 6. Variation of chlorate concentration in treated water at ZUW
Rudawa and Dłubnia in the years 2007 – 2012 Source: own research based on the MPWiK analyses
Aluminium is present in treated waters in trace amounts (Fig. 7). The highest concentration reached at the ZUW Dłubnia – the mean of 0.06 mg·dm-
3. The lowest- at the ZUW Bielany and Raba, the mean values 0.003 and 0.01 mg·dm-3, respectively.
Figure 7. Variations of aluminium concentration in water supplied to
Cracow in the years 2007 – 2012 Source: own research based on the MPWiK analyses
0,00
0,05
0,10
0,15
0,20
0,25
0,30
0 12 24 36 48 60 72
chlo
rate
s m
g·dm
-3
month
ZUW Rudawa
ZUW Dłubnia
0,000
0,050
0,100
0,150
0,200
0,250
0,300
0 12 24 36 48 60 72
alum
inum
mg·
dm-3
month
ZUW Rudawa
ZUW Raba
ZUW Dłubnia
ZUW Bielany

16
The highest aluminium concentration was observed in drinking water at the ZUW Rudawa in August 2010, exceeding the permissible value of 0.2 mg·dm-3 specified in the ordinance of the Minister of Health (Rozporządzenie Ministra Zdrowia z dnia 29 Marca 2007, Rozporządzenie Ministra Zdrowia z dnia 20 Kwietnia 2010). This concentration was 0.274 mg·dm-3. This indicator was most noticeable in waters where aluminium salts were used at the coagulation stage. Both at the ZUW Rudawa andZUW Dłubnia there was aluminium polychloride (PAX 16).
Discussion
To reach the highest quality of drinking water the selection of appropriate water treatment technology is of utmost importance. There are several processes used in water treatment employing physical, chemical and biological methods. In practice their combinations are used.
The water filtration and chlorination stages are of great importance for removing microorganisms. Most bacteria are removed by sand filters as they are adsorbed on the slime sand layer. Chemical agents added in the later stage cause coagulation of bacteria and organic substances so that they can be easily removed mechanically. The presence of free chlorine in water cleans it from faecal pathogens. After treatment and disinfection of water contaminated microbiologically no presence of the following indicators was found in any of the plants: coli bacteria Escherichia coli, Enterococcus faecalis. However, the occurrence of Clostridium perfringens was observed incidentally at amounts 1 cfu/100 ml in examined waters (Centralne Laboratorium MPWiK S.A. 2013, Jawetz 1991).
In turn the disinfection with chlorine dioxide (ClO2) leads to formation of chlorates and chlorines, and their high concentrations are harmful to human health. The total permissible concentration of chlorites and chlorates in drinking water should be 0.7 mg·dm-3 (Rozporządzenie Ministra Zdrowia z dnia 29 Marca 2007, Rozporządzenie Ministra Zdrowia z dnia 20 Kwietnia 2010).

17
Table 1. Selected quality indicators for waters before and after treatment at Cracow Water Treatment Plants (ZUW) in the years 2008 – 2012 – average monthly values
ZUW
Drinking water Raw water
Measure
pH
Alkalinity [mmol·dm-3]
COD [mg·dm-3]
pH
Alkalinity [mmol·dm-3]
COD [mg·dm-3]
Rudawa
xmin 7.31 3.4 0.0 7.85 3.7 1.8 xmax. 7.76 4.6 1.6 8.29 4.9 5.3 x 7.54 4.0 0.6 8.04 4.2 2.9
s / SD 0.10 0.29 0.45 0.11 0.31 0.85 Cv [%] 1.27 7.10 70.18 1.33 7.25 29.44
n 60 59 28 60 59 28
Raba
xmin. 7.67 1.6 0.0 7.81 1.5 1.3 xmax. 8.05 2.6 1.2 8.52 2.7 2.8 x 7.85 2.2 0.8 8.08 2.2 2.0
s / SD 0.08 0.22 0.36 0.14 0.23 0.33 Cv [%] 1.00 9.99 44.98 1.68 10.35 16.36
n 60 58 28 60 58 28
Dłubnia
xmin. 7.68 4.1 0.0 7.83 4.7 0.8 xmax. 7.96 5.2 0.8 8.14 5.5 3.7 x 7.81 4.9 0.2 8.06 5.1 1.6
s / SD 0.06 0.15 0.26 0.05 0.16 0.57 Cv [%] 0.74 3.13 155.87 0.66 3.18 36.53
n 60 58 28 60 58 28
Bielany
xmin. 7.38 3.3 0.7 7.68 1.8 2.6 xmax. 7.70 4.3 3.1 8.03 4.3 10.0 x 7.49 3.8 1.3 7.91 3.8 4.5
s / SD 0.07 0.19 0.48 0.08 0.39 2.01 Cv [%] 0.88 4.89 36.56 1.03 10.16 44.51
n 60 59 28 60 59 35 Source: own research based on the MPWiK analyses
Conclusions
1. The most important conclusion drawn from microbiological analysis of drinking water is the efficiency of disinfection agent (chlorine gas) used at the ZUW Bielany. Chlorine gas – contrary to chlorine dioxide – is less durable and weaker and undergoes rapid decomposition.

18
2. The filtration and chlorination stages are of great importance for microorganism removal. The newest water treatment technology is based on coagulation and rapid filtration. At the ZUW Bielany a slow filtration was used. Thus the thesis that the quality of drinking water depends on the treatment process used in a given plant has been confirmed.
3. No relationship between the amount of bacteria in drinking water and raw water was found.
4. The strongest correlation between the quality of treated water and raw water was found for alkalinity, where the correlation coefficient R=0.869. at the ZUW Raba. The lowest correlation was observed for chemical oxygen demand.
5. At the ZUW Rudawa and ZUW Dłubnia aluminium polychloride (PAX 16) was used in the coagulation phase (in these waters the aluminium concentrations were higher than those of other plants). The highest aluminium concentration occurred in drinking water at the ZUW Rudawa in August 2010, exceeding 0.2 mg·dm-3 . i.e. the maximum permissible value specified in the ordinance of the Minister of Health (Rozporządzenie Ministra Zdrowia z dnia 29 Marca 2007, Rozporządzenie Ministra Zdrowia z dnia 20 Kwietnia 2010). The maximum concentration recorded was 0.274 mg·dm-3.
References
Centralne Laboratorium MPWiK S.A., 2011, Rejestr metod badawczych, Kraków; (in Polish)
Centralne Laboratorium MPWiK S.A., 2013, Wyniki analiz laboratoryjnych wskaźników jakości wody surowej i pitnej w ZUW: Bielany, Raba, Dłubnia, Rudawa wykonane w Centralnym Laboratorium w latach 2008 - 2012, Opracowanie własne, Kraków; (in Polish)
Data available at: www.mpwik.krakow.pl, accessed 25 February 2014;
Data available at: http://www.sni.edu.pl/proj/wodadlakrak/zuw.htm, accessed 25 February 2014;
Directive 98/83/WE of the European Council of 3 November 1998 on the quality of water intended for human consumption (Dz. U. L 330 dated 5.12.1998);
Jawetz E., 1991, Przegląd mikrobiologii lekarskiej, Warsaw: Państwowy Zakład Wydawnictw Lekarskich, second edition revised and supplemented.(in Polish)
Kowal A. L., Świderska-Bróż M., 2003, Oczyszczanie wód, Warsaw: Wydawnictwo Naukowe PWN; (in Polish)

19
Rozporządzenie Ministra Zdrowia z dnia 29 Marca 2007 roku zmieniające rozporządzenie w sprawie jakości wody przeznaczonej do spożycia przez ludzi (Dz. U. Nr 61, poz. 417); (in Polish)
Rozporządzenie Ministra Zdrowia z dnia 20 kwietnia 2010 roku zmieniające rozporządzenie w sprawie jakości wody przeznaczonej do spożycia przez ludzi (Dz. U. Nr 72, poz. 466); (in Polish)
Sozański M. M., Jeż-Walkowiak J., 1995, Wybrane problemy badawcze i projektowe decyzji inwestycyjnych małych zakładów uzdatniania wody, [w]: Kontenerowe i przydomowe oczyszczalnie ścieków oraz stacje uzdatniania wody, Wydawnictwo Ekonomia i Środowisko; (in Polish)
ZUW Rudawa MPWiK S.A., 2011, Technologia uzdatniania wody w ZUW Rudawa, Opracowanie własne, Kraków; (in Polish)

20

21
Arcese G., Flammini S., Lucchetti M. C., Martucci O. THE EVOLUTION OF OP EN INN OVATION IN LARGE FIRM S
THE EVOLUTION OF OPEN INNOVATION IN LARGE FIRMS
Gabriella Arcese, Serena Flammini, Maria Claudia Lucchetti, Olimpia Martucci
Department of Business Studies, Roma Tre University [email protected]
Introduction
The starting point of this work takes place from the theorization that the innovation management is moving from the paradigm of Closed innovation into the paradigm of Open innovation (Chesbrough, H. 2003).
Starting from the second half of the nineties several works have proved that the presence of innovative networks connecting various companies can affect their behaviors and their outputs (Powell, W. W., et al. 1996; Walker, G., et al. 1997; Ahuja, G. 2000). In fact, as a consequence of the changes of innovative processes inside the enterprises, it is possible to see a reversal of the paradigm concerning how the enterprises spread their knowledge (Chesbrough, H. 2004). “The internet had opened up access to talent markets through out the world” (Huston, L., Sakkab, N., 2006). This implies many changes in the technology development process, especially for what concerns the time to market. Before the Internet era, the commercialization of an innovative product or service was a long and complex process (Robertson, T. S., & Gatignon, H. 1998).
Through the spreading out of Internet, the reduction of the time to market variable has become one of the main strategic goals for all kinds of enterprises, as this reduction determines competitive advantages both in terms of competition and profitability (Arcese G., et al., 2013).
In the light of these assumptions, we found interesting to focus our research question on the analysis of the Open innovation diffusion rate among large firms, through some of the main researches that have been done in the field. Therefore the final aim of the present work is to find out the large firms Open innovation adoption rate through an analysis of the Open innovation state of art and some of the main literature case studies.

22
State of art: diffusion of open innovation
Innovation is at the basis of the economic development (Lazonick, W., 2002). As “The Economist” stated in 1999, the innovation has become the “industrial religion” of the XX century (Arcese G., et al., 2013). More frequently governments consider the innovation one of the best approach to improve their gross domestic product (GDP) (OECD, 2007).
Technological development with its constitutional macro phases: invention, innovation and diffusion, is strictly related to the concept of economic development (Chiacchierini, E., 2012).
Starting from the second half of the nineties several works have proved that the presence of innovative networks connecting various enterprises can affect their behaviors and their outputs (Powell, W. W., et al. 1996; Walker, G., et al. 1997; Ahuja, G. 2000). It is well known that technological developments as well as innovation are at the basis of every profitable business. Nowadays innovation is the responsibility of every executive, and it starts with an accurate research for opportunities. In the late nineties Drucker argued that the most successful innovation, results only from a few situations. Some of them come from the inside of a company or an industry (unexpected occurrences, incongruities, process needs and industry and market changes); some other come from outside a company (demographic changes, changes in perception and in new knowledge) (Drucker, P. F.,1998).
According to the Drucker’s vision of innovation there is a big gap between the time by when a new knowledge comes up and the time by which it will be turned into a usable technology. There is also another long time before technology can get into the market (Drucker, P. F., 1998). But the advent of “internet had opened up access to talent markets through out the world” (Huston, L., Sakkab, N., 2006). This implied several changes in the technology development process, especially for what concerns the time to market (Robertson, T. S., & Gatignon, H. 1998).
Traditionally, the research and development (R&D) done by firms to develop new products/services were mainly done inside the company (March, 1991; Wyld & Maurin, 2009; Ahlstrom, 2010; Wyld, 2010; Lichtenthaler, U. 2011). This concept is named Closed innovation (e.g. Figure 1. Closed innovation.) and “is a view that says successful innovation requires control” (Chesbrough, H., 2004). Closed innovation can be seen in the meaning of limited interactions of the organizations with the external environment (Lichtenthaler, U. 2011).

23
Figure 1. Closed innovation. Source: Chesbrough, H., 2003.
The spreading out of Internet had increased the competition among firms and the barriers to entry that had been placed by the most powerful enterprises are meaningfully reduced. Therefore the time to market variable has become one of the main strategic goals for all kinds of enterprises, as this reduction determines competitive advantages both in terms of competition and profitability (Arcese G., et al., 2013). To face such strong competition large firms from different sectors, have built a double strategy. On the one hand they started acquiring technologies from the outside environment (Teece, 1986; von Hippel, 1988; Cassiman & Veugelers, 2006; Beamish & Lupton, 2009) and on the other one they started to externalize their own technology knowledge (Grindley, P. C., & Teece, D. J. 1997; Gassmann, O. 2006; Lichtenthaler, U. 2011).
The strategy to externalize technological knowledge could be referred to the idea that firms can exploit the largest possible number of innovations that are not directly useful for their business models. These projects have been defined by Chesbrough as “False Negatives” (Chesbrough, H. 2004). Therefore the organization of false negatives represents another strategic way to get profits from the technology transfer.
According to this scenario, there has been a shift in the innovation paradigm, concerning how the enterprises spread their knowledge (Chesbrough, H. 2004). Following Chesbrough’ s theorization, the innovation management is shifting from the paradigm of Closed innovation into the paradigm of Open innovation (e.g. Figure 2. Open innovation.) (Chesbrough, H. 2003).

24
Figure 2. Open innovation. Source: Chesbrough, H., 2003.
The concept of “Open innovation” has been defined in several ways; some of them have been synthetized in the table below (e.g. Table 1. Open innovation definitions).
In broadening the theoretical developments on the Open innovation analysis, the advantages deriving from inter-firms cooperation are becoming more and more increasing.“… By using a firm’s process perspective” (Gassmann, O., & Enkel, E., 2006), Gassmann and Enkel have identified three base archetypes in the Open Innovation processes where each of them represents a different strategy: the outside-in process, the inside-out and the coupled process (Gassmann, O., & Enkel, E., 2006). From a recent study it has come up that a growing number of companies is adopting a strategy geared to maintain their knowledge at the outside. The choice of keeping the knowledge at the outside can be referred to the strategy of leaving, in the long run, the know-how outside the borders of the organization (Lichtenthaler, U., & Lichtenthaler, E.,2009, Lichtenthaler, U.,2011) using the inter-firms relationships as an extension of the basic knowledge (Grant, R. M., & Baden‐Fuller, C. 2004; Lichtenthaler, U. 2011).
Actually, “Open innovation offers the prospect of lower costs for innovation, faster times to market, and the chance to share risks with others” (Chesbrough, H., 2013). Therefore, the activities geared towards the acquisition and/or the exchange of technologies (from the outside and/or with the outside), allow the expansion of the basis of inside knowledge increasing shorter technological innovation cycles; this remarkably reduce the firm’s times to access to the market and the initial costs of research and development (R&D). In this way it is possible to acquire directly the technologies that are

25
Table 1. Open innovation definitions
Source Definition
Chesbrough, H., 2003 “Open Innovation is a paradigm that assumes
that firms can and should use external as well as
internal ideas, and internal and external paths to
market, as the firms look to advance their
technology”.
Chesbrough, H. 2004 “Open innovation assumes that internal ideas can
also be taken to market through external
channels, outside a firm’s current business to
generate additional value”
Huston ,L., Sakkab, N., 2006 “Leveraging one to another’s (even
competitors’) innovation assets, products,
intellectual property and people”.
Chesbrough, H.,
Vanhaverbeke, W., & West, J.
(Eds.). 2006
“ […] the purposive use of inflows and outflows
of knowledge to accelerate in one’s own market,
and expand the use of internal knowledge in
external market, respectively”.
Almirall, E., & Casadesus-
Masanell, R. 2010
“an open approach to innovation allows the firm
to discover combinations of product features
that would be hard to envision under
integration”.
Lichtenthaler, U. 2011 “Open innovation is defined as systematically
performing knowledge exploration, retention,
and exploitation inside and outside and
organization’s boundaries throughout the
innovation process”.
Chesbrough, H., 2013 “Open innovation means that companies should
make much greater use of external ideas and
technologies in their own business, while letting
their unused ideas be used by other companies”.
Source: own research.

26
necessary for the development of the guidelines. As a confirmation of this, Koschatzky sustains that the companies that do not cooperate and do not exchange knowledge, in the long run will tend to reduce their basis of know-how, diminishing in this way their ability to create relations with other companies, organizations and more in general with the external environment of the company (Koschatzky, K. 2001). Therefore it is possible to observe that cooperation with the exterior represents a fundamental pressure for the companies in the perspectives of increasing their innovation capacities and reduce their time to market (Enkel, E., 2009).
Narrative analysis of case studies
Usually the majority of the empirical evidences for what concerns Open innovation is based on cases of high tech industries (Gassmann,O., 2006). Among the relations with the outside an interesting possibility to reduce the time to market is represented by the acquisition process of the startup companies. As a confirmation of this, there are many high tech companies that constantly adopt the acquisition strategy as one of their way to innovate. For example Google can be broadened as a possible case of a company that operates in the high tech sector geared towards Open innovation processes. This hypothesis is sustained following the acquisition policy that has been carried out by Google that has involved more than 150 companies, startups and other kinds of companies, so far. This strategy aimed to utilize external sources of innovation to implement internal knowledge has highly contributed to the growth of Google.
Among the most significant examples of the application of this theory it is possible to remark the acquisition of the startup Android Inc. in 2005 (Vogelstein, F. 2013). Since the beginning of the year 2005 Google had started acquiring a series of companies in the mobile sector, this to confirm Google trend policies towards the mobile market (www.businessweek.com). Through this acquisition Google has succeeded in reducing remarkably the time of releasing this technology on the market. As an evidence of what has been said it could be remarked that Android Inc, has been acquired in 2005, and the first version of Android software developer kit has been released in 2007 (Google, 2007) and only one year later the first smart phone has been commercialized by HTC (Google, 2008).
This one and similar other cases, are an additional evidence of how Google exploits at the best the acquisition of technology and know-how from the outside mixing them with the firm inside knowledge reaching innumerable competitive advantages.
“In contrast to earlier models and “fully integrated innovators” like AT&T (now Lucent) Bell Labs and IBM which conduct basic research

27
through commercial products, open innovation celebrates success stories like Cisco, Intel and Microsoft, which succeed by leveraging the basic research of others” (Chesbrough, 2003a; West, J., & Gallagher, S. 2006). Among some historical examples of successful companies it is possible to find: Proctor & Gamble (Huston, L., Sakkab, N., 2006); IBM’s industry solution laboratory (ISL) in Zurich (Gassmann, O., & Enkel, E. 2006); Linux (Henkel, J. 2006) Eli Lilly (Schwartz, K. 6 Huff, B. 2010), and others.
To better understand the adoption process of the Open innovation paradigm, we could analyze the viewpoint offered by the Proctor & Gamble (P&G) case study, as reported by Huston and Sakkab (2006). After the Internet advent, in 2000, this company realized that they were investing more money but gained less and less payoff. At the same time, a growing number of important innovations were made by small and medium firms and even by individuals offering valid projects. Therefore it was necessary to reinvent “the company innovation business model”. P&G decided to move from an innovative model based on internal R&D to a new one called “Connect & Development” (C&D). According to the C&D model half of the innovations had been taken from internal business and the other half had been produced by external connections. Therefore C&D consists of finding good ideas that come up from a constant worldwide collaboration between both organizations and individuals. These new ideas are put together and fetched in to improve and exploit internal capabilities. “[…] we created our connect and develop innovation model. With a clear sense of consumer’s needs, we could identify promising ideas through out the world and apply our own R&D, manufacturing, marketing and purchasing capabilities to them to create better and cheaper products, faster” (Huston ,L., Sakkab, N., 2006).
If we want this strategy to increase the company’s payoff, it is necessary to know exactly what is needed or where to compete. Therefore it is necessary to determine since the beginning the areas of business interests, based on one’s own business model (Chesbrough, H. W., & Appleyard, M. M., 2007).
In order to scout the best ideas P&G decided to operate on a double strategic plan. On the one hand, P&G found three main environments: “[…] top ten consumer needs; adjacencies, that is […] new product or concept that help to take advantage of existing brand equity”; […] Technology game boards, is used to evaluate how technology acquisition moves in one area might affect products in other categories” (Huston ,L., Sakkab, N., 2006). On the other hand, P&G defined the “core networks” that are divided in “Proprietary networks” (Technology Entrepreneurs - Suppliers) and “Open networks” (NineSigma - InnoCentive – YouEncore – Yet2.com).
Once ideas have been selected is possible to move towards an inflexible and complex screening in order to evaluate the profitability and feasibility of

28
each idea. “In the end, for every 100 ideas found on the outside, only one ends up in the market” (Huston ,L., Sakkab, N., 2006).
From the example so far considered as well as from the Google one (above mentioned) we can infer that new ideas can come up both from the external and the internal, but in order to get a profitable payoff and a reduced time to market it is necessary to have since the very beginning a clear view of the areas of business interests.
Although every reverse of paradigm creates intrinsic difficulties in adapting to the change, once the critical time space has been overrun, the innovative process spreads out at a growing speed.
In a study, which has been carried out through a set of interview on a sample of 12 companies, Chesbrough & Crowther have analyzed the Open innovation practices adopted by firms working in mature sectors. According to their analysis, which has been carried out for 24 months, these authors have discovered a certain number of determinant incentives to introduce Open innovation practices in the sectors with high production intensity, and among the results it has come up that the inbound activities are predominant (Chesbrough, H., & Crowther, A. K., 2006).
In a further empirical analysis conducted by Enkel, Gassmann and Chesbrough (2008) it has come up that a sample of 107 (including small medium and large size) European companies that invest in Open innovation have to face risks and obstacles that prevent them from making profit from their initiatives. This study has proved that among the most mentioned risks and obstacles it is possible to find: loss of knowledge (48 %), more expensive costs of coordination (48%) loss of control and higher level of complexity (41%). Moreover there are several internal barriers such as: difficulty in finding the right partner (43%), unbalance between the Open Innovation activities and everyday activities (36%) time and financial resources (Enkel, E., et al. 2009).
The Garwood center for Corporate Innovation at University of California, Berkeley, in the USA and the Fraunhofer society in Germany, in 2013 have published a report about the adoption of the Open innovation model in 125 large American and European companies, quoted at the stock exchange, with their annual sales volume exceeding 250$ billion and with no less than 1000 employees (Chesbrough, H., & Brunswicker, S., 2013).
Among some of the meaningful results of the study carried out by Chesbrough and Brunswicker, it is has come up that: the 78% of the companies adopts Open innovation practices and that these ones are sustained by the 71% of the top managers. No company would leave the support of the Open Innovation; 82% of the sample reports that in comparison to the past three years there has been an increase in the adoption of the Open innovation processes, in the average, the sample of the so far considered companies

29
earmarks (reserve) 2$ billion in Open innovation activities and about 20 employees are nominated for this specific job. (Chesbrough, H., & Brunswicker, S., 2013).
Conclusions
From the several studies analyzed in this work it is evident how after the Internet advent the companies had been pushed to bring in changes in their innovative strategies in order to maintain a high payoff and competition rates. For these reasons and with the support of the analysis done by Chesbrough and Brunswicker (2013), it is possible to say that the adoption rate of Open innovation in large firms is constantly increasing. But this growth doesn’t take place without difficulties that are connected with the barriers in the changing process. Therefore the evolution of technologies along with the evolution of the concept of innovation, characterize the co-partnership of strategic elements. This co-partnership allows reaching a general economic development based on competitiveness.
In order to build a broader and deeper research on the Open innovation, we think that would be worth: to monitor the Open innovation adoption rate both in large and small firms, through empirical analysis; to understand benefits and limits of Open innovation through the literature reviews; in the end, it would be interesting to study the incidence rate on profits and on the time to market originating from the strategies of acquisition of startups done by large firms.
References
Ahlstrom, D., 2010. Innovation and growth: How business contributes to society. Academy of Management Perspectives, 24(3), 11–24.
Ahuja, G., 2000. Collaboration networks, structural holes, and innovation: A longitudinal study. Administrative science quarterly, 45(3), 425-455.
Almirall, E., & Casadesus-Masanell, R., 2010. Open versus closed innovation: a model of discovery and divergence. Academy of management review, 35(1), 27-47.
Android Inc. acquisition, 2005: http://www.businessweek.com/stories/2005-08-16/google-buys-android-for-its-mobile-arsenal.
Arcese G., Flammini S., Martucci O., 2013. Dall’Innovazione alla Startup – l’esperienza d’imprenditori italiani in Italia e in California, McGraw-Hill, Milano.
Beamish, P. W., & Lupton, N. C., 2009. Managing joint ventures. Academy of Managemen Perspectives, 23(2), 75–94.

30
Cassiman, B., & Veugelers, R. , 2006. In search of comple- mentarity in innovation strategy: Internal R&D and external knowledge acquisition. Management Science, 52(1), 68–82.
Chesbrough, H. W., & Appleyard, M. M., 2007. Open innovation and strategy. California management review, 50(1), 57.
Chesbrough, H. W., 2003. Open innovation: The new imperative for creating and profiting from technology. Harvard Business Press.
Chesbrough, H., & Brunswicker, S., 2013. Managing open innovation in large firms. Survey report. Stuttgard: Mediendienstleistungen des Fraunhofer-Informationszentrum.
Chesbrough, H., & Crowther, A. K., 2006. Beyond high tech: early adopters of open innovation in other industries. R&d Management, 36(3), 229-236.
Chesbrough, H., 2004. Managing open innovation. Research-Technology Management, 47(1), 23-26.
Chesbrough, H., 2013. Open business models: How to thrive in the new innovation landscape. Harvard Business Press.
Chesbrough, H., Vanhaverbeke, W., & West, J. (Eds.)., 2008. Open Innovation: Researching a New Paradigm: Researching a New Paradigm. Oxford university press.
Chiacchierini, E., 2012. Tecnologia & produzione. Cap 2: innovazione. CEDAM.
Drucker, P. F.,1998, The discipline of innovation. Harvard business review,76(6), 149-157.
Enkel, E., Gassmann, O., & Chesbrough, H., 2009. Open R&D and open innovation: exploring the phenomenon. R&d Management, 39(4), 311-316.
Gassmann, O., & Enkel, E., 2006. Constituents of open innovation: Three core process archetypes. R&D Management.
Gassmann, O., 2006. Opening up the innovation process: towards an agenda. R&D Management, 36(3), 223-228.
Google, 2007: http://googlesystem.blogspot.it/2007/11/google-launches-android-open-mobile.html.
Google, 2008: http://googlesystem.blogspot.it/2008/08/more-about-android-and-htc-dream.html.
Google, 2014: http://investor.google.com/releases.html.
Grant, R. M., & Baden‐Fuller, C., 2004. A knowledge accessing theory of strategic alliances. Journal of Management Studies, 41(1), 61-84.
Grindley, P. C., & Teece, D. J., 1997. Managing intellectual capital: licensing and cross-licensing in semiconductors and electronics. California Management Review, 39(2).

31
Henkel, J., 2006. Selective revealing in open innovation processes: The case of embedded Linux. Research policy, 35(7), 953-969.
Huston, L., & Sakkab, N., 2006. Connect and develop: Inside Procter & Gamble’s new model for innovation. Harvard Business Review, 84(3), 58–66.
Koschatzky, K., 2001, Networks in innovation research and innovation policy – an introduction. In: Koschatzky, K., Kulicke, M. and Zenker, A. (eds), Innovation Networks: Concepts and Challenges in the European Perspective. Heidelberg: Physica Verlag.
Lazonick, W., 2002, Innovative enterprise and historical transformation. Enterprise and Society, 3(1), 3-47.
Lichtenthaler, U., & Lichtenthaler, E., 2009. A Capability‐Based Framework for Open Innovation: Complementing Absorptive Capacity. Journal of Management Studies, 46(8), 1315-1338.
Lichtenthaler, U., 2011. Open innovation: Past research, current debates, and future directions. The Academy of Management Perspectives, 25(1), 75-93.
March, J. G., 1991. Exploration and exploitation in organizational learning. Organization Science, 2(1), 71–87.
Open innovation paradigm, 2014: www.openinnovation.eu.
Organisation for Economic Co-operation and Development, 2007, OECD Science, Technology and Industry Scoreboard 2007: Innovation and Performance in the Global Economy. Organisation for Economic Co-operation and Development.
Powell, W. W., Koput, K. W., & Smith-Doerr, L., 1996. Interorganizational collaboration and the locus of innovation: Networks of learning in biotechnology. Administrative science quarterly, 116-145.
Robertson, T. S., & Gatignon, H., 1998. Technology development mode: a transaction cost conceptualization. Strategic Management Journal, 19(6), 515-531.
Schwartz, K., & Huff, B., 2010. The story of Eli Lilly’s open innovation journey: How one company developed a mature model. PDMA Visions, (March), 19–22.
Teece, D. J., 1986. Profiting from technological innovation: Implications for integration, collaboration, licensing and public policy. Research Policy, 15, 285–305.
Vogelstein, F., 2013. Dogfight: How Apple and Google Went to War and Started a Revolution. Macmillan.
Von Hippel, E., 2010. Comment on “Is open innovation a field of study or a communication barrier to theory development?” Technovation, 30(11/12), 555.
Walker, G., Kogut, B., & Shan, W., 1997. Social capital, structural holes and the formation of an industry network. Organization Science, 8(2), 109-125.

32
West, J., & Gallagher, S. (2006). Challenges of open innovation: the paradox of firm investment in open‐source software. R&D Management, 36(3), 319-331.
Wyld, D. C., & Maurin, R., 2009. Keys to innovation: The right measures and the right culture? Academy of Man- agement Perspectives, 23(2), 96–98.
Wyld, D. C., 2010. Speaking up for customers: Can sales professionals spark product innovation? Academy of Management Perspectives, 24(2), 80–82.

33
Yuriy Belkin, A lexey Goncharov, Marina P olozhishnikova THE AUTOMATED EXPRESS TECHN OLOGIES OF LOT ID ENTIFICA TION OF SP IRITS F OR ITS SAF ETY AND AUTHEN TICITY
THE AUTOMATED EXPRESS TECHNOLOGIES OF LOT IDENTIFICATION OF SPIRITS FOR ITS SAFETY AND AUTHENTICITY
Yuriy Belkin, Alexey Goncharov, Marina Polozhishnikova
Department of Commodity Science, Plekhanov Russian University of Economics,
Introduction
Big sales volume of low-quality and adulterated alcoholic beverages and high health risk for consumers of such goods are the two main factors providing a strong necessity for development of an effective system for identification and traceability of spirits on different stages of the product life cycle: from producers to consumers. Scientists all over the world use a wide set of physicochemical analytical methods to solve the problems of origin determination, authenticity approval, revelation of adulterated and counterfeit spirits.
Analysis of volatile compounds with gas-liquid chromatography (also with mass spectrometry) is used for determination the authenticity criteria for cognacs and brandies (Zaychik et al., 2007), finding out distinction between different spirits of vinicultural origin (Ledauphin et al., 2010), identifying the spirit origin (concerning different types of raw agricultural materials used in spirit production) (Henryk et al., 2010), finding out correlation with the age of the spirit and for solving other identification problems.
High performance liquid chromatography (HPLC) is used to determinate the contents of specific sugars (Montero et al., 2005), phenolcarbonic acids and furanic compounds (Mavlutova & Polozhishnikova, 2008) to identify the age of cognacs and brandies. Capillary electrophoresis method allows to identify spirits on the basis of neutral sugars and some alcohols analysis (Rovio et al., 2007), volatile nitrogenous compounds and ions analysis (Shelehova et al., 2012). One of the methods that holds much promise is determination of spirits origin according to the contents of different isotopes of carbon and oxygen (Martin et al., 1998).

34
Spectrum analysis is widely used for identification and adulteration revelation of spirits in many countries. A correlation between absorbance in infrared range and classification of spirits into particular types has been proved (Picque et al., 2006). It is also proved that identification of spirit origin with luminescent methods is possible (Polaykov & Abramova, 2012). UV/VIS-spectroscopy and method of principal components have been used to develop mathematical models of wine classification (Manuel et al., 2006).
Many of the methods listed above require some complicated sample preparation or are either not effective enough or too hard to use or too expensive to solve the problem of lot identification, so they can’t be widely used in production to make serial analysis. One of the most efficient methods of adulteration and counterfeiting revelation and prevention is registration of specific parameters, determined by physicochemical methods of different origin, in produced lots. This approach should guarantee the reliability of the identification results.
Material and methods
The objects of the research were 124 samples of spirits of vinicultural origin(cognacs, brandies, grappa) and 47 samples of vodka. The samples were originated from Russia, France, Armenia, Azerbaijan, Georgia, Moldova, Uzbekistan, Ukraine. Determination of physicochemical parameters were conducted without any sample preparation.
Conductivity was measured using conductometers “Anion 4150” (Russia) and “ECTester 138(II)” (China). Meter error for both conductometers was not more than 2 %. Measurement was conducted with automated compensation of temperature change effect.
UV spectrums were registered using spectrophotometers “Shimadzu UV-2450” (Japan) and “SF-2000” (Russia) on the wavelength segment [200;400] nm, the step was 1 nm. 0.1 mm cells were used for colored spirits and 10 mm cells were used for colorless spirits. The comparison solution was distilled water.
Results and discussion
The automated express technology of spirits lot identification provides the registration of most typical and stable physicochemical parameters correlated with the composition of spirituous beverages and their belonging to a particular producer and lot. Conductivity and UV absorbance spectrums were chosen as such parameters.

35
The main influence on the conductivity value in spirits is caused by the ionic composition of water used in production to reach the needed strength of spirit, that is why there are specific conductivity values for each producer. If the water used for spirit production was not specially prepared according to the technical requirements (that is forbidden) the conductivity of such spirits will deviate from the usually measured average values (table 1).
The registration of ultraviolet absorbance spectrums in quartz cells of correct thickness and statistical treatment of the received results made it possible to find out the informative spectrum areas (the areas on the spectral curve on which it is reasonable to compare spectrums of different spirits), which are highly necessary for the efficient identification (table 2).
The automated express technology of lot identification is based on registration and following comparative analysis spectral characteristics and conductivity of identified and reference samples.
Table 1. Conductivity variation limits for genuine and adulterated spirits
Type of spirit Ranges of conductivity variation, µS/cm For genuine spirits For adulterated spirits
Cognacs, brandies, grappa
[22-196] More than 196
Vodka [2-58] More than 58
Table 2. UV-spectrums wavelength areas characteristic
Spirit type \wavelength
200-220 nm 220-230 nm 230-350 nm 350-400 nm
Spirits of vinicultural
origin
Highest variation between parallel
sample measurements
Informative area
Informative area
Insignificant absorbance
values
Vodka Informative area Informative area
Insignificant absorbance
values
Insignificant absorbance
values
According to the proposed method (Belkin et al., 2012), the selection of compared spectral parameters is conducted within the informative areas of the UV-absorbance spectrum, besides that conductivity is measured and compared in the same samples. So the authenticity of the sample is proved by two methods: spectral and electrochemical. After conducting the comparison analysis of identified and reference samples the sample is considered to be authentic if it complies two criteria A and B, which have the following

36
reference values: A≥0.95, B ≤1.0 for colored spirits, B ≤0.1, А – not controlled..
А и В values can be found using the following equations from the spectrum parameters of the samples:
� = �� ∑ ��� − �� ∙ �� − ��������∑ �� − ��� ∙ ∑ �� − ������������ , � = ���∑ �� − ������� ∙ �� ��
where λi…λn – discrete wavelength values within the informative area, nm;
λ – arithmetical mean of discrete wavelength values within the informative area, nm;
Di…Dn – discrete values of UV absorbance of the subtraction curve (the curve which is a difference between spectral curves of identified and reference sample) on the informative area, AU.;
¯ D – arithmetical mean of discrete values of UV absorbance of the subtraction curve on the informative area, AU
n – a number of discrete values of wavelength λi…λn and absorbance Di…Dn of the subtraction curve on the informative area.
At the same time the conductivity of identified and reference sample should fulfill this condition:
(1 - 0,05Е) • Si ≤ Sx ≤ (1 + 0,05E) • Si ,
where Si – conductivity of reference sample, µS/cm;
Sx - conductivity of identified sample, µS/cm;
Е – conductivity meter measurement error, %.
The usage of two independent parameters makes it possible to reach the identification reliability of 93,55 % for spirits of vinicultural origin and 95,75 % for vodkas.
Comparison tests conducted on different models of analytical equipment showed a good reproducibility estimated as an error of 8 % for conductivity measurement and 0,004 AU for UV-spectrum registration. The stability of conductivity values in samples of spirits during storage at recommended conditions for 12 month has been experimentally proven. The relative change in conductivity was not more than 10 % and the sums of squared residuals between registered spectrums before and after storage was not more than between parallel measurements.

37
In order to minimize the data volume in the data analysis system it was proposed to approximate the experimental data of the UV absorbance spectrums. On the basis of maximum reliability and minimum number of model curves coefficients it was established that UV-spectrums can be approximated as a sum of 6 Gauss functions and a cubic polynomial function (R2 not less than 0,99999). Automated identification is carried out using specially developed software that is compatible with all models of analytical equipment.
Conclusions
The technical result of the suggested method is a possibility of an unambiguous spirits identification, the reliable results of which make it possible to find out whether the identified sample belongs to a particular lot (particular producer) or not, besides that it makes possible to find out adulterated spirits . The advantages of the data analysis system are simplicity, reproducibility, low cost, objectiveness, high accuracy – all these advantages stimulate the system to be adopted in analytical laboratories.
The original technology of mathematical data treatment makes it possible to stare data in a compressed form which is necessary for effective use of database memory and for ensuring the high working speed of the system
References
Belkin Yu.D., Goncharov A. I., Kuznetsov V. V., Polozhishnikova M.A. , 2012. Identifikatsiya spirtnykh napitkov na osnove mnogofaktornogo instrumental'nogo analiza. Tovaroved prodovol'stvennykh tovarov, №12, 14-17
Dodero, M. C. R., Snchez, D. A. G., Rodrguez, M. S., Barroso, C. G., 2010. Phenolic Compounds and Furanic Derivatives in the Characterization and Quality Control of Brandy de Jerez. J. Agric. Food Chem., 58 (2), 990–997.
Henryk, H. J., Ziłkowska, A., Kaczmarek, A. J., 2010. Identification of the Botanical Origin of Raw Spirits Produced from Rye, Potato, and Corn Based on Volatile Compounds Analysis Using a SPME-MS Method. J. Agric. Food Chem., 2010, 58 (24), 12585–12591.
Ledauphin, J., Milbeau, C. L., Barillier, D., Hennequin, D.,2010. Differences in the Volatile Compositions of French Labeled Brandies (Armagnac, Calvados, Cognac, and Mirabelle) Using GC-MS and PLS-DA. J. Agric. Food Chem., 58 (13). 7782–7793.
Martin, G., Nicol, L., Naulet, N., Martin, M.,1998. New isotopic criteria for the short-term dating of brandies and spirits. J. of the Science of Food and Agr., 77(2), 153–160.

38
Mavlyutova, M. A., Polozhishnikova M.A., 2008. Opredelenie srednego vozrasta kon'yachnykh spirtov dlya armyanskikh kon'yakov. Tovaroved prodovol'stvennykh tovarov, №7, 8-10.
Montero, C. M., Dodero, M. del C. R., Sánchez, D. A. G., 2005. Sugar сontents of Brandy de Jerez during its aging. J. Agric. Food Chem., 53 (4), 1058–1064.
Picque, D., Lieben, P., Corrieu, G., Cantagrel, R., Lablanquie, O., Snakkers, G., 2006. Discrimination of Cognacs and other distilled drinks by mid-infrared spectropscopy. J. Agric. Food Chem., 54 (15), 5220–5226.
Polyakov, V. A., Abramova, I. M., 2012. Reshenie problemy identifikatsii etilovogo spirta razlichnogo proiskhozhdeniya v tselyakh sovershenstvovaniya kontrolya bezopasnosti i kachestva likero-vodochnoy produktsii. Tekhnika i tekhnologiya pishchevykh proizvodstv, № 3, 85-95.
Rovio, S., Yli-Kauhaluoma, J., Sirén, H., 2007. Determination of neutral carbohydrates by CZE with direct UV detection. Electrophoresis Special Issue, 28(17), 3129–3135.
Shelekhova, N. V., Shelekhova, T. M., Veselovskaya, O. V., Ovchinnikov, O. A., Skvortsova, L. I., 2012. Kontrol' kachestva alkogol'noy produktsii i biotekhnologicheskikh protsessov pererabotki sel'skokhozyaystvennogo syr'ya v etilovyy spirt s ispol'zovaniem khromato-mass-spektrometricheskikh, gazokhromatograficheskikh i elektroforeticheskikh metodov analiza. Proizvodstvo spirta i likerovodochnykh izdeliy, №3, 32-34.
Urbano Manuel, Luque de Castro Maria D., Pepez Pedro M., Garcia-Olmo Juan, Gomez-Nieto Miguel A., 2006. Ultraviolet—visible spectroscopy and pattern recognition methods for differentiation and classification of wines. Food Chem., 97 (1), 166-175.
Watts, V. A., Butzke, C. E., Boulton, R. B., 2003. Study of Aged Cognac Using Solid-Phase Microextraction and Partial Least-Squares Regression. J. Agric. Food Chem., 51 (26), 7738–7742.
Zaychik, B. Ts., Shcherbakov, S. S., Ruzhitskiy, A. O., Khotchenkov, V. P., Koroleva, O. V., 2007. Metody otsenki podlinnosti kon'yakov. Sravnitel'nye issledovaniya ikh individual'nogo sostava. Vinodelie i vinogradarstvo, № 6, 12-13.

39
Paolo Bogoni, Lorenzo Pal lini, Barbara C ampisi, Paola Masotti ITA LY’S R OLE IN THE EUROP EAN
NATURAL GAS MARKET
ITALY’S ROLE IN THE EUROPEAN NATURAL GAS MARKET
Paolo Bogoni1, Lorenzo Pallini2, Barbara Campisi1, Paola Masotti3
1Department of Economics, Business, Mathematics and Statistics, University of Trieste 2University of Trieste
3Department of Economics and Management, University of Trento [email protected]
Introduction
Nowadays, natural gas is a vital component of the world's energy mix and, in addition, is the world’s fastest growing fossil fuel. In fact, natural gas is the cleanest fossil fuel in terms of CO2 emissions, consequently it represents the quickest way to reduce greenhouse gas emissions and it will be more popular in the future as a consequence of environmental issues and concerns. The European Union have stood out in a global context that has not always been conscious of environmental issues, precisely because of its policies for the reduction of CO2. For the short term, as well known, the EU has committed to cutting its emissions to 20% below 1990 levels, whereas the European Commission proposed that the EU set itself a target of reducing emissions to 40% below 1990 levels by 2030 and 60% by 2040. The ambitious roadmap suggests that EU should cut its emissions to 80 - 95% by 2050 (European Commission, 2011). Next to an increasingly popular recourse to renewable energies, energy efficiency and savings, fuel switching programs could contribute a large part of the total mitigation potential and then, in this case, probably natural gas will play an important role in reaching the ambitious European environmental goals. It will acquire value, at least within the European context, as recently stated by Rainer Seele, chief executive of Wintershall (Germany's largest crude oil and natural gas producer), that is natural gas is “the climate-friendly energy source of the 21st century” (Webb, 2010). Natural gas production within the European Union, however, is rather limited, and the main sites are restricted to the area of the North Sea, historically rich in hydrocarbons. To be noted that the sixth World natural gas producer, Norway (BP, 2013), though geographically in the area of Western

40
Europe, is not part of the European Union; its huge production is therefore excluded from the total production count EU27 (EU28 after 1 July 2013). The current situation could change significantly over the next few years or decades, if it will be decided to deploy the potential of a recent and challenged technology, the fracking, which would make it possible to exploit non-conventional deposits. In Europe it is estimated the presence of 16 trillion cubic meters of shale gas (much higher than the tight gas, 3 trillion cubic meters and the coalbed methane, 2 trillion cubic metres), against 1.8 trillion cubic metres of conventional gas present in the territory of the European Union (IEA, 2012; European Commission, 2012). Although the estimates must be verified and there is still considerable uncertainty on the economically recoverable resources foreseen, it is needless to stress that any exploitation of shale gas in Europe would change the productive framework both in quantity and geographically, at least partly offsetting the decline in conventional gas production and avoiding an increase in the EU's dependence on gas imports.
The fact remains that, even the most optimistic scenario examined by the International Energy Agency (IEA, 2012) European production of shale gas could satisfy no more than 10% of the demand in the EU up to 2035 and that the JRC's Unconventional Gas report (European Commission 2012) says that Europe will still have to import 60 per cent of its needs. Therefore, the creation of an efficient interconnected market for natural gas, based on a mix of transport infrastructure, ranging from transnational pipelines to LNG vessels and regasification terminals, remains, in the opinion of the authors, the most effective response to the challenges of the European future, from both an environmental point of view as well as an economic point of view.
European Union: consumption, internal production and importation of natural gas
The last annual report of the BP (BP, 2013) shows, for the European Union, a natural gas production equal to 134.7 MTOE in the year 2012, in sharp decline compared to the previous year (-5.5%), highlighting a decline began, not surprisingly, in 2011, the year in which the global financial crisis has had the strongest impact on the real economy in Europe, resulting in a contraction in consumption exceeding 10%; the production of course followed the negative trend, falling by more than 11%. Figure 1 illustrates the consumption of EU27 of last years. In a fortnightly positive trends, two recent losses leap out, the first following the financial crisis of 2008, and the second, as above shown, for the 2011-2012 biennium. The year 2012 has recorded a consumption of approximately 400 MTOE, and this means that the domestic production of the Union covered the 34% of its requirements. In addition, the first quarter of 2013 highlighted a contraction of 0.7% of the Gross Domestic
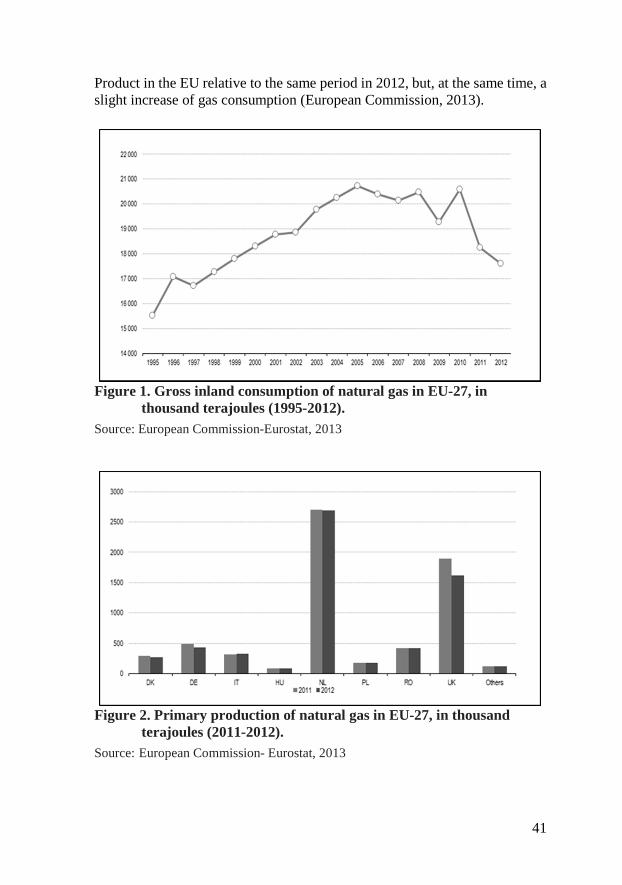
41
Product in the EU relative to the same period in 2012, but, at the same time, a slight increase of gas consumption (European Commission, 2013).
Figure 1. Gross inland consumption of natural gas in EU-27, in
thousand terajoules (1995-2012). Source: European Commission-Eurostat, 2013
Figure 2. Primary production of natural gas in EU-27, in thousand
terajoules (2011-2012). Source: European Commission- Eurostat, 2013

42
As mentioned above, the main producing countries exploit their offshore deposits in the North Sea, and are therefore the United Kingdom and the Netherlands. The latter in particular, the first nation for importance in the Union, is the thirteenth producer on the world stage (BP 2013). Figure 2 clarifies the production volumes of the eight leading European manufacturers, by grouping the remaining production in a ninth column. It is noticed Italy among the major manufacturers, but also for relatively small quantities, due essentially to localized deposits in the Adriatic Sea. Everything brings us, inevitably, to consider another crucial aspect of the European market, that is the strategic, political and economic importance of natural gas imports.
Imports who have met in 2012 approximately 66% of the European Union requirements, with an energy dependence which, moreover, in 15 Member States exceeds the 90% (European Commission - Eurostat, 2013). An effective framework of that situation, well diversified within the European Union, is provided by figure 3, which shows the balance of trade of natural gas amount to the 27 EU Countries. On the side of imports it can be seen as, after the German locomotive, first in Europe in terms of economy and population (and consequently very energy-intensive), in second place there is Italy, a country that has long favoured, in its energy policy, the use of natural gas. The main exporter, mainly to other EU countries, is the Netherlands, by virtue of their large production and the limited spatial and demographic significance, allowing modest domestic consumption. It is interesting to consider also the major trading partners and their streams via pipeline and LNG. The main exporter to the EU, to 118 MTOE, is Russia, whose Caucasian and in the Caspian area deposits are connected to the areas of European consumption by several pipelines, while the second exporter is Norway, to 100 MTOE, which similarly uses largely the European pipeline network to sell its natural gas to most of the countries of the Union. In third place, helped by the proximity to the Mediterranean countries, is the world's ninth producer, Algeria, for over 47 MTOE. Despite the reduced distances, under the thousand kilometres, the fear of a certain inconstancy and political instability in the country, increased by the recent Arab spring, has so far prevented the creation of an extended network of offshore pipelines. Consequently, with the exception of the short Transmed gas pipeline which crosses the Tunisia to Sicily, the transport is only by sea with the technique of LNG. Fourth, fifth, seventh and eighth place respectively are Qatar, Nigeria, Trinidad & Tobago and Egypt (approximately 38, 14, 3.3 and 2.9 MTOE), clearly too far apart to use another form of transportation other than the LNG. Qatar, should be borne in mind, is the world’s largest exporter of liquefied gas. Sixth place (5.8 MTOE via pipeline) is Lybia (Gas in focus, 2013).

43
Figure 3. Imports and exports of natural gas in EU-27, in thousand
terajoules (2011-2012). Source: European Commission- Eurostat, 2013
Italy: consumption, internal production and importation of natural gas
Natural gas is an energy source of crucial importance as a key factor of the Italian economy. The most recent National Energy Balance (Ministero dello Sviluppo Economico, 2013a) shows the data for the year 2012, year in which the economic crisis has further exacerbated, resulting in a further decline in GDP and consumption. Consequently, energy consumption also decreased compared to an already weak 2011: -3.5%. Analyzing the data, there is a total energy consumption of 177.8 MTOE, in which natural gas accounted for 61.4 MTOE, that is 34.5%, almost equal to the oil, despite the prevailing role in the transport of it. Renewable sources have guaranteed 37.9% of the national electricity production, and the thermoelectric the remaining 62.1%. In the thermoelectric sector, natural gas provided 20.6 MTOE, accounting for 57.7%, a decline of almost 3% compared to 2011, that leaves intact the dominance of methane. It remains to analyze which economic sectors have consumed natural gas not directed to thermoelectric. Removed consumption and losses in the energy sector, almost 39.2 MTOE remain available: among these, 25.5 were used for civil uses, mainly in domestic heating; 12.3 have been used by industries; transport have used barely 0.8 and the remainder was divided between agricultural use and non-energy use. Domestic production in 2012 met only 11 .5% of gross domestic consumption: the main Italian deposits are located offshore in the Adriatic Sea and their production has been reduced from decade to decade, to the point that they are

44
considered in depletion. It is hypothesized the presence of additional methane in other fields in the northern Adriatic, but its possible exploitation is not allowed by local environmental legislation in force, therefore there are no in-depth and detailed studies that esteem the present quantities. This progressive decline has not stopped: from the first data relating to 2013 it is observed a domestic output of 6.3 MTOE, which means that almost 90% of the demand is covered by imports (Fiorini, Picchio & Sileo, 2014). With the collapse of gas demand after the crisis of 2008 also imports were down by more or less the same amount on all borders, except in 2013-14, when flows from Russia have recovered and exceeded pre-crisis levels, while the contribution of other exporting countries has collapsed dramatically (see figure 4, that compares the data of February 2008, before the crisis, with those relating to February 2014.)
Figure 4. Italian natural gas imports in MTOE (February 2008 and
2014). Northern Europe = Netherlands and Norway Source: : personal elaboration by the authors on data Fiorini, Picchio and Sileo,
2014
Any decision regarding the supply of natural gas can not be separated by the demand trend, in sharp decline in recent years, not only because of the economic crisis. In fact, the reasons that have contributed to this decline are, on the one hand, the restructuring that took place in the industrial, residential and services sectors, focused on saving policies and energy efficiency, on the other hand, the increasing presence of competitors of methane, particularly in electricity generation, where the significant contribution of renewables energies has literally revolutionized the market. It follows that the main
45
problem for Italy is not represented by the amount of gas necessary for its energy system, but it is the security of supply through diversification of sources in order to change the current context of high dependence on Moscow. This basically means two things: pricing processes (long term contracts and spot trading) and infrastructures, that are necessary not only for Italy, but also (and perhaps even more so) for the entire European Union.
Italy and the new strategic pipelines
The geographical position of Italy could be crucial to assure a leading role in a single European market for natural gas. Overlooking the Mediterranean, Italy is close to the countries of North Africa rich of methane; it's quite close to the Black Sea, the main gateway for the transposition of the gas Caucasian; it's relatively close to Turkey, the main passage of Iranian, Azeri and Turkmen gas. This would allow Italy to become the main gateway for most of the direct gas in Europe; not surprisingly, in the four primary gas runners identified by the European Commission, Italy is present in three of them: North-South corridor in Western Europe, North-South Corridor in Central and South-Eastern Europe and the Southern Corridor, to the exclusion only (and obviously) from the Baltic Interconnection Plan. However, there is the need for large investments in infrastructure and heavy unknowns remain on the actual future development of the market for natural gas, which is currently in decline, as mentioned above. In this regard, it is interesting to note that in the context of the possible evolution of the national energy system, analyzed by '"National Agency for New Technologies, Energy and Sustainable Economic Development" (ENEA) according to three different scenarios with a time horizon of the year 2030 (ENEA, 2012), they lead to very different results. It passes from a first reference scenario or "Reference Scenario", where the demand for natural gas continues to grow up to a 10% increase in 2030 compared to 2010, helping to meet, with 75 MTOE, 40% of the primary energy requirements, to a third scenario, “Roadmap Scenario” (which describes a development of the national energy system in line with the European policies for the reduction of CO2 emissions by 80% in 2050 (European Commission, 2011) when consumption would be reduced by the year 2030 to 50 MTOE, contributing to meet 31% of domestic energy demand. But there is another aspect to be noted, that is the need for a reduction in the price of Italian gas, historically higher than the average European price. On the spot market, on average, in 2012 a MWh of gas cost €29 in Italy, against a European average of €25: a differential of 13% (Cassa Depositi e Prestiti, 2013). All this leads us to the information provided by the Ministry for Economic Development in the National Energy Strategy to 2013, where one of the main goals is “the promotion of a competitive gas market, integrated with Europe and with aligned prices , and with the opportunity to become the

46
main hub in the southern belt of the continent " (Ministero dello Sviluppo Economico, 2013b). The idea here expressed is therefore precisely that of making Italy the reference market for natural gas for the whole Southern Europe, and therefore the ability to resell the gas to much of Mediterranean Europe: this would greatly increase the political and economic weight of Italy in the European chessboard. To reach the hub goal, in addition to the trans-European infrastructure investments, it's necessary to strengthen the national network and to increase the storage capacity. In addition, it is essential to increase the capacity of Italian transposition of gas from abroad. This can be achieved basically in two ways: via pipeline, enhancing existing pipelines and realizing of new ones, or via LNG, building new terminals on the Italian coastline.
In the way of the pipelines, it is necessary to mention first of all the South Stream (South Stream, 2014) to the absolute importance of the project in terms of investment, path length and capacity of transport: 63 billion cubic meters per year, equivalent to almost 52 MTOE or 85% of the gas consumption of the whole of Italy throughout 2012. It will connect the Russian, Caucasian and Caspian Sea fields to the North Eastern Italy. The first section will be 930 km offshore, across the entire Black Sea up to land in Varna, Bulgarian territory; hence, proceeding on the mainland, it will cross Bulgaria, Serbia, Hungary and Slovenia, until the arrival in Italy. The construction of the offshore section of South Stream began December 7, 2012 from Anapa, Russia, and is scheduled for completion and commissioning of the entire work by the end of 2015. The financial effort will be extremely significant, nearly 16 billion euros expected, but is expected to generate one billion Euros of annual net revenues thanks to the remarkable extent.
Secondly, we find GALSI, Gasdotto Algeria Sardegna Italia (Algeria Sardinia Italy Pipeline) (Galsi, 2011). The project involves the construction of an offshore pipeline from Annaba, the Algerian coast, to Porto Botte, in Sardinia; the onshore route would continue on the Sardinian territory, then go back and finish underwater in Tuscany. A total route of almost 900 km, including 600 km offshore, with a maximum depth reached in the southern Mediterranean, 2885 m: the deepest pipeline ever built. The pipeline would have a capacity close to 8 billion cubic meters per year, increasable up to 20. The compression of natural gas consumption is, however, calling into question the viability initially promised by GALSI, and in February 2013 there was a further postponement of the final investment decision.
In third place we find the TAP, Trans Adriatic Pipeline (TAP, 2014). The project will connect the existing Turkish infrastructure for the import of natural gas from the Caspian, primarily from Azerbaijan, to Italy. The pipeline will pass through Greece and Albania to arrive, after a short distance offshore of 105 km, to Puglia. The entire route would be around 800 km, and would bring Azeri gas to Europe through Italian pipelines. The project is nothing

47
short of strategic and delays in the approval and financing by Nabucco West (the Turkey–Austria gas pipeline) make it even more interesting in hubs-point of view: with a limited investment, given the brevity of the track, Italy could become the only gateway to Europe for the Azeri gas at first, then Turkmen gas and in a longer term, even Iran gas. Not to mention that the competition of these new suppliers is expected to drive down the prices currently charged by other traditional exporters. In addition, the creation of TANAP, Trans ANAtolic Pipeline and its junction with TAP, near the border with Greece, will ensure reliability and security of supply of Caspian natural gas to Italy and consequently to the whole Europe. The consortium for the construction of the TAP provides an initial capacity of 10 billion cubic meters per year, which can be increased up to 20. Feasibility studies started in 2005, thanks to funding from the European Union, which recognizes TAP status "project of common interest", which is crucial in the realization of the Southern Corridor. The completion of the work is expected around 2018, in conjunction with the first flows through TANAP.
The direct competitor of TAP may be IGI Poseidon (IGI Poseidon, 2013), the planned gas pipeline between Greece and Italy, that assumed the same purposes of diversification and with the same region of final destination, Puglia. The Poseidon should only connect existing infrastructure in Greece and Italy, with a long underwater pipeline about 200 km, from the Greek Ionian coast to Otranto, and with an expected capacity of 8 billion cubic meters per year, increasable over time up to 20. The construction is expected by the end of 2015, but one wonders if indeed the project will never see the light, given the very close and similar TAP, now under construction. Poseidon has a planned investment much lower, about 500 million, but the link with TANAP and ownership of the onshore section in Greece and Albania give TAP a far higher security of supply. An interesting hypothesis would see the merger of the two projects into one: the connection of Poseidon at TAP on the Greek territory, and a double pipe to Puglia, in addition to the bifurcation of TAP to Croatia.
Figure 6 summarizes effectively the strategic eastern route of the new pipelines.
Italy seems willing to undertake with strength the way of construction of new LNG terminals, which go to support Panigaglia and Cavarzere. The completion of all structures should take place by 2018, and would cumulatively increase import capacity theoretical 85 billion cubic meters of gas per year: 126% of total imports throughout 2012. The effective implementation of all planned LNG terminals is strongly in doubt, both for the reduction of consumption often cited, both in the geographical proximity of some projects too, and because an increase in so remarkable ability to absorb the new LNG would make regasifiers work only a fraction of their potential speed, with a significant economic impact. The flexibility of LNG

48
terminals is awesome and makes an important economic and strategic option: take advantage of price fluctuations on the spot markets. The absence of permanent bonds with a supplier allows to consult from time to time to those who practice the lowest price, almost with no geographical limits, given the very low impact on the final price of the mileage to be made by ship. However, this latter aspect makes the construction of LNG terminals a double-edged sword: once almost zero the obstacle of distance between producer and market outlets, gas tankers would arrive directly in each importing country, without necessarily crossing Italy, which at this point would have thrown away its geographical advantage and renounced the role of hub. The pipeline is the most economical way for short distances, and even up to 1500 km offshore route involves a consideration less than the cost of transport LNG. Contrary to the construction of LNG terminals, pipeline accentuate the focus on Italian advantageous geographic location, and therefore seems to be the most rational way forward in a hub perspective. However, the rigidity of long-term contracts signed with suppliers is a major obstacle. These decades of contracts also usually provide for a clause “take–or–pay”: regardless of the actual withdrawal from the pipeline, the importing country must pay a predetermined lump sum, equal to the price of a minimum amount of methane. The “take–or–pay”, however, can be mitigated by the terms “make up” and “carry forward” allowing to retrieve the non-purchase of a period in subsequent periods. The real problem with these long-term contracts is their indexing to the price of petroleum products: the probable unforeseen fluctuations in oil prices are reflected in the prices of natural gas, and the gas bill of an importing country is so dangerously related to the moods of global finance. Without changes in the indexing of supply contracts via pipeline, natural gas so purchased, while remaining anchored to oil prices, would not benefit from any price decrease, due e.g. to the exploitation of shale gas, even if any forecasts on future energy market and on the interactions of natural gas and oil-coal remain somewhat risky (Asche, Oglend & Osmundsen, 2012). In the opinion of the authors, a country with the ambition and geographical requirements to become a gas hub for Southern Europe should leave only a supplementary role to LNG terminals, focusing on the strategic pipeline, but using the new bargaining power (obtained under the strategic role acquired) in order to change the "traditional" contract and suggest different types of indexing.
Conclusions
The future of the European gas market remains undoubtedly a dilemma not so easy to resolve. Net of uncertain situation in Ukraine, whose evolution could further modify the EU28 supply strategies, the theme of energy security remains indissolubly linked to geopolitical and environmental aspects (role of gas, shale gas included (Weijermars et al, 2011) in strategies for climate

49
change mitigation, environmental impact of regasification plants etc) and economical ones, such as the impact of American shale gas on energy commodity prices. The direct effect of prices on European gas regional markets should remain rather moderate, in the case of the exploitation of European shale gas deposits due to relatively low volumes, to higher production costs and to prices that are still largely defined in the scope of long-term contracts indexed on oil. Waiting for desirable restructuring policies of the Italian electricity network and, more generally, for a massive use of renewable energies, the role of natural gas remains and will remain for a long time still prevailing in Italian energy system. The need for internal energy demand coverage, along with strategic geographical position, offer to Italy the opportunity to become an energy hub in southern Europe and the Mediterranean, assuming a crucial role in the supply of natural gas for the entire European Union, pending a European revolution of shale gas that maybe won't happen ever.
Figure 5. Southeast gas corridor: competing European and Russian
pipeline projects Source: Center for Security Studies – ETH Zurich, 2008
References
Asche F., Oglend A., Osmundsen P., 2012, Gas versus oil prices the impact of shale gas, Energy Policy,47, 117-124.
BP, 2013, Statistical Review of World Energy June 2013, www.bp.com, accessed 4 April.
Cassa Depositi e Prestiti, 2013, Il mercato del gas naturale in Italia. Lo sviluppo delle infrastrutture nel contesto europeo, CDP Studio di settore n. 03 - March 2013.

50
Center for Security Studies – ETH Zurich, 2008, Energy Security of the European Union, CSS Analyses in Security Policies, 3 (36), June 2008.
Enea, 2012, Rapporto energia e ambiente. Il compendio del rapporto energia e ambiente 2009-2010, Enea, April 2012, Roma (Italy).
European Commission, 2011, Roadmap for moving to a low-carbon economy in 2050, Communication from The Commission to the European Parliament, the Council, the European Economic and Social Committee and the Committee Of The Regions, Brussels 8.3.2011.
European Commission, 2012, Unconventional Gas: Potential Energy Market Impacts in the European Union, JRC Scientific and Policy Reports, Luxembourg: Publications Office of the European Union, 2012.
European Commission, 2013, Quarterly report on European gas market, DG Energy - Market Observatory for Energy, 6 (2), Second Quarter of 2013.
European Commission – Eurostat, 2013, Natural gas consumption statistics, http://epp.eurostat.ec.europa.eu/, accessed 4 April 2014.
Gas in focus – Observatoire du Gaz, 2013, Supply. Imports of natural gas into the European Union, www.gasinfocus.com, accessed 4 April 2014.
Fiorini A., Picchio G., Sileo A., 2014, Quanto dipendiamo dal gas russo?, lavoce.info 28.03.2014, www.lavoce.info, accessed 4 April 2014.
Galsi, 2011, www.galsi.com, accessed 4 April 2014.
IEA, 2012, Golden Rules for a Golden Age of Gas, WEO 12.11.2012.
IGI Poseidon, 2013, www.igi-poseidon.com, accessed 4 April 2014.
Ministero dello Sviluppo Economico, 2013a, Bilancio energetico nazionale 2012, Dipartimento per l’Energia, Direzione generale per la sicurezza dell'approvvigionamento e le infrastrutture energetiche DIV. VII - Statistiche ed analisi energetiche e minerarie, FINALE – Rev 1., 2013.
Ministero dello Sviluppo Economico, 2013b, Strategia Energetica Nazionale:per un’energia più competitiva e sostenibile, March 2013.
South Stream, 2014, www.south-stream.info, accessed 4 April 2014.
TAP, 2014, www.trans-adriatic.pipeline.com, accessed 4 April 2014.
Webb C., 2010, Europe's gas supply dilemma, Power Engineering International, 1.05.2010, www.powerengineeringint.com, accessed 4 April 2014.
Weijermars R., Drijkoningen G., Heimovaara T.J., Rudolph E.S.J, Weltje G.J., Wolf K.H.A.A., 2011, Unconventional gas research initiative for clean energy transition in Europe, Journal of Natural Gas Science and Engineering, 3, 402-412.

51
Cho, Jae Kyung, Kim, Hyo-Jung , Shim, Hyo-Young A study on convergence education program development
to build up CR EATIVe·Personality: Focused on “making smart DEVIC E”
program for SEC ONDARY EDUCATION A STUDY ON CONVERGENCE
EDUCATION PROGRAM DEVELOPMENT TO BUILD UP CREATIVE·PERSONALITY: FOCUSED ON “MAKING SMART DEVICE” PROGRAM FOR SECONDARY EDUCATION
Jae Kyung Cho1, Hyo-Jung Kim2, Hyo-Young Shim1
1 Dept. of Industrial Design, Ewha Womans University, [email protected]
2 Dept. of Convergence Design, Ewha Womans University,
Introduction
In the convergence age, the educational world is lately trying to nurture human resources for intelligence, skills and value creation through convergence with the different lines of study. The concept of convergence is being used in many different fields as well as education for synergy of each field. Now it is a time for development of class models that can improve study results to train human resources at the educational arena. The basic of the class models aims to improve problem-solving abilities on real life and to acquire actively knowledge based on creative and personality. 21st the characteristics of global talent is to have talented, creative and specialty, also they need the power that can change organization and society, having responsibility for society and humankind (Korea Science Creative Foundation, 2012). Exciting creativity research has limits that research focuses mostly on the thought ability of creativity factors, but now is a global trend is trying to unite cognitive, creativity and affective elements in equilibrium (Gardner, 2006; Urban, 1995; Csikzentmihalyi, 1996). Future education should be not a center of education, the crammed-packed education but the education, bringing out personal qualities. Also there should be creative and personality in the center of the education that can search for students’ potential and raise up their values (The Ministry of Education, Science and Technology, 2009). Following this trend, we need applicable class models to the scene.
This study is a basic research of the convergence education program development for creative and personality education in education program.

52
In this study, before the program development, a basic research had proceeded.
First, we studied a core competence of creativity and personality on education.
Second, we drew main elements of a core competence on creativity and personality in art field.
Third, we designed the program, applied a core competence of creativity and personality in art class.
The concept of creative and personality education
The concept of creativity
The dictionary definition of creativity is the abilities to think of something new (Korea Standard Unabridged Dictionary 1999). Guilford (1959) defines that creativity is a power to bring out new and something mysterious. Veron (1989) defines that creativity is human capability that a specialist produce something: new and unusual ideas, insight, invention or artistic products that accepted the value of scientific, social, descriptive or an esthetic. Talyor (1988) defines that creativity is one of personality traits; it is a complicated mentality process to express creativity thinking and productive thinking, it also is a passion, producing the attitude of tolerance, achievement and change and big belief. Torrance (1977) defines that creativity is the process of Problem-Solving: first, the perception of difficult issues second, making the idea for solving it third, conforming hypotheses and testing hypotheses finally, delivering the effects.Weisberg (1988) defines that creativity is products valued positively in a view of results in art, science and areas of performance. Csikszentmihalyi (1996) defines that creativity is to arise from interaction of the system consisted of three elements in an emphatic meaning the interaction of people and their environment: the site composed of culture including symbolical rules, people bring up new one at symbolical area and experts who admit new one and confirm. Rogers (1962) defines that creativity is to appear the action predicting new results; it is produced process in individual characteristics, affairs around the individual, people, materials, some circumstance of their life and so on. Boden (1993), Schmalhoger (1998), Maslow (1954) and Taylor (1959) divided creativity into extraordinary creativity and ordinary creativity, in the same vein, divided that into personal creativity and historical creativity by Boden, s small letter and capital creativity Gardner by Gardner, peculiar and impossible creativity by Schmalhoger (1998) self-realization and special talent creativity by Maslow. Tayolr classify extraordinary and ordinary creativity by expressive, creative, intensive, innovative and occurrence.

53
The concept of personality
Freud caught personality in the way to satisfy individual instinctive needs among realistic and moral brakes. Rodgers understood it as the process of realizing self-realization individual in the universe of unique subjective experience. Skinner is arguing that it is a learned course of action through process of some unique change. In a study on personality theory measurement, Pervin defined that it appears people’s unique reaction and dynamic character in many situation.
Now OECD countries and many advanced countries insist that personality education is more important than knowledge education and health is more important than personality and knowledge education.
Creative·Personality Education
Competitiveness committee of the U.S. suggested ‘Five Minds for the future’ on detailed creative personality mind: Disciplined mind, Synthesizing mind, Creating mind, Respectful mind, and Ethical mind (Howard Gardner, 2007). The partnership of the U.S. for 21st Century Skill suggests that the qualities that make for talent needed for the future is creative and innovation with core ability: Learning & Innovation ability, Life & Career ability, Information, Media & Technology ability. Since 2006, the UK announced government guidelines for creativity education and created Creative and Culture Education Advisory Board. Though CP (creative Partnership), a typical international creativity education project of the UK, the class has been progressed by artist, architect and professionals in a various fields. France runs Center for Teaching and Learning Support(Sellen), government lead creativity education program and through it, provides higher creativity education resources to public education, also it is installed a network throughout France. In 2008 new national curriculum, Japan emphasized experienced education to build decision-making skills, problem-solving skill and personality to live together. If a person’s creativity and personality isn’t constructed, it is hard to grow up as a leader of a society (Moon, Yong lin, Cho, in, 2010: Choi, me jung, 2010: Cho, nan sim, 2004: An, Bum hee 2004: Park, Choon sung 2010: Park, Young tea 2002). Two-zone of creativity and personality are connected organically (Kim Young suk, 2012: Choi, me jung, 2010: Park choon sung, 2010). In art and science Barron (1972) suggests creative personality though creativity cognitive and affective characteristic of creativity, studying on people’s characteristic, made creative achievements. The elements of creativity are universally emphasized originality and usefulness but an argument was also presented that ethicality problems should be emphasized. (Cropley, 2001; Martin & Stoner, 1996) creativity personality education

54
emphasizes unique function role of creative education and personality education and it is an educational philosophy and education strategy to develop of creative human resource with good personality and moral judgment through organic combination of two educations (Kim, hyung suk,2012). Cho, nan sam (2004) presented creativity, self-directedness, tolerance, openness, flexible thinking, the understanding of other cultures and problem-solving ability as the 21st century personality education’s sources. An Bum hee (2004) insisted that it is the progressive attitude including civil education, aptitude development, reasonable decision-making ability, creative problem-solving ability and leadership. 21st century emphasizes group’s creative products as a results of communicate and social cooperation and need for personality education to maintain harmonic relationship with society (Choi, Me jung, 2010: Cho, nan sim 2004: Park, choon sung, 2012).
A core capabilities of creativity and personality education in the field of art
A study on creative education resources in the field of art
In the field of art, problem- solving abilities have to be emphasized with the strategy of creativity personality education on the development of education courses to improve creative, also thought ability have to be emphasized: idea creation, using new materials and diffuse thinking through convergent cognitive processes. Put a high value on environment development for creative, learning the following self-interest through individual study as well as cooperative learning (Zimmerman 2009). In the field of art, creative can be improved through discovering the problem and problem-solving processes by recognizing problems and themes encountered in students’ daily lives.
A study on personality education elements in the field of art
In art education, creative is an essential attribute for everybody as well as small groups of artists with artistic talents. The definition of personality education will be limited in art class during individual study as well as cooperative learning. We want to suggest a study and operation process on education of creativity personality through an art education.

55
Table 1. Creative education resources in the field of art
Creative education resources The meaning of art
Extend of thought
The ability to think new ideas and the diverse perspectives when observing things
The faculty to express something and create the image with no limits to thoughts and ideas
Capable of making creativity idea a visually idea, exercising or applying visual information
The capability of constructing and thinking totally different structures and forms, thinking out of box as the existing common thoughts and ideas
Collect of thought
When coming with several concepts and expression methods, a capable of making and expressing for it in a broad view
The ability to understand emotionally, feel a work and accept art work
The tendency to evaluate and analysis the difference when appreciating another’s works.
Problem-solving ability
The ability to find out a new problem and to present solution point
When faced with some problem, the capability of coming to the right decision and making the right decision
Curiosity/ Interest The tendencies or attitudes to ask questions and explore the change and the phenomena in their surroundings and a new subject
Independence In individual work, the work is being carried out with other work’s influences but it is the ability to make an fresh design with creative ideas
Openness The faculty to accept other’s ideas and expression with open mind and a different view
Immersion Feel confident and happy on finding more than one’s capabilities when people finished the work with high concentration

56
Table 2. Personality education elements in the field of art
Personality education elements The meaning of art field
Honest To admit and report exactly without manipulating a result of creative work that I earned
Promise Understand and perform the self role regarding art activity
Forgiveness Understand the situation of me and other people
Responsibility Try to perform exactly my role
Consideration Understand what they are going through and sympathize to others
Possession Realize that there is a proprietary right in invisible creative works ( the concept of the work, ideas)
Moral sensitivity Think about the emotions and the feelings of the people discriminated In art activities
Moral judgment Understand that me and other’s position are all important in art activities
Decision-making ability Judge what is important among one’s own interest and other people’s profit
Action and the power of execution
Look for the impedimental elements, in doing good deeds
The core capabilities in the field of art
In the field of art, the creative core capabilities
• In the field of art, the creative core capabilities are limited to creative performance elements, creative communication elements and creative motivational elements.

57
• As the creative cognitive elements, collect of thought and extend of thought are a flexible thinking ability about the subject of creative activities.
• As the creative performance elements, the problem-solving ability is a performance ability to create the effective result on a given subject of the class.
• As a creative communication elements, personal and social issues like other cultures and other people’s thoughts and so on with independence and openness
• Creative motivational elements are the ability to be able to concentrate in their class with immersion, curiosity and interest in the art class.
A core competence of the personality in the field of art
• A core competence of the personality in art is limited to personality elements in the right of creative works, personality elements of ethical thought, personality elements of performance ability and personality elements of conversation.
• Personality elements in the right of creative works are honesty , responsibility and possession about the result of creative works and creative ideas in art class
• Personality elements of ethical thought are moral sensitivity and moral judgment and these elements can improve ethical thought on the subjects and issues of art class.
• Personality elements of performance ability are decision-making ability, action and the power of execution to express the creative ideas
• Personality elements of conversation are promise, consideration and forgiveness: these are the ability to resolve the conflict through communication each other in group activities.
The convergence of science and art in the field of art. The suggestion of the convergence class model
IDEO global company’s a founder Davide Kelly said that creativity is much more extensive and common than what people feel that something is artistic. We think that creativity is to create totally new things, using imagination. The creativity is developed everywhere that there is a chance to draw the new idea, the solution and the approach method. He also said that everyone must have access to many resources which it can be nourishing of creativity. This study wants to suggest the class models that connect between

58
science and design to respond to the latest trends that integrate humanities and cutting edge technology with economy and industry.
We will develop the convergence class models based on improving creative problem-solving ability and building an upright character to live together out of the art school curriculums that are hard to do convergence and combination education between school system.
Figure 1. The core capabilities of art
The development of the education models combined with science and art.
• Invention in culture into our daily lives, Motivation for design and scientific invention, Connection design thinking with creative invention
• We can cultivate insightful people, as creating the academic value and the industrial value, building up science, technology, knowledge, experience, reason and sensitivity in art.
• The education for instilling design thinking and design mind was implemented to improve problem-solving ability in our daily life.
This class as a activity of expression conflated what they learned in an instructional unit of art and the technology home economics: through ‘the technological development and the future society’ and ‘technology and

59
invention’ in middle school 3rd grader and could invent creative ideas, applying the expression method of art and the invention of the technology home economics harmoniously. It was composed of four steps and it also was an intriguing activity that makes creative character toys with new material conductivity thread, using principle of turning on a lamp and a light bulb based on understanding about electrical network diagram that they learned in the technology home economics class.
The name of the The name of the The name of the The name of the ProgramProgramProgramProgram ““““Making Smart DeviceMaking Smart DeviceMaking Smart DeviceMaking Smart Device””””
The Gole of educationThe Gole of educationThe Gole of educationThe Gole of education
- Invention in culture into our daily lives, Motivation for design and scientific invention, Connection design thinking with creative invention
CreativeCreativeCreativeCreative ···· PersonalityPersonalityPersonalityPersonality education resourceseducation resourceseducation resourceseducation resources
---- Creativity :Creativity :Creativity :Creativity : Problem-solving ability,Iimmersion, Curiosity, Interest ---- Personality : Personality : Personality : Personality : Responsibility, Possession, Decision-making ability, Action and the power of execution
The gole of The gole of The gole of The gole of CreativeCreativeCreativeCreative ···· PersonalityPersonalityPersonalityPersonality
---- To feel joy and interest about scientific and creative elements appearing in our daily lives through artistic expression. - To improve the tendency or an attitude, exploring and raising a question a new subject or change and phenomenon in our daily lives. - In our daily lives, we can improve problem-solving ability and integrated thought with the invention through a scientific principle.
EvaluationEvaluationEvaluationEvaluation - Creative · Personality education resources
Figure 2. Program

60
‘Making Smart Device’, the evaluation of the class model and verification
We made descriptive problem into the text after the simulation teaching of the subject class model from teachers for “MAKING SMART DEVICE” PROGRAM and listed it according to the frequency of major words in the text using Tag Cloud technique and then the words listed was visualized and marked handwriting sizes and thickness according to a font and the frequency of each word. In Figure 5, we can see languages related to interest on scientific and mechanical. We can gain educative results and positive evaluation of the program through high frequency of adjective like “Interesting” and “aceepted”.
Figure 3. Descriptive survey of teachers was expressed with tag cloud.
Source: http://www.wordle.net/
Conclusion and Proposal
In this study, we drew the core capabilities of creativity and personality for creative program development in art. It can be used with preliminary data to cultivate creativity and personality at the same time as a class that consist of creative activities contents Based on art curriculum and another class curriculum through this program. It can handle role as art education for the capable person with creativity and personality that is needed for the future society. Besides, it is contributed to realize art education with unified

61
intimately creativity and personality through the art curriculum in the educational scene. And then it contributes to cultivate more creative talent based with integrated thinking ability through the vision of ducation and strategic planning.
Acknowledgement
“This Paper was supported by Korea Foundation for the Advancement of Science and Creativity (KOFAC)grant funded by the Korea government (MOE).”
References
Amabile, T. M. 1989. Growing up creative, Buffalo, NY: Creative Education Foundation
Amabile, T. M. 1988. A Model of creativity and innovation in organizations. In B. M. Staw & L. L. Cummings(Eds.), Research in organizationl behavior
Amabile, T. M. 1996. Creative in Contect: Update to “The Social Psychology of Creativity, “Boulder, CO: Westview Press
Amabile, T. M. 1998. How to kill Creativity, Keep doing what You’re Doing or, If you what to Spank Innovation, Rethink How You Motivate, Reward, and Assing work to people. Harvard Bussiness Review
Amabile, T. M., and Mueller, J. S. 2008. Studying creativity, its processes, and its antecedents: an exploration of the componential theory of creativity. In Zhou & Shalley 2008
Chang Soo-jin. 2007. A Study on the Eveluation of Creativity through : With emphasis on design education for primary school children in the first, second and therd grades
Cho Yun Soon. 2008. Creativity Education: Creative Problem-solving Development and Education Methodology
Chris Smith, Creative Britain (London: Faber and Faber, 1998)
DCMS, Creative Industries Mapping Document (London: DCMS, 1998); Creative Industries Task Force, 2001.
Dewey, J. 1910. How we think, Heath, D. C. London
Esherrick. 1963. Problems of design of a design system, in conference on design Methods
Ha, joo hyun. 2000. Creative personality test development. A study of educational psychology

62
Hill, A. M.: 1998, ‘Problem Solving in Real-Life Contexts: An Alternative for Design in Technology Education’, International Journal of Technology and Design Education 8(3), 1998.
Joo, sung hae, The development and a study on creativity personality education class in art, Korea National University of Arts, 2011
Kang, jung ha, Choi, in soo(2006). Creative Problem-solving program The effect of creative problem-solving ability program on college student’s problem-solving tendency and ability of achievement. A study of educational psychology. A study of educational psychology
Kim, Youn hee. 2011. Qualitative thought and creativity :new concept for art education. A study of aesthetics and science of art
Tom Kelley & David keiiey. 2013. Creative Confidence
Kim choon il. 1999. Theory and Substance of Creativity Education
Nam Hwa Jung. 2010. The Effects of Creative Thinking Technique based Design Curriculum on Creative Artistic Expression : Apllied to Juniors at a Specialized High School
Nemiro, J., Creativity in Virtual Teams: Key Components for Success., Wiley & Sons, 2004
Norman, E., Riley, J., Urry, S. & Whittaker, M., Advanced Design and Technology, Longman, Essex, 1990.
Alexander Osterwalder and Yves Pigneur. 2010. Business Model Generation
Seung eun, Choi. 2014. The effect of culcure and arts based experience on individual creativity and performance
Robert W. Weisberg. 2006. Creativity : Understanding Innovation in Problem Solving, Science, Invention, and the Arts
http://www.mindmapinspiration.com/
http://www.wordle.net/

63
Maria Vittoria Cont ini , Maurizio Doro, Giovanni Maria R ugg iu,. A lessio To la Energy and e nvironmental planning: the case of the Municipa lity of Sassari
ENERGY AND ENVIRONMENTAL PLANNING: THE CASE OF THE MUNICIPALITY OF SASSARI
Maria Vittoria Contini 1, Maurizio Doro2, Giovanni Maria Ruggiu3, Alessio Tola4
1Scienze Economiche e Statistiche, presso Centro Interuniversitario per la Ricerca nel settore della Nautica, Università degli Studi di Sassari
[email protected] 2Consulente energetico. Amministratore Unico di Prometeo Sistemi srl
3Smeralda Consulting associati srl 4Analisi e Controllo dei Processi Produttivi presso, Dipartimento di Scienze
Economiche e Aziendali dell’ Università degli Studi di Sassari, Direttore Centro Interuniversitario per la Ricerca nel settore della Nautica
Introduction
The objective of Energy and environmental planning at municipal level is to coordinate the actions aimed at reducing energy consumption, promoting the production of energy from renewable sources and reducing carbon dioxide emissions into the atmosphere.
The instability of prices of the petroleum products and the intensification of the greenhouse effect caused by fossil fuels, are pushing the public towards a new awareness and better knowledge of environment, in the direction of what many define as a real " energy revolution ".
Renewable energy sources (RES), the main actors of this revolution, represent a clear ethical, social and environmental opportunity. Their unplanned use, on the contrary, may result in a risk, in terms of damage to natural ecosystems and landscape.
Energy planning provides a functional set of actions aimed to improve the sustainability of the overall system, starting from the characteristics of the local context, both in terms of weak points and potential strong points.
The choice to focus on a sustainable energy policy, based on energy saving and development of renewable energies, has many advantages: environmental benefits include the decrease fossil fuels usage, which is connected to the reduction of both greenhouse gases, responsible for the greenhouse effect, and of air pollutants, which are particularly harmful to human health; In addition, this desirable "green revolution" can determine, on
64
a local level, multiple, direct and tangible economic benefits, such as decreased energy costs for local authorities, families and businesses and new business development opportunities related to green technologies. A new energy culture, therefore, may represent an important opportunity to address the current economic crisis.
With a steadily increasing energy consumption level in EU cities and territories, the European Commission launched in January 2008 the initiative known as “The Covenant of Mayors” during second edition of the EU Sustainable Energy Week. This initiative is aimed directly at the Mayors of the Member States. It encourages them to move to the frontline in the fight against climate change, by promoting energy and environmental sustainability at the local level.
The local authorities who choose independently and voluntarily to adhere to the Covenant of Mayors are committed to reduce by at least 20% the emissions of carbon dioxide (CO2) generated within their administrative borders. This reduction will have to take place no later than 2020, and has to be calculated considering the emission levels of 1990 if data are available or a following the year starting from which the local authority has certain energy data).
In addition to the formal adhesion to the Covenant of Mayors, the Municipality is committed to:-provide, within one year, their own SEAP- Sustainable Energy Action Plan (Baseline Emission Inventory + Action Plan), which is a tool for the current environmental status and energy consumption analysis of the Municipality and a planning and coordination document of all actions that the local authority will have to implement in order to achieve the goal of reducing emissions; -submit, every two years, a report on the implementation and monitoring of the Action Plan (Monitoring Emission Inventory, MEI ) ;-adapt city structures, in order to pursue the actions necessary to achieve the objective of emission reduction; -promote its activity and involve citizens and businesses in the setup of local energy days;
-spread the message of the Covenant of Mayors, in particular by encouraging other local authorities to join and contribute to the realization of events.
Climate change, energy consumption and cities. The energy issue is the result of the sum of various problems, mainly connected to the fact that fossil fuels are rapidly depleting, while greenhouse gas emissions have continued to increase and contributed to the intensification of the climatic variations .
At the World Climate Conference held in Durban in December 2011, it was recognized "that cities are the centres of economic, political and cultural innovation and that they are the engines of their national economies and manage important resources, investments and public infrastructures" and that "local governments play a strategic role in tackling climate change because of
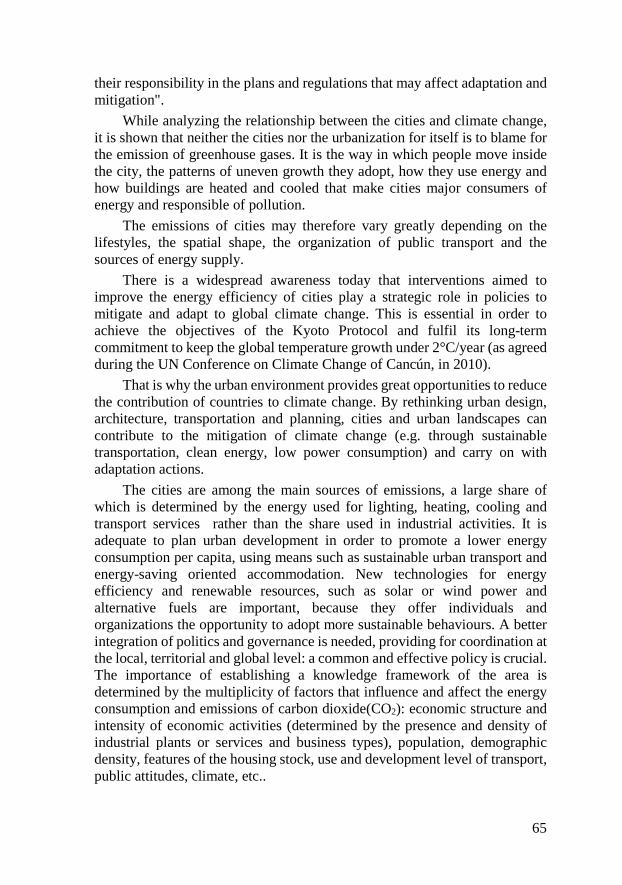
65
their responsibility in the plans and regulations that may affect adaptation and mitigation".
While analyzing the relationship between the cities and climate change, it is shown that neither the cities nor the urbanization for itself is to blame for the emission of greenhouse gases. It is the way in which people move inside the city, the patterns of uneven growth they adopt, how they use energy and how buildings are heated and cooled that make cities major consumers of energy and responsible of pollution.
The emissions of cities may therefore vary greatly depending on the lifestyles, the spatial shape, the organization of public transport and the sources of energy supply.
There is a widespread awareness today that interventions aimed to improve the energy efficiency of cities play a strategic role in policies to mitigate and adapt to global climate change. This is essential in order to achieve the objectives of the Kyoto Protocol and fulfil its long-term commitment to keep the global temperature growth under 2°C/year (as agreed during the UN Conference on Climate Change of Cancún, in 2010).
That is why the urban environment provides great opportunities to reduce the contribution of countries to climate change. By rethinking urban design, architecture, transportation and planning, cities and urban landscapes can contribute to the mitigation of climate change (e.g. through sustainable transportation, clean energy, low power consumption) and carry on with adaptation actions.
The cities are among the main sources of emissions, a large share of which is determined by the energy used for lighting, heating, cooling and transport services rather than the share used in industrial activities. It is adequate to plan urban development in order to promote a lower energy consumption per capita, using means such as sustainable urban transport and energy-saving oriented accommodation. New technologies for energy efficiency and renewable resources, such as solar or wind power and alternative fuels are important, because they offer individuals and organizations the opportunity to adopt more sustainable behaviours. A better integration of politics and governance is needed, providing for coordination at the local, territorial and global level: a common and effective policy is crucial. The importance of establishing a knowledge framework of the area is determined by the multiplicity of factors that influence and affect the energy consumption and emissions of carbon dioxide(CO2): economic structure and intensity of economic activities (determined by the presence and density of industrial plants or services and business types), population, demographic density, features of the housing stock, use and development level of transport, public attitudes, climate, etc..

66
The basic survey stands as the starting point of the construction process of the SEAP. In relation to it the objectives and related actions have been defined and the monitoring system of the plan has been set.
The context: the Municipality of Sassari and its territorial peculiarities. The guidelines of the Joint Research Centre (JRC) for the preparation of SEAP require the drafting of a general overview of the city and its territory, aimed at providing a framework for the evaluation by the Covenant of Mayors staff. The following paragraphs provide an overview and objective elements of knowledge of the characteristics of the territory of Sassari. The general picture of the area has been developed in close relationship with some of the documents approved and adopted by the City of Sassari: -The Municipal Urban Plan (adopted on 26/07/2012); -The preliminary document for the Municipal Environmental and Energy Plan (adopted on 9/11/2011); -The report on the resident population, CED Sassari (2011); -The Social Balance Sheet 2010, Municipality of Sassari (31/03/2011); -The General Plan of Urban Traffic (11/07/2008); -The Strategic plan of the City of Sassari (28/06/2007).
The territory of the municipality of Sassari, the largest in terms of size of the whole island of Sardinia, is also among the largest municipal terms in Italy, with an overall surface of 546.08 square kilometres. This feature contributes to the heterogeneity of this territory, with different characteristics regarding the morphologic and natural aspects, the socio-economic, historical and cultural features but also the different types of urban settlements that can be found among the city and the nearby suburbs of Argentiera, Bancali, Biancareddu, Campanedda, Caniga, Li Punti, Palmadula, San Giovanni, Ottava, Sant’Orsola and Tottubella. The resident population sums up to 130.658 inhabitants with a density of 239 inhabitants per square kilometre (ISTAT 2010). Resident Population 130658 Area km2 546,08 Density Inhab./km2 Altitude m over sea level 225. (table.1)
Generally speaking, the territory of Sassari is characterized by a Mediterranean climate, typical of most of Sardinia, which is defined by a period of surplus water as opposed to another, longer, stronger deficit season, characterized by high temperatures. An almost bi-seasonal climate, influenced by the presence of two critical phases, one in winter due to low temperatures, and a summer to the low amount of available precipitations (Mitrakos, 1991).
The proximity of the sea scarcely affects the climate trend, while the influence of factors related to human activities is more significant, particularly in the city centre and industrial areas, but also in the cultivated areas that affect large surfaces.

67
Figure 1. Essential data and population trend of the Municipality
of Sassari –ISTAT data 31 December2010 Source: ISTAT.
The trend of average annual temperatures recorded from 1973 to 2011 allows us to make some significant considerations. The average temperature is 16.2°C. The peak corresponds to the average value of 2003, 17.4°C, while the lowest reading corresponds to 14.2°C in 1976. Over the years the trend of the average minimum temperature is continuously decreasing, while there was an increase in the average maximum. The average annual temperature had a significant increase, although not linear, between 1992 and 2003, and then settled in recent years to values more stable. However, the annual average has increased by about 2°C since 1970.
The economic profile of the area has a central importance in energy policy: the manufacturing businesses are in fact at the same time energy-intensive subjects and potential partners for a policy of consumption containment and enhancement of Renewable Energy Sources.
According to data from the Northern Sardinia Economic Observatory, in 2010 in the territory of Sassari there were 10.967 operating companies out of 13.840 registered businesses. Compared to 2009 the number increased by 1.41 %. The sectors who recorded the highest number of companies are agriculture, forestry and fishing (971), construction (1,705), hotels and restaurants (761) and retailers (3,841). The tertiary sector counts 2,099 active companies. Sassari , like many other Italian cities, has experimented the trend of population growth in the suburbs and in the satellite municipalities, acting as an attraction centre.
The distribution of the population reflects itself on the entire urban system and on the local mobility. The building activities boomed during the last years calling for ever new areas for urban development and generating uneven edification. The new urban areas that have resulted have redistributed the resident population in the municipality of Sassari : 72.70 % in the so-called "compact city", 18.31% in the "diffused urbanisation" and the remaining

68
8.99% in the outskirts, where scattered settlements prevail. If we consider the great increase in size of the vehicle stock in recent years in Sassari (from 2005 to 2009 there was an increase of 4,201 units, as shown in the table below), a continuous increase of the car space demand is evident while, on the other side, the space available for other uses, in particular those for the pedestrian mobility, decreases.
As a result, Sassari’s public transport suffers not only the traditional competition of the car, but also those resulting from the dispersal of residential settlements bordering the compact city its outskirts. Another critical element of the system is due to the fact that bus services suffer of a progressive difficulty do move in the traffic due to congestion, especially along the main axes of city, and the lack of room reserved for public transport (bus lanes). This involves, on the one hand , the increase of operating costs and on the other hand a great difficulty in ensuring adequate levels of service, both in terms of travel times, regularity and punctuality.
The city of Sassari and its vast area have a comprehensive road network, characterized by a strong radial structure, with a single-centre connected to two important roads of regional/national importance: the northern part of the SS131 “Carlo Felice” and the SS 291 to Alghero.
These two highways, which link up right at the north of the city centre, reaffirm the function of Sassari as a joint between the North/South and the East/West directions. It is also within the area in which the two routes actually meet (the industrial district of Predda Niedda) that a large number of businesses (manufacturing, wholesalers, retailers), some of them very dynamic, have developed. From these two main roads the other roads stem towards different directions. The Predda Niedda district development contributes to confirm further the role of this main artery.
The city of Sassari also hosts the most important railway connections at regional level and local/urban level. The rail network within the urban system of Sassari performs two main functions: the national/regional connections for passengers and cargo with the Italian Peninsula and the other main cities of Sardinia like Cagliari, Oristano, Porto Torres(port) Macomer, and the passenger connection between Sassari and Olbia Golfo Aranci; and the local connections between Sassari, Porto Torres(town), Alghero, Sorso, Osilo and Nulvi. There is only one train station for both regional and local lines; In addition, intermodality is fostered by the proximity of the bus station to the railway station. Consequently, an adequate organization of local public transport in urban scale could allow greater intermodality which, combined with policies to increase the use of public transport, could reduce the reducing emissions resulting from car traffic. The station is next to the old town, which is closed to vehicular traffic, and to some traffic attractors such as the University and in the law and socioeconomic disciplines departments, some

69
institutions of higher secondary education, several local government offices, the hospital and other public services.
The current system of mobility of Sassari highlights the priorities for action in the transport sector because of the significant importance of it in relation to energy saving and reduction of environmental impacts which could be obtained through reorientation actions towards sustainability.
Apart being the capital of the province, Sassari is the second largest city of the island, both in size and importance; the distribution of the "higher functions" (political, economic, financial, administrative, medical, cultural) between the two towns of Sassari and Cagliari has polarized the island’s territory in two areas of influence and gravitation. This is why Sassari has a large area of resident users who are attracted by the concentration of services of medium-high importance.
In the past years the Municipality of Sassari has enabled policies to raise the citizens’ awareness on their own energy profile and on the need to reduce fuel consumption and emissions that relate to their activities; at the same time the Municipality has activated multi-level governance paths for the areas that are not under its complete and direct competence. In addition to local institutions, in the most central part of the city, we find the branch offices of the Central Administration of the State (e.g. the court, the correction facilities, the Court of Appeal, the Land Registry, the Revenue and Tax office), the police headquarters, the decentralized offices of the regional administration (eg, the office of the local authorities , the Health Service offices) and the province (especially buildings hosting high schools). These are important energy-consuming entities, which are not controlled by the municipal administration.
The Plan and the Actions of the SEAP of Sassari
The Sustainable Energy Action Plan is the key document which defines the energy policies that the municipality of Sassari intends to carry out in order to pursue the objectives of the Covenant of Mayors. This document, far from being considered as an instrument in its own right, interacts with all other planning instruments adopted in recent years by the municipality (Municipal Urban Plan, the Strategic plan, the Strategic plan of the neighbouring towns, the urban mobility plan, the Energy and Environment Plan).
Through the support of the methodology GOPP (Goal Oriented Project Planning) the Plan was built on a tree-like hierarchically organized structure of its goals, which allowed the identification of actions (both direct and indirect) of the Plan, the objective of which is the reduction in 2020 of CO2
emissions by 22.7%, compared to the values recorded in 2010. The achievement of the stated objectives cannot take place, however, without the

70
involvement of all actors of the territory directly responsible of the greenhouse gas emissions, i.e. citizens, businesses and organizations with offices in the territory Sassari (University, Health Service, Military Forces, the large retail chains).
The feasibility and measurability of actions involving other institutions is based on a process of involvement and participation, which began in 2009 with the Local Agenda 21, which now allows them to collaborate in order to achieve the objectives of energetic sustainability at the local level. Regarding the general public, which is partly responsible of the objective achievement, the effort is articulated in two steps: a process of greater awareness on the sustainability issues, which has its origin in the general awareness of the global risks of climate change and a significant, widespread and ongoing awareness-raising campaign by the city administration through the local Agenda 21 and regular communication campaigns carried out by the environment offices of the municipality.
Methodology of the consumption data collection
The year 2010 was adopted as the index year for the Baseline Emission Inventory (BEI). The data contained in the BEI are the base on which the concrete actions to reduce the CO2 emissions into the atmosphere are based.
The IBE data collected were processed through the use of the ECOregion software, which was officially recognized by the EU as an efficient tool to develop IBEs under the Covenant of Mayors. ECOregion uses the LCA (Life Cycle Assessment) emission factors that take into account the whole life cycle of the energy carrier. This approach calculates not only the emissions derived from the final combustion, but also of all those emissions that are generated within the supply chain of fuels, such as emissions from the exploitation, transport, and refining processes. It also includes emissions that occur outside the territory in which the fuel is used. Under this approach, the emissions of greenhouse gases from the use of biomass/ bio-fuels, as well as issues related to the use of certified green electricity are greater than zero. In this case, other greenhouse gases, different from CO2, can play an important role. The local authorities who decide to use the LCA approach can therefore express emissions as CO2 equivalents. However, if the methodology or tool is used only calculate CO2 emissions, the emissions can be referred to as CO2 ( in metric tons).
Results and discussion: overall energy balance
The data of energy consumption of Sassari are characterized by a growing trend since 1990. During the last years the trend was constant and from 2009

71
there was a decline in consumption. The figure for 2010 was 1,883,938.95 MWh, decreased since the previous year. In recent years there has been an increase in consumption in the business sector, however, the transport sector remains the most influential of the total consumption.
Figure 2. Overall energy consumption per sector in the Municipality of Sassari– years 1990 – 2010, autors’ elaboration with ECOregion software
Source: own research.
Regarding the total emissions due to final energy consumption (excluding the fuel consumption of major industries and large-scale plants for energy production according to the criteria of the guidelines ECORegion) the total figure of the territory in 2010 was 664,581.37 tons of CO2. The trend is coherent with the decreasing consumption, however, the decline of recent years is proportionately more consistent than that of consumption. This could be attributed to increased awareness and commitment towards the reduction of emissions through the use of new technologies.
Per capita energy balance. At the per capita level, based on the number of the municipal area residents, the final energy consumption is lower than the national average. In 2010, in fact, the per capita figure of Sassari resident for electrical, thermal and transport end-use amounted to 14.42 MWh compared to a national average of 26.3 MWh per capita.
Per capita emission balance. As a result, the related CO2 emissions per capita determined by energy uses, equal to 5.09 tons (elaborated on a final energy consumption of 137.5 MTOE in 2010 - source: ENEA) appear to be below the national average of 8.2 tonnes (ISPRA, national emissions for 2010 of 501.3 million/TCO2).
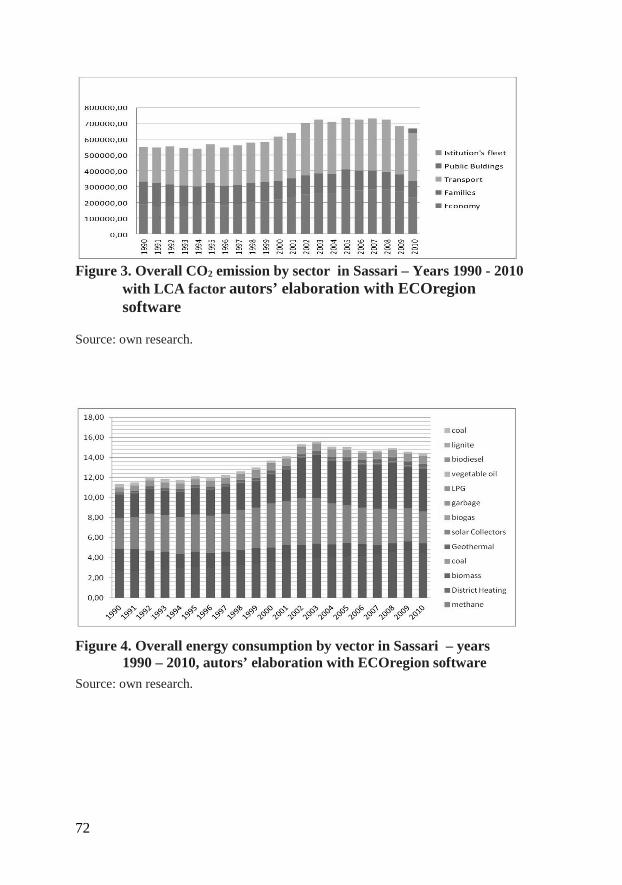
72
Figure 3. Overall CO2 emission by sector in Sassari – Years 1990 - 2010
with LCA factor autors’ elaboration with ECOregion software
Source: own research.
Figure 4. Overall energy consumption by vector in Sassari – years
1990 – 2010, autors’ elaboration with ECOregion software Source: own research.

73
Figure 5. Per capita CO2 emissions in Sassari by vector – years
1990 - 2010 with LCA factor, autors’ elaboration with ECOregion software
Source: own research.
The emissions of the Municipality of Sassari. With a view to reducing CO2 emissions in the territory of Sassari, energy consumption and related emissions of the municipal administration play a particularly important role. The example that the body wants to set for the community has an effect on its credibility in the interactions with others. At the same time, energy costs represent a significant item in the municipal budget and reducing them in times of restricted funds widens the spaces of action of the administration in other fields. The estimation and evaluation of energy consumption municipal entity is made very difficult by the fragmentary nature of the information needed and sometimes total lack of objective data with which to make a precise analysis.
The main buildings belonging to the Municipality of Sassari are 165: 17 sports facilities; 5 kindergartens; 71 schools (nursery, primary, secondary); 42 municipal offices; 6 judicial offices; 23 various purpose buildings; 1 cemetery.
Data collection For the preparation of the City’s first greenhouse gas emissions budget the staff had to collect all available data of energy consumption attributable to the real estate properties of the Municipalities and to the street lighting system; the municipal vehicles fuel consumption data had to be considered as well. The most interesting data are certainly the ones regarding the total electricity consumption of the municipality (classified in building consumption and street lighting consumption) and, when available, the data of the overall heating connected emission, differentiated by energy carrier.
Through the conversion factors used in ECORegion it is possible to trace the emission of greenhouse gases starting from the energy consumption data.
coal
lignite
biodiesel
vegetable oil
LPG
garbage
biogas
solar Collectors
Geothermal
74
The total emissions of the Municipality of Sassari for the year 2010 is 42943.35 tons of CO2, divided as follows: vehicles account for 1% of the emissions, street lighting 27%, public buildings 13%, public infrastructures 31% and, finally, other forms of emission 28%.
Conclusions
The general strategy of the Sustainable Energy Action Plan of the Municipality of Sassari fits into the broader strategic framework of the European Union, of Italy and of Sardinia, whose guidelines and objectives are endorsed by a specific programmatic commitment: the adhesion the Covenant of Mayors and the approval of SEAP by the City Council.
The goal is to lower the carbon intensity of Sassari’s economy through a process aimed at modernising the energy production and consumption, promote the availability of energy sources at local level and disseminate, through technological innovation, a rational use of resources. In order to achieve this, the City of Sassari wants to lead this ambitious project through a twofold commitment:
– setting an example to its citizens by promoting initiatives aimed to reduce their "carbon footprint." In a moment of economic hardship, the City has chosen to plan actions that are characterized by a high cost/benefit ratio. Such actions will allow the local administration to obtain significant results with cost that are compatible with the existing financial means and the other instruments that can be activated. Many of the interventions contained in the Action Plan go towards this direction.
– stimulating efficiency and the development of renewable energy actions by private citizens. With this purpose a large effort will be put into raising awareness towards the stakeholders operating in the area, by using all available channels. Particular attention will be given to the training and education of new generations, in order to help them become aware citizens of tomorrow.
References
Manca G., Franco A., Tola A., 2010, I sistemi di gestione ambientale per lo sviluppo eco-sostenibile del territorio, 24-25 june 2010, Arkadia editore Cagliari, Italy.
Rete Gaia Srl, 2013, PAES, Piano di azione per l’energia sostenibile del comune di Sassari, Sassari, Italy.
Tola A., Conti L., Franco M.A., Manca G., 2010, Potential Biomass resources for energy production in Sardinia (Italy), 3-6 maggio 2010, in Attidella 18th European Biomass Conference and Exhibition, Lione.

75
Tola A., Doro M., Manca G., 2010, Solar energy employment in receptive structures: “La Mariposa” Camping – Alghero (SS), in Atti del XXIV CongressoNazionale di ScienzeMerceologiche, 23-25 giugno, Torino, Italy.
Tola A., Doro M., Manca G., 2010, The use of solar energy in leisure facilities, Journal of Commodity Science, Pescara, , 49 (II), pagg. 83-94.
Tola A., Franco A. M., Manca G., 2010, Produzione di energia sostenibile per l’Isola dell’Asinara: un’applicazione da fonte solare fotovoltaica, in Atti del Convegno “I sistemi di gestione ambientale per lo sviluppo eco-sostenibile del territorio”, a cura di Manca G., Franco A. M, Tola A., Arkadia Editore, Cagliari, Italy.
Online document
Copyright 2013 - Prometeo Sistemi Srl Powered by Webristle Creative Web Agency, http://www.prometeosistemi.com/.
Copyright Smeralda Consulting ed Associati http://www.smeraldaconsulting.it/

76

77
Anna Gacek, Pr ze mysław Szopa, Jace k C zerniak THE STUDY OF BIOINDICATOR S AS PROXIES OF ENVIR ONMEN TAL P OLLUTION
THE STUDY OF BIOINDICATORS AS PROXIES OF ENVIRONMENTAL POLLUTION
Anna Gacek, Przemysław Szopa, Jacek Czerniak
Department of Metrology and Instrumental Analysis, Cracow University of Economics, Cracow, Poland
Introduction
Current rapid technological development and the ensuing increase in the amount of consumer goods entails the use of more and more energy. World consumption of various types of energy significantly contributes to the growth of environmental pollution, which forces the developed countries to implement legal and economic regulations aimed at improving the efficiency of energy production and use. The countries of Western Europe facing the growing demand for all kinds of consumer goods, the production of which significantly increases the amount of energy used, gradually began to introduce tools helping to achieve sustainable development in many aspects of human life. Sustainable development can be defined as an attempt to improve the quality of life while maintaining social equality, biodiversity and wealth of natural resources (Brundtland, 1987). A very important feature of sustainable development is its multidimensional and interdisciplinary character. One dimension is the environmental aspect, in the broadest sense of the word. In the last decade it has contributed significantly to the reduction of the harmful consequences of energy production, and determined the research trends into novel energy technologies based on renewable energy sources. Society is the second dimension essential for sustainable development. The countries following the plan for sustainable development put special emphasis on social justice, poverty reduction, and the formation of public awareness towards greater responsibility in the consumption of non-renewable energy resources. Economics is the third very important factor for sustainable development, being an inherent binding element between society and economy.
Sustainable development should not be perceived as a mere tool used directly for the purposes of environmental protection, because its range extends far beyond issues related to ecology and nature conservation. However, sustainability is an important part of the concept, based on high

78
awareness of the society in matters related to the protection and improvement of the environment. The concept of sustainability is an important element in the legislation of many European countries. Polish Constitution of 2 April 1997 pays special attention to environmental issues. Article 5 of the Polish Constitution classifies the principle of sustainable development as the most important principle according to which the Polish state should proceed. Article 74 of the Constitution requires the authorities to pursue policies ensuring ecological security of the current and future generations, and to support the activities of citizens for the sake of improving the environment.
Ambient air protection has become a primary goal for developed countries, which began to implement on a large scale close monitoring of the air in densely populated urban areas.
For the last ten years the European Union has put strong emphasis on the aspect of air quality and strategies for reducing air pollution with PM2.5 and PM10 particles. Already in 2006 the European Parliament adopted a report by Holger Krahmer MEP on the improvement of air quality in Europe. The report specifically refers to the pollution caused by suspended dust (aerosol compounds) with particle size of 2.5 microns, which poses the greatest threat to human health. Regarding these especially harmful particles, the European Parliament adopted the acceptable level of concentration of PM2.5 below 25µg/m3 starting from 2010, with a further reduction as of 2015. The European Parliament pointed out in 2006 that high concentration of suspended particulate matter in urban areas resulted in the loss of 3.6 million years of life of European citizens each year. In other words, by 2006 55% of European ecosystems felt the negative impact of polluted air. Its consequences included acidification of forests, eutrophication and loss of biodiversity. The sources of these problems are mainly nitrogen oxides, sulfur dioxide, ammonia, and ozone (Bell and Treshow, 2004). The reduction in concentration of dust and harmful chemicals in the air also requires efficient tools for the assessment of air quality based on stations monitoring air pollution. An extensive network of monitoring stations/bases would indeed indicate areas of excess concentrations of dust suspended in the air thus allowing for rapid implementation of procedures aimed at improving air quality in the territory. Biomonitoring of the environment based on biomarkers and bioindicators seems to be most consistent with the objectives of sustainable development. Living organisms used for qualitative and quantitative assessment of the degree of pollution in the environment are important for the improvement of air quality in large areas where conventional environmental monitoring becomes non-cost-effective. In the biomonitoring of air greatest hopes are connected with plant bioindicators (Kłos, 2009), however in bio-indicative assessment of pollution animal organisms and micro-organisms are also used increasingly often.
79
Characterisation of air pollutants
Malopolska Province (Malopolskie Voivodeship) can be clearly divided regarding the quality of air found in this part of Poland. This area comprises the Tatra Mountains, at the foot of which plenty of tourists spend their holidays attracted by purity and quality of air. On the other hand, the province includes the city of Krakow, which in turn does not enjoy good air and is even considered one of the most polluted towns in Poland. The reason for that is the high concentration of particulate matter emitted from industrial sources, transport and heating, further enhanced by adverse climatic and local conditions facilitating the spread of contamination. Therefore, in the province of Malopolska eleven measuring stations are located, whose task is to monitor air quality every day in terms of the content of suspended particles and harmful chemical compounds.
All these factors have a detrimental impact not only on people but also on the environment. They contribute to changes both in the abiotic and biotic parts of ecosystems (Gorbea and Calatayud, 2012). The results of the physical and chemical analysis of environmental samples do not fully show the effects of toxic substances introduced into living organisms (Traczewska, 2011) as well as do not provide sufficient information about the synergistic or antagonistic interrelationships between chemical compounds. For analytical as well as economic reasons it is also not possible to determine all components of the water or soil. More information can be obtained by analysing the effect of pollution on living organisms.
It is important and desirable that the vegetation in urban areas be as lush as possible because it works very significantly for the improvement of air quality in such places, especially when it grows along the busiest routes. Trees remove particulate matter, including heavy metals, thus purifying the air. Therefore, the state of health of trees and shrubs in cities should be as good as possible.
Consequently, it is important to monitor the content of particulate matter in the air. Substances contained in such matter are extremely harmful to the environment, in particular to people breathing the air.
Particulate matter PM10 is a mixture of organic and inorganic substances containing toxic substances such as polycyclic aromatic hydrocarbons, among others carcinogenic benzo(a)pyrene, heavy metals, and dioxins and furans. It is important that the allowed daily average concentration of PM10 particles may not be exceeded more than 35 times a year.
PM10 suspended particulate matter: the allowed daily average is 50 µg/m3; the allowed annual average – 40 µg/m3.
PM2.5 particulate matter is a mixture of organic and inorganic substances. It is emitted into the atmosphere as a primary pollutant resulting

80
from anthropogenic and natural processes, as well as secondary pollutant, resulting from changes of its precursors such as sulfur dioxide, nitrogen dioxide, ammonia, volatile organic compounds and stable organic compounds. This dust is also a transboundary pollutant, which can be transported a distance up to 2500 km. It can remain in the air for many days or even weeks, and sedimentation and precipitation does not remove it from the atmosphere.
PM2.5 suspended particulate matter: the allowed annual average – 25 µg/m3.
Directive 2008/50/EC of the European Parliament and of the Council of 21 May 2008 on ambient air quality and cleaner air for Europe determines concentrations of particulate matter PM2.5 as target values and limit values, and introduces a separate index for urban areas (average exposure indicator). According to the Directive, the target annual average concentration of PM2.5 at the level of 25 mg/m3 is valid from 1 January 2010. The value of allowable annual average concentration of particulate matter is defined for two stages.
In Stage 1 it is assumed that the level of 25 mg/m3 should be met but its margin of tolerance is to be gradually decreasing. The tolerance margin will vary in subsequent years to eventually achieve the value 20µg/m3. Since 2014, the margins will be proportionally reduced by 5/7 mg/m3. A limit value of 25 mg/m3 will be valid until the end of 2019, when Stage 1 will be terminated. In Stage 2, which will begin on 1 January 2020, it is initially assumed that the limit value of annual average concentrations of PM2.5 should be 20 mg/m3.
Chlorophyll fluorescence imaging in pollution assessment
Chlorophyll fluorescence imaging demonstrates that the efficiency of photosynthesis in the leaves is varied, especially when the plants are subjected to various types of stressful factors. It has many advantages which make this technique a valuable tool in the study of plants. Chlorophyll fluorescence imaging is a potential method to detect stresses before their visible symptoms appear. This is especially important when the goal is to review the different genotypes of plants in terms of their tolerance to environmental stresses. The detection of such adverse factors at the earliest possible stage reduces the time needed to make the selection. In addition, chlorophyll fluorescence imaging is a fast, non-destructive process in the assessment of air quality. Chlorophylls are unstable compounds. Their characteristic green colour is preserved only in living, undamaged tissues. The rate and nature of changes occurring during storage and processing of vegetable raw materials depends on the temperature and acidity of the environment (Oleksyn, 1989). Changes of chlorophylls are affected by various factors such as temperature, pH, oxygen, the presence of metals, enzymes (chlorophyllase, lipoxygenase), particulate matter. In the

81
living tissues chlorophylls occur in bonded forms, e.g. to proteins, phospholipids, which results in the stability of the green colour (Bartkowiak, 2011). On the other hand, the destruction of the living plant tissue and of the chlorophyll structure by e.g. heating, dehydration, contact with solvents, enzymes, leads to the transformations of chlorophyll and colour changes. Also exposure to light and oxygen accelerates the decomposition of chlorophyll.
Aim of the study
The aim of this study was an attempt to use green plants, in this case American arborvitae (Thuja occidentalis) as a biomarker. The research was focused on attempting to apply thuja in the biomonitoring of the environment.
In this experiment we examined the total chlorophyll content in needles of thuja (American arborvitae - Thuja occidentalis) in Krakow and in several towns of the Malopolska Province (Malopolskie Voivodeship), in close vicinity of the streets with heavy traffic as well as outside the urbanized area. The studies were supposed to show significant differences in the content of chlorophyll in plants, depending on the conditions in which they grow. The decrease of photosynthetic efficiency in plants growing in urban areas is associated with a reduction in the amount of photosynthetic pigments in the leaves. There are numerous works on the diminished content of chlorophyll a and b in plants. The experiment was also supposed to prove the usefulness of the fluorescence method for quantitative and qualitative analysis of chlorophyll in the green parts of plants. The obtained results allowed us to conclude that the needles of the trees growing in the vicinity of streets have lower content of total chlorophyll in comparison with those growing in nearly natural environment, which corresponds to the net intensity of photosynthesis. Moreover, a decrease of chlorophyll content was observed in centres of towns where a mix of coal was used as heating fuel.
In this study chlorophyll fluorescence was determined by examining samples from the places marked on the map of Krakow shown in Figure 2, and the locations listed in Table 1. In the locations mentioned, samples of plants (Arborvitae, Thuja occidentalis) were collected.
Sampling locations in the city of Krakow are presented on the map in Figure 2.
Other places outside the city are listed in Table 1.

82
Figure 1 American arborvitae (Thuja occidentalis) source: the present study
Figure 2. Map of Krakow and its vicinity with indicated sampling
locations source: present study based on
http://krakow.gazeta.pl/krakow/51,44425,11044260.html 12.12.2012

83
Table 1. Sampling locations
Kraków Małopolska Province 1. Dębniki 2. Swoszowice 3. Borek Fałęcki 4. Aleje Trzech Wieszczów 5. Rybitwy 6. Przewóz 7. Łuczanowice 8. Przylasek Rusiecki
a- Jordanów - street b- Rabka – town centre c- Rabka - fields d- Masłomiące e- Wilkanowice f- Michałowice
source: present study
The experimental procedure involved extraction of chlorophyll from the samples in acetone solution. For this purpose, the green parts of the plants were ground in a mortar. Acetone was added in portions (3 ml) - it is a good solvent for non-polar compounds, such as photosynthetic pigments, including chlorophyll. Prior to analysis, samples were kept in a darkroom for at least 3 hours, in order to open up light traps in chlorophyll. After a thorough grinding of plants, the obtained extract was filtered into beakers. The samples prepared in this way were diluted 2 times with acetone. After dilution, the pH of the samples was measured, yielding results in the range pH 5.5 - pH 6 and then samples were successively inserted into the spectrophotometer and the chlorophyll fluorescence emission spectra were measured in the range of 500-750 nm with excitation at 380 - 400 nm. Measurements were performed in the same range for all samples. Chlorophyll fluorescence measurements for the samples collected from the areas denoted by numbers 2, 6, 8 in Figure 2 show high intensity of chlorophyll fluorescence in the range of 650 - 720 nm, which demonstrates that chlorophyll degradation resulting from environmental pollution for these samples is small. As a biomarker, chlorophyll strongly reacts to air pollution with industrial dusts and dusts arising from the combustion of solid fuels such as coal. Areas 2, 6, 8 are located around the administrative boundaries of Krakow and thus they are characterized by a lower density of dust in comparison with the city centre. Samples from the areas denoted by numbers 1, 3, 5 in Figure 2 showed lower intensity of chlorophyll fluorescence. The results revealed lower activity of chlorophyll fluorescence emission due to greater air pollution in these locations. The weakest activity of chlorophyll dye was observed for the samples taken from the areas denoted by numbers 4 and 7 in Figure 2, characterized by the highest pollution. A clear decrease in the chlorophyll fluorescence activity for these samples indicates a significant pollution with smog. Smog in the city centre and in the vicinity of the Sendzimir steelworks clearly contributes to the degradation of chlorophyll. The fluorescence intensity decreased by an

84
average of 150 units compared to fluorescence of the samples collected from areas with the least pollution. Fluorescence measurements outside the city of Krakow were conducted in seven locations which are summarized in Table 1. The studies consisted likewise in collecting plants that were found at particular locations and, after the preparation of the extract, measurements performed using a fluorometer.
Samples originating from the area indicated by the letter “a” in Table 1 revealed the lowest intensity of fluorescence from chlorophyll. The results showed lower activity of chlorophyll fluorescence emission due to greater air pollution in the area. A summary of selected maximum values of chlorophyll fluorescence intensity readings for all studied areas is shown on the graph (Figure 3). A clear decrease in the fluorescence activity of chlorophyll of the sample "a" indicates significant pollution with compounds originating from fuel combustion since the sample was taken near a busy street. Smog in the city centre (location "b") originating from the combustion of fuel used for home heating contributes significantly to the degradation of chlorophyll in the studied samples, as shown in Figure 3. The fluorescence intensity decreased in the examined samples by up to 2000 units compared to fluorescence from samples collected in rural areas: c, d, e, f with the least pollution.
Figure 3. Examples of chlorophyll fluorescence spectra in the studied
areas source: present study

85
Summing up, it can be stated that the pilot studies highlight the differences in the fluorescence response of samples, which justifies further measurements of this type, as well as an extension of the study to further areas of the Malopolska Province and possibly also to the neighbouring provinces.
The next goal of the research will be the selection of evergreen plants most sensitive to pollution. Such plants retain chlorophyll in winter, which is impossible in the case of deciduous plants. The choice of this type of plants is dictated by the fact that the amount of chlorophyll remains approximately at the same level throughout the year, which makes them good bioindicators.
Figure 4. Summary of the maximum values of chlorophyll fluorescence
for the studied areas souce: present study
Conclusions
In summary, the present studies highlight the differences in the fluorescence response of samples, which justifies further research and expansion of the scope of such determinations to further areas of Poland. The results indicate that evergreens can be good bioindicators in the period when dust pollution is greatest, i.e. between November and March.
At this stage, the present authors conducted a comparative study of chlorophyll fluorescence intensities for rural and urban areas, as well as for samples collected from locations in close vicinity of town streets. The results have confirmed that the particular plant selected by the authors for this study is a good bioindicator.

86
References
Bartkowiak A., 2011, Gotowanie zielonych warzyw, Chemia żywności, Zachodniopomorski Uniwersytet Technologiczny, Wydział Nauk o Żywności i Rybactwa, Centrum Bioimmobilizacji i Innowacyjnych Materiałów Opakowaniowych, Szczecin, http://www.cbimo.zut.edu.pl, ( 30.01.2013)
Brundthland G , Report of the World Commission on Environment and D
Development, United Nations 1987
Bell J.N.B., Treshow M., Zanieczyszczenie powietrza a życie roślin, WNT Warszawa 2004
Gorbea E., Calatayud A., 2012, Applications of chlorophyll fluorescence imaging technique in horticultural research: A review, Scientia Horticulturae 138, 24–35
Kłos A, Porosty w biomonitoringu środowiska, Wydawnictwo Uniwersytetu Opolskiego 2009
Oleksyn J., 1989, Fotosynteza drzew w skażonym środowisku, Życie drzew w skażonym środowisku. Nasze drzewa leśne., Monografie Popularnonaukowe, Red. S. Białobok, Inst. Dendrologii PAN, PWN, Warszawa – Poznań: 341–376.
Traczewska T. M., Biologiczne metody oceny skażenia środowiska, Oficyna Wydawnicza Politechniki Wrocławskiej, Wrocław 2011
87
Robert Gajewski, Joaquin Ferrer, Miguel A. Martínez, A lberto Zapatero, Natal ia C uesta, Andrzej Gajewski Footwear carbon foot print in footwear industry (CO2Shoe)
FOOTWEAR CARBON FOOTPRINT IN FOOTWEAR INDUSTRY (CO2SHOE)
Robert Gajewski1, Joaquin Ferrer2, Miguel A. Martínez2, Alberto Zapatero2, Natalia Cuesta2, Andrzej Gajewski3
1 Instytut Przemysłu Skórzanego, Oddział w Krakowie (IPS Kraków) [email protected]
2 Footwear Technological Institute (INESCOP) Polígono Industrial Campo Alto - 03600 Elda (Spain)
3 Katedra Metrologii i Analizy Instrumentalnej, Uniwersytet Ekonomiczny w Krakowie
Introduction
In the context of increasing global awareness of alleged anthropogenic climate change, the carbon footprint concept is now widely used both as a marketing tool as well as to mobilize public sentiment.
There are several concepts for determination the impact of product/castor on environment:
• CFP; Carbon Footprint of Product,
• CO2e; CO2 equivalent,
• EPD; Environmental Product Declaration,
• GHG; Green House Gas,
• GWP; Global Warming Potential,
• IPCC; Intergovernmental Panel on Climate Change,
• LCA; Life Cycle Assessment,
• LCI; Life Cycle Inventory,
• LCIA; Life Cycle Impact Assessment,
• PCR; Product Category Rule,
• PEF; Product Environmental Footprint,
• PEFCR; Product Environmental Footprint Category Rule.
Lately, the most “fashionable” is CFP: Carbon Footprint of Product. The footwear industry is not exempted from efforts to evaluate its contribution in carbon dioxide (CO2) production. The carbon footprint establishes a

88
quantitative measurement of the environmental impact produced by certain activities in terms of GHG emissions. The quantification of environmental repercussions is very useful for the footwear sector, in that it allows the establishment of an objective value corresponding to the impact produced by the manufacture of a pair of shoes. The greenhouse gases most likely to be released during the shoes’ assembly are CO2, CH4, NO2, whose releases are related to energy consumption and fossil combustion. With regard to the other three greenhouse gases mentioned in the Kyoto Protocol (HFCs, PFCs and SF6), their release into the atmosphere is not foreseen in footwear manufacturing since they are banned at an European level through the Regulation 2006/842/EC [9], which prohibits the placing on the market of footwear containing such gases. As aforementioned, there are other gases not considered in the Kyoto Protocol that are deemed to cause greenhouse effect, such as tropospheric O3. The footwear industry may contribute to the formation of troposphere O3 by the use of organic solvent-based products (mainly adhesives). This products lead to the release of Volatile Organic Compounds (VOCs), which are subject to form the troposphere O3. Therefore, in order to build a comprehensive tool able to provide a carbon footprint value that best represents the footwear sector’s reality, not only will Kyoto Protocol’s greenhouse gasses be addressed but also those not included in the international Protocol that might be release in the manufacture of footwear.
Former studies developed by INESCOP show how the replacement of some footwear components can improve the environmental performance of footwear. For example, the ECO-INNOVATION project ECOTPU “Thermoplastic polyurethane (TPU) from renewable sources applied in footwear” is based on the production of footwear components (soles, stiffeners and toe-puffs) from non-petroleum based resources. The use of these components in footwear may avert up to 10 kg of CO2 emissions per pair of shoe.
However, other environmental improvements non-reflected on the carbon footprint are expected to be achieved in the project such as chemicals’ reduction, mainly chromium. At this point, it is important to highlight that most of the leather used in the footwear industry is tanned with such substance (chromium III), which poses a risk both for the environment and human health when it oxidises to chromium VI. Previous studies carried out by INESCOP have led to the development of more environmentally friendly chromium-free materials. In this regard, it is worth mentioning the LIFE+ project OXATAN “Environmentally friendly Oxazolidine-Tanned Leather” as well as the ECOINNOVATION project TiLEATHER “Eco-friendly Leather Tanned with titanium”. The substitution of chromium-based leather for leather tanned either with titanium or oxazolidine would avoid the release of 10 g of chromium per shoe pair.

89
Regarding the Life Cycle Assessment of the footwear product the following stages has been identified:
And additionally:
(9) Transports between stages
(10) Production of energy necessary for each stage.
It was decided that, for leather production, the CO2Shoe project considers raw hides and skins as a waste of the milk and meat industries. This implies that agriculture and animal farming, as processes of the upstream module, shall be excluded from the system boundaries of LCA studies of leather and the system boundaries are to be considered starting in the slaughterhouse The cases when animals are breaded or hunted for their leathers only are rare and insignificant (reptiles, fish). Generally, the following diagram for Footwear Life Cycle Assessment has been adopted.
Figure 1. Chart flow of footwear life cycle taken into account Source: own work
Despite the companies’ interest in knowing about and reducing their environmental impact, most of them do not have the necessary resources
RAW MATERIALS
EXTRACTION
PRODUCTION OF INPUT
MATERIALS
FOOTWEAR COMPONENTS MANUFACTURE
FOOTWEAR ASSEMBLY
AND FINISHING
PACKAGING MANUFACTURE
DISTRIBUTION TO BUSINESS CUSTOMER
USE
PHASE END OF LIFE
System boundary Inputs
Outputs
Emissions (air, waste water, solid waste) Co-products
Generation
of energy
Water
supply
FOOTWEAR
COMPONENTS MANUFACTURE
PRODUCTION OF INPUT
MATERIALS
RAW MATERIALS
ACQUISITION
-Leather
-Plastic -Rubber
-Textile -Metal
-Wood -Wool
-Cork -Cardboard
-Paper -Chemicals -Other
-Top part
-Lower part -Other
-Assembly
-Finishing -Joining
FOOTWEAR ASSEMBLY & FINISHING
PACKAGING
MANUFACTURE
-Primary -Secondary
-Tertiary
DISTRIBUTION
TO BUSINESS CUSTOMER
USE PHASE END OF LIFE
90
available to address these issues. In the EU, the footwear industry is mainly comprised by small and medium sized companies that employ 10-20 workers on average. Generally, these are family-owned companies that lack specialists in environmental issues on their staff. Therefore, the lack of human resources in European footwear companies make them face a situation of ignorance in relation to the environmental impact of their activities. This lack of knowledge of environmental issues also extends to footwear companies based in the countries involved in the CO2SHOE project (Spain, Italy, Portugal and Poland). The footwear production in these four countries accounts for ca. 73% of the total production in the EU. The countries that mostly contribute to this figure are Italy and Spain, which produce ca. 40% and 20% respectively. The table attached (Footwear production) shows the figures relative to the production and the number of companies in the countries involved in the CO2SHOE project. The carbon footprint not only provides a quantification of the environmental impact, but also allows the identification of those aspects that represent the highest impact in the production process of a pair of shoes. This way, footwear companies will be able to make the necessary modifications in order to manage to reduce the environmental impact of the footwear they produce. Therefore, it is a means of raising the awareness about ecodesign among footwear companies, taking environmental issues into account from the product design stage. Given the need to make footwear companies know about the environmental repercussions of their activities, the CO2SHOE project involves countries with a significant footwear production within the European Union. Nevertheless, this initiative will be later on extended to the rest of the European area in order to make the biggest number possible of European footwear companies aware of the environmental situation of the sector.
The aim of the carbon footprint calculation tool is not to compare the values between footwear companies, but to prove that they are calculating it and consequently, are aware of the environmental impact produced by their activities. This way, the reduction in this value will be promoted through the implementation of the mitigating measures that best suit the needs of the footwear industry.
The CO2SHOE project will help meet the objectives of the EU’s Environmental Policy. What is more, it will contribute to the implementation of EU commitments under UNFCCC Kyoto Protocol, EU GHG emission reduction commitments in 2020 under the Climate and Energy Package as well as those national schemes addressed to reduce GHG emissions. On the other hand, recently, the EU commitment to implement the Kyoto Protocol has been criticised by some Member States and representatives of European entrepreneurs who claim that such a policy would threaten the competitiveness of European industry versus countries which do not introduce any legislation

91
related to CO2 issues. This concern has been voiced in particular against the European directive 2003/87/EC, which will create a CO2 allowance market covering carbon-intensive industry and energy supply from 2005 on. This fear is particularly strong among footwear manufacturers, who are exposed to strong extra-EU competition. According to Quiron at al [7], who computed the loss in sales for three sets of import and export price elasticities, estimated at the sector level, and compared it to the impact of a 10% rise in UE currencies against all other currencies, he concluded that if allowances are grandfathered, and assuming a high allowance price (20 euros per ton of CO2), the competitiveness impact of the directive is, at worst, 20% of the impact of the 10% rise in exchange rates. Furthermore, if allowances are auctioned and the income recycled through a cut in social security contributions, sales of non-carbon intensive sectors increase. For two out of our three sets of import and export price elasticities, the overall impact is positive, i.e., the loss in carbon-intensive sectors is more than compensated by the increase in other sectors. The question is, what is actual impact of footwear industry on CO2 generation and which sector we may allocate it to – carbon-intensive or non-carbon intensive? The first step to develop it is determination of knowledge on Carbon Footprint among footwear manufacturers and generally their knowledge on environmental related issues and wiliness to develop a tool for Carbon Footprint calculation.
Material and methods
Within the project it was decided to evaluate the following concepts: Life Cycle Assessment (LCA) and Carbon Footprint of Product (CFP).
In purpose to select the most suitable and applicable methodology for the footwear sector the various available techniques has been analysed.
Regarding the LCA assessment the following documents has been used:
ISO 14040 and ISO 14044. However both have several limitations. The first describes the principles, does not describe the LCA technique in detail. The latter specifies the requirements. In addition, there are recommendations and options. Additionally there was used the Life Cycle Impact Assessment (ILCD) Handbook [10] which is based on the ISO LCA standards (14040 & 14044) and provides much more details (over 400 pages vs 60). Therefore, it is a LCA general guidance for LCA at European level.
The CO2Shoe project used it as query tool when we had doubts to apply ISO 14044 requirements.
Regarding the Carbon Footprint methodologies ISO/TS 14067 (2013) has been chosen. Actually it is not an Standard but a Technical Specification (TS). It describes the principles, requirements and guidelines for the

92
quantification and communication of the CFPs It is based on International Standards on LCA (ISO 14040 & 14044) for quantification and on environmental labels and declarations (ISO 14020 &14025) for communication.
For calculations, the Simapro 8.0.2 software has been chosen.
Input data to develop a reliable tool for carbon footprint assessment was obtained via questionnaire. The questionnaire was translated into languages of four participating countries. The questionnaire was circulated among entrepreneurs of four countries: Spain, Italy, Portugal and Poland who account roughly for 73% of total footwear production in EU (Table 1).
Table 1. Footwear production
Spain Italy Portugal Poland Total in CO2Shoe countries
Total in EU
Number of footwear companies
2 300 6 700 1 150 5 900 16 050 26 100
Production (millions of pairs)
118 244 72 377 4717 6 424
% production total EU
18 38 11 6 73 100
Source: estimations provided by IPS Kraków (Poland), INESCOP (Spain), CGS (Italy), CTCP (Portugal).
The questionnaire included the questions related to such details as: purchase raw materials (distance to the supplier premises, price, quality, using of recycled raw materials, recyclable raw materials, absence of harmful substances for human health and the environment etc.). Finally, there were obtained questionnaires from 146 companies.
The Materials and methods section should provide sufficient detail to allow the work to be reproduced. Methods already published should be indicated by a reference: only relevant modifications should be described.

93
Figure 2. Questionnaire about the carbon footprint aimed at footwear
factories Source: own work
Results and discussion (all own research)
Table 2. Percentage of companies according to their level of knowledge of the environmental legislation affecting them
Very important 2.7 % Fairly important 28.8 % Important 51.4 Slightly important 13.0 Not at all important 4.1

94
Table 3. Percentage of companies according to various environmental related issues
Yes No Percentage of companies which have a person in charge of dealing with environmental issues. 39.7 60.3 Percentage of companies which know about Environmental Management Systems 19.2 80.8 Percentage of companies according to whether they have ever considered implementing an Environmental Management System 15.8 84.2 Percentage of companies according to whether they know any of the available computing tools intended for the identification and/or quantification of environmental impacts. 6.2 93.8 Percentage of companies according to whether they know any database where information can be obtained in order to quantify environmental impacts. 4.8 95.2 Percentage of companies according to whether they have ever calculated the carbon footprint of any of their products 1.4 98.6 Percentage of companies according to whether they have calculated their carbon footprint 0.7 99.3 Percentage of companies according to whether they know any database where information can be obtained in order to quantify environmental impacts. 4.8 95.2
Table 4. Percentage of companies according to their level of knowledge of the environmental legislation affecting them.
Much 2.7 Plenty 17.1 A little bit 51.4 Very little 25.3 Not at all 3.4
Table 5. Percentage of companies according to their level of knowledge of ‘Eco-design’.
Don’t know 17.1 Much 2.7 Plenty 7.5 A little bit 24.0 Very little 24.0 Not at all 24.7

95
Table 6. Percentage of companies according to the environmental criteria they take into consideration when a new product is designed.
Absence of hazardous substances 63.0 Durability 61.0 Easy repair, cleanliness in use 39.0 Use of environmentally-friendly materials 19.9 It is not possible to establish our own environmental criteria because the design is imposed by a third party
19.2
Recyclability of materials 13.0 Other environmental criteria 2.1
Table 7. Percentage of companies according to whether they consider
the environmental viability when they plan to make a change in their production processes
Yes 21.2 No 78.1 Don’t know 0.7
Table 8. Percentage of companies according to how they control the raw
materials supplied by their suppliers
Analyses of hazardous substances in raw materials 2.1
Certificates of conformity of raw materials 4.8
visual inspection of materials 84.9
not at all 7.5
Table 9. Percentage of companies according to the aspects they take into
consideration when they purchase raw materials
Price 84.9 Quality 82.2 Absence of harmful substances for human health and the environment
33.6
Distance to the suppliers premises 19.2 Recyclable raw materials 12.3 Recycled raw materials 2.7 Don’t know 0.7 Raw materials obtained from renewables 0.7

96
Table 10. Percentage of companies according to the environmental impacts they think that are caused by footwear production processes
waste 90.4 emissions 46.6 energy 36.3 Discharges 21.2 Noise 15.8 Don’t know 2.7 Others 2.7
Table 11. Percentage of companies according to the existing standards they know for lifecycle analysis
None 92.5 ISO 14044 4.8 ISO 14040 4.8 Don’t know 1.4
Table 12. Percentage of companies according to the existing standards they know carbon footprint calculation
none 93.2 GHG Protocol 5.5 ISO 14067 2.1 PAS 2050 1.4 Don’t know 1.4
The above mentioned results show that despite of importance the
footwear manufacturers assign to environmental issues (82.9% considers it at least important), the most of producers are not interested in investments which are to minimise their influence on environment. Moreover, the declarations of their concern about their influence on environment in the light of their conduct is not confirmed. For example, despite of above mentioned respect for environmental issues, for majority of producers the most important environmental aspects taken into account when designing a new product are “absence of hazardous substances”, “durability”, “easy repair, cleanliness in use” (respectively 63.0, 61.0 and 39.0%). Whereas only 19.9% of producers take into consideration to “use of environmentally-friendly materials”. One should mention, that declared wiliness to produces durable, deprived of hazardous substances may be attributed rather to producers’ efforts to avoid consumer complaints and additional costs associated with it. Moreover, even regarding these aspects, the producers do not control strictly the content of hazardous substances as only 2.1% analyse hazardous substances, and only 4.8% demand certificates of conformity of raw materials. The lack of wiliness

97
to invest additional funds to reduce the effect on environment is clearly visible in data provided in Table 7.). Percentage of companies according to whether they consider the environmental viability when they plan to make a change in their production processes), where the producers honestly confirmed that only 21.2% of them takes into account the environmental viability, which figure corresponds to the number of companies which take into consideration the “use of environmentally-friendly materials”. The practical knowledge on methods for calculation/assessment of Life Cycle as well as Carbon footprint, despite of awareness of environmental impacts (Table 10) is practically non-existent (Tables 11 and 12).
Conclusions
Footwear products, despite being considered as traditional and simple goods are inconvenient object for assessment of their effect on environment. It is due to the fact that in footwear manufacturing processes there are used various materials of different origin. It relates both to the geographic issues as well as a sort of material (natural leathers, artificial leathers, textiles). But the main problem is that majority of footwear manufacturers do not feel a need to calculate their effect on environment. The main reasons to do so is a fear of revealing its company secrets and of increase of production costs. The most effective method to encourage the manufactures to improve their pro-ecological attitude is to use intermediate factors. For example, pro-consumer legislation which impose the obligation on producers to provide durable products gives an effect in efforts of producers to purchase raw materials of high quality.
Acknowledgments
This paper presents the work carried out in the European project CO2Shoe “Footwear Carbon Footprint”, that is co-funded by the European Union through the LIFE+ programme.
References
Quiron P., Hourcade J-C., 2004, Does the CO2 emission trading directive threaten the competitiveness of European industry?Quantification and comparison to exchange rates fluctuations, EAERE Conference, Budapest, Hungary.
http://unfccc.int/resource/docs/convkp/kpeng.pdf
http://eur-lex.europa.eu/legal-content/EN/TXT/?uri=CELEX:32006R0842
http://eplca.jrc.ec.europa.eu/uploads/2014/01/ILCD-Handbook-General-guide-for-LCA-DETAILED-GUIDANCE-12March2010-ISBN-fin-v1.0-EN.pdf

98

99
Moran Galil, Tamar Gavrieli and Gideon Oron COMBINED TECHNOLOGICAL, ENVIRONMENTAL AND ECONOMIC
CONSIDERATIONS IN GREY WATER REUSE via Analytic Hierarchy Process (AHP)
COMBINED TECHNOLOGICAL, ENVIRONMENTAL AND ECONOMIC
CONSIDERATIONS IN GREY WATER REUSE VIA ANALYTIC HIERARCHY PROCESS (AHP)
Moran Galil 1, Tamar Gavrieli2 and Gideon Oron3
1INTEL Electronics, Zoran Ave., Kiryat Gat, Israel 2MLTAM Team, Martin Gahel St. No. 7, Kiryat Arie, Petach Tikva, Israel
3Zuckerberg Water Research Center, J. Blaustein Institute for Desert Research, Ben-Gurion University of the Negev, Kiryat Sde-Boker, Israel
the Department of Industrial Engineering and Management, and the Environmental Engineering Program, Beer-Sheva, Israel
Introduction
The pressure on water resources due to population growth, elevated living standards and over-pumping of groundwater, primarily in arid and semi-arid regions, has enhanced the search for alternative sources (Mcllwaine and Redwood, 2010). Reuse of household wastewater consists of two major streams, the one emerging from the toilet and the second one which includes influent disposal via different systesm such as the shower, washing machines and the others. The water portion from the toilet is considered the most contaminant one while the other portion contains significant lower contaminants. The shower, shower sink and the washing machines are considered as the greywater (Al-Joyous, 2003; Jefferson et al., 1999). The greywater is much easier to treat than the black wastewater (toilet and consists of 50% to 70% of the total wastewater of the household. In arid and semiarid regions, with limited water resources that are slowly exhausted, that water plays an important role in the national water budget (Li et al., 2010; Yu et al., 2010; Zeng et al., 2013). It is therefore advisable to reuse the greywater (GW) for on yard irrigation or for the toilet flushing. It is recommended to reuse GW for on-yard irrigation under Subsurface Drip Irrigation (SDI) of ornamental

100
trees and crops or to use it with some disinfection for the toilets flushing (Al-Mashaqbeh et al., 2012; Finey et al., 2009).
Figure 1. Greywater reuse on a private yard Source: own photo.
A preliminary economic analysis shows GW use is worthwhile issue, namely another options of implementing a reasonable cycle right away close to the generation point (Christova-Boal et al., 1996). Actually it means that the household owner can save a lot of money by constructing a GW reuse system on his yard. At the moment the Ministry of Health in the state of Israel approved mainly reuse of GW in large scale water systems where the inhabitants are staying for a short time such as sport centers and the main wastewater consist of greywater (Al-Hamaiedeh and Bino, 2008). It will decrease the demand for high quality fresh water and will allow having green ornamental gardening adjacent to the house.
The complexity of GW reuse stems from the various definitions as given in Table 1 (Diaper et al., 2001; Eriksson et al., 2002; Trouan, 2007). As indicated the definition is not quite clear, where in some cases the kitchen sink is included, or in other cases the dish washing machine is excluded. The definition of GW is a site specific interpretation and views to some extent the status of water in the discussed country and the attitude to water.

101
Table 1. Definition of greywater in different states in the US
IDA
HO
AR
IZO
NA
WA
SH
ING
TO N
TE
XA
SA
UT
AH
NE
VA
DA
NE
W-
ME
XIC
O
SO
UT
H-
DA
KO
TA
CA
LIF
OR
NIA
Greywater excluding
• • • • • • • • • Wastewater from
Toilet
• • • • • • • Wastewater from kitchen sink or
dish washer
• • • • Wastewater from
closes that contains or feces or urine
• • • • Wastewater that
contains hazardous or toxic consistent
Source: Trouan, 2007
Table 2. Economic assessment of installing a family treatment system for greywater
System Component Cost of Component, US $
Comments
Treatment Facility 1,300 Sand filtration Pump 350
Container 150 Piping and Accessories 325 Energy, Operation and
Contingency 225 Considered here as
permanent expense Total 2,350
Capital recovery Factor 0.106 Annual Cost* ≈250 2,350x0.106 ≈ 250
* Based on Capital Recovery Factor of 0.106
The Ministry of Health of the State of Israel allows the reuse of GW in the public sector, after a high level treatment. Currently, the Ministry of Health refuses to approve private scale projects of GW reuse. The ultimate solution is therefore that non-controlled private systems are installed in private houses, thus turning the so called citizens into law violators. The main trigger is the high cost of waters and the way to save additional expenses for water. GW on a private property can be treated and reused in various ways (Paulo et al., 2009). However, the main principle is to avoid any contact with human being. It means that SDI can mainly be applied for ornamental plantation. Another

102
possibility is to apply the treated GW for toilet flushing, with some disinfection. A scheme of the system discussed is given in Figure 2. This simple layout system was further analyzed for economic uses. If one considers
a human water cost of say 4.0 US dollars per m3 of high quality water, a family size of five persons and annual disposal of GW of say 0.1 m3/ca/day which leads to annual of around 185 m3 per family per year.
Figure 2. The schematic greywater system taken into account in this work
Source: own research
The purpose of this study is to examine the economics of reuse of GW, subject to the family size, environmental conditions and the dependence on water costs. The method of comparing was the Analytic Hierarchy Process (AHP), developed by Saaty (2008) and further by Srdjevic and Medeiros (2008). The discussed system includes all the bathroom components and the laundry machine.
Materials and Methods
General
The theoretical study is based on four GW use alternatives: (i) reclaiming GW for irrigation under SDI and toilet flushing after treatment in constructed wetlands; (ii) treatment by an UltraFiltration (UF) membrane technology; (iii) using GW for the garden irrigation under SDI using chemicals to prevent emitter clogging, and; (iv) GW reclamation for the toilet flushing only. Each method is based on subsurface drip irrigation and on toilet flushing after using a simple disinfection system (Figure 2).

103
Modeling with AHP
The Analytic Hierarchy Process (AHP) method is a powerful and flexible multi-objective decision-making process that helps in setting priorities and is making the best decision when both qualitative and quantitative aspects need to be considered. This approach prioritizes requirements quantitatively and enhances analytical thinking. AHP is designed for subjective evaluation of a set of alternatives based on multiple criteria, and is arranged in an hierarchical structure. At the top level the criteria are evaluated and at the lower levels the alternatives are estimated according to each criterion. The purpose is to provide a vector of weights expressing the relative importance of the elements, helping people to cope with the intuitive, the rational and the irrational, as well as with risks and uncertainties in complex settings.
Figure 3. Schematic description of AHP modeling Source: own research
The decision-maker performs four steps. The first step setup consists in structuring the hierarchy of criteria and elements for evaluation, and arranges the input data for the problem. The second step weighting consists of entering into the alternatives and conducting pair-wise evaluation comparisons. Ratio scales are employed to represent judgments by the integers of levels 1 to 9 and their reciprocals. The comparisons are placed in a positive reciprocal matrix (aij=1/aji) and the comparisons are evaluated in terms of their contribution to or effect on the elements in the immediately higher level. That is also the ladder of values given to the variables. In the third step ranking, statistical methods are used to yield priorities (weights for criteria and for elements. The decision-maker assesses the pair-wise comparison matrix Ai,j, and similarly

104
calculates the eigen-vector of the elements Vj. Each eigen-vector is normalized so that the sum of entries within it becomes 1. In the last step (evaluation, after recording the preference, the priorities of the elements are arranged by criteria into composite measures to arrive at a set of ratings for the elements (alternatives. Lower level priorities are weighted by higher level priorities until the bottom level is reached. At this stage, the composite priorities (i.e. the overall relative weights of the alternatives, where these weights add up to one are calculated using the linear additive model.
Resualts
GreyWater Modeling with AHP
Six criteria were used in current AHP analysis: (i water quality as given by BOD, TSS, Turbidity and fecal coliform content; (ii cost of the system installation; (iii cost of maintenance of system; (iv having “green in the eyes”; (v water saving, and; (vi return period on the investment (Table 3).
Table 3. Summary of results Criteria Alternative 1:
Garden & Toilet
Alternative 2: Membrane for
toilet & Garden
Alternative 3: Loan only
Alternative 4: Toilet flushing
BOD, mg/L Less than 20 Less than 5 Responds for Australian Grey Water Diversion Devices
Not monitored yet TSS, mg/L Less than 30 Less than 1
Feacal coliform, x/100 ml
Less than 14 Less than 1
Turbidity, NTU Less than 5 Less than 1 Low Cost of purchasing and installation, $
2,900 7,370 2,080 920
Cost of operation and Maintenance, $/y
95 470 130 56
Contribution to “green in the eyes”
Positive Positive Positive Positive
Annual saving per family, $/year
300 260 310 40
Return period, years 14 Around 15 Around 10 No return for 15 years
Source: own research
An AHP analysis was conducted for the four alternatives, as presented above. A pair wise comparison was also conducted and the best alternative revealed that the system for both garden and toilets flushing using wetlands treatment was preferable. The pair-wise analysis, considering the six evaluation criteria allows finding the relative weights of each of the criteria

105
(row 1-in table 4). The values given in Table 4 rows 2 to 5 are as well a result of the separate pair-wise analysis (are not given here). An additional sensitivity analysis was conducted for the different options. Scenarios as subsidization policy, water consumption quantity changes and water tariff increase were examined. Subsidization reduced system cost and time of investment return however, it did not change the principle results. Increase in water consumption enlarges the potential saving in water costs and decrease the time of investment return in all alternatives.
Table 4. The vector of priorities according to the criteria selected Criteria Water
Quality Cost of
purchasing and
installation
Cost of operation and main-tenance
“Green in the eyes”
Water saving
Return period
Weighted commutati
on, percent
Weight of Criterion
0.352 0.088 0.081 0.051 0.263 0.165 1.00/100
Alternative 1 0.401 0.140 0.301 0.318 0.383 0.262 34 Alternative 2 0.401 0.070 0.052 0.318 0.192 0.058 23 Alternative 3 0134 0.280 0.182 0.318 0.383 0.591 30 Alternative 4 0.064 0.509 0.465 0.045 0.042 0.089 13 Source: own research
Sensitivity analysis
The results were used to conduct a sensitivity analysis. As indicated it gives rise to the issue of garden size, depending on the number of people in the family and the water consumption (Figure 5. As indicated the garden size and the possibility to reuse the GW on the yard are promising.
Figure 5. Dependence of greywater reuse on the number of people in the family and the garden size
Source: own research

106
Conclusions
The multi-objective AHP method is an excellent and practical tool for project evaluation. It allows to take a sample of people with different opinion and from various disciplines and then to select the preferable project development. The size of the group is also a variable, although it can be left even to one subjective expert. It is essentially a problem how to select the people and at what size sample.
Here the AHP method for evaluation GW reuse on the residential area is presented. It gives rise to the option of GW reuse where the input data can be changed easily and other possibilities can as well be plugged in. Economic profitability was found in two systems only: a system that uses constructed wetlands treatment for reusing the GW for both garden and toilets and a system that reuse the water for the garden only. Water tariff increase has been examined as well and while it makes the annual water costs saving grow, it doesn’t make the non-profitable systems become economically more profitable. Potential membrane treatment might have an economic benefit mainly if GW will be reused for producing drinking waters.
References
Al-Hamaiedeh, H, and Bino, M., 2010. Effect of treated grey water reuse in irrigation on soil and plants. Desalination, 256, 115-119.
Al-Joyous O. R., 2003. Greywater reuse: towards sustainable water management. Desalination, 156 ,pp. 181-192.
Al-Mashaqbeh O. A., Ghrair, A. M., and Megdall, S. B., 2012. Grey Water reuse for agricultural purposes in the Jordan Valley: household survey results in Deir Alla. Water, 4, 580-596
Christova-Boal D., Eden R. E. and McFarlane S., 1996. An investigation into greywater reuse for urban residential properties. Desalination, 106, 391-397.
Diaper C., Dixon A., Buttler D., Fewkes A., Parsons S.A., Strathern M., Stephenson T. and Strutt J., 2001. Small scale water recycling systems - risk assessment and modeling. Water Science and Technology, 43 10, 83-90.
Eriksson E., Auffarth K., Henze M. and Ledin A., 2002. Characteristics of grey wastewater. Urban Water, 4, 85-104.
Finley, S., Barrington, S., and Lyew, D., 2009. Reuse of domestic greywater for the irrigation of food crops. Water, Air, and Soil Pollution, 199 1–4, 235–245.
Jefferson B., Laine A., Parsons S., Stepenson T. and Judd S., 1999. Technologies for domestic wastewater recycling. Urban Water, 1, 285-292.

107
Li, Z., Boyle, F., and Reynolds, A., 2010. Rainwater harvesting and greywater treatment systems for domestic application in Ireland. Desalination, 260, 1-8.
Mcllwaine, S., and Redwood, M. Edt., 2010. Greywater use in the middle east: technical, social, economic and policy. Practical Action publishing: CSBE-Center for Study of the Built Environment, International Development Research Center, p-178.
Paulo, P. L., Begosso, L., Panasonato, N., Shrestha, R, R., Boncz M. A., 2009. Design and configuration criteria for wetland stream treating greywater. Water Science and Technology, 60, 2001-2007.
Portoghese, I., D’Agostino, D., Giordano, R., Scardigno, A., Apollonio, C., Vurro, M., 2013. An integrated modeling tool to evaluate the acceptability of irrigation constraints measures for groundwater protection. Environmental Modelling & Software, 46, 90-103.
Saaty, T. L., 2008. Decision making with Analytical Hierarchy Processes. International Journal of Services, 1, 83-88.
Srdjevic B., Medeiros Y. D. P., 2008. Fuzzy AHP assessment of water management plans. Water Resource Management. 22, 877–894.
Trouan, Y., 2007. Reuse of greywater in the legislation of 9 states in the US. The information and research center of the Israeli Knesset Parliament of Israel, 7-10.
Yu, Z. L. T., Rahardianto, A., DeShazo, J. R., Stenstrom, M. K., Cohen, Y., 2010. Critical review: regulatory incentives and impediments for onsite greywater reuse in the United States. UCLA, USA, p-28.
Zeng, S., Dong, X., Chen, J., and Li, P., 2013. Planning an urban wastewater system with centralized greywater reuse: a case in Beijing. Civil Engineering and Environmental Systems, 30:1, 40-55.

108

109
Teodoro Gallucci, Vera A micarelli, and Giovanni Lagioia Is lithium a strategic mineral? A review
IS LITHIUM A STRATEGIC MINERAL? A REVIEW
Teodoro Gallucci, Vera Amicarelli, and Giovanni Lagioia
Unit of Commodity Science and Ecology, Department of Business and Law, University of Bari Aldo Moro, Bari, Italy
Introduction
Lithium is a silvery white metal and it is found in nature both as hard rock ore and as brine. The name lithium comes from the Greek word “lithos”, meaning stone. It is the lightest metal known which belongs to the alkali metals and reacts in particular with oxygen. Lithium has particular characteristics, as a low thermal expansion coefficient and its compounds have a ratio of viscosity/temperature constant, which makes it unique for several application. Table 1 compares the properties of lithium with those of magnesium aluminium and iron, considered for be applied for the same structural applications.
Table 1: Main properties of selected material
Fe Al Mn Li Melting point °C 1,535 660 650 180 Boiling point °C 2,860 2,518 1,093 1,347 Density (g/cm3) 7,87 2,70 1,74 0,53
Source: Kamienski et al 1995
In the last years these peculiarities made lithium, together with its compounds, as lithium carbonate, lithium hydroxide, lithium bromide, etc a strategic metal for manufacturers particularly for the realization of numerous electric and electronic applications. Thanks to its characteristics is used in different applications, as shown in figure 1.
Extraction of lithium
Sources of lithium include several minerals containing Lithium, as Spodumene, LiAl (SiO3)2 with 6% of Lithium; Triphylite (Li, Na)2PO4 (Fe, Mn)3(PO4) – with 24 % of Lithium; Petalite LiAl(Si 2O5)4 with 2.7 – 3.7% of

110
Figure 1. Summary of Lithium applications Source: Adapted from Ebensperger et al 2005 and Ziemann 2012.
Lithium; Lepidolite (Li, Na, K)2(SiO3)3(FOH) with 21.5% of Lithium; Amblygonite LiAl(PO4), Brine and sedimentary rocks. Spodumene with Brine is the main sources of lithium the most common form of lithium in pegmatite deposits. Brine originating from the Salar de Atacama in Chile, which is the world’s largest producer of lithium carbonate. Above the Lithium extraction from Spodumene and Brine are discussed. Lithium extraction from Spodumene: Spodumene is converted into carbonate. This process involves alkaline fusion and carbonation or acid roasting, calcination, and carbonation. Conversion to carbonate involves purification (removal of potassium) and precipitation. The carbonate is then converted to the chloride with the action of a chlorinating agent such as hydrogen chloride. The extraction of Lithium from its minerals involves two steps: First the conversion of Lithium into Lithium chloride and then the electrolysis of Lithium chloride. The conversion of Lithium into Lithium chloride minerals occurs by acid treatment methods and fusion method (Kamienski et al, 1995, Haus 2010, Qun-xuan 2010).
Lithium mineral
concentrateLithium minerals
Lithium Hydroxide
Lithium Carbonate
Lithium Bromide
Butillithium
Brines
Glass
Lubrificant
Batteries
Batteries
Ceramics
Others
Air conditioning
Batteries
Pharmaceuticals
Chemicals
Lithium Chloride
Lithium metal
Polymers
Pharmaceuticals

111
Acid treatment method. Lithium is most commonly extracted from spodumene, petalite and lepidolite ore. The ore is heated to roughly 1100˚C. Then it is crushed and then mixed with sulphuric acid and heated to 250˚C and extracting it into water producing a lithium sulphate (Li2SO4) solution. This is cooled, leached with water and then filtered to remove silica (SiO2). The filtrate thus obtained is treated with a calculated amount of Na2CO3 to precipitate aluminium and iron as carbonates, which are filtered. It is then treated with soda ash to form lithium carbonate. The carbonate is then reacted with hydrochloric acid (HCl) to convert it to the lithium chloride according to the following reaction:
Li 2CO3 (s) + 2HCl (aq)---> 2LiCl (aq) + H2O (aq) + CO2 (g)
After first step the electrolysis of molten pure and dry lithium chloride potassium chloride (45% LiCl; 55% KCl) is the way to produce lithium metal. The purpose of adding potassium chloride is to decrease the melting point from 614 °C to approximate 420 °C (Kamienski et al 1995, Kipouros 1998).
Fusion method. The powdered silicate mineral is fused with CaCO3 and the fused mass is extracted with HCl and filtered. The filtrate contains chlorides Li, Al, Ca, Na and K whereas silicon is removed as insoluble residue. The filtrate is evaporated to dryness and the residue is extracted with pyridine in which only LiCl dissolves. Pyridine is distilled off while LiCl is left behind. The method discussed above may be summed up in the following flow-sheet.
Figure 2. Fusion method
Lithium ore (spodumene
or lepidolite)
Fuse with CaCO3 and
extract with HCl and
filtered
Insoluble
SiO2 Filtrate
Chloride of Li, Al,
Ca, Na, K
Evaporate and
exctract to prydine
Soluble
LiCl
Insoluble
(NaCl, KCl, CaCl2, AlCl3

112
Electrolysis of Lithium chloride. The mixture of dry lithium chloride (55%) and potassium chloride (45%) is fused and electrolysed in an electrolytic cell. Potassium chloride is added to increase the conductivity of lithium chloride and to lower the fusion temperature. As a result of electrolysis, the following reactions take place:
LiCI ↑ Li+ CI-
At cathode: Li++ e- → Li
At anode : 2CI-- 2e- → CI2
Chlorine gas, a valuable by product liberated at the anode leaves the cell through the exit while molten lithium rises to the surface of the fused electrolytes and collects in the cast iron enclosure surrounding the cathode. The metal thus obtained is 99% pure and is preserved by keeping it wrapped in paraffin wax. Extraction of lithium from Brines: to date, there are other approaches to extract lithium. One method is from brines. Salt brine is the most abundant lithium source available in world and it contains a mixture of sodium, magnesium, potassium and lithium. These are generally, known as salars. The process can be summarized in concentration of brine water through an evaporation process. Then removal of magnesium by the addition of lime milk occurs. This results in a solid-phase conversion reaction, which converts the calcium hydroxide into magnesium hydroxide. The magnesium hydroxide is removed from the brine solution with a filtration process at a later stage. Calcium ions from the solid phase conversion reaction are retained in the brine solution. Removal of calcium through the addition of lithium carbonate follows. This produces another solid-phase conversion reaction that converts lithium carbonate into calcium carbonate. The calcium carbonate is removed with a filtration process at a later stage. Extraction of lithium from Spodumene and other minerals, in contrast with salar brine sources, requires a wide range of hydrometallurgical processes (Bradley et al 2013). In figure 1 are reported a summary of several lithium application
Market
For many years, the lithium compounds and minerals were used in the production of ceramics, glass and aluminium. Rapid growth in lithium battery use has resulted in batteries gaining significant market share, and rechargeable lithium-ion and lithium-polymer batteries appear to have the greatest potential for growth as showed in table 2.

113
Table 2. World market share is expressed as a percentage (%) of the total global sales of lithium
End use 2007 2008 2009 Ceramics and glass 18% 31% 30% Batteries 25% 23% 21% Lubrificants 12% 10% 10% Pharmaceutical 7% 7% 7% Air conditioning 6% 5% 5% Other 28% 21% 24% World production in metric tons
25,400 25,400 18,000
Source: Goonan, 2012
The lithium presents high capacity for energy storage, which is the main reason of the increasing of its importance in the automotive sector for supply of electric cars, in the production of lithium-ion batteries for tablet, cell phones, computers and other portable electronic devices. The global production of lithium increased from 12,370 tonnes (65,850 t of lithium carbonate equivalent (“LCE”) in 2000 to 24,739 t (131,689 t LCE) in 2011. Overall lithium demand increased of 6.5% from 2000 to 2011. Forecasts between 2011 and 2025 are annual rate of 7% from existing market applications (Kesler et al 2012).
World reserves of lithium
As shown in table 3 the worldwide lithium deposits are located in China, Australia, Canada, whereas Congo (even if there are not available official data because of the geo-political situation), Zimbabwe and Brazil have a marginal position.
The data have been collected by different sources but there are misalignments in the estimation of the “lithium total reserves”. In references there are often reported “reserves” and “reserve base”. USGS defines Reserve as “That part of the reserve base that could be economically extracted or produced at the time of determination; whereas defines Reserve Base “That part of an identified resource that meets specified minimum physical and chemical criteria related to current mining and production practices, including those for grade, quality, thickness, and depth” (USGS, 2014). The official statistics do not always clearly illustrate at which type of reserve the figures belong, probably, because of both the difficulties in estimating reserves in different Countries (e. g Russia, China, Congo, etc) and for strategic motivation. These could be the reasons of different estimations for world total lithium resource, which ranges between 19 - 64 Mt, whereas world total lithium reserve ranges between 4 and 39 Mt (USGS 2014, Gruber et al 2011).

114
Table 3. World reserves of Lithium by years (tons)
1997 2000 2005 2012
Argentina 850,000 850,000 2,000,000 850,000[§] Australia 150,000 150,000 160,000 1,000,000 Brazil 1,000 1,000 190,000 46,000 Canada 180,000 180,000 180,000 n.a Chile 1,300,000 3,000,000 3,000,000 7,500,000 Russia n.a n.a n.a n.a United States
340,000 38,000 38,000 38,000 [§]
Zimbabwe 23,000 23,000 23,000 23,000 China n.a n.a 640,000 7,500,00[§]
Congo n.a n.a n.a n.a
[§] estimated. - Elaboration of the authors based on USGS 2014, Greiner 2001.
These estimation of Li, are sufficient to meet estimated global lithium demand for the next century, as long as batteries are recycled as discussed above.
Main Countries producing Lithium
China
Within the territory of China, the mineral lithium is located at the Jiangsu province where the industry Xingjuan Non Ferrous Metal Corp Mingyaun extract lithium carbonate. It is very difficult to assess the Lithium resources China because of the political regime in the country.
Australia
In the Australian territory there are two important mineral basins. The first one is located at the mining town of Greenbushes, in the south west of Australia. The extraction of the minerals, where operates the Talison Minerals Pty, Ltd., covers the 60% of global demand for spodumene concentrate (which is the main mineral of lithium). The second one is located in Ravensthorpe, in the mine known as Mt Cattlin in Western Australia. The Galaxy Resources Ltd has operated on this deposit from 2009 to 2013, when the mine was officially closed.

115
Canada
In Canada there are two main basins where operate two different industry. In the province of Manitoba, at the TANCO mines, the Tantalum Mining Corp produces spodumene concentrate. While in eastern Canada, in the Ontario region there is a large deposit of pegmatite known with the name "Big Whopper mine" where operates the Avalan Ventures.
Congo
The Democratic Republic of the Congo has significant potential sources of lithium, but the main problem concerns the infrastructure and the politically unstable situation. The only source refers to the "Min de Pegmatittes" an industry, which is in Katanga province, in the south of the country.
Zimbabwe
The only deposit of lithium in the Republic of Zimbabwe is located in the south of the country at the Masvingo province in the region of Bikita. It is a pegmatite deposit, from which the Bikita Mining industry, produces petalite concentrated.
Brazil
In Brazil there are three small industry: the Arqueana Minérios and de Metais Ltda, Companhia Brasileira de Lithium (CBL) and the Socieda Mineira de Pegmatitas. The first two extract the pegmatite minerals from the "Mina Cachoeira" located in the region of Minas Gerais, while the latter extract from deposits of Ceara. Both deposits reach 85,000 tons of lithium (Jaskula 2011).
World consumption of lithium
The above chart shows the future trend of the consumption of lithium (Polinares 2012). Whether the period from 2000 to 2010, the lithium consumption was stable with an annual growth rate of 10%, in the next decade, until 2020, the consumption will increase of 1% per annum, reaching a growth rate of 11% per year. This surge is a consequence of the growth demand for commodities incorporating lithium, particularly rechargeable batteries widely used in the consumer electronics industry and, more recently, in the automotive industry as well. The future scenario is characterized by an economic investment of about 1.6 billion € for electric-drive vehicles to be built by 2050, and this would cause high lithium demand with inevitable impact on the lithium market (Santini 2009).

116
Figure 3. World consumption of lithium by end-use, 2000-2017 Fox Davis Capital, 2013
Results and discussion
Considering the trend for the near future to replace the internal combustion engine in cars and trucks with electric batteries the demand for lithium, as a component of batteries, should arise. Lithium should become very strategic and considering the worldwide reserves, recycling policy planning for the increment of demand represented by automobile batteries that contain lithium, should become the best solution (Scrosati et al 2010). The recycling would not only recover lithium but would also recover the other metals, including cobalt and nickel. The lithium recycling is in its infancy; there is currently no recycling infrastructure worldwide. In 2009 it was calculated roughly 3,700 t of lithium, contained in scrap batteries, was recycled (Goonan 2012). Considering the growth of automotive industry recycling of electric vehicle batteries could provide a massive percent of the lithium requirement for new batteries even if not all types of batteries can be recycled (Miedema et al 2013). The recycling system can range from $1,100 to $ 2,200 for 1 t of batteries of any chemistry and size (including small cells), except automobile batteries (Goonan 2012). Significant subsidies are still required from manufacturers, agencies, and governments to support the battery recycling programs. Available data are insufficient to project future lithium demand with certainty. Specialised processes dedicated to recycling plants closer to vehicle manufacturers are in programme to be realized. The main problem is related the financial investments required by to implement specialised waste disposal services. As the market is still in infancy, the

117
specific turnovers of these investments are uncertain and difficult to foreseen. Any case for the future, recycling of Li-ion batteries is expected to be one of the main sources of lithium supply (Dewulf et al 2010).
Conclusions
Lithium are becoming the batteries of the futures. Existing projections are speculative and largely assume a regular progression of automobile sales and an increasing share for electric vehicles. If the general economy remains constrained, then demand for lithium will growth in the near future. The lithium reserves are large enough to meet the arising of the demand in the short term, but attention should be paid to long term. An attentive management of this resource entails an efficient recycling management. Of course, the current global economic situation does not help in the realization of these projects. If new financing recycling projects, or new plants for the production of lithium will not be built, a period of high volatility in the prices dictated by the alleged scarcity and preciousness of the resource take place. The price of lithium, in fact, could reach $ 6,000 per tons. Who would make it better would be the costs of the European continent that has no resources or reserves sufficient to manage such a large increase in demand, setting up a geo- strategic bottleneck.
References
Bradley D., Munk L., Jochens H., Hynek S., Labay K., 2013, A Preliminary Deposit Model for Lithium Brines, U.S. Geological Survey Open File Report, 1006 available at http://pubs.usgs.gov/of/2013/1006/OF13-1006.pdf accessed 14 May 2014.
Dewulf J., Der Vorsta G.V., Denturcka K., Van Langenhovea H.W., Ghyootb T., Tytgatb J., Vandeputteb, K., 2010, Recycling rechargeable lithium ion batteries: Critical analysis of natural resource savings, 54, 229–234.
Ebensperger A., Maxwell P, Moscoso C., 2005, The lithium industry: its recent evolution and future prospects, Resources Policy, 30, 218–231.
Fox Davis Capital, 2013, The lithium Market, http://www.globalstrategicmetalsnl.com/_content/documents/405.pdf accessed 14 May 2014.
Goonan T.G., 2012, Lithium use in batteries, U.S. Geological Survey Circular 1371, http://pubs.usgs.gov/circ/1371/pdf/circ1371_508.pdf accessed 14 May 2014.
Greiner E.O.C., 2001, “Lithium, Lithium minerals and lithium chemicals”, Chemical Economics Handbok.
Gruber P.W., Medina P., Keoleian S.E., Everson M.P, Wallington, T., 2011, Global Lithium Availability- A Constraint for Electric Vehicles?, Journal of Industrial Ecology, 1-15.

118
Kamienski C.W., McDonald D.P., Stark M.W., 1995, “Lithium and Lithium Compounds,” Kirk-Othmer Encyclopedia of Chemical Technology, 15, New York: Wiley, pp. 434–463.
Haus B.F.R., 2010, New concepts for lithium minerals processing, Minerals Engineering, 23 (8), 659−661.
Kesler S. E., Gruber P. W., Medina P. A., Keoleian G. A., Wallington, T. J., 2012, Global lithium resources: Relative importance of pegmatite, brine and other deposits, Ore Geology Reviews, 48, 55–69.
Kipouros J., Sadoway D.R., 1998, Toward New Technologies for the Production of Lithium, JOM, http://web.mit.edu/dsadoway/www/81.pdf accessed 14 May 2014
Jaskula W., 2011, Lithium, U.S. GEOLOGICAL SURVEY MINERALS YEARBOOK, http://minerals.usgs.gov/minerals/pubs/commodity/lithium/myb1-2011-lithi.pdf accessed 14 May 2014
Miedema J.H., Moll J., 2013, Lithium availability in the EU27 for battery-driven vehicles: The impact of recycling and substitution on the confrontation between supply and demand until 2050, Resources Policy 38 204–211.
Qun-xuan L., Xin-hai L., Wang Z., Wang J., Guo H., Hu Qi-Y., Peng, W., WU X., 2012, Extraction of lithium from lepidolite using chlorination roasting−water leaching process, Trans. Nonferrous Met. Soc. China 22, 1753−1759.
Polinares, 2012, Fact sheet Lithium,; http://www.polinares.eu/docs/d2-1/polinares_wp2_annex2_factsheet4_v1_10.pdf accessed 14 May 2014
Santini D.J., 2009, Where Is the Early Market for PHEVs?, World Electric Vehicle Journal, 2 (4), 49–98.
Scrosati B., Jürgen G., 2010, Lithium batteries: Status, prospects and future, Journal of Power Sources 195, 2419–2430.
USGS, 2014, Lithium Statistics and Information, U.S. Geological Survey, http://minerals.usgs.gov/minerals/pubs/commodity/lithium/ accessed 14 May 2014.
Ziemann S., Weil M., Schebek S., 2012, Tracing the fate of lithium––The development of a material flow model, Resources, Conservation and Recycling 63, 26– 34.

119
Grosu Raluca Mariana, SăseanuAndrea Simona IMMIGRANT ENTR EPREN EUR SHIP - A CHA LLENGE T O COMM ODITY SC IENC E IN THE AGE OF GLOBALISA TION
IMMIGRANT ENTREPRENEURSHIP - A CHALLENGE TO COMMODITY SCIENCE
IN THE AGE OF GLOBALISATION
Raluca Mariana Grosu, Andrea Simona Săseanu
The Department of Business, Consumer Science and Quality Management, The Faculty of Commerce, The Bucharest Academy of Economic Studies;
Introductory aspects
Considering the actual context we live in, migration represents one of the main issues our society faces. Thus, in an extremely interconnected world, highly characterised by a pronounced globalisation, migration is one of the most important phenomenon being on the main interest agenda of policy makers, scholars, or researchers. In what concerns the last two categories, their interest areas are extremely diverse being connected with demography, history, geography, sociology, psychology, politics, economy etc. Even in these areas, more narrow niches are addressed. For example, in case of the latter, according to Dustmann & Preston (2006), there is a wide range of studies focused on migration’s impact on the economy, one of the main directions for research - also with a vast tradition in the area - being mainly targeted towards the relationship between migration and the labour market (Kancs 2011; Kindler & Szulecka 2013; Pemberton & Scullion 2013). In general, economists tend to approach immigrants mainly as labour force (Pajo 2008; Bodvarsson & Van der Berg 2009), probably because of their strong impact on the labour market in the country of destination (Shapira 2010). However, they can also manifest an extremely developed entrepreneurial spirit in the country of destination, mainly expressed through business start-up in various areas, according to Arjona (2004) cited in Săseanu, Petrescu & Zgură (2011) the most frequent ones being the ‘sale of ethnic products, retail, construction, intensive agriculture, high intensity personal services, and hospitality and food’. For example, according to Kitching, Smallbone & Athayde, ‘in the United Kingdom, the businesses are concentrated in competitive, low-value-added ethnic niche sectors, such as catering, food retailing, and textiles. However, in more recent times new trends in targeted niches arose such as business and professional services, music, the arts, and software’ (2009, pp 692-693).

120
Immigrant entrepreneurship faces different approaches in the specific scientific literature, commonly ‘the terms of immigrant entrepreneurship, ethnic entrepreneurship, and minority entrepreneurship being used interchangeably’ (Basu 2006, p 582). However, there are a series of differences between them. For example, immigrant entrepreneurs are the immigrants who start a business in the country of destination. Minority entrepreneurs are the ones that are part of a minority group, implicitly they do not belong to the majority; they are not necessary immigrants, sometimes women being included in such a category. Ethnic entrepreneurs are the ones that belong to an ethnic group with a common culture, history, language, etc. (Chaganti & Greene 2002 cited in Basu 2006). Furthermore, they tend to develop an ethnic economy based on their close interaction and also on their interaction with suppliers and consumers (Miera 2008). ‘Thus, an ethnic entrepreneur may or may not be an immigrant but it is likely to belong to a minority community’ (Basu 2006, p 582). Research in the area of migration’s influence on supply is in an incipient phase; the specific scientific literature offers a quite narrow range of scientific papers in this area, the vast majority of them being focused on the analysis of the migration-supply relationship in connection with the labour market (Linton 2002; Bodvarsson, Van den Berg & Lewer 2008), or the housing market (Jones, Leishman & Watkins 2004; Pemberton 2009). In what concerns the relationship between migration and the supply of goods, Bodvarsson & Van der Berg (2009) consider that it is almost never approached in the literature. However, considering the migration-supply/demand relationship in connection with the commodities market, Hercowitz & Yashiv (2002) propose an open-economy based model that incorporates differentiated inputs of immigrants on the labour market and on the goods market. They focus on the short term effects of the dynamics of immigration, with the aim of studying the macroeconomic effects of massive immigration to Israel in the 1990s on the employment rates of natives. ‘The reduced form of the model – consisting of two equations for native employment and the relative price of domestic goods – is estimated, finding negative effects of immigration on native employment a year after arrival. The delay in the effect is attributed to a positive impact of immigration on the excess demand for goods and, thus, on the demand for labour earlier on.’ (Hercowitz & Yashiv 2002) Different from the previously mentioned authors, the relationships between migration and demand/supply are analysed by Lach (2007) with focus on prices, and not in relation with the labour market. Lach examines the ‘behaviour of prices following the unexpected arrival of a large number of immigrants from the former Soviet Union to Israel, using store-level price data on 915 consumer price index products. The study shows that the increase in aggregate demand prompted by the arrival of the FSU immigration significantly reduced prices during 1990’ (2007, p 548).

121
Considering the previously stated information, in this paper we aim at providing a different approach to immigrant entrepreneurship outlining the impact migration has on the supply of food commodities in the country of destination in the context of immigrants developing business based on the production of ethnic food products. In our specific case, bakery products were chosen mainly because they are part of the alimentary culture of the vast majority of nations around the world (Săseanu, Petrescu & Voica 2009) and they are one the basic food products, almost indispensable in daily diet (Săseanu 2005). Furthermore, they, as all the food products, represent ‘more than a nourishment means; they are a key element in expressing the culture of a nation’ (Penaloza 1994, p 42). We based the paper mainly on a research carried out among Turkish immigrants in Bucharest Romania owners of active enterprises in the bakery industry. In this sense, besides the introductory and the conclusive aspects, we structured the paper into two parts that outline the main methodological aspects and the main findings of the carried out research.
Research methodology
In this paper we outline the results of a qualitative exploratory research carried out between 2011 and 2014 among Turkish immigrants who own active enterprises in the bakery industry in Bucharest, Romania and among representative figures of the Turkish business community in Romania and of the Romanian bakery industry. The fundamental aim of the research was to highlight the main model of influence migration has on the supply of bakery products on the Bucharest market, with focus on the businesses owned by the Turkish immigrants. We have chosen for investigation the Turkish entrepreneurs as, with a very developed entrepreneurial spirit, they are occupying an important position on the Romanian business environment. Along with the Chinese immigrants, they are probably the most representative community of immigrant entrepreneurs in Romania. Also, they were the first investors and foreign business men that started and developed businesses in Romania after 1989, and ever since the early 1990s Turkish entrepreneurs played an important role in the transition process from a centralised to a market economy in the post-communist period. Part of these hypotheses on which we based our choice for the investigation group, was also found in the study accomplished by Constantin, Goschin & Drăguşin (2008). Immediately after the fall of the communist regime, Romania represented an attractive investment environment for Turkish people, mainly due to its geographical position, to the proximity to Turkey, and to the very close friendship between the two countries. Turkish entrepreneurs in Romania are very well organized in associations. In 2011, in Romania there were approximately 12,800 enterprises hold by Turkish people, out of which 6,000-6,500 were active – mainly focused in Bucharest; out of them, around two-five per cent were

122
active in the bakery industry. Starting from 1993, in Romania there is active the Turkish Businessmen Association (private NGO, apolitical and non-profit association), with approximately 150 members. However, as enterprise representativeness, the number of members rises at approximately 700, as one entrepreneur may have three, four, or even 10 enterprises. In general, the members of the association are representative figures of the Turkish business environment in Romania, the enrolled enterprises contributing with approximately 70-80 per cent to the turnover accomplished by the Turkish investors in Romania. Member and vice-president of the European Federation of the Turkish Businessmen Associations, the Turkish Businessmen Association in Romania aims to develop the Romanian-Turkish bilateral relationships, mainly in the economic, cultural, and social areas. The association helps and supports its members in their relationship with the Romanian authorities. In the same time, it is considered by the Romanian authorities as an important liaison factor with the Turkish business environment. (TIAD 2011)
For the proper development of the research, we have identified the total number of the active enterprises in the bakery industry hold by the Turkish entrepreneurs in Bucharest in 2011, respectively 64. For their appropriate identification, we have conducted a series of informal discussions on this subject with representative persons from the Turkish community in Bucharest, persons actively involved in the bakery industry in Romania, implicitly in Bucharest, and persons hired in the public administration in Romania in charge with enterprise monitoring.
In order to establish and to select the participants to the research we used the snowball and the purposive sampling techniques; a series of reasons for these choices refer to the fact that data could not be gathered for the entire investigated population, to the fact that statistical inference was not an essential condition, to the fact that the members of the Turkish business community in Romania were difficult to identify, or to the fact that the carried out research was an exploratory one.
In order to get the necessary information from the participants to the research, we used the unstructured and the semi-structured interviews. In both cases the interviews were formal and in the case of the semi-structured interviews, an interview guide was used. As the research in the investigated area is in an incipient phase, the initial version of the interview guide was improved after debating it with important representatives of the Turkish business environment in Romania and of the Romanian academic environment. Although we used an interview guide, the number of questions addressed or the order in which they were addressed varied, in general, from one interviewee to another, in accordance with the interview’s way of development. The research sample was composed of 3 representatives of the
123
Turkish business community in Romania, 18 Turkish immigrant entrepreneurs active in the bakery industry and 2 representatives of the Romanian bakery industry. The participants to the research were purposely chosen based on contrast and variety criteria, in order to provide a more complex and comprehensive perspective on the subject. Considering confidential reasons, their identity is not revealed. The interviews were face-to-face type and they last, in average, for 36 minutes each. They took place, in general, at the interviewee's office, and the number of persons involved in the interview varied from one interviewee to another, in general, the type of conducted interview being of one-to-one. However, there were also situations in which the presence of another person - especially translators - was necessary. During the interviews we took notes; based on them and using the inductive approach, the analysis of information presented in the following part of the paper was elaborated. Considering the qualitative character of the research, we do not aim to expand the obtained results. More precisely, the outlined results are specific to the respondents that took part in the research.
Main findings of the research
The interviewed entrepreneurs were mainly man, aged between 31 and 62 that immigrated in Romania in all the years after the fall of the communist regime until periods closer to the one when the research was carried out. In general, the vast majority of the entrepreneurs appreciated that the main purpose for migrating to Romania was related to business start-up. Very few interviewees migrated in Romania in order to find a job; however, afterwards they started a business in the bakery industry, or in other branch and subsequent in the bakery industry.
The businesses in Romania, in the bakery industry, were developed since 1995 until 2010. Since the fall of the communist regime, the bakery industry was of interest for the Turkish immigrants that wanted to invest in Romania. This industry was chosen for business start-up by the more experienced entrepreneurs as, in general, they possessed vast knowledge about the industry’s specific features. In general, they started the business in periods closer to the fall of the communist regime, shortly after their immigration in Romania, and at the moment when the research was carried out they held medium or big enterprises. There were also cases among the interviewed Turkish entrepreneurs of more experienced persons for whom the bakery industry has a vast tradition in their family, that owned businesses in this industry in Turkey and that ‘continued’ them in Romania. Also, the bakery industry was chosen by the entrepreneurs as this has a significant importance also in Turkey, bread being an important part of the Turkish gastronomic culture.

124
I had a lot of experience in this field, as since I was little I have been working with my father in his bakery ... [moment of thinking and a light smile appeared on interviewee's face] Actually, I have continued the family tradition. In 1995, I have decided to migrate to Romania with the main aim of developing my business with bakery products.
In Turkey, bread is very important. It is part of our culture. [the interviewee becomes very serious] One may have nothing to eat and to put on his/her table, but the bread is unacceptable to miss.
The younger entrepreneurs did not have any proficiency in the bakery field before starting their business. In general, they only possessed vast entrepreneurship knowledge and about the bakery market and they had very developed entrepreneurial skills and competences, becoming very important players on the market associated to the Turkish business community in Romania, as remarked by their representatives. The young entrepreneurs migrated to Romania in order to start a business in the bakery industry, considered to be very attractive and auspicious for investment. In this sense, one of the main set of hypothesis their business was based on referred to the unsatisfied demand for Turkish bakery products on the Bucharest market from the part of the Turkish immigrants and to the high level of acceptance of these products by the Romanians, as resulted from various market studies they carried out. Also, they were prepared to produce in the same time Romanian bakery products.
Romanians consume a lot of bread and other bakery products. Mainly of Romanian nature, but they are open also towards other products with ethnic specific. [smiling] This is the market I searched for.
Irrespective of their age, in general, the interviewed entrepreneurs started their business alone, or with another member of their family. As specified by the representatives of the Turkish business community in Romania, Turkish people are very connected with their family and friends; it is part of their culture. However, there were also situations when the business was started in collaboration with another person of Turkish nationality that was not relative.
In general, the business model started and developed by the interviewed entrepreneurs was based on the existence of a bakery and of a series of stores where the products were sold to final consumers. However, there were also entrepreneurs that produced bakery products that were sold to intermediates; they did not sell directly to the final consumer.
The vast majority of the interviewed entrepreneurs produced and sold both Turkish and Romanian bakery products. However, driven by the desire of a higher profit, there were also entrepreneurs that produced and sold only Romanian bakery products. Turkish immigrants’ community in Romania, implicitly in Bucharest is relatively limited; in Romania, there are around 15,000 Turkish immigrants. Considering this, it can be assessed that there is not a very developed ethnic market in Romania, specific to Turkish

125
immigrants. Thus, a business targeted only towards clients from the Turkish community by producing and offering only Turkish bakery products, is not very profitable. In this sense, even the entrepreneurs that produced and sold Turkish bakery products did this in a smaller proportion in comparison with Romanian bakery products. The very developed entrepreneurial spirit and the business intuition specific to persons of Turkish nationality, along with a high degree of flexibility and adaptability to market conditions, determined the Turkish entrepreneurs active in the bakery industry in Bucharest to start businesses mainly addressed to Romanian customers, but also to Turkish customers.
In general, Romanians prefer and consume Romanian bakery products. I cannot produce and sell only Turkish bakery products. [moment of silence] This way, I will not sell as much products as I need to get the expected profit. One has to adapt to the Romanian market and to offer products mainly for Romanians, and especially products they demand.
I have in my plant ovens of small and medium capacity in order to diversify the assortment. I have to meet also the demand for Romanian bakery products.
We work for Romanians. We produce for them. [slight laugh]
We produce a wide range of products, both Turkish and Romanian, for both Turkish immigrants and Romanians. Also, there are a lot of Romanians that consume Turkish bakery products. However, as the main demand on the market is for Romanian bakery products, mainly from the part of Romanians, we produce these products. Although, we hope that more and more Romanians will become more familiarized with the Turkish bakery products and will want to consume them more.
As consumers, Romanians were very open-minded to our Turkish bakery products. [satisfaction could be read on the interviewee's face] If we think, historically there is quite a mutual effect between Romanians and Turkish people … there is a connection between the two nations. In this sense, there was not a rejection between the two nations and implicitly, of the products. Romanians did not reject our Turkish bakery products. On the contrary, Romanians showed an attraction towards Turkish bakery products, especially considering the cultural familiarity between nations.
Also, their very developed entrepreneurial spirit helped them to overcome a series of problems they faced during the economic crisis. In this sense, some of the interviewed entrepreneurs adapted their offer of products and produced and sold different products to all types of clients, regardless their income.
During the crisis we had to adapt and to offer products for everybody. We also reduced some prices in order to have bakery products accessible to everyone.
126
The clients targeted by the interviewed entrepreneurs were persons of any nationality, especially Romanians - which buy both Romanian and Turkish bakery products - and Turkish immigrants. They were also the ones that frequently bought the bakery products. Furthermore, in case of the Romanian buyers, Turkish entrepreneurs considered that there was a need for their ‘education’, for their better information regarding the Turkish bakery products; this aspect was considered by the representatives of the Romanian bakery industry. There were also entrepreneurs, among the interviewed, that addressed only to Romanians, as they produced and sold only Romanian bakery products, as mentioned before.
The production of Turkish bakery products - even if they are a little bit different from the ones in Turkey, being adapted to the Romanian market - implied, among other aspect, the existence of various relationships with Turkish providers of ingredients. Thus, one of the countries providers of ingredients was Turkey. Bulgaria and Italy were also preferred by the interviewed entrepreneurs. However, the main providers of ingredients came from Bucharest, or from other Romanian regions, such as Prahova County.
In order to produce Turkish bakery products we need some special ingredients that we can find only in Turkey. Otherwise, the product is not produced as it should; even if we follow the recipe, if we don’t have the necessary Turkish ingredients, it doesn’t have the same taste. Nonetheless, the product is not the same as in Turkey … ingredients have an important contribution, but mainly the problem is related to the adaptation to the Romanian market. The Turkish bakery product from Romania is not 100 per cent the Turkish bakery product from Turkey. It is a little bit different.
In the same context, respectively of producing Turkish bakery products, along with the specific ingredients, specific workforce was also required. Thus, in general, the employees in the studied enterprises were mainly Romanians and Turkish immigrants. The latter were employed mainly for their knowledge about the fabrication process of Turkish bakery products, especially about the particularities of the recipe, or for the fact that they were part of the entrepreneurs’ family or friends. However, the share of Turkish immigrants in the total number of employees in the studied enterprises was quite low, compared to the one of Romanians. One of the main reasons was the high cost of Turkish labour, compared to Romanian labour. Thus, Turkish immigrants were required for employment only in ‘extreme’ conditions, for example when they were needed to develop a series of activities impossible to accomplish by employees of another nationality.
In our enterprise with over 250 employees, are both Romanian and Turkish employees. [moment of thinking] But, more than 95 per cent of them are Romanians.

127
We hired both Romanians and Turkish immigrants. We needed Turkish employees that know the particularities of the Turkish bakery products recipes and their preparation methods.
A Turkish worker costs an enterprise at least EUR 1,000 per month. Turkish immigrants are very expensive labour. An enterprise cannot afford to employ many persons of Turkish nationality…unless it is very profitable. In Turkey, salaries are higher than in Romania, and it is very hard to convince a person of Turkish nationality to migrate and work in Romania…How can one convince him? Romania is another country, with harder conditions, especially for foreigners. We do not have the tendency to hire persons of Turkish nationality, unless it is extremely necessary.
Adopting an acculturation strategy of integration, in general, the entrepreneurs were actively involved in different associations and organizations specific to the Romanian bakery industry. Also, the representatives of the mentioned industry encourage the involvement of Turkish entrepreneurs. In the same frame, entrepreneurs were also collaborating with other entrepreneurs active in the bakery industry, regardless their nationality, but mainly of Turkish nationality. However, there were also cases of entrepreneurs that collaborate only with Romanian entrepreneurs. The cooperation between Turkish and Romanian entrepreneurs was somehow supported also by the Turkish Businessman Association in Romania. Some of the interviewed Turkish entrepreneurs cooperated with Romanian entrepreneurs active in the bakery industry in order to develop mixed recipes for producing new types of products (with mixed specific, Turkish-Romanian), in order to enlarge the available assortment, and implicitly to modify the supply structure. Also, there were entrepreneurs that cooperate with other Turkish immigrants, in order to improve the products recipe. Furthermore, even the entrepreneurs that did not collaborate with Romanian entrepreneurs for developing new products, would like to act in this direction.
At the moment, we do not cooperate with any other entrepreneur, neither of Romanian nor Turkish nationality. [moment of thinking] But, in the future, it might represent a trend. I am interested in future collaborations with Romanian entrepreneurs active in the bakery industry, in order to launch new products.
We are always interested in finding out the consumers needs. We even collaborate with different Romanian enterprises in order to develop new products.
If one comes to Romania, he has to collaborate with Romanians…of course, if he wants to develop a profitable business. [smile] This is the market you act on.

128
Concluding remarks
The interviewed entrepreneurs developed their businesses immediately after immigration, alone or along with another member of their family, or another person of Turkish nationality from outside the family. The proficiency and expertise in the bakery area represented an advantage for older entrepreneurs, while the younger ones, mainly based their business on their entrepreneurial knowledge and skills and on their knowledge about the Romanian bakery market. The outlined business models were based on the existence of a production plant for bakery products, on their commercialization to resellers and also to individual clients through their own retail stores. The produced and sold bakery products were both with Romanian and Turkish character, in general, the first ones having the majority share in production. The inexistence of an ethnic market because of the quite narrow number of Turkish immigrants in Romania, implicitly in Bucharest, led the Turkish entrepreneurs with a very developed entrepreneurial spirit and motivated by a substantial income, to reorient their business in a way in which the main targeted clients were Romanians. The targeted clients by the interviewed Turkish immigrants were all persons of all nationalities, but mainly Romanians - that purchased both Romanian and Turkish bakery products - and Turkish immigrants. Furthermore, in case of the Romanian clients, the interviewed Turkish entrepreneurs aimed to raise awareness regarding the Turkish bakery products among them, to nurture their knowledge and appetite for Turkish bakery products; in this area, an important role play the representatives of the Romanian bakery industry. For a proper production of the bakery products, especially of those with Turkish character, the interviewed entrepreneurs had their suppliers of raw materials in Turkey, Bulgaria, or Italy; however, in general, the main suppliers were from Romania, especially from Bucharest. Also, along with the necessary ingredients, labour represented another important variable for a successful business model. In general, the employees of the interviewed entrepreneurs were of Turkish nationality or Romanians; the first ones were employed mainly because they possess special knowledge and expertise about the production process of the Turkish bakery products.
The outlined business models developed by the Turkish entrepreneurs had a great influence on the supply of bakery products in Bucharest, mainly through its diversification, by the introduction of new products, with Turkish character. Also, in general, the interviewed entrepreneurs cooperated with the other entrepreneurs active in the bakery industry in Romania, irrespective of their nationality, but mainly with Romanians and Turkish entrepreneurs. Among the main directions of collaboration with the other Turkish entrepreneurs, the collaboration in the area of bakery products recipe improvement, was aimed. In case of the cooperation with the Romanian

129
entrepreneurs, among other aspects, the development of new mixed recipes in order to produce new types of products (with mixed character, Turkish-Romanian) was aimed. Also, even the interviewed Turkish entrepreneurs that did not cooperate with Romanian entrepreneurs in order to develop new products were opened to future collaborations in this direction. This way, the assortment will develop more, implicitly the supply will be more diverse, emphasising the influence model of migration on the supply of bakery products in Bucharest. Thus, as a final conclusion, it can be assessed that, irrespective of the existence of collaboration between the interviewed Turkish entrepreneurs and the other entrepreneurs active in the bakery industry in Bucharest, the investigated immigrant entrepreneurs contributed to the diversification of the supply specific to this market. Implicitly, migration marked the supply of commodities on the bakery market in Bucharest.
Acknowledgements
This work was supported from the European Social Fund through Sectorial Operational Programme Human Resources Development 2007 – 2013, project number POSDRU/159/1.5/S/142115, project title “Performance and Excellence in Postdoctoral Research in Romanian Economics Science Domain”.
References
Basu A., 2006, Ethnic minority entrepreneurship, in: Casson M, Yeung B, Basu A & Wadeson N (eds.) The Oxford Handbook of Entrepreneurship, Oxford University Press, New York, pp 580-600.
Bodvarsson O.B., Van den Berg H.F., Lewer J.J., 2008, Measuring immigration's effects on labor demand: A reexamination of the Mariel Boatlift, Labour Economics, 15(4), 560–574.
Bodvarsson O.B. & Van der Berg H., 2009, The Economics of Immigration. Theory and Policy, Springer-Verlag, Heidelberg.
Constantin D.L., Goschin Z., Drăguşin M., 2008, Ethnic entrepreneurship as an integrating factor in civil society and a gate to religious tolerance: a spotlight on Turkish entrepreneurs in Romania, Journal for the Study of Religions and Ideologies, 7(20), pp 49-79.
Hercowitz Z., Yashiv E., 2002, A Macroeconomic Experiment in Mass Immigration. http://www.econstor.eu/bitstream/10419/21482/1/dp475.pdf, accessed 10 September 2013.
Jones C., Leishman C., Watkins C., 2004, Intra-Urban migration and housing submarkets: theory and evidence, Housing Studies, 19(2), pp 269-283.

130
Kancs d'A., 2011, The economic geography of labour migration: Competition, competitiveness and development, Applied Geography, 31(1), pp 191-200.
Kindler M., Szulecka M., 2013, The Economic Integration of Ukrainian and Vietnamese Migrant Women in the Polish Labour Market, Journal of Ethnic and Migration Studies, 39(4), pp 649-671.
Kitching J., Smallbone D., Athayde R., 2009, Ethnic Diasporas and Business Competitiveness: Minority-Owned Enterprises in London, Journal of Ethnic and Migration Studies, 35(4), pp 689-705.
Lach S., 2007, Immigration and Prices, Journal of Political Economy, 115(4), pp 548-587.
Linton A., 2002, Immigration and the Structure of Demand: Do Immigrants Alter the Labor Market Composition of U.S. Cities?, International Migration Review, 36(1), pp 58-80.
Miera F., 2008, Transnational Strategies of Polish Migrant Entrepreneurs in Trade and Small Business in Berlin, Journal of Ethnic and Migration Studies, 34(5), pp 753-770.
Pajo E., 2008, International Migration, Social Demotion, and Imagined Advancement: An Ethnography of Socioglobal Mobility, Springer Science+Business Media LLC, New York.
Pemberton S., 2009, Economic Migration from the EU 'A8' Accession Countries and the Impact on Low-demand Housing Areas: Opportunity or Threat for Housing Market Renewal Pathfinder Programmes in England?, Urban Studies, 46(7), pp 1363-1384.
Pemberton S., Scullion L., 2013, The Policies and Politics of Managed Migration: Exploring Mature Labour Migration from Central and Eastern Europe into the UK, Journal of Ethnic and Migration Studies, 39(3), pp 443-461.
Penaloza L., 1994, Atravesando-fronteras border crossings - a critical ethnographic exploration of the consumer acculturation of mexican immigrants, Journal of Consumer Research, 21(1), pp 32-54.
Săseanu A.S., 2005, Strategii manageriale în industria de panificaţie, MATRIX ROM, Bucureşti.
Săseanu A.S., Petrescu R.M., Voica D., 2009, The bakery industry – a favourable environment for the Romanian entrepreneurs. http://steconomice.uoradea.ro/anale/volume/2009/v2-economy-and-business-administration.pdf, accessed 4 May 2013.
Săseanu A.S., Petrescu R.M., Zgură I.D., 2011, Research Concerning the Romanian Immigrants Owners of Grocery Stores with Romanian Food Products in Andalusia, Spain, “Ovidius” University Annals, Economic Sciences Series, XI(2), pp 1175-1180.
TIAD, 2011, Romania - Businessmen and investors guide. TIAD, Bucharest.

131
Susanne Gruber educating D iplomats in Commodity Sciences at t he k. k. Consular-Acade my
EDUCATING DIPLOMATS IN COMMODITY SCIENCES AT THE K. K. CONSULAR-ACADEMY
Susanne Gruber
Forschungsverein Warenlehre Association for research in Commodity Sciences, Austria
E-mail: [email protected]
Introduction
The Oriental Academy was founded in 1754 on the basis of an Imperial Order by empress Maria Theresa. The Academy's initial purpose was to enhance Austria's position in the Balkans and the Near East by improving the nation's trade and cultural relations. The curriculum emphasized oriental languages such as Persian, Arabic and Turkish as well as political sciences and general sciences in order to educate diplomats and merchants. In 1898 the commercial education was added to the offered courses. (US Embassy, 2004, p. 3)
In addition field trips were organized to trading companies, factories and mines, especially to complete the commodities museum with product samples. (US Embassy, 2004, p. 13). In the 1930's education was enlarged with trade geography, product technology and industrial engineering science. (US Embassy, 2004, p. 14)
During the Second World War in September 1942 the Consular Academy moved to the site of the University for World Trade, and thereby the equipment, the storage and the collections of scientific study materials were transferred to the Commodities Collection of the Institute of Technology.
History of the Viennese Commodities Collection
The emergence of the well-known Viennese Commodities Collection at the Technical Museum Vienna dates back to the Vienna International Exhibition in 1873. Numerous samples and raw materials from the Vienna International Exhibition and later objects from the Oriental Museum (k. k. Orientalisches Museum) were largely unknown on the European market at that time, and thus had a high commercial value.

132
The collection of the Commercial Museum (k. k. Österreichisches Handelsmuseum) was continuously enlarged with valuable exhibits such as carpets, silken clothes as well as metal and ceramic wares. In 1922 the collection was transferred to the University of International Trade and Commerce. From the beginning of the 20th century to 1971, this collection was enlarged to include 30,000 objects and was the largest collection of its kind all over Europe.
Often they originated from colonized countries in Africa and Asia at a time when the Habsburg monarchy did not have any colonies.
An especially noted and notable event was the 1892 acquisition of the famous Japanese collection of Heinrich von Siebold. (Handelsmuseum, 1900, p. 127). The arts-and-crafts-related collections of the Commercial Museum later were transferred to the Museum of Applied Arts (Museum für Kunst und Industrie, today’s Museum für Angewandte Kunst), (Handelsmuseum, 1919, p. 10f) to the k. k. Natural History Museum (its collection is housed by today’s Worldmuseum, former Ethnological Museum, Völkerkundemuseum), as well as to the Technical Museum Vienna (Technisches Museum Wien). (Ministry for Trade, 1924).
Today, these 'Siebold collection'-parts owned by them form the stock of the Asian collections of both the Worldmuseum and the Museum of Applied Arts.
The Establishment
In 1753 Chancellor Prince Wenzel Anton Kaunitz proposed the setting up of the establishment of an École des Langes Orientales to Empress Maria Theresa. Today the academy is the oldest in the world for preparation for posts and careers in international relations. Empress Maria Theresa personally approved the first eight candidates. (Pfusterschmid, 2008, p. 10).
"The Imperial and Royal Academy of Oriental Languages", founded on 1 January 1754 was incorporated into the University of Vienna as an annexe of the Philosophenstube of the University on Bäckerstraße in the first district. Since 1785 the Oriental Academy leased the Jakoberhof for more than a century. In the first period, the curriculum was of a grammar school, additionally with "noble" components of education, horse-riding, fencing, dancing, music lessons, etc. The preparatory training and the level of the subjects were raised and law and political studies incorporated into the curriculum. (Pfusterschmid, 2008, p. 11-12).
After 80 years the Academy had progressed the reform of 1833, where the entry requirement was the entire curriculum of a grammar school. The Academy now replaced a university education for those seeking a career as ministry officials or in the diplomatic corps. Until the end of the 19th century

133
the Oriental Academy produced outstanding educated Orientalists. Excellent documents and valuable writings and dictionaries were collected and translated which today preserved in the Austrian State Archives and at the University of Vienna. (Pfusterschmid, 2008, p. 13-14).
With the increasing industrialization of Europe and economic expansion overseas, interest in the training of the consular corps and of diplomats in commercial subjects grew. Contemporary the demand for a knowledge of Oriental languages diminished in favour of Serbo-Croat or Russian. This tendency was underscored by the rise of English, which was an optional subject at that time. With the help of the Japanese legation in Vienna, attempts were made to teach Japanese, but in the end Chinese was taught. (Pfusterschmid, 2008, p. 16-17).
New locations
At the beginning, the Academy did not have its own building but moved around different places in the university quarter. The growth in the number of pupils and therefore the search for classrooms for extended courses was solved by the merger with the institution 'Theresianum' in 1883. There the Academy was housed in the new built Academy Wing. (Pfusterschmid, 2008, p. 17).
The increasing demands of a training institute for the consular and diplomatic corps lead to a reorganization of the curriculum.
In 1838 the disciplines taught were oriental languages, juridical and political studies, French and Italian language and literature, Modern Greek, freehand drawing, calligraphy and horse riding. The focus in the studies was divided in juridical-political instructions and in language studies. (Starkenfels, 1839, p. 38-41)
From the Oriental Academy to the k. k. Consular Academy
It was not long, that the location in the Theresianum was not sufficient for the increasing demands of a training institute for the consular and diplomatic corps. At the end of the 19th century the requirement of a reorganisation of the curriculum increased. Oriental languages lost their previous pre-eminent position and the programme of the studies weighted to the economic interests of the Monarchy. The Common Foreign Minister of Austria-Hungary, Count Goluchowski, held a speech before the Hungarian Delegations on 20 November 1897 in which he stated “the 20th century will be for Europe a century of existential struggle in the commercial sphere and therefore consular functionaries will acquire an increased significance in ensuring the interests of the Monarchy”. Therefore a commission developed a new curriculum, that comprised a department to Oriental studies and a second one for the rest of the world. (Pfusterschmid, 2008, p. 18)

134
Figure 1. The Favorita – summer residence of Empress Maria Theresia,
Vienna. Source: Gryffindor, public domain, http://de.wikipedia.org/wiki/Datei:Neue_
Favorita_Vienna_Sept._2006_006.jpg, accessed 11 March 2014
The director of the Academy, Michael Freiherr Pidoll von Quintenbach, developed a fundamental reorientation of the training programme:
1. The preparation for practical service by maintaining the academic level of a university,
2. The central role of economics, while retaining the disciplines of jurisprudence, history and politics, with a corresponding reduction in language instruction;
3. The promotion of the independent work from students; and
4. The achieving an equilibrium between the courses.
In addition, he attached great importance to analytical abilities and to the concrete. The Academy became an international leader in its field, due to the small number of students, the educational facilities in the new building and avail itself of professors from the University of Vienna, one of the leading universities in the world at that time. (Pfusterschmid, 2008, p. 19)

135
Figure 2. The building in Boltzmanngasse 16, Vienna, today: Embassy
of the United States. Source: Bwag, Commons, http://de.wikipedia.org/wiki/Datei:US-
Botschaft_Wien.JPG, accessed 11 March 2014.
The new location of the k. k. Consular-Academy at Boltzmanngasse 16, in the 9th district of Vienna, was constructed from 1902 to 1904 by the architect Ludwig Baumann. (US Embassy, 2004, p. 7). The new building housed up to 50 students. It also had seven lecture theatres, examination halls, a library, a commodities museum, a billiard room, a skittle-alley, a reading room and a music room. (Pfusterschmid, 2008, p. 20) The new students were equipped with clothing, shoes, underwear and bed linen, as well as with the necessary text books, teaching materials and stationery. (Pfusterschmid, 2008, p. 20). The studies at the Consular Academy lasted five years. The daily routine for the students started at 7:00 am, lectures from 8:10 to 13:00 and from 15:10 to 18:00. Additional recreation activities such as dancing, horse riding and hunting were offered. (US Embassy, 2004, p. 9).
After the First World War, plans were made to close down the Consular Academy, but the Council of Ministers decided the continuation under the State Authority for Foreign Affairs. In 1921 the length of the studies was cut to two years. In 1926 the Oriental section was integrated into the Western section for budgetary reasons. The Academies professors and lecturers were

136
experienced specialists who had proven their expertise in the fields of public service or national economics. The Consular Academy enjoyed international reputation and many countries founded similar institutes on basis of the Academies studies. (US Embassy, 2004, p. 11)
The lectures and facilities
Figure 3. Class hour in French language at the k. k. Consular-Academy,
Vienna 1904. Photo: Unknown, Österreichische Nationalbibliothek, Bildarchiv L39762–C.
In 1935 the name changed to the "International Institute for Politics and National Economy". The studies included national economics, history of dogmatic theology, trade policy, trade geography, product technology, industrial engineering science, civil and criminal law, international law, and press and propaganda issues. Most students attended lectures in jurisprudence and political science at the university. (US Embassy, 2004, p. 15)
Scientific material was regularly exchanged between the Consular Academy and other institutions abroad, like the American Academy of Politics and Social Science in Philadelphia or with the Institut International de Cooperation Intellectuelle in Paris. Publications were exchanged throughout the world. (US Embassy, 2004, p. 11)
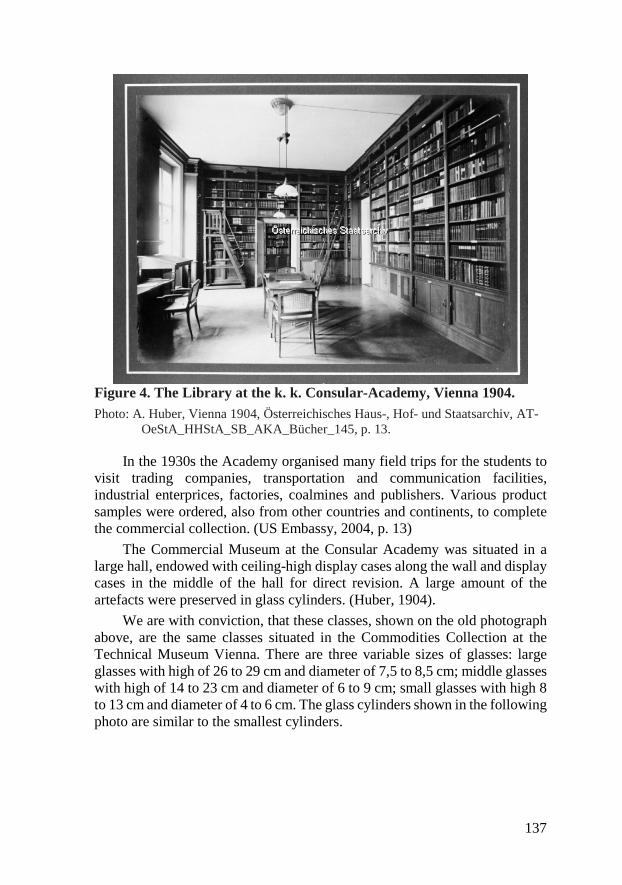
137
Figure 4. The Library at the k. k. Consular-Academy, Vienna 1904. Photo: A. Huber, Vienna 1904, Österreichisches Haus-, Hof- und Staatsarchiv, AT-
OeStA_HHStA_SB_AKA_Bücher_145, p. 13.
In the 1930s the Academy organised many field trips for the students to visit trading companies, transportation and communication facilities, industrial enterprices, factories, coalmines and publishers. Various product samples were ordered, also from other countries and continents, to complete the commercial collection. (US Embassy, 2004, p. 13)
The Commercial Museum at the Consular Academy was situated in a large hall, endowed with ceiling-high display cases along the wall and display cases in the middle of the hall for direct revision. A large amount of the artefacts were preserved in glass cylinders. (Huber, 1904).
We are with conviction, that these classes, shown on the old photograph above, are the same classes situated in the Commodities Collection at the Technical Museum Vienna. There are three variable sizes of glasses: large glasses with high of 26 to 29 cm and diameter of 7,5 to 8,5 cm; middle glasses with high of 14 to 23 cm and diameter of 6 to 9 cm; small glasses with high 8 to 13 cm and diameter of 4 to 6 cm. The glass cylinders shown in the following photo are similar to the smallest cylinders.

138
Figure 5. The Commodities Collection at the k. k. Consular-Academy,
Vienna 1904. Photo: A. Huber, Vienna, Österreichisches Haus-, Hof- und Staatsarchiv, AT-
OeStA_HHStA_SB_AKA_Bücher_145, p. 12.
Figure 6. Samples of textile fibres. Photo: S. Gruber, Vienna 2014.

139
Most of the objects and boxes with samples of commodities have labels with the imprint 'K. u. K. Konsular-Akademie', shown on the photo above. The name of the objects and in the majority of cases the manufacturers are written on the labels, additionally the inventory number. The relevance of the code, consisting of three numbers and one letter (A, B, C or D) is unidentified at the moment. On the basis of these labels and/or of the red cross signed on the objects the affiliation of commodities to the collection of the Consular Academy can be determined.
Figure 7. Sample of china clay, Karlsbader Kaolin Gesellschaft, Sodau. KA-Inv.-Nr. 416/35.
Photo: S. Gruber, Vienna 2014.
End of the Consular Academy and the new beginning
In 1938, after Hitler's troops crossed the Austrian border, the future of the academy was unclear. The length of the studies was three years and focused on three categories: Foreign Service, economic and trade studies and journalism. By adding two semesters of national economy or juridical studies at the university, the doctorate could be obtained, or post-graduate students could receive their diploma after one year's time. (US Embassy, 2004, p. 17)
In December 1940, 56 rooms were rent by the local SS Air Command to be occupied by medical cadets of the Air Force who stayed until 1942. In the last year of the Consular Academy nineteen languages were taught, in addition to National and International Law, Ethnology, National Economy, Trade, Studies of Product Technology, Commercial Geography, History, Diplomacy and Consular Science and Principles of Political Economy. (US Embassy, 2004, p. 19)
The Academy building was affiliated with the University of Vienna in 1942, and the academy itself, with the collections of scientific study materials,

140
moved to the site of the University for World Trade. The library with an inventory of 10,000 books moved to the Viennese Reichs-Archives. (US Embassy, 2004, p. 23). Finally in 1946, the large building on Boltzmanngasse was sold to the USA by the Republic of Austria. (Pfusterschmid, 2008, p. 29)
The Austrian Parliament decided to finance the reconstruction of the Consular wing of the Theresianum that had been destroyed in the war. After completion of the building the Foreign Minister Dr. Bruno Kreisky signed the document establishing the new Diplomatic Academy on 1 June 1964. The first Director Professor Dr. Ernst Florian Winter added subjects such as cultural policy, game theory and UN conference simulation to the curriculum. (Pfusterschmid, 2008, p. 30f)
Today the Diplomatic Academy of Vienna is a training institution offering postgraduate courses for university and college graduates of all disciplines partially in accordance with the University of Vienna. It was separated from the Austrian Foreign Ministry in 1996 and has been an independent public institution ever since. (Diplomatic Academy, 2014)
Conclusions
In the current research-project the two existing inventory-books of the k. k. Consular-Academy were digitalised and completely reviewed. Based on these informations the database of the collection shall get completed.
Towards digitizing the inventory-books, one aim of the project is to find out, in which case the collection was used in the courses for diplomatic students. Additionally, the structure of the collection will be reconstructed and the meaning of the code, written on the labels, should be resolved.
Acknowledgments
The results of our research are supported by funds of the Oesterreichische Nationalbank (Anniversary Fund, project number: 15587).
References
Diplomatic Academy: https://www.da-vienna.ac.at, accessed 14. April 2014
Embassy of the United States (Ed.), 2004, History of the Consular-Academy at Boltzmanngasse 16, Vienna 2004.
Handelsmuseum in Wien (Ed.), 1919, Das Handelsmuseum in Wien. Darstellung seiner Gründung und Entwicklung 1874 – 1919, Wien 1919.

141
Huber, A., 1904, Album of the k. k. Consular Academy, Österreichisches Haus-, Hof- und Staatsarchiv, AT-OeStA_HHStA_SB_AKA_Bücher_145.
K. k. Österreichisches Handelsmuseum (Ed.), 1900, Das k. k. österreichische Handels-Museum. 1875 – 1900. Wien 1900.
Ministry for Trade and Transport, 1924, Letter 19 February 1924, Archiv of Worldmuseum, Korr.-Nr. 78 (Praes 19.II.1924/Nr59/M).
Österreichische Nationalbibliothek, Picture library L39762–C
Pfusterschmid-Hardtenstein, H., 2008, A Short History of the Diplomatic Academy of Vienna, Training for international careers since 1754, Vienna 2008, p. 10.
Starkenfels, W. E. v., 1839, Die kaiserlich-königliche Akademie zu Wien, ihre Gründung, Fortbildung und gegenwärtige Einrichtung, Wien 1839.

142

143
Mariola Jastr zębska Recycling of glass polyester waste
RECYCLING OF GLASS POLYESTER WASTE
Mariola Jastrzębska
Gdynia Maritime University [email protected]
Introduction
In recent years there has been an increase in the use of composite products, particularly in the automotive, construction and marine industries. Frost & Sullivan expects that the marine composites market will grow to 200,000 tonnes in 2018 year (Jacob 2013). Composites like glass reinforced polyester have many advantages in the manufacturing of recreational boat. Composites enable 30-40% reduction in overall weight of boat in contrast to metal. Glass reinforced polymers accounted for more than 80% of overall maritime composites demand while unsaturated polyester and vinyl esters dominated among polymers. Despite the many advantages that composites are not recyclable. These materials cannot be heated and shaped once the polyester has cross-linked and cured, and they are termed thermoset.
In Europe, approximately 1 Mt of composites are manufactured each year. According to the European Composites Industry Association, 304 kilo tonnes of glass reinforced polymers waste are expected in 2015 (Jacobs 2011). The following options are potentially available for glass reinforced waste, in decreasing order of preference: waste minimization, reuse, recycling, incineration with energy recovery and landfill or incineration without energy recovery. The hierarchy of waste management routes appears to give preference to material recycling.
EU directive, 199/31/EC, prohibits the landfilling of material with more than 10% organic content. Potential techniques that could be in use for glass reinforced polyester waste include mechanical breakdown, thermal recycling as well as chemical recycling. The main concern is non-reprocessable glass thermosetting waste and it has been described in the literature ( Cunliffe, Williams 2003; Conroy, Halliwell, Reynolds 2006; Pickering 2006; Yang, Boom, Iron, Van Heerden, Kuiper, De Wit 2012). Recycling of polymer composites is an even more recent work generated in occurrence, with significant microwave pyrolysis, co-processing in a cement industry and material recycling.

144
Microwave pyrolysis glass reinforced plastics from wind turbine blades was the subject of project LIFE07 ENV/S/000904, which took place in Sweden and Poland (Akesson, Foltynowicz, Christeen, Skrifvars 2013). The project was the result of a partnership between Stena Metall AB, Univesrity of Barås, Stena Sp. z o.o. and Gisip AB. Pyrolysis is a process where an organic materials is heated in the absence of oxygen. In the project the waste was heated using microwaves what is more easily controlled. Using microwave pyrolysis to recycle glass reinforced polymers means that gas, oil and glass fibres are recovered. 1 kg of shredded wind turbine blades produces of 0.13 kg gas, 0.17 kg oil and 0.7 recovered glass fibres. The oil consists aromatic components such as styrene, toluene, naphthalene and has a caloric energy content of 36 MJ/kg, so could be used as a good fuel or a raw material in the chemical industry. Recovered glass fibres can be used as a reinforcement or as a construction material in road construction or landfill covering. The pilot-scale pyrolysis apparatus with 60 kW of microwave power, using three 20 kW magnetrons plus a 20 kW electrical heater has been constructed. The capacity was estimated at 100-150 kg/h in continuous flow. Disadvantage of this method is technically complicated equipment. Oxygen must not leak into reactor, while the pyrolysis gases must not leak out (Project LIFE Layman’s report 2011). The commercial viability of the process in Poland, however, remains to be proven. In our history polish entrepreneurs have bad experience with pyrolysis. Until 2007, installations were popular, where produce in processes of pyrolysis from thermoplastic polymers component slashed fuels (KTS-F). This component was added to motor fuel in Jasło Rafinery and was partially exempt form excise duty. After the expiry of the concession in 2007 almost all installations suspended processing.
Co-processing is both material and energy recycling and it is the use of glass reinforced polyester waste in the cement industry, as a substitute for fossil fuels and natural resources. The glass polyester waste may be used as alternative fuel in the cement industry. In 2010 years 1 mln tonnes of waste to replace standards fuel such coal, oil and gas (non-renewable) in Polish cement plant. Waste as alternative fuels enable cement manufactures to control production costs and improve environmental performance. The energy equivalent of 25 Mt of coal is required annually to service the demand for cement in Europe. In Cemex company plants in Poland 80 per cent of their energy requirements with alternative fuel such a rubber, animal meal, waste paper. Using glass reinforced polyester waste will have many environmental benefits: reducing the use of fossil fuels and decreasing emissions of greenhouse gases by replacing coal with waste. Of course it is necessary monitoring restricted substances like sulphur, chloride. The resultant emissions during the incineration of waste are controlled for protection human health and the environmental. Alternative fuels may contain harmful elements, such as Hg, Cd and Tl, that are heavily restricted; in some regions levels of

145
these elements must not exceed, more than 0.5 ppm. Other elements, such as As, Cr, Sn, Sb, Pb, Zn and Ni, may only be permissible in the range of 10 to 100’s of ppm. The disadvantage this method is that waste must be analysed to prevent illegal emission and changes in the process parameters. A complication arising from the use of glass reinforced polyester waste fuels is considerable variation that can occur in the composition of fuel batches. This makes it difficult to define a method for monitoring different samples using one type of reference material. The benefits of using glass polyester waste as alternative fuels provides a solution to some of society’s waste problems. The use of waste for production of cement does not influence the final product. The organic compound (resin) generates energy will be burned and the inorganic compound is transferred into material for cement production will be reinforcement in cement. We must remember that using waste is not “core business” of cement plants but good quality of the final product. The high investment is needed for magazine and feed system of waste. If waste will be coarser than coal than combustion of it takes more time. Limit the grain of glass reinforced waste is less than 30 mm. Happily glass polyester waste have less moisture than coal so decreased exhaust gas volume. Needs of cement plants of waste as alternative fuels regarding contracting issues are high quality, steady quality level, low prices, long term contracts, just-in time deliveries. Disadvantage is periodic production of leisure’s boats from glass reinforced polyester. On the contrary for producer of waste needs are low quality, flexible quality levels, high prices, short, flexible terms, steady deliveries. Detailed economic analyses has to be done, especially cost of shredding. Benefits using of glass reinforced polyester waste in cement are: large market and varied products, encapsulates waste so safer for future generations and can handle varied waste of filler/resin/fibre mix. But some risks exist like cement degradation due to alkaline attack on glass fibres and possibility of leaving voids over time, supply too low amount of waste for certain markets and need to certify waste before use.
Glass fibres in the waste contain a silica (55wt.%), calcium oxide (22 wt.%) and significant levels of sodium, potassium and magnesium. Whereas the high content of calcium in waste is an advantage in cement, high levels of sodium, potassium and magnesium can have harmful effects on the production process and cement quality. Potassium and sodium are alkalis and in cement, high alkali levels can, in the presence of moisture give rise to reactions with certain types of aggregates to produce a gel which expands resulting in cracking in concretes and mortars. Where there is sufficient sulphate present in the clinker, the alkalis are normally present as sulphates. Higher levels of alkali sulphates in cements affect the reactivity of cement, thus leading to possible setting problems (Chinyama 2011). By using composite waste in co-processing a significant reduction of CO2 emission about 0.9 kg CO2 –eq/kg composite of the cement manufacturing process can be obtained.

146
Material recycling which involves grounding of glass reinforced polyester waste to a recyclate that can be used as a new material with reinforcing properties in composite part and in other products that need reinforcement. It can also be used as filler. Thermoset composites in compare with thermoplastic composites are less likely to be recovered due to the nature of materials and the difficulties regarding to reuse of them. Glass fibre reinforced polyester partly lose their properties during aging and regrinding. The advantages of material recycling are:
• most readily available process
• most cost effective to start up and run
• some proven use in composite industry
• can be considered more friendly to the environment
• no chemicals
• no high temperatures
• low energy requirements.
Although the finer grade particles can be used to replace filler, leading to some modest performance improvement, the challenge still remains to find sufficient markets for the range of mechanically recycled grades. Improvement of mechanical properties has been obtained by using composite waste in base resin systems, concrete and thermoplastics. Thermoplastic matrix for waste has benefits such as low risk of adverse chemical reactions with recycled material, large market and varied products mostly unreinforced and process improvements are demonstrated in Europe. Research based on the adding composite waste to thermoplastic matrix shows some reduction of tensile strength and poor surface appearance what influence on market. The better effect was achieved after using recycled grades in cement.
Cement made with recycled composite waste has already been proposed in the literature (Tittarelli, Moriconi 2010; Asokan, Osmani, Price 2010; Ribeiro, Meixedo, Fiuza, Dinis, Meira Castro, Silva, Costa, Ferreira, Alvim 2011; Correia, Almeida, Figueira 2011). The possibility of re-using glass reinforced polyester waste in cement was investigated by Tittarelli and co-workers. Mortar mixture with cement to sand ratio 1:3 and water/cement of 0.5 were manufactured by replacing the 10%, 15% and 20% of aggregates volume with glass polyester waste. The results show that the waste caused a strong reduction in compressive strength (up to 25%) and in flexural strength. The reduction in mechanical performance was due to the fact that the strength of the polyester particles and the interface between waste and cement is lower than those of natural sand or calcareous (Tittarelli, Moriconi 2010). Recently experiments conducted by Asokan et al. (Asokan, Osmani, Price 2010) show that the replacing the fine aggregate by glass fibre reinforced polymers waste power (with substitution rate of 5% and 15%) may lead to considerable

147
improvements in concrete performance for both mechanical (compressive strength, tensile splitting strength) and durability (shrinkage, initial surface absorption and water absorption) properties. However, a previous study conducted by the same authors (Asokan, Osmani, Price 2009) found that similar replacement procedures were not so successful. Another recent study reported by Correia et all (Correia, Almeida, Figueira 2011) showed that a substitution of sand by glass fibre reinforced polymer led to a lower water/cement ratio and lower water absorption by immersion. After replacement the tensile splitting strength and modulus of elasticity were only marginally affected (2.7 and 3%) but the compressive strength suffered a noticeable loss (19.4%). The influence of two different glass reinforced polymer waste weight content (4% and 8%) in polyester based mortars were investigated by Riberio et all (Ribeiro, Meixedo, Fiuza, Dinis., Meira Castro, Silva, Costa, Ferreira, Alvim 2011). Compressive and flexural strengths of waste admixed polyester mortars increase with regard to unmodified mortars. The study showed the possibility to using glass reinforced waste to polymer mortars as potential construction materials.
Recently study conducted by Asmatulu et al. (Asmatulu, Twomey, Overcash 2013) show that the composite products appear to have better value if they are recycled or reused as composite structures rather than composite constituents (e.g. fibre, filler, reinforcement, etc.). The use of glass polyester waste in building materials industries is becoming increasingly important so the purpose of the presented work has been the adding of glass reinforced polyester waste as a filler to polyester composites with silica. The research examined the change in the composites characteristics such as: density, flexural strength and compressive strength.
Material and methods
The waste of glass fibre reinforced cold-cured polyester laminates was ground in a shredder manufactured by Kubala Sp. z o.o. The waste parts could be reduced in size smaller than 7 mm. The recyclate was a mixture of cured polyester resin particles (20%) and glass fibre (80%). E glass is commonly used for reinforcement in laminates and is based on an alumina-lime-borosilicate composition. Glass fibres used are 10-20 µm in diameter. The drawbacks of glass fibres are their low modulus, self-abrasive and poor adhesion to resin.
The materials used for the composites with glass reinforced polyester waste were:
– unsaturated ortophthalic polyester resin Polimal 109-32 K – manufactured by “Organika –Sarzyna” S.A. (Poland)
– initiator (methyl ethyl ketone peroxide)
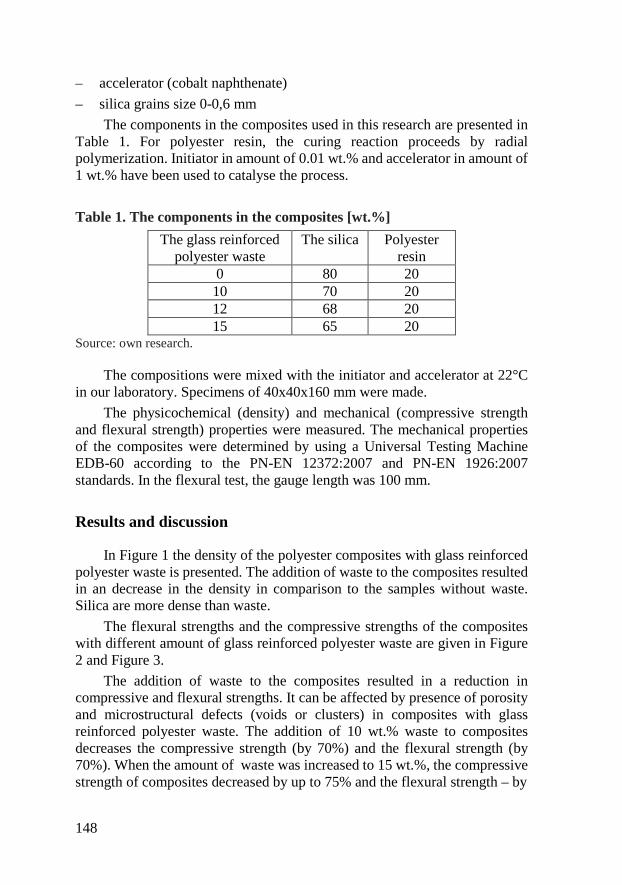
148
– accelerator (cobalt naphthenate)
– silica grains size 0-0,6 mm
The components in the composites used in this research are presented in Table 1. For polyester resin, the curing reaction proceeds by radial polymerization. Initiator in amount of 0.01 wt.% and accelerator in amount of 1 wt.% have been used to catalyse the process.
Table 1. The components in the composites [wt.%]
The glass reinforced polyester waste
The silica Polyester resin
0 80 20 10 70 20 12 68 20 15 65 20
Source: own research.
The compositions were mixed with the initiator and accelerator at 22°C in our laboratory. Specimens of 40x40x160 mm were made.
The physicochemical (density) and mechanical (compressive strength and flexural strength) properties were measured. The mechanical properties of the composites were determined by using a Universal Testing Machine EDB-60 according to the PN-EN 12372:2007 and PN-EN 1926:2007 standards. In the flexural test, the gauge length was 100 mm.
Results and discussion
In Figure 1 the density of the polyester composites with glass reinforced polyester waste is presented. The addition of waste to the composites resulted in an decrease in the density in comparison to the samples without waste. Silica are more dense than waste.
The flexural strengths and the compressive strengths of the composites with different amount of glass reinforced polyester waste are given in Figure 2 and Figure 3.
The addition of waste to the composites resulted in a reduction in compressive and flexural strengths. It can be affected by presence of porosity and microstructural defects (voids or clusters) in composites with glass reinforced polyester waste. The addition of 10 wt.% waste to composites decreases the compressive strength (by 70%) and the flexural strength (by 70%). When the amount of waste was increased to 15 wt.%, the compressive strength of composites decreased by up to 75% and the flexural strength – by
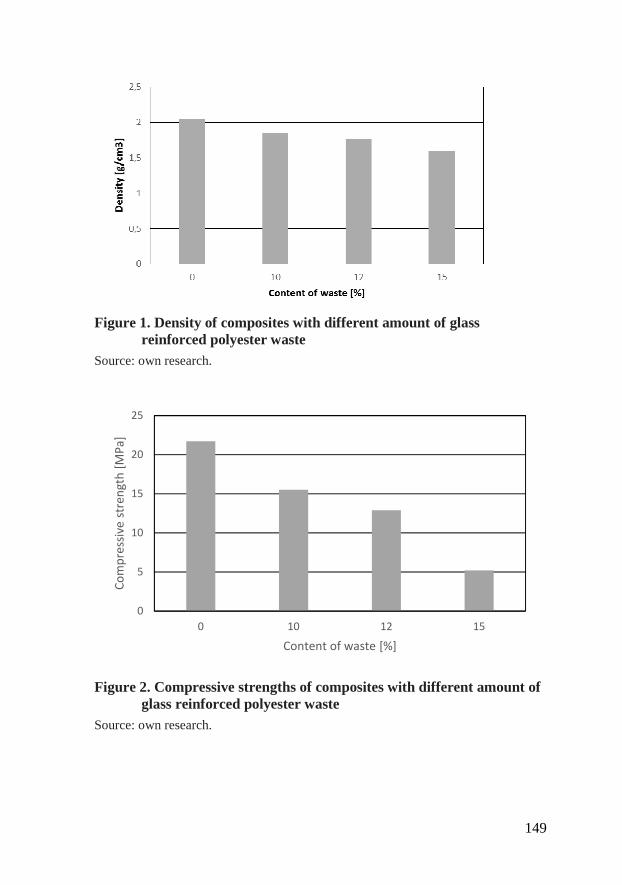
149
Figure 1. Density of composites with different amount of glass
reinforced polyester waste Source: own research.
Figure 2. Compressive strengths of composites with different amount of glass reinforced polyester waste
Source: own research.
0
5
10
15
20
25
0 10 12 15
Co
mp
ress
ive
str
en
gth
[M
Pa
]
Content of waste [%]

150
Figure 3. Compressive strengths of composites with different amount of
glass reinforced polyester waste Source: own research.
up to 60% compared to the properties of the sample without waste. Polyester resin was used to bond silica and waste. We expected that adding glass fibre reinforced polyester to improve strength of composites but the effect was opposite. Silica are in form of “flour” but waste particles are larger so there is no bond between waste and the polyester used. Large particles of waste are likely to reduce the strength of composites. The surfaces of silicas possess siloxane and silanol groups. Probably some macromolecules of polyester segments (polyol) were chemically bonded with –OH groups silica particles. Hydrophilic inorganic silica require modification to hydrophobic to promote the miscibility and interaction between hydrophobic organic polyester phases. Moreover strong interaction between the silica particles increases viscosity, which is not desirable in polyester composite processing. In earliest studies using of dolomite dust instead of silica in composites with waste gave better mechanical properties (Jastrzębska, Jurczak 2007). The compressive strength of polyester composites with dolomite dust has been found to increase 20% with addition of 10 wt.% glass reinforced polyester waste. Addition of recyclate allows also reducing production cost as a result of lower weight of materials and make easy to transport ready products.
The end-of-life option for glass reinforced polyester composites is increasing issue and landfill is becoming unacceptable methods of waste disposal. Producers need to take responsibility for manufactures to recycle glass reinforced polyester waste. The simplest method is material recycling, however the recycling process damages individual fibre and reducing the

151
mechanical performance. Furthermore, investigation into safety aspects in grinding glass polyester waste must be taken into consideration (for example the risk of fine dust particles causing respirator problems). Grinding requires energy input, which cost will be compensated by legislation for forbidding the landfill of glass reinforced polyester waste. The cost and the luck of markets were the main barriers to implantation of glass reinforced polyester waste recycling operations but the new legislation was the main driver towards recycling.
Conclusions
Glass reinforced polyester waste can be applied as a filler only in building materials, where mechanical properties are not main requirement, such as fence posts and plastics lumber. At a higher waste amount, the negative effects of waste are observed because a high amount of waste can create a restriction to obtaining high crosslinking density, thus leading to lower strength. Specific used of composites with glass reinforced polyester waste are: countertops, noise absorption material, wall/floor coverings, parking curbs, construction barricades, temporary traffic barriers, insulation material and garden ornaments.
When starting up a glass polyester waste recycling business, a number of aspects need to be considered like finding a satisfactory market for materials with waste. The recycling company achieves benefit when can charge a gate fee for the waste, which is only just lower than the disposal charge levied by the landfill operator. The starting of recycling company will be attractive when waste management legislation in Poland put more pressure on industry to address the option available for dealing with glass reinforced polyester waste. Waste management is becoming increasingly important within the glass reinforced polyester, especially with the continual implementation of EU directives concerning waste management.
References
Asmatulu E., Twomey J., Overcash M., 2013, Recycling of fiber-reinforced composites and direct structural composite recycling concept, Journal of Composite Materials, 0(0), 1-16.
Asokan P., Osmani M., Price A.D.F., 2009, Assessing the recycling potential of glass fibre reinforced plastics waste in concrete and cement composites, Journal of Cleaner Production, 17, 821-829.
Asokan P., Osmani M., Price A.D.F., 2010, Improvement of the mechanical properties of glass reinforced plastic waste powder filled concrete, Construction and Building Materials, 24 (4) 448-460.

152
Akesson D., Foltynowicz Z., Christeen J., Skrifvars M., 2013, Products obtained from decomposition of glass fibre-reinforced composites using microwave pyrolysis, Polimery, 58 (7-8), 582-586.
Chinyama M.P.M., 2011, Alternative fuels in cement manufacturing, Publishing Intechopen: http://cdn.intechopen.com/pdfs-wm/17593.pdf, accessed 26 March 2014
Conroy A., Halliwell S., Reynolds T., 2006, Composite recycling in the construction industry, Composites: Part A 37, 1216-1222.
Correia J.R., Almeida N. M., Figueira J. R., 2011, Recycling of FRP composites: reusing fine GFRP waste in concrete mixtures, Journal of Cleaner Production, 19, 1745-1753.
Cunliffe A.M., Williams P.T., 2003, Characterisation of products from the recycling of glass fibre reinforced polyester waste by pyrolysis, Fuel 82, 2223-2230.
Jacob A., 2011, Composites can be recycled, Reinforced plastics, May/June, 45-46.
Jacob A., 2013, US composites market on the up, Reinforced plastics, may/June, 37-39.
Jastrzębska M., Jurczak W., 2007, Environment-friendly recycling of marine craft made from glass-reinforced polyester, Polish Journal of Environmental Studies, 16 (3C), 26-28.
Project LIFE Layman’s report, 2011, Recycling of waste glass fibre reinforced plastic with microwave pyrolysis, LIFE07 ENV/S/000904, Publishing StenametallWeb: http://corporate.stenametall.com/PageFiles/16743/Project%20LIFE%20Laymans%C2%B4s%20report.pdf, accessed 26 March 2014.
Pickering S.J., 2006, Recycling technologies for thermoset composite materials-current status, Composites; Part A 37, 1206-1215.
Ribeiro M.C.S., Meixedo J.P., Fiuza A., Dinis M.L., Meira Castro A.C., Silva F.J.G., Costa C., Ferreira F., Alvim M.R., 2011, Mechanical behaviour analysis of polyester polymer mortars modified with recycled GFRP waste materials, Engineering and Technology 75, 365-371.
Tittarelli F., Moriconi G., 2010, Use of GRP industrial by- products in cement based composites, Cement & Concrete Composites, 32, 219-225.
Yang Y., Boom R., Iron B., Van Heerden D.-J., Kuiper P., De Wit H., 2012, Recycling of composite materials, Chemical Engineering and Processing, 51, 53-68.

153
Vladimir Kiselev, Yulija Syaglova, Larisa P ljushcheva C OMPETITIV E ADVAN TAGE OF THE GOOD S
COMPETITIVE ADVANTAGE OF THE GOODS
Vladimir Kiselev, Yulija Syaglova, Larisa Pljushcheva
Plekhanov Russian University of Economics. Russia [email protected]
Introduction
The growth of the commodity item in trade offer of modern retail companies that emerged in the last decade before the economic crisis period (2008-2012.) is accompanied by mild differences in their consumer properties (Kiselev, 2008). This has led to increased competition between manufacturers and suppliers of goods in the last link of the chain of goods movement - at the point of sale. Not having at their disposal an effective method to ensure competitive advantage for their products by non-price methods, producers and suppliers of goods seek to increase trade by price drop. The consequence of this widespread phenomenon (both in Russia and abroad) is the decline of the economic efficiency of the participants as the sphere of commodity circulation in general and retailers in particular.
Of course, this aggravate the effects of the economic crisis, and enters the retail industry in the cycle of systemic crisis. The escape of the current and future economic nightmare should be Shumpeterov's "storm of innovation" (Shumpeter, 1991), in production and in the distribution of goods.
Another consequence of the same phenomenon of the crisis is the decline of loyalty to the places of sales and brand image. The use of traditional commodity and technological tools to address these negative effects doesn't bring desired results to the participants of the sphere of commodity circulation.
These circumstances have led us to the necessety and feasibility of developing a conceptual approach that will effectively influence on the customers' attention to a specific product brand on the retailer's salesrooms, through effective visualization the point of sale.
In our study, we relied on known fundamental researches of DA Aaker, N.N. Borden, L. Bucklin, A.S.C. Ehrenberg, R.F. Lauterborn, A. Rives, Trout, E.H. Weber, etc.
In the series of commodity production, marketing paradigm emerged first as a distribution logistics (1902), combining efficient methods for goods in distant markets (Litman, 1902).
154
Much later, Professor Neil Borden (1964) developed this concept to understand that effective marketing activity producers needed though different, but the same tactical tools (Borden, 1964).
However, the economic markets, should increasingly based not on material flows and on the management of consumer perceptions of products. Thus, in the depths of the first marketing paradigm was born second paradigm. Prominent American professor Theodore Levit (1988) pointed out in this connection that the producer of commodities to increase sales efficiency should direct their efforts not to compel consumers to desire his goods, but forced himself to produce what consumers want (Levit, 1988).
In the context of this article, we note that the core of these efforts should be long-term and multifaceted relationship between the producers and the rest of the goods movement for providers, sellers, buyers, consumers, by means of which will be realized and attained mutually beneficial terms of trade. The most attractive conception for producers who want to start similar relationships, is the concept of «4C», proposed by Professor Robert F. Lauterborn (1990): Customer value, Customer cost, Convenience, Communication (Lauterborn, 1990). These four components producers should consider at the stage of design of the goods. Fundamental work Robert F. Lauterborn led to the formalization of the third, post-economic paradigm of marketing - relationship.
For a long time, this concept is not recognized as a new paradigm of marketing, but as one of its focus of the second paradigm. Professor Ian H. Gordon (1998) developed a second set of measures tactical marketing paradigm «4C» to «11C»: customer (buyer); categories (category); capabilities (features); cost, profitability and value (cost, profitability and value); control of the contact to cash process (monitoring of processes associated with the receipt of funds to the company from customers); collaboration and integration (cooperation and integration with customers); customization (the production of goods for individual orders); communications (communication with customers); interaction and positioning ( interact with customers and positioning); customer measurement (buyers to assess the profitability of the company); customer care (customer care); chain of relationships (chain relationships) (Gordon, 1998). As follows from the essence of the above instrument list, it is increasingly the focus of attention is oriented producers to consumers.
Elliott Ettenberg (2001) in his "Neoeconomics" formulates the name of the third paradigm (posteconomic) cut a long list of instruments proposed by Professor Ian H. Gordon to brief mnemonic formula «4R»: relationship, relevancy, retrenchment and rewards (Ettenberg, 2001). The main elements of the tactical complex, he suggested the following: building relationships (with clients), the importance of customers to the company, reducing unprofitable for the company customers and encouraging beneficial.

155
Genesis of post-economic prerequisites of relationship marketing paradigm began to emerge in the late twentieth century in response to the emerging while the growth of commodity production and the crisis of goods movement.
Interaction between participants of sales channels is their competitive advantage. Professor Peter Drucker called this economic paradigm "network society" (1991), due to the rapid expansion of trade networks (Drucker, 1991). Networking paradigm is characterized by the formation of partnerships, industrial companies, strategic alliances, inter-firm networks.
Formation of post-economic paradigm is accompanied by significant sales growth in the number of studies in the field of relationship management, which come to the fore, such non-economic categories such as trust, commitment to the relationship, communication, value. This created a new understanding of competitive advantages of trade offers - through the formation of intangible assets such as brands (value of trade marks in the minds of consumers), positioning (brand a special place in the minds of the target consumer audience), the creation of value (not good) to consumers, etc.
Advocate for the formation of these intangible assets was made Jack Trout, co-developed with colleagues Al Ries and Steve Rivkin concept of product positioning in the minds of consumers. According to this concept, the commercial offer should be accepted by consumers, so that it seemed to them a unique. In addition, consumers should differentiate trade offer from the other by themselves (Ries & Rivkin, 1985). Jack Trout etc. formulated the first principle of commodity production, "... It's better to be the first in the buyer's mind than on the market! ...".
It is fair to note that the concept of positioning, executed as an imperative of the new economy, was first proposed by advertising coryphaeus Rosser Reeves (1960) as the concept of «USP» (Unique Selling Proposition / Point), aimed at maximum consideration of the psychology of perception trade offer the target audience of consumers (Reeves, 1960).
Heuristic paradigm of relationships is an ongoing process of identifying and creating new values, together with our customers, and then co-production and distribution of the benefits of this activity between suppliers interaction. It involves understanding, focus management attention and ongoing joint activities suppliers and selected customers for mutual development and use of values through interdependence and adaptation of organizations.
To a great extent on the formation of the third paradigm of marketing are inspired by resource dependence theory (vertical integration of supply chains), developed by Professor Louis P. Bucklin(Bucklin, 1966), and network theory (penetrating cooperation as the primary way of organizing relations between the participants of networks), described by Professor Jagdish N. Sheth (Sheth, 1988).
156
A third paradigm of marketing involves direct participation сustomer in the value chain. It erases the boundaries between buyers and producers / suppliers. It will organize a new company, changes the system of staff incentives and seeks to transform all aspects of the Company's activities to more closely link its business processes with customers. Professor Paul Temporal (2001), published their joint work on the subject vividly outlined a paradigm of marketing "novel with the buyer," and valued the relationship between suppliers, vendors, customers and consumers - the world famous phrase «Je t'aime! (Fr.) " (Temporal, 2001).
Paradigm of the relationship can be defined as the process of identifying and satisfying customer needs better than the competition in order to achieve organization's goals. Producers create new value for customers and recognizes the key role of consumers in determining the value that they want.
Thus, the value is created with the consumers, and not for them. It was assumed that the definition of self determination and providence of this value because they are considered "goods" Producers, in line with its business strategy, and focusing on customers, build and coordinate their business processes, communication, technology and training to provide the value that consumers are willing to receive. They seek to build a chain of relationships between the company and its partners in the supply chain, including suppliers, intermediaries in the distribution channel.
The paradigm of the relationship found acceptance among scholars and practitioners in many countries and continents, including North America, Europe, Australia and Asia. Its scope is wide, includes a wide range of related industries sales, including distribution channels, marketing research, etc.
Based on the foregoing, we conclude that to date has all the objective conditions for a trade channels to really scale to apply the methods and principles of partnership between sellers and buyers / consumers.
Development of network theory of trade channels and customer relationships has led to the fact that their length was significantly increased, spreading to the entire global market. Product offering increases exponentially, reaching into one shopping complex of hundreds of thousands of commodity items.
At the end of XX century, there was a tendency of less effective marketing communications. It reflects changes in society: the growing role of information, the massive impact on society of the media, the increase in the consumption of consumer experience they purchase goods, the rising cost of communications.
Began to appear throughout the new modern format retail (shopping centers), which received marketing communications opportunities through specific determinants of the physical environment of the goods. Honored American professor Kotler, Philip (1973), one of the first identified one of the

157
attributes of goods atmosphere of the place of sale (Kotler, 1973). Later, Philip Kotler brilliantly predict - in communications with customers at point of sale should focus on customer experience by selling proposition (Kotler, 1984).
So formulated, new (the fourth) paradigm marketing, called The Experience Economy. Name of the new marketing paradigm later gave American consultants Pine II, B. Joseph & Gilmor, James H. (Pine & Gilmor, 1999). They predicted the evolutionary growth of the economic proposals from the physical attributes - to impressions: "... when a person is buying experience, it pays for the unforgettable moments of his life, prepared by the company, ie for their own feelings and emotions ... ". The market value of trading offer increases several times.
Thus, producers, suppliers and retailers need to focus on the experience that accompanies using of their products. The focus of empirical economics has become not only consumers, but also the behavior and emotional state at the time of using of the goods. That's what today should be concerned about the producers, whose products are currently in demand, or do not find it decidedly lost.
The last ten years the Russian economy as a whole has evolved rapidly. Grew up living standards. During this period, the real income of the population increased by half, one-third decrease in the number of people with incomes below the subsistence minimum. Achieved macroeconomic stability characterized by a decrease in the rate of inflation, stability of the national currency, the federal budget surplus and income growth of the budget system of the Russian Federation. Russia has, according to international experts, one out of four of the world's most dynamic economies (BRIC). In terms of GDP, calculated at purchasing power parity, ahead of Russia, countries, "eight", as Italy and France, and among the seven largest economies in the world. The accumulated foreign investment in Russia over the past ten years has grown to more than 7 times. Improving living standards, promote the development of "human capital", stated by the Russian Government as a priority, which gives a high and sustainable economic growth of the state.
Overcoming the economic crisis well for the Russian consumer market also implies a qualitative transformation of the market potential of the country, the foundation of which will be the introduction and dissemination of scientific and technological achievements. With a favorable course of innovation processes can form a new (innovative) model of economic development areas of the consumer market, which is a consequence of the transition to the dominance of items such as: information and communication technologies, the development of high-tech industries, the emergence of market innovation and intellectual property, the growing role of the human factor - as in respect of trade supply and consumption.

158
Innovations that provide competitive advantages of macro-and microeconomics, have a strong impact on the functioning of trade, lead to its greater transparency, the establishment of the integration process, control over the consumer market, to uniformity of norms and rules of supply and standardization requirements of the structure, the growth of foreign investment . Innovations "pumped up" a new energy trading sphere of subjects, form a competitive innovative unique selling proposition, a mutually beneficial relationship based on technological innovation.
Currently, there is a steady increase in the competitiveness of the economy of the home countries of multinational corporations (MNCs) - Leaders of innovative technologies in their industries and sectors. The consequence of this phenomenon is the decline in the economic performance of the participants as the sphere of commodity circulation in general, and the retail trade, in particular in those countries, including Russia, where innovation is not developed or nonexistent. This is especially tragic given the high importance at the present time the retail industry to the GDP of Russia (~19%)
Another consequence of the same phenomenon is the decline of loyalty to the places of sale and trade-marks, which show no innovation. The use of traditional marketing tools to eliminate these negative effects not bring participants sphere of commodity circulation desired result. Researchers explain the decline in performance, such as advertising, in particular: the growing number of advertising messages that emerged in the last five years, the lack of a mechanism for managing advertising of products in targeted market segments, both in quantitative and qualitative terms, reduced the credibility of Russian buyers to funds direct marketing, the rising cost of production and distribution of traditional channels of advertising messages, while their significant glut.
These circumstances have led us to the necessity and feasibility study on the nature of changes in consumer behavior and the development of a set of innovative communication tools that can effectively influence the behavior at points of sale. To do this, examine the reasons for the loss of efficiency of the existing marketing tools and allocate it the elements of strengthening the emotional perception of the goods sent on the salesrooms as a new value.
Russian consumer market during the crisis in 2009 with the significant drop in the level of consumer activity and turnover (-5.5% in the mass of commodities) and the slow progress of these factors in the current 2010 (forecast +4%). To rise to the former high level Russia need not only Shumpeterov's "storm of innovation" and innovative tsunami in trade, not only (and not so much) commercial type, and how much of the process of organizational types.

159
On the phases of the economic crisis and depression are prerequisites for the transition to the new technological principles of the development of innovation. This, in turn, requires large investments in not only update the fleet of existing facilities, but also the formation of new markets, such as markets for innovation. Protracted global economic recovery, which lasted until the beginning of the new millennium, has confirmed the fact that the potential for economic development of the fifth technological system has run its course. It is time the sixth technological structure, while innovative breakthrough and application of advanced technologies, the emerging new Kondratiev's cycle. It's necessery to invest russian foreign exchange reserves in the new basic innovations, of the present sixth technological order, in the knowledge economy of the future, in its infrastructure and social programs.
In order to identify hundreds of such products, manufacturers and retailers need to create an image based on a unique set of emotions and experiences, through which goods reach the consumer. The economic crisis calls for sales of goods not in material form, and brought their emotions that bring pleasure to the consumers, the legend.
To do this is not enough traditional channels of marketing communications, of which the main source of information (90%) are visual images. Another 8% of all information necessary for an audio channel. The remaining three human senses: touch, smell, and taste account for only 2% of all the information received. In the efficiency of the 2% of the data is forecasted success full interaction with consumers at point of sale.
Innovative task of promoting sales of goods can be sent to the desired effect on the emergence of human emotions through effects on the organs of taste sensation?
Our study aims to examine the impact of the taste channel information on the trade offer to the point of sale to generate buyers emotional feelings. This is part of the scientific school "multisensory marketing communications at point of sale." Previously, it was found possible to influence human behavior through the influence of his senses by olfactory marketing communications (Kiselev, 2008).
Material and methods
In this study, the hypothesis was put on the possibility of adjusting the consumer a sense of value through the use of trade offer as a channel marketing communications taste buds man.
To achieve this goal the method Hall-Test. In this case, the discussion of perceived value to consumer snacks with different tastes: sweet, bitter, sour and salty. It was assumed that when exposed to different types of participants

160
in the discussion of taste, their emotional mood will change, which will lead to change and consumer behavior.
Results and discussion
Realizing the impact of such tools in the future will affect sellers of consumer solutions for the benefit of both sides of the buy / sell. The result will be an increase in the degree of involvement of the consumer in the process of purchase, as well as increase customer value and the perceived value of the product.
In discussing the value of trade in groups offers sweet candys, sour - jelly with a sharp sour taste, salty taste - roasted peanuts with salt, bitter - bitter almonds. In addition to the four groups were treated to snacks taste of this, another group of consumers has been allocated as a control. Members of this group discussed the value of the trade offer in a neutral setting without any taste influences.
Each group also offered to discuss trade offers different purposes. During the discussion, participants were treated to refreshments offered. To determine the type of emotional states parties were fixed in their questionnaires discussed their sense of value of trade offers. These feelings were both quantitative and qualitative. Quantitative assessment of the participants exhibited in a suitable price range for them, perceived at the time of refreshments snacks and quality - by describing arise when serving, snack options discussed emotional selling proposition.
The data obtained in this experiment were subjected to statistical analysis and correlation analysis.
Summarizing the data on the effect of taste to create emotional states of consumers, we can conclude about the correctness of such theories.
Thus, under the influence of a sweet taste in the discussion of the value of trade offer for 51% of the respondents have formed positive emotions, in this case - 13% of this kind of emotion manifested in the extreme, 23% of apparent negative emotions, in 26% of the emotional state has changed. Quantitative assessment of the value of the respondents trade offer such taste test was +50% ÷ +75% compared to the control group.
Sour taste less actively excites extreme positive emotions - 7% of the study population, 14% of respondents appeared negative emotions, the rest remained neutral emotional states. Quantitative assessment of the value of the respondents trade offer such taste test was +20% ÷ +600% compared to the control group.
Bitter taste caused 34% of the positive emotions, 16% - the negative, the others brought a taste neutral, calm emotional state. Quantitative assessment

161
of the value of the respondents trade offer such taste test was -28% ÷ +570% compared to the control group.
Salty taste is 48% of the panelists positive emotions, and the very positive development of interest in 9% of respondents, negative emotions have formed 19% of the participants, including 3% of respondents, felt the extreme negative emotional state, and the remaining respondents maintained a neutral emotional state. Quantitative assessment of the value of the respondents trade offer such taste test was -3% ÷ +90% compared to the control group.
Conclusions
Our studies suggest that the hypothesis of the possible use as a channel marketing communications human taste buds. With their help it is possible to adjust the emotional mood of the consumer, and the consumer a sense of value selling proposition.
For us, it seems obvious the fact that the taste and flavor of association handling emotions is little unexplored phenomenon, and still are numerous studies and experiments for the development of a complete, working methods, which would allow companies to more effectively identify and position themselves in the market.
However, as is evident by the fact that the sellers of products that succeed in establishing innovative methods of communication with customers at point of sale by the taste of messages will have a strong competitive advantage and thus greatly increase the loyalty of their customers.
Acknowledgments
The authors are grateful for the participation at various stages of this study Evgeny Kudrin and Evgenyja Murzina, who worked at the Department of Maketing & Advertising in the Plekhanov Russian University of Economics. Kemerovo Branch as candidates for a degree.
References
Borden, N.H., 1964. The Concept of the Marketing Mix. Journal of Advertising Research, 4(June): 2-7.
Bucklin, L.P., 1966. A Theory of Distribution Channel Structure. CA: Institute of Business and Economic Research. University of California.
Drucker, P.F., 2001. Management Challenges for the 21st Century. NY: Harper Collins Business.

162
Ettenberg, E., 2001. The Next Economy: Will You Know Where Your Customers Are? NJ: McGraw-Hill.
Gordon, I.H., 1998. Relationship Marketing: New Strategies, Techniques and Technologies to Win the Customers You Want and Keep Them Forever. NY: John Wiley & Songs.
Kiselev, V.M., 2008. Methodology of management of assortment of goods of commodity distribution networks. Achieving Commodity & Service Excellence in the Age of Digital Convergence, The 16th Symposium of IGWT. Korea. Suwon (Vol. 1), pp: 397-402.
Kiselev, V.M., I.N. Krasiuk and L.V. Pljushcheva, 2008. Management of consumer value perception at the Point of Sale. Achieving Commodity & Service Excellence in the Age of Digital Convergence (Vol. 2), The 16th Symposium of IGWT. Korea. Suwon, pp: 923-925.
Kotler, P., 1984. Dream Vacations: The Booming Market for Designed Experience. The Futurist, 18(5. October): 7-13.
Kotler, P., 1973. Atmospherics as a Marketing Tool. Journal of Retailing, 4 (49): 48-64.
Lauterborn, R.F., 1990. New marketing Litany: 4Ps Passe; 4Cs Take Over. Advertising Age, 1 (October): 26.
Levitt, T., 1988. The pluralization of consumption. Harvard Business Review, 66: 7-8.
Litman, S., 1902. Mechanism & Technique of Commerce. LA: University of California. Unpublished Manuscript., pp: Record series 9/5/29 Box 3.
Pine, B.J. and J.H. Gilmore, 1999. The Experience Economy: Work Is Theater & Every Business a Stage. Boston, MA: Harvard Business School Press. 1 ed.
Reeves, R., 1961. Reality in Advertising. NY: Knopf.
Ries, A., 1985. Positioning: The Battle for Your Mind. NY: Mcgraw-Hill.
Schumpeter, J.A. and R. Swedberg, 1991. The economics and sociology of capitalism. Princeton University Press.
Sheth, J. N., B. Mittal and B.I. Newman, 1999. Customer Behavior and Beyond. The Dryden Press, pp: 6-35.
Temporal P. and M. Trott, 2001. Romancing the Customer: Maximizing Brand Value Through Powerful Relationship Management. NY: Wiley.

163
Federica de Leo; Pier Paolo Migl ietta; Slađana Pavl inović Economics A nalysis of Marine Fisheries and Maricult ure in Croatia and Trade Balance with Ita ly
ECONOMICS ANALYSIS OF MARINE FISHERIES AND MARICULTURE IN CROATIA AND TRADE
BALANCE WITH ITALY
Federica de Leo1; Pier Paolo Miglietta1; Slađana Pavlinović2
1 Departament of Management, Economics, Mathemathics and Statistics, University of Salento, Italy
[email protected] 2 Faculty of Economics, University of Split - Croatia
Introduction
Fishery activities represent an important segment of Croatian economy since they are mostly export oriented. Gallegati et al (2011) and Vignes and Etienne (2011) analysed advanced forms of whole sale fish trading. Although several whole sale fish markets initiated to work in Croatia, nonfunctioning of the wholesale market for fish is a consequence of problems with fish trading in Croatia. Since Croatian GDP shows negative or slightly positive trends, improvement in any segment of economy has to be taken with particular attention. Fish trade in Croatia needs significant improvements. Thus, one of the aims of this paper is to describe the marine resources exchange network in Croatia.Since Fishery sector is above average in terms of export-import balance, it is necessary to explore the actual importance of such a trade. Thus, this paper evaluated the assumption that Italy is a significant Croatian marine fishery products trading partner.
Trade of unobservable goods may be limited due to the problem of information asymmetry. Marine fishery products in this case are in particular exposed to such a problem. Firstly, marine fishery resources are perishable goods dramatically affected by fishing and storage conditions. Secondly, as this is an export oriented industry, the lack of information about product origins and producer may deter final consumers from buying such a kind of products. This may cause an absence of trade. Certificates are tools sometimes used to reduce information asymmetry problems (OECD, 2011).
Short overview of databases used to obtain data on fishery sector and trade balance with Italy is presented in the following section. Caches and production of sea fish in Croatia is analysed in the third section. Trade balance

164
between with Italy and fishing fleet are presented in the fourth and the fifth section respectively. The paper concludes with analysis of fish market and final discussion.
Materials and Methods
In order to obtain an insight into fishery sector in Croatia, several databases were overviewed.
The main used data source is Croatian Bureau of Statistics (CBS) which annually publishes Statistical Yearbookwith basic data on fisheries regularly collected by Directorate of Fisheries of Croatian Ministry of Agriculture. Traffic of Seaport is occasional publication of the same institution which was used to analyse the density of fish ships traffic. Finally, CBS also publish annual data on export and import at 4-digit custom tariff which was used to study the trade balance of fishery products between Croatia and Italy. EUROSTAT data were used to compare total catches of Italy and Croatia. Croatian financial agency FINA dataset was used to obtain more insight in the size of fishery and fish processing business sector. Remaining data was collected from National Strategic Plan for Marine Development of Fisheries of the Republic of Croatia and Marine fishery act (NN 81/13).
Catches and Production of Sea Fish in Croatia
In this section we analyse structure and volume of fish and other marine commercial catches. The presentation is based on CBS and EUROSTAT data on fisheries. Lokar and Mason (2006) analyse Croatian fishing sector in less recent period.
The importance and share of marine fishery catches and production in Croatia can be seen in Table 1. Total fishery production in 2012 is slightly lower than 52 million Euro where majority of these amounts belongs to finfish. Production of freshwater and diadromous fishes is less than tonne, which can be neglected when compared to marine fishery production since freshwater and diadromous fishes take less than 500 kg, both in 2011 and 2012.
Value and volume of all subcategories of fish production has increased in 2012 compared to 2011. Since value per tonne has decreased also, one can conclude that a fall in value was sharper than a fall in volume.
Since freshwater and diadromous fish takes small portion of total fish catches in Croatia the remaining analysis focuses on marine fishery catches and production.

165
Table 1. Value and volume of fish production in Croatia
Value in Euro Tonne Euro/Tonne
2011 2012 2011 2012 2011 2012
Total fishery products
80.968.877 51.650.680 69.701 62.349 1.162 828
Finfish and invertebrates
80.937.771 51.631.903 69.701 62.349 1.162 828
Freshwater and diadromous fishes
9.445 3.701 0,4 0,39 23.612 9.489
Crustaceans and molluscs
10.460.041 8.472.378 1.635 1.782 6.398 4.754
Finfish 70.477.729 43.159.525 68.026 60.540 1.036 713
Source: EUROSTAT
Catch and production of sea fish and other marine species is presented in Table 2 and Figure 1. It needs to be mentioned that there is anecdotal evidence about unregistered marine fish catch in Croatia is rather large. Government subsidies on fuel for fishing boats significantly affected those numbers.
Table 2. Catches and Production of Sea Fish, Crustaceans, Oysters and
other Molluscs and Shellfishin Croatia (in Tonnes)
Year
Total fish catch and production in Tonnes
Pelagic fish Other fish Crustaceans
Oysters, other
molluscs and shellfish Total
Of that, Pilchard
2008 60.187 46.399 21.194 9.331 461 3.996
2009 66.619 53.659 28.815 9.137 529 3.294
2010 63.252 50.303 26.749 9.298 543 3.108
2011 77.759 66.618 46.051 9.026 505 1.610
2012 69.748 58.687 43.527 8.894 487 1.680 Source: CBS, Statistical Yearbook, 2013:277
Catch structure is presented in Table 3where it can be seen that in 2012 pelagic fish participates with more that 84% in total volume of fish catch. Species which dominates, as in pelagic fish catch, so in total fish catch, is Pilchard with 62,4% in total fish catch and production. The remaining catch mostly belongs to demersal fish. Share of crustaceans in total catch volume is less than 1% during the whole period.

166
Figure 1. Catch and Production of Sea Fish in Croatia Source: Croatian Bureau of Statistics, Statistical Yearbook, 2013
Table 3. Structure of total fish catch
Year Pelagic fish Other fish Crustaceans Oysers,
other mollusc and shellfish
2008 77,1% 15,5% 0,8% 6,6%
2009 80,5% 13,7% 0,8% 4,9%
2010 79,5% 14,7% 0,9% 4,9%
2011 85,7% 11,6% 0,6% 2,1%
2012 84,1% 12,8% 0,7% 2,4%
Source: Croatian Bureau of Statistics, Statistical Yearbook, 2013
Table 4. Chain indices of fish catch
Year Total fish catch and production
Pelagic fish Other fish Crustaceans Oysters,
other mollusc and shellfish
2009/2008 11% 16% -2% 15% -18%
2010/2009 -5% -6% 2% 3% -6%
2011/2010 23% 32% -3% -7% -48%
2012/2011 -10% -12% -1% -4% 4%
Source: Croatian Bureau of Statistics, Statistical Yearbook, 2013
Time trends in fish catch and production can be seen in Table 4 which contains annual relative changes in catch volume. It can be noticed that total catch volume increased almost by quarter in 2011 compared to 2010. This increase owes to a vast increase in pelagic fish catch in 2011 by 32% compared to 2010, while catch or production of other marine organisms records negative
0
10 000
20 000
30 000
40 000
50 000
60 000
70 000
80 000
90 000
2008 2009 2010 2011 2012
Ton
nes
Total
Pelagic fish
Of that, Pilchard
other fish
Vrustaceans
Oysters, other molluscsand shellfish

167
indices in 2011 compared to 2010. In 2012 compared to 2011, all fish catch categories register negative trends, except oysters and other molluscs and shellfishwhich can be explained by an increase in mariculture.
Value of purchased through first sale is presented in Table 5. Data on value followtrends detected by analysis of catch volume, so that value of purchased fish decreased in 2012 compared to 2011. Data included in Table 5 show the values in HRK since Croatia has only recently joined the European Union.
Table 5. Value of Purchased and Sold Fishing (includes river fish)
Year Fish, fresh or cooled
Crustaceans (not frozen), other water invertebrates
000 HRK % 000 HRK %
2008 379.914 97,16 11.089 2,84
2009 328.711 97,13 9.698 2,87
2010 277.278 99,55 1.240 0,45
2011 311.689 98,77 3.874 1,23
2012 302.029 99,06 2.874 0,94
Source: Croatian Bureau of Statistics, Statistical Yearbook, 2013:279
Subsequently fishery product trade between Italy and Croatia is analysed and in light of the recent Croatian accession to the EU.Table 6 compares the EU, Italian and Croatian volume of catch in Mediterranean within period 2008-2012. These values contain only the caches within Mediterranean, so that they refer mostly to southeuropean countries. It can be noticed that Italy participates in almost half of the EU catch in Mediterranean. While in 2008 Croatian catch is around 10% of the EU catch, in 2011 it represents one sixth of the EU catch. Even in the northern and middle Adriatic sea Croatian share in total catches is 30% (UNDP, 2012:21).
Table 6. Catches in Mediterranean in Tonnes live weight
GEO/TIME 2008 2009 2010 2011 2012 European Union (27 countries)
446.387 456.105 429.094 404.204 :
Croatia 49.011 55.365 52.397 70.534 63.599
Italy 221.652 239.564 228.211 210.591 195.839
Source: EUROSTAT
It can be noticed in Table 6 that Italian catch in 2012 was 3 times larger than Croatian catch. However, it can be seen in Figure 2 that Croatian catch demonstrates continuous growth and Italian catch demonstrates continuous

168
fall. Such trends can partly be a reason for a significant fish export from Croatia to Italy. Since Italian catches shrink, a shortage of domestic fish supply in Italy is compensated by import.
Figure 2. Catches in Mediterranean in Tonnes live weight Source: EUROSTAT
When aquaculture is compared ratios are slightly different. Volume of fish production from aquaculture in Italy is almost 10 times larger than in Croatia. In fact,mariculture in Croatia is far from sufficiently developed. There are large capacities for mariculturedevelopment along Croatian Adriatic coast. However, due to incompatibility with tourism activities and due to negative environmental impacts, mariculture sector remains relatively small.
Table 7. Production from aquaculture excluding hatcheries and nurseries in tonnes live weight
Year 2008 2009 2010 2011 2012
Croatia 16.387 16.329 15.686 17.189 13.921
Italy 157.865 162.325 153.626 164.127 - Source: EUROSTAT
Marine Vessels and Fishing Craft
Important aspects of the EU common fishery policy are member quotas in terms of fish fleet capacity which affects the catch volume and value.Table 8 provides data on the size of Croatian fishing fleet and tools.
Contrary to the trends in catch and production of sea fish, the trends in fishing fleet indicate that the number of vessels has increased recently, as well as total size of vessels measured in gross tonnage (GT) which is a measure
0
50 000
100 000
150 000
200 000
250 000
300 000
350 000
2003 2004 2005 2006 2007 2008 2009 2010 2011 2012
Ton
nes
live
wei
ght
Croatia
Italy

169
unit for the overall size of a ship which is grounded in the International Convention on Tonnage Measurement of Ships (1969).
The EU Common Fishery policy certainly affected the trends in Croatian fishing fleet since it size is taken into account in determination of national quotas. The data on fishing tools indicate that single and triple gillnets dominate by number.
In order to obtain closer insight into the level of equipment across vessels, the average size of vessels in GT, and average number or fishing nets per vessels is presented in Table 9. The equipment intensity of vessels seems rather
Table 8. Marine Vessels and Fishing Craft
Ships Total size of vassels,
GT
Fishing nets by type Drift nets
Single and triple gillnets* Number Trawl nets
Purse seine nets
2008 488 28.984 1.910 892 1.118 17.752.600
2009 445 31.236 1.850 841 1.011 17.630.200
2010 477 32.643 1.254 709 803 15.330.000
2011 420 32.300 1.254 842 756 12.028
2012 424 32.922 1.130 836 750 7.015
Source: Croatian Bureau of Statistics, Traffic of Seaports, 2011; *From 2011 Gillnets were presented in numbers, while till 2010 they were measured in metres
stable. An average vessel is equipped by 3 trawl nets, 2 purse seine nets, 2 drift nets and 17 gillnets. A slight increase in average vessel size in terms of GT is noticed in 2012 compared to 2011. Such a trend is not surprising knowing that Croatian fishing ships are rather small compared to the EU averages.
Table 9. Average size of vessel in GT, average number of nets by vessel
Ships Total size of vassels,
GT
Fishing nets by type Drift nets
Single and triple gillnets* Number Trawl nets
Purse seine nets
2008 59 4 2 2 36378 59
2009 70 4 2 2 39618 70
2010 68 3 1 2 32138 68
2011 77 3 2 2 29 77
2012 78 3 2 2 17 78
Source: Croatian Bureau of Statistics, Traffic of Seaports, 2011

170
Arrivals of fishing ships by ports are also analysed. According to CBS (Traffic in Seaports 2006-2010, 2011:49) in 2010, out of the total quantities of goods in the international traffic (8 321 thousand tonnes) loaded in the seaports of the RH, the most of them departed towards ports of Italy (52,4%).
The following table presents traffic in arrivals of fishing ships in Adriatic statistical ports where. Fishing shipsinclude fish catching and fish processing vessels, while a statistical port is composed of one or more ports, controlled by a single port authority.
Table 10. Arrival of fishing ships in statistical ports
Year 2006 2007 2008 2009 2010
Number of vessels 619 496 951 1011 1069
Thousand of GT 85 68 74 86 98
Average size of vessel in GT
137 137 78 85 92
Share of North Adriatic (in number of vessels)
65 76 80 71 71
Share of North Adriatic (in thousands of GT)
75 82 64 55 64
Source: NBS, Traffic of Seaports 2006-2010, 2011
There is an increasing trend in fish ship arrivals, both in number of vessels and GT. The most of arrivals happen in statistical ports of northern Adriatic (Counties: Istria, PrimorjeiGorskiKotar, and Lika-Senj). Previously, this share was even larger in terms of GT till 2008 when the trends reversed.
From comparison of arrived fishing vessel size in GT in Table 9 to the vessels in Croatian fishing fleet in Table 8 it can be noticedthat significantly larger fishing vessels arrive to the statistical ports than vessels contained in Croatian fishing fleet.
Trade Balance between Croatia and Italy
Fishing is a recognised exporting sector in Croatia where there is a trend to export expensive fishery products and to import cheap ones. Since one of the aims of this paper is to obtain an insight into relation between Croatia and Italy within fishery sector, the data on quantity and value of various fishery products are presented in Table11. More fish products are exported from Croatia to Italy than imported from Italy to Croatia, with exception of fresh fillets.

171
Table 11. The classification of products is based on custom tariff level 4.
Product Export/Import
2010 2011 2012
Tonnes 000 euro
Tonnes 000 euro
Tonnes 000 euro
Live fish Export 288 419 423 568 286 427
Import 25 1.489 36 1.684 31 1.515
Fresh or chilled
Export 10.189 20.165 11.701 25.652 10.224 23.026
Import 144 711 188 548 166 494
Frozen Export 529 440 1.855 1.625 1.392 1.309
Import 76 293 86 290 33 168
Fish fillets Export 21 68 18 58 40 172
Import 41 178 60 301 56 317
Dried/ salted
Export 6.172 13.763 5.909 12.847 2.152 5.467
Import 36 145 24 90 33 166
Crusta- ceans
Export 61 930 68 1.123 60 999
Import 86 602 127 985 117 923
Molluscs Export 534 1.765 564 2.444 634 2.516
Import 267 836 206 724 179 609
Source: Croatian Bureau of Statistics
Fish Market
In terms NACE classification of activities, the main economic activities related to marine fishing are contained in classes: 03.11 (marine fishing), 03.21 (marine aquaculture) and 10.20 (processing and preserving of fish, crustaceans and molluscs), 46.38 (wholesale of other food, including fish, crustaceans and molluscs) and 47.23 (retail sale of fish, crustaceans and molluscs in specialized stores). In 2013, there were 18, 10, 3, 15 and 1 registered firms in mentioned classes respectively, according to database of FINA (Financial Agency), a leading Croatian company for financial mediation. Those are firms which are obliged to submit annual financial statement to FINA and which main activity is one of the listed above. These data exclude fishing cooperatives and crafts. All mention firms (47 in total) are small ones except one medium-size firm.
Thus, fish processing sector is relatively small in Croatia (RH, 2013b:15). Traditionally, most of industry was based on canning (RH, where small pelagic fish was used as a raw material. In recent period, share of salted fish

172
and frozen fish production has been increasing. Most of the demersal special catch is distributed to the final consumers as fresh (RH, 2013b:15), that is, it is not used for processing.
There are 18 fishing cooperatives approved by Directorate of Fisheries of Croatian Ministry of Agriculture with total number of 443 members where some of the fisheries signal the capacities to become producer organizations (RH, 2013b:8).
Since the wholesale market places are established with difficulties in Croatia (the largest whole sale fish market in Rijeka had bankrupted), the trade channels of the marine fishery products are rather heterogeneous. For example, a significant share of the catches has been sold directly to the restaurants.
Thus, as we previously, mentioned. Most of the small pelagic fish is used as input for the fish processing industry or as a feed for tunas. Demersal catches are directed to the restaurants and market-places for the final consumption as fresh, or they are exported after the first sale.
Bush (2004) anylised the importance of fish trading networks. We mention here the main players of marine fish distribution network in Croatia. Beside professional fishermen, there exists a category of small-scale fishermen in Croatia which is not in line with the EU legislation, and thus it is going to be abolished. Fishermen are usually organized into fishermen cooperatives (RH, 2010) whose basic activity by NCA is fishing or aquaculture. Their aims are: common and organized access to the market, sustainable fishing, and production planning and adjustment to demand. Members of fishing cooperativeshave to sell 80% of their catch through cooperatives. First sale can be done to registered buyers only. First buyers are legal or physical personswho are registered at the register of first buyers (RH, 2013a).Other players who determine price and other trading conditions are processing companies, exporters, supermarkets, wholesale markets, big retail chains, fish market-places and final consumers.
The first contact of fish with mainland happens on a landing site. That is a part of port area, or exceptionally other place outside of port areas, used to unload fish and other marine organisms or other products resulting from commercial marine fishing. Next, the fish is directed to buyoff sites, selected objects in line with relevant food regulation serving for first fish and other marine resources fish sale to the first retail or wholesale buyer.The is a lack of necessary infrastructure which significantly determines market conditions, such as fishing ports, buyoff stations and whole sale markets. The lack of storage and cooling capacities limit the capacities of fishermen to adjust to demand. On the side of demand, lack of information is evident, so that one of the aims of National strategy plan for development of fisheries of the Republic of Croatia is improvement in transparency of the market for fish (RH, 2013b)

173
which would improve fishermen market position (DG Maritime Affairs and Fisheries, 2013)
Consumption of fish in Croatia is rather low taking into consideration that that Croatia is a country with very long coast. Lack of trust is one of the reasons for such a low level of consumption. The importance of consumer trust for fishery sector is discussed in Pieniak et al (2007).
Results and discussion
We find that pelagic fish dominates in total fish catch in Croatia which share demonstrated a dramatic increase in 2011. Crustaceans and other invertebrates participate with less than 1% of total first sale value in 2012. More fish products are exported from Croatia to Italy than imported from Italy to Croatia. Average size of Croatian fishing fleet vessel is much lower than the average fishing vessel size arriving to Croatian ports. Market trade is underdeveloped since whole sale markets do not function. Croatian fish processing industry consists of small firms, while the fishermen are organized into fishing cooperatives through which they sell most of their catch.
Conclusions
Croatian fish market is underdeveloped and Italy is important Croatian fish trading partner. Small capacities of Croatian fishing fleet as well as domination of small firms if fishery sector indicate that creation of additional value is needed along the fish market trade network. Good functioning of whole sale fish markets, additional storage and cooling capacities, as well as additional information provision about quality through certification can assure creation of additional value along the chain.
References
Bush, R.S. (2004): Scales and Sales: Changing Social and Spatial Fish Trading Networks in the Siiphandone Fishery-Lao PDR, Singapore Journal of tropical Gegraphy, 25(1):32-50
CBS (2011): Traffic in Seaports 2006-2010, CBS, Zagreb
CBS (2013): Statistical Yearbook, CBS, Zagreb
DG Maritime Affairs and Fisheries (2013): Common market organization: Knowing the market better to boost earnings, Fiseries and Aquaculture in Europe,no. 61, May 2013,4-7 available at: http://ec.europa.eu/fisheries/documentation/magazine/mag61_en.pdfaccessed 29 March 2014

174
Gallegati, M., Giulioni, G., Kirman, A. and Palestrini, A. (2011): What’s that got to do with the price of fish? Buyers behavior on the Ancona fish market, Journal of Economic Behavior and Organization, 80:20-33
Lokar, A.L. and Mason, M.C. (2006): A Market Overview of the Fishing Sector in Croatia, Transition Studies Review, 13(3):589-604
OECD (2011): Fisheries and Aquaculture Certification, OECD Publishing
Pieniak, Z., Verbeke, W., Scholderer, J., Brunso, K., and Olsen, S.O. (2007): European Consumers’ use of and trust in information sources about fish, Food Quality and Preference, 18:1050-1063
RH (2010): Ordinance on fishing cooperatives, in NN 48/10, Zagreb
RH (2013a): Marine Fishery Act, in NN 81/13, Zagreb
RHa (2013b): National Strategic Plan of Development if Fisheries, available at: http://www.mps.hr/ribarstvo/UserDocsImages/NSP/NSP_OP_06112013/1511OPNSP_ENG/National%20strategic%20plan%20for%20development%20of%20fishries%20of%20the%20Republic%20of%20Croatia.pdf accessed 29 March 2014
UNDP (2012): Croatian Marine Fishery: State and Perspectives, UNDP, Project Coast, Zagreb
Vignes, A. and Etienne, J.-M. (2011): Price formation on the Marseille fish market: Evidence from a network analysis, Journal of Economic Behavior and Organization, 80:50-67

175
Anatoliy Mazaraki, Grygoriy Pugachevskyi Commodity Science in the age of g lobalization
COMMODITY SCIENCE IN THE AGE OF GLOBALIZATION
Anatoliy Mazaraki, Grygoriy Pugachevskyi
Commodity Entrepreneurship Department, Kyiv National University of Trade and Economics
[email protected] Commodity Science and Nonfoods Examination Department
Kyiv National University of Trade and Economics
Introduction. Formation of Commodity Science
The opening and formation of above mentioned department happened during the period of the development of commodity production, which promoted the extension of trade relations, trade information exchange, the development of the methods of goods research, accumulation of information about the properties of the investigated commodity science objects. The investigated objects of the department were rare and specific products for pharmaceutical use, plant and animal origin. The department activity investigative results were of the information-descriptive character that is why this period in the history of commodity research was called descriptive as the first (early XVI century and to the early XVIII century).
The investigations at this stage were aimed at the research of pharmaceutical products properties, the purpose and methods of their usage. At this stage the basis of scientific commodity science and its essence were created, the areas of research were outlined which defined object, subject and task of commodity science as the scientific knowledge about goods.
Replacement of craft management for industrial production that took place at this stage, increase in trade volumes of Mediterranean States required the scientific information about goods and trade in particular, about product characteristics, commodity value of commodity science objects, methods of its estimation and formation in the process of production. These and other trends of scientific research have been already practiced in technical sciences in particular, in engineering sciences technologies.
This situation encouraged commodity exploration works to implement the technological methods of research in the commodity sphere. This was achieved because of the commodity production extension, using advanced

176
technological approaches and methods of investigation from the technological sphere into the commodity sphere. This period was usually called commodity and technological (early XVIII to the middle XX century) in the history of commodity science.
The second stage of development – commodity science-technological
At the second stage, the subject of investigation of wide range of objects is being extended: raw materials, semi finished products; methods and commodity research tools are being improved; processing and generalization of the experiments results are being made. Commodity science is enriched by the information base, computer technology, etc. At this stage, departments and laboratories considerably increase the volumes of research of raw materials and finished goods features while preparing to the solving of problems of quality products.
The third stage. Commodity science in market conditions.
The third period of commodity science development in Ukraine is connected with the origin and development of capitalism (approximately from the 20s of XX century).
Characteristic features of this stage were: the subsequent development of commodity science, the opening of new commercial educational establishments, increasing the training of specialists for trade, evolving and development of international ties of specialists - commodity experts, formation of international societies of scientists - commodity science.
The event of international significance took place in 1978 in Austria in Vienna. The International society – of commodity science and technology IGWT was organized and open there. Since that time and up to present every two years in the countries of – IGWT members the international forums, devoted to the development of commodity science, are being held.
Regular XVIIIth IGWT Symposium was held in Rome (Italy) in September 2012. The topic of Symposium was «Technology and Innovation for a Sustainable Future: a Commodity Science Perspective». The analysis of topics and trends of Symposiums, that were held during the last 10 years testifies to the fact that IGWT, national divisions, namely Ukrainian Society of Commodity Science and Technology use global approaches, incident to the current commodity science. The modern stage of commodity science development is of globalization character.

177
The current stage of commodity science development – globalization
The objects of commodity science at this stage should be the commodity categories of knowledge that surrounds the human environment, which compose the human living conditions and sustainable development.
The globalization of commodity science objects relates to both the unusual expansion and strengthening the role of the subject.
The problem of quantitative provision of market and different sectors of goods consumption is practically solved.
Consumers of different categories are first of all interested in the quality of commodity science quantitative objects, which is defined in terms the subject study.
This provision is confirmed by global approaches chosen and discussed at the XVIIIth IGWT Symposium in Rome. Among them:
– Commodity science, technology and chemistry.
– Product quality, safety and traceability and consumer information.
– Consumer information and protection.
– Business ethics and corporate social responsibility.
– Quality management.
– Environmental management tools.
– Natural resources exploitation.
– Research and development.
– Energy, waste management and sustainability.
References
Alekseyev N.S., Gantsov S.K., Kutianin G.I., 1988, Theoretical basics of nonfoods commodity science, Moscow, Economics, USSR.
Alekseyev N.S., Zaitsev V.G., Kutianin G.I., 1975, Introduction to commodity science of industrial goods, Moscow, Economics, USSR.

178

179
Roberto Merli, Ilaria Massa, Maria C laudia Lucchetti High Frequency Trad ing: Technology, Regulation and Ethical Issues
HIGH FREQUENCY TRADING: TECHNOLOGY, REGULATION AND ETHICAL ISSUES
Roberto Merli 1, Ilaria Massa2, Maria Claudia Lucchetti1
1Department of Business Studies, Roma Tre University, Italy [email protected]
2Management Department, “Sapienza” University of Rome, Italy
Introduction
The significant development of IT enabled the employment of algorithmic trading (thereafter AT) allowing market operators to have remote access to a variety of trading venues not needing to be physically present. AT involves the use of computer software operating on the basis of key parameters in order to optimize trade execution through the reduction of buy-sell decisions impacts (Chlistalla 2010). Investment firms or their clients can automatically generate orders to trading platforms in response to market changing due to relevant information identified through their key parameters. Over the last years, the use of these algorithms for the ‘straightforward order execution tasks’ has increased. High frequency trading (thereafter HFT) is AT subcategory, and it is characterized by the ability to give effect to a large amount of orders at very high speed, with a ‘round-trip’ of the execution time input on the order of milliseconds. The aim is to benefit from market liquidity imbalances or small pricing inefficiencies. HFT success critical aspects are therefore related to the ability to dramatically reduce latency and taking advantage from small temporal differences in price data transmission. Fast market access by some participants entails intermediation costs reduction (Biais & Foucault, 2014), though it is source of adverse selection. Firms provided with HFT technology are able to adopt the best trading strategy as they can have access to market data slightly before the other market participants (Capgemini, 2014).
In 2011, the International Organization of Securities Commissions (thereafter IOSCO) report highlighted HFT contribution to innovation and improvement of market efficiency . However, the report emphasizes the presence of the negative effects that technological developments may have on market quality, such as excessive volatility of the processes or lack of transparency. European Security and Market Authority (thereafter ESMA) has issued guidelines that provide for disclosure requirements for both market
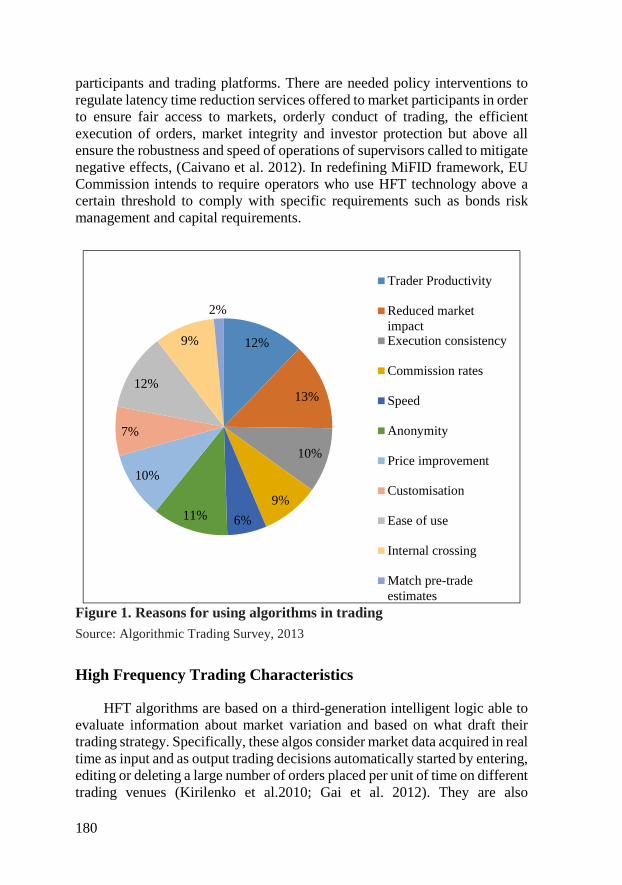
180
participants and trading platforms. There are needed policy interventions to regulate latency time reduction services offered to market participants in order to ensure fair access to markets, orderly conduct of trading, the efficient execution of orders, market integrity and investor protection but above all ensure the robustness and speed of operations of supervisors called to mitigate negative effects, (Caivano et al. 2012). In redefining MiFID framework, EU Commission intends to require operators who use HFT technology above a certain threshold to comply with specific requirements such as bonds risk management and capital requirements.
Figure 1. Reasons for using algorithms in trading Source: Algorithmic Trading Survey, 2013
High Frequency Trading Characteristics
HFT algorithms are based on a third-generation intelligent logic able to evaluate information about market variation and based on what draft their trading strategy. Specifically, these algos consider market data acquired in real time as input and as output trading decisions automatically started by entering, editing or deleting a large number of orders placed per unit of time on different trading venues (Kirilenko et al.2010; Gai et al. 2012). They are also
12%
13%
10%
9%
6%11%
10%
7%
12%
9%
2%
Trader Productivity
Reduced marketimpactExecution consistency
Commission rates
Speed
Anonymity
Price improvement
Customisation
Ease of use
Internal crossing
Match pre-tradeestimates

181
characterized by the production of high volumes of transactions due to low profit margins per transaction.
Sudden changes in placed orders are used to adapt strategies even to minor changes in the market (Hasbrouck & Saar 2012). This ability derives from specific operational and technological characteristics. Operational characteristics are (Fabozzi et al. 2009, SEC 2010 ):
• Usage of sophisticated and high speed computer programs to purse a number of different strategies, generating, rotting and exchanging orders;
• Usage of individual data feeds from exchanges as well as collocated servers in order to minimize network latency;
• Maintenance of very short timeframes for establishing and liquidating positions;
• High daily portfolio turnover and a large number of order submissions that are cancelled compared to executed trades;
• Maintenance of overnight positions;
• Enter into short-term position and end the trading day flat.
– These operating characteristics are due to the use of specific technologies that consist of (Capgemini, 2014):
• Replacement of copper cables with optical fibers to reduce information transmission speed
• Bandwidth that allows you to transfer up to 10 gigabits of data per second
• Field Programmable Gate Arrays (FPGAs), integrated circuits that implement complex logical figures to reduce latency
• Multi-core process, which consists in different processors working on a single computer component and performing different tasks at the same time
• Co-located servers. Market participants and data vendors can lease racks and place servers close to market platforms to reduce the physical distance between trading servers and exchange servers. (Physical distance reduction can also be achieved by central proximity hosting system which differs from the co-location because spaces are provided by third parties).
Investments in technologies to reduce latency is the main entry barriers for firms interested in doing business using HFT. Other relevant costs are those for constantly updating algorithms. The system must be able to interpret market orientations and to review strategies on the basis of changes in the correlation among different factors such as price, interest rates and any events that can significantly influence the market. Moreover, algorithms short utility period requires permanent upgrade procedures. When HFT is used, it becomes easily decipherable by competitors, causing loss of competitiveness for the

182
company that had originated it. Finally, updating algos allows the monitoring and the correction of any errors or improprieties that might spoil the market.
Method of detection of HFT in markets
Currently, there are three categories of HFT firms: independent firms, broker-dealers and hedge funds (Capgemini, 2014). However, it is extremely difficult to identify those who resort to use HFT among all market participants (IOSCO, 2011). Only a few countries developed strategies to tell apart HFTs from other low speed algorithmic trading (Caivano et al., 2012). Estimated current levels of HFT deployment is provided by the private sector.
Among the approaches currently used to identify high frequency traders (thereafter HFTr) it possible to distinguish:
Direct Method: HFTr are identified by information provided by the operators themselves who carry out proprietary high speed trading. This method does not identify traders who do not use HFT primarily.
Indirect Method: HFTr identification is based on the presence of specific operational criteria (e.g. low inventory at the end of the day, low variation in inventory positions). However, depending on the criteria, there are likely to keep out some HFTr.
Strategic Method: HFT strategies are identified through the analysis of a large amount of data in order to pick up entry, modification and cancellation flows of orders. This can lead to strategic approach disadvantages related to the large amount of resources needed to carry out the collection and analysis of data. Moreover, the present inability in identifying all HFT possibly strategies could lead to the erroneous inclusion of operators that do not use high speed systems, and vice versa.
HFT Strategies
High speed trading consist in technical tools usable in a wide range of strategies. Very often, HFTr do not implement new trading strategies but they implement strategies that have already been distributed in the market employing fast computer technology (Angel & McCabe 2013; Biais & Foucault 2014). This is the case of “market making strategy that involves continuously posting passive orders on both sides of the order book in order to offer liquidity to other market participants and earning the spread” (IOSCO definition). Market making is useful as it aims to reduce bid/ask spread prices. Increasing competition among market makers enables offering competitive prices. Operators who can act quickly have great advantages over other participants. Fast traders are able to capture more opportunities and to profit before the spread is too much reduced (Foucault, Kadan & Kandel 2013).

183
HFTr due to their operating speed can place their proposal at the top of the column of order (front-running), discouraging traditional market makers to participate in the market and threatening to create temporary illiquidity phenomena. This ‘predatory’ behavior has the predictable consequence of market participants confidence erosion (Bhupathi 2010). Another strategy is statistical arbitrage. Statistical arbitrage aims to make profit of short-term price movements. Rather than to respect the historical prices trends, traders simultaneously buy and sell securities for which the temporary movement of prices is due to technical reasons. It might seem that the validity of this strategy is based on the ability to discover mathematical relationships of market prices, but success is not necessarily due to the development of a good model. This is actually determined by the ability to perform the highest number of transactions in terms of timing and cost efficiency. Statistical arbitrage strategies involve many risks
Model risk: it is related to computer models defaults. It may happen that an operative damage can influence other HFTr behavior. Because HFTr cross-market operations, defaults can negatively impact the entire market.
Liquidity risk: it is involved when statistical arbitrage strategies are implemented on low liquidity stocks where violent price fluctuations may hinder the closing of positions at a loss.
Operational risk: the opening of a large number of transactions involves a general operational risk that can spread its effects in extreme market conditions or in case of malfunctioning of systems running.
HFT Effects
Theoretical and empirical contributions on HFT impacts on the financial markets provide manifold results. The high dynamics of HFT entails difficulties in isolating the effects that tightly depend on strategies in which they are employed.
Main benefits of HFT use
Market efficiency is expressed by price capacity to reflect fast and accurately market information. This is known as the ‘news reaction’ mechanism. Markets need to respond quickly to news, and for this reason, market participants devote significant resources to information collecting and analyzing processes. HFT make price updating in short-term possible, improving market through all available information incorporation. Speed has a key role in incorporation phase (Angel & McCabe 2013). In fact, the capacity to quickly process information relevant for the market enables HFTr to return to the market the necessary information for equilibrium price

184
formation, helping to speed up the entire adjustment process (Baron, Kirilenko & Brogaard 2012). While the increased access to information promotes the formation of the price, on the other hand the fear of offer devaluation due to distort price formation can induce market participants to make use of dark pools - electronic trading venues that do not display public quotes for stocks (Rose, 2010). Another aspect for which the use of HFT can generate ambiguous effects is liquidity. Some studies show that strategies in which there is the use of HFT help to add liquidity to the market (Hendershott, Jones & Menkveld 2011). HFTr search liquidity capacity is greater than other operators, since expanding the capacity to store information and reducing reaction times allows operators to take advantage of trading opportunities before they vanish from the market (Biais Foucault & Moinas 2013).
Main disadvantages of HFT use
High speed trading benefits deriving should not overshadow risks that occur to market efficiency and integrity. Because of its ability to negotiate positions held for periods of time lasting only a few minutes, HFTr can affect price fluctuations and volatility in the short term (Chakrabarty et al. 2014).
HFT effect on liquidity is ambiguous. Liquidity provided by HFTr involves the overestimation of the effective one. This phenomena known as ‘ghost liquidity’ is due to the characteristic of disappearing at times when market conditions are more turbulent (van Kervel 2012). This can happen if HFTr place an order on different platforms to increase selling chances. If the order is executed on a trading venue, ‘twins’ orders will be immediately deleted from all other platforms on which they are present. Cancellations result in a reduction of liquidity. High speed allows traders to send thousands of orders in stock exchange, and then delete it immediately. This strategy is called quote stuffing (Egginton et al. 2014). Defective HFT can act in unexpected ways and lead to chain reactions that affect market liquidity in very short time frame (IOSCO 2011). For example they can amplify downturns, as it happened in Flash Crash of May 2010 (Menkveld & Yueshen 2013), (Figure 2).
Both in normal times and in market stress times, HFTr are not willing to accumulate large positions and the attempt to rebalance their positions during stress times it determines a subtraction of liquidity to the market and it increases volatility. Another negative externality generated by HFTr is adverse selection. HFT operations are based on a superior information system which generates high costs (Jovanovic & Menkveld 2012). For this reason traders could be pushed to prefer dark pools to avoid their strategies are caught by HFTr. Displacement of traders in dark pools affects price discovery process. Arguments opposed to those previously exposed argue that the operating speed of HFTr would quick integrate market prices information

185
fostering price discovery. However, this can affect efficiency of decision-making mechanisms of the market participants, (Biais et al. 2013).
Figure 2. The Dow Jones Industrial Average, May 6th, 2010 Source: http://money.cnn.com/2010/10/01/markets/SEC_CFTC_flash_crash/,
accessed April 2014
HFT and manipulation
Some HFT strategies can generate trading manipulations. The U.S. Securities and Exchange Commission (SEC) highlighted the adoption of momentum ignition strategies which consist in buy/sell orders submission to lead to artificial price changes. In this way HFTr can efficiently change their position, either selling at inflated price or buying at extremely low prices. This practice undermines the ability to make predictions based on past order flow (Biais & Foucault 2014). Another manipulative strategy consists in placing a large number of orders in the market (quote stuffing). Quote stuffing may affect slow traders market access. Instead, ‘smoking’ provides convenient order submissions that will be then modified by placing less favorable terms before slow traders attracted in the transaction can realized order changed characteristics.
In case of ‘spoofing’ HFTr objective is to get the best buying price. To pursue this aim, HFTr will submit sell orders in order to induce other investors to believe that phase of decline started. Subsequently, high speed traders will cancel orders before they are executed and they will enter buy orders, which were previously affected by the pressure exerted on the supply side (Caivano et al. 2012).
‘Wash sales’ procedures are fictitious sales designed to simulate a greater trading activity than it is actually carried out in order to increase interest of specific trading stocks. This practice has resulted in rising prices making

186
appear the market more liquid than it is in reality and increasing pressure on the stock price (Angel & McCabe 2013).
Increased risk for market stability occurs furthermore when HFT strategies are combined with ‘controversial tools’ (Bhupathi 2010). Flash orders allow investors to have preview information on trade orders than other market participants. This involves creating two-tier market and improper disclosure of information(Rose 2010). ‘Naked access’ refers to the practice put in place by market makers and broker dealers that enables their clients to have direct access to their exchange servers using their Market Participant Identifier (MPID) (Chakabatry et al., 2014). Naked access allows traders to have direct access to the market without going through the pre-trade checking systems to reduce latency.
Policy Issues
Recent changes in global market have lead European legislator to ensure its proper functioning. In this broad view, HFT is one of the main issue. In October 2011, EU Commission adopted a new Market Abuse Regulation (MAR), where there are specified HFT strategies that are likely to constitute a market abuse (COM (2011) 651). Instead, Markets in Financial Instruments Directive (MiFID) (first draft in 2004 and revised in 2007) meets financial intermediaries and investors requirements to conduct investment services throughout the Community, providing for European regulatory framework harmonization. According to the Directive, each member State must ensure that investment firms execute orders to achieve the best results for their clients. In addition, companies are required to comply customers instructions. The directive has been revised several times in order to guarantee that the financial system remains as safe as possible. Today a new legislation drafting is in progress. Reforms will develop strict transparency to [..ensure that dark trading of shares and other equity instruments which undermine efficient and fair price formation will no longer be allowed]. MiFID II will [.. ensure that legislation will keep peace with technological developments ..] (EU Commission Memo 14/15). Specific controls will be introduced to the AT activities. In addition, firms that provide direct electronic access will be required for the adoption of risk control systems to prevent practices that can result in disorderly markets or market abuse.
Policy Responses
The possibility that HFT can produce negative externalities has sparked debate on possible policies to minimize these effects. The following measures highlight disadvantages and risks associated with their adoption.

187
Mandatory Notification of Algorithm: the aim is to mitigate software malfunction risks. HFT organizations must notify authorities characteristics of algos and systems for risk management used. However, notification requirement has disadvantages in terms of costs associated with communication of information because the high pace of change due to the need to constantly adapt to changing market conditions.
Circuit Breaks: there are interruption of trading mechanisms. They are used to facilitate the management of momentary orders imbalances that can cause sudden price movements (Poirer 2012). Pausing market can be a good way to allow market participants to recalibrate their strategies and to reset their own algorithms parameters (IOSCO 2011). Risk associated with the use of this tool is to slow down price discovery mechanisms. If traders are aware of the threshold that triggers the interruption, they will begin trading activity gradually approaching the threshold. This behavior will speed up threshold achievement. It is therefore necessary to proceed by working with careful modulation.
Tick Size : A tick is the minimum level of price change that one tool can cause and it depends on instrument characteristics. In literature there is not an universally acknowledge method for determining optimal price tick (IOSCO 2011). Tick size reduction may encourage retail investors as it increases competition, moreover it reduces spreads and it contracts trading costs. However, when ticks are very small they are a great incentive for HFT firms to submit orders that will be canceled before execution.
Minimum Order Exposure Time: this tool prevents cancellation of submitted orders for a minimum period of time. This instrument aims to mitigate quote stuffing and ghost liquidity effects (Jones 2013). Minimum exposure time in order books can be differentiated on the basis of the characteristics of the contingent market. An indirect effect of this tool consists in reducing information flow that comes to trading platforms. That reduces risks of technological problems related to co-management systems that receive and process such data. Risk associated with the imposition of minimum exposure time is an adverse effect on price formation. If market participants are able to react to sudden events only after a certain time span, that will impact relative price ability to incorporate new information.
Order to Trade Ratio: It imposes a maximum limit to order submissions and executions.
Periodic Auctions: Periodic auctions are characterized by start time and duration randomness. If this tool is scattered in trading phases they can mitigate HFT competitive advantage in terms of speed. Negative effect of this measure could consist in discouraging supply of liquidity to the market.
Controls to trading: The establishment of pre and post-trade minimum requirements of market participants and the control of pre and post-trading of their activities ensure platforms orderly functioning. ESMA has also proposed

188
the introduction of controls to prohibit unauthorized access to the trading systems, imposing filters on prices and quantities (ESMA 2012).
HFT & Ethics
Finance could not exist without ethics. Delegating own asset management requires trust. There are numerous ethical issues related to HFT usage. Are HFTr imposing an unacceptable risk to the market? Is HFT usage giving a fair advantage to its users or is it affecting fair market participation? Is it right to impose limits on technology such as minimum orders exposure time? Who is responsible for negative effects production?
In finance many ethical issue have been addressed by the legislation or by the companies through self–regulation (Boatright 2014). Codes of conduct conditions financial institutions governance processes intervening in areas not governed by rules and obligations imposed by regulators and supervisory authorities. UNESCO defined ‘good governance’ decision making and decisions implementation processes developed in accordance with eight parameters listed below (Figure 3), (Sheng 2009).
Figure 3. Characteristics of Good Governance Source: UNESCO 2009
Ambiguity of market output production increases problems of ethical behavior in finance. High level of uncertainty hinders perceptions of cause and effect relationship between the adoption of a specific behavior and results produced in training environment, (Davis, Kumiega & Van Vliet 2013). HFT amplifies this problem due to rapid adoption of the trading strategies. Universality of good governance principles allow them to be applied to HFT firms and they can be used in corporate strategies in order to seek ethical goals of fair behavior.

189
Accountability: HFT technologies and strategies require combined action of traders, computer engineers and quantitative analysts. Cross disciplinary is HFT strategy core. These three functional areas traditionally respond to different ethical principles that lead them to analyze risks from their professional perspective and from there deduce their priority scale. It is necessary to develop a single ethical conscience that addresses company policy based on contact points of various ethical codes. Competent internal authority has to check compliance with these principles and it must be accountable to the public.
Transparency: Firms should periodically produce reliable and clear reports in order to inform stakeholders about their performances. They must ensure a regular update on the state of the art of their procedures. In addition, companies should keep detailed records of information about key decisions, system properties, testing methodologies to enable competent authorities to carry out their monitoring role (ESMA 2012).
Responsiveness: Prompt reaction to stakeholders needs is a key feature of good governance. High speed trading takes place automatically in milliseconds time frames. That does not allow real-time corrections. However, algos are implicit ethical agents (Moor 2006), which can be programmed to act in accordance with ethical principles (Anderson & Anderson, 2007). Companies are then able to correct the system on the basis of their ethical policy, of a constant monitoring of the interaction between the system and the market, and the collection of information relating to the needs of their stakeholders.
Equitable and Inclusive: the main criticism leveled against HFT firms is that they take unfair advantage because not all market participants can support investments to develop algorithms. This advantage is likely to lead to a ‘crisis of participation’ (Angel et al., 2013). Initiative of companies like Marketcetera can solve this problem. Marketcetera is an open source project devoted to democratizing access to high frequency trading (www.marketcetera.org). HFT firms should ensure support to similar initiatives to contribute to guarantee fair market access and to increased social gain resulting spreading technology knowledge.
Effective and Efficient: Shareholders profit maximization is companies main objective. In order to avoid that risks linked to this aim persecution could provoke negative effects to the market, HFT firms must adopt testing system. ESMA suggest that system of testing has to include performance simulations/back testing or offline-testing within a trading platform testing environment. By adapting testing methodology to the adopted HFT strategies, companies would not only ensures the real efficiency of the system but also they would be able to verify its compliance with regulatory framework.

190
Follows the rules of law: Boundaries of financial organizations actions are well defined by regulatory framework and supervisory authorities disposals. However, firms should not restrict themselves to compliance, they should adopt a pro active behavior. Companies have to voluntary adopt guidelines and best practices. They have to implement new standards and to impede unethical behaviors of other market participants, (e.g. corruption, financing of non-ethically correct companies/activities ).
Participatory: Firms must ensure compliance with shareholders rights, encouraging their participation to decision meeting where they can exercise their voting rights. Shareholders have to contribute in market strategies development. They have also to monitor that strategies are implemented in accordance with diligence and prudence principles. Companies must contribute to the spread of a smart and prudent risk management culture among internal (employees) and external (shareholders) stakeholders.
Consensus oriented: HFT can collect and analyze flurry data in a very short time. That characteristic enables those algos to perform effective long-term forecasts and thereby protect stakeholder interests and to operate in a sustainable perspective.
Conclusions
HFT technological and operational characteristics make it difficult to identified it in the market. However, its effects are noticeable and they can affect market proper functioning. According to Kearns is possible to distinguish between passive HFT and aggressive HFT (Kirilenko et al. 2010). The presence of passive HFT in the market ensures all participants contributing to efficient price formation and increased liquidity in the market. Aggressive HFTr adopt predatory behaviours that manipulate markets, eroding market participants trust.
Strategies and automated trading systems should plan their trading decisions process basing it on fairness, prudence and diligence principles. These principles are the basis of good governance. Adoption of quality management systems able to guarantee the fulfillment of the eight strands of good governance must become the real competitive advantage of HFT firms.
References
Anderson M., Anderson, S. L., 2007, Machine ethics: Creating an ethical intelligent agent, AI Magazine 28(4)
Angel J. J., McCabe D., 2013, Fairness in Financial Markets: The Case of High Frequency Trading, Journal of Business Ethics 12, 585–595
191
Baron M., Brogaard J., Kirilenko A., 2012, The trading profits of high frequency traders, Working Paper, Bank of Canada
Biais B., Foucault T., 2014, HFT and Market Quality, Bankers, Markets & Investors 128
Biais B., Foucault T., Moinas S., 2013, Equilibrium high-frequency trading, HEC Research Paper 968, available at http://papers.ssrn.com/sol3/papers.cfm?abstract_id=2024360##
Bhupathi T., 2010, Technology’s Latest Market Manipulator - High Frequency Trading: The Strategies, Tools, Risks, and Responses, North Carolina Journal of Law and Technology 11, 477-400
Boatright J.R., 2014, Ethics in finance (3rd ed.), John Wiley & Sons, UK
Caivano V., Ciccarelli S., Di Stefano G., Fratini M., Gasparri G., Giliberti M., Linciano N., Tarola I., 2012, High frequency trading: definition, effects, policy issues, Consob - Discussion papers, December
Capgemini, 2012, High Frequency Trading: Evolution and the Future, Report, available at http://www.capgemini.com/resource-file-access/
resource/pdf/High_ Frequency_Trading__Evolution_and_the_Future.pdf
Chakrabarty B., Jain P.K., Shkilko A., Sokolov K., 2014, Quote intensity and market quality: effects of the SEC naked access ban, Available on http://papers.ssrn.com/sol3/papers.cfm?abstract_id=2328231
Chlistalla M., 2011, High Frequency Trading. Better than its Reputation?, Deutsch Bank Research, Research Briefing, February
Davis M., Kumiega A., Van Vliet B., Ethics, 2013, Finance, and Automation: A Preliminary; Survey of Problems in High Frequency Trading, Science and Engineering Ethics 19, 851–874
Egginton J., Van Ness B., Van Ness R., 2014, Quote stuffing, Working paper, available at file:///C:/Users/user/Downloads/SSRN-id1958281.pdf
European Commission, 2011, Proposal for a Regulation of the European Parliament and of the Council on insider dealing and market manipulation (market abuse), Communication n.651
European Security and Market Authority, 2012, Guidelines Systems and controls in an automated trading environment for trading platforms, investment firms and competent authorities, ESMA 122, February
Fabozzi F. J., Focardi S. M., Jonas C., 2009, High-Frequency Trading: Methodologies and Market Impact, Conatum Consulting Press, available at http://www.conatum.com/presscites/HFTMMI.pdf
Foucault T., Kadan O. Kandel E., 2013, Liquidity Cycles, and Make/Take Fees in Electronic Markets, Journal of Finance 68, 299-339.
192
Gai J., Yao C., Ye M., 2012, The Externalities of High-Frequency Trading, Working paper, University of Illinois at Urbana-Champaign
Hasbrouck J., Saar G., 2013, Low-latency trading, Journal of Financial Markets 16(4), 646-679
Hendershott,T., Jones C.M., Menkveld A.J., 2011, Does Algorithmic Trading Improve Liquidity , Journal of Finance 66, 1-33
Jones C. M., 2013, What do we know about High Frequency Trading, Working Paper, Columbia Business School Research Paper 13(11), available on http://papers.ssrn.com/sol3/papers.cfm?abstract_id=2236201
Jovanovic B., Menkveld A.J., 2012, Middlemen in limit order markets, Working Paper, available on file:///C:/Users/user/Downloads/SSRN-id1624329.pdf
Kearns, M., Alex, K., Yuriy, N. ,2010, Empirical limitations on high frequency trading profitability. Available at ssrn.com/abstract=1678758.
Kirilenko A., Kyle A. S., Samadi M., and Tuzun T., 2010, The flash crash:the impact of high-frequency trading on an electronic market, Working paper, University of Maryland
Menkveld A. J., Yueshen B. Z., 2013, Anatomy of the Flash Crash, Working paper, available at http://papers.ssrn.com/sol3/papers.cfm?abstract_id=2243520
Moor J. H., 2006, The nature, importance, and difficulty of machine ethics, Intelligent Systems, 21(4), 18–21
Poirer I., 2012, High-Frequency Trading and the Flash Crash: Structural Weaknesses in the Securities Markets and Proposed Regulatory Responses, Hastings Business Law Journal 8(2), 445- 472
Rose C., 2010, Dark Pools And Flash Orders: The Secret World Of Automated High-Frequency Trading, Journal of Business & Economics Research 8(8)
Securities and Exchange Commission, 2010, Concept Release on Equity Market Structure, available on http://www.sec.gov/rules/concept/2010/34-61358.pdf
Sheng Y.K., 2009, What is Good Governance?, UNESCAP Technical Committee of the International Organization of Securities Commissions, 2011, Regulatory Issues Raised by the Impact of Technological Changes on Market Integrity and Efficiency, Consultation Report, July
van Kervel V., 2012, Liquidity: What you see is what you get?, Working Paper, available at http://pages.stern.nyu.edu/~jhasbrou/SternMicroMtg/SternMicroMtg2012/Accepted/WhatYouSee71.pdf
193
Helena Panfil- Kuncewicz, A ndr zej Kuncewicz, Anna Lis The Effect of Gas Composition in Modified Atmosphere Pac kaging on t he Shelf Life of Portioned R ipe ned C heese
THE EFFECT OF GAS COMPOSITION IN MODIFIED ATMOSPHERE PACKAGING ON THE SHELF LIFE OF PORTIONED RIPENED CHEESE
Helena Panfil-Kuncewicz1, Andrzej Kuncewicz2, Anna Lis1
Chair of Dairy Science and Quality Management1, Chair of Commodity Science and Food Analysis2,
Faculty of Food Science, University of Warmia and Mazury in Olsztyn, [email protected]
Introduction
Ripened cheese is generally produced in large blocks, and when the optimum degree of maturity is achieved, it is portioned and packaged into "consumer units". Metabolic, enzymatic, microbiological and physical changes continue to take place in packaged cheese, and the intensity of those processes is determined by the applied packaging method. Packaging with unsuitable barrier properties, including permeability to air, water vapor, gases and light, can lead to drying of the cheese surface, oxidation of cheese ingredients such as fat, and the development of undesirable microflora, mostly yeast, molds and bacteria. The above processes can be intensified in packaged cheeses that have a relatively long shelf life. For this reason, packaging materials and packaging methods applied to cheese and other dairy products should be carefully selected.
Vacuum packaging and modified atmosphere packaging are popular packaging methods where excess air (oxygen) is pumped out and / or a neutral gas or a mixture of neutral gases is introduced to the packaging to prevent and delay microbiological and chemical changes in cheese. Ripened cheeses, excluding mold-ripened cheeses, are usually packaged under modified atmosphere containing various quantities of carbon dioxide (CO2) and nitrogen (N2). The bacteriostatic and bactericidal properties of such packaging are generally attributed to CO2. The proportions of carbon dioxide in every gas mixture should be defined individually for every type of cheese based on its specific attributes such as water activity, pH, microbial species and abundance.
Gas absorbers and emitters can be placed inside cheese packaging to produce a new generation of active packaging. Active packaging interacts

194
with the packaged product or the atmosphere inside packaging to prolong the product's shelf life. The atmosphere inside packaging is most effectively modified by oxygen and carbon dioxide absorbers and emitters in the form of sachets or substances embedded directly into the packaging material.
The objective of this study was to evaluate the effect of gas composition in modified atmosphere packaging with and without oxygen absorbers on the shelf life of ripened cheese.
Materials and Methods
The experimental material comprised Dutch-type (Gouda) ripened cheese supplied by three dairy plants. In the laboratory of the Department of Dairy Science and Quality Management, the products were portioned (150 g + 20 g) and packaged in PA//PA//PE/PE-EVA bags with the capacity of 450 cm3 and thickness of 70 µm. Cheese samples were packaged in the Multivac C300 single-chamber machine with the use of four different methods: I – active packaging (the air atmosphere was modified by placing a sachet of ATCO FT 210 oxygen absorber inside the packaging) (AP), II – modified atmosphere packaging (40% CO2 and 60% N2) (MAP), III – modified atmosphere packaging with an oxygen absorber (MAP + absorber), IV – in air (control). Packaged cheese portions were stored at the temperature of 6 + 0.5oC for 90 days. Samples of fresh cheese and cheese stored for 30, 60, 90 days were analyzed.
Gas composition inside the packaging of fresh and stored cheese was analyzed in the PBI-Dansensor CheckMate3 gas analyzer. Samples of fresh and stored cheese were analyzed to determine plate counts of coliform bacteria on VRBL medium (Merck) according to standard PN-93/A-86034/08, yeast and mold counts on YGC selective medium (Merck) according to standard PN-ISO 6611:2007. A sensory evaluation was performed by the gradation method based on a six-point grading scale (1-6) (PN-ISO 4121:1998; PN-ISO 6658:1998). Five sensory attributes were evaluated: color, eye formation, consistency, aroma and taste, based the specification of quality attributes for Gouda cheese defined by standard PN-68/A-86230 and IDF Standard 99C:1997. Coded cheese samples were evaluated by a team of five experts trained in sensory analysis. The analyses were performed on three Dutch-type ripened cheeses.
Results and Discussion
The results of the analyses revealed variations in gas composition inside cheese packaging, subject to the applied packaging method and storage time (Table 1 ). In control samples stored for 24 hours, oxygen content decreased

195
to 17.90% on average, and carbon dioxide content increased to 5.65%. After 30, 60 and 90 days of storage, the oxygen content of control packaging decreased from 2.67% to trace amounts, and the carbon dioxide content decreased to 22.70%, 21.58% and 19.20%, respectively. The observed changes in gas composition resulted from microbiological and enzymatic processes in cheese stored in atmospheric air. In packaging containing oxygen absorbers, oxygen was removed completely, and CO2 content increased from 0.37% after 24 hours of storage to 1.51% after 30 days of storage, and decreased to 1.14% after 90 days of storage. Cheese was packaged in an atmosphere composed predominantly of nitrogen (N2).
Table 1. Gas composition inside packaging of Dutch-type ripened cheeses packaged with the use of different methods and chill stored for 90 days.
Packaging method
1 day 30 days 60 days 90 days
gas content [%]
O2 CO2 N2 O2 CO2 N2 O2 CO2 N2 O2 CO2 N2
Control 18.67 4.70 76.63 2.88 25.12 72.00 0.21 24.00 75.79 0.04 21.20 78.76
17.90 5.65 76.45 5.06 16.15 78.79 0.02 16.55 83.43 0.02 17.75 82.23 17.13 6.60 76.27 0.06 26.83 73.11 0.07 24.20 75.73 0.01 20.80 79.19
x ± s 17.90 ±0.77
5.65 ±0.95
76.45 ±0.18
2.67 ±2.51
22.70 ±5.74
74.63 ±3.64
0.10 ±0.10
21.58 ±4.36
78.32 ±4.43
0.02 ±0.02
19.92 ±1.89
80.06 ±1.89
AP
0.12 0.37 99.51 0.00 0.10 99.90 0.00 0.70 99.30 0.00 0.85 99.15 0.10 0.10 99.80 0.00 2.53 97.47 0.00 1.97 98.03 0.00 2.17 97.83
0.13 0.63 99.24 0.00 1.90 98.10 0.00 1.47 98.53 0.00 0.40 99.60
x ± s 0.12 ±0.02
0.37 ±0.27
99.51 ±0.28
0.00 ±0.00
1.51 ±1.26
98.49 ±1.26
0.00 ±0.00
1.38 ±0.64
98.62 ±0.64
0.00 ±0.00
1.14 ±0.92
98.86 ±0.92
MAP
0.28 32.20 67.52 1.20 35.34 63.46 0.59 34.27 65.14 0.65 29.10 70.25
0.27 33.80 65.93 0.03 28.90 71.07 0.04 29.30 70.66 0.02 28.20 71.78
0.26 35.40 64.34 0.05 35.90 64.05 0.08 31.37 68.55 0.02 29.63 70.35
x ± s 0.27 ±0.01
33.80 ±1.60
65.93 ±1.59
0.43 ±0.67
33.38 ±3.89
66.19 ±4.23
0.24 ±0.31
31.65 ±2.50
68.11 ±2.79
0.23 ±0.36
28.98 ±0.72
70.79 ±0.86
MAP +absorber
0.00 31.02 68.98 0.00 27.90 72.10 0.00 24.86 75.14 0.00 19.40 80.60
0.00 31.08 68.92 0.00 28.14 71.86 0.00 26.70 73.30 0.00 20.16 79.84
0.00 30.80 69.20 0.00 29.78 70.22 0.00 25.16 74.84 0.00 19.04 80.96
x ± s 0.00 ±0.00
30.97 ±0.12
69.03 ±0.12
0.00 ±0.00
28.61 ±0.84
71.39 ±0.84
0.00 ±0.00
25.57 ±0.81
74.43 ±0.81
0.00 ±0.00
19.53 ±0.47
80.47 ±0.47
Source: own research
In modified atmosphere packaging (40% CO2 and 60% N2), the actual carbon dioxide content was lower than the expected content, and it was determined at 33.80% on average. Carbon dioxide levels remained fairly stable until storage day 60. After 90 days of storage, the carbon dioxide content of packaging decreased insignificantly to 28.98% on average (Table 1).

196
The presence of oxygen was not determined in MAP with and without oxygen absorbers throughout the entire period of storage. The carbon dioxide content of packaging decreased gradually from 30.97% after 1 day of storage to 19.53% after 90 days of storage. The observed changes in CO2 concentrations are difficult to explain. They cannot be attributed to the dissolution of carbon dioxide in the product, because CO2 levels were significantly higher than in MAP without oxygen absorbers. The reported drop in the carbon dioxide content of MAP containing oxygen absorbers could be explained by the reaction between CO2 and iron hydroxide formed during oxygen absorption.
Table 2. Microbiological evaluation of Dutch-type ripened cheeses packaged with the use of different methods and chill stored for 90 days (yeast, mold and coliform bacterial counts and the average yeast, mold and coliform counts are expressed in terms of log CFU).
Source: own research
The observed changes in the gas composition of packaging were correlated with changes in the abundance of cheese microflora – yeast, molds and coliform bacteria (Table 2). The greatest increase in yeast cell counts was noted in control samples. The average size of yeast populations increased from 4.23 log cfu/g before packaging to 6.01, 6.15 and 6.11 log cfu/g after 30, 60 and 90 days of storage, respectively. In active packaging containing oxygen absorbers, a somewhat lower increase in yeast counts was reported, ranging from 4.55 log cfu/g after 30 days to 5.19 log cfu/g after 90 days of storage. In
Type of microbiological contamination
Fresh sample Control AP MAP MAP + absorber
0 30 60 90 30 60 90 30 60 90 30 60 90
Yeast counts [log cfu/g]
4.48 5.85 5.20 6.38 3.52 4.00 4.30 3.48 3.72 4.51 5.14 5.24 5.64
4.26 6.28 6.20 6.04 5.00 5.28 5.64 4.58 4.62 5.15 3.85 4.20 4.72
3.54 5.66 6.40 5.58 3.43 3.82 3.15 3.94 2.83 3.66 4.41 3.42 4.88
x ± s [log cfu/g]
4.23 ±0.40
6.01 ±0.26
6.15 ±0.52
6.11 ±0.33
4.55 ±0.72
4.84 ±0.65
5.19 ±1.02
4.22 ±0.45
4.20 ±0.73
4.77 ±0.61
4.76 ±0.53
4.81 ±0.75
5.27 ±0.40
Mold counts [log cfu/g]
4.08 5.36 4.20 5.26 2.90 3.59 3.53 3.15 3.26 3.90 4.60 4.68 3.90
3.41 5.54 5.30 5.51 4.78 4.80 5.26 3.90 4.00 4.26 3.12 3.64 5.11
3.20 5.00 5.58 4.30 2.58 3.20 2.20 3.23 2.15 2.60 3.96 3.62 3.87
x ± s [log cfu/g]
3.73 ±0.38
5.36 ±0.22
5.30 ±0.60
5.24 ±0.52
4.31 ±0.97
4.36 ±0.68
4.79 ±1.25
3.57 ±0.34
3.60 ±0.76
3.94 ±0.71
4.22 ±0.61
4.27 ±0.50
4.68 ±0.58
Coliform bacterial counts
[log cfu/g]
0.90 4.20 3.57 3.54 2.72 3.49 2.81 3.62 1.00 2.75 3.69 3.08 4.64
0.90 2.63 1.00 4.00 2.36 1.00 2.95 2.11 0.00 2.74 3.98 3.12 4.97 2.38 2.41 2.28 2.15 3.08 1.00 3.64 3.64 3.00 2.18 3.97 3.04 4.73
x ± s [log cfu/g]
1.93
±0.70 3.75
±0.80 3.11
±1.05 3.66
±0.79 2.81
±0.29 3.02
±1.17 3.30
±0.36 3.46
±0.72 2.53
±1.25 2.62
±0.27 3.90
±0.13 3.08
±0.03 4.80
±0.14

197
MAP, yeast counts remained stable (relative to fresh samples) until storage day 60 and were determined at 4.77 log cfu/g on average after 90 days.
In cheese samples packaged under modified atmosphere with oxygen absorbers, a minor increase in yeast counts can be explained by the fact that yeasts are facultative anaerobes that can grow without oxygen. The observed increase in yeast abundance in the above samples can also be attributed to the drop in carbon dioxide levels in MAP with oxygen absorbers. Oxygen absorbers are recommended for use with MAP to maintain anaerobic conditions inside packaging.
Similarly to yeast, the lowest abundance of molds (relative to samples packaged with the use of other methods) was determined in MAP samples. The average mold counts in cheese packaged under modified atmosphere were somewhat lower than in fresh samples after 30 and 60 days of storage and only insignificantly higher after 90 days of storage (Table 2). The highest mold counts were determined in control samples where they remained fairly stable throughout the period of storage.
The use of oxygen absorbers in MAP had an adverse effect on changes in mold abundance. Mold counts in cheese samples packaged under modified atmosphere with oxygen absorbers were higher than in MAP without oxygen absorbers and comparable with mold concentrations in active packaging with oxygen absorbers. The above findings could be attributed to a decrease in the carbon dioxide content of MAP with oxygen absorbers (Table 2).
The average size of coliform bacterial populations in fresh cheese samples was determined at 1.93 log cfu/g. In control samples, coliform bacterial counts reached 3.75, 3.11 and 3.66 log cfu/g after 30, 60 and 90 days of storage, respectively. Somewhat greater variations in the abundance of coliform bacteria were observed in cheese packaged with the use of other methods. No significant correlations were reported between the abundance of coliform bacteria, packaging method and storage time.
A sensory evaluation revealed that the analyzed samples of Dutch-type cheese were characterized by satisfactory quality throughout the experiment. In fresh cheese samples, the evaluated sensory attributes scored 4.13 to 5 points on a six-point grading scale, and no significant variations were observed throughout the entire period of storage (Table 3). The sensory analysis did not reveal any correlations between packaging method (gas composition inside packaging) and the sensory attributes of the examined cheeses. The sensory attributes of samples packaged with the use of different methods scored a similar number of points on the grading scale (Table 3). Control samples scored a lower number of points for taste and aroma than the remaining samples. The above results can be attributed to the gas composition inside packaging because air promotes the growth of undesirable microflora and chemical changes that lower cheese quality.

198
Table 3. Sensory evaluation of Dutch-type ripened cheese packaged with the use of different methods and chill stored for 90 days.
Source: own research
The shelf life of portioned Gouda cheese supplied by domestic dairy plants was most effectively prolonged by modified atmosphere packaging containing 40% CO2 and 60% N2. Active packaging with oxygen absorbers also slowed down the proliferation of the analyzed microorganisms, but to a lesser degree than MAP without oxygen absorbers. A similar decrease in microbial growth rates was observed in MAP with oxygen absorbers. The analyzed cheeses were supplied by three dairy plants, and they could differ in attributes that are crucial for the selection of the optimal atmosphere inside packaging. Despite those differences, the analyzed samples responded similarly to increased carbon dioxide levels in packaging. The results of this study confirm the well-known fact that carbon dioxide is the most effective antimicrobial agent for modifying the gas atmosphere inside food packaging.
Our results corroborate the findings of other authors who suggested that the shelf life of portioned cheese is most effectively prolonged by carbon dioxide (Garabal et al. 2010, Trobetas et al. 2008, Gammarielo et al. 2009b, Temiz et al. 2010). The results of other studies investigating the effect of
Weight coefficient
Ww
Sensory attribute
Fresh sample Control AP MAP MAP + absorber
0 30 60 90 30 60 90 30 60 90 30 60 90
0.15
COLOR 4.00 4.00 4.67 3.00 4.00 4.67 5.33 4.00 4.33 4.00 4.00 4.67 5.00
5.00 5.50 5.50 5.60 5.50 5.50 5.60 5.50 5.50 5.60 5.50 5.50 5.60 4.00 4.50 4.50 4.00 4.00 4.00 4.50 4.00 4.33 4.33 4.00 4.33 4.33
x ± s 4.33
±0.58 4.67
±0.76 4.89
±0.54 4.20
±1.31 4.50
±0.87 4.72
±0.75 5.14
±0.57 4.50
±0.87 4.72
±0.68 4.64
±0.84 4.50
±0.87 4.83
±0.60 4.98
±0.64
0.15
EYE FORMATION
4.00 4.00 4.33 4.67 4.00 4.33 4.33 4.00 4.33 4.00 4.00 4.33 4.33
4.40 4.25 4.25 4.40 4.25 4.25 4.40 4.25 4.25 4.33 4.25 4.25 4.60
4.00 4.00 4.00 4.00 4.00 4.00 4.00 4.30 4.00 4.50 4.30 4.00 4.50
x ± s 4.13
±0.23 4.08
±0.14 4.19
±0.17 4.36
±0.34 4.08
±0.14 4.19
±0.17 4.24
±0.21 4.18
±0.16 4.19
±0.17 4.28
±0.25 4.18
±0.16 4.19
±0.17 4.48
±0.14
0.25
CONSISTENCY
5.00 5.00 4.67 4.67 5.00 4.67 5.00 5.00 5.33 5.00 5.00 5.00 4.67
4.60 4.13 5.00 5.00 4.38 4.50 5.00 4.50 4.75 5.20 4.75 4.75 5.20
4.00 4.50 5.00 5.00 4.50 5.00 5.00 4.00 4.80 4.80 4.00 4.80 4.90
x ± s 4.53
±0.50 4.54
±0.44 4.89
±0.19 4.89
±0.19 4.63
±0.33 4.72
±0.25 5.00
±0.00 4.50
±0.50 4.96
±0.32 5.00
±0.20 4.58
±0.52 4.85
±0.13 4.92
±0.27
0.20
AROMA
5.00 5.50 4.67 4.33 5.50 5.00 5.33 5.50 5.33 5.33 5.50 5.33 4.33
5.00 4.75 4.50 4.00 4.75 4.50 4.40 4.75 4.25 4.60 4.75 4.50 4.60
5.00 4.50 4.00 3.70 4.90 5.00 4.50 4.50 4.30 4.50 4.50 4.30 4.30
x ± s 5.00
±0.00 4.92
±0.52 4.39
±0.35 4.01
±0.32 5.05
±0.40 4.83
±0.29 4.74
±0.51 4.92
±0.52 4.63
±0.61 4.81
±0.45 4.92
±0.52 4.71
±0.55 4.41
±0.17
0.25
TASTE
4.00 5.00 4.00 3.67 5.00 4.33 4.17 5.00 4.67 4.83 5.00 4.33 4.33 3.60 3.50 3.50 3.40 3.50 3.75 4.00 3.75 4.00 4.40 4.00 4.75 4.60
4.80 3.80 3.30 3.00 4.30 4.00 3.83 4.00 3.93 4.00 4.00 4.20 4.25
x ± s 4.13
±0.61 4.10
±0.79 3.60
±0.36 3.36
±0.34 4.27
±0.75 4.03
±0.29 4.00
±0.17 4.25
±0.66 4.20
±0.41 4.41
±0.42 4.33
±0.58 4.43
±0.29 4.39
±0.18
Σ=1 OVERALL SCORE
4.43 4.46 4.36 4.15 4.59 4.49 4.61 4.47 4.55 4.65 4.51 4.62 4.63

199
modified atmosphere packaging on the quality of portioned cheese indicate that the composition of gases inside the packaging should be selected individually for every cheese type in view of the product's quality (Rodrigez-Aguilera et al. 2011b, Oyugi and Buys 2007, Mexis, Chouliara and Kontominas 2010).
The effectiveness of modified atmosphere packaging, i.e. packaging where air is replaced with a gas mixture of known composition, has been extensively researched, and research results have been implemented in industrial practice. By contrast, very few studies have addressed new-generation packaging, including active packaging with gas absorbers and emitters (Mexis, Chouliara and Kontominas 2011, Oyugi and Buys 2007). In the nearest future, active packaging containing oxygen absorbers and carbon dioxide emitters will offer a viable alternative to modified atmosphere packaging for cheese.
Conclusions
1. The sensory and microbiological attributes of cheese were most effectively preserved in modified atmosphere packaging containing 40% CO2/60% N2 throughout the entire period of storage.
2. Oxygen absorbers induced adverse changes in gas composition inside packaging, which lowered the sensory and microbiological quality of cheese.
Acknowledgments
This study was supported by research project(KBN0 no.NN312202539 from The Ministry of Science and High Education in the years 2010-2013.
References
Gamariello D., Conte A., Di Giulio S., Attanassio M., Del Nobile M.A., 2009, Shelf life of Stracciatella chese under modified-atmosphere packaging. J.Dairy Sci. 92(2), 483-490
Garbal J.I., Rodrguez-Alonso P., Franco D., Centeno J.A.,2010,Chemical and biochemical study of industrially produced San Simon da Costa smoked semi-hard cow,s milk cheese:effects of storage under vacuum and different modified atmospheres. J.Dairy Sci. 93(5),1868-1881
IDF Standard 99C:1997. Sensory evaluation of dairy products by scoring – reference method. International Dairy Federation. Brussels, Belgium.

200
Mexis,S,F., Chouliara, E., Kontominas M.G., 2011,Quality Evaluation of Grated Graviera Chesse stored at 4 and 120C usingActive and Modified Atmosphere Packagibg. Packag.Technol.Sci 24:15-29
Oyugi E., Buys E.M.,2007, Microbiological quality of shredded Cheddar cheese packaged in modified atmpspheres. Int.J.Dairy Technol. 60(2), 89-95.
PN-ISO 4121:1998. Analiza sensoryczna. Metodologia. Ocena produktów żywnościowych przy użyciu metod skalowania.
PN-ISO 6658:1998. Analiza sensoryczna. Metodologia. Wytyczne ogólne.
PN-68/A-86230. Mleko i przetwory mleczarskie. Sery podpuszczkowe dojrzewające.
PN-ISO 6611:2007. Mleko i przetwory mleczne. Oznaczanie liczby jednostek tworzących kolonie drożdży i/lub pleśni. Metoda płytkowa w temperaturze 25 oC.
PN-93/A-86034/08. Mleko i przetwory mleczarskie. Badania mikrobiologiczne. Bakterie z grupy coli – wykrywanie obecności, oznaczanie najbardziej prawdopodobnej liczby (NPL) i oznaczanie liczby metodą płytkową.
Rodriguez-Aguilera R., Oliveira J.C., Montanez J.C., Mahajan P.V., 2011, Effect of modified atmosphere packaging on quality factors and shelf-life of surface mould ripened cheese. Part I constant temperaturę. LWT Food Sci. Technol. 44, 330-336
Temiz H.,2010, Effect of modified atmosphere packaging on characteristics of sliced Kashar cheese. J.Food Proc. and Pres. 34(5), 926-943
Trobetas A., Badeka A., Kontominas M.G., 2008, Light-induced changes in grated Graviera hard cheesepackaged under modified atmosphere. Int. Dairy J., 18(12), 1133-1139

201
Michele Prezios i, Roberto Merli, Ayse Agar EVOLU TION OF EUROP EAN BIOFU ELS P OLICY: ADDRESSING SUSTAINABILITY AND INDIR ECT LAND-USE C HANGE
EVOLUTION OF EUROPEAN BIOFUELS POLICY: ADDRESSING SUSTAINABILITY AND INDIRECT
LAND-USE CHANGE
Michele Preziosi, Roberto Merli, Ayse Agar
Department of Business Studies, “Roma Tre” University [email protected]
Introduction
The production and use of biofuels have dramatically expanded in the last decade. Global production of biofuels has been constantly growing steadily over the last decade from 16 billion liters in 2000 to more than 100 billion liters in 2011. Today, biofuels provide around 3% of total road transport fuel globally (on an energy basis) and considerably higher shares are achieved in certain countries (Brazil 2009 - 23%) (IEA 2012).
US, Brazil, and the EU dominate the sector, contributing with 44, 27, and 17% of the global production, and 44, 23, and 23% of global consumption, respectively (on an energy basis) (US EIA, 2011; Witcover J. et al. 2013). In 2012 EC total biofuels incorporation rate in transport sector was of 4.7%. Its consumption in transport has constantly grown, from 1,096 Mtoe in 2001 to 14,4 Mtoe in 2012. Between 2011 and 2012 this growth has slowed down, with a rate of +5,3% (EurObserv’ER, 2013).
European legislation is one of the most advanced with regard to environmental protection in many areas (Kelemen, 2010). The EC has adopted programs to boost a wider use of biofuels. One of the main goal is to reduce carbon emissions by replacing fossil fuels with low carbon fuels in the transport sector (Com 2010/547/EC). This paper has traced the evolution of the EC policies concerning biofuels. In the first Directive on biofuels in 2003, the link between biofuels consumption and its sustainable production it was not explicit. In 2006, the EC announces ambitious targets for 2020 and, in 2009, enhances RED and new FQD, introducing sustainability criteria, targets for GHG savings and certification schemes for biofuels (Witcover J. at al. 2013).
With the RED, the EC expressed the need to take into account the potential environmental effects related to the production of biofuels and ILUC, which today is a debated topic due to the uncertainty and difficulty of

202
assessing the effects on a global scale (Gawel and Ludwig, 2011). This controversial issue has created a political deadlock, where European policy makers are required to regulate over a theme without a definitive scientific evidence (Di Lucia L. at al. 2012).
A General Overview on 1st and 2nd Biofuels Generations
On a global level, there are four generations of biofuels in which two of them play an important role to decrease the dependency on fossil fuels. The EC is constantly looking for innovations and new technologies to overcome this dependency and has interest in producing new types of fuels from plants and organic waste (Kamm B, Gruber PR; 2006). Biofuels have a potential for sustainability and economic growth of industrialized countries. Nevertheless, many of the biofuels that are currently being supplied have been criticized for their adverse impacts on the natural environment, food security, and land use (FAO 2008; FAO et al. 2011).
First generation of biofuels, crop based, consists of bioethanol, biodiesel, biogas and plant oil and are made from sugar, starch, and vegetable oils extracted using conventional established technology which is found in arable crops (Halvik et al. 2011).
Biodiesel, oxygenated fuel, is used in diesel vehicles as a replacement for diesel and produced by the transesterification of the vegetable oils or animal fat feedstock (animal fats, vegetable oils, soy, rapeseed, jatropha, mahua, mustard, flax, sunflower, palm oil, hemp, field pennycress), and it is the most common in Europe. Bioethanol is used in petrol engines as a replacement for gasoline and derived from sugar or starch through fermentation of wheat, corn, sugar beets, sugar cane, molasses. Biogas is produced through anaerobic digestion.
This generation of fuels, with almost 50 billion liters produced annually, is blended with fossil fuels and used in existing infrastructures (Naik et al. 2009). Skepticism on first generation is the increase in food prices and land use, due to production increase of these fuels (Barnabe et al. 2013).
Second Generation of biofuels: non-food biomass, biomass from crops residues, other non-food energy crops, wood/forestry residues, waste, industry waste (Bringezu at al. 2009). Second generation biofuels, which are produced from biomass material, derived from living, or recently living organisms: these plants or plant-based materials, called lignocellulosic biomass, are energy sources, and can either be used directly via combustion to produce heat, or indirectly after converting it to various forms of biofuels. Thermal, chemical, and biochemical classified methods are used for conversion of biomass to biofuels (Naik at al. 2009).

203
Biofuels in the European sustainability strategy
Until 2003, there was no common biofuels policy governance in the EU. Biofuels represented, in fact, only a slight part of the fuels used in transport. Furthermore, their production had been promoted only in some European Member States (Di Lucia R., 2013).
The first European official document in which the theme of biofuels production was introduced dates back to the 1998 European Parliament Resolution, in which a reference was made to increase biofuels market share to 2% in 5 years (EBTP 2011).
With the adoption of Directive 2003/30/EC "on the promotion of the use of biofuels or other renewable fuels for transport", the first European targets for their production related to the transport sector were established. This Directive set a generic biofuels consumption target for the entire European region (Linares P. and Perez-Arriaga I.J., 2013), to contribute in the achievement of the ambitious targets for GHG reduction in the transport sector. The goals were to mitigate climate change, increase security and diversity of energy supply and create opportunities for a sustainable rural development (Di Lucia L. and L. Nilsson, 2007). The Directive required Member States to set a target for the use of biofuels and other renewable fuels, and two reference values were given: a 2% share by 2005 and a 5.57% share by 2010.
In 2006, with the Communication "An EU Strategy for Biofuels", the new basis for a European policy on biofuels were formalized, followed by the adoption in 2009 of two important Directives which are related to biofuels production with special regard to the transport sector: Directive 2009/28/EC, known as RED, and Directive 2009/30/EC.
RED aimed to reduce GHG emissions and energy consumption, promote security in energy supply and regional sustainable development, and set a series of measures as energy savings, increased energy efficiency and usage of renewable energy sources. In particular, it mentioned an increase in the use of renewable sources in the transport sector. Following the recommendations of the COM(2006) n.848 “Renewable Energy Road Map”, the EC endorsed targets for renewable sources: a mandatory 20% share of energy from renewable sources in overall Community energy consumption, and a 10% share of renewable energies in transport consumption by 2020.
According to RED, biofuels production should be sustainable; in fact, there are different groups of “sustainability criteria” in order to consider the environmental impact of crops production, taking into account the impact of land usage conversion and its impact on total GHG emissions. The GHG savings should be at least 35%, 50% from 2017 and 60% from 2018 (Dir.

204
2009/28/EC), based on the Life Cycle methodology (Holma et Al. 2013; Offergeld 2012).
The 2009/30/EC Directive (FQD), that emended the 98/70/EC Directive, established minimum specifications for petrol and diesel fuels for health and environmental reasons. The aim is to reduce the fuel life cycle GHG emissions through the decarbonization of transport fuel, responsible of 20% of the GHG emissions in the EC.
In 2010, the total share of biofuels in transport was at 4.45%, while the share of renewable energy in transport was 4.70%. In 2010 the biofuels production was concentrated in five Member States (Germany, France, UK, Italy and Spain) that represented more than 70% of the European biofuels market, both in production and consumption. The target of 5.75% set in the Directive 2003/30/EC was not reached, but it has been abolished with the adoption of RED (Ecofys et Al. 2012).
Figure 1. Planned (blue) versus estimated (red) trend in EU biofuels Source: Com 2013/175/EC “Renewable energy progress report 2013”
As can be noted in Figure 1, even if the target of 5.75% share of biofuels for 2010 has been removed, previsions made by the European Commission are not positive regarding the ability of Europe to achieve 2020 targets (Com 2013/175/EC).
Both in RED and FQD, important target for biofuels production have been introduced; furthermore important requirements regarding the necessity to ensure an effective reduction of GHG compared to fossil fuel have been set. Nowadays several problems related to these calculations have been pointed out by the scientific community, due to data lack and the early state of methodology (Cherubini and Strømman 2011).

205
Indirect Land-Use change
As mentioned in the Joint Research Center of the European Commission report, the indirect land-use change occurs when the demand for a specific land use induces a change on other lands. Biofuels produced from arable land take space to produce something else. It occurs when bioenergy crops displace other crops causing the conversion of cropland, somewhere, to replace some portion of the displaced crops (Hertel et al. 2010). Impact on land use has increasing concerns over potential conflicts for food supplies and land protection (Searchinger et al. 2008).
Furthermore, there is a general scientific uncertainty related to the calculation of the indirect effects of biofuels production, not only related to GHG emissions, but also concerning global issues like prices stability, food security and loss of biodiversity (Panichelli and Gnansounou 2008). This uncertainty is underlined in the RED, with the necessity to develop a methodology to minimize GHG generation due to Indirect Land Use Change: ”The main indirect effects of ILUC are on biodiversity, GHG emissions and other environmental, social and economic factors; changes in agricultural commodity prices; and demand-induced yield increases.” (Dehue, et al. 2011).
In terms of environmental effects, it causes the conversion of tropical land or rain forest to agriculture. This means that the bio-energy system may require many years before enough emission reductions are created to compensate the emissions caused by ILUC (a carbon debt) (Searchinger et al. 2008). Indirect impacts on the greenhouse gases balance of biofuels through land use changes are predicted to be between 30 and 103 gCO2eq/MJ biofuels (Cornelissen and Dehue 2009). Biofuels together with bioproducts improves and provides new income and creates opportunities in rural areas (Naik at al. 2009; Havlik 2011). This is debatable since as biofuels demand is inelastic, and an increased demand could impact on certain manufacturers of food, and products who rely on the same raw materials.
Integrating ILUC in the European biofuels policy
Both the considered Directives (RED and FQD) underline that biofuels production should be sustainable and a number of sustainability criteria are set in order to reduce negative side-effects. However, an important element to consider is that the increase in demand for agricultural products along with that of first-generation biofuels will lead to the increase of cultivated land in the world. For this reason, the Directives required to submit in 2010 a report on the impact of biofuels on ILUC emissions of greenhouse gases. With Communication 810 "on indirect land-use change related to biofuels and bioliquids", the EU Commission presented the main results of several studies

206
commissioned on ILUC and the analysis carried out worldwide about the subject. The analysis of these results emphasized that ILUC is a phenomenon that is impossible to directly observe and measure, and therefore requires modeling.
The presented results are based on several studies by: the Institute for Prospective Technological Studies of the EC's Joint Research Centre; International Food Policy Research Institute (IFPRI); DG Energy; the Institute for Environment and Sustainability of the EC's Joint Research Centre (Com 2010/811/EC).
With the aim to optimally incorporate ILUC within the European policy, Community Institutions carried out two consultations analysing different policy options in response to ILUC. In 2009, a pre-consultation was carried out by the EC in which eight policy options were presented to several groups of stakeholders. In 2010, the second public consultation was conducted, with 145 respondents. As with the previous consultation, respondents can be divided into two groups: industry, farmers 'associations and overseas countries judged insufficient scientific basis to take account of ILUC; NGOs and a few industry groups have pushed for other sectors' introduction of ILUC in European policies (Di Lucia et al. 2012; European Commission 2010; Pilgrim & Harvey 2010). The common objective of these consultations, with different stakeholder groups, was to provide support for the development of a study with highest scientific reliability on ILUC and biofuels (Com 2010/811/EC). On these basis, the European Commission published in November 2011 the Impact Assessment on ILUC related to biofuels and bio-liquids. This document is based on the need to define new European strategies on biofuels. Both RED and FQD describe methodologies to determine GHG saving considering the emissions associated with direct land-use change, but the methodology for the calculation of ILUC is not specified.
The Impact Assessment is based primarily on the study of IFPRI, Global trade and environmental impact study of the EU biofuels (Laborde, 2011). It also considers the results of public consultations with stakeholders groups; technical consultations organized by the JRC, and the Member States National Renewable Energy Action Plans for 2020. The general objective of the document is to “Minimize the impact of indirect land-use change on greenhouse gas emissions of biofuels, within the wider policy objectives of the targets that by 2020 at least 10% of transport fuels are renewable and that greenhouse gas intensity in road transport fuels is reduced by at least 6% compared to 2010”.
As can be seen in Figure 2, the overall GHG emissions balance of biofuels estimated consumption, compared to fossil fuels, could be positive in 2020. It means that even considering the ILUC emissions, biofuels production will reduce emissions compared to the actual scenario.
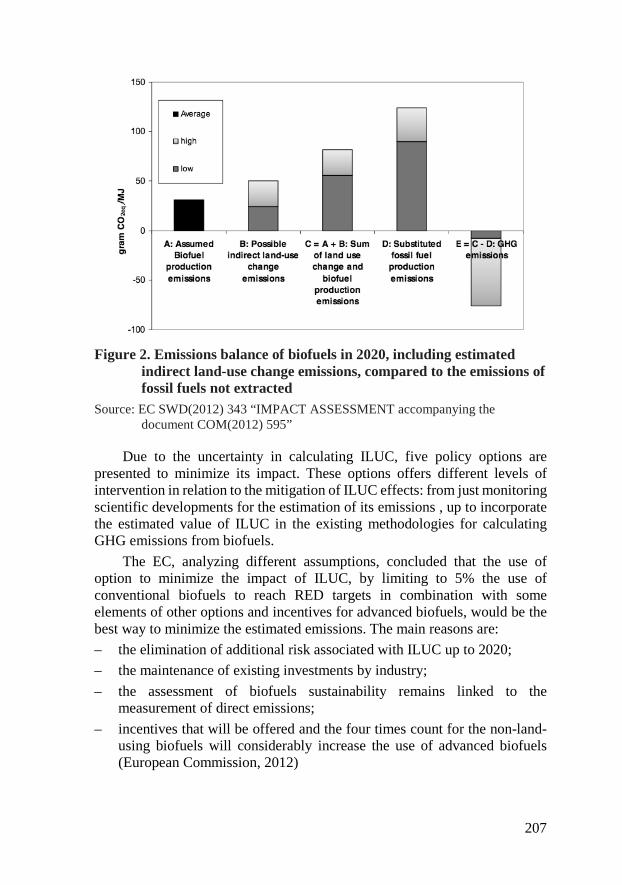
207
Figure 2. Emissions balance of biofuels in 2020, including estimated indirect land-use change emissions, compared to the emissions of fossil fuels not extracted
Source: EC SWD(2012) 343 “IMPACT ASSESSMENT accompanying the document COM(2012) 595”
Due to the uncertainty in calculating ILUC, five policy options are presented to minimize its impact. These options offers different levels of intervention in relation to the mitigation of ILUC effects: from just monitoring scientific developments for the estimation of its emissions , up to incorporate the estimated value of ILUC in the existing methodologies for calculating GHG emissions from biofuels.
The EC, analyzing different assumptions, concluded that the use of option to minimize the impact of ILUC, by limiting to 5% the use of conventional biofuels to reach RED targets in combination with some elements of other options and incentives for advanced biofuels, would be the best way to minimize the estimated emissions. The main reasons are:
– the elimination of additional risk associated with ILUC up to 2020;
– the maintenance of existing investments by industry;
– the assessment of biofuels sustainability remains linked to the measurement of direct emissions;
– incentives that will be offered and the four times count for the non-land-using biofuels will considerably increase the use of advanced biofuels (European Commission, 2012)

208
European proposal for biofuels policy
Following the publication of the Impact Assessment on ILUC, the European Commission in November 2012 issued a formal proposal for the consideration of the ILUC feed crops for biofuels. The proposal consists in the introduction of several amendments to the RED and FQD (Com 2012/595/EC). The aim is to limit the use of conventional biofuels, increase the GHG emissions performance requirements and support the dissemination of advanced (low ILUC) biofuels.
The main novelty of the proposal to amend the FQD is to set at least 60% of GHG emissions savings for the biofuels installation stating operation after July 2014.
With respect to RED, the main proposed changes are:
– share content of biofuels produced from cereal and other starch rich crops, sugars and oil crops to be no more of 5% of final consumption of energy in transport in 2020;
– end of public subsidies for biofuels produced from food crops and other biofuels after 2020, unless a clear evidence of substantial GHG savings;
– increasing incentives for advanced biofuels; after 2020 incentives just for advanced biofuels with low ILUC impact;
– a quadrupling of credits for second-generation biofuels and renewable liquid and gaseous fuels of non-biological origin (Annex IX Part A);
– in 2017, a policy review regarding the scientific evidences about ILUC (European Commission, 2012; Euractive, 2012)
Conclusions
''First generation of biofuels produced from agricultural feedstock could be progressively replaced in the future by advanced biofuels produced from lignocellulosic biomass, waste material or other non-food feedstock.'' (OECD-FAO 2012). The technology used to produce first generation biofuels is very economical and, as World Bank declares, the cost of second-generation (cellulosic) ethanol can be two to three times as high as the current price of gasoline on an energy equivalent basis. ''The economic potential market for second generation likely to be limited due to the amount of feedstock that can be produced at affordable costs with available land, as well as the costs of production relative to liquid fossil fuels.'' (World Bank 2010). European Union should only reach 8.6% of transport fuel by 2022. (OECD-FAO 2012). In fact, due to technological issues, economical production of second generation biofuels is not yet achieved. In addition, the introduction of the 5% limit for the production of first generation biofuels, would determine the

209
necessity to replace them with second generation and, up to 2020, it will not be economically suitable as identified in cost-benefit related analysis (IEA 2011).
Second-generation biofuels, which are typically more expensive to produce, also do not pose problems related to increased food prices as they do not come from food crops such as those from waste and residues, and climate impact is less if compared to conventional and first generation. But unless action is taken now, they are not likely to be available in any significant amounts in 2020.
Moreover, in 2010 only 1.4% of biofuels are produced from wastes, residues, non-food cellulosic material, and lignocellulosic material (double counting according to Functional Article 21.2 of RED) (Ecofys 2012).
The recent consultations (2012) with the stakeholders made after the analysis of several studies has led the European Commission to formulate a European proposal to control the potential negative effects of ILUC. Given the uncertainty on the topic, the proposed policy option has been issued to limit the use of first-generation biofuels; this is mainly due to the difficulty of modeling crop-specific factors for ILUC, because of the large differences in the impacts of each feedstock (Johnson, FX, Pacini, H., Smeets, E., 2012). Other countries, such as U.S., has decided to introduce the ILUC factor in the calculation of the environmental effects of biofuels production. In particular, the California Low Carbon Fuels Standard (LCFS) has inserted "lookup tables" for the most relevant fuels, that already include fuel-specific ILUC factors (CARB 2010). In this sense, the U.S. has implemented a policy to encourage the use of feedstock less land-reliant (Witcover at al. 2013). In Europe, the issue of ILUC related emissions has therefore evolved moving from a risk-indifferent approach in 2003 to a risk-taking approach with the RED (Di Lucia at al. 2012). The proposal made in 2012 which would amend the RED and FQD aims for a preventive approach. The preventive approach does not ensure that all of the negative effects of ILUC are taken into account, but aims to reduce the possibility of adverse effects (Di Lucia at al. 2012).
After more than a year from the publication of the proposal to reform the RED and FQD the European Parliament has not yet approved any final document.
The main reason concerns the difficulty to replace first-generation biofuels. Another reason to consider is the strong opposition from the European bioethanol and biodiesel industry, which has made enormous investments on first generation production plants. According to biofuels producers, this proposal cannot be adopted for several reasons: the scientific uncertainty concerning the calculation models ILUC; a negative impact on employment, industrialization of regions and farming; an increased fuel dependency of Europe; a reduction of investments for advanced biofuels, because the research is largely funded with the revenues generated by first

210
generation biofuels (EurObserv’ER 2013). Furthermore, according to the European Biodiesel Board (EBB), the importance covered by first generation biofuels in reducing the dependency on imported fuel from third countries should be considered. Because of these reasons the EBB argues that any cap for conventional biofuels should not be lower than 7% (EBB 2013).
This paper has summarized the main issues on the introduction of ILUC considerations in the European legislation. To this day the debate is still open and object of several studies carried out to clarify the scientific uncertainty related to biofuels production and consumption.
References
Afionis S., Stringer L.C., 2012, European Union leadership in biofuels regulation: Europe as a normative power?, Journal of Cleaner Production 32, 114-123.
Ahlgren S., Di Lucia L., 2014, Indirect land use changes of biofuel production – a review of modelling efforts and policy developments in the European Union, Biotechnology for Biofuels, 7:35.
Bernabè D., R. Bucchi, Rispoli C., Chiavetta C., Porta P.L., Bianchi C.L., Pirola C., Boffito D.C., Carvoli G., 2013, Land Use Change Impacts of Biofuel: A Methodology to Evaluate Biofuels Sustainability, INTECH, http://www.intechopen.com/, accessed March 2014.
Bringezu S., Schutz H., O'Brien M., Kauppi L., and Otto M., 2009, Towards sustainable production and use of resources: Assessing Biofuels, United Nations Environment Programme.
CARB (California Air Resources Board), 2010, Low Carbon Fuel Standard (LCFS), http://www.arb.ca.gov/fuels/lcfs/lcfs.htm, accessed March 2014.
Cherubini F. & Hammer Strømman A., 2011, Life cycle assessment of bioenergy systems: State of the art and future challenges, Bioresource Technology 102, 437–451.
Dehue B., Cornelissen S. & Peters D., Indirect effects of biofuel production, 2011,
Di Lucia L., Ahlgren S., Ericsson K., 2012, The dilemma of indirect land-use changes in EU biofuel policy – An empirical study of policy-making in the context of scientific uncertainty, Environmental science & policy 16, 9–19.
Di Lucia L., 2013, Too difficult to govern? An assessment of the governability of transport biofuels in the EU, Energy Policy 63, 81–88.
Di Lucia L. & Nilsson L., 2007, Transport biofuels in the European Union: the state of play, Transport Policy 14, 533–543.
Edwards R., Mulligan D. & Marelli L., 2010, Indirect Land Use Change from increased biofuels demand, JRC EUR 24485 EN
Easterly J. et al., 2007, Biofuels for Transport: global potential and implications for agriculture, Worldwatch Institute, Editor: Lisa Mastny, http://www.worldwatch.org/system/files/EBF008_1.pdf, accessed March 2014.

211
Ecofis et al., 2012, Renewable energy progress and biofuels sustainability, Report for the European Commission Tender Number: ENER/C1/463-2011-Lot2, http://ec.europa.eu/energy/renewables/reports/doc/2013_renewable_energy_progress.pdf, accessed March 2014.
European Biodiesel Board, 2013, EBB Updated Position: EU legislative proposal on the revision of EU biofuels policy based on ILUC assumptions, www.ebb-eu.org Accessed April 2014.
European Commission, 2011, Public consultation on renewable energies: ILUC and biofuel,http://ec.europa.eu/energy/renewables/consultations/2010_10_31_iluc_and_biofuels_en.htm, accessed March 2014.
European Commission, “IMPACT ASSESSMENT accompanying the document COM(2012) 595 ”, Staff and joint staff working documents, SWD(2012) 343.
European Biofuels Technology Platform, 2011, Pure Plant oil as fuel Technical Aspects and Legislative Context, http://www.biofuelstp.eu/downloads/ppo/pure-plant-oil-as-fuel.pdf, accessed March 2014.
EC Communication 2006/34 “An EU Strategy for Biofuel”.
EC Communication 2006/848 “Renewable Energy Road Map”.
EC Communication 2010/811 “On indirect land-use change related to biofuels and bioliquids”.
EC Communication 2012/595 “Proposal for a Directive Of The European Parliament And Of The Council amending Directive 98/70/EC relating to the quality of petrol and diesel fuels and amending Directive 2009/28/EC on the promotion of the use of energy from renewable sources”.
EC Communication 2013/175 “Renewable energy progress report 2013”.
EC Directive 2003/30 “On the promotion of the use of biofuels or other renewable fuels for transport”.
EC Directive 2009/28 “On the promotion of the use of energy from renewable sources and amending and subsequently repealing Directives 2001/77/EC and 2003/30/EC”.
Euractive, 2012, EU calls time on first-generation biofuels, http://www.euractiv.com/climate-environment/eu-signals-generation-biofuels-news-515496, accessed March 2014.
EurObserv’ER, 2013, Biofuels Barometer, SYSTÈMES SOLAIRES le journal des énergies renouvelables 216, http://www.energies-renouvelables.org/observ-er/stat_baro/observ/baro216_en.pdf, Accessed April 2014.
FAO, 2008, State of Food and Agriculture 2008: Biofuels—prospects, risks and opportunities, fao.org/docrep/fao/011/i0100e/i0100e.pdfS, accessed March 2014.
FAO, IFAD, IMF, OECD, UNCTAD, WFP, World Bank, WTO, and IFPRI, 2011, Price Volatility in Food and Agricultural Markets: Policy Responses, Interagency Report to the G20, UN Food & Agriculture Organization, /http://www.fao.org/fileadmin/templates/est/Volatility/Interagency_Report_to_the_G20_on_Food_Price_Volatility.pdfS, accessed March 2014.

212
Gawel, E., Ludwig, G., 2011, The iLUC dilemma: how to deal with in direct land-use changes when governing energy crops? Land Use Policy 28(4), 846-856.
Havlìk P., et al., 2011, Global land-use implications of first and second generation biofuel targets, Energy Policy 39, 5690-5702.
Holma A., Koponen K., Antikainen R., Lardon L., Leskinen P., Rouxe P., 2013, Current limits of life cycle assessment framework in evaluating environmental sustainability e case of two evolving biofuel technologies, Journal of Cleaner Production 54, 215-228.
International Energy Agency (IEA), 2011, World Energy Outlook 2011, IEA, Paris.
Johnson, F. X., Pacini, H., Smeets, E., 2012, Transformations in EU biofuels markets under the Renewable Energy Directive and the implications for land use, trade and forests, Occasional Paper 78. CIFOR, Bogor, Indonesia.
Kelemen, D.R., 2010, Globalizing European Union environmental policy, Journal of European Public Policy 17, 335-349.
Laborde D., 2011, Assessing the Land Use Change Consequences of European Biofuel Policies, ATLASS Consortium Specific Contract No SI2. 580403, http://trade.ec.europa.eu/doclib/docs/2011/.pdf, accessed March 2011.
Linares P. & Perez-Arriaga I.J., 2013, A sustainable framework for biofuels in Europe, Energy Policy 52, 166–169.
Naik S.N., Goud V.V., Rout P.K., Dalai A.K., 2010, Production of first and second generation biofuels: A comprehensive review, Renewable and Sustainable Energy Reviews 2, 578–597.
Offergeld T., 2012, Indirect Land Usage Change from Biofuel production, Master Thesis in Sustainable Development, Uppsala University, http://uu.diva-portal.org/smash/get/diva2:514209/FULLTEXT01.pdf, accessed March 2014.
Panichelli L., Gnansounou E., Estimating greenhouse gas emissions from indirect land-use change in biofuels production: concepts and exploratory analysis for soybean based biodiesel production, 2008, Journal of Scientific and Industrial Research 11, 1017-1030.
Pilgrim, S., Harvey, M., 2010, Battles over biofuels in Europe: NGOs and the politics of markets, Sociological Research Online 15, 4.
Searchinger, T., R. Heimlich, R.A. Houghton, F. Dong, A. Elobeid, J. Fabiosa, S. Tokgoz, D.Hayes, & T.H. Yu, 2008, Use of U.S. Croplands for Biofuels Increases Greenhouse Gasesthrough Emissions from Land Use Change, Sciencexpress, sciencexpress.org, Accessed March 2014.
Vogler, J., 2003, The external environmental policy of the European Union. In: Stokke, O.S., Thommessen, Ø.B. (Eds.), Yearbook of International Cooperation on Environment and Development 2003/2004, Earthscan, London, 65-72.
Witcover J., Yeh S., Sperling D., 2013, Policy options to address global land use change from biofuels, Energy Policy 56, 63–74.
213
Joanna Ptas ińska-Marcinkiewic z Cow’s mi lk - production, consumption and healt h promoting compounds
COW’S MILK - PRODUCTION, CONSUMPTION AND HEALTH PROMOTING COMPOUNDS
Joanna Ptasińska-Marcinkiewicz
Department of Food Commodity Science,Cracow University of Economics, [email protected]
Introduction
Milk and dairy products are considered to be the most complete, balanced and nutritious foods used by humans since the dawn of the century. Because it is produced as a food source for a neonate, milk is a nutritionally wholesome product, i.e., not only contains all the necessary nutrients but contains it in such quantities that are sufficient in the first period of mammals life. Milk protein is a nutritious protein of high biological value, contains all the essential amino acids in quantitative ratio corresponding human needs. At the same time milk proteins have a high absorption and are easily digestible. Milk is also a rich source of B vitamins (especially riboflavin and B12) and vitamin D. It contains a number of minerals, including easily absorbed calcium.
However the traditional view of the role of milk has been greatly expanded in recent years. It is no longer just the nutritional subsistence of infants, a source of nutrients for the healthy growth of children and nourishment of adult humans. It have recently been used as a functional food due to its physiological impact in promoting human health. Alongside its major proteins (casein and whey), milk contains biologically active compounds, which have biochemical functions and plays significant role, inter alia in human metabolism. These bioactive components are either naturally present in milk, such as conjugated linoleic acid, or are released in large amounts through protein hydrolysis by the digestive or microbial enzymes to produce bioactive peptides. These compounds are formed inside the gastrointestinal tract. Both have demonstrated benefits to human health and well being (Park and Haenlein 2013; Alhaj and Kanekanian 2014).
Milk production and consumption
Approximately 150 million households worldwide are engaged in milk production. In recent decades, developing countries have significantly

214
increased their production and hence share in global dairy production. The most of the expansion in milk production has been in South Asia, which is the main driver of milk production growth in the developing world. Milk production in Africa due to adverse climatic conditions and poverty is growing more slowly than in other developing regions. Unfortunately, this growth is mostly the result of an increase in numbers of producing animals rather than a rise in productivity per head (Milk production).
Table 1. Cows milk production (million tons)
Country /year
2004 2005 2006 2007 2008 2009 2010 2011 2012
USA 77,5 80,3 82,5 84,2 86,2 85,9 87,5 89,0 90,9 India 37,3 39,8 41,1 44,6 47,0 47,8 54,9 53,5 54,0 China 22,9 27,8 32,3 35,6 35,9 35,5 36,0 36,9 37,8 Brazil 24,2 25,4 26,2 26,1 28,4 30,0 30,7 32,1 32,3 Russian Federation
31,9 30,9 31,2 31,9 32,1 32,3 31,6 31,4 31,6
Germany 28,2 28,5 28,0 28,4 28,7 29,2 29,6 30,3 30,5 France 24,4 24,9 24,2 24,4 23,6 22,7 23,3 24,4 24,0 New Zealand
15,0 14,6 15,2 15,6 15,2 15,7 17,0 17,9 20,1
Turkey 9,6 10,0 10,9 11,3 11,3 11,6 12,4 13,8 16,0 UK 14,6 14,5 14,3 14,0 13,7 13,2 14,1 13,8 13,9 Poland 11,8 11,9 12,0 12,1 12,4 12,4 12,3 12,4 12,7 World 528,
0 544,
1 560,
1 572,
6 583,
1 586,
2 597,
1 607,
4 620,
4 Source: own ellaboration based on: World milk production, FAOSTAT
Since the early eighties, the world production of cow's milk steadily grows. In the last three decades, it has increased by more than 40%. In 2012, it reached more than 620 million tons. Also in the majority of countries in the top ten producers of milk it is observed the stable growth trend. Only in countries such as Russian Federation, Germany, France, UK and Poland the cow's milk production remained at a constant level. In the European Union countries it is most likely due to the existence of the milk quota.
The top ten producing countries accounted for more than 55% of the world cow’s milk production. For many years USA has been the largest cow's milk producer in the world, producing nearly 91 million tons in 2012 (14.6% of world production). India is the second largest cow's milk producer, accounting for almost 9% of world production and producing 54 million tons in 2012 (World milk production). For seven years in third place has been China, with production at the level of nearly 38 million tons in 2012.

215
Of the ten largest milk producing countries, New Zealand and Turkey have shown the largest percentage growth from 2011 to 2012 at 12.1% and 15.8%, respectively (World milk production). However, observing the situation in the longer term, over the last 10 years it was Turkey and China that have shown the largest percentage increase in production. In contrast, quantitatively the largest increase was recorded in India and China. The most spectacular production growth was noted in China, where in 2000 the production of cow's milk was 8.6 and in 2007 grew up to 35.6 million tons (FAOSTAT). The countries with the highest milk surpluses are New Zealand, the United States of America, Germany, France, Australia and Ireland. On the conrary China, Italy, the Russian Federation, Mexico, Algeria and Indonesia have the highest milk deficits (Milk production).
It is estimated that more than 6 billion people on the globe consume milk and milk products, the majority live in developing countries. As one can expect the per capita consumption of milk and milk products is higher in developed countries. However the gap is narrowing as the milk consumption in developing countries has increased almost twofold since the early 1960s. Growing demand for milk and milk products is particularly observed in highly populated countries such as China, Indonesia and Viet Nam. It is expected that in South Asia, the consumption of milk and milk products will increase by 125% by the year 2030. Unfortunately the consumption of milk has grown more slowly than that of other livestock products (Milk and milk products).
Some of the developing countries have a long tradition of milk production, and milk and its products have an important role in the diet. Other countries have established significant dairy production only recently - China (Milk production). Nevertheless in general milk provides only 3% of dietary energy supply, 6 – 7% of dietary protein supply and about 6 - 8% of dietary fat supply in Asia and Africa, compared with 8 – 9% in Europe and Oceania; 19% in Europe; 11 – 14% in Europe, Oceania and the Americas, respectively. High milk consumption (> 150 kg/capita/year) is in: Argentina, Armenia, Australia, Costa Rica, Europe, Israel, Kyrgyzstan, North America and Pakistan, while low milk consumption (< 30 kg/capita/year) is noted in: China, Ethiopia, most of Central Africa and most of East and Southeast Asia (Milk and milk products).
Milk health promoting components
Lactose
Lactose is the main milk sugar. It is the carbon and energy source for the human body, and an important nutrient. In the presence of lactase enzyme, has a positive effect on the bioavailability of minerals, as it facilitates intestinal

216
absorption of calcium, magnesium and phosphorus and the better use of vitamin D. It is also the only source of galactose, ingredient required for growth and development of the central nervous system. In infants and neonates galactose is important in stimulating insulin secretion, because it interacts with glucose. While in patients with diabetes does not increase the level of glucose in the blood, so it can be a good source of carbohydrates and protein. Moreover, lactose as a major carbon source is necessary for the development of microorganisms that are part of the normal bacterial flora of the colon. In the digestive tract lactose is easily converted to lactic acid stimulating indigenous intestinal flora and thereby maintaining the normal functions of the GI tract (Crisa 2013, Kłobukowski and Kozikowski 2008, Nadolna et al. 2001).
Carbohydrates other than lactose include glucose, galactose, oligosaccharides, glycopeptides, glycoproteins, and small amounts of nucleotide sugars. Oligosaccharides included in the milk have significant antigenic properties, and are valuable because they affect the development of intestinal microflora (Crisa 2013).
Proteins
Milk is also a good source of protein, which is a basic building component of our body. According to nutritionists milk is a "nutritionally dense" product, that is, it has a lot of nutrients relative to the amount of energy delivered (Gawęcki 2003, Kłobukowski and Kozikowski 2008). Milk proteins contain approximately 95% of nitrogen. The remaining part is called non-protein nitrogen or non-protein nitrogen compounds. These are mainly peptides, urea, free amino acids, creatine, creatinine, uric acid and ammonia (Jaworski and Kuncewicz 2008).
Milk proteins revealed the presence of 19 amino acids, including all exogenous and therefore milk is a wholesome source of protein, which perfectly covers the daily requirement of the human body for the essential amino acids. The high content of the lysine in the protein of milk, complete all the less valuable protein products of plant origin (Kłobukowski and Kozikowski 2008).
High biological value of milk proteins is also due to their high digestability and bioavailability (assimilability). True digestibility coefficient is as high as 97%, while for soy or peas it amounts to 91% and 89%, respectively. Protein efficiency ratio (PER) of milk is 3.1. For comparison, these indicators for beef, soy and wheat are 2.9, 2.1 and 1.5, respectively (Kłobukowski and Kozikowski 2008).
In the construction of proteins can be distinguished two main phases: the unstable micellar phase composed of casein proteins bonded with the help of

217
particles of calcium phosphates and small amounts of magnesium, sodium, potassium and citrate, and soluble phase composed of whey proteins, among which the largest share has β-lactoglobulin and α-lactalbumin. Casein proteins in cow's milk are in the range 2.3-2.6%, which constitute 76-86% of the total milk protein by weight, and the whey proteins around 17-22%. Casein micelles scatter light and give milk its opaque, matte white color (Jaworski and Kuncewicz 2008, Jurczak 2005, Swaisgood 2003).
Casein is a high-value protein. Its biological value is close to the meat and greatly exceeds the value of the proteins of cereals and legumes (Kłobukowski and Kozikowski 2008). It is the most useful as a building material for the synthesis of hemoglobin and plasma proteins (Gawęcki 2003). Milk whey proteins contain more exogenous amino acids than casein. They are a good source of lysine, threonine, isoleucine, tryptophan and valine. The most valuable protein is α-lactalbumin that has the largest amount of tryptophan of all milk proteins (Kłobukowski and Kozikowski 2008).
Bioactive peptides
Enzymatic hydrolysis of milk proteins can lead to the release of protein fragments having specific biological activity. They can act antihypertensive, antibacterial, antioxidant, opioid, increased resistance, functioning as immunomodulators or affect the ability to bind and transport the minerals, as well as inhibit blood platelet aggregation process. These fragments are known as bioactive peptides and are produced during digestion in the intestines or in the technological processing of milk (milk fermentation and cheese maturation). Enzymes such as digestive, naturally occurring in milk, coagulants and microbial enzymes, especially those from adventitious or lactic acid starter bacteria, usually generate these bioactive compounds. Several milk-derived peptides have shown multifunctional properties, and specific peptide sequences have two or more distinct physiological activities. Thanks to its multifunctionality, milk peptides are considered to be highly significant components of milk in the promotion of healthy nutrition and are used in the pharmaceuticals and compounds of functional food. It should be added that the milk proteins show the highest potential biological activity and are the richest source of bioactive peptides (Dziuba, Iwaniak and Dziuba 2008, Park 2009, Ziajka, Kowalik and Łobacz 2008).
Biologically active peptides released from caseins and whey proteins contain from 2 to 20 amino acids per molecule on average. Most are made up of two or three amino acids but there are also those, which contain 25. Beta casein composed of 209 amino acids contains up to 70 fragments corresponding to various bioactive peptides. Also, alpha and kappa casein, whey proteins and lactoferrin are the source of many bioactive peptides performing numerous health promoting functions (Dziuba, Iwaniak and Dziuba 2008, Park 2009).

218
Different processing techniques are available for fractionation, isolation purification of such components from colostrum, milk and cheese whey, also on the industrial scale. Biomining and marketing of dairy-derived functional ingredients has emerged as a new lucrative business sector for the dairy industry and specialized bioindustries. A few milk protein and peptidebased products as well as growth factors have already been commercialized as components of both dairy and nondairy food and even pharmaceuticals. Thus the dairy industry has achieved a leading role in the development of functional foods (Korhonen 2009).
Lipids
The content of fat in cow‘s milk is from 2.8% even up to 5.9% (Kłobukowski and Kozikowski 2008). The main components of milk fat are the triacyloglycerols, which are esters of glycerol and fatty acids. Over 450 different fatty acids are present in milk fat, but only a relatively small number affect the nutritional value of the fat. Fatty acids modulate lipid metabolism and other physiological systems that influence risk factors for a number of chronic diseases. The effects on health can be beneficial or harmful, depending on the specific fatty acids and the mix of fatty acids. Unsaturated fatty acids are believed to have positive implications for human health by reducing the risk of cardiovascular disease and they may also reduce the incidence of some cancers, asthma, diabetes and a number of other conditions (Woods et al. 2005).
Noteworthy is also the fact that milk fat shows the highest digestibility expressed by both speed and absorption coefficient at the level of 97-99%. High digestibility results from its structure and composition. Good dispersion of fat causes that small fatty globules can be absorbed even without prior hydrolysis in the gastrointestinal tract (Kłobukowski and Kozikowski 2008). Besides ruminant milk fat is characterized by the presence of short and medium chain fatty acids produced by de novo synthesis of fatty acids from dietary digestive products, acetate and butyrate (Woods et al. 2005). As water-soluble these acids are absorbed in the intestinal wall without resynthesis, transported to the liver and directly metabolized. Short and medium chain fatty acids also promote the functions of the human digestive system in a number of positive ways. They stimulate the development of lactic bacteria in the digestive tract and inhibit the growth of putrefactive bacteria, fungi and molds (Kłobukowski and Kozikowski 2008).
Short chain fatty acids accounts for approximately 11% of saturated fatty acids present in bovine milk. Generally, the fat in 65-70% consists of saturated fatty acids and the most important from the quantitative view point are palmitic (43%), myristic (17%) and stearic acid (16%). Monounsaturated fatty acids represent about 25-30% of the total fatty acids. The dominant is oleic

219
acid. The share of polyunsaturated fatty acids does not exceed 5%, and the main representatives are linoleic and linolenic acid. They belong to the essential fatty acids and account for about 1,6% and 0,7% by weight of the total fatty acids (Kłobukowski and Kozikowski 2008, Lindmark Mansson 2008). The longer chain fatty acids (C18) and approximately 50% of the C16 fatty acids strongly reflect the cow’s diet as they are obtained directly from the fodder. Due to this fact their content can be modiffied to some extend (Woods et al. 2005). In milk fat there are also natural trans-fatty acids, which account for about 2-8%. Vaccenic acid is the main one and its content is about 45-60% of all trans fatty acids in milk. It is an intermediate product in the biohydrogenation of linolenic acid C18:3 cis-9_12_15 and linoleic C18:2 cis-9_12 and it is the precursor in the synthesis of the main CLA (conjugated linoleic acid) isomer, i.e. rumenic acid C18:2 cis-9-trans-11 (Park et al. 2007, Tsiplakou, Kominakis and Zervas 2008, Woods et al. 2005). CLA (this name includes a collective term to describe all positional and geometric isomers of linoleic acid containing conjugated double bonds, that is two double bonds separated by a single bond), in particular isomer of rumenic acid, whose volume may be as high as 73-95% of the total amount of CLA, has anticarcinogenic, antidiabetic, antiatherogenic effect, helps fight obesity and coronary disease, reduces the signs of arteriosclerosis, also improves the immune system (immunomodulatory functions) and protects against osteoporosis. Results of numerous studies on CLA suggests that its content in milk depends largely on diet offered to animals and individual characteristics of ruminant (Contarini, Pelizzola and Povolo 2009, Jensen 2002, Lock and Bauman 2004, Korhonen 2009, Meluchova et al. 2008, Tsiplakou, Mountzouris and Zervas 2006). Seasonal variations are very marked, with values during the summer period often up to three to four times higher than winter values (Parodi 1997).
Although 97–98% of lipids are triacyloglycrols, small amounts of di- and monoacyloglycerols, free cholesterol and cholesterol esters, free fatty acids, and phospholipids are also present in milk.
Phospholipids in bovine milk account for 0.2–1.0 g/100 g of total lipids, where they are associated with the milk fat globule membrane. Sphingomyelin represents about one third of total milk phospholipids; and its variation in content depend on season and the cows' stage of lactation (Parodi 1997). There is considerable evidence that phospholipides, especially sphingomyelin have beneficial health effects, such as regulation of the inflammatory reactions, chemopreventive and chemotherapeutic activity on some types of cancer. It also inhibits absorption of the cholesterol (Contarini and Povolo 2013).
Sterols constitute minor fraction of total milk lipids and their main component is cholesterol. Its content in cow's milk is only about 300 mg/100 g of fat, i.e. about 10 mg/100 ml of milk (Park et al. 2007).

220
Vitamins
Vitamins A, B6, B12, C, D, K, E, thiamine, niacin, biotin, riboflavin, folates, and pantothenic acid are all present in milk. Among the fat-soluble vitamins milk is a good source of vitamins A and D. However, their content is subject to seasonal fluctuations. As evidenced by the test conducted in the U.S. two cups of cow’s milk per day appears sufficient to maintain healthy vitamin D and iron stores for most children. During the wintertime vitamin D supplementation was needed particularly among children with darker skin pigmentation (Maguire et al. 2013). Milk is also an excellent source of B vitamins, not only because of their high content but also because of the good bioavailability. One liter of milk covers 100% of the daily requirement for vitamin B2 and B12, and 30% of the folic acid. (Kłobukowski and Kozikowski 2008).
Minerals
Milk is the good source of many minerals necessary for proper functioning of human organism. Mineral elements occur in milk as inorganic ions and salts, as well as part of organic molecules, such as proteins, fats, carbohydrates and nucleic acids (Zamberlin et al. 2012). The best known elements are calcium, phosphorus and potassium. Moreover milk also contains magnesium, sodium, chlorine, iron, copper, zinc, iodine, sulfur, cobalt, fluorine, selenium, manganese, molybdenum, chromium and other trace elements (Gaucheron 2005, Jaworski and Kuncewicz 2008, Zamberlin et al. 2012).
Calcium is one of the most important nutrients delivered by milk and its products. Milk has the highest content of calcium from all the food products (Kłobukowski and Kozikowski 2008). The RDA (Recommended Dietary Allowances) for calcium is difficult to reach without consuming milk and dairy products (Zamberlin et al. 2012). Calcium has a beneficial effect on bone mineralization, as well as the condition of teeth. Calcium has also been shown to be beneficial in reducing cholesterol absorption, and in controlling body weight and blood pressure (Park 2009). Together with phosphorus, magnesium, sulfur, fluorine, is the building block of bones, teeth, skin and hair (Kłobukowski and Kozikowski 2008). Moreover calcium, magnesium and potassium in the human body have a role of deacidifying agents, are factors that shift the acid-base balance towards alkaline. Eating the right amount of milk and its products, we are able to ensure the body's daily requirement for calcium in 100%, and for potassium, chlorine, magnesium and zinc, and sodium in 75%, 35%, 30% and 25%, respectively (Kłobukowski and Kozikowski 2008). Man assimilates up to 80% of calcium from cow's milk, while for comparison with soya milk only 13%. If trying to replace one glass

221
of milk by other foods one should eat two loaves of bread, a few pork chops, a pound of broccoli, cabbage or carrots (Czy piecie mleka…., Nadolna et al. 2001).
Some minerals, such as zinc, magnesium, iron, copper, manganese and molybdenum are required by enzymes as cofactors, other (iron, zinc, copper, iodine, cobalt) are responsible for maintaining the proper composition of tissues and body fluids, formation of hemoglobin, or regulation of circulatory system in the body. Important role in water-electrolyte balance and in maintaining acid-base balance have sodium, potassium and chlorine. Selenium, manganese, molybdenum and chromium affect the functioning of various organs (Kłobukowski and Kozikowski 2008).
Conclusions
In recent years, in media goes a heated debate about the impact of milk on human health. Both opponents and supporters present their arguments outlining more or less serious and credible arguments. Although adverse reactions to some of the components in milk and dairy products are reported, it is not possible to unambiguously conclude that they are unhealthy products. Allergies and undesirable reactions are experienced by a small sector of society. As it was demonstrated in this article milk contains a wide variety of chemical compounds, which reveal biological activity, biochemical functions and plays significant role in human nutrition, health and well being. Thus the benefits of consuming milk and its products far outweigh negative health risk linked to dairy products. This is supported by, among others, constantly growing popularity of dairy functional products in the world.
References
Alhaj O.A., Kanekanian A., 2014, Milk-derived Bioactive Components from Fermentation, in: Kanekanian A.(ed) Milk and Dairy Products as Functional Foods, Wiley-Blackwell ans SDT, West Sussex, UK, pp 237-288.
Crisa A., Milk Carbohydrates and Oligosaccharides, 2013, in: Park Y.W., Haenlein G. F.W., Milk and Dairy Products in Human Nutrition: Production, Composition and Health, Wiley-Blackwell, West Sussex, UK, pp129-147.
Contarini G., Pelizzola V., Povolo M., 2009, Content of conjugated linoleic acid in neutral and polar lipid fractions of milk of different ruminant species; International Dairy Journal, 19, 342–344.
Contarini G. Povolo M., 2013, Phospholipids in milk fat: composition, biological and technological significance, and analytical strategies, Int. J. Mol. Sci. 14 (2), 2808-2831.

222
Czy picie mleka jest zdrowe? Argumenty zwolenników i przeciwników picia mleka, article on: http://www.poradnikzdrowie.pl/zywienie/zasady-zywienia/Czy-picie-mleka-jest-zdrowe-argumenty-zwolennikow-i-przeciwnikow-picia-mleka_36296.html, accessed 22 April 2014
Dziuba J., Iwaniak A., Dziuba M., Białka mleka jako żródło bioaktywnych peptydów, 2008, in: Ziajka S. (ed) Mleczarstwo 1, Wydawnictwo Uniwersytetu Warmińsko-Mazurskiego w Olsztynie, Olsztyn, pp133-151.
FAOSTAT, Production, Livestock Primary, table: milk, whole fresh cow, http://faostat.fao.org/site/569/default.aspx#ancor, accessed 10.04.2014.
Gaucheron F., 2005, The minerals of milk, Reprod. Nutr. Dev., 45, 473–483.
Gawęcki J., 2003, Białka pochodzenia zwierzęcego, ich charakterystyka i znaczenie w żywności Białka w żywności i żywieniu, in: Gawęcki J. (ed) Wyd. AR, Poznań, pp 31-36.
Jaworski J., Kuncewicz A., Właściwości fizykochemiczne mleka, 2008, in: Ziajka S. (ed) Mleczarstwo 1, Wydawnictwo Uniwersytetu Warmińsko-Mazurskiego w Olsztynie, Olsztyn, pp 53-99.
Jensen, R. G., 2002, The composition of bovine milk lipids: January 1995 to December 2000, J. Dairy Sci., 85, 295–350.
Jurczak M., 2005, Mleko – produkcja, badanie, przerób; Wydawnictwo SGGW, Warszawa.
Kłobukowski J., Kozikowski W., Wartość żywieniowa mleka, 2008, in: Ziajka S. (ed) Mleczarstwo 1, Wydawnictwo Uniwersytetu Warmińsko-Mazurskiego w Olsztynie, Olsztyn, pp108-132.
Korhonen H. J., 2009, Bioactive Components in Bovine Milk, in: Park Y.W. (ed) Bioactive Components in Milk and Dairy Products, Wiley-Blackwell, West Sussex, UK, pp 15-42.
Lindmark Månsson H., 2008, Fatty acids in bovine milk fat, Food Nutr. Res., 52, PMC, http://www.ncbi.nlm.nih.gov/pmc/articles/PMC2596709/, accessed 12 May 2014
Lock A.L., Bauman D.E., 2004, Modifying milk fat composition of dairy cows to enhance fatty acids beneficial to human health, Lipids, 39 (12), 1197-206.
Maguire J.L., Lebovic G., Kandasamy S., Khovratovich M., Mamdani M., Birken C.S., Parkin P.C., 2013, The Relationship Between Cow's Milk and Stores of Vitamin D and Iron in Early Childhood, Pediatric 1 (31),144-151.
Meluchova B., Blasko J., Kubinec R., Gorova R., Dubravska J., Margetin M., Sojak L., 2008, Seasonal variations in fatty acid composition of pasture forage plants and CLA content in ewe milk fat, Small Ruminant Research, 78, 56–65.
Milk and milk products, http://www.fao.org/agriculture/dairy-gateway/milk-and-milk-products/en/, accessed 12.04.2014.

223
Milk production, http://www.fao.org/agriculture/dairy-gateway/milk-production/en/, accessed 23.04.2014
Nadolna I., Kunachowicz H., Przygoda B., Iwanow K., 2001, Mleko a zdrowie, Wydawnictwo IŻŻ, Warszawa.
Park Y.W., 2009, Overview of Bioactive Components in Milk and Dairy Products, in: Park Y.W. (ed) Bioactive Components in Milk and Dairy Products, Wiley-Blackwell, West Sussex, UK, pp 3-12.
Park Y.W., Haenlein G. F.W., 2013, Milk and Dairy Products in Human Nutrition: Production, Composition and Health, Wiley-Blackwell, West Sussex, UK.
Park Y.W., Juarez M., Ramos M., Haenlein G. F.W., 2007, Physico-chemical characteristics of goat and sheep milk, Small Ruminant Research, 68, 88–113.
Parodi P. W., 1997, Cows' Milk Fat Components as Potential Anticarcinogenic Agents, J. Nutr. June 1, vol. 127 no. 6, 1055-1060.
Swaisgood H. E., 2003, Chemistry of caseins, in: Fox, P. F., McSweeney P.L.H. (ed) Advanced Dairy Chemistry, Vol. 1: Proteins. 3nd ed. Springer Science +Bussines Media: New York, pp 139-202.
Tsiplakou E., Kominakis A., Zervas G., 2008, The interaction between breed and diet on CLA and fatty acids content of milk fat of four sheep breeds kept indoors or at grass, Small Ruminant Research, 74, 179–187.
Tsiplakou E., Mountzouris K.C., Zervas G., 2006, The effect of breed, stage of lactation and parity on sheep milk fat CLA content under the same feeding practices, Livestock Science, 105, 162-167.
Woods V.B., Forbes E.G.A., Easson D.L., Fearon A.M., 2005, Dietary sources of unsaturated fatty acids for animals and their subsequent availability in milk, meat and eggs, Agri-Food and Biosciences Institute (AFBI), Hillsborough.
World milk production, 2014, DairyCo Market Information, http://www.dairyco.org.uk/market-information/supply-production/milk-production/world-milk-production/, accessed 10.04.2014.
Zamberlin S.,. Antunac P., Havranek J., Samarzija D., 2012, Mineral elements in milk and dairy products, Mljekarstvo, 62 (2), 111-125.
Ziajka S., Kowalik J., Łobacz A., 2008, Funkcjonalne produkty mleczne; Przegląd Mleczarski, 2008, 7, 4-8.

224

225
Shim, Hyo-Young, Par k, Jong-Chan A STUDY ON THE CR EATIV E D ESIGN EDUCATION M ETHOD BY APP LYING DESIGN METHOD OLOGY: FOCU SING ON MID D LE SCHOOL D ESIGN EDUCATION PR OGRAM
A STUDY ON THE CREATIVE DESIGN EDUCATION METHOD BY APPLYING DESIGN
METHODOLOGY: FOCUSING ON MIDDLE SCHOOL DESIGN EDUCATION PROGRAM
Hyo-Young Shim1, Jong-Chan Park2
1Dept. of Industrial Design, Ewha Womans University, [email protected]
2 Division of Design, Incheon National University, [email protected]
Introduction
Recently, in the variety of education disciplines, Design Methodology is acting as a tool for creative thinking line and is taking matters based on Design Methodology. The Methodology in design is one of the tools for solving problems and should be given different way of presentation by personality through many kinds of the methodology that can be various tools. It is exploited as a tool in design education programs and then can create outputs through interaction to draw the creative problem solving ability. For this reason this study has a system of programming to progress effective design classes by applying Design Methodology in art class and science class convergence education program. In this regard science, “Science is concerned knowledge and design is mainly concerned acts”. Science observes mainly by keeping objective neutrality on purpose but design takes functional actions for having special purpose. Science is sequential, systematic and defined clearly and only limited by order but design doesn’t care those. A scientific approach is concise and clear but design solution is under the control of intuition, thinking convention, learning process from another person and their own subjectification. The result in science is generalized theory about particular phenomenon. Design, on the other hand, seeks for creative and specific solution based on generalized theory. Schematized this relationship is as below. (2003. Yeon Ung Im)

226
Figure 1.The thought learning process of design and science (2003.Yeon
Ung Im) Source: Yeon Ung Im. 2003. A Study on the Design Methodology
In this study fragmentary solution that another knowledge theory field have is used in the way to carry out a design convergence subject by applying design methodology in design process education program. First, among design methodology chose applicable process and then designed to apply selected process to the program. Second, simulation teaching is held for middle school students with design program. Finally, program was verified through post – evaluation after program application.
Design methodology concept and method of study
Design concept and Process as a design methodology
Design study methodology is study method to use problem solving method by introducing the way of scientific and systematic approach methods system engineering technique (overall industrial –engineering method system that apply of many technology in overall and systematic to interpret and solve complex problems). Design process can be said a theory on design problem solving processes among many design method fields. Design methodology is supposed through specific concepts adjustment sometimes, found concrete concepts and one of definite process through new concepts approach (Choi, 2010). Design phenomenon is assembled design problems premises; the problem is described in concise interrogative sentence: like this, solve the problems by surveying the relationship between two and two or more variables which have formed matters and particularly these variables consist of conceptual systems. Therefore, the starting point of the problem-solving is to grasp concepts about that (Woo,1996). It is necessary to introduce process concept for creative thinking process based on design problem-solving. That design thinking processes also induce step-by-step thought and enable structural approaches and solutions about design problems. (Seong Su Jeon

227
2005) can’t systematize uniformly thinking process formed at an individual’s inner.
In other words, it is necessary to make the creative resulting content by deducting the reasonable sequence and departmentalizing the requisite job steps to gain the end result. Dewey (1910) present problem- solving processes model after considering astringency and dispersibility in his book ‘How to think’ through the five-step process : The occurrence of difficulty, Definition of difficulty, Occurrence of a suggested explanation or possible solution, The rational of an idea, Corroboration an idea and formulation. Drucker (1955) present more quoted problem-solving process in the modern era with Defining the problem, Analyzing the problem, Developing alternative solutions, Deciding on best solution, Conveying decision into effective action in his book “The Practice of Management”. Jones (1969) said that design behavior involves three stages of analysis, synthesize and evaluation as one of the most simple and common among the many points of view about design behavior. In that stages Jones (1969) said that the analysis stage is a step to divide the problem into the details, synthesize stage is a step to create pattern also, it is to consider with new method for divided problem into the details and the evaluation stage is to narrow the choice down by doing produced design; it is to test that outcome by actually carrying out new arrangement. This theory is a theory in the early and middle 1960s and first theory of design process that is classified into the total four. Asimo (1964) divided design process into the total six steps. Analysis of problem situation, Synthesis of solution, Decision and evaluation is to choose the solution that can solve the aim well in constraints and available resources. Frist, A Optimization step refines selected solutions. Second, A Revision stage tries out the solution on a real situation. Finally, An Implementation stage performs the solution. Archer (1964) presents in an article “systematic method for designers” five steps: Programming, Data collection, Analysis, Development, Communication. Finkelstein (1983) presents five steps design process: Information gathering organization, Formulating of value model, Generation of candidate designs, Analysis of candidate design, Decision. Lately Bruce Hanington, Bella Martin (2013). presents five steps: the element exploration, plan, postposition, justice stage of the design project, the search integration logic establishment stage, the concept development, prototype manufacture stage, the goods responses observation stage and the design quality conformance test stage. Design tasks can’t do in a way, but various ways can be applied in a process.

228
Table 1. Design process as a problem-solving process of designers
Source: Searched for Yeon Ung Im. 2003. ‘A Study on the Design Methodology’ and Bella Martin 2013. ‘A unchangeable law of design methodology’
All words like transformation, synthesizing solution, suggestion of candidate designs that previously scholars used express the stage which some solution is being synthesized.
Finally, all words like concentration, evaluation, development, deciding and so on show evaluation stage to distinguish whether some solutions is the best solution or not, judging by how much the identified problems were solved in the first step. Like this show, we can know that these processes have generally converged into three stages: Understanding problem, Synthesizing solution and Evaluation Solution.
Dewey (1910)
Drucker (1955)
Jones (1980)
Asimow (1964)
Archer (1963-64)
Finkelstein (1983)
Bruce Hanington,
Bella Martin (2013)
Problem compre-hension
-Occurrence of difficulty -Definition of difficulty
-Defining the problem -Analyzing the problem
-Divergence -Analysis of
problem situation
-Program-ming
-Information gathering
organization -Formulating
of value model
the element exploration,
plan, postposition,
justice - the search integration
logic establish-
ment
Synthesize of the
solution
-Occurrence of a
suggested explanation or possible
solution -The rational
ideas
-Developing alternative solutions
-Transformation
-Synthesis of solution
-Data collection -Analysis
-Generation of candidate
designs
Concept, development
early prototype production
Evaluation of the
solution
-Corrobora-tion of an idea and
formulation of a
concluding belief
-Deciding on best solution -Conveying decision into
effective action
-Convergence
-Decision and
evaluation -Optimiza-
tion -Revision
-Implementation
-Develope-ment
-Communi-cation
-Analysis of candidate
design -Decision
interactive experiment
and evaluation,
improvement production
goods responses
observation, design quality
conformance

229
Figure 2. Theoretical design process Source: A researcher modified Yeon Ung Im. 2003. A Study on the Design
Methodology
Mind mapping as a design methodology
Figure 3. Mind mapping case Source: http://www.mindmapinspiration.com/
Mind mapping is a way to arrange visually when handling subjects or problems that have many uncertain elements to better understand. Mind mapping is thinking visually technique to develop ideas or concepts in case relationship between some problem and the relevant information is unclear. This method is a nonlinear way to draw thought in the head and to be able to do combine, interpretation, delivery, memory, recycling and so on towards the idea. Mind mapping is a powerful tool to helping effect of association by enhancing memory. Because people rarely think straightforward, it is not easy

230
to make a simple pattern by separating complex problems one by one with. Mind mapping shows our brains as it is when accepting a complex problem. According to completing the map, we can have opportunity that summarize and identify hypothesis, join or cut linking points, consider alternatives during defining data as a meaningful subject and a pattern.
Creative toolkits as a design methodology
Creative toolkits have been saved physical elements for convenience in use when expressing something visually, making a model or playing a creative game also, design teams and management teams use this way to gain information and inspiration. Creative toolkits are made of a package to use conveniently elements of the participative and productive design method. As using that, if it is induced for attendants to express their thought more creative, it will be expressed thought, feelings, desires and emotions that are difficult to come out with traditional study methods through a physical object. Also creative toolkits can express an creative innovation and will be the stimulus constructive for Team building. Ingredients for creative toolkits depend on the type of active on purpose of design teams.
For example, kits for making a model freely, Velcro model which is an adhesive textile, product name of the Velcro Company use many kinds of three-dimensional models, buttons and ingredients of abstract model which can easily be reattached. The interface kit can arrange freely design ingredients, using papers or cards which design features are well expressed; website and use of apparatus can interaction by rights. The collage kit help participants can draw pictures in various ways with various kinds of papers, cards, markers, pencils, pens and so on. And then it leads widely to participatory design activities, using synthetically a few or all of kinds of the list before. Advantage of creative toolkits is the portability; moreover, the storage is easy and it is comfortable to take out for use and to put things back when moving in various locations. It is particularly useful to do the participatory design study in various locations such as a house or diffuse working space and so on.
Education frame through Design methodology application
It was divided into three stages: Problem comprehension stage, Synthesize of the solution stage and Evaluation of the solution stage to apply appropriate methodology at each design process stages for design education. Design process was applied by these stages. As shown in Figure5, when design process stages were divided into five stages, Mind mapping, a creative tool, brainstorming methodology applied to Problem comprehension stage and Synthesize of the solution stage are an applicable methodology till detail four

231
stages in application stage. This methodology can be used science and social system subjects as well as design class in an applicable methodology.
Program Program Program Program applicationapplicationapplicationapplication
Design step(process)Design step(process)Design step(process)Design step(process) Design Design Design Design
MethodologyMethodologyMethodologyMethodology
Application Application Application Application stagestagestagestage
Problem Problem Problem Problem comprehensioncomprehensioncomprehensioncomprehension
》》》》
STEP 1STEP 1STEP 1STEP 1 ExplorationExplorationExplorationExploration
〉〉〉〉* Brainstorming * Brainstorming * Brainstorming * Brainstorming visualizationvisualizationvisualizationvisualization
STEP 2STEP 2STEP 2STEP 2 FoundingFoundingFoundingFounding
〉〉〉〉* Mind map, * Mind map, * Mind map, * Mind map, * brainstorming * brainstorming * brainstorming * brainstorming visualizationvisualizationvisualizationvisualization
↓↓↓↓ ↓↓↓↓
Synthesize of Synthesize of Synthesize of Synthesize of the solutionthe solutionthe solutionthe solution
》》》》
STEP 3STEP 3STEP 3STEP 3 ConceptConceptConceptConcept developmentdevelopmentdevelopmentdevelopment
〉〉〉〉* Creative * Creative * Creative * Creative tooltooltooltoolkitskitskitskits * * * * Brainstorming Brainstorming Brainstorming Brainstorming visualizationvisualizationvisualizationvisualization
STEP 4STEP 4STEP 4STEP 4 Prototype productionPrototype productionPrototype productionPrototype production
↓↓↓↓ ↓↓↓↓
↓↓↓↓ ↓↓↓↓
EvaluationEvaluationEvaluationEvaluation Evaluation of Evaluation of Evaluation of Evaluation of the solutionthe solutionthe solutionthe solution
》》》》STEP 5STEP 5STEP 5STEP 5 Experiment, Experiment, Experiment, Experiment, EvaluationEvaluationEvaluationEvaluation
Figure 4. Education program application through design methodology application
Processes and targets of design education program study
Design education processes and targets
In this paper methodology of educational programs was configured, using design process of the brain storming mind mapping and verification was executed through strips after the education of TOSRA(Test of Science Related Attitude) and tag cloud. Research procedure and the subject are as below.

232
Table 2. Research process and the subject
EducationEducationEducationEducation ProgramProgramProgramProgram EvaluationEvaluationEvaluationEvaluation
The timeThe timeThe timeThe time 23-24. Oct. 2013, Two hours each time
1. Nov. 2013, About 20 min.
The The The The targettargettargettarget Program application on forty five middle school students
- Practice on 45 middle school students, Yeabong Middle School - Practice on 4 teachers, Yeabong Middle School
The subjectThe subjectThe subjectThe subject
- Science class application case through design methodology application - Mind Mapping, Brainstorming
Science attitude and interest test through design process application “TOSRA” and “Tag cloud”
Research result
In this Paper, we applied design process of Design Methodology to middle school science class and found that causing interesting and scientific attitude of science were changed positively, also applying brainstorming and mind mapping, design toolkits as a creativity problem-solving tool to that class.
A survey was conducted with dividing into students and teachers. Teachers were asked to do write-out answer about students’ attitudes. Examination about students’ scientific attitudes analyzed how interest and attitudes in class instruction applying design process turn out through selected questions in TOSRA(Test of Science Related Attitude).
Overall data analysis is as follows.
First, investigated attitudes of students as a observer through survey of teachers who had a class.Second, after class, take a survey immediately to check actual interest and attention about science for students who took a class after picking up the items related to interest among the items surveyed of TOSRA(Test of Science Related Attitude).
Figure 7 below show that emotional assessments took effect through tag and cloud, using a descriptive survey about four teachers feelings while having the second class. In that survey, can see that positive words like ‘fun’, ‘feel’, ‘excellent’, ‘understanding’ and so on was shown.

233
Figure 5. Descriptive survey of teachers was expressed with tag cloud Source: http://www.wordle.net/
Figure 6. The change of scientific attitudes after applying design process
Figure 8. show that the test results after class were arranged in a chart to find out for scientific attitudes of students who took a design process class. As you see in Figure 8, after class, “The attitudes toward scientific investigation” research was shown averaging 3.2 points and “Pleasure of science class” was shown averaging 3.5 points. “Interest of science as a hobby” and “Receptive attitudes about science” earns high marks with 4.2points and 4.5points each.
0
0,5
1
1,5
2
2,5
3
3,5
4
4,5
5
Attitude towardAttitude towardAttitude towardAttitude toward
ScientificScientificScientificScientific
InvestigationInvestigationInvestigationInvestigation
Pleasure ofPleasure ofPleasure ofPleasure of
Science ClassScience ClassScience ClassScience Class
Intrest inIntrest inIntrest inIntrest in
Science as aScience as aScience as aScience as a
HobbyHobbyHobbyHobby
ReceptiveReceptiveReceptiveReceptive
Attitudes inAttitudes inAttitudes inAttitudes in
ScienceScienceScienceScience
Initiative in Initiative in Initiative in Initiative in
ScienceScienceScienceScience

234
But the “Initiative of science” earns somewhat low marks as 3.3 points. In this, accept easily for science through design process applying by program. It could be proved that a hobby, interest, attention and receptive attitudes, accepting easily for science was highly shown through a lot of applications about the program in the future.
A proposal
The research was pumping up students’ interest in class, applying design process in middle school class. In science class, this program was effective to search for the knowledge and to change the attitude to science as shown in the interest and the attitude to science class through “Mind mapping”, “Creative toolkits”, and “Brainstorming” as a design methodology. Quantitative evaluation and emotional evaluation was implemented to the teachers and the students, and then the result of that was confirmed positively. The recent design creative problem-solving methods are the education to improve creative ability. Besides, we can verify that it can be applied and extended as a problem-solving method in every sphere benefiting new things, life and companies and so on.
But the ex post facto assessment was taken after the class for a short period time and it was difficult to compare because a preliminary evaluation was not done. Based on the opinion of teachers who had a class, effectiveness was able to be confirmed. Effectiveness certainly needs to be tested, using the program to other class through applying design process as a follow up study based on the research, applying the preliminary evaluation and the ex post facto assessment over a period of time. Also, in design methodology, it needs to search for what is effective problem-solving methodology is required to search. Through this study, we are able to prove that design methodology is effective to develop the self directed learning capability and new problem-solving ability out of the crammed–packed education of the current educational world.
References
Amabile, T. M. 1988. A Model of creativity and innovation in organizations. In B. M. Staw & L. L. Cummings(Eds.), Research in organizationl behavior
Amabile, T. M. 1989. Growing up creative, Buffalo, NY: Creative Education Foundation
Amabile, T. M. 1996. Creative in Contect: Update to “The Social Psychology of Creativity, “Boulder, CO: Westview Press

235
Amabile, T. M. 1998. How to kill Creativity, Keep doing what You’re Doing or, If you what to Spank Innovation, Rethink How You Motivate, Reward, and Assing work to people. Harvard Bussiness Review
Amabile, T. M., and Mueller, J. S. 2008. Studying creativity, its processes, and its antecedents: an exploration of the componential theory of creativity. In Zhou & Shalley 2008
Asomow, M. 1964. Introduction to Design, Prentice Hall Inc. Englwood
Archer, L. B. 1963. Systematic Methods for Designers
Baitry J. Fraser. 1982. Test of science related attitudes
Bela Martin. 2013. A unchangeable law of design methodology
Boradbent, G. 1973. Design in architecture
Chang Seop O. 1999.A study on design thought of modern design. Design learning research. No.34
Dewey, J. 1910. How we think, Heath, D. C. London
Drucker, P. 1955. The Practice of Management, Hinemann, London
Esherrick. 1963. Problems of design of a design system, in conference on design Methods
Finkelstein, L. 1983. Review of Design Methodology, IEEE Proceedings
Geon Pyo Lee. 1987. A study on Design Methodology. Chungnam Korea Institute of Technology
Hae Chun O. 2009. Design Methods. Seoul: Sejin Publishing.
Jeon, Kyungmin. 2012. The development and effectiveness analysis of elementary gifted student converce program through design thinking process
Jones, C. J. 1980. Design Methods : Seeds of Human Future, John Wiley & Sons, New York
Nam, Sue-Hyun. 2008. “A Study on the Design Methodology for Eco-Friendly Product Design.” M.A, Changwon National University
Alexander Osterwalder and Yves Pigneur. 2010. Business Model Generation
Seung eun, Choi. 2014. The effect of culcure and arts based experience on individual creativity and performance
Sung Su Hong. 2007 / Industrial design theories Real examples
Robert W. Weisberg. 2006. Creativity : Understanding Innovation in Problem Solving, Science, Invention, and the Arts
Yeon Ung Im. 2003. A Study on the Design Methodology
Young Hwa Lee. 2003. A Study on teaching plan of design by the adaptation of design process. / Kon Kuk University.

236
Yu Mi Jeong. 2011. A study on proposal for elementary design education program applying design process /.
Yu Jeong Jang. 2011. The development of design education program focused on Design Process/
http://www.mindmapinspiration.com/
http://www.wordle.net/
237
Magdale na Woj narowska THE APPLICATION OF IN TEGRATED PROD UCT P OLIC Y IN ENTERPRISES
THE APPLICATION OF INTEGRATED PRODUCT POLICY IN ENTERPRISES
Magdalena Wojnarowska
Department of Technology and Ecology of Products, Faculty of Commodity Science, Cracow University of Economics
Introduction
As environmental problems became a global concern, one of challenges of contemporary economy is to improve relations between an enterprise and its environment. An increasing demand for goods caused the development of industrial manufacturing methods.
Enterprises that use business practices consistent with sustainable development appear to be more attractive and reliable to customers. The implementation of the concept of sustainable development at enterprise level, thus the tools of Integrated Product Policy, favours environmentally safe products and services. Modern society is more and more often interested in environmental protection. There is increasing awareness of the need for pro-environmental activities both on micro- and macro-environmental scale. This trend forced enterprises to follow strategies realizing the fundamental concepts of sustainable development.
This paper is of theoretical and empirical character. The first section contains an analysis of the gathered Integrated Product Policy data. This consisted in gathering and analysing policy-related data while emphasizing the indication of goals and tools enabling to use them in enterprises, while considering the care for the environment. Among these tools special attention was paid to environmental management systems, product life cycle analysis and environmental labelling.
In the second section of this paper the results of the study on implementation of the presented tools are presented. The qualitative examination was aimed at the determination of the degree of application of the Integrated Product Policy tools in enterprises. The test method used was based on a questionnaire distributed among some randomly chosen enterprises. The gained data were used also to verify the main study

238
hypothesis, i.e. there is a low level of the use of the Integrated Product Policy in enterprises.
The goal of this study is justified by the necessity for permanent and efficient implementation of ecological prerequisites into enterprises policy. This results among other things from the National Environmental Policy and Integrated Product Policy promoted by the European Union.
The concept of Integrated Product Policy
The concept of Integrated Product Policy is an initiative of the European Commission and the EU member states. This is an element of a broader European community processes within the framework of the Lisbon strategy targeted at creating the most competitive and dynamic economy in the world based on knowledge (Strategia wdrażania… 2005).
The implementation of Integrated Product Policy has not been regulated by European law provisions with any regulation or directive, however is undertaken based on Communication from the European Commission referring to the Decision of the European Council and of the European Parliament No. 1600/2002/WE (Fuksa, Ciszyńska 2010). An improvement in efficiency of natural resources and better raw material and waste management are adopted as the main objectives of IPP.
Integrated Product Policy is based on activities oriented towards the stimulation of continuous product improvement for environmental protection during the its whole life cycle, that should reduce a shift of environmental responsibility from one product life cycle stage to another. This means that activities related to environmental impact of a product or service should be undertaken at such life cycle stage when this is the most cost effective (Komunikat Komisji… 2003). Therefore, the concept of Integrated Product Policy should favour the realization of preventive actions by (Lorek 2008):
– developing LCA methodology and extending the range of application,
– implementation of EMAS,
– setting environmental guidelines for designing new products,
– developing environmental labelling.
In Communication from the European Commission for the European Council and the European Parliament the significance of products for ecological policy is emphasized, and since the products launched on the market have the heaviest environmental impact, Integrated Product Policy lies an emphasis to product environmental performance. An enterprise due to improvement in environmental management systems being one of the IPP tools, will use a product-oriented management. Proper implementation of

239
product-oriented environmental management should indicate (Matuszak-Flejszman 2010):
– founding a common denominator between organisation’s pro-environmental activities and the market,
– enriching environmental studies by market analyses and analyses of involves parties expectations,
– direct integration of environmental requirements with product development system,
– knowledge creation.
The European Council specified that within the scope of more responsible natural resource management the European Union integrated Product Policy should be implemented in collaboration with enterprises, while assigning them the following tasks:
– offering ecological agreements,
– encouraging the national standardisation bodies to consider ecological items,
– educational, training and other activities increasing employee awareness on thinking in the categories of life cycle and environmental protection information tools,
– supporting the Community efforts to create life cycle databases,
– supporting implementation of ecological design and LCA,
– including the IPP approach to enterprise’s R&D programs,
– using EMS, while using products,
– using environmental criteria when purchasing at an enterprise
– supporting the development and application for European eco-label,
– proceeding in accordance with environmental requirements,
– education and training /informing customers and suppliers about an approach based on thinking in life cycle categories,
– participation in pilot projects,
– reporting IPP implementation, while considering company’s environmental reports,
– information exchange on IPP implementation with other enterprises and participants.
However, since the achievement of Integrated Product Policy is a complex task, it requires commitment and cooperation not only entrepreneurs but also other entities such as scientific and research institutions, public administrations, consumer organisations, ecological organisations, EU institutions (the European Commission and the European Environmental

240
Agency). Consumers is another important group; their conscious pro-environmental attitude should oblige manufacturers to activities aimed at reducing environmental impact during the whole life cycle of products and services. The cooperation of all market participants should lead to achievement of sustainable consumption and sustainable production standards as well as improvement of enterprise’s environmental results.
Presentation of empirical data
Conceptual framework for this study
The main aim of this study was to verify the level of implementation and assessment of the Integrated Product Policy tools. The obtained results allowed to derive conclusions on company’s commitment in achieving IPP assumptions. The study was carried out in the form of questionnaire survey on sample N counting 163 enterprises based on 26 questions and firmographic questions. The questions were focused on:
– environmental management systems,
– product life cycle analysis,
– environmental labelling,
– financial preferences.
For data analysis the Excel worksheet was used.
The most numerous respondent group (41%)was composed of physical persons performing business activity, the next group was limited liability companies (28%), and 14% was represented by private companies, 11% by joint stock companies, and cooperatives and state owned companies by 3% each.
The firmographic questions include also the duration of market presence. 48.5% of respondents operated for more than 10 years and 28.2% for less than 5 years. 15.3% of companies declared the market presence for 5 to 10 years. The smallest number of respondents (6,8%) pointed out below 1 year.
The question about the number of persons employed by the company indicated that 50.3% of companies employed between 1 and 10 people, 19.6% from 11 to 50 people, 18.4% above 250 people, and11% from 51 to 250 people.
The most numerous respondent group (32.5%) operated on the local market, while the next group(26%) on the domestic market, 24.9% on the international market, and 16.6% on the regional market.

241
To the question about foreign capital share 80.4% of all companies declared no foreign capital, 7.9% of them indicated the share of 1-50%, while in 11.7% of companies the share of foreign capital exceeded 50%.
Environmental Management Systems
The implementation of environmental management systems is one of the tools for achieving pro-environmental company management. The necessary condition for proper functioning of an environmental management system is its integration with an organisation’s general management system. This must be correlated with general objectives, priorities and procedures applicable in the organisation. This refers not only to environmental policy, that should be an integral part of organisation’s general policy, but also all practices, procedures, processes and means. If this is not the case, some conflicts may arise because in many cases the environmental protection objectives set without considering organisation’s economical goals will turn out to be contradictory to them (Lisowska-Mieszkowska 2007).
According to the definition of the Technical Committee ISO/TC 207 “environmental management are those aspects of general management function related to preparation,, implementation and realisation of organisational unit environmental policy and goals”.
It follows from the survey that the vast majority of respondents (84%) has no environmental management systems implemented. Among respondents who have implemented environmental management systems (16%) most of them (75%) declare the implementation of ISO 14001. This is surely one of best known systems derived directly from the standard. The second common system indicated by the respondents (18%) consisted in adopting the rules of cleaner production. 4% of respondents indicated other environmental management programs. The smallest number of companies under investigation has EMAS (3%) implemented.
When analysing questionnaires for direct benefits gained after implementation of an environmental management system or program 27% of enterprises pointed out advantages resulting from reduction of wastes requiring storage. Slightly smaller group (23%) benefits from reduced water and energy consumption and 22% in reduced costs of waste recovery and management. 18% of companies profits by economic use of the environment, while 5% by reduced pollutant emissions and 5% by other type advantages.
The survey included also indirect benefits resulting from implementation of environmental management systems. Most of respondents (28%) indicated an improvement in company’s image and 23%an increase of company’s competitive position by improving quality of products and services. Slightly smaller group of enterprises (17 %) benefits by fulfilling customer’s

242
requirements and expectations. Similar percentage of companies profits from higher operational efficiency by improving work organisation. 14% of respondents indicate an increased access to new customers and partners, that undoubtedly brings better financial results to the company. 2% of companies benefit other indirect profits.
The presented results indicate that the implementation of environmental management systems is backed at first place by economical reasons directly related to company’s competitive position on the market.
As regards to the question about problems related to implementation of EMSs 31% of respondents considered the supervision over processes connected with significant environmental aspects as the biggest problem. For 19 % of companies the problem applied both to identification of environmental aspects and system documentation. The next 6% and 5% thought that the problem was related to detailing environmental objectives and tasks, and monitoring and measurements, respectively. For 3% of respondents only the system documentation was a problem.
Almost half of respondents having implemented EMSs belong to limited liability companies, 34% to joint stock companies. 17% to individuals performing business activity. This indicates a relationship with the size of company where systems were implemented. The largest company, the higher chance of system implementation. Small entities such as cooperatives or personal firms are mainly companies employing one or several people, contrary to joint stock or limited liability companies, that are counted among medium-size and large companies. This is confirmed by answers to the question about company size. Almost 3 of 4 companies having EMS implemented employ more than 250 people. Large entities are able to bear additional costs related to EMS implementation. The larger number of employees, more often EMS implementation. It should be emphasised that EMSs are investments that are rarely made during initial years of company’s operation. Merely 8% of respondents indicated EMS implementation within first 5 years of operation on the market. Most companies having EMS implemented made such investment within 10 years. This indicates that the development of environmental management systems takes place only with later investments. The companies with short period of activity are unable to perform activities related to adaptation and implementation of EMS. Another issue is unawareness and complete lack of interest in environmental affairs among companies. Environmental Management Systems are implemented primarily by manufacturing companies. Heavy and light industries are producers and manufacturers of goods. Heavy industry is a sector related among other things to production of machinery and semi-finished products and employing a lot of people. The persons responsible for company’s development appreciate advantages of systems supporting environmental

243
management. Having an EMS is a kind of ennoblement and indication that the company takes care of the environment. The systems are implemented in above half of companies operating on international markets. No distinct relationships with the level of foreign capital share are visible.
It should be noted that 75% of companies having EMS consistent with ISO 14001 have also LCA system implemented, based on the same family of standards. It can be concluded that these companies operate in more comprehensive manner in the area of reducing their adverse environmental impact.
Among respondents having no environmental systems implemented, 32% of them consider limited financial resources as the strongest barrier, while 27% of such companies believe in lack of benefits of EMS implementation in the company. For 13% of respondents no environmental management systems were implemented because the process of implementation was too complicated, while for 12% of them there were other reasons. 7% of respondents do not implement any system due to difficulties with fulfilling requirements of particular EMS and because of time-implementation. Only in 2% of companies the barrier results from employee’s resistance.
LCA
Current knowledge enables us to conclude that each product has its specific environmental impact and Product Life Cycle is long and complicated. This includes among other things the extraction of raw materials, product designing, assembling components of whole product, marketing, distribution, use, waste generation, waste collection, repair, recycling and neutralisation. Thus it is necessary to strive for minimizing environmental impact of products (Strategia wdrażania… 2005).
LCA (Life Cycle Assessment), that is ecological life cycle assessment is an environmental management technique. It belongs to tools enabling identification and assessment of potential environmental impact and allowing methods of environmental quality improvement to be established (Kowalski, Kulczycka, Góralczyk 2007).
The results of survey carried out indicate a low level of LCA implementation reaching 8% only among all companies under investigation. 50% of them are limited liability companies. Most of them operate on the market for above 10 years (64%). According to questionnaires there are large companies (63%) employing above 250 people and performing activity in manufacturing sector (53%) and international market-oriented, however without any foreign capital share.

244
The next question dealt with the way how LCA is used, namely whether this system has been implemented in compliance with the standard ISO 14040. ISO 14040 describes basic rules and indicators related to LCA, however without detailed description of ecological life cycle assessment method. 67% of companies confirmed that they have LCA system implemented according to this ISO standard.
The next question took up the problem of benefits brought by LCA implementation in the company. Among all variants provided the reducing material and energy consumption was most popular option (33%). It should be noted that this is both ecological and economic advantage. Reducing amounts of materials/ raw materials used and lesser energy consumption unload the environment as well as company’s budget. The second significant advantage resulting from LCA implementation according to respondents is the possibility of developing and designing the production and service processes (28%). It is worthy to mention that none of companies that declared the use of LCA did not choose the answer that there were no benefits of the use of this tool. All respondents using LCA indicate also achieving the planned goals. Thus, it is possible to conclude that LCA implementation in the company is effective and justified, as the use of this tool leads to achievement of planned goals and numerous profits.
In the next question the entrepreneurs were asked if they see any competitive advantages in companies using LCA. Half of respondents see or see a competitive advantage of such companies. However, this not fully consistent with the survey results. Only 8% of163 companies under examination declared the use of LCA. This may indicates a misconviction of these entrepreneurs that since they take advantages of using LCA, so other companies also use this tool. 33% of respondents rather do not see any competitive advantage of companies that use LCA, and 17% have no opinion of this matter.
Lack of relevant knowledge about this tool is considered as the main reason of lack of LCA (35,5%). Lack of education and ecological awareness is the principal reason of disinclination and resistance to implementation of such solutions. Companies fear of additional costs, lack of collaboration with employees or lack of support from other units having experience of this subject, thus being able to facilitate the implementation of this tool. The conviction that there are no clear advantages of the use of LCA (11.6%) may follow from poor knowledge of the tool itself. 13% of respondents claim that at present there is a too little interest in products that satisfy the LCA requirements. In this case the problem of low ecological awareness appears once again, but no with respect to customers not to entrepreneurs.

245
Among enterprises participating in the survey declaring the use of LCA, the most numerous group (50%) consisted of limited liability companies. Also joint stock companies form a significant group (25%).
Above 58% of respondents with LCA implemented have been operated on the marked for more than 10 years and employ from 51to 250 people. Most LCA having companies is connected with production (41%) and operates on the international market (67%).
In addition, up to 75%of enterprises with LCA have an environmental management system implemented, and 42% gain privileges from manufacturing environmentally-friendly products.
Environmental labelling
The ISO 14020 standard defines environmental labelling as: “a claim which indicates the environmental aspects of the product or service, that may take the form of a statement, symbol or graphic on a label, in product literature, in technical bulletins, in advertising or in publicity, among other things” (Etykiety i deklaracje… 2003).
The ISO 14000 series of international standards identifies three environmental labelling types (Strategia wdrażania… 2005):
– I type eco-labelling- consists in distinguishing and promoting products and its varieties that have less adverse environmental impact than other products within the same category. This is connected with a third party program that awards a licence which authorise to the use of environmental labels on products indicating overall prefer ability of a product within a specified product category.
– II type eco-labelling – applies to environmental self-declaration claims made by the manufacturer or other interested parties, if they wish to declare some special features of product, for example related to recycling.
– III type eco-labelling – is connected with providing an environmental declaration, i.e. quantified environmental data of a product based on product life cycle assessment conducted in compliance with the ISO 14040 group of standards. Environmental labelling is considered as a competition instrument in a
specified segment of commodity market. Its application is more and more often tied with competition mechanisms and is used by producers as a market expansion tool.
The questionnaires set to enterprises contained also questions related to environmental labelling. Based on the gathered data it can be noted that there is poor knowledge about environmental labels within individual lines of business. In practice environmental labels are present in all market sectors,

246
however 43% of respondents stated that no environmental labels were used in their businesses, and 17% did not know whether such labels were present. 40% of respondents knew that environmental labels were present in their lines of business.
The survey indicates a very low level of environmental labelling implementation in enterprises. Up to 77% of enterprises under survey declares that they do not use environmental labelling. The fact that only 23% of entrepreneurs use environmental labelling may indicate that despite of its high potential eco-labelling is a relatively poorly known tool.
Among respondents declaring the use of environmental labelling for marking products in their enterprises: 55% use II type environmental labels and declarations, 28% III environmental labels and declarations, while 17% I type environmental labels and declarations.
It follows from the survey that company’s legal status has no effect on the use of environmental labelling by an enterprise. Both among respondents who use environmental labelling for marking products in their enterprises, and who do not use it, physical persons performing business activity prevail. The same relationship applies also to duration of company’s operation on the market, employment, market sector on which the company is active and foreign capital share in the company. The respondents who use environmental labelling for product marking in their enterprises are divided primarily into such sectors as production, services and trade.
The use of different environmental labelling types for product marking by enterprises is connected to some extent with LCA implementation by these companies. The vast majority of companies that do not use environmental labelling for product marking has also no LCA implemented. Among companies where environmental labelling is used, 19% have LCA; 11% of them use III type, 6% - II type and 2% - I type environmental labelling.
Among respondents who do not use environmental labelling for product marking in their enterprises, 89% declares also that no environmental management systems are functioning in their companies. However, among companies where environmental labelling is used, 31% have EMS implemented.
The largest respondent group (28%) uses the “Recycled content” eco-label for product marking, 24% use “Keep cleanliness. Throw waste into dustbin”. The next eco-label (10%) “Suitable for recycling” and 9% both for “Energy Star” and “Green Point”, 8% for “Reusable”. The remaining labels (e.g. “Biodegradable packaging”, “EKO” ecological mark, “Ecolabel”, “Blue Angel”) are used by less than 2% of respondents. It should be noted that most respondents (81%) use more than one eco-label for marking their products.
Among respondents declaring the use environmental labels the largest group (56%) has no opinion on how environmental labels can be connected

247
with product sale increase. 24% of respondents claims that this had no effect of product sale increase, and 20% noted a sale increase (63% of them point out also an improvement in company’s image among customers). However, 20% of respondents claiming that implementation of environmental labelling had no effect on sale increase, noted an improvement in their public image. This may indicate a relationship between company’s product sale increase and enhancement of positive image of the company.
Conclusions
The studies carried out indicate a low level of the use of the Integrated Product Policy tools. This results to large extent from shortage of funds for realization of environmental policy in companies. However, besides financial barrier the problem is lack of knowledge about the Integrated Product Policy tools. It should be noted that conducting researches and analyses, e.g. LCA techniques, is not an easy task and is quite time-consuming. The asked entrepreneurs point out the necessity of gathering large amounts of input and output data and information on the manufacturing process. Thus, the barriers in application of the Integrated Product Policy tools refers both to economic and social capital.
To remove these barriers it is important to educate society as well as company owners that it reasonable to use the Integrated Product Policy tools. Until the management attitude to pro-environmental policy remain unchanged, the environmental tools such as environmental management systems, LCA and environmental labelling will be considered rather as a difficulty not a helpful aid in business activity. To encourage entrepreneurs to pro-environmental policy it necessary to present benefit of such solutions in a simple and clear way. An example chance is improvement of competitive position on the market. By raising confidence in offered products it is a chance of profit increase, while keeping care for the environment. However, customers have an opportunity of aware choosing of environmentally-friendly products and services.
The next activities that could improve situation in company’s environmental area is raising awareness of relationship between pro-environmental activity and company’s financial result, and simplifying procedures of implementation of the Integrated Product Policy tools.
By following the Integrated Product Policy recommendations, the company’s competitive position will increase through more consistent policy stimulated by IPP. The practice of some environmental management tools indicates that increased ecological awareness in enterprises may reduce environmental costs. The enterprises that observe the Integrated product

248
Policy recommendations more often use their ecological achievements as a marketing instrument for creating their ecological image.
References
Communication of the Commission for the Council and the European Parliament. Integrated Product Policy. The use of environmental approach based on product life cycle analysis, Commission of European Societies, Brussels, 18.06.2003, COM (2003) 302. p.2.
Etykiety i deklaracje środowiskowe. Zasady ogólne, PN-EN ISO 14020:2003,PKN, Warszawa.(in Polish)
Fuksa D., Ciszyńska E., 2010, Propozycje wprowadzenia zmian w polskim systemie fiskalnym w aspekcie Zintegrowanej Polityki Produktowej, w: Knosala R. (red.) Komputerowo zintegrowane zarządzanie, T.1, Oficyna Wydawnicza Polskiego Towarzystwa Zarządzania Produkcją, p.457. (in Polish)
Kowalski Z., Kulczycka J., Góralczyk M., 2007, Ekologiczna ocena cyklu życia procesów wytwórczych (LCA), Wydawnictwo Naukowe PWN, Warszawa. (in Polish)
Lisowska-Mieszkowska E., 2007, Systemy zarządzania środowiskowego – rozwój i funkcjonowanie w Polsce, Ochrona Środowiska i Zasobów Naturalnych, nr 30, Warszawa.(in Polish)
Lorek E., 2008, Polska polityka energetyczna w warunkach integracji z Unią Europejską, Wydawnictwo Akademii Ekonomicznej, Katowice. (in Polish)
Matuszak-Flejszman A., 2010, Determinanty doskonalenia systemu zarządzania środowiskowego zgodnego z wymaganiami normy ISO 14001, Wydawnictwo Uniwersytetu Ekonomicznego w Poznaniu, Poznań. (in Polish)
Strategia wdrażania w Polsce Zintegrowanej Polityki Produktowej. Dokument przyjęty przez Komitet Europejski Rady Ministrów w dniu 25 lutego 2005r. Ministerstwo Środowiska Luty, 2005, p.5-10.(in Polish)

249
COMMODITY SCIENCE
IN RESEARCH AND PRACTICE
series consists of eight monographs:
ACHIEVEMENTS AND CHALLENGES
OF COMMODITY SCIENCE IN THE AGE OF GLOBALIZATION
Edited by Andrzej Chochół & Jerzy Szakiel
CONSUMER PROTECTION AND SATISFACTION
Edited by Andrzej Chochół
FOOD PRODUCTS’ QUALITY
Edited by Małgorzata Miśniakiewicz & Stanisław Popek
FUTURE TRENDS AND CHALLENGES IN THE FOOD SECTOR
Edited by Małgorzata Miśniakiewicz & Stanisław Popek
INNOVATIONS IN PRODUCT DEVELOPMENT AND PACKAGING
Edited by Agnieszka Cholewa-Wójcik & Agnieszka Kawecka
NON-FOOD PRODUCTS’ QUALITY & INNOVATIONS
Edited by Renata Salerno-Kochan
TOWARDS QUALITY - MANAGEMENT SYSTEMS
AND SOLUTIONS
Edited by Tadeusz Sikora & Joanna Dziadkowiec
TOWARDS SUSTAINABLE DEVELOPMENT
Edited by Waclaw Adamczyk

I S B N 9 7 8 - 8 3 - 9 3 8 9 0 9 - 0 - 3 ( p r i n t e d v e r s i o n )I S B N 9 7 8 - 8 3 - 9 3 8 9 0 9 - 4 - 1 ( h t m l )
E d i t e d b y A n d r z e j C h o c h ó ł & J e r z y S z a k i e l
GLOBALCHALLENGE
CO
MM
OD
ITY
SC
IEN
CE
IN
RE
SE
AR
CH
AN
D P
RA
CT
ICE
AC
HIE
VEM
ENTS
AN
D C
HA
LLEN
GES
OF
CO
MM
OD
ITY
SCIE
NC
E IN
TH
E A
GE
OF
GLO
BA
LIZ
ATIO
N
COMMODITY SCIENCE IN RESEARCH AND PRACTICE
ACHIEVEMENTS AND CHALLENGES
OF COMMODITY SCIENCE IN THE AGE OF GLOBALIZATION
1_COMMODITY SCIENCE.indd 1 03/09/2014 14:59:09