Economic developments in India: achievements and challenges
240
a_____________ ; 0 * r - '~~~~~~~~~~~~~~~~~ :L 0: - : 0 V'~~~~~~ t''~~~~~~~~~~~~~J J44gI ~ Public Disclosure Authorized Public Disclosure Authorized Public Disclosure Authorized Disclosure Authorized
-
Upload
khangminh22 -
Category
Documents
-
view
0 -
download
0
Transcript of Economic developments in India: achievements and challenges

a_____________
; 0 * r - '~~~~~~~~~~~~~~~~~
:L 0: - : 0 V'~~~~~~
t''~~~~~~~~~~~~~J J44gI ~
Pub
lic D
iscl
osur
e A
utho
rized
Pub
lic D
iscl
osur
e A
utho
rized
Pub
lic D
iscl
osur
e A
utho
rized
Pub
lic D
iscl
osur
e A
utho
rized


A W O R L D B A N K C O U N T R Y S T U D Y
EconomicDevelopments in India
Achievements and Challenges
The World BankWashington, D.C.

Copyright © 1995The International Bank for Reconstructionand Development/ THE WORLD BANK
1818 H Street, N.W.Washington, D.C. 20433, U.S.A.
All rights reservedManufactured in the United States of AmericaFirst printing October 1995
World Bank Country Studies are among the many reports originally prepared for intemal useas part of the continuing analysis by the Bank of the economic and related conditions of itsdeveloping member countries and of its dialogues with the governments. Some of the reports arepublished in this series with the least possible delay for the use of govemments and the aca-demic, business and financial, and development communities. The typescript of this papertherefore has not been prepared in accordance with the procedures appropriate to formal printedtexts, and the World Bank accepts no responsibility for errors. Some sources cited in this papermay be informal documents that are not readily available.
The World Bank does not guarantee the accuracy of the data included in this publication andaccepts no responsibility whatsoever for any consequence of their use. The boundaries, colors,denominations, and other information shown on any map in this volume do not imply on thepart of the World Bank Group any judgment on the legal status of any territory or the endorse-ment or acceptance of such boundaries.
The material in this publication is copyrighted. Requests for permission to reproduce portionsof it should be sent to the Office of the Publisher at the address shown in the copyright noticeabove. The World Bank encourages dissemination of its work and will normally give permissionpromptly and, when the reproduction is for noncommercial purposes, without asking a fee.Permission to copy portions for classroom use is granted through the Copyright ClearanceCenter, Inc., Suite 910, 222 Rosewood Drive, Danvers, Massachusetts 01923, U.S.A.
The complete backlist of publications from the World Bank is shown in the annual Index ofPublications, which contains an alphabetical title list (with full ordering information) and indexesof subjects, authors, and countries and regions. The latest edition is available free of charge fromthe Distribution Unit, Office of the Publisher, The World Bank, 1818 H Street, N.W., Washington,D.C. 20433, U.S.A., or from Publications, The World Bank, 66, avenue d'lna, 75116 Paris, France.
ISSN: 0-0253-2123
Library of Congress Cataloging-in-Publication Data
Economic developments in India: achievements and challenges.p. cm. - (A World Bank country study, ISSN 0253-2123)
ISBN 0-8213-3464-61. India-Economic conditions-1947- 2. India-Economic
policy-1980- I. International Bank for Reconstruction andDevelopment. II. Series.HC435.2.E269 1995338.954- dc2O 95-38912
CIP

8L SM.... AS IOUd 1!H 3uIUUOJ3){9L j..ouIofl3g 2U1s6uI3uj pue s•¶uoQ ui3lnpaO)
SL uoipanpoiiuISL ...... 1.............. ..... Vis;S 93'1 SyIUtf
.LNOIIJF1UO?{INI
SL .3HIJf1HISVHANI NI IN3NIS3ANILLVArdI 1O0 X)OMA3lWVHŽ 9NI'1HVN3 3H1 :£ II3IdVHJ
69 ..... S3OSX 'OsM pue uoilnie
Z9 ................ . snssl ivHoo3S c331aS6. .N.MOX.O. 3lVIS liOd 3NI1dIDSIG CU3SVH-1L3?VN STHVMOjL8. -.................................... S..T1 VJd WDSIJ 'UvO?IgZ.S.A........ -. pu. . p........... .... --SA 11p Mpuadxg pllS
6u .. SAll III lnU3A pJ POPPSSt .SIN3NN.3AOD VIVlS Ag S3ALINIIYI NHOI3IJ VODSIJ
..S.3.SNaI -1VN3WNNMAOO3INI J0 WN3SAS 3H1
6£ ............. S. .... svs 0 3BNVNXOJ3d TVQSId..NO.L.D.lonNI
6.......................... SNHO HI laAaIAl 3IVIS NI S3HfSSI UJ3LJH'IJ S :Z I3JldVHJ
8£.ONIDNVNIJ 1I{WNHIX3
6Z .......... ... sO TLDnuLS NI SS9O-dLZ ....... . AlJdAOJI* ......... .. u..S.u uN lqaa luuajlxg pue sjuouxLU I jo ouueleg
91 ......... 1png 96-S661 ip ul 11u1unsnfpV lu-osq.................................. 1 96-S661 3H1 UNV S3nSSI IN3N3DVNVJ 3140O0O3gINHXQf......... O......1•O............1....... no sluo tjo oo IL,
v.:ALI 1o!U§U1SAI pue dUDlo AlUlDoJV.UOflUjJUZ Pmuno z)!IOd £IU auO4u
z .- -I-.... ........... N...dO..A3G DINONODHO IDVW 1N333X....... .. ... ... .............................................. ....................... "I'll ..... ..... o llD n u o -dlN l
. S3ON3V11HJ UNV SNaN3AW3IH3V:SIN3WdN1oaAU JINONOJ3 IN3HJf :1 T3HAVHJ
MX.VV IN3NJszOThA3U JTNONO33
ix.SNARNOII3V UNV SNOIINAfI*SVx.SINt3NDUTIMONXV
X! '''''''''''''''''''''''''' ' .... .................. ......... .............................. A , ] ]W a , , ., , ,,, ,,,,X,,,,3SE
SIN3INO0
-Itt-

-Iv-
CONTENTS (Cont'd)...
CHAPTER 3Labor Laws ................................. 78Tax Laws ................................. 79Land Laws ................................. 79Alternative Commercial Dispute Settlement ................................. 80Competition Laws ................................. 80
Conclusion ................................. 81POWER ................................ 81
Introduction ................................. 81The Invitation, and the Negotiation of Entry ................................. 83
The Invitation ................................. 83The Administration of Entry ................................. 84
Conditions of Operation ................................. 88Power Generation ................................. 88Distribution ................................. 91
TRANSPORT: SELECTED ASPECTS .93Introduction 93Improving Competition and Efficiency .94
Trucking .94Multimodal Freight Transport .95
Facilitating Private Sector Investment in Fixed Transport Assets .98Ocean Ports .98Highways .99Railway Infrastructure .101
T ELECOMMUNICATIONS .103Introduction .103
The Present Framework .103Sector Reform .104Policy Implementaion .105
The Tendering Process .105Clarifications . 106
Summary and Recommendations ................................ , ........ 107
CHAPTER 4: SUSTAINING PRIMARY EDUCATION REFORMS .109
INTRODUCTION .. 109BENEFITS AND PROGRESS .. 110
The Benefits of Primary Education . 110Progress in Developing Primary Education .. 1.1 1
INFLUENCING EDUCATIONAL OUTCOMES . 120The District Primary Education Program (DPEP) .123
TRENDS AND PROSPECTS IN PRIMARY EDUCATION FINANCE . 125Overview of Expenditure on Primary Education .125
SUSTAINING PRIMARY EDUCATION REFORMS - A THREE-FOLD STRATEGY . 128Selective Interventions ................. 128State Financing ................. 130Central Government Leadership ......................... 130

CONTENTS (Cont'd...)
STATISTICAL APPENDIX .................... 133
LIST OF TABLES
Table 1I.1 Selected Central Government Finances .3Table 1.2 Recent Evolution of the Public Deficit .4Table 1.3 Selected Monetary Indicators .5Table 1.4 Key Interest Rates .6Table 1.5 Direct Foreign Investment .8Table 1.6 Growth Performance .8Table 1.7 Trends in Total Investment .10Table 1.8 Balance of Payments .12Table 1.9 Real Exchange Rate of India's Main Trading Partners and Competitors .13Table 1.10 Foreign Direct and Portfolio Investment .14Table 1.11 Public and Private Savings of High Performing Asian Economies and India .15Table 1.12 Composition of the Internal Public Debt of the Central Government .17Table 1.13 Sustainable Primary Deficit of the Central Government .17Table 1.14 Center and States--Selected Fiscal Transactions .18Table 1.15 Profitability Profile of Non-Departmental Central Government PEs .20Table 1.16 India's External Debt .24Table 1.17 Annual Percentage Change In Real Wages for Unskilled Agricultural Labor .27Table 1 .18 Tariff Structure .31
Table 2.1 India - State Profiles .41Table 2.2 State Government Finances .42Table 2.3 Cumulative Progress in Resource Mobilization for Plan Outlays
Under the Eighth Five Year Plan .43Table 2.4 The Composition of Transfers from the Center to the States .45Table 2.5 Allocation Formulae Employed by the Planning Commission .45Table 2.6 Transfers Relative to Per Capita Ranking of Major States .46Table 2.7 Central Plan Loans as a Percentage of Plan Capital Expenditures of States .47Table 2.8 Savings from Private Provision of Civic Services in Rajkot .55Table 2.9 Elasticity of Physical Stocks With Respect to Purchasing Power Parity GDP .62Table 2.10 Financial Performance of State Electricity Boards .63
Table 4.1 Primary Gross Enrollment Ratios, Dropout Rates and Adult Literacy Rates inLow-Literacy Districts in Seven States .113
Table 4.2 Distribution of Districts by Female Literacy Rates, Major States .114Table 4.3 Average Achievement in Selected Low-Literacy Districts in Eight States .116Table 4.4 School Characteristics Positively Related to Higher levels of Mathematics or Reading
Achievement in Low-Literacy Districts in Seven States .121Table 4.5 Average Number of Instructional Materials Available in Low-Literacy
Districts in Eight States .122

-Vl-
LIST OF BOXES
Box 1.1 Non-Resident Indian Deposits Made Less Attractive ........................................................... 22Box 1.2 Non-Resident Deposits ........................................................... 23Box 1.3 Malaysia Applied Administrative Controls Pragmatically ........................................................... 26
Box 2.1 Responsibilities and Revenues in India are Divided Between the Center and the States ............... 40Box 2.2 Several States Partially Reform Sales Tax Rates and Administration ........................................... 49Box 2.3 Management Contracts in Place for Public Services in Some Indian Cities .................................. 53Box 2.4 The Tenth Finance Commission Urges Fundamental Changes im the System of
Intergovernmental Transfers ................................. 57Box 2.5 Argentina Pursues Broader Fiscal Reforms ................................ 58Box 2.6 Australia Develops and Refines an Approach to Managing State Debt
Through More Market-Based Discipline ................................ 61Box 2.7 Orissa Makes Progress in Power Sector Reform ................................ 64Box 2.8 PWD Reform Moves Forward in Selected States ................................ 67Box 2.9 Cost Recovery Potential in Irrigation Exists ................................ 70Box 2.10 The Tanul Nadu WRCP Addresses Comprehensive Issues
In Water Resource Management .............................................................. 71Box 2.11 Water Users Associations (WUAs) Have An Important Role ....................................................... 73
Box 3.1 Multiple Public Agencies Operate in the Power Sector .............................................................. 82Box 3.2 Key Features of the Power Sector Reform Policy Introduced Starting 1991 ................................. 83Box 3.3 Orissa - An Example of the New Public and Private Sector Roles in Power ................................. 89Box 3.4 Existing Legislation Can Accommodate Private Sector Provision of Port Services ....................... 97Box 3.5 Some Private Investment in Port Infrastructure is Occuring Under Existing Legislation ............... 98Box 3.6 Efforts on Several Fronts to Encourage and Expedite Private Investment in BOT Projects ........ 102Box 3.7 A Large Unmet Demand for Telecommunication Services Exists ............................................... 103
Box 4.1 Policy Analysis to Help Raise Learning and Reduce Gaps .......................... ...................... 118Box 4.2 Government-Aided Primary Schools are More Cost-Effective
Than Other Schools in Tamil Nadu ....................................................... 119Box 4.3 The National Policy on Education is Adopted and Updated ............................................... 124Box 4.4 Specific Interventions Improve the Cost Effectiveness of Schools in Assam ...................... 129

-vii-
LIST OF FIGURES
Figure 1. I Do You Expect To Authorize More Or Less Capital Expenditure? ................................................9Figure 1.2 Are You More Or Less Optimistic Than You Were Six Months Ago? ....................... ....................9Figure 1.3 Real Private and Public Gross Fixed Capital Formation ........................................................... 10Figure 1.4 India: Capacity Utilization in Selected Industries ........................................................... 15
Figure 2.1 Nominal Interest Rates on New Loans to States and Inflation ....................................................... 43Figure 2.2 India: Real Public Sector Gross Fixed Capital Information ........................................................... 65
Figure 4.1 Achievement of Universal Primary Enrollment in Five Asian Economies: Total ................. 112Figure 4.2 Achievement of Universal Primary Enrollment in Five Asian Economies: Female .............. 112Figure 4.3 Total Achievement in 23 States ........................................................... 115Figure 4.4a Arithmetic Achievement in Low-Literacy Districts in Seven States .117Figure 4.4b Language Achievement in Low-Literacy Districts in Seven States .117Figure 4.5 Central and State Expenditure on Primary Education ............... ....................... 126


-Ix-
ABSTRACT
Over the last four years since the macroeconomic crisis of 1991, the Indian economy hasundergone substantial changes. Almost all areas of the economy have been opened to domesticand foreign private investment. Import licensing restrictions on intermediates and capital goodshave been virtually eliminated. Tariffs have been significantly reduced and full convertibility hasbeen established for current account transactions. In the financial sector, prudential regulationsthat meet international standards have been introduced; banks now have significantly morediscretion in their lending decisions; financial markets have been liberalized; and entry restrictionshave been eliminated. The external accounts have strengthened considerably and, although still amajor obstacle to higher growth, central fiscal imbalances are lower. By 1994-95, GDP growthhad risen to 5.3 percent from one percent in 1991-92.
Notwithstanding the improving economic performance, this report, like the Government's recentEconomic Survey, highlights a large unfinished agenda. First, all reforms, which are part of theprogram articulated since 1991, need to be followed through to completion. In addition,agriculture, which historically has contributed extensively to poverty reduction, requires a morefocused effort. Reforms in this sector have been uneven and partial. Similarly, the pace of publicenterprise reform has yet to accelerate.
Second, an urgent and appreciable improvement in public savings (now practically zero)--embracing reduction of the fiscal deficits of the Central and state governments, and improvingsubstantially the efficiency of public enterprises--is absolutely necessary. It is critical for restoringthe capacity of the public sector to invest, and accommodate higher levels of private investment.Such levels of total investment, particularly in infrastructure and social services such as primaryeducation, are needed to achieve and sustain rates of growth and poverty reduction comparable tohigh performing countries in Asia. If the public sector savings performance is not reversed--permitting a sustained reduction in the public sector deficit--excessive monetary tightening will berequired to reduce inflation. This would affect real interest rates, investment, and the necessaryprocess of financial sector liberalization, and place India on a lower growth trajectory.
Third, failure to correct fiscal imbalances would complicate and ultimately undermine externalsector policies. Over the last two years, the challenge has been to prevent surpluses in the capitalaccount from causing the nominal and real exchange rates to appreciate, and thereby, fromreducing export growth. Careful and cautious management of these external accounts needs tocontinue in the foreseeable future, whether the challenge is large capital inflows or outflows. Atthe same time, international experience indicates that a strong fiscal position has a central role inmanaging effectively the capital and current accounts of the balance of payments.
Fourth, in an economy which was driven for four decades by increases in public investment,maintaining dynamic growth requires a dramatic increase in private investment in infrastructure.Recent changes in the policy framework provide ample scope for this needed private sectorinvolvement, and private investors have expressed interest in participating in the sector. Buttranslating their interest into actual capital formation will require the authorities also to address anumber of specific legal, regulatory, and administrative issues that are inhibiting such investment.Resolving these issues in some cases will depend on actions by state governments.

ACKNOWLEDGMENTS
This Memorandum was prepared by a team led by Colin Bruce. It draws on contributions fromZoubida Allaoua (poverty); Paul Beckerman (monetary and financial sector developments andpolicies); Benoit Blarel (recent agricultural sector performance); Robert Burns (financial,institutional, legal and regulatory issues in the transportation sector); Joelle Chassard (legal,regulatory and administrative issues in the power sector); Xinghai Fang (the management of largecapital inflows); Mona Haddad (external sector developments); Fernando L. Hernandez (themanagement of large capital inflows); Keith Hinchliffe (education finance); Ernst Huning(financial issues in the transportation sector); Mudassar Imran (recent developments in thehydrocarbons and coal sectors); Sanjay Kathuria (trade policy and inflation); Hugh Lantzke(legal, regulatory and administrative issues in the telecommunications sector); Marlaine Lockheed(primary education); William McCarten (central and state finances, intergovernmental fiscalrelations, and fiscal reforms at the state level); John Middleton (primary education); Kari Nyman(recent performance and reforms in the power sector); Keith Oblitas (financial and institutionalissues in the irrigation and water resources sector); Shreelata Rao-Seshadri (social sector issues);V.J. Ravishankar (central and state finances, and intergovernmental fiscal relations); SunandaSengupta (industrial profitability and capital market developments); Martin Stewart-Smith (legaland regulatory issues in the telecommunications and power sectors); Fahrettin Yagci (industrialsector performance, regulations and policies, and public enterprise performance and reforms); andChristina Wood (financial and institutional issues in the irrigation and water resources sector).Statistical and computational assistance was received from Maria Almero-Siochi, Rajni Khanna,Bhaskar Naidu and Farah Zahir.
Arrangements for missions to India were made by Marilyn Chatterji and Padma Gopalan.Production assistance was provided by Marcia Bailey, Zelena Jagdeo, Lal Gardner and DianeGaither. The document was prepared under the guidance of Roberto Zagha and the generaldirection of Luis Ernesto Derbez, Division Chief. The peer reviewers for the whole report wereLuca Barbone and Nemat Talaat Shafik. Mohan Gopal contributed to and reviewed Chapter 3.Nicholas Burnett provided comments on Chapter 4.
We gratefully acknowledge the cooperation of government officials and other colleagues in Chile,Colombia, Indonesia, Malaysia, the Republic of Korea and Thailand in our investigation ofpractical aspects of managing large capital inflows. Our appreciation is also extended to theUnion Ministries of Finance, Power, Surface Transport and Water Resources, the UnionDepartments of Education and Telecommunications, the Reserve Bank of India, stategovernments and other governmental and private institutions in India for their cooperation in thepreparation of this Memorandum. The document was discussed with the Indian authorities duringMay 22-25, 1995.

-xi-ABBREVIATIONS AND ACRONYMS
AEC Ahmedabad Electricity Company HMT H-industan Machine ToolsAL Advance License ICC International Chamber of CommerceARWSP Accelerated Water Supply Program ICD Inland Container DepotBHEL Bharat Heavy Electricals Limited ICDS Integrated Child Development SchemeBIFR Board of Industrial and Financial ICICI Industrial Credit and Investment
Restructuring Corporation of IndiaBOLT Build-Own-Lease-Transfer IDBI Industrial Development Bank of IndiaBOT Build-Operate-Transfer IDF India Development ForumBSES Bombay Suburban Electric Supply lIP Index of Industrial ProductionCABE Central Advisory Board on Education IPC Investment Promotion CellCD Certificate of Deposit IPCG Import Promotion Capital Goods SchemeCEA Central Electricity Authority IPP Independent Power Projects/ ProducersCESC Calcutta Electric Supply Corporation IPRS Intemational Price ReimbursementCII Confederation of Indian Industry SchemeCIL Coal India Limited IRDP Integrated Rural Development ProgramCMIE Centre for Monitoring the Indian ISO International Standards Organization
Economy ITU Intemational Telecommunications UnionCONCOR Container Corporation JNPT Jawahalal Nehru Port TrustCP Commercial Paper JRY Jawahar Rozgar YojanaCPI Consumer Price Index LIC Life Insurance CompanyCRR Cash Reserve Requirement LOI Letter of InvitationCSO Central Statistical Organisation M&A Mergers and AcquisitionsCSS Centrally Sponsored Schemes MDR Maximum Deposit RateDFHI Discount Finance House of India MHRD Ministry of Human ResourceDFI Development Finance Institution DevelopmentDGCIS Directorate General of Commercial MLL Minimal Levels of Learning
Intelligence and Statistics MLR Minimum Lending RateDIET District Institute of Education and MNC Multinational Corporation
Training MOC Ministry of CommunicationsDOT Department of Telecommunications MODVAT Modified Value Added TaxDPEP District Primary Education Program MOF Ministry of FinanceDRS Debt Reporting System MOP Ministry of PowerEAS Employment Assurance Scheme MOST Ministry of Surface TransportEB Empirical Bayes MOU Memorandum of UnderstandingEFT Electronic Funds Transfer MOWR Ministry of Water ResourcesEGF Employmnent Generation Fund MRTP Monopolies and Restrictive TradeEPCG Export Promotion Capital Goods Scheme Practices ActFCBOD Foreign Currency (Banks & Others) MTNL Mahanagar Telephone Nigam Limited
Deposits MTO Multimodal Transport of Goods ActFCCB Foreign Currency Convertible Bonds NABARD National Bank for Rural DevelopmentFCNRA Foreign Currency (Non-Resident) NCA Normal Central Assistance
Accounts NCAER National Council of Applied EconomicFCNRB Foreign Currency (Non-Resident) Research
Accounts Bank Scheme NCERT National Council of Education ResearchFCON Foreign Currency (Ordinary) Non- and Training
Repatriable Deposit Scheme NDP National Drug PolicyFDI Foreign Direct Investment NGO Non-Governmental OrganizationFERA Foreign Exchange Regulation Act NHA National Highway AuthorityFIl Foreign Institutional Investment NHPC National Hydroelectric PowerFIPB Foreign Investment Promotion Board CorporationFRN Foreign Rate Notes NIEPA National Institute of EducationalFSQ Free Sale Quota Planning and AdministrationFW Family Welfare NREP National Rural Employment ProgramGDP Gross Domestic Product NRER(A) Non-Resident External Rupee AccountGDR Global Depository Receipts NRF National Renewal FundGER Gross Enrollment Ratio NRls Non-Resident IndiansGIC General Insurance Company NRNRD Non-Resident (Non-Repatriable) DepositGNP Gross National Product SchemeGOO Government of Orissa NRY Nehru Rozgar YojanaGRIDCO Grid Corporation of Orissa NSE National Stock ExchangeHLM Hierarchical Linear Modeling NSSO National Sample Survey Organisation

-Xii-
NTP New Telecom Policy VAS Value Added ServicesNTPC National Thermal Power Corporation VAT Value Added TaxNWB National Water Board VPT Village Public TelephonesNWP National Water Policy VRS Voluntary Retirement SchemnesO&M Operations and Maintenance VSAT Very Small Aperture TemiinalOBB Operation Blackboard VSNL Videsh Sanchar Nigam LimitedOBC Other Backward Castes WPI Wholesale Price IndexOECD Organisation for Economic Cooperation WRCP Water Resource Consolidation Project
and Development WRMP Water Resource Management ProjectOGL Open General License WIJA Water Users AssociationOHPC Orissa Hydro Power CorporationOSEB Orissa State Electricity BoardPDS Public Distribution SystemPE/ PSE Public EnterprisePFC Power Finance CorporationPLF Plant Load FactorPOL Petroleum, Oil and LubricantsPOWERGRID Power Grid Corporation of IndiaPPA Power Purchase AgreementPSRA Public Sector Restructuring BoardPWD Public Works DepartmentRBI Reserve Bank of IndiaREC Rural Electrification CorporationREER Real Effective Exchange RateRFC Resident Foreign Currency AccountRFP Request for ProposalRLDC Regional Load Dispatch CenterRLEGP Rural Landless Employment Guarantee
ProgramRRB Rural Regional BankSAIL Steel Authority of India Ltd.SC Scheduled CastesSCI Shipping Corporation of IndiaSEB State Electricity BoardSEBI Security and Exchange Board of IndiaSES Socio-Economic StatusSGC State Generating CompaniesSGDP Sectoral Gross Domestic ProductSGL Subsidiary General LedgerSICA Sick Industrial Companies ActSIDA Swedish International Development
AgencySIL Special Import LicenseSLR Statutory Liquidity RequirementsST Scheduled TribesSTCI Securities Trading Corporation of IndiaSTD/ISD Subscribers Truncated Dialing/
International Subscribers DialingTEC Tata Electric CompaniesTFC Tenth Finance CommissionTRAI Telecom Regulatory Authority of IndiaUKODA United Kingdom Overseas Development
AgencyUNCTAD United Nations Conference on Trade and
DevelopmentUNDP United Nations Development ProgramUNICEF United Nations International Children's
Emergency FundUT Union TerritoryUTI Unit Trust of India

-Xiii-
CURRENCY
Rs/ US$
Currenvy Official Unified Marketl
Prior to June, 1966 4.76June 6, 1966 to mid-December 1971 7.50Mid-December 1971 to end-June 1972 7.28
1971-72 7.441972-73 7.711973-74 7.791974-75 7.981975-76 8.651976-77 8.941977-78 8.561978-79 8.21
1979-80 8.081980-81 7.891981-82 8.931982-83 9.631983-84 10.311984-85 11.891985-86 12.241986-87 12.791987-88 12.971988-89 14.481989-90 16.661990-91 17.951991-92 24.521992-93 26.41 30.651993-94 31.361994-95 31.40
March 1995 31.65April 1995 31.41May 1995 31.42
Note: The Indian fiscal year runs from April 1 through March 31.
Source: IMF, International Finance Statistics (IFS), line "rf'; Reserve Bank of India.
A dual exchange rate system was created in March 1992, with a free market for about 60 percent of foreign exchangetransactions. The exchange rate was reunified at the beginning of March 1993 at the free market rate.

-xiv-
ECONOMIC DEVELOPMENT DATA
GNP Per Capita (US$, 1993-94): 290 a
Gross Domestic Product (1993-94)
Annual Growth Rate (% p.a.., constant prices)% of 70-71- 75-76- 80-81- 85-86- 91-92- 92-93-
USS Bln GDP 75-76 80-81 85-86 90-91 92-93 93-94GDP at Market Prices 250.6 100.0 2.4 3.0 5.3 6.6 4.6 3.5Gross Domestic Investment 53.4 21.3 4.4 3.8 4.7 8.3 8.0 -3.9Gross National Saving 52.7 21.0 4.4 2.6 3.6 8.8 4.2 1.0Current Account Balance -0.7 -0.3 -- -- -- -- -- --
Output, Employment and Productivity (1990-91)
Value Added Labor Force b V. A. per WorkerUSS Bln. % of Tot Mill. % of Tot. US$ % of Avg.
Agriculture 82.5 31.0 186.2 66.8 443 46.4Industry 78.0 29.3 35.5 12.7 2195 230.0Services 105.7 39.7 57.2 20.5 1849 193.7Total/ Average 266.2 100.0 278.9 100.0 954 100.0
Government Finance
General Government c Central GovermmentRs. Bln. % of GDP Rs. Bln. % of GDP1993-94 1993-94 8S-89-93-94 1993-94 1993-94 88-89-93-94
Revenue Receipts 1477.0 18.8 19.9 754.5 9.6 10.5Revenue Expenditures 1864.0 23.7 23.6 1081.7 13.8 13.6
Revenue Surplus/ Deficit (-) -387.0 -4.9 -3.7 -327.2 -4.2 -3.1
Capital Expenditures d 367.3 4.7 5.0 275.4 3.5 4.2
External Assistance (net) 50.7 0.6 0.7 50.7 0.6 0.7
Money, Credit, and Prices
88-89 89-90 90-91 91-92 92-93 93-94 94-95p(Rs. billion outstanding, end of period)
Money andQuasi Money 2002.4 2309.5 2658.3 3170.5 3668.3 4344.1 5264.8Bank Credit to Government (net) 973.7 1171.5 1401.9 1582.6 1762.4 2039.2 2195.9Bank Credit to Commercial Sector 1326.6 1517.0 1717.7 1879.9 2201.4 2377.7 2878.9
(percentage or index numbers)Money and Quasi Money as % of GDP 50.6 50.6 49.6 51.5 52.2 55.2 57.6Wholesale Price Index (1981-82 = 100) 154.3 165.7 182.7 207.8 228.7 247.8 284.6
Annual Percentage Changes in:WholesalePriceIndex 7.5 7.4 10.3 13.7 10.1 8.4 14.9Bank Credit to Government (net) 15.4 20.3 19.7 12.9 11.4 15.7 7.7BankCredittoCommercial Sector 23.4 14.4 13.2 9.4 17.1 8.0 21.1
a. The per capita GNP estimate is at market prices, using World Bank Atlas methodology. Other conversions to dollars in thistable are at the prevailing average exchange rate for the period covered.
b. Total Labor Force from 1991 Census. Excludes data for Assain and Jammu & Kashmir.c. Transfers between Centre and States have been netted out.d. All loans and advances to third parties have been netted out.e. As recorded in the government budget.
-xv-
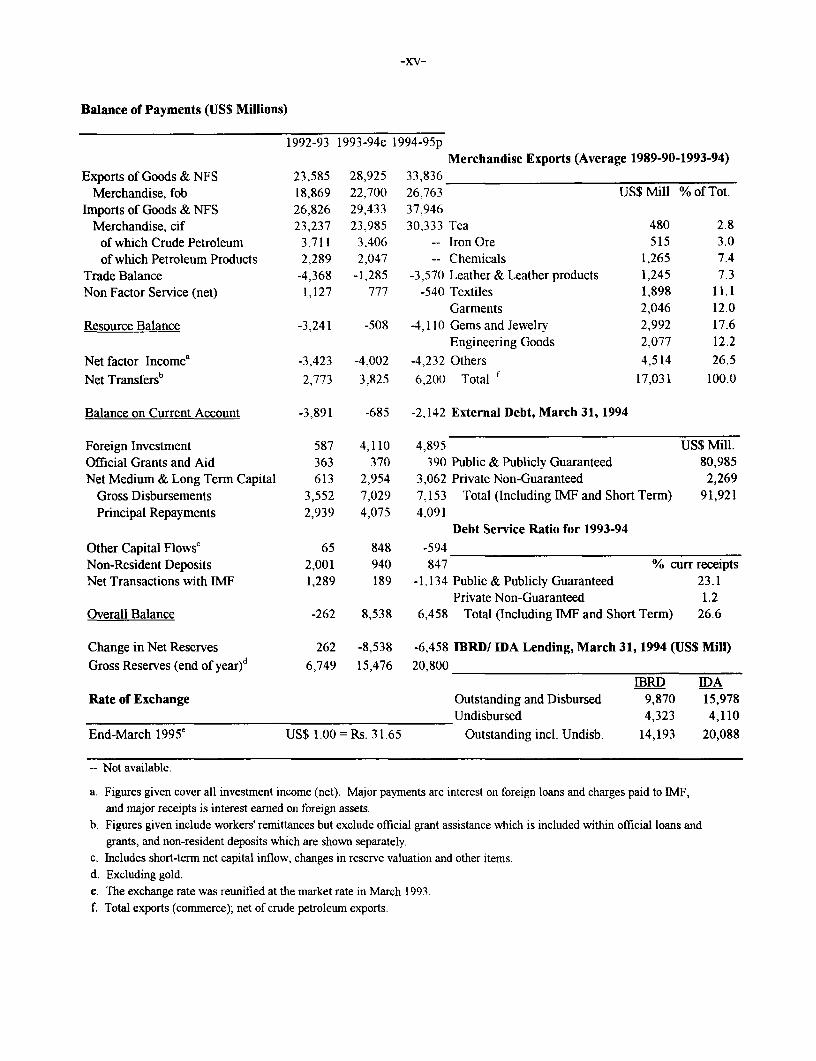
Balance of Payments (US$ Millions)
1992-93 1993-94e 1994-95pMerchandise Exports (Average 1989-90-1993-94)
Exports of Goods & NFS 23,585 28,925 33,836Merchandise, fob 18,869 22.700 26,763 US$ Mill % of Tot.
Imports of Goods & NFS 26,826 29,433 37.946Merchandise, cif 23,237 23,985 30,333 Tea 480 2.8
of which Crude Petroleum 3,711 3.406 -- Iron Ore 515 3.0of which Petroleum Products 2,289 2.047 -- Chemicals 1,265 7.4
Trade Balance -4,368 -1,285 -3,570 Leather & Leather products 1,245 7.3Non Factor Service (net) 1,127 777 -540 Textiles 1,898 11.1
Garments 2,046 12.0Resource Balance -3,241 -508 -4.110 Gems and Jewelry 2,992 17.6
Engineering Goods 2,077 12.2
Net factor Incomea -3,423 -4,002 -4,232 Others 4,514 26.5Net Transfersb 2,773 3,825 6,200 Total f 17,031 100.0
Balance on Current Account -3,891 -685 -2,142 External Debt, March 31, 1994
Foreign Investment 587 4,110 4,895 US$ Mill.Official Grants and Aid 363 370 390 Public & Publicly Guaranteed 80,985Net Medium & Long Term Capital 613 2,954 3,062 Private Non-Guaranteed 2,269
Gross Disbursements 3,552 7,029 7.153 Total (Including IMF and Short Term) 91,921Principal Repayments 2,939 4.075 4,091
Debt Service Ratio for 1993-94Other Capital Flowsc 65 848 -594Non-Resident Deposits 2,001 940 847 % curr receiptsNet Transactions with IMF 1,289 189 -1.134 Public & Publicly Guaranteed 23.1
Private Non-Guaranteed 1.2Overall Balance -262 8,538 6,458 Total (Including IMF and Short Term) 26.6
Change in Net Reserves 262 -8,538 -6,458 IBRD/ IDA Lending, March 31, 1994 (US$ Mill)Gross Reserves (end of year)d 6,749 15,476 20,800
IBRD IDARate of Exchange Outstanding and Disbursed 9,870 15,978
Undisbursed 4,323 4,110
End-March 1995e US$ 1.00 = Rs. 31.65 Outstanding incl. Undisb. 14,193 20,088
-- Not available.
a. Figures given cover all investment income (net). Major payments are interest on foreign loans and charges paid to IMF,and major receipts is interest earned on foreign assets.
b. Figures given include workers' remittances but exclude official grant assistance which is included within official loans andgrants, and non-resident deposits which are shown separately.
c. Includes short-term net capital inflow, changes in reserve valuation and other items.d. Excluding gold.e. The exchange rate was reunified at the market rate in March 1993.f. Total exports (commerce); net of crude petroleum exports.

-XVi-
IndiaMost Same region,4ncome grou Next
Latest singkcyear recent higherUnit of estimate South Lor. income
Indicator measure 1970-75 1980-85 1988-93 Asia income group
Priority Poverty IndicatorsPOVERTYUpper poverty line local curr. ..
Headcount index % of pop. 43 .. .. 28 19Lower poverty line local curr. .. .. ..
Headcount index % of pop. .. .. ..
GNPpercapita USS 180 280 310 310 380 1,590
SHORT TERM INCOME INDICATORSUnskilled urban wages local curr. .. .. ..
Unskilled rural wagesRural terms of trade .. 84 94
Consumerpriceindex 1987=100 45 85 171Lower income " .. .. ..
Food' 27 .. ..
Urban .. 83 176 ..
Rural
SOCIAL INDICATORSPublic expenditure on basic social services % of GDP .. .. ..
Gross enrollment ratiosPrimary %schoolagepop. 79 96 106 106 108 104Male 94 111 118 118 116Female 62 80 93 93 101
MortalityInfant mortality perthou. live births 132.0 106.0 80.0 83.7 63.1 39.0Under 5 mortality .. .. 122.0 123.9 101.4 61.5
ImnunizationMeasles % age group .. .. 85.8 85.8 87.3 77.6DPT " .. 41.0 90.2 90.2 89.9 82.2
Child malnutrition (under-5) .. . 63.0 60.4 40.3Life expectancyTotal years 50 55 61 60 62 67Female advantage -1.9 -0.3 0.1 0.4 2.1 5.9
Total fertility rate births per woman 5.4 4.5 3.7 4.0 3.6 2.9Maternal mortality rate per 100,000 live births .. 460 420 420
Supplementary Poverty IndicatorsExpenditures on social security % of total gov't exp. .. .. ..
Social security coverage % econ. active pop. .. .. ..
Accessto safewater: total %ofpop. 31.0 56.3 74.5 69.5 67.0Urban " 80.0 76.0 79.0 73.8 78.7Rural 18.0 50.0 73.0 67.2 62.0
Access to health care .. 75.0 100.0 95.8
Population growth rate GNP per capita growth rate Development diamondb6 (annual average, percent) 5 (annual average, percent) Life expectancy
45GNP Gross
2 ~ ~ ~ ~_ _ __ _ _ _ per i-
-Pit* I6olment
0 - - -5
-2 - -10 - Access to ;afe water1970-75 1980-85 1988-93 1970-75 1980-85 1988-93
z India India- Low-income - Low-income
a. See the technical notes, p.387. b. The development diamond, based on four key indicators, shows the average level of development in the countrycompared with its income group. See the introduction.

-xvii-
IndiaMost Same region/income grou Nexd
Latest singleyear recent higherUnit of estimate South Low- income
Indicator measure 1970-75 1980-85 1988-93 Asia income group
Resources and ExpendituresHUMAN RESOURCESPopulation(mre=1993) thousands 620,701 762,875 898,200 1,193,503 3.091,764 1,096,665Age dependency ratio ratio 0.77 0.72 0.70 0.74 0.67 0.69Urban %ofpop. 21.3 24.3 26.3 25.7 27.6 54.7Population growth rate annual % 2.2 2.0 2.0 2.1 1.9 1.6
Urban " 3.7 3.0 3.0 3.5 3.9 2.9
Laborforce(15-64) thousands 243,481 293,193 341,460 437,138 1,442.452 459,196Agriculture % of labor force 71 70Industry " 13 13 ..
Female 28 26 25 22 33 31Females per 100 males
Urban number 81 88 ..Rural 96 94 ..
NATURAL RESOURCESArea thou sq. km 3,287.59 3,287.59 3,287.59 5,133.49 39,091.96 40.682.67Density pop. per sq. km 188.80 232.05 267.69 227.55 77.60 26.52Agricultural land %of land area 60.83 60.86 60.89 59.03 52.82 39.61Change in agricultural land annual % 047 -0.07 0.03 0.00 0.03 -0.13Agricultural land under irrigation % 18.65 23.09 25.30 29.34 18.02 12.66Forests and woodland thou. sq. km .. 551.19 517.29 658.32 7,154.40 5,953.78Deforestation (net) annual 0/0 .. .. 0.63
INCOMEHlousehold income
Share of top 200,% of households % of income 49 41 41Share of bottom 40% of households 16 20 21Share of bottom 20% of households 6 8 9
EXPENDITUREFood %ofGDP 43.6 35.3 ..
Staples 20.6 12.4 ..
beat, fish, milk, cheese, eggs 6.5 7.4 ..
Cereal imports thou. metric tonnes 7,669 205 694 6,211 34,420 66,281Food aid in cereals 1.582 304 276 1,624 8,334 5,477Food productionper capita 1987 =100 95 104 113 111 113 101Fertilizer consumption kg/ha 19.3 47.0 67.5 70.2 59.9 48.0ShareofagricultureinGDP %ofGDP 36.6 29.5 28.2 27.4 26.3 15.7Housing %ofGDP 4.4 7.1 ..
Average household size persons per household 5.2 .. ..Urban 4.8 .. ..
Fixed investmnent: housing % of GDP 2.3 2.8 ..
Fuelandpower %ofGDP 2.4 2.3 ..
Energy consumption per capita kg of oil equiv. 123 170 243 216 364 1,595Households with electricity
Urban % of households .. .. ..
RuralTransport and conmmunication %ofGDP 4.7 5.1 ..Fixed investment: transport equipment 1.4 2.3 ..
Total road length thou, km 1.375 1,546 1,636
INVESTMENT IN HUMAN CAPITALHealthPopulationperphysician persons 4,958 2,515 2,446 2,850 .. 3,277Population per nurse 3,756 1,696 ..
Populationperhospitalbed " 1,720 1,296 1,364 1,638 1,016 604Oral rehydyration therapy (under-5) / of cases .. .. 37 37 38EducationGross enrollment ratioSecondary %/ofschool-agepop. 26 38 44 40 41 53
Female " 16 26 32 29 34Pupil-teacher ratio: primary pupils per teacher 42 58 63 61 39Pupil-teacher ratio: secondary 21 21 26 26 20Pupils reaching grade 4 % of cohort 51 58Repeater rate: primary % of total enroll 17Illiteracy %ofpop. (age 15+) 66 56 52 54 41 19
Female %offem. (age 15+) .. 71 66 69 53Newspaper circulation per thou. pop. 15 26 31 26 .. 74World Bank International Economics Department, April 1995


-xix-
EXECUTIVE SUMMARY
The government's Economic Survey, 1994-95 (March 1995), reports and analyzescandidly and insightfully the accomplishments of the stabilization and reform efforts initiated since1991. It also identifies several remaining challenges. That Survey is the point of departure of thisCountry Economic Memorandum (CEM). Chapters I and 2 cover recent developments andselected economic issues at the state level. Chapter 3 of this report reviews the enabling legal,regulatory and administrative framework for expanding private investment in infrastructure.Chapter 4 on Primary Education discusses the accomplishments and challenges in this extremelyimportant area.
Highlights of Recent Developments
Four years ago in India, internal and external imbalances had reached crisis proportions.GDP growth (in 1991-92) had fallen to one percent. Investment in the most important areas ofthe economy was a public sector monopoly and foreign investment was negligible. The traderegime imposed pervasive licensing restrictions on imports of virtually all commodities, andextremely high import duties. The financial sector was dominated by public banks which had littlecommercial discretion in allocating their lending. The prudential regulations were inadequate.This made it difficult to assess the true quality of banks' portfolios or the true level of banks'profits. Financial markets were highly controlled. The tax system was based on highlydistortionary taxes falling on a narrow base, and tax administration was very cumbersome.
The situation has changed dramatically since then, with further improvements during1994-95. While still a major obstacle to high economic growth, the Central Government's fiscaldeficit (which if not corrected would have exceeded 10 percent of GDP) was reduced to 5.9percent of GDP in 1991-92, and 5.7 percent of GDP in 1992-93. It increased to 7.7 percent ofGDP in 1993-94 against a target of 4.7 percent, reflecting revenue shortfalls and expenditureoverruns. But it was reduced again to 6.7 percent of GDP in 1994-95.
The external accounts have strengthened considerably The current account deficitcontracted from 3.7 percent of GDP in 1990-91 to 0.3 percent in 1993-94. It is estimated at 0.7percent of GDP in 1994-95. Following 20 percent growth in 1993-94, exports grew by 17percent in dollar terms during April 1994-January 1995. Reflecting the economic recoveryunderway in 1994-95, imports rose sharply by 28 percent in dollar terms in contrast to a fall ofone percent last year; non-oil imports (particularly imports of machinery, iron and steel) increasedby 33 percent in dollar terms. The resulting trade deficit during the first ten months, at $2 billion,was more than twice the level of the previous year. However, this was partially offset byincreases in remittances. Meanwhile, foreign direct and portfolio investment flows contributed toa large surplus in the capital account and to further accretion of reserves to $20.8 billion by end-March 1995. These reserves were equivalent to around 8.2 months of imports of goods.
-xx-
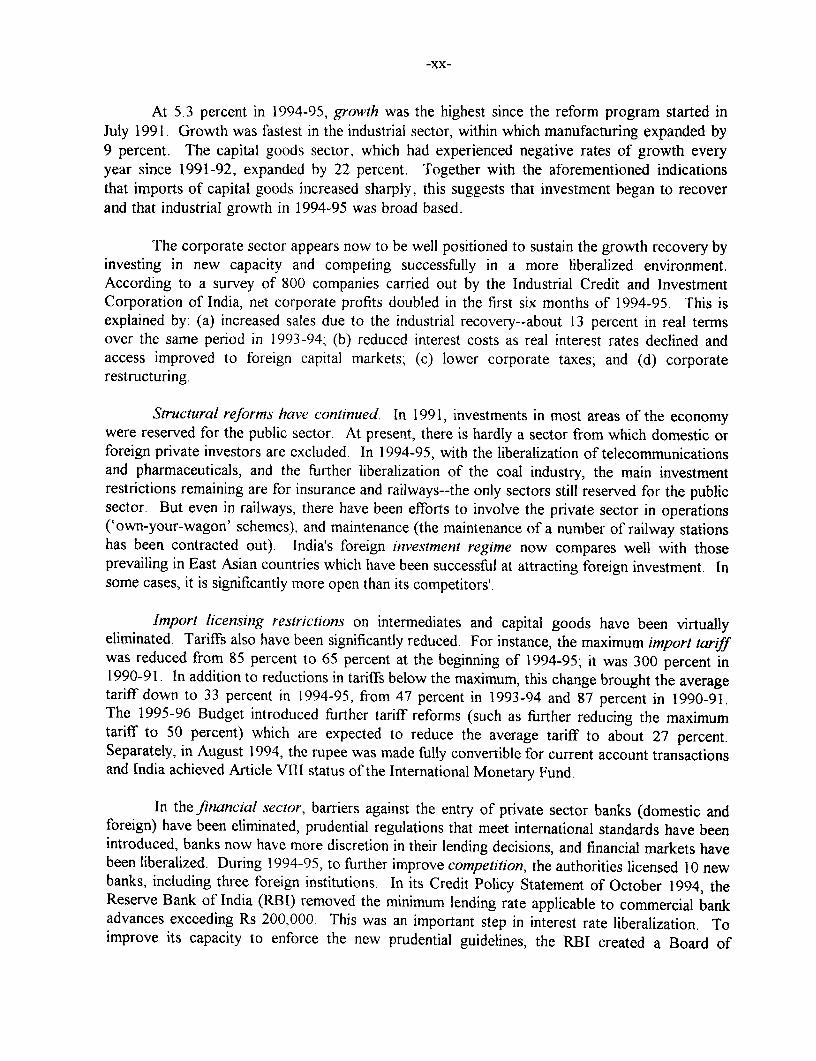
At 5.3 percent in 1994-95, growth was the highest since the reform program started inJuly 1991. Growth was fastest in the industrial sector, within which manufacturing expanded by9 percent. The capital goods sector, which had experienced negative rates of growth everyyear since 1991-92, expanded by 22 percent. Together with the aforementioned indicationsthat imports of capital goods increased sharply, this suggests that investment began to recoverand that industrial growth in 1994-95 was broad based.
The corporate sector appears now to be well positioned to sustain the growth recovery byinvesting in new capacity and competing successfully in a more liberalized environment.According to a survey of 800 companies carried out by the Industrial Credit and InvestmentCorporation of India, net corporate profits doubled in the first six months of 1994-95. This isexplained by: (a) increased sales due to the industrial recovery--about 13 percent in real termsover the same period in 1993-94; (b) reduced interest costs as real interest rates declined andaccess improved to foreign capital markets; (c) lower corporate taxes; and (d) corporaterestructuring.
Structural reforms have continued. In 1991, investments in most areas of the economywere reserved for the public sector. At present, there is hardly a sector from which domestic orforeign private investors are excluded. In 1994-95, with the liberalization of telecommunicationsand pharmaceuticals, and the further liberalization of the coal industry, the main investmentrestrictions remaining are for insurance and railways--the only sectors still reserved for the publicsector. But even in railways, there have been efforts to involve the private sector in operations('own-your-wagon' schemes), and maintenance (the maintenance of a number of railway stationshas been contracted out). India's foreign investment regime now compares well with thoseprevailing in East Asian countries which have been successful at attracting foreign investment. Insome cases, it is significantly more open than its competitors'.
Import licensing restrictions on intermediates and capital goods have been virtuallyeliminated. Tariffs also have been significantly reduced. For instance, the maximum import tariffwas reduced from 85 percent to 65 percent at the beginning of 1994-95; it was 300 percent in1990-91. In addition to reductions in tariffs below the maximum, this change brought the averagetariff down to 33 percent in 1994-95, from 47 percent in 1993-94 and 87 percent in 1990-91.The 1995-96 Budget introduced further tariff reforms (such as further reducing the maximumtariff to 50 percent) which are expected to reduce the average tariff to about 27 percent.Separately, in August 1994, the rupee was made fully convertible for current account transactionsand India achieved Article VIII status of the International Monetary Fund.
In the financial sector, barriers against the entry of private sector banks (domestic andforeign) have been eliminated, prudential regulations that meet international standards have beenintroduced, banks now have more discretion in their lending decisions, and financial markets havebeen liberalized. During 1994-95, to further improve competition, the authorities licensed 10 newbanks, including three foreign institutions. In its Credit Policy Statement of October 1994, theReserve Bank of India (RBI) removed the minimum lending rate applicable to commercial bankadvances exceeding Rs 200,000. This was an important step in interest rate liberalization. Toimprove its capacity to enforce the new prudential guidelines, the RBI created a Board of

-xxi-
Financial Supervision which started functioning in December 1994. And as part of its strategy tostrengthen and broaden the ownership base of public banks, the Government in 1994 provided$3.3 billion in recapitalization to the 19 "nationalized" commercial banks directly owned by theMinistry of Finance. It also changed legislation to allow private ownership of these banks up to49 percent of equity.
Progress likewise has been made in developing money markets. In March 1995, the RBIissued guidelines for creating a system of primary dealers in government securities. Together withthe historic agreement (reached in 1994) between the Treasury and the RBI to phase out (overthree years) the automatic monetization of the deficit, these developments established the basis formarket-determined interest rates on Government paper, and for more flexible and independentimplementation of monetary policy by the RBI.
Since 1991, the tax regime has been simplified and strengthened considerably. In the1994-95 Budget, taxes on corporate income were unified at 40 percent, from 45 percent forwidely held companies and 50 percent for others. A major reform of excises was implemented tomake it more closely resemble a value-added tax and address its major problems. Meanwhile, theGovernment extended the coverage of MODVAT (a modified value-added tax) to includemanufacturing sectors thus far excluded, and, for the first time, some services. Of particularimportance also were the decisions to: (a) shift most excise rates from specific to ad-valorem toincrease buoyancy; (b) reduce the number of rates; and (c) simplify the system by relying oninvoices for value determination. These reforms considerably simplified and modernized India'stax system and made it possible for the Central Government to begin to focus its efforts onimproving tax administration. The 1995-96 Budget further reduced peak excises. It did notreduce corporate tax rates further but it continued the emphasis on simplification, lower rates andgreater buoyancy. To strengthen compliance, the authorities proposed tax deduction at source forfees for professionals, technical services and service contracts, and interest income on timedeposits.
Clearly, all of the foregoing reforms, which are part of the program which has beenarticulated since 1991, need to be followed through to completion. But there also needs to be amore focused effort on agriculture which historically has contributed substantially to povertyreduction. Here the pace of reforms has been uneven and partial. The performance of agriculturestill suffers from obstacles to domestic and international trade, and agro-processing. Theseobstacles not only limit the potential gains of a better integration of India's regional markets, butalso the gains stemming from a better integration of India's agriculture with the rest of the world.Broader concerns arise from the inappropriate composition of public expenditures in the sector,particularly the large share of Central Government expenditures devoted to subsidies. One resultis the inability of the public sector to contribute adequately to the needed gross capital formationin the sector. Similarly, the pace of public enterprise reform has yet to accelerate.
Selected Challenges in Economic Management
Overview. The achievements since 1991 notwithstanding, serious problems remain andthe "unfinished agenda" is very challenging. From March 1994, the twelve-month inflation rate

-xxii-
climbed to around 12 percent--above the psychologically comfortable level of 10 percent--a levelabove which it remained until April 1995. As of 1993-94, total investment was about 3-4percentage points of GDP below the level in the years just before 1991 (although gross fixedcapital formation was only slightly lower). Even if private investment recovered somewhat in1994-95, there are no indications that public sector investment did. In fact, because of its poorfinancial performance, the public sector does not have the resources to invest at adequate levels inpublic infrastructure and social services.
Public Savings. The most importanit issue in current economic management in India isimproving public savings appreciably and reducinig the fiscal deficit. India's private savingsperformance is strikingly comparable to that of Malaysia's and other successful East Asianeconomies. For instance, during the 1980s, it was 19 percent of GDP for Malaysia, a level whichIndia marginally exceeded towards the end of that decade. In sharp contrast, India's publicsavings performance (that is, the excess of central and state government revenues over currentexpenditure plus the gross profits of public enterprises) has been much worse, and has beendeteriorating. It was around three percent of GDP in the 1 980s but has been declining since then.Now it is zero.
C(orrecting this situation is criticalfor restoring ihe capacity of the public sector to investand for accommodating higher levels of private investment. Such levels of investment,particularly in infrastructure and social services, are needed to achieve and sustain rates of growthand poverty reduction comparable to high performing countries in Asia. In addition, if the publicsector savings performance is tnot re versed--permitting a sustained reduction in the public sectordeficit--excessive monetary tightening will be required to reduce inflation. This would affectreal interest rates, investment, and the necessary process of financial sector liberalization, andplace India on a lower growth trajectory.
Continuous improvements in the current account deficit of the balance of paymentssuggest that fiscal imbalances lhave not yet spilled over into the external accounts. However, thismay have resulted from subdued levels of investment typical of the initial phases of structuraladjustment programs and evident in India in recent years. A strong recovery would easilyincrease domestic investment to the levels prevailing in years such as 1990-91, and possiblyhigher. In this case, unless public savings increase, a strong investment recovery could have astrong destabilizing effect on the balance of payments.
Reversing the deterioration in public savinigs requires major improvements in thefinancial performance of the central and state governments, as well as public enterprises. Atboth the center and state levels, non-interest expenditure already has borne the brunt of fiscaladjustment and not much room is left for further reductions. At the same time, fiscal adjustmentmust proceed without jeopardizing public resources for human resource development andtargeted anti-poverty programs. Containing food subsidies would help. This would depend, to alarge extent, on effective management of the record level of stocks now in the godowns of theFood Corporation of India. Large and timely releases into the external market and the eliminationof restrictions by the states on private traders' ability to hold stocks would reduce the significantcarrying cost. Besides further reducing other subsidies, particularly for fertilizers, and readjustingoil prices, achieving further fiscal consolidation at the level of the Central Government will likely

-xxiii-
need to rely on: (a) continuing the tax reform process, with full attention to improving taxadministration and tax collections, extending the tax net, and increasing the role of personalincome taxes (in 1992, about four million persons--equivalent to about 0.5 percent of the totalpopulation and 2 percent of the urban population--paid personal income taxes); and (b) moreaggressive privatization of enterprises owned by the Central Government, primarily to improveefficiency (losses by central public enterprise are close to one percent of GDP), but also to retiredebt. At the level of the states, further fiscal consolidation will need to rely on cost recovery(particularly in power and water); on strengthening tax efforts; and containing the growth ofcurrent expenditure
Fiscal Adjustment and the 1995-96 Budget. The 1995-96 Budget of the CentralGovernment meets only very partially the major challenge of fiscal consolidation. It aims toreduce the fiscal deficit to 5.5 percent of GDP, a significant decline of 1.2 percentage points ofGDP in relation to 1994-95--mostly by contracting non-interest spending and acceleratingdisinvestment in public enterprises. However, some of the implicit assumptions underlying thebudget may be overoptimistic. In particular, the budget assumes implicitly that: (a) the policy ofmonetary restraint in place since December 1994 will not significantly affect growth and thus taxrevenues; (b) the recommendations of the Pay Commission will not increase expenditure on wagesand salaries during 1995-96; (c) the government will be able to reduce grants and loans to thestates even though general elections are due before May 1996; and (d) disinvestment of publicenterprises can be accelerated in spite of the pressures typical in a pre-election year. Clearly,although possible, achieving the 1995-96 fiscal deficit target of 5.5 percent of GDP will be verydifficult. But even if the target is achieved, the fiscal deficit would still need to be reduced furtherto stabilize interest payments on the Central Government's domestic debt, and to enable privateinvestment to grow at the levels required to sustain more rapid growth.
UJntder reasonable assumptions, a deficit of 5.5 percent of GDP needs to be reduced by affurther 1.5-2.5 percent of GL)I to reach the government's inflation target of 5-6 percent andincrease growth to 6.5 percent In addition, with financial sector liberalization underway in India,and long-term international real interest rates projected to remain at around 4-5 percent, India'slong-term real interest rates will be at least 5 percent. This implies that GDP growth rates lowerthan 5-6 percent will requiire primary surpluses just to stabilize the domestic debt in relation toGDP. Yet, the government has not been able so far to generate a primary surplus. Indeed,interest payments have claimed an increasingly large share of the Central Government's taxrevenues--SO percent in 1990-91, bhut 70 percent in 1995-96. This means that for every Rs I oftaxes collected, the government now has discretion over just one-third of it (before incurring adeficit). Unless this situation is reversed, the probability of the government eventually collectingtaxes just to service its debt is more than marginal. If unchecked, such trends will undermineconfidence in public sector financial management, with adverse consequences for India's financialmarkets.
These calculations capture the financial consequences of rising government debt, but theconsequences for growth and development are at least equally serious. As interest payments rise,development expenditure will suffer inevitably. If the composition of expenditure is not improved

-xxiv-
(in particular, if public savings do not increase to finance public investments with high returns),the foundation for further growth will weaken.
State Finances. Adjustments in state finances are equally important. The CentralGovernment devolves to the states roughly 30 percent (40 percent) of the tax receipts it mobilizes(retains). In addition, the center provides loans and grants to states equivalent to about 25percent of its total expenditures. In fact, the center has delivered over 90 percent of itscontribution to plan expenditure under the Eighth Plan for the 1992-95. Meanwhile, the stateshave only met 28 percent of their contribution.
Over time, the indebtedness of the states to the center has increased despite periodic debtrelief from the center. Because of the weak revenue performance of the states, the burden of theresulting debt service obligations to the center also has risen steadily, even though the effectiveinterest rates on these loans have been relatively low. In response, the center has moderated thegrowth in its lending to states. One consequence, however, is that net loan transfers from theCentral Government to the states are turning negative. Given the difficult financial position ofmany states, net negative loan transfers from the Central Government could weaken their abilityto service their debt to the Central Government. This may have a strong impact on the CentralGovernment revenues, even if the center is able to deduct some payments from the states at thesource (of transfers).
There is also a need to review the system of transfers between the central and stategovernments. Traditionally, states have looked to moneys from the Central Government as thesolution to their financial problems. Funds flow from the Central Government to the statesthrough three principal channels. First, every five years the President of India appoints a FinanceCommission, as mandated by the Constitution. This Commission makes recommendations forawarding transfers from the Central Government to the states from certain taxes collectednationwide, as well as grants. A major objective of the Finance Commission is to ensure broadlythat the revenues collected are allocated between the Central Government and states in a way thatenables each to carry out the public service responsibilities assigned to them under theConstitution. In keeping with this objective, Finance Commissions also seek to leave states with asurplus on recurrent account to assist in financing their capital expenditures. Transfers via theFinance Commission declined from 65 percent during 1969-74 to 58 percent of the total CentralGovernment transfers to the states in 1992-93 because funds via the other major source increasedmuch faster. That second but important channel through which the Central Government providesfunds to the states is the allocations authorized by the Planning Commission for economic andsocial development. In recent years, about 50 percent of state deficits has been financed in thismanner. Third, the Central Government has direct or indirect control over the way in which theremainder of these deficits is financed.
The current system may be discouraging fiscal discipline. The current system ofintergovernmental transfers presents several problems of which the following are examples. First,because Finance Commissions traditionally have sought to fill the revenue shortfall of states, thelatter have had little incentive to strengthen their effort to improve their revenues, for instance,through taxation or better cost recovery. Second, there is evidence at the aggregate level that

-xxv-
funding (including loans) for projects approved by the Planning Commission is spent, at least inpart, on recurrent expenditure items. Third, in keeping with its regulations, the PlanningComrnission authorizes funding for the operating as well as the capital costs of new stateprograms for the first five years from their inception. This funding, which typically is 30 percentgrant and 70 percent loan, encourages states to initiate new programs even when additional ownrevenue cannot be mobilized to finance the associated recurrent costs. The cumulative effect ofthis heavy subsidization of incremental programs has been to foster employment and expendituregrowth, and weaken fiscal performance. Fourth, periodic Central Government loan forgivenessand refinancing, without conditionality, have created the expectation of future debt relief Suchrelief has undermined financial discipline as an incentive for creditworthiness.
As the resources of the center have tightened, making the levels of transfers to statesvulnerable, there is encouraging evidence that the dependence on transfer-based solutions may bechanging. Some states are taking initiatives to improve their revenue and better manage theirexpenditures. Some states have even found ways to begin to address politically sensitive butimportant fiscal reforms. Examples include the strengthening of property taxes (AndhraPradesh); more efficient provision of public services (several states) involving private sectorparticipation; and public enterprise reform (Uttar Pradesh). It is especially welcome that manyinitiatives address the revenue side of the budget. Often in the past, most of the burden ofadjustment has fallen disproportionately and almost entirely on (non-interest) expenditures.
Broader efforts are needed. However, a much broader and uniform reform effort withinand across states is needed. Issues such as the unsustainable indebtedness of states, insufficientcost recovery, inadequate provisions for non-wage operations and maintenance (O&M), and theheavy burden of the wage bill, all remain to be addressed in most states.
An encouraging sign for reforming intergovernmental fiscal relations is the recent reportsubmitted by the Tenth Finance Commission (TFC). The TFC has proposed a number ofinnovative and bold measures. The recommended move towards a mandated system of sharingthe total tax revenue collected by the center (the proposed ratio is 71:29 between the center andthe states), would contribute towards strengthening incentives for enhanced tax collection by theCentral Government because it would reduce the Central Government's relative neglect of taxesshared with the states. The recommendation, tying debt forgiveness by the Central Government(of debts owed by the states) to better fiscal performance by states is a step in the right direction.So too is the proposal to also tie such forgiveness to the use by states of their privatizationproceeds to retire their debt.
The Planning Commission, which at the conceptual level plays the role of a developmentbank, needs to make efforts to ensure that the transfers it authorizes are used for the intendedpurposes and that borrowed resources are utilized only for such expenditures that yield a returnadequate to meet the cost of borrowing. Options for rationalizing its transfers could include: (a)doing away with the fixed (70 percent for major states) loan component of central assistance tostate plans, and replacing this with specific purpose loans advanced on the basis of repaymentcapacity, with generous provision of technical assistance, particularly for states with weakimplementation capacity; and (b) replacing the current system of thinly spread central resources

-xxvi-
across many central schemes (covering all states and monitored by different central ministries),with a much smaller set of well targeted redistributive transfers focused on the needy states andmonitored by the Planning Commission.
External Sector Management. Over the last two years, the challenge has been toprevent surpluses in the capital account from causing the nominal and real exchange rates toappreciate, and thereby, reduce export growth. The RBI has maintained the nominal exchangerate (in theory a float) constant at Rs. 31.37/US$ by purchasing all excess foreign exchange atthat rate. Foreign exchange dealers believe that in the absence of such interventions, the nominalexchange rate and thus also the real would have appreciated, probably by 20 percent. This wouldhave prevented the rapid expansion of exports witnessed in the last two years. Nevertheless, theauthorities are concerned over the impact of the exchange market interventions on the moneysupply, and thereby on inflation, the real exchange rate and export performance.
There has been no noticeable impact on exports yet mostly because of the depreciation ofthe US$ vis-a-vis other currencies, and the reduction of the anti-export bias implicit in high tariffs.The authorities also have responded to capital account surpluses with several new measures.Guidelines stipulate that Indian firms should raise money abroad only for physical investmentprojects, and bring those funds on shore only when a clear use for them exists. Deposits by non-resident Indians (NRls) have been made less attractive and their growth thus has been contained.Together with recent increases in US interest rates and adverse developments in emergingmarkets, these measures have helped to bring inflows to more manageable levels in recent months.It is evident, however, that the impact of developments in the capital account on thecompetitiveness of the real exchange rate and export growth will continue to be an area ofconcern for some time. The stance on fiscal policy, and its impact on interest rates will be a factorin determining the magnitude, direction and composition of the capital inflows.
If inflows return lo the 1993-94 level, more active management of the capital accountmay be necessary. International experience indicates that the basic long-term strategy formanaging capital inflows should be to increase the economy's capacity to absorb and allocatethem efficiently to high return investments through market-based mechanisms. However, in theshort-term, capital inflows, particularly if they may be reversed, can complicate domesticmacroeconomic management. While the authorities have not articulated formally their policystance on the capital account in the short- to medium-term, a number of policy statements andrecent decisions suggest that the authorities intend to follow a three-pronged approach tomanaging inflows which seems appropriate to India's current circumstances: (a) relaxing somerestrictions on capital outflows--the authorities have already relaxed conditions governing India'sinvestment abroad and rules regarding the timing of repatriation of export and loan proceeds, andfurther steps in this direction are possible; and (b) introducing further prudential regulations oninflows. The last prong, as suggested by the RBI's Annual Report for 1993-94, is: (c) "[a]s partof the use of fiscal adjustment to neutralize the capital inflows, taxation of the capital inflows todiscourage the inflows and to also bridge the fiscal gap." The RBI rightly argues for use of thisinstrument "... only if the capital inflows accelerate and other instruments are unable to containthe expansionary effects of the inflows."

-xxvii-
Obviously, the overall management of the balance of payments will need to be calibratedto reflect domestic and external developments, some of which may be totally exogenous.Specifically, although the external accounts have improved since 1991 and remain manageable,several challenges may lie ahead. First, in spite of the more inviting approach towards foreigninvestors adopted in recent years, domestic oil production (40 percent of national consumption atpresent) will level off towards 1998 and oil imports will consequently increase rapidly thereafter.Second, of India's $96 billion external debt (which includes $4 billion of short-term debt), about$24 billion is due to be repaid in the next four years with a peak of roughly $7 billion in 1996-97.This is in addition to the rollover of the short-term debt and the rollover of NRI accounts. Addedto the financing requirements of the current account deficit, this means that over the next fouryears India will need to mobilize about $40 billion of external finance--excluding the rollover ofshort-term debt and NRI accounts-
7Third, NRI foreign currency accounts continue to be a potential source of pressure since,in theory, they can be withdrawn on demand, subject to a small penalty, and create somevulnerability. Fourth, while India has enjoyed an unprecedented sequence of good monsoons theprobability of a bad one has not changed. Fifth, recent developments in emerging capital marketshave highlighted the macroeconomic turbulence that sudden changes in market sentiments canbring about. These vulnerabilities are tempered by India's strong liquidity position--$20.8 billionof reserves versus short-term liabilities (including NRI deposits with remaining maturities of lessthan one year) roughly half that. In addition, portfolio investment in India has taken place ininstruments that are costly to reverse. All this makes capital flight more costly and less likely, butcannot prevent it. International experience indicates that it would be ill-advised to attempt toprevent the exchange rate from depreciating were outflows to occur. At the same time, as theauthorities continue carefuil and cautiouis matnagemenit of the balance of payments, improvedaccess to concessional donor fundinig would be helpful.
Poverty. The poverty reduction strategy of the authorities has two pillars. According tothe Eighth Development Plan, the first pillar is "...increasing the productive employmentopportunities in the process of growth itself" The second pillar is "... human resourcedevelopment comprising better health and nutrition," with education as "... the catalytic factor."The strategy allows a supplementary role for "... specific poverty alleviation programs..." forsections of the population bypassed by the process of growth. In implementing this strategy, theCentral Government in its 1995-96 Budget redoubled its efforts. While re-iterating thatsignificant and sustained reduction in poverty could only be achieved through broad-basedgrowth, the 1995-96 Budget introduced new anti-poverty programs. They include new schemeswhich direct the commercial banks to provide credit to small scale units, scheduled castes andtribes, enterprises in backward regions, and state governments to complete ongoing ruralinfrastructure projects.
The return of inflation to double digits raised concern in India over the impact of theeconomic program on the poor. International experience, and research on poverty in India up tothe late 1980s, all suggest that inflation affects the poor adversely. However, no clear answersare possible at this stage about the more recent period in India. Since 1991, conditions knowngenerally to be favorable and unfavorable to the poor have evolved. At present, about 80 percent

-xxviii-
of India's poor reside in rural areas and their welfare is closely tied to the performance of theagricultural sector. Annual growth in the agricultural sector averaged 3.5 percent since 1991-92,when it contracted by 2.3 percent. Employment creation has accelerated also. The recentEconomic Survey (1994-95) indicated that employment increased twice as fast between 1992 and1994 than during 1985-92, at a rate of 6 million new jobs a year. In 1994-95, employment grewby approximately 7.8 million. Prior to the reforms initiated in 1991, industrial policies providedhigh effective protection for capital intensive manufacturing sectors. This had resulted in a four-fold decrease in the labor intensity of manufacturing during 1960 and 1986.
In addition, the Government has made deliberate efforts to ensure that the burden of fiscaladjustment does not fall on social programs that benefit the poor. Total central and state fiscalexpenditures on anti-poverty programs approached 2 percent of GDP over 1992-93 to 1994-95.State spending on social services has remained largely unchanged at around 5.3 percent of GDPsince 1991-92. The Central Government also has maintained or increased its expenditures onbasic social services, particularly for those that have a strong impact on the poor's human capitaldevelopment and living standards. Spending on disease control programs rose by 44 percentbetween 1992-93 and 1994-95, and is projected to increase by 17 percent over 1995-96.Expenditure on individual disease control programs was much higher than the aggregate.Spending on Tuberculosis, Leprosy Control, and Trachoma and Blindness programs rose by 59,169, and 100 percent respectively over 1992-95.
Greater investments in human resources--and especially primary education--are essentialfor both generating higher rates of growth and reducing poverty in India. This will require a shiftin public resources to the social sectors and within the social sectors, to provide basic socialservices. It will also require more effective implementation of India's social sector and anti-poverty programs. Given the importance of the states in the delivery of such services, thefailureto correct fiscal and itnstitutionial problems at the state level will jeopardize over time thecapacity of the governments to provide the poor with the physical health, skills and opportunitiesneeded to benefit from the growth process. In this context, it is especially worrying that recentefforts include only limited attempts to improve the administration of existing programs. Inaddition, requiring that the banking sector fund some of the new anti-poverty initiatives, albeitfrom the shortfall in its priority sector lending, is a small step in the wrong direction.
Reducing poverty is unquestionably the most critical--and complex--developmentchallenge that India faces. The structural reforms are an important step in establishing theenabling environment for more rapid poverty reduction by opening up the way for more rapid jobgrowth. And the heightened attention to basic social services also points to a more favorableclimate for poverty reduction. But more is needed on both fronts to establish the framework foraccelerated poverty reduction. As indicated earlier, here a critical step is to extend the reformeffort to the agricultural sector.
Selected Sectoral Issues
Overview. Along with the challenge of sound macroeconomic management comes theneed to address issues brought to the forefront following progress in the earlier rounds of policy

-xxix-
reforms. Unless there is improvement in infrastructure--power, roads, irrigation and water, andtelecommunications--and adequate investment in human capital development, India will not beable to achieve its medium- and longer-term objectives of higher and sustained rates of growthand poverty reduction.
Inadequate power supply is a well-known constraint to industrial growth. The EighthDevelopment Plan proposed 30,000 MW in new generating capacity over the planning period butonly 20,000 MW is likely to be added. There is also: (a) continuing under-investment intransmission and distribution which will reduce the impact of any new generation capacityinstalled; and (b) insufficient advance preparation for new projects that would fall under the NinthDevelopment planning period. In consequence, power shortages have been a serious andrecurring problem, and may continue for several years to come. At 50 percent, the share ofIndia's paved roads is lower than it was in Malaysia (85 percent) and Thailand (67 percent) in1971--a comparison that ignores the severe problems of congestion on India's roads.Meanwhile, in nearly all states irrigation networks, which had a major impact on agriculturalgrowth and helped the sector to lead the reduction in rural poverty during the 1980s, are deficientand deteriorating. At present, telephones per 100 persons in India (around 1) are much fewerthan in Korea (4) and Malaysia (2.5) in 1975, and well below what is needed.
Among social services, primary education stands out as an investment that is crucial forimproving the country's human capital stock. Consistent with international experience, theauthorities believe that human capital development is necessary to provide a vibrant modemeconomy with a labor force that has the requisite basic skills. They also recognize that it isequally important that individuals, at the very least, have requisite basic skills that would enablethem to take full advantage of opportunities present in an expanding economy to grow out ofpoverty. But although a number of attempts have been made to make more resources availablefor primary education, public expenditures remain inadequate. This reflects the tightness of theCentral Government's budget, the weakness of state finances, and ultimately, the paucity of publicsavings.
A strong case already has been made for improving the overall capacity of the publicsector to invest in these areas by improving public savings and reducing fiscal deficits at the centerand state levels. A number of other issues pertaining to these sectors also warrant attention. Twoof the most important and related issues, pertaining variously to power, roads, irrigation andtelecoms, are highlighted briefly below. They are: (a) redefining the role of government (centraland state) in some cases; and (b) providing an appropriate legal, regulatory and administrativeframework for private investment which must now assume the dynamic economic role played bypublic investment for over four decades. This summary is followed by a brief overview ofselected issues in primary education.
Redefining the Role of Government. Like most key areas of infrastructure, the publicsector dominated power generation and distribution. State governments own the StateElectricity Boards (SEBs) and other power companies which together generate 75 percent ofIndia's electricity supply and distribute more than 95 percent of it. Although SEBs haveconsiderable operational and managerial autonomy under the Electricity Act of 1948, in practice

-xxx-
they must obtain state government approvals, often at the highest level, for the most importantbusiness decisions, including tariff adjustments. Such permission is seldom granted. As a result,most SEBs have been in a precarious financial situation for some time and have become a largefinancial burden on state finances, with subsidies equivalent to at least 1.5 percent of GDP.Addressing these issues requires more than a one time increase in tariffs. As the Governmentof Orissa is demonstrating, it requires changing fundamentally the role of the public sector,including: (a) privatizing power generation, transmission and distribution; (b) depoliticizingtariff adjustments and other major business decisions in the power sector; and (c) introducingcompetition. Several other state governments also are beginning the process of power sectorreform.
To re-invigorate the power sector, the Electricity Act of 1948 was amended inSeptember 1991 to permit private domestic and foreign investment. Many investors havecome forward. However, they have sought counter-guarantees from the Central Governmentbecause the SEBs with whom they must deal are not considered to be bankable risks, andprogress in reforning most of them has been slow. The Central Government understandablyhas been reluctant to provide counter-guarantees for power investments. The reasons are thedilution of accountability by the states and SEBs, and the potentially large contingent liabilitiesthis creates for the Treasury. Indeed, after considering counter-guarantee for the first eightprivate power sector projects under the new legislation (at a potential cost of 1.3 percent ofGDP per year), the Central Government recently announced that it will discontinue the policy.This is a welcome decision. Clearly, it needs to be followed by measures by states such astimely tariff adjustments and the extension of private participation beyond generation totransmission and distribution (as is contemplated in Orissa).
State Public Work Departments (PWDs) and small labor-intensive road constructors, whohave monopolized road planning, design and construction in India for decades, do not have thecapacity to build the expressway capacity now needed for the high density corridors. Many of thesingle and one-and-a-half lane state and major district roads need also to be upgraded to goodtwo lane roads. To overcome the capacity constraints of PWDs, private professional engineeringfirms should be contracted to investigate and design large costly sections of road suitable forconstruction by machine intensive methods alone. Large contractors should be mobilized also.They should provide the full range of the requisite financial, managerial and engineering skills. Inaddition, they should have the capacity to supply equipment and material for rapid high standardroad construction. Construction supervision would be undertaken by private professionalconsulting engineers representing the client PWD. These consulting engineers, many of whomwill have to come from abroad initially to fill the skill gap locally, also would be responsible forthe equitable treatment of the contractors through contract interpretation and progress payments.
The more machine intensive and efficient approach to high density road building willrequire downsizing in-house PWD engineering staff, especially those involved in the constructionof main roads. This would be consistent with a smaller but very important role for state PWDs asthe planner, administrator and maintainer of roads. The private sector would investigate anddesign roads, supervise construction and maintenance, and supply material and equipment. Sucha division of responsibilities is common to developed countries and generally is very efficient.

-xxxi-
In the irrigation and water sector, the challenge here involves both a redefinition of rolesamong governmental entities, as well as vis-a-vis the private sector. In India, planning, allocationand management of water resources are conducted at the state level with minimum recourse toprice signals. State Irrigation Departments take the lead role in the sector, since irrigation is thelargest user of water. Planning and management of water resources should be conducted alongriver basin lines and be based on the appropriate pricing of water, and encompass all users ofwater--urban, industrial, power and agriculture. This presents an additional level of complexity inthe Indian context since river basins rarely fall neatly within existing state boundaries. In additionto negative externalities, the lack of coordination creates serious conflicts among water users.While some success in harmonizing inter-state riparian development has been achieved throughcooperation and specific tribunals (for instance, in the sharing of Narmada, Krishna andSubernarekha waters according to tribunal awards), agreement is lacking or requires clearerdefinition in a number of basins. One example is the highly contentious inter-state dispute amongTamil Nadu, Karnataka and Kerala regarding the waters of the Cauvery, which has remainedunresolved since 1974.
The Legal, Regulatory and Administrative Framework for Private Investment inInfrastructure. India's legal system--that is, its legal doctrines, instruments and institutions--isadequate to facilitate the objectives of the on-going economic reform program, including privatesector investment in infrastructure. However, there is room to enhance the capacity of the systemto support reform objectives by: (a) improving the efficiency of the administration of justice bymeasures such as providing an efficient legal information system; and, particularly forinfrastructure, by (b) adjusting a limited number of specific laws affecting labor, taxes, land, theregulation of utilities and dispute settlement.
As India seeks to attract private investment in key areas of infrastructure --particularly,power, transport and telecommunications--appropriate regulatory and administrativearrangements will be required. These requirements will vary across sectors, and within sectors.
As a concurrent responsibility of the center and states, power sector investments requirean enabling framework at both levels of government. Private investors face uncertainties in thegovernmental approval process because reasonably precise guidelines for approval areunavailable. Until recently, the process of inviting and assessing investment proposals was bymemoranda of understanding, not competitive tendering. Compounding this situation has been ageneral lack of coordination among the various central and state level agencies involved in theprocess. Lack of reform of most SEBs has been a further, and possibly the major source ofuncertainty. Haryana, Orissa and Uttar Pradesh are at various stages of developing orimplementing reforms, Orissa being the most advanced; Rajasthan and Bihar will soon launchrestructuring studies. And the World Bank, in response to a request by the Government of India,is developing a program for the use of World Bank guarantees in support of private investmentsin the power sector. Thus far, the proposed scheme, which would be contingent on thedevelopment of an overall framework that would ensure sectoral viability, is the only alternativeto counter-guarantees that takes a long-term view of the problem.
-xxxii-
In trucking, which has been deregulated substantially since the late 1980s, concerns focuson impediments to competition and efficiency arising from the way relevant laws are administered,not from the laws themselves. Police checkposts and octroi (tax) collections before entering citiescause long waiting periods. Custom and port rules are a problem also for multimodal freightservices which seek to provide door to door transportation for containerized cargo. Meanwhile,India's Multimodal Transport Document Rules are being reworked to meet internationallyacceptable standards, particularly in its assignment of liability to carriers. Separately, Rajasthan,Tamil Nadu, Punjab and Madhya Pradesh have enacted legislation to pernit tolls on bridges,highways and overpasses as part of their efforts to attract private sector participation in thedevelopment of this infrastructure. At the national level, the National Highway Authority (NHA)was re-constituted from February 1995, although its staffing needs are yet to be met adequately.As the nodal point for build-operate-transfer (BOT) operations in India, NHA plans to assistprivate investors in obtaining clearances from sub-national governments. In addition, theGovernment of India recognizes that land acquisition usually takes a long time. Accordingly, asalready demonstrated for some projects, the Government is prepared to use the emergencyprovisions under the Land Acquisition Act (1894) to acquire land for projects pending finalsettlement of compensation. In the case of ports, where legal impediments are perceived to exist,the private sector has obtained more liberal policies under existing legislation.
In liberalizing the telecommunications sector, the Government of India has announcedsteps to assure transparency in the evaluation of potential new entrants and has indicated that it isestablishing an independent Telecom Regulatory Authority. This Authority will be responsibleinter alia for fixing tariffs, interconnect charges, resolution of disputes between licensees, andredressal of customer grievances. At present, the single most important issue for the sector iscompleting the establishment of the Regulatory Authority. This will: (a) reduce the bidding riskswhich result from the uncertainty related to tariffs, interconnection agreements and conditions ofthe license; and (b) enable the regulator to begin the necessary and unavoidable process ofintroducing, testing and refining the appropriate mechanisms for overseeing what could becomeone of the most complex telecommunications sectors in the world. In addition, time will beneeded to develop and pass the necessary legislation. There is also a need to create an armslength relationship between the Department of Telecommunications' (DOT's) operational role,and the government's responsibility for making policy decisions and awarding licenses. Thiswould free DOT to concentrate on preparing for competition and would also help to level 'theplaying field' for DOT's competitors.
Primary Education. Adequate human capital development, especially a solid foundationin primary education, is essential for individuals to be able to participate fully in the growthprocess. In turn, such participation not only helps to achieve higher growth, but also to sustain itand reduce poverty by ensuring that the benefits of economic prosperity are distributed reasonablyequitably. This said, primary education is especially vulnerable to the current fiscal problems,especially at the state level. Of all the services provided by state governments, educationinvariably consumes the largest proportion of the revenue budget. And primary education in turnconsumes the largest proportion of the education budget. This is welcome because primaryeducation also increases the effectiveness of investments in other services such as health andnutrition.

-xxxii"i-
The Indian authorities expanded primary education and attained high gross enrollmentrates in the 1980s. In addition, a substantial national reform effort was launched in 1992 by theCentral Government--under the National Policy on Education of 1986 (as amended in 1992)--toaddress some of the financial and institutional weaknesses facing the sector. However, enormouschallenges lie ahead. Universal primary enrollment will be achieved late in comparison withcountries that have grown out of poverty quickly. And while most children enroll at the beginningof primary school, more than half of the rural students drop out before completing the cyclebecause of the poor quality of schooling and the pressures of poverty. Among those who dropout as well as those that stay, learning achievement is low. Furthermore, gender and castedisparities remain on most educational indicators despite some progress in reducing them. Widedisparities also exist between and within states.
The essential challenge for education authorities at the central, state and district levels is toimprove the quality of education in rural primary schools. A three-pronged strategy isrecommended for achieving this objective: (a) selecting the most cost-effective strategies; (b)increasing state financing; and (c) maintaining an effective and efficient Central Government roleover the medium-term. This will require building on what is known about what affects learning.In India: (a) school factors that are associated with higher learning achievement vary by location;(b) the teachers' subject knowledge is more critical than years of pre-service training, and despitethe relatively high level of formal education of teachers, many lack a strong foundation in thesubject they are teaching, (c) even modest teaching tools--such as textbooks, libraries, andclassroom instructional materials are significant determinants of achievement, and (d) somepopular investments do not enhance primary education.
Given the role of location-specific factors in educational achievement, the governmentlaunched the District Primary Education Program (DPEP) in 1993. This is the most intensiveeffort to date by the Central Government to increase enrollment, retention and the quality ofprimary education. Through the program, the Government provides grants to states equivalent to85 percent of the cost of approved investments, with the states providing the balance. Investmentis targeted to districts with below average female literacy rates. Emphasis is placed oninvestments in the quality of primary instruction, including teacher in-service training, improvedteaching learning materials, improved school facilities and strong community participation. Only alimited amount of new school construction is financed. In addition, DPEP differs from othercentrally-sponsored schemes in ways which encourage careful project selection, performance-based resource allocation, and tangible results on the ground. This is a sound approach and awelcome beginning.
The next step toward greater cost-effectiveness in primary education could be taken byfurther expanding the on-going research effort to identify the actual implementation costs ofinterventions and systematically evaluating their on-the-ground impact over time. The DPEPmonitoring and evaluation framework has considerable promise in this regard, but to realize thepotential benefits, present objectives for capacity building at the national and state levels willremain a high priority.

-xxxiv-
Over the past two years, the Indian authorities--both at the center and state levels--frequently have reiterated their intention to ensure that the public resources for education increaseto 6 percent of GNP over the period of the Ninth Plan (1997-2002). In 1992-93, total publicexpenditures on education, widely defined, was equal to 3.9 percent of GNP. This compares with4.2 percent in 1989-90. Thus, both the center and the states need to increase significantly theirallocations to the sector if universal primary education is to be achieved by the end of the NinthPlan (1997-2002). As noted in this report, current fiscal trends indicate that this will be a majorchallenge unless the fiscal performance of the public sector improves substantially.
Recent attempts by the Central Government to raise expenditures in elementary education,by shifting its own priorities away from higher education and utilizing external sources of funding,have not been equally matched by the states. Expenditure on overall education by states as agroup declined from 3.31 percent of GDP in 1989-90 to 3.05 percent in 1992-93 but rose in1993-94 to 3.12 percent of GDP. This spending varied considerably among states. Moreover, asof 1992-93, about 97 and 96 percent of the government's expenditures in lower and upperprimary education respectively were being spent on salaries. Notwithstanding their contributionto learning achievement, libraries, equipment and furniture received only 0.2 percent of the total.Clearly, additional resources will be required across all states, both to maintain or increase levelsof access and to improve learning quality, retention and achievement. In turn, this will requiremajor improvements in fiscal performance at the state level.
External Financing
Reflecting the remarkable improvement in India's external accounts in 1993-94, the lasteconomic report presented to the India Development Forum (IDF) indicated that no additionalfast-disbursing assistance needs were foreseeable at the time. The assessment of this report is thesame. However, although the economy's capacity to attract private foreign investments hasimproved markedly, continued access to "high quality" long-term assistance, including asubstantial concessional component--focused on spending for human resource development,small-scale agriculture, management of the environment and anti-poverty programs--remainscritical. Last year, the bilateral and multilateral participants in the IDF responded to this needwith pledges totaling $6 billion. Although this was lower than the $7.4 billion pledged the yearbefore, the share of concessional commitments was 40 percent compared to 30 percent one yearearlier.
At the same time, the government has taken steps to speed up its utilization of bilateraland multilateral assistance. They include: (a) advance release of funds to state governments; (b)disintermediation by the Center of loans to public enterprises; (c) adopting streamlined proceduresfor awarding contracts and procurement; and (d) creating a central Project Management Unit inthe Department of Economic Affairs, Ministry of Finance, for better portfolio management andproject implementation. As a result, India's disbursement ratio moved up from 10 percent in1992-93 to 12 percent in 1993-94, with a further improvement to 19 percent during of 1994-95.
A key concern of this report is that investment in the economy is still well below the levelsneeded for India to grow at rates comparable to the high performing Asian economies. The

-xxxv-
private sector continues to show a strong interest in investing in a number of areas ofinfrastructure, particularly in power and telecommunications. However, the scope for privateinvestment in some key areas is very limited. Furthermore, necessary public investment in this andother strategic areas--including rural infrastructure, medium and major surface irrigation systems,and social services--has been minimal in recent years. Evidently, such investments are crucial forsustaining the economic recovery and equipping the poor to participate in the growth process.
The Bank, therefore, is of the view that support for these public investments, especially inthe social sectors, should guide the deployment of available assistance. In this context, themembers of the IDF should aim once again for "high-quality" official development assistance; thatis, funding for sustainable development which directly supports priority public investments orcatalyzes complementary private investments. Such assistance should be timely. It should alsobear terms which are competitive and suited to the financial returns expected from the investment.


-1-
RECENT ECONOMIC DEVELOPMENTS:ACHIEVEMENTS AND CHALLENGES
INTRODUCTION
India has seen changes in domestic policies that have fundamentally altered its developmentstrategy. Four years ago, internal and external imbalances had reached crisis proportions. Investmentin the most important areas of the economy was a public sector monopoly and foreign investment wasnegligible. The trade regime imposed pervasive licensing restrictions on imports of virtually allcommodities and extremely high tariffs. The financial sector was dominated by public banks which hadlittle commercial discretion in allocating their lending. The prudential regulations were inadequate andmade it difficult to assess the true quality of banks' portfolios or the true level of banks' profits, andfinancial markets were highly controlled. The tax system was based on highly distortionary taxesfalling on a narrow base and tax administration was very cumbersome.
This situation has changed dramatically since then. While still a major obstacle to higheconomic growth, fiscal imbalances of the Central Government have been stabilized. The externalaccounts have strengthened considerably. Now, there is hardly a sector from which domestic orforeign private investors are excluded. Import licensing restrictions on intermediates and capital goodshave been virtually eliminated, tariffs have been reduced significantly, and full convertibility has beenestablished for current account transactions. In the financial sector, barriers against the entry of privatesector banks (domestic and foreign) have been eliminated, prudential regulations that are on par withintemational standards have been introduced, banks now have more discretion in their lendingdecisions, and financial markets have been liberalized. Similarly, the tax regime has been simplified andimproved markedly. And at 5.3 percent in 1994-95, GDP growth was much better than in stabilizationand reforn experiences elsewhere in the world and the highest since the reform program started in July1991.
This said, and as amply discussed in the Ministry of Finance's annual report on the economy(The Economic Survey), developments in 1994-95 indicate also that serious problems remain and thatthe 'unfinished agenda' is very challenging.
On the macroeconomic front, notwithstanding some progress in stabilizing fiscal imbalances,the Economic Survey highlights that the public sector savings performance has continued todeteriorate. As discussed in this Chapter, without substantial improvements in public savings, theeconomy will not be able to accommodate higher levels of investment-public and private, physicaland social--needed to accelerate and maintain growth, and reduce poverty. In addition, unless thepublic sector savings performance is improved significantly, monetary policy will bear the brunt ofinflation reduction. This may affect real interest rates and investment and place India on a lowergrowth trajectory. Reversing this trend requires major improvements in the financial performance of

-2-
the central and state governments, as well as public enterprises. Finally, on the external front, theauthorities will need to continue to manage potentially volatile capitalflows to ensure that they do notintroduce instability within the r eal economy.
On the structural side, the program launched in 1991 needs to be followed through tocompletion, with a more focused effort on agriculture which historically has contributed substantially topoverty reduction and for which the pace of reforms has been uneven and partial. Also, in an economywhich was driven for four decades by increases in public investment, maintaining dynamic growthrequires a dramatic increase in private investment in infrastructure. This will only be possible if theauthorities address a sumber of specific legal, regulao)ry, and administrative issues 'hich (ire 110W
inhibiting private inivestment ini it?frastructure. Resolving these issues in macyv cases Vvill depend onactions by state government.s.
Chapter I of this report discusses the macroeconomic issues highlighted above as well as themain recent economic developments. Chapter 2 examines state-level financial and sectoral reformissues. Both are extremely important to improve public sector savings performance and enable thestates to play the developmental role in the provision of key infrastructure and social services. Onesuch service--primary education--to which the government has given special attention in the recentpast, is the subject of Chapter 4 of this report. Meanwhile, Chapter 3 examines the legal, regulatoryand administrative issues that need to be addressed if private investment is to flow into key areas fromwhich it was excluded until recently.
RECENT MACROECONOMIC DEVELOPMENTS
The Fiscal Outturn
Reduction of fiscal imbalances has been a major objective of government policies since the startof the stabilization and reforrm program in July 1991. Substantial progress was made in the first twoyears mostly as a result of a contraction in non-interest spending. The Central Government's fiscaldeficit, which if not corrected would have exceeded 10 percent of GDP, was reduced to 5.9 percent ofGDP in 1991-92, and 5.7 percent of GDP in 1992-93. However, it increased to 7.7 percent of GDP in1993-94 against a target of 4.7 percent (Tables 1. 1 and 1.2). This was the result of expenditureoverruns and a tax revenue shortfall due to stagnant industrial output. Imports were lower thanexpected and consequently, revenues from excises and import tariffs were one percent of GDP belowthe budget forecast. Considerably stronger extemal accounts suggested, however, that fiscalimbalances were not a short-term threat to macroeconomic stability. Thus, the government decided tomoderate the pace of fiscal adjustment to stimulate the economy and set a relatively modest fiscaldeficit target of 6 percent of GDP for 1994-95. In addition, the authorities introduced a wide range oftax measures aimed at reducing the user cost of capital.

-3-
Table 1.1: Selected Central Government Finances, 1990-96(percentage of GDP)
90-91 91-92 92-93 93-94 94-95 94-95 95-96BE RE BE
A. Revenue 10.3 10.7 10.5 9.6 9.4 9.7 9.7
Taxrevenue 8.1 8.1 7.7 6.8 6.9 7.1 7.1Corporation tax 1.0 1.3 1.3 1.3 1.4 1.5 1.5Income tax 1.0 1.1 1.1 1.2 1.2 1.2 1.3Excise duties 4.6 4.6 4.4 4.0 4.0 4.1 4.1Customs 3.9 3.6 3.4 2.8 2.8 2.9 2.8Other 0.3 0.4 0.5 0.3 0.2 0.2 0.2Less: States' share 2.7 2.8 2.9 2.8 2.7 2.7 2.8
Non-tax Revenue 2.2 2.6 2.9 2.8 2.6 2.6 2.5(Interest receipts) 1.6 1.8 1.8 1.9 1.8 1.8 1.8
B. Revenueexpenditure' 13.8 13.4 13.2 13.8 13.0 13.5 13.1Interest payments 4.0 4.3 4.4 4.7 5.0 4.8 5.0Subsidies 2.3 2.0 1.7 1.6 1.0 1.4 12Food 0.5 0.5 0.4 0.7 0.4 0.6 0.5Fertilizer 0.8 0.8 0.9 0.6 0.4 0.6 0.5Others 1.0 0.7 0.4 0.4 0.2 0.3 0.2Defense 2.0 1.9 1.7 1.9 1.8 1.8 1.7Grantstostates 2.6 2.7 2.5 2.7 2.1 2.3 2.1Wages and salaries 2.0 1.9 1.8 1.9 1.7 1.7 1.6Other 0.8 0.6 0.9 1.0 1.3 1.5 1.5
C. Capital expenditure 2.3 1.9 1.8 1.7 1.5 1.7 1.4Defense 0.9 0.8 0.8 0.9 0.7 0.8 0.7Econonic Services 1.3 0.9 0.9 0.7 0.6 0.7 0.5Others 0.2 0.2 0.2 0.1 0.2 0.2 0.
D. Gross Loans 3.7 2.9 2.4 2.6 2.1 2.6 2.0to states 2.6 2.0 1.7 1.8 1.5 2.0 1.6to PEs 0.7 0.6 0.4 0.6 0.4 0.5 0.4Others 0.5 0.3 0.2 0.2 0.1 0.1 0.1
E. Repayment ofloans 1.1 1.0 0.9 0.8 0.7 0.7 0.6F. Net lending (D-E) 2.6 1.9 1.4 1.8 1.3 1.9 1.4G. Disinvestment in PEs 0.0 0.5 0.3 0.0 0.4 0.6 0.7
Fiscal Defcit (A-B-C+F+G) 8.4 5.9 5.7 7.7 6.0 6.7 5.5
Memo Items (CentralGovenment)Total Expenditure(B+C+D) 19.7 18.1 17.4 18.0 16.6 17.8 16.5TotalExpenditure(B+C+F) 18.7 17.1 16.4 17.3 15.9 17.1 15.8
Education, etc. 0.2 0.2 0.2 0.2 0.2 0.2 0.2Health and Welfare 0.1 0.1 0.1 0.1 0.1 0.1 0.1
Total Revenue (A+G) 10.3 11.2 10.8 9.6 9.9 10.4 10.3Prinary DefiCit b 4.4 1.6 1.3 3.0 1.0 1.9 0.5Non-Interestspending' 15.7 13.8 13.0 13.4 11.6 13.0 11.5Note: BE= budget estimates; RE=revised estimates.a. Revenue expenditure is the budget terminology for cunernt expenditrre.b. Fiscal deficit minus interest payments.c. B+C+D-interest
Source: Goverment of India, Budget documents.

4-
Table 1.2: Recent Evolution of the Public Defidt, 1990-95
(Percent of GDP)I1990-91 1991-92 1992-93 1993-94 1994-95
RE1. Central 6overmnient
Overall Deficit 8.4 5.9 5.7 7.7 6.7 :ltrssPRiazyDeficit 4.3 1.6 1.3 3.0 1.9
2. General GovemnentOverallDeficit 9.9 7.3 7.5 9.6 8.6: GssPrinmaiyDeficit 5.7 3.9 3.2 5.4 4.6
3. Non-Financial Public SecturOverallDeficit 10.5 9.0 8.4 11.0 10.4
4. Meno Item:
RBI Financing toGenera lGovenent(Net) 2.8 0.9 0.6 1.4 0.0
Souirce: Budget docuiments;l RBI, IM, and staff estimates.
The stimulus package worked well. Industrial growth recovered, and with it, tax revenue roseabove target by 0.3 percentage points of GDP. In addition, disinvestment receipts were 0.2 percent ofGDP higher than budgeted. Expenditure, however, was 1.2 percentage points of GDP above plannedlevels for three reasons. First, subsidies (food and fertilizer) were reduced by 0.2 percentage of GDPin relation to the previous year. But a further reduction, equivalent to 0.4 percentage points of GDP,was required to reach the budgeted level. Second, loans to states were 0.5 percentage points of GDPhigher than budgeted. This was due to larger than anticipated deposits in Small Savings accounts(administered by the Post Office), 75 percent of which is automatically on-lent to the states. 7hira theremaining expenditure overrun, equivalent to 0.3 percent of GDP, resulted from unplanned increases inCentral Government grants to states, and other smaller items. In net, the 1994-95 fiscal deficit was 6.7percent of GDP, one percentage point less than last year's fiscal deficit. Although this reduction wassignificant, the fiscal deficit remains too high. As discussed later in this Chapter, further fiscal deficitreduction is critical to ensure macroeconomic stability and strengthen the economy's growth prospects.
Monetary Policy and Inflation
Monetary Expansion Contributed Significantly to Inflation. Since the stabilization programstarted in July 1991, the authorities have sought to keep monetary growth at moderate levels.Accordingly, reserve money grew between 11-13 percent in the first two years of the program andinterest rates were maintained at relatively high levels. Thus, inflation declined from a peak of 17percent in June 1991 to around 7 percent in the second half of 1993, and throughout the first quarter of1994. This monetary stance was radically changed in 1993-94, however, when the monetization oflarge surpluses in the capital account led reserve money to grow at annual rates (point-to-point) ofaround 25 percent (Table 1.3). This rate of growth persisted until late 1994 even though net RBIcredit to the government remained virtually constant in nominal terms.

-5-
Table 1.3: Selected Monetary Indicators, 1990-95(Rs. billion)
Stocks(End-March of each year)
Money Aggregate 1990-91 1991-92 1992-93 1993-94 1994-95p
SourcesofReserveMoney 878 (100) 995 (100) 1108 (100) 1387 (100) 1690 (100)Net RBI credit to Govenument 888 (149) 940 (44) 984 (39) 993 (3) 987 (-2)Net foreign exchange assets (RBI) 80 (19) 188 (93) 226 (34) 514 (103) 747 (77)Otherassets(net) -91 (-68) -133 (-37) -103 (27) -121 (-6) 44 (25)
Sources of Broad Money 2658 (loo) 3170 (0oo) 3668 (100) 4344 (100) 5265 (o00)NetbankcredittoGovernnent 1402 (66) 1583 (35) 1762 (36) 2039 (41) 2196 (17)Creditto comnercial sector 1718 (58) 1880 (32) 2201 (65) 2378 (26) 2879 (58)Netforeignexchangeassets 106 (11) 212 (21) 250 (7) 537 (43) 747 (23)Otherassets (net) -567 (-35) -504 (12) -545 (-8) -610 (-0) -557 (6)
Memo ItemsM3/13aseMoney 3.0 3.2 3.3 3.1 3.1M3/GDP 0.6 0.6 0.6 0.6 -Growth ratesReserveMoney 13.1 13.4 11.3 25.2 21.9M3 15.1 19.3 15,7 18.4 21.2NomialGDP (factorcost) 17.8 16.0 13.8 12.7 -
Note: The flow as a percentage of the change in base money or the change in broad money stock is in parentheses.Increases in foreign assets following a devaluation are offset by declines m other assets.
Source: RBI.
The authorities subsequently took several measures to contain the impact of reserve moneygrowth on broad monetary aggregates. They increased reserve requirements (the Cash Reserve Ratio,(CRR)) from 14 to 15 percent during June-August 1994, and introduced a CRR on Non-ResidentIndians (NRIs) foreign currency accounts on which there were no reserve requirements previously.They also reduced maximum interest rates payable on such accounts both to contain growth incommercial banks' liquidity base and reduce the volatile component of India's external debt. Thisnotwithstanding, broad money continued to rise at relatively high rates and inflation rose above 10percent.
At first, the authorities did not take stronger steps to contain monetary expansion. Interestrates declined in nominal and real terms; call money rates reached historically low levels; and, fromMarch 1994 onwards, interest rates on 364-Treasury Bills became negative or marginally positive(Table 1.4). Low interest rates did indeed contribute to the strong expansion in investment witnessedduring the year, and to the recovery of the economy. From March 1994 onwards, however, inflationalso accelerated--to around 12 percent, well above the psychologically comfortable level of 10 percent.

-6-
Table 1.4: Key Interest Rates, 1990-95'
Call Money Treasury Bills Minimun Maximum"r' Certiticates MflationiRate 364-day 182-day 91 -day Lending Deposit of(Bombay) Rate Rate Deposit
1990-91June 13.5 - 10.0 4.6 16.0 10.0 10.0- 16.3 9.7September 15.2 - 10.0 4.6 16.0 10.0 10.0- 14.0 7.9December 13.6 - 10.0 4.6 16.0 11.0 10.0- 13.1 12.6March 18.5 - 10.1 4.6 16.0 11.0 10.0- 14.9 12.11991-92June 24.8 - 10.0 4.6 17.0 12.0 12.0- 16.8 12.2Septemnber 12.8 - 10.0 4.6 18.5 13.0 11.5 - 16.0 15.9December 12.7 - 10.0 4.6 20.0 13.0 12.5 - 17.6 14.3March 14.3 - 9.3 4.6 19.0 13.0 12.0- 17.0 13.61992-93June 15.8 11.4 - 4.6 19.0 13.0 12.3-25.0 12.3September 11.4 11.3 - 4.6 19.0 13.0 13.0-20.0 10.2December 11.2 11.2 - 4.6 18.0 12.0 12.3 - 17.5 8.4March 13.9 11.1 - 11.0 17.0 11.0 12.5- 16.5 7.01993-94June 8.0 11.4 - 10.1 16.0 11.0 11.0-16.5 7.1September 5.0 11.2 - 8.4 15.0 10.0 8.0-15.0 8.8Decemnber 5.3 11.0 - 7.8 15.0 10.0 7.0 -15.0 8.8March 4.3 10.0 - 7.5 14.0 - 15.0 10.0 7.0- 12.2 10.51994-95June 6.7 10.0 - 8.8 14.0 - 15.0 10.0 7.0 - 12.0 11.8September 15.3 9.4 - 9.1 14.0 - 15.0 10.0 - 8.9December - 9.8 - 10.3 14.0 - 15.0 10.0 - 11.2March - 11.9 - 12.00 14.0 - 15.0 11.0 - 11.2
- Not available.Note: March 1995 is preliniinary.a. Rdes to rate on tam deposit Up to April 1992 rates were fixod for diffant rnaturitics. Since April 1992 only a
maximin deposit rate is specified.b. Whola ale ptice index, annual increase, point-to-point.
Source: RBI Montldy Bulletin, variow issues; RBI, Renont on Currency and Firance; Catder for Monitoring IndianEcnmy (CMIE), various issues.
Since late 1994, the sources of monetary expansion and the monetary policy stance havechanged. The authorities decided to take stronger steps to reduce inflation. In September 1994, theRBI and the Treasury signed a landmark agreement to limit and then to phase out by 1997 theautomatic monetization of the Treasury's cash deficits. Henceforth, the Treasury will be obliged tomeet the bulk of its borrowing requirements by issuing securities directly in the market. In fact, this hasalready happened in 1994-95 when the change in net RBI credit to the Central Government wasslightly negative. Meanwhile, the balance of payments became less important as a source of monetaryexpansion while credit by commercial banks become more important. Helped by declines in the capitalaccount surplus, the RBI was able to reduce the rate of money expansion and real interest rates beganto rise. Inflation thus has been abating, and by end April 1995, stood at around 9 percent. In its mostrecent credit policy announcement (April 17, 1995), the RBI re-affirmed its commitment to a tighter

-7-
monetary stance to combat inflation. For 1995-96, it is targeting M3 growth of 15.5 percent against17.6 percent for 1994-95, assuming an inflation of 8 percent and GDP growth of 5.5 percent. Whilethe announcement assumes moderate capital inflows (and thus, less pressure on monetary aggregatesfrom the accumulation of net foreign assets), it also took steps such as raising the maximum rate onterrn deposits from II to 12 percent.
Thle Economic Survey notes that other factors contributed to inflation in 1994-95. Amongthem were: (a) production shortfalls dating back to the previous year in items such as sugar and cottonwhich could not be imported; and (b) the pass-through of successively large increases in minimumsupport prices (which occurred until 1993-94) to primary products, wage goods and wages. Tocombat inflation during 1994-95, the authorities relaxed import restrictions on several goods that werein short supply. They included sugar, cotton and all major edible oils, except coconut. Evidently,continued trade reform aimed at further reducing quantitative restrictions and tariffs, as well as theliberalization of domestic agricultural markets (at present, for example, futures trading is banned formost key agricultural commodities) should help India to avoid the sharp gyrations in domestic prices ofkey products which were so frequent in 1994-95.
Recent GDP and Investment Growth
Real G(I) Recovery Was Broad-Baved The package introduced in the 1994-95 Budgetconsisted essentially of actions (a) to stimulate investment, including greater tariff reduction onimports of capital on other goods, reducing corporate income taxation; extending India's partial value-added tax to include capital goods, thus enabling firms to credit (against tax liabilities) taxes paid on thepurchase of equipment, (b) measures to increase consumption such as reducing to more moderatelevels (as part of tax reform) extremely high indirect taxes (excises) on a wide array of commodities;and (c) slowing the pace of fiscal adjustment. Coming on top of the cumulative effects of reforms,another good monsoon and an increase in foreign direct investment (Table 1.5), and supported by thedecline in real interest rates, this package produced the intended results. Real GDP growth in 1994-95was the higliest since 1991. Growth was fastest in the industrial sector. Within the industrial sector,manufacturing expanded by 9 percent (Table 1.6). The capital goods sector, which had experiencednegative rates of growth every year since 1991-92, expanded by 22 percent. Together with indicationsthat imports of capital goods increased sharply, this suggests that investment began to recover and thatindustrial growth in 1994-95 was broad based.
(Cotporate Profits Rose, Srengthening the Prospects For Sustained Investment Recovery. Thecorporate sector appears to be well positioned to sustain the growth recovery by investing in newcapacity and competing successfully in a more liberalized environment. According to a survey of 800companies carried out by the Industrial Credit and Investment Corporation of India (ICICI), corporatenet profits doubled in the first six months of 1994-95. This is explained by: (a) increased sales due tothe industrial recovery--about 13 percent in real terms over the same period in 1993-94; (b) reducedinterest costs as real interest rates declined, and as the elimination of restrictions on access to capitalmarkets raised financing from this source to over 45 percent of total financing (from 18 percent in1991 -92), (c) lower corporate taxes; and (d) corporate restructuring.

-8-
; :: Table 1E.5: Direct Foreign : A recent poll found that aboutInvtt two-thirds of the manufacturing firs,
Actual Infls i~ :Ai . : : ::under the pressure of increased; 2 T!Eiit7E::: i X Achualn vsApprovil:
1 991i 1992 1993 1994 : Thal competition, have gone through, or are(199 ~ 194) going through, a process of restructuring.
Another quarter expect to do so over the
USsballion 0.2 1.3 2.8 2.9 72 next two years. Actions include: (a)consolidating core competencies; (b)
t0US5; bilion ; 0 t 0.2 0 0.2: 0 0.6 ::0.9 1.9. venturing into growth areas outside theircore competencies, particularly in areas
yIK o FA:vl ;66 :17 20 33 26 recently opened to the private sector suchSou:AimistryofFnance. Economic Suwv 1994-95. as telecommunications and power; (c)
mergers and acquisitions (which increasedfrom 30 in 1991 to about 150 in 1993) to expand capacity quickly, consolidate market share and insome cases, meet rising export demand; (d) strategic alliances with foreign companies to acquire newtechnologies cheaply ormarketing outlets, (e) Table 1.6: Gr4vth Perfonnance, 1981-95
financial restructuring, (p )including retiring high MI:1-9 1990-91 1991-92 123 199-94: 1994-95
cost debts early; (f)changing organizational
srce aat Factor Cost 5.5 5.4 0.9 4.3 4.3 5.3.structures and profes- : : : ;
sionalizing their manage- AgJcuwrJ: I 34 3.8 -23 5.1 2.9 2.4
ment; and (g) reducing undzzstry 6.9 7.2 -0.8 2.9 3.5
excess workforce MinS4g& nyit t 7.4 10.7 4.s 1,5 4.8A-
through arrangements eucturigM 7.2 6.1 -3.1 .3.1 3.6 iX7such as voluntary retire- lted 8.0 5.0 -1.8 2.3 32
ment schemes. Ued 6.1 7.9 -5.3 4.4 42Elwbirity, Gm & 8.9 6.5 9.$5 7 i:.9 5
In this context, Constru C: 4.4A 11.6 2.7 0.5. 1 2
there are good prospects Scs, 6.6 5.2 4.7 4.8 59 56
for private investment to Notea: QuicEsm tc.:
continue to recover and
reverse the declining trend witnessed in recent years (Table 1.7). Business surveys (Figures 1.1 and
1.2) show high levels of confidence not evident in any of these biannual assessments (by the
Confederation of Indian Industries) obtained for the period 1985-86 to 1994-95. However, whether
these prospects will be translated into higher and sustained investment growth, without threatening
macroeconomic stability, will depend on improving the public sector's fiscal deficits, and its savings
performance which has been deteriorating in recent years. This will determine also the public sector's
capacity to raise significantly its outlays on efficient fixed investments and reverse the substantial
declines observed in recent years (Figure 1.3).

C. N~~~~~~~~~~~~~~.......
U0 0
0'~~~~~
0 C~~~~~~~~~~~~~~~~~~0
,~~~~~ E O O O 0 '0O0 CL2
o u ~ ~ ~ ~ ~ ~ ~ ~ ~ t
0A

-10-
:: ~~~~~~Tablel1.7: :Trends in Utal.Investment , 0 I~~~~~~~~~~~percent of DP) _X
: : :~~~~~~~~~~1989-90: i990-91 1991-92 1992-93 i 13943-4
Grbss Doinf Investment 24.3 25.6 22.9 23.3 21.3Public: 10.0 9.7 :9.2 8.9 8.9Pnvate 14.3 15.9 13.7 14.4 12.4
a. PrvMisaLb. Qick estmat.:c. Adj%eif arerrors nomissions.SPw*ce CSO, National AcountsStatistics 1995.
Figure 1.3: Real Private and Public Gross Fixed Capital Formation(pcrcmt of real GDP)
13.0
12.0
11.0
E~Public Seckr10.0 -kN../|N PivaCS
(%) -.- ~~~~~~~~~~~~~~~~~~~~~~~~~Pwivate SeCk
9.0
8.0
7S 0
1981 82 1983-84 1985-86 1987-88 1989-90 1991 92 1993-94
Souirce: CSO, National Accounts Statitcs, van'ous issues.
The Balance of Payments Outturn
The External Accounts Remained Strong. After a 20 percent growth in 1993-94, exports grewby 17 percent in dollar terms during April 1994-January 1995 (Table 1.8). Commodities thatperformed well were basically the same as in the past few years: coffee, electronic goods, handicraftsexcluding carpets, textile, ready-made garments and marine products. Manufactured exports increasedby 21 percent relative to the same period last year. Export markets have continued to diversify. Forexample, the share of exports to East Asian economies (Singapore, Thailand, Malaysia, Japan)increased from less than 10 percent in 1991-92 to 14 percent at present. These developmentsoccurred even though the plague in September-October adversely affected seasonal exports such asgems and jewelry which lost their Christmas market, and even though the rupee appreciated vis-a-visthe US$ (Table 1.9) in 1993-94. In 1994-95, because of the decline of the US$ in relation to othercurrencies, the real effective exchange rate (that is, the weighted average of bilateral exchange rates inrelation to India's trading partners weighted by their share in India's total trade) actually experiencedsome depreciation. In fact, this probably explains the robust export performance in 1994-95 despiterelatively high domestic inflation and a fixed nominal exchange rate vis-a-vis the US$. In addition,export performance probably benefited also from: (a) productivity gains brought about by thereform program; and (b) the reduction in the anti-export bias brought about by the liberalizationof the trade regime. However, the authorities are legitimately concerned with the effect ofinflation on the future of the real exchange rate and export performance.
Imports registered a sharp rise of 28 percent in dollar terms after stagnating the previous year.Non-oil imports rose by 33 percent in dollar terms as the domestic industrial recovery strengthened.Underlying the overall growth in non-oil imports was the rise in imports of sugar, edible oil, pulses,non-ferrous metal, metalliferous ores and scrap, iron and steel and chemicals. During April 1994-January 1995, imports of machinery and imports of iron and steel rose by 33 percent and 56 percentrespectively over the same period one year ago. Meanwhile, the oil bill for the period remainedrelatively constant (one percent increase) reflecting higher volumes and lower prices. Additionalproduction of crude oil by the Oil and Natural Gas Corporation Ltd. reduced the requirement ofimported crude oil. Overall though, the trade deficit during the first ten months, at $2 billion, was morethan twice the level during last year. At the same time, workers remittance rose significantly and theresulting improvement in the surplus in the invisible account partly offset the widening of the tradedeficit. Thus, the current account deficit is estimated to have risen only marginally from 0.3 percent ofGDP to 0.7 percent in 1994-95 (Table 1.8).
As was the case last year, foreign direct and portfolio investment flows (Table 1. 10)contributed to a large surplus in the capital account. They amounted to $4.9 billion during April 1994-March 1995. As investment intentions were translated into actual flows, foreign direct investment(FDI) rose to an estimated $1.3 billion during 1994-95. A major portion of FDI approvals was in thecore sectors of power, oil refining, food processing, chemicals, and electrical equipment.

-12-
Table l.8: Balance of Paymen , 1991-98
(USM billion)
Actaub Estim Projected
91-92 92-93 93-94 94-95' 95-96 96-97 97-98
TotaleczrtsofGNFS 23.3 23.6 28.9 33.8 39.3 43.7 48.6Mcrchandise(FOB) 18.3 18.9 22.7 26.8 31.3 35:1 39.3Nonrfacf srsvices 5.0 4.7 6.2 7.1 8.0 8.6 9.3
Total hiports of GNFS 24.9 26.8 29.4 37.9 43.7 49.2 54.9Mchandise (CIF) 21.1 23.2 24.0 30.3 35.5 40.7 45.8Norfator servic 3.8 3.6 5:4 7.6 8.2 8.5 9.1
Reaouce balance -1;6 -3.2 -0.5 -4.1 4.4 -5.5 -6.4
Net actor inccwne -3.8 -3.4 4.0 4.2 4.7 4.9 4.9Factorreceipts 1.2 1.1 0:9 0.7 0.7 .0.6 0.7Factorpayner2s 5.1 4.6 4.9 5.0 5.4 5.4 5.6hstcr (aheued)u ' 5.0 4.5 4.7 4.4 4.6 4.5 4.5ofiv6ichinteiDrtpaymer1sonNRI 1.0 0.9 0.9 1.0 1.4 1.4 1.4
Othora ctorpaymerte' 0.1 0.1 0.1 0.6 0.8 0.9 1.1
Net privat:cuent ansen 3.8 2.8 3.8 6.2 5.0 5.1 5.2Ciaentmacipts 3.8 2.8 3.9 6.2 5.0 5.1 5.2of isichwcickrsreittance 2.5 2.1 3.1 5.0 3.6 3.6 3.7
Curmtpayrinat 0.0 0.0 0.0 0.0 0.0 0.0 0.0
CQarataccoit balance -1.6 -3.9 -0.7 -2.1 4.1 -5.3 -6.1
Official capital grans 0.5 0.4 0.4 0.4 0.4 0.3 0.3
Foteign rinvssmets 0.2 0.6 4.1 4.9 3.3 4.7 . 5.5Di=ctfabxignim.nents 0.2 0.3 0.6 1.3 1.8 1.9 2.3Podfolio iwhnlats 0.0 0:2 3.5 3.6 1.5 Z8 3.2
Net 1on-tnn box0wing 5.2 0.6. 3.0 3.1 1.4 1.1 Z6
Diunrsrnenta (netofNRI) 7.8 3.6 7.0 7.2 5.8 7.3 7.4Rcpaymia (scheduled): 2.6 29 4.1 4.1 4.4 6.2 4.
Otwr lInmb inflom (net)' 0.3 2.0 0.9 0.8 0.5 0.0 0.
OLbercapial flos -1.9 0.1 0.8 4 0.6 4 ..:7 -02 -0.1lNetshort-tesn capital -1.5 -0.7 -2.7 0.5 0.5 0.5 0.5Cap" flawmn.eLi' -1.2 .0.9 -0.7 -1.1 -1.2 -0.6 -0.6Eznti and nmonm 0.8 1.7 4.3 0.0 0.0 0.0 0.0
Chiges in net intematinal reasvra -2.6 0.3 -8.5 -6.5 -0.6 -0.7 -2.3INIF (nt) b0.8 1.3 0.2 4.1. -1.8 .0 -0.7ChngeinGru Resen:s -3.4 -1.0 -8.7 -5.3 1.1 0.3 -1.6
Menwrandurm it,m:CtrrntA AoumtBalance/GDP -0.7 -1.6 -0.3 -0.7 -13 -1.6 1-1.7GauForeigiExchangeRaervus 57 6.7 15.5 20.8 19.7 19.4 2l.0
inmonfia ofimports (goods) 33 3.5. 7.7 8.2 6.7 5.7 5.5
ExtfeullDebt iezcntofGDP) 33A. 37.1 36.7 32.89 30.9 29.1 28.0Dcbtsavice(%aftotal ntleceipts) 28.2. 28.1: 26.6 23.5 24.0 23.1 18.2a. Pre esytinate.b. AlthoWughodd Bank and Govemnxnet of ldisacuroee abow similarfatod toAl debt ,em.ce data, dimeepanacs
e,dstin the se of inte tandammAtiom Ihme dim"nsci am uXredaviw.c. Inwudes izter on tnlitary debt to te FSU wnd ietrma an foirt:nj_vel51et.d. Net Bum in I dqxit udhana except lhe e 4epatriable NRM)D Sorem.¢. SweAang. th Rmda d&t.e (- iidicatm iutKe in asets.
Sow-ce: Govsnzncst of nda; R13B Misistsy of CMui Vc; World Bank Stfvnute

-13-
Table 1.9: Real Exchange Rate of India's Main Trading Partners and Competitors 1981-94(end of period)
Export 1994She 1981 1989 1990 1991 1992 1993 I 11 in m V
IndianUS$ 0.93 1.05 1.00 1.26 1.17 1.28 1.25 1.20 1.19 1.17inSDR 0.76 0.98 1.00 1.27 1.13 1.24 1.25 1.23 1.23 1.20
REERb 0.56 0.91 1.00 1.28 1.29 1.30 1.28 1.27 1.33 1.28
India's Main MarkeUSA 20.0 1.20 1,05 1.00 1.02 1.01 1.00 0.99 0.99 0.98 0.97Japan 12.2 1.47 1.10 1.00 0.98 0.97 0.88 0.85 0.84 0.81 0.82
Germay 8.0 1.69 1.18 1.00 1.03 1.03 1.12 1.10 1.06 1.00 1.01UnitedKingdom 7.2 1.56 1.29 1.00 1.02 1.16 1.16 1.15 1.12 1.08 1.08Belgium c 5.4 1.75 1.23 1.00 1.02 1.00 1.07 1.04 0.99 0.94 0.95
Francec 2.8 1.75 1.21 1.00 1.03 1.01 1.08 1.05 1.01 0.96 0.98Netherlands 2.4 1.64 1.18 1.00 1.01 1.00 1.08 1.07 1.02 0.97 0.97
ltdias Min Campetitorshidonesia 0.81 1.11 1.00 1.06 1.06 1.06 1.06 1.04 1.02 1.00Malaysia C 1.03 1.03 1.00 0.97 0.87 0.84 0.88 0.82 0.80 0.80
Philippines 0.99 0.93 1.00 0.84 0.74 0.75 0.72 0.69 0.65 0.61Thailand 1.16 1.10 1.00 0.99 1.00 0.98 0.95 0.95 0.93 0.92Korea 1.12 1.01 1.00 1.04 1.06 1.07 1.06 1.05 1.03 1.01Singapore 1.06 1.15 1.00 1.08 1.1 1.10 1.10 1.04 1.02 1.00Hongongc 1.39 1.11 1.00 0,91 0.82 0.76 0.75 0.73 0,71 0.69
- Not available.Note: Increase = depreciation.a. Indexofacountrys nnA exciangz rate vis.a.vis the USSdivided byt c auwtl esaiepnep inee x or, ifnot available, the
cor3Iw price indexb. Based on the IMFs Infomatian Nodoe System tnetodology. Trade weigp ae based ontrade fow.s aveaged over 1980-82.
c. Uses CPI.
Source: IIF. bifleaLaonal Fwnazcial Statisict; Wodd Bak StUOinatez.

-14-
Table 1.10: Foreign Direct and Portfolio Investment(US$ billion)
1990-91 1991-92 1992-93 1993-94 1994-95
Direct InvestmentForeign Direct Investment 0.2 0.2 0.3 0.6 1.3
Portfolio Investmnent 0 0 0.1 3.5 3.6Foreign Insttutional Investment 0 0 0 1.7 1.5Euro-issues/ GDR 0 0 0.1 1.5 1.8Others a 0 0 0 0.4 0.2
Total Direct and Portfolio Investment 0.2 0.2 0.4 4.1 4.9
Memorandum item: (US$ million)Foreign Currency Convertible Bonds (FCCB) b 0 0 0 914 103Floating Rate Notes (FRN) 0 0 0 0 167
a. Includes NRI portfolio investments, offshore funds, and others.b. FCCB is treated as commercial borroNimg before conversion into equity.Source: Reserve Bank of idia; NMistry of Finance.
Reserves increased by about $4 billion between March and October 1994. Thereafter, they(excluding gold and SDRs) fluctuated between $19-20 billion. This slowdown in the accretion ofreserves reflected attempts by the authorities to discourage several foreign exchange accounts and toallow private companies to pre-pay their foreign loans. It also reflected the outflow of profits abroadbecause most of the FIls completed their one year mandatory lock-in period during November-December 1994 which entitled them to the substantial concessions on capital gains tax. The inflow ofGDR (global deposit receipts) into the country also slowed following policy changes which now allowcompanies to bring in such funds only when they are needed; the generally more cautious attitude offoreign investors following developments in Mexico; and increases in US interest rates. By March1995, reserves began to rise again. They reached about $20.8 billion--that is, $5.3 billion over the levelat end-March 1994 (Table 1.8).
CURRENT ECONOMIC MANAGEMENT ISSUES AND THE 1995-96 BUDGET
The most important issue in current economic management in India is improving appreciablyand urgently public savings and reducing the fiscal deficit. India's private savings performance isstrikingly comparable to high performing East Asian economies (Table 1.11). In sharp contrast, itspublic savings performance (that is, the excess of central and state government revenues over currentexpenditure plus gross profit of public enterprises) has been much worse, and has been deteriorating.
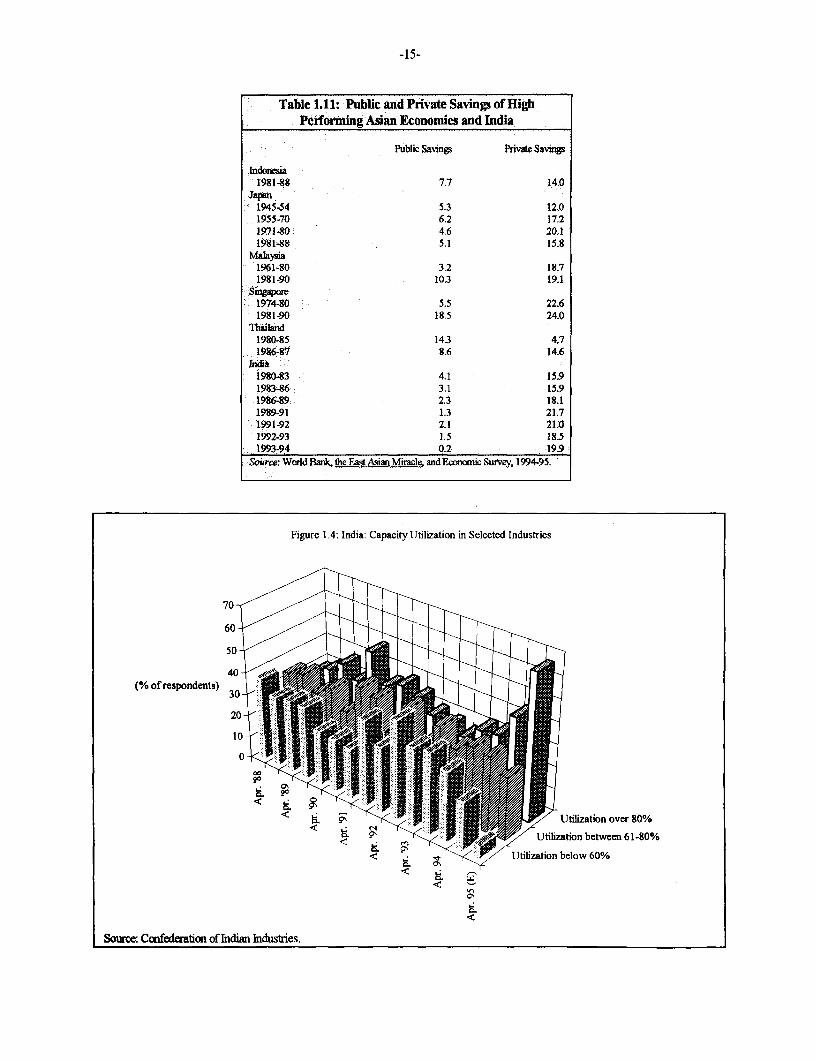
-15-
Table 1.11: Public and Private Savings of HighPeiforming Asian Economies and India
Public Savings Private Savuigs
198148 7.7 14.0Japan
1945-54 5.3 12.01955-70 6.2 17.21971480 4.6 20.11981-88 5.1 15.8
Mahysia1961-80 3.2 18.71981-90 10.3 19.1
singapo1974-80 5.5 22.61981-90 18.5 24.0
IhaiJand1980-85 14.3 4.71986-97 8.6 14.6
Iadi1980-83 4.1 15.91983-86 3.1 15.91986-89 2.3 18.11989-91 1.3 21.71991-92 2.1 21.01992-93 1.5 18.51993-94 0.2 199
Source: Woild Bazc, the East Asian Miracle and E aoo Survey, 1994-95.
Figure 1.4: India: Capacity Utilization in Selected Industries
(% of respondents) 31
0 ~ ~ ~ ~ ¢ v
-0C~~~~~~~~~~~~~~~~~~~r
Utilization over 80%
9owce CasuSeduaUltn between 6 1 -80%
Utlzation below 60%
Sourc: Comfederaticm of hidimn Industries

-16-
Correcting this situation is critical for restoring the capacity of the public sector to invest,particularly in infrastructure and human resource development (including primary education). It is alsocritical if India is to accommodate the markedly higher levels of total investment--public and private--needed to achieve and sustain rates of growth and poverty reduction comparable to high performningcountries in Asia. Indeed, capacity utilization in manufacturing already has reached unprecedented highlevels (Figure 1.4) and other indicators suggest that India's infrastructure is stretched. Inadequatepower supply is a well-known constraint to industrial growth. At 50 percent, the share of India'spaved roads is lower than it was in Malaysia (85 percent) and Thailand (67 percent) in 1971--acomparison that ignores the severe problems of congestion on India's roads. Meanwhile, telephonesper 100 persons in India (around 1) are much fewer than in Korea (4) and Malaysia (2.5) in 1975, andwell below what is needed.
In addition, unless the public sector savings performance is reversed drastically, monetarypolicy will bear the brunt of inflation reduction. This may affect real interest rates and investment, andplace India on a lower growth trajectory. So far very limited progress has been made on this issue,and prospects for a prompt resolution are not encouraging.
Fiscal Adjustment in the 1995-96 Budget
T7he 1995-96 Budget Meets Only Partially this Major Challenge. As indicated in the EighthPlan documents and other government policy papers, a reduction in the Central Government fiscaldeficit to 3-4 percent of GDP, and an increase in public sector savings to over 2 percent of GDP arecritical for achieving the government's growth and inflation objectives--and would bring fiscalimbalances to sustainable levels. However, as emphasized in the Economic Survey (1994-95), theCentral Government has been unable to meet its fiscal targets. Neither have state governmentscontributed to an increase in public savings (Chapter 2).
The 1995-96 Budget Envisages A Further Fiscal Adjustment But The Target May BeOveroptimistic. The 1995-96 Budget aimns to reduce the fiscal deficit to 5.5 percent of GDP. This is asignificant adjustment of 1.2 percentage points of GDP in relation to 1994-95--to be achieved mostlyby contracting non-interest spending. Helped by faster disinvestment of public enterprises (equivalentto 0.2 percentage points of GDP), revenue is projected to remain relatively constant in relation to GDPin spite of further significant reductions in tariffs and excises. Interest payments are projected toincrease by 0.2 percentage points of GDP. Non-interest expenditures are expected to decline by 1.3percentage points of GDP mainly on account of reduced spending on defense (0.2), subsidies (0.2),grants to states (0.2), lending to states (0.4), and non-defense capital expenditure (0.2). Explicitassumptions underlying the budget forecast are that: (a) nominal GDP will grow by 15 percent; (b)import growth will offset the revenue impact of tariff reductions; and (c) improvements in taxadministration will offset the impact of lower excise rates.
However, some of the implicit assumptions underlying the budget may be overoptimistic. Inparticular, the budget assumes implicitly that: (a) the policy of monetary restraint in place sinceDecember 1994 will not significantly affect growth and thus tax revenues; (b) the recommendations ofthe Pay Commission will not increase expenditure on wages and salaries during 1995-96; (c) thegovernment will be able to reduce grants and loans to the states even though general elections are due

-17-
before May 1996; and (d) disinvestment of public enterprises can be accelerated in spite of thepressures typical in a pre-election year. Clearly, although possible, achieving the 1995-96 fiscal deficittarget of 5.5 percent of GDP will be very difficult.
Table 1.12: Composition of the Public Debt of the Central Government
1980-81 1989-90 1990-91 1991-92 1992-93 1993-94 1994-95R.E. B.E.
Debt Stocks:Internal Labilities (Rs billion) 309 2398 2830 3177 3597 4260 4835ExternalDebt(Rsbillion) 135 541 663 1097 1210 1278 1322
Intemal Liabilities (percent of GDP) 22.7 52.5 53.1 51.6 51.2 54.2 53.0
Ext malDebt(percentofGDP)a 8.3 11.8 12.4 17.8 17.2 16.3 14.5
Interest RatesOnNew DatedSecurities n.a. 11.0 11.0 11.5 12.4 13.2 12.0
On Internal Liabilities (Average) n.a. 8.0 8.2 8.4 8.6 9.3 9.8
On External Liabilities n.a. 3.0 3.0 3.1 3.1 3.1 3.2
Memo IemGDP Deflator n.a. 8.3 11.0 14.6 8.9 8.1 10.5
Note: Figures are as of the end of March.a.. Converted at current year exchange rates.
Somrce: Ministry of Finance, Economic Survey, various issues; RBI, Report on Currency and Finance various issues,
Persistent High Fiscal Deficits Are A Major Threat to Macroeconomic Stability. Even if the1995-96 target is achieved, the fiscal deficit would still need to be reduced further to stabilize interestpayments on the Central Government domestic debt. After doubling between 1980-81 and 1990-91,the Central Government domestic debt as a percent of GDP has virtually stabilized since the start of thereform program in July 1991. However, this was partly the result of relatively high inflation whichrendered average real interest rates on domestic debt low or even negative in some years (Table 1.12).
Table 1.13 Sustainable Primary Deficits of the Central Government_(percent of GDP)
Domestic Real iterest Real GDP Growth (%)Rate
3.00 4.0 5.00 6.00 7.00 8.00
3.00 -0.1 0.6 1.3 1.9 2.6 3.24.00 -0.6 0.1 0.7 1.4 2.1 2.75.00 -1.1 -0.4 0.2 0.9 1.5 2.26.00 -1.6 -1.0 -0.3 0.4 1.0 1.77.00 -2.1 -1.5 -0.8 -0.1 0.5 1.28.00 -2.6 -2.0 -1.3 -0.7 0.02 0.7
Note: The calculations are based on the followng assunptions:Foreign real interest rate: 0.035 Foreign debt stock/GDP: 0.15Rate of real depreciation: 0.00 Domestic debt stockIGDP: 0.51
Source: Staff calculations.

-18-
Under reasonable assumptions, a deficit of 5.5 percent of GDP would still not be consistentwith the government's growth and inflation objectives. That is, because of the effect of the fiscaldeficit on real interest rates and private investment, at that level and with the existing composition ofexpenditures, it will not be possible over the long term to: (a) reach the government's inflationtargets of 5-6 percent; and (b) increase growth to between 7-8 percent. In addition, with financialsector liberalization underway in India, and long-term intemational real interest rates projected toremain at around 4-5 percent, India's long-term real interest rates will be at least 5 percent. Thisimplies that GDP growth rates lower than 5-6 percent will require primary surpluses just to stabilizethe domestic debt in relation to GDP (Table 1.13). Yet, the government has not been able so far togenerate a primary surplus. Accordingly, interest payments have claimed an increasingly large share ofgovernment's tax revenues--50 percent in 1990-91, and possibly 70 percent in 1995-96. This meansthat for every Rs 1 of taxes collected, the government now has discretion over just one-third of it(without running a deficit). Unless this situation is reversed, the probability of the governmenteventually collecting taxes just to service its debt, is more than marginal.
These calculations only capture the financial consequences of a rising government debt, but thegrowth and development consequences are equally serious. As interest payments rise, developmentexpenditure will inevitably suffer. If the composition of expenditure is not improved (in particular, ifpublic savings do not increase to finance public investments with high returns), the foundation forfurther growth will weaken.
Table 1.14: Center and States-Selected Fiscal Transactions, 1980-95(Rs billion)
1980-81 1985-86 1990-91 1991-92 1992-93 1993-94 1994-95R.E. B.E.
Paymnent ofinterest totheCenter 9 19 52 66 78 97 112
States' Payments of Principal to the Center 19 16 37 29 34 41 42
A. Subtotal 27 35 89 95 113 138 154
B. Central Governmmentloans to states 28 90 136 123 121 144 138
C. NetPosition(B-A) 0 55 47 29 9 6 -16
Memo iterns:berest Payments from States(as a Percent of Central GovemmentRevenue) 6.9 9.0 9.0 9.5 10.2 12.1 12.3Effective Interest Rate 4.1 4.2 5.6 6.0 6.3 6.9 7.0Total DebtStocksofStates(asa 147.2 152.9 163.3 154.5 154.2 154.1 156.6Percent of Total Revenue of States)
Note: RE = Revised estimates; BE = Budget estimates.Source: RBL Report on Currency and Finance, various issues.

-19-
The Fiscal Situation Raises Other Issutes. According to central budget documents, roughly 30percent (40 percent) of the tax receipts mobilized (retained) by the Central Govemment is devolved tothe states. In addition, the center provides loans and grants to states equivalent to about 25 percent ofits total expenditures. Over time, the indebtedness of the states to the center has increased despiteperiodic debt relief from the center. As discussed in Chapter 2, because of the weak revenueperformance of the states, the burden of the resulting debt service obligations to the center hasincreased steadily, even though the effective interest rate on these loans has been relatively low (Table1.14). In response, the center has moderated the growth in its gross lending to states. Oneconsequence, however, is that net loan transfers from the Central Govemment to the states are turningnegative. As discussed in Chapter 2, many states are in a difficult financial position and net negativeloan transfers from the Central Government could reduce their ability to service their debt to theCentral Government. This may have a strong impact on the Central Government revenues, even if thecenter is able to deduct some payments from the states at the source (of transfers).
Continuous improvements in the current account deficit of the balance of payments suggestthat fiscal imbalances have not yet spilled over into the balance of payments. However, this may haveresulted from subdued levels of investment typical of the initial phases of structural adjustmentprograms and evident in India in recent years (Table 1.7). A strong recovery would easily increasedomestic investment to the levels prevailing in years such as 1990-91, and possibly higher. In this case,unless public savings increase, a strong investment recovery could have a strong destabilizing effect onthe balance of payments.
As indicated earlier, non-interest expenditures already have bome the brunt of fiscal adjustmentand not much room is left for further reductions At the same time, fiscal adjustment must proceedwithout jeopardizing public resources for human resource development and targeted anti-povertyprograms. Containing food subsidies would contribute to this adjustment. This would depend, to alarge extent, on effective management of the record level of stocks now in the godowns of the FoodCorporation of India. Large and timely releases into the extemal market and the elimination ofrestrictions by the states on private traders' ability to hold stocks would reduce the significant carryingcost. Besides further reducing other subsidies, particularly for fertilizers, and readjusting oil prices,achieving a further 2 percent of GDP fiscal consolidation will likely need to rely on: (a) continuing thetax reform process, with full attention to extending the tax net, improving tax administration andincreasing the role of personal income taxes; and (b) more aggressive privatization, with proceedsgoing toward debt retirement.
In 1992, only about four million persons--equivalent to about 0.5 percent of the totalpopulation and 2 percent of the urban population--paid personal income taxes. And they declared onlyabout one-third of taxable income. Following the recommendations of the Chelliah Tax ReformsCommittee (which was set up in August 1991), successive recent budgets introduced and extended thecoverage of the presumptive taxes, and rationalized personal income tax rates. Otherrecommendations to broaden the tax base and improve the efficiency of income taxes focused on issuessuch as the tax unit, exemptions and deductions, perquisites, fringe benefits, and the treatment ofcapital gains. In the crucial area of tax administration, the Committee put forward several detailedsuggestions for streamlining tax administration that touched on issues such as penalties and

-20-
prosecutions, the Settlement Commission, computerization, effective tax identification numbers andsummary assessments. Actions so far include commencement of extensive computerization, and thedesign of new tax identification numbers. Reform of corporate taxes, following the Committee'srecommendations, has raised receipts from this source from 1.0 percent of GDP in 1990-91 to 1.5percent in 1994-95. In contrast, receipts from personal income taxes rose from 1.0 percent of GDP toonly 1.2 percent during the same period. This relatively modest improvement reflects the substantialground still to be covered in reforming personal tax administration and expanding the base. There isscope at least to double the personal income tax receipts to around 2 percent of GDP.
Furthermore, the tax reforrms introduced during 1993-95, particularly the reduction inexemptions, increased the buoyancy of excise duties from 0.9 to 1.0, custom duties from 0.8 to 1.0,and corporate taxes from 1.0 to 1.2. With the continuation of such tax reforms, including increasedemphasis on personal income taxation, these improvements could raise total Central Governmentrevenue to GDP by about 1.5 percentage points. If total expenditure were held constant in nominalterms, these revenue improvements would reduce the fiscal deficit of the Central Governmentcorrespondingly.
Table 1.15: Profitability Profile of Non-Departmental Cental Government PEs, 1990-94(Rs. billion)
1990-91 1991-92 1992-93 1993-94
Number of Operating Enterprises 236 237 239 240Profitable 123 133 131 120Loss-making 111 102 106 117
Profit of profit-making PEs 54 61 74 97(Percent of GDP) 1.0 1.0 1.1 1.2
Loss of loss-making PEs 31 37 41 53(Percent of GDP) 0.6 0.6 0.6 0.7
Memo Item:Profits of PEs in the Oil sector 23 18 23 39
(Percent of GDP) 0.4 0.3 0.3 0.5
Source: Ministry of Finance. Economic Survey 1994-95; CMIE.
These calculations assume no improvement in the performance of public enterprises (PEs).Evidently, if their performance improved, their contribution to fiscal adjustment would be significantthrough payments of larger dividends. At present, however, about 40 percent of central PEs arechronic loss makers. Their losses in 1993-94 were 30 percent higher than in the previous year; theyamounted to Rs 53 billion, equivalent to 0.7 percent of GDP (Table 1.15). These losses put asubstantial burden on the budget and the financial sector. They crowd out private investment andpublic spending in social sectors and infrastructure. In addition, the low quality and high cost inputsthey provide the other companies, weaken Indian's position in intemational competition. Therefore,
-21-
acceleration in the PE reforms, including privatizations, would play a pivotal role in improving fiscaldiscipline and in strengthening the competitiveness of India's industry.
Balance of Payments and External Debt Management
For the past two years, a key issue for the authorities has been to avoid surpluses in the capitalaccount, which at present is more open than China's and Korea's, from leading to a deterioration inexport performance. Surpluses in the capital account have surged while the current account deficitremained negligible. This has put pressure on the nominal exchange rate to appreciate. The RBI hasmaintained the nominal exchange rate (in theory a float) constant at Rs. 31.371US$ by purchasing allthe excess supply of foreign exchange at that rate. Foreign exchange dealers believe that in the absenceof such interventions, the nominal exchange rate and thus also the real would have appreciated,probably by 20 percent. This would have prevented the rapid expansion of exports witnessed in thelast two years. Because of the devaluation of the US$ vis-a-vis major currencies, and the reduction inthe anti-export bias, there has been no noticeable impact on exports. However, the authorities arelegitimately concemed with the pressure of inflation on the real exchange rate and export performancethat could re-emerge if capital inflows were to return to the levels witnessed in the last two years.
Accordingly, the authorities have responded to the surge in capital inflows through measuresthat seek to discourage three categories of inflows. First, following a procedure established at the timeof the last IMF Stand-By (November 1992-May 1994), the authorities continue to set annual limits forexternal commercial borrowing. Second, new guidelines in May and October 1994, for Indian firmsraising funds abroad, establish a maximum of one (two) issue(s) per year per company (group ofcompanies); require that money raised abroad be for physical investment projects; and stipulate thatthese funds must not be brought into the country until a clear use for them exists. Thirda as indicatedearlier, NRI deposits have been made less attractive (Boxes 1. I and 1.2) and their growth thus has beencontained. Together with recent increases in US interest rates and adverse developments in emergingmarkets, these measures have helped to bring inflows to more manageable levels in recent months (andhave created an opportunity for more restrictive monetary policies, which as indicated earlier, the RBIhas seized). It is evident, however, that the impact of developments in the capital account on thecompetitiveness of the real exchange rate and export growth will continue to be an area of concern forsometime. The stance on fiscal policy, and its impact on interest rates will be a factor in determiningthe magnitude, direction and composition of the capital inflows.
The Eighth Plan (1992-1997) document anticipated a current account deficit in the balance ofpayments averaging 1.6 percent of GDP per annum. Assuming that the current account deficitincreases to about 2 percent of GDP thereafter, this would reduce India's external debt from 33percent of GDP at present to 25 percent of GDP by the end of the decade, and 22 percent of GDP bythe year 2003. As a share of current account receipts, the debt service ratio would decline from 24percent at present to 16 percent towards the end of the decade, and 14 percent by the year 2003. Keyassumptions of this scenario are that: (a) GDP growth during 1997-2003 will average 6 percent perannum; (b) merchandise export and import growth will stabilize at about 11 percent per annum and 10

-22-
percent per annum respectively toward the end of the projection period; (c) foreign investments(including foreign institutional investment, foreign direct investment, and global deposit receipts) willrise from the current level of $4.9 billion to as much as $7 billion by 2003 (with foreign directinvestment comprising an increasing share); and (d) gross reserve (net of gold) accumulation will reach$22 billion by the end of decade, equivalent to 4.2 months of imports of goods.
Although the external accounts have improved since 1991, they remain vulnerable in severalrespects. First, in spite of the more welcoming approach toward foreign investors adopted in recentyears, domestic oil production (40 percent of national consumption at present) will level off towards1998 and oil imports will consequently increase rapidly thereafter. Seconid, of India's $96 billionextemal debt (which includes $4 billion of short-term debt) (Table 1.16), about $24 billion is due to
Box 1.1: Non-Resident Indian Deposits Made Less Attractive
Since the 1990 crisis, the authorities have sought to reduce their rehiance on foreign currency deposits from Non-Resident Indians (NRls), which had reached 17 percent of India's extemal debt in March 1991. In addition to thepotentially volatile nature of NP] deposits, they also imposed a high quasi-fiscal cost to the RBI which provided anexchange rate guarantee to a large share of them. A number of measures were taken during 1992 and 1993 to reduceIndia's dependence on such accounts. New kinds of accounts were created in Junc 1992 and May 1993, for which thecommercial banks bear the foreign exchange risk. In addition (a) the guarantee on the Foreign Currency Non-ResidentAccount (FCNR(A)) has been discontinued since May 1993 for deposits with less than one year maturity, this was firtherextended to maturities up to three years in October 1993; and (b) since July 1993, the cost of the foreign exchange risk onFCNR(A) accounts has been shifted from the RBI to the Central Government-the cost of the guarantees is now an explicitbudget item.
During 1994, further measures were taken to reducc India's dependence on NR deposits. First, the FCNR(A) depositscheme (of which only the three-year maturity remained) was withdrawan effective Auguist 15, 1994. The existing FCNR(A)deposits wvere allowed to continue till maturity but no renewals Nvill be perritted thereafter. Second, as of October 1, 1994,the interest accrued on Non-Resident (Non-Repatriable) Deposit Scheme NRNRD (but not the principal amount of thedeposit) was made eligible tor repatriation. Third, the Foreign Currency (Ordinary) Non-Repatriable (FCON) scheme, forwhich the principal arnount of the deposit and the interest accrued are not eligible for repatriation, was abolished as ofAugust 20, 1994. The existing deposits held under this scheme would not be renewed upon maturity. lnterest accruing onexisting FCON deposits from the quarter beginning October 1, 1994 will be eligible for repatriation up to the maturity dateof the existing deposits. Fourtii, in the context of a stable dollar-rupee rate, the term deposit rates for NRER accounts formaturity of 6 months to 3 years anld above would be reduced from "not exceeding 10.0 percent per annum" to "notexceeding 8.0 percent per annum" effective October 18, 1994. The revised temi deposits will be made applicable only tonew deposits and upoIn renewal of inaturing deposits. Effective November 1, 1994, the NRER savings deposit rate wasreduced from 5.0 to 4.5 percent per anmnm. Fiftli, at present FCNR(B) liabilities are totally exempt from reserverequirements. As the spreads under this scheme are extremely high and the forward cover charges are moderate under astable dollar-rupee rate, effective October 29, 1994 scheduled commercial banks will be required to maintain a cash reserveratio (CRR) of 7.5 percent on liabilities under the FCNR(B) scheme. As a result of this prescription, resources of scheduledcommercial banks would be impounded to the extent of Rs 5500 million. Recentlv, the RBI further increased the cashreserve ratio on FCNR(B) from 7.5 to 15 percent The RBI also imposed a CRR of 7.5 percent on the NRNRD. The CRRnorms are applicable from January 20, 1995. This step was taken to control monetarv expansion and the inflationaryimpact of such expansion. The inmiediate impact of the move was to withdraw about Rs 12 billion from the bankingsystem.
Although inflouws of NRI deposits are decreasing due to the active government action to make them less attractive, theshare of NRI deposits in total ex1ernal debt is still about 16 percent, downi from 17 percent during the 1990-91 crisis.However, although this decline is verx modest, the nature of the NRI deposits todav (less costly and of longer maturity)suggests that the situation is not alartming. This is true despite the f'act that all remaining NRI schemes are repatriable(except the principal amount on NRNRD).

-23-
Box 1.2: Non-Resident Deposits Characterized
Non-resident devosits includes net inflows under the six schemes in place and the terminated FCBOD scheme.
Starting Foreign Repatiability SLRI CRR Interest OutstandingDate Exchange Principal Interest Requirements Ratese Stock (US$
Guarantee billionp
FCNR(A) Nov. 1975 Yes Yes Yes Yes (a) 7.1NR(E)RA Feb. 1970 No Yes Yes Yes (b) 4.6FCNR(B) May 1993 No Yes Yes Yes (a) 3.0NR(NR)RD June 1992 No No Yeec Yes (c) 2.5FCON June 1991 No No Yee No (C) 0.0RFC Feb. 1992 No Yes Yes No (c) -
FCBODFCNR(A): Foreign Currency (Non-resident) Accounts in US$, UK£, Yen, or DM. Withdrawn effective August 15, 1994.NR(E)RA: Non-resident (External) Rupee Account; Rupee denominated.FCNR(B): Foreign Currency (Non-resident) Accounts (Banks) Scheme in US$, UK£, Yen or DM.NR(NR)RD: Non-resident (Non-Repatriable) Deposit Scheme; Rupee denominated.FCON Foreign Currency (Ordinaiy Non-Repatriable) Deposit Scheme; in US$. Abolished as of August 20, 1994.RFC Resident Foreign Currency Accounts (for citizens retuming to India after working abroad), any crrency.FCBOD: Foreign Currency (Banks & Others) Deposits from corporations abroad. Discontinued since July 31, 1992.
-- Not available.Note: All figures are inclusive of accrued interest.
a. (a) fixed by RBI; (b) ceiling of 11 percent; (c) banks deternine the rate.b. Preliminary, as of March 1995.c. Applicable on interest accruing on deposits from the quarter beginning October 1, 1994.d. Applicable on interest accruing on existing deposits from the quarter beginning October 1, 1994 up to the
maturity date of existing deposits.
Source: Reserve Bank of India.
be repaid in the next four years with a peak of roughly $7 billion in 1996-97. This is in addition to therollover of the short-term debt and the rollover of NRI accounts. Added to the financing requirementsof the current account deficit, this means that over the next four years India will need to mobilize about$40 billion of extemal finance--excluding the rollover of short-term debt and NRI accounts.
Third, NRI foreign currency accounts continue to be a potential source of pressure since, intheory, they can be withdrawn on demand, subject to a small penalty, and create some vulnerability. Inpractice, of course, this has not occurred Fourth, while India has enjoyed an unprecedented sequenceof good monsoons the probability of a bad one is not believed to have changed. Fifth, recentdevelopments in emerging capital markets have highlighted the macroeconomic turbulence that suddenchanges in market sentiments can bring about. Portfolio investment in India has taken place ininstruments that are costly to reverse, debt instrument are highly restricted, and the authorities havemaintained foreign exchange reserves at a level sufficient to accommodate portfolio outflows.

-24-
However, there is always a risk of other outflows--such as NRI accounts. These vulnerabilitiesare tempered by India's strong liquidity position--$20.8 billion of reserves versus short-term liabilities(including NRI deposits with remaining maturities of less than one year) roughly half that. All thismakes capital flight more costly and less likely, but cannot prevent it. International experience indicatesthat it would be ill-advised to attempt to prevent the exchange rate from depreciating were outflows tooccur.
Table 1.16: India's External Debt, 1990-95(US$ billion, end-March)
1990-91 1991-92 1992-93 1993-94 1994-95S
Multilateral 21.8 24.0 26.1 27.8 29.1
Concessional 13.8 14.8 16.0 16.7 17.5
Non-Concessional 7.9 9.2 10.2 11.2 11.6
Bilateral (include. Rupee Debt) 26.7 25.6 27.9 28.0 29.1Concessional 25.2 24.0 26.2 26.2 27.3
Non-Concessional 1.5 1.6 1.6 1.8 1.8
IME 2.6 3.5 4.8 5.0 4.3
Export Credit 2.8 2.9 3.1 4.5 5.3
Supplier's Credit 0.4 0.4 0.6 0.8 1.0
Other Private 0.9 0.9 1.1 1.5 19
Private Non-Guaranteed 1.5 1.5 1.5 2.3 2.4
Commercial Borrowing 19.6 21.0 21.8 22.9 23.6
Comrnercial Banks 16.7 16.6 17.5 18.9 20.0
of which:NRIDeposits 10.2 10.1 .11.1 12.7 13.0
Bonds 2.9 4.4 4.4 4.0 3.7
Short TermDebt 8.5 7.1 6.3 3.6 4.1
Total 82.0 84.0 90.1 91.9. 95.6
Source: World Bank D)ebt Reporting System.
For all these reasons, a significant revision in the anticipated current account deficit is notexpected before the end of the Eighth Plan period in 1997-98 when the government will announce itsmacroeconomic targets for 1997-2002. At that time, it would not be unreasonable for the anticipatedcurrent account deficit to be revised upward, perhaps to around 2 percent of GDP especially as theeconomy absorbs large investments in infrastructure, and the capital goods imports associated withthem. However, more important than setting targets for the current account deficit is to ensure that themacroeconomic and sector policy framework are such that foreign savings incrementally finance highreturn investments rather than consumption.
Openness Of India's Capital Account Already Comparable To Some High PerformingCountries. The surge of capital inflows over the last two years was unexpectedly large. It led to therealization that India's capital account, while still more closed than Chile's, Mexico's or Indonesia's, is

-25-
already more open than Korea's and China's at present, or Japan's until the late 1970s. At present,India's foreign direct investment regime is comparable to those in the most open economies. Inaddition to being permitted in a wide range of sectors, with the amendment of the FERA (Act) in 1993there is now no discrimination between firms with foreign equity and firms fully owned by Indiannationals. This means that once established in India, a foreign investor can invest in all areas of theeconomy under the same terms and conditions as a national investor. In addition, unlike a practiceprevailing in a number of developing countries, there are no limits or restrictions on profit remittances.Conditions on portfolio investment by foreign institutional investors (FHs) are much more liberal inIndia than in Korea (where there is a limit of 10 percent, recently increased to 15 percent, on thecumulative amount of equity that foreign institutional investors can hold in any given firm); andTaiwan, China, where the limit is 10 percent and where, in addition, there is a global ceiling on theaggregate amount of annual portfolio inflows allowed into the country.
At the same time, the conditions in India are considerably more restrictive than in Malaysia(where the only shareholding limits are for portfolio investment in banks and finance companies, anddesignated non-bank stocks); Indonesia (where the shareholding limit is 49 percent), and Mexico(where the shareholding limit is 100 percent, except for banks where it is 30 percent). And contrary tocountries such as Argentina and Mexico, foreigners cannot hold India's government debt instrument,and can only purchase private firms debt instruments in the secondary market--which in India isrelatively illiquid. Regarding external borrowing, India's regime is more liberal than in Korea (where inaddition to an overall ceiling similar to that in effect in India, firms can only use proceeds exclusivelyfor imports), but is less liberal than in most other countries. However, as has been the case in othercountries (Box 1.3), and as witnessed last year, even this current degree of openness can be the sourceof considerable macroeconomic turbulence.
If Inflows Return To Last Year 's Level, More Active Management Of The Capital AccountMay Be Necessary. International experience indicates that the basic long-term strategy for managingcapital inflows should be to increase the economy's capacity to absorb and allocate them efficientlythrough market-based mechanisms. However, the short-term macroeconomic destabilizing effects ofrapid accumulation of foreign assets are not unlike those stemming from excessive governmentspending. The exception is the fact that real retums on liquid foreign assets accumulated by the RBIare unlikely to be over 2-3 percent while returns on government spending, in theory at least, could bemuch higher. This highlights that the opening of the capital account should keep pace with the overallprogress of stabilization and reforms in the economy. This is based on two familiar argumentsarticulated by Vittorio Corbo and Stanley Fisher in Adjustment Lending Revisited, 1992: "First, thespeed of adjustment in the asset markets is much faster than in the commodity markets. To avoid largemovements in capital inflows and the real exchange rate, controls on capital should limit the flows ofcapital to the rate at which the goods markets adjust to domestic deregulation and foreign tradeliberalization. Second, because the prices of assets are determined by the expected present value offuture income streams, distortions in the prices of goods and factors result in assets being traded atdistorted prices. The consequence is a misallocation of investment."
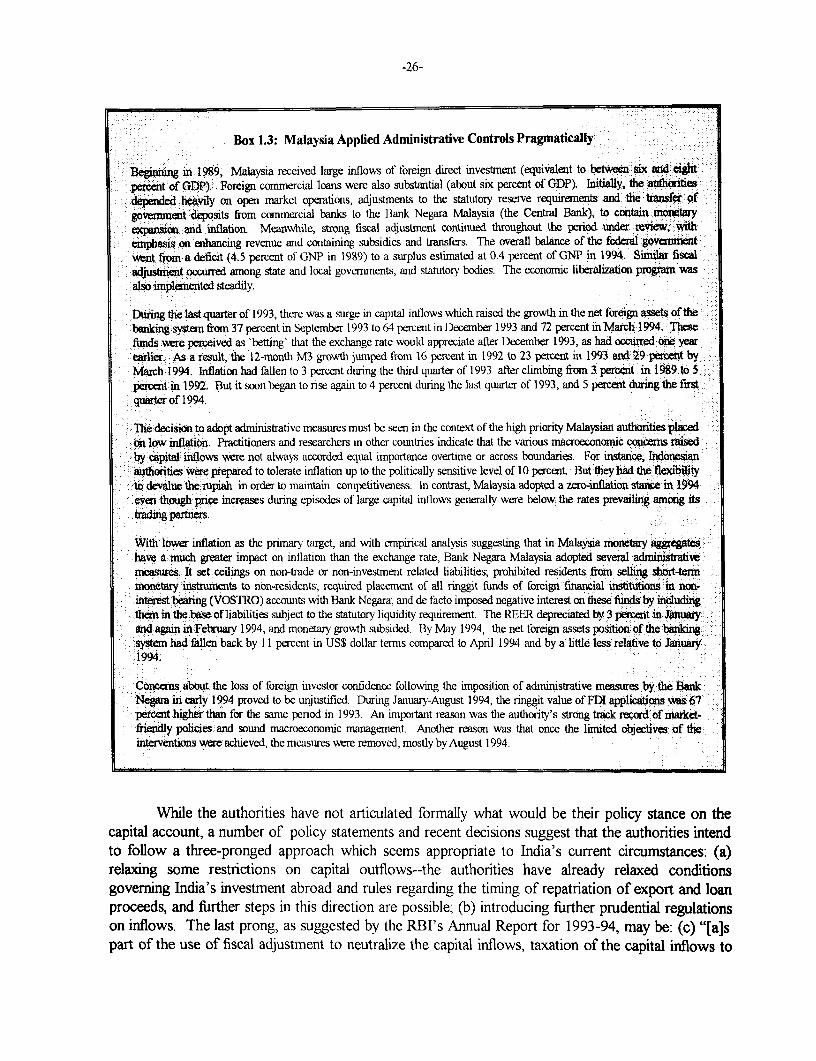
-26-
Box 1.3: Malaysia Applied Administrative Controls Pragmatically
Beginn¢ing n 1989, Malaysia received large inflows of foreign direct investmnent (equivalent to betwveesix and eight.Wperent of GDP). Foreign commercial loans were also substantial (about six percent of GDP). Initially, thea uthoitiesi
| depenehvily on open market operations, adjustments to the statutory reserve requirements and the trans ofgovermment deposits from commercial banks to the Bank Negara Malaysia (the Central Bank), to contain.rootem;ywqnu _; :and inflation- Meanwhile, strong fiscal adjustment continued throughout the period under review,with :emphasis on enhancng revenue and containing subsidies and transfers. The overall balance of the fedesl pgov=nenrt| went from a deficit (4.5 percent of GNP in 1989) to a surplus estimated at 0.4 percent of GNP in 1994. Sinil fiscaladjustmen ocwuned among state and local governments, and statutory bodies. The economic liberalization program nwasalso implemented steadily.
During the last quarter of 1993, there was a surge in capital inflows which raised the growth in the net foreign asses of thebanking systea from 37 percent in September 1993 to 64 percent in December 1993 and 72 percent in March 1994. Thesefimds were perceived as 'betting' that the exchange rate would appreciate after December 1993, as had occurrcdone yearearlier. 1:As a result, the 12-month M3 growth jumped from 16 percent in 1992 to 23 percent in 1993 and 29 pent by..March 1994. inflation had fallen to 3 percent during the third quarter of 1993 after climbing from 3 percent in 1I89lto 5percet in 19921 . ut it soon began to rise again to 4 percent during the last quarter of 1993, and 5 perc.t during the :firsquarter of 1994.
:::The:decision to adopt administratve measures must be seen in the context of the high priority Malaysian authoritie plcedon low inflation. Practitioners and researchers in other countries indicate that the vanous macroeconomic concens wisedby awpital ilows were not always accorded equal imnportance overtime or across boundaries. For instance, Indnesianauthorities were prepared to tolerate inflation up to the politically sensitive level of 10 percent. But they had the lexito devalue the6rupiah in order to maintain competitiveness. In contrast, Malaysia adopted a zero-iiflation stacemin 1994even though price increases during episodes of large capital inflows generally were below the rates prevailing among its..
trading partnr. :0
With lower inflation as the pnimary target, and w%ith empirical analysis suggesting that in Malaysia monety ary teshave a miuch greater impact on inflation than the exchange rate, Bank Negara Malaysia adopted several administrativemeasures. It set ceilings on non-trade or non-investment related liabilities; prohibited residents flom selling shorttermnimonetay .instlrnents to non-residents; required placement of all ringgit funds of foreign financial instituons In nn-interest bearing (VOSTRO) accounts with Bank Negara, and de facto imposed negative interest on these funds by including.thean inthe baseof liabilities subject to the statutory liquidity requirement. The REER depreciated by 3 percent iin tJanuyand :i again in February 1994, and monetary growbth subsided. By May 1994, the net foreign assets poOSitiO Of thebnkn
|.system had fallen back by 11 percent in US$ dollar terms compared to April 1994 and by a little less relative to JanuaryI 1994.
Concerns about the loss of foreign investor confidence folloving the inposition of administrative measures by the Bank..Negara in early 1994 proved to be unjustified. During January-August 1994, the ringgit value of FDI applications was. 67percent higher than for the same period in 1993. An important reason was the authority's strong track record of narket-:friendly policies ;and sound macroeconomic management. Another reason was that once the limited obectives oF theinterventions were achieved, the measures wvere removed, mostly by August 1994.
While the authorities have not articulated formally what would be their policy stance on thecapital account, a number of policy statements and recent decisions suggest that the authorities intendto follow a three-pronged approach which seems appropriate to India's current circumstances: (a)relaxing some restrictions on capital outflows--the authorities have already relaxed conditionsgoverning India's investment abroad and rules regarding the timing of repatriation of export and loanproceeds, and fhrther steps in this direction are possible; (b) introducing further prudential regulationson inflows. The last prong, as suggested by the RBI's Annual Report for 1993-94, may be: (c) "[a]spart of the use of fiscal adjustment to neutralize the capital inflows, taxation of the capital inflows to

-27-
discourage the inflows and to also bridge the fiscal gap. This instrument of policy is [to be] used only ifthe capital inflows accelerate and other instruments are unable to contain the expansionary effects ofthe inflows."
POVERTY
A Major Objective Qf The 1995-96 Budget Is To Increase The Anti-Poverty Orientation OfGovernment Policies. The pillars of the Governmnent's poverty reduction strategy are accelerated andsustained labor-intensive growth and investment in human capital development. Anti-povertyprograms have a supplementary role. However, although growth improved further in 1994-95, thereturn of inflation to double digits raised concem over the impact of the economic program on thepoor. This has been accentuated by particularly large increases in food prices. For example, the priceof common rice sold through the Public Distribution System (PDS) has risen by about 90 percent sinceJuly 1991, and the price of wheat has risen by about 70 percent. This is well above the 40 percent bywhich the Wholesale Price Index (WPI) has increased since that time.
Table 1.17: Annual Percentage Change in Real Wagesfor Unskilled Agricultural Labor by Selected States
(percentage change for agriculturll year (July to Juneover previous year))
State 1990- 1991-92 1992-93 1993-9491
Andhra Pradesh -1.1 -11.4 1.6 8.7Assam 5.4 -8.9 0.8 -6.7Bihar 4.2 -4.5 -4.7 5.9Gujarat -0.8 -4.3 7.7 3.3Karmataka -3.1 -13.1 -14.4 41.3Kerala 5.2 4.1 9.7 -2.9Madhya Pradesh 6.8 -3.9 12.3 -3.7
Maharashtra 6.8 -14.7 0 5 26.1
Orissa 9.4 -3.5 10.7Punijab 3.9 3.8 4.1 1.6Rajasthan 0.7 5.6 -3.3 -7.6Tamil Nadu 2.6 -5.1 13.4 11.3Uttar Pradesh -3.5 1.4 7.6 -7West Bengal -6.1 -6.2 24.3 -6.4All India 1.1 -5.3 5.6 3.6
P-Provisional.Source: Ministry of Finance, Econcwnic Survev 1994-95.
In its 1995-96 Budget, the Central Government re-doubled its efforts to alleviate poverty.While re-iterating that significant and sustained reduction in poverty could only be achieved throughbroad-based growth, the 1995-96 Budget introduced new anti-poverty programs. New schemes directthe commercial banks to provide credit to small scale units, scheduled castes and tribes, enterprises inbackward regions, and state governments to complete ongoing rural infrastructure projects. Other

-28-
schemes target the urban poor with subsidized housing, old age pension, maternity benefits, subsidizedlife insurance, lump-sum survivor benefits on the death of the primary bread eamer, and mid-day mealsfor school children. The operational modalities and exact cost of most of the schemes are beingworked out. The Budget also introduced lower excise duties and other measures aimed at increasingaccess to cheaper imports of essential items such as sugar, pulses and edible oils.
Intemational experience, and research on poverty in India up to the late 1980s, all suggest thatinflation affects the poor adversely. However, no clear answers are possible at this stage about themore recent period. The reason is that there are no definitive data on recent household expenditureand therefore, no definitive indications of the net impact of inflation and other developments since 1991on poverty in India. Since 1991, conditions known generally to be favorable and unfavorable to thepoor have evolved. Growth in the 1980s was not sustainable and was based on rapidly growingdomestic and extemal imbalances. If not corrected, they would have led the economy to a cycle ofrapid inflation, chronic balance of payments problems, and low growth--a situation in which the poorare particularly vulnerable. Thus, the rapid correction of the unsustainable domestic and externalimbalances and the structural reforms, which are setting the economy on a higher growth trajectory,have improved prospects considerably for raising the living standards of the poor. In addition, Indiahas avoided the sharp and prolonged declines in GDP growth which have been common in stabilizationand reform experiences elsewhere in the world, and which tend to have a strong negative impact on theconsumption levels of the poor.
Also on the positive side, annual growth in the agricultural sector averaged 3.5 percent since1991-92, when it contracted by 2.3 percent (Table 1.6). At present, about 80 percent of India's poorreside in rural areas and their welfare is closely tied to the performance of the agricultural sector.When the sector contracted in 1991-92, the real average wage (nominal wage deflated by state-levelconsumer price index) of unskilled agricultural labor at the all-India level--an important indicator of theconsumption levels of the poor--contracted in 1991-92. But the subsequent recovery more thancompensated for this one year decline (Table 1.17).
Employment creation has accelerated. The recent Economic Survey (1994-95) indicated thatemployment increased twice as fast between 1992 and 1994 than during the 1985-92, at a rate of 6million new jobs a year. In 1994-95, employment growth was approximately 7.8 million. Prior to thereforms initiated in 1991, industrial policies provided high effective protection for capital intensivemanufacturing sectors. This had resulted in a four-fold decrease in the labor intensity of manufacturingduring 1960 and 1986.
Contrary to some stabilization and reform experiences elsewhere in the world, the governmenthas made deliberate efforts to ensure that the burden of fiscal adjustment does not fall on socialprograms that benefit the poor. India has several antipoverty programs, including: (a) the PublicDistribution System (PDS) which provides to the poor basic foodstuffs at subsidized prices; (b) theIntegrated Rural Development Program which helps the poor to acquire income-generating assets suchas milk cows or bullock carts; (c) public works programs which aim to provide additional wageemployment, and (d) the Integrated Child Development Scheme. Total central and state fiscalexpenditures on these programs approached 2 percent of GDP over 1992-93 to 1994-95. In addition,a revamped PDS was launched in 1992. The authorities expanded the network of fair prices shops to

-29-
backward and remote blocks in tribal and dry land areas. An "Employmnent Assurance Scheme" alsowas introduced in 1993 in 1,752 backward blocks in drought-prone tribal and hill areas. The CentralGovernment has also maintained or increased its expenditures on social services, particularly for thosethat have a strong impact on the living standards of the poor. Spending on disease control programsrose by 44 percent between 1992-93 and 1994-95 and is projected to increase by 17 percent over1995-96. Expenditure on individual disease control program was much higher than the aggregate.Spending on Tuberculosis, Leprosy Control, and Trachoma and Blindness programs rose by 59, 169,and 100 percent respectively over 1992-95.
Meanwhile, state spending on social services has remained largely unchanged at around 5.3percent of GDP since 1991-92. Evidently, failuire to correctfiscal and institutional problems at thestate level, as discussed in Chapter 2, wouldjeopardize over time the capacity of the governments toprovide the poor with the physical health, skills and opportuinities to benefit from the growth process.
While the intense focus on poverty reduction is welcome, it is of concern that the recent effortsdo not include improvements in the administration of existing programs. To enhance theimplementation and monitoring capacity of the rural and urban development ministries, the governmentadded six new departments in 1995 and consolidated others to improve the coordination betweendifferent department heads. These changes are expected to correct the pervasive mis-targeting andsupply mismanagement, particularly of foodgrains. Even if successful, this would be just a beginning.Another concern is that the initiatives announced in the 1995-96 Budget involve creating nine newprograms. This could strain the delivery system and compound the fundamental inefficiencies in theexisting arrangements. In addition, requiring that the banking sector fund some of the new anti-povertyinitiatives, albeit from the shortfall in their priority sector lending, is a step in the wrong direction.Finally, with a large proportion of the rural poor directly dependent on agricultural growth, there isconcern that several unresolved issues in the sector would undermine its contribution to povertyreduction.
PROGRESS IN STRUCTURAL REFORMS
Structural Refornms Continued in 1994-95. Over the last three years the Indian authoritieshave taken measures in a wide range of areas to push the economy into an incentive regime moreconducive to rapid employment generating growth and poverty reduction. The last two EconomicSurveys and the last three Economic Memoranda reviewed in detail the reforms introduced in the firstthree years of the government's structural reform program.
The reform process continued during 1994-95. On the investment front, the New TelecomsPolicy of May 1994 allows private investment (including foreign investment up to 49 percent of equity)in the provision of basic telecommunication services. Value-added services were opened to privatesector in July 1992 but private sector entry was blocked because of unclear guidelines on the award oflicenses. These problems have now been addressed. In October 1994, private companies receivedlicenses to operate cellular services in Bombay, Calcutta, Madras, and Delhi. By the end of 1996cellular services are expected to be introduced in all telecom operating areas in India. In January 1995,the Government invited bids for licenses in basic services. Meanwhile, a new Drug Policy wasintroduced in September 1994 It permits foreign investment of up to 51 percent equity to receive

-30-
automatic approval, removes restrictions on production and imports for foreign companies, and freesthe price of most drugs except the most basic ones. In December 1994, the government opened coalmining fully to the private sector in two stages. In the first stage, domestic and foreign companies willbe allowed to form joint ventures as minority shareholders with Coal India Ltd. In the second stage,the Coal Mines Nationalization Act will be amended to allow private companies independently to mineand sell coal in the open market. Separately, the Government allowed 10 new banks to openoperations, including three of foreign origin. Foreign investors can own up to 49 percent of small scaleindustries; but the products reserved for small scale enterprises have not been changed and this remainsan obstacle to achieving economies of scale in the production of a number of industrial products.
In the 1995-96 Budget, the Minister of Finance reaffirmed the Government's commitment tothe continuation of reforms of the capital market through the Securities and Exchange Board of India(SEBI) directives. As a part of the process of eliminating the administrative bottlenecks in the transferprocedures and as a move towards paperless trading, the Budget announced that legislation to establisha Central Depository Scheme will be introduced during the year. This follows several measures takenduring the course of the 1994-95. A new National Stock Exchange (NSE) was inaugurated formally inJuly 1994. It is India's first entirely scripless stock exchange. It is viewed by the Government as animportant step in providing efficient and transparent services to investors. During the year, the RBIinstructed banks that all transactions in debt securities, previously handled by brokers in an unregulatedtelephone market, should be done solely through the NSE. Meanwhile, SEBI has taken several stepsto strengthen the regulatory framework of India's capital markets. Actions include introducingregulations governing substantial acquisition of shares, guidelines governing disclosures and publicoffering of shares. in January 1995, the SEBI Act was amended to re-inforce SEBI's autonomy andcapacity to respond quickly to market conditions; and provide regulatory powers (and penalties) overcorporates in matters such as the issuance of capital. Starting January 1995, FIls were allowed toborrow in Indian capital markets on registration with SEBI.
The much awaited decision to end the public sector monopoly of the insurance industryrecommended last year by the government-appointed Malhotra Comrmittee on Insurance has not yetbeen taken. However, in his recent budget speech, the Finance Minister announced a decision to set upan Insurance Regulatory Authority, on lines similar to SEBI--this is an essential first step for theliberalization of insurance and was an important recommendation of the Malhotra Conmmittee. Thegovernment has also continued to encourage investment growth by lowering import and excise dutieson the parts, components, and inputs for the capital goods industry, and raising the investment lirnit toRs. 30 million from the present Rs. 20 million for excise exemptions for the small scale industry.
With these measures, the main investment restrictions remaining at present are for insuranceand railways which are the only sectors of the economy still reserved for the public sector. Therailways already have made increasingly large efforts to involve the private sector in operations ("own-your-wagon" schemes), and maintenance (the maintenance of a number of railway stations has beencontracted out). India's foreign investment regime now compares well with those prevailing in EastAsian countries which have been successful at attracting foreign investment. In some cases, it issignificantly more open than its competitors' (telecommunications, power and mining). However, asdiscussed in Chapter 3, the liberalization of the investment regime in infrastructure needs to be

-31-
accompanied by considerable improvements in the institutions and regulations governing privateinvestment in this area
In trade reform, the maximum import tariff was reduced from 85 percent to 65 percent at thebeginning of 1994-95, it was 300 percent in 1990-91. In addition to reductions in tariffs below themaximum, this change brought the average tariff down to 33 percent in 1994-95, from 47 percent in1993-94 and 87 percent in 1990-91. The 1995-96 Budget introduced further tariff reforms which areexpected to reduce the average tariff to about 27 percent (Table 1. 18). The highest import duty is tobe cut from 65 to 50 percent, with wide-ranging reductions of tariffs on inputs and outputs in keysectors, such as capital goods, electronics, textiles, chemicals and metal-based industries. Import dutieson general machinery, machine tools, instruments and projects were unified at 25 percent. These tariffadjustments will remove some of the remaining anomalies in the duty structure such as multiplicity ofrates on import of capital goods, and tariffs on imports of inputs for the capital goods industry higherthan those for the final goods. Duties on inputs for electronics have been cut significantly along withitems such as ferrous and non-ferrous metals, polyester fiber and polyester filament yarn, chemicalssuch as ethylene, benzene, soda ash and caustic soda, and paper.
Since 1991-92, the pervasive licensing restrictions on imports of intermediate and capital goodshave been eliminated. In August 1994 the rupee was made fully convertible for current accounttransactions, earning India Article VIII status with the IMF. Restrictions on imports of consumergoods and trade of agricultural commodities are still important obstacles to the full integration ofIndia into the world economy. However, during 1994-95, the government took additional measures toliberalize imports of consumer goods. Over the past few months, the government placed pulses, sugar,edible oil, butter oil and skimmed milk powder on the free import list.
Table 1.18: Tariff Structure, 1990-96(in percent)
------ Mean----- - -- Import Weighted Averag e-
1990-91 1992-93 1993-94 1994-95 1995-96 1990-91 1992-93 1993-94 1994-95 1995-96 No. of Itans
Whole 128(41) 94(34) 71(30) 55(25) 42(21) 87 64 47 33 27 5040Econorny
Agri. Products 106(48) 59(49) 39(39) 31(30) 26(21) 70 30 25 17 15 268
Mining na. na. 71 (24) 48(25) 37(18) n.a n.a 33 31 30 1W
ConsumerGoods 142(33) 92(42) 76(36) 59(33) 43(21) 164 144 33 48 39 1,347
Intennediates 133(42) 104(25) 77(22) 59(17) 45(15) 117 55 40 31 24 2,337
CapitalGoods 109(32) 86(26) 58(24) 42(20) 35(13) 97 76 50 38 30 988Note: Standard deviations are in parentheses. hi 1990-91 and 1992-93, mining is included in intermediates.
Source: Ministry of Finance and Bank Staff estimates.
The most recent Exim Policy (April 1, 1995) fuirther liberalized imports of consumer goods.The Special Import License (SIL) scheme, which enables importers of consumer goods to purchase theimport license from exporters to which it is granted as a proportion of their exports, has been increasedfrom 42 to 75. The new items include: computer systems, TV tubes, commercial refrigeration

-32-
equipment, battery and electrically-operated vehicles, refrigerated trucks, cash registers, and sewingmachines. Several consumer items were also removed from the Negative list onto the (OGL) freelyimportable list. Among them are personal computers, CD rom, diskettes, coffee, fish, paper and paperproducts, cameras, sports goods, and some baby products. The import duty on the liberalizedconsumer goods will be 50 percent. Prior to these measures, in December 1994, the Governmentreached agreements on Market Access in Textiles with the European Union and the United States,which import about two thirds of India's textile exports. The agreements inter alia involve the phasedliberalization of India's tariffs on certain items and a phased opening of India's market for importedtextile products. As a first step, textile and garments were placed on the list of items that can beimported with SILs. All these measures are welcome steps towards eliminating non-tariff barriers toconsumer goods imports. However, they clearly are very partial steps and a bolder approach toliberalizing consumer goods is warranted
The recent Exim Policy also took several steps to enhance export incentives. They includeextending the Export Promotion Capital Goods (EPCG) scheme. The scheme allows exporters toimport capital goods at a concessional tariff of 15 percent, subject to an export obligation of four timesthe c.i.f value of imports to be fulfilled within a period of five years from the date of issue of the importlicense. The extension allows duty-free imports of capital goods against export obligation in caseswhere the c.i.f value is over Rs 200 million (about $6 million). The export obligation is six times thec.i.f value of imports in eight years. Duty-free imports apply to second-hand machinery too if themninimum residual life is at least 10 years. Unlike earlier, this scheme is now extended on the sameconditions to both merchant exporters as well as the service sector. This will benefit particularly hotelsand tourism industry, enabling them to import goods such as air conditioning systems, buses, cars,special kitchen equipment and furniture. In addition, supplies to all EPCG license holders and projectsin the power, oil and gas sectors will be regarded as "deemed exports" (indirect exports). They will beeligible for a number of export benefits, including duty drawback. Duty-free importation of capitalgoods and extension of the EPCG scheme to the service sector also will strengthen the ongoinginvestment recovery. To further promote exports, the new Exim Policy also took the major decision tointroduce back-to-back inland letters of credit to enable an Advance License (AL) holder to obtain hisinput from domestic suppliers. In addition, AL holders can now claim MODVAT credit on imports.And a green channel facility will be provided to certain categories of exporters and importers for fastercustom clearance. Based on these policy improvements, the Ministry of Commerce expects a 20percent increase in exports in 1995-96 in current dollars, almost the same rate realized in the past twoyears.
India has developed a financial system which has been highly successful at mobilizing financialsavings. The financial savings rate is over 13 percent of GDP; financial instruments are well diversified;and measures of financial sector development (such as the ratio of M3 to GDP or the size of the stockmarket) are unusually high for a country with a per capita income of $290. However, India's financialsystem has been less successful at allocating capital efficiently. Until very recently, prudentialregulations were inadequate and made it difficult to assess the true quality of the banks' portfolios, orthe true level of banks' profits. In addition, returns to financial assets were highly regulated, entry andcompetition were highly restricted, banks had little autonomy on how to conduct their operations, andpublic banks dominated the banking system.

-33-
To address these problems, the Government formulated a program of reforms which has sixcomponents: (a) liberalizing financial policies; (b) re-invigorating competition in financial serviceindustries, (c) restoring health to banking institutions; (d) broadening the ownership of public sectorbanks; (e) developing an active domestic market for government securities; and (f) initiating reform ofthe rural credit system.
In liberalizingfinancialpolicies, the RBI's Credit Policy Statement of October 1994 removedthe minimum lending rate applicable to commercial bank advances exceeding Rs 200,000. This was amajor step in interest rate liberalization. Earlier steps included reducing the number of bank lendingrates; removing most restrictions on banks wishing to issue certificates of deposits; and liberalizinginterest rates on debentures and most public sector bonds (other than tax-free bonds). The keyremaining interest rate restriction is the ceiling on term deposits for maturities of 46 days and beyond.In timing the lifting of this ceiling, the authorities are conscious that the financial soundness of banksmust first improve.
The Statutory Liquidity Ratio (SLR) was reduced from 38.5 percent of incremental deposits in1991 to its present level of 25 percent. The authorities' target is to reach 25 percent on total depositsby March 1996. Similarly, the Cash Reserve Ratio (CRR) on incremental deposits was brought downfrom 25 percent in 1991 to its present level of 15 percent; deposits no longer earn interest. Thesemeasures are intended to increase the effectiveness and improve the flexibility of the CRR as a tool ofmonetary policy. But they also reduce preemption of bank assets.
To further improve competition, the authorities licensed ten new banks in 1994-95, includingthree foreign institutions. Earlier reforms had introduced greater competition through measures suchas allowing reputable Indian corporations to tap Euro-markets and opening India's capital markets(with the exception of government securities) to foreign investments. In addition, over the last twoyears, the RBI raised the loan size above which consortium lending is mandatory; liberalized selectivecredit controls applicable to sensitive agricultural commodities, allowed banks more leeway to decidelevels of collateral; and abolished limits on banks' purchases of bonds in public sector undertakings.
To restore health to banking institutions, new guidelines were issued in 1992 for incomerecognition, asset classification and provisioning requirements. They have been tightened progressivelysince then. The authorities also adopted capital adequacy standards of the Basle Accord to bringIndia's regulatory framework closer to international standards. To improve its capacity to enforcethese guidelines, the RBI created a Board of Financial Supervision which started functioning inDecember 1994. The medium-term strategy for strengthening and restructuring banks includesimproving loan recovery. Toward this end, the Recovery of Debts Due to Banks and FinancialInstitutions Act was passed in 1993. It establishes special tribunals for expediting adjudication and loanrecovery. Five tribunals started functioning in Calcutta, Delhi, Jaipur, Ahmedabad and Bangalore,along with an appellate tribunal in Bombay. In addition, the RBI started circulating to commercialbanks lists of large defaulters.
During 1994 the Government provided about $3.3 billion in recapitalization to the 19"nationalized" commercial banks directly owned by the Ministry of Finance as part of its strategy tostrengthen the banks and broaden the ownership base of public banks. All the nationalized banks have

-34-
developed annual Memoranda of Understanding with the RBI, committing themselves to performanceand development targets. Furthermore, legislative changes now permit partial privatization. Onenationalized bank made a successful equity issue in private markets in October 1994. Anothernationalized bank had done likewise in 1993. The remaining nationalized banks are planningsubstantial equity issues over the next three to four years.
The development of India's "money" markets, in particular the government-securities market,has been particularly strong over the past three years. One consequence is that the authorities arerapidly acquiring the means to manage monetary policy and public debt efficiently through open-market operations. Innovations of the late 1980s included: (a) introduction of new instruments, suchas certificates of deposit (CDs), commercial paper (CP), and a 182-day treasury bill sold on an auctionbasis ("dated securities"--long-term treasury bonds--had long existed); (b) development of the inter-bank market; and (c) important institutional changes, including the establishment of the DiscountFinance House of India to serve as a secondary market maker in public securities.
Since the early 1990s, the RBI has carried out institutional and market development of thegovernment-securities market, and this effort has been successful. In 1992-93, the government decidedhenceforth to auction all its issues of dated securities. The RBI has carried out regular auctions of billsand dated securities since then, and they have generally worked smoothly. Several large financialinstitutions and corporations have issued floating-rate bonds linked to the 364-day auction cut-off rate.This is a welcome development because the financial markets had never previously adopted anyreference rate, which prevented the development of floating-rate debt. In addition, in January 1994,the Treasury began issuing Five-Year zero-coupon bonds to manage better the Government's domesticdebt. Finally, in March 1995, the RBI issued guidelines for the creation and establishment of a systemof primary dealers in government securities. Together with the historic agreement (reached in 1994)between the Treasury and the RBI to phase out (over three years) the automatic monetization of thedeficit, these developments established the basis for market-determined interest rates on Governmentpaper, and for more flexible and independent implementation of monetary policy by the RBI.
While this progress is commendable, India has yet to embark on several other items on thereform agenda which constitute a wider vision of the financial sector. That vision could include a moredeveloped financial system that is very competitive in resource mobilization and allocation (thusreducing the use of directed credit), provides a broader range of products to households and thebusiness sector in rural and urban areas, and makes much better use of technology to deliver theseservices efficiently. That would mean, for instance, substantially upgrading India's payments systems tosupport the higher volumes of transactions that rapid economic growth is likely to generate. Inter-citypayments by draft or check are subject to substantial cost and delay. India needs to develop itselectronic funds-transfer capabilities. When used appropriately, such transactions are highly cost-efficient. They also can help to relieve the rapidly growing strain on check-processing facilities.
The rural financial system and institutions face particularly acute problems. Financialinstitutions specialized in rural operations, including financial cooperatives and rural regionalbanks (RRBs), have been severely weakened by excessive costs and regulation, and have deep-seatedproblems of asset quality and capital adequacy. Following the recommendations of the Government'sAgricultural Credit Review Committee in 1989, a consensus has emerged within India on the need to

-35-
move toward a more market-driven system of promoting rural credit delivery, restructuring the RBBs,and improving the capability of cooperative banks to function as intermediaries. Several importantmeasures already taken include: (a) lowering directed lending from 100 percent to 40 percent andgreater freedom to rationalize branches; and (b) deregulating interest rates of rural/agriculturalcooperative banks (subject to a minimum lending rate of 12 percent). Meanwhile, the RBI is to beginan ambitious program under which 49 RRBs will be selected for comprehensive restructuring,including recapitalization and managerial strengthening. Even if this program proves successful, theneeds of the rural financial system are far larger: RRBs account for less than 10 percent of the nation'srural credit operations. Changes should be made also in the role and function of the National Bank forRural Development (NABARD), cooperatives, and other financial institutions (including commercialbanks) with extensive rural activities.
Rix reformns have been seeking to transform India's tax system from one with high (and highlydifferentiated) tax rates falling on a narrow base, into one with tax rates at moderate levels falling on abroad base. In the 1994-95 Budget, taxes on corporate income were unified at 40 percent, from 45percent for widely held companies and 50 percent for others. A major reform of excises wasimplemented to make the system more closely resemble a value-added tax and address its majorproblems. Meanwhile, the Government extended the coverage of MODVAT (a modified value-addedtax) to include manufacturing sectors thus far excluded, and, for the first time, some services. Ofparticular importance also were the decisions to: (a) shift most excise rates from specific to ad-valoremto increase buoyancy; (b) reduce the number of rates; and (c) simplify the system by relying on invoicesfor value determination. These reforms considerably simplified and modernized India's tax system andmade it possible for the Central Government to focus its efforts on improving tax administration. The1995-96 Budget further reduced peak-rates of excises. It did not reduce corporate tax rates further butit continued the emphasis on simplification, lower rates and greater buoyancy. In particular, tostrengthen compliance, the authorities propose tax deduction at source for fees for professionals,technical services and service contracts, and interest income on time deposits. These efforts at taxreform need to be continued with forceful actions directed at improving markedly tax administrationand enforcement.
I'ublic enterprise (PE) reform has been one of the weakest elements in the reform process.Reforms have concentrated mainly in five areas. First, dereservation, delicensing and liberalization oftrade have fostered competition. Public enterprises operating in the tradable sector are now subject tointernal and external competition. State-owned banks are subject to competition from new privatedomestic and foreign banks, and among themselves. However, PE managers have not been given theauthority to introduce measures essential for restructuring such as large scale retrenchment, corporatereorganization, closure or selling of units, or joint ventures with private investors. Thus, with fewexceptions, the financial performance of PEs has failed to improve.
Second, to enable restructuring or liquidation of chronically loss making PEs, the SickIndustrial Companies Act was amended in December 1991 to bring these enterprises under the purviewof the Board of Individual and Financial Restructuring (BIFR). So far, the results have been less thansatisfactory. The main reason is that the BIFR process is biased against winding up and is very slow.About 140 PEs have been referred to BIFR. Winding up notices have been issued for three PEs, butso far none of these enterprises has been liquidated. Two of them are challenged in the high courts and

-36-
one awaits cabinet approval. BIFR can only order a wind up which then has to be implernented by therespective high courts after the state governments' clearances of winding up, retrenchment and sale ofland. Because of social and political implications for the state, the state governments do not grantclearances. Concerned parties can challenge the BIFR order in the high courts. As a quasi-judicialbody, however, BIFR cannot appear in court to argue its case. The Goswami Committee on IndustrialSickness and Corporate Restructuring made very useful recommendations in July 1993 to eliminate theprocedural hurdles and streamline the process. The reconmmendations include establishment of five fasttrack Winding-up Tribunals situated in Bombay, Calcutta, Madras, Delhi, and Bangalore to speed upthe closure process. The govemment has not yet acted on these proposals.
Third, a National Renewal Fund (NRF) was created in February 1992 to reduce excessemployment in the public sector and provide a safety net for workers affected in the restructuringprocess. NRF has two windows: (a) the National Renewal Grant Fund which finances the voluntaryretirement schemes (VRSs) for workers in PEs, and compensation of the affected workers in the closedor restructured public and private companies under BIFR; and (b) the Employment Generation Fund(EGF) for retraining and counseling for the affected workers. Implementation fell far short ofexpectations. So far only VRSs have been implemented. Programs regarding compensation ofemployees of BIFR companies and retraining of affected workers have not yet been made fullyeffective after over three years of operation of NRF. Regarding VRSs, the results have not been asgood as expected. So far, about 90,000 workers have been released in about 40 PEs under VRSswhich is far below the 263,000 target set in the business plan of NRF.
Fourth, budgetary support to PEs was to be reduced and PEs subjected to a hard budgetconstraint. Loans to PEs have declined from 0.7 percent of GDP in 1990-91 to 0.4 percent in 1992-93but jumped to 0.6 percent in 1993-94. In addition, in the 1994-95 Budget, loans to a number of sickPEs were significantly increased. Fifth, only disinvestment up to 49 percent of selected profit makingPEs has been allowed. Evidently, this leaves control in the hands of the public sector and helps toexplain why performance has not improved substantially.
Future PE reform strategy would need to concentrate in three main areas. First, a moreambitious privatization program for the viable units needs to be put in place. Various privatizationoptions could be considered depending on the nature of the sector and the enterprise, but the mainobjective should be to transfer the management to the private sector to enhance efficiency. Second, theunviable units need to be closed in a timely and orderly manner. As noted earlier, this requiresamendments in the related legislation to turn BUFR into an effective bankruptcy process. To alleviatethe social impact and defuse likely employee resistance, the safety net programs need to bestrengthened. NRF also needs to be fully operationalized. Third, to date the Government has alloweddisinvestment up to 49 percent of selected profit making enterprises. The Rangarajan Committee onthe Disinvestment of Shares in Public Sector Enterprises (April 1993) recommended inter aliaprivatization up to 74 percent of PEs in the sizable non-reserved sectors. As suggested earlier, theGovernment should consider acting on this recommendation not only because of efficiency gains butalso as a one-time down payment on debt.
Reforming the Agriculture Sector. While there have been a number of beneficial reforms in theagriculture sector in the last two to three years, the performance of the sector would benefit from the

-37-
removal of obstacles to domestic and international trade and agro-processing. These obstacles not onlylimit the potential gains of a better integration of India's regional markets, but also the gains stemmingfrom a better integration of India's agriculture with the rest of the world. Developments in 1994-95highlight some of the high costs of the existing restrictions. For example, a sizable share of the budgetexpenditure overrun on food subsidies in 1994-95 was related to the cost of maintaining the FoodCorporation of India's extremely high stocks of grain. This resulted from a combination of interrelatedfactors, including the public sector monopoly on grain storage and the government's price supportsystem. The cost could be significantly reduced if restrictions on private traders' storage activities,which change from time to time, were lifted and remained lifted long enough to attract viable privateinvestments. Similarly, the significant variations witnessed during 1994-95 in the domestic price ofsome imnportant food items such as sugar or oilseeds could have been mitigated by the development offuture commodities' markets in India (which are now restricted), and more extensive integration ofIndia's agricultural markets with world's markets.
A better integration of domestic regional markets, and a better integration of domestic andinternational markets, need not lead to short-term increases in the domestic prices of items consumedby the poor--and will likely lead to long-term increases in the consumption levels of the poor. First, inthe case of most items, domestic price levels are now relatively in line with their internationalequivalent. Second, even in cases where domestic prices are below their international equivalent, exporttaxes would be a much more efficient instrument than the current export restrictions which, despiteprogress in the recent past, remain on a large number of agricultural commodities. Conversely, in caseswhere domestic prices are higher than international ones, import tariffs would be preferable instrumentsto the import restrictions that still remain.
Broader concerns arise from the inappropriate composition of public expenditures in the sector.The share devoted to agricultural services and subsidies (fertilizer, electricity, irrigation and credit)grew from 37 percent of Central Government expenditures on economic services in 1985-86 to morethan 58 percent by 1992-93. Such agricultural subsidies are not fiscally sustainable, especially for stategovernments who are responsible for about 60 percent of public expenditures on agriculture. Oneresult is the inability of the public sector to contribute adequately to the needed gross capital formationin the sector. For instance, public sector gross domestic capital formation in agriculture declined from1.2 percent of GDP in 1981-82 to 0.6 percent in 1991-92.
Agricultural subsidies also are not conducive to the efficient and sustainable use of agriculturalinputs and scarce natural resources such as water. Fertilizer subsidies have caused significantinefficiencies by promoting unbalanced nutrient and geographical consunption patterns. Recentresearch shows that an improved balanced consumption of fertilizer alone would increase total rice andwheat production by about 20 mnillion tons. Irrigation subsidies, either from power tariffs in the case ofunderground exploitation or from low water charges and collection rates in the case of canal irrigation,contribute to the over-exploitation of scarce water resources, to waterlogging and salinity in conmmandareas, and to saline ingress in coastal areas. They result also in inadequate operation, maintenance andwater management of surface irrigation systems, and reduced average crop yields and croppingintensity. They also limit farmers' capacity to diversify into higher-valued crop enterprises.

-38-
The inappropriate mix of recurrent expenditures is reflected in the increasing share of resourcesdevoted towards establishment costs (salaries) at the expense of non-wage O&M in a number ofcrucial public services such as Irrigation Departments (Chapter 2). It is reflected in the under-fundingof expenditures with a demonstrated and strong effect on agricultural growth. For example, onaverage, other developing countries invest more than three times what India spends on agriculturalresearch as a share of its agricultural GDP. Policy and institutional reforms in the irrigation sector willbe particularly important if Indian agriculture is to achieve the much needed efficiency and sustainabilityimprovements in resources use (Chapter 2).
EXTERNAL FINANCING
Reflecting the remarkable improvement in India's extemal accounts in 1993-94, the lasteconomic report presented to the India Development Forum (IDF) indicated that no additional fast-disbursing assistance needs were foreseeable at the time. The assessment of this report is the same.However, although the economy's capacity to attract private foreign investments has improvedsubstantially, continued access to "quality" long-term assistance, including a substantial concessionalcomponent, remains critical. Last year, the bilateral and multilateral participants in the IDF respondedto this need with pledges totaling $6 billion. Although this was lower than the $7.4 billion pledged theyear before, the share of concessional commitments was 40 percent compared to 30 percent the yearbefore.
At the same time, the government has taken steps to speed up its utilization of bilateral andmultilateral assistance. They include: (a) advance release of funds to state governments; (b)disintermediation by the Center of loans to public enterprises, (c) adopting streamnlined procedures forawarding contracts and procurement; and (d) creating a central Project Management Unit in theDepartment of Economic Affairs, Ministry of Finance, for better portfolio management and projectimplementation. As a result, India's disbursement ratio moved up from 10 percent in 1992-93 to 12percent in 1993-94, with a further improvement to 19 percent during 1994-95.
A key concern of this report is that investment in the economy is still well below the levelsneeded for India to grow at rates comparable to the high performing Asian economies. The privatesector continues to show a strong interest in investing in a number of areas of infrastructure,particularly in power and telecommunications. However, the scope for private investment in some keyareas such as roads is very limited. Furthermore, necessary public investment in this and other strategicareas--including rural infrastructure, medium and major surface irrigation systems, and social services--have been minimal in recent years. Evidently, such investments are crucial for sustaining the economicrecovery and equipping the poor to participate in the growth process. The Bank, therefore, is of theview that support for these public investments, especially in the social sectors, should guide thedeployment of available assistance. In this context, the members of the IDF should aim once again for"high-quality" official development assistance; that is, funding for sustainable development whichdirectly supports priority public investments in physical infrastructure and human capital developmentor catalyzes complementary private investments. Such assistance should be timely. It should also bearterms which are competitive and suited to the financial retums expected from the investment.

-39-
- ] ~~SELECTED ISSUES IN STATE LEVEL REFORMS
INTRODUCTION
Attention to state level issues is a logical next step in the reform process in India. Thereasons are two-fold. First, financial and institutional weaknesses at the state level are becominga major constraint to the provision of infrastructure and social services. State governmentsaccount for 56 percent and 85 percent of the combined expenditures of the Center and states onsocial and econornic services respectively. Reflecting this large and vital role in the institutionaland financial framework of the country, they also account for about 53 percent of the totalexpenditure of the center and states combined.
Second, discrete changes in the policy regime by afew central ministries and departmentsalone (Finance, Commerce, Industry, Telecommunications) can no longer profoundly improve theenabling environment as occurred immediately after the 1991 crisis. Changing India's economicenvironment further, and ensuring that the liberalization of the economy leads to sustainedincreases in GDP and living standards of the population, will depend increasingly on sustainedreform efforts in several areas, including ones in which state governments play a central role.Among the key areas are: (a) irrigation and road transport, which constitutionally are theexclusive responsibility of state governments; and (b) power and education, which constitutionallyare responsibilities shared with the Central Govermment (Box 2.1).
This Chapter first discusses the recent fiscal performance of states. Specific financial andinstitutional constraints also operate in individual sectors. In some cases, institutional factors areequally or more significant. Accordingly, the Chapter also looks at each of the most importantinfrastructure sectors individually--power, roads and irrigation. (Primary education, a key socialservice, is the subject of Chapter 4).
FISCAL PERFORMANCE OF STATES
Indian states are diverse economic and social entities (Table 2.1). They receive about 60percent of their total revenue from tax receipts, within which about one-third is the states' share intaxes collected by the Central Government. Total revenue over the period 1986-94 varied from13.2 percent of GDP in 1986-87, to 12.6 percent in 1990-91 and 13.1 percent in 1993-94 (Table2.2). The single most important and growing source, accounting for around 40 percent of taxreceipts (or about one quarter of total revenue), is the state sales tax. Slightly more than half ofthe non-tax revenue of states (or close to 20 percent of total revenue) comprises grants from thecenter. Most years during 1986-94, these grants were equivalent to between 2.5 and 2.7 percentof GDP (Table 2.2).

-40-
The total expenditure of the statesdisplayed two clear trends during 1986-94. Box 21: Responsibilities and RevenuesFirst, recurrent expenditure, which in India are Divided Between thegenerally was four times as much as capital Center and the Statesexpenditure, rose almost steadily inrelation to GDP (from 13 percent to 13.9 The Constitution of India lays out the division ofpercent of GDP). It followed the trend set powers between the center and states in three detailedby interest payments, which rose from 1.5 lists called the Union List, the State List and theConcurrent List. Residual powers not speified ini anypercent of GDP in 1986-87, to 2.2 percent of these lists are vested in the center. Article 254 ofof GDP in 1993-94. Second, capital the Constitution further states that if any conflict wereexpenditure in total fell during most of the to aise between legislation: passed by a state and by
the Center, the central legislation would pTevail oversame period, from 3.2 percent of GDP to the state legislation.2.4 percent, and so did developmentexpenditure, by 0.6 percentage points of The Union List includes defense and defense
production, foreign relations. and foreign loans,railways, shipping and navigation, banking andinsurance, and scientific and technical training
What is emerging in state finances institutions. Among the responsibilities of state
is not a crisis of overspending. Unlike a governm are policing, local governent, publichealth: and sanitation, water supply, agriculture: and.number of other federal systems, state irrigation, and road transport. The Concurrent List
governments in India need the permission includes education, social: security, econoinic andof the Central Government to borrow. | j social planning, and the supply of electric power.
The Central Government also exercises Taxes assigned. to the Union List include customs .other direct and indirect controls on the diuties on external trade, excise duty on manufactues,level of state financing through the central sales tax on inter-state trade land consignment,
tax on capital assets and inheritance o*ter thanprevailing system of intergovernmental agricultural land, property taxation, personal income:transfers. What is evident, instead, is the tax (non-agricultural) and the corporate profitst tax.i On.absence of improvements in the own the State List are land revenue and agricultural inco=e
tax, state. sales tax: on trade within states, state exciserevenue efforts of states as a group. Also duty on alcoholic beverages, and taxes on motorevident is a crisis of expenditure vehicles.
composition. Growth-inducing andsocially productive investments are beingreduced while other items, particularly interest obligations, absorb a growing share of resources.Indeed, states as a group have been significantly slower (compared to the center) in meeting theirobligations for plan outlays under the Eighth Development Plan (Table 2.3).
It is unlikely that states will be able to sustain their current patterns of expenditure. Oneindicator is the rising ratio of interest to total state revenue. For instance, in Andhra Pradesh, itrose from 6.9 percent in 1985-86 to a budget estimate of 15.2 percent in 1994-95. The numberswere 7.4 to 13 percent for Maharashtra; 6.1 to 13.2 percent for Tamil Nadu, 8.3 to 22.4 percentfor Uttar Pradesh, 9.3 to 17.7 percent for Kerala; 13.2 to 16.4 percent for Rajasthan; and 12.5percent to 32.7 percent for the Punjab. In general, these trends reflect rising interest rates (Figure2.1) for a largely stable stock of total state debt to GDP. Evidently, as part of the effort toimprove public savings, states should seek to reduce their fiscal deficits through a concerted efforton the revenue front.

-41 -
Table 2.1: India - State Profiles 1991
State Population Urban Per-Capita Agiculture Female(million) (% of pop.) Incomei in State Literacy
_ (USS) GDP (%)b (%)India 846 26 330 32 39
Andhra Pradesh 67 27 308 42 33Assam 22 11 256 41 43Bihar 86 13 161 46 23Gujarat 41 34 351 30 49Haryana 16 2S 486 48 41Karnataka 45 31 329 39 44Kerala 29 26 257 36 86Madhya Pradesh 66 23 244 41 29Maharashtra 79 39 446 21 52
Orissa 32 13 213 51 35Punjab 20 30 544 51 50Rajasthan 44 23 245 53 20
Tamil Nadu 56 34 324 24 51
Uttar Pradesh 139 20 223 46 25West Bengal 68 27 294 36 47Otherse 35 84d 17 S 512 d - 27-73d
Low income economies 1,145 - 370 30 45
- Not available.
Notes:a. Per-capita income data is based on per-capita net stat domestic product at cunzen rupees and c4uvetkd
to USS by the average exchange rate.b. In 1988-89.c. 10 states and 7 union territories each with populations less than 10 miliond. Minimum and maximum.
e. Excluding China and India.
Source: RegistrarGeneral of India, Census 1991; C4nter for MororingthbelndinEcxwmy; sty of Finance,Economic Survev, various issues; Rcserve Bank of lndia &(P)znd Bank stAff estimas.

-42-
Table 2.2: State Government Finances, 1986-95(percent of GDP)
1986-87 1987-88 1988-89 1989-90 1990-91 1991-92 1992-93 1993-94 1994-95RE. :B.
Revomeereftip4s(A+B) 13.2 13:4 12.8 12.9 12.6 13.2 13.0 13.1 12.3
A. Tax rvenue 8.6 8.7 8.4 8.6 8.4 8.6 8.6 8.6 8.4: : Directax :: 0.6 0.6 0.6 0.7 0.6 0.6 0.6 0.6 0.61z4 iUtX i t 5.1 5.2 .5.1 5.0 5.1 5.2 5.1 5.1 5.1siatishaeincentraltaxes 2.9 2.9 2.7 2.9 2.7 2.8 2.9 2.8 2.7
B. Non-axn rvOnUe 4.6 4.8 4.5 4.3 4.2 4.6 4.4 4.6 3.9G: A tntsfrcenur : 2.5 2.7 2.5 2A4 2.5 2.6 2.5 2.7 2.2
Revenue Expenditure(A4+4C) 13.0 13.6 13.2 13.2 13.5. 14.0 13.7 13.9 13.6
A.1Delopmental 9.2 9.5 9.2 8.9 9.2 9.5 9.0 8.9 8.5| Social Servicca ;5.2 5.3 5.2 5.3 5.2 .5.1 4.9 5.0 4:9conof O Srvices 4.0 4.2 4.0 3.7 3.9 4.5 4.1 3.9 3.6
::pi.Agi.ndAUiSerdvies. 1.1 1.2 1.1 1.1 1.2 1.1 1.2 1.1 0.9Ruralllvclopi4nt 1.o 1.0 0.9 0.6 0.9 .9s 0.9 1.0 0.9-; t; : Irrigon : : ii i 00 : ; : a0.8 0.8 0.8 0.7 0.6 0.7 0.7 0.7 0.7
B. Non-Dkne1rntMal : 3.7 3.9 3.9 4.1 4.2 4.3 4.5 4.8 5.0itrotPsPaynm:ts: 1.5 1.6 1.6 1 7 1.7 Ls 2.0 2.2 2.2ToCenter 0.9 0.9 1.0 1.0 1.0 1.1 1.1 1.2 1.2ToOtkhers: 0.6 0.6 0.7 0.7 0.8 0.7 0.9 0.9 10
C. thr1EXpenditure 0.2 0.1 0.1 0.1 0.1 0.2 0.2 0.2 0.1
NtkCurrent Balance 0.2 -0.1 -0.4 -0.3 -0.8 -0.8 -0.7 -0.8 -1.3
Cipl expaidilre jA+B+Cl 3.2 3.0 2.5 2.6 2.5 2.2 2.2 2.4 2.3
A. Dwopment 2.1 1.9 1.7 1. 1.7 1.6 1.5 15: 1.5: Soni5aimvcca : j t: : ; -: :0.3 0.3 0.3 0.3 0.2 0.3 0.2 0.3 0.3
T:Econenmic Ktv1s X : V : : i: 1.7 1.6 1.4 1.4 1.4 1.3 1.2 1.2 :1.3
B. Non-developmental : : ; : :7 ; : : 0.1: : 00.1 0.1 0.1 0.1 0.0 0.0 o 0.0: 0. 0.1
VC.gi Lansan44dwai nes ("ne) 1.1 I.o 0.7 0.8 0.8 0.5 0.7 0.9 0,7
Gros Fiu wDefidt 3.0 3.1 2.9 .2.9 3.4 2.9 3.0 3.2 3.7
fiyknabv Inmrumon: ::Muket iAns . 0.5 05 : 0.6 0.6 0.5 0.5 0.5 0.5 0.5Lomsofi CntCeta 1.6 (t1.8): 1.7 1.7 1.8 . 1.5 1.2 13 1.0Sinl1Ssvings&ProvideagFunds. 0.4 0.5 0.5 0.5 0.6 0.5 0.5 0.5 0. 5Other;- ;: l; ;; 0 0 j T: i t:: :0i: 0 C t: : 0.6 0.4 0.5 0.4 0.7 0:.9 L6
MwnranmItem |
RevaeuwiEowmic Serviea 1.1 1.1 0.9 .1.0 0.8 0.8 0.9 . 08 0.rriaMty :FieUa1 fl B e Q-1.5 -1.6 -1. 3 -1.2 -1.6 -1.2 -1.0 -1.0 -15ToXlatDd !JcbtOutstand/GD 20.3 20.6 20.1 20.4 20.4 20.2 20.0 20.2-- Not awilable.Nome; BE440 i RE-reviwd aeaimaes.Sourci^ Gotnlt ofIria, 8u4et D lsvarious ius.

-43-
Table 2.3: Cumulative Progress in Resource Mobilizationfor Plan Outlays Under the Eighth
Five Year Plan
Target Actual1992-95 Actual/Target
(Rs billion at 1991-92 prices) (percent)
Mobilization by the Center' 667.4 609.0 91.3
Mobilization by the Statesa 386.5 109.3 28.3Non-Special Category States (15 )b 383.5 173.4 45.2Special Category States (10) c 3.0 -64.1 n.a.
Note: n.a. =not applicable.a Prorated based on targets for 1992-97.b. Refers to same 14 states in Tables 2.6 and 2.7 plus Goa.c. Negative sign means that these states not only did not meet their targets
but also received plan resources from the center beyond the center's original obligation.Source: Central Planning Cornmission.
Figure 2.1: NonInal Interest Rates on New Loans to States, and Inflation1984-1994
Apercent)
00 5Lk
<-r w l~~~~~~3.5.
800
Small Savings Loans to States
Central Loans (Excl. Small Savings) -
Average Annual Inflation (WPI) oo C-
Sources: RBI and CMIE.

-44-
THE SYSTEM OF INTERGOVERNMENTAL TRANSFERS
India has a complex system of intergovernmental transfers. It reflects the constitutionalassignment of responsibilities and revenues between the national and sub-national governments. Italso reflects the need to cater to vast differences among states in features such as population (ofIndia's 25 states, 13 have populations in excess of 20 million people, 6 in excess of 60 million, 3in excess of 80 million, and one with a population of 140 million), natural resources, economicand social performance, administrative capacity, and ethnic compositions (Table 2.1).
The system has three basic components, each with its own resource transfer mechanism.First, every five years the President appoints a Finance Commission, as mandated by theConstitution. This Commission makes recommendations for awarding transfers from the centerto the states in the form of shared taxes and grants. A major objective of the Finance Commissionis to create a better match (or a 'vertical balance') between the responsibilities assigned by theConstitution to the states and Central Government respectively, and the revenues generated ateach level to carry out these responsibilities. Finance Commissions seek to leave states with asurplus on recurrent account to assist in financing their capital expenditures. So far, ten suchCommissions have been constituted and have completed their work. Their recommendationsinvariably have been accepted by Parliament and implemented by the Government of India.Highlights of the recent Commission's report (December 1994) are presented later in Box 2.4.
Finance Commissions enjoy considerable respect as arbiters in fiscal conflicts between thestates and the center. Traditionally, Finance Commissions have interpreted their mandates asmaking grant awards for filling gaps between projected "current account" revenues andexpenditures of the states. The Ninth Finance Commission explored the use of indicators of fiscalcapacity which were invariant to the actual tax effort but only adopted this approach to awardsfor special category states. Transfers via the Finance Commission declined from 65 percentduring 1969-74 to 58 percent of total net transfers in 1992-93 (Table 2.4) because funds via theother major source increased much faster.
The second and quickly growing source is transfers authorized by the PlanningCommission, a body not required by the Constitution, which was set up soon after Independence.Its mandate was and still is rooted in India's pursuit of a centrally planned development strategy.Its major responsibilities include formulating national five-year development plans as well asannual plans. Transfers authorized by the Planning Commission (Plan Transfers) are of three maintypes: (a) untied transfers in aid of state plans; their overall size is determined by the center buttheir distribution among states is predetermined by a formula (Table 2.5); (b) tied (specificpurpose) transfers associated with externally-aided projects; and (c) tied (specific purpose)transfers associated with central plan and centrally sponsored development schemes, some ofwhich are fully centrally funded. Others may require matching allocations by the states.Examples of specific purpose transfers include the Integrated Rural Development Program, a loanprogram intended to provide the poor with productive assets, crop development programs; familyplanning and health services; and the Integrated Child Development Service. A growing share ofplan assistance for major states now takes the form of assistance for externally aided projects (thatis, additional central assistance).
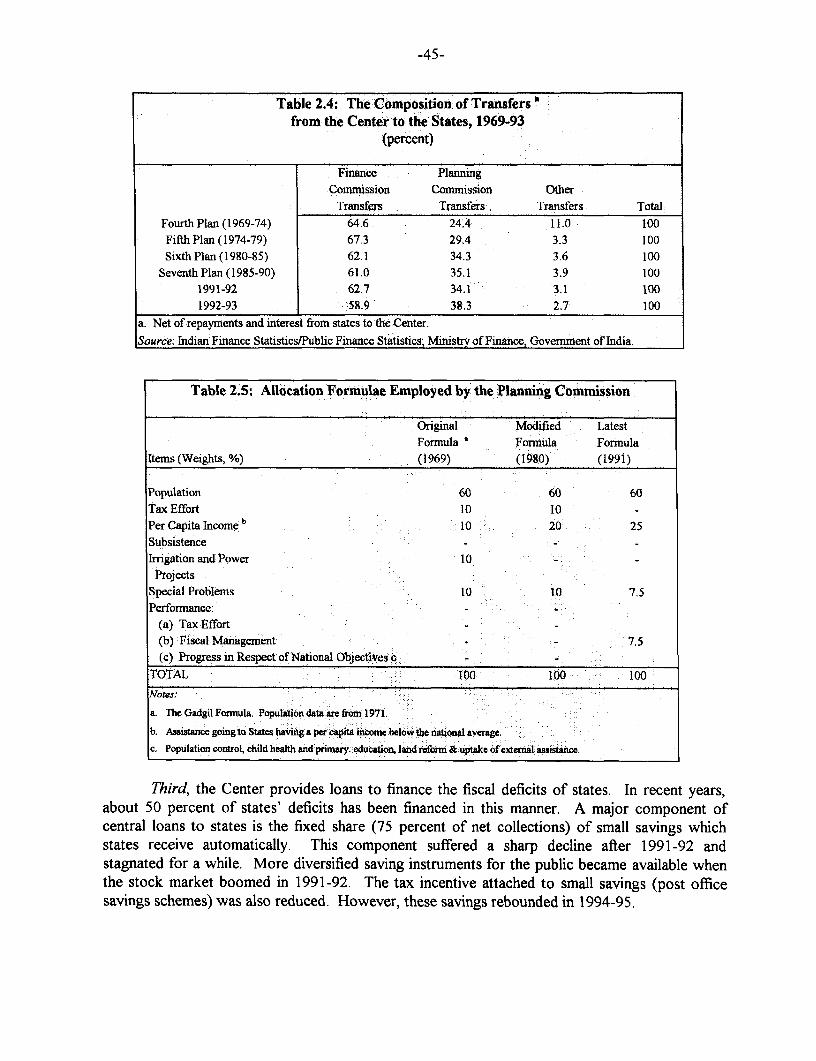
-45-
Table 2.4: The Composition of Transfers 'from the Center to the States, 1969-93
(percent)
Finance Planning
Comuission Commission OtherTransfers Transfers Transfers Total
FourthPlan (1969-74) 64.6 24A Il.0 100Fifth Plan (1974-79) 67.3 29.4 3.3 100SixthPlan(1980-85) 62.1 34.3 3.6 100
Seventh Plan (1985-90) 61.0 35.1 3.9 1001991-92 62.7 34.1 3.1 1001992-93 58.9 38.3 2.7 100
a. Net of repayments and interest from states to the Center.
Source: Indian Finance Statistics/Public Finance Statistics; Ministry of Finance, Govemrnent of India.
Table 2.5: Allocation Formulae Employed by the Planning Commission
Original Modified LatestFormula a Formula Fonnula
Items (Weights, %) (1969) (1980) (1991)
Population 60 60 60Tax Effort 10 10 -
Per Capita Income b 10 20 25
SubsistenceIrrigation and Power 10 - -
ProjectsSpecial Problems 10 10 7.5Performance:
(a) Tax Effort(b) Fiscal Management - 7.5
(c) Progress in Respect of National Objectives c - -
TOTAL 100 100 100
Notes:
a. The Gadgil Formula. Population data are from 1971.
b. Assistance going to States having o per capita income bejow the iioaal average.c. Population control, child health and primary, education, land reform & uptake of extemal assistance.
Third, the Center provides loans to finance the fiscal deficits of states. In recent years,about 50 percent of states' deficits has been financed in this manner. A major component ofcentral loans to states is the fixed share (75 percent of net collections) of small savings whichstates receive automatically. This component suffered a sharp decline after 1991-92 andstagnated for a while. More diversified saving instruments for the public became available whenthe stock market boomed in 1991-92. The tax incentive attached to small savings (post officesavings schemes) was also reduced. However, these savings rebounded in 1994-95.

-46-
The center also has direct or indirect control over the way in which the remainder of thesestate deficits is financed. State debt issues are not sold in an open capital market. To achieveSLR ratios set by the RBI, banks and insurance companies may hold such state bonds. Inaddition, state provident funds and PEs with savings are obliged to hold state debt issues.Reduction in the SLR in recent years has resulted in a small decline in center loans to states (Table2.2) and in a lower allotment of market borrowing automatically held by commercial banks.Under the Central Government's banking policy reforms, the average SLR will be reduced to 25percent of net demand and time deposits by early 1996.
Finance Commissions have been successful in prescribing relatively higher shares for thepoorer states to reduce inequities. The Constitution recognizes that such inequities could arisebecause of differences in states' respective tax bases and in their costs of providing publicservices. In Table 2.6, the efforts of the Finance Commission in reducing inequities is captured bythe negative rank correlation for 1992-93 between per-capita awards and per capita income. Butthe discretionary transfers authorized by the Planning Commission have neutralized partly theseefforts by the Finance Commission to reduce horizontal imbalances across states. That is, thericher and relatively more developed states have received more plan transfers per capita than thepoorer and less developed ones in spite of the inclusion of poverty-related criteria in thedistribution of plan assistance (especially in the Gadgil formula) (Table 2.5). The reason is thatmany poor states are unable to provide matching funds to co-finance central schemes andexternally-aided projects, or otherwise lack the capacity to absorb this funding.
Table 2.6: Transfers Relative to the Per Capita Ranking of Major States,1992-93
PeT-Capita Per-Capita Per-Capita FC Per-CapitaIncome State Revenue Transfers PC
Transfers8aPunjab 1 4 12 2Haryana 2 1 14 6Maharashtra 3 3 13 11Gujarat 4 2 10 7Karnataka 5 5 1I 5TamnilNadu 6 6 7 8WestBengal 7 11 8 12Andhra 8 : 8 9 10
PradeshKerala 9 :7 6 3Rajasthan 10 9 2 4Madhya 11 o10 5 13
PradeshUttar Pradesh 12 12 4 9Orissa 13 13 1 IBihar 14. 14 3 14Spearman's Rank 0.92 -0.93 0.23Correlation(with Per-Capita Incoe)_:
a. Includes externally aided projects.Source: Government of India, Budget Documents, various issues, and CSO.

-47-
The Current System May Be Discouraging Fiscal Discipline. The current system ofintergovernmental fiscal transfers presents other problems. First, the "gap filling" approach,adopted traditionally by Finance Commissions in determining grant awards, undermines fiscaldiscipline. This approach is not guided by the fiscal capacity of states. As a result, stategovernments use a number of strategies to increase their individual share of the transfers from theFinance Commission. One is to understate the projected growth rate of their own tax revenue.Since the projected rate is based on the past trend, some state governments attempt to show thatpast increases in revenue resulted from extraordinary and unsustainable efforts. States alsofrequently make commitments just prior to the appointment of the Commission. As the timing ofthe Commission's appointment is well known, state governments tend to incur liabilities in time toincrease the gap between their recurrent revenues and expenditures. Some of the tactics usedinclude advancing loans to cooperative institutions; public enterprises such as the State ElectricityBoards (SEBs) and the State Road Transportation Corporation; and local bodies. Often theseinstitutions are already in arrears on their payments of principal and interest to state governmentsbefore the additional loans are made. In response, Finance Commissions have been assuming thatloans and interest due to the state government (from these bodies), would be repaid during theaward period. Commissions thus have been adding these expected loan repayments to theprojected revenue or capital receipts. Some state governments have reacted by converting unpaidloans and interest into equity or grants before presenting their revenue and expenditure forecasts.
Table 2.7: Central Plan Loans as a Percentage Second, there is evidence at the aggregate
of Plan Capital Expenditure of States level that funding (including loans) for projects
1990-91 1992-93 approved by the Planning Commission is spent, atAndh& Pradesh 121.6 87.2 least in part, on recurrent expenditure items.Bihar 99.6 134.9 Table 2.7 shows the ratio of plan loans from theGuartat 81.9 6293 center to actual plan spending. Ratios in excess
Karnataka 61.6 74.3 of 100 percent are the strongest evidence thatKerala 111.2 161.6 some percentage of the funds for capital spendingMadhya Pradesh 83.6 50.5 is financing other expenditures. In the sample ofMaharashtra 65,7 63.2Orissa 103.1 62.9 major states in Table 2.7, this problem is mostPunjab 69.7 54.0 acute in West Bengal, Tamil Nadu, Kerala andRajasthan 90.5 63.2 Bihar. The situation is troubling because: (a) inTanmilNadu 219.7 255.9Utt Pradesh 118.7 95.4 effect, some states may be borrowing to financeWest Bengal 230.9 234.0 items such as salaries and consumables; (b)All States 108.8 87.0 growth-inducing investment expenditures areSource: Governaedn of India, Budget Documents,vaious issues. eroded; and (c) it may allow states to postpone
structural budgetary reforms which are necessaryto improve the quality and impact of their expenditures in general.
Third, in keeping with its regulations, the Planning Commission authorizes for funding, theoperating as well as the capital costs of new state programs for the first five years from theirinception. This funding, which typically is 30 percent grant and 70 percent loan, encouragesstates to initiate new programs even when additional own revenue cannot be mobilized to finance

-48-
them. The cumulative effect of this heavy subsidization of incremental programs has been tofoster employment and expenditure growth, and weaken fiscal performance.
Fourth, periodic Central Government loan forgiveness and refinancing, withoutconditionality, have created the expectation of future debt relief Such relief has underminedfinancial discipline as an incentive for creditworthiness.
Fifth, the loans and grants for capital and other expenditures authorized by the PlanningCommission are provided in fixed proportions irrespective of the nature of the activity to befinanced or the degree of interstate spillover. The prevailing system of recurring loans from thecenter to the states is driven by the fixed 70:30 ratio of loans to grants in all plan assistance tomajor states. But loan recovery is not always pursued by the states. In Orissa, for example,which has the highest ratio of debt to state domestic product, the bulk of plan expenditures are forenhancing social services from which no costs are recovered. Yet 70 percent of all central andexternal assistance for the state's plan consists of loans. Sixth, the system contains perverseincentives for the center. For example, the center has weak incentive to be effective in collectingnon-corporate and nonagricultural income taxes. The reason is the requirement for revenuesharing (85 percent in the case of income tax) with the states.
There are other problems with the current system of transfers. Under the Union system ofcreditable excise taxes (called MODVAT), the tax paid forms part of the sales tax base. In turn,the sales tax becomes part of the excise tax base in subsequent stages of production. Thiscascading effect has led to major efficiency losses. As an additional problem, most states haveadopted a sales tax design which permits the exporting of tax burdens from the more developedstates with large manufacturing sectors to the less developed states.
FISCAL REFORM INITIATIVES BY STATE GOVERNMENTS
Traditionally, many state governments have relied almost entirely on transfer-basedsolutions to their fiscal problems. Some states have taken a very opportunistic approach tomaximize transfers without addressing their fundamental fiscal problems. However, there isencouraging evidence that this may be changing.
The Reform Mentality Is Percolating To The States The initiatives taken have includedactions on revenue and expenditure. Examples follow with illustrative states cited in brackets.On the revenue front, the measures include: reforming sales tax and simplifying administration toenhance revenue (Kerala, Maharashtra, Rajasthan, Punjab and Uttar Pradesh); abolishing salestax exemptions as industrial incentives and preliminary steps toward harmonizing sales taxes(planned but not yet implemented in all states) (Box 2.2); privatizing octroi tax collections toensure revenue buoyancy (Maharashtra, Rajasthan and Punjab); reforming property taxation(Andhra Pradesh); establishing new luxury taxes and modifying existing state excises (Punjab,Maharashtra, and Rajasthan); establishing new regulatory and tariff structures to achieve costrecovery for electric power (in Orissa); partial cost recovery programs in health and education(Punjab and Tamil Nadu); enabling legislation to permit tolls on bridges, highways and overpassesdesigned to attract private sector participation in public infrastructure development (Rajasthan,

-49-
Box 2.2: Several States Partially Reform Sales TaxRates and Administration
One of the greatest challenges facing Indian states is the reform of their sales tax system. These tax systemstypically have narrow bases, complex rate structures, and inefficient administrations. Basic design features,standards of enforcement, and administrative regulations differ greatly from state to state. And interstate taxcompetition has led some authorities to grant multi-year sales tax exemptions in return for new investmentcommitmnents and to establish concessional rates on commodities with high price elasticities of demand. Suchstrategies have produced inequitable rate structures. Consequently, effective tax rates vary widely across statesand commodity groups, and much of the burden of states' sales taxes is routinely exported from high income,manufacturing states to low income states. The disharmony created by this patch work system of taxation isdepriving Indian producers and consumers of much of the potential benefit of the common economic space.
In the past year, state governments have taken a numnber of steps to harnonize their sales taxes and to explore apossible replacement of the current system with a scheme of harmonized state Value Added Taxes (VATs).Committees of state officials are exploring ways in which the current system might be harnonized through theadoption of a simplified and uniform commodity classification structure with agreed floor rates. Northern Indianstates have already announced an agreement to work for sales tax harmonization. Committees of state financeministers have also investigated the experiences of European and Asian countries with VAT and are consideringhow states might adopt a VAT in stages.
Some states have initiated other reforms. Rajasthan, Punjab and Maharashtra are among the states which haverecently compressed their sales tax rates to achieve simplification. They have lowered also the rates onintermediate inputs to reduce cascading. Fuirther, Maharashtra announced, in its 1994 budget, administrativereformns which permit taxpayers to make sales tax paymnents through banks. The objective is to speed upcollections and lessen the need for direct contact with the revenue authorities.
To simplify their administrations and to avoid costly disputes, some states, including both Kerala and Rajasthan,have permitted small producers and traders to opt out of the imposed assessment system based on a examinationof books of accounts or estimation of turnover by tax collectors. Under a new presumptive tax option, thetaxpayer will pay a comipound tax calculated on a base of historical payments over the last three years, withoutreference to future turnover. Compounding factors on the historic base will increase over time to keep pace withinflation. The taxpayer has no obligation to present books of account. While such a measure is attractive tosmall producers who fear harassment by tax officials, it does not come to terms with the administrativeweakness of state assessment and collection administrations. Moreover, the ceiling for participation has beenset too high in some states. As an alternative to this stopgap reforn, the authorities rnight investigate thefeasibility of implementing a well-designed presumptive tax such as the forfait system used in West Africa andFrance. Under this system, assessments and collections are the responsibility of separate tax administrationunits. Assessments are based on a number of objectively observable characteristics of the taxpayer's business.
Tamil Nadu, Punjab and Madhya Pradesh); attempts to increase public financing through smallsavings (Punjab); enhancing resources for irrigation by earmarking income from locally-administered subscription funds for irrigation maintenance (Tamil Nadu); and extensiveearmarking of taxes, perhaps to ensure income redistribution and improve taxpayer compliance(Maharashtra). This list is not a comprehensive one; but is indicative of the paths being pursued.
Selected Revenue Initiatives
Andhra Pradesh Overhauls Its Property Tax in Some Municipalities. Property taxes arean importance source of revenue for urban local bodies in India, and by extension, for the stategovernment. Accordingly, a number of states have been reviewing the structure of these taxes to

-50-
improve their buoyancy substantially. Several committees appointed by the Government of Indiahave also reviewed the system of property taxes and identified major defects. These reviews haveconcluded that there are too many large exemptions and that the classification of properties needsto be rationalized. But in recent years, revisions of this tax in many states have not been possiblebecause of political pressure or stay orders obtained from courts. However, Andhra Pradeshsuccessfully managed these difficulties and reformed the tax in medium-size towns.
Prior to 1989, property taxes in Andhra Pradesh could be levied by local bodies through aresolution. The basis of the tax was the annual rental value of lands and buildings, reflecting theactual rent received for the buildings. There was widespread under-reporting of rent in the caseof buildings not covered by the Rent Control Act. For owner-occupied buildings, the annualrental value was determined on the basis of the likely rent. Here, considerable discretion wasexercised. As a result, many anomalies developed and different rental values were determined forsimilar buildings in the same area. This arbitrariness in determining rental values led to muchresentment and many complaints.
In 1989, the state government amended the Andhra Pradesh Municipalities Act and theHyderabad Municipal Corporation Act to introduce a new, transparent basis for the tax. It seeksto reduce the discretion of municipal employees by simplifying the procedure of assessment. Forthe first time, the assessment of property tax was de-linked from the rent paid by the tenants ofbuildings covered by the Rent Control Act. Instead, the annual rental value is determined withreference to the location, type of construction, age, plinth area of the building and the purpose forwhich the building is used. Rules framed under the Andhra Pradesh Municipalities Act divide theentire municipal area into convenient territorial zones for the purpose of property tax assessment.Within each zone, attention is paid to factors such as: (a) the availability of civic amenities andlocation in relation to markets and shopping centers; (b) the type of building construction - and (c)the purpose for which the property is used.
Within the Indian context, the deliberative and consultative way in which the legislationwas implemented is instructive. After the state government finalized the rules under theMunicipal Act, the Municipal Boards conducted sample surveys of 20 percent of the buildings indifferent categories in all the zones and prepared a draft notification giving the proposed monthlyrental value. At that juncture, the district level advisory committees--comprising the DistrictMagistrate, Superintending Engineering (Public Health), and the Regional Director (MunicipalAdministration)--were engaged to examine these proposals and make recommendations. Afterconsidering these recommendations, the Municipalities issued notifications demarcating themunicipal areas into zones, and setting the rental value.
Subsequently, the Government received inputs from individuals and groups that had nothad the opportunity to make adequate representations to the Municipal Commissioners. Theseinputs were forwarded to and considered by the District Advisory Committees which madeadditional recommendations. The final notifications were then issued by the MunicipalCommissioners. The impact of the general property tax revisions was softened somewhat bylimiting the extension of the increase. For instance, the increases for buildings assessed after 1983

-51-
were not to exceed 75 percent. A limit of two hundred percent was set for properties assessedbefore 1983.
Andhra Pradesh has not overcome all of the opposition to reforming its property taxsystem. The changes adopted by medium-size towns have been resisted so far by the three largestcities in the state--Hyderabad, Vijayawada and Vishakhapatanam. Even where adopted, thereforms do not contain any provision for periodic revision of the rate or take into account the risein the property value and rents. Even with the reforms, the annual rental value is tied to thecurrent use and is not based on the potential use of the land. Evidently, this should be reviewedand provision made for periodic survey and revision of the rental value every three to five years.Despite these shortcomings, Andhra Pradesh has made a commendable start in reforming thisimportant tax. The collections from this tax have increased almost by 50 percent.
Some States Are Reforming Octroi Collection But Few Want To Abolish This WidelyCriticized Tax. Nine Indian states continue to levy an indirect tax, known as octroi, on behalf oftheir municipalities. The base for octroi is the value, weight, or number of items entering a localjurisdiction (usually a municipality) for consumption, sale, or use in production. In India, the rateof octroi tax is usually defined in specific terms, rather than by value or weight, leading to amultiplicity of rates, arbitrary classification, and long transport delays as goods are assessed at citygates. Many government commissions have studied the tax and, almost universally, haverecommended its abolition. However, octroi has continued to exist because many states believeits abolition would worsen the fiscal imbalances of municipalities and because increased relianceon property taxation is not seen as a viable alternative.
Several jurisdictions are reforming octroi collection to improve its buoyancy. Thecollection of octroi traditionally has been associated with rent-seeking behavior by collectionofficials. Consequently, revenue collections in many states have fallen far short of what should becollected given the estimated base.
To overcome this problem, the government of Maharashtra permitted, but did not require,municipal bodies to auction contracts to the private sector to collect octroi. Successful privatebidders under the new system agree to provide municipal bodies with a guaranteed revenuestream. In return, they are given the right to retain tax receipts above this guaranteed revenuestream. Government estimates show that, for the 23 municipal councils in Maharashtra whichprivatized octroi collections, the total winning auction bids were at least 24 percent higher thanthe amounts collected in the three years prior to privatization.
Despite the potential for impressive revenue improvements, this reform should be seen asa palliative measure. It does not come to terms with the fundamental weaknesses of the octroi.These include the negative impact on trade and distortion of relative production prices. The taxalso distorts decisions about the location of industries. For instance, establishments within theboundaries of large urban entrepots, such as Bombay, often are exempt from paying octroi ontheir finished exports. This and other factors contribute to pollution and traffic congestion inthese urban areas. Furthermore, private collectors may be tempted to harass firms in competitionwith the tax farmers' other business interests and to use proprietary information of taxpayers to
-52-
obtain an unfair advantage. Recent successful bidders in octroi auctions in India have includedliquor wholesalers and general transport companies--enterprises that have a potential conflict ofinterest. In order to restrict potential abuses, state governments will need to monitor theperformance of private collection agencies.
Uttar Pradesh abolished octroi in 1990 in all of its 228 municipal boards and eightmunicipal corporations. (It had abolished octroi in towns in 1979). The state governmentcompensated these jurisdictions by providing grants based on their respective octroi proceeds in1988-89. The grants are increased by 10 percent each year in nominal terms. To finance the lossfrom octroi, the rate of additional sales tax (the Trade tax) was raised from 10 to 25 percent. Atpresent, this trade tax covers fully the loss of revenue from the abolition of the octroi.
Selected Expenditure Initiatives
On the expenditure side, reforms have been initiated in areas such as the restructuring ofPEs through privatization (partial and complete), closure and reorganization (with Kerala havingthe most formally articulated strategy and Uttar Pradesh making the most progress onimplementation); state level "renewal funds" to facilitate privatization and closures (in Punjab andRajasthan); strong zero-based budgeting or other mechanisms for expenditure program review (inKerala, Tamil Nadu and Maharashtra); formal policy statements on reform of SEBs includingprovision for private participation in power generation (in Punjab, Rajasthan and Maharashtra); astrategy of maintaining capital expenditures on infrastructure at high levels relative to overallexpenditures (in Rajasthan and Maharashtra); and measures to compress operating costs withoutneglecting vital expenditures such as maintenance and medical supplies (Punjab, Tamil Nadu andKerala). Some states and their major cities also have turned to the private sector to providepublic services more cost-effectively (Box 2.3). Others are taking additional steps to exercisebetter control over the disbursement of their limited financial resources.
Kerala And Uttar Pradesh Pursue PE Reform Differently. The Governments of Keralaand Uttar Pradesh have adopted different approaches to the reform of PEs. Kerala controls 85PEs, which is more than any other state. Its strategy for PE reform stands out for the formalnature of its strategic planning and its commitment to micro-level diagnosis of the problems ofeach enterprise. Starting in 1991, the Government of Kerala announced an industrial policy withstrong support for the rehabilitation of weak industries and PEs restructuring. The review ofthese enterprises has been carried out by a semi-autonomous Public Sector Restructuring Board(PSRA), which has worked closely with outside management consultants, merchant bankers andother experts. The PSRA Board is attempting to use objective criteria, based on pastperformance and market prospects, to classify PEs into three categories: candidates to be shutdown, PEs to be restructured as public sector activities, and candidates for complete or partial

8 tK a it 4*
I a
OQ ~ ~ ~ ~ ~ ~ i
S , i,IP0-
I~~~~~~~~~~~~~~~~~~~~~~~~~~~I . .. ~~~~~~~~~~~~~~~~~~~~~~~~~~~~~~- _.
arq
~~~~~~~~. ~ ~ ~ ~ ~ ~ B
.. - ' : t.'~~~P
-- ~~~~ - 4 -

-54-
privatization. The Board has consulted widely and sought the support of the representatives ofaffected PE employees. Based on these evaluations and consultations with national developmentagencies, the PSRA Board has designed restructuring plans for about a dozen large PEs Someindications of improved performance in the public sector have been recorded as a result of the1991 policy reforms: the number of profit-making units rose from 16 in 1991 to 31 in 1993.
However, in Kerala the cost of restructuring and reestablishing PEs as profitable units islarge and funds for the exercise would probably have to be borrowed on commercial terms. Thissuggests the need for careful cost-benefit assessment on a case-by-case basis to ascertain whetherrehabilitation is warranted.
In Uttar Pradesh, the state government stated that except for units which are sociallybeneficial, all PEs would be privatized in a phased manner. Of the roughly 50 enterprises ownedby the state government, about 13 have been shut down to date. These undertakings wereengaged in such diverse activities as operating rural cinemas, marketing horticultural products,and forestry. The state also controls 24 spinning mills for which it has sought buyers. Since littleinterest has been shown in outright purchase of these enterprises, a few units have been leasedwith the stipulation that management does not retrench the work force. The state governmentalso owns many loss-making sugar mills. It has attempted to privatize them by entering intomemoranda of understanding with successful bidders. This privatization has led to a legalchallenge by state sugar employees. While the subsequent court ruling has upheld, in principle,the right of the state government to discontinue operations of commercial enterprises, it has alsoheld that information presented by the state to the New Delhi-based BIFR, which approvesprivatization, was not complete and accurate. Therefore, the court voided the sales. Thischallenge and similar challenges in other states have led to costly delays in restructuring and mayhave discouraged potential purchasers of state PEs across India.
Uttar Pradesh's experience indicates that a state should have a coherent plan for choosingenterprises to be privatized, adopt procedures for valuation of assets consistent with previouscourt rulings, and adopt transparent procedures for finding credible buyers. While agreement forprivatization with prospective purchasers in Uttar Pradesh contained provisions to protect theinterests of employees, such provisions have often not been widely publicized nor haveemployees' representatives been consulted in the privatization process. By contrast, Keralaappears to have achieved some co-operation from its PE unions as a result of extensiveconsultation.
Some States Are Taking Additional Steps To Better Manage Limited Funds. The attemptsby states to contain non-Plan expenditures include: (a) banning recruitment and the purchase ofvehicles; (b) restricting expenditure on travel, (c) more closely managing the release of funds forsanctioned schemes; (d) and transferring funds to Public Ledger Accounts.
Andhra Pradesh, for example, passed legislation to prevent government officers, andboards of corporations and universities from employing additional workers. It is the firstlegislation of its kind in India. So far, it has not been enacted by another state or the center. The
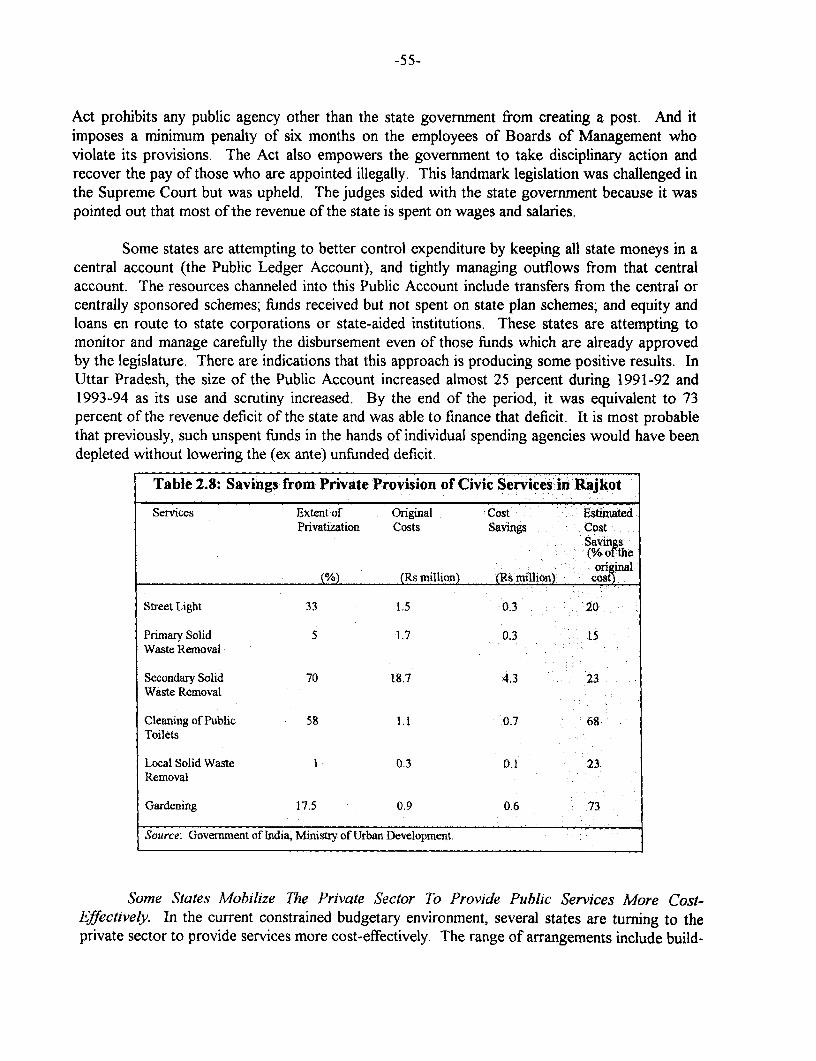
-55-
Act prohibits any public agency other than the state government from creating a post. And itimposes a minimum penalty of six months on the employees of Boards of Management whoviolate its provisions. The Act also empowers the govermnent to take disciplinary action andrecover the pay of those who are appointed illegally. This landmark legislation was challenged inthe Supreme Court but was upheld. The judges sided with the state government because it waspointed out that most of the revenue of the state is spent on wages and salaries.
Some states are attempting to better control expenditure by keeping all state moneys in acentral account (the Public Ledger Account), and tightly managing outflows from that centralaccount. The resources channeled into this Public Account include transfers from the central orcentrally sponsored schemes; finds received but not spent on state plan schemes; and equity andloans en route to state corporations or state-aided institutions. These states are attempting tomonitor and manage carefully the disbursement even of those funds which are already approvedby the legislature. There are indications that this approach is producing some positive results. InUttar Pradesh, the size of the Public Account increased almost 25 percent during 1991-92 and1993-94 as its use and scrutiny increased. By the end of the period, it was equivalent to 73percent of the revenue deficit of the state and was able to finance that deficit. It is most probablethat previously, such unspent funds in the hands of individual spending agencies would have beendepleted without lowering the (ex ante) unfunded deficit.
Table 2.8: Savings from Private Provision of Civic Services in Rajkot
Services Extent of Original Cost EstimatedPrivatization Costs Savings Cost
Saving(% of th
onBginal(%) (Rs million) (Rs million) cost)
Street Light 33 1.5 0.3 20
Primary Solid 5 1.7 0.3 15Waste Removal
Secondary Solid 70 18.7 4.3 23Waste Removal
Cleaning of Public 58 1.1 0.7 68Toilets
Local Solid Waste 1 0.3 0.1 23Removal
Gardening 17.5 0.9 0.6 73
Source: Govemment of India, Ministry of Urban Development.
Some States Mobilize The Private Sector To Provide Public Services More Cost-Effectively. In the current constrained budgetary environment, several states are turning to theprivate sector to provide services more cost-effectively. The range of arrangements include build-

-56-
operate-transfer (BOT); franchises; provision of services through voluntary organizations,community organizations and common interest groups. On example is the City and IndustrialCorporation of Maharashtra which is responsible for planning and developing New Bombay. TheCorporation involves private contractors in the maintenance of infrastructure and services such asroads, drainage, water supply, sewerage, street lighting and landscaping. In Rajkot, anotherexample, the Municipal Corporation has started using private contractors for services such asmaintaining street lights, removing solid waste, cleaning public toilets and providingtransportation. Table 2.8 presents data on Rajkot which show the savings that these newarrangements are producing.
It is too early to attempt to assess the overall impact of these initiatives in revenue andexpenditures on the fiscal performance of individual states, or all states combined. Severalobservations could be made, however. Some states have found ways to begin to address somepolitically sensitive but important fiscal reforms. Examples include strengthening property taxes(Andhra Pradesh); more efficient provision of civic services (several states); and public enterprisereform (Uttar Pradesh). It is especially welcome that so many of the initiatives address therevenue side of the budget. Often in the past, most of the burden of adjustment has fallendisproportionately and almost entirely on expenditures.
The foregoing discussion further suggests that the Indian system of intergovernmentalfiscal relations, in its present form, may not embody institutional structures or incentives capableof reversing or arresting the crisis in state finances. While some states have recently takeninitiatives on their own to overcome their problems, the fiscal impact of measures adopted to datehas been inadequate relative to the size of the needed fiscal adjustment. A much broader anduniform reform effort within and among states is desirable. Issues such as the unsustainableindebtedness of states, insufficient cost recovery, inadequate provisions for non-wage operationsand maintenance, all remain to be addressed in most states.
Many observers agree that the economic and political balance between the center and thestates is shifting in the direction of greater autonomy for the states. This development hasincreased the scope for more fragmentary implementation of national policies involving stateparticipation. In such an environment, the federalVstate dialogue on fundamental reform ofintergovernmental fiscal relations could be particularly protracted, unless the crisis in statefinances deepens substantially over the short term. Nevertheless, the possibility for dramaticstrides in federaLstate dialogue on reform should not be completely discounted. The example ofthe recent agreement on state sales tax harmonization is instructive (Box 2.2). In this case, aconsensus agreement on floor sales tax rates and abolition of sales exemptions as industrialincentives was reached. This occurred after open dialogue between the center and the states thatfocused on a limited set of reforms which promise unambiguous net gains.
What is needed inter alia is a system free of the perverse incentives discussed above. Oneof the encouraging signs of an emerging constituency for reforming intergovernmental fiscalrelations is the recent report submitted by the Tenth Finance Commission (TFC). The TFC hasproposed a number of innovative and bold measures (Box 2.4). The recommended move towardsa mandated system of sharing the total tax revenue collected by the center (the proposed ratio is

-57-
Box: 2.4: The Tenth Finance Commission Urges Fundamental Changes in theSystem of Intergovernmental Transfers
Main Conclusion
The current system of intergovernmental transfers gives both central and state authorities fiscal signalswhich misdirect revenue generation efforts and expenditure allocations. For instance, many states havedevoted inadequate attention to such non-plan expenditures as maintenance, education and health, whichare vital inputs into the growth process. States are under-funding these activities because of their desire toprotect large plan outlays which are eligible for financing through loans and grants from the PlanningCommission. Another example is the tendency to use borrowings to finance revenue expenditures. Onereason is that the system "clubs revenue and capital components in one category designated as planoutlay" without adequate monitoring of end use.
Main Recommendations
* New incentive schemes should support states in taking responsibility for generating current accountsurpluses and reducing indebtedness, without looking to the Center for extraordinary relief or "gapfilling" solutions. Transfer policies not consistent with this objective should be abolished or phased out.Specifically:
* establish an alternative tax devolution scheme. Under this alternative system, the revenue from all mnajorcentral taxes would be grouped into a single pool and 29 percent of this total would be devolved to states.The 29 percent share is equivalent to the share of the states in total Central tax revenues during 1993-94.The Conmmission proposed that the ratio be reviewed after 15 years. The proposed new devolution rulewould be expected to increase the buoyancy of state revenues generated by shared taxes, and wouldprovide the Center with a strong incentive to improve the administration of the income tax system;
* for the next fiscal year (1995-96), inctease from 45 to 47.5 percent the devolved share of MODVAT excisetax revenue going to states and reduce the devolved share of income tax from 85 to 77.5 percent;
* in determining how funds from the devolved pool should be allocated among the states, adopt new criteria:(a) 20 percent on the basis of population; (b) 60 percent on distance of per capita income from the highestincome major state; (c) 5 percent on the basis of infrastructure; (d) 5 percent on the basis of the area ofstates subject to certain normative limits; and (e) 10 percent on the basis of tax effort defined as the ratioof per capita own tax revenue to the square of per capita income. This formula differs from the presentone by reducing (for income taxes) the weight of population; increasing the weight given to "distance" ofper capita income; introducing a weight for infrastructure; and removing the "gap filling" weight;-
* create two new incentive schemes for debt relief of principal owed to the Center. Under the first scheme,write-offs of existing debt to the Center will be offered to states. The amount will be a proportion of theimprovements in the state's actual ratio of total revenue receipts to total revenue expenditures over thepreceding three years. Under the second schemne, the Center will match the amounts, fram the proceeds ofprivatizing state public enterprises, which are used to retire state debts;
* ptovide limited debt relief for specific states with the weakest financial positions and award special"upgradation grants" totaling Rs. 26 billion, including Rs 7.6 billion for girls and all primary education;and create a new category of prants for local bodies totaling Rs. 53.8 billion in the area of civic amenities.Also improve facilities for health facilities, elementary education and drinking water in recognition ofrecent constitutional amendments which have provided more autonomy for local governments; and
* set up a pennanent Finance Commission division within the Ministry of Finance to monitor and evaluatethe utilization of upgraded grant awards and other Finance Commission recommendations.

-58-
71:29 between the center and the states), would contribute towards strengthening incentives forenhanced tax collection by state governments and the center. The recommendation that centraldebt forgiveness should be tied to states' own initiatives to retire their debt is a positive step in thedirection of enhancing incentives for responsible fiscal behavior.
Reform of the Planning Commission could enhance the states' capacity to provide orsupplement the provision of infrastructure effectively and efficiently. Effort should be madeespecially to ensure that borrowed resources are utilized only for such expenditures that yield areturn adequate to meet the cost of borrowing. Options for rationalizing central plan transferscould include: (a) doing away with the fixed (70 percent for major states) loan component ofcentral assistance to state plans, and replacing this with specific purpose loans advanced by anational development bank, with generous provision of technical assistance, particularly for stateswith weak implementation capacity; and (b) replacing the current system of thinly spread centralresources across a multitude of central schemes (covering all states and monitored by differentcentral ministries), with a more compact set of well targeted redistributive transfers focused onthe needy states and monitored by the Planning Commission.
BROADER FISCAL REFORMS
Broader Efforts Are Needed. It is unclear whether the current system ofintergovernmental transfers, even with the changes recommended by the TFC, and reform of thePlanning Commission, would be enough to secure broad-based reforms in public finances at thestate level. The Government might wish also to consider mobilizing resources--domestically andabroad--for a package of policy and performance-based support to selected states. Improvedeconomic performance by participating states relative to non-participants probably wouldgenerate a strong demonstration effect and encourage more states to pursue reforms (Box 2.5).
Box 2.5: Argentina Pursues Broader Fiscal Reforms
Efforts by the Argentine Government to encourage reforms in its provinces may be instructive. Argeniina!sprovinces account for about 50 percent of general government expenditures. By the early 1 990s, the size andgrowth of Federal transfers had reduced the pressures on these provinces to exercise fiscal discipline. Greaterattention also needed to be paid to providing and maintaining public infrastructure.. In August 1993, theiFederal Government and all 22 provinces signed an open-ended offer (the "Pacto Fiscal") to any provincewishing to paticipate in a program of provincial structural adjustment.
Reflecting the. most pressing constraints, the terms of the agreement included: (a) reform of provincial. tax:policy and administration; (b) privatization and civil service reform by provinces; (c) refinancing of provincialdebts by the Federal Government as well as assumption of financing, for the Provincial Security System; and (d)the adoption of a new budgetary system. The Federal Government funded, this policy package, partly fromexternal sources. Additional commitments made by the Government included maintaining sustainablemacroeconomic policy and providing additional federal discretionary transfers only to those states which hadreform programs consistent with the "Pacto Fiscal."

-59-
TOWARDS MARKET-BASED DISCIPLINEFOR STATE BORROWING
Market-Based State Borrowing Needs To Be A Long-Term Objective. At present, theprecarious condition of state finances indicates that the first priority should be to improve revenueperformance and expenditure allocation. In the long run, however, an explicit objective of thesystem of intergovernmental transfers could be to encourage market-based fiscal discipline.Beyond seeking to improve their own revenue collections, cost recovery for economic servicesand expenditure efficiency, Indian states in the foreseeable future will have few other alternativesbut to achieve better access to the domestic capital market (they are constitutionally barred fromborrowing abroad). To access the domestic primary market, they will have to achieve substantialand sustained improvements in their finances.
Market-Based Discipline Usually Works When Four Known Conditions Prevail.International experience suggests that for market discipline to encourage better fiscalperformance:
- States must want to maintain or establish creditworthiness in order to obtain funding onterms which are better suited--in maturity and interest rate-structure--to their investmentpriorities. They should not be guaranteed access to the market funds which are set asideas statutory reserves or to pension funds controlled by the government. One corollary isthat the capital markets should be free to respond to the demand for loanable funds andthe circumstances of the borrower.
Adequate information on the borrower's creditworthiness, such as the stock of debt owedby government and government-controlled PEs, should be available to would-be lenders.This implies that rating agencies and potential lenders can identify off-budget liabilities andstate loan guarantees. With imperfect information, a default or weak performance by onesub-national government may signal impending risk of default by other states in the samecategory.
There should be a credible, no-bailout commitment for sub-national governments. If thiscondition cannot be met, then the commitment should state that the bailout will only bepartial. The expectation of a complete bailout in the case of default lowers the incentiveof lenders to monitor creditors.
The borrowing government must respond to market signals such as widening interest ratespreads for their bonds or the threat that their credit rating would be downgraded--byreducing their fiscal imbalances.
Most of the evidence on market discipline and fiscal issues relates to the experience ofjurisdictions in the United States and Canadian provinces. Market discipline is judged to haveworked relatively well in Canada in the absence of binding restrictions on provincial deficitfinancing. There are noticeable spreads among provinces in bond yields which appear to be

-60-
correlated with relative fiscal performances. In addition, the need to preserve the provinces creditrating is frequently given by provincial authorities as a rationale for fiscal austerity. A recenteconometric evaluation of the evidence from markets for US state debt suggests that the marketdoes impose a default premia which increases in a nonlinear fashion with increased borrowing.Specifically, the econometric evidence shows that the debt to state GDP ratio is a significantexplanatory variable determnining the state-specific risk premium for state government bonds.
At present, the degree of creditworthiness of Indian states--as indicated by measures suchas their primary deficits and the ratio of debt service to recurrent revenue--appears to be low.Most market loans to states (or their PEs) from the domestic capital market have an implicitguarantee by the Government of India because they finance the annual public sector investmentexpenditure sanctioned by the federal Planning Commission. These debt issues are not rated. It isprobable that most non-guaranteed state securities would not be viewed by the market as high-yieldingbonds if they were issued outside the SLR umbrella.
Nonetheless, the recent evolution of the Indian capital market indicates that it couldbecome an important source of local currency financing for states. The Indian capital market forfixed income assets is evolving rapidly and is lengthening. Securities with seven years maturityare feasible although investors appear to prefer three to four year maturities. Transaction costsremain high and competitive behavior is not strong, but recent and contemplated financial sectorreforms could bring about the needed improvements.
No state is likely to enjoy capital market access comparable to that of prime grade Indiancompanies. And there are very few cases of successful issues of state bonds without aGovernment of India guarantee. Recently, Rajasthan obtained a market rating for the state inorder to place a bond issue for a canal and irrigation project which was not self-financing. Inearly 1994, an issue of Sardar Sarovar Nigar bonds with a de facto guarantee from the State ofGujarat was oversubscribed by a wide margin. The prevailing view in the Indian financialcommunity is that only states like Maharashtra, Gujarat and potentially a few more could aspire toaccess the primary market for limited amounts, provided an appropriate premium is offered overprimary securities.
The sharp reduction in SLRs will reduce the access of the financially weak states tomarket borrowings. The RBI in its 1992-93 Annual Report broached a proposal that a StateFunding Corporation be established to raise funds at market-related interest rates and advancethem to states at subsidized rates. However, this proposal does not give the states an incentive toachieve creditworthiness. And it could create an open-ended drain on Central Governmentresources. One approach, which holds greater promise of resolving the fundamental fiscalproblems, is to require the more developed states to place their bonds in a competitive market forstate debt issues with independent bond rating of the individual state. As discussed earlier, theTFC has proposed some incentives for debt retirement by states. An agency with centralsponsorship, perhaps similar in design to the Australian Loan Council (Box 2.6), might be neededto intermediate the terms and supply of marketable debt to the non-creditworthy state. In returnfor the services provided to non-creditworthy states, the Council might insist on some degree of

-61-
Box 2.6: Australia Develops and Refines an Approach to Managing State DebtThrough More Market-Based Discipline
The Australian Loan Council was conceived at a time when Australia did not have a fully developed financial market forlong-term debt. In addition, the finances of the federation were characterized by large imbalances between the revenueand expenditures of the federal government and the states.
The Council was formed in 1923 to co-ordinate the borrowing of both the states and the Commonwealth (federalgovernment) on a voluntary basis. The Council comprises one representative of the Commonwealth: the Prime Ministeror his nominee; and one representative of each state, the state premier or his nominee. As a result of large debts incurredin the First World War, both levels of government faced the problem of high interest service expenses and high debtburdens. Moreover, due to the thinness of the domestic debt market and initial difficulty in placing debt issues overseas,the states and the Commonwealth engaged in a bidding competition on issue prices, interest rates and tax concessions tobond holders. Coordination appeared as a logical solution to what was perceived as a negative sum game. A subsequentagreement in 1927 formalized the rules of the institution and committed the members to a policy of joint decision-makingresponsibility.
Under the 1927 agreement: (a) the Commonwealth took over all existing state debt; (b) all future borrowing of bothlevels of government were to be arranged by the Commonwealth subject to the Councils approval; (c) the states wererequired to compensate the Commonwealth for interest and sinking fund payments on their debt; (d) the states wererequired to make annual payments to a sinking fund on their debt which was a small, fixed proportion of the debtoutstanding; (e) the Council exerted no control over the uses to which the loans were put; (0 all states were chargedinterest at the same rate; and (g) the Commonwealth was given the power to enforce payments by states. When one stateattempted to default during the 1 930s, the courts upheld the right of the Commonwealth to withhold transfers from thatstate as a means of securing interest repayment.
Loan allocations during the first phase of the Council's life were based, not on a rigorous assessment of needs but on thesize of past loan issues. As this system matured after the Second World War, many deficiencies become apparent.Individual state fiscal performance was not evaluated. And there were no restrictions on the usc of loans. This meantthat state governments received no reward, either in terms of cheaper borrowing rates or access to more debt for capitalprojects, for adopting a tighter fiscal stance on their current account or primary balances. Moreover, loan awards werenot related to the states' evolving fiscal capacities or their relative expenditure needs.
New arrangements were adopted in 1985 which gave the states the freedom to borrow on their own in the private capitalmarket at whatever terms they could arrange. The Council retained a mandate to set a global ceiling on the annualborrowing of all governments, including local governments and PEs, and to award state-specific borrowing ceilings.These state ceilings were awarded on the basis of population without accounting for fiscal capacity or other statecircumstances However, financial innovations, including the emerging derivative market, soon permitted states tocircumvent their borrowing ceilings. This development resulted in the abolition of global limits in 1992-93.
In the most recent round of reforms (1993-94), the Council embraced two new policies: (a) a normative or indicativeapproach to assessing each government's expenditure needs, fiscal capacity and financial strategy; and (b) a commitmentto evaluate borrowing intentions against Australia's macroeconomic policy needs. If an adjustment in the fiscal stance ofthe general government account is deemed appropriate by the Council, after its review of macroeconomic conditions, thenthe global adjustment and its allocation among member governments would be negotiated by Council members. Ifconcern is raised about the fiscal strategy of a member government, further justification for its financing request may berequired. The Council retains the power to ask a member to modify its request.
The new arrangements are intended to facilitate tighter surveillance and more objective assessment of public sectorfinances. A higher standard of financial reporting is required of members. In return, the states have been given greaterfreedom to determine their own financial requirements. Once targets are agreed upon by members for various fiscalindicators, members are required to give a formal explanation to the Council if outturns exceed a 3 percent tolerance levelin either direction. This explanation will be made public.
In future, the Loan Council's raison d' etre will be to serve as a voluntary forum for the coordination of public sectorborrowing, with an emphasis on the need for a joint co-ordination of macroeconomic fiscal policy. However, therewould appear to be a strong incentive for members to forge consensus agreements. If deadlock occurs, there is likely tobe a downside risk in the form of market disapproval and higher risk premia on state borrowing. Failure to abide byperformance targets might also be expected to lead to higher future borrowing costs.

-62-
conditionality in the form of state-specific fiscal adjustment measures. As a general principle, theterms and conditions of borrowing from this agency should not be so attractive that states wouldprefer to intermediate their debt through the agency rather than borrow directly in the market overthe long-term. Such a transitional agency also might provide a forum for all states and the centerto review their market financing needs in light of the prevailing macroeconomic conditions, as hasbeen done by the Australian Loan Council since 1993-94.
SELECTED SECTORAL ISSUES
In addition to addressing issues of overall fiscal performance, state governments must alsotackle several specific financial and institutional factors which prevent them from delivering betterinfrastructural and social services. Table 2.9 underscores the importance of investing ininfrastructure in support of the growth process. Although financial problems abound in thesectors considered--power, roads, and irrigation--the rest of this Chapter also reasons thatinstitutional factors often are an independent and even more important concern.
Table.2.9: Elasticity of Physical:Stocks with Respectto PurchasingPower Parity GDP, for Low sand Middle Income Countries
: ...... 0; t:;t tt; : (0g1975-90)i1975 1980 1985 1990 :975-80a
Pow er 1.45 1.39 1.5 1.51 1.54:Roads 0.95 0,86 0.86 0.82 0.98Irrigation 0.88 0.9 0.86 0.71 0.90Phone
Mainlines 1.67 1.59 1.76 1.73 1.69
a. Covers 1960-90 for power and roads; 1965-90 for irrigation; and 1975-90 for phone mainlines.
Source; Crqoegy K. Ingra, and Marianne Fay, :Valuing lnfrastructure Stocks and Gains from ImprovedPerfolmance, miimeo, May 1994.
Power
Overview. State governments own the SEBs and other power companies which togethergenerate 75 percent of India's electricity supply and distribute more than 95 percent of it. Theremaining 10 percent is distributed by private companies. The SEBs have considerableoperational and managerial autonomy under the Electricity Act of 1948. In practice, however,they must obtain state government approvals, often at the highest level for the most importantbusiness decisions, including tariff adjustments. Such permission is seldom granted. As a result,most SEBs have been in a precarious financial situation for some time because they have beenunable to generate sufficient resources to maintain and expand their power generation capacity inline with demand.
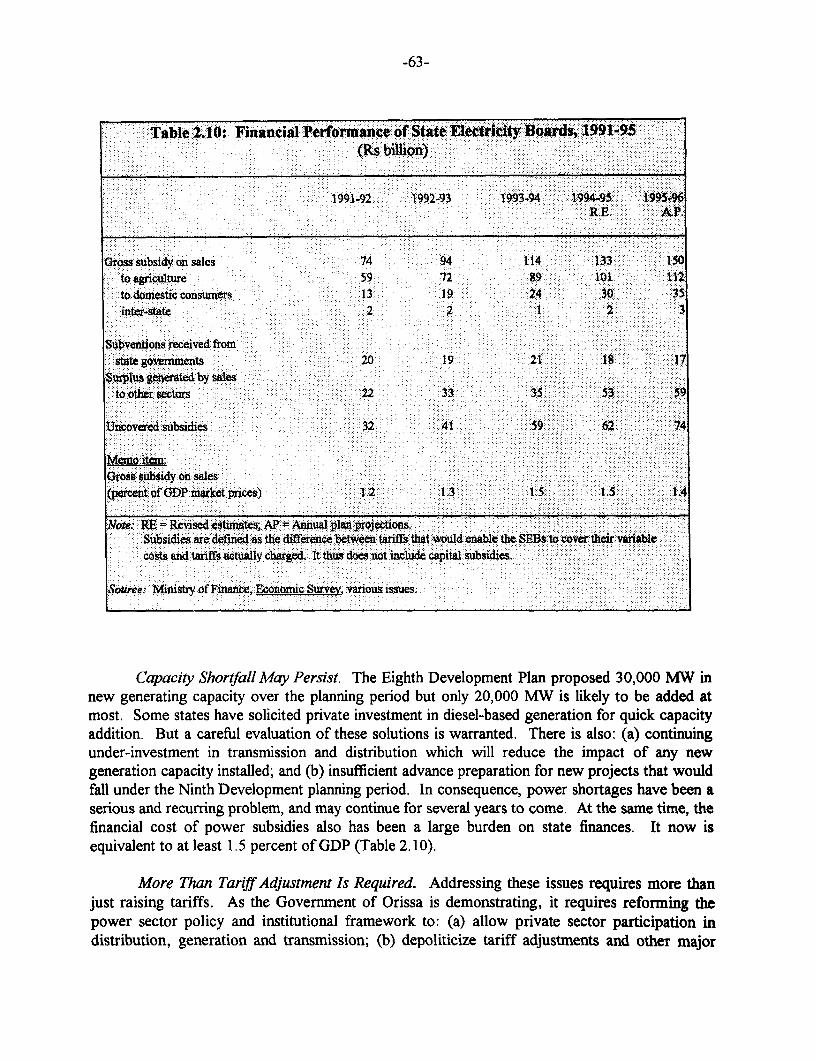
-63-
Table 2.10: Financial Perfornmasice of State Electricity Boards, 1991-95(Rs billion)
1991-92 1992-93 1993944 1994-95 1995196. - - It~~~~~~~~~~~~~~~~.E. 'A;.P.
Gtoas subsidy on sales 74 04 114 133 150to agriculture 59 72 8g 101 . 112to domeetic consumers 13 19 24 30 35inter-state 2 2 1 2 3
SSubvent.ions received fiom:'tate governments 20 19 21 18 17
Suplus generated by sailestO othet sectors 22 33 35 '3 59
Uncovered subsidies 32 41 .59 62 74
Meno it-m:Gtoss subsidy on sales(pcmt ofGDPmarketprices) 12 1.3 .1.5 ' 1.5 I A
Note: -RE = Revised estimates; AP.= Annual plan projections.Subsidies are defined as the difference between tWari- that would enable the SEBs ta cover fteir: variabl'costs and tariffs actually charged. It thus does not include capital subsidies.
Source: Ministy of Finance, Economic SurveV, various issues.
Capacity Shortfall May Persist. The Eighth Development Plan proposed 30,000 MW innew generating capacity over the planning period but only 20,000 MW is likely to be added atmost. Some states have solicited private investment in diesel-based generation for quick capacityaddition. But a careful evaluation of these solutions is warranted. There is also: (a) continuingunder-investment in transmission and distribution which will reduce the impact of any newgeneration capacity installed; and (b) insufficient advance preparation for new projects that wouldfall under the Ninth Development planning period. In consequence, power shortages have been aserious and recurring problem, and may continue for several years to come. At the same time, thefinancial cost of power subsidies also has been a large burden on state finances. It now isequivalent to at least 1. 5 percent of GDP (Table 2.10).
More Than Tariff Adjustment Is Required. Addressing these issues requires more thanjust raising tariffs. As the Government of Orissa is demonstrating, it requires reforming thepower sector policy and institutional framework to: (a) allow private sector participation indistribution, generation and transmission; (b) depoliticize tariff adjustments and other major

-64-
Box 2.7: 0Orisa Makes Progress in Power Sector Reform
YOrissa Power System. The Orissa State]Electricity Board (OSEB) and the Departmient of Energy of theGovernment of Orissa own and operate 0rissas power generation plants (respectively 70 percent and 30 percent)which service about 1.1 million consumers. OSEB's: operational performance has been the poorest among stateelectricity boards in hidia.0 The current power shartage is estimated at about 40 percent of peak demand and theenergy deficit at about 20 percent. Both amr more than twice India's average. This situation has developed inSpite of significant investment in power which absorbed 20-25 percent of the state's investment program over thelasti decade, In addition, subsidies to the -OSE13 became an increasingly large burden on the budget, exceedingone percent of the state GDP in FY94. The main explanation is inadequate tariffs.
0?rissa's Power Reform Pogram. A comprehensive power sector reform programn was agreed with theGovernment of Orissa and the OSEB in November 1993. The Governnent of Orissa's objective is to withdraw
* from the power sector. as an operaor of utilities, laying instead: privately-managed utilities operating, in acomnpetitive : and approprately regulated :power market. Power sector industry and market structures to be
V established under the power sector reform progr uhave been defined for this purpose.
Successful completion of thc program iwould eliminate power cuts and supply restrictions by 1998. It would alsoit thelp to realize Orissadspower potential, based on vast, coal and significant hydro resources. The Government of l:Orissa authorized four ta:iff adjustments fo April: 1992 to July 1994 which cumulatively increased powertariflf by 50 percent. This will help to restore the financial viability of the power sector and provide a soundfinancial: base for the reform prga.Further tariff adjustmnents of the same order are planned for the 1995-98period&:to meet the financial targets of: the new power companies (as per current legislation and tariff
:notificationts).;
The; Scope of the Program. The program involves: (a) unbundling and structural separation of generation,tranmiission and distribution into sepaate companies; (b) private sector participation in hydro-generation andprivatization of thermal. generation and distribution; (c) competitive bidding for new generation; (d) theestablishment of a power sector regulatory agency; (with no utility assets, and ino involvement in operations); and(e) electricity tariff reforms at :bulk power, tramission and retail levels. The reform program is beingsupported by the World Bank and the International Finance Corporation.
business decisions in the power sector; and (c) introduce competition (Box 2.7). Several otherstate governments are beginning the process of power sector reform. A restructuring study isunderway in Uttar Pradesh and Haryana, together with the creation of an organizationalstructure to manage the reform process. Critical actions in Uttar Pradesh will include: (a)tariff adjustments; (b) significantly improved collection of bills; and (c) payments by the UttarPradesh SEB to the state government and suppliers. The states of Rajasthan and Bihar willsoon launch restructuring studies with assistance from the World Bank.
To overcome the power crisis, the Electricity Act of 1948 was amended in September1991 to open fully the power sector to private domestic and foreign investment. Theamendments also enabled state governments to guarantee rates of return on equity invested ingeneration (16 percent for a plant load factor of 68.5 percent, with a 0.7 percent increase inthe rate of return for each one-percent increase in the load factor). This legislation does notpromote competition or encourage minimization of capital costs. And the normativeoperational parameters are relatively easy to exceed. In addition, the efforts of the Central andstate governments have focused on attracting private investment in generation rather thantransmission and distribution. New plants, therefore, can only sell to the SEBs. Privateinvestors have sought counter-guarantees from the Central Government because the SEBs with
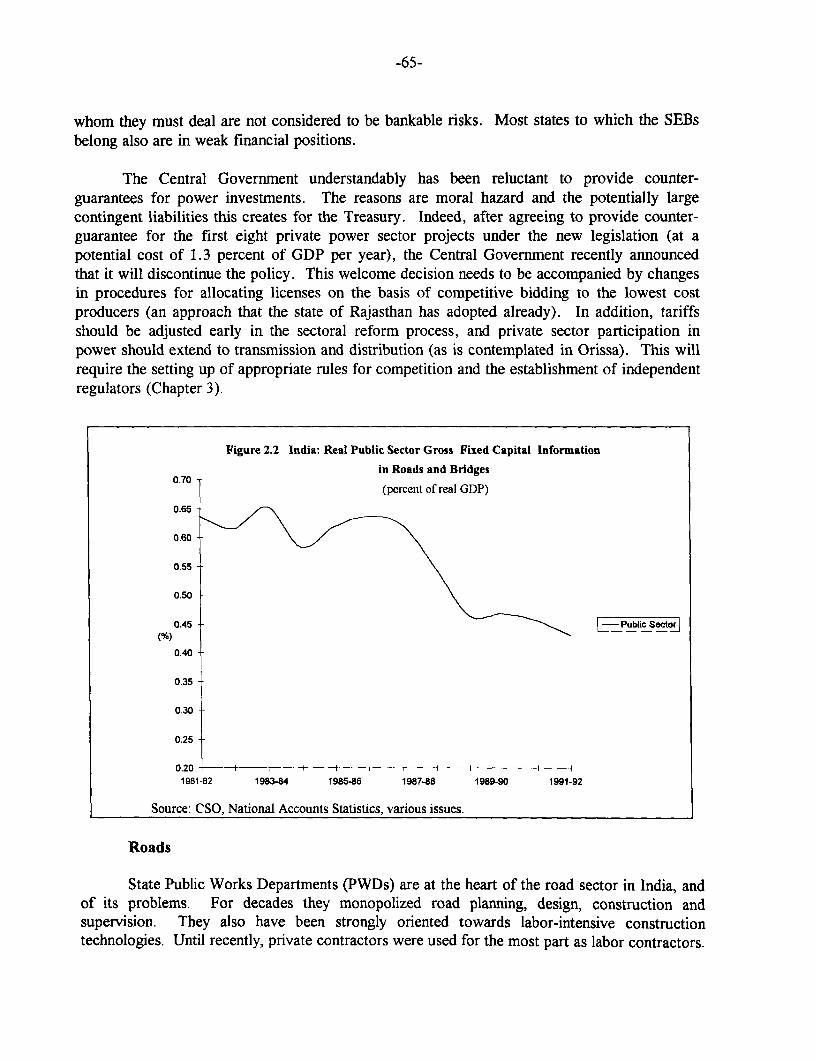
-65-
whom they must deal are not considered to be bankable risks. Most states to which the SEBsbelong also are in weak financial positions.
The Central Government understandably has been reluctant to provide counter-guarantees for power investments. The reasons are moral hazard and the potentially largecontingent liabilities this creates for the Treasury. Indeed, after agreeing to provide counter-guarantee for the first eight private power sector projects under the new legislation (at apotential cost of 1.3 percent of GDP per year), the Central Government recently announcedthat it will discontinue the policy. This welcome decision needs to be accompanied by changesin procedures for allocating licenses on the basis of competitive bidding to the lowest costproducers (an approach that the state of Rajasthan has adopted already). In addition, tariffsshould be adjusted early in the sectoral reform process, and private sector participation inpower should extend to transmission and distribution (as is contemplated in Orissa). This willrequire the setting up of appropriate rules for competition and the establishment of independentregulators (Chapter 3).
Figure 2.2 India: Real Public Sector Gross Fixed Capital Information
in Roads and Bridges0.70
(percent of real GDP)
0.65-
0.60
0.55
0.50
0.45 Public Socior
0.40
0.35
0.30
0.25
0.20- _ I I I l1981-82 1983-84 1985-86 1987-88 1989-90 1991-92
Source: CSO, National Accounts Statistics, various issues.
Roads
State Public Works Departments (PWDs) are at the heart of the road sector in India, andof its problems. For decades they monopolized road planning, design, construction andsupervision. They also have been strongly oriented towards labor-intensive constructiontechnologies. Until recently, private contractors were used for the most part as labor contractors.

-66-
They did not provide engineering skills, materials, machinery or working capital; these came fromthe PWDs. This arrangement allowed many small labor contractors to build sections of a verylarge network at relatively low costs. The network consisted of one, one-and-a-half and two-laneroads with thin rough pavements.
Congestion Is The Overriding Concern. Traffic in excess of 30,000 vehicles per daycurrently use some of the core sections of India's road network. This has created the singleoverriding concern regarding India's infrastructure for surface transportation; that is, the extremecongestion on the core system and the impossible task of maintaining low standard roads underthese circumstances. The system comprises about 10,000 kilometers of roads that account forabout half the national road freight and passenger traffic. This core system is part of a largersystem of state highways (128,000 km), major district roads (216,000 km), national highways(34,000 km) and major urban roads serving the four mega cities of Delhi, Bombay, Madras andCalcutta. Together, these categories of roads account for 95 percent of all national road traffic,and most of the engineered road construction in the country.
The extreme congestion is the result of population growth, increasing urbanization,expanding foreign and domestic trade, and the shift of private shippers from rail to road becauseof superior service characteristics. Such traffic requires four lane roads capable of carrying heavyaxle loads. Much of the single and one-and-a-half lane State and Major District roads needs alsoto be upgraded to good two lane roads. But neither the PWDs nor the prevailing localengineering and construction industry has suitable technology and the related experience for thetask.
PWDs Are The Major Constraint. The technological requirements for designing andconstructing the core highway network are both large scale and machine-intensive. Hand laborcannot compact the earth or finish the pavement to specifications appropriate for high densityheavy axle load traffic. However, it can be retained for the very extensive remainder of thenetwork that is lightly trafficked, if done on a programmed and dedicated basis.
To overcome the capacity constraints of PWDs, private professional engineering firmsshould be contracted to investigate and design large costly sections of road suitable forconstruction by machine intensive methods alone. Large contractors should be mobilized also.They should provide the full range of the requisite financial, managerial and engineering skills. Inaddition, they should have the capacity to supply equipment and material for rapid high standardroad construction. Construction supervision would be undertaken by private professionalconsulting engineers representing the client PWD. These consulting engineers also would beresponsible for the equitable treatment of the contractors through contract interpretation andprogress payments (Box 2.8).
India currently does not have enough large scale private domestic road engineering or roadconstruction firms to undertake the task at hand. Little effective demand for such services existedin the past and it will take time to build such capacity. Local small and medium-size domesticengineering and construction firms need to acquire relevant experience before they can qualify forsuch large projects.

-67-
One possible solution to the . ...........transitional problem would be to make use of Bow-2*8: PWD Refforeign engineering and construction :- -nI inSeltedStatsservices, at least initially, until the domesticcapacity develops. There is also scope for A Aiumber: ofstate PWDsandte Centiral,MOST are joint venture arrangements between foreign e tmd this mre
and domestic firms. Such arrangements also -of Aadra Pradesh, Tamil Nam6, O' isKs .ra,could encourage the return of NIs with the -RajasthiA and ''.a .. .activelyp.rerg .s.taappropriate skills and experience. d y ropi, o t t, e World Ba'' lc:
, sy. : in- ,0 , ,aAi :WIfi.:. ,Wa ld .5.' '".IStategic oions studiesr ing prepard .n each
The more-machine intensive and sta-e toanalye t mad networs.'efficient approach to high density roadbuilding will require downsizing and re- T studies ridin :o upri the,.corrd,ors .w,ith hi,gh t,raffi.c volumes,, and* coge.st,ion,..'.Itraining in-house PWD engineering staff, Thiis 'will be followed by the dse1ction: ofpoit' .especially those involved in the construction -consultAts to con out the'- dead eoihibty and- of main roads. This would be consistent with gneer.. s..ies. .i t ur.t.hcnstitanti ' ....prepare consruction. packages and associated tendera smaller but very important role for state : 'ts, sitable :f-or inteniaiztpetitive.PWDs as the planner, administrator and bidding Subsequently, private cwnsu1tantswill b-",maintainer of roads. The private sector -retaind by"the sate to jspse cnact
eiplementation. Writh this: arrangemet, the neededwould investigate and design roads, igineeng cio hi c :supervise construction and maintenance, and rapidly ranarered t dia- d t work. abesupply material and equipment. Such a supported fu inily ybily ,ateral andmultilateraldivision of responsibilities is common to lenders.developed countries and generally is veryefficient. In India, those states with PWDs that assume such a narrower role effectively will havegood roads sooner than those that cannot or will not make the transition.
Finances Are A Separate But Surmountable Problem. The financial challenge for thegovernment is how to provide a stable and dependable annual stream of $2.5 billion resources forroad improvement and conservation. Roughly $1.5 billion is for investment; the rest would covermaintenance. Less than half of this requirement is provided for in India's current Eighth Five-Year Development Plan. The recommended allocation for National Highways under the EighthFive-Year Plan is $2.0 billion. For the state and major district roads, it is $5.5 billion. Another$1.0 billion per year is needed for maintenance. Only $3.2 billion is provided. The currentfinancial resources of the states and the Central Government are grossly inadequate to meet theseinvestment and maintenance requirements.
Additional financing sources should better tap road users and direct the proceeds into roadconstruction and maintenance. The engineering, construction and maintenance costs of roadslargely are public costs. In contrast, the benefits of savings in travel time and vehicle operatingcosts mostly are private. At present, this private benefit stream is tapped through special centraland state taxes on fuel, vehicles, passengers and octroi. User revenues currently total about $5.4billion annually, or about 3.5 times the total expenditures on roads for construction andmaintenance. About one half of these revenues are collected at the central level. The remainder is
-68-
collected at the state level and is growing at a faster pace. Clearly, there is no linkage--in terms ofpragmatic quasi-cost recovery--between road user revenues and expenditures. Indeed, roadprojects with 40 percent returns are routinely passed over for those with returns of less than 10percent such as railway electrification and railway gauge conversion.
One way of effecting a linkage between road users and new high quality road investmentsis to build toll roads--public and private. However, international experiexice and studies in Indiahave shown that few of the intercity expressways proposed could be entirely financed andmaintained by tolls. Among the reasons are the many free (albeit circuitous, rough andcongested) alternatives to the toll facility, and the very low level of automobile ownership and usein India. Again based on experience in other developing countries, the best potential for privatesector participation in road finance would be for bridges and urban bypasses. In most cases thefree alternative routes to bridges are very circuitous, very congested and very unlikely to beimproved because of problems of land acquisition. As such, it should be entirely feasible tofinance the operation, maintenance and policing costs of most of these new facilities with tolls.Their access points could also be used to weigh and control truck axle loads. Private firms couldthen be given the franchise to operate and maintain the public toll facilities. This would removesignificant administrative and financial burdens from the Central and state governments.
The fact remains, however, that most roads in India (and elsewhere in the world) will haveto be financed entirely or largely with public funds. As indicated earlier, these allocations havebeen inadequate in India. And they are likely to continue to be insufficient given the intensecompetition for and limitation of general central and state revenues. One option would be to raisefuel taxes, (especially diesel fuel and leaded petrol taxes) and earmark them for road funds at thecentral, state, and municipal levels of government. These funds would be used exclusively forroad maintenance, public toll road construction and, possibly, as a substitute for the congestion-inducing octroi tax.
Fuel Taxes Are Viable Options. In India, the price of a liter of gasoline is about $0.60,similar to the average price of gasoline in the OECD countries in 1993. In contrast, the price ofdiesel fuel in India is about $0.20, well below the OECD average of $0.45. In Japan, the currentprice of gasoline is about $1.11 per liter while diesel sells for $0.66 per liter. Because diesel isrelatively cheap in India, it combines with other factors--such as dated technology and weak ornon-existent pollution controls--to create serious problems of pollution by road vehicles. Raisingthe price of diesel fuel in India to the OECD level of $0.45 cents per liter could help to moderatediesel use and would generate additional annual revenues of about $325 million. This is aboutone-third of the estimated current annual shortfall in the Government's spending on constructionand maintenance.
A diesel tax would have other distinct benefits. It would be easy to collect. And if theincrement in fuel taxes--essentially as a user charge--is earmarked for road funds and placed inspecially created State Road Funds, there is likely to be less taxpayer resistance since the fundswill benefit the road user directly. Fuel taxes currently account for only 21 percent of road usercharges in India. This is one of the lowest ratios of fuel taxation to user charges of any petroleumimporting country. A fuel tax also would leave room for unleaded gasoline, which has been

-69-
introduced recently in India, to be sold at a lower price than leaded gasoline. For instance, theprice of unleaded gasoline could be set at the current leaded level. A five cent tax could then belevied on leaded fuel. This would raise about $38 million in revenue. In addition, it wouldencourage the use of more fuel efficient and less polluting engines.
The final reform necessary to encourage taxpayer support is to set up Highway Boards ineach state to preside over the State Road Fund. This by itself would change little unless suchboards were comprised of private road user representatives as well as the state roads bureaucracy.Such boards would set the priorities and guidelines for the use of the funds and provide a quasi-commercial linkage between road users and road providers.
Irrigation and Water Resources
Irrigation is the largest user of water in India, accounting for about 83 percent of presentgross water use. As a result, the condition of the water sector as a whole is linked very closely tothat of the irrigation sub-sector. State Irrigation Departments operate public medium and majorsurface irrigation systems which accounted for 36 percent of the net irrigated area in India in1990. The remainder of this area consists of private tubewell groundwater irrigation (49 percent);traditional tank irrigation schemes (7 percent); and other sources of irrigation (8 percent). Themajority of the facilities in this last category are owned by the private sector (56 percent) andinclude surface flow and lift irrigation. Indeed, the expansion in the net irrigated area in Indiaafter 1950 was due largely to the spectacular growth in private tubewells. They increased fromzero hectarage to about 60 percent of the increase in total net irrigated area.
Expansion of irrigation networks has had a major impact on agricultural growth in India.Technical progress made possible by irrigation investments and its complementary inputs--high-yielding variety seeds and fertilizer--accounted for about 30 percent of the growth in agriculturaloutput in the post Green Revolution period. Irrigation also helped the agriculture sector to leadthe reduction in rural poverty during the 1980s. In fact, the incidence of rural poverty becamelower in irrigated areas compared to rainfed areas. This is true across states, as well as withinstates, including those in which agriculture grew rapidly during 1980s. Given indications thatIndia may be close to the ceiling of cultivable land, irrigation will become even more important asa potential contributor to technical progress, improved agricultural performance and povertyreduction.
Unfortunately, the upkeep of public irrigation infrastructure has been inadequate. Fieldobservations by government officials and Bank staff reveal that in nearly all states, irrigation anddrainage infrastructure is deficient and deteriorating. This situation is reflected partly in threerelated facts about the performance of the irrigation in India. First, the productivity of Indianirrigation is lower than, and in some cases half, the levels attained in other large Asian countriesand elsewhere. For example, in 1989, irrigated paddy yields averaged 2.6 t/ha in India, comparedwith 5.5 t/ha in China and 4.2 t/ha in Indonesia. Furthermore, while yields in China and Indonesiaimproved between 1989 and 1992 (to 5.8 t/ha and 4.5 t/ha, respectively), yields in India remainedthe same. Second, farmers with access to water through private tubewells or dugwells generallyhave better yields than those utilizing public or shared facilities. These farmers also have greater

-70-
Box 2.9: Cost Recovery Potential in: Irrigation Exists
Raising the rates charged to water users is a necessary action not only for cost recovery purposes but also toinduce greater efficiency in the use of water resources. Water rates should be set at levels at least to cover thecosts of efficient O&M. This should include an amount to cover essential numbers of personnel and excludeexpenditures for excess personnel, unproductive items, and rehabilitation activities.
Research shows that full recovery of O&M cost could be easily borne by farmers in most cases, depending oncrops grown and yields achieved. In Haryana, Bihar and Gujarat irrigation charges to cover recurrent O&M costswould account for no more than 4.5 percent of net additional benefits from irrigation or more than 2 percent ofgross returns. Partial recovery of capital costs may also be possible. For instance, 25 percent coverage of capitalcosts would represent from 8 to 22 percent of net additional benefit from irrigation under low capital costassumptions, and from 18 to 37 percent of net additional benefits under high capital cost assumptions. The shareof these charges in gross returns to farmers is lower. The impact of higher charges, however, would beproportionately harder to bear where crop failures occur or farm yields are low. For instance, a review of farmbudgets in Bihar under differing yield assumptions reveals that for farmners with low yields irrigation chargeswould represent 7 percent of net returns for wheat, and 28 percent of net returns for rice. This compares with 1.5percent and 2.3 percent, respectively, for fanners with average yields. For this reason, actions to raise watercharges need to be accompanied by an assessment of farm budgets and the likely impact on farm families.
Merely increasing water rates to full cost recovery levels, however, would not guarantee sufficient funds tosustain O&M activities, given the typically low collection ratios achieved Yea of inadequate attention to O&Mactivities have eroded the quality of irrigation service delivery, leaving little inducement for farmers to complywith water rate statutes. Achieving full cost recovery requires a multi-faceted approach, linking increased waterrates to improved quality of services and greater participation of users in the operations and maintenance ofinfrastructure. Service quality should be enhanced through better management and full finding of maintenanceworks, and through rehabilitation and modernization of existing facilities. Participation of users should befostered through greater consultation with farmers through water user associations (WUAs), and progressiveturnover of facilities to such associations should be sought. Agreements with water users on the new schedule ofrates and on design and rehabilitation plans, should be established prior to investment. In order to ensureadequate water rates over time, an institutional structure and analytical apparatus should be established forassessing service costs and fees, making annual recommendations on adjustments, and reviewing and approvingsuch recommendations.
control over the water supply. Third, State Irrigation Departments appear to be falling behind intheir efforts to improve water distribution in existing schemes, construct micro-networks, andcomplete ongoing projects. For instance, major preparation and implementation problems wereencountered in most of the Bank-funded projects implemented in the 1970s and 1980s. In sevenof the eight projects whose economic rates of return (ERRs) were re-estimated at completion,implementation problems were determined to be the primary influence on low ERRs although thedecline in world rice prices in the mid-1980s was a very important contributor. Financial andinstitutional weakness in Irrigation Departments are at the heart of these problems.
Financial Problems Did Not Always Exist. In India prior to the 1950s, revenues fromwater charges levied on farmers exceeded the combined government expenditures for O&M andfor imputed interest on the initial investments (except for drought relief irrigation works). By1989-90, the subsidy to the sector, using the historical cost valuation method, was estimated to beRs 26 billion, or equivalent to 0.6 percent of GDP. The main reasons for this poor financialperformance included a failure to adjust water charges in line with rising costs of O&M, andfailure to achieve high collection rates of water charges. For instance, water charges haveremained unaltered since the mid-1970s in some states (for example, Punjab, Haryana and West

-71-
Bengal). They also have not beenchanged since the mid-1980s in most Box 2.10: The Tamil Nadu WRCPother states, even though the capacity to Addresses Comprehensive Issues in Waterpay exists (Box 2.9). Resource Management
O&M Is A Major Casualty. As The Tarnil Nadu WRCP comprises comprehensive supportto policy, institutional and expenditure reform in the
with capital expenditures, funding sector. Tamil Nadu is severely short of water . Theallocations for O&M have lost ground to state's future development will depend on improvedincreases in establishment costs, and water planning and allocation for all uses of water, andmore efficient uise in agriculture, the largest user of water.typically have fallen short of The World Bank approved funding for the Tamil Nadurecommended levels. For instance, the WRCP in FY95.
average actual expenditure levels for In Tamil Nadu, the WRCP would introduce waterO&M in Tamil Nadu were 78 percent of resources planning by river basins across all uses of water,the average recommended levels in 1989- improve agricultural productivity through modernization
90, and 66 percent in 1992-93. In Orissa, and completion of irrigation schemes, upgrade watermanagement and fanmer participation, and strengthen
they were 78 percent on average in 1990- institutional and technical capabilities for managing water91. Tamil Nadu and Orissa have now resources.
eliminated their O&M expenditure In preparation for the WRCP, Tamil Nadu: (a) created a
shortfalls, as part of their preparation of a new specialist state Water Resources Organization (WRO)
Water Resource Consolidation Project from the former Public Works Department, including(WRCP) but other states lag behind (Box major reorganization of WRO to create a functionally
2.10). As recently as 1992-93, shortfalls specialized and decentralized management structure; (b)I issued a State Water Policy consistent with India's
in O&M expenditures for various National Water Policy and Bank policy, (c) created a newirrigation schemes in Haryana ranged from state apparatus to implement multisector water planning;31 to 57 percent of the recommended (d) redefined expenditure priorities to emphasize
maintenanice, unproved water management, moderniationlevels, prior to implementation of its and scheme completion rather than new constructions; (e)Bank-financed Water Resource doubled state allocations for mnaintenance to bringConsolidation Project. Additional maintenance funding in line with WRO reconmnendations;
(f0 prepared a program to involve farmers in iTrigationproblems on the financial front typically magement and maintenance, including tunover of the
include insufficient attention to lower levels of conmands to farmer councils; (g)monitoring and controlling of construction established procedures for annual review of water charges;costs, and to construction quality. In fact, (h) strengthened environmental mnagement capabilities;
costs, and to construction quality. In fact, and (i) approved new policies and created an institutionalIrrigation Departments often do not have apparatus to handle resettlement and rehabilitation. Thethe relevant data to perform this function project would support tunditng of the associated physicalor the capabilities in financial analysis. and institutional investments to help implement Tanil
Naduts new state strategy and expenditure program for theirrigation and water sectors.
International experience suggests .,__ . . ., ................ ,, , .. ,_. that granting financial autonomy to anirrigation department would be an important step toward greater financial discipline andefficiency. Due to the political deliberations and budgetary reforms this would entail in India,financial autonomy should be a long term vision towards which Irrigation Departments shouldstrive. An imnmediate course of action could be to levy and collect charges, and earmark theseirrigation revenues for O&M. Such a move toward full reliance on revenues from water charges,combined with the hard budget constraint that financial autonomy entails, would improveincentives in irrigation departments for maintaining viable operations.

-72-
Institutional Constraints Are An Issue Of Boundaries. Among the most seriousinstitutional challenges facing the irrigation and water resources sector are: (a) forging a coherentwater resources policy and multi-sectoral state water plans; and (b) re-ordering government andprivate roles, and fostering greater private sector participation.
In India, planning, allocation and management of water resources are conducted at thestate level. State Irrigation Departments take the lead role in the sector, since irrigation is thelargest user of water. While some Irrigation Departments have responsibilities beyond theirrigation sub-sector, the typical situation is one of several independent departments or agenciesresponsible for different types of water use (for example, municipal water supply, power,transportation). There is, therefore, a lack of integrated management or holistic planning of waterresources, to link sites and purposes of water to their respective unitary sources. Managing waterin a fragmented manner generates significant negative externalities such as pollution stemmingfrom domestic or industrial wastes, or decrease in water availability down stream due to theconstruction of reservoirs or irrigation canals. It also threatens the future availability of usablewater. While some states are moving toward integrated planning and management of water, moststates are not.
Planning and management of water resources should be conducted along river basin lines.This presents an additional level of complexity in the Indian context since river basins rarely fallneatly within existing state boundaries. In addition to negative externalities, the lack ofcoordination creates serious conflicts among water users. Nevertheless, the Government of Indiais committed to shifting toward river basin planning as detailed in its National Water Policy(NWP) of 1987. The NWP allows the Government of India to refer any water dispute foradjudication to a legal tribunal, whose findings would be final and legally binding. Over time,however, inadequate coordination of water planning and usage across states has becomeincreasingly apparent. While some success in harmonizing inter-state riparian development hasbeen achieved through cooperation and specific tribunals (for instance, in the sharing of Narmada,Krishna and Subernarekha waters according to tribunal awards), the more common situation islack of agreement. One example is the highly contentious inter-state dispute among Tamil Nadu,Karnataka and Kerala regarding the waters of the Cauvery, which has remained unresolved since1974.
In the Indian federal structure where state rights are the strong, use of CentralGovernment power to lead the decision-making process toward river basin planning--as has beendone in China, Indonesia and the Philippines--would not be easy. Accordingly, the NWPcommenced a gradual shift toward river basin planning. It authorized the integration of thevarious water planning departments under one umbrella Department, the Ministry of WaterResources (MOWR). In turn, MOWR is coordinating state and Central Government discussionson objectives and strategies through its National Water Board (NWB) which was established inSeptember 1990. The NWB approach is to effect the gradual shift to river basin planning, startingwith improved collection and sharing of river basin data. This first step is to be followedsuccessively by the establishment of river basin planning boards, encouragement of joint inter-state development projects, and possibly over time, whole-basin management. Additionally, the

-73-
Government may also wish to make greateruse of Legal Tribunals (under the Inter-State Box 2.11: Water Users AssociationsWater Disputes Act of 1956) to adjudicate (WUAs) Have an Important Rolecurrent or future water-sharing disputes.There is also a need to better coordinate the An encouraging recent development is the much greater
functions of the Government of India's interest in promoting WUAs now found at the stateCentral Water Commission (which has level. For instance, piloting of WUAs has been
underway for several years in some states (for example,purview over surface water) and the Central Tamil Nadu and Maharashtra, both assisted by Bank
Groundwater Board to encourage holistic projects under implementation or preparation). West
consideration of river basin resources. Bengal has transferred govermnent tubewells to localPanchayats, and Orissa is initiating a program toestablish the structure for WUAs. Experience in India
State Governments in turn should: and elsewhere indicates that the successful development
(a) prepare their own river-basin oriented of WUAs would depend on: (a) reliable and predictableState Water Policies fitting within the water supply to the head of each minor canal (under anStatem Waework oftheNWP besfittmg blish Stae agreed operational plan); (b) common economicframework of the NWP; (b) establish State incentive for fanners to group together to secure tangibleWater Resources Boards, (c) consolidate and reasonably early gains; (c) defined rights and
water planning functions in a single Water obligations for govenmment and WUAs, encompassingthe agreed water delivery service to the minor head,
Resources Department, and reorganize WUA payments for the service, and respective WUA-planning and management along river basin government maintenance responsibilities includinglines; (d) and work toward establishing reduced payments where farmers handle maintenance
and operations; (d) equitable participation andwater sharing agreements with other states. operational integrity, (e) assistance of NGOs, privateA very positive development is that these consultants, social activists, and local leadership inactions have already been initiated in the organizing farmers; and (f) a grass-roots approach,context of WRCP preparations in Tamil progressively building farmer capabilities andsontext of WRCP preparations In Tamll responsibilities.Nadu, Orissa, and Haryana.
Additional features generally regarded as important toSeveral functions currently per- successful WUAs include: (a) regular meetings of the
formed by the financially and institutionally executive and general body; (b) periodic elections ofcommittee officials including rules to limit the
deficient State Irrigation Departments could permissible tenure of conuiittee officials; (c) annualbe handled better by the private sector. elections for the committee with a vote for each WUAExamples are maintenance and operation of member; (d) measures to ensure representation inthe distributor-y canals, agricultural services, decision-making by every chak and including committeeparticipation by minorities and women; and (e)and seed production. Promotion, develop- procedures for outside auditing of accounts, allment and support of Water User Asso- safeguarded under a written WUA constitution and by-ciations (WUA) should be pursued. They laws.are likely to be the most effective vehicle, inthe short and long term, for farmer partici-pation and control of irrigation schemes (Box 2.11). Scheme level adminis-tration could thenactively reach farmers through the WUAs to enlist them in widening circles of consultancy,participation, decision-making and cost recovery. Coordination between irrigation departmentsand farmers on management and maintenance of micro-networks is critical for improving efficientwater use and sustainability of investments. It has the added advantage of being more costeffective when farmers are involved and are encouraged to acquire ownership of their micro-networks.

-74-
The appropriate long-term role for the public sector is to: (a) support the private sectorthrough groundwater monitoring (increasingly through river basin authorities); (b) planningsurface irrigation development (with purview over topographic surveys and layout design) tofacilitate conjunctive groundwater exploitation; (c) providing policy and legislative guidance,research and extension; and (d) channeling government funds (including supervision ofcontractors) for large public works. It should also assist in forming water user associations.

-75-
S ~~~THE ENABLING FRAMEWORK FOR PRIVATES ~~INVESTMENT IN INFRASTRUCTURE,
INTRODUCTION
For over four decades after Independence, the public sector in India held a monopoly inthe provision of most infrastructure. In 1991, when the current period of reforms started,electricity, the railways, ports, roads and telecommunications were among the sectors reserved forthe public sector. Now, virtually all parts of the economy--including all infrastructure--are opento private investment. In addition to liberalizing the investment regime, the Government has beenintroducing reforms in the trade regime, the financial sector, taxes and public enterprise to createan overall policy environment more conducive to undertaking and operating these investmentsefficiently. This Chapter focuses on one critical aspect of that enabling environment, the legal,administrative and regulatory framework, and the challenges it faces in accommodating the new,broader role for the private sector in power, transport and telecommunications. Given that thesechallenges are new for India, some experimentation and learning while doing are inevitable.However, there are actions that can and need to be taken, and identifying them is the purpose ofthis Chapter.
The discussion which follows highlights that India's legal system--that is, its laws,instruments and institutions--is adequate to facilitate the objectives of the on-going economicreform program, including private sector investment in infrastructure. However, there is room toenhance the capacity of the system to support reform objectives by: (a) improving the efficiencyof the administration of justice by measures such as providing an efficient legal informationsystem; and, particularly for infrastructure, by (b) adjusting in a limited manner specific lawsaffecting labor, taxes, land, the regulation of utilities and dispute settlement. Within the threesectors which are reviewed below--power, transport and telecommunications--there are stilladministrative and regulatory issues which are impediments to private sector investment. Theseissues, which vary across sectors and within sectors, are set out in the rest of this Chapter.
INDIA'S LEGAL SYSTEM
Introduction
Unlike economies in transition in parts of Eastern Europe and East Asia, India has a highlydeveloped and sophisticated legal system with an institutional and professional depth unparalleled

-76-
among developing countries. The system includes about 8,000 courts at various national and sub-national levels, a diverse and complex body of quasi-judicial and other administrative tribunals,about 500,000 lawyers, and a widely respected, independent and competent higher judiciary. TheConstitution of India provides for the separation of the executive, legislative and judicial branches,as well as the protection of civil liberties by an independent judiciary along lines similar to the Billof Rights in the Constitution of the United States. India's legal system also provides for thecomprehensive protection of property and contractual rights and legal interests in economictransactions based on Anglo-American legal doctrines. As such, India's legal system is a valuableasset in its efforts to permanently alter the country's development paradigm and achieve sustainedeconomic growth.
That said, there is room to enhance the capacity of the system to facilitate and support theGovernment's economic policy objectives in general, and private sector participation ininfrastructure in particular, in two areas. These areas, identified through a participatory processinvolving private sector leaders and Government officials, are:
* reduction of delays in court proceedings, expansion of access to courts and enhancementof the efficiency of courts; and
o adjustments in specific areas of the law which are of greatest relevance to private sectorparticipation in the funding, construction and operation of infrastructure--labor laws;indirect laws; utilities regulation; land law (land acquisition and collateral; urban landceiling, and construction laws); and commercial dispute settlement.
As explained below, these issues are receiving priority attention from the Government.
Reducing Delays and Increasing Efficiency
The Old Role of Government Contributed to Delays. Long delays in final resolution ofcases is the most significant challenge facing Indian courts. The conventional view is that thesedelays arise solely or mainly because of a shortage of courts, judges and lawyers; inefficientprocedures, and a failure to use modern court management systems. However, past experienceshows that sizable increases in the number of courts, judges and lawyers (including tribunals), andprocedural changes and institutional upgrading have not achieved commensurate reductions in thebacklog or delays. While failure to invest in and expand judicial infrastructure in line with theexpanding economy undoubtedly is a contributing factor, recent research has pointed to a link,explained below, between court delays and the interventionist economic policies that werefollowed until mid-1991.
Delays are attributable in part to inefficiencies in procedures, a matter beyond the controlof parties to litigation. Delays are also attributable to actions, or omissions, of the partiesthemselves. In litigation between private parties, delays attributable to acts or omissions of theparties are limited by the net economic and financial cost to the parties arising from such delay.

-77-
However, where government or a public sector entity is a litigant, this limitation is, by and large,not applicable for a variety of reasons: their ability to absorb the economic and financial costs ofdelay; the absence of penalties against the institutions or concerned individuals for incurring suchcosts; and distortions in institutional incentives. It is often safer for an official of such aninstitution involved in litigation to institute an appeal, even if the chance of success is very low.Data on the Bangalore area indicates, for example, that appeals filed by governmentagencies/public sector institutions have an extraordinarily low success rate of between five and sixpercent. Yet they occur routinely against decisions of courts and government appointedadministrative tribunals. Such appeals constitute a significant proportion of the burden of thehigher judiciary.
The extensive involvement of government agencies/public sector entities in litigation inIndia should be considered in the above light. Data on the Bangalore area indicate, on apreliminary basis, that the Government is a party (as plaintiff, defendant, appellant or respondent)to appeals in a large proportion of all Indian civil suits (that is, suits other than those pertaining tocriminal offenses), estimated at about 60 percent. It appears therefore that the dominant presenceof the government and public sector enterprises as litigants, is an important factor contributing todelays in courts.
What explains this extraordinary Government involvement in civil litigation in India? Thepolicy of the Government, prior to July 1991, of direct intervention in and regulation of individualeconomic transactions required a legislative structure that conferred vast administrative discretionon government and contained detailed rules governing transactions at the micro-level. Thissituation was not dissimilar to the practices in a number of previously centrally-plannedeconomies. What was unique in India, however, was that this centrally planned developmentstrategy was implemented within a legal framework of Anglo-American origin. The coreobjectives of such a framework include the protection and maximization of individual choices ineconomic transactions and limiting government intervention in private transactions. As a result,courts became crowded with a large volume of litigation, with the Government as a party. Herethe motive of private litigants was to question or alter the application of economic policydecisions of the Government to individual activities.
The on-going move away from centralized planning and the adoption of a market-basedmodel of economic development should significantly reduce, however, the extent of governmentinvolvement in civil litigation. It should reduce the need for private economic agents to use courtsto resist or modify the application of government laws to individual transactions. TheGovernment and public sector entities could also productively reduce their involvement inlitigation by reducing substantially the number of civil cases initiated by them, including appeals.
A reduced government presence in litigation will, in turn, reduce the distortion of thelitigation system described above. It will also reduce government crowding out of privatelitigation. As the proportion of litigation involving only private parties increases, the economicand financial costs of delay should also operate as a powerful factor in favor of containing delays.

-78-
In addition to reducing ex ante discretionary controls and intervention policies, the Governmenthas itself identified the need for "... a major overhaul [of the administration of justice], takinginto account technological advances which have proved to be powerful tools for speedymanagement decisions in business firms."
The Government has reviewed the problem of delays extensively, particularly since 1991.The 1991 Malimath Committee Report identified causes for delays and suggested remedialmeasures. The Law Commission of India also has prepared a number of reports on the subject.These recommendations have been considered by Chief Justices, Chief Ministers and LawMinisters. Steps taken pursuant to this effort include the preparation and submission toParliament of a new law governing arbitration. Other measures to strengthen courts and simplifyprocedures are being monitored by Government. One of the recommendation of the LawMinisters is that disputes between Government and public sector undertakings, or between publicsector undertakings, should not go to courts or tribunals but should be settled between the partiesout of court.
Reforming High Priority Laws
Of the priority reform areas identified above, five are directly relevant to the enablingenvironment for private investment in infrastructure, and are discussed further in this report:labor laws; indirect tax laws; utilities regulation; land laws (land acquisition and collateral, urbanland ceiling, and construction laws); and commercial dispute settlement (the remaining issues areaddressed in a paper, under finalization, on the legal framework for private sector development).
Labor Laws. One priority issue requiring attention of policy makers is labor disputesettlement. In seeking increased private investment in infrastructure, it is important to ensure alsothat necessary steps be taken to strengthen the mechanism for settlement of labor disputes so thatworkers in private enterprises will have adequate access to quick and efficient remedies to protecttheir rights. As a general matter, an efficient system for the settlement of labor disputes is essentialfor the development of a labor market.
The legal regime governing industrial relations in India is complex, with some 50 majorpieces of legislation covering labor welfare and dispute settlement. These laws apply to theorganized sector. The unorganized sector is not covered by labor laws. This labor disputesettlement system no longer offers adequate remedies to protect the rights of workers. Neitherconciliation, compulsory adjudication nor arbitration--the three methods of dispute settlementavailable under Indian labor law--any longer provide employees a fair and expeditious method oflabor dispute settlement. The final resolution of a labor dispute could take about 20 years if it ischallenged in appeal by the concerned employer.
The employment relationship in a private enterprise is based upon a private, voluntarycontract. However, once that contract is concluded for those who fall within the term 'workmen'in 'industries', the terms of the employment contract are circumscribed by several detailed

-79-
statutory provisions. In particular, those provisions pertain to changes in the nature of the job,termination and dispute settlement. Labor laws do not provide to the 'workman' adequatefreedom to choose where and how to pursue disputes with his employers. In fact, employees canpursue grievances only after the government approves their planned course of action.
The establishment of an efficient system of labor dispute settlement is of high priority.The Government is in the process of reviewing such existing laws as the Industrial Disputes Actand the Trade Unions Act, with the same objective. On the issue of dispute settlement, the systemshould protect the rights of individual workmen to choose the forum and type of remedy to beused to protect rights. It should be based on an unambiguous legal framework defining themutual rights and obligations of employers and employees. In addition to a system of laborcourts, there should be improved opportunities for voluntary arbitration.
Tax Laws. There are a number of legal barriers to the free inter-state movement ofgoods, arising mainly from the legal framework governing indirect taxes imposed by states. Legaldefinitions regarding the incidence of taxes vary significantly from state to state. Legalprocedures for compliance with state tax law are cumbersome and vary widely from state to state.Physical barriers such as check posts, as well as legal rights to stop vehicles to check on paymentof indirect taxes, operate as major sources of delay in the flow of goods across state barriers.They also afford important rent-seeking opportunities for state officials. The national agitation bytruck operators in August, 1993 that led to the abolition of one of these taxes ('path kar' or entrytax) demonstrates the extent of the frustration of the private sector with these barriers. Theresolution of this issue will raise complex legal questions, including constitutional law aspects,that require careful consideration. However, legal reform in this area is necessary for India tofunction effectively as a single market.
The Indian Stamp Act and state stamp laws require payment of stamp duty for certaintransactions. Stamp duty is an important source of state revenue and their rates have steadilyincreased. Excessive stamp duty rates have, in turn, resulted in widespread under valuation oftransactions and a migration of transactions to jurisdictions with lower stamp duty. Rates ofstamp duty also have had the unintended consequence of distorting the choice of legalinstruments. For example, although registered mortgages offer greater legal protection tomortgagees, mortgage by deposit of title deeds is preferred because it carries little or no stampduty. Further, an imprecise classification of categories also has generated considerable litigationover tax liability. A rationalization of stamp duty across various states will have an importantpositive impact on facilitating commercial transactions.
Land Laws (Including Tenancy, Urban Land Ceiling and Construction). Delays inobtaining reliable access to land and buildings are a significant constraint to private sectordevelopment. From a legal point of view, three issues require attention in this respect. First, theestablishment of an effective system of land titling is necessary to support the development of aland market. It would assist also in creating mortgages required to facilitate lending. Without aneffective system of land titling, title to land in India cannot be ascertained with adequate reliability.

-80-
This operates as a constraint on efficient and effective transfer of land, whether by way of sale orlease.
Second, the legal and policy framework governing the leasing of land and buildingsrequires re-examination. The main legal issue here is the lack of an effective and speedy methodof dispute settlement for tenancy disputes. Again, the intervention of the government (forinstance, through the office of rent controllers) in the lease contract, as well as in the settlement ofdisputes arising under lease contracts, has muddled the mutual rights and obligations of theparties, delayed the process of dispute settlement and created opportunities for rent seeking.Third, the legal requirements for obtaining local government approval for construction ofbuildings and land use have become highly cumbersome and inefficient, and are an importantsource of delay in project implementation. These procedures also generate a considerable amountof civil litigation.
Alternative Commercial Dispute Settlement. In addition to measures discussed abovewhich would enhance 'judicial space' for commercial dispute settlement, the government couldalso consider measures to improve the availability and effectiveness of alternative disputeresolution mechanisms for commercial disputes. Commercial arbitration is not yet a popularmethod of commercial dispute settlement in India and is used infrequently. The recentintroduction in parliament of a new Arbitration Act signals the importance now attributed to thismatter by Government.
Three main reasons explain the low use of commercial arbitration. First, arbitration issubjected to excessive review by courts. Second, a series of court decisions in effect have madearbitration tribunals subject to nearly the same procedural complexities as the civil court system.Consequently, arbitration proceedings have become slower, more formal, and more expensivethan they should be. Third, the legal and institutionalframework for commercial arbitration is notadequately developed. Institutional arbitration is not currently available in India. Acomprehensive plan could be developed to strengthen commercial arbitration in India covering:(a) updating the Arbitration Act, 1940 with particular reference to the judicial review ofarbitration; (b) developing institutional arbitration including investment of necessary additionalresources for training; (c) reducing costs and delays currently associated with commercialarbitration; and (d) involving the business community in the promotion of arbitration as a meansof dispute settlement.
Competition Laws. A key regulatory challenge during the process of liberalization is theestablishment of a legal framework for fostering competition. The provisions of the Monopoliesand Restrictive Trade Practices Act, 1969 (MRTP Act) governing monopolistic and restrictivetrade practices afford an initial basis for pursuing this objective. However, remedies to enforcelaws against anti-competitive practices set out in the MRTP Act do not adequately include privateremedies or provide for criminal liabilities. Consideration should be given to improving privateremedies to those suffering economic injury from anti-competitive practices. The need to extendjurisdiction to civil courts over remedies under the MRTP Act to encourage private monitoring

-81-
and regulation of compliance with the law as well as provide enhanced access to consumersacross the country, could also be considered.
Conclusion
Economic law reform has been approached cautiously by the Government and is generallypreceded by careful systemic analysis of underlying issues. There are no quick solutions or shortanswers to some of the problems involved in redirecting one of the largest and most complex legalsystems in the world to a path supportive of sustained and rapid economic growth.
POWER
Introduction
The electric power sector is a core component of India's infrastructure and its continuedexpansion is critical to the success of India's economic liberalization efforts. The system iscomplex and dynamic. It has grown from approximately 1,300 MW at independence in 1947 toalmost 80,000 MW today. Despite this level of growth, the sector is beset with seriousoperational and financial problems, and its needs--which include additional generating capacity,higher levels of efficiency in generation, transmission and distribution, and greater financialstability-- are great.
The sector has a federal structure with significant central direction. In addition to state-owned SEBs, there are national entities such as the National Thermal Power Corporation (NTPC)which was established in 1985, the National Hydroelectric Power Corporation (NHPC) and thePower Grid Corporation of India Limited (Powergrid), and regional bodies such as regionalelectricity boards (Box 3.1). There also are several private distribution companies, most notablythe Calcutta Electric Supply Corporation (CESC) Limited in Calcutta, the Bombay SuburbanElectric Supply (BSES) Limited and Tata Electric Companies (TEC) in Bombay.
According to Indian constitutional law, electricity is one of the sectors on the "concurrentlist." This means that both the central and state governments have the authority under theConstitution to legislate and regulate the sector. In practice, state legislatures have amended thecore legislation, comprising the Indian Electricity Act 1910 (the "1910 Act") and the Electricity(Supply) Act 1948 (the " 1948 Act"), over the last twenty years by issuing associatedregulations. At the same time, the Central Government has made amendments to these Acts asrecently as 1991 to reflect policy changes and the liberalization of generation.
At present, the function of regulation in the power sector is closely linked under these corestatutes. Regulation is carried out by various departments of the Central Government such as theMinistry of Power and the Central Electricity Authority (CEA). In addition, the Stategovernments and the SEBs themselves play an extensive role under the 1910 and 1948 Acts,which has given rise to significant degrees of overlapping jurisdiction with central authorities.

-82-
Box 3.1: Multiple Public Agencies Operate in the Power Sector
The Central Government currently owns: (a) several generating companies, including the National Thermal PowerCorporation (NTPC) and the National Hydroelectric Power Corporation (NHPC); and (b) the Power GridCorporation of India (POWERGRID), the new transmnission grid operator. Tariff setting principles for thecentrally-owned entities are approved by the Ministry of Power (MOP). Actual tariff proposals are reviewed byCEA. as the regulatory authority and then are notified for implementation by the MOP. These tariffs are establishedon a cost, of service basis, subject to basic performance standards. The Central Government also owns two powersector financial intermediaries, the Power Finance Corporation (PFC) and the Rural Electrification Corporation(REC). India's renewable energy program is administered by the Ministry of Non-Conventional Energy Sources,which covers mnini-hydro, wind and solar as well as the decentralized needs of the rural sector.
States own their respective SEBs and State Generating Companies (SGCs) which together generate about 75percent of the electricity supplied and most of the distribution to final users. The 1948 Act expressly requires theSEBs to operate "in the most efficient and economical manner". It also requires the SEBs to adjust their oxvntariffs so as to achieve a minimum (but no maximum) return after interest of three percent on average fixed assets.in operation. The 1948 Act does allow a state to specify a higher minimum rate of return for its SEB, and tosubordinate payment of interest on state loans until after meeting the minimum return requirement. However, mostSEBs do:not reach the :1948 Act's three percent minimum return. If the SEBs were allowed to meet the threepercent minimum return specified in the law, most would be able to cover their operating costs and debt service (solong as rural electrification subsidies were fully paid and bill collections were reasonable) but would hardlycontribute anything to :capital expenditures.
Indian: utilities are grouped into five regional interconnected power systems in the Eastern, Northern, North-Eastern, Southern and Western regions of India. In 1964, the Government of India created Regional ElectricityBoards (REBs) to bring together the concerned SEBs and central and joint sector utilities, to coordinate systemoperations in their respective regional gids. The CEA also was entrusted with the development and operation ofRegional Load Dispatch Centers (RLDCs) by an amendment to the 1910 and 1948 Acts requiring generatingcompamies. and licensees to follow their instructions. The transfer of the operational responsibilities of the RLDCsand CEA to POWERGRID (to:be completed by December 31, 1995) was agreed in 1993. Thus far, three RLDCshave been taken over by POWERGRID in accordance with the planned timetable.
Autonomous regulation, as is found in other countries' power sectors and characterized byminimal political interference, is not present in India at this time. Some reforming states (notablyOrissa) are making the first concrete steps towards establishing a new regulatory authority for thestate through appropriate state-specific legislative amendment.
In the late 1980s, it became clear that more fundamental structural reform was needed ifIndia's electricity sector was to meet the demand growth of 9 percent per annum. The EighthPlan (1992-1997) initially envisioned additional generation capacity of some 48,000 MW (whichwas subsequently adjusted to 30,600 MW). In May 1994 it was estimated that India will need anadditional 140,000 MW of electricity over the next 15 years, a level of demand which is secondonly to that of China.

-83-
In order to address the . :- -7- . : : ~~. . - :.- . . . :. . . . . . . ................. -.....:.-....I
significant needs of the sector--not Bo 3.2 Key-Features of the-Po r Setoleast the need to mobilize private . Rfom Policy Int.odu.cd .capital to finance the sector's Sta^ng 1991expansion and complement the - . ....rapidly dwindling public sector - s cotflpaes y onstt, ow opea
resources--in 1991 the Govern- guenratar saonsae nd texc$fonutlcrlment of India announced a policy .......that would allow domestic and * - einty is pi in generati-n''-m- M's-foreign private companies to - A - rno eityof6pte ta t Wad invest in the power sector. (Box Yor PLF of-68.5 t) isg teed b a tpar3.2). Although privately-owned - ff Orula wichco er' s both fixed a 'ariable Coats'entities have been operating in the * Addifioa kte on qty is a we e t esector in the past, they have -- pcet' -accounted for a small share of the - -. I
a h-ere is free repatia of diideds mid o nst a. foreignsector's total output since the eqityd lo,1960s. Encouragement of privateinvestment in power thus marked a k A five ye taX WIb,lay is a6ai f ne gern ad
significant break from past i .government policy. Most of the * - hreisptectinfomexc ten,.
expressions of interest from theprivate sector since the pre . ad way:announcement of the new policy *. C ut i seqpt he
have been for generation projects. ............Interest in distribution is more ................recent and clearly the result o A p po
other sectoral changes underway . - ieonofte ev teovern-etor under consideration in somestates.
The Invitation and the Negotiation of Entry
The Invitation. Under the 1991 amendment, private companies can build, own, andoperate power stations pursuant to certain terms and conditions detailed in a Notification, datedMarch 13, 1992, from the Ministry of Power and Non-Conventional Energy Sources, Departmentof Power, as amended (Notification). Promoters of such projects are expected to negotiatepower purchase agreements (PPAs), with the purchasing SEBs, that would reflect those termsand conditions.
The Notification itself has several shortcomings and ambiguities. Its implementation alsohas been rendered difficult by uncertainties in the approval process and a general lack of

-84-
coordination among the various central and state government agencies involved. Attempts havebeen made, from time to time, to clarify the policy and to correct its shortcomings, through theissue of amendments to the Notification and other guidelines.
The Notification deals only with the tariff and not with the host of other issues that needto be addressed in a PPA. These include the type of power station to be built, its performancecharacteristics, the extent to which it is to be subject to dispatch by the SEB, and the extent of thegenerating company's liability if the power station is not completed on time or fails to meet thespecification in all respects. The Notification is also designed for a base load plant which ispermitted to generate at full load whenever possible. Although the Notification acknowledgesthat a generating plant may from time to time be asked to reduce output by the RegionalElectricity Board, it does not expressly recognize the right of an SEB to ask a contracted powerstation to do so. Nor does the Notification make any allowance for the additional fixed andvariable costs that are incurred when a generating plant is slowed down. A PPA that requires anSEB to treat a generating plant as base load over a period of 20 to 30 years and does not allowthe SEB to dispatch it in economic merit is likely to impose significant costs on the electricitysystem. The PPA should give the SEB the absolute right to require a generating company to backdown its plant when necessary for the security and stability of the SEB's electrical system.
In order to adapt the Notification to deal with dispatchable plants, a number of changeswould need to be made to its wording, though not necessarily to its underlying principles. Forexample, references to plant load factor would need to be changed to refer to availability, withsome provisions being added to indicate how availability would be determined and to discouragegenerating companies from overstating their availability.
The Notification also has all the appearances of a cost-plus approach to tariff setting dueto its frequent references to the costs actually incurred by the generating company. It hasundoubtedly been interpreted in that way by many developers and SEBs. A cost-plus structurewould have the highly undesirable consequence of encouraging the generating company to inflateits costs. It would place also on the SEB the responsibility for monitoring and approving thegenerating company's actual expenditures. In practice, the Central Government has interpretedthe Notification as requiring the tariff payable under the PPAs to be calculated on the basis of thecapital costs and the capital structure approved by CEA and the norms approved by theNotification. Adjustments are allowed to the extent necessary to reflect changes in cost elementssuch as interest and currency exchange rates that are treated as pass-through items in theNotification. The Notification should be revised to reflect this practice.
The Administration of Entry. In addition to the establishment of the InvestmentPromotion Cell (IPC), a High Powered Board (under the Chairmanship of the Minister of Power)was also established to facilitate project implementation by serving as "a single point forum forfaster clearances of the proposals received within a definite time frame". In addition, common toall sectors, investments with substantial amounts of foreign participation are to be approved bythe Foreign Investment Promotion Board (FIPB).

-85-
There has been considerable interest, since the new policy was announced, from bothdomestic and foreign parties to set up new ("greenfield") power stations, although to date onlyone project has reached financial closure. As of December 1994, there were approximately 108expressions of interest for private power projects, amounting to about 35,000 MW of capacity(nearly half of the existing installed capacity). However, actual progress in bringing the projectsto fruition has been slow. In addition, the process of negotiating the suite of contracts that makeup the typical IPP is inherently complex. The close interdependencies between fuel supply,operation and maintenance, turnkey construction, and electricity offtake agreements and thefinancing arrangements inevitably, mean slow progress when one actor wishes to change certainparameters in the contractual matrix. Despite the inherent complexities in arranging and closingnon- or limited recourse project financed IPPs, there are nonetheless additional reasons in Indiafor the slow pace.
Apart from collecting clearances from various departments of the state government andCEA, a project generally need clearances from the Ministries of Power, Finance, Environment andForests, Petroleum and Natural Gas or Coal, and possibly Railways, Shipping and SurfaceTransport. Other relevant entities include the Central Water Commission, the Directorate Generalof Civil Aviation, and the Reserve Bank of India for all the consents required under the ForeignExchange Regulation Act, 1973 (FERA). The role that had originally been envisaged for IPC,that of a one-stop window for project developers, did not actually materialize. The reason wasthe split of responsibilities between the central and state governments, but also because of itsinadequate institutional set-up. The number of clearances and the number of relevant bodiesinvolved has limited the ability of the IPC to ensure that all clearances are granted expeditiously.In addition, although the states, through their SEBs and the state governments, have a variety ofresponsibilities for the implementation of the projects (such as assistance with the permit andclearance process, provision of construction power and water, grid connection), they have notcarried out these responsibilities expeditiously in all circumstances. The investment, contracting,and approval processes could be facilitated by improvements at the state level as well.
There also has been uncertainty in the process, partly because it was (but is no longer)new, and also because of a failure to provide reasonably precise guidelines for promoters tofollow for project approval. In some instances, contracts seeking Government of India's counter-guarantees have been reviewed by both CEA and the Ministry of Finance, with different results. Indetermining whether a PPA meets the requirements of the Notification, CEA uses a tariff modelto identify the maximum price permitted by the Notification at different plant load factors andcompares it to the corresponding price offered under the PPA. For projects seeking aGovernment of India counter-guarantee, the PPAs also are subject to review by the Ministry ofFinance. Justifiably, the Ministry of Finance considers not only whether the PPA complies withthe Notification, but also reviews the acceptability of the PPA documentation itself against itsown guidelines. The Ministry of Finance guidelines were developed essentially to address theshortcomings of the Notification and ideally should have been issued in the early stage of the newpolicy initiative.

-86-
A number of PPAs reviewed by CEA and Ministry of Finance have had to be extensivelyrenegotiated to conform to both the Ministry of Finance guidelines and the Notification beforebeing approved. Although it has proven frustrating to the developers and the SEBs concerned,the modifications achieved in the process have brought the PPAs to the standards required ofmajor contractual documents designed to last for 20 or 30 years. The modifications also haveresulted in substantial savings to the SEBs through a more balanced allocation of risks. Essentialto the latter is still the need to develop commercially enforceable contracts for the supply ofIndian fuel, particularly coal, but also gas. The absence of such fuel contracts simply results in areallocation of risks, since promoters are reluctant to take the fuel risk in such circumstances.
Commercially-enforceable coal supply contracts will be of critical importance to privatepower development. Such contracts require that coal producers and transporters provide powerplants with adequate supplies of consistent quality fuel according to an agreed schedule and at apredictable price. The effective use of commercially enforceable contracts in the integrated coalenergy chain (coal production, preparation, transportation and conversion) can achieve importantincreases in power sector efficiency. This integrated approach enables the power plant designerto minimize costs by integrating the selection of fuel source, fuel preparation, transportation, plantdesign and citing. It also provides the investor with assurances regarding fuel supply.
An integrated approach, including greater using of coal preparation facilities, can alsoimprove the efficiency of the existing coal energy chain. For example, using increased volumesof prepared coal could improve the thermal efficiencies of many existing power plants. Thiswould reduce generating costs per unit of electricity and increase output at existing power plants,thereby reducing requirements for new plants. Greater use of coal preparation would also reducethe volume of material that would be shipped on the railroads and thus help to reduce pressure ontransportation capacity.
Coal India Limited is in the process of implementing a reform program that will enhanceits ability to respond to commercial forces. But improvements in efficiency can also be achievedby allowing new privately-owned and privately-managed coal mine developments. Recognizingthe potential benefits of competition and the need to find new sources of capital to finance a rapidgrowing coal supply, the Government of India is opening the coal sector to private investors.Thus, as well as private power generation, there can also be private supply of fuel to the newpower plants. This will require a review and revision of the rules and regulations affecting thecoal industry which will be critical to the decisions of private companies to enter into coal mininginvestments.
While a number of companies have expressed interested in entering the sector, they haveso far been unable to secure access to the necessary coal reserves. The key barrier appears to bethat the necessary mechanism has not been established for the provision and allocation ofunexploited mining blocks to potential private sector investors. Mechanisms should be developedto return some of the coal-bearing lands presently held but not exploited by Coal India to the

-87-
government. Those areas can then be made available to interested private sector investors forexploration and development through the stewardship of an independent agency with well-definedlicensing and operating procedures and requirements.
Different, as well as additional, issues arise with major hydroelectric projects and powerplant refurbishment. While the former are addressed in the Notification, the latter are not.There is a growing interest in power plant refurbishment in which the private party makes theinvestment and sells power to the SEB pursuant to a PPA. For example, a competitivesolicitation recently has begun in Uttar Pradesh for the Harduaganj coal-based power station.Such refurbishment should be vigorously encouraged. Most refurbishment is likely to presentgreater risks and contingencies to the private parties which will be reflected in the terms andconditions of the PPAs. Also, refurbishment raise the very difficult issues associated with theretention (or not) of existing SEB employees. As discussed earlier, the Notification containscertain norms for new thermal projects. Refurbishments, however, will vary significantly fromproject to project, depending upon the age and condition of the equipment, and so on. Thus,these are not easily amenable to a "normative" approach. Nonetheless, because these projectswill generally exceed the Rs I billion standard that triggers CEA review, clarity is neededregarding the mode and scope of the center's review of plant refurbishments and associated PPAs.
The negotiation and approval process has been slowed down considerably by a generallack of understanding by most central and state authorities of the complexity of the contractualarrangements and a clear reluctance to seek and engage appropriate professional advice. As aresult, SEBs and state governments often find themselves unwilling or unable to take control ofthe negotiation process and anxious that developers might drop their projects if the states pressedtoo hard during negotiations. Some developers could exploit this situation to their advantage andnegotiate PPAs that are generally one-sided, ambiguous and insufficiently comprehensive. TheCentral Government ought to take an unequivocal stance on the need for the states to takeprofessional advice for PPA negotiation.
Several problems encountered so far by the implementation of the new policy would havebeen greatly diminished if, from the very beginning, the SEBs had not only taken professionaladvice, but also sought investment proposals through a well-structured and fair system ofcompetitive bidding. To date, negotiation and contracting have been conducted throughMemoranda of Understanding (MOUs) in which there has been no competition among privatesector firms or consortia. The lack of competition has made it difficult for the SEBs and stategovernments to justify the tariffs without also being able to claim that they were the best projectsavailable (as evidenced by a fair competition). Recently, this has begun to change and some SEBsare in varying stages of competitive tendering processes. Examples include Andhra Pradesh,Rajasthan, Uttar Pradesh and Orissa. Competitive bidding more recently has been reinforced bythe Ministry of Power's decision to make it official policy. Adequate safeguards need to be put inplace now to ensure that the policy is appropriately implemented at the state level.

-88-
The Central Government should clarify the nature and scope of its review of competitivelybid projects. One could envisage that, rather than involving a detailed scrutiny of the selected bid,such review could be limited to: (a) checking the fairness of the competition by which the PPAwas awarded; and (b) evaluating the PPA against the guidelines of the Ministry of Finance todetermine whether there is need for a project. The review should also ascertain whether there is areasonable allocation of risk to the private developer to justify awarding the project to the privatesector. At least one project, a lignite station and captive mine in Rajasthan (Barsingsar Project),has recently been put up for competitive bid in the real sense, after consultation with CEAregarding its review process. However, some important judgments had to be made in thepreparation of the Request for Proposals (RFP) for the Barsingsar Project because CEA's reviewprocess has yet to be clearly articulated.
Conditions of Operation
Power Generation. The Notification currently is interpreted by developers and someSEBs as setting the appropriate tariff for private power projects. The very existence of theNotification conditions developers to expect nothing less than the maximum permitted tariff. Forsome power projects, the norms contained in the Notification (such as the normative heat rate ofa coal plant) are excessively generous and allow independent power producers (IPPs) to makelarge profits in addition to the return on equity linked to the Plant Load Factor (PLF). TheNotification should make clear that it sets a maximum tariff, and SEBs should be expected tonegotiate a tariff which is substantially lower than the maximum.
The Notification places too much emphasis on restricting the profits to be earned bydevelopers and too little on the tariffs to be paid by the SEB. The Notification provides that thetariff offered by the developer of a new power station shall be calculated so as to allow thedeveloper to recover the fixed and variable costs of building and operating the power station. Theoperator should not make more than the prescribed rate of return on equity, assuming that thePLFs, the station heat rate, operation and maintenance expenses and insurance costs correspondto the normative levels set out in the Notification.
The most recent amendment to the Notification permits certain deviations from the norms;that is, provided the "overall per unit tariffs of electricity calculated on the basis of the norms indeviation does not exceed the per unit tariff calculated on the basis of the norm specified in thisNotification." However, the SEBs are not permitted to deviate from the norrms concerningoperation and plant load factor. Consequently, tariffs still generally need to be structuredaccording to the basic principles set out in the Notification if only to allow the CEA to comparethe tariff under the PPA with the normative tariff
The presence offinancially weak SEBs in the operating environment is a major issue forprivate investors. The severe problems faced by the power sector at the state level areattributable to the poor operational performance of the SEBs, and more importantly, the politicalinterference by state governments. While in the existing law the SEBs have considerable
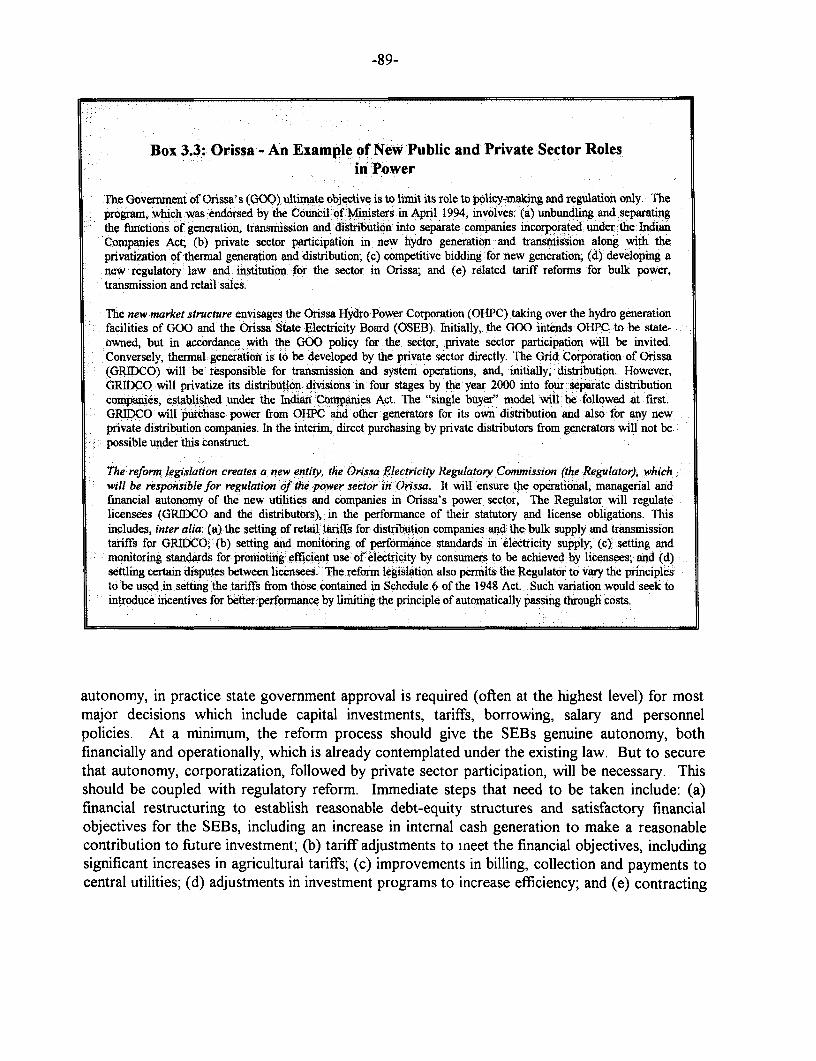
-89-
Box 3.3: Orissa - An Example of New Public and Private Sector Rolesin Power
The Government of Orissa's (GOO) ultimate objective is to limit its role to policy-making and regulation only. Theprogram, which was endorsed by the Council of Ministers in April 1994, involves: (a) unbundling and separatingthe functions of generation, transmission and distribution into separate companies incorporated under the IndianCompanies Act; (b) private sector participation in new hydro generation and transmission along with theprivatization of thermal generation and distribution; (c) competitive bidding for new generation; (d) developing anew regulatory law and institution for the sector in Orissa; and (e) related tariff reforms for bulk power,transmission and retail sales.
The new market structure envisages the Orissa Hydro Power Corporation (OHPC) taking over the hydro generationfacilities of GOO and the Orissa State Electricity Board (OSEB). Initially, the OO intends OHPC to be state-owned, but in accordance with the GOO policy for the sector, private sector participation will be invited.lConversely, thernal generation is to be developed by the private sector directly. The Grid Corporation of Orissa(GRIDCO) will be responsible for transmission and system operations, and, initially, distribution. However,GRIDCO will privatize its distribution divisions in four stages by the year 2000 into four separate distributioncompanies, established under the Indian Companies Act. The "single buyer" model will be followed at first.GRIDCO will purchase power from OBPC and other generators for its own distribution and also for any newprivate distribution companies. In the interim, direct purchasing by private distributors from generators will not bepossible under this construct.
The reform legislation creates a new entity, the Orissa Electricity Regulatory Commission (the Regulator), whichwill be responsible for regulation of the power sector in Orissa. It will ensure the operational, managerial andfinancial autonomy of the new utilities and companies in Orissa's power sector, The Regulator will regulatelicensees (GRIDCO and the distributors), in the performance of their statutory and license obligations. Thisincludes, inter alia: (a) the setting of retail tariffs for distribution companies and the bulk supply and transmissiontariffs for GRIDCO; (b) setting and monitoring of perfornance standards in electricity supply, (c) setting andmonitoring standards for promoting efficient use of electricity by consumers to be achieved by licensees, and (d)settling certain disputes between licensees. The reform legislation also permits the Regulator to vary the principlesto be used in setting the tariffs from those contained in Schedule 6 of the 1948 Act. Such variation would seek tointroduce incentives for better performance by limaiting the principle of automatically passing through costs,
autonomy, in practice state government approval is required (often at the highest level) for mostmajor decisions which include capital investments, tariffs, borrowing, salary and personnelpolicies. At a minimum, the reform process should give the SEBs genuine autonomy, bothfinancially and operationally, which is already contemplated under the existing law. But to securethat autonomy, corporatization, followed by private sector participation, will be necessary. Thisshould be coupled with regulatory reform. Immediate steps that need to be taken include: (a)financial restructuring to establish reasonable debt-equity structures and satisfactory financialobjectives for the SEBs, including an increase in internal cash generation to make a reasonablecontribution to future investment; (b) tariff adjustments to meet the financial objectives, includingsignificant increases in agricultural tariffs; (c) improvements in billing, collection and payments tocentral utilities; (d) adjustments in investment programs to increase efficiency; and (e) contracting

-90-
with the private sector or NTPC for the rehabilitation and operation of poorly performing stationsand other services. Orissa is making commendable efforts along these lines (Box 3.3).
To mitigate the risks associated with financially weak SEBs, the Central Governmentformulated a guarantee policy. It requires the state government to guarantee SEB payments. TheCentral Government then provides a counter-guarantee. This counter-guarantee policy is notsustainable as it imposes a significant contingent liability on the national balance sheet whileproviding limited assurance to the Central Government that, in return, states are takingappropriate steps to improve the creditworthiness of power entities. Thus, the CentralGovernment has already announced that counter-guarantees would no longer be provided. Anumber of alternatives have been put forward. The alternatives consist of various forms ofescrow arrangements which would provide for payments for power sales to be deposited indedicated escrow accounts for the benefit of the private promoter. Direct sales to creditworthyindustrial consumers is another scheme being considered. Such arrangements, which only take ashort-term view of the problem, need to be carefully considered as they detract from thefundamental issue of SEB creditworthiness. They allow the private promoter to select the SEB'smost creditworthy customers or give him "first call" on all SEB revenues. At best, such schemeswould be feasible only at the margin and therefore could not be applied on any significant scale.Follow-on projects would become difficult to implement as subsequent lenders would have"subordinated" rights on SEB revenues or would have to rely for payment on an SEB with a lesscreditworthy customer base. Moreover, such arrangements tend to be technically difficult toadminister.
The World Bank, in response to a request by the Government of India, is developing aprogram for the use of World Bank guarantees in support of private investments in the powersector. Thus far, the proposed scheme is the only alternative to counter-guarantees that takes along-term view of the problem. It clearly links the provision of guarantees to tangible measurestaken by the states to enhance the creditworthiness of their SEBs and state governments,whenever a minimum level has already been achieved (determined by a detailed credit assessmentof the institutions). Other tangible measures include sectoral restructuring when this is consideredthe only avenue to enhance the financial standing of the concerned state institutions. Given theeligibility criteria that are being developed, states could be declared eligible for Bank guaranteesunder the following scenarios: (a) both the SEB and the state government are consideredcreditworthy; (b) because of the poor financial standing of the SEB and its government, the statehas started to implement power sector reforms in a meaningful way, thus laying the ground for theestablishment of creditworthy utilities in the state; and (c) in some circumstances, the projectcompany which a Bank guarantee could support is contracting with a creditworthy distributioncompany in a state that has a record of sound sectoral and regulatory policies. In addition, theBank would require that, before entering into negotiations with the project developer, theparty(ies) representing the state government's interests engage a team of competent legal,financial and technical advisors to assist in the preparation and negotiation of the PPA.

-91-
Distribution. Although several distribution companies in India have been operating priorto 1991, the amendments to the 1910 and 1948 Acts were also designed to improve the incentivesand encourage additional private sector participation in distribution. Since distribution is carriedon primarily by the SEBs, reform in distribution necessarily requires state government support forthe reform agenda. Moreover, the existing legal and constitutional position of the electricitysector functions as a limitation to interventions by the Government of India at the state level.Therefore, many of the key reforms require and point to the importance of reform efforts beingtargeted at the state level.
The amendment contemplates arrangements, not including outright purchases or long-termleases, in which the recovery of, and return on, investments are at issue. Other types ofarrangements, such as short-term management contracts of either one or more distributionfunctions (such as meter reading and billing) or of the entire operation, are also possible and donot require licenses. These are straight fee-for-services arrangements in which the SEB retainsboth ownership and the responsibility for major investments. The smaller investments required formanagement contracting--computers, trucks and so on--may be recovered in the contract fee.Such arrangements are being tried out in Rajasthan for a number of distribution circles. They arelikely, nevertheless, to be insufficient to address the fundamental weakness of the SEBs in the areaof distribution.
There are a number of important issues that will have to be addressed in order for privatecompanies to play a more significant role, and to undertake sizable investments (including lines,meters and substation equipment) in the Indian distribution business. Attracting the private sectorinto distribution--that is, beyond the existing private licensees--is more complex than it is forgeneration. The issues include:
* the appropriate designation of distribution territories, so as to satisfy technical, financial,and social criteria;
* the negotiation of meaningful performance standards;
* whether the performance standards can be met in all instances without taking control overgeneration;
* the means by which the retail tariffs will be set;
* how present employees are to be dealt with; and
* the creation of an independent regulator.
Distribution territories. Specific areas or territories will have to be designated for theprivate sector. While it is conceivable that a designated territory might in some instances be theentire area served by the SEB, it is much more likely to be a portion, at least at first. The

-92-
designation may happen as the result of a major restructuring effort, or the SEB may stay intactbut for an area set aside for the private sector. An example of the latter is the NOIDA area,which Uttar Pradesh carved out a few years ago, although private operators do not consider thislimited model as particularly successful. NOIDA is a relatively small (45 MW or so) area that ishighly industrial. Thus, it is not a 'typical' area with a representative mix of customers. TheNOIDA agreement--between Uttar Pradesh and CESC--has not worked satisfactorily and needsto be reconfigured if CESC is to continue to be involved. One of the main problems is thatconsumers are not willing to pay a higher tariff where their neighbors who are supplied by theSEB are getting power at a lower price. Uttar Pradesh currently is evaluating variousrestructuring options, including a more extensive privatization effort in distribution. Thedesignated area must be sensible as a technical matter but, ideally, should also contain a mix ofcustomers. Further, it should be large enough to permit technically feasible and measurableimprovements in service and adequate tariffs. The private sector should not be allowed to selectonly the best customers as that would only make it more difficult to encourage involvement in theremaining distribution area.
Performance standards. The license or contract should contain performance expensesand investment expenditures on a cost-plus basis. The overall rate of return to the private entityshould be partially dependent upon meeting certain objective criteria. As a strategic matter, itmay be sensible to increase the performance requirements for distribution areas leased or sold tothe private sector gradually, as the perceived risks associated with those investments diminish.This needs to be explored.
Vertical integration. It is important for long-term success that electricity customersexperience improvements in service. Some potential licensees have questioned whether there canbe long-term success if significant generation problems continue. They are concerned also aboutnot obtaining fair power allocation where they do not own or directly contract with the powerproducers. There is concern among potential investors that their efforts would not be wellreceived if customers continued to experience a substantial number (and length) of outages evenif, as a technical matter, they could be attributed to generation (or transmission) problems. Inother words, they see a benefit in some degree of vertical integration, on the assumption that itwill allow for a more reliable power supply. Issues such as this are most important and need to besorted out on a case-by-case basis.
Labor retrenchment. There are substantial problems associated with "excess" labor inSEB distribution (and in the SEBs generally). As noted earlier, this problem also arises in regardto private sector investments in power plant refurbishments. There are no simple answers to thisproblem. While it will be mitigated to some extent by attrition, it is evident that attrition alonewill not suffice if private sector participation is even modestly robust in the near term. Withexpansion of the system due to larger investments in the sector, the employment opportunities arelikely to grow. However, a large number of unskilled employees may not be able to takeadvantage of such opportunities as they may not be retrainable and redeployable.

-93-
Regulation. Establishing an independent regulator should be among the highest prioritiesfor distribution. By "independent" regulation, is meant regulation that is as free as possible fromgovernment interference in its staffing, processes and decisions, and where appeals from adversedecisions are to the courts rather than the government. It also means, of course, that theregulator is granted, by legislation, the authority to render those decisions that are now thegovernment's to make. Independent regulation would provide a measure of comfort to both theprivate sector investors and the customers. The requirements for independent regulation vary withthe structure of the sector and the terms and conditions of the licenses given to private sectorcompanies. The scope of the regulatory mandate--what is reviewed, subject to approval, and soon--will depend upon a number of factors, including the license requirements themselves. Theabsence of independent regulation may therefore affect the extent to which, for example,significant performance standards can be built into the licenses.
The 1991 amendment to the 1910 and 1948 Acts, and the promulgation of theNotification by the Ministry of Power, preceded the recent restructuring programs in severalstates. At the time, the Government of India contemplated private sector involvement in thosedistribution areas--such as NOIDA--which were culled out of an SEB that otherwise wouldremain a vertically integrated whole (but for new private sector IPPs); this is no longer a tenableassumption for all states. Moreover, the restructuring efforts at the state level will affect the rolesof both the state and Central Governments and will create additional pressures for changes inregulation and law. The privatization of distribution areas in India will thus take place in adifferent, and somewhat unknown, environment from that which prevails today
In summary, the foregoing discussion underlines the dynamic and changing nature of theenvironment within which private sector involvement in India's power sector is contemplated. Thesector clearly is in a state of transition and many of the changes under consideration aresubstantial. Solutions to the various issues raised above, in particular the establishment of aregulatory regime that will govern power sector's operations, must be designed to allow for andfacilitate appropriate modifications to the sector. At the same time, regulation will have to ensurethat high quality electricity services are provided to consumers at fair and equitable prices, andthat investors are given the opportunity to earn reasonable rates of return on their investments.
TRANSPORT: SELECTED ASPECTS
Introduction
The administrative and regulatory issues associated with providing transport in India (as inmost large countries) are complicated, most obviously because of the heterogeneous nature oftransport services--freight and passenger traffic on roads, railways and ocean. Each of thesemodes of transport has developed at different historical rates with ocean shipping, ports andrailways ranking as the oldest established modes. These were followed by bus and truckoperations on the highways and, most recently, commercial aviation. The laws and regulations forthe older modes are generally rooted in the nineteenth century while those for road transport and

-94-
aviation generally are based in the twentieth century. At the Union level, the administration ofthese modes of transportation reside with three ministries. One ministry presides over therailways, and another ministry (the Ministry of Surface Transport (MOST)) presides over nationalhighways, ports and ocean shipping. The Ministry of Civil Aviation presides over airports and airtransport. But whereas the Constitution of India gives the Central Government authority overaviation, national highways, railways, ocean shipping and the principal ocean ports, stategovernments are given authority over state highways and district roads, urban and inter-city busoperations, and the smaller ocean ports. Trucking falls under the controls of both the Central andstate authorities.
Despite the complexity of introducing and managing change in such an environment, agreat deal of transport sector reform has been accomplished already in India with private servicesin trucking, bus and shipping, and steps toward the privatization of rail container transport. Infact, India already has set up a legal and administrative framework in which private domesticentrepreneurs are willing to finance, maintain and operate extremely mobile pieces of capitalequipment--trucks, buses, flatcars and ships--in a competitive environment.
The discussion which follows below highlights two broad areas of administrative andregulatory challenge in the transport sector. The first is the development of effective regulationsto promote competition and efficiency. Trucking and intermodal freight transport will be used toillustrate this issue. The second area is investment in fixed transport infrastructure where privateinvestment currently is minimal, and which rapidly is generating physical bottlenecks to moreefficient use of the generally adequate privately financed and operated equipment. The discussionhere will center in roads, ports, highways and railway infrastructure.
Improving Competition and Efficiency
Trucking. The trucking fleet on Indian roads is almost entirely privately-owned. The keyissue facing the industry is administrative barriers to efficiency. In a recent survey, truckersidentified, as their most serious concern, delays caused by police check posts, sales tax barriersand octroi collections before entering cities. Generally, inadequate road widths and poor ridingquality of roads were the second concern. Currently, trucking accounts for about 60 percent ofall inter-city ton-kilometers. This share (based on the experience of other countries) could reachas high as 80 percent and then stabilize, depending on the ability of rail to offer competitiveservices. Few countries at India's stage of development have advanced trucking reforms so far,and many more developed countries have yet to do so.
Some states began levying tolls at their borders on out of state truckers for use of stateroads but this was struck down recently by the Supreme Court. The Court ruled that, althoughtoll roads are legal, the charges in question were not specific to a particular route, anddiscriminated between in-state and out-of-state truckers. Other states have imposed restrictionson the movement of food grains out of state, and all states tax trucking as a major source ofgeneral revenues. With an economy dominated by roads and road transport, it is increasingly

-95-
important that truckers, at least on the National Highways, have much the same rights as railwaysto travel interstate with a minimum of delays.
Another issue facing the trucking industry is that it has been effectively precluded fromcarrying container cargo, especially import cargo, over the road. This is because the IndianCustoms Service had interpreted its rules and regulations in a manner that precluded trucks fromcompeting with the railroad's Container Corporation (CONCOR). Customs regulations providedthat transshipment of imported goods by motor vehicles should be allowed only after taking intoconsideration available alternate (public) means of transport; that is, rail, coastal vessel, or aircraft. Use of this rule, and very high and administratively cumbersome bonding requirements,precluded trucks from competing. In December 1994, Indian Customs relaxed these constraints.It remains to be seen how customs officers actually interpret and implement the new regulation.
These were not serious problems until recently because India's foreign trade was not largeand the benefits of containerization were not being pursued. The first International StandardsOrganization (ISO) containers arrived in Indian ports in the mid-1970s but the full benefits ofdoor-to-door delivery were not obtained because the containers were not allowed inland. Theyhad to be unloaded or loaded in the ports. Only in 1984 was the first inland container depot (ICD)established in Bangalore by Indian Railways. Today, about 35 percent of import/export generalcargo for India moves in containers versus about 65-70 percent for other developing countries.Of the cargo that arrives/departs in containers, only 20 percent moves inland in containers eventhough 60-65 percent of the containerized cargo has origins/destinations inland. The potential forfull blown, door-to-door, intermodal service with all its benefits is enormous.
CONCOR will not be able to handle it all efficiently. This is because Indian Railways doesnot have the track capacity necessary for high speed container trains and because, as a nearmonopoly, CONCOR need not do the job well. The effort should be supplemented with effectivetrucking competition. To do this, the Indian Customs Service needs to assure a level playing fieldfor qualified truckers. This does not require a change of the law or even the regulations. Itrequires a change in attitudes and interpretation of the regulations which is now possible followingthe changes in December 1994.
Multimodal Freight Transport. The Multimodal Transportation of Goods Act (1993)constitutes the legal framework for the development and promotion of multimodal transportservices (MTOs)--door-to-door transport services for domestic and foreign containerized tradesin India. The Directorate General of Shipping, which is authorized to grant MTO status, so farhas licensed 74 MTOs. Eight of these are foreign companies, of which three are shipping lines.However, the intended effect of creating a network of MTOs to facilitate freight transportmarketing and raising the efficiency of container movement is materializing only slowly.
A principal shortcoming is deficiencies in the Multimodal Transport Document Ruleswhich were issued in March 1994. The prescriptions embedded in the Rules have not beenendorsed by the International Chamber of Commerce (ICC). ICC rules for the multimodal

-96-
transport documentation are widely accepted for international trade-related services transactions.The principal shortcoming of the Indian multimodal transportation legislation relates to theliability regime which specifies responsibilities for cargo damage or loss. ICC's review of theRules pointed out that:
* sections 13, 14, 15 and 16 impose absolute liability on the carrier beyond the scope of theHague Visby Rules;
* the definition of "carrier" was vague, and, in keeping with UNCTAD/ICC rules, neededto be amended to mean the persons who actually perform or undertake to perform thecarriage or part thereof;
* the definition of goods was so broad that the liability for certain items would be imposedon the multimodal transport operator while sparing the shipowner who did the substantialpart of the voyage; and
* six consecutive working days to make a written claim for losses or damage (that were notapparent at the time of delivery) was too long; three days was the desirable maximum.
Other concerns included:
* the loose definition of "multimodal transportation" which would make the Indianlegislation applicable to different modes of transportation outside of Indian, and transportthat had not originated in India;
_ the absence of a procedure to appeal the refusal by the authorities to register applicantswishing to carry on or commence the business of multimodal transportation;
v the need to make licenses valid for a longer period--five years as opposed to one year--toreduce the clerical burden of frequent renewal;
a the absence of a timeframe for disposing of applications for registration and renewal, aswell as appeals; and
* excessive details about the goods transported, especially in containerized cargo, that themultimodal operator is required to provide in the transport documents.
Attempts are now being made to solve these problems with appropriate revisions. After agood initial effort, it is important that these "loose ends" be tied as soon as possible.
Regulations derived from the Major Ports Trust Act (1963) and the Customs Act (1962)have generated a major problem in clearing containers, and moving them overland to and fromthe ports. Customs practices required a physical check of 10 percent of each consignment and 10

-97-
percent of the content of each box in containers. Only recently at the TKD facility in Delhi hasthis been changed to a random sample of containers (10-15 percent), as opposed to 10-15 percentof the contents of each container. In addition, because of inadequate inland transport and onerousdocumentary procedures, most import and export containers are still packed and unpacked in
Box 3.4: Existing Legislation Can AccommodatePrivate Sector Provisioa of Port Services
Major Ports Trusts Ad (1963)
Thae Act empowers the Port Trust to provide the full range of facilities and services, includinglanding, shipping, transhipping of passengers and goods, piloting, hauling, mooring, removing,hooking or measuring vessels and other services in respect vessels (Section 42(1)).
It enables the Board of the Port Trust to authorize any person to perform any services mentionedon terms and conditions agreed upon. But sub-section (4) states that, in such an event, theauthorized person sall not charge or recover for such services amounts in excess of the ratesstipulated by the Board.
The Act also enables private parties to construct and provide-within the limits of the Port or Portapproaches-the full range of port facilities (with their own finds).
It prevents the Board from leasing, farming, selling or alienating its power to levy rates under theAct, without the permission of the Government. Conversely, such leasing, farming, selling oralienating can be done with Governmental sanction.
The Indian Ports Act (190*)
The Act applies to all major and minor ports. The Act is regulatory in nature, coverirg issuessuch as the moving of vessels, pilotage, fire extinguishing apparatus for large vessels. It alsogives power to the Government against acts of defaults of port vessels or pilots.
Dock Workers (Regul.tion of Employment) Act (1948)
The Act pennits the creation of Boards. Boards are mandated under the Act to register dockworkers (stevedore labor) and employers to ensure more regular employment. Such schemesdetail the terms of employment and specify items such as recruitment and regulatory conditions ofservice. Registered employers make payments directly to the Board. In turn, the Board paysworkers directly.
The application of these schemes, however, can be limited to particular groups of dock workersand employers. And private operators can engage their own laborers subject to other labor lawssuch as the Industrial Disputes Act (1947).
ports. Container movements by rail between Delhi and Bombay are now handled by CONCORwithin 72 hours (against 14 days previously). In contrast, it takes approximately 30 hours on theaverage to then move the containers past the gate onto the port-controlled rail line within thestate-of-the-art new port at Nhava Sheva (JNPT).

-98-
Box i3.5: Some Private investment in Port infrastructureisOccurring Under:Existingi Legislation
India's new policy of allowing the privatesector into the petroleum product impo busiess hasled to a bom fin the construction of new specialized port and terinal facilities for petroleumproducts. About 160 private companies have entered: the field. New cryogenic terminals andpetroleum handling.facilities in eight ports now are being entirely financed with private capital.Here were cases where a seriousE infiastructure bottleneck existed that could not be relieved by0 iXthe current pt auithoties. The pressure exerted by deregulation of the petroleum productsindustry made the initiatives possible. Also, these specialized facilities in no way impinge on themovement of the traditional dry bullk, general, and container cargoes in Tndia's public ports.
CTh re are examples of marginal moves towards more liberal policies under existinglegislation. Tate Iron and Steel has taken on lease several berths at Haldia port. Privatestevedores have: been authorized to load and unload cargo at Tuticorin port. Ship repair and drydowk faicilities have been leased to private firms and a lamge foreign carrier has negotiated andpaid fora priority berthingright at the Bmbay container terminal.
This is a start but the potential for much more exists. The stae-of-the-art container facility atJNPT in New Bonbay coud easily be leased to a private consortium for rehabilitation, operation
Iand maitenance.. This would&more than double the ntaier throughput overnight. Thisinitiative, unlike the railways BOLT proposels and the BOT proposals of MOST for roads, hasless risk associated. The. revenue stream is reasonably predictable, the up-front investment arenot large and the equipment investments::are both mobile and useable elsewhere. The legalauthority exists as does the draf contract and several qualified groups are willing to bid.However, the proposal has been awaiting Cabinet consideration for about six months and nomovement has taken place.
Progress was made recently to improve the rail transport system and to link the ports to anetwork of container depots. Customs also are more flexible, particularly with entities such asnationalized industries. Their export containers may be sealed at the factory and shipped directly;their import containers may enjoy green channel facilities. However, these arrangements usuallyare not extended to the private sector. The old port and customs regulations evidently need to befurther adjusted to enable seamless intermodal transport of containers to and from quayside.
Facilitating Private Sector Investment in Fixed Transport Assets
Ocean Ports. The most difficult question for ports is the potential for private sectorinvestment in civil works such as breakwaters, entrance channels, wharf facilities, andwarehousing. A properly organized commercial port authority would be a financially self-sufficient real estate operation. It would be able to lease its land for privately financed andoperated special purpose dry and liquid bulk loading, unloading and storage operations andcontainer facilities. It would charge fees for jointly used facilities such as breakwater, channel,internal roads and wharves. It would be capable of raising capital to build jointly used facilities onthe domestic or international market on the basis of its financial strength. To do this would requirea Port Reorganization Act, as suggested by a recent study by the Asian Development Bank, that

-99-
would be tailored specifically to these ends and the abolition of the old enabling legislation. TheGovernment is not pursuing such comprehensive new legislation at this time for ocean ports.
However, most legal experts agree, and case studies suggest, that several activities arepossible without changing the existing major legislation--the Major Ports Trusts Act (1963), IndiaPorts Act (1908), the Dock (Regulation of Employment) Workers Act (1948) (Boxes 3.4 and3.5), and the Customs Act (1962).
Highways. The major hurdle to relieving the absorptive capacity constraint in roadbuilding in India is in making the new National Highway Authority (NHA) fully operationaLThe law bringing the NHA into existence was passed in 1988. NHA began operating in 1995 butseveral key staffing needs still have to be met. Currently, a study is being completed which willspecify precisely the structure and role of NHA's new organization and how it will operate. NHAwill preside over the existing 34,000 km National Highway System which is generally the mostdensely utilized. It will gradually take back from the state PWDs the responsibility for NationalHighway construction and maintenance. All new externally funded National Highway projectswill be undertaken by the NHA with help from the private engineering and construction sector asdiscussed in Chapter 2. NHA plans to use the BOT mechanism to attract private (foreign anddomestic) consortiums into designing, financing, building, operating and maintaining toll roadsand bridges for a pre-specified period (say 30 years). After this, the facilities will be transferredfrom private ownership to the relevant public authority.
Despite the greater complexity of BOT road projects, the central MOST has attempted todevelop a legal and administrative environment that will allow them to take place on nationalhighways. Currently, MOST is drafting amendments to the National Highways Act of 1956which will remove the most obvious obstacles that have kept even small BOT operations frommoving ahead. The principal items are: (a) the right to let such concessions to the private sector;and (b) the right of the concession to collect and keep the tolls. Some of the lessons being learnedfrom private electric power are directly transferable to the road sub-sector. Among them is theneed to: (a) avoid politicizing rate setting, (b) exercise care in determining the allowable rates ofreturn; (c) clarify the legal status of land on which the facility is built; and (d) providearrangements for dispute resolution outside the courts. The road sub-sector also hascharacteristics that will require unique administrative and legal arrangements. Often toll roads: (a)compete with routes which are free of tolls; (b) require fencing and police power to limit access;(c) involve the purchasing of land from hundreds or thousands of land owners; (d) enhance thevalue of land, especially at intersection; and (e) generate substantial non-toll revenue from roadrelated service facilities. The first characteristic of competition from alternative free routesgenerates uncertainty for private investors. This is because traffic and revenue projections dependcritically on the level of tolls charged and the quality of competing facilities.
Empirically based diversion curves or actual survey through interviews can be used toestimate the traffic split between the new toll and the existing facility. The survey should considerboth options, namely, 'with' free facility being improved and 'without' such an improvement in

-100-
the future. If the results indicate that the traffic would divert despite improvements in the freefacility, then there is no question of any guarantee. Consistent with international experience, thishas led many proponents of the concept to back only those facilities that have no effectivecompetition. Examples include some bridges and urban bypasses where urbanization precludesthe land acquisition necessary to expand competing free routes. Other than such naturalmonopolies, however, there are no legal or administrative measures that can reduce thisuncertainty and the draft legislation being prepared by MOST does not attempt to do so.
Fencing and police power for limited access is essential. Toll authorities will want theright to exclude overweight, oversize, or very slow vehicles. In India, traffic is heterogeneous andaccustomed to the right to access most public roads. The population is dense and villages arenumerous. Unauthorized access to the toll roads by vehicles and pedestrians will take placeinevitably. Encroachments in the rights-of-way also are a near certainty. If the private tollfacility is not policed effectively, the service levels will degenerate. The legal and administrativequestions of private or public police authority then loom large. The draft MOST legislationrecognizes this problem and proposes a change in the NHA Act that will specify offenses andallow the Central Government to give some police power to the private concession, includingtraffic control. Matters concerning law and order, terrorist acts and investigation of crimes will beexempted.
Typically, non-toll formal revenues from restaurants and service stations within the right-of-way vary between 6-15 percent of total concession revenues. Frequently, however, the profitsassociated with land outside the right-of-way is the most attractive feature of the investment.Those land owners in the vicinity of major toll road intersections typically experience largewindfall increases in land values the moment the locations of intersections are made public.Arrangements to obtain these profits can be either formal or informal. If formal, the commercialland may be purchased at the time the right-of-way is purchased by the public authorities and theland leased to the concession owner for development. Net revenues from the development of thisland may then become a part of the formal revenue stream of the private investors. If the informalroute is taken, the concession operators may, on their own account, make early private landpurchases which may in turn influence the precise location of intersections.
The land development approach to toll road projects, formal or informal, has its own risksin India. It is unclear whether the public right to eminent domain acquisition of private land canbe extended to those parcels of land that are not strictly needed for road right-of-way. It is notclear also whether the courts would approve of land acquired this way outside the right-of-wayfor purely commercial development, even though the profits from such a development would(transparently) help finance the cost of providing the road. Zoning and land use controls of stateand local governments would come into play for such parcels. Indian Railways has been tryingfor some time to develop idle land for commercial use and to develop air rights over urban stationsites. This has been blocked by state and local governments exercising their land use controlpowers.

-101-
To make the informal approach work, it is usually necessary to suppress the transparencyof the exercise and operate through local political rather than public bureaucratic channels. InIndia, the press is free and elections take place regularly. Power shifts over time and informalarrangements that are enormously profitable can be easily upset. Toll road projects with financialviability based on informal real estate operations are unlikely to flourish in such an administrative,legal and political environment. It would be better, therefore, to utilize transparent operationsbased on user charges and explicit road-related real estate development. This approach shouldrecognize that few such developments will be entirely self financing from tolls. This is theapproach being taken in the MOST draft legislation.
The final special characteristic of toll roads in India is that the gestation period will beunusually long. Feasibility studies and preliminary engineering are costly and time consuming.The draft legal document for a potential project, prepared by consultants in 1992, was 60 single-spaced pages of text. Negotiating such an agreement takes much skill and time. The landacquisition process and relocation of utilities for a major facility can take several years especiallyif there are large populations (as is frequently the case in India) to be resettled. The land itself canbe as much as five percent of project cost and the funds must be obtained from the governmentbudget. Unlike a private power project which can come on stream four years after the decision togo forward, it would probably be closer to ten years for a major toll road facility.
As the appropriate framework evolves (at the national and state level) for such privatesector participation in the sector, there is evidence that the authorities are forging ahead onseveral other fronts to encourage private investment (Box 3.6).
Railway Infrastructure. Railways, like highways, are seeking to attract private sectorfinance. In their case the appropriate acronym is BOLT--build-own-lease-transfer. Privateconsortiums would be allowed to build (or rebuild) a needed facility such as an electrified line orcommunication link. The consortia would own the facility for railway use in exchange for anannual lease payment which will cease after 20 years when the facility reverts to ownership byIndian Railways. This is a mechanism that has been used successfully in Germany to fundhighway, rail and waterway projects associated with the reunification effort.
A lease contract is, however, a claim on future revenue streams and the private investor ina highly specialized and immobile railway investment must judge the future net revenue earningpower of Indian Railways. However, there may be uncertainty about the financial soundness ofIndian Railways, for it has many money losing low density lines, much surplus labor and lowproductivity. In the past, monopoly revenues from bulk government freight services have coveredthe money losing operations but this is not likely to continue much longer.
The BOLT schemes have been advertised recently and expressions of interest requested.Relevant infrastructural bid documents, including draft agreements, already have been on sale andbids for four projects of gauge conversion have either just closed or are about to close. The draftdocuments for rolling stock procurement on the BOLT basis have been finalized. The BOLT

-102-
Box 3.6: Efforts on Several Fronts to Encourage and Expedite PrivateInvestment in BOT Projects
According, to MOST, there is an immediate need to: (a) increase the length of national highways from 34,000km. to 66,000 kln involving an expenditure of $7 billion; (b) upgrade single lane national highways to two lanehighways, and two lane highways to four lane highways in the heavy traffic corridors, at a cost of about $17billion, and (c) construct 10,000 km of expressways involving an expenditure of $25 billion (at 1994 rates) inthe next 20 years. Against this demand, the provision in the Annual Budget for national highways is only about$250 million dollars. Therefore, the authorities wish to encourage private investment in this infrastructure andpropose the following assistance:
a * Tax Incentives. The Government of India has announced a 5 year tax holiday to all companies thatinvest in infrastructure projects after April 1, 1995. Income-tax exemption of 30 percent would beallowed for a fArther 5 years. However, these incentives must be used by the investors within 12years after the facility becomes operational.
Land Acquisition. MOST will acquire land for highway construction, and give it to the privateinvestor unencumbered and free of cost. Private investors will be free also to obtain possession ofland by direct negotiations. The Government recognizes that the land acquisition process usuallytakes a long time. Accordingly, for highway projects, it will use the emergency provisions in Section17 of the Land Acquisition Act 1894 and take possession of land for projects pending the finalsettlement of compensation. This was done recently for projects such as the Ahmedabad VadodaraExpressway.
*: 0 : Clearances from Sub-National Govenments. N7HA, as the nodal point for BOT: national highwayprojects in India, will interact with state and local governments to help the private investor secure allclearances required.
Funding for Preparation of Feasibility Reports. To meet the initial cost of: preparing feasibilityreports and acquiring land (where necessary), NHA has proposed setting up a Rs. 10 billion revolvingInfrastructure Fund for highways. At present, the proposal is at the conceptual stage.
I * Technical Assistance. The Govemrment: of India will make use of foreign and Indian consultants toadvise on the implementation of BOT projects. The authorities expect that, with the help of theseconsultants, the time taken to prepare feasibility and preliminary engineering studies can be reduced.
State governments also are making efforts to attract. private investments in the sector. The goverunents ofMaharashtra, Gujarat, Madhya Pradesh, Rajasthan and Haryana have successfully amended their laws to enableprivate sector participation and collection of tolls. Some states already are seeing results.. In Rau-Pitnampurain the State of Madhya Pradesh, one company has successfully executed a BOT project. And West Bengal hasentered into an MOU with an overseas finn for a BOT highway project.
scheme has worked in Germany because the government is making or guaranteeing the leasepayments. In India, the success of this approach will depend much more on the financialcondition of the railways rather than an enabling legal and administrative environment.

-103-
TELECOMMUNICATIONS
Introduction
The development of the telecommunications sector is key to the growing internationalcompetitiveness of India. At Independence, there were only 82,000 telephone lines throughoutthe country. Telecommunications expanded slowly thereafter reaching the first one million linesin 1972. By 1994, there were roughly 8 million telephone lines. Despite an impressive rate ofgrowth of more than 15 percent per annum in recent years, there remains a large unmet demand(Box 3.7). The government has begun a program of reform aimed at promoting new competitiveentry by experienced private operators and tapping private sources of financing.
The Present Framework. Under the Indian Constitution telecommunications is on theUnion List, which means that only the Central Government can legislate on this important sector.
Box 3.7: A Large Unmet Demand for Telecommunication Services Exists
In March 1994, the number of telephone lines in India was 8.02 million. The waiting list indicated animmediate unsatisfied demand of a further 2.5 million customers. In addition, about 75 percent of India'spopulation lives outside urban areas. These areas are not adequately served with telephones. For instance,there are about 436,000 villages without access to telephone services.
The Department of Telecommunications (DOT) has estimated that the total demand for telephone services bythe end of the decade would be about 40 to 50 million. The investment needed to meet this demand would beabout $42 billion dollars, well outside the Government's financing capability. In addition, virtually no businessoriented services are available. There is a small amount of packet data switching service. But paging mobileand Very Small Aperture Terminal services are only now in the process of being licensed to private operators.
There is scope also for improving the quality of the existing services. Over the last five years, call completionrates have improved significantly. But subscribur fault rates remain very high, averaging around two faults perline per year (about 10 times higher than international standards). Many telephone exchanges in outlying areasare out of order for long periods of time.
This classification differs from that of the power sector which is on the Concurrent List, givingboth the Central and state governments power to legislate.
At present, sector-specific legislation comprises the Indian Telegraph Act of 1885 and theIndian Wireless Telegraph Act (1933), each as amended and supplemented by the Telecom Rules.Under the Indian Telegraph Act, the Central Government has the exclusive privilege ofestablishing, maintaining and working "telegraphs," but could license any person to establish,maintain or operate "telegraphs" within any part of India. However, until recently, the policy hasbeen for the government to be the monopoly provider of telecommunication services through agovernment department.

-104-
The Ministry of Communications is responsible for providing telecommunication servicesthrough DOT. A Telecom Board, chaired by the Director General, provides guidance to DOT.In 1986, the government corporatized two operational divisions of DOT. The internationaltelecommunications division was corporatized as Videsh Sanchar Nigam Limited. In addition,operational responsibility for providing telecommunications services in metropolitan Delhi andBombay was spun off into a separate corporation named the Mahanager Telephone NigamLimited. The DOT retained responsibility for providing services throughout the remainder of thecountry.
In May 1989, the government replaced the Telecom Board by a TelecommunicationsCommission having a much broader mandate of responsibilities. These included telecoms policy,regulation, technical research and development, design and manufacture of equipment, andprovision of telecommunications services. Five full time members of the Commission's boardretained day-to-day responsibility for separate operational divisions within DOT. The Chairmanof the Telecom Commission also was the Secretary of DOT. In effect, the functions of policy-making, regulation and operations were integrated. Because of the inseparability of theTelecommunications Commission and DOT's functions, the rest of the report refers only to DOT.
Sector Reform
Following an extended domestic debate and progress in liberalizing other sectors, theGovernment has liberalized also the telecommunications sector. The Telecom Policy statement ofMay 12, 1994:
* allows new entrants to provide basic telephone services to supplement DOT;
* maintains DOT's status as sole provider of long distance services and confirms that DOTwould remain a government department;
* sets targets for providing all villages with access to a telephone by the end of 1997;
* endorses the existing policy whereby the private sector will be the main provider of valueadded services;
* encourages pilot projects which envision an inflow of new technology and managementtechniques, and generally involve foreign investments; and
* indicates that mechanisms will be set up to protect consumer interests and ensure faircompetition.
Given the general nature of the new policy, the Government issued implementingguidelines in September 1994. In summary, these guidelines indicate that:
a Telecom Regulatory Authority of India will be established as an autonomous body witha Chairman and two members;

-105-
new entry for basic telephone services will be permitted as duopolies (that is, DOT andone other operator) in the 20 "Circles" into which the country has been divided;
DOT will retain the long distance monopoly for five years after which the decision wouldbe reviewed; and
foreign ownership of telecom operators will be welcome up to 49 percent of equity.
The liberalization of the sector is a landmark for India and reflects sound internationalpractice. In particular, the principle of allowing new entrants to compete with DOT in providingbasic telephone service is in line with best practices. Competition in the local loop is viableunder appropriate commercial and technical conditions. Furthermore, fair competition betweennew entrants and DOT will help to raise the quality of the existing service and encourage DOT tobecome more efficient. Similarly, allowing the private sector to provide the value added servicesis now accepted international practice.
The main objectives of the new telecom policy also are laudable. They include makingavailable, as soon as possible, a wide range of quality telecommunications services for all,including village access to basic telephone services, at reasonable prices. The policy permitscompanies in India to supplement the services provided by DOT, but requires them to maintain abalanced coverage of service. Furthermore, it recognizes the need to take action to protectconsumer interests and ensure fair competition.
Policy Implementation
Implementation of the new policy began in January 1995 when DOT issued tendersrequesting bids for the operation of basic telephone services in 20 separate geographic regions("circles") throughout India. As indicated earlier, one new entrant per region will be licensed ona non-exclusive basis as a local operator to provide basic telephone services in competition withDOT.
The Tendering Process. The tendering process has two steps. Bidders are first short-listed. Next, the financial offers of short-listed bidders are opened. The process is animprovement on the arrangements for selecting the first mobile cellular licensees for the majorcities in India. The tender outlines clearly the documentation required, defines the process, andproposes a reasonable two stage evaluation process. The essence of the bid process is as follows:
Bid Submission: Bids for basic services were to be submitted not later than March 30,1995 but this deadline was extended to June 23, 1995. They are to include detaileddocuments, such as the Memorandum and Articles of Association of the bid company, networth calculations and five years of Annual Reports of the bid company and its promoters,corporate profiles and detailed five year network and financial plans and funding sources.

-106-
Two Stage Bid Evaluation: A technical and commercial evaluation will be carried out,giving due consideration to the bidders' conformity to the technical specifications as wellas the commercial and eligibility conditions (which include minimum net worth ofpromoter companies and relevant experience). A short list of compliant bidders will beprepared. The financial offers of the short-listed bidders then will be opened in theirpresence and evaluated. The bidder offering the best financial bid for each area will beselected.
* Award and Negotiation. The License and Interconnection Agreements will be negotiatedwith the successful bidder.
In January 1995, the Government issued tender documents requesting bids for theoperation of mobile cellular telephone services in 20 separate geographic regions throughoutIndia. The bidding process is similar to that of basic services. Two private licensees will beselected to compete in each region; DOT will retain an option to operate a cellular mobile service.
The new Telecoms Policy also liberalized the provision of value added services except forpacket switching and related data services for which DOT retains a monopoly. On application toDOT, licenses may be granted for the provision of E-Mail, Voice Mail, VSAT 64Kbs closed usergroup systems, Videotex Service and Video Conferencing. DOT has begun to license radiopaging services through a tendering process similar to cellular services.
Clarifications. As the process of liberalizing the sector has unfolded, the Government hasbeen taking further steps to clarify the policy, and maintain the strong interest demonstrated bydomestic and foreign private investors. An important objective has been to assure thetransparency of the process of selecting new entrants by making clear the evaluation criteria in thebidding process; and to create a competitive operating environment in which operations can becommercially viable and fairly regulated. Thus, at end-May 1995:
* Clarifications were issued for the Basic Services Tender which now closes on June 23,1995. Some of the main clarifications were as follows: (a) access fees were reduced fromRs 0.64 and Rs 0.87 per unit for long distance and international calls, to Rs 0.50 and Rs0.70 respectively; (b) weights to be applied during the evaluation of the bids werespecified; and (c) the experience of a subsidiary or holding company of the foreignpromoter company will be permitted where the promoter company has more than 10percent equity in the bidder company.
* Clarifications were issued for the Mobile Cellular Tender which now closes on June 7,1995. One of the main clarifications lifts restrictions and allows direct interconnection toother operators, including cellular operators in the same region, without going throughDOT's network.

-107-
* The Government also announced that a Telecom Regulatory Authority of India is beingestablished. It will have responsibility inter alia for fixing tariffs, interconnect charges,dispute resolution between licensees, and redressal of customer grievances.
The announcement further stated that the Govemment has received the recommendationsof a study on the role and structure of DOT. The study recommends the separation of theoperations, policy and regulatory functions.
The Government has set up an expert body to examine tariff policy for the sector.
These are important developments, and further announcements and actions aimed atmaintaining the momentum of reform and the interest of private investors are expected. In furtherimplementing these reforms, two particular areas will require the Government's attention: (a) theoverall regulation of the sector; and (b) the role of DOT. In addition, the conditions of operationwill require continued review in light of actual experience and investor response.
Summary and Recommendations
To summarize:
The government's new telecoms policy and implementing guidelines are criticallyimportant steps towards rapidly building India's telecommunications infrastructure.
* A major step was taken toward implementing the new policy with the issue in January1995 of tender documents for licensing: (a) new telephone service operators; and (b)cellular services (for cities other than four for which licenses have been issued already).
* In recent months the Government of India has provided clarifications on a number of keyissues pertaining to the evaluation of tenders and the conditions of operation. Animportant objective of these clarifications has been to assure transparency in the evaluationof potential new entrants and to signal that the sector will have an independent regulator.
This said, a number of issues require further attention. The single most important issue issetting up the independent regulatory authority. Prompt action in doing so will: (a) reducethe bidding risks which result from the uncertainty related to tariffs, interconnectionagreements and conditions of the license; and (b) enable the regulator to begin thenecessary and unavoidable process of introducing, testing and refining the appropriatemechanisms for overseeing what could become one of the most complextelecommunications sectors in the world. In addition, time will be needed to develop andpass the necessary legislation.
* There is a need also to create an arms length relationship between DOT's operational roleand the government's responsibility for making policy decisions and awarding licenses.

-108-
This will free DOT and allow it to concentrate on preparing for competition. It wouldalso help to level 'the playing field' for DOT's competitors.
In addition, it will be necessary to subject the conditions of operation to continued reviewin light of actual experience and investor response.
In essence, while allowing new entrants to compete with DOT is an important and usefulstep, a balance is needed. Conditions of entry need to be reasonable enough to encourageinvestment, rigorous enough to prevent rent-seeking operations, and fair enough to promotebalanced competition with DOT. At the same time, however, it is appropriate to allow DOT aperiod of adjustment to train and strengthen its staff, improve its operational procedures andpractices, and generally increase its efficiency.

-109-
A SJUSTAINING PRIMARY EDUCATION REFORMS
INTRODUCTION
The development of physical infrastructure, and an enabling legal and regulatoryframework for private investment, will be essential for the future expansion of the Indian economyand for allowing individuals to take advantage of an environment increasingly conducive tomarket-led growth. Similarly, increases in human capital, particularly those resulting from a broaddevelopment of primary education, will be essential for enabling individuals to translate marketopportunities into reality and for ensuring that increases in economic growth are distributedreasonably equitably.
Chapter 2 of this report points out that in India, state governments are responsible forproviding several of the key infrastructural and social services crucial for accelerated andsustained growth, and poverty reduction. Primary education is one such service. Constitutionally,it is a concurrent responsibility of the central and state governments. State governments fundalmost all recurrent expenditures for primary education and around 63 percent of the planexpenditures. The Central Government is responsible for developing education policy incooperation with the states and also finances the rest of plan expenditure. Virtually all centralresources for primary education are channeled through the state governments. But there isincreasing concern that the financial and institutional constraints at the state level, as discussed inChapter 2, have eroded severely the capacity of the states to provide, or even supplement theprovision of, these services.
This Chapter explains that primary education is especially vulnerable to these constraints.Of all the services provided by state governments, education invariably consumes the largestproportion of the revenue budget. And primary education in turn consumes the largest proportionof the education budget. This is welcome because primary education also increases theeffectiveness of investments in other services such as health and nutrition. Thus, the Indianauthorities expanded primary education and attained high gross enrollment rates in the 1980s. Inaddition, a substantial national reform effort was launched in 1992 by the Central Government--under the National Policy on Education of 1986 (as updated in 1992)--to address some of thefinancial and institutional constraints facing the sector.
However, as explained in the rest of this Chapter, enormous challenges lie ahead.Universal primary enrollment will be achieved late in comparison with countries that have grownout of poverty quickly. And while most children enroll at the beginning of primary school, morethan half of the rural students drop out before completing the cycle because of the poor quality ofschooling and the pressures of poverty. Among those who drop out as well as those that stay,learning achievement is low. Furthermore, gender and caste disparities remain on most

-110-
educational indicators despite progress in reducing them. Wide disparities also exist between andwithin states. The new District Primary Education Program (DPEP) is the latest attempt by theauthorities to tackle the problems in the sector. This Chapter makes the case for sustaining suchreform efforts through a three-fold strategy involving: (a) more cost-effective interventions; (b)larger expenditures by state governments; and (c) selective and strategic leadership by the CentralGovernment.
BENEFITS AND PROGRESS
The Benefits of Primary Education
Primary education pays substantial returns to society world wide and India is noexception. In the short term, it: (a) raises the productivity and earnings of workers across theeconomy; (b) generates substantial additional social benefits in the form of improved family healthand welfare; and (c) and contributes to lower fertility and slower rates of population growth. Inthe medium term, rising primary education leads increasingly well educated parents to send theirchildren to school, with girls benefiting substantially. Lower rates of population growth reduce thesize of the cohort of new school entrants. This generates budget savings that can be used toimprove quality and to expand higher levels of the system.
In a sample of eight East Asia countries, increasing enrollments in primary education, andlater secondary education, have been a significant factor in explaining sustained high levels ofgrowth in export-led economies. Since 1960, these economies grew twice as fast as the rest ofEast Asia, three times as fast as Latin America, and faster than the industrial economies. Growthwas accompanied by equitable distribution of benefits. As a result, poverty fell dramatically overthe same period. Macroeconomic models indicate that primary education enrollment was thelargest contributor to predicted economic growth rates in these countries. It was responsible forbetween 58 percent and 87 percent of predicted growth for Japan and Thailand, respectively.Physical capital accumulation was the second most important factor, responsible for between 35and 49 percent of predicted growth. However, expanding enrollments alone is not sufficient. Thequality of education counts. Efficient, flexible and responsive labor markets also matter.
Studies of the impact of primary education on wages and agricultural productivity in Indiaare few, and most have used data from the 1960s and 1970s. However, the available researchfindings mirror international experience. Social rates of return ranged from 13 to 16 percent whilethe private returns range from 15 to 21 percent. Agricultural productivity and the wages oflandless laborers were significantly increased by education. These positive effects on earnings ofprimary education hold for all caste groups, but scheduled castes seem to benefit the most.
In India, women who complete primary education are much more likely than illiteratewomen to use health services. For those who complete primary school, the likelihood of usingfamily planning services is 50 percent higher than for those who did not. Primary education alsoimproves the probability of having ante-natal check-ups from a physician and immunizing childrencompletely (by 100 percent). It also increases three-fold the likelihood of a physician-assistedbirth. The evidence further suggests that primary education reduces total fertility rates by about25 percent.

-111-
Population trends in Indian states largely reflect the differences in primary educationcoverage at the state level. The annual rate of population growth (as measured from the 1991census) ranges from 1.3 percent in Kerala to 2.5 percent in Uttar Pradesh. Between 1997 and2003, the number of children in Kerala in the 7-12 age group will decline from 3.8 to 3.5 million.In Uttar Pradesh, the number will increase from 28.1 million to 32.1 million. Kerala should be ableto invest a fixed share of budgetary resources but still improve the quality of primary educationand expand secondary education. Uttar Pradesh will have to increase the share of primaryeducation in the state budget just to keep pace with population growth.
Progress in Developing Primary Education
A principal asset to India for the development of human capital is its education system,which is the second largest in the world. In 1994, 108 million children were enrolled in 573,000lower primary schools. Another 40 million were in 156,000 upper primary schools and 23 millionin 88,000 secondary schools. Roughly five million students were enrolled in nearly 8,000institutions at the tertiary level. Expansion of the system has contributed to an improved overallliteracy rate, which increased from 18 percent in 1951 to 52 percent in 1991.
With the exception of a few southern states, notably Kerala and Tamil Nadu, rural primaryeducation is almost exclusively public. In 1987, of 472,000 rural primary schools, 12,000 weregovernment-aided private schools (usually receiving grants for teacher salaries) and fewer than5,000 were private un-aided schools. In contrast, 40 percent of urban primary schools and morethan half of all secondary schools were government-aided or fully private.
Universal Enrollment Achieved Later Than In Countries With Quick And EquitableGrowth Universal enrollment in primary education in India may be achieved before the end of thecentury. This will be about a decade later than in such countries as Indonesia and Malaysia, andthree decades later than in Korea (Figure 4.1). Enrollment of girls also has progressed moreslowly (Figure 4.2). The present overall literacy rate of 52 percent is an enormousaccomplishment. But it is still lower than that of East Asian countries when they began tointegrate their economies with the world market. For instance, the literacy rates in Korea andThailand were 71 percent and 68 percent respectively in 1960.
Furthermore, while levels of education are rising among younger workers, the stock ofadult labor remains poorly educated. A 1993 survey of workers in textile mills targeted forsignificant retrenchment found that 30 percent had less than complete primary education. Another25 percent had 5-7 years of education, just enough to develop basic skills. This suggests lowproductivity and poses a significant barrier to work force adjustment in a changing economy.
Gender Inequities Have Fallen But Remain Substantial. Over the past forty years muchhas been achieved to improve equity between boys and girls in primary education. Grossenrollment ratios (GERs) increased from 82 percent for boys and 33 percent for girls in 1951, to116 percent and 88 percent respectively in 1992. In the period 1981-91, primary femaleenrollments grew at 3.7 percent annually while those for boys grew at 2.5 percent. Genderdifferences in schooling may derive from differences in household investment decisions, In India,some families prefer to invest in the education of sons, for it is perceived that the returns to this

-112-
investment will remain with the family, while the returns to the investment in a daughter'seducation are perceived as flowing to her husband's family.
Figure 4.1: Achievement of Univeral Primary Enrollmentin Five Asian Economies: Total
o0 1004 1280 . .... ..... .......... .. : : :: :: :-::: :::: :: :::::;; : | - i - E E i E . : ;::: ;; i; - --. ... : .; : :: ;.:.........
+ ... 8 0 . . . . . . . . . .. .. ..................
.6 0 ... ... ... . . ... ....-.... ..... . .. . .. . ..... ....... .......0 . . .... ... .. .. .. . . . . ..... .. .. .... .................
o 1960 ............ 185190l::-|-Pkia40ar
1960 196 1970g 197 198 198 1990 -:- :.---s -E--g-E--- I:-E :i- ::--E- -
e~~~~~i Fiv Asa Economlgl iels:Femal
0 0
8 0 .- A........ . ............
1960 1965 17 1975 1980 1985 19930 . ga.l& ;
...... . .... ... ..... .. ....................' .." ....
Year .... .. .
Source: World Bank, Social Indicators Database.

-113-
Table 4.1: Primary Gross Enrollment Ratios, Dropout Rates, and LiteracyRates for Major Indian States, By Gender
Male FemaleDrop Drop
GER Out Literacy GER Out Literacy
Kerala 104 0 94 99 0 86Tamil Nadu 149 16 74 141 18 51Maharashtra 124 24 77 115 32 52Punjab 93 21 66 88 23 50Gujarat 131 42 73 106 51 49West Bengal 125 36 68 123 46 47Karnataka 124 37 67 115 44 44Haryana 110 02 69 95 07 40Andhra Pradesh 116 42 55 100 42 33Orissa 117 53 63 78 52 35Madhya Pradesh 117 23 58 91 35 29Uttar Pradesh 104 20 56 73 20 25Bihar 96 62 52 54 66 23Rajasthan 120 35 55 61 56 20
All-India 115 35 64 93 39 39AverageSource: Governmet of India, Department of Education. GER and dropout data are for 1993; literacy rates arefrom the 1991 census.
Enrollment And Completion Rates Diverge Substantially. Sixty five percent of all boysand 60 percent of all girls complete the first five-year cycle of primary schooling. Completionrates vary widely from virtually 100 percent in Kerala and 84 percent in Tamil Nadu to 40 percentin Bihar. Rural enrollment and drop out rates are higher than the national averages. Of thechildren who complete the first five-year cycle of primary schooling, 77 percent of boys and 69percent of girls progress to upper primary school in the country as a whole (Table 4.1). This isequivalent to around 46 and 28 percent of the respective age and gender cohorts. Indeed, only 35percent of children who enroll in primary class 1 are enrolled in class VIII eight years later.
Children from the poorest families, and rural girls, are most likely to be out of school. Onethird of the rural children aged 6- 1i not in school, and one half of non-enrolled urban children, arefrom the poorest 20 percent of households. The Department of Education estimates that about 24million children were not in school in 1987, representing 25 percent of their cohort (6-1 1 years ofage). Almost 60 percent of these were female.
The increase in literacy rates has not been as dramatic as the recorded increases in primaryenrollments because of the high drop out rates, India's high birth rate, and the past backlog ofchildren who reached adulthood without attending school. The literacy rate for those aged sevenyears and above was 64 percent for males and 39 percent for females. This translated into 121million illiterate males and 181 illiterate million females in 1981. The numbers for 1991 were 127million males and 197 million females. In four of the major states (Bihar, Madhya Pradesh, UttarPradesh and Rajasthan), the overall rate was below 45 percent, and below 28 percent for females.In addition, each of these states had districts where the female literacy rate was below 10 percent.Even in the educationally more developed states, there were substantial differences in literacy

-114-
among districts (Table 4.2). For example, of Maharashtra's 30 districts, 21 had female literacyrates above the national average but the rates in nine districts were below. Only in Kerala werethere no districts below the national average.
Table 4.2: Distribution of Districts by Female Literacy Rates,Major States, 1991
Female LiteracyLess than 30-39 More than29 percent percent 39percent
Kerala 14Tamil Nadu - 3 18Maharashtra 3 6 21Punjab -- 3 9Gujarat 2 1 16West Bengal 4 4 8Karnataka 2 7 11Llyana 1 6 9Andbra Pradesh 12 7 4Orissa 5 4 4MadhyaPradesh 29 10 6U-3ttarPradesh 45 12 6iihar 39 3 --
'Rajasthan 26 1 --
Totals 168 67 126
Note: Average national female literacy rate (1991) is 39 percent..Source .3Bose 1991.
Learning Achievement Is Very Low. Children who reach the final year of lower primaryschool often have low learning achievement. In a 1991 study conducted in 23 states, the NationalCouncil of Education Research and Training (NCERT) found that the average achievement oncurriculum based basic skills tests of arithmetic, reading comprehension and spelling, for a sampleof 65,000 urban and rural grade 4 students, was 46.4 percent. Students answered correctly fewerthan half the questions on an arithmetic test in 19 of the 23 states and fewer than half thequestions on a reading comprehension test in 16 states. They spelled correctly fewer than half thewords on a spelling test in 15 of 21 states. Yet all the skills tested were expected to be achievedby the end of grade 3.
Differences in learning achievement among states and districts are very large. In the 1991study (Figure 4.3) students in the worst performring state (Karnataka) achieved only 45 percent ofthe total achievement of students in the highest achieving state (Bihar). A 1993 study of learningachievement in 39 low-literacy districts in eight states, carried out as part of the DPEPpreparation studies program, tested pupils in the last class of the primary cycle (class 4 in somestates, class 5 in others) on arithmetic skills and reading comprehension skills expected at the endof the previous year. Average achievement levels were poor with large differences betweendistricts.

-115-
Figure 4.3: Total Achiewment (arithmetic, reading andspelling)in 23 states, 1991 (average percentage correct)
Bihar _ 69.3
Mzoram _ 56.8
Guajrat 54.3
Punjab 54 1
Andhra Pradesh 53
Meghalaya 51.6
Uttar Pradesh 50.5
Haryana 50
Assam 49.8
Rajasthan 49.6
Nbharashtra 454
Orissa j 45.2
I Tarml Nadu 441
Dehi_ 43.7
Sikkim 43.7
West Bengal 42.9
Jammu 42.3
Kerala 41.3L I Total Achievemient
Arunachal Pradesh 40
Madhya Pradesh 37.5
Nagaland 35.2
Tripura _ _ _ 34.7
Karnataka 31.8 Percentage conmet
Maximum 100II I ,II . s . _
0 10 20 30 40 50 60 70 80 90 100
Source: Shukla 1994.
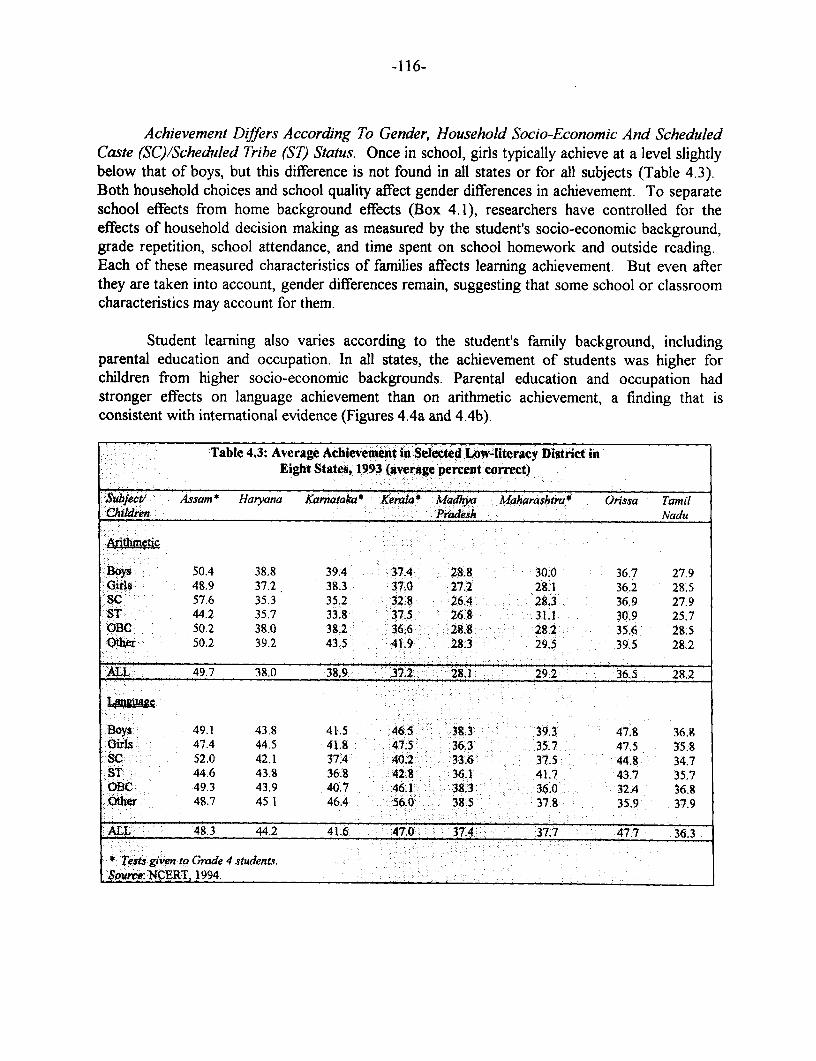
-116-
Achievement Differs According To Gender, Household Socio-Economic And ScheduledCaste (SC)/Scheduled Tribe (ST) Status. Once in school, girls typically achieve at a level slightlybelow that of boys, but this difference is not found in all states or for all subjects (Table 4.3).Both household choices and school quality affect gender differences in achievement. To separateschool effects from home background effects (Box 4.1), researchers have controlled for theeffects of household decision making as measured by the student's socio-economic background,grade repetition, school attendance, and time spent on school homework and outside reading.Each of these measured characteristics of families affects learning achievement. But even afterthey are taken into account, gender differences remain, suggesting that some school or classroomcharacteristics may account for them.
Student learning also varies according to the student's family background, includingparental education and occupation. In all states, the achievement of students was higher forchildren from higher socio-economic backgrounds. Parental education and occupation hadstronger effects on language achievement than on arithmetic achievement, a finding that isconsistent with international evidence (Figures 4.4a and 4.4b).
Table 4.3: Average Achievetnent in Selected Low-literacy District inEight States, 1993 (average percent correct)
iSdecbt; Assam* Haryana Karnataka Kera*a Madhwy Maharashtra* Onssa TamilChildren Pridesh Nadu
Boys*: :: 50.4 38.8 39.4 37.4: 28.8 30.0 36.7 27.9GiCrils .a: 48.9 37.2 3S.3: 371. 21.7 28.1 36.2 28.5SC 57.6 35.3 35.2 :32.8: 264 28.3 36.9 27.9i0ST;: 5 44.2 35.7 33.8 37.5 26.8 31.1 0.9 25.7OH: C S3C f 50.2 38.0 38.2 36.6 28.8 2 8.2 35.6 28.5OtChr:: 50.2 39.2 43.5 :41.9: 28.3 29.5 39.5 28.2
AJ..L;#; 49.7 38.0 38.9: .37.2 28.1 29.2 365 _28.2
Boys.. 49.1 43.8 41.5 46.5 38.3: 39.3: 47.8 36.8hirls ; X 47.4 44.5 41.8 47.5 36.3 35.7 47.5 35.8
-Sc 52,0 42.1 37.4 40.2: A33.6: 37.5 C 44.8 34.7ST. 44.6 43.8 36.8 42.8 36.1 41.7 43.7: 35.7OBCi 49.3 43.9 40.7 46.1:: 8 38.3 36.0 32.4 36.8oth"r 48.7 45.1 46.4 : 56.0: 38.5 37.8 35.9 37.9
ALL : 48.3 44.2 41.6 :470 37.4 37.7 47.7 36.3
Teses given to Grade 4 students.Souircw:WCERT, 1994.

-117-
~~~~~~~~~~~~~~~~~e 'r
~~~~~~~~~~~~~~~~~~~~~~~~~~~~~~~~~~~.................... .C> : ~~~~~~~~~~~~~~~~~~~~~~~~~~~~~~~~~~~~~~~~~~~....... ....
G)_ c -c
Q~~ ~ ~ ~ ~ ~~~~~~~~~~~~~~~~~ ~~~~~ . . ....'..... ..... .- m _g 5 ..... ~~~~~~~~~~. . . . . .. . .. . .O
C's
lv)~~~~~~~~~~~~~~~~~~~~~~~~~~~~~~~~~~~~~~1 ............_11 O
o~~~~~~........ c n ......cn C
81 t ~~~~~~~~~~~~~~~~~~~~~~~~~~
U 0
cJn
U -o~~~~~~~~~~~~~~~~~~~~~cC.) .. | ....
=, I ~~~~~~~~~.. ....... ... ... St..--.''.. :-..-.-
I I I I I I I ~ ~ W It I I1 1
13a1100 juaOnad 103aUoD lU00JOd
½ 2~~~~~~~~

-118-
Box: 4.1: Policy: Analysis to Help Raise Learning and Reduce Gaps
Forma countries, some schools are more effective than others in both raising the average achievement oftheir stentso& nd reducing the gap- in achievement often associated with gender and social disadvantage.Resrhe at NCERT, NIEPA and the Department of Education are collaborating with the World Bank on asynthesis of school level factors that raise leaniing and reduce gender, SC/ST and socio-economic differences ina i anvement. Using hierarchical linear modeling techniques, they have deternined that differences between:shools acuzt for 30-60 pereent of the variation in mathematics achievement and 14-47 percent of variationin reding:chievemnent:between students. Differences between students' famnily backgrounds account for thein rem cidiere. ent bet w st e:
|Port; iP n of variance in mathematics and reading achievement attributable to differencesbetween schools in low-literacy districts in 8 states, 1993
State Mathematics RRading
Assarn 49 33Haryana 29 24Karnataka 60 47Kerala 16 14Madhya Pradesh 45 40Maharashtra 43 39Orissa 43 22TamnilNadu 33 35
Preliminhiy BLA analyses indicate that the packages of interventions needed to boost learning and reducegaps would vary according to local conditions. Different school-level inputs raised achievement in different:states (seeTable: 4.4). In addition, the analysis of school-level factors can help shape the design of district andstate-level interventions to benefit girls, SC and ST students, and children from other disadvantagedbackgrounds...
For instane d theBLM analysis found that the strong association between studeiit gender and achievementvaned according to the: school the student attended. Researchers at NCERT have begun to explore what featuresof schools miiitigate the relationship between gender and achievement. The gender gap in mathematicsaWhievement wa sm:iallor in schools with a higher percent of qualified teachers (Maharashtra), a higherpercentage of trained teachers(OCrissa), higher average teacher experience (Maharashtra), more instructionaltime devoted to math (Madhya Pradesh), nmore emphasis on instructional improvement, (Assarn and TamilNadu), and more instrationaIl supervision (Kerala). Other school characteristics increased the gender gap in: mathImatics,& bingmoe favorable to boys than girls. They include a higher percentage of qualified teachers(Koerala). more and better school facilities (Assam), and greater financial autonomy (Madhya Pradesh andOrissa).
SC and ST students scored about 5 percentage points lower on average on overallachievement in the 1991 survey relative to all students. In large part, differences between SC/STstudents and non-SC/ST students are attributable to differences in socioeconomic status betweenthe two groups rather than differences among schools. In the 1993 study, the gap between SC/STand non SC/ST students did not vary much among schools and ranged broadly across states.
The 1993 survey also points to the impact of household investments in human capitalformation. Students from families that permit regular school attendance (three states), allocatetime for school homework (four states), encourage reading (seven states), and support the

-119-
Box 4.2: Government-Aided Primary Schools are More Cost-Effectivethan Other Schools in Tamil Nadu
In Tamnil Nadu, government schools account for 68 percent, government-aided schools for 28 percent, andprivate unaided schools for 4 percent of primary enrollments. Each type of school follows the prescribed stateprimary education curriculum and syllabus. Which of the three sectors should be expanded?
A 199 2 study of student learning achievement in Tamil language and mathematics in rural and urban primaryschools found that governmeent-aided primary schools were unambiguously more cost-effective in raisingstudent learning achievement than either goverinent managed schools or fully private unaided schools.Conducted with carefully drawn samples of schools and pupils, the study tested student learning achievement inmathematics and reading comprehension in grade 5. A principal first finding was that average achievementscores were very low in all schools, with pupils averaging 30-35 percent correct on achievement tests.
Raw test scores of students in private unaided schools were significantly higher than those in either govermmentaided or government schools. A significantly higher proportion of students in private unaided schools masteredbasic skills, in comparison with students in government-aided and government schools, However, whendifferences in home background and communrity characteristics were statistically controlled, students ingovernment-aided schools outperformed those in both government and private unaided schools. Schoolmanagement practices in government-aided schools were found to be significantly associated with betterlearning achievement. Achievement in Tamil and mathematics in private unaided schools was, in turn, affectedby the use of English as the medium of inistruction -- a service which attracted both poor and not poor familiesto these schools.
Substantial variation in performance was found between schools. Leadership activities of the headteacher andteacher subject matter knowledge were found to be positively related to student achievement, but norelationship was found for such variables as the student/teacher ratio and teacher qualifications. Years ofteacher experience had a negative effect on achievement, reflecting lower motivation and obsolescence of skillsfor older teachers. Difficult textbooks and lack of training for teachers in how to use them, also constrainedachievement.
Using data on both direct and opportunity costs of pupils, the study further found that both government-aidedand government schools were more cost-effective than private unaided schools, with aided schools being mostcost-effective. The incrernental direct costs of increasing learning achievement in the unaided sector, forexample, were found to be 44 percent higher than in the public and publicly-aided schools.
The results would superficially indicate that expansion of the government-aided sector would be the best optionfor public policy. However, historical and institutional analysis showed that government-aided schools weremost often established by particular communities in response to non-economic factors at a time when public l
education was scarce. Substantial voluntary assistance is provided to the schools. In the changed circumstancesof Taiil Nadu today it is not clear that the motivations of new entrepreneurs would be similar and cost-effectiveness ratios maintained. Equally, a policy to restrict growth of the less cost-effective unaided sector onthe basis of cognitive test scores would ignore the other outcomes of unaided schooling, including Englishlanguage skills, in demand by segments of the population.
The study concludes that cost-effective policy options for improving achievement would include, for all threeschool types: (a) training of headteachers in instructional management; (b) improving textbooks; and (c)increasing resources for instructional materials, perhaps through reallocation away from such incentives as freeschool unifonns. Improvements in government schools through the measures identified would give the bestprospects for equitable and cost-effective improvement in learning outcomes.
Source: Bashir 1994.

-120-
educational aspirations of the children (seven states) have significantly higher achievement thanthose from households that do not provide such support. Students who repeat classes, moreover,achieve significantly less than those who do not (seven states). These effects were observed afteradjustments for the effects of family socio-economic status had been made.
Private and government-aided schools constitute a very small share of the rural primaryeducation system in most states. The potential for mobilizing additional private resources for ruralprimary schooling remains to be explored. However, emerging research indicates that privateprimary schools may serve specialized markets and may not be as cost-effective as government-aided schools in improving student learning achievement (Box 4.2).
In summary, virtually all children in India enroll in class I of primary school. In statessuch as Kerala, Tamil Nadu and Punjab, progress toward universal access and completion ofprimary education is encouraging. Overall, however, India's annual expenditures on primaryeducation are yielding low returns relative to the basic skills being acquired. This is partlybecause only sixty percent of the enrolled children complete primary schooling. At least half ofthose who finish master less than fifty percent of the curriculum. Consequently, a substantialshare of annual expenditures is being lost to inefficiency.
The essential challenge for education authorities at the center, state and district levels is toimprove the quality of education in rural primary schools. Providing better services also willincrease the schools' attractiveness to children and parents alike, and improve learningachievement. Achieving acceptable levels of quality will require strategies that take into accountvariation in access to, completion of and learning achievement in primary education within andamong states. It will also take account of the fact that girls, SC and ST students, and the poortend to stay in school for the shortest period and score below average on achievement tests.
INFLUENCING EDUCATIONAL OUTCOMES
Varied Local Factors Are Highly Significant. Teachers, tools and time for teaching,standards for learning outcomes and guidelines for curriculum are necessary if not sufficientconditions for raising learning achievement. In addition, in India, the patterns of school factorsthat are associated with higher learning achievement vary by location. The 1991 study identifiedapproximately 10 school-level determinants of learning, but only two--the presence of OperationBlackboard and of Parent Teacher Associations--were positively associated with higher levels oflearning in at least one-third of the states. In the 1993 study, no school-level determinant ofachievement was common to low-literacy districts in all states surveyed. Of 35 school-levelcharacteristics tested, only four--teacher attendance, instructional time spent on language,emphasis on instructional improvement and instructional supervision--were positively related tolearning achievement in at least three states surveyed (Table 4.4).
Teacher's Subject Knowledge Is More Critical Than Years Of Pre-Service Education.Indian experience and international research confirm that proxies for teacher knowledge, such asthe type of certification and pre-service education, typically are unrelated to student learningachievement. What really matters is the teacher's knowledge of the subject. Despite therelatively high level of formal pre-service education of teachers in India, many teachers lack astrong foundation in the subject they are teaching. For example, in Tamil Nadu, only half of the

-121-
Table 4.4:- School Characteristics Positively Related to Higher Levels of Mathematics or ReadingAchievement in Low-Literacy Districts in Seven States, 1993
Ayam | Hatyna Kemzia Madhya Maharashtra Onssa Tamit Nadul__________ __________ __________Pradesh
Contribution Student Financialin kind pcr incentives autonomy
pupil
School Instructional Sufficientphysical materials classroomsfacilities
Instructional Instructional Instructional timetime on . time on on languagelanguage language
Total Totalinstructional instructional
time time
Teacher Teacher Teacherattendance attendance attendance
Emphasis on Emphasis on Emphasis oninstructional instructional instructionalimprovement improvement improvement
.Istructional Instructional . Instructional. supervision supervision supervision
Frequency of Frequency oftesting testing
Frequency of Frequency ofhomework homeworkassigned assigned
Class size Graded Multi-grade Gradedclassrooms classrooms classrwms
Community._____________ .___________ ______________ _____________ involvem ent . ____i___ov m n
primary teachers who were tested could correctly answer 80 percent of the questions on a test ofgrade 4 mathematics knowledge (Bashir 1994). Investment in improving teachers is likely toimprove learning outcomes. Greater attention to strategies for improving teacher knowledge (asopposed to investments in more levels of formal certification) may need to be a focus of futureresearch.
Time Is Important. The amount of time for learning is consistently related to achievementin countries worldwide. Student achievement in India is higher in schools with more totalinstructional time and more instructional time spent on the subjects tested. Student achievementis higher for children who attend school regularly and who do school work at home, both ofwhich increase the amount of time spent on learning. Achievement is also higher in schools with

-122-
higher rates of teacher attendance. Teacher absenteeism is widely reported in a number of states.This reduces the instructional time and, consequently, achievement.
In India, poor teacher compensation does not appear to be a major cause of teacherabsenteeism and variations in teacher salaries were not associated with higher student learning. Infact, teacher salaries are comparable to those of public employees with similar qualifications.Furthermore, at 3.6 times average per capita income, primary school teachers' salaries in India arerelatively better than those in such middle income countries as Chile, Costa Rica, and Thailand butworse than those in such low-income countries as Kenya, Malawi and Zambia (Lockheed andVerspoor, 1991).
Even Modest Teaching Tools Are Beneficial. Instructional materials include the entirerange of teaching tools, from chalk to computers. International experience has demonstrated thatsuch relatively modest teaching tools as textbooks, libraries, and classroom instructional materialsare significant determinants of achievement in low and middle income countries. Most childrenhave basic essential learning materials (Table 4.5, column 1), but relatively few schools are wellequipped with adequate instructional materials (Table 4.5, column 2 and 3). For example, fewschools in low-literacy districts had a complete set of 16 instructional materials. In Assam,Madhya Pradesh and Kerala, most schools on average had fewer than 10 of the 16 items. Theavailable instructional materials vary considerably among states. For example, schools in low-literacy districts in Orissa and Tamil Nadu report having about twice the number of instructionalmaterials as schools in Assam.
Table 4.5: Average Number of Instructional Materials Available inLow-Literacy Districts in Eight States, 1993
State Average Number of Learning Average Number of Number of:Materials per Student Instructional Materials per School Facilities
(maximumi 7) School (maximum=1 6) (Maximum3 1):Assam 6.62 6.98 8.911-lasyana 6.55 10.40 18.37Knataka: 5.42 10.64 15.10Kerala 6.16 9.85 16.15
adliya'Pradesh 6.11 7.87 12.89MUaashtra 5.95 10.46 15.33Orissa 5.75 12.28 8.68Tamil Nadu 6.05 12166 19.32
No:t: The l earoing materials were: language text book, math text book, science/envirornentallsocial sciencetext book, any other book, notebooks, slate, and pencils/pens. The instructional materials were: blackboard,duster, chalk, teacher table, teacher chair, cupboard, teacher guides, dictionary, books apart from the children'stexbook (library), map, globe, charts, flash cards, science kit, mathematics kit, and other unspecified; Thei:physical facilities of the schools were: maps, globes, charts, play materials and toys, games.and equipment,primy science kit, mini tool kit, mathematics kit, reference books for library, children's books, magazines andjournals, school bell, musical instnrnents, mats and furniture, chairs for teachers, tables for teachers,.blackbod, pin-up board, chalk and duster, water pitcher, dust-bin, safe drinking water, toilet facilities,separate toilet facilities for girls, electricity, playground, annual medical check up for children, immuinzation
tfacility, and first aid kits.
To correct these imbalances, the Department of Education established a scheme(Operation Blackboard) that sought to improve the instructional environment in three ways: bybuilding an additional classroom, posting an additional teacher, and providing a package ofteaching materials to the school. Small schools (1-2 teachers) participating in Operation

-123-
Blackboard had higher mathematics achievement in Assam and Orissa and higher languageachievement in Assam and Madhya Pradesh in comparison with small schools not participating inOperation Blackboard. However, small schools participating in Operation Blackboard inMaharashtra and Haryana had lower mathematics and language achievement. This latter resultagain demonstrates how variations in existing conditions may determine the effectiveness of aparticular intervention.
The most commonly available instructional material is the textbook. In most states mostprimary students have textbooks (Table 4.5). However, the production and instructional designquality of primary level textbooks is often poor, which makes them difficult to read andunattractive to children. One study of textbook readability found that the vocabulary used was toodifficult (Sharma, 1994). The overlap between words used in primary textbooks and those usedvoluntarily by children was quite low. In general, fewer than 20 percent of textbook words wereused by children in their normal speech. The textbooks also demonstrated poor instructionaldesign, with only about 5 percent of words repeated 10 or more times, and more than 350different words used only once. Clearly, improving the readability of textbooks is a prime area forinvestment.
Standards Matter. To bring primary level education standards in line with children'sdevelopmental capabilities, the DOE established "minimal levels of learning" (MLL) for language,mathematics and social/environmental studies in each of the five primary grades. The standardsare expressed as competency statements for curricular domains and grade level. For instance, theunderstanding whole numbers competency statement for class 1 is that the student counts from Ito 20 using objects and pictures; by class 4 the student should recognize and write numerals from1,000 to 10,000 (NCERT, 1994). While neither states nor districts are under an obligation toadopt MLL standards, they have been widely disseminated. Model textbooks have beendeveloped to support them. National surveys of achievement have used MLL standards as a basisfor testing students.
Curricula Embody The Standards. There are no international curricula for primaryeducation. However, most systems, worldwide, emphasize acquisition of arithmetic and languageskills (reading and writing) as a core element of the curriculum. The curriculum defines thesubjects to be taught and furnishes general guidance regarding the frequency and duration ofinstruction. In some cases, it is accompanied by a syllabus that specifies more precisely what is tobe taught and what will be assessed. In India, responsibility for curriculum development inprimary education resides with the states, although NCERT provides model materials foradaptation at state and district levels.
The District Primary Education Program (DPEP)
DPEP is the most intensive effort to date by the Central Government to increaseenrollment, retention and the quality of primary education. It was established in 1993 by theDepartment of Education, in close consultation with the states, to implement therecommendations of the National Policy on Education, 1986 (updated in 1992) (Box 4.3).Through the program, the Government of India provides grants to states equivalent to 85 percentof the cost of approved investments, with the states providing the balance. Investment is targetedto districts with below average female literacy rates. Emphasis is placed on investments in the
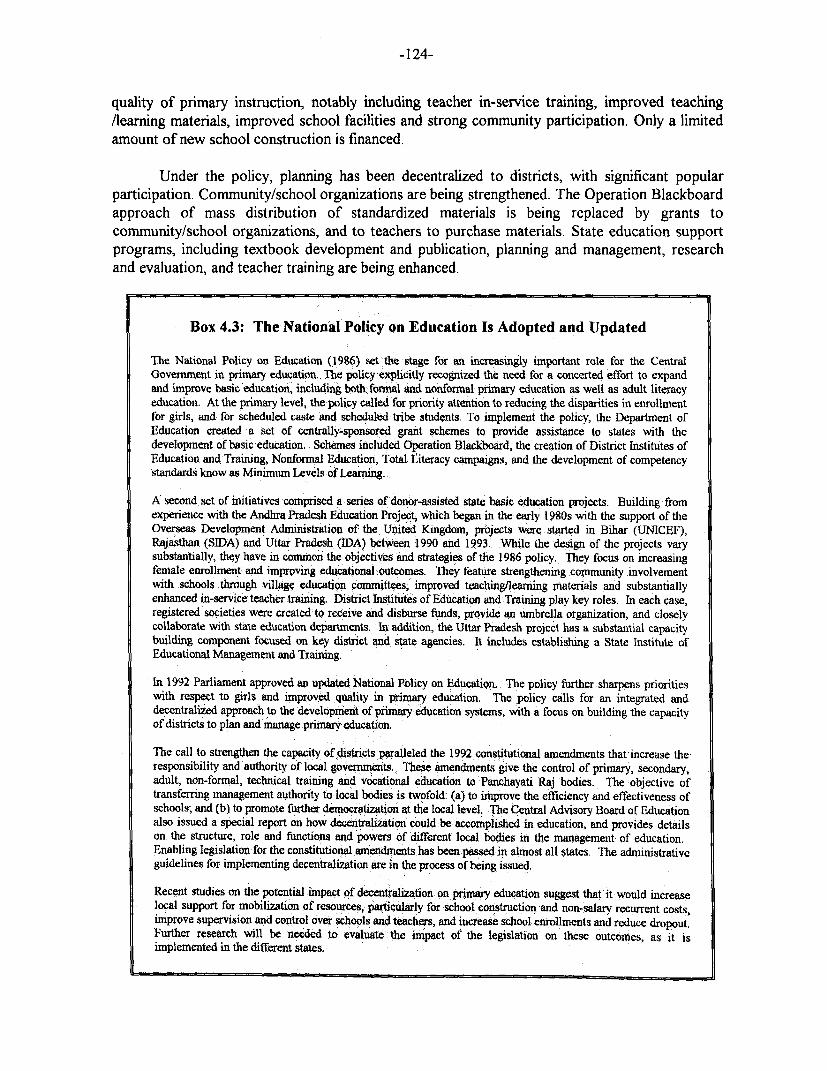
-124-
quality of primary instruction, notably including teacher in-service training, improved teaching/learning materials, improved school facilities and strong community participation. Only a limitedamount of new school construction is financed.
Under the policy, planning has been decentralized to districts, with significant popularparticipation. Community/school organizations are being strengthened. The Operation Blackboardapproach of mass distribution of standardized materials is being replaced by grants tocommunity/school organizations, and to teachers to purchase materials. State education supportprograms, including textbook development and publication, planning and management, researchand evaluation, and teacher training are being enhanced.
Box 4.3: The National Policy on Education Is Adopted and Updated
The National Policy on Education (1986) setthle stage for an increasingly important role for the CentralGovernment in primary education.. The policy explicitly recognized the need for a concerted effort to expandand improve basic education, including both: formal and nonformal primary education as well as adult literacyeducation. At the primary level, the policy called for priority attention to reducing the disparities in enrollmentfor girls, and for scheduled caste and scheduled tribe students. To implement the policy, the Department ofEducation created a set of centrally-sponsored grant schemes to provide assistance to states with thedevelopment of basic education. Schemes included Operation Blackboard, the creation of District Institutes ofEducation and Training, Nonformal Education, Total Literacy campaigns, and the development of competencystandards know as Minimum Levels of Leaning.
A second set of initiatives comprised a series of donor-assisted state basic education projects. Building fromexperience with the Andhra Pradesh Education Project, which began in the early 1 980s with the support of theOverseas Development Andministration of the United Kingdom, projects were. started in Bihar (UNICEF),Rajasthan (SIDA) and Uttar Pradesh (EDA) between 1990 and 1993. While the design of the projects varysubstantially, they have in common the objectives and strategies of the 1986 policy. They focus on increasingfemale enrollnent and improving educational outcomes. They feature strengthening community involvementwith schools through village education committees, improved teaching/learning materials and substantiallyenhanced in-service teacher training. District Institutes of Education and Training play key roles. In each case,registered societies were created to receive and disburse funds, provide an umbrella organization, and closelycollaborate with state education departments. In addition, the Uttar Pradesh project has a substantial capacitybuilding comnponent focused on key district and state agencies. It includes establishing a State Institute ofEducational Management and Training.
In 1992 Parliament approved an updated National Policy on Education. The policy further sharpens prioritieswith respect to girls and improved quality in prinimy education. The policy calls for an integrated anddecentralized approach to the development of primary education systems, with a focus on building the capacityof districts to plan and manage primarteducation.
The call to strengthen the capacity of districts paralleled the 1992 constitutional amendments that increase theresponsibility and authority of local governments. These amendments give the control of primary, secondary,adult, non-formal, technical training and vocational education to Panchayati Raj bodies. The objective oftransferring management authority to local bodies is twofold:. (a) to improve the efficiency and effectiveness ofschools; and (b) to promote further democratization at the local level, The Central Advisory Board of Educationalso issued a special report on how decentralization could be accomplished in education, and provides detailson the structure, role and functions and powers of different local bodies in the management of education.Enabling legislation for the constitutioal amendments has been passed in alnost all states. The administrativeguidelines for implementing decentralization are in the process of being issued.
Recent studies on the potential impact of dectrlizahtion on primary education suggest that it would increaselocal support for mobilization of resources, particularly for school construction and non-salary recurrent costs,improve supervision and control over schools and teachers, and increase scbool enrollments and reduce dropout.Further research will be needed to evaluate the impact of the legislation on these outcomes, as it isimplemented in the different states.

-125-
DPEP differs from other centrally-sponsored schemes, which provide resources to statesfor the implementation of standard program designs, in five principal ways: (i) proposals forfinancing sub-projects are developed by each participating district and state; (ii) proposals areappraised by the DPEP Bureau of the national Department of Education against transparenttechnical, managerial and financial criteria; (iii) participating states must make DPEP grants fullyadditional to normal growth of education budgets; (iv) funds are made available to states anddistricts annually on the basis of performance reviews and proposals for the next year--and poorlyperforming sub-projects can be dropped from the program and replaced; and (v) implementationsupport and technical assistance are made available to states and districts through contracts withresearch and development agencies.
DPEP is managed at the national level by a newly created DPEP Bureau, serving as afinancial and technical intermediary organization to appraise, finance, monitor and supervise stateand district action programs. DPEP will be the mechanism through which all substantial externalassistance to primary education will be channeled.
The DPEP was launched in seven states in 1994. Together with the four state projects,India has now initiated significant action to improve primary education in 11 of the largest states.At least three additional states are expected to join the program in 1995-96. The investment costof reaching 300 districts through the DPEP is estimated at approximately $3.5 billion over theremainder of the Eighth Plan, and the Ninth and Tenth Plan periods. Maintaining the value ofthese investments will, in turn, require that states substantially increase resources for primaryeducation. As efficiency improves at that level, state will need to increase resources for upperprimary and secondary education. The financial challenge to the states is large.
TRENDS AND PROSPECTS IN PRIMARY EDUCATION FINANCE
Two features dominate the structure of primary education finance (meaning in this contextfinancing for elementary grades 1-8). First, the bulk of financial allocations and responsibility forthe sector effectively lies with state governments, almost all of whom currently face seriousfinancial weaknesses. Second, the level of primary education coverage varies widely across states.These variations broadly reflect the relative priority given to the sector within individual states.
As India pursues universal enrollment and enhanced quality in primary education, all states willhave to make a considerable financial effort. But many will need to make a substantially greatereffort because they have spent very little on the sector in the past.
Overview of Expenditure on Primary Education
State governments, households and the Central Government are the main providers ofprimary education funding, in that order. The capacity of state governments to fund the sectorderives from a mix of their own willingness and ability to raise own revenues, the transfers theyreceive from the Central Government via the Finance and Planning Commissions, and the prioritygiven to primary education among competing demands for government resources. Householdexpenditures on primary education reflect the interplay between the level and distribution ofincome, the perceived adequacy of publicly provided services, complementary householdexpenditures required by the public system and, again, the priority given to competing demands.

-126-
The Central Government's direct funding of the sector is small; some additional funding isprovided through tied grants for specific activities. Constitutionally, there is no limit to suchtransfers. Despite their relatively small size, direct Central transfers for elementary educationhave a catalytic and developmental effect by supplementing the state's own plan outlays.
Figure 4.5: Centrnl and State Expenditure on Prlmary Education, 1989-94(percent of GDP)
1.8
1.6 --
1.4
1.2
CenterO.S .............................................. 5 + States and Union Territories0.8
0.6
0.4
0.2
0 r I _7.
89-90 90-91 91-92 92-93 93-94
Source: Department of Education, Ministry of Human Resource Development.
Public expenditures on primary education in India increased during the 1980s to 1.68percent of GDP in 1989-90. They fell in 1991-92 and 1992-93 to 1.57 percent and 1.51 percentrespectively but recovered to 1.60 percent of GDP in 1993-94. During this period, the CentralGovernment increased its share of the total (in relation to GDP), implying that the reductionsreflected lower spending by state governments (in relation to GDP) (Figure 4.5). For the CentralGovernment, this trend is part of a broader attempt to protect its overall spending on education inrelation to GDP while seeking to reduce other expenditures as part of fiscal consolidation. Thus,although education expenditures remained constant as a share of GDP between 1990-91 and1994-95, they increased as a share of total Central Government revenue expenditures from 1.28percent to 1.48 percent.
In addition, the Central Government has been shifting education resources toward theprimary level. This shift is a welcome step. Over the period 1989-94, the share for higher andtechnical education in total Central Government education expenditure fell from 54 to 43 percentwhile that for elementary and adult literacy increased from 20 to 31 percent. These shifts reflectdifferences in expenditure growth rates. In current prices, the average annual growth inelementary expenditures was 20.7 percent. It was 12.5 percent for secondary education and 3.7

-127-
percent for higher education. These trends continued in the 1995-96 budget: the allocation forelementary and adult literacy rose to 34 percent while it fell in nominal terms for higher education.
Expenditure on overall education by states as a group declined from 3.31 percent of GDPin 1989-90 to 3.05 percent in 1992-93 but rose in 1993-94 to 3.12 percent of GDP. The reason isthat although the state education spending has held its share in total state development revenuespending, the latter has fallen in relation to GDP. If there is further contraction in the overalleducation budget at the state level in subsequent years, there will be even less room at this sub-national level to begin to correct the underfunding of primary education through a reallocation ofthe overall education budget away from higher education. Indeed, in 1993-94, 46 percent ofpublic educational expenditure was allocated to elementary education and 31 percent tosecondary. Higher and technical education combined received 17.0 percent. While the overalldistribution is almost exactly the same as twenty years ago, the states' share for elementaryeducation has fallen slightly while the Center's has increased.
But there are other reasons suggesting that the financial problems of primary educationcannot be solved largely by redirecting resources from other education sub-sectors. First, overallpublic expenditures on education have not maintained their share of GNP in recent years and needto increase. Expenditures by all (center and state) departments of education in 1992-93 wereequal to 3.34 percent of GNP. When expenditures across departments other than education wereincluded, the share was 3.9 percent. This compares to 4.2 percent in 1989-90. Second, the shareof total budgetary resources devoted to education in India is low compared to that in many otherdeveloping countries. While the share increased from 11.8 percent in 1986-87 to 12.8 percent in1992-93, it is still below the average of 17.5 percent for all low income countries (omitting Indiaand China). This situation reflects partly the breadth of government involvement in the Indianeconomy and the considerable budgetary subsidies in areas such as food, fertilizers and electricity.
There are other concerns about primary education. Both the center and the states need toincrease significantly their allocations to the sector if universal primary education is to be achievedby the end of the Ninth Plan (1997-2002). As explained in Chapters 1 and 2 of this report,current fiscal trends indicate that this will be a major challenge unless the financial performance ofthe public sector improves substantially. Another concern is that the composition of publicexpenditures within primary education has been badly skewed. About 97.1 and 95.9 percent oftotal public expenditures on lower and upper primary education respectively were being spent onsalaries. Combined expenditures on libraries, consumables, equipment and furniture were just 0.2percent of the total. One caveat is that expenditures on primary education are incurred also bydepartments other than education. In most states scheduled caste, scheduled tribe and otherbackward caste children qualify for incentive programs such as free textbooks and schoolclothing. In some states attendance allowances are paid to girls. The costs of these programs aresubstantially above direct non-salary education expenditures. Analysis of their cost-effectivenesshas to be undertaken.
Spending by state education departments also varies substantially, suggesting that anumber of states may be spending much less on primary education than the already low averagelevels for the nation as a whole. For instance, per capita state spending on primary education hasranged from Rs 96, Rs 110 and Rs 113 in Uttar Pradesh, Bihar and Madhya Pradesh respectively,to Rs 168 in Karnataka and Rs 184 in Kerala. Likewise, as a share of state domestic product,

-128-
educational expenditure (and implicitly primary education spending) ranges between 3.1 and 7.2percent across the fourteen major states. Some of the poorer states spend more per capita thansome of the richer ones. Among the former are states such as Assam which are highly dependenton Central Government grants. In states like Tamil Nadu and Kerala, much more is spent oneducation but this occurs in the context of large revenue deficits which are financed through theaccumulation of state debts. Neither of these situations is sustainable. Given the possibility thatdiscretionary central transfers to states will decline because of tight central budgetary resources,those states which have neglected the sector in the past will now find it increasingly difficult toallocate additional resources. That is, unless there are significant changes to either their ability togenerate additional own-revenues or to alter the structure of their overall expenditures.
A number of measures have been taken by the Central Government to make availableadditional funding in the short and medium term in an effort to increase state governments'expenditures. Central funding for new education programs at the state level now constitute halfof all Central Government expenditure on education compared to a quarter in 1986. Currently,the most important new spending program supported by the Central Government is the DPEPwhich was initiated in mid 1994. Apart from a 15 percent requirement from the states involved,the program is planned to be externally funded through grants and loans. IDA, EEC and UKODAfunding for the first phase of the program, over seven years, is pledged at around $550 million.The 1994-95 allocation for the centrally sponsored Operation Blackboard, teacher training andnon-formal schemes for elementary education is about $135 million. The DPEP represents,roughly, a 55 percent hike. However, over time, these investments will require additional staterecurrent funding.
Overall, the recent attempts to raise expenditures in elementary education by the CentralGovernment through shifting its own priorities away from higher education and utilizing externalsources of funding, has not so far been equally matched by the states. Variations in efforts by thelatter are very wide but across many there is no evidence of an upward trend. The launch of theDPEP is a first step in reversing this situation.
SUSTAINING PRIMARY EDUCATION REFORMS -A THREE-FOLD STRATEGY
Achieving the objectives and sustaining the anticipated benefits of the primary educationreform program during a period of changing center/state fiscal relationships and tight resourceswill be very difficult. However, efforts could be directed at: (a) selecting the most cost-effectivestrategies; (b) substantially increasing state financing; and (c) maintaining an effective and efficientCentral Government role over the medium term.
Selective Interventions
Select Cost-Effective Interventions. High dropout rates and low levels of learningachievement make India's present primary education system highly wasteful, not only of publicresources, but also of children's lives. National policy clearly recognizes that building moreschools--without giving sustained and systematic attention to the factors that lead to good qualityteaching and acceptable levels of learning--would simply lead to a larger inefficient system. At the

-129-
Box 4.4: Specific Interventions Improve the Cost-Effectiveness of Schools in Assam
lmproving cost-effectiveness of schooling requires knowing which inputs are effective, how effective they are andwhat they cost. The baseline surveys of learning achievement can be used to determine the input mix that is mostlikely to boost achievement.
For example, in low-literacy districts in Assam, the average achievement of the top 25 percent of schools is 13.7points above that of the bottom 25 percent of schools (26.35 and 12.66 points respectively). HILM analyses haveidentified five characteristics that separate "good" schools from "bad" schools, more instructional time, more hourson language taching, more school facilities, more emphasis on instructional improvement, and more commnunitycontributions (see table below). Investments in these five, taken together, could turn "bad" schools to "good"schools, and could be high priority areas for improving schools in low-literacy districts in Assarn.
Differences between Good and Bad Schools in Low-Literacy Districts in Assam on Five School CharacteristicsSignificantly Related to Arithmetic Achievement (Z-Scores)
Differencein means Regression Points gainedbetween top 25 Coefficient by raising bottom
School percent and bottom 25 in final HM schools to the levelCharacteristic percent schools Model of top schools
-Istitutional time onlanguage 0.45 1.22 0.55
School facilities 0.35 1.05 0.37Instructional improvenents 0.34 0.94 0.32Total instructional tir 0.45 0.68 0.31Community contribution 0.26 0.88 0.23
per pupil
Note: Variables are standardized with a mean of 0 and a standard deviation of I. The top 25 percent schools (n~40) andbotm 25. percent schools (,r40) in Assam were identified in terms of arithmetic adhievment. The analysis controlled foreight student background characteristics based on the Empirical Bayes (EB) residual associated with the intercept (school meanarithmetic achievement adjusted for student background variable). The EB residual is provided by the residual file associatedwith the unconditional model for arithmetic achievement Other characteristics of schools, even those related to higher levels oflearning, did not differentiate "good" schools fhom "bad" schools and hence would be lower pnonities for investment.
same time, investment in the development of the quality of primary schooling will need to be ascost-effective as possible.
The DPEP research program is demonstrating that the factors associated with schoolquality vary substantially across India. The research gives India an unprecedented opportunity toidentify, at the district level, the varying patterns of school factors that account for between 25and 50 percent of variation in learning achievement. This base of empirical evidence provides theopportunity to select the interventions that are most likely to be effective in a given district, andavoiding investments in interventions that are less likely to make a difference (Box 4.4).
The next step toward greater cost-effectiveness in primary education could be taken byfurther expanding the research effort to identify the actual implementation costs of interventionsand systematically evaluating their on-the-ground impact over time. The DPEP monitoring andevaluation framework has considerable promise in this regard, but to realize the potential benefits,present objectives for capacity building at national and state levels will need to remain a highpriority.
-130-
State Financing
Increase State Financing For Primary Education While the Central Government isimportant for overall policy direction in education and for encouraging national initiatives, thestate governments provide almost 90 percent of the funding for the education system. Thevariations between states in past financial efforts to develop the primary education system aresubstantial. Consequently, the present ability of individual states to sustain past investments andsupport new initiatives varies as well. However, across all states, additional resources will berequired both to maintain or increase levels of access and to improve learning quality, retentionand achievement. The trends in revenue deficits across the major states (see Chapter 2) suggestthat the required increases in budgetary resources for education in general and primary educationin particular will entail significant changes in the conduct of fiscal policy. To enable the furtherdevelopment of the primary education system in the near future, state governments need toconsider the following options:
(a) develop a wider revenue base to improve resource mobilization;
(b) implement, as a minimum, the share of plan expenditure for primary education asprojected for the Eighth Plan period and prepare for increases in the shares underthe Ninth Plan;
(c) increase expenditure on education through a general restructuring of totalexpenditures. Currently, losses across all states in the state electricity corporationsare equivalent to two and a half times the size of state plan expenditures oneducation;
(d) develop policies for fee levels in government institutions and clarify the role ofprivate institutions. Since the states share responsibilities for higher education withthe Central Government and the University Grants Committee, it is important thatthey give adequate attention to these issues; and
(e) develop financial arrangements for the envisaged third tier of district governmentwhich will ensure that: (i) adequate financing is devolved from state governmentsfor their educational responsibilities and that there are incentives not to divert suchfunds; (ii) inequalities within states are addressed through policies which effectdifferential transfers between the state and individual lower level units ofgovernment; and (iii) local governments raise additional revenues from taxes whichmay be less available to state governments.
Central Government Leadership
The degree of involvement of Central Governments of federal countries in primaryeducation varies significantly. In the United States, Canada and Australia, for instance, there isvirtually none. In countries such as Brazil and Nigeria, however, the Central Government hasbeen directly involved in influencing levels of funding through direct sectoral transfers or through

-13 1-
decrees setting minimum shares of state expenditure. The situation in India is currently betweenthese positions.
The analyses in this chapter suggest that the Central Government will need to continue toplay an important role in the medium term for three reasons: (a) the overall low level ofeducational resources and outcomes, and variations among states; (b) the importance at this stageof educational development of capacity building in states and districts to plan and manageeducation more effectively; and (c) the need for substantial research in order to select cost-effective strategies.
The Central Government plays a direct role in the provision of primary education throughits responsibility for developing many aspects of policy and the funding of centrally sponsoredplan schemes, and an indirect role through general financial transfers to states. Over the past twoyears, the Central Government has frequently reiterated its intention to ensure that publicresources for education increase to 6 percent of GNP over the period of the Ninth Plan. Asindicated earlier in this chapter and the rest of the document, adequate provision of such serviceswill require significant improvements in both central and state finances. In addition, furtherconsideration will need to be given to the most effective ways in which central transfers cantrigger maximum additional state expenditures.
Implementing a gradually expanding DPEP, with careful attention given to cost-effectiveness, would appear to be an essential bridging mechanism during the medium term asstates undergo fiscal reforms. In addition, the use of untied grants to states for educationaldevelopment might be considered under terms which: (a) do not allow for substitution; (b) requirea commitment from the state government either to increase its rate of growth of expenditures oneducation (if the state is a low spender such as Haryana), or to maintain education's share (if thestate is a high spender such as Kerala) and generally to shift the pattern of its expenditurestowards the social sectors.
Government may also wish to re-assess the issue of educational inequality across statesmore broadly by: (a) re-examining the criteria for the distribution of general transfers relying moreon need but balanced by an increased emphasis on an equal fiscal effort across states; and (b) afurther targeting of grants for the centrally sponsored schemes such that they do not penalizethose states which have made strong efforts to raise revenues and allocate expenditures towardsthe social sectors. Conversely, such further targeting should not reward states with low taxefforts and/or expenditure patterns which discriminate against the social sectors. Options for thestate and Central Governments with respect to primary education would, of course, have to beconsidered in the broader context of administrative decentralization and changing center-statefiscal relations. The high economic returns to investment in primary education, and itsfundamental importance to economic growth with equity, suggest that deepening and sustainingthe new reform efforts should have high priority in a changing India.
Recognizing the necessity of building on the progress made and facing the challengesahead in the sector, the Chief Ministers of India's states, at their conference in February 1994, re-affirmed that:

-132-
* the highest priority would be given to primary and adult education;* major efforts would be made to mobilize resources for education;* optimal utilization of resources would be ensured;* outlays for education would be increased to 6 percent of GNP;* special attention would be focused on seven high population, low-literacy states which
account for more than 70 percent of India's illiterate people; and* a spirit of decentralization and community participation would become the basis for
education development.

-133-
STATISTICAL APPENDIX


-135-
CONTENTS
l. National Accounts
A 1.1(a) National Accounts Summary, (Rs billion at current prices)Al. 1(b) National Accounts Summary, (Rs billion at 1980-81 prices)Al .2(a) Gross Domestic Product at Factor Cost - By Industry of Origin, (Rs billion at current
prices)A1.2(b) Gross Domestic Product at Factor Cost - By Industry of Origin, (Rs billion at 1980-81
prices)A1.2(c) Implicit Price Deflators for GDP at Factor Cost, (1980-81 = 100)Al.3 Gross Savings and Investment, (Rs billion)Al.4 Disposable Income and Its Use, (Rs billion at current prices)A1.5(a) Gross Domestic Investment by Industry of Origin, (Rs billion at current prices)Al.5(b) Gross Domestic Investment by Industry of Origin, (Rs billion at 1980-81 prices)Al.5(c) Investment Deflators by Industry of Use, (1980-81 = 100)Al .6(a) Gross Domestic Investment in Public Sector, (Rs billion at current prices)A1.6(b) Gross Domestic Investment in Public Sector, (Rs billion at 1980-81 prices)
II. Balance of Payments - Current Accounts
A2.1 Balance of Payments, (US$ million at current prices)A2.2(a) Merchandise Exports, (US$ million at current prices)A2.2(b) Merchandise Exports, (US$ million at 1980-81 prices)A2.2(c) Export Unit Value Indices, (US$ terms, 1980-81 = 100)A2.3(a) Merchandise Imports, (US$ million at current prices)A2.3(b) Merchandise Imports, (US$ million at 1980-81 prices)A2.3(c) Import Unit Value Indices, (US$ terms, 1980-81 = 100)A2.4 Invisibles on Current Account, (US$ million)A2.5 Decomposition of Recent Export Growth, (US$ million at current prices - annual
averages)
III. Balance of Payments - Capital Accounts
A3.1(a) External Debt Summary: Debt Outstanding and Disbursed, (US$ million at currentprices)
A3. 1(b) External Debt Summary: Disbursements, (US$ million at current prices)A3.1(c) External Debt Summary: Principal Repayments, (US$ million at current prices)A3. I (d) External Debt Summary: Net Flows, (US$ million at current prices)A3. 1(e) External Debt Summary: Interest Payments, (US$ million at current prices)A3.2 External Reserves (US$ million at current prices)

-136-
IV. Public Finance
A4.1 Central Government Finances Summary, (Rs billion at current prices)A4.2 Budgetary Classification of Central Government Finances, (Rs billion at current prices)A4.3 Budgetary Classification of State Government Finances, (Rs billion at current prices)A4.4 Budgetary Classification of General Government Finances, (Rs billion at current prices)A4.5 Tax Revenue - Center and States, (Rs billion at current prices)A4.6 Non-Tax Revenue - Center and States, (Rs billion at current prices)A4.7 Revenue Expenditure of the Central Government, (Rs billion at current prices)A4.8 Revenue Expenditure of State Government, (Rs billion at current prices)A4.9 Capital Expenditure - Center and States, (Rs billion at current prices)A4.10 Transfers between Center and States, (Rs billion at current prices)A4.11 Explicit Subsidies in the Central Government Budget, (Rs billion at current prices)A4.12 Outstanding Debt of Central Government, (Rs billion at current prices)A4.13 Outstanding Debt of State Government, (Rs billion at current prices)A4.14 Outstanding Debt of Central and State Governments, (Rs billion at current prices)A4.15(a) Projected and Actual Plan Outlays by Sectors, (Rs billion at current prices)A4.15(b) Projected and Actual Plan Outlays by Sectors, (Rs billion, annual averages at 1980-81
prices)A4.15(c) Projected and Actual Plan Outlays by Sectors, (percent distribution and achievement rates)
V, Money and Credit
A5. I Money Supply and Sources of Change, (Rs billion)A5.2 Base Money Supply and Sources of Change, (Rs billion)A5.3 Selected Monetary Policy InstrumentsA5.4 Structure of Short-term and Long-term Interest Rates, (percent per annum)A5.5 Sectoral Deployment of Gross Bank Credit, (Rs billion - change during year)
VI. Agriculture, Industry, Transport, Energy and Prices
A6.1 Production of Major CropsA6.2 Irrigated Area Under Different Crops, (million hectares)A6.3 Yield Per Hectare of Major Crops, (kgs. per hectare)A6.4 Net Availability, Procurement and Public Distribution of Foodgrains, (million tons)A6.5 New Index of Industrial Production, (1980-81 = 100)A6.6 Production, Imports and Consumption of Fertilizers, (000' nutrient tons)A6.7 Indian Railways - Freight and Passenger TrafficA6.8 Petroleum Summary: Commodity Balance of Petroleum and Petroleum Products, (million
tons)A6.9 Generation and Consumption of Electricity, (000' GWH)A6.10 New Index Numbers of Wholesale Prices - by Years, (Base 1981-82 = 100)A6.11 Contribution of Selected Commodities to Increase in WPI in Calendar Year 1993A6.12 Consumer Price Index Numbers for Industrial Workers, Urban Non-Manual Employees
and Agricultural LaborersA6.13 Evolution of the Wholesale Price Index, 1991-94, (index and twelve months point-to-point
increase)

-137-
Table Al.I (a)National Accounts Summary(Rs. billion at current prices)
1980-81 1985-86 1986-87 1987-88 1988-89 1989-90 1990-91 1991-92 1992-93 1993-94
GDPfc 1224.27 2337.99 2600.30 2948.51 3527.06 4086.62 4777.97 5520.30 6276.34 7071.45Agriculture 466.49 772.24 824.13 923.79 1140.73 1270.51 1480.01 1728.99 1933.32 2143.82Industry 317.15 658.14 737.46 838.29 1000.73 1196.93 1400.25 1548.57 1768.01 1990.96Mining 18.87 61.98 67.96 70.85 92.08 103.08 117.85 128.75 145.14 169.68Manufacturing 216.44 417.75 461.66 528.65 628.63 770.76 891.60 968.81 1113.09 1222.62Construction 61.14 129.47 152.17 176.11 206.77 235.86 286.16 323.97 358.33 398.47Electricity 20.70 48.94 55.67 62.68 73.25 87.23 104.64 127.04 151.45 200.19
Services 440.63 907.61 1038.71 1186.43 1385.60 1619.18 1897.71 2242.74 2575.01 2936.67Indirect Taxes 135.86 284.44 329.19 383.50 430.76 481.59 577.20 640.31 751.95 792.10GDPmp 1360.13 2622.43 2929.49 3332.01 3957.82 4568.21 5355.17 6160.61 7028.29 7863.55
Resource Gap (M-X) 48.25 81.37 80.87 85.93 124.93 112.19 151.79 39.03 93.84 15.94Imports (g+nfs) 137.17 237.67 255.25 296.23 388.59 465.46 565.11 610.00 776.72 923.40Exports (g+nfs) 88.92 156.30 174.37 210.31 263.66 353.28 413.32 570.97 682.88 907.46
Total Expenditure 1408.38 2703.80 3010.36 3417.94 4082.75 4680.40 5506.96 6199.64 7122.13 7879.49
Consumption 1123.85 2069.38 2331.37 2669.12 3112.21 3572.49 4133.05 4791.00 5484.57 6203.96General Govt 130.84 291.74 346.25 408.43 473.31 542.03 617.79 694.59 785.86 910.52Private 993.01 1777.64 1985.12 2260.69 2638.90 3030.46 3515.26 4096.41 4698.71 5293.44
Investment 284.53 634.42 678.99 748.82 970.54 1107.91 1373.91 1408.64 1637.56 1675.53Fixed Investment 262.76 542.55 620.52 721.94 856.69 1027.75 1240.04 1367.76 1511.78 1643.79Change inStocks 21.77 91.87 58.47 26.88 113.85 80.16 133.87 40.88 125.78 31.74
Domcstic Savings 236.28 553.05 598.12 662.89 845.61 995.72 1222.12 1369.61 1543.72 1659.59Net Factor Income 2.81 -19.00 -26.16 -32.06 -38.12 -48.79 -67.34 -93.91 -99.11 -125.55CurrentTransfers 22.57 27.01 29.75 34.99 38.42 38.01 37.14 92.75 80.29 120.00
National Savings 261.66 561.05 601.71 665.82 845.91 984.94 1191.91 1368.45 1524.90 1654.04
Foreign Savings 22.87 73.37 77.28 83.00 124.63 122.97 182.00 40.19 112.66 21.49
GDPpercapita(Rs.) 2003.14 3473.42 3799.60 4228.44 4916.55 5557.43 6382.80 7196.97 8059.97 8855.35Per capita private consumption 1462.46 2354.49 2574.74 2868.89 3278.13 3686.69 4189.82 4785.53 5388.43 5961.08
Average Exchange Rates:RupeesperUSS 7.893 12.237 12.787 12.968 14.477 16.663 17.949 24.519 28.954 31.373RupeesperSDR 10.154 12.918 15.707 17.360 19.269 21.361 30.714 33.428 40.486 43.886
Memo Items:Priv. Consumption (CSO) 992.92 1777.58 1999.98 2240.61 2589.93 2900.72 3323.64 3847.99 4245.55 4795.86Population (mill) 679 755 771 788 805 822 839 856 872 888
Source: CSO, National Accounts Statistics 1995.

-138-
Table Al.I (b)National Accounts Summary(Rs. billion at 1980-81 prices)
1980-81 1985-86 1986-87 1987-88 1988-89 1989-90 1990-91 1991-92 1992-93 1993-94
GDPfc 1224.27 1565.66 1632.71 1703.22 1884.61 2014.53 2122.76 2141.56 2234.38 2330.42Agriculture 466.49 542.18 532.81 534.79 622.14 632.63 656.53 641.74 674.25 694.12Indutry 317.15 432.25 463.82 493.67 538.66 593.98 637.00 631.96 650.59 673.45
Mining 18.87 26.23 29.78 30.80 35.42 38.01 42.07 43.96 44.64 46.77Manufacturing 216.44 303.20 324.45 348.18 378.65 422.85 448.63 434.54 448.05 464.21Construction 61.14 71.83 75.37 77.77 83.79 88.07 98.33 100.95 101.43 102.65Electricity 20.70 30.99 34.22 36.92 40.80 45.05 47.97 52.51 56.47 59.82
Services 440.63 591.23 636.08 674.76 723.81 787.92 829.23 867.86 909.54 962.85Indirect Taxes 135.86 200.82 219.79 237.63 248.84 259.14 279.85 272.72 291.11 282.78GDPmp 1360.13 1766.48 1852.50 1940.85 2133.45 2273.67 2402.61 2414.28 2525.49 2613.20
Terms of Trade Effect 0.00 16.36 24.62 14.83 23.63 22.90 8.94 7.61 10.44 15.05GromsDomenticIncome 1360.13 1782.84 1877.12 1955.68 2157.08 2296.57 2411.55 2421.89 2535.93 2628.25
Resource Gap (M-X) 48.25 61.97 62.10 55.88 71.77 53.47 61.45 12.45 27.19 4.34Imports(g+nfs) 137.17 181.02 195.98 192.66 223.23 221.85 228.76 194.49 225.09 251.61
Capacity to import 88.92 119.05 133.88 136.78 151.47 168.38 167.31 182.05 197.90 247.27[Exports (g+nfs)] 88.92 102.68 109.26 121.95 127.84 145.48 158.38 174.44 187.46 232.22
TotalExpenditure 1408.38 1844.82 1939.22 2011.57 2228.84 2350.05 2472.99 2434.34 2563.12 2632.59
Consumption 1123.85 1446.35 1537.51 1593.71 1728.76 1839.60 1892.28 1925.42 2013.37 2104.37General Govt 130.84 189.24 208.49 226.60 238.68 252.15 260.59 259.25 267.69 288.32Private 993.01 1257.11 1329.02 1367.11 1490.08 1587.45 1631.69 1666.17 1745.68 1816.05
Investment 284.53 398.47 401.71 417.86 500.08 510.45 580.71 508.92 549.75 528.22FixedInvestment 262.76 329.74 359.97 399.55 428.00 465.10 511.17 490.63 498.25 516.96ChangeinStocks 21.77 68.73 41.74 18.31 72.08 45.35 69.54 18.29 51.50 11.26
Domestic Savings 236.28 336.50 339.61 361.98 428.31 456.98 519.26 496.47 522.56 523.88Net Factor Income 2.81 -14.47 -20.08 -20.85 -21.90 -23.25 -27.26 -29.94 -28.72 -34.21CurrentTranmfers 22.57 20.57 22.85 22.76 22.07 18.12 15.03 29.57 23.27 32.70
NationalSavings 261.66 342.59 342.38 363.88 428.48 451.84 507.04 496.11 517.10 522.36
Foreign Savings 22.87 55.88 59.33 53.98 71.60 58.61 73.67 12.81 32.65 5.86
GDPpercapita(Rs.) 2003.14 2339.71 2402.72 2463.01 2650.25 2766.02 2863.66 2820.42 2896.20 2942.79Percapita private consumnption 1462.46 1665.04 1723.76 1734.91 1851.03 1931.20 1944.81 1946.46 2001.93 2045.11
Rupee Deflators (1980-81=100):GDPmp 100.0 148.5 158.1 171.7 185.5 200.9 222.9 255.2 278.3 300.9Imports(g+nfs) 100.0 131.3 130.2 153.8 174.1 209.8 247.0 313.6 345.1 367.0Exports(g+nfs) 100.0 152.2 159.6 172.5 206.2 242.8 261.0 327.3 364.3 390.8Total Expenditure 100.0 146.6 155.2 169.9 183.2 199.2 222.7 254.7 277.9 299.3Govt. Consumption 100.0 154.2 166.1 180.2 198.3 215.0 237.1 267.9 293.6 315.8Priv. Consumption 100.0 141.4 149.4 165.4 177.1 190.9 215.4 245.9 269.2 291.5Fixed Investment 100.0 164.5 172.4 180.7 200.2 221.0 242.6 278.8 303.4 318.0Total Investment 100.0 159.2 169.0 179.2 194.1 217.0 236.6 276.8 297.9 317.2
-- Not available.
Source: CSO, National Accounts Statistics 1995.

-139-
Table Al.2 (a)Gross Domestic Product at Factor Cost - By Industry of Origin
(Rs. billion at current prices)
1980-81 1985-86 1986-87 1987-88 1988-89 1989-90 1990-91 1991-92 1992-93 1993-94
Agricultural Sector 466.49 772.24 824.13 923.79 1140.73 1270.51 1480.01 1728.99 1933.32 2143.82Agriculture 424.66 699.64 744.05 835.15 1041.03 1154.47 1351.62 1594.27 1782.28 1977.29Forestry & Logging 32.62 52.86 57.58 61.78 68.28 78.23 82.81 83.90 86.69 89.65Fishing 9.21 19.74 22.50 26.86 31.42 37.81 45.58 50.82 64.35 76.88
Industry Sector 317.15 658.14 737.46 838.29 1000.73 1196.93 1400.25 1548.57 1768.01 1990.96Mining&Quarrying 18.87 61.98 67.96 70.85 92.08 103.08 117.85 128.75 145.14 169.68Manufacturing 216.44 417.75 461.66 528.65 628.63 770.76 891.60 968.81 1113.09 1222.62
Registered 122.81 258.06 282.54 322.07 390.50 483.69 555.53 611.04 692.64 759.80Unregistered 93.63 159.69 179.12 206.58 238.13 287.07 336.07 357.77 420.45 462.82
Electricity,Gas &Water 20.70 48.94 55.67 62.68 73.25 87.23 104.64 127.04 151.45 200.19Construction 61.14 129.47 152.17 176.11 206.77 235.86 286.16 323.97 358.33 398.47
Services Sector 440.63 907.61 1038.71 1186.43 1385.60 1619.18 1897.71 2242.74 2575.01 2936.67Transport, Storage & Com. 57.24 140.98 165.37 199.38 238.72 277.31 339.13 410.64 491.45 575.44
Railways 11.24 31.36 37.65 43.56 47.51 55.75 64.33 73.42 84.46 102.06Other Transport 36.80 91.00 105.10 124.68 152.29 177.85 223.11 275.81 331.17 375.42Storage 1.22 2.60 2.80 3.17 3.34 3.88 4.45 4.78 4.98 5.27Communication 7.98 16.02 19.82 27.97 35.58 39.83 47.24 56.63 70.84 92.69
Trade, Hotels etc. 147.13 310.50 345.51 384.33 452.22 529.10 618.66 705.33 814.79 919.78
Banking&lnsurnce 34.08 82.65 96.64 111.43 134.13 171.31 210.96 279.93 305.66 364.91Real Estate etc. 73.83 116.17 126.45 136.13 148.43 164.46 178.06 195.41 215.84 233.33Public Admin & Defence 57.94 125.11 149.33 179.48 208.58 241.33 271.09 314.41 362.07 406.02Other Services 70.41 132.20 155.41 175.68 203.52 235.67 279.81 337.02 385.20 437.19
GDP at Factor Cost 1224.27 2337.99 2600.30 2948.51 3527.06 4086.62 4777.97 5520.30 6276.34 7071.45
Source: CSO, National Accounts Statistics 1995.

-140-
Table Al.2 (b)Gross Domestic Product at Factor Cost - By Industry of Origin
(Rs. billion at 1980-81 prices)
1980-S1 1985-86 1986-87 1987-8S 1988-89 1989-90 1990-91 1991-92 1992-93 1993-94
Agricultural Sector 466.49 542.18 532.81 534.79 622.14 632.63 656.53 641.74 674.25 694.12Agriculture 424.66 498.55 489.95 492.58 579.40 585.68 609.91 594.54 625.89 644.56Forestry& Logging 32.62 31.81 30.90 29.86 29.40 31.95 31.05 30.83 30.95 31.09Fishing 9.21 11.82 11.96 12.35 13.34 15.00 15.57 16.37 17.41 18.47
Industry Sector 317.15 432.25 463.82 493.67 538.66 593.98 637.00 631.96 650.59 673.45Mining & Quarrying 18.87 26.23 29.78 30.80 35.42 38.01 42.07 43.96 44.64 46.77Manufacturing 216.44 303.20 324.45 348.18 378.65 422.85 448.63 434.54 448.05 464.21
Registered 122.81 184.53 195.21 209.02 231.26 263.36 276.57 271.53 277.81 286.81Unregistered 93.63 118.67 129.24 139.16 147.39 159.49 172.06 163.01 170.24 177.40
Electricity,Gas &Water 20.70 30.99 34.22 36.92 40.80 45.05 47.97 52.51 56.47 59.82Construction 61.14 71.83 75.37 77.77 83.79 88.07 98.33 100.95 101.43 102.65
Services Sector 440.63 591.23 636.08 674.76 723.81 787.92 829.23 867.86 909.54 962.85Transport, Storage & Com. 57.24 79.51 84.83 92.27 98.04 106.63 111.64 118.04 124.53 132.02
Railways 11.24 14.04 15.14 15.76 15.60 16.23 16.77 17.78 17.58 17.46Other Transport 36.80 53.09 56.51 62.61 67.92 75.01 78.53 82.93 87.95 93.70Storage 1.22 1.63 1.70 1.69 1.64 1.70 1.77 1.76 1.75 1.72Communication 7.98 10.75 11.48 12.21 12.88 13.69 14.57 15.57 17.25 19.14
Trade, Hotels etc. 147.13 196.49 208.52 218.01 233.85 252.31 265.79 267.61 284.97 297.67Banking&lnsurance 34.08 58.28 66.92 73.99 86.23 102.69 111.69 129.22 132.83 149.93Real Estate etc. 73.83 88.80 92.24 94.72 97.93 101.34 105.55 108.84 112.40 116.16Public Admin & Defence 57.94 80.16 88.07 97.04 103.42 112.14 113.28 115.70 121.56 126.88Other Services 70.41 87.99 95.50 98.73 104.34 112.81 121.28 128.45 133.25 140.19
GDPatFactorCost 1224.27 1565.66 1632.71 1703.22 1884.61 2014.53 2122.76 2141.56 2234.38 2330.42
Source: CSO, National Accounts Statistics 1995.

-141-
Table Al.2 (c)Implicit Price Deflators for GDP at Factor Cost
(1980-81=100)
19S0-81 1985-86 1986-87 1987-88 1988-89 1989-90 1990-91 1991-92 1992-93 1993-94
Agricultural Sector 100.00 142.43 154.68 172.74 183.36 200.83 225.43 269.42 286.74 308.85Agriculture 100.00 140.33 151.86 169.55 179.67 197.12 221.61 268.15 284.76 306.77Forestry & Logging 100.00 166.17 186.34 206.90 232.24 244.85 266.70 272.14 280.10 288.36Fishing 100.00 167.01 188.13 217.49 235.53 252.07 292.74 310.45 369.62 416.24
Industry Sector 100.00 152.26 159.00 169.81 185.78 201.51 219.82 245.04 271.75 295.64Mining&Quarrying 100.00 236.29 228.21 230.03 259.97 271.19 280.13 292.88 325.13 362.80Manufacturing 100.00 137.78 142.29 151.83 166.02 182.28 198.74 222.95 248.43 263.38
Registered 100.00 139.85 144.74 154.09 168.86 183.66 200.86 225.04 249.32 264.91Unregistered 100.00 134.57 138.59 148.45 161.56 179.99 195.32 219.48 246.97 260.89
Electricity,Gas &Water 100.00 157.92 162.68 169.77 179.53 193.63 218.14 241.93 268.20 334.65Construction 100.00 180.25 201.90 226.45 246.77 267.81 291.02 320.92 353.28 388.18
Services Sector 100.00 153.51 163.30 175.83 191.43 205.50 228.85 258.42 283.11 305.00Transpmt, Storage & Com. 100.00 177.31 194.94 216.08 243.49 260.07 303.77 347.88 394.64 435.87
Railways 100.00 223.36 248.68 276.40 304.55 343.50 383.60 412.94 480.43 584.54OtherTransport 100.00 171.41 185.98 199.14 224.22 237.10 284.11 332.58 376.54 400.66Storage 100.00 159.51 164.71 187.57 203.66 228.24 251.41 271.59 284.57 306.40Communication 100.00 149.02 172.65 229.07 276.24 290.94 324.23 363.71 410.67 484.27
Trade, Hotel etc. 100.00 158.02 165.70 176.29 193.38 209.70 232.76 263.57 285.92 308.99Banking&Insurance 100.00 141.82 144.41 150.60 155.55 166.82 188.88 216.63 230.11 243.39Real Estate etc. 100.00 130.82 137.09 143.72 151.57 162.29 168.70 179.54 192.03 200.87Public Admin & Defence 100.00 156.08 169.56 184.95 201.68 215.20 239.31 271.75 297.85 320.00Other Services 100.00 150.24 162.73 177.94 195.05 208.91 230.71 262.37 289.08 311.86
GDPatFactorCost 100.00 149.33 159.26 173.11 187.15 202.86 225.08 257.77 280.90 303.44
Source: Derived from Tables 1.2(a) and 1.2(b).

-142-
Table Al .3Gross Savings and Investment
(Rs. billion)
1980-81 1985-86 1986-87 1987-88 1988-89 1989-90 1990-91 1991-92 1992-93 1993-94
(At current prices)
GROSS NATIONAL SAVINGS 261.66 561.05 601.71 665.82 845.91 984.94 1191.91 1368.45 1524.90 1654.04Households 192.28 423.30 469.57 535.69 677.59 792.71 993.12 1046.20 1207.93 1323.07Private corporate sector 22.84 53.18 52.12 57.90 87.31 118.00 144.43 194.90 208.04 311.53Public sector 46.54 84.57 80.02 72.23 81.01 74.23 54.36 127.35 108.93 19.44
ForeignSavings 22.87 73.37 77.28 83.00 124.63 122.97 182.00 40.19 112.66 21.49
GROSS DOMESTIC INVESTMENT 284.53 634.42 678.99 748.82 970.54 1107.91 1373.91 1408.64 1637.56 1675.53
Clangeinstocks 21.77 91.87 58.47 26.88 113.85 80.16 133.87 40.88 125.78 31.74
GROSS FIXEDCAPITAL FORMATION 262.76 542.55 620.52 721.94 856.69 1027.75 1240.04 1367.76 1511.78 1643.79By Type of Asset:Construction 136.49 274.53 305.73 347.87 414.45 478.92 583.63 672.05 734.03 793.73Machinery&Equipment 126.27 268.02 314.79 374.07 442.24 548.83 656.41 695.71 777.75 850.06
By Sector:Publicsector 116.93 275.01 332.54 345.71 398.66 438.62 501.76 587.14 596.69 660.04Private sector 145.83 267.54 287.98 376.23 458.03 589.13 738.28 780.62 915.09 983.75
GDPmp at cuwsnt prices 1360.13 2622.43 2929.49 3332.01 3957.82 4568.21 5355.17 6160.61 7028.29 7863.55
(At 1980-81 prices)
GROSS DOMESTIC INVESTMENT 284.53 398.47 401.71 417.86 500.08 510.45 580.71 508.92 549.75 528.22
ChangeinStockh 21.77 68.73 41.74 18.31 72.08 45.35 69.54 18.29 51.50 11.26
GROSS FIXED CAPITAL FORMATION 262.76 329.74 359.97 399.55 428.00 465.10 511.17 490.63 498.25 516.96By Type of Asset:Construction 136.49 139.60 145.90 150.45 164.23 170.69 187.58 192.10 192.91 191.17Machinery & Equipment 126.27 190.14 214.07 249.10 263.77 294.41 323.59 298.53 305.34 325.79
By Sector:Public sector 116.93 170.80 192.31 186.60 195.39 196.51 206.01 210.03 193.50 204.40Private ector 145.83 158.94 167.66 212.95 232.61 268.59 305.16 280.60 304.75 312.56
Source: CSO, National Accounts Statistics 1995.

-143-
Table Al .4Disposable Income and Its Uses(Rs. billion at current prices)
1980-81 1985-86 1986-87 1987-88 1988-89 1989-90 1990-91 1991-92 1992-93 1993-94
GDPmp 1360.1 2622.4 2929.5 3332.0 3957.8 4568.2 5355.2 6160.6 702S.3 7863.6Net Factor Income from abroad 2.8 -19.0 -26.2 -32.1 -38.1 -48.8 -67.3 -93.9 -99.1 -125.6Othercurrent transfers 22.6 27.0 29.8 35.0 38.4 38.0 37.1 92.8 80.3 120.0
Disposable income 1385.5 2630.4 2933.1 3334.9 3958.1 4557.4 5325.0 6159.5 7009.5 7858.0Private disposable income 1208.1 2254.1 2506.8 2854.3 3403.8 3941.2 4652.8 5337.5 6114.7 6923.0Public disposable income 177.4 376.3 426.3 480.7 554.3 616.3 672.2 821.9 894.8 930.0
Gross National Savings 261.7 561.1 601.7 665.8 845.9 984.9 1191.9 1368.5 1524.9 1654.0Privatesavings 215.1 476.5 521.7 593.6 764.9 910.7 1137.6 1241.1 1416.0 1634.6Public savings 46.5 84.6 80.0 72.2 81.0 74.2 54.4 127.4 103.9 19.4
Final Consumption 1123.8 2069.4 2331.4 2669.1 3112.2 3572.5 4133.1 4791.0 5434.6 6204.0Private Consumption 993.0 1777.6 1985.1 2260.7 2638.9 3030.5 3515.3 4096.4 4698.7 5293.4Public Consumption 130.8 291.7 346.3 408.4 473.3 542.0 617.8 694.6 785.9 910.5
Source: CSO, National Accounts Statistics 1995; World Bank Staff estimates.

-144-
Table Al.5 (a)Gross Domestic Investment by Industry of Origin
(Rs. billion at current prices)
1980-81 1985-86 1986-87 1987-88 1988-89 1989-90 1990-91 1991-92 1992-93 1993-94
Agricultural Sector 48.6 76.1 77.8 91.8 99.8 111.1 128.5 142.3 159.7 173.7
Agriculture 46.4 70.4 70.8 83.9 90.6 100.3 115.9 128.4 144.6 156.4Foretry&Logging 1.0 2.1 2.4 2.6 3.0 3.8 4.6 4.5 4.5 4.8
Fishing 1.3 3.7 4.5 5.4 6.3 7.1 8.1 9.4 10.5 12.5
Industry Sector 96.7 280.6 308.7 329.2 408.1 449.8 538.2 548.2 606.6 646.1Mining & Quanying 9.6 41.8 45.4 42.2 47.9 63.0 66.3 63.4 65.8 67.0Manufacturing 48.4 153.6 156.2 170.9 235.9 244.4 305.8 277.1 332.3 345.9
Registered 29.2 110.4 107.8 118.7 175.4 167.2 218.7 194.5 229.2 235.8
Unregistered 19.2 43.2 48.4 52.2 60.5 77.2 87.1 82.6 103.1 110.1Electricity,Gas&Water 31.7 72.4 96.3 103.8 113.0 123.4 144.1 189.0 186.8 210.9Construction 7.0 12.8 10.8 12.4 11.3 18.9 22.1 18.8 21.7 22.4
Services Sector 112.6 246.8 309.6 274.1 384.2 416.1 538.7 575.9 701.5 698.1Transport, Storage & Com. 29.1 64.1 79.8 80.6 106.4 128.2 143.3 160.5 197.5 220.7
Railways 8.1 16.9 23.1 21.5 26.4 26.4 30.8 33.2 49.2 52.1
Other Transport 17.5 37.4 45.3 44.0 57.9 73.6 83.3 94.4 97.6 107.3
Storage 0.2 0.6 0.8 0.8 0.8 0.9 0.7 0.7 0.7 0.8Communication 3.2 9.2 10.7 14.3 21.4 27.3 28.6 32.1 50.0 60.6
Trade,Hotelsetc. 23.3 46.0 68.4 17.1 72.1 66.2 115.5 90.1 150.2 85.9
Bankng & Insurance 1.7 5.5 8.7 14.8 21.1 23.6 30.9 48.7 43.5 39.7
RealEstateetc. 31.4 68.8 80.9 90.1 101.6 118.1 147.4 168.2 185.1 208.5Public Admin&Defencc 21.6 48.3 55.5 55.1 62.2 55.8 75.1 82.3 95.8 108.5
Other Services 5.5 14.1 16.3 16.5 20.8 24.2 26.5 26.0 29.5 34.8
GrossDomesticInvestment 257.9 603.5 696.1 695.2 892.1 976.9 1205.4 1266.3 1467.8 1517.9
Memo Items
Gros Domestic investment 308.8 581.7 611.6 764.6 975.8 1142.5 1449.9 1454.1 1544.5 1606.4Errors & Omissions 24.3 -52.8 -67.4 15.7 5.3 34.6 76.0 45.4 -93.1 -69.1Gross Domestic Investment 284.5 634.4 679.0 748.8 970.5 1107.9 1373.9 1408.6 1637.6 1675.5
(unadjusted) b
a. Refers to CSO's savings-based estimate of investment.b. Refers to Gros Capital Fornation unadjusted for errors and omissions, which is CSO's direct estimate of investment based on physical flows.
Source: CSO, National Accounts Statistics 1995.

-145-
Table Al 5 (b)( ross ])omestic Investment bv Industry of Origin
(Rs. billion at 1980-81 prices)
1980-81 1985-86 1986-87 1987-88 1988-89 1989-90 1990-91 1991-92 1992-93 1993-94
Agricultural Sector 48.6 46.4 43.6 47.8 47 3 47.9 50.7 49.8 51.2 52.3Agriculture 46.4 43.2 40.2 44.1 43.5 43.5 45.9 45.0 46.2 47.0Forestry& Logging 1.0 1.2 1.3 1 2 1 3 1.5 1.7 1.4 1.3 1.2Fishing 1.3 2?0 2.2 2.4 26 2.9 3.1 3.4 3.8 4.1
Industry Sector 96.7 171.1 177.6 192.2 2195 217.8 239.6 207.9 212.7 216.1Mining & Quarrying 9.6 26.5 27.7 24.3 25 5 29.9 28.5 23.8 22.2 21.2Manufacturing 48.4 90 8 85.9 101.6 130 7 120.2 139.2 107.1 119.1 117.6Registered 29.2 66.9 60.5 74.4 101 7 85.8 103.7 78.8 85.5 84.2Unregistered 19.2 23 9 25.4 27.2 29 1 34.4 35.6 28.3 33.6 33.4
Electricity,Gas &Water 31.7 45.4 57.1 58.6 566 57.7 61.5 69.3 63.3 69.1Construction 7 0 8 4 6.9 7.7 6 7 10.0 10.4 7.7 8.1 8.3
Services Sector 112.6 165 1 160.4 136.8 184.8 180.3 220.2 202.9 232.5 211.1Transport, Storage & Corn. 29.1 39 7 48.5 45.7 53.8 58.8 60.4 59.5 67.8 73.4
Railways 8.1 9 1 12.4 10.0 111 9.8 10.6 10.0 14.4 14.5OtherTransport 17.5 246 29.6 27.4 1.9 36.5 37.9 38.1 37.1 39.7Storage 0.2 0 3 0.4 0.3 0.3 0.4 0.3 0.3 0.2 0.2Communication 3.2 5 7 6.1 7.9 10.5 12.1 11.7 11.2 16.1 18.9
Trade, Hotels etc. 23.3 52.0 32.5 10.0 42.9 34.5 57.6 38.4 59.4 30.2Banking & Insurance 1.7 3 4 5.2 8.8 11 3 11.4 13.7 19.1 15.6 13.6Real Estate etc. 31.4 34.4 35.9 36.6 386 42.3 49.7 50.0 51.6 53.3PublicAdmin&Defence 21.6 28.1 29.9 27.4 28.7 23.1 28.4 27.1 29.1 30.6Other Services 5.5 7 5 8.4 8.4 9 6 10.2 10.3 8.8 9.1 10.1
Gross Domestic Investment 257.9 382 6 381.6 376.8 4516 446.0 510.5 460.5 496.5 479.4
Memo ItemsGross Domestic Investment 308.8 366.4 362.6 426.6 502.7 526.1 612.0 525.2 519.1 506.5Errors&Omissions 24.3 -32.1 -39.1 8.7 2.6 15.7 31.3 16.3 -30.7 -21.7Gross Domestic lnvestment 284.5 398.5 401.7 417.9 500.1 510.5 580.7 508.9 549.8 528.2
(unadjusted) b
a. Refers to CSO's savings-based estimate of investment.b. Refers to Gross Capital Formation unadjusted for errors and omissions. which is CSO's direct estimate of investment based on physical flows.
Source: CSO, National Accounts Statistics 1995.

-146-
Table Al.5 (c)Investment Deflators by Industry of Use
(1980-81=100)
1980-81 1985-86 1986-87 1987-88 1988-89 1989-90 1990-91 1991-92 1992-93 1993-94
Agricultural Sector 100.0 164.0 178.3 192.2 210.9 231.9 253.3 285.7 311.8 332.2
Agriculture 100.0 162.8 176.3 190.1 208.5 230.3 252.4 285.5 313.2 333.2Forestry&Logging 100.0 173.1 194.4 206.5 234.1 252.3 272.5 318.6 357.5 389.3Fishing 100.0 185.0 205.9 223.3 239.8 246.0 256.4 274.9 279.0 304.4
Industry Sector 100.0 164.0 173.8 171.3 186.0 206.5 224.7 263.7 285.2 299.0
Mining & Quarrying 100.0 157.5 163.7 173.3 188.0 210.7 232.9 266.2 296.4 316.6
Manufacturing 100.0 169.2 181.8 168.2 tS0.5 203.3 219.6 258.9 279.0 294.2
Registered 100.0 165.0 178.1 159.5 172.6 194.8 211.0 246.8 268.2 280.1
Unregistered 100.0 181.0 190.6 192.1 207.9 224.4 244.9 292.4 306.7 329.7Electricity,Gas &Water 100.0 159.4 168.7 177.3 199.7 213.9 234.2 272.6 295.0 305.1
Construction 100.0 152.8 156.7 160.8 169.5 190.2 212.8 244.0 267.6 270.7
Services Sector 100.0 149.5 193.1 200.4 207.8 230.8 244.7 283.9 301.7 330.8Transport, Storage & Com. 100.0 161.4 164.8 176.3 197.8 218.2 237.2 269.5 291.4 300.7
Railways 100.0 184.4 186.1 214.3 237.4 269.1 291.8 332.7 342.7 359.2
Other Transport 100.0 152.2 153.0 160.3 181.4 201.7 219.8 247.7 263.1 269.9Storage 100.0 193.5 208.3 229.4 253.3 251.4 265.4 296.0 313.6 357.1Communication 100.0 162.7 176.1 181.2 204.2 225.7 243.9 287.1 310.7 320.0
Trade, Hotels etc. 100.0 88.4 210.5 171.1 168.2 191.9 200.6 234.8 253.0 284.9
Banking & Insurance 100.0 161.9 166.9 168.3 186.2 206.7 225.1 255.7 279.3 292.8
Real Estate etc. 100.0 200.2 225.3 246.3 263.3 279.4 296.2 336.4 358.9 391.2
Public Adnin & Defence 100.0 171.7 185.7 200.7 216.9 241.3 264.6 303.5 328.9 355.2
Other Services 100.0 189.4 193.6 198.1 216.9 236.9 257.0 297.0 323.2 343.9
GrossDomesticlnvestment 100.0 157.7 182.4 184.5 197.5 219.1 236.1 275.0 295.7 316.6
Memo Items
GrossDomesticlnvestment 100.0 158.7 168.7 179.2 194.1 217.2 236.9 276.9 297.5 317.2
Gross Domestic Investment 100.0 159.2 169.0 179.2 194.1 217.0 236.6 276.8 297.9 317.2
(unadjusted) b
a. Refers to CSOs savings-based estimate of investment.b. Refers to Gross Capital Formation unadjusted for errors and omissions, which is CSO's direct estimate of investment based on physical flows.
Source: CSO, National Accounts Statistics 1995.

-147-
Table Al.6 (a)Gross Domestic Investment in Public Sector
(Rs. billion at current prices)
1980-81 1985-86 1986-87 1987-88 1988-89 1989-90 1990-91 1991-92 1992-93
Agricultural Sector 18.92 28.42 29.36 33.03 34.41 33.54 36.26 36.54 41.92Agriculture 17.96 26.42 27.01 30.57 31.61 29.89 31.91 32.28 37.62Forestry & Logging 0.95 1.97 2.30 2.42 2.78 3.62 4.33 4.23 4.28Fishing 0.01 0.03 0.05 0.04 0.02 0.03 0.02 0.03 0.02
Industry Sector 53.27 177.32 196.02 192.84 204.33 235.48 277.65 324.39 305.74Mining&Quarrying 9.14 40.41 42.87 40.96 47.60 62.46 65.04 61.92 63.76Manufacturing 11.70 64.88 61.38 50.73 51.72 54.66 71.45 84.68 83.67Electricity,Gas&Water 29.51 69.12 90.87 98.81 105.62 117.55 137.69 174.11 154.53Construction 2.92 2.91 0.90 2.34 -0.61 0.81 3.47 3.68 3.78
Services Sector 45.48 103.00 128.77 104.72 154.90 186.64 207.59 204.11 275.9Transport, Storage & Com. 18.19 34.96 51.41 46.40 61.50 75.92 79.58 92.37 123.91
Railways 8.14 16.85 23.10 21.52 26.37 26.43 30.78 33.17 49.21OtherTransport 6.67 8.49 17.00 10.12 13.48 21.86 19.73 26.58 24.27Storage 0.17 0.43 0.57 0.46 0.27 0.36 0.46 0.51 0.45Communication 3.21 9.19 10.74 14.30 21.38 27.27 28.61 32.11 49.98
Trade, Hotels etc. -0.30 3.55 1.17 -22.61 -2.99 17.48 14.55 -16.71 12.49Banking&Insurance 1.10 3.20 4.98 9.49 14.82 16.99 17.98 23.52 18.18Real Estate etc. 1.70 5.18 6.59 6.70 7.57 7.32 6.16 8.66 9.65PublicAdmin&Defence 21.62 47.96 55.20 55.08 62.24 55.78 75.13 82.27 95.84OtherServices 3.17 8.15 9.42 9.66 11.76 13.15 14.19 14.00 15.83
GrossDomesticInvestmnent 117.67 308.74 354.15 330.59 393.64 455.66 521.50 565.04 623.56
Source: CSO, National Accounts Statistics 1995.

-148-
Table Al.6 (b)Gross Domestic Investinent in Public Sector
(Rs. billion at 1980-81 prices)
1980-81 1985-86 1986-S7 1987-88 1988-89 1989-90 1990-91 1991-92 1992-93
Agricultural Sector 18.92 16.31 15.50 15.76 14.82 13.01 13.13 11.35 11.85Agriculture 17.96 15.16 14.28 14.58 13.62 11.56 11.53 10.01 10.65Forestry&Logging 0.95 1.13 1.18 1.16 1.19 1.43 1.59 1.33 1.19Fishing 0.01 0.02 0.04 0.02 0.01 0.02 0.01 0.01 0.01
Indnsty Sector 53.27 108.31 111.07 110.85 105.93 111.40 120.36 121.06 105.09MiningAQuaffying 9.14 25.64 26.17 23.59 24.76 29.63 27.85 23.21 21.4Manufacturing 11.70 38.14 30.89 30.36 28.60 26.49 32.49 33.13 30.91Electricity,Ga &Water 29.51 43.15 53.67 55.59 52.65 54.81 58.56 63.38 51.51Construction 2.92 1.38 0.34 1.31 -0.08 0.47 1.46 1.34 1.27
Servica Sector 45.48 57.54 69.27 50.73 72.20 81.98 82.39 67.92 87.55Trasnpost,Storage&Com. 18.19 20.19 29.79 24.34 28.90 32.74 31.14 31.72 39.42
Railways 8.14 9.14 12.41 10.04 11.11 9.82 10.55 9.98 14.36OtherTransport 6.67 5.18 11.00 6.21 7.22 10.69 8.68 10.37 8.82Storage 0.17 0.22 0.28 0.20 0.10 0.15 0.18 0.18 0.15Counununication 3.21 5.65 6.10 7.89 10.47 12.08 11.73 11.19 16.09
Trade,Hotelsetc. -0.30 0.11 -1.39 -14.53 -1.94 9.56 7.19 -7.47 4.85Banking & burance 1.10 1.94 3.02 5.71 8.05 8.26 8.03 9.27 6.59Real Estate etc. 1.70 2.56 2.99 2.82 2.98 2.69 2.12 2.64 2.71Public Adihin&Defence 21.62 28.14 29.86 27.44 28.70 23.12 28.39 27.11 29.14Other Services 3.17 4.60 5.00 4.95 5.51 5.61 5.52 4.65 4.84
GrosaDomestic zwestmcnt 117.67 182.16 195.84 177.34 192.95 206.39 215.88 200.33 204.49
Source: CSO, National Accounts Statistics 1995.

-149-
Table A2.1Bae of Paymaeb'
(USS million at current pricea)
1980-81 1985-46 1986-87 1987-88 1983-89 1939-90 1990-91 1991-92 1992-93 1993-94
ExportsofGoodsandNon-FactorServices 11265 12773 13637 16217 18213 21201 23023 23237 23585 21925Merchandise (fob) 3316 9463 10420 12646 14257 16955 18477 13266 13869 22700Non-factor Services 2949 3310 3217 3571 3956 4246 4551 5021 4716 6225
Imports of Goods and Non-Factor Servioes 17378 19422 19962 22343 26343 27934 31435 24379 26326 29433Merchandise (cif) 15362 17293 17740 19316 23613 24411 27914 21064 23237 23985Non-factor Services 1516 2124 2222 3027 3225 3523 3571 3315 3539 5443
Trade Balance -7546 -7835 -7320 -7170 -9361 -7456 -9437 -2793 -4363 -1235NonfactorServicesBalance 1433 1186 995 544 731 723 980 1206 1127 777
Resource Balance -6113 -6649 -6325 -6626 -8630 -6733 -8457 -1592 -3241 -503
Net Factor Income 356 -1553 -2046 -2472 -2633 -2928 -3752 -3830 -3423 -4002Factor Service Receipts 1033 547 501 446 397 936 1221 1232 1142 355Factor Service Payment b 727 2100 2547 2913 3030 3364 4973 5062 4565 4857
Net Current Transfers 2360 2207 2327 2698 2654 2231 2069 3733 2773 3325Transfer Receipts 2374 2219 2339 2724 2670 2297 2083 3798 27S4 3350Transfer Payments 14 12 12 26 16 16 14 15 11 25
Current Account Balance -2397 -5995 -6044 -6400 -3609 -7380 -10140 -1639 -3391 -685
Foreign Investment 8 160 208 181 287 350 165 158 587 4110DirectForeignInvestment S 160 203 131 287 350 165 150 341 620Portfolio Investment 0 0 0 0 0 0 0 3 246 3490
Official Grant Aid 643 359 403 410 406 500 462 461 363 370Net Medium & Long-Term Capital' 1345 2120 2490 3417 3346 3074 2321 5212 613 2954
Gross Disbursements 2439 5009 6605 7304 8123 7332 6754 3073 5553 7969World Bank Staff estimates. 755 1310 2290 1395 1949 1963 2397 2576 2939 4075
Other LT Inflows (NRI) 339 1579 1825 1992 2323 2295 1536 290 2001 940
Capital Flows NEI -798 2538 1337 1144 1520 1320 2357 -1371 65 343Nct Short-Term Capital 573 636 583 727 635 1143 1043 -1474 -730 -2714Others d -200 474 -102 -731 141 167 -1193 -1240 -373 -745Capitalflowsn.e.i.' -1171 1423 1351 114S 694 10 2507 343 1673 4307
Overall Balance -1360 312 720 744 -222 15S -2799 2611 -262 3533
Net IMF Credit 1014 -264 -643 -1082 -1210 -100I 1028 773 1239 189
Change in Reserves (Excl. Gold) 346 -54S -72 338 1432 850 1771 -3334 -1027 -3727(- = increase)
Memorandum Items:End of Year Gross Reserves (Excr. Gold) 6858 6657 6729 6391 4959 4109 2333 5722 6749 15476Reserves in Months of Imports 5.2 4.6 4.6 3.9 2.5 2.0 1.0 3.3 3.5 7.7Current Account Deficit I GDP 1.7/o 2.3% 2.6% 2.5% 3.1% 2.7% 3.4% 0.70/o 1.6% 0.3%Debt Service Ratio f 9.2% 22.7% 32.0% 29.4% 23.0% 27.6% 30.3% 28.2% 23.1% 26.6%
a. BOP based on revised treatment of non-cudtom imports t sdopted by GOI from 1990-91 onwards.b. Includes interest on military debt to FSU and return on forcigp investments.c. Excluding non-resident deposits, shown below under Other LT Inflows (NRI).d. Corresponds to bilateral balance or ervioing of the Russia debt from 1990-91 onwards.e. Residual item including reserve valuation changes, rnpee trade imbalance, etc.f As proportion of gross current receipts.
Source: Government of India; Resrve Bank of Indis; Minisry of Commeroe; Ministry of Finance, Economic Suev. various issua;World Bank Staff estimates.

-150-
Table A2.2 (a)Merchandise Exports
(US$ million at current prices)
1980-81 1985-86 1986-87 1987-88 1988-89 1989-90 1990-91 1991-92 1992-93 1993-94
Primary Exports 3399 3152 3279 3287 3254 3853 4354 4189 3940 4794Fish 275 334 421 411 435 412 535 588 602 814Rice 284 160 154 261 229 256 257 308 337 410Cashews 177 184 256 243 191 221 249 276 259 334Coffee 271 217 232 202 203 208 140 135 130 174Tea 540 511 451 463 421 550 596 494 337 338Spices 141 227 218 260 190 170 133 161 136 181Iron Ore 384 473 428 427 465 557 584 585 381 438OtherPrimary 1327 1046 1118 1020 1121 1478 1859 1641 1758 2105
Manufactured Exports 5106 5639 6457 8797 10693 12715 13781 13773 14603 17441Chemicals 298 407 456 618 890 1288 1176 1591 1378 1813LeatherManufactures 494 629 721 964 1051 1170 1448 1276 1278 1300Textiles 1057 860 994 1407 1312 1598 2266 2164 2153 2536Garments 697 872 1041 1403 1452 1936 2235 2211 2394 2586Gems&Jewellery 783 1228 1622 2015 3033 3179 2923 2753 3072 3995Engineering Goods 1048 779 886 1141 1558 1967 2157 2246 2458 3023Petroleum Products 32 417 321 500 349 418 522 417 476 398OtherManufacturesa 697 447 416 750 1049 1159 1053 1115 1394 1791
TOTAL EXPORTS (Commerce)b 8506 8791 9736 12085 13948 16569 18136 17962 18542 22235
Statistical Discrepancy -189 672 684 561 310 387 341 304 327 465
TOTALEXPORTS (B.O.P.) 8316 9463 10420 12646 14257 16955 18477 18266 18869 22700
a. Including unclassified exports.b. Net of crude petroleum exports.
Source: Ministry of Commerce (D. G. C.I .S); Reserve Bank of India; Ministry of Finance, Economic Survey, various issues;World Bank Staff estimates.

-151-
Table A2.2 (b)Merchandise Exports
(USS million at 1980-81 prices)
1980-81 1985-86 1986-87 1987-88 1988-89 1989-90 1990-91 1991-92 1992-93 1993-94
Primary Exports 3399 3078 3184 3099 3220 3986 4499 4368 4530 5619Fish 275 325 357 354 386 424 480 571 571 424Rice 284 96 97 152 137 165 197 265 424 300Cashews 177 204 236 229 202 266 305 288 344 404Coffee 271 295 231 317 291 437 339 343 445 437Tea 540 471 418 479 451 487 463 503 390 487Spices 141 153 138 114 122 115 110 115 104 115IronOre 384 497 468 461 541 578 530 490 344 578OtherPrimary 1327 1037 1239 994 1090 1513 2075 1793 1909 2874
Manufactured Exports 5106 5875 6698 8414 9184 10418 11303 12678 14142 16997Chemicals 298 377 463 542 847 1182 1585 2157 1333 1724LeatherManufactures 494 781 770 899 958 962 980 957 1071 1151Textiles 1057 669 757 1074 915 1123 1329 1873 2513 2267Garnents 697 837 917 1142 1137 1485 1641 1759 1823 1807Gems & Jewellery 783 1021 1419 1602 2082 1909 1573 1646 2082 2640Engineering Goods 1048 952 978 1391 1728 2221 2470 2514 3229 5018Petroleum Products 32 535 645 986 694 784 917 980 1242 1336Other Manufactures ' 697 704 749 777 823 752 808 793 850 2390
TOTAL EXPORTS (Commerce)b 8506 8954 9883 11513 12403 14404 15802 17046 18673 22616
Statistical Discrepancy -189 684 695 535 275 336 298 289 329 473
TOTAL EXPORTS (B.O.P.) 8316 9638 10577 12048 12679 14740 16100 17335 19001 23089
a. Including unclassified exports.b. Net of crude petroleum exports.
Source: Ministry of Commerce (D.G.C.I:S); Reserve Bank of India; Ministry of Finance, Economic Survey, various issues;World Bank Staff estimates.

-15 2-
Table A2.2 (c)
Export Unit Value Indices
(US$ terms: 1980-81 100)
1980-81 1985-86 1986-87 1987-88 1988-89 1989-90 1990-91 1991-92 1992-93 1993-94
Primary Exports 100.0 102.4 103.0 106 1 1()1.1 967 96.8 95.9 87.0 85.3Fish 100.0 102.9 118 1 116.1 112.7 97.2 111.5 103.1 105.5 192.0Rice 100.0 167.3 159.0 172.1 167.4 155.6 130.5 116.3 79.5 136.7Cashews 100.0 90.2 108.6 106.3 94.5 82.9 81.7 95.8 75.2 82.7Coffee 100.0 73.4 100.4 03.7 69.7 47.7 41.4 39.5 29.2 39.8Tea 100.0 108.6 107.9 96.7 93.3 113.0 128.8 98.2 86.4 69.4Spices 100.0 148.1 158.2 228.0 155.2 147.3 121.3 139.3 130.4 157.4Iron Ore 100.0 95.1 91.4 92.7 85.9 96.4 1lO.2 119.4 110.8 75.8Other Primary 100.0 100.8 90.3 1026 102.9 97.7 89.6 91.5 92.1 73.2
Manufactured Exports 100.0 96 0 96.4 t104.6 116.4 t22.1 121.9 108.6 103.3 102.6Chemicals 100.0 107.9 98.4 113.9 105.0 108.9 74.2 73.8 103.4 105.2Leather Manufactures 100.0 80.6 93.6 107.2 1()9.8 121.7 147.9 133.4 119.3 112.9Textiles 100.0 128.7 131.4 131.0 143.4 142.3 170.5 115.5 85.7 111.9Garments 100.0 104.2 113.5 122.9 127.7 130.4 136.2 125.7 131.3 143.1Gems & Jewellery 100.0 120.3 114.3 125.7 145.7 166.5 185.8 167.3 147.5 151.3Engineering Goods 100.0 81.8 90.6 X2 0 90.1 88.6 87.3 89.4 76.1 60.2Petroleum Products 100.0 77.9 49.8 5)0.8 50.3 53.4 57.0 42.5 38.3 29.8Other Manufactures 100.0 63 5 55.6 964 127.4 154.0 130.3 140.5 164.1 74.9
TOTAL EXPORTS (Commerce) b 100.0 98.2 98.5 1(i5() 112.4 115.0 114.8 105.4 99.3 98.3
Statistical Discrepancy 100.0 98.2 98.5 105(.0 112.4 115.0 114.8 105.4 99.3 98.3
TOTAL EXPORTS (B.O.P.) 100.0 98.2 98.5 105.0 112.4 115.0 114.8 105.4 99.3 98.3
a. Including unclassified exports.
b. Net of crude petroleum exports.
Source: Ministry of Commerce (D.G.C.I.S); Reserve Bank of India; Ministry of Finance, Economic Survey, various issues;World Bank Staff estimates.

-153-
Table A2.3 (a)Merchandise Imports
(USS million at current prices)
1980-81 1985-86 1986-87 1987-88 1988-89 1989-90 1990-91 1991-92 1992-93 1993-94
Food 1348 1321 1068 1292 1203 714 690 424 702 550Foodgrains 127 90 37 25 437 227 102 70 334 93Edible Oils 865 600 479 709 503 127 182 101 58 53Others 356 631 552 557 263 361 407 253 311 404
OtherConsumerGoods 378 452 594 600 700 800 851 634 782 680
P.O.L 6669 4054 2187 3148 2938 3766 6028 5364 6000 5453Crude Petroleum' 4243 3013 1672 2395 1891 2455 3423 3194 3711 3406Petroleum Products 2426 1041 515 753 1047 1311 2605 2170 2289 2047
Capital Goodsb 2416 3503 5073 5064 4803 5304 5833 4233 3743 5312
Intermediate: PRIMARY 1277 2156 2474 2997 3800 4488 4653 3801 4553 4533Fertilizer Raw Material 210 313 218 243 301 329 348 309 279 194Gems 528 899 1170 1538 1984 2546 2082 1957 2442 2634Other 539 944 1087 1217 1515 1613 2223 1534 1832 1705
Intermediate: MANUFACTURES 3781 4471 4316 4054 6053 6147 6018 5673 6297 6257Fertilizer Manufactures 826 860 387 132 341 737 636 645 699 632Iron&Steel 1080 1140 1134 982 1341 1383 1177 799 779 795Non-Ferrous Metals 605 443 324 444 544 752 614 341 395 479Others 1270 2028 2470 2496 3827 3275 3591 3888 4425 4351
TOTALIMPORTS(Commerce)' 15869 15957 15712 17156 19497 21219 24073 20128 22078 22785
Statistical Discrepancy -7 1341 2028 2660 4121 3192 3841 936 1159 1200
TOTALIMPORTS' 15862 17298 17740 19816 23618 24411 27914 21064 23237 23985
a. Net of crude oil exports.b. 1987-88 onwards Capital Goods includes Project Goods.
Source: Ministry of Commerce (D.G.C.I.S); Reserve Bank of India; Ministry of Finance, Economic Survey various isues;World Bank Staff estimates.

-154-
Table A2.3 (b)Merchandise Imports
(US$S million at 1980-81 prices)
1980-81 1985-86 1986-87 1987-88 1988-89 1989-90 1990-91 1991-92 1992-93 1993-94
Food 1348 1454 1527 1710 1968 865 807 445 1014 612Foodgrains 127 113 56 35 1021 310 126 77 662 165EdibleOils 865 564 770 980 539 160 259 111 51 56Oten 356 777 701 695 409 395 422 256 302 391
OtberConiumerGoods 378 471 567 513 555 643 647 472 558 483
P.O.L 6669 5113 5065 5959 6748 7281 8284 9428 11415 11918CmidePedroleum 4243 3828 4053 4644 4665 5105 5422 6283 7660 79S8Petroleum Produts 2426 1285 1012 1314 2083 2176 2862 3145 3755 3929
Capital Goods 2416 3875 4703 4203 3702 4142 4311 2610 2594 3664
Intermediate: PR1MARY 1277 2461 3038 2419 2841 3363 3314 2646 3072 3075Fertilizer Raw Mserial 210 140 197 161 178 157 174 151 147 121Gems 528 977 1127 1262 1511 1965 1521 1400 1673 1796Othr 539 1344 1714 996 1151 1242 1619 1095 1251 1158
Intanxediate: MANUFACTURES 3781 5468 4644 3529 4728 5057 4797 4335 4818 4926FostiuizerManufactires 826 1163 813 320 472 876 808 830 1117 989IronhSteel 1080 1319 1110 874 1275 1162 936 622 581 590Non-Ferrous Metals 605 642 481 540 553 775 599 325 361 436Othes 1270 2344 2240 1795 2428 2244 2454 2557 2759 2911
TOTAL MPORTS (Commerco) 15869 18842 19543 18332 20542 21351 22160 19936 23471 24678
Statistical Discrepancy -7 1583 2522 2842 4342 3212 3536 927 1232 1300
TOTAL IMPORTS ' 15862 20426 22066 21175 24884 24563 25695 20863 24703 25977
a. Net of cmde oil exporu.b. 19S7-S8 onwards Capital Goods includes Project Goods.
Source: Ministry of Commerce (D.G.C.I.S); Reserve Bank of India; Ministry of Finance, Economic Survey various issues;World Bank Staff estimates.

-15 5-
Table A2.3 (e)Import Unit Value Indices
(USS Terms: 1980-81 = 100)
1980-81 1985-86 1986-87 1987-88 1988-89 1989-90 1990-91 1991-92 1992-93 1993-94
Food 100.0 90.8 70.0 75.5 61.1 82.6 85.5 95.3 69.2 89.8Foodgrains 100.0 79.6 66.1 72.0 42.8 73.1 80.6 91.4 50.4 56.4Edible Oils 100.0 106.4 62.2 72.4 93.4 79.3 70.1 90.4 114.0 94.6Others 100.0 81.1 78.8 80.2 64.5 91.4 96.4 98.6 102.9 103.3
Other Consumer Goods 100.0 95.9 104.8 117.1 126.1 124.5 131.5 134.3 140.2 140.8
P.O.L 100.0 79.3 43.2 52.8 43.5 51.7 72.8 56.9 52.6 45.8Crude Petroleum 100.0 78.7 41.2 51.6 40.5 48.1 63.1 50.8 48.4 42.6Petroleum Products 100.0 81.0 50.9 57.3 50.3 60.2 91.0 69.0 61.0 52.1
Capital Goods 100.0 90.4 107.9 120.5 129.7 128.1 135.3 162.2 144.3 145.0
Intermediate: PRIMARY 100.0 87.6 81.5 123.9 133.8 133.4 140.4 143.6 148.2 147.4Fertilizer Raw Material 100.0 223.6 110.5 150.7 168.7 209.6 200.0 204.7 190.1 160.3Gems 100.0 92.0 103.8 121.9 131.3 129.6 136.9 139.8 146.0 146.7Other 100.0 70.2 63.4 122.2 131.6 129.9 137.3 140.2 146.4 147.2
Intermediate: MANUFACTURES 100.0 81.8 92.9 114.9 128.0 121.6 125.4 130.9 130.7 127.0Fertilizer Manufactures 100.0 73.9 47.6 41.3 72.3 84.2 78.7 77.7 62.5 63.9Iron & Steel 100.0 86.4 102.1 112.3 105.2 119.0 125.7 128.4 134.1 134.7Non-Ferrous Metals 100.0 69.0 67.5 82.3 98.3 97.0 102.5 104.7 109.3 109.9Others 100.0 86.5 110.3 139.1 157.6 145.9 146.3 152.1 160.4 149.5
TOTAL IMPORTS (Commerce) 100.0 84.7 80.4 93.6 94.9 99.4 108.6 101.0 94.1 92.3
Statistical Discrepancy 100.0 84.7 80.4 93.6 94.9 99.4 108.6 101.0 94.1 92.3
TOTAL IMPORTS 100.0 84.7 80.4 93.6 94.9 99.4 108.6 101.0 94.1 92.3
Source: Ministry of Cornmerce (D.G.C.I.S); Reserve Bank of India; Ministry of Finance, Economic Survey various issues;World Bank Staff estimates.

-156-
Table A2.4Invisibles on Current Account
(UJSS million)
1980-81 1985-86 1986-87 1987-88 1988-89 1989-90 1990-91 1991-92 1992-93 1993-94
GROSS RECEIPTS 6906 6076 6057 6741 7023 7479 7855 10051 8642 10930Non-Factor Services 2949 3310 3217 3571 3956 4246 4551 5021 4716 6225of which:Transport 458 494 538 680 898 907 983 939 982 2327Travel 1478 972 1256 1431 1419 1433 1456 1977 2098 2075Others 1013 1844 1423 1460 1639 1906 2112 2105 1636 1823
Factor Income 1083 547 501 446 397 936 1221 1232 1142 855Current Transfers 2874 2219 2339 2724 2670 2297 2083 3798 2784 3850
GROSS PAYMENTS 2257 4236 4781 5971 6271 7403 8558 8892 8165 10330Non-Factor Services 1516 2124 2222 3027 3225 3523 3571 3815 3589 5448of which:Transport b 450 667 585 870 1027 1115 1093 1289 1485 2250Travel 114 336 290 376 405 403 392 465 385 750Others 952 1121 1347 1781 1793 2005 2086 2061 1719 2448
Factor Income 727 2100 2547 2918 3030 3864 4973 5062 4565 4857Current Transfers 14 12 12 26 16 16 14 15 11 25
NET RECEIPTS 4649 1840 1277 770 752 76 -703 1159 477 600Non-Factor Services 1433 1186 995 544 731 723 980 1206 1127 777of which:Transport 8 -173 -47 -190 -129 -208 -110 -350 -503 77Travel 1364 636 966 1055 1014 1030 1064 1512 1713 1325Others 61 723 76 -321 -154 -99 26 44 -83 -625
Factor Income 356 -1553 -2046 -2472 -2633 -2928 -3752 -3830 -3423 -4002Current Transfers 2860 2207 2327 2698 2654 2281 2069 3783 2773 3825
a. Excluding foreign grants, and including the Bhopal settlement in 1988-89.b. Excluding freight included in c.i.f value of merchandise imports.
Source: Reserve Bank of India; World Bank, World Debt Tables, various issues.

-157-
Table A2.5Decomposition of Recent Export Growth
(US$ million at current prices - annual averages)
1982-83 1988-89 Increase Contribution87-88 93-94 to Growth
Manufactured Exports 6079 13834 7756 90%
Consumption goods 3964 8554 4590 53%Leather 623 1254 631 7%Gems (gross) 1369 3159 1790 21%Garments 915 2136 1221 14%Textiles 1057 2005 948 11%
Investment goods a 881 2235 1354 16%
Intermediate goods 1234 3046 1812 21%Chemicals 428 1356 928 11%Petroleum Prod. 330 430 100 1%Others b 477 1260 783 9%
Primary Exports 3171 4064 893 10%
Fish 370 564 195 2%Rice 176 300 124 1%Cashews 187 255 68 1%Coffee 200 165 -34 0%Tea 492 456 -36 0%Spices 182 162 -20 0%Iron Ore 416 502 85 1%Other Primary 1148 1660 512 6%
TOTAL EXPORTS (Customs) c 9249 17898 8649 100%Discrepancy 713 356 -358TOTAL EXPORTS (BOP) 9963 18254 8291
Memo:Gems (Net) d 319 885 566
a. Refers to engineering goods.b. Including unclassified exports.c. Total exports, f.o.b., net of crude oil.d. Exports less imports of gems and jewellery.
Source: Ministry of Commerce, (D.G.C.I.S.); Reserve Bank of India.

-1598-
Table A3. I (a)External Debt Summary: Debt Outstanding and Disbursed
(US$ million at current prices)
1982-83 1983-84 1984-85 1985-86 1986-87 1987-88 1988-89 1989-90 1990-91 1991-92 1992-93 1993-94
A. Public & Publicly Guar. LT 20566 22769 24355 30284 37175 44379 48040 62775 69339 71886 77486 80985
1. Official Creditors 17787 18983 19236 22729 26396 30394 31221 43659 48440 49523 54037 55822
a. Multilateral 8562 9801 10462 12400 14268 16588 18060 19665 21768 23964 26130 27834
aa. of whichIBRD 1395 1779 1688 2396 3475 4661 5590 6614 7685 8459 9067 9870
ab. ofwhich IDA 6983 7820 8545 9750 10529 11615 12019 12521 13312 14203 15339 15978
b. Bilateral ' 9225 9182 8774 10329 12129 13806 13161 23994 26672 25559 27907 27988
2. Private Creditors 2779 3786 5119 7555 10779 13985 16819 19116 20899 22363 23449 25163
a. Commercial Banks 2288 3228 3933 5728 7986 10934 13332 15076 16666 16576 17456 18911
b. Suppliers Credits 94 96 466 629 805 715 632 539 434 430 582 754
c.Bonds(includinglDB) 11 30 259 657 1117 1317 1876 2577 2948 4436 4351 4027
d. Other Private 386 432 461 541 871 1019 979 924 851 921 1060 1471
B. PrivateNon-Guaranteed LT 1029 1185 1341 1497 1388 1652 1473 1551 1488 1545 1505 2269
C. Total LT DOD(A+B) 21595 23954 25696 31781 38563 46031 49513 64326 70827 73431 78991 83254
D.UseoflMFCredit 3446 4713 4456 4832 4768 4023 2573 1566 2623 3451 4799 5040
E. Short-Tem Debt 2397 3338 3672 4358 4946 5673 6358 7501 8544 7070 6340 3626
F. Total Extemal Debt (C+D+E) 27438 32004 33825 40971 48277 55727 58444 73393 81994 83952 90130 91921
Memo item:
TotalNRIDeposits 2023 2809 3265 4915 6595 8616 10482 12368 13953 12926 14523 14498
a. Data have been revised from March 1990 to include military debt to the former Soviet Union amounting to about $10.0 billion as of March 1990,
$11.6 billion as ofMarch 1991, $9.2 billion as ofMarch 1992, $9.7 billion as of March 1993. and $9.2 billion as of March 1994.
Source: World Bank, DRS data.

-159-
Table A3. 1(b)External Debt Summary: Disbursements
(US$ million at current prices)
1982-83 1983-84 1984-85 1985-86 1986-87 1987-88 1988-89 1989-90 1990-91 1991-92 1992-93 1993-94
A. Public& Publicly Guar. LT 3103 3329 3825 4506 6280 6956 7948 7092 6540 7769 5299 6849
1. Official Creditors 1947 1934 1836 2079 2265 3627 3642 3574 3578 4368 3653 3832
a. Multilateral 1458 1366 1144 1403 1314 2269 2625 2105 2210 2758 2424 2097
aa. IBRD 288 471 291 328 641 1295 1716 1445 1219 1231 852 1216
of which fast-disbursing 0 0 0 0 0 0 0 0 0 150 100 300
ab. IDA 1109 874 823 1047 656 917 755 566 762 953 1186 669
ofwhichfast-disbursing 0 0 0 0 0 0 0 0 0 155 350 0
b. Bilateral 489 568 693 675 951 1358 1017 1469 1367 1611 1229 1735
2. Private Creditors 1156 1395 1989 2427 4015 3329 4306 3518 2962 3401 1645 3017
a. Commercial banks 776 1244 1258 1857 3057 3030 3416 2645 2358 1511 1170 2210
b. Suppliers Credits 40 41 405 193 283 5 16 3 8 77 221 259
c.Bonds(includinglDB) 10 21 232 330 359 116 679 773 586 1644 0 0
d. OtherPrivate 330 89 94 47 316 178 195 97 10 169 254 548
B. Private Non-Guaranteed LT 355 407 450 503 325 348 175 240 214 309 254 1120
C. Total LT Disbursements (A+B) 3458 3736 4275 5009 6605 7304 8123 7332 6754 8078 5553 7969
D. IMF 1968 1376 201 0 0 0 0 0 1754 1233 1623 323
E.NetShort-TermnCapital 800 941 334 686 588 727 685 1143 1043 -1474 -730 -2714
F. Total Disbursements(C+D+E) 6226 6053 4810 5695 7193 8031 8808 8475 9551 7837 6446 5578
Source: World Bank, DRS data.

-160-
Table A3. I(c)External Debt Summirmy: Principal Repayments
(USS million at current prices)
1982-83 1983-84 1984-85 1985-86 1986-87 1987-88 1988-89 1989-90 1990-91 1991-92 1992-93 1993-94
A. Public&PubliclyGuar. LT 714 825 786 947 1810 1606 1669 1641 2079 2303 2633 3822
1. Official Creditors 602 602 549 656 851 1121 991 1115 1223 1467 1658 2384
a. Multilateral 100 122 131 161 242 509 397 467 609 703 838 1000
aa. ofwhichlBRD 72 87 87 104 174 430 303 352 472 527 634 758
ab. ofwhich IDA 26 33 41 53 61 69 81 98 114 141 155 174b. Bilateral 502 480 418 494 609 613 594 648 614 763 820 1384
2. Private Creditors 112 223 237 291 959 485 678 526 856 836 975 1438
a. Commercial Banks 64 154 178 200 773 284 409 278 331 391 545 871
b. Suppliers Credits 33 38 30 47 120 98 96 98 113 82 89 96
d.Bonds(includinglDB) 0 2 0 0 0 6 14 27 282 244 211 343
C.OtherPrivate 15 29 29 44 66 97 159 123 130 119 130 129
B. PrivateNon-GuanteedLT 219 261 305 363 480 289 280 322 318 273 306 253
C. Total LT Repayments(A+B) 933 1086 1091 1310 2290 1895 1949 1963 2397 2576 2939 4075
D. IMF Repayments 0 70 134 264 648 1082 1210 1008 726 460 334 134
E.TotalLTRepaymenta(C+D) 933 1156 1225 1574 2938 2977 3159 2971 3122 3036 3273 4209
Note: Historical amortization payment of the Debt Reporting System differ from numbers of the GOI. These discrepancies are currently under review.
Source: World Bank, DRS data.

-161-
Table A3.1 (d)External Debt Summary: Net Flows
(US$ million at current prices)
1982-83 1983-84 1984-85 1985-86 1986-87 1987-88 1988-89 1989-90 1990-91 1991-92 1992-93 1993-94
A. Public & Publicly Guar. LT 2389 2504 3039 3559 4470 5350 6279 5451 4461 5466 2666 3027
1. Official Creditors 1345 1332 1287 1423 1414 2506 2652 2459 2355 2901 1996 1448
a. Multilateral 1358 1244 1012 1242 1072 1761 2228 1639 1602 2054 1586 1098
aa. ofwhich IBRD 217 384 203 224 467 865 1414 1094 747 703 218 458
ab. ofwhich IDA 1083 841 782 994 595 848 675 468 648 812 1030 495
b. Bilateral -13 88 275 181 342 745 423 820 753 847 409 351
2. Private Creditors 1044 1172 1752 2136 3056 2844 3628 2992 2106 2565 670 1579
a. Commercial Banks 712 1090 1080 1657 2284 2746 3007 2367 2027 1120 625 1339
b. Suppliers Credits 7 3 375 146 163 -93 -80 -95 -105 -5 132 163
c. Bonds (including IDB) 10 19 232 330 359 110 665 746 304 1400 -211 -343
d. OtherPrivate 315 60 65 3 250 81 36 -26 -120 50 124 420
B.PrivateNon-GuaranteedLT 136 146 145 140 -155 59 -105 -82 -104 36 -52 867
C.TotalLTRepayments(A+B) 2525 2650 3184 3699 4315 5409 6174 5369 4357 5502 2614 3894
D. Net IMF Credit 1968 1306 67 -264 -648 -1082 -1210 -1008 1028 773 1289 189
E. NetShortDebtFlows 800 941 334 686 588 727 685 1143 1043 -1474 -730 -2714
F. Total NetFlows(C+D+E) 5293 4897 3585 4121 4255 5054 5649 5504 6428 4801 3173 1370
Memo item:
Total NRI Net Flows 671 938 814 1579 1825 1992 2328 2295 1536 290 2001 940
Source: Derived from Tables 3.1(b) and3.1(c).

-162-
Table A3. I(e)Extemal Debt Summary: Interest Payments
(USS million at current prices)
1982-83 1983-84 1984-85 1985-86 1986-87 1987-88 1988-89 1989-90 1990-91 1991-92 1992-93 1993-94
A Public&PubliclyGuar.LT 613 786 833 1120 1505 1845 2003 2870 3700 3797 3657 3957
1.OfricialCreditors 359 432 443 558 694 812 941 1352 1492 1513 1629 1715
a. Multilateral 148 218 239 282 388 479 581 640 738 799 899 945
aa. ofwhich IBRD 101 158 169 209 296 378 474 529 615 646 708 721
ab. of which IDA 46 58 68 71 91 98 98 90 97 101 109 114
b. Bilateral 211 214 204 276 306 332 360 712 754 714 730 770
2. Private Creditors 254 354 390 562 811 1033 1062 1518 2208 2283 2028 2241
a. Commercial Banks 219 305 340 449 634 806 816 1240 1888 1950 1669 1752
b. Suppliers Credits 6 8 8 48 64 67 61 53 43 31 30 44
c. Bonds(includinglDB) 0 3 3 17 55 85 111 150 207 223 258 361
d. Other Private 29 38 39 48 58 75 74 75 70 79 71 85
B.PrivateNon-GuaranteedLT 126 130 138 154 158 147 127 140 135 126 123 139
C. Total LT Interest (A+B) 739 916 971 1274 1663 1992 2130 3010 3835 3923 3780 4096
D. IMFServiceCCharges 144 277 374 360 317 297 233 184 134 203 271 271
E. Interest Paid on ST Debt 227 261 389 326 356 429 437 570 899 826 399 367
F. Total Interest Paid (C+D+E) 1110 1454 1734 1960 2336 2718 2800 3764 4868 4952 4450 4734
Memo item:
TotalNRIInterestPayments 195 243 291 400 524 715 609 1076 1282 1036 918 905
Note: Historical interest payxnents ofthe Debt Reporting System differ from numbers ofthe G01. These discrepancies are currntly under review.
Source: World Bank, DRS data.

-163-
Table A3.2External Reserves
(US$ million)
Reserve Reserves ReservesForeign Position excluding including Use of Net
Exchange SDRs in the Fund Gold Golda Gold IMF Credit Reserves
1980-81 5850 603 405 6858 370 7228 327 69011981-82 3582 473 405 4460 335 4795 964 38311982-83 4281 291 393 4965 324 5289 2876 24131983-84 5099 230 518 5847 320 6167 4150 20171984-85 5482 145 483 6110 325 6435 3932 2503
1985-86 5972 131 554 6657 416 7073 4290 27831986-87 5924 179 626 6729 470 7199 4291 29081987-88 5618 97 676 6391 507 6898 3653 32461988-89 4226 103 630 4959 473 5432 2364 30671989-90 3368 107 634 4109 487 4596 1493 3102
1990-91 2236 102 -- 2338 504 2842 2623 2191991-92 5631 90 1 5722 542 6264 3451 28121992-93 6434 18 297 6749 557 7306 4798 25081993-94 15068 108 300 15476 583 16059 5040 110191994-95 20809 19 332 21160 695 21855 4312 17543
End of the Month1992
March 5631 90 1 5722 542 6264 3451 2812June 6221 115 1 6336 565 6901 3522 3379September 5777 34 1 5812 582 6394 4183 2211December 5461 4 292 5757 548 6305 4483 1822
1993March 6434 18 297 6749 557 7306 4798 2508June 6553 187 298 7038 560 7598 5102 2495September 7629 61 302 7992 569 8561 5109 3452December 9807 100 292 10199 551 10750 4924 5826
1994March 15068 108 300 15476 583 16059 5040 11019June 16372 45 308 16725 598 17323 4002 13321September 18856 3 312 19171 606 19777 4055 15722December 19386 2 310 19698 603 20301 4034 16267
Note: IiMF Credit refers to Use of IMU credit within the General Resources Account (GRA) excluding Trust Fund,Structural Adjustment Facility (SAF), and Enhanced Structural Adjustment Facility (ESAF) loans.
a. Valued at 35 SDR's per fine troy ounce.
Source: vIMF, International Fiiiancial Statistics, various issues.
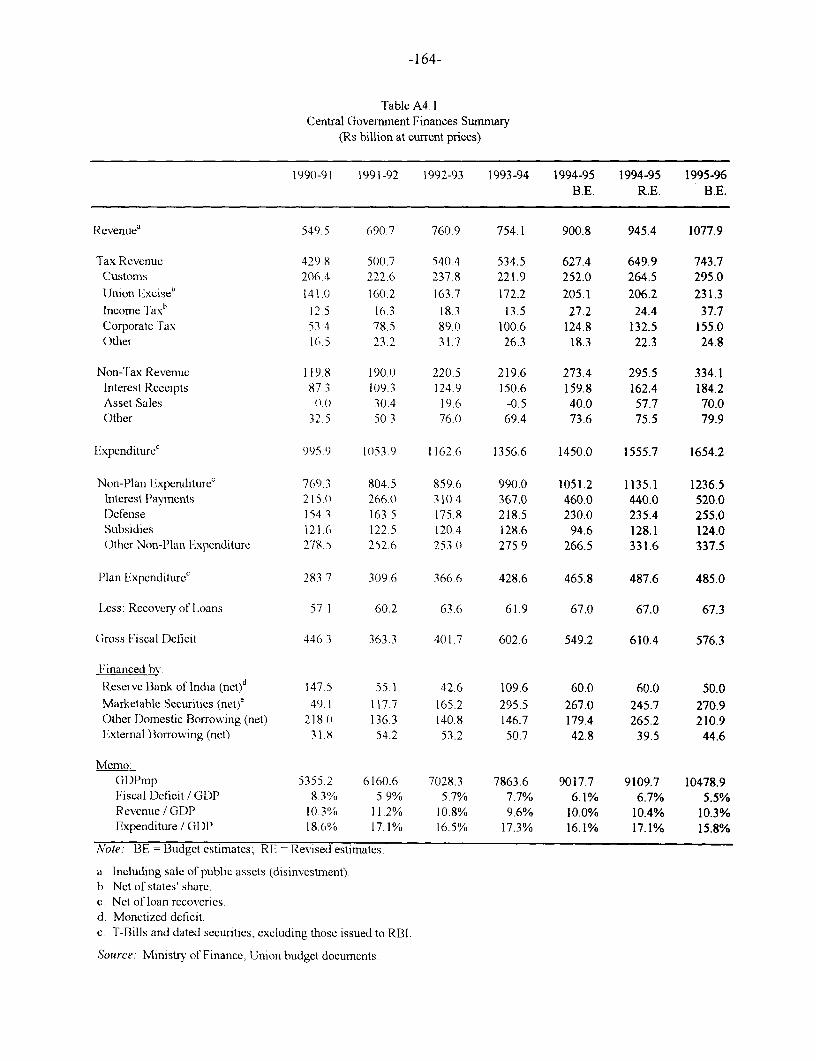
-164-
Table A4. 1Central Government Finances Summary
(Rs billion at current prices)
1990-91 1991-92 1992-93 1993-94 1994-95 1994-95 1995-96B.E. R.E. B.E.
Revenuea 549.5 690.7 760.9 754.1 900.8 945.4 1077.9
Tax Revenue 429.8 500.7 540.4 534.5 627.4 649.9 743.7Customs 206.4 222.6 237.8 221.9 252.0 264.5 295.0Union Exciseb 141.0 160.2 163.7 172.2 205.1 206.2 231.3Income Fax" 12.5 16.3 18.3 13.5 27.2 24.4 37.7Corporate Tax 53.4 78.5 89.0 100.6 124.8 132.5 155.0Other 16.5 23.2 31.7 26.3 18.3 22.3 24.8
Non-TaxRevenuc 119.8 190.0 220.5 219.6 273.4 295.5 334.1Interest Receipts 87.3 109.3 124.9 150.6 159.8 162.4 184.2Asset Sales 0.() 30.4 19.6 -0.5 40.0 57.7 70.0Other 32.5 50.3 76.() 69.4 73.6 75.5 79.9
Expenditurec 995.9 10(53.9 1162.6 1356.6 1450.0 1555.7 1654.2
Non-Plan E`xpenditurec 769.3 804.5 859.6 990.0 1051.2 1135.1 1236.5Interest Payments 215.0 266.0 310.4 367.0 460.0 440.0 520.0Defense 154.3 163.5 175.8 218.5 230.0 235.4 255.0Subsidies 121.6 122.5 120.4 128.6 94.6 128.1 124.0(O)ther Non-l'tan Expenditure 278.5 252.6 253.0 275.9 266.5 331.6 337.5
Plan Expenditurec 283.7 309.6 366.6 428.6 465.8 487.6 485.0
Less: Recovery of Loans 57 1 60.2 63.6 61.9 67.0 67.0 67.3
Gross Fiscal Deficit 446 3 363.3 401.7 602.6 549.2 610.4 576.3
Financed by:
Reserve Bank of India (net)d 147 5 55.1 42.6 109.6 60.0 60.0 50.0Marketable Securities (net)e 49. 1 117.7 165.2 295.5 267.0 245.7 270.9Otherl)omesticBorrowing(net) 218.( 136.3 140.8 146.7 179.4 265.2 210.9External Borrowing (net) 31.8 54.2 53.2 50.7 42.8 39.5 44.6
Mcmo:GDPmnp 5355.2 6160.6 7028.3 7863.6 9017.7 9109.7 10478.9Fiscal Deficit / GDP 8.3% 5.9% 5.7% 7.7% 6.1% 6.7% 5.5%Revenue / GDP 10.3% 11.2% 10.8% 9.6% 10.0% 10.4% 10.3%Expenditure/GDP 18.6%/o 17.1% 16.5% 17.3% 16.1% 17.1% 15.8%
Note: BE = Budget estimates; RE Revised estimates.
a. Including sale of public assets (disinvestment).b Net of states' share.c. Net of loan recoveries.d. Monetized deficit.e. T-Bills and dated securities, excluding those issued to RBI.
Source: Ministry of Finance, Union budget documents.

-165-
Table A4.2Budgetary Classification of Central Government Finances
(Rs. billion at current prices)
1986-87 1987-88 1988-89 1989-90 1990-91 1991-92 1992-93 1993-94 1994-95 1994-95 1995-96
B.F R.E. B.E.
Revenuereceipts 330.83 37037 435.91 499.96 549 54 n60 30 741 28 75s.53 860.84 88770 1007.87
Taxrevenue 243.19 280.15 337.51 383.49 429 7x 500 69 540 44 534 49 627.42 649 88 743.74Non-taxrevenue 87.64 90.22 98.40 116.47 119 76 159.61 200.84 220.04 233.42 237.82 264.13Interestfromstategovernments 27.54 31.58 37.70 44.24 51 74 6522 7754 9553 111 27 113.80 133.48
Revenue expenditure (A+B+C+D) 408.60 461.75 541.06 642.07 735 Iis 823.0X 927.02 1081 69 1188.11 1229.02 1363.29
A. Developmental 102.85 114.25 140.36 184.15 196 )1 198 17 20860 243.6X 26085 306.78 325.2()1. Social services 16.75 19.35 22.43 24.99 27 5.3 30.57 34 30 40.97 45.93 47 72 53.572. Economic services 86.11 94.90 117.93 159.17 168.48 16760 17430 20271 21492 259.06 271.62
B. Non-developmental 220.10 244.59 287.69 335.47 391 0)O 450.34 521.58 613.17 720.83 709.06 810.66Defenceservices 91.79 88.60 95.58 101.94 108 74 114.42 121.09 149.77 161.69 166 11 181.46Interest payments 92.37 112.36 142.61 177.57 214 71 265 63 3 10.35 366.95 460.00 440.00 520.00
C. Grants-in-aid and contributions 78.59 93.49 1(02.08 109.36 134 39 159.53 180.54 211 11 200.30 2(06.75 220.47Grantstostategovernments 73.53 91.36 100.15 107.44 13202 157.00 17830 213.77 19627 202.63 215.44
D. Revenue expenditure ofUTs 7.06 9.43 10.92 1309 13.7 1505 1630 13.73 6 12 6.42 6.97
Netcurrentbalance -77.77 -91.38 -1()5.15 -142.11 -185 61 -162 78 -185 74 -327.16 -327 27 -341.32 -355.42
Capital expenditure (A+B+C+D-E) 185.65 179.07 204.08 237.18 260 88 200.63 215.99 275.41 221.88 269.04 220.93
A. Developmental 75.62 56.67 60.03 70.95 69.23 58.26 73.82 55 60 63.20 75.47 62.341. Social services 3.90 2.80 3.51 3.21 2.47 2.39 2 59 3 32 4.15 7.25 6.212. Economic services 71.72 53.86 56.52 67.74 6677 55.87 7;.23 52.28 59.05 6822 56.13
B. Non-developmental 14.58 33.39 40.76 45.27 49.56 52.32 58.88 73.92 75.58 75.89 81 13Defence services 12.98 31.08 37.83 42.22 45 52 49.05 54.73 68.67 68.31 69.33 73.54
C. Capital expenditure ofUTs 2.40 2.88 1.76 1.87 2.68 3.42 3 5) 2.78 2.46 2.43 2.52
D. Loansandadvances(net) 93.05 86.13 101.53 119.09 139.4(0 117.01 99.41 142.63 12064 172.91 144.94toStates&UTs 49.87 58.51 67.30 79.55 98.69 94.18 86.97 100.72 95.50 143.00 115.27to Others 43.18 27.62 34.23 39.55 40.71 22.83 12.44 41.92 25.15 29.91 29.67
E. Disinvestment of equity in PSEs 0.00 0.00 0.00 0.00 ((00 3(.38 1961 -0.48 40.00 57.67 70.00
Grossfiscal deficit(GOI Deffi.) 263.42 270.45 309.22 379.30 446.50 363.41 40)1.74 602.57 549.15 610.36 576.35
Finance by intnrunentsMarket loans 55.32 58.62 84.18 74.04 80.01 75.10 36.76 289.28 147.00 207.00 227.00Small savings 34.11 39.11 58.35 85.75 91.04 66.40 57.17 91 00 60.00 140.00 80.00Provident funds 46.80 52.74 71.12 90.86 89.37 79.56 87.55 93 58 99.00 108.00 109.64External loans 20.24 28.93 24.60 25.95 31.81 54.21 53.19 50.74 42.79 39.47 44.56Treasurybills 88.62 56.52 62.44 109.11 11769 68.87 11773 119.82 60.00 36.50 49.99Other 18.33 34.53 8.53 -6.41 36.58 19.27 49.33 -41.85 140.36 79.39 65.15
Note: BE = Budget estimates; RE = Revised estimates.
Source: Ministry of Finance, Union budget documents; Department of Expenditure. Finance Accounts.

-166-
Table A4.3Budgetary Classification of State Government Finances
(Rs. billion at current prices)
1986-87 1987-88 1988-89 1989-90 1990-91 1991-92 1992-93 1993-94 1994-95R.E. B.E.a
Revenuereceipts 386.86 448.00 507.09 589.08 673.19 813.59 911.04 1031.77 1123.80
Tax revenue 251.88 289.20 330.70 392.27 448.80 529.53 603.90 673.27 767.02Directtax 16.77 19.85 24.13 30.06 33.75 39.59 42.28 46.71 57.31Indirecttax 150.35 173.37 199.88 229.89 269.70 317.98 356.40 404.12 465.76State share in central taxes 84.76 95.98 106.69 132.32 145.35 171.97 205.22 222.44 243.94
Non-tax revenue 134.98 158.80 176.38 196.81 224.39 284.06 307.14 358.51 356.78Grants from centre 73.53 91.36 100.15 107.44 132.02 157.00 178.30 213.77 196.27
Revenueexpenditure[A+B+C] 381.58 451.54 522.96 602.53 717.73 861.86 962.05 1091.58 1243.4(0
A. Developmental (1+2) 269.44 318.20 362.37 407.81 488.55 585.05 634.65 701.07 773.55
1. Social services 151.99 177.06 205.74 240.17 279.62 310.92 345.65 391.24 445.022.Economicservices 117.45 141.14 156.63 167.64 208.92 274.13 288.99 309.83 328.53
B. Non-developmental 107.69 128.44 155.06 188.69 221.34 266.66 315.06 378.59 456.24Interestpayments 44.29 52.68 64.11 76.68 92.21 109.44 138.65 170.81 200.94Tocentre 27.54 31.58 37.70 44.24 51.74 65.22 77.54 96.95 111.27To others 16.75 21.10 26.41 32.44 40.47 44.23 61.11 73.86 89.67
C. Otherexpenditureb 4.46 4.91 5.53 6.03 7.84 10.16 12.35 11.92 13.61
Net current balance 5.28 -3.55 -15.87 -13.45 -44.54 -48.27 -51.01 -59.81 -119.60
Capital expenditure [A+B+C] 94.39 101.31 98.66 117.52 134.78 132.49 157.77 192.57 213.73
A. Developmental (1+2) 60.51 64.29 68.53 77.28 89.61 98.61 103.44 117.86 140.30
1. Social services 9.88 10.74 11.28 11.71 12.57 16.47 16.64 19.80 25.662. Economic services 50.63 53.55 57.25 65.57 77.03 82.14 86.80 98.06 114.64
B. Non-developmental 2.26 2.26 2.25 2.36 2.63 2.34 3.10 4.02 7.51
C. Loansandadvances(net) 31.62 34.77 27.88 37.88 42.55 31.54 51.22 70.70 65.92
Gross fiscal deficit 89.11 104.85 114.53 130.96 179.32 180.77 208.78 252.38 333.33
Finance by instrument:Market loans 14.31 18.01 22.46 25.95 25.60 33.10 38.50 41.51 46.36Loans from centre (Net) 48.22 58.31 67.07 79.30 98.39 93.75 86.60 101.97 92.82Small savings & Provident funds 10.42 16.28 20.01 23.07 30.69 29.09 36.22 40.33 43.69Other 16.16 12.26 4.98 2.65 24.63 24.82 47.45 68.58 150.46
Note: BE = Budget estimates; RE Revised estimates.
a. Figure for 1994-95 includes Union Territory of Delhi.b. Other expenditure include compensation and assignments to local bodies and panchayat raj institutions and reserve with the
finance department.
Source: Ministry of Finance, Union budget documents; Reserve Bank of India, RBI bulletins on state finances.

-167-
Table A4.4Budgetary Classification of General Government Finances
(Rs. billion at current prices)
1986-87 1987-88 1988-89 1989-90 1990-91 1991-92 1992-93 1993-94 1994-95R.E.a B.E.b
Revenue receipts 616.62 695.43 805.15 937.36 1038.97 1251.67 1396.48 1476.99 1677.10
Tax revenue 495.07 569.35 668.21 775.76 878.58 1030.22 1144.34 1207.74 1394.44Nontaxrevenue 121.55 126.08 136.94 161.60 160.39 221.45 252.13 269.25 282.66
Revenueexpenditure[A+B+C+D] 689.12 790.35 926.17 1092.92 1269.12 1462.72 1633.23 1863.98 2123.97
A. Developmental 372.29 432.44 502.73 591.96 684.56 783.22 843.24 944.75 1034.40
1. Social services 168.73 196.40 228.17 265.15 307.16 341.49 379.95 432.22 490.952. Economic services 203.56 236.04 274.55 326.80 377.40 441.72 463.29 512.53 543.45
B. Non-developmental 300.25 341.45 405.05 479.92 560.60 651.78 759.10 896.23 1065.80C. Revenue disbursements of UTs 7.06 9.43 10.92 13.09 13.75 15.05 16.30 13.73 6.12D. Other expenditurec 9.52 7.04 7.46 7.95 10.21 12.68 14.59 9.27 17.65
Net current balance -72.49 -94.93 -121.02 -155.56 -230.15 -211.05 -236.75 -386.99 -446.87
Capital expenditure [A+B+C+D-E] 230.17 221.87 235.44 275.15 296.97 238.95 286.80 367.26 340.11
A. Developmental (1+2) 136.14 120.95 128.56 148.23 158.84 156.87 177.26 173.46 203.50
1. Social services 13.78 13.54 14.79 14.92 15.04 18.86 19.23 23.12 29.812. Economic services 122.35 107.41 113.76 133.31 143.80 138.00 158.03 150.34 173.69
B. Non-Developmental 16.83 35.65 43.01 47.63 52.19 54.67 61.98 77.93 83.09C.Loansandadvances(net) 74.80 62.38 62.11 77.42 83.26 54.37 63.67 112.62 91.07D. Capital disbursements of UTs 2.40 2.88 1.76 1.87 2.68 3.42 3.50 2.78 2.46E. Disinvestment of equities in PSEs. 0.00 0.00 0.00 0.00 0.00 30.38 19.61 -0.48 40.00
Gross fiscal deficit 302.66 316.79 356.45 430.71 527.12 450.00 523.55 754.25 786.98
Finance by Instrument:Market Loans 69.63 76.63 106.64 99.99 105.61 108.20 75.26 330.79 193.36Small Savings 34.11 39.11 58.35 85.75 91.04 66.40 57.17 91.00 60.00Provident Funds 57.22 69.02 91.13 113.93 120.06 108.65 123.77 133.91 142.69Extemal Loans 20.24 28.93 24.60 25.95 31.81 54.21 53.19 50.74 42.79Treasury Bills 88.62 56.52 62.44 109.11 117.69 68.87 117.73 119.82 60.00Other 32.84 46.58 13.29 -4.02 60.90 43.66 96.43 28.00 288.14
Note: BE = Budget estimates; RE = Revised estimates.
a. Actuals for the center and revised estimates for the states.b. Figure for 1994-95 includes Union Territory of Delhi.c. Other expenditure include compensation and assignments to local bodies and panchayat raj institutions and reserve with the
finance department.
Source: Ministry of Finance, Union budget documents; Reserve Bank of India, RBI bulletins on state finances; Dept. of ExpenditureFinance Accounts.

-168-
Table A4.5Tax Revenue - Center and States
(Rs. billion at current prices)
1986-87 1987-88 1988-89 1989-90 1990-91 1991-92 1992-93 1993-94 1994-95 1994-95 1995-96R.E.a B.E. R.E. R.E.
Central Government
A. Gross tax revenue 328.38 376.66 444.74 516.36 575.76 673.61 746.37 757.44 871.36 898.31 1037.62Corporation tax 31.60 34.33 44.07 47.29 53.35 78.53 88.99 100.60 124.80 132.50 155.00Taxes on income 28.79 31.92 42.41 50.04 53.71 67.31 78.88 91.15 109.25 110.00 135.00Customs 114.75 137.02 158.05 180.36 206.44 222.57 237.76 221.93 252.00 264.50 295.00Union Excise Duties 144.70 164.26 188.41 224.06 245.14 281.10 308.32 316.97 367.00 369.00 427.80Other 8.54 9.13 11.80 14.61 17.12 24.10 32.42 26.79 18.31 22.31 24.82
B. States ShareofTaxRevenue 84.76 95.98 106.69 132.32 145.35 171.97 205.22 222.42 243.94 248.43 293.88IncomeTax 21.60 25.89 27.49 39.22 41.21 51.04 60.57 77.69 82.05 85.60 97.34Estate Duty 0.10 0.06 0.01 0.00 0.00 0.00 0.00 0.00 0.00 0.00 0.00Union Excise Duties 63.06 70.03 79.19 93.10 104.14 120.93 144.65 144.73 161.89 162.83 196.54
C. Assignments ofUT taxes to 0.43 0.53 0.54 0.55 0.63 0.95 0.71 0.53 0.00 0.00 0.00local bodies
Tax Revenue (net) [A-B-C] 243.19 280.15 337.51 383.49 429.78 500.69 540.44 534.49 627.42 649.88 743.74
State Government
States own Tax Revenue 167.12 193.22 224.01 259.95 303.45 357.56 398.68 450.83 523.08
Direct Tax 16.77 19.85 24.13 30.06 33.75 39.59 42.28 46.71 57.31Taxes on income 2.70 2.70 3.12 4.53 6.34 6.45 6.02 6.78 7.59Land revenue 3.82 4.48 5.94 6.90 6.07 6.36 6.17 5.55 10.78Stamps and registration fees 10.16 12.54 14.86 18.45 21.12 26.54 29.78 34.08 37.88Other 0.08 0.13 0.21 0.19 0.22 0.24 0.31 0.31 1.05
Indirect Tax 150.35 173.37 199.88 229.89 269.70 317.98 356.40 404.12 465.76Sales Tax 96.40 111.85 131.22 150.60 176.67 210.64 233.49 270.12 318.51State excise 24.21 28.67 30.81 38.64 47.95 54.39 62.65 65.16 72.91Taxeson Vehicles 9.98 11.75 12.90 14.15 15.66 18.37 21.94 24.89 27.68Other 19.77 21.09 24.96 26.49 29.41 34.58 38.32 43.95 46.66
State's Share of Central Taxes 84.76 95.98 106.69 132.32 145.35 171.97 205.22 222.44 243.94
Tax revenue retained by states 251.88 289.20 330.70 392.27 448.80 529.53 603.90 673.27 767.02
Note: BE = Budget estimates; RE = Revised estimates.
a. Actuals for the center and revised estimates for the states.
Source: Ministry of Finance, Union budget documents; Reserve Bank of India, RBI bulletins on state finances.

-169-
Table A4.6Non-tax Revenue - Center and States
(Rs. billion at current prices)
1986-87 1987-88 1988-89 1989-90 1990-91 1991-92 1992-93 1993-94 1994-95 1994-95 1995-96R.E.' B.E. R.E. R.E.
Central Govemment
Non-tax revenue 87.64 90.22 98.40 116.47 119.76 159.61 200.84 220.04 233.42 237.82 264.13
Interest receipts 53.53 57.55 69.81 84.66 87.30 109.33 124.87 150.62 159.78 162.35 184.20from state governments 27.54 31.58 37.70 44.24 51.74 65.22 77.54 95.53 111.27 113.80 133.48Dividends and profits 5.07 6.05 4.75 7.16 7.74 10.58 24.93 24.48 27.93 27.21 29.46Other general services 3.01 3.37 3.95 4.05 5.06 5.72 10.14 10.46 7.91 10.70 11.01Social services 4.54 0.60 0.80 0.57 0.65 0.90 0.79 1.01 1.31 1.23 1.44Economic services 11.49 12.73 8.93 5.45 8.60 21.46 17.86 13.26 14.68 16.46 19.08Grants-in-aid and contributions 4.36 4.92 6.00 7.54 5.86 9.47 9.19 9.93 13.65 11.76 11.54Other 5.64 5.00 4.16 7.04 4.55 2.15 13.06 10.28 8.16 8.11 7.40
State Government
States own Non-tax revenue 61.45 67.44 76.24 89.37 92.37 127.06 128.84 144.74 160.51
Interest receipts 16.88 19.47 23.87 26.34 24.03 53.20 39.38 44.01 48.81General services 7.04 7.54 9.51 11.40 19.13 17.28 18.44 29.92 31.29Social services 4.75 5.04 5.73 6.76 5.86 7.74 8.48 8.67 9.83Economic services 32.55 35.12 36.64 44.59 43.01 48.39 61.48 61.55 69.98Forestryandwildlife 9.59 10.67 10.08 11.96 11.37 12.71 12.72 13.91 14.17Industries 8.50 9.11 12.08 14.31 12.23 15.37 23.17 23.38 28.29Other 14.46 15.33 14.48 18.32 19.41 20.31 25.59 24.26 27.52Other 0.23 0.28 0.49 0.28 0.34 0.45 1.06 0.59 0.61
Grants from centre 73.53 91.36 100.15 107.44 132.02 157.00 178.30 213.77 196.27
Non-taxrevenueretainedbystate 134.98 158.80 176.38 196.81 224.39 284.06 307.14 358.51 356.78
Note.: BE = Budget estimates; RE = Revised estimates.
a. Actuals for the center and revised estimates for the states.
Source: Ministry of Finance, Union budget documents; Reserve Bank of India, RBI bulletins on state finances.

-170-
Table A4.7Revenue Expendiure of the Central Government
(Rs. billion at cuzrent prices)
1986-87 1987-88 1988-89 1989-90 1990-91 1991-92 1992-93 1993-94 1994-95 1994-95 1995-96B.E. R.E. BE
Revenue expenditure (A+B+C+D) 408.60 461.75 541.06 642.07 735.15 823.08 927.02 1081.69 1188.11 1229.02 136329
A. Developmental 102.85 114.25 140.36 184.15 196.01 198 17 208.60 243.68 260.85 30678 325.20
1. Social services 16.75 19.35 22.43 24.99 27.53 30.57 34.30 40.97 45.93 47.72 53.57Education,Sports,ArtandCulture 7.08 10.13 11.12 11.41 12.74 13.72 14.97 18.37 20.80 21.52 22.19HealthandFamilywelfare 2.22 2.67 3.11 3.48 3.97 4.50 5.59 6.47 7.39 790 8.96Information and Broadcasting 1.72 2.10 2.36 3.23 3.60 4.43 461 415 428 4.46 4.76Wata supply and Saniation 0.80 0.13 0.51 0.78 0.93 0.64 0 63 0.84 1.26 0.90 3.98Labourandlabourwelfare 2.34 1.64 2.43 2.64 2.78 3.00 3.29 5.11 4.81 4.82 5.07Social security and welfare I 86 1.92 1.96 2.36 2.25 2.81 344 3.71 5 10 5.24 5.43Other 0.72 0.76 0.94 1.09 1.27 1.47 1 77 2.33 229 2.87 3.18
2. Economicservices 8611 94.90 117.93 159.17 168.48 167.60 17430 202.71 214.92 259.06 27162
Agricultureandalliedservices 5.10 5.55 7.45 7.75 22.92 19.25 21.26 1873 18 11 35.19 35.35FertilizerSubsidy 18.98 21.64 32.01 4542 4389 51.85 61.36 51.94 4000 51.66 54.00FoodSubsidy 20.00 20.00 22.00 2476 2450 28.50 28.00 55.31 40.00 51.00 52.50ExportSubsidy 7.85 9.62 1386 20.14 27.42 17.58 8.19 665 3.00 5.60 3.15
lIrigationandFloodControl 084 0.76 0.85 0.81 0.89 1.20 1.07 1 68 1.70 1.44 1.77Rural Development 2.91 3.13 3.61 3.70 3.77 3.57 4.06 16.25 42.26 41.57 5700SpecialAreasProgrammes 012 0.06 0.05 0.07 012 0.19 0.17 0.20 0.25 8.10 8.10Energy 3 16 3.94 5.59 6.90 749 5.37 2.67 5.48 5.26 4.52 562
IndustryandMineals 11.17 13.57 12.20 17.96 12.26 1203 17.98 1793 20.37 15.95 1900Transport and Communications 312 6.06 6.79 15.62 8.05 9.19 9.68 14.45 12.79 17.50 1582Science, TechnologyandEnvirorine 610 7.57 9.34 10.40 11.27 12.87 13.68 15.86 17.88 17.77 1876General Economic Services 6.76 2.99 4.18 5.62 5.90 6.00 6.19 -1.84 13.31 8.76 055
B. Non-developmental 220.10 244.59 287.69 335.47 391.00 45034 521.58 613.17 720.83 709.06 810.66
Defenceservices 91.79 88.60 95.58 101.94 108.74 114.42 121.09 149.77 16169 166.11 181.46Interestpayments 92.37 112.36 142.61 177.57 214.71 265.63 310.35 366.95 460.00 440.00 520.00onIntemalDebt 47.63 55.14 69.13 82.73 96.22 109.09 12989 154.83 213.31 193.91 232.83onExtenalDebt 766 9.77 12.42 14.94 1778 25.69 34.51 37.92 41.61 41.10 43.09onSmallSavings,PFs.etc. 3489 44.90 58.01 75.73 96.37 124.20 138.83 168.42 199.04 198.91 23735Other 2.19 2.56 3.06 4.17 4.34 6.66 7.12 5.78 6.04 6.07 6.73Administrative Services 13.28 15.32 17.91 20.71 2524 27.98 37.83 38.27 39.80 4234 4433FuicalServices 12.07 10.94 11.00 12.78 12.12 17.69 20.48 21.37 23.57 2442 24.75Pensions and misc. svices 1059 17.37 20.60 22.46 30.19 24.63 31.84 36.80 35.77 36.20 40.13
C. Grants-in-aidandcontributions 78.59 93.49 102.08 109.36 134.39 159.53 180.54 211.11 200.30 20675 220.47
GrantstoStateGavemment. 73.53 91.36 100.15 107.44 132.02 157.00 178.30 213.77 196.27 202.63 215.44a. NonPlan 16.77 19.80 24.11 23.69 42.19 86.45 27.41 32.39 24.55 24.55 61.07b. State Plan Schemes 26.64 34.43 35.59 35.38 38.78 70.55 82.80 102.39 97.88 109.09 84.03c.CentralandCentrallysponsored 30.12 37.14 40.46 48.37 51.05 54.93 66.34 78.99 73.84 68.99 70.34
schemesd. Other 0.00 0.00 0.00 0.00 0.00 0.00 0.00 0.00 0.00 0.00 0 00
GrantstoUTs. andOthes 5.06 2.13 1.93 1.92 2.37 2.53 224 -2.65 4.04 4.12 503
D Revenue Disbursments ofUTs (net) 7.06 9.43 10.92 13.09 13.75 15.05 16.30 13.73 6.12 6.42 6.97
Memo Items:
Total Subsidies 54.51 59.80 77.32 104.74 121.58 122.53 120.43 128.64 94.63 128.10 124.01Major Subsidies 46.83 51.26 67.87 90.32 95.81 97.93 94.15 107.64 83.00 108.26 109.65Other Subsidies 7.68 8.54 9.45 14.42 25.77 24.60 26.28 21.00 11.63 19.84 14.36
RuralEmploymentProgramme 12.05 14.10 12.44 21.00 20.00 18.17 2546 39.06 50.55 4675 5432RLEGP 7.27 6.66 7.84 0.02 0.00 0.00 0.00 0.00 0.00 0.00 0.00NREP 4.78 7.45 4.60 0.02 0.00 0.00 0.00 0.00 0.00 0.00 0.00JawaharRojgarYojana 0.00 000 0.00 20.96 20.00 18.17 25.26 3306 3855 3535 38.62
Note: BE = Budget estimates; RE = Revised estinates.
Source: Ministry of Finance, Union budget documents, Department of Expenditure, Finance Accounts.

-171-
Table A4.8Revenue Expenditure of State Governments
(Rs. billion at current prices)
1986-87 1987-88 1988-89 1989-90 1990-91 1991-92 1992-93 1993-94 1994-95R.E. B_E.a
Revenue expenditure (A+BAC) 381.58 451.54 522.96 602.53 717.73 861.86 962.05 1091.58 1243.40
A. Developmental (1+2) 269.44 318.20 362.37 407.81 488.55 585.05 634.65 701.07 773.55
1. Social services 151.99 177.06 205.74 240.17 279.62 310.92 345.65 391.24 445.02Education, Sports, Art and Culture. 77.55 90.10 109.43 135.71 155.28 170.77 192.61 220.63 251.88Health and Family Welfare. 25.54 30.53 34.77 39.64 45.86 50.54 56.62 64.81 72.92Water supply and Sanitation 11.78 13.22 13.94 14.77 16.38 18.45 20.95 21.89 24.16Welfare ofSC, s5f and BCs 9.08 11.84 13.18 14.69 17.90 20.71 23.01 27.25 29.77Social security and welfare 9.24 8.23 9.70 11.07 13.62 14.77 16.63 19.30 22.08Other 18.79 23.13 24.72 24.29 30.59 35.68 35.83 37.36 44.21
2. Economic services 117.45 141.14 156.63 167.64 208.92 274.13 288.99 309.83 328.53
Agriculture and Allied Services 33.25 38.98 42.65 48.29 62.67 69.81 84.34 83.27 85.94Crop Husbandry 8.76 9.59 11.06 12.65 16.97 20.82 29.37 27.72 26.94Food Storage and Warehousing 1.05 1.20 1.23 1.56 1.88 2.38 4.16 4.18 4.35Forestryand WildLife 7.61 8.69 9.46 10.28 11.75 13.42 14.90 15.93 17.31Other 15.83 19.50 20.90 23.80 32.06 33.19 35.91 35.44 37.34
Rural Development 28.20 32.20 36.54 28.27 46.75 52.87 63.62 75.45 84.53Special Areas Progranmnes 2.06 2.35 3.09 3.54 3.57 4.11 3.96 5.17 5.10krrigationandFloodControl 24.08 27.75 33.19 33.94 34.56 41.40 48.68 51.42 60.82Energy 4.04 9.14 7.74 10.92 9.89 50.30 26.15 31.69 19.05
Industry and Minerals 6.67 7.33 8.69 12.17 11.65 12.71 13.56 14.98 17.55Transport and Communications 13.78 16.01 17.35 19.22 23.36 27.59 31.28 30.73 34.16Science, Technology and Environment 0.23 0.24 0.23 0.26 0.29 0.36 0.39 0.65 0.72General Economic Services 5.15 7.14 7.15 11.02 16.18 14.98 17.01 16.48 20.66
B. Non-Developmental 107.69 128.44 155.06 188.69 221.34 266.66 315.06 378.59 456.24
Interest Payments 44.29 52.68 64.11 76.68 92.21 109.44 138.65 170.81 200.94On loans from the centre 27.54 31.58 37.70 44.24 51.74 65.22 77.54 96.95 111.27On the Internal Debt 7.06 8.95 10.42 13.41 15.68 21.70 24.67 31.61 38.71On Small Savings, PFs. 6.01 7.63 10.58 12.70 17.03 21.17 24.73 30.01 34.38Other 3.68 4.51 5.41 6.34 7.76 1.36 11.71 12.24 16.58
Administrative Services 37.18 44.18 50.31 59.74 70.18 78.10 93.44 103.88 133.54Pensions and Miscellaneous Services 13.91 17.58 23.92 29.31 35.93 44.79 52.72 69.58 81.42Other 12.31 13.99 16.72 22.96 23.01 34.33 30.24 34.32 40.33
C. Other expenditureb 4.46 4.91 5.53 6.03 7.84 10.16 12.35 11.92 13.61
Note: BE = Budget estimates; RE = Revised estimates.
a. Figure for 1994-95 includes Union Territory of Delhi.b. Other expenditure include compensation and assignments to local bodies and panchayat raj institutions and reserve with the
finance department.
Source: Reserve Bank of India, RBI bulletins on state finances.

-172-
Table A4.9Capital Expenditure: Center and States
(Rs. billion at current prices)
1986-87 1987-88 1988-89 1989-90 1990-91 1991-92 1992-93 1993-94 1994-95 1994-95 1995-96B.E. R.E. B.E.
Central Government
Capital expenditure [A+B+C+D-E] 185.65 179.07 204.08 237.18 260.88 200.63 215.99 275.41 221.88 269.04 220.93
A. Developmental (I +2) 75.62 56.67 60.03 70.95 69.23 58.26 73.82 55.60 63.20 75.47 62.34
1. Social services 3.90 2.80 3.51 3.21 2.47 2.39 2.59 3.32 4.15 7.25 6.21Education, Sports, Art etc. 0.68 0.05 0.13 0.08 0.06 0.04 0.05 0.06 0.15 2.30 0.12HealthandFamilywelfare 0.01 0.19 0.15 0.20 0.00 0.20 0.07 0.03 0.05 0.07 0.14Housing 1.03 0.75 0.99 0.98 1.11 1.26 1.78 1.87 2.06 2.14 2.79Information and Broadcasting 2.13 1.74 1.71 1.78 1.06 0.35 0.07 0.24 0.36 0.30 0.58Other 0.05 0.08 0.52 0.18 0.24 0.53 0.62 1.12 1.53 2.44 2.58
2. Economic services 71.72 53.86 56.52 67.74 66.77 55.87 71.23 52.28 59.05 68.22 56.13Agriculture and allied 2.32 0.54 0.55 0.45 0.45 0.49 0.47 0.48 1.57 3.09 4.48Energy 21.25 18.46 19.05 26.07 27.09 19.91 16.21 17.69 19.72 22.92 13.22Industry and Minerals 20.82 14.07 13.10 11.52 7.71 6.70 8.82 9.87 8.65 8.04 8.06Transport & Communications 23.79 18.40 21.51 26.15 26.45 24.72 33.81 19.45 22.87 22.50 23.81General Economic Services 1.09 0.65 0.00 1.26 2.52 2.57 9.07 1.58 2.27 7.37 2.37Other 2.45 1.75 2.31 2.28 2.56 1.48 2.85 3.21 3.96 4.30 4.19
B. Non-developmental 14.58 33.39 40.76 45.27 49.56 52.32 58.88 73.92 75.58 75.89 81.13Defence Services 12.98 31.08 37.83 42.22 45.52 49.05 54.73 68.67 68.31 69.33 73.54Other 1.59 2.32 2.93 3.05 4.04 3.27 4.14 5.24 7.27 6.56 7.58
C. Capital Expenditure of UTs 2.40 2.88 1.76 1.87 2.68 3.42 3.50 2.78 2.46 2.43 2.52D.LoansandAdvances(Net) 93.05 86.13 101.53 119.09 139.40 117.01 99.41 142.63 120.64 172.91 144.94
To State Governments & UTs. 49.87 58.51 67.30 79.55 98.69 94.18 86.97 100.72 95.50 143.00 115.27To Others 43.18 27.62 34.23 39.55 40.71 22.83 12.44 41.92 25.15 29.91 29.67
E. Disinvestment of equity in PSEs 0.00 0.00 0.00 0.00 0.00 30.38 19.61 -0.48 40.00 57.67 70.00
State Government
Capital expenditure [A+B+C] 94.39 101.31 98.66 117.52 134.78 132.49 157.77 192.57 213.73
A. Developmental (1+2) 60.51 64.29 68.53 77.28 89.61 98.61 103.44 117.86 140.30
1. Social Services 9.88 10.74 11.28 11.71 12.57 16.47 16.64 19.80 25.66Education, Sports, Art etc. 1.20 1.29 1.68 2.64 2.84 2.78 3.02 3.23 4.21Health and Family welfare 1.89 1.88 2.04 1.84 2.37 2.76 2.63 3.31 3.71Water supply and Sanitation 3.39 4.00 4.04 3.37 3.54 4.99 5.49 7.01 8.53Housing 1.75 2.11 1.90 1.99 1.82 2.09 1.88 2.07 2.87Other 1.65 1.45 1.63 1.87 2.00 3.86 3.62 4.18 6.36
2. Economic Services 50.63 53.55 57.25 65.57 77.03 82.14 86.80 98.06 114.64Agriculture and allied 2.60 2.17 2.69 5.91 6.11 8.32 7.85 8.87 7.61Irrigation and Flood control 27.11 29.66 32.66 32.91 36.56 38.52 42.93 46.46 55.63Transport 9.75 9.43 10.27 11.59 13.42 13.92 15.90 19.98 23.13Other 11.17 12.28 11.63 15.16 20.94 21.38 20.13 22.75 28.28
B. Non-developmental 2.26 2.26 2.25 2.36 2.63 2.34 3.10 4.02 7.51C. Loans and advances(Net) 31.62 34.77 27.88 37.88 42.55 31.54 51.22 70.70 65.92
Note: BE = Budget estimates; RE Revised estimates.
Source: Ministry of Finance, Union budget documents; Reserve Bank of India, RBI bulletins on state finances.

-173-
Table A4.10Transfers between Centre and States
(Rs. billion at current prices)
1986-87 1987-88 1988-89 1989-90 1990-91 1991-92 1992-93 1993-94 1994-95 1994-95 1995-96B.E. R.E. B.E.
States' share in central taxes 84.76 95.98 106.69 132.32 145.35 171.97 205.22 222.42 243.94 248.43 293.88Union excise duties 63.06 70.03 79.19 93.10 104.14 120.93 144.65 144.73 161.89 162.83 196.54Income tax 21.60 25.89 27.49 39.22 41.21 51.04 60.57 77.69 82.05 85.60 97.34Estate duty 0.10 0.06 0.01 0.00 0.00 0.00 0.00 0.00 0.00 0.00 0.00
Grants to States 73.53 91.36 100.15 107.44 132.02 157.00 178.30 213.77 196.27 202.63 215.44Non-plan grants 16.77 19.80 24.11 23.69 42.19 86.45 27.41 32.39 24.55 24.55 61.07State plan schemes 26.64 34.43 35.59 35.38 38.78 70.55 82.80 102.39 97.88 109.09 84.03Central and Centrally sponsored 30.12 37.14 40.46 48.37 51.05 54.93 66.34 78.99 73.84 68.99 70.34schemes
Other 0.00 0.00 0.00 0.00 0.00 0.00 0.00 0.00 0.00 0.00 0.00
LoanstoStates&UTs 75.13 86.98 99.15 109.16 135.66 123.30 121.41 139.85 137.92 186.55 162.81
Loan Repayments by States and UTs 25.27 28.47 31.85 29.62 36.97 29.12 34.44 39.13 42.43 43.54 47.54
InterestPaymentsbyStates 27.54 31.58 37.70 44.24 51.74 65.22 77.54 95.53 111.27 113.80 133.48
NET TRANSFER (Centre to States) 180.61 214.28 236.43 275.07 324.32 357.93 392.94 441.37 424.43 480.27 491.10
Note: BE = Budget estimates; RE = Revised estimates.
Source: Ministry of Finance, Union budget documents; Reserve Bank of India, RBI bulletins on state finances; Dept. of Expenditure,Finance Accounts.

-174-
Table A4.11Explicit Subsidies in the Central Government Budget
(Rs. billion at current prices)
1986-87 1987-88 1988-89 1989-90 1990-91 1991-92 1992-93 1993-94 1994-95 1994-95 1995-96B.E. R.E. B.E.
A. Maior Subsidies 46.83 51.26 67.87 90.32 95.81 97.93 94.15 107.64 83.00 108.26 109.65
1. Food 20.00 20.00 22.00 24.76 24.50 28.50 28.00 55.37 40.00 51.00 52.502. Indegenious Fertilizers 17.00 20.50 30.00 37.71 37.30 35.00 48.00 38.00 35.00 40.00 37.503. Imported Fertilizers 1.98 1.14 2.01 7.71 6.59 13.00 9.96 7.62 5.00 11.66 16.504. Other Fertilizer Subsidy 0.00 0.00 0.00 0.00 0.00 3.85 3.40 6.32 0.00 0.00 0.005. Export Promotion and 7.85 9.62 13.86 20.14 27.42 17.58 8.19 6.65 3.00 5.60 3.15
Market Development.
B. Debt relief to farmers 0.00 0.00 0.00 0.00 15.02 14.25 15.00 5.00 3.41 3.41 0.00
C. Other Subsidies 7.68 8.54 9.45 14.42 10.75 10.35 11.28 16.00 8.22 11.12 9.36
5. Railways 1.44 1.74 2.07 2.33 2.83 3.12 3.41 4.05 4.03 4.23 4.116. Mill-made cloth 0.36 0.23 0.27 0.10 0.10 0.15 0.15 0.00 0.00 0.00 0.017. Handloom Cloth 1.23 1.24 1.46 1.81 1.85 1.87 1.94 1.90 2.05 1.59 1.578. Import/Export of Sugar, 0.76 0.05 0.40 0.00 -- 0.00 0.00 0.00 0.00 0.00 0.00
Edible Oils etc.9. Interest Subsidies 2.29 3.93 4.06 8.81 3.79 3.16 1.12 1.13 1.12 0.76 0.3410. Other Subsidies 1.60 1.35 1.19 1.37 2.18 2.05 1.26 2.44 0.92 4.44 3.33
TOTAL - Subsidies 54.51 59.80 77.32 104.74 121.58 122.53 120.43 128.64 94.63 128.10 124.01
-- Not available.
Note: BE = Budget estimates; RE = Revised estimates.
Source: Minstry of Finance, Union Budget Documents.

-175-
Table A4.12Outstanding Debt of Central Governmenta
(Rs. billion at current prices)
1980-81 1985-86 1986-87 1987-88 1988-89 1989-90 1990-91 1991-92 1992-93 1 99 3-94b
1. To Reserve Bank of hidia 152.78 380.47 451.38 516.97 582.00 720.13 884.44 943.48 976.21 989.69
a. Treasury bills 118.44 242.49 185.61 70.91 123.18 235.73 49.80 61.59 167.17 238.38b. CG Securities 38.58 104.23 82.26 88.43 110.89 141.02 174.50 171.47 86.43 -
c. Special securities 5.85 51.87 198.67 371.77 369.87 368.81 671.01 720.47 720.47 720.47d. Other liabilities -2.92 -16.64 -6.95 -6.12 -11.69 -25.43 -10.87 -10.05 2.14 30.84e. Cash balances and Dpts. 7.17 1.48 8.21 8.02 10.25 - -- - - -
2.Tocomtercialbanks 73.64 151.90 202.10 241.46 287.66 333.85 388.13 460.46 531.12 -
a. Treasury bills 5.21 0.46 0.16 0.14 0.03 0.06 0.10 0.11 3.06 -
b. CG Securities 68.43 151.44 201.94 241.32 287.63 333.79 388.03 460.35 528.06 -
To Banking system 226.42 532.37 653.48 758.43 869.66 1053.98 1272.57 1403.94 1507.33 -
3.To Private Sector 258.09 660.94 808.99 964.95 1170.59 1344.52 1557.76 1773.20 2089.21 -
a. Small savings 79.76 214.49 247.25 283.58 338.33 417.91 501.00 557.55 601.28 672.85b. Others 178.33 446.45 561.74 681.37 832.26 926.61 1056.76 1215.65 1487.93 -
4. External Debt 112.98 181.53 202.99 232.23 257.46 283.43 315.25 369.48 422.69 473.45
5. Total outstanding debt 597.49 1374.84 1665.46 1955.61 2297.71 2681.93 3145.58 3546.62 4019.24 4779.68
-- Not available.
a. End of year stocks.b. Provisional.
Source: RBI, Report on Currency and Finance, various issues; Ministry of Finance, Union Budget & Indian Economic Statistics(Public Finance); Ministry of Finance, Economic Survey, various issues; World Bank Staff estimates.

-176-
Table A4.13Outstanding Debt of State Govenunent'
(Rs. billion at current prices)
1980-81 1985-86 1986-87 1987-88 1988-89 1989-90 1990-91 1991-92 1992-93 199 3-9 4b
1. To Reserve Bank ofIndia 11.65 6.31 11.47 9.90 14.14 16.70 20.90 17.50 19.26 25.17a. Gross 12.11 10.65 14.58 10.09 14.29 -- -- -- -- -
b. CashbalancesandDpts. 0.46 4.34 3.11 0.19 0.15 -- - -- --
2.Tocommercialbanks 19.11 44.53 55.25 75.37 89.92 100.83 125.32 182.01 245.28 --
a. SG Securities 16.81 47.74 56.18 69.47 85.02 103.49 122.90 150.12 171.82b. Others 2.30 -3.21 -0.93 5.90 4.90 -2.66 2.42 31.89 73.46 --
ToBankingSystem(1)+(2) 30.76 50.84 66.72 85.27 104.06 117.53 146.22 199.51 264.54
3.ToPrivateSector 45.00 108.06 106.36 119.05 150.40 189.33 219.89 234.90 236.46a. ProvidentFund 24.63 58.17 66.99 83.27 103.29 126.35 157.04 186.14 222.36 262.68b. Others 20.37 49.89 39.37 35.78 47.11 62.98 62.85 48.76 14.10 -
4.To Central Govt. (a-b-c) 164.01 352.23 421.58 483.69 542.06 623.41 719.56 809.63 903.29 1005.23a. LoansfromCenter 170.71 369.84 437.02 495.34 562.22 641.39 741.17 834.90 924.12 1028.19b. States' holding of Trs.Bill 4.35 15.20 12.68 8.88 17.38 15.18 18.80 24.95 20.83 22.96c. States'holding ofCG Sec. 2.35 2.41 2.76 2.77 2.78 2.80 2.81 0.32 0.00 0.00
5. Total outstandingdebt 239.77 511.13 594.66 688.01 796.53 930.27 1085.67 1244.04 1404.29 1588.53
- Not available.
a. End of year stocks.b. Provisional.
Source: RBI, Report on Currency and Finance, various issues; Ministiy of Finance, Union Budget & Indian Economnic Statistics(Public Finance); Ministry of Finance, Economic Survey, various issues; World Bank Staff estimates.
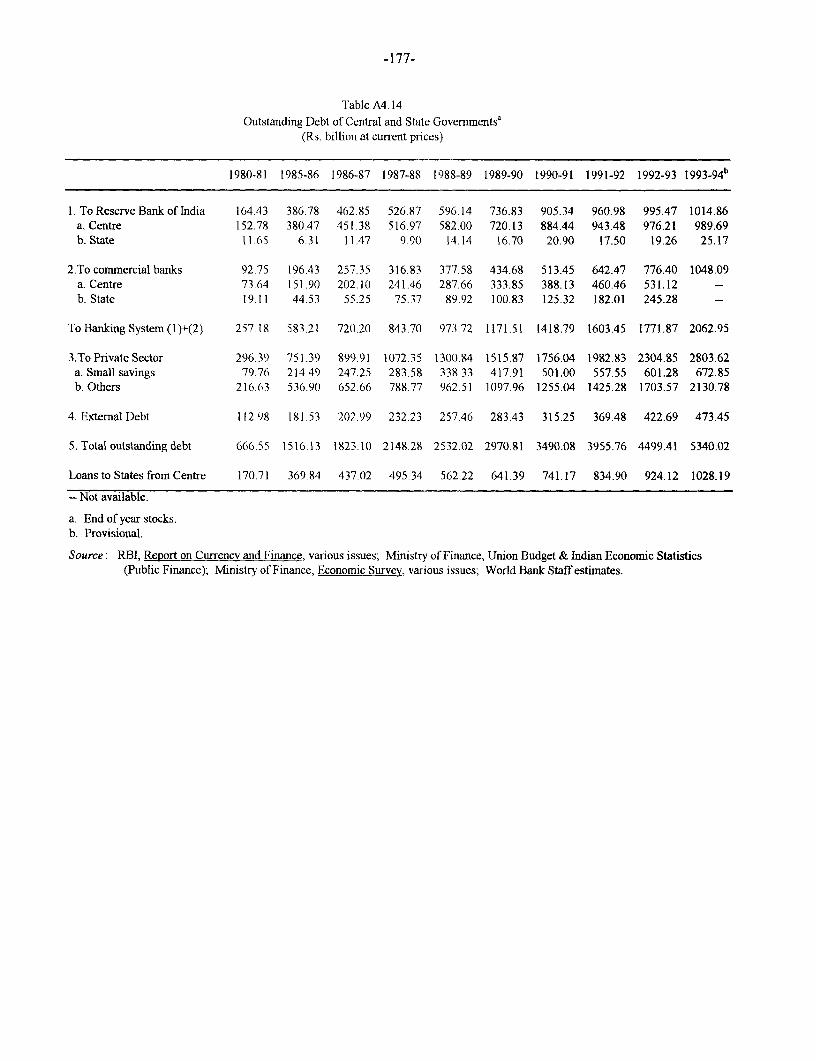
-177-
T able A4.14Outstanding Debt of Central and State Governmentsa
(Rs. billion at current prices)
1980-81 1985-86 1986-87 1987-88 1988-89 1989-90 1990-91 1991-92 1992-93 199 3-94b
1. To Reserve Bank of India 164.43 386.78 462.85 526.87 596.14 736.83 905.34 960.98 995.47 1014.86a. Centre 152.78 380.47 451.38 516.97 582.00 720.13 884.44 943.48 976.21 989.69b. State 11.65 6.31 11.47 9.90 14.14 16.70 20.90 17.50 19.26 25.17
2.To commercial banks 92.75 196.43 257.35 316.83 377.58 434.68 513.45 642.47 776.40 1048.09a. Centre 73.64 151.90 202.10 241.46 287.66 333.85 388.13 460.46 531.12 --b. State 19.11 44.53 55.25 75.37 89.92 100.83 125.32 182.01 245.28 -
ToBankingSystem(1)-(2) 257.18 583.21 72(0.20 843.70 973.72 1171.51 1418.79 1603.45 1771.87 2062.95
3.ToPrivateSector 296.39 751.39 899.91 1072.35 1300.84 1515.87 1756.04 1982.83 2304.85 2803.62a. Small savings 79.76 214.49 247.25 283.58 338.33 417.91 501.00 557.55 601.28 672.85b. Others 216.63 536.90 652.66 788.77 962.51 1097.96 1255.04 1425.28 1703.57 2130.78
4. External Debt 112.98 181 53 202.99 232.23 257.46 283.43 315.25 369.48 422.69 473.45
5.Totaloutstandingdebt 666.55 1516.13 1823.10 2148.28 2532.02 2970.81 3490.08 3955.76 4499.41 5340.02
Loans to States from Centre 170.71 369.84 437.02 495.34 562.22 641.39 741.17 834.90 924.12 1028.19
-- Not available.
a. End of year stocks.b. Provisional.
Source: RBI, Report on Currencv and Finance, various issues; Ministry of Finance, Union Budget & Indian Economic Statistics(Public Finance); Ministry of Finance, Economic Survey, various issues; World Bank Staff estimates.

-178-
Table 4.15(a)Projected and Actual Plan Outlays by Sectors
(Rs billion)
Sixth Plan Seventh Plan Annual Plans Eighth Plan(80-81 - 84-85) (85-86 - 89-90) 90-91 91-92 (92-93 - 96-97) 92-93 93-94
Proj. Actuals Proj. Actuals Actuals Actuals Projected Actuals Revised
A Agriculture & Allied Programs 119.15 152.02 222.34 315.10 85.44 90.59 636.43 132.54 160.21Agficulture 56.95 66.24 105.24 127.93 33.96 38.51 224.67 49.13 58.46Rural Development 53.64 69.97 89.06 152.46 41.21 41.42 344.25 70.13 86.27Special Area Program 14.80 15.81 28.04 34.70 10.27 10.67 67.50 13.28 15.48
B Irfigation & Flood Control 121.60 109.31 169.79 165.91 38.37 42.32 325.25 50.06 64.95MinorIrrigation 18.10 18.48 28.05 31.92 8.35 8.44 59.77 9.69 14.13Majorlmgation 84.48 74.93 115.56 110.20 25.01 28.24 224.15 33.69 42.85Flood Control 10.45 8.11 9.47 9.45 2.08 2.64 16.23 2.70 3.21Command Area Development 8.56 7.79 16.71 14.33 2.93 3.00 25.10 3.97 4.76
C Industry and Minerals 150.18 169.50 221.08 290.99 82.40 65.64 469.22 105.88 125.66Village & Small Scale 17.81 19.45 27.53 32.49 9.07 9.41 63.34 11.80 15.93Large& Medium Industries 132.37 150.05 193.55 258.50 73.33 56.23 405.88 94.07 109.73
D Energy 265.35 307.51 551.29 618.20 179.98 197.34 1155.61 270.44 329.15Power 192.65 182.98 342.74 378.95 113.34 145.18 795.89 137.02 184.55Petroleum 43.00 84.82 129.35 161.31 41.30 33.40 240.00 106.60 113.87Coal 28.70 38.08 74.01 71.22 23.92 17.10 105.07 24.21 27.81
E Transport 124.12 142.07 229.71 297.70 86.96 93.14 559.26 133.18 149.09Railways 51.00 65.87 123.34 165.50 49.16 53.93 272.02 66.00 71.49Roads & Road Transport 46.35 50.82 71.90 84.59 21.32 24.82 169.52 32.36 40.10Ports & Shipping' 14.86 12.13 23.13 26.07 10.97 8.45 76.14 18.84 19.45Civil Aviation 8.59 9.57 7.58 18.99 4.92 5.47 40.83 14.71 17.19
F Communication & Broadcasting 31.34 34.69 61.14 98.93 33.54 36.14 289.66 63.88 71.94
G Science & Technology 8.65 10.11 24.63 30.23 7.87 8.62 90.42 13.18 14.35
H Social Services 140.35 159.15 295.78 332.61 87.90 102.99 751.55 142.71 180.49Education 25.24 29.78 63.83 76.85 20.63 23.75 196.00 32.59 44.00Health&Family Welfare 28.31 34.12 64.49 68.09 17.46 19.48 140.76 27.09 32.49Housing&Urban Development 24.88 28.38 42.30 48.36 12.53 13.52 105.50 21.36 26.89WaterSupply&Sanitation 39.22 39.97 65.22 70.92 18.45 22.46 167.11 41.08 35.89Other Social Services 22.70 26.90 59.94 68.38 18.84 23.77 142.19 20.58 41.22
I Others 8.02 16.50 24.24 57.94 12.72 10.74 63.60 14.43 26.14
J TOTAL 975.0 1100.9 1800.0 2207.6 615.18 647.51 4341.00 926.29 1121.97Note: The Plan totals are at base year prices for projections and at current prices for actuals.
a. Covers Major and Minor ports, Shipping, Lighthouses and Inland Water.
Source: Planning Commission.

-179-
Table 4.15(b)Projected and Actual Plan Outlays by Sectors
(Annual averages at constant 1980-81 prices - Rs. billion)
Sixth Plan Seventh Plan Annual Plans Eighth Plan(80-81 - 84-85) (85-86 - 89-90) 90-91 91-92 (92-93 - 96-97) 92-93 93-94
Proj. Actuals Proj. Actuals Actuals Actuals Projected Actuals Revised
A Agriculture & Allied Programs 26.8 24.8 30.3 33.7 36.1 32.7 46.0 44.5 50.5Agriculture 12.8 10.8 14.3 13.7 14.4 13.9 16.2 16.5 18.4Rural Development 12.1 11.4 12.1 16.3 17.4 15.0 24.9 23.5 27.2Special Area Program 3.3 2.6 3.8 3.7 4.3 3.9 4.9 4.5 4.9
B Irrigation & Flood Control 27.3 17.8 23.1 17.7 16.2 15.3 23.5 16.8 20.5Minor Irrigation 4.1 3.0 3.8 3.4 3.5 3.0 4.3 3.3 4.5Major Irrigation 19.0 12.2 15.8 11.8 10.6 10.2 16.2 11.3 13.5Flood Control 2.3 1.3 1.3 1.0 0.9 1.0 1.2 0.9 1.0Command Area Development 1.9 1.3 2.3 1.5 1.2 1.1 1.8 1.3 1.5
C Industry and Minerals 33.7 27.6 30.1 31.1 34.8 23.7 33.9 35.5 39.6Village & Small Scale 4.0 3.2 3.8 3.5 3.8 3.4 4.6 4.0 5.0Large & Medium Industries 29.7 24.4 26.4 27.6 31.0 20.3 29.3 31.6 34.6
D Energy 59.6 50.1 75.2 66.0 76.1 71.3 83.5 90.8 103.8Power 43.3 29.8 46.7 40.5 47.9 52.4 57.5 46.0 58.2Petroleum 9.7 13.8 17.6 17.2 17.5 12.1 17.3 35.8 35.9Coal 6.4 6.2 10.1 7.6 10.1 6.2 7.6 8.1 8.8
E Transport 27.9 23.1 31.3 31.8 36.8 33.6 40.4 44.7 47.0Railways 11.5 10.7 16.8 17.7 20.8 19.5 19.7 22.2 22.5Roads & Road Transport 10.4 8.3 9.8 9.0 9.0 9.0 12.2 10.9 12.6
Ports & Shipping' 3.3 2.0 3.2 2.8 4.6 3.1 5.5 6.3 6.1Civil Aviation 1.9 1.6 1.0 2.0 2.1 2.0 3.0 4.9 5.4
F Communication & Broadcasting 7.0 5.6 8.3 10.6 14.2 13.1 20.9 21.4 22.7
G Science & Technology 1.9 1.6 3.4 3.2 3.3 3.1 6.5 4.4 4.5
H Social Services 31.5 25.9 40.3 35.5 37.2 37.2 54.3 47.9 56.9Education 5.7 4.9 8.7 8.2 8.7 8.6 14.2 10.9 13.9Health & Family Welfare 6.4 5.6 8.8 7.3 7.4 7.0 10.2 9.1 10.2Housing & Urban Development 5.6 4.6 5.8 5.2 5.3 4.9 7.6 7.2 8.5Water Supply& Sanitation 8.8 6.5 8.9 7.6 7.8 8.1 12.1 13.8 11.3Other Social Services 5.1 4.4 8.2 7.3 8.0 8.6 10.3 6.9 13.0
I Others 1.8 2.7 3.3 6.2 5.4 3.9 4.6 4.8 8.2
J TOTAL 219.1 179.3 245.4 235.9 260.0 233.9 313.7 310.9 353.7
Memo Item: Investment Deflator 89.0 122.8 146.7 187.2 236.6 276.8 276.8 297.9 317.2
Note: See note to Table 4.15(a).
a. Covers Major and Minor ports, Shipping, Lighthouses and Inland Water.
Source: Planning Commission.

-180-
Table A4.15(c)Projected and Actual Plan Outlays by Sectors
(percentage distribution and achievement rates)'
Sixth Plan Seventh Plan Annual Plans Eighth Plan(80-81 - 84-85) (85-86 - 89-90) 90-91 91-92 (92-93-96-97) 92-93 93-94% Achieve- % Achieve- Achieve- Achieve- % Achieve- Achieve-
shareb ment' shareb ment' ment' mentf shareb menf ment'
A Agriculture & Allied Programs 12.2 13.8 12.4 14.3 13.9 14.0 14.7 14.3 14.3Agriculture 5.8 6.0 5.8 5.8 5.5 5.9 5.2 5.3 5.2Rural Development 5.5 6.4 4.9 6.9 6.7 6.4 7.9 7.6 7.7Special Area Program 1.5 1.4 1.6 1.6 1.7 1.6 1.6 1.4 1.4
B Irrigation & Flood Control 12.5 9.9 9.4 7.5 6.2 6.5 7.5 5.4 5.8Minor Irrigation 1.9 1.7 1.6 1.4 1.4 1.3 1.4 1.0 1.3Major Irrigation 8.7 6.8 6.4 5.0 4.1 4.4 5.2 3.6 3.8Flood Control 1.1 0.7 0.5 0.4 0.3 0.4 0.4 0.3 0.3Command Area Development 0.9 0.7 0.9 0.6 0.5 0.5 0.6 0.4 0.4
C Industryand Minerals 15.4 15.4 12.3 13.2 13.4 10.1 10.8 11.4 11.2Village & Small Scale 1.8 1.8 1.5 1.5 1.5 1.5 1.5 1.3 1.4Large & Medium Industries 13.6 13.6 10.8 11.7 11.9 8.7 9.3 10.2 9.8
D Energy 27.2 27.9 30.6 28.0 29.3 30.5 26.6 29.2 29.3Power 19.8 16.6 19.0 17.2 18.4 22.4 18.3 14.8 16.4Petroleum 4.4 7.7 7.2 7.3 6.7 5.2 5.5 11.5 10.1Coal 2.9 3.5 4.1 3.2 3.9 2.6 2.4 2.6 2.5
E Transport 12.7 12.9 12.8 13.5 14.1 14.4 12.9 14.4 13.3Railways 5.2 6.0 6.9 7.5 8.0 8.3 6.3 7.1 6.4Roads & Road Transport 4.8 4.6 4.0 3.8 3.5 3.8 3.9 3.5 3.6Ports & Shippingd 1.5 1.1 1.3 1.2 1.8 1.3 1.8 2.0 1.7Civil Aviation 0.9 0.9 0.4 0.9 0.8 0.8 0.9 1.6 1.5
F Communication & Broadcasting 3.2 3.2 3.4 4.5 5.5 5.6 6.7 6.9 6.4
* Science & Technology 0.9 0.9 1.4 1.4 1.3 1.3 2.1 1.4 1.3
H Social Services 14.4 14.5 16.4 15.1 14.3 15.9 17.3 15.4 16.1Education 2.6 2.7 3.5 3.5 3.4 3.7 4.5 3.5 3.9Health &FamilyWelfare 2.9 3.1 3.6 3.1 2.8 3.0 3.2 2.9 2.9Housing & Urban Development 2.6 2.6 2.4 2.2 2.0 2.1 2.4 2.3 2.4Water Supply & Sanitation 4.0 3.6 3.6 3.2 3.0 3.5 3.8 4.4 3.2Other Social Services 2.3 2.4 3.3 3.1 3.1 3.7 3.3 2.2 3.7
I Others 0.8 1.5 1.3 2.6 2.1 1.7 1.5 1.6 2.3
J TOTAL 100.0 100.0 100.0 100.0 100.0 100.0 100.0 100.0 100.0
a. Derived from Table 4.15(a).b. Percentage share in total plan outlay.c. Actual outlay as a percentage of target outlay for the Plan.d. Covers Major and Minor ports, Shipping, Lighthouses and Inland Water.
Source: Planning Commission.

-181-
Table A 5.1Money Supply and Sources of Change, 1980-81 - 1993-94
(Rs. billion)
1980-Si 1985-86 1986-87 1987-88 1988-89 1989-90 1990-91 1991-92 1992-93 1993-94 1994-95'
BROADMONEYSUPPLY(M3) 557.74 1193.99 1416.42 1642.79 2002.41 2309.48 2658.28 3170.49 3668.25 4344.10 5264.78
NarrowMoney Supply(MI) 234.24 440.99 515.22 585.59 711.01 810.58 928.92 1144.06 1240.66 1507.81 1870.73Currency with Public 134.26 250.59 283.82 335.59 380.71 463.00 530.48 610.98 682.73 823.01 1008.7DepositMoney(total) 95.87 187.50 22830 246.00 32340 341.60 39170 524.23 544.80 659.52 862.03
TimeDeposits withfBanks 323.50 75300 901.20 1057.20 1291.40 1498.90 1729.36 2026.43 2427.59 2836.29 3394.05
SOURCES OF CHANGE
NetBankDomesticCredit 623.59 1411.24 1667.61 1918.57 2300.36 2688.57 3119.62 3462.56 3963.73 4416.92 5074.81
To Goveniment 257.18 583.21 720.20 843.70 973.73 1171.53 1401.93 1582.63 1762.38 2039.18 2195.91FromReservelBankoflndia(RBI) 164.43 386.78 462.85 526.87 596.15 736.83 888.48 940.16 984.49 993.00 987.37FromnOtherBanks 9275 196.43 257.35 316.83 377.58 434.70 513.45 642.47 777.89 1046.18 1208.54
ToCommercial Sector 366.41 828.03 947.41 1074.87 1326.63 1517.04 1717.69 1879.93 2201.35 2377.74 2878.9FromReserveBankoflndia 17.00 30.52 33.94 37.90 55.24 63.49 63.42 72.60 62.20 6445 65.93FromOtherBanks 349.41 797.51 91347 1036.97 1271.39 1453.55 165427 1807.33 2139.15 2313.29 2812.97
Net Foreign Exchange Assets 47.30 38.72 48.15 56.72 6800 66.51 105.81 212.05 25014 537.27 746.86of Banking Sector
Govennmenfs Currency Liabilities 6.19 9.40 11.92 13.80 14.75 1555 16.21 17.04 18.24 19.90 21.04to the Public
Net Non-MonetwryLiabilities 119.34 265.37 311.26 346.30 380.70 461.15 583.36 521.37 563.24 619.01 589.97of Reserve Bank of India 53.60 107.07 134.44 142.25 169.36 175.36 270.22 27415 282.46 260.37 266.16of Other Banks 65.74 158.30 176.82 204.05 211.34 285.79 313.14 247.22 280.78 358.64 323.81
BroadMoneySupply(M3) 557.74 1193.99 1416.42 1642.79 2002.41 2309.48 2658.28 3170.49 3668.25 4344.10 5264.78
GDP at market prices 1360.13 2622.43 2929.49 3332.01 3957.82 4568.21 5355.17 6160.61 7028.29 7863.55 -
Note: Upto 1992-93, as of March 31 on the basis of the closure of govemnment accounts; 1994-95 numbers are provisional data from RBI as of March 31.
a The data for 1994-95 are not strictly comparable with those of the previous years, as M3 data for 1994-95 include scheduled commercual banks' data for 27 fortnightswhile for the previous years they include 26 fortnights.
Source: Ministry of Finance, Economic Survav various issues; Reserve Bank of India, RBI Bulletin (Weekly Statistical Supplement).

-182-
Table A 5.2Base Money Supply and Sources of Change, 1980-81 - 1993-94
(Rs. billion)
1980-81 1985-86 1986-87 1987-88 1988-89 1989-90 1990-91 1991-92 1992-93 1993-94 199495'
TOTAL BASE MONEY SUPPLY 194.52 381.66 448.08 534.90 629.59 77591 877.79 995.05 1107.79 138672 1689.74
Currency with Public 13426 25059 283.82 335.59 380.71 463.00 530.48 610.98 682.73 823.01 10087OtherDeposits withRBI 411 289 3.09 3.97 6.94 5.98 6.74 8.85 13.13 25.25 335CashwithBanks 8.81 14.65 15.31 15.63 19.72 19.86 22.34 26.40 30.53 3095 35.36BankDepositswithRBI 4734 113.53 145.86 179.71 222.22 287.07 31823 348.82 381.40 507.51 612.18
SOURCES OF CHANGE
RBIClaims 194.19 44192 524.39 609.18 722.18 875.03 1051.97 1063.78 114554 1112.97 1188
On Govemrnent(net) 164.43 386.78 462.85 526.87 596.15 736.83 888.48 940.16 984.49 993.00 98737On Banks 12.76 24.62 27.60 4441 70.79 74.71 100.07 51.02 98.85 55.52 134.7On Commercial Sector 17.00 30.52 3394 3790 55.24 63.49 63.42 72.60 62.20 64.45 6593
NetForeignExchangeAssets 47.75 37.41 46.21 54.17 62.02 60.69 79.83 188.38 22647 514.22 746.86of RBI
Government's Currency Liabilities 6.19 9.40 11.92 13.80 1475 15.55 16.21 17.04 1824 19.90 2104to the Public
NetNon-MonetaryLiabilities 53.60 107.07 134.44 14225 16936 175.36 270.22 274.15 282.46 26037 266.16of Reserve Bank of India
Total Base Money Supply 194.52 381.66 448.08 534.90 629.59 775 91 877.79 995.05 1107.79 1386.72 1689.74
GDP at market prices 1360 13 2622.43 2929.49 3332.01 3957.82 4568.21 5355 17 6160.61 7028.29 7863.55 --
Note: Upto 1992-93, as of March 31 on the basis of the closure of government accounts; 1994-95 numbers are provisional data from RBI as of March 31.
a. The data for 1994-95 are not strictly comparable with those of the previous years, as M3 data for 1994-95 include scheduled commercial banks' data for 27 fortnightswhile for the previous years they include 26 fortnights
Source: Ministry of Finance, Economic Survey various issues, Reserve Bank of India. RBI Bulletin (Weekly Statistical Supplement).
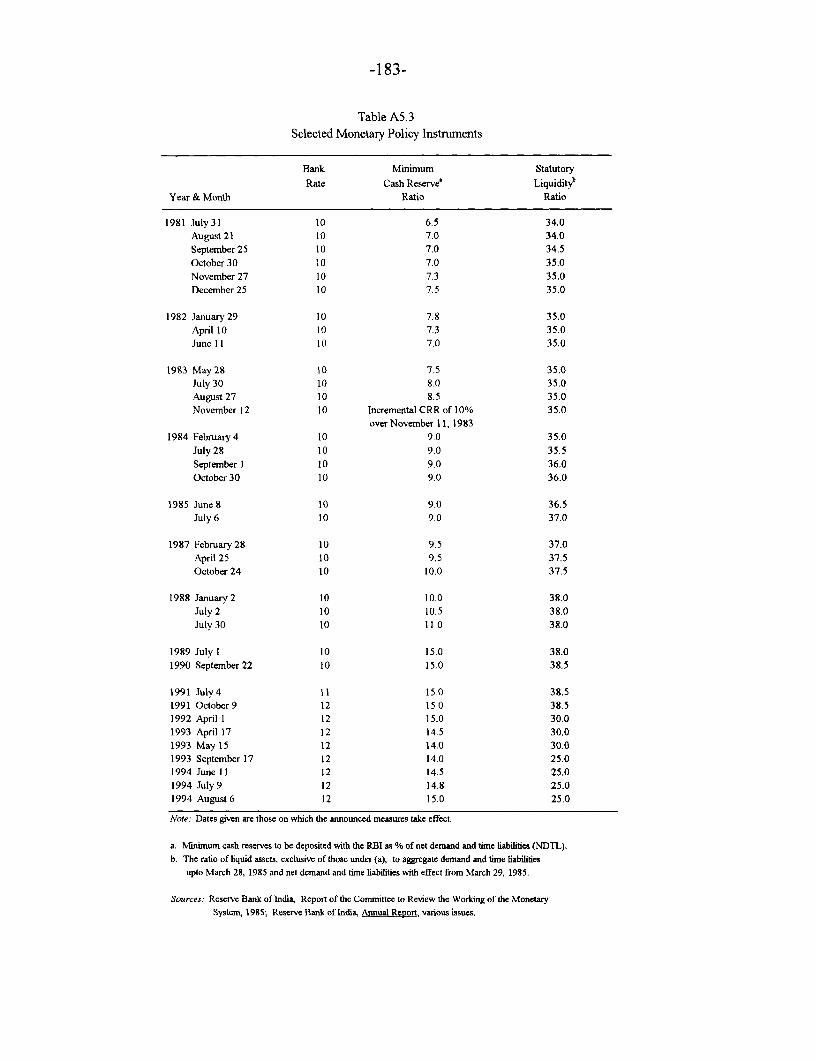
-183-
Table A5.3Selected Monetary Policy Instrunents
Bank Minimum StatutoryRate Cash Reserve' Liquidite
Year & Month Ratio Ratio
1981 July31 10 6.5 34.0August 21 10 7.0 34.0September 25 t0 7.0 34.5October 30 10 7.0 35.0November 27 10 7.3 35.0December 25 10 7.5 35.0
1982 January 29 10 7.8 35.0April 10 10 7.3 35.0June II 10 7.0 35.0
1983 May28 10 7.5 35.0July 30 10 8.0 35.0August 27 10 8.5 35.0November 12 10 Incremental CRR of 10% 35.0
over November 11, 19831984 February4 10 9.0 35.0
July 28 10 9.0 35.5September 1 10 9.0 36.0October 30 10 9.0 36.0
1985 June 8 10 9.0 36.5July 6 10 9.0 37.0
1987 February28 10 9.5 37.0April 25 10 9.5 37.5October 24 10 10.0 37.5
1988 January 2 10 10.0 38.0July 2 10 10.5 38.0July 30 10 11.0 38.0
1989 July 1 10 15.0 38.01990 September22 10 15.0 38.5
1991 Julv4 11 15.0 38.51991 October9 12 15.0 38.51992 April 1 12 15.0 30.01993 April 17 12 14.5 30.01993 May 15 12 14.0 30.01993 September 17 12 14.0 25.01994 June 11 12 14.5 25.01994 July 9 12 14.8 25.01994 August 6 12 15.0 25.0
Note: Dates given are those on which the announced measures take effect.
a. Minimum cash rescrves to be deposited with the RBI as % of net demand and time labilities (NDTL).b. The ratio of liquid assets, exclusive of those under (a), to aggregate demand and time labilities
upto March 28, 1985 and net demand and time liabilities with effect from March 29, 1985.
Sources: Reserve Bank of India, Report of the Conuinttee to Review the Working of the MonetarySystem, 1985; Reserve Bank of India, Annual Repon, various issues.

-184-
Table A5.4Structure of Short-term and Long-term Interest Rates
(percent per annum)
1980-81 1985-86 1990-91 1991-92 1992-93 1993-94 1994-95
A. SHORT-TERM RATES
Reserve Bank Rate 9.0 10.0 10 () 12.0 12.0 12.0 12.0
Treasury Bills:91-day' 4.6 4.6 4.6 4.6 8.8-10.7 7.1-11.1 7.21-11.99182-day 10.0-10.1 8.8-10.1 7.8-8.4364-day 9.9-10.3 10.0-11.4 9.41-12.21
CallMoneyRate(Bombay) 7.1 10.0 15.9 19.6 14.4 7.0
Commercial Bank Rates:Maximum Deposit Rate b 10.0 11.0 11 ( 13.0 11.0 10.0 11.0Minimum Lending Rate 13.5 16.0) 19.0 17.0 15.0 14.0
B. LONG-TERM RATES
I.D.B.I. Prime Lending Rate 14.0 14.0 14.0-15.0 18.0-20.0 17.0-19.0 14.5-17.5
Company Deposit Rates: cPrivate Sector Companies d
(i) I year 9.0-13.5 10.0-15.0 10.5-14.0 10.5-15.0 12.0-15.0 12.0-14.0(ii) 2 years 10.0-14.5 12.0-15.0 12.0-14.) 12.0-15.0 13.0-15.0 13.0-14.0(iii) 3 years 13.0-15.5 13.0-15.0 13.5-14.0 14.0-15.0 15.0 14.0
Public Sector Companies(i) I year 11.0 11.5-12.0 10.5-12.0 10.5-15.0 13.0 12.0-15.0(ii) 2 years 12.0 12.0-13.0 11.5-13.0 11.5-15.0 14.0 13.0-15.0(iii) 3 years 13.5 13.5-14.5 13.0-14.0 13.0-15.0 15.0 14.0-15.0
Average Yield - Ordinary Shares 5.9 3.2 2.6 2.1 1.7 2.2
Redemption Yield - Government of India Securities(i) Short-term (1-5 years) 4.7-6.0 5.4-9.8 7.0-21.7 8.4-26.3 9.1-23.8 11.9-12.9(ii) Medium-term (5-15 years) 5.8-6.8 6.5-9.5 9.4-12.7 9.5-13.4 9.5-14.8 12.7-13.3(iii)Long-term (above 15 years) 6.4-7.5 8.4-11.5 10.9-12.0 9.9-12.4 8.8-12.5 12.9-13.4
Note: 1994-95 is preliminary.
a. Effective 8 January, 1993, a new auction system for 91 -day T reasury Bills was introduced.b. Effective 22 April, 1992, a single 'maximum deposit rate' has been for deposits of various maturities.
Earlier different rates were prescribed for different deposit maturities.c. Deposits accepted from the public.d. Well-established private sector companies.
Source: Reserve Bank of India, Report on Currency and Finance, various issues.

-185-
Table A5.5Sectoral Deployment of Gross Bank Credit
(Rs billion - change during year)
April-July1980-81 1985-86 1986-87 1987-88 1988-89 1989-90 1990-91 1991-92 1992-93 1993-94 1993-94 1994-95
Gross Bank Credit 35.69 72.57 73.56 76.91 154.68 169.43 153.48 79.86 211.34 96.97 11.07 19.15
Public FoodProcurement Credit -3.41 -1.30 -4.31 -29.14 -14.21 12.37 25.00 1.64 20.73 41.64 28.08 11.02
GrossNon-FoodCredit 39.10 73.87 77.87 106.05 168.89 157.06 128.48 78.22 190.61 55.33 -17.01 8.13
Priority Sectors 17.74 31.57 34.84 40.20 51.49 61.64 25.32 25.10 44.07 40.43 0.21 5.60Agriculture 8.17 13.98 15.12 14.39 19.41 25.76 2.24 14.07 18.06 12.45 1.59 0.16Small Scale Industries 5.94 12.04 12.92 17.12 23.15 24.08 16.38 9.69 18.76 25.94 0.83 0.94Other Priority Sectors 3.63 5.55 6.80 8.69 8.93 11.80 6.70 1.34 7.25 2.04 -2.21 4.50
Industry(Medium&Large) 16.91 24.83 29.34 37.97 70.32 60.87 62.46 25.82 115.46 -7.64 -9.69 -3.23
Wholesale Trade (other thanfoodprocurement) 0.79 4.17 0.14 5.18 11.69 7.05 4.38 2.44 8.15 3.65 -4.21 -2.30
Other Sectors 3.66 13.30 13.55 22.70 35.39 27.60 36.32 24.86 22.93 18.89 -3.32 8.06
Export Credit (included inGrossNon-FoodCredit) 0.09 0.74 7.37 7.71 22.24 21.04 9.41 11.08 50.62 17.38 10.91 15.39
Priority Sector advances as percent
ofnetbankcredit' 35.00 40.80 42.20 44.10 43.20 42.40 39.20 38.70 35.10 35.30 34.60 35.00
a. In the last month of each period, advances include Participation Certificates.
Source: Ministry of Finance, Economic Survey various issues.

-186-
Table A6.1Production of Major Crops
1980-81 1983-84 1984-85 1985-86 1986-87 1987-88 1988-89 1989-90 1990-91 1991-92 1992-93 1993-94
Total Foodgruns 129.6 152.4 145.5 150.4 143.4 140.4 169.9 171.0 176.4 168.4 179.5 182.1Khaif 77.6 89.2 84.5 85.3 80.2 74.6 95.6 101.0 994 91.6 101.5 99.4Rabi 51.9 63.1 61.0 65.2 63.2 65.8 74.3 70.0 770 768 78.0 82.7
TotalCereals 119.0 139.5 133.6 137.1 131.7 129.4 156.1 158.2 162.1 156.4 166.6 169Khaif 73.9 83.9 79.8 80.7 76.0 70 2 90.0 95.5 94.0 87.2 95.8 93.9Rabi 45.1 55.6 53.8 56.4 55.7 592 66.1 62.7 68.1 69.2 70.8 75.1
Rice 53.6 60.1 58.3 63.8 60.6 56.9 70.5 73.6 74.3 74.7 72.9 79Khrif 50.1 55.0 53.8 59.4 53.6 490 63.4 65.9 66.3 66.4 65.3 69.4Rabi 3.5 5.0 4.6 4.4 7.0 7.8 7.1 7.7 8.0 8.3 7.6 9.6
Wheat 36.3 45.5 44.1 47.0 44.3 462 54.1 498 55.1 55.7 57.2 59.1Barley(Jowar) 10.4 11.9 11.4 102 9.2 122 10.2 129 11.7 8.1 12.8 11.5Khaif 7.5 8.7 7.8 73 6.5 86 7.1 9.2 8.3 5.7 9.4 7.5Rabi 2.9 33 3.6 2.9 2.7 36 3.1 37 3.4 2.4 34 4Maize 7.0 7.9 8.4 66 7.6 57 8.2 9.7 9.0 8.1 10.0 9.5Bajra 5.3 7.7 6.0 3.7 4.5 3.3 7.8 6.6 6.9 4.7 8.9 5
TotalPulses 10.6 12.9 12.0 13.4 11.7 110 13.8 12.8 14.3 12.0 12.8 13.1Khaif 3.8 5.4 4.8 4 5 4.2 4 4 5.6 5.5 5.4 4.4 5.6 5.5Rabi 6.9 7.5 7.2 8.8 7.5 6.6 8.2 7.3 8.9 7.6 7.2 7.6
Gram 4.3 48 4.6 5.8 4.5 3.6 5.1 4.2 5.4 4.1 4.4 4.9Tur 2.0 2.6 2.6 24 2.3 2.3 2.7 27 2.4 2.1 2.3 2.7
Totaloilseeeds 9.4 12.7 12.9 10.8 11.3 12.6 18.0 16.9 18.6 18.6 20.1 21.5Kharif 5.0 7.2 7.0 5.9 6.4 6.4 105 9.6 9.8 9.3 12.0 12.2Rabi 4.4 5.5 59 4.9 49 6.2 75 7.3 8.8 9.3 8.1 9.3
Groundrut 5.0 7.1 64 5.1 59 58 97 8.1 7.5 7.1 8.6 7.8Khauif 3.7 5.3 4.7 3.8 4.4 4.2 75 6.1 5.1 5.0 6.7 5.6Rabi 1.3 1.8 1.7 1.4 1.4 1.7 22 2.0 2.4 2.1 1.9 2.2
Rapeseed & Mustard 2.3 2.6 3 1 2.7 2.6 3.4 4.4 4.1 5.2 5 9 4.8 5.4
Sugamane 154.3 174.1 170.3 170.6 186.1 196 7 203.0 225.6 241.0 254.0 228.0 227.1Cotton 7.0 6.4 8.5 8.7 69 6.4 87 11.4 9.8 9.7 11.4 10.7Jute & Mesta 8.2 7.7 7.8 12.6 8.6 6.8 7.9 8.3 9.2 10.3 8.6 8.5
Jute 6.5 6.3 65 10.9 7.3 5.8 67 7.1 7.9 8.9 7.5 7.4Mesta 1.6 1.4 1.3 1.8 1.3 1.0 1.2 1.2 1.3 1.4 1.1 1.1
Potato 9.7 12.1 12.6 10.4 12.7 14.1 14.9 14.8 15.2 16.4 15.2 17.6
Votoes: Units of measurement of all commodities is million tonnes, except in the case of cotton jute and mesta where production is in terns of millions of bales.Figures for 1993-94 are provisional.
a. Includes groundnuts, rapeseeds and mustard, sesame, lineed, castorsed, nigerseed, safflower, sunflower and soybean.
Soumrc: Ministry of Finance, Economic Survey various issues.

-187-
Table A6.2Irrigated Area Under Different Crops
(million hectares)
1980-81 1982-83 1983-84 1984-85 1985-86 1986-87 1987-88 1988-89 1989-90 1990-91 1991-92
Total Foodgrains 37.6 38.4 40.2 40.1 40.6 41.7 40.5 42.9 43.7 44.5 45.0
Total Cereals 35.6 36.6 38.5 38.4 38.5 39.5 38.5 40.8 41.4 42.0 42.5Rice 16.3 16.0 17.4 17.7 17.7 18.2 17.0 18.7 19.2 19.2 19.6Jowar 0.6 0.6 0.6 0.7 0.7 0.8 0.8 0.8 0.8 0.9 0.8Bajra 0.6 0.6 0.6 0.6 0.6 0.7 0.7 0.6 0.7 0.6 0.6Maize 1.2 1.2 1.0 1.0 1.1 1.3 1.2 1.2 1.2 1.2 1.3Wheat 15.5 17.0 17.9 17.5 17.5 17.7 17.9 18.6 18.7 19.4 19.4Barley 0.9 0.7 0.7 0.6 0.7 0.6 0.6 0.6 0.5 0.5 0.6
Total Pulses 2.0 1.8 1.7 1.8 2.1 2.2 2.0 2.0 2.2 2.6 2.5
Other Crops
Oilseeds 2.3 2.6 3.1 3.5 3.4 3.3 4.3 4.4 4.6 5.6 6.5Cotton 2.1 2.3 2.3 1.9 2.2 2.2 2.3 2.3 2.7 2.5 2.6Sugarcane 2.3 2.8 2.6 2.6 2.5 2.8 2.9 3.0 3.0 3.3 3.3
a. Oilseeds include groundnuts, rapeseed and mustard, linseed, sesame, and others.
Source: Ministry of Finance, Economic Survey various issues.

-188-
Table A 6.3Yield Per Hectare of Major Crops
(kgs. per hectare)
1980-81 1983-84 1984-85 1985-86 1986-87 1987-88 1988-89 1989-90 1990-91 1991-92 1992-93 1993-94
TotalFoodgrains 1023 1102 1149 1175 1128 1173 1331 1349 1380 1382 1457 1487Kharif 933 1060 1041 1042 985 996 1166 1241 1231 1174 1302 1308Rabi 1195 1343 1341 1410 1382 1468 1628 1544 1635 1751 1725 1781
Total Cereals 1142 1296 1285 1324 1266 1315 1493 1530 1571 1574 1654 1690Kharif 1015 1148 1129 1140 1074 1082 1270 1366 1357 1305 1440 1456Rabi 1434 1608 1617 1718 1673 1763 1964 1875 2010 2126 2068 2116
Rice 1336 1457 1417 1552 1471 1465 1689 1745 1740 1751 1744 1879Kharif 1303 1413 1374 1514 1393 1368 1627 1677 1670 1676 1677 1797Rabi 2071 2205 2274 2329 2563 2640 2548 2678 2671 2720 2653 2814
Wheat 1630 1844 1870 2046 1916 2002 2244 2121 2281 2394 2327 2373Barley (Jowar) 660 726 715 633 576 762 697 869 814 655 982 894
Kharif 737 851 820 761 665 892 789 1053 969 757 1230 1084Rabi 520 522 563 447 437 568 550 604 582 496 632 672Maize 1159 1352 1456 1146 1282 1029 1395 1632 1518 1376 1676 1583Bajra 458 652 519 344 401 378 646 610 658 465 836 527
Total Pulses 473 548 526 547 505 515 598 549 578 533 573 584Kharif 361 483 453 412 392 435 504 480 471 393 495 476Rabi 571 605 589 658 604 587 686 616 672 672 654 696
Gram 657 663 661 742 649 629 753 652 712 739 684 761Tur 689 801 819 767 722 685 779 763 673 588 652 754
Total Oilsceeds 532 679 684 570 605 629 824 742 771 719 797 801Kbarif 492 655 633 516 554 559 805 691 698 604 804 753Rabi 588 713 758 651 687 720 851 822 872 886 786 875
Groundnut 735 940 898 719 841 855 1132 930 904 818 1049 926Kharif 629 835 779 602 733 737 1066 824 751 687 969 799Rabi 1444 1484 1518 1549 1540 1425 1442 1532 1611 1501 1473 1591
Rapeseed&Mustard 560 674 771 686 700 748 906 831 904 895 776 856
Sugarcane 57844 55974 57673 60000 60000 60000 61000 65000 65000 66000 64000 67000Cotton 152 141 196 197 169 168 202 252 225 216 257 248Iute&Meata 1129 1323 1242 1524 1454 1274 1540 1646 1634 1662 1658 1713
Jute 1245 1417 1411 1710 1647 1496 1748 1879 1833 1837 1857 1907Mesta 828 869 764 910 865 680 909 956 988 1019 955 1016
Potato 13256 15206 14806 12000 15000 16000 16000 16000 16000 16000 15000 --
- Not available.
Note: Figures for 1993-94 are provisional.
a. Includes groundnuts, rapesceds and mustard, sesamc, linseed, castorseed, nigerseed, afflower, sunflower and soybean.
Source: Ministry of Finance, Economic Survey, various issues.

-189-
Table A 6.4Net Availability, Procurement and Public Distribution of Foodgrains a
(mnillion tonnes)
1980-81 1985-86 1986-87 1987-88 1988-89 1989-90 1990-91 1991-92 1992-93 1993-94
Net Production 113.4 131.6 125.5 122.8 148.7 149.7 154.3 147.3 157.5 159.3
NetImports 0.7 -0.5 -0.2 3.8 1.2 1.3 -0.1 -0.4 2.6 0.5
CbangeinGovernmentStocks -0.2 -1.6 -9.5 -4.6 2.6 6.2 -4.4 -1.5 10.3 4.0
Net Availability 114.3 133.8 134.8 130.8 147.2 144.8 158.6 148.4 149.8 155.8
Procurement 13.0 19.7 15.7 14.1 18.9 24.0 19.6 17.9 28.0 25.9
Public Distribution 13.0 17.3 18.7 18.6 16.4 16.0 20.8 18.8 16.4 14.1
a. Production figures relate to agricultural year. Figures for procurement and public distribution relate to calendar years.
Source: Ministry of Finance, Economic Survey, various issues.

-190-
Table A6.5New Index of Industrial Production
(1980-1=100)
1992-93 1993-94
Index over overWeight 1986-87 1987-S8 1988-89 1989-90 1990-91 1991-92 1992-93 1993-94 1991-92 1992-93
General Index 100.00 155.1 166.4 180.9 196.4 212.6 213.9 218.9 225.6 2.3 3.1
MiningandQuarrying 11.46 177.9 184.6 199.1 211.6 221.2 222.5 223.7 228.3 0.5 2.1
Electricity Generated 11.43 168.1 181.0 198.2 219.7 236.8 257.0 269.9 289.8 5.0 7.4
ManufacturingIndex 77.11 149.7 161.5 175.6 190.7 207.8 206.2 210.7 215.7 2.2 2.4
Foodproducts 5.33 133.2 139.0 148.5 150.9 169.8 178.0 175.3 157.7 -1.6 -10.0Beverages tobacco, etc. 1.57 98.5 84.9 92.1 103.0 104.8 107.3 113.7 137.8 5.9 21.2Cottontextiles 12.31 112.5 111.2 107.8 112.3 126.6 139.0 150.1 155.5 8.0 3.6Jutetextiles 2.00 101.1 91.0 101.9 97.4 101.6 90.8 87.0 103.1 -4.2 18.5Textile products 0.82 87.1 91.7 134.2 151.7 103.2 97.2 75.8 74.2 -22.0 -2.2Wood&woodproducts 0.45 246.1 161.7 171.7 176.0 197.2 185.0 190.5 198.7 3.0 4.3Paper&paperproducts 3.23 163.2 166.3 171.3 181.5 198.0 203.0 210.9 224.7 3.9 6.5Leather & leatherproducts 0.49 177.7 185.5 177.4 188.3 194.3 181.3 187.7 199.2 3.5 6.1
Rubber, plastic & pelroleum prod. 4.00 149.6 155.1 168.3 173.5 174.0 172.0 174.6 176.6 1.5 1.1Chemical & chemical products 12.51 175.5 200.9 233.4 247.6 254.1 261.2 276.9 298.1 6.0 7.6Non-metallicmineralproducts 3.00 160.3 158.1 184.6 189.9 193.1 205.2 209.0 216.6 1.8 3.6Basicmetal&alloyproducts 9.80 126.8 135.6 144.9 143.7 158.8 167.8 168.5 177.5 0.4 5.4Metal products 2.29 124.5 129.6 133.5 142.6 143.1 133.1 124.6 126.5 -6.4 1.5Machinery&niachinetools 6.24 141.8 139.2 161.2 171.9 186.9 183.3 181.1 190.0 -1.2 4.9Electrical machinery 5.78 254.7 335.2 346.0 459.2 563.6 493.7 483.6 450.9 -2.0 -6.8Transprtequipnent 6.39 144.9 151.9 171.3 181.1 192.5 191.1 200.6 212.3 5.0 5.8Miscellaneous products 0.90 235.4 272.1 306.3 333.2 321.8 269.9 281.3 264.7 4.2 -5.9
Note: Figures for 1993-94 are provisional.
Source: Ministry of Finance, Economic Survey various issues.

-191-
Table A6.6Production, Inports and Consumption of Fertilizers
(000' nutrient tons)
Nitrogenous Phoqhatic b Potauic Total
(April-March) Production Importa Consumption Production Imports Conmunption Imports Co_mmption Pmduction Impots Counption
1980-81 2163.9 1510.2 3678.1 841.5 452.1 1213.6 796.8 623.9 3005.4 2759.1 5515.61981-82 3143.3 1055.1 4068.7 950.0 343.2 1322.9 643.8 676.2 4093.3 2042.1 6067.81982-83 3429.7 424.6 4242.5 983.7 63.4 1432.7 643.7 726.3 4413.4 1131.7 6401.51983-84 3491.5 656.1 5204.4 1064.1 142.6 1730.3 556.4 775.4 4555.6 1355.1 7710.11984-85 3917.3 2008.6 5486.1 1317.9 745.2 1886.4 871.0 838.5 5235.2 3624.8 8211.01985-86 4328.0 1680.0 5661.0 1428.0 816.0 2005.0 903.0 808.0 5756.0 3399.0 8474.01986-87 5410.0 1103.0 5716.0 1660.0 255.0 2079.0 952.0 850.0 7070.0 2310.0 8645.01987-88 5466.0 175.0 5717.0 1665.0 0.0 2187.0 809.0 880.0 7131.0 984.0 8784.01988-89 6712.0 219.0 7251.0 2252.0 407.0 2721.0 982.0 1068.0 8964.0 1608.0 11040.01989-90 6747.0 523.0 7386.0 1796.0 1311.0 3014.0 1280.0 1168.0 8543.0 3114.0 11568.01990-91 6993.0 414.0 7997.0 2052.0 1016.0 3221.0 1328.0 1328.0 9045.0 2758.0 12546.01991-92 7301.0 566.0 8046.0 2562.0 967.0 3321.0 1236.0 1361.0 9363.0 2769.0 12728.01992-93 7430.0 1160.0 8426.0 2306.0 746.0 2842.0 1082.0 884.0 9736.0 2988.0 12152.01993-94 7231.0 1564.0 8986.0 1816.0 722.0 2884.0 880.0 963.0 9047.0 3166.0 12833.01994-95 7820.0 1518.0 d 9890.0 2300.0 - 3110.0 - 1060.0d 10120.0 1518.0 14060.0
- Not available.
a. Excludes nitrogen meant for non-agricultural purposea.b. Excludes data in respect of bonemeal and rockphosphate.c. Anticipatcd.d. Inemporatca import of Ura in nutrient temsa, the only controlled festiliact inported on Government aecount.
Source: The Fertilizer Association of India, Fertilizer Statisties various isu; Ministry of Finance, Economic S various isues.

-192-
Table A6.7Indian Railways - Freight and Passenger Traffic
Passenger Traffic
Revenue Earning Freight Traffic Non-Suburban Suburban
Originating Net tons- Average Passenger Passenger- Average Passenger Passenger- Averagetonnage kilometers lead originating kilometers lead originating kilometers lead
Year (min.tons) (million) (kilomeers) (million) (million) (kilometers) (million) (million) (kilometrs)
1980-81 195.9 147652 754 1613 167472 103.9 2000 41086 20.51981-82 221.2 164253 743 1640 176822 107.8 2064 43965 21.31982-83 228.8 167781 733 1626 181142 111.4 2029 45789 22.61983-84 230.1 168849 734 1491 180808 121.3 1834 42127 23.01984-85 236.4 172632 730 1449 182318 125.8 1884 44264 23.51985-86 258.5 196600 760 1549 195175 126.0 1884 45439 24.11986-87 277.8 214100 771 1610 208057 129.0 1970 48411 24.61987-88 290.2 222528 767 1637 217632 133.0 2171 51859 23.91988-89 302.1 222374 736 1495 211819 141.6 2022 52023 25.71989-90 310.0 229602 741 1544 226045 76.9 2129 54933 25.81990-91 318.4 235785 741 1599 236066 147.6 2281 59724 26.21991-92 338.0 250238 '740 1637 251174 153.4 2436 63543 26.11992-93 350.1 252388 721 1467 239655 163.3 2298 60547 26.41993-94 358.7 252411 704 1406 233200 165.9 2318 63147 27.21994-95 373.0 259810 697 1451 243798 168.0 2359 63275 26.81995-96 398.0 278766 700 1509 253549 168.0 2454 65806 26.8
Note: Figures for 1994-95 and 1995-96 are revised estimates and budget estinates respectively.
a. Passengers booked between stations within the suburban areas of Bombay; From 1988/89 onwards Suburban passenger traffic includeMetro Railway, Calcutta.
Source: Ministry of Railways, Railway Budget.

-193-
Table A6.8Petroleum Sumimary
Comnmoty Balance of Petrolemt and Petroleum Products
(mnllion tr)
1980-81 1981482 1982-83 1983-84 1984-85 1985-86 1986-87 1987-88 1988-89 1989-90 1990-91 1991-92 1992-93 1993-94'
A. CRUDE PETROLEUM
I .Refiny Throqhput 25 8 30.2 33.2 35.3 35.6 42.9 45 7 47 7 48.8 51 9 51.8 51.4 53.5 54.3
2.Dmestic Production 10.5 16.2 21 1 26.0 29.0 30.2 30.5 3014 32.0 341 33.0 30.4 27.0 27.0(a)On-shore 5.5 8.2 8.2 86 89 9.4 99 102 10.9 12.4 118 11.4 11.2 11.7(b)Off-hore 50 8.0 129 17.4 20.1 20.8 206 202 21.1 21.7 21 2 19.0 15.8 15.3
3.xportb 16.2 153 16.9 16.0 137 15.1 155 18.0 17.8 19.5 207 24.0 29.2 30.8
4.Exports - 0.8 4.5 5.5 6.5 0.5 - - - - - -- - -
5.NtlImport.s(34) 16.2 145 12.4 10.5 72 14.6 155 18.0 17.8 19.5 207 24.0 292 30.8
B. PRODUCT S
I .Do.eWti. Crumpt 30.9 32.5 34.7 35.8 38.5 40.8 43.4 46.4 50.1 54 1 55.0 57.0 58 9 60.8ofwhich(a)Naphtlh 2.3 3.0 3.0 2 8 3.1 3.1 3.2 2.9 3.4 3.4 3.4 3.5 3 4 3.2(b)KesUSene 4.2 47 5.2 55 6.0 6.2 6.6 7.2 7.7 8.2 8.4 84 8.5 8.7(c) HghSpcedDtesel 103 10.8 12.0 12.6 137 14.9 160 177 18.8 20.7 21 1 227 24.3 259(d) Ful oils 75 7.2 7.3 76 7.9 7.9 7.9 8.1 8.5 8.8 9.0 9.2 9.3 9.2
2-DonmticPtoducion 24.1 28.2 31.1 329 33.2 39.9 42.8 447 45.7 487 48.6 48.3 504 51.1(a) Napitha 2.1 3.0 3.0 3 6 3.5 5.0 5.6 5.5 5.4 5.2 4.9 4 5 4.6 4.7(b) Kosne 2.4 2.9 3 4 3 5 3.4 4.0 4.9 51 5.2 5.7 5.5 5 3 5 2 5.3(c)HighSpeedDiewl 7.4 90 9.8 109 11.1 14.6 155 16.3 16.7 17.7 17.2 17.4 18.3 18.8(d)Fueloils 6.1 69 8.0 8.0 79 8.0 8.0 8.5 8.9 90 9.4 9.6 10.4 10.3
3.1npou 73 49 5.0 4.3 6.1 39 3.1 3.9 6.5 6.6 8.7 9.4 11.3 121
4.Exportz' - 0.1 0.8 1.5 0.9 2.0 2.5 3 4 2.3 2.6 2.6 2.9 3 7 4 0
S.NetImports 73 48 4.2 28 5.2 1.9 0.6 0.5 4.2 4.0 6.1 6.5 7.6 8.1
- Not available.
a- ProvrioSUI.
b. Excludes refminey fiwel conrwuptionc. Excludes supplies ofPOL products to Nepal.
Sour"c: Ministry of Financce, FEooc us neues.

-194-
Table A6.9Generation and Consumption of Electricity
(in '000 GWH)
1980-81 1985-86 1986-87 1987-88 1988-89 1989-90 1990-91 1991-92 1992-93 1993-94'
A. GENERATION OF ELECTRICITY BY SOURCE AND REGIONI1. Thermal1b
Northern 13.69 25.73 29.80 37.74 41.24 48.82 52.13 60.44 66.17 71.48Western 25.37 48.94 54.58 61.80 63.39 73.08 76.95 84.33 88.50 96.27Southern 9.22 20.45 24.10 28.07 30.53 34.03 35.76 40.39 44.31 51.06Eastem 12.53 18.37 19.31 20.77 21.40 21.55 20.39 22.40 24.56 28.44North-Eastern 0.50 0.87 1.06 1.24 1.15 1.22 1.31 1.19 1.23 1.08
All-India 61.30 114.35 128.85 149.61 157.71 178.70 186.55 208.75 224.77 248.33
2. HydroNorthern 15.08 19.49 22.02 20.86 23.57 25.01 27.16 27.21 25.45 24.33Western 7.81 6.18 6.15 5.06 7.54 6.87 8.31 8.16 7.27 8.72Southern 20.28 21.15 21.08 17.35 21.64 24.54 29.17 29.63 30.70 30.72Eastern 2.96 3.17 3.67 3.19 3.76 4.11 5.34 5.87 4.52 4.46North-Eastern 0.41 1.03 0.92 0.97 1.36 1.58 1.66 1.89 1.93 2.20
All-India 46.54 51.02 53.84 47.44 57.87 62.12 71.64 72.76 69.87 70.43
3. NuclearNorthern 1.23 1.28 1.32 1.39 1.87 1.73 2.16 1.66 2.77 1.53Western 1.77 1.96 2.00 1.61 1.90 1.55 1.90 1.71 1.97 2.48Southern - 1.74 1.70 2.04 2.05 1.35 2.07 2.16 1.98 1.39
All-India 3.00 4.98 5.02 5.04 5.82 4.63 6.14 5.53 6.72 5.40
4. Utilities- All India (1 + 2 + 3) 110.84 170.35 187.71 202.09 221.40 245.44 264.33 287.03 301.36 324.16
5. Self-Generation in industry 8.42 13.04 13.57 16.89 19.91 23.23 25.11 28.60 31.35 32.10and Railways
6. Total- All India (4 + 5) 119.26 183.39 201.28 218.98 241.31 268.66 289.44 315.63 332.71 356.26
B. CONSUMPTION OF ELECTRICITY BY SECTORS
I. Mining&Manufacturingc 55.35 78.30 81.98 82.97 92.05 100.40 105.38 110.62 116.17 121.282. Transport 2.31 3.08 3.23 3.62 3.77 4.07 4.11 4.52 5.07 5.543. Domestic 9.25 17.26 19.32 22.12 24.77 29.58 31.98 35.85 39.72 43.144. Agriculture 14.49 23.42 29.44 35.27 38.88 44.06 50.32 58.56 63.33 70.695. Others 8.30 12.26 13.66 15.42 17.02 17.01 19.74 21.42 22.38 24.256. Total 89.70 134.32 147.64 159.40 176.49 195.12 211.53 230.97 246.67 264.90
a. Data for 1993-94 are provisional.b. Includes steam, diesel, wind and gas.c. Includes industrial power from utilities plus net generation in the non-utilities.
Source: Central Electricity Authority, Power Data Bank & Infornation Directorate.

-195-
Table A6.lONew Index Numbers of Wholesale Prices - by Years
(Base 1981-2=100)
Weights 82-83 85-86 86-87 87-88 88-89 89-90 90-91 91-92 92-93 93-94 94-95 %change'
TOTALFOODARTICLES 17.386 111.1 134.1 147.8 161.1 177.1 179.3 200.6 241.1 271.0 284.4 313.8 10.3
Food Grains 7.917 109.1 124.5 129.4 141.3 161.8 165.4 179.2 216.4 242.4 260.8 293.0 12.4OtherFood 9.469 112.8 142.1 163.2 177.7 189.9 190.9 218.5 261.8 294.9 304.2 331.1 8.9
INDUSTRIALRAWMAT. 14.909 101.6 115.9 124.4 142.8 140.3 145.3 166.6 192.3 192.2 211.8 247.1 16.7
Non-Food Articles 10.081 100.8 120.4 134.1 163.0 160.2 166.0 194.2 229.2 228.7 249.1 297.0 19.2Minerals 4.828 103.3 106.5 104.2 100.5 98.6 102.2 109.0 113.5 116.1 133.9 142.9 6.7
FUEL, POWER& LUB. 10.663 106.5 129.8 138.6 143.3 151.2 156.6 175.8 199.0 227.1 262.4 280.0 6.7
MANUF. PRODUCTS 57.042 103.5 124.5 129.2 138.5 151.5 168.6 182.8 203.4 225.6 243.2 268.5 10.4
FoodProducts 10.143 97.4 117.2 129.1 140.5 147.8 165.4 181.7 206.3 223.8 246.7 269.9 9.4Beverage&Tobacco 2.149 100.2 123.2 133.0 155.0 180.7 207.7 242.1 265.7 293.7 306.6 341.2 11.3Textiles 11.545 104.8 119.5 116.0 126.6 139.6 158.2 171.2 188.0 201.3 219.9 255.4 16.1
Chemicals and 7.355 103.5 118.3 124.6 131.9 135.8 140.1 147.9 168.4 192.6 207.8 231.5 11.4Chemical Products
Basic metals and 7.632 104.5 139.7 141.3 149.7 176.4 205.6 219.9 234.8 256.6 276.6 298.7 8.0Products
Machinery and 6.268 102.8 121.4 127.3 132.3 150.8 166.2 180.2 208.3 230.6 237.9 260.7 9.6Machine Tools
Transport Eqpt 2.705 103.6 123.0 129.6 135.5 148.9 166.2 181.3 202.5 218.1 223.9 238.2 6.4
ALL COMMODITIES 100.0 104.9 125.4 132.7 143.6 154.3 165.7 182.7 207.8 228.7 247.8 274.5 10.8
Note: This WPI series baed 1981-82 was introduced as of July 1989. Data for 1994-95 are provisional.
t Refers to percent change in fiscal year 1994-95 over 1993-94.
Sources: Ministry of Industry, Office of the Economic Adviser, Centre for Monitoring Indian Economy.
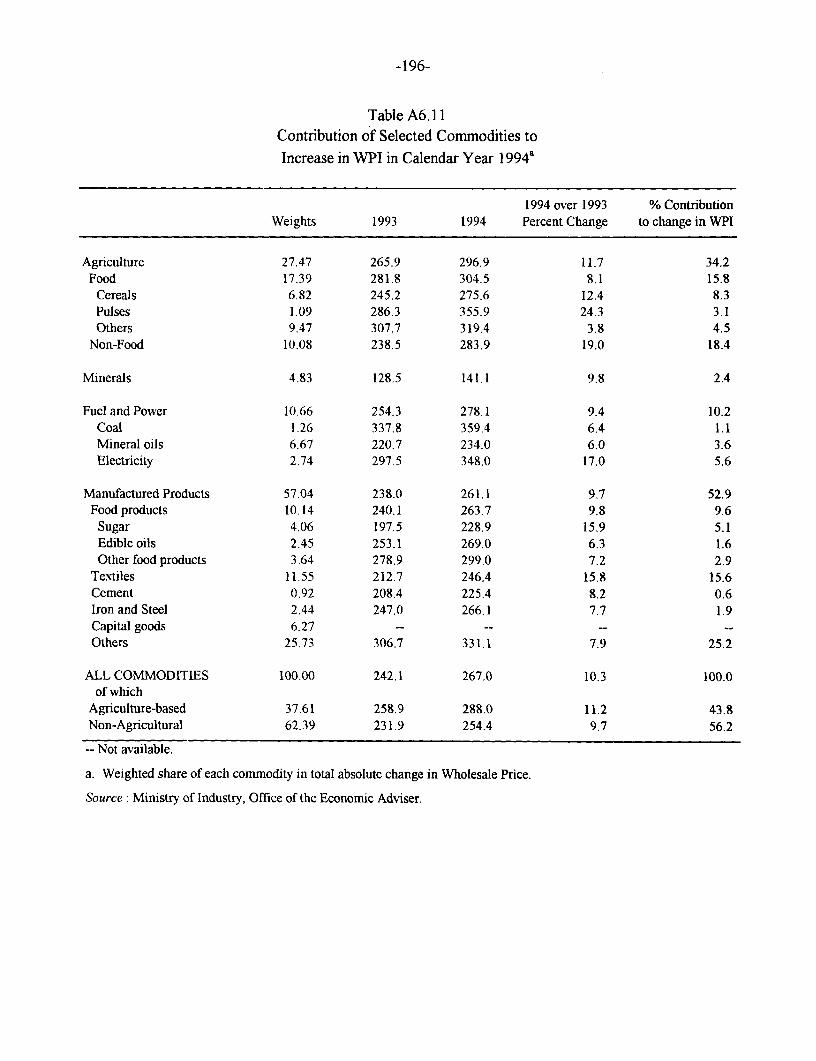
-196-
Table A6.11Contribution of Selected Commodities toIncrease in WPI in Calendar Year 1 994a
1994 over 1993 % ContributionWeights 1993 1994 Percent Change to change in WPI
Agriculture 27.47 265.9 296.9 11.7 34.2Food 17.39 281.8 304.5 8.1 15.8
Cereals 6.82 245.2 275.6 12.4 8.3Pulses 1.09 286.3 355.9 24.3 3.1Others 9.47 307.7 319.4 3.8 4.5
Non-Food 10.08 238.5 283.9 19.0 18.4
Minerals 4.83 128.5 141.1 9.8 2.4
Fuel and Power 10.66 254.3 278.1 9.4 10.2Coal 1.26 337.8 359.4 6.4 1.1Mineral oils 6.67 220.7 234.0 6.0 3.6Electricity 2.74 297.5 348.0 17.0 5.6
Manufactured Products 57.04 238.0 261.1 9.7 52.9Food products 10.14 240.1 263.7 9.8 9.6
Sugar 4.06 197.5 228.9 15.9 5.1Edible oils 2.45 253.1 269.0 6.3 1.6Other food products 3.64 278.9 299.0 7.2 2.9
Textiles 11.55 212.7 246.4 15.8 15.6Cement 0.92 208.4 225.4 8.2 0.6Iron and Steel 2.44 247.0 266.1 7.7 1.9Capital goods 6.27 -- -- -- --Others 25.73 306.7 331.1 7.9 25.2
ALL COMMODITIES 100.00 242.1 267.0 10.3 100.0of which
Agriculture-based 37.61 258.9 288.0 11.2 43.8Non-Agricultural 62.39 231.9 254.4 9.7 56.2
-- Not available.
a. Weighted share of each commodity in total absolute change in Wholesale Price.
Source: Ministry of Industry, Office of the Economic Adviser.

-197-
Table A 6.12Consumer Price Index Numbers for Industrial Workers, Urban Non-Manual
Employees and Agricultural Laborers
Urban Non-Manual AgriculturalYear Industrial Workers Employees Laborers'
(April-March) Food Index General Index (1984-85=100) General Index(1982=100) (1982=100) (1960-61=100)
1980-81 84 81 69 409
1981-82 96 91 78 448
1982-83 102 99 84 481
1983-84 117 111 92 522
1984-85 122 118 100 525
1985-86 128 126 107 555
1986-87 141 137 115 578
1987-88 154 149 126 650
1988-89 169 163 136 724
1989-90 177 173 145 752
1990-91 199 193 161 830
1991-92 230 219 183 1007
1992-93 254 240 202 1073
1993-94 272 258 216 1147
Average of weeks1992
March 241 229 192 1046June 251 236 197 1068September 258 243 204 1112December 256 243 205 1067
1993March 252 243 205 1053June 262 250 210 1057September 275 259 217 1113December 281 264 221 1166
1994March 281 267 222 1175June 294 277 230 1189September 309 288 238 1251December -- 289 240 1297
1995March -- 293 244 1300
Percentage Change in Index over thecorresponding month of previous year1993
March 4.6 6.1 6.8 0.7June 4.4 5.9 6.6 -1.0September 6.6 6.6 6.4 0.1December 9.8 8.6 7.8 9.3
1994March 11.5 9.9 8.3 11.6June 12.2 10.8 9.5 12.5September 12.4 11.2 9.7 12.4December -- 9.5 8.6 11.2
1995
March -- 9.7 9.9 10.6
-- Not available.
a. Indices relate to Agricultural Years (July-June).
Source: Ministry of Labor, Labor Bureau, Simla; Central Statistical Organization; Ministry of Finance,Economic Survey, various issues.

-198-
Table A 6.13Evolution of the Wholesale Price Index, 1991-95(index and twelve months point-to-point increase)
Weight June 1991 June 1992 June 1993 June 1994 Mar. 1995 %Index % Index % Index % Index % Index % Contrib.
WPI 100.00 100.0 11.2 113.0 13.0 120.9 7.0 135.1 11.8 143.1 10.2 43.1
Primary Articles 32.30 100.0 8.3 112.6 12.6 116.7 3.7 133.8 14.6 141.9 13.7 13.5Food 17.39 100.0 0.6 119.3 19.3 121.6 2.0 136.7 12.4 139.5 12.7 6.9
Food grains 7.92 100.0 18.6 126.9 26.9 124.9 -1.6 146.1 17.0 157.6 8.2 4.6Non-Food 10.08 100.0 10.1 103.5 3.5 107.5 3.8 131.2 22.0 149.5 17.2 5.0Minerals 4.83 100.0 6.4 103.3 3.3 122.2 18.2 126.4 3.5 132.3 6.4 1.6
Fuel, Power, Lubricants 10.66 100.0 9.2 113.0 13.0 133.7 18.3 146.7 9.8 148.5 1.2 5.2
Manufactured Products 57.04 100.0 9.4 113.1 13.1 120.8 6.9 133.7 10.6 142.8 10.1 24.4Food products 10.14 100.0 12.0 110.6 10.6 121.9 10.2 134.3 10.2 136.4 8.4 3.7Textiles 11.55 100.0 5.1 109.2 9.2 116.3 6.5 137.2 18.0 152.2 13.7 6.0Chemicals 7.36 100.0 6.5 116.1 16.1 129.1 11.3 141.1 9.2 153.5 12.0 3.9Metal and Metal Products 7.63 100.0 8.7 110.8 10.8 116.0 4.7 126.8 9.3 136.8 9.7 2.8Machinery 6.27 100.0 9.5 114.7 14.7 119.2 3.9 128.0 7.4 140.1 13.1 2.5
Memo ItemsAdministered Prices: 15.93 100.0 111.7 131.7 143.9 145.8 2.9 7.3
Petroleum crude & natural gas 4.27 100.0 101.5 123.4 127.1 130.3 5.0 1.3Petroleum products 6.67 100.0 109.3 129.9 138.5 138.3 0.0 2.6Coal 1.26 100.0 127.4 146.9 154.1 158.1 5.2 0.7Electricity 2.74 100.0 113.0 134.3 160.4 163.4 3.0 1.7Urea 0.99 100.0 130.0 127.9 148.4 155.3 21.4 0.5
Decontrolled Prices:Iron and steel 2.44 100.0 113.3 116.6 128.3 134.9 6.9 0.9Phosphatic fertilizers 0.18 100.0 130.0 307.7 302.7 306.7 0.1 0.4Super phosphate 0.06 100.0 130.0 295.3 282.2 292.7 0.1 0.1Ammonium phosphate 0.12 100.0 130.1 315.4 315.4 315.4 0.0 0.3Lubricatingoil 0.45 100.0 118.5 160.3 171.0 168.7 0.2 0.3
Note: The last column indicates each item contribution to the WPI increase, that is the index item percentage change in March 1995times the weight of the item in the WPI.
Source: Ministry of Finance, Economic Survey, various issues.
Distributors of World Bank PublicationsARGEN'INA DENMARK JAPAN SINGAPORE TAIWANCarlor Hirsch, SRL Sarnfundstteratur Eatem Book Servwce Gower Asia Pafic Pbe Ltd.Gai aGuemns Rosenoerr Al 141 Hongo 3-Chorne, Bunkyo-ku 113 Golden Whel BuildingFlonda 165,4thFloor-Ofc. 453/465 DK-l970Fred*rlikbergC Tokyo 41, Kalang Pudding, 04-031333 Buence Aime
Singapore 1334EGYPT, ARAB REaUsuc OF KENYA
Oficina delLabro lntermacoral Al Ahram Africa Book Service (EA.) Ltd. SEOVAKREPUBLICAlberti 40 Al Gal Street Quaran Hoflo, Mfangno St Slovart G.T.G. Ltd.1082 Buenos Aires CAir P.O. Box 45245 Krupinka 4
NairDbi P.O. Box 152AUSTRAIIA, PAPUA NEW GUINEA, The Middle Eat Observer 852 99Braiilava 5FIJl SOLOMON ISLANDS, 41, Sherif Street KOREA. REPUBUC OFVANUATU, AND Calro DaejonTradingCo. Ltd. SOUrH AFRICA, BOTSWANAWESTERN SAMOA P.O. Box 34 Oxford University PressD.A. Information Services FNLAND Yeoesda Southern Africa648 Whutehorse Road AkateeminenKiijaluuppa Seoul P.O. Box 1141Mitcharn3132 P.O Box 23 Cape Town 8000Victoria F-1171 Heinki MALAYSIA
Univenuty of Malaya Coopertive SPAINAUSTRIA FRANCE Bookahop, LAnittd Mundi-Prenra Libro, S.A.Gerold and Co. World Bnk Publication P.O. Box 1127, Jalan Pants, Baru CteUlo 37Grsben3l 66. avenue diAra 59700 Kuala Lumnpur 2801 M dridA-1011 Wien 75116 Pans
MEXICO LTbretanternacional AEDOSBANGLADESH GERMIANY lN}VTEC Conell de Cent, 391Micro Industrie Developrnint UNO-Verlag ApartadoPostal22-60 08009BarcelonaAssistance Society (MDAS) PoppelsdorferAllee55 14060Tpelp, MexacoDF
House 5, Road 16 53115Bonn SRILANKA 4c THE MALDIVESDhenmondiR/Area NETHERLANDS Lake House BookshopDhkl*1209 GREECE DeLindeboom/InOr-Publikaties P.O. Box 244PapasotiriouS.A. P.O. Box202 100,SirChittnpalam nA.BELGIUM 35,StournaraStr. 7480 AE Hlaoabergen GardinerMawatheJean De Lannoy 106 82 Athens Colonrbo 2Av. du Roi 202 NEW ZEALAND
1060 Brusels HONG KONG, MACAO EBSCO NZ Ltd. SWtMENAsia 2000 Ltd. PrivateMilBag99914 Fntze Cutowr ServiceBRA2mL 46-UWyndharnStreet New Market Regeringsgatanl2
PubliccoeslTecnacs Internaaonais WinningCentre Auckland S-10647StockhoilrnLtd&. 7th Floor
Rua Peixoto Gonsude, 209 Central Hong Kong NIGERIA Wennergren-Willis AB01409 Sw Paulo, SP University Press Lirrdted P.O. Box 1305H UNGARY Three Crown BuildingJericho S-171 25SolnaCANADA Foundation forMarket Eornny Private Mal Bag 595
Le Diffuseur Dornbovan Ut 17-19 Ibadan SWITZERLAND151ABoul. deMortagne H-111713udapest LibrainePayotBoucherville, Quebec NORWAY Case postale 3212J4B5E6 INDIA NarvesenInforrnabonCenter CH1002Lausanne
Allied Publishers Private Ltd. BookDepartrentRenoufPublishingCo. 751 Mount Road P.O. Box 6125 Ettertad Van Diernen EditionTechuques1294Algorm Road Madram-600002 N602 Oslo 6 P.O. Box 465Ottawa,OntanoKIB3W8
CH1211 Geneva 19INDONESIA PAKISTAN
CH-INA Pt Indira Limted Minza Book Agency TANZANIAChin Financilk & Economic Jlan Borobudur20 65,Shahrah-e-Quaid-Azam Oxford Unuversity PresPublishing House P.O. Bo 181 P.O. Box No. 729 Makta, Staret8, DaFoSiDongJle Jelc-rl0320 Lahore54000 P.O. Box 5299Bejing
Dar e -.SalamIRAN Oxford University Press
COLOMBIA Kowkab Publishers 5BangaloreTown THAIIANDInfoenlsceLtds. P.O. Box 19575-511 SharseFaia Central Books Distribution Co. Ltd.ApartadoAereo34270 Tehran P.O. Box 13033 306 Silom RoadBogota D E Karchi-75350 Bangkok
EIELANDCOSTA RICA, BEUZE, GUATE Governmwnt Supplies Agency PERU TRINIDAD & TOBAGO, JAMAICA-MALA, HONDURAS 4-5 HArcourt Road Editorial DesarrolloSA Systemnatim Studies UnitNICARAGUA, PANAMA Dublin 2 Apartsdo3824 #9 Watts StreetChisp Bookstore Limal Curepe75 Meters *I Norte del Hotel BaImoral ISRAEL Trindad, West Indiesen calle 7 YozrmotLiterature Ltd.' PHILIPPINESSan Jose P.O. BoC 56055 InternbonalBookCenter UGANDA
Tel Aviv 61560 Suite 720. CitylAnd 10 Gustro Ltd.COTE D'IVOIRE Condcomini umTower 2 1st Floor, Room 4, Geogiadis Chan-ber.Centre d'Edition et de Diffusion ROY. International Ay"le Avenue. HLV. dela P.O. Box 9997Afncaines (CEDA) P.O. Box 13056 CostA Extension Plot (69) Kampala Road04BP 541 TelAviv61130 MRkati,MetrGMAulA Kampala
Abidjan 04 Plateau
PafrstinianAutIDntlMidde East POLAND UNITED KINGDOMCYPRUS IndexinformstionServices Internationl Publishing Service MicroinfoLtd.Canter of Applied ReeArch P.O.B. 19502 Jerusalem Ul. Piekna 31/37 P.O. Box 3Cypru College 00-577Weus wa Alton,m HampshireGU34 2PG6, Diogenes Street, Engomu ITALY EnglandP.O. Box 2006 Licosa Comrniosionri-a Saroni SPA PORTUGALNicosia Via Duca Di Calabria, l/l Livrar,aPortugal ZAMBIA
Ceela Portale 552 Rua Do Carmo 70-74 UnuversityBookshopCZECH REPUBUC 50125Firenze 1200Libon GreatEastRoadCampuNationallnforrnation Center P.O. Box 32379P.O. Box 668 JAMAICA SAUDIARAB, QATAR LusakaC5-11357 Prague I Ian Randle Publithers Ltd. Janr BookStore
206 Old Hope Road P.O. Bcx 31% ZIMBABWEKingston6 RiyadhIl471 LongmnanZimbabwe(Pte.)Ltd.
Tourle Road, ArdbeniueP.O. Box ST 125


_- i
* | ~~*
I 1