Assessment of Phytoplankton Nutrient Limitation in Productive Waters: Application of Dilution...
16
------------------------- ( \ .... Assessment of Phytoplankton Nutrient Limitation in Productive Waters: Application of Dilution Bioassays Hunter J. Carrick,' Claire L. Schelske, and Frederick J. Aldridge Department of Fisheries and Aquatic Sciences, University of Florida, 7922 NW 71 st Street, Gainesville, FL 32606, USA and Michael F. Coveney Division of Environmental Sciences, 51. Johns River Water Management District, Palatka, FL 32178, USA Carrick, H.j., CL. Schelske, F.]. Aldridge, and M.F. Coveney. 1993. Assessmentof phytoplankton nutrient limitation in productive waters: application of dilution bioassays. Can. l. Fish. Aquat. Sci. 50: 2208-2221. Excessive nutrient loads to aquatic systems can complicate otherwise predictable relationships between nutrient concentrations and phytoplankton biomass. We conducted six bioassays on surface phytoplankton assemblages collected from productive Lake Apopka, Florida, to measure the effect of nutrient reduction on phytoplankton growth and nutritional state. Lake water was mixed with one of three diluents to create a gradient of ambient nutrient concentrations; nitrogen (N) and phosphorus (P) limitation at each level of dilution was evaluated in a 2 x 2 factorial design. While the addition of N clearly increased the growth of phytoplankton in undiluted Lake Apopka water, the phytoplankton became more P limited with the reduction of particles (30-60% dilution). Regression of algal yields onto total Pconcentrations from our bottle experiments indicated that an 8 ug- L -1 change in P leads to only a 1 ug-L -1 change in chlorophyll yield, probably due to the high concentration of P in the lake. Because dilution influences factors in addition to ambient nutrient concentrations, results obtained with the technique must be carefully evaluated. Despite this, reduction of particles to improve water quality may, in concept, be a reasonable management scheme in lakes where a large fraction of the nutrients is particulate. Des charges excessives en rnatieres nutritives dans les svsternes aquatiques peuvent compliquer des relations qui seraient par ailleurs previsibles entre les concentrations de nutrients et la biomass phytoplanctonique. Nous avons realise six bioessais sur des assemblages de phytoplancton superficiel preleves dans un lac productif, Ie lac Apopka, en Floride, pour mesurer I'effet de la reduction des nutriants sur facroissance et l'etat nutritionnel du phytoplancton. L'eau du lac a ete rnelangee tour a tour avec trois diluants afin de creer un gradient de concentrations ambiantes de nutriants; on a evalue la limitation de l'azote (N) et du phosphore (P) a chaque niveau de dilution a I'aide d'un plan factoriel (2 x 2). Tandis que l'ajout de N faisait nettement augmenter la croissance du phytoplancton dans l'eau non diluee, on observait une limitation de P avec la reduction des particules (dilution a 30-60 %). La regression de la production algale sur lesconcentrations de Ptotal obtenues par nos experiences dans des bouteilles a indique qu'un changement de 8 j.tg·L- 1 de P cause un changement de seulement 1 Jlg'L- 1 dans la production de chlorophylle, ce qui est probablement dO a la forte concentration de P dans Ie lac. Etant donne que la dilution a un effet sur les facteurs, en plus des concentrations ambiantes de nutriants, les resultats obtenus par cette technique doivent etre soigneusement evalues, Malgre cela, la reduction des particules pour arneliorer la qualite de I'eau pourrait theoriquernent constituer un schema raisonnable de gestion dans les lacs OU une fraction importante des nutriants se trouve sous forme particulaire. Received December 17, 7992 Rer;u Ie 77 decembre 7992 Accepted April 29, 7993 Accepte Ie 29 avril 7993 (1B732) A lthough the relationship between water column nutrient status of the phytoplankton themselves, as deficient cells can concentrations (i.e., total phosphorus (TP) and total take up nutrients in excess of their immediate growth require- nitrogen (TN)) and phytoplankton biomass provides a ments (Healey 1979; Lean and Pick 1981). Several tests have useful framework for estimating the response of aquatic systems been used to study the problem of nutrient limitation of phyto- to nutrient enrichment (Dillon and Rigler 1974; Jones and plankton. The most notable of these techniques are bioassays Bachmann 1976), this relationship is correlative and offers involving the enclosure of natural phytoplankton assemblages limited information on underlying causal factors. Ambient nu- (Schelske 1984), whole-lake fertilization (Schindler and Fee trient concentrations are not always the best predictors of nutrient 1974), and the use of physiological indicators of nutrient defi- ciency (Healey and Hendzel 1980; Vincent 1981a, 1981b). Despite these approaches, it can be difficult to identify the 'Also: Department of Research, South Florida Water Management nutrients that limit phytoplankton growth in productive waters District, 3301 Gun Club Road, West Palm Beach, FL 33406, USA. Present address: Department of Biology & Romberg Tiburon Center for due to persistent nutrient excesses (Paerl and Bowles 1987). In Environmental Studies, San Francisco State University, San Francisco, these systems, alternative approaches may be required to assess CA 94132, USA. nutrient limitation. 2208 Can. J. Fish. Aquat. Sci .. Vol. 50, 1993
Transcript of Assessment of Phytoplankton Nutrient Limitation in Productive Waters: Application of Dilution...

-------------------------pd:f~
( \ ....
Assessment of Phytoplankton Nutrient Limitation in Productive Waters: Application of Dilution Bioassays
Hunter J. Carrick,' Claire L. Schelske, and Frederick J. Aldridge Department of Fisheries and Aquatic Sciences, University of Florida, 7922 NW 71st Street, Gainesville, FL 32606, USA
and Michael F. Coveney Division of Environmental Sciences, 51. Johns River Water Management District, Palatka, FL 32178, USA
Carrick, H.j., CL. Schelske, F.]. Aldridge, and M.F. Coveney. 1993. Assessmentof phytoplankton nutrient limitation in productive waters: application of dilution bioassays. Can. l. Fish. Aquat. Sci. 50: 2208-2221.
Excessive nutrient loads to aquatic systems can complicate otherwise predictable relationships between nutrient concentrations and phytoplankton biomass. We conducted six bioassays on surface phytoplankton assemblages collected from productive Lake Apopka, Florida, to measure the effect of nutrient reduction on phytoplankton growth and nutritional state. Lake water was mixed with one of three diluents to create a gradient of ambient nutrient concentrations; nitrogen (N) and phosphorus (P) limitation at each level of dilution was evaluated in a 2 x 2 factorial design. While the addition of N clearly increased the growth of phytoplankton in undiluted Lake Apopka water, the phytoplankton became more P limited with the reduction of particles (30-60% dilution). Regression of algal yields onto total Pconcentrations from our bottle experiments indicated that an 8 ug-L-1 change in P leads to only a 1 ug-L -1 change in chlorophyll yield, probably due to the high concentration of P in the lake. Because dilution influences factors in addition to ambient nutrient concentrations, results obtained with the technique must be carefully evaluated. Despite this, reduction of particles to improve water quality may, in concept, be a reasonable management scheme in lakes where a large fraction of the nutrients is particulate.
Des charges excessives en rnatieres nutritives dans les svsternes aquatiques peuvent compliquer des relations qui seraient par ailleurs previsibles entre les concentrations de nutrients et la biomass phytoplanctonique. Nous avons realise six bioessais sur des assemblages de phytoplancton superficiel preleves dans un lac productif, Ie lac Apopka, en Floride, pour mesurer I'effet de la reduction des nutriants sur facroissance et l'etat nutritionnel du phytoplancton. L'eau du lac a ete rnelangee tour a tour avec trois diluants afin de creer un gradient de concentrations ambiantes de nutriants; on a evalue la limitation de l'azote (N) et du phosphore (P)achaque niveau de dilution a I'aide d'un plan factoriel (2 x 2). Tandis que l'ajout de N faisait nettement augmenter la croissance du phytoplancton dans l'eau non diluee, on observait une limitation de P avec la reduction des particules (dilution a 30-60 %). La regression de la production algale sur lesconcentrations de Ptotal obtenues par nos experiences dans des bouteilles a indique qu'un changement de 8 j.tg·L-1 de P cause un changement de seulement 1 Jlg'L-1 dans la production de chlorophylle, ce qui est probablement dO ala forte concentration de P dans Ie lac. Etant donne que la dilution a un effet sur les facteurs, en plus des concentrations ambiantes de nutriants, les resultats obtenus par cette technique doivent etre soigneusement evalues, Malgre cela, la reduction des particules pour arneliorer la qualite de I'eau pourrait theoriquernent constituer un schema raisonnable de gestion dans les lacs OU une fraction importante des nutriants se trouve sous forme particulaire.
Received December 17, 7992 Rer;u Ie 77 decembre 7992 Accepted April 29, 7993 Accepte Ie 29 avril 7993 (1B732)
A lthough the relationship between water column nutrient status of the phytoplankton themselves, as deficient cells can concentrations (i.e., total phosphorus (TP) and total take up nutrients in excess of their immediate growth requirenitrogen (TN)) and phytoplankton biomass provides a ments (Healey 1979; Lean and Pick 1981). Several tests have
useful framework for estimating the response of aquatic systems been used to study the problem of nutrient limitation of phytoto nutrient enrichment (Dillon and Rigler 1974; Jones and plankton. The most notable of these techniques are bioassays Bachmann 1976), this relationship is correlative and offers involving the enclosure of natural phytoplankton assemblages limited information on underlying causal factors. Ambient nu (Schelske 1984), whole-lake fertilization (Schindler and Fee trient concentrations are not always the best predictors of nutrient 1974), and the use of physiological indicators of nutrient defi
ciency (Healey and Hendzel 1980; Vincent 1981a, 1981b). Despite these approaches, it can be difficult to identify the 'Also: Department of Research, South Florida Water Management nutrients that limit phytoplankton growth in productive waters District, 3301 Gun Club Road, West Palm Beach, FL 33406, USA.
Present address: Department of Biology & Romberg Tiburon Center for due to persistent nutrient excesses (Paerl and Bowles 1987). In Environmental Studies, San Francisco State University, San Francisco, these systems, alternative approaches may be required to assess CA 94132, USA. nutrient limitation.
2208 Can. J. Fish. Aquat. Sci .. Vol. 50, 1993


00 0
Oklawaha River Basin
c
o •5 10 km
Florida, USA
27 0
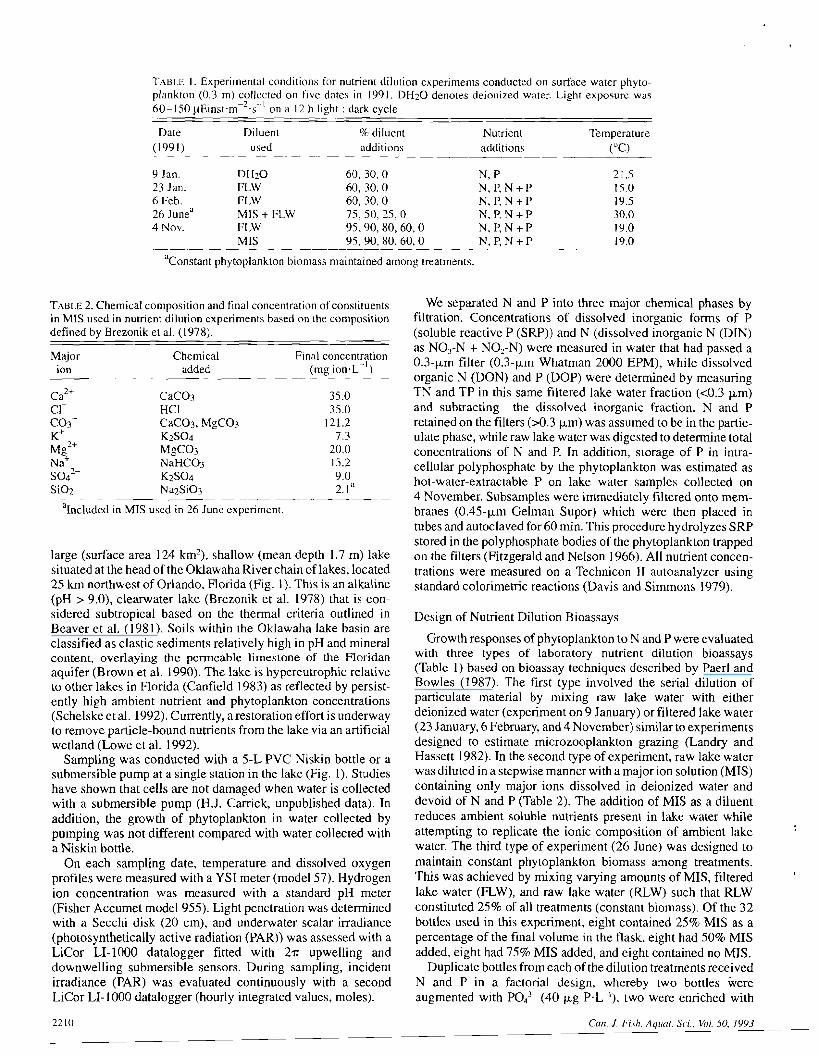
FIG. 1. Map of the location of the state of Florida, USA, with the Oklawaha River basinenlarged. The studysite is indicated with a dot (afterDeevey 1988; ReddyandGraetz 1991).
There is some question as to which primary factors mediate phytoplankton dynamics in tropical and subtropical lakes (Kratzer and.Brezonik 1981; Osgood 1982; Canfield et al. 1989), as little research has been conducted on these systems compared with temperate systems (Lewis 1987). The evidence for nutrient limitation in subtropical lakes appears circumstantial because few controlled experiments have actually been conducted to test this hypothesis (cf. Schelske 1989). Relationships between ambient nutrient concentration (i.e., TP and TN) and phytoplankton biomass across a suite of Florida lakes support the idea that the phytoplankton biomass in these lakes is nutrient limited (Canfield 1983). However, additional work has spawned a debate as to whether phytoplankton abundance is under strict nutrient control, given the potential for self-shading at the high levels of biomass supported in some of these lakes (e.g., Agusti et a1. 1990).
In this study, we evaluated nitrogen (N) and phosphorus (P) limitation of phytoplankton in productive waters utilizing an approach whereby nutrient enrichment bioassays are coupled with serial dilution of lake water (Paerl and Bowles 1987).
Call. J. Fish. Aquat. Sci .. Vol. 50, /993
Because dilution experiments may be prone to experimental artifacts (e.g., Li 1990; Stockner et al. 1990), the critical assumptions of the technique were also evaluated. This approach is potentially useful because it can serve as experimental evaluation of current management schemes to improve water quality in lakes, such as reduction of nutrient loads (Loehr et al. 1980) or removal of particulate material (phytoplankton and associated nutrients) from the water column of lakes via artificial wetlands (Lowe et al. 1992). The specific objectives of the study were to (1) determine if dilution alters phytoplankton Nand P limitation, (2) evaluate the effect of particle reduction on phytoplankton growth yields, and (3) compare our results with the original technique formulated by Paerl and Bowles (1987).
Methods
Physical-Chemical Conditions
All experiments were conducted on surface water samples (0.3 m) collected from Lake Apopka, Florida. Lake Apopka is a
2209
TAtlLE I. Experimental conditions for nutrient dilution experiments conducted on surface water phytoplankton (0.3 m) collected on five dates in 1991. DH20 denotes deionized water. Light exposure was 60-150 llEinst·m-2·s· 1 on a 12 h light: dark cycle
Date Diluent % diluent Nutrient Temperature (1991 ) used
-_._. additions additions (0C)
9 Jan. DH20 60,30,0 N,P 21.5 23 Jan. FLW 60,30,0 N,P,N+P 15.0 6 Feb. FLW 60,30,0 N, P, N +P 19.5 26 Junea MIS + FLW 75,50,25,0 N, P, N + P 30.0 4 Nov. FLW 95,90,80,60,0 N, P, N +P 19.0
MIS 95,90,80,60,0 N, P, N +P 19.0 ._---~----- ._-----
"Constant phytoplankton biomassmaintained among treatments.
TABLE 2. Chemicalcompositionand finalconcentration of constituents in MIS used in nutrientdilution experiments based on the composition defined by Brezoniket al. (1978).
Major Chemical Finalconcentration ion added (mg ion' L-I)
Ca2+ CaC03 35.0 Cl HCl 35.0 C03- CaC03, MgC03 121.2 K+ K2S04 7.3Ml+ MgC0 3 20.0 Na+ NaHC03 15.2 so," K2S04 9.0 Si02 Na2Si03 2.1 8
aIncluded in MIS used in 26 June experiment.
large (surface area 124 krrr'), shallow (mean depth 1.7 m) lake situated at the head of the Oklawaha River chain oflakes, located 25 krn northwest of Orlando, Florida (Fig. 1). This is an alkaline (pll » 9.0), clearwater lake (Brezonik et al. 1978) that is considered subtropical based on the thermal criteria outlined in Beaver et al. (1981). Soils within the Oklawaha lake basin are classified as clastic sediments relatively high in pH and mineral content, overlaying the permeable limestone of the Floridan aquifer (Brown et al. 1990). The lake is hypereutrophic relative to other lakes in Florida (Canfield 1983) as reflected by persistently high ambient nutrient and phytoplankton concentrations (Schelske et al. 1992). Currently, a restoration effort is underway to remove particle-bound nutrients from the lake via an artificial wetland (Lowe et al. 1992).
Sampling was conducted with a 5-L PVC Niskin bottle or a submersible pump at a single station in the lake (Fig. 1). Studies have shown that cells are not damaged when water is collected with a submersible pump (H.J. Carrick, unpublished data). In addition, the growth of phytoplankton in water collected by pumping was not different compared with water collected with a Niskin bottle.
On each sampling date, temperature and dissolved oxygen profiles were measured with a YSI meter (model 57). Hydrogen ion concentration was measured with a standard pH meter (Fisher Accumet model 955). Light penetration was determined with a Secchi disk (20 em), and underwater scalar irradiance (photosynthetically active radiation (PAR)) was assessed with a LiCor LI-lOOO datalogger fitted with 211' upwelling and downwelling submersible sensors. During sampling, incident irradiance (PAR) was evaluated continuously with a second LiCor LI-lOOO datalogger (hourly integrated values, moles).
We separated Nand P into three major chemical phases by filtration. Concentrations of dissolved inorganic forms of P (soluble reactive P (SRP)) and N (dissolved inorganic N (DIN) as NO)-N + N02-N) were measured in water that had passed a 0.3-!J.m filter (0.3-!J.m Whatman 2000 EPM), while dissolved organic N (DON) and P (DOP) were determined by measuring TN and TP in this same ftltered lake water fraction «0.3 urn) and subtracting the dissolved inorganic fraction. Nand P retained on the filters (>0.3 urn) was assumed to be in the particulate phase, while raw lake water was digested to determine total concentrations of Nand P. In addition, storage of P in intracellular polyphosphate by the phytoplankton was estimated as hot-water-extractable P on lake water samples collected on 4 November. Subsamples were immediately filtered onto membranes (0.45-!J.m Gelman Supor) which were then placed in tubes and autoclaved for 60 min. This procedure hydrolyzes SRP stored in the polyphosphate bodies of the phytoplankton trapped on the filters (Fitzgerald and Nelson 1966). All nutrient concentrations were measured on a Technicon IT autoanalyzer using standard colorimetric reactions (Davis and Simmons 1979).
Design of Nutrient Dilution Bioassays
Growth responses of phytoplankton to Nand P were evaluated with three types of laboratory nutrient dilution bioassays (Table I) based on bioassay techniques described by Paerl and Bowles (1987). The first type involved the serial dilution of particulate material by mixing raw lake water with either deionized water (experiment on 9 January) or filtered lake water (23 January, 6 February, and 4 November) similar to experiments designed to estimate microzooplankton grazing (Landry and Hassett 1982). In the second type of experiment, raw lake water was diluted in a stepwise manner with a major ion solution (MIS) containing only major ions dissolved in deionized water and devoid of Nand P (Table 2). The addition of MIS as a diluent reduces ambient soluble nutrients present in lake water while attempting to replicate the ionic composition of ambient lake water. The third type of experiment (26 June) was designed to maintain constant phytoplankton biomass among treatments. This was achieved by mixing varying amounts of MIS, filtered lake water (FLW), and raw lake water (RLW) such that RLW constituted 25% of all treatments (constant biomass). Of the 32 bottles used in this experiment, eight contained 25% MIS as a percentage of the final volume in the flask, eight had 50% MIS added, eight had 75% MIS added, and eight contained no MIS.
Duplicate bottles from each of the dilution treatments received Nand P in a factorial design, whereby two bottles were augmented with P04) - (40 !J.g P'L- I
) , two were enriched with
Can. I Fish. Aquat. Sci., VIII. 50, J993 2210

NO,- (400 j..Lg N'L-I), two received both Nand P, and two did not receive nutrients and served as controls (Paerl and Bowles 1987). This design was true for all experiments except one conducted on 9 January in which Nand P were added singly without a N + P treatment. Experimental bottles were incubated for 5-7 d in a walk-in growth chamber or in Percival incubators. The light (range 60-150 u.Einst-mvs') and temperature (15-30D C) environment in the incubators was maintained at levels similar to those occurring at the average mixing depth of the lake at the time of collection (Table I).
In all experiments, acid-washed bottles (500-mL Erlenmeyer flasks) received varying mixtures of RLW and one of three diluents to achieve a final volume of350 mL. FLW was prepared by passing RLW through a 0.2-j..Lm filter capsule (Gelman maxicap) under low pressure (<10 mm Hg), while deionized water used on 9 January was prepared with a reverse osmosis system.
Phytoplankton Biomass and Community Composition
In all experiments, bottles were sampled daily (every 24 h) by removing 8 mL from each flask at approximately the same time for in vivo chlorophyll a (Chi a) fluorescence determination. Because the total volume we removed from each bottle was small « 10%), we assumed that decreasing volume had little influence on the outcome of these experiments. Once collected, samples were allowed to dark-adapt for 20 min to provide a better measure of phytoplankton biomass and were then read with a Turner Designs fluorometer (Vincent 1979). Extracted Chi a concentrations at the start and termination of the experiments conducted in June and November were determined fluorometrically using an acetone-DMSO (50:50) extraction procedure (Shoaf and Lium 1976), although we did not use grinding.
In the experiments conducted on 26 June and 4 November, phytoplankton abundance and composition was determined using epifluorescence microscopy, due to the abundance of phototrophic picoplankton in the lake (Carrick et al. 1993). Slides were prepared within 24 h of sampling from samples preserved in I% glutaraldehyde. Lake water subsamples « 1.0 mL) were filtered onto prestained (irgalan black) 0.2-j..Lm pore size Nuclepore filters. Filters were mounted between a microscope slide and coverslip with immersion oil, subsequently stored at -20DC, and counted within 1 wk to minimize the fading of fluorescence (Fahnenstiel and Carrick 1992). Biomass was estimated by enumerating a total of 500-1000 individuals from two duplicate slides «5% counting error assuming Poisson statistics) using a Nikon Research microscope (I OOOx) equipped for Chi a fluorescence (blue light 450-490 nm excitation and >515 nm emission) and determination of phycobilin proteins (green light 530-560 nm excitation and >580 nm emission). Dominant pigment fluorescence of individual picoplankton cells and intermittent observation with white light was used to assign general taxonomic (Division) position (Tsuji et al. 1986). Cell volumes were calculated for each taxon by measuring the cellular dimensions of at least 10 cells on at least two dates. These estimates were converted to carbon (C) based on Strathrnann's (1967) equations for large phytoplankton (>2 11m), or the conversion factorO.15 g C'mL-1 forpicoplankton (Laws et al. 1984). The algal taxonomy applied conforms to that outlined by Prescott (1973) and Patrick and Reimer (1966, 1975), taking into account changes suggested by Rippka et al. (1979) and Round et al. (] 990).
Call. J. Fish. Aquat. Sci.. Vol. 50. /993
Data Analysis
The time-dependent change in in vivo fluorescence readings for the phytoplankton in each of the bottles was determined by calculating exponential growth rates (r) using the following:
r = (In(N,/ No» / t
where N, is the maximum in vivo fluorescence achieved in the experiment, No is the initial in vivo fluorescence allowing 24 h for adaptation if necessary, and t is the duration of time between initial and final samplings.
Estimates of phytoplankton growth were then analyzed using a two-way analysis of variance (ANOVA), with nutrient treatments and the level of dilution considered fixed factors. When two-way ANOVA yielded significant interaction terms, one-way ANOVA was utilized where dilution was considered a blocked factor and nutrient treatments were fixed (Zar 1983). All the data met assumptions of equal variances, and Tukey's test (p < 0.05) was used to test for pairwise differences among the fixed factors. All statistical analyses were performed using SYSTAT (Ver. 4.0, 1991).
Evaluating Assumptions of Dilution Bioassays
Certain aspects of dilution techniques have recently come into serious question that also have bearing on other experimental protocols (Li 1986, 1990). While many of these can be readily tested, potential problems concerning passage of cells through leaky filters and contamination of diluents resulting from cell breakage require careful checks (Stockner et al. 1990).The major criticisms are four: (I) artifacts arising from containment of phytoplankton in bottles, (2) filter-induced enrichment of nutrients, (3) occurrence of cells in the diluent resulting from passage through leaky filters, and (4) contamination of the diluent after preparation. We examined a fifth assumption more specifically related to the application of the Paerl and Bowles (1987) technique, whereby the constant quantity of nutrients added to a changing level of algal biomass in the dilution treatments is thought not to alter the nutrient response of phytoplankton among the dilution treatments.
We designed experiments to investigate these criticisms, which will subsequently aid in the interpretation of results. First, to evaluate the effects of containment on Lake Apopka phytoplankton, water was collected from 0.3 m depth on 6 February 1991, mixed, and dispensed into replicate vessels of various sizes (500, 700, 1000, and 2000 mL). The volume of lake water used was allowed to vary among different-sized containers, in that we were interested in comparing our basic experimental unit (350 mL of lake water in a 500-mL flask) with that contained in a series of larger vessels. All eight vessels were incubated (as described above) at ambient light and temperature and subsampled at 0, 24, 48, 120, 140, and 160 h for extracted Chi a. Second, nutrient contamination of diluents was assessed by determining concentrations of Nand P in the three diluents utilized in our experiments (distilled water, MIS, and FLW) using the wet chemistry methods described above. Third and fourth, the occurrence of cells in the diluents and contamination related to sampling (airborne or inadvertent inoculation of flasks) was evaluated on 4 November by incubating replicate flasks containing MIS, FLW, and each diluent with added Nand P. In vivo fluorescence was measured daily and initial and final subsamples were prepared for epifluorescence microscopy to determine if
2211

rABLE 3. Distribution of P (as SRP, DOP, and PP) and N (as DIN (N02-N + N03-N), DON, and PN) and concentrations of TP and TN for surface water collected from Lake Apopka on seven dates in 1991.
SRP DOP PP TP DIN DON PN TN Date (%) (%) (%) (llg'L- I
) (%) (%) (%) (llg'L- l)
23 July 4A 19.6 76.0 109.5 0.06 58.7 41.2 3237 24 July 3.5 IDA 87.6 137.7 0.01 49.1 50.9 3682 25 July 2.6 8.2 90.5 187.7 0.01 48.9 51.1 3682 26 July 3.5 11.9 86.6 139.3 0.04 51.8 48.1 3627 27 July 4.3 12.6 85.7 111.9 0.03 51.1 48.9 3439 16 Sept. 0.3 12.8 87.1 110.7 0.06 2968 04 Nov. IA 8.7 89.9 118.3 0.08 42.1 57.8 3421
Average 2.8 12.0 86.2 130.7 0.04 50.3 49.8 3436.6 SO 1.6 3.8 4.8 28.1 0.03 5A 5A 263A
autotrophic cells were present and growing in the diluents. Lastly, the effects of adding a constant nutrient spike to various
standing stocks of phytoplankton (resulting from dilution) were assessed by measuring nutrient uptake in the experiments conducted on 4 November. P uptake was determined from subsamples of water from the control treatments at the start of the experiment (time 0) and from all experimental bottles after 24 h of incubation. Subsamples were immediately filtered through membranes (0.45-/-Lm Gelman Supor) arid assayed for SRP using the wet chemistry methods outlined above. Yalues referred to hereafter as P uptake rates (micrograms P per microgram Chi a per day) were derived using the following calculation:
P uptake =: «SRPo - SRP,) / ChI) / t
where SRP, is the SRP concentration at time t. SRPo is the initial SRP concentration, Chi is the initial Chi a concentration of the phytoplankton assemblage (little growth occurred in 24 h), and t is the duration of time between initial and final samplings.
Results
Nutrient Pools in Lake Apopka Surface Waters
Both TN and TP are present in high concentrations in the surface waters of Lake Apopka (Table 3). Large percentages of both nutrients occur in the particulate phase (49.7 and 85.6%, respectively). DIN and SRP occur in very low (marginally detectable) concentrations and constitute very little «4%) of the respective TN and TP pools. Inclusion of NH4-N concentrations measured monthly during 1991 (average 14.0, SD 9.4, n =: 12, St. John's River Water Management District, Palatka, Fla., unpublished data) into our estimate shows that DIN remains a small component ofN (0.5% of TN). Despite low DIN concentrations and the predominance of cyanobacteria (>80% phytoplankton C), N fixation does not appear to be an important component of the N cycle in Lake Apopka (Reddy and Graetz 1991; Aldridge et al. 1993). The remainder of Nand P is present in dissolved organic fractions (51.9 and 12.6%, respectively). In addition, P stored intracellularly by the phytoplankton in polyphosphate bodies and measured as HEP constitutes a substantial fraction of particulate P (PP) in the surface waters (average 24.8%, SD 8.3, n = 3), as determined in our study and that of Newman (1991).
Nutrient Dilution Bioassays
Changes in phytoplankton growth rates among nutrient treatments were fairly consistent in all six experiments (Fig. 2 and 3).
2212
-----------_.
N or N + P yielded the greatest phytoplankton growth, while ditferences in phytoplankton growth among dilution levels were observed in five of the six experiments (two-way ANaYA). However, treatment and pairwise differences in these experiments were complex and required reanalysis, as indicated by significant interactions obtained from the two-way ANaYA (Zar 1983).
Subsequently, one-way ANaYA was used to test for differences among nutrients (dependent variable) at each. level of dilution (blocked factor) in order to investigate interactions between nutrients and dilution on algal growth (Table 4). The general pattern of switching from N limitation to colimitation by both Nand P among treatments was observed consistently in treatments receiving 30% or more diluent, although these differences were not always statistically significant. Yiewed another way, dilution appears to relax the degree to which phytoplankton are N limited. We are confident that the in vivo fluorescence readings measured in our experiments reflect changes in algal biomass, given that in vivo fluorescence correlates well with both extracted Chi a (r =: 0.85, p < 0.001, n = 56) and phytoplankton C derived from microscopic cell counts (r =: 0.68, p < 0.00 I, n =: 36). All three biomass estimates were determined simultaneously in the June and November experiments.
Alterations in phytoplankton composition following N t P enrichment were manifest at the termination of the three experiments from which we have data (26 June and 4 November), particularly with large dilutions of MIS (Fig. 4 and 5). In the June experiment (Fig. 4), phytoplankton biomass was constant across dilution treatments at the onset of the experiment (25% of the total mixture). By the end of this experiment, changes in the percent contribution (average percent ± I SD based on C) of the phytoplankton in the controls compared with initial lake water conditions (total algal C 3633 ug C· L'", 97.3% cyanobacteria) were only observed in bottles receiving >25% MIS. Cyanobacteria (Synechococcus sp., Synechocystis sp., Microcystis incerta Lemm., and Lyngbya contorta Lemm.) were dominant in the lake (Carrick et al. 1993) and in unenriched bottles containing oand 25% MIS (92.4 ± 6.6 and 89.4 ± 5.3%, respectively). In the controls, chrysophytes were important (i.e., Chrysochromulina parva Lackey, range 7.7-75.4%) at higher levels of dilution with MIS (biomass at 0% relative to 50% dilution, 42-430 ug C·L-I). In the N + P treatments, chrysophyte biomass increased more than an order of magnitude (range 106-1193 ug C·L-I) with increasing MIS additions; these increases were greater than those realized in the controls (range in chrysophyte
CUll. 1. Fish. Aquat. Sci.. Vol. 50, 1993

biomass 17.6-44.1%). Diatoms (primarily Synedra sp.) only occurred in the 75% MIS treatment enriched with N + P (290 ug C'L-I, 8.9 ± 1.7% of total C).
Similar alterations in phytoplankton composition were observed in samples taken at the termination of the November experiments (Fig. 5). The percent contribution of cyanobacteria in the control treatments diluted with either FLW or MIS (81.7 ± 12.6 and 87.2 ± 8.7%, respectively) remained similar to initial lake populations (total C 3300 ug: L-1
, 85% cyanobacteria). The addition of both Nand P at large dilution factors of either FLW or MIS diluents promoted shifts in community composition, such that diatoms became more abundant (232 and 1042 ug C' L-I, respectively) and constituted a greater fraction of the total biomass (11.2 and 55.9%, respectively). This same general trend of increasing occurrence with dilution was evident for chrysophyte biomass (range 689-1033 Ilg C' L-I) and percent contribution (21-61 %), but only when MIS was the diluent.
Algal Yield and TP Concentration
The growth yield (maximum in vivo fluorescence minus the initial fluorescence) of phytoplankton enriched with N was related to TP concentrations in five of six experiments (Table 5). TP accounted for 78-89% of the variation in algal yield, although the nature of this relationship did vary between experiments. On 9 January, no significant relationship was observed (p < 0.20). Maximum yields were achieved following N addition in all experiments except those on 4 November, when N + P addition prompted maximum yield (see below). The yield versus TP relationship was not relevant in the experiments on 26 June where algal biomass and TP concentrations were constant among bottles. Instead, we measured changes in algal yield with the increasing percentage of MIS added and found that algal yield (as well as diatom and chrysophyte biomass, see above) was augmented by greater additions of MIS. Lastly, fluorescence units appear to provide a good estimate of phytoplankton Chi a concentrations, given their strong empirical relationship with Chi a (see above). Also, slopes of regressions between both fluorescence units and TP and Chi a and TP in the June experiment gave nearly identical results (Table 5).
Relationships between algal yield and TP (or dilution) were different when plotted for individual nutrient treatments for both of the 4 November experiments. Anegative relationship between maximum yield and TP was obtained for the control, P,and N + P treatments. However, yields in the N treatment increased linearly, excluding data for the 100% RLW treatment (0% dilution). These results are important for two reasons: first, the degree of N limitation of the phytoplankton appeared to be relaxed by dilution so that phytoplankton in the N-treated flasks became P limited; and second, the growth yield of phytoplankton was enhanced with increasing TP. Conversely, enrichment with both Nand P promoted the greatest phytoplankton yields and these were inversely related to TP concentrations.
Major Assumptions of Nutrient Dilution Experiments
Experiments designed to evaluate the major underlying assumptions of these nutrient dilution experiments indicated that two factors we assessed did appear to complicate our results. First, MIS was intended to produce a diluent that was free of N and P and yet had an ionic composition similar to natural lake water (Tables 2 and 6). The construction of MIS was successful in the sense that this diluent had an ion balance and pH similar
30,....--------------, A. 0% MIS ---0--- Control
24 --a-- N
-- P18
-- N+P
12
15010050
30 ~-------------. --1Il B.25%MIS c: 24 ::J
CD 18 >-~ 12 CD a:
6 -CD o O+---.---.----.----r--....,.-----lc: CD o 50 100 150 o 1Il CD ~
o 30...----------------, ::l C.50%MIS U. 24 o > 18 > c: 12
6
O+---.---.------r--....,.--; o 50 100 150
30,----------------, D.75%MIS
24
18
12
6
O+----.----r--~-__._---.--__l
o 50 100 150
TIME (Hours)
Fro.2.Timecourses of phytoplankton biomass froma nutrient dilution bioassay conducted on 26 June. Average biomass (as in vivo fluorescence) values were derivedfromduplicate bottlesreceiving one of four nutrient treatments (control, N, P, and N + P, at fourdilution levels (0,25,50, and75%)utilizing MIS.Phytoplankton biomass wasconstant amongtreatments at the startof the experiment.
to natural lake water (Brezonik et al. 1978). Additions of MIS to RLW certainly reduced TN and TP concentrations, but did not diminish DIN and SRP concentrations because they were low in RLW to begin with (Table 3). Perhaps most importantly, large additions of MIS appeared to augment algal growth and changes in algal species composition beyond that which occurred
Can. J. Fish. Aquat. Sci., Vol. 50. /993 2213

20.,....--------------, A. 0% FLW
15
10
5
o+-~-.,........~-.__~___,--__l
o 50 100 150 200
20...._-------------, B. 60% FLW
15
--en
CI) O+-~__r-~..,.._~____r-~__l
> o 50 100 150 200-as CI) 20....--------------,a: C. 80% FLW-
15 CI) (,)
c: 10CI) (,) en CI) ~
o ;::,
O+-~__r-~..,.._~___r-~__l
L1. o 50 100 150 200
o 20.,..--------------,> D. 90"10 FLW >
15 c:
10
20.,....--------------,
15
10
5
E. 95% FLW
_ Control
-p
---0-- N _____ N+P
O~~~~~~~ o 50 100 150 200
Time
20...------------___, A. 0% MIS
15
10
5
o+-~-...._~-r_~____,.__~___l
o 50 100 150 200
20...._-------------, B. 60% MIS
15
10
5
o+-~-...._~-r_-____,.__~___l
o 50 100 150 200
20..-------------, C. 80% MIS
15
O+-~-r_--.__~___,-~__l
o 50 100 150 200
20..--------------, D. 90°.4 MIS
15
10
5
O+-~-.,........~-r_-___,.__~___l
o 50 100 150 200
40.,....-------------,E. 95°.4 MIS
30
20
10
0-,=~~6::!~~~~ o 50 100 150 200
(Hours)
FIG.3. Time courses of phytoplankton biomass from nutrient dilution bioassays conducted on 4 November. Average biomass (as in vivo fluorescence) values were derived from duplicate bottles receiving one of four nutrient treatments (control, P, N, and N + P) at five dilution levels (0, 60, 80, 90, and 95%). The two diluents were FLW and MIS.
Can. 1. Fish. Aquat. Sci.. Vol. 50. /993 2214

TABLE 4. Results from one-way ANOVAcomparing average growth rates for Lake Apopka photoplankton among nutrient treatments at each level of dilution (blocked factor). Treatments joined by underlining were not significantly different from one another when assessed with Tukey's pairwise comparisons (p < 0.05). ***p < 0.00001, **p < 0.01, *p < 0.05.
Date Blocked Tukey's pairwise comparison (diluent) factor F-stat (least to greatest)
9 Jan. Dilution (%) (DH20 ) 0 21.9** ~ N
30 12.7* ~ N 60 5.5 C P N
23 Jan. Dilution (%) (FLW) 0 18.5*** ~ N+ P N
30 91.3*** ~ N+ P 1'l. 60 19.2*** C P N N+P
7 Feb. Dilution (%) (FLW) 0 76.4*** c..r N+ P N
30 51.7*** ~ N+P N 60 13.8** ~ N N+ P
26 June Dilution (%) (MISIFLW) 0 421.6*** ~ 1'l. N + P
25 153.0*** ~ N N+ P 50 261.3*** ~ N+P N 75 546.1 *** ~ N N+ P
4 Nov. Dilution (%) (FLW) 0 121.8*** ~ N N+P
60 72.9*** ~ N N+P 80 169.0*** ~ N N+P 90 2294.5*** c.r N N+P 95 40.3** C N P ~
4 Nov. Dilution (%) (MIS) 0 121.8*** ~ N N+P
60 169.0*** ~ N N+P 80 18.0** ~ N N+P 90 212.0*** ~ N N+P 95 202.9*** C P N N+P
following the addition of FLW (Fig. 4 and 5). At present, we do not know if inadvertent addition of elements with MIS ancl/or dilution of inhibitory substances in Lake Apopka water could account for the observed response.
P uptake rates varied greatly with the dilution of lake water in experiments conducted on 4 November using FLW (Table 7). After 24 h of incubation, P uptake in both P and N + P nutrient treatments were similar and increased logarithmically with increasing dilution of phytoplankton biomass. A graph of P uptake in the control and N treatments versus percent RLW showed no discernible pattern, presumably because there was little SRP available for uptake. P uptake increased linearly with the quantity of P added to our experimental bottles, once-these rates were corrected for Chi a standing stocks (Fig. 6).
The other factors that might have confounded results did not appear to be important. None of the three diluents used in our nutrient bioassays was an additional source of N or P (Table 6). Nand P concentrations were undetectable in the deionized water we used. As expected, the concentrations of DIN and SRP in the FLW produced with the filter capsule were comparable with those present in natural lake water determined with conventional filtration methods. Because the filter capsule should remove the particulate material in lake water, it is not surprising that total TN and TP concentrations in FLW expressed as a percentage of
Call. J. Fish. Aquat. Sci.. Vol. 50. /993
TN and TPconcentrations ofRLW (41.3 and 6.8%, respectively) were similar to concentrations of dissolved DON and DOP in natural lake water (Table 3).
Phototrophic cells were not present in the diluents prior to mixture with RLW, nor did algae manifest in bottles containing only FLW and MIS, even when nutrients were added to promote their growth. Daily in vivo fluorescence readings of these bottles and inspection of subsamples with epifluorescence microscopy showed that phototrophic cells were not detectable in the diluents as found in some studies (Li 1990). This is not to say that these diluents did not support the growth of other planktonic components such as heterotrophic bacteria and protozoans that would not have been easily detected due to their lack of autofluorescence. While stains were not used to confirm the presence or absence of heterotrophic organisms, we believe their presence was unlikely because no trace of them was observed under the bright background fluorescence of green light excitation.
Lastly, containment artifacts attributable to the use of 500-mL bottles in the experiments were probably small. Minor differences were observed in the growth (-0.01 to -0.04·d-') of phytoplankton contained in bottles of varying size (500 to 2000 mL) relative to the growth of phytoplankton following nutrient addition in our dilution experiments.
2215

B. N+P
0% 25% 50% 75%
°/0 MIS Addition FIG. 4. Phytoplankton community composition and biomass (as C) for a nutrient dilution bioassay conducted on 26 June. Average biomass values werederivedfrommicroscopic cell countstakenfromduplicate bottles receiving one of two nutrient treatments (control and N + P) at four dilution levels(0, 25, 50, and 75%) where MIS was the diluent.
Discussion
Nutrient Limitation in Productive Waters
The addition of N in our experiments clearly increased the growth of phytoplankton in undiluted Lake Apopka water in the laboratory; however, reduction of particles in lake water altered the response of the phytoplankton to nutrients. This was particularly true at dilution factors of 30% or greater, when phytoplankton growth appeared to become more limited by P.This was a consistent feature in nearly all of our experiments independent of the diluent utilized, although additional growth stimulation was achieved in treatments receiving the greatest dilution with major ionic solution, MIS. High proportions of Nand P present in particulate matter rather than in soluble reactive forms made it possible to remove nutrients with FLW additions, while mixtures of Nand P-deficient MIS may be required to dilute abundant dissolved nutrients even though MIS may also contain unwanted substances. The later situation was the case in the Neuse River, North Carolina, where dissolved inorganic nutrient concentrations were very high (approximately 200 ug ·L-1
) and readily reduced with additions of MIS (Paerl and Bowles 1987). Following another approach, Dodds and Randel (1992) used chemical treatments (alum, zeolite) to remove high concentrations of dissolved inorganic nutrients from lake water.
P limitation of freshwater phytoplankton has been demon-
Can. 1. Fish. Aquat. Sci., Vol. 50. /993
strated in a variety of environments, suggesting that N limitation is less common. N limitation may be more prevalent in marine systems (Hecky and Kilham 1988; Vitousek and Howarth 1991). However, recent work in subtropical and tropical lakes indicates that N limitation of phytoplankton may be more frequent than previously thought, particularly in productive lakes like Lake Apopka (Henry et al. 1985; Agusti et al. 1990). Moreover, reanalysis of experiments on temperate lakes suggests that N limitation and N + P limitation are more prevalent than P limitation (Elser et al. 1990), and N utilization can be an indicator of the severity of eutrophication (Schelske 1975). Our results support the hypothesis that N limitation is a consistent feature in some freshwater systems, particularly eutrophic to hypereutrophic lakes.
The nutrient status of productive freshwater lakes, like Lake Apopka, may be similar to some estuarine habitats. Like many estuaries (e.g., Howarth 1988), Lake Apopka is consistently N limited as determined from 20 bioassay experiments conducted over an 18-mo period (Aldridge et al. 1993). DIN (including both NOz-N + NOrN and NH4-N) to SRP molar ratios are low (average ratio II: I, n = 7) relative to the Redfield (1958) N:P molar ratio of 16, and large concentrations of DON and DOP are common (see Table 3). Also, nutrient loads to the lake are low in N relative to P compared with the Redfield ratio (4: 1,Lowe et al. 1989). These patterns are commonly observed in estuarine environments (Boynton et al. 1980).
Predicted Changes in Algal Yield with P Loading
Relationships between algal biomass and TP loads have long been used to assess the nature of lake eutrophication (Vollenweider 1968).:Reductions in P loading should result in lower algal biomass provided the algae are growth limited by P at some point (Tilman 1982). However, this relationship may be complicated. For example, luxury P uptake and storage by the phytoplankton commonly occurs when P loads are excessive (e.g., Lean and Pick 1981; Schelske and Sicko-Goad 1990), at which point the phytoplankton may become growth limited by other substances, thus decoupling the relationship between P loads and algal biomass.
This decoupling appears to be the case in Lake Apopka, where P loads are high relative to N (average TP > 100 Ilg'L-I, see Table 3). A large portion of the'I'Pis stored within phytoplankton cells as readily soluble polyphosphates (24% of PP, n = 3) and very little P is present in a soluble reactive form (average SRP 2.8%, n = 7). Consequently, the phytoplankton in Lake Apopka are not currently growth limited by P; however, they do become more P limited with increasing dilution (see Fig. 6). .
The slope of the regression (k) between TP and Chi a yields derived from our experiments has predictive value in determining the degree of P overloading in this and other ecosystems. Our experiments were designed to determine the change in algal yield (in vivo fluorescence units (FU); dependent variable) expected per unit increase in TP (independent variable), as expressed by the slope of this regression. The average slope from our N addition experiments was 0.129 FU·(Tp·L-1t1 (coefficient of variation 30.2%), given the range of concentrations tested. This indicates that currently in Lake Apopka, a I ug- L- 1
change in ChI a concentration would require a reduction in TP of approximately 8Ilg'L-1 .
The relationship between TP and summer ChI a concentrations for some temperate lakes yields a slope of nearly I (Dillon and Rigler 1974; Jones and Bachmann 1976); however, a slope <I in
4000
3000
-..I
...J
2000
1000
C> :l.-c: 0 -e ro U
0
4000
3000
2000
1000
0
A. Control
0 Chrysophyta
II Cyanobacteria
Bacillariophyta•
0% 25% 50% 75%
2216

5000 ...---------------, 5000 ...---------------..., C. Control, MISA. Control, FLW
4000 4000
o Chrysophyta
3000 III Cyanobacteria 3000 • Baclllariophyta
2000 2000
.-10001000~
o o 0% 60% 80% 90% 95%
c: 5000 ...----------------, 5000 -r---------------....,o D. N+P, MIS B. N+P, FLW -e
C'lS 4000 4000(J
3000 3000
2000 2000
1000 1000
o o 0% 60% 80% 90% 95% 0% 60% 80% 90% 95%
% Diluent Added FIG. 5. Phytoplankton community composition and biomass (as C) for nutrient dilution bioassays conducted on 4 November. Average biomass values were derived from microscopic cell counts taken from duplicate bottles receiving one of two nutrient treatments (control and N + P) at five dilution levels (0,60,80,90, and 95%). The two diluents were FLW and MIS.
TABLE5. Summary of linear regression analyses assessing the relationship between the maximum yield measured with in vivo fluorescence (relative units from the N addition treatment) and TP (ug-L-I) for five nutrient dilution experiments (variable biomass). In addition, regression analyses evaluating the relationship between maximum algal yield and percent MIS added were conducted on one date (constant biomass). All experiments were performed on surface phytoplankton communities collected from Lake Apopka.
0% 60% 80% 90% 95%
Diluent Date y-intercept Slope n Prob
DHzO FLW
MIS
MIS
9 Jan 23 Jan. 6 Feb. 4 Nov. 4 Nov.
26 June 26 June"
1.20 0.85 2.49 0.42 1.33
0.98 14.37
Variable biomass
0.087 6 0.131 6 0.182 5 0.097 8 0.150 8
Constant biomass
0.290 8 0.288 8
0.42 0.86 0.78 0.79 0.86
0.89 0.83
0.200 0.005 0.050 0.002 0.001
0.001 0.005
aRelationship based on extracted Chi a (ug-L-I).
the TP - Chi a relationship among lakes is not uncommon (Forsberg and Ryding 1980; Canfield 1983). Both of the later studies observed nonlinearity in the relationship at high TP concentrations (> 100 ug- L-I ) that accounted for lower slopes, while the studies by Dillon and Rigler (1974) and Jones and Bachmann (1976) had fewer samples from lakes of greater trophic state. If TP concentrations in Lake Apopka were reduced by 30-60% as suggested by our experiments (range 5090 ug-L" ), correspondingly, Lake Apopka would fall onto the linear portion of this empirical TP - Chi a relationship.
Can. J. Fish. Aquat. Sci., Vol. 50. /993
Our data offer experimental evidence to suggest that N limitation can explain some of the discrepancy in TP - Chi a relationship for Lake Apopka. Such departures or nonlinearity are cited as evidence that phytoplankton biomass is limited by substances other than P, most likely N or light (Canfield 1983). The slope of the TP - Chi a relationships derived from our experiments (k =0.1291lg Chl-ug TP-') was only comparable with the empirical data collected by Canfield from 165 Florida lakes (k = 1.80 ug Chl-ug TP-') when lake water was enriched with N. The studies of Aldridge et al. (1993) also indicate that
2217

TABLE 6. Average (SD) concentrations of P (as SRP and TP) and N (DIN as N02-N + N03-N and TN) for three diluents used in nutrient dilution experiments. These values are compared with values for RLW collected (0.3 m) on 4 November from Lake Apopka. Estimates were derived from duplicate water samples.
SRP TP DIN TN Diluent (~g'L-I) (~g-L-I) (~g-L-I) (~g'L-I)
DH20 0.0 0.0 0.0 0 FLW 1.8 (0.7) 7.2 (0.0) 0.6 (0.1) 1295 (29.7) MIS 1.4 (0.2) 5.9(0.6) 0.9 (0.9) 23 (26.9)
Lake 2.0 (0.4) 105.8 (3.4) 0.8 (0.7) 3136 (128.7)
TABLE 7. Average P uptake rates (~g P'~g Chl-I'd- I) by Lake Apopka phytoplankton exposed to four nutrient treatments and diluted with various quantities of FLW. Uptake estimates were derived from duplicate water bottles containing lake water collected on 4 November and incubated for 24 h. Extracted ChI a values were measured at the outset of the experiment.
Chla %RLW (~g'L-l)
5 4.44 10 8.49 20 16.81 40 31.42
100 91.12
phytoplankton growth in Lake Apopka is N limited. Further algal growth following additions of MIS in our experiments suggests that other elements (in addition to N) enhance algal growth or dilute some inhibitory substance that retards growth.
This is not to discount the potential importance of light in turbid systems. Light can compensate the response of phytoplankton to nutrients, particularly at levels below light saturation (Rhee and Gotham 1981; Fahnenstiel et a!. 1984). Because a significant portion of the shallow water column (mean depth 1.7m) in lake Apopka received < I% surface irradiance (approximately 33%) due to the turbid nature of the water, it is likely that phytoplankton yield is diminished to some extent by low light. These dynamics could also account for disparities in the nutrient - CWa relationshipin shallow,turbidsystemslikeLake Apopka.
Factors Influencing Nutrient Dilution Bioassays
Several factors can influence the results derived from nutrient dilution bioassays, in addition to those evaluated when the method was first presented (Paerl and Bowles 1987). We found that factors such as bottle containment, Nand P contamination of the diluents, and the occurrence and growth of cells in the prepared particle-free diluents did not significantly influence our results, although these factors can be important (Li 1986, 1990). Nonetheless, we feel such checks are important when using this bioassay procedure, especially because factors like containment can affect specific planktonic species (Carrick et a!. 1992) or are manifest in a manner that is temporally variable (Fahnenstiel and Scavia 1987).
Several experimental artifacts appeared to influence our results and thus temper our interpretation of them. The phytoplankton response to nutrient enrichment was not always similar among the three diluents. MIS promoted higher phytoplankton yields and changes in community composition compared with
Nutrient treatment
Control N P N+P~
0.04 0.10 0.02 0.01 0.01
0.04 0.1 I 0.01 0.02
-0.01
7.16 4.08 2.10 1.13 0.35
7.08 4.02 2.10 I.l3 0.37
the FLW diluent. This observation was confirmed in the constant biomass experiment (26 June), where algal yield was measured as a function of increasing percent MIS (see Table 5).
The stimulatory effects associated with large additions of MIS might be explained in one of several ways. Important trace elements or other micronutrients can be present in manufactured chemicals and might have been present in the analytical, reagent-grade chemicals from which we constructed MIS. If so, we inadvertently added such substances to our experimental bottles, particularly elements like Si which have been identified as common contaminants (e.g., Carrick and Lowe 1988). The presence of Si in MIS might account for the additional growth of diatoms and chrysophytes we observed. Removal of natural chelates (present as dissolved or particulate material) with additions of MIS might have increased the availability of other micronutrients that otherwise would have been unavailable. While we added more MIS to some treatments compared with the work of Paerl and Bowles (1987), we did observe changes in algal growth and composition at relatively low additions as well (25-95%). At any rate, alterations in the supply rate of nutrients or trace elements, resulting from dilution, could influence algal growth and composition (e.g., Kilham and Kilham 1984).
Inhibitory substances in Lake Apopka water might have been diluted with the addition of MIS and not FLW.Given that phytoplankton biomass in Lake Apopka is dominated by cyanobacteria (Carrick et a!. 1993), the lake may behave like some other systems where alleopaths produced by the cyanobacteria can suppress other phytoplankton groups, particularly diatoms (Keating 1978). The dramatic shift from cyanobacteria to diatom dominance following dilution with MIS supports this notion because additions of MIS would dilute any inhibitory chemicals present in Lake Apopka water. Regardless, confounding factors such as those reviewed above need to be considered in future studies.
Can. J. Fish. Aquat. Sci.. Vol. 50. 1993 2218

••
••
8~---------------'• A. P Addition• 6
..... I
"C
..... '",I 2 ,:i: U Cl 0 • ~ 40 80 120 160
8
6
4
2
0
• • B. N+P Addition
• •
••, • •
8-r------------..........-----. C. P Addition
6
4
2 y = 0.15 + 0.90x r2 = 0.99
0-t-..........--r--r---,--.-,.-....,....--r-.....--4
2 4 6 8 10o
8~----------~--,
6
4
2
O+--.---r----,r--r--.--,---.-,--r--!
y = 0.15 + 0.89x r2 = 0.99
D. N+P Addition
o 2 4 6 8 10
Corrected TP Conen. (~g P ~ ~g Chi !-1)
40 80 120 160
TP Conen. (~g . L-1) FIG. 6. (A and B) Average P uptake rates versus TP concentrations and (C and D) linear relationship between P uptake rates and corrected TP concentrations (relativized to Chi a). Lake Apopka phytoplankton were obtained from nutrient dilution bioassays conducted on 4 November. Uptake estimates were derived from duplicate water bottles receiving one of two nutrient treatments (P and N + P) at five dilution levels (0, 60,80,90,95%) with FLW.
The question of why phytoplankton become more P limited with dilution (or why the degree of N limitation is relaxed with dilution) is difficult to answer. Because we added the same dose of nutrients to experimental bottles, the concentration of added nutrients per unit phytoplankton biomass changed along our dilution series, although the N:P ratio did not. This meant that the quantity of added soluble inorganic N or P encountered by the phytoplankton at 95% FLW dilution was approximately 20-fold higher than that available to undiluted phytoplankton. The pattern of increasing P uptake rates by phytoplankton with dilution appears to be analogous to experiments designed to determine uptake kinetics by exposing phytoplankton to increasing concentrations of nutrients (e.g., Dugdale 1967). Instead of adding greater concentrations of nutrients, we have reduced the biomass of phytoplankton; hence, a characteristic hyperbolic relationship exists between the corrected P concentration added to our bottles and phytoplankton growth (Monod 1950).
Associated changes in algal yield expressed as a function of TP can be complex because manipulated TP concentrations covary with other physical and biological parameters. For example, the design of our experiments is similar to that utilized to estimate microzooplankton grazing (Landry and Hassett 1982). In Landry and Hassett's experiments, increasing lake water dilution relieves grazing pressure, such that regressing the growth rate of phytoplankton prey (dependent variable) onto the
Can. J. Fish. Aquat. Sci., Vol. 50. 1993
corresponding dilution treatment (independent variable) yields estimates of microzooplankton grazing loss (slope) and the intrinsic growth rate of the prey (y-intercept). Despite this, interference due to microzooplankton grazing did not appear to be a significant factor in our experiments. Algal growth in control and P treatments was influenced only to a limited extent by microzooplankton grazing, whereby derived loss rates were low (average slope ± SD: -0.0011 ± O.OOOI·d- l ) relative to growth (average y-intercept ± SD; 0.072 ±0.007 -d'). More importantly, estimates of algal growth in the N-enriched treatments (range 0.I-OA·d-1
) were greater by more than two orders of magnitude than losses attributable to microzooplankton grazing. While errors in the algal yield versus TP relationship were not attributable to microzooplankton here, the importance of this factor cannot be neglected, particularly because the relative importance of microzooplankton grazing varies with changing food web structure (e.g., Pace and Funke 1991).
Application of Dilution Bioassays
The application of nutrient dilution experiments to the study of phytoplankton nutrient limitation in eutrophic waters, like Lake Apopka, is important for several reasons. First, the large magnitude of nutrients incorporated into algal biomass can be indicative of the degree of high nutrient loading that exists. Such a condition is difficult to evaluate using classical approaches which assess relationships between phytoplankton biomass and
2219

P loading (e.g., Jones and Bachmann 1976). Second, assessment of phytoplankton nutrient status along a series of lake water dilutions can be utilized for predictive purposes, utilizing FLW to dilute particulate nutrients or MIS to reduce dissolved nutrients. Third, this type of experimentation can offer independent validation for target nutrient reduction plans required to alleviate the cultural eutrophication of marine and fresh waters. A wetland was constructed adjacent tv Lake Apopka in an effort to reduce annual TP loads by 30% (Lowe et al. 1992), while target management plans for eutrophic Lake Okeechobee, Florida, are currently set at 40% reduction in P loading (Federico et al. 1981) by employing best management practices to the agriculture surrounding the lake. Nutrient dilution experiments could be applied to evaluate such nutrient reduction practices, with recognition of the methodological constraints inherent to these experiments. Because Lake Apopka has high P loads and much of these are stored as intracel1ular poly phosphate by the phytoplankton (24% of PP), reduction of lake water particles is at least conceptually a reasonable management approach.
We evaluated some inherent features of nutrient dilution. experiments. Some of these factors influenced our results and need to be considered prior to the application of this method. Such factors include (1) potential biases related to the diluents used, (2) the amount of nutrient added In the bioassays relative to variation in phytoplankton biomass imposed by dilution, and (3) impact of microzooplankton grazing losses.
Acknowledgments
We thankT.Habib,J. Kahn,M. Love, and A. Peplowfor theirassistance. N. Aumen,R. Fulton, S. Newman,and J. VanArman reviewedan earlier versionof the manuscript.Criticismsby H. Paeri and ananonymous reviewer were most appreciated. This work was supportedby a. contract from the SL Johns River Water Management District and funding from the Carl S. Swisher Endowment, University of Florida Foundation, Inc., both to C.L.S.
References
AGUSTI, S., C.M. DUARTE, AND D.E. CANFIELD, JR. 1990. Phytoplankton abundance in Florida lakes: evidence for frequent lack of nutrient limitation. Limnol. Oceanogr. 35: 181-188.
ALDRIDGE, F.J., CL, SCHELSKE, AND H.I. CARRICK. 1993. Nutrient limitation in a hypereutrophic lake in Florida. Arch. Hydrobiol. 127: 21-37.
BEAVER, I.R., TL CRISMAN, AND I.S. BAYS. 1981. Thermal regimes of Florida lakes. Hydrobiologia 83: 267-273. .
BOYNTON, W.R., W.M. KEMP, AND c.o. OSBORNE. 1980. Nutrient fluxes across the. sediment-water interface in turbid zone of a coastal plain estuary, p. 93-109. In V.S. Kennedy [ed.jEstuarine perspectives. Academic Press, New York, N.Y.
BREZONlK, PL., CD. POLLMAN, T.L. CRISMAN, J.N. ALLINSON, AND J,N. Fox. 1978. Limnological studies on lake Apopka and the Oklawahachain oflakes in 1977. Fla. Dep. Environ. Regul. Rep. No. ~NV-07-78-01.
BROWN, R.B., E.L. STONE, AND V.W. CARLtSLE. 1990. Soils, p. 35-69. In R.L. Meyers and J.J. Ewe! [ed.] Ecosystems of Florida. University of Central Florida Press, Orlando, Fla.
CANFIELD, D.E. JR. 1983. Prediction of chlorophyll a concentrations in Florida lakes: the importance of phosphorus and nitrogen. WaterResour. Bull. 19: 255-262.
CANFIELD, D.E. JR., E. PHLIPS, ANDe.M. DUARTE. 1989. Factors influencing the abundance of blue-green algae in Florida lakes. Can. J. Fish. Aquat. Sci. 46: 1232-1237.
CARRICK, H.1., F.1. ALDRIDGE, AND c.i, SCHELSKE. 1993. Wind influences phytoplankton biomass and composition in a shallow productive lake. Limnol. Oceanogr. 38: 1179-1192.
CARRICK, H.J., G.L. FAHNENSTtEL, AND W.D. TAYLOR. 1992. Growth and production of planktonic protozoa in Lake Michigan: in situ versus in vitro comparisons and importance to food web dynamics. Limnol. Oceanogr. 37: 1221-1235. .
CARRICK, H.J., AND R.L. LOWE. 1988. Response of Lake Michigan benthic algae to in situ enrichment with Si, Niand P. Can. J. Fish. Aquat. Sci. 45: 271-279.
DAVIS, e.0., AND M.S. SIMMONS. ! 979. Water chemistry and phytoplankton field and laboratory procedures. Great Lakes Res. Div. Spec. Rep. No. 70. University of Michigan, Ann Arbor, Mich. 100 p.
DEEVEY, E.D. JR. 1988. Estimation of downward leakage from Florida lakes. Limnol. Oceanogr. 33: 1308-1320.
DILLON, P.l.. AND F.H. RIGLER. 1974. The phosphorus--chlorophyll relationship in lakes. Limnol. Oceanogr. 19: 767-773.
DODDS, W.K., AND e. RANDEL. 1992. Field assessment of nutrient removal on phytoplankton productivity and biomass. J. Freshwater Ecol. 7: 283-292.
DUGDALE, R.e. 1967. Nutrient limitation in the sea: dynamics, identification, and significance. Limnol. Oceanogr. 12: 685-695.
ELSER, J.1., E.R. MARZOLF, ANDe.R. GOLDMAN. 1990. Phosphorus and nitrogen limitation of phytoplankton growth in the fresh waters of North America: a review and critique of experimental enrichments. Can. J. Fish. Aquat. Sci. 47: 1468-1477.
FAHNENSTIEL. GL, AND H.J. CARRICK. 1992. Phototrophic picoplankton in Lakes Huron and Michigan: abundance, distribution, composition, and contribution to biomass and production. Can. J. Fish. Aquat. Sci. 49: 379-388.
FAHNENSTIEL, G.L., AND D. SCAVIA. 1987. Dynamics of Lake Michigan phytoplankton: primary production and growth. Can, J. Fish. Aquat. Sci. 44: 499-508.
FAHNENSTIEL, G.L., D. SCAVIA, AND c.L. SCHELSKE. 1984. Nutrient-tight interactions in the Lake Michigan subsurface chlorophyll layer. Verh. lnt. Vcr. Limnol. 22: 440-444.
FEDERICO, A.e., K.G. DICKMAN, CR. KRATZER, AND F.E, DAVIS, 1981. Lake Okeechobee water quality studies and eutrophication assessment. South Fla. Water Manage. Dist. Tech. Publ. 81-2.
FITZGERALD, G.P., AND T.e. NELSON. 1966, Extractive and enzymatic analyses for limiting or surplus phosphorus in algae. J. Phycol. 2: 32-37.
FORSBERG, C, AND S.O. RYDING. 1980. Eutrophication parameters and trophic state indices in 30 Swedish waste-receiving lakes. Arch. Hydrobiol. 88: 189-207.
HEALEY, F.P. 1979. Short-term responses of nutrient-deficient algae to nutrient addition. L'Phycol. 15: 289-299.
HEALEY, F.P., AND L.L. HENDZEI.. 1980, Physiological indicators of nutrient deficiency in lake phytoplankton. Can. J. Fish. Aquat, Sci. 37: 442-453.
HECKY, R.E., AND P. KILHAM. 1988. Nutrient limitation of phytoplankton in freshwater and marine environments: a review of recent evidence on the effects of enrichment. Limnol. Oceanogr. 33: 796-822.
HENRY, R., K. HINO. J.G. TUNDlSI, AND J,S.B. RIBEIRO. 1985. Responses ofphytoplankton in Lake Jacaretinga to enrichment with nitrogen and phosphorus in concentrations similar to those of the River Solimoes. Arch. Hydrobiol. 103: 453-477.
HOWARTH, R.W. 1988. Nutrient limitation of net primary production in marine ecosystems. Annu. Rev. Ecol. Syst. 19: 89-110.
JONES, J.R., AND R.W, BACHMANN. 1976. Prediction of phosphorus and chlorophyll levels in lakes. J. Water Pollut. Control Fed 48: 2176-2182.
KEATING, K.I. 1978. Blue-green algal inhibition of diatom growth: transition from mesotrophic to eutrophic community structure. Science (Wash., D.e.) 199: 971-973.
KiLHAM, S.S., AND P. KILHAM. 1984;. The importance of supply rate in determining the phytoplankton community structure, p. 7-27. In Trophic interactions within aquatic systems. Am. Assoc. Adv. Sci. Symp. 85.
KRATZER, C.R., AND P.L. BREZONIK. 1981. A Carlson-type trophic index for nitrogen in Florida lakes. Water Resour, Bull. 17: 713-715.
LANDRY, M,R., AND R.P. HASSETT. 1982. Estimating the grazing impact of marine micro-zooplankton. Mar. BioI. 47: 283-288.
LAWS, E.1. ET AI.. 1984. High phytoplankton growth and production rates in oligotrophic Hawaiian coastal waters. Limnol. Oceanogr. 29: 1161-1169.
LEAN, D.R.S., AND F.R. PICK. 1981. Photosynthetic response of lake plankton to nutrient enrichment: a test for nutrient limitation. Limno!. Oceanogr. 26: 1001-1019.
LEWIS, W.M.,JR.1987. Tropical limnology. Annu, Rev. Eco!. Syst. [8: 159-184. LI, W.K.W. 1986. Experimental approaches to field measurements: methods and
interpretations, p. 25!-286.In T. Platt and W.K.W. Li [ed.] Photosynthetic picoplankton. Can. Bull. Fish. Aquat. Sci. 214.
Lt, W.K.W. 1990. Particles in "particle free" seawater: growth of ultraphytoplankton and implications for dilution experiments. Can. J. Fish, Aquat, Sci. 47: 1258-1268.
LOEHR, R.e., e.S. MARTIN, AND W, RAST [ED,] 1980. Phosphorus management strategies for lakes, Ann Arbor Science Publishers, Ann Arbor, Mich. 490 p.
Call, J. Fish. Aquat. sci, Vol. 50, 1993 2220

LOWE. E.F.• L.E. BATIOE, D.L. STITES, AND M.F. COVENEY. 1992. Particulate phosphorus removal via wetland filtration: an examination of the potential for hypertrophic lake restoration. Environ. Manage. 6: 67-74.
LOWE, E.F .•D.L. STITES. AND L.E. BATIOE. 1989. Potential role of marsh creation in the restoration of hypereutrophic lakes. p. 710-717. In D.A. Hammer [ed.] Constructed wetlands for wastewater treatment. Lewis Publishers. Chelsea. Mich.
MONOD. J. 1950. Recherches sur la croissance des cultures bacteriennes, Hermann. Paris. France. 210 p.
NEWMAN. S. 1991. Bioavailability of organic phosphorus in a shallow hypereutrophic lake. Ph.D. thesis, University of Florida. Gainesville, Fla. 180 p.
OSGOOD. R.A, 1982. A Carlson-type trophic state index for nitrogen in Florida lakes. Water Resour. Bull. 18: 343.
PACE. M.L., AND E. FUNKE. 1991. Regulation of planktonic microbial communities by nutrients and herbivores. Ecology 72: 904-914.
PAERL, H.W., AND N.D. BOWLES. 1987. Dilution bioassays: their application to assessments of nutrient limitation in hypereutrophic waters. Hydrobiologia 146: 265-273.
PATRICK, R" AND CR. REIMER. 1966. Diatoms of the United States. Vol. I. Academy of Natural Sciences of Philadelphia, Philadelphia, Penn. 688 p.
PATRICK, R.• AND CR. REIMER. 1975. Diatoms of the United States, Vol. II. Academy of Natural Sciences of Philadelphia. Philadelphia, Penn. 213 p.
PRESCOTI, G.W. 1973. Algae of the western Great Lakes area. 5th ed. WM. C. Brown, Dubuque, Iowa. 977 p.
REDDY. K.R., AND D.A GRAETZ. 1991. Internal nutrient budget for Lake Apopka. Spec. Pub I. SJ91-SP6, St. Johns River Water Management District, Palatka, Fla. 430 p.
REDFIELD, AC.. 1958. The biological control of chemical factors in the environment. Am. Sci. 46: 205-222.
RHEE, G.Y., AND LJ. GOTHAM. 1981. The effects of environmental factors on phytoplankton growth: light and the interactions of light with nitrate limitation. Limnol. Oceanogr. 26: 649-659.
RIPPKA, R 1. DERUELLES, J.B. WATERBURY, M. HERDMAN, AND R.Y. STANIER. 1979. Generic assignments, strain histories and properties of pure cultures of Cyanobacteria. J. Gen. Microbiol. III: 1-61.
ROUND. F.E., R.M. CRAWFORD, AND D.G. MANN. 1990. The diatoms. Cambridge University Press, Cambridge, England. 747 p.
SCHELSKE, c.L. 1975. Silica and nitrate depletion as related to rate of eutrophication in Lakes Michigan, Huron, and Superior, p. 277-298. In A.D. Hasler [ed.] Ecological studies. Vol. 10. Springer-Verlag. New York, N.¥.
SCHELSKE, C.L. [984. In situ and natural phytoplankton assemblage bioassays, p. 15-47. In L.E. Shubert [ed.] Algae as ecological indicators. Academic Press. London, England.
SCHELSKE, c.L. 1989. Assessment of nutrient effects and nutrient limitation in Lake Okeechobee. Water Resour, Bull. 25: 1119-1130.
SCHELSKE, C.L., F.J. ALDRIDGE, AND H.J. CARRICK. 1992. Phytoplankton-nutrient interactions in Lake Apopka. Spec. Pub\. SJ92-SP-9. St. Johns River Water Management District. Palatka, Fla. 181 p.
SCHELSKE. C.L.. AND L. SICKo-GOAD. 1990. Effects of cheJated trace metals on phosphorus uptake and storage in natural assemblages of Lake Michigan phytoplankton. J. Great Lakes Res. 16: 82-89.
SCHINDLER, D.S., AND E.J. FEE. 1974. Experimental lakes area: whole lake experiments in eutrophication. 1. Fish. Res. Board Can. 31: 937-953.
SHOAF, W.T., AND B.W. LiUM. 1976. Improved extraction of chlorophyll a and b from algae using dimethyl sulfoxide. Limnol. Oceanogr. 21: 926-928.
STOCKNER, J.G., M.E. KLUG, AND W.P. COCHLAN. 1990. Leaky filters: a warning to aquatic ecologists. Can. J. Fish. Aquae Sci. 47: 16-43.
STRATHMANN, R.R. 1967. Estimating the organic carbon content of phytoplankton from cell volume or plasma volume. Limnol. Oceanogr. 12: 411-418.
TILMAN, D. 1982. Resource competition and community structure. Princeton University Press. Princeton. N.J. 296 p.
TSUJI, T .• K. OHKI. AND Y. FUJITA. 1986. Determination of photosynthetic pigmentcomposition in an individual phytoplankton cell in seas and lakes using fluorescent microscopy; properties of the fluorescence emitted from picophytoplankton cells. Mar. BioI. 93: 343-349.
VINCENT, W.F. 1979. Mechanisms of rapid photosynthetic adaptation in natural phytoplankton communities. I. Redistribution of excitation energy between photosystems I and II. J. Phycol. 15: 429-434.
VINCENT, W.F. 1981a. Rapid physiological assays for nutrient demand by. the plankton. I. Nitrogen. J. Plankton Res. 3: 685-697.
VINCENT, W.F. 1981b. Rapid physiological assays for nutrient demand by the plankton. II. Phosphorus. J. Plankton Res. 3: 699-710.
VITOUSEK, P.M., AND R.W. HOWARTH. 1991. Nitrogen limitation on land and in the sea: how can it occur? Biogeochemistry 13: 87-115. '
VOLLENWEIDER, R.A. 1968. Scientific fundamentals of the eutrophication of lakes and flowing waters, with 'particular reference to nitrogen and phosphorus as factors in eutrophication. Tech. Rep. DAS/CSI/68.27. Organ. Econ. Coop. Dev., Paris; France.
ZAR,J.H. 1983. Biostatistical analyses. 2nd ed. Prentice-Hall. Englewood Cliffs, N.J. 718 p.
Can. J. Fish. Aquat. Sci., Vol. 50. 1993 2221