
Primary production under nutrient limitation affects larval fish condition
Upload
khangminh22Category
view
1download
0
UNCLASSIFIED
AD NUMBER
AD152573
NEW LIMITATION CHANGE
TOApproved for public release, distributionunlimited
FROMDistribution authorized to U.S. Gov't.agencies and their contractors;Administrative/Operational Use; Jul 1958.Other requests shall be referred toDirector, Air Force Cambridge ResearchCenter, Bedford, MA.
AUTHORITY
AFCRC Notice, 26 Sep 1985
THIS PAGE IS UNCLASSIFIED

NCLASSIFIED
DEFENSE DOCUMENTATI!ON CENTERFOR
SCIENTIFIC' AND TECHNICAL INFORMATION
'AMEROW 3ATION ,U:cXAiRIA. VIRGINIA
N lLASSI fIED

NOTICE: When government or other drawingr., rpeca,.fLications or other data are used for any i poseother than in connection with a definltely ;!,alatadgovernment procurement operation, the U. SGovernment thereby incurs no respon-ibilit., nor anyobligation whatsoever; and the fact that t Jovern-ment may have formulated, furnished, or iz any waysupplied the said drawings, specifictionis, vr otherdata is not to be regarded by implication )r other-wise as in any mazinmr licensing the holder ),r anyother person or corporation, or conveying uiiy rightsor permission to manufacture, ume or sell Ir.,patented invention that may in mny way be ,,it.isdthereto.
9;

APCRC-TR-5V--23t vj'ASTiA Document f! 44152573
r,.OPHYSICAL RESEA.RCH PAPERS
No. 59
PROJ 1 ,T PRAIRIE GRAS A FL IPVRCIRAMI
EPITEf) BYmokR010N t
JULY ?q.)
GEOPHYSICS RESEARCH DIRECTORATEAIR FORCE CAMBRIDGE RESEARCH CENTER
AIR RESEARCH AND DEVELOPMENT COMMANDUNITED STATES AIR FORCE
m BEDFORD, MASSACHUSETTS
I . tM. -

REPRODUCTION QUALITY NOTICE
This document is the best quality available. The copy furnished
to DTIC contained pages that may have the following qualityproblems:
* Pages smaller or larger than normal.
* Pages with background color or light colored printing.
* Pages with small type or poor printing; and or
* Pages with continuous tone material or colorphotographs.
Due to various output media available these conditions may ormay not cause poor legibility in the microfiche or hardcopy outputyou receive.
E lf this block is checked, the copy furnished to DTICcontained pages with color printing, that when reproduced inBlack and White, may change detail of the original copy.

AFCRC-TR-58-235(II)ASTIA Document No. AD 152573
GEOPHYSICAL RESEARCH PAPEi.S
Ne. 59
PROJ ECT P-,A [I k C f \ 5.
A FI.ELI)'PC.;,OGAN! IN DIFFUSION
dited by
%1O.il .N !.. tr\ .A i)
July 1958
Project 7657
Atmospheric Analysis LaboratoryGEOPHYSICS RESEARCH DIRECTORATF
AIR FORCE CAMBPIDGE RESEARCH CENTERAIR RESEARCH AND DEVELOPMENT COMMAN D
UNITED STATES AIR FORCEBedford, Mass.

ABSTRACT
Project Prairie Grass was a field program designed to pro.-
vide experimental data on the diffusion of a tracer gas over a
range of 800 mo In each of 70 experiments the gas was
released continuously for 10 minO at a source located near
ground level. The gas releases were made over a flat prairie
in Nebraska under a variety of meteorological conditions during
July and August of 1956..
- .n::twa v;lume.s inekW",a brief history
of the p'toject detailed descriptions of the tracer technique and
the meteorological equipment employed in the field program.
Tabulations of the diffusion data and the meteorological data
collected durig the gas releases are alsu presented. In addition,
t-a-paper w, nits data,.on the heat budget at the air-earth inter-
face during other selected periods during the dummer of 1956.
iii

CONTENTS
VOLUMEII
Chapter Page
7. Instrumentation Used by the Texas A&MGroup 1
8, Micrometcorological Data Collected byTexas A&M 539. Evaluation of the Fluxes of Sensible and
Latent Heat from Measurements ofWind, Temperature, and Dew Point 97Profiles
10. Heat Budget Determinations Made by theUniversity of Wisconsin Group 12411. Optical Measurements of Lapse Rate 128
12. Rawinsonde Data 13e13. Airplane Observation Data 174
V

ILLUSTRATIONS
Figure Page
7.1 Topography of Field Site and Layout of Equipment 2
7.2 The Micrometcorological Station (Texas A&M) 3
7.3 Vertical Distribution of the Sensing Elements 57.4 Instrument Trailer Interior 6
7.5 Instrument Trailer Interior 7
7.6 Calibrated D-C Voltage Source 9
7.7 Temperature Measuring System 97.8 Shielded Thermocouple Assembly 117.9 Soil Temperature Thermocouple Elements 13
7.10 Installation of Soil Temperature Elements 15
7.11 Thermocouple Amplifier 17
7.12 Reference Temperature Compensator 197.13 Thermocouple Wire Calibrating Circuit 19
7.14 Calibrating Circuit 217.15 Amplifier Calibrating Circuit 21
7.16 Twenty-Minute Profiles of Temperature and Po-tential Temperature for Conditions of NearlyAdiabatic Stratification, 6 August 1956, 1805 CST 25
7.17 Twenty-Minute Profiles of Temperature and
Potential Temperature for Conditions ofNearly Adiabatic Stratification, 7 August 1956,0305 CST 26
7.18 Twenty-Minute Profiles of Temperature andPotential Temperature for Conditions ofNearly Adiabatic Stratification, 8 August 1956,0205 CST 27
7.19 Twenty-Minute Profiles of Temperature andPotential Temperature for Conditions ofNearly Adiabatic Stratification, 8 August 19560805 CST 28
7.20 Twenty-Minute Profiles of Temperature andPotntial Temperature for Conditions ofNearly Adiabatic Stratification, 8 August 1956,1905 CST 29
vii

ILLUSTRATIONS (Continued)
Figure Page
7.21 'Twenty-Minute Profiles of Temperature andPotcntial Temperature for Conditions ofNearly Adiabatic Stratification, 9 August 1956,1705 CST 30
7.22 Temperature Profile, 6 August 1956, 1805 CST 337.23 Temperature Profile, 8 August 1956, 0205 CST 33
7.24 Mean Temperature Plus or Minus Its StandardError, 8 August 1956, 1505 CST 35
7.25 Air Sampling System 387.26 Dew Point Hygrometer 397.27 Air Saturating Chamber 42
7.28 Counting Circuit 467.29 View of flikoken Anemometers Installed at
Heights of 25, 50, and 100 cm. 49
7.30 Anemometer Calibration Curve 519.1 Distorted Area Pattern 100
9.2 Wind Profile Grid for Steady Flow of Air atConstant Temperature over AerodynamicallySmooth Surfaces 104
9.3 Net Radiation vs. Summation of Heat Fluxes,O'Neill, Nebraska, Summer of 1956.KM KH -KW 117
9.4 Net Radiation vs. Summation of Heat Fluxes,O'Neill, Nebraska, Summer of 1956.KM = KH = KW 119
11.1 Light Paths and Related Geometry 135
11.2 Optical Observation of A (DT/8z), O'Neill,Nebraska, 10-12 July 1956 136
11.3 Optical Temperature Profiles, O'Neill, Nebraska,10-12 July 1956 137
11.4 Time Series of A (a T/3z) at a Height of 12 cm,O'Neill, Nebraska, 2 August 1956 138
viii

TABLES
Number Page
7.1 Values of Standard Error of Mean PotentialTemperature 31
7.2 Statistical Measures of Temperature 34
8.1 Micrometeorological Data for Gas ReleaseTimes 54
8.2 Micrometeorological Data at Times other thanGas Release Time 66
8.3 Soil Moisture and Soil Density, O'Neill,Nebraska, 1956 96
9.1 Heat Budget Data Collected by the Texas A&MResearch Foundation (kilocalories/cm 2sec) 114
9.2 Heat Budget Data Collected by the Texas A&MRe-search Foundation (c.Jories/cm2min) 115
9.3 Percentage of Double-Level Values within10 Percent of Profile Values 122
9.4 Statistical Analysis of Heat Budget Balance 122
10.1 Heat Budget Data Collected by the Universityof Wisconsin 126
11.1 Values of A (8T/8z) Found by Optical Methods(10-12 July) 132
11,2 Values of A (OT/Oz) Found by Optical Methods(21,.23, 31 July) 133
11.3 Time Series of A (OT/8z) at Height of 12 cm 13412.1 Rawinsonde Data 140
13.1 Aircraft Observations 177
ix

CHAPTER 7INSTRUMENTATION USED BY T HE TEXAS A&M GROUP
R. L. Richman* and W. CoveyTexas A&M Research Foundation
7.1 The Mobile Micrometeorological Station
The mobile micrometeorological station of the Texas A&M group
was installed at the extreme west end of the observation line (Figure.
7.1). Figure 7.2 shows the relative locations of the component elementsof the station. The station consisted of (a) a slender aluminum pipemast supporting six memometers at heights of 8, 4, 2, 1, 0.5, and 0.25meters, (b) a similar mast supporting seven temperature measuring,
radiation shielded, copper-constantan thermocouple junctions at heightsof 8, 4, 2, it 0.5, 0.25, and 0.125 meters, (c) a similar mast supporting
seven polyethylene air sampling tubes at heights of 8, 4, 1, 0.5, 0.25, and0.125 meters, (d) a triangular sectiin, tubular steel, fold-over type tower
supporting at a height of 16 meters an air sampling tube, an anemometer,
a shielded thermocouple, a wind vane and a radioactive point collector,
(e) a U. S. Signal Corps instrument shelter housing maximum and mini-mum thermometers and a thermograph, (f) an 8-inch rain gauge and a
weighing type recording rain gauge, (g) a wind vane supported at a heightof 1 meter by an iron pipe stake, (h) a Gier and Dunkle net exchange radio-
meter supported at a height of 1 meter, (1) an inverted Eppley thermoelec-
trical pyrheliometer supported by an iron pipe standard at a height of 2
meters to receive reflected short-wave radiation, (j) an instrument trailerwhich housed indicating and recording apparatus, (k) an Eppley pyrhelio-
meter mounted on the roof of the trailer, (1) two differentially connectedshielded thermocouple measuring junctions supported by a pipe stake at
heights of 1/2 and 1 meter, and (m) six copper-constantan temperature
measuring junctions at depths of 3.125, 6.25, 12,5, 25, 50, and 100 cm in the
*Present affiliation: U. S. Navy Electronics Laboratory
tI

OPPORTUNITY aA -
Fx K
1980a
GAS SOURCE M
19 5
1985 --.----- ~NmK0
LEGEND
A-Mll HIUY E-TEXAS A &M HUT J-U OF WISCONSIN TRAILER
a-OUAO MiUT F -TEXAS A a M TRAILER K-AWS TRUCK
C-HEADQUARTERS OUT 6-MIT TRUCK L-LABORATORY 0
0-AWS RAWINSONDE ANTENNA Il-U OF WISCONSIN "UT MNO-UIT NUTS
Figure 7. 1 Topography of field site and layout of equipment

3t.
ww
o 412 w m
I~Ll
MWI-
zw
Z 0x0
0 w
w01 U) 7 z a
I.- wCD z
z w U)
I.- 49z
10 0 0Z

soil. Figure 7.3 illustrates the vertical distribution of the sensing ele-ments.
The instrument trailer was a 15-foot.house trailer shell, the interior
of which was designed to accommodate the recording and indicating equip-
ment associated with the exposed sensing elements. 5 Figures 7.4 and 7.5
illustrate the assignment of space in the trailer. The principal instruments
were (a) a Thornthwaite dew-point hygrometer and associated air sampling
apparatus, (b) a group of six recording milliammeters with modulated-
carrier-type d-c amplifiers for recording insolation, reflected short-wave
radiation, net radiation, temperature differences, wind direction, and
absolute temperatures, (c) a temperature indicating system with a switch
for selecting thermocouple measuring junctions, and (d) a counting system
for indicating the number of turns of the anemometers, that is, 'for record-
ing wind profiles. These instruments will be discussed individually and
described in detail. In addition, space was provided for computing and
plotting data, storing spare parts, anrd storing the sensing elements and
supporting structures during transit.
7.2 Observation Procedure
Most of the observatior:s were made during periods which centered
about five minutes after the hour Central Standard Time. The procedure
during such observations is listed below, A similar procedure was followed
for periods centered about other times.
1, Ten minutes before the hour: measurement of soil temperature
at 6 depths,
2. Five minutes before the hour: start of the anemometer counting
period; start of the air sampling period; start of the recording period for
insolatio, net radiation, reflected short-wave radiation, temperature
difference, and wind direction; start of the air temperature measurements.
(Eight measurements of air temperature, one at each height, were made
each minute for a 20-minute period.)3. Fifteen minutes after the hour: ending of observation period
which was started at five minutes before the hour.
4
--- i-.-..-..-"--J....--

WIND VANE ANEMOMETER
3ft
-Ja-__ oaO-- !----- %AIRITEMPERATURE
-J ELEMENT
I4
AIR SAMPLINGT UBE
PYRHELIOMETER
I51_ LII\ NET RADIOMETER
-325 TL-
- .0 31 25 ."
SOIL TEMPERATUREELEMENTS
Figure 7. 3 Vertical distribution of the sersing elements
5

ID ~0 4)
a o
UH 1101,4b. iO 4r tO tO s0*i2~tI ~.o O, 1414 0
93 '. A. -f4'~~~ 0fj
,.4®R_

Al
-~V H
0 K1 A
I 44
rN P. ---
P4 H HIF$ d Q 4 p b ~ .4 N d0 4-4)000t
r. 4 Cl- l444N ~ )qko r4
*040 S. m . 0 93O044 J0 .4r
0)0 ) ) to c) ~ 0P4 W~
X1 Z £4 Mu. Y

4. .Seventeen minutes after the hour: second measurement of soil
temperatures.
5. Twenty minutes after the hour: measurement of the dew-points
of the 8 air samples obtained during the air sampling period. (One sample
was obtained for each height.)
All data reported are average values for the observation period.
7,3 Individual Elements
7.3.1 Insolation Ilcoming short-wave radiation wits measured by an
Eppley pyrheliometer (Weather Bureau 10-junction type). The output of
the pyrheliometer was continuously recorded by a modulated-carrier-
type d-c amplifier (Figure 7.11) and an Esterline-Angus graphic ammeter.
The amplifier was equipped with a gain selector switch so that the re-
cording sensitivity could be changed. Three recording scales were thus(11-2 -1 o001clc -2 -1
provided, 0 to 0.025 cal (1 sec ) 0 to 0.01 cal cm sec , and 0 to-2 -10.0025 cal cm sec
The calibration factor for the pyrheliometer was determined by the
manufacturer and assumed to be correct. The amplifier and recorder
combined were calibrated by supplying an input voltage from a calibrated
voltage source. The voltage source had been calibrated by a Leeds and
Northrup potentiometer (Type K).The calibrated voltage source (Figure 7.G) is extremely stable and
was used in the field for periodic checks of the calibrations of 1he various
amplifier-recorder systems.7.3.2 Reflected Short-Wave Radiation Short-wave radiation reflected
by the surface was measured and recorded by a system which was identi-
cal to that used for insolation measurements. In measuring reflected
radiation, tho Eppley pyrheliometer was mounted at a height of 2 meters
and inverted so that this radiation was incident on the sensitive element.
The calibration of this system was determined in the same manner
as that of the insolation system.
7.3.3 Net Radiation A Beckman and Whitley thermal radiometer,
Model N188-1 (Gier and Dunkle net exchange radiometer), was used in
measuring the net radiation. 3 A continuous record of the net radiometer

H T_90__F Fi~re 76 Caibraed d- volag 990ur "
A 1^VVV&
___ *6
~Z2Z2J I , 9M0TER200X 'OK R
<M ---S ---RMEEG
JUNCTIONS COMPENSATOR
f I I
.1iA i -MREFERC
ZONE BOX COPR tI
-- - -- CONSI~A NT AN
Figure 7. 7 Temperature measuring system

output was obtained by means of an amplifier and recorder similar to
that used for Insolation measurements. Two recording scales were pro-vided; -0.00125 to +0.005 cal cm-2sec -. , and -0.005 to +0.02 cal m-2 sec 1.
The calibration of this system was determined in the same manneras that of the insolation system.
7.3,4 Air and Soil Temperature Profiles All temperature measure-ments were made by means of coppe~r-constantan thermocouples. The
temperature measuring system (Figure 7.7) consisted of (a) shielded air
temperature measuring junctions, (b) soil temperature measuring junc-tions, (c) measuring junction selector switches, (d) a modulated-carrier-
type d-c amplifier, (e) a milliammeter, (f) a reference temperature com-
pensator (calibrated microvolt source), (g) a constantan junction zone box,and (h) a reference junction. 2
A radiation-shielded thermocouple assembly is shown in Figure 7.8.
The shield consisted of four aluminum plates held together by small
screws and plastic spacers. "Alzak" aluminum 0.032 inches thick wasused for the shield plates because it is highly reflective in the portion of
the spectrum between 0.4 and 7.5 microns. The thermocouple junction
formed by No. 36 B&S gauge copper and constantan wire was positionedin the center space of the shield plate stack. The surfaces of the plates
faced toward the junction were coated with flat black paint so that heattransfer by radiation would assist in keeping the shield stack at air tem-
perature.The lead wires were No. 16 B&S gauge rubber-covered copper and
constantan in a twisted pair which was encased by a weather-proof neoprenecovering.
Hollow brass tubes formed the supporting arms for the shield assembly.The lead wires entered the base fitting and the copper lead was threadedthrough one arm and the constantan through the other. As shown in Figure
7.8, the ends of the No. 36 B&S gauge copper and constantan wires which
formed the junction were secured to the corresponding lead wires by meansof firm-fitting plastic sleeves.
10

I
.. .. .
I , #
III___
111

The thermocouple junctions were made by tinning the ends of No. 36B&S gauge copper and constantan wires, bringing them into end-to-end
contact with the aid of a glass capillary tube, and soldering them. 8 Junc-tions formed in tils manner are uniform and not significantly larger in
diameter than the wires themselves. A thermocouple of this type has a
low heat capacity and relatively low thermal conductivity.A set of eight shielded thermocouple ar Femblies was used as shown
in Figure 7.3. The supporting structures could be lowered to facilitatecleaning the shields and replacing the thermocouples.
The thermocouple measuring junctions used to obtain soil tempera-
tures were of two types 4 as shown in Figure 7.9. The junctions which
were placed at depths of 12.5, 65, 50, and 100 cm were formed by No. 16B&S gauge copper and constantan lead wire. This type of junction was
encased in a copper tube 6.5 inches long and 5/16-inch outside diameter.
The copper tube was sealed at one end by a brass bullet-shaped cap, Thejunction was electrically insulated from the copper sheath by "Glyptal"
lacquer and plastic tape. The junctions which were placed at depths of
3.125 and 6.25 cm were formed by No. 36 B&S gauge copper and constan-
tan wires. The wires were insulated by means of thin glass capillarytubes and inserted in a brass sheath 6.5 inches long and 0.095 inchesoutside diameter. One end of the sheath was sealed by a pointed brasscap and thother ed -was connected to a 1.5-inch length of 5/16-inch
outside diameter copper tubing which served as a housing for the splices
of the No. 36 B&S gauge wires to No. 16 B&S gauge lead wires. Thejunction was electrically insulated from the sheath by "Glyptal" lacquer.
Care was taken during installation of the soil temperature elements
to disturb as little as possible the soil which would surround the junc-
tions. A triangular pit slightly more than one meter deep was excavated.The sod was cut and removed and successive layers of soil were removedand piled separately. In order to maintain accurate spacing between the
junctions, a wooden template (5 cm X 2 cm X 105 cm) in which appro-
priate holes had been drilled was used, The wooden support was accurately
positioned vertically at the apex of the pit. Holes which were slightly
12

I44)
4-
tun
13

smaller in diameter than the temperature elements were drilled into the
side of the pit at each level. The temperature elements were then in-
serted horizontally through the wooden support and into the holes in the
soil. The layers of soil were replaced at their original depths as the pit
was filled. To minimize the effect of thermal conduction along the lead
wires, each lead was buried at the same depth as its corresponding ele-
ment for a horizontal distance of approximately one meter from the ele-
ment. Figure 7.10 illustrates the arrangement of the soil temperature
measuring junctions.
All constauntan leads from the measuring junctions were connected
to the constantan lead to the reference junction at the constantan junc-
tion zone box. (See Figure 7.7j The lead ends were held in contact with
the common lead by means of plastic clamps. Each lead could be easily
disconnected from the circuit for checking purposes.
The copper leads from the measuring junctions were connected to
the individual positions of a two-gang rotary selector switch. A copper
L knife switch permitted selection of a gang. Since the rotary selector
switch had silver contacts, it was mounted in a thermos flask which in-
sured isothermal conditions and prevented the occurrence of spurious
voltages due to the copper-silver junctions.
The reference junction was fo,-med by No. 16 B&S gauge copper and
constantan wires and -as electrically insulated and water-proofed by a
thin coating of polyethelene. The reference junction was immersed in a
pint thermos flask filled with a mixture of distilled water and crushed
distilled water ice. To prevent conduction of heat to the junction by the
lead wires, approximately one foot of the lead wires was looped and
immersed with the junction. The thermos flask was mounted in a cork-
lined metal container to further reduce the melting rate of the ice. The
metal container was mounted near the floor on a. pair of horizontal pivots.
The operator could impart a rocking motion to the container with his foot.
In this way the reference bath was agitated to minimize thermal stratifica-
tion. The mixture of ice and water was assumed to be at 00C.
14
• -I

3.125 -
25
50/
1 00 CM
Figure 7.10 Installation of soil tempexature elements
15

The circuit diagram for the modulated -carrier -type d-c amplifier is~j-
shown in Figure 7.11. The prominent characteristics of this amplifier
are high sensitivity, virtually no zero drift, high gain stability, relativelyhigh input impedance, and a high degree of linearity. The amplifier used
for temperature measurements had a nominal input range of 0 to 400microvolts which corresponds to the output of copper-constantan thermo-
couples for a 10'C temperature difference. A control was provided forprecise setting of the amplifier gain.
The amplifier output was indicated on a meter (Weston, Model 271)which had a range of 0 to 1 milliampere and an internal resistance of
1400 ohms. The meter scale was 5.8 inches (147 mm) in length, had100 divisions, and was marked to read a temperature range of 00 to
100 °. This meter was equipped with a knife-edge pointer and a mirror
scaie which eliminated reading errors due to parallax.The reference temperature compensator circuit is shown in Figure
7.12. This unit is a calibrated variable microvoltage so-urce. By setting
the dial of the 5000-ohm precision variable resistor and regulating the
voltage across the precision divider coiasisting of the 1-ohm, 250-ohm,
and nominal 5000-ohm series-connected resistors; a microvoltage
equivalent to that produced by copper-constantan thermocouples for any
temperature difference in the ranges of 0" to 45"C and 0' to 450 C could
be obtained. In this circuit, the output microvoltage is made dependent
only on the setting of the 5000-ohm resistor by maintaining a constant
voltage across the divider. This is accomplished by comparing the
voltage across the divider with the emf of a standard cell and varyingthe 100K ohm resistor in series with the 1.5-volt dry cell until a condi-
tion of balance is obtained as indicated by the microammeter.Since the input range of the amplifier was iimited to a 10'C increment
and the reference thermocouple jnctl n was maintained at 0"C, the refer-ence temperature compensator was employed in measuring temperatures
which exceeded 10'C. The connection of the compensator in the measuring
circuit was such that its output voltage was subtracted from the voltage
16
- ' -. - --- - - --------.---.--..-.-.------- '-'-.-- - - - - - - --r- - -

0U
1 17W N CY

produced by the thermocouples. The net voltage was then amplified and
indicated on the meter. The following example illustrates the operationof the temperatnr. measuring system:
To measure the temperature (assumed to be between 200 and 30"C)
at the 50-cm depth in the soil:(1) Set the selector switch for the -50 cm soil-measuring junction,(2) Set the reference temperature compensator dial for 20°C com-
pensation and adjust the balance control,(3) Set the amplifier gain dial for the 20' to 30'C increment, and(4) Read the meter (assume a reading of 6.35 is obtained)(5) Apply a meter correction, in this case +0.02.
The temperature (26.37) is the compensation (20°C) plus the meter reading(6.35 0C) plus the meter correction (+0.02).
A platinum resistance thermometer (Leeds and Northrup), which had
been calibrated by the National Bureau of Standards, and a Mueller Bridge(Rubicon) were used to calibrate the copper-constantan thermocouple wire.
A thermocouple circuit was constructed from a length of No. 16 B&S gauge
copper-constantan lead wire. One junction was placed in a 0"C referencebath and the other junction was immersed in a large thermos flask filled
with water (approximately five gallons). A Beckman differential thermo-meter and the resistance thermometer were immersed in this calibrating
bath. The thermocouple junction, Beckman thermometer bulb and resist-ance thermometer bulb, were placed in close proximity near the center of
the bath. A motor-driven stirring mechanism was used to agitate the
water. The thermocouple wires were connected in a circuit with an ampli-fier, meter, and reference temperature compensator as shown .in Figure7.13. The amplifier and meter merely served as I sensitive null indicator,hence their calibrations had no influence on the wire calibration.
The temperature of the calibrating bath was varied through the rangeof -20°C to 100C and 15 evenly-distributed calibrations points were
obtained. Methanol antifreeze was added to the bath water for temperatures
less than 0°C. The temperature of the bath was determined by the resistance
18
I I.- - - - --

100
STANDARD250LCELL 10
Figure 7.12 Reference temperature compensator
V METER REFPERATNCECOMP NSATOR
---- COPPER
----------------------------CONSTANTAN ~
Figure 7. 13 Thermnocouple wire calibrating circuit
19

thermometer, and the rate of change of temperature was mcnitnred by theBeckman differential thermometer. At each calibration point, a referencetemperature compensator setting was determined which produced zerocurrent flow in the measuring circuit as indicated by the amplifier meternull detector; that is, a setting was determined which caused the compen-sator output to be equal in magnitude to the emf produced by the thermocouplejunctions. The emnf temperature characteristic of the copper-constantanwire was then determined by measuring the output of the compensator foreach of the dial settings. A potentiometer (Leeds and Northrup Type K),a precision voltage divider, an amplifier-meter null detector, and an auxiliaryemf source were used for this measurement as shown in Figure 7.14. Theamplifier and meter were calibrated by means of the circuit shown inFigure 7.15. In this circuit, the compensator serves as a calibrated micro-voltage source which simulates the output of a thermocouple circuit. Withthe auxiliary microvoltage source set at zero output, the compensator wasset for 10 'C and the setting of the amplifier gain control which producedfull-scale meter deflection was determined. The output of the auxiliarymicrovoltage source was then adjusted until it was equal in magnitude tothe compensator output. Since the two microvoltage sources were connec-ted so that their polarities were in opposition, a condition of equality wasindicated by a reading of zero on the meter. (The zero reading, of course,
is independent of the amplifier-meter calibration.) The setting of the com-pensator was then changed to 20C and the amplifier gain setting for full-scale meter deflection was determined. The auxiliary microvoltage sourcewas again adjusted for a condition of equality and the process was repeated.Dy this method, amplifier gain settings were established for a series ofoverlapping operating ranges, that is, 0" to lOC, 5' to 15'C, 10' to 209C,etc. The transfer characteristic of the amplifier-meter combination wasdetermined and it was found that deviations from linearity were due primarilyto meter movement and scale irregularities. Corrections to be applied tometer readings were established which corrected for the Irregularities inthe amplifier-meter transfer characteristic and the curvature of the emftemperature characteristic of the thermocouple wire.
20
i•
A

AMPLIFIER
DIVIDER POTENTIOMETER
REFERENCETEMPERATURECOMPENSATOR
Figurv 7.14 Calibrating circuit
V' REFERENCETEMPERATURECOMPENSATOR
AM PLIF IER
- +MICROVOLT
SOURCE
Figure 7.15 Amplifier calibrating circtdit
21

The emf temperature characteristic of the No. 36 B&S gauge copper-
constantan thermocouple wire had been established to be virtually the same
as that of the No. 16 B&S gauge thermocouple wire by the Leeds andNorthrup Compatiy. This was verified by experimentation. A series circuit
was constructed from lengths of No. 16 B&S gauge copper wire, No. 16 B&Sgauge constantan wire, No. 36 B&S gauge copper wire, and No. 36 B&S
gauge constantan wire.Four junctions were formed: (1) No. 16 B&S gauge copper to No. 36
B&S gauge copper, (2) No. 36 B&S gauge copper to No. 36 B&S gauge
constantan, (3) No. 36 B&S gauge constantan to No. 16 B&S gauge constan-tan and (4) No. 16 B&S gauge constantan to No, 16 B&S gauge copper.This circuit was connected to an amplifier-meter null detector. The No.16 B&S gauge copper-constantan junction and the No. 36 B&S gauge copper-constantan junction were maintained at the same temperature by immersingthem in a thermos flask filled with water. The No. 16 B&S gauge to No. 36B&S gauge copper junction and cnonstantan junction were heated separately.No thernioelectrical emf was obtained.
An overall statement of the accuracy of the temperature measure-ments cannot be made. The accuracy of the air temperature measurementsis a function of the prevailing atmospheric conditions at the time the measure-ments were made. Errors inherent in thermal measurements further compli-
cate an assessment of accuracy. It is possible, however, to designate the
sources of error-and to estimate, in some cases, the magnitude.Absolute accuracy can be defined as the deviation of a measurement
from true temperature. Relative accuracy can be defined as the deviationof a measured difference from true temperature difference. The signifi-
cant errors in air temperature measure ments are calibration error, radia-tion error, and sampling error.
The calibration of the thermocouplP wire is the basis of the calibra-
tion of the temperature measuring system. The accuracy of the wire cali-bration is difficult to evaluate. However, the calibration was conducted
with extreme care and several determinations of each measured value
22

showed the calibration to be reproducible. A conservative estimate of the
error due to calibration inaccuracies is 0.05"C for an absolute measure-
ment and 0.0200 for a relative measurement. Error caused by loss of
calibration due to change in characteristics of the system components (in
particular, a change in the emf temperature characteristic of the thermo-
couple wire) can be considered insignificant. A comparison of this wire
calibration (conducted in April .956) with a calibration conducted in May
1953 shows an average difference of 0.05"C. An unknowin fraction (be-
lieved to be small) of this difference is probably due to a change in tieemf temperature characteristic of the wire. Frequent checls of theamplifier calibration were made by the method illustrated in Figure 7.15
to insure no loss in accuracy due to this component.
Probably the most detrimental effect on the accuracy of the air tem-
perature measurements was produced by radiative transfer at the
measuring junctions. The magnitude of the radiation error is difficult to
determine since it is a function of atmospheric conditions, time, height,
and vertical distribution of wind velocity, In the daytime with a clear sky
and low wind velocity this error would be greatest. All measured air
temperatures would be higher than true air temperature. Air movement
decreases the effect of radiation. The measurement nearest the ground
would have the greatest error since the wind speed there is less than the
wind speed aloft. At night with a clear sky the radiation error would pro-
duce measured temperatures lower than real, and variable with height and
wind speed. Under cloudy and windy conditions, the radiation error would
be less significant. Under isothermal conditions with zero net radiation
at the surface, the radiation error would be completely absent. It is con-
ceivable that the radiation error could be as high as 2 'C; however, for
most of the observations made at O'Neill it probably did not exceed 0.1 U.
A handy means of checking the relative accuracy of air temperature
measurements independent of sampling error makes use of Nature's heat
bath which exists with adiabatic thermal stratification. At these times, the
thermocouples on the mast are exp osed to the 6..me. constant potential
23

temperature. * That is, since the potential temperanre is constant through-
out the depth of measurement, and over the time of measurement, no breathof air of different potential temperature can come along to introduce sam-
pling error. Since meteorological sampling error is missing, only radia-tional error and calibration error remain.
Adiabatic thermal stratification near the ground occurs typically twice
a day, shortly after sunrise and a while before sunset. However, theseare also times of rapid heating in the morning and cooling in the afternoon,
so that the length of time that adiabatic stratification exists may be very
short. On some occasions the entire 16-meter depth of measurement
will not be at uniform potential temperature at any one time. Adiabatic
profiles may be caused at other times by high turbulence if the turbulentheat flux Is relatively small.
Analyses were made of six adiabatic or nearly adiabatic air tempera-
ture profiles (20-minute periods) obtained during the 3-day observationperiod 6-9 August 1956. Profiles of mean temperature and mean potentialtemperature were plotted for each of the six runs (see Figures 7.16, 7.17,
7.18, 7.19, 7.20 and 7.21). It was assumed that the logrithmicprofile
equation holds:
0=08 + nA9,
where AO does not vary with height in the lowest 16 meters. Logarithmic
profiles were fitted-by-eye, and the standard error of mean potential
temperature for the 20-minute period was estimated as 1.25 times the
average deviation of the points from the fitted line. The values aregiven
in Table 7.1. This standard error ranges from 0.0048°C to 0.031°C,
with an average value of 0.020'C. Since some meteorological sampling
*More precisely, to the same value of 0 T + --- z where z Is m.s-Cp
ured from the surface of the ground. p
24

. 41 0
4
~t o
qQD~~~~- 0 ) t) u ~
______sila __ __ _ __ __ cU6.)-
I25

0 04
V)
'0
du 4) 0
0 u
ED'0
Cb 0
U? 4
CO 0~
0
26

go
OD u
00
CP
'-4
4
('j
000
.-4 I
0
N -
27o

to I.
00
4)
T -'
4
- 0
4O
4 (
0 t4
IcIas~
'I28

0
N. 0
0 0
4J.
400J u
1.0 0.
4)
0 0
00
29

N
o
1:1
04
-4
-- .o
04
4..
-4
*m vCY LO n Ln c
30-

error still exists, and possibly a very small radiational error, these
values are considered outside limits for the calibration standard error.
Table 7.1 Values of standard error of mean potential temperature
Date Time Type A8* Wind Velocity S.ET Remarks(C) Speed Dir (C)(cm/sec) (deg)
6 Aug 117 55- 18 05 Cooling .00 537 160 .031 .1 Cs
7 Aug 0255-0315 Dynamic .04 574 65 .016 .4 low cloudWas rainingprevioustwo hrs
8 Aug 0155-0205 Dynamic .015 812 20 .0048 Thunderstormsto north lastfew hrs
8 Aug 0755-0805 Warming .01 314 330 .030 OvercastRaining onehr. ago
8 Aug 1855-1905 Cooling .03 527 0 .017 .2 Cu
9 Aug 1655-1705 Cooling .002 416 30 .019 Huge thunder-storm to west,advancing onus for last3 hrs
Ae where n ("number of doubled levels") is the logarithmic,
non-dimensional height scale n = n 2 "
31

The importance of the meteorological sampling error still remainingcan be appreciated by taking a closer look at the data for tw o of the runs:that of 0205 CST on 8 August, an ideal case, and that of 1805 CST on6 August, a less than ideal. case. The thing sought is the nature of trendsduring the 20-minute periods. To this end, simplified profiles of poten-tial temperature for the first and last five minutes of each run were
obtained. The data of the lowest two heights, middle two heights, and toptwo heights were combined, giving profiles of only three points. These
profiles are plotted in Figures 7.22 and 7.23. The latter 20-minute pro-
file was obtained when shelter-height temperature dropped 1.0°C in 15minutes, and the potential temperature profile quickly passed from day-
time type to nighttime type during the run.
On the other hand, the Ideal 20-minute profile was obtained withhigh turbulent mixing and small, nearly constant, heat flux downward.
The drop in shelter-height temperature was only 0.4C in 15 minutes,and the slope of the potential temperature profiles changed very littleduring the run. Meteorological sampling error was therefore much lessin this period of observation than in that of 1805 CST on 6 August 1956.
Errors in the 20-minute profiles of mean temperature due to samp-ling may be evaluated by simple statistical techniques. The magnitude ofthese errors is least (nearly zero) when thermal stratification is adia-batic. It is also usually small with calm conditions at night, These errorsare greatest in the heat of the day when no steady breeze is blowing.
A computation was made to evaluate sampling error in the temperature
profiles. Data are from the 1455-1515 observation period of 8 August.This was a time of strong solar heating (clear sky above, bank of cumulus
clouds in the distant southeast) and "very light" winds from the southwest.In the computations, the standard deviations are in all cases estimated at5/4 of the average deviation.
The standard deviation of the 20 temperature measurements at eachheight varied from 1.06 degrees (Z = 0.125 m) to 0.44 degrees (Z = 16 m).Since the serial correlation is negligible, the standard error of the mean
temperature is (1/20) " times the standard deviation. The mean
32
-,
. ... ... . . . . . l . . .. ..

co ID
'1 0
44)
N061
o 0U
a aR
00
*. -
3 3,

temperatures at the various heights are found to have standard errors of
0.10 to 0.24 degrees. Figure 7.24 shows the profile of T plus or minus
S.E.r as a function of height.
The accuracy of mean temperature differences within the profile
is increased by a small positive correlation between temperature obser-
vations at various heights. In this example, the difference in mean temp-
erature at 1 m height and at all other heights is between 0.18 degrees
and 0.24 degrees.The means, standard deviations, and correlation coefficients are
given in Table 7.2.
Table 7.2. Statistical measures of temperature
Height T aT S.E. *(T _T r(T(Cm) . . VTn-_
1600 28.86 0.44 0.10 -1.83 0.93 0.21 0.20 -. 044800 29.37 .57 .13 -1.32 .92 .21 .22 +.13400 29.76 .75 .17 -0.93 .91 .20 .25 +.31200 30.31 .68 .15 -0.38 .91 .20 .23 +.25100 30.69 .80 .18
50 31.40 .93 .21 +0.71 0.82 .18 .27 +.5625 32.54 0.92 .21 +1.85 1.06 .24 .27 +.2512 33.55 1.06 0.24 12.8a 1.03 0.23 0.30 +.41
• - Value that S.E.(TZ-T)lm would have if correlation were zero.
N
N N
VN IT-iaT 1 (Ti) 2 i 1 i i
S.E.T N T
34

'.4
4)
0
', 0
0
.
I I I I I
-- SJ) M U Z 4ql'H.4
34)
4)i

N 2
2 =-, 2z IM
a (Tz-Tm) T + -2r(Tz Tim )UTz TM
The accuracy of the soil temperature measurements is 0.05°C for
absolute measurements and 0,02"C for relative measurements since the
only significant error is that due to calibration inaccuracy.Malfunctioning of the temperature measuring system could be easily
recognized by observing the hourly change in temperature at the 1-meterdepth in the soil. Large scale change or rapid fluctuations in this read-ing usually Indicated shorts or leakage to ground, electric and magneticfield pickup, or component failures. Difficulties could also be recognizedby reading the 1-meter soil temperature using two overlapping referencetemperature compensator ranges.
7.3.5 Air Temperature Difference. The air temperature differencebetween tie 1-meter and the 1/2-meter levels was measured by meansof two radiation-shielded thermocouple junctions of the same type asthat used for air temperature profile measurements. The two junctionswere differentially connected and the output was recorded by a modulated-carrier-type d-c amplifier and an Esterline-Angus graphic ammeter.
A recording scale of -5' to +5°C was used; hence, the temperatureat one level relative to the other was determined in addition to thetemperature difference.
7.3.6 Vapor Pressure Profiles. The measurement of the amount ofwater vapor in the air was accomplished by means of an air samplingsystem and a dew-point hygrometer. During the 20-minute observationperiods, air samples were obtained at each level as shown in Figure 7.3.
36

The dew point of each sample was then measured using a Thornthwaite
automatic dew-point hygrometer. 6 The data reported are in units ofvapor pressure (millibars) which were obtained by conversion of themeasured data which were in terms of dew-point temperature (degreesCentigrade).
The air sampling system shown schematically in Figure 7.25consisted of (a) polyethylene sampling tubes, (b) sample storage jugs,(c) sample selector valves, (d) a variable speed pump, and (e) a pump
speed control. Polyethylene tubing having an inside diameter oi 0.25-in. was used since this material is virtually non-hygroscopic. Onegallon glass jugs were used as reservoirs for the air samples in order
to obtain average samples(that is, samples which did not exhibit smallscale fluctuations) simultaneously from all levels. The sample selec-tor valves permitted extraction of the samples from the reservoirs formeasurement. A modified vacuum cleaner was used as an air pump.The rate of pumping could be changed by varying the input voltage to
the pump motor. Two pump speeds were used and were convenientlyobtained by switching the motor input to full line voltage or to thevoltage at a tap on an auto-transformer.
The dew-point hygrometer is shown in Figure 7.26. This is acondensation type hygrometer which utilizes a mirror surface on whichmoisture is caused to condense. By measuring the temperature of themirror at the time of incipient condensation the dew point is obtained.
The instrument which was used consisted of (a) a mirror assembly,(b) a sample chamber, (c) a photoelectric dew-film detection system,(d) a dry-ice heat sink, (e) a control circuit, and (f) a radio frequencyInduction-heating unit. The mirror assembly was formed by copperfoil chrome plated on one surface and soldered to the end of a steel rod0.25-in. in diameter which, in turn, was connected to a copper slug 1-inchin diameter and 5 inchcs long. The chrome surface served as the mirrorand a coppcr-constantan thermocouple junction was held in contact withthe under or copper surface by a second piece of copper foil. This junction
37

GALLONJUG
'I (17)SAMPLE SELECTOR
i D.P
Figure 7. 25 Air sampling sBytem
38

4L.w4
JQ
w oa.l 0ilt
w 4j
0~ Nv1 !
39

was connected to the temperature measuring system (see Figure 7.7).The thermocouple wire was the same type, No. 36 B&S g,-.,'ge, as thatused for the air temperature measuring junctions.
The copper slug of the mirror assembly was inserted in a thermos
flask filled with crushed dry ice and tWe steel mirror stem was insertedin a hole in the sample chamber. A radio frequency induction heating
coil concentric with the hole in the sample chamber then encircled
the steel mirror stem. The sample chamber was ahollow, airtight, plas-tic block with air sample intake and exhaust ports, windows for two
photocells, and a window for the admission of a light beam.
The photoelectric dew-film detection system was connected to anamplifier (control circuA) which, in turn, controlled a radio frequencyoscillator (R-F induction heating unit).
In operation the mirror surface was cooled by the dry ice andheated by the R-F induction heater. By controlling the heating, the
mirror temperature could be varied. Three heat controls were available:
(1) a quick-heat button, (2) a manual control, and (3) an automatic con-trol, By man,.ally depressing the quilck-heat button, rapid heating of themirror was obtained. The manual control enabled the operator to vary
the mirror temperature to obtain a dew-film of proper thickness. Theautomatic control was provided by the photoelectric dew.-film detection
system. Light which was incident at an angle of 45 degrees on the
mirror was reflected to one photocell. A second photocell positioneddirectly below the mirror surface(that is, on a line nornial to the mirror
surface) received scattered light when a dew-film was present. An in-
crease in dew-film thickness caused a decrease in reflected light and
an increase in scattered light. This change was sensed by the photo-
cells which produced a control voltage causing an increase in R-F in-
duction heating. Conversely a decrease in dew-film thickness was
sensed and the heat supply to the mirror decreased. In this way the auto-
matic control aided the operator in maintaining a constant dew-film thick-
ness on the mirror.
40
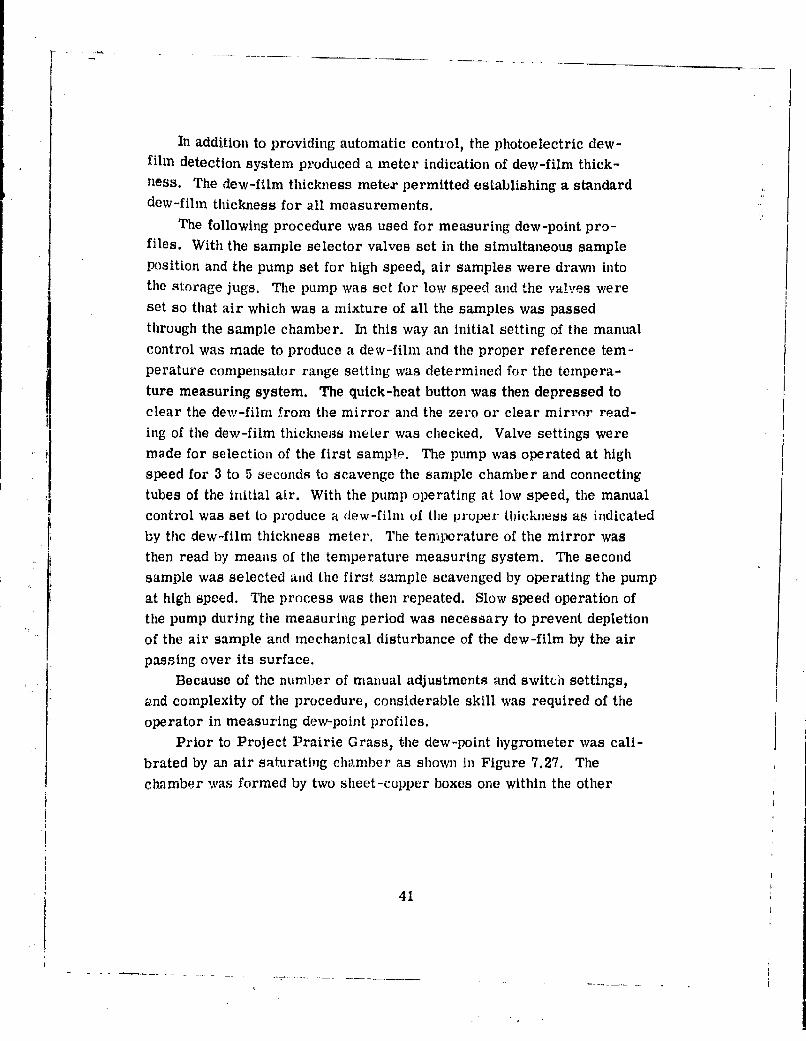
In addition to providing automatic control, the photoelectric dew-film detection system produced a meter indication of dew-film thick-
ness. The dew-f"Llm thickness meter permitted establishing a standarddew-film thickness for all measurements.
The following procedure was used for measuring dew-point pro-files. With the sample selector valves set in the simultaneous sample
rlosition and the pump set for high speed, air samples were drawn intothe storage jugs. The pump was set for low speed and the valves wereset so that air which was a mixture of all the samples was passedthrough the sample chamber. In this way an initial setting of the manual
control was made to produce a dew-film and the proper reference tem-perature compensator range setting was determined for the tempera-ture measuring system. The quick-heat button was then depressed toclear the dew-film from the mirror and the zero or clear mirrnr read-ing of the dew-film thickness meter was checked. Valve settings were
made for selection of the first sample. The pump was operated at highspeed for 3 to 5 seconds to scavenge the sample chamber and connectingtubes of the initial air. With the pump operating at low speed, the manualcontrol was set to produce a dew-film of the proper thickness as indicated
by the dew-film thickness meter. The temperature of the mirror wasthen read by means of the temperature measuring system. The secondsample was selected and the first sample scavenged by operating the pumpat high speed. The prncess was then repeated. Slow speed operation ofthe pump during the measuring period was necessary to prevent depletion
of the air sample and mechanical disturbance of the dew-film by the airpassing over its surface.
Because of the number of manual adjustments and switch settings,
and complexity of the procedure, considerable skill. was required of the
operator in measuring dew-point profiles.Prior to Project Prairie Grass, the dew-point hygrometer was cali-
brated by an air saturatig chamber as shown in Figure 7.27. The
chamber was formed by two sheet-copper boxes one within the other
41

AIR SATURATING CHAMBER
'I*THERMOCOUPLE
II. 1 ,111 1111 111A
iiIII~ :; i !:'~~ :1
PUMPI
DE OI NIiHYGROMETER
* _ _ _ I 4 I 4 ~AI I'7
Fig r 7. 27 Ai sau atn chamber
42 ,~

and separated by insulating material 1-inch thick. The box was con-
structed in two sections to permit access to the chamber. The bottom
section formed a pan 18 inches by 18 inches by 1.5 inches deep. The
top section cuntained a labyrinth of baffle plates. The pan formed by
the top section was 1.5 inches deep and the baffle plates were 2 inches
in width. The bottom section was filled with distilled water and thetop section was positioned in such a way that the lower edges of the
baffle plates were immersed to a depth of 0.5 inches. In this way anenclosed and baffled air space 1.5 inches high was formed over the
water surface. Glass tubing inserted through the top section of thechamber provided intake and exhaust ports. Air entering the chamber
was confined to a puth formed by the baffle plates. Between the in-take and exhaust ports, the air path length was 27 feet. The air tem-perature and water temperature were measured by means of copper-
constantan thermocouple junctions at three stations along the air path:4! at the intake port, at the exhaust port, and at the midpoint of the air
path. The dew-point hygrometer, a pump, and the chamber were connec-
ted in a closed circuit by means of polyethylene tubing. The pump circu-
lated air through the chamber and dew-point hygrometer at a speed
sufficiently high to produce turbulent flow in the saturating chamber. Thedifference between air and water temperature at each station was
observed. A condition of temperature equilibrium between air and water
was used as an indication of saturation. The temperature at whichsaturation occurred was then taken as the actual dew point of the air. The
condensation temperature or dew point as indicated by the dew-point
hygrometer when operating with various dew-film thicknesses was
compared with the saturation temperature. By repeated tests a dew-filmthickness was established which produced agreement of saturation
temperature and dew point as indicated by the dew-point hygrometer. To
prevent condensation from occurring in the connecting polyethylene
tubes which were virtually at room temperature, saturation temperatures
less than room temperature were used. This was accomplished by using
43

water in the chamber having a temperature a few degrees below that of
the room.The accuracy of the dew-point measurements is at best equal to
the accuracy of the calibration of the temperature measuring system.In addition there are sampling errors, and small random errors
introduced in setting the dew-film thickness. Sampling errors aredifficult to evaluate but are suspected to exist when a smooth profile is
not obtained. Excluding sampling errors, absolute measurements areprobably accurate to 0.060C and relative measurements are probably
accurate to 0.03"'C.Malfunctioning of the dew-point hygrometer was readily recognized
by observing the behavior of the dew-film thiclmess meter. Thepresence of water in the sampling tubes could be detected by the behavior
of the instrument and by readings of dew point which were greater thanambient temperature. Water in the sampling tubes sometimes occurredas a result of rain, fog or an inversion under humid conditions. The
sampling tubes were necessarily cleared of water before resumingmeasurements. During the observation periods, moisture measurements
were made by means of a sling psychrometer. These measurements
were used as a check for gross error in the dew-point system.7.3.7 Wind Profiles. Wind profiles were measured by a set of
matched three-cup anemometers. Nineteen Rikoken* anemometers
were modified, compared, and grouped in sets of seven matched units.
When received from the manufacturer, the Rikoken anemometers
were equipped with gear trains and contact systems for counting the
*Manufactured by the Sanoya Iron Works,1064 Nakata-machi, Kanuma-shiTochigi-ken, Japan
44
______€ ~

turns of the cups. The modification consisted of replacing the gear train
and contact system with a photoelectric counting system. The latter
system utilized a cadmium sulfide 1hotoconductive cell and a No. 51light bulb. The light reflected to the photocell by the mirror was inter=
rupted by a shutter blade connected to the shaft which was turned by the
cup assembly, In this way the photocell was illuminated and shadedonce for each revolution of the cup assembly. The photoelectric counting
system had several advantages not afforded by the gear train and con-
tact system: (a) Friction due to the gear train and contacts was elimi-
nated by use of the photoelectric system. Since this was the major
portion of the friction in the instrument, its elimination resulted in
lower starting speed. Also, the magnitude of this portion of the friction
was 'not the same in each anemometer so its absence tended to make
the anemometer characteristics more nearly alike. (b) The resolution
i'( ounts per revolution or counts per metrr cf z passage) obtained by,i using a photoelectric system which counted each revolution of the
anemometer cups was 6.9 times as large as that provided by the gear
train and contact system. Since the anemometer output was in digital
or pulse form and was recorded by means of a digital counter (step
function integrator), wind measurements having a resolution commen-
surate with accuracy could be obtained for a shorter time interval
using the photoelectric system than by using the gear train and con-
tact system. (c) Gear train and contact systems often produce
spurious counts caused by contact bounce and intermittent conductionat the instant of make or break. The photoelectric system produced
no spurious counts. (d) Conacts become pitted with use requiring
that they be burnished or replaced. The photoelectric system required
little and infrequent maintenance.A unit having 8 counting channels (one for each anemometer and
one spare) was used to register the number of revolutions of the
anemometers. The circuit of a counting channel is shown in Figure 7.28.
The circuit consists of a pulse-shaping stage, three bi-stable multivi-
45

41
U
L''aIw
NN
c'-
46

brators, and a thyratron-driven electromechanical counter. Input pulses
from the anemometer were converted to short rise time rectangular pul-
ses. The output of the pulse-shaping stage was then fed to the three bi-stable multivibrators which were connected as a binary frequency divider.By means of a selector switch, the thyratron driven electromechanical
counter could be connected to the output of the pulse-shaping stage or the
output of any multivibrator. In this way the electromechanical counterwas caused to register either each, every other, every fourth, or everyeighth revolution of the anemometer. The electromechanical counter(mercury four-digit reset type) was rated at 10 counts per second. Since
the anemometer speed could exceed this rate, the binary frequencydivider was employed. In addition to enabling the counting circuit to
accommodate a maximum input rate of 80 counts per second, the binaryfrequency divider reduced wear of the electromechanical counter whenwind measurements were made which did not require the maximumavailable resolution.
The counting unit was constructed in three assemblies. The elec-
tronic portion of the counting channels was built on a single chassis.The threshold controls and count-down (frequency division) selectorswitches were located on this chassis. Two banks of electromechanicalcounters, a counter start-stop switch and a bank selector switch were
mounted on a panel. One bank of counters could be read and reset while
the other was registering counts. In this way successive profilemeasurements could be made without loss of data during the reading
and reset periods. The power supply for the system was contained ona single chassis.
Prior to Project Prairie Grass, the a .nemometers were matchedby means of a whirling device having four horizontal arms each eightfeet long. 7 The anemometers were matched at O'Neill by mounting
them at the same level on a horizontal support approximately twometers above the ground in an open field as far as possible from
1obstructions. The support could accommodate 10 anemometers
47

having a horizontal spacing of approximately I foot.An anemometer which was representative of the matched set was
selected as a standard and its calibration was defermined. This anemom-eter was calibrated in a wind tunnel* against a pitot tube which had been
calibrated by the Bureau of Standards. Several trial calibrations were
run to investigate the characteristics of the calibrating procedure andequipment. Four independent calibrations were then made and the average
was taken as the true calibration. A check of this calibration was made
using a different procedure and different calibrating apparatus.** Thecalibrating apparatus consisted of an airtight room (located in the
laboratory building) having an air intake nozzle (9-inch throat diameter)
in one wall and a volumetric flow rate-measuring exhaust nozzle in theopposite wall. By measuring the rate of flow out of the airtight room,the speed of the air entering the room through the intake nozzle could
be determined. The anemometer was placed in the throat of the intake
nozzle and its calibration determined. In the velocity range of I to 4.5
meters per second this calibration was virtually the same as the previouscalibration. At higher velocities a difference was obtained. The calibra-tions differed by 2 percent at 5 meters per second and increased to 8percent at 15 meters per second. A pitot tube was recognized to be most
accurate at high velocities. The second calibrating technique was recog-nized to have an accuracy deficiency at high velocities. Both calibration
techn:Iques were unsatisfactory at velocities less than 1 meter per secondsince the air flow could not be maintained constant and the zero error and
drift of the manometers became large compared to their readings. The
calibration using the pitot tube, therefore, was accepted for the velocity
*Massachusetts Institute of Technology portable wind tunnel atO'Neill, Nebraska.
**This calibration wa8 performed at the Fan Test Laboratory,Engineering Experiment Station, Texas A&M campus, October 1956.
48

V ~ ~~ ~~ - ---.--- -
I>. __i." "r ".
Figure ". 9 View of Rikoken anemometers installedat heights of 25, 50, and 100 cm
range of 1 to 15 meters per second. A third method was employed toobtain a calibration point at a velocity less than 1 meter per second.Under conditions of steady low velocity., virtually laminar flow at aheight of 0.5 meters in the atmosphere* the wind velocity was measuredby observing the time required for smoke from a cigarette to travela measured distance, and the corresponding anemometer indicationwas obtained.
In measuring wind profiles, the anemometers were installed atthe heights shown in Figure 7.3. The three lowest anemometers,
*These conditions existed at 2100 CST, 22 July 1956 at O'Neill.
49

those at 251 50, aad 100 cm, are shown in Figure 7.29. Each anemom-eter was carefully leveled so that the cups rotated in a horizontal planethus minimizing the effect of asymmetrical weight distribution in the
cup assembly. The revolutions of the anemometers were measuredfor 20-minute periods and converted to units of wind speed by means oftables derived from the calibration curve shown in Figure 7.30.
7.3.8 Summary. In measuring these micrometeorological parameters,the method used in each case was designed to provide data which was in aconvenient form for imraediate reduction. The operating procedure wassuch that the operator observed the behavior of each measuring systemat least once during each 20-minute observation period. With the ex-ception of the radiation, wind direction and air temperature differencemeasurements which were recorded on strip charts, all measurementswere recorded on data forms. These were so arranged that all tabula-tions and computations per data class were on one page. All computa-tions were made from prepared tables, slide rule, and or standard deskcalculator. This enabled the operator to reduce the data immediatelyafter the measurements were made; hence, gross errors due to malfunc-tioning of the measuring equipment were noted and remedial action couldbe taken before measurements were resumed.
50

22-
21
20
I
, 17
is
15
t"213
I*1- a
12
~9
0 ASM Fen Test Lob- MIT
5
4
3
2
0 I2 3 4 5 6 7 8 9 10 11 12 13 14 15 1Motors per Second
Figure 7, 30 Anemometer calibration curve
51

REFERENCES
1. Halstead, M. H., "The Measurement of Wind Profiles,"Piblications in Climatology 7, No. 2, The Johns HopkinsUni rst!FaboraFy o _f Cim~atology, Seabrook, NewJersey, 1954.
2. Portman, D. J., "The Measurement of Air TemperatureProfiles." Publications in Climatolqgy 7, INo. 2, TheJohns Hopkins University Laburaf6iry oTtlimatology,Seabrook, New Jersey, 1954.
3. "The Measurement of Radiation. " ibid.
4. , The Measurement of Temperature andHeat Transfe in the Soil." ibid.
5. Superior, W. J., "The Mobile MicrometeorologicalStation." Publications in Climato1o 7, No. 2, The JohnsHopkins University Lab-or-ato ry -of Climatology, Seabrook,New Jersey, 1954.
6. Thornthwaite, C. W. and C. Beenhouwer, "The Measure-ment of Humidity Profiles." Publications in Climatology 7,No. 2, The Johns Hopkins Uni-v'crsitvLab6orator'y 'o Clima-tology, Seabrook, New Jersey, 1954.
7. Thornthwaite, C. W., et al., "Micrometeorology of theSurface Layer of the Atmosphere." The Johns HopkinsUniversity Laboratory of Climatology, Interim Report 10,6, 1950.
8. Thornthwaite, C, W,, et al., "Micrometeorology of theSurface Layer of the Atmosphere." The Johns HopkinsUniversity Laboratory of Climatology, Interim Report 13,4),1951.
52

CHAPTER 8
MICROMETEOROLOGICAL DATA COLLECTEDBY TEXAS A&M
W. Covey, M. H. Halstead*, S. Hillman,J. D. Merryman, R. L. Richmar*, and A. H. York
Texas A&M Research Foundation
This section contains three groups of data collected during Project
Prairie Grass. In the first group (Table 8.1) are micrometeorological
data collected during the 68 regular and the two special gas releases.
These observations covered a period of 20 minutes each, starting .5
minutes before and ending 5 minutes after the 10-minute period during
which the gas was released.
The second group (Table 8.2) includes similar observations, but at
times other than the 70 gas release times. 177 observational periods
are included in this group.
The third group (Table 8.3) contains soil moisture and soil density
data on four days during July and August.
*Present affiliation: U. S. Navy Electronics Laboratory
53

Table 8,1
HOURLY OBSERVATIONS OtNEILL, NEBRASKAGAS RELEASE NO. 1 2 3 4 5 6JULY (1956) 3 3 5 6 6 6CST 1105 1505 2205 0105 1405 1705
LADIATION ca1/cm 2 00 "- ulkn'-8 .houo, .0048 ---- .0205 .0120
o f - -0
I v tI'F(. -
Not R;'adiatiun ).050 .0)9 -0013 -0010 .0145 .00110
All) and SOIL TENIPERATUIES C
8.00 2,,B 23.78 22.41 20.00 29.18 30.194.00 211.90 23.79 21.12 M155 29.72 30.502.00 22,12 23.87 19.83 17.50 30.1? 30.801.00 2,32. 23.9 18.45 16.75 30.71 31.09
.50 22.95 24.18 1'7.24 16.00 31.44 31.32
.25 231.22 24.54 16.89 15.63 32,05 31.03
.12 2:1.84 24.85 18.55 15.33 - 31.82-.03 2.1.06 25.30 -- I .. ..-. 00 23.11 24.63 -- .. ..-.12 21.71 23.20 -- [ .. .5-. 25 21.6, 1 58 -- -. .-. 50 20.53 20.38 - -
1.00 l.I I.))18 .5 00 84 72
1.00 IaK 18. 62 18 :). 11j. 48 171.1) 1.5i4.0 li3~ H. I,73 /1. 44| 16. 52 [17.39 10,64
M;"-0[! i [ lit 18.46| 1(. 53 17.73 16.81)1.00 1 9,0.1 0l+.I 1 I H.58! 16.,8 18.r11 17,07I.10 19,, 1,(,.:1 it 1.58/ 16.04 18.46 I T o.24.2. - 9 77 113.,I9 16.65 18.73 17.30
-. 12 9.195 210.21 1i8,m1; 7 -I.29 19.27 _ 17.41 _ ___
)WIND SPEED (cm/ese I8.00 321 2:13 21) 34 703 846
4.00 2119 2161 113 I209 651 7652.00 258 19 0 44 120 593 11801.00 2:19 174 61, ) 9 515 599
.50 206 1 39 52 448 523
.25 173 122 16 17 378 439)
WIND DIR2CTION (d1g)
SOIL TEM1)I.:HTUIB- CIIAI, GE ( _C)
Ilmi 1,111c,(iii 29 -- - -----.03 T 1 -.10 -- -- -- --,06 00 .... .... -
-12 -- .11 - - - -
-. 25 -- .03 - - -
-5()- -. 02 - - - -
-1.00 -- -. 01 - - - -
lPrecipitlaion (cm) .. .. .... ... ..
54

I
Table 8.1 (Continued)
HOURLY OBSERVATIONS O-NEILL, NEBRASKAGAS RELEASE NO. 7 8 9 10 11 12JULY (1956) 10 10 11 1! 14 14CST 1405 170 5 1005 1205 0805 1005
_ _ _ _RADIATION cal/cm 2 aoc)Insolauo. 1 02 .01°1 (i go .0200 .0165 .0 185 ]
26.71te 3'lT M~tiu~C T__ ___
.00gh 9' .0023. 00-35- .0040
10.00 28.71 2.0 2..7 .28.42-8.00 2D.04 30,15 20.25 28.98 24.16 28.834.00 29.46 30.57 26.01 29.58 24.64 29.252.00 30.27 31.10 27.39 3D.45 25.01 28.671.00 31.21 31.47 28.10 31.47 25.42 30.53
.50 31.90 32.01 28.75 32.11 25;02 31.18
.25 33.10 32.58 20.53 33.14 26.34 31.94
.12 34,23 33.06 29.82 33.78 26.68 32.65-. 03 34.90 33.74 26,64 31.79 24.23 28.86-.no 30.53 31.77 24.48 27.91 23.4f0 25.98-. 12 24.23 26.77 '23.14 23.93 24.25 24.16-. 25 21.11 21.84 22.*47 22.27 24.14 23.65-. 50 20.03 19.99 20.42 20.34 21.4 21.34
-1.00 18.22 18.22 18.28 18 20 18.75 18.68 , 1
12.06 -. VAPOR PRESSURE (rob)6.01.6 13.16 -20.60 22.84 - -
8.00 12.97 1387 20.88 23.10 .- --
4.00 13.02 13.72 20.92 23.14 --2.00 13.05 13.75 21.10 23,27 --1.00 13.18 13.815 21,14 23.40 --
.50 13,50 1308 I 21.20 23.43 --
.25 13.85 14.16 21.39 23.59 --
.12 14.15 14.32 21.92 23.62 L-- ] _
0WIND SPEED _cm/aoc)5 I 611 884 579 - --
8.00 508 540 842 536 944 9734.00 481 408 709 500 850 8922.00 444 452 700 408 761 7991.00 402 400 611 415 677 721
.50 352 350 533 376 570 0317
.25 295 288 450 312 490 522
_____WIND DIR'..CTION dog)1.00 204 ,, 109 1 200l 103 175
SOIL TEMPERATIEI CIIANGE (C)Initial 'rTime 1351 1651 0950 1150 07 050 0950Run Time (mLn) 27 20 16 26 28 27-. 03 -1.80 -,70 1.01 .79 .80 .23-.06 .53 -. 29 .59 .70 -. 16 .72-. 12 .53 .20 .06 .23 -. 08 .10-,25 .07 .13 -.08 - 63 - 11 -.08-.50 00 -. 03 -.01 -.01 -. 03 -.01
.1.00 00 00 oo00 -.01 -.01 I__
ProclplIflhin (cm) -- -- - -- --
55

Table 8.1 (Continued)
IIOUIILY OBSERVATIONS O'NEILL, NEBRASICAGAS RE;LEASE NO. 1.3 14 15 16 17 18JILY (1956) 22 22 23 23 23 23CST __ 2005 2205 08105 1005 2005 2205
______ RADIATION (cal/vm2
scpL___Is/.0001 .0000 "°10 0183 .001 . 0 011loelcd -- o- o o o -o -o --Net -. 0011 -. 0010 .0050 0100 -.0011 -.0014
Alt and SOIL TI.MPERI1ATUILES (C)
16.00 22.34 21.04 20.32 24.61 27.01 25. 118.00 21.64 19.76 20.51 24.82 27.83 24.304.00 21.04 17.87 20.78 25.10 27.62 23.832.00 20.39 16.25 21.44 25.01 27.44 23.521.00 19.56 15.31 22.05 20.67 27.32 23.2..50 18.72 14,66 22.51 27.79 27.10 23.03.25 MIS 14,31 23.32 28.84 27.08 22.53.12 17.76 13,99 23.05 29.63 21.00 22.66
-. 03 20.40 23.10 20.75 26.71 29.48 26.39-.06 27.02 24,G2 20.48 23.55 20.53 27.08-.12 25.50 24.95 21.44 21.62 27.2 26.51-. 25 22.17 2200 22.12 21.79 22.96 23.20-.50 20.30 20,48 20.72 20.68 20.32 20.28
,1.00 18.95 1JO2 10.04 18-90 18.54 18.62 _ _
6.0 6 10. 13 - 174.01 17.10 7,3______ ~VAPOR PREISSURE.~~b ____b____
8.00 10.47 14. 20 1'.391 1814 I r T4.00 16.74 14.21 17.41 18.21 -..2.00 10.60 14.20 17.43 18.30 I . .
o /0 10.02 14.25 I 17.52 18.40 I . .
,50 15,86 14.27 17.63 18.57 I ...2(1 /15.71 14.:2 17.65 18.81 -. ..12 15,71 14.99 17.77 10.08 -- --
WIND SPEED ,cm/sec)8.00 -f264 348 /378! 3_ 4 488
4.00 108 225 354 346 402 3752.00 141 139 322 331 341 3221.oo00 74 |290 29 / 287/ 268.50 41 2, i 2G:, 237 229.25 8 16j 215 225 209 1 6
WIND DI1{1C'I'I N __d__ _.. - _ -- 202 2 188 1SOIL T,-M PI,.IATJItI{CHANGE VC) _ _
nliali me 1952 2150) 0752 0050 1050 2155Oun TIIu (main) 25 1 30 1 24 79. 26 22-.03 -1.08 -.68 .79 1.54 -. 78 -. 83-. i -.03 -.60 .32 .92 -.59 -. 70-.Q -.07 -. 18 -.04 .17 -. 10 -.25-.26 .04 .04 -.04 .,02 .05 ..07-.50 -.05 .04 1 00 01 00 -.04-1.00 -.04 J .02 u ..02 00 -.01
lr'f'.:l)i 1tiloll (cm ) ... .. .. .... ..
56

Table 8.1 (Continued)
HOURLY OBSERVATIONS O'NEILL, NEBRASKAGAS RELEASE NO. 19 20 21 22 23 24JULY (1950) 25 25 25 26 29 21)CST 1105 1305 2205 0005 2105 2305
RADIATION (cal/cmrn2s-c.
Reflected .00290 00415 --Net Radiation '0081 .0137 -. 0000 .. 0014 1 -. 0014
______ _____ AIR and SOIL TEMPEUA'rURES.V_)_Iheight (m) F . ..16.00I 27.26 30.14 2,,91 261.7) 231.62 22.07
8.00 27.77 30.88 28.84 26.70 23.52 21.904.00 28.04 31,17 28.74 26,60 23.49 21.962.00 28.59 32.49 28.60 26.42 23.40 21.891.00 " .. 28 '1334 28.50 26.32 23.31 21.83..50 2U.75 3 4. J1 28.42 26.22 2:3.21 21.74
.25 30.56 35.16 28.32 2 6. 05 23.11 21.71
.12 31.06 35.98 28.19 25.93 23.04 21.63
..03 28.52 33.60 27,70 26.32 27.92 25.85-.06 24.02 2880 27.65 26.57 28.14 26,38-.12 22.80 23.92 26.76 26,1 26.83 26.16-. 25 22.74 22.56 .13.Do 24.00 23.98 24.10-. 50 21 21 21.12 21.14 21.!7 21.63 21.65
-1.00 i 19.00 1..94 1.14 129.0_ 19._2 19.2
________ VAPOR PRESSURE Tb ___-
14.01 14.19 14.56 1581 - --8.00 15.22 14.33 14.65 15.7 - .
54.00 1.24 14.39 14.C6 15,H1 -" -2.00 15,30 14.41 14.60 15.82 - -1,00 15,41 14.47 14.62 15.80 20.7' 20.9*.50 15.80 14.5! 14.64 1581 -- -
.25 15.00 14.57 24.65 1 .77 -- --.12I25.73 4.721 14.59 15.75 _ -.
_____________ ______ WIND SPEED (viaic ___ __ ___
-6.60 752 1211 859 1041 883 658.00 721 1130 772 033 784 7644.00 627 1017 6 7/5 814 085 I 6622.00 -- 938 il 739 (05 I 586
.50 475 727 40/ 557 471 461
.25 393 5094 376 454 380 382
WIND DIRECTION {d _ _
J.oo 1 .... - 1 2 167 170[ [ 1_
SEIL TEMPERATURE_ C ALE r ___ni l limo 1050 1250 2154 2350 200"2250
Run Tinm (min) 20 27 23 20 20 27-.03 .91 .67 -. 10 -.24 -. 53 -. 7s8-. 03 .96 .41 -. 20 -.11 -. 43 -.77-. 12 .3 .37 -. 2t -. 11 -. 12 -.33--2 .04 -.01 .02 .05 .06 -. 12-. 50 -. 02 -.01 -.01 00 00 00
-1.00 -.01 00 - lL .01 00 -00 3
lPvipilat in (cm) --4 Sling Psyehrometer
57

Table 8.1 (Continued)
HOURLY Ol3SERVATIONS ONEI.L, NEBRASKAGAS RELEASE NO. 25 26 27 28 29 30AUGUST' (1056) 1 2 2 3 3 3CS' 1305 1205 1405 0005 0205 1305
RADIATION (cal/cm2soc)
M.-- -----0 3-- .0202Itefletad I.°(° 15 ..0U101 -- j -- - - j .0032DNut h,,d,,ton .0052 [ .012 [ .0123 j -- ! -. 00031 .0120
_.I IlAIR andson, T I'rEMPFRATURKS'CI -c
10.00 22.87 .. 25.24 26.24 31.888.00 22.92 27.93 30.23 24.70 25,81 32.30
4.00 23.26 28.57 30.114 24.38 25.72 32.062.00 I 23.62 29.21 3113 24.22 25.30 33.531.00 24.1) 29.91 31.906 24.07 25.14 34.00
.50 24.77 30.42 32.62 23.92 24.78 34.73
.25 25.32 31.15 33.45 23.72 24.58 35.42
.12 25.72 31.74 34.25 23.53 24,33 30.10-03 27.11 27.41! 29.97 23.68 22.92 33.29
2532 25.42 27.84 24.64 23.78 30.50- 2291 22. 96 23.93 25.25 24.00 25.03-. 25 22.50 22. 3.1 22.31 23.74 23.08 22.94-.50 21.73 21.38 21.311 21.58 21.52 21.58
-1.00 !L,2 19.70 1 .65 1 1.2 19 821 19.71 ....
VAPOR PRESSURE (mil
8.00 22.57 22 13 21.72 19.274.00 22 401 22.69 21.11(6 -- 0.482.00 2l2.,,t; 23.02 22.02 - -- 10.7.11,00 -- 23.40 22.29 - " . 20.07
.51) .. - 2:1.72 22. '14 - 05.25 23.21 2: 2 2 20.651 23.75 21. 1 22.82 _2. 1.04 1
WIND S PEP D m/6 0c _28 81 849 ) 508 600 885
8.00 318 775 755 388 529 8524.00 207 i 721 094 I 321 441 7752.00 275 640 013 255 304 6971.00 218 568 540 212 340 628.50 221 511 483 J 177 296 540.5 173 422 40)2 154 241 455
"W IND D IIECTION J % Igog
L %il~r L 71 17LL_167 208F' -[- -T-SOIl, TI.M1II:1!,ATURE CIIANGE C
- Tieial 'lmo 125- 2357 0150 1250Hun Tim (min) | ! 27 26 20 27 20-. 03 .04 1._5 1.10 .51 -. ,1 .72
-.06 .21 1.09 .60 .01 -.17 .74-. 12 .07 I .14 .30 -.45 -.10 .02-. 25 -.04 '-.0 .11 -.27 -.01 .05-.50 -.03 -.07 .05 -.o20 .02 00. _03 -.04 .00 _L.31 00 .02
I'r''v )l,ti iu ('zn) .. ..
58

Table 8.1 (Continued)
HOURLY OBSERVATIONS O'NEILL, NEBRASKAGAS RELEASE NO.' 31 32 33 34 35f 35 36AUGUST (1950) 3 6 7 7 7 11 11CST 10 2005 1305 1505 2305 2135 2335
RADIATION (cnl/ern 2s)Insoatlon .015, .1000-1 . 74 - - - ---Roflec , .024 -- .- -- j -- -- -"Not Radiation .0092 1.0013 .010) .0113 -. 0007 1-00091 00085
2 AIR and SOIL TEMPERATUR S ]_ _.....
16.00 33.23 27.21 21,71 29. )9 23.03 23.57 20.748,00 23.44 25.33 27.811 29.21 2 .68 22.30 19.814,00 33.79 [ 23.7t 28.16 29. 1 22.47 21.04 19.322.00 34.25 22.9A 21.73 301.19 22-28 10.73 18.941,00 34.85 {22.4t5 29 16 A)0.99 2)2.17 19,13 18, 63
,50 35.37 222.0 29. 4 31.45 22.05 18,47 18.10.25 35,81 21.61 30.07 32.13 21.94 18.34 10.10.12 36.11 21.312 30.61 32.62 21 79 18.21 17.98
.. 03 34.05 29.57 1.07 23.42 24.85 23.15-. 00 32, 10 21; ,42 27.07 219 24.41 26.02 24. 1
2 225.22 2 .2 25.4 1
.25 2,1.11 2.1,00 22.5H 22.73 23.93 23.78 24.01- . 5 0 2 1 5 0 :2. 2 2 1 . 8 0 2 8 1 2 1 .9 1 2 1 . 6 3 2 1 . 7 4-1.00 !). _) : 9_11) 19.13 2.01 19.,99) 20. 08
VAPOR PRESSURR ( ob)Si8. 1 :3.12 1.f.1 17.00 1 . - 19.08 18.30
8.00 1 ;,5 '1.31 16.917 17.21 20.12 111.13 18.434,00 11.,1.6 15.1Ml 17.11; 17:.1 20.17 19.06 18.442.00 111.7 9 15.54 17.41 17.51 20.17 18.91 11.441.00 I19.07 15. 85 [17. 62 1 *::, 7f 6 210. 23 18.84 [18. 52
.50 19.20 16.01 17.77 1 1.97 20.27 19.32 18.83
.10 19.13 1 5.8 1G7911. M2 I 1. 7M 20.23 18.84 18.52.25 1.. III :!a 8.1 20. 327 111.59 1 11P1
- . .. W . . ... { { _ ......L .. . _L. __ _ ...... _
WIND SPEED '/se
~T~o ~ ~ lll ii,) 283 121.1 6:1) 41 46418.00 - '112 11 ) 11 520 318 3424.00 A87 218 I '"n I ')-9 1,.1 253 2432.00 717 213 7564 920 73) 1380 1861.00 691 1, O f..) I 41 310 110 137
.50 0 17 136 0(4 7o6 2111 P8 116.26 527 95 . 1 - 5 17 -2,11 .15 81
121)4 WIND D11WCTIOYjc ~ - ___. 0. J _ __ 1,, 7
SOIL TEMPERATURE CHANGE (OJ__.-- fn-iI, atTme5 190-TT 225 2120 12320
Run Time (min) 28 27 27 28 1 21 20 M(-. 03 -.06 -. 70 101 .14 -. 3d -. 17 -. 35-.00 .25 [ ... .64, .31 -. 319 -. 49 -. 38-.12 .25 -. 09 .22 .25 -. 11 -. 12 -. 23-.25 .1( .05 -. 12 .02 -. 04 .12 00-.50 00) M1• -. 11 -. 01 .06 .04 .01
-1.00 L 00 01 -. on 1"03 - 04- .0 4 (10
PrecipItation (cm) --
59
3

Tablo 8.1 (Continued)
I1OURLY OBSERVATIONS O'NEILL, NEBRASKAGAS RELEASE NO. 37 38 39 40 41 42AUGUST (1956) 12 12 13 14 14 14CST 0305 050 22.15 003; 030b 0505
RADIATION (cnl/cm2 aec)
lnsalation 4-.- - -00
l~ce lected -
Net adiation .00067 _.008, -0013_J -.0014 -00123 -.00192
_____________AIRI andl SOIL TFMPERIATUltES (40 __________
16.00 21.02 20.07 23.131 21.91 2i.63 21.92
8.00 20.90 19.93 22,39 21.11 20.82 21.684.00 20.70 19.84 21.20 20.00 20.43 21.612.00 20.j5 10.82 20.47 20.0 2020 21.491.00 20.55 1.9. b5 20.01 I9.J6 20,03 21.30.50 20.41 10.34 19.55) 19.52 19.90 21.16.25 20.33 10.46 19,35 19,20 10.02 21.03.12 20.22 19.37 10.00 19.08 19.43 20.90
-. 03 21.68 21.50 25,.09 23.94 22.2r 2!.92-. 08 22.609 2.37 26-.52 24.08 23.53 22.82-. 12 24.21 23 62 27.12 26.41 25.28 24.56-. 25 23.83 23 02 24.h, 1 24.10 24.80 24.47-. 50 21.80 . 21.G1 21.017 21.92 22.06 22.06
-1.00 20.08 20.05 20.03 20.02 20.00 22.03 ___
VAPOR PRELSUR E (ob)10,01 19,77 12.82 13.11 14.93 14.13
8.00 10.62 19.77 12.91 13.15 15.03 14.144.00 19.63 19.02 12.92 13,18 15.08 i 14.192.00 190 2 19,75 12M9 13.19 15.07 14.161,00 19.03 19.73 12.94 13.21 15.08 14.20
.50 20.11 20.00 12.095 13.22 15.08 14.23
.25 1 P.aa 19.12 12.93 13.23 15.00 14.22,12 210.04_ 074 19.731 12,09 13.31 15.00 14.23 [ ,[
_____WIND SPEED _cm/_o_ __
720 679 542 40 71 828
6.0o 008 585 419 343 550 7514.00 528 504 201 250 435 6732.00 459 428 229 208 369 5041.00 400 370 160 158 31. 527.50 344 317 152 / 137 207 452.2 281 250 112 L 216 380 I 1
WIND DIRECTION dg)-1.00 iF______ 1I7 fl) f 122 1 89 i,5- 119 ________
SOIL TEMPEIRATURE CHfANGqE _C_ -
-InItlal 'rime 0250 0450 -- 2220 0020 0250 1 0450Ru Tho (mm) 30 20 28 28 28 28-.03 .00 -. 12 -. 46 -.27 -. 10 -. 05-.00 -. 13 -. 00 .5 -. 30 -. 18 .01-. 12 -'29 -. 11 -.25 -.25 I -. 15 -. 14-. 25 -.04 -.06 .02 -.04 -. 03 -. 00-.60 oo -.01 00o .01 .01 , 0o-.M0 .01 _-.01 -. 021 0 .02 00
l'ru u pltluzn (cm)
60

Tab 8.! (Continued)
HOURLY OBSERVATIONS O'NEILL NE MRASKAGAS RELEASE NO. 43 44 45 40 47 48a 48 48AUGUST (1956) 15 15 15 15 20 20 20 21CST 1205 1405 1705 1850 1005 1205 1255 0905
RADIATION (Cnl/c m2Sc ____
s'-']ni'0n .018 [.004 -,00443 .00W3 .'6187 V.0125 [ - [.142Reflected .0030 .0028 I00080 [.- 00313 [ 00215] :0- 00253
Not Radiation .0108 .0007 .0014 .0014 .0108 .0070 -- .0181
Alit Cc)i
16.00 3L63 33.92 34.59 33.12 16.81 18.55 19.29 17.188.00 32.00 3,37 34.75 33.01 17.10 18.77 19.71 17.704.00 32.60 34.73 34,91 32.00 17.47 19.04 20.11 18.052.00 33.05 35.43 35.04 32.74 17.73 19.45 20.72 18.408.00 31.17 360 35.28 32.57 18.46 19.091 21.31 18.96.50 3492 36.92 35.59 32.44 19.20 0.52 22.10 19.43.0 35.76 37.6 35.12 132.32 20.13 21.12 23.15 19.97.12 36.64 38.64 35.95 32,20 21.30 22.02 24.44 20.4.50 .01 11.3 7 1 2.3 1,50 18.27 025. -- 17.1206 2.84 32.35 33.03 31 67 1 0" " 22.57 16.89.12 24.63 2.11 27.99 2.70 1, 11.33 - 18.40
2U'32 - 18 7 0 12
-.25 23.75 2.1.72 354.11 241 20 4 1.87 20.52450 22.2 22,25 22.12 220 206 20.78 20.732.00 2.13 201 20.02 0.05 2.28 30.3 20.04
-I VAP0Ht Pl1J'SSUaE (il.I-1f: 164 - [i-- V 1--1, --DO- 11.41-= 0. 12.53
8.00mo 12.28 11,17 [12,17 [ 11.51 -- 10l.9 _ 1 12.784 090 12.3 11110 ! 2.1 a 11.57 -- 1 0.26 12-I.812.00 12.40 1115 12.21 1.63 - 10.35 12.931.00 12.50 1119 12.26 1.4 2- 2.49 2.0 13.03S. 12.01 11.30 I 12.3 11.64 -- 10.58 13.17.25 12.74 11.33 12.3 11 .8 -- 10.0 13.27.12 1 ___ 511.41 12.34 _ -,_1 133
WIND SPEED ko3
o-1027I .-- l-- 8 I 7878.00 Goo 2 719 735 707 .374 3 47 35 1 9014.00 5605 80 f? 6-5 625 - 35 329 342 --2.0 522 {02 36 l 32- 307 321 7841,00 460 530 31 480 .302 j 277 2,04 691'50 I411 468 / 460 d 28 270 249 1.00 / 00.25P p 343 397 , 378 [ - , - - 210 2.23 505 O
WIND DIRECTION (deg)....~ ~ 16 156 J_ I -.... I.216_ i-: ,o._WL ' : A T u uF, CH A N GE CC)
--ITI-fill -Tme I1150 Ta 16b 5 0 1 635o0o "T15o0-" 0o850Run Tirme (min) 27 28 [ 20 27 [ 26 28 - 271-,o03 .07 .21 1-.57 I-,77 [1.87 .47 - - Aft
-1.22 .36 .13 -.05 .03 .34 -- 0o-.5..0 .03 .0 .05 .03 -.00 - -.00..0-.03 I -.02 [ -.o2 I -. 04 I .04 -. 03 . . ..02.I.0O _-.02 0-'0] _ __ -'.07._ _ .04 _ . 01! -.02
Precipitation (cm)
61

Table 8.1 (Continued)
IJ OUIiiY ODSERVA'rIONS O'NEILL, NEBRASKAGAS RELEASE NO. 55 -56 57 58 59 00AUGUST (1956) 25 25 25 25 25 26CSTI 0105 0305 1735 1035 2235 0035
RADIATION_(Ca I/czn2 ficcjInsnltallouio. -- f.04 1-
Net__ 1-.001 n 1,05 I3 j-0014 -. 0014j
_______ All and SOIL TIHMPE[IATURES (*C)lyj*ight~ (mi)1600 17.17 15.1 3:1 5 20,50 20061 26.498.00 17.01 1 5.7'0 33.76 20.49 25,34 26.1741.00 I10 I '1 7 3:1.91 27. 1 f 24.31 25.91
2.1 16,75 15,. 29 34.11 23.04 23.630 257
11.00) 16 62 15.15 319 25.------2.132 11.495110 H;.411 15:. 03 J~ 34 33 51 P2.82 25.35
4.0, II T3(j 2452.29 24i 30 ,
.12 .22:1 58 55 '/ -) '.112590 2.10 2.41
.25 23.0:4 i:):) "" . 19 42.99 23.09.52 21-0 . 2 12 2 V2.1 8- f) 2.1 00 20.08
WIND -PE Ihna~ f__ (in __
11. 00 71 19 111 3 4129 159
-.00 11 73 ):.10 124 5!: 1 11~i 11.2.1)0 I9 1 1.3 12u 5!'1 1 1I 20
0 11 '. 1 12.3f 1, ; 1 101 32.4.25 1.7 1299( 1. 103 1,14 12.04
12_ 123 1P.15 15 1 :1.1 12.8
-.00 67 -.2 1 0 -.124 311 -11 5-.102.01 -524 .2 -. 2 2.! -24 26 .147-. 00 5.17 42 .15 -.03' -.1 202 10
-.25 -.04 .9 09 11 03 -.4 04
-. 43 (JO 03 .0118 .0 .0 00 ....J
1;( (1 .212 -.01 J .51 -. 24 00.17 __
-.12iii iiIi.17uu)- -.2 .1 -0 -.- -. 1
62

Table 8.1 (Continued)
HOURLY OBSERVATIONS O'NEILL, NEBRASKAGAS RELEASE NO, 49 50 51 52 53 54 _AUGUST (1956) 21 21 21 24 24 24CST 1105 1405 1535 132n 2005 2205 •
_ _ _ _RADIATION cal/cm2 sec_ _
-Insolatlon .020" .0202 .0158 J .0204 -- --Reflected .0UAsJ .00309 .00200 .00280 0 - - -Not Radiation .0120 .0128 .0088 . 0110 = T0015 -. 0017
_ _AIl and SOIL TEMPEIATUE * _."
16.00 21.45 2.14 28.36 23.17 21.32 19.568.00 21.94 27.68 29.13 23.59 20.26 19.314.00 22.64 27.90 29.40 -I.08 18.77 18.912.00 23.2D 28.64 29.110 24.96 17.30 18.681.00 24.05 2U.20 M-050 25.98 16.56 18.45
.50 25.00 30.05 31 .07 26.7 1b.76 18.25
.25 25,72 31.23 31.97 27.05 15.37 18.04.12 26.38 31.95 32.52 20.19 14.00 17.89
-0 .77 [2.55 30.45 27.56 25.07 22.48o.06 2o.34 26.118 27.78 23.69 26.32 23.92
-. 12 18. 8 21.20 22.15 21.12 25.65 24.88-. 25 .n,! 1 139.99 N . 12 2..-57 22.;, 22.0-=.50 20.60 201.45 20.4 20 91 20. B2 2.u0
- 1.00 19.92 19.383 19.73 __ 5 8 19.561 56 1.64
_ _VAPOR PRESUR, (1. 14.03 14.09 12,4 0.22 10.61 11.408.00 13..84 14.35 13.21 10.72 3(1 79 11.424.00 13.77 1..) 132 (1 69 10.75 11.422.00 13.60 14.49 . 3 3 3 10.79 10.7,1 11.401.00 13.7 14.5 1 1:1.53 ii 39 30.7U 11.42
.50 13.29 14.68 13.57 ii 1) 10.816 11.41
.25 1 3.20 147, 5 :33 1 33.21 30 1 '1 21:19
.12 2.07 14 9: _3392 11.19 314 31.42______
WIND SPEFD ,c/e).16.00 80 TF _ 6j~ 51 1 51 564 3418,00 802 7136 1104 508 44( 6 374.00 752 764 "'16 f 406 3 320 4642.00 674 673 6332 .442 228 3941.00 003 06 (313 I 40, 156 3,10
.50 22 -- 547 1 237 29
.25 444 448 475 3l1 1 () 1 248
_______ WIND DIflECIION (deg) .. 4. . ...
________ ______ SOIL T1MP'E:IR3ATUR3 CItlA GE C(Q 1hltal Tlime 1050 1350 1610 151 25 MIA 23501lun Tim. (min) 211 28 25 26 26 27-.03 I 1.44 .56 .,,2 1.21 .. 9 ... 97 .60 .20 .89 -. 6t -.44-. 12 .22 40 I .14 .20 -. 2 -. 21-. 2I -.06 .02 034 .0 .07 .04-. ,0 -.03 -. 02 -. 03 -02 I .01 00
-1.00 -.01 -.03 -. 02 L -.02 .(01 00
ir3c~ ip1hill lla (cn) ....
63

Table 8.1 (Continued)
HOURLY OBSERVATIONS O'NEILL4 NEBRASKAGAS RELEASE NO. 01 62 03 64 65 68AUGUST (1956) 27 27 27 27 29 29CST 1105 1405 2005 2235 1930 2136
___ DRADIATION..al/cm 2 s ec)Insolation .0190 lO -- -- " " -"Reflectod .003 0017.1 -- -- I -- .Not Radiation ,000 1-0072 -. 0011 .0005. -0-,022 -. 0018 .
_ _ AIR and SOIL TEMPERATURES PC)Icight (m)10.00 29.80 29.77 29.52 26.77 25.98 22.02
8.00 30.41 30.00 27.27 23,85 25.01 21.224.00 31.00 30.40 25.54 22.16 25.22 20.052.00 31.63 30.75 24.07 20.90 24.96 20.191.00 32.29 31.15 21.41 1960 24.76 19.88
.5f0 33.20 31.58 19.24 18.70 24.57 19.57
.25 34.10 32.10 18.17 18.16 24.30 19.27
.12 34.61 32.35 17.57 17.83 24.04 18.99-. 03 30.12 30.02 26.64 23.49 I - -
-. 08 25.80 28.56 27.33 24.08 .. ..-. 12 23.60 25.44 20.30 25.54 .. ..-. 25 03.19 23.01 23.77 23.98 - ..-. 50 21.49 21.39 21.55 21.59 ..
-1,00 19.0 19.01 19,50 19.78 j.-- -- _ ....
-~_______ VAPOR PRESURE (mb). .11.04 L2,41 15.09 15.33 .. ..
8.00 12.35 12j.5 15.04 15. 8 - - I4.00 12.10 12.07 14,i8 15.87 - --
2.00 12.20 12.83 14.13 15.58 -- --1.00 I 12.20 12.91 13.64 15.13 -- "-
.50 12.28 13.13 13.20 14.86 "- "
.25 12.36 13.30I2.1 14.80 -.. 1-4 6
.12 .12.,..._.L I J±2Q I . ... - -- 4!1
WIND SPEED {cm/s ac18.00 980 032 1 2(7 307 788 650
8.00 , 926- o30 I0 15 209 626 504.00 I "" I 583 139 169 530 3922.00 I 782 518 118 120 455 3141.00 I 700 4(1 26 .46 303 250.50 814 405 -- P. 5 339 217.25 520 343 " - -- 277 177
WIND DIRECTION _A.t)- ii i ioo . 189 . 1159 L 1. I _
SOIl, TEMPERATURE CHANGE ('C)Tie10,00 1353 11950 2220 -
Iu,, T.,,,, (.,l) 26 23 27 27 ---. 03 1.40 .46( -. 80 -. 24 --
u -. 27 -. 64 ".31 -S-.3 -. 19 -
.,25 L-008 .03 .08 I ,°l--
-. 0 :05 .01 I .04 00 l1.00 03 .05 00
IVrecipilhtIon (cm) .. .. .. ... . ...
64

Tablo 8. 1 (Continued)
HOURLY OBSERVATIONS O'NEILL, NEBRASKAGAS RELEASE NO, C-17 68AUGUST (1956) 30 3UCST 0035 0236
'insolaiion - ~RAD IATION (cal/cm 2 ac)....____ ___
Reflected --
Net Radiation -,0 .0000 1
-A!IR and SPIL TXMPERAT1JHlES (0C).__ _____
Height (in) .16.00 21.12 21.97
8.00 20.88 21.364.00 20.66 20.912.00 20.55 20.f51.00 20.38 2031
.50 20.21 2024
.25 20.19 20. O8.12 20,02 10.88
-.03 ... ..-. 00 - -
-. 12 ... -,25 --
-. 50-____.ii. ____--._--1.00 ____ ________
VAPOR PRESSURE mr L ,)
4.00 1 32.00 44 - 91.00 -- -2
.50 33 -1
.25 - -49
-. 12
WINDSPE2C ( se16.00 748 5588.00 015 42!74.00 521 3312.00 444 2639.00 385 219.50 330 188.25 274 149 ___
WIND IRP17~TION (de'______ _
________SM TE___soi iMPERAUREm CHANG~JJ__
11i-.00 ic - -- -
-. 12 I-. 25 -
l'ieullhation (cm) --
65

Tablo 8. 2
HOURLY OBSERVATIONS July 10, 19,56 O'NEILL, NEBRASKA
LCSTL _ __
_ 1, 1405 1 _ 190RADIA'rION (cal/cm
2q). __
-so -. -- .1112-5 . 'l2?50 --.10 f .0115 .0066Reflected .004U .0u39 .0!13 .0027 .0023 .0015Not bdlto, ' . l38 .0128 .01u8 .0085 [ .0057 0025 t I
_____ _ __ AlIt and SOIL TEMPE ATU ES (=C) __llelght (M)
16.00 28.55 28.71 29.22 20.85 29.90 20.898.00 21.09 29.04 29.57 30.18 30.15 30.124.00 29.21 21.4)fi Z9.75 30.61 30.57 30.342.00 29,84 30.27 30.34 30.73 3..10 30.521.00 30.50 31.21 31.10 31.61 31.47 30.79
.50 32.01 31.99 32.01 32.30 32.01 31,00
.25 32.93 33.10 33.39 33.22 32.58 31.16
.12 33.92 34.33 34.27 34.16 33.06 31.38-. 03 33.68 34.89 35.41 35.22 33.74 31.75-. 06 20.89 30.53 31.58 32.08 31.77 30,82-. 12 23.25 24.23 25.34 26.16 2G.77 27.19-. 25 21.01 21.11 21.27 21,55 2184 22,17
-.50 20.07 20.03 19.97 20.00 [ 19.99 19.97-1.00 18.23 8. 22 18.19 18.22 18.22 18.23 -'
VAPOR PRE SSU RE (m ..10- 11.90 12.91 12.12 13.28 13.16 13.41 18.00 13,06 12A.)7 13.U 13.81 13.87 13.54.00 13.03 13 02 13.10 13.87 13.72 13.632.00 13.12 13.05 1316 13.92 13.75 13.6D i1.00 13.32 13.18 13.42 14.15 13.85 13.78.50 13.71 13.50 13.63 14.52 13.08 13.8B.25 14.26 13.85 13.94 14.65 14,16 13.93.12 14.,81_ 14.15 14.31 21 ..2 14.32 14.02
_______w__ WIND SPEED (qcinec16. . 362 5 5 I 479 506 o11 8278.00 314 508 433 / 401 540 7104.00 324 481 408 427 498 0472-. 00I 20A 4441 370 I 390 / 452/ 5721.00 277 402 350 353 406 503
.50 246 352 309 308 350 432
.25 203 295 257 25 3 2 6.3_ 2
WIND .DIECTION (d _
1.00 [ 1i~z ~ __ 171 f ____
11 SOIL.TM PII'tATt1l.C1A GE ("C'nitii, T 'lmo 3 - ---1 24 H52 1550 1757I,,l ,i,,. (mi,,) 26 -- 29 20 21-.03 .65 -- .02 -. 37 ---061 M 8 .40 .8 -
-. 12 .55 ... .3. ,5 ... ..-. 25 .02 -- .08 .12 .. ..-. 50 -.05 .- -. 04 1-.01 .. ..
-1.00 0 ] - I)!I 0 -
1I'i'iililhtll lin (wn)
66

TaI( 8.2 ( . o.jt. M I lu d)
IIUURtIY OI3 ISEVA'PIONS July J, ]1,61 O'NE!LL, NLRMASKA
CST 1905 200 2)5 0flU 5 *-~L 0205k_____
________1,_1 RADIATION .cIm2 fj. _ _) __-1
1118-011~ti -m .0)2 -. -I
16.00 29.15 2.9U 25.72 .-- -
8.00 29 12 26.36 25.06 23.2 21.W) 21.92
4.1)0 29.07 25.90 24.47 23.03 21. 6 1 21.502.01 2U.U3 25.50 24.13 22.11i 21.311 21.241.00 28.90 25.2t; 23.81 22.63 21.12 21.04.50 28.96 25.02 23.45 22.47 20.96 20,86.25 28.91 24.78 23.20 22.29 20.74 20.64.12 28.89 24.58 23.03 22.13 20.58 20.38
-. 03 30.34 28,48 26.89 24.10 23.47 22.91
-. 00 29.9) 28.78 27.19) 14,.!A, 24.40 23.19-. 12 27.2 27.0 2,1.4 25.54 25. 16 24.86-. 25 22.42 22 72 23.00 23.30 23.33 23.34-.50 19.9) 20.0) 21 Il) 1 20.20 20.26 2(.34.' .00 ,111.20 18.25 18.32 (,.:) 18.34 1,t.35_ _
VA'oR1 I)1SJU.1_IJI,_ (InI___81.00 14.2,1 14.00 14.20 15.7) 16.06 19.04
4.00 j 14.35 14.114 4.24 15.7: 16;. DO 101.072.01 14.43 14.113 4 1,.2)) 15.7 6 16.02 l6.6)(1I 0 14.54 14.!)11 1 14.3, P),7H t60l 16.09.50 14.58 1502 3l 1;. 15.78 1 6.03 16.11.25 14.13 S12 14.43 15.150 .5.U8 1,111 .1 70 15 1 2 14.5, 15.8.) 16. 00 11.13
WIND N PE 1-:0____.,___16. 7 Of) 1 ) ) .. .11). 1368 6.,) 00 1139 478 501 640 j 1061 4014.00 51'0 380 397 554 100 416 12.00 497 307 322 484 775 352 I1.10, 432 2,,O 279 .115 661 005
371 21 23) 12 576 262,25 [ 29 l1 _ 17,3 204 J457 1 20 173
__________ WIND DIREC(TION (doi)_______Soil,, ,,iJ- i .:( C, IN , C I..SOIl. ':RI'tI:IATIII)I
.1, ('IIAN(;.LLL'C
,,hlal Time 1850 F lr) 2 50- 2353 0058 0155IlV Thz.u, (111111) 2)) 28 28 211 26 22
M. 1.-84 -. 7 -1fill .27 -. 20 .20.-,06, .51 -. 52 -. 53 -. 30 -,1" .20-. 12 | .(j2,' -,U 17 -. 19 =.08 .11
-. 25 .I .14 .0 0 .1)0 .A1-50 2 j '1 0 -02 .1KI 9-I~(, '01~ .05F . 0J...1 -. 04 0 .02
I-1 f. lliah t loll W III)
* July 11, 1956
67

Tablo 8.2 (Continued)
HOURLY 03SERVATIONS July 11, 1956 O'NEILL, NEBRASKA
CST0305 0405 0505 0605 0705 0805
RADIATION (cal/cn12sec)"Insolation -- - .0001 0020 05
Iterlected 0- .-- .0003 1.0014 .0 INut l.dat~o, -.0 .:09_-.0012_.000 .0028 .0042
AIR and SOIL TIMPE ATIIRI Is ___! _0
1! 0 .. .I .... 1 -I)
8.00 21.86 21,88 22.33 22.87 23.49 24.024.00 21.61 21.09 22.29 22.83 23.69 24.232.00 21.30 21.58 22.12 22.80 23.87 24.351,00 21.10 21,42 22.04 22.77 I 24.03 24.51.50 20.97 21.30 21.87 22.74 24.23 24.66.25 20.78 21.18 21.06 22.67 24.38 24.81.12 20.61 21,03 21.54 22.64 24.50 24.88
-. 03 22.44 22.18 22.07 21.96 22.35 23.19-. 06 23.34 23.02 22.74 22.55 22.5. 22.84-. 12 24.48 24.13 23.80 23.56 23.30 23.07-. 25 23.28 23.1 1 23.08 22.99 22.87 22.70-. 50 20.40 20.38 20.40 20.44 20.44 20.40
.1.00 [18.36 18.34 .18.32 18.33 I1831 18.28
VAPOR PRESSURE nib_-T -0 10.34 16U.73-F-7. 16 U 7, IU I H ,UU 1t8.32
8.00 16.30 16.68 17.10 17.21 17.92 18.384.00 16.35 16.71 17.15 I 17.39 18.09 18.582.00 36.36 16.76 17. 1W) 17.30 38.10 i8.821.00 16.30 16.75 17.21 17.39 18.19 18.94.50 16.43 1 6.8o) i. i, 4 f.47 18.15 18.68.25 16.46 10.,82 17.24 I17 .54 18.22 19.32.12 16.40 10.82 17.24 175.1 18.15 10.42
WIND SPF1,
8.00 500 559 707 080 7193 9304.00 429 491 628 07 704 8332.00 365 437 558 543 / 636 7441.00 314 383 48 4 553 649,50 272 327 424 411 484 570.25 204 267 348 340 / U2 408
WIND DIECT'I ON (d)
SOIL TEMP:ITU1Rt, C lAN M "CL-Itl'1(, 0.) 23 25 24 20 20 26-.0-3 15 ". / .03 I .,)8 ,-i 1 / -.20 [ -.26.00 .07 1 .14 / O .I 03 .. 04 -. 1 5 1. 2 .12 .06 .10 .0 .8 .-. 25 12 .16 .04 .04 .118~
-. 60 .02 I -.01 -.01 - .02-1.00 -.02 201 0
I' ' lI)J111llol (cm) .. .. .. ... ..
68

fTable 8.2 (Continuced)
HOURLY OBSERVATIONS July 11, 1956 O'NEILL, NEBRASKA
CST-- -___ 0905 110505 1__ ______5-4 __________
RADIATION (cl/cm 2
nolation ,35 200 "-- -190 .22 .c' 0135 .1Itofl'1te J .0028 .0038 .0037 .0030 .0028 .0032Ne Radiation .0082 .0128 .0125 .012 .0080 .0075
II[ i od SOIL 'I'EMP IATUIDS (1C)
16.00 - 27.13 29.54 31.20 32.47 32.028.00 25.06 27.2'7 30,00 31.67 32.83 33.384.00 25.38 27.93 30.46 32.13 33.32 33.812.00 25.87 20.11 31.39 32.85 34.11 34.331,00 20.00 20.84 32.22 33.26 34.80 35.23
.50 26.77 30.40 32.98 33.97 35.75 36.19
.25 27.30 31.04 33.82 35.26 36.98 37.17
.12 27.89 32.07 34.71 36.49 38.02 37.76-. 03 24.42 29.290 34.30 35,52 36.46 36.00-. 06 23,37 26.06 29.64 31.12 32.34 32.72
-.25 22.58 22.34 22.34 22.3b 22.50 22.58-. 50 20.41 20.37 20.40 Zu.34 20.38 20.26
-l.00 ____ _ 182 J 18.21 2a 18.21 18.20 18.18
VAPOR P[E.'SSUI[E F(. .IT).O IfU 23.-1F A3SJ4 -2 7. 62 124.01 23.55
8.00 19.17 23.48 23.62 22.94 24.31 23.694.00 19.20 23 57 23.40 ?,3 11 ! 24.45 23.742,00 10.26i 23.78 2:1 40 23.22 24.75 23.891.00 19,34 23.911 23,54 23.34 24,94 24.10.50 19.51 24.31 23,73 23.57 24,90 24.15.25 2U 05 24.61 24.06 23.85 24.91 24.55.12 20.21 25.07 24.58 24.26 24.88 24.75 _
WINI) SPEI'1D (cm/s__)I, , oo 1 13 5 -670 ,4 486 63o
8.oo 923 684 626 - - 463 6284 I0 837 634 575 D.A3 435 502 00 761 582 530 4,0 403 5151.00 6601 519 471 439 360 484
o.50 1 85 | 460 410 ; 390 |320 42925 527 380 350 321 326 361
WINO DIMII'EC'ION (d_ _
851-SC)!l, 'IM I:IIATU III'; CIIAN(IE (C) _
11 'I latTj " 050 6( 15 350 1453 T15.50,u, (,i,,,, n) 26 26 20 27 25 27
. 3 +.87 1.12 f.67 4.52 q.20 -. 2306 03? t.76 +.G . .i -0J1
...12 u 4. 1 4.3, +.34 +.28 +.25.25 -0 -,03 0 +,01 .03 +.07
..50 0 0 - 0 -02 -.01 -.03-1.[ . -. o0 -. 04_.. -. 02 - -. 01 -. 1
I-rcciladton (C111) .. . .. .
69

''ablo 6.2 (Cgutlnued)
IOUIiLY OBSERVATIONS July 23, 1956 O'NEILL, NEBRASKA
cs'r 01)9 105 1205 305 145 00
RADIATION (caI/(!1128e
oil~ - - -- I -j-_ --- Y -1--Net WidiidlOn .0080 __.011 .. 1.1. U. .0117 J.O
______ - AII and SOIl., 'I2-E21.7'WT[/LS ('C)' 2h2Ilht (in) - . -.--- ____
1600 22.67 26.10 27.43 28.56 30.54 30.928.00 23.18 26.83 2.89 28.83 30.91 31.224.00 23.65 20.89 28.30 2D, 52 31.76 31.61
2.00 24.19 27.81 2ii. 11 30.45 32.47 32.03.0 25.04 28.73 29 82 30.91; 32,85 32.80.50 25.fl 29.59 31.02 31.85 33.62 33.08.25 20.80 30.92 32.17 33.U5 34.9U 34.62.12 27.44 31.07 33.06 34.21 35.80 35.22
-. 03 23.44 30.35 33 22 35.40 37.20 3(.62Of 61. 25.811 28.20 311.24 :12 72 33.05
-2 21.37 22.10 22.81 23. 74 257 221 48
21 VA_2(Jl 1 12 i1r7 2 1. W1_ 21. 8
VAPOR PPE S . .. .. ..
8 ill 18.47 - 2 I4.00 18.50 17 5 -- 13 I2.00 18.54 1.57 -.. 13.841.00 / H1)1 2 17.77 2.. H - 3.82
I 80 18.14 AM ,61 1 3 149 .I 8.86 18.34 -14 07
.12 19.09 28.83 25 30 - I. 21 _0
I .00 1 I 12 522-.100 409 3711 424 / 423 511 485
.O0 41N 35 :197 452 472 4 ,1552.() 0 425 342 :273 42) | 457 1231.00 379 30.
, 3:14 :117 410 182
.50 338 275 30:3 34:2 3Ii! :0 6
.25 2U] 234 2,55 289 3113 217
I '6" "- WIND D)IRECI(,N cdig
SOIl, T,:M IPI9A'IMII.: (HANGE (Cl'., , 57 2 15 1254 1 5 234 12555
Pll 2 I.e (mil) 27 25 .27 2) 2 5 10-. 03 , 38 .89 .63 , -2 -.316-.02 .74 .23 .74 .72 .26 .16-.12 .07 .22 .30 .49 .21 .16-.2 b05 -0 -. 04 .13 .17 .25
50 _____ 0 -~j.08[ .. 04 j.118 02___ .12-.00 .t° 1 t- L -0 3 I - -02 -o .
70

Table 8.2 (Continued)
HOURLY O13SERVATIONS July 23, 1956 O'NEILL, NEBRASKA
c'1705 1805 1905 2105 2305 0005*
.. ... .. .I TDATION (llcm2 q). ..
1Fiol l Uio -i .009 0 o 0018Netlladaton L~. 1017 - 00"7 -. 0011 j-0014 -. 0014
lh, ight (m) All( anod SOIL, TI' IIAUTIIREIq qISC
16.00 31.21. 31.05 29.9:6 2.1G3 23.68 24.828.00 31.48 31.27 30.04 2t;-491 23.13 24.264.00 31,93 31.52 30.04 26. 111 22. A9 23.93
2.00 32.37 31.77 ;IU.ol 26.01 22.34 23.55
1.00 32.65 31.99 30.02 25.70 22.07 23.15.50 33.16 32.26 30.01 25.511 21.74 22.59.25 33. 61 32.5() 30.01 25.40 21.51 22.27
.12 34.06 32.69 30.03 25.22 21.33 21,99-. 03 34.40 33.20 31.31 27.98 25.27 24.66-. 0r 32.77 31.81 30. Co 21.31 2i.20 25.69-. 12 26.08 27.30 27.2M 21i.95 26.16 26.07-. 25 22.10 22.52 22.74 23[ i7 23.44 23.75-. 510 20.31 20.38 20.32 26.32 20.38 20.65
-1.1,(1 81.58 [ 18.54 18.54 - 111.54 65 18.93
VAI. I' .S l I: l Lt -,9 -1 -6.01) . ... . . -- 1.3 ~ l -~
8.0- -- 1 5.A8 15.17 16.464.00 1 fi.-- 1.26 15.1 16.502.00 - 15.74 15,12 111.431. 00 -- .1 15.09 16.34.UO -- 5.53 15,13 16.30.25 -- 15.71 15.16 16.11.12 --- - -1558 15,15 16.11
1. 37,'1ND s ',.:i'.%V DSP , , . I(rm,1aHi16.00 " 3 1178 I 731 532 575,A.o 60o 706 635 410 474 3084.00 537 667 561 141 385 3412.00 4H7 "- - - 278 330 288S.00 44D 505 437 233 27'9 241
.50 390 442 377 176 241 217
.25 326 368 310 160 174 118
WIND DIIECTI'ION (deg)1 . ..... ! 1 0 0 l -- 0 1 - .,T --[ 1 8 _ 2 U -0 --:~1 2 5
SOI1, TlI;MII'lATII CIIANGI;V ( .. .liitia 'l imIe 165 1753 1850 2050 2252 23521un 'lhne (.7, h1) 20 13 27 27 33 25
-.)i -. 9 -A62 1-.76 I.68 -. 40 -. 33-. 06 -. 35 -. 38 -. 48 -. 58 -. 43 -. 31-. 12 .37 .22 U -. 26 -. 24 -. 17-.2 -.o4 .m I .12 I 0 .07 I o. 15 -. 01 0 0 .07 .01 ]-1_.00 . .. ... 1__2 .. . q . - 9 . -, o q I .. i . -,ol
l1'rcul' it( l otl (cnl) .- -- .-- -.-July 24, 1956
71

Table 8.2 (Continued)
HOURLY OBSERVATIONS July 24, 1056 O'NEILL, NEBRASKA
CST 01o Lt 0 -, RADIAT ION ( al/cm 2sec)...
Insuola ion IA ""AI."0I-" -- I ow. l [.0013tllflected -- .0 - U00 .0003Net Madlfiton [. .1130L17 -.00U18 U0008
AIRannd SOI L TEMPEriATI1IIFS (C
10.00 24.31 22.55 20.00 19.83 19.64 18.748.00 24.17 22.18 20,62 10.47 19.52 18.704.00 23.98 21.93 20.35 I19.2' 19.41 18.682.00 23.8t 3 21.73 20.18 19.08 19.25 18.601.00 23.65 21.47 19.90 6 lh.95 19.13 18.50
.50 23.30 21.23 19.02 18.68 18.95 10.43
.25 23.05 20.91 19.32 18.48 18.89 18.34
.12 22.80 20.64 19.02 18.33 18.62 18.26-. 03 24.23 23.71 22.92 22.37 21.91 21.6U-.06 25.04 24.58 24.02 23.50 23.00 22.64-. 12 25.65 25.28 24.U6 24.60 24.32 23.99-. 25 23.76 23.15 23.70 23.70 23.,62 23.52-. 50 20.70 20.74 20.80 20.84 20.88 20.91
-1.00 18,3 j 18.92 18.93 94 18.94 18.95
VAPOR PRESSUHE (rb
8.00 f18.47 17.74 (7.9 (8,05 1 8.35 18.054.00 1 8.44 17.70 17,97 18.09 18.42 18,032.00 I 8.41 17.61 17.98 18.17 18.45 18.051.00 18.30 17.57 1 o.01 18.19 51 1(8.07
,s0 183.3 17.57 18.07 18.21 10. 5 15 1. 12.25 18.31 17. '18 18.09 ! S.23 18.161 1 8.13.12 H .3 1 17.43 1814 1 8. 25 1.71 18 11
_______WIND SPEED Ccin/s c) __
11.0 69 1105 IT T63 7 -6(42 -5'848.0U 559 4172 418 1 405 542 5324.00 4607 415 37 i 435 463 5052.00 375 355 31( 37 1 411 4201.00 321 307 7J 328 378 380.50 204 267 229 287 33u 336.25- 246 222 17 __ Z4 4 28i 289 I _
WIND DICUTION Idr.) .....--rh61o-o I3O 32 31J32 2
SOIL TEMIEIlATIIlE CIIANGE L_I-nitial T- mo -0051- - 57--023 .. 0450 0051,,un Time (nm) 25 1.9 20 2"I 1 27 25-. 03 -,12 -.26 I -3 I-.20 I -,.12 -.11-.06 -.17 I-,21 I-.'8 I-.10 j/-.12 -", 15 /-. 12 -.15 -. 13 . I-.11 -. 10 -.14-.25 -.01 0 1 -. 03 0 -.06-,.0 .02 .03 .01 .03 06 -.02
..100 0 .01 0 0 --.02 I
1rucelpllatlin (eM) -- -- -
7/2

Tablo 8.2 (Continued)
HOURLY OI3SERVATIONS July 24, 1956 O'NEILL, NEBRASKA
CST .]0705 ] 80 -0 15 05.. 1105 1205
RADIATION cal/cm -ac)Insolation DY.00 , 0182 .0212 ".02250
Reflected .0 . .0030 0035 .0039 .0041Not Radiation .0084 0115 .0133 .0144
AIR and SOIL TEMPFATU s8 (°C)
16.00 19.75 21.48 22.78 24,58 25.64 26,778.00 20.95 21.87 23.09 24.90 26.05 27,034.00 20.05 22.13 23.50 25.26 26.60 27.872.00 20.20 22.48 24.02 26.04 27.23 28.661.00 20.35 22,73 24.66 26.91 28.16 29.74.50 20.42 23.20 25.08 27.68 20.11 30.38.25 20.59 23.0 25.77 28.44 29.80 31.31.12 20.67 23.98 26.30 28.83 30.52 32.02
-. 03 I.i.70 22.75 24.72 21.44 3U.20 32.65-. 06 22,38 22.60 23.47 24.84 26.57 28.38-. 12 23.00 23.43 23.30 23.38 23.74 24.30-. 25 23.37 23.29 23.16 23.04 22.90 22.85-,o 29.90 2U:97 2(.98 21.00 21.00 20.08
-1.00 18.94 18.96 1H5 18.H4 18.87 18.85
I______VAPOR PRE. SUWIE Lmb10,00 T 7.-u T97' ZTF9i 1 l)1JW "-. 4
8.00 18.05 18.36 18.00 17.1U 15.96 12.744.00 18.Ub 18.34 18,04 17.15 16.12 19.742.00 18.03 18.37 18,01 17.14 16.08 12.081.00 18.09 18.43 10.07 17.25 16.19 12.70
.50 18.13 18.48 11. 19 I 17.39 16.23 12.11
.25 18.12 H.48 18.21 17.18 16.20 12.83
.12 18.21 18.57 18.30 17.68 16.17 12.88
WIND SPEFD (cmnsc10.00 843 905 929 994
8.00 763 828 856 904 889 80634.00 708 710 723 756 745 7652.00 609 608 614 662 658 8791. M 552 532 540 585 585 013
.50 S01 475 492 537 538 560.25 426 412 416 455 455 502
WIND DIR CTION (di'),.00 34U- -m 7 - [-340 1340I " 34
SO!M TEMP'IATURE. CIIANGE (T)iliial 'ime "00 1 [ ,7n0 - 01,1 , ' 1050 1150 "Run Time (rn) 35 27 26 25 29 130-.03 .20 .70 ,7 1.05 i 21 ,88-.00 -.03 .29 .46 .61 .75 .74-.12 -14 -.06 .03 .00 .21 .29-. 25 -. 06 -. 02 -. 04 -.05 -. 05 -. 04-. 50 -.01 1,06 .02 O 0 -.01
-3.00 ,-.01 ,01 0 -.02 -. 02 -. 02
3'ecljl h (era) -73
"/73

Table 8.2 (Continued)
HOURLY OBSERVATIONS July 24, 1950 O'NEILL, NEBRASKA
-ST 1305 1405 1505 1 1 5 1
RD4ATION (cal/c m2, c)1n-olation .0222 .0208 .0183 .0150 1 .0063 .0019Rteflctcd .0041 .0030 .0034 .0030 .0017 -Nut radiation .0142 .0127 .0109 .0080 .0014 -. 0011
Alit and SOIL IEPltATUE (°CC)
10.00 27.71 28.60 28.92 29.04 29,09 28.45
8.00 28.11 29.83[ 29.30 [ 29.63 20.19 28.54.00 28.75 29.5U1 3007 / 30 12 ?.Q54 28.542.00 29.93 30.08 { 30.74 30.83 29.82 28.56
1.00 30.35 31.11 [ 31.44 31.24. 300OR 28,59.50 31.32 32.05 32.17 31.84 30.36 28.60.25 32.54 32.04 33.08 32.42 30.72 28.65.12 33.36 33.71 33.08 33.26 31.17 28.63
-. 03 34.60 36. ?2 36.74 36.43 33.54 31.58-.00 30.03 31.45 32.5? 32.05 32.03 30.09-. 12 24.98 25.T/I 20.47 2'1.17 28.04 2808-. 25 22.84 22.04 23.03 23.20 23,45 23.69
-. 50 20.98 21.03 21.01 20 90 20.87 20.85-1.00 18.82 18.84 18.8U 18.75 18.87 18.87 1 1
VAPOR PRESSURE (m"-IfO. ITY-F. -FF Fc- 1o.51 16.46 12.28
8.00 11.82 I 11.05 11.89 16.88 16.01 12.384.00 11.84 I 11.68 12.00 1 .88 i,6.- i 12.382.00 11.66 11.65 11.70 10.84 16.45 12.361.00 11.78 11.68 11.79 16,71 16.44 12.35
.50 I 11. 12.19 11.93 16.81 16.46 12.26
.25 12.24 12.76 11.93 16.02 16.57 12.30
.12 233 12.84 12.21 17.14 16.57 12.36 ,_,
WIND SPEED (cm/@ec)---60 856 790- _ 825 1 657 -- 4i7 503
8.00 793 707 745 588 433 4274.00 736 688 704 566 426 3982.00 657 611 618 501 376 3391.00 595 540 554 444 337 291
.50 540 485 507 401 206 259.25 477 420 434 353 264 224
WIND DIRECTION (deg
1.00 30 [ 14 m..L___-- t _____
SOIL TEMPEIRATUIRE COI OF, CLTiii-laTme 1250 1350 1450 1554 1752 1850
Hun Time (mi) 27 27 26 27 25 ' 26-,l .0! .4 -.3 ..3 F
.06 .74 .46 . 30 .06 -.33 -. 52-.12 .32 .30 .30 .28 .05 -. 02.60.01 .02 .03 .09 .10 4.06
-1.00 -. 01 0 .02 0 .01 0
7__ .
Pr, c ipltton (cm) -- -- -- -- - --
74

Table 8.2 (Continued)
HOURLY OBSERVATIONS July 24, 1956 O'NEILL, NEBRASKA
csar 2005 f2105 2205 12305 10005' 0105-
a o.RADIATION (cal/cm2sec)lisolaio .000 II
Reflected 0- 0:: -.090 TNot Radiation 0-.00" -.0012 [-.00 01 . . 000
AIR and SOIL TEMPERATURES (-C _
16.00 27.19 26.40 25.42 23.60 22.44 21.26
8.00 26.47 24.30 23.13 22.37 21,29 19.584.00 25.28 22.98 21.83 20.73 19.43 17.152.00 23.83 21.71 19.63 19.17 11.62 15.941.00 22.94 20.23 17.27 16.31 18.54 14.54
.50 21.68 18.52 16.01 14.68 15.76 13.05
.25 21.02 17.49 15.42 13.73 15.20 12.13
.12 20.26 16.30 14.81 13.02 14.77 11.58-. 03 29.13 26.72 25.05 23.70 22.64 21.70-. 00 29.62 28.04 26.68 25.49 24.48 23.62-. 12 27.94 27,63 27.21 26.69 20.14 ---. 25 23.05 24.19 24.33 24.42 24.44 24.46-. 50 20,95 21.05 21.08 21.10 21.16 21.24
' -1.00 18.91 18.95 1 19.00 19.04 19.08 10.16
VAPOR PRESSURE ( )160012.36 12.93 12,40 13.18 13.74 13.16
8.00 12.28 12.64 12.46 13.18 1358 12.894,00 12.26 12.42 12.46 ] 13.20 13.55 12,762.00 12.22 12.28 12.38 13.25 13.56 12.711.00 12.20 12.19 12.22 13.1U 13.52 12.67
.50 12.33 12.08 13.34 12.66
.25 12.22 11,08 11.6 : 13.08 t 13.15 12.64
.12 12.18 11.07 11.04 3.3I 13.1_ . 12498
WIND SPEED em/s.c)10 [ 417 442 48 4-- 7 8 1512 5218. 00 3i7 [ 27U 387 [395 [414 [378 [
4.0 250 172 301 291 302 2302.00 146 115 216 217 202 1781,00 85 69 1in 12G 137 116.50 36 21 7 q 6 . 92 48.25 2 18 J 27 I 16. __ ,
WIND DIRECTION .dct)-
SOIL TEMPEIRIIATURE CHANGEluli ttl 1951 2353 0T.5.3lun Time (nL) 26 27 [27 1 25 31
-i~iu -.83 .60 -.57 -.34 -.49-.00 -.73 -. 64 -.57 -.50 -.30 -.47-. 12 -. 10 -. 16 -. 20 -. 28 -. 22 ---. 26 ,17 .04 I 05 -.01 -. 01 -.11-.60 ,11 -.ol .03 0 0 -.03
-1.00 L_ 0 1 .02 -.01 .02_ j .02
Pruclpllation (crn - -- --* July 25, 19568
75

Table 8.2 (Continued)
HOURLY OBSERVATIONS July 25, 1956 OtNEILL, NEBRASKA
CST 0205 2 305 0405 osoL o s_ 0705 1
RADIATION (cal/cm2sec)
Insolation - - -- -- ,.0000 .0017 .0057
Roflected "" "" -- .000 .0006 .0016Not Radiation -0009 -i.!0d -.0012 0011 -.0004 .0022
_________ _ AIR and SOIL TE'I'MPERATURES (°C) .Iieight (m)16.00 20.05 18.35 18.15 17.65 17.14 19.228.00 18.51 15.34 16.34 15.56 16.07 19.404.00 15.78 14.13 15.07 14.04 16.52 19.562.00 14.60 13.73 14.47 13.25 16.41 19.751.00 13.61 13.38 14.00 12.86 16.36 20.09.50 12.56 11.91 13.06 12.45 16.27 20.33.25 11.77 10.73 13.34 12.13 16.24 20.69.12 11.04 9.86 13.01 11.89 i16.19 20.8?
-. 03 21.24 19.94 19.47 19.21 18.99 19.82-. 0 22.78 ? 21.40 20.90 20.31 20.64-.12 '5.06 24.56 24.0 i 23.60 23.14 22.82-.25 24.30 24.18 24.00 23.90 23.69 I23.550 21.24 21.26 21.30 21.29 21.32 21.34
-1.0 19.15 19.16J 19.18 19.16 19.08 19.09
VAPOR PRESSURE (rb[-~~ 32 --oo1'i.-f-.-3T- -. . 114.658.00 12.33 12.0l I 14.874.00 12.23 11.95 -- I-""- I 14.792.00 12.20 11.11i I -" 14.861.00 12.28 11.79 -- I -- I 14.87.50 12.30 11.83I I -" 14.02.25 12.36 11.001 -- I -- I14.08.12 12.6 3 22.27 L -_ -- -" 15.05
WIND SPEED (cm]aec) ___
8.00 398 217 442- 414 I 514 5 12 I I4.00 220 118 301 267 426 4662.00 153 70 230 191 365 4291.00 95 55 ,174 I137 3 221 390 I I.50 I 32 45 140 I 7 278Z~ 335WIND IREC'ION deg_
8.3 -1 ____ _____ 0 -.Ruon Time (min) 32 24 24 24 28 2
i .0 'b ! i -.Z0 -. 0 6 -.14 .1 i + .5 6-.06 -.43 -32 I -.12 i ,.17 ..58 t .12.S-.12 -.30 ..21I -.22 I-.14 -.16 -.1s-.25 ..o5 I ..07 -.05 -..01 ..06 -.,10
,-.50 .0l -.O0 I .03 ! o 03 -.01i-1.00 0 1 0 o .01 .. . .0 -.0z
*1 Procipii[tion (cm) -- -- -- --
76

Table 8.2 (Continued)
HOURLY OBSERVATIONS July 25, 1956 ONEJLL, NEBRABKA
CST 0805 0905 1005 1020 0
RADIATION (cal/cm2seceIsono .0085 .0055 (.0120) 1.0230 T .0203 .0180Reflected .0020 .0012 .0025 j .0044 .00 38 3Not Radiatio .0042 .0023 0000 .0142 .0128 .0108
AIR and SOIL TEMPERATURES (=C)
Height (mn)16.00 21.95 23.96 25.37 28.91 31.40 32.838.00 2.27 24.25 25.82 29.72 32.15 33.354.00 22.68 24.39 26.27 30.44 32.87 34.012.00 22.96 24.64 28.90 31.13 33.63 34.701.00 23.17 24.83 27.43 31.,75 34.40 35.31
.50 23.64 24.95 27.98 32,80 35.18 35.80
.25 24.00 25.17 28.55 34.06 307 36.55
.12 24.27 25.35 28.81 34.96 30.82 37,35-.03 21.41 23.58 25.58 31.46 35.05 35.69-.06 21.19 22.30 23.38 26.50 30.32 31.22-.12 22.52 22.44 22.57 23.24 24.66 25.58-.25 23.31 23.09 22.91 22.62 22.56 22.60-.50 21.31 21.27 21.85 21.15 21.11 21.02-1.00 19.05 10.01 19,02 18.97 18.92 18.89 .[
VAPOR PRE URE _(mb).-16.00 14.69 15.09 15.20 13,22 13.75 13.28
8.00 14.79 15.23 15.37 13.68 13.95 13.444.00 14.83 15.24 15.38 13.70l 13.99 13.482.00 14.89 15.32 15.42 13.97 14.05 13.541.00 14.89 15,38 15.48 14.04 14.11 13.58.1, 14.96 15.46 15.51 14.30 14.17 13.64.25 15.00 15.47 15.00 14,38 14.21 .3.67.12 15,09 15.50 15.73 14.57 1 14.30 13.90
WIND SPEED (cm/sec)16.00 786 819 776 1053 1289 114-5-8.00 717 753 -- 1009 1217 11034,00 I 852 684 662 878 1073 0942.00 547 624 616 841 975 9Q11.00 522 550 545 732 804 785.508_ 400 474 -- 048 740 688
.25 375 388 393 534 014 565WIND DIRECTION (dog) , __,___
1.0I-SO0- -1 18 170 16 15e6SOIL TIEMPERATUR1E CHANGE ("C)
Inlial Time 0750 0854 0951 1151 1350 14500un3r5w(rnln 26 24 28 27 28 28
-.0373 .4b .90 1.03 .48 .-
.'12 .30 .52 .83 .75 ] .S8 .27-.12 -.13 .02 .07 .21 .33 .31-,25 -.11 [-.08 /-.0 -.0o .01 .o5 I
-.50 I -.02 0 -.01 -.02 -.02 0-1.00 -.04 I 02 -.01 -.02 0 0
PrecIpIt tilon (cm) -..-- -- --.
77
..... .. . .. . . . ... s. . . .. . .. . . . .. .

Table 8.2 (Continued)
HOURLY OBSERVATIONS July 25, 1956 O'NEILL, NEBRASKA
-CSTr 165 10 1805 105 257 15
RADIATION (Cal/cmaec)Insolation .0140 00001V . TOO -- . -. [iHoloctCd .0028 .0020 .0010 I -- I -- --
Not 0aiation 080 0040 000 -(lOi5 -. 0011 -.0011AIoarSC .. '~'.!(VI.k8 I._____lh~~~ilhlA and . . 0. 1, . .. .. . .
!13.00 32.86 33.42 33.14 31.97 29.63 28.918.00 33.32 33.68 33.20 31.87 20,52 28.864.00 33.70 34.01 33.36 31.79 20.42 28.762.00 3445 34.38 33.41 31.68 20.21 28.681.00 34.90 34.72 33.40 31.01 20.03 28.62.50 35.40 35.02 33,56 31,5K 28.85 28.12.25 36.17 35.34 33.62 31.38 28.66 28.34.12 36.78 35.62 33.118 31.28 28.50 2G.25
-03 35.28 34.46 32.09 31.28 20,64 28.1406 31.64 31.71 .11 30.21 2930 28.28
-. 12 26.22 26084 27.14 27.22 27.!8 2U.06-. 25 22.70 22.09 23.17 23.37 23,0 23.,8-. 50 20.98 21.00 21.04 21.04 21.00 21.10
-1.00 1M.8 18.99 18.98 18.98 30,01 19.04
__VAPOR PRESSUIE (nb _ _
1(.00 14,01 13.05 13.13 13.80 14.37 14.511.00 14.20 13.12 13.27 13.94 14.43 14.614. 00 14,24 13.21 13.26 13.85 14.49 14.602.010 14.31 13.26 13.28 13.94 14.38 14.531.00 14.35 3.29 13.35 13.86 14.48 14.62
,50 14.39 1:.33 13.32 13.97 14.45 14.59.25 14.42 13.40 13.32 13.94 14.49 14.59.12 14.49 13.40, 13.33 13.84 .14.3 14.59
WIND S DE (cmi sec12- 1230 1 1174 948 020 972
8.00 1179 1193 1073 621 803 8634O0 3046 1044 944 727 714 7702.00 055 959 853 1150 614 6831.00 83( 826 744 565 541 587'50 72 1Mi 652 400 475 520
591 588 534 405 , 86 419
W I D DI M ..tCT ION (de ,) _ __ ___o ,,_u7 I fjL 70[ 1300 50[ SOi.1, T3,PEIIATUI,' CIIANGE -C__-- ital 'rime iso 1 5 375--112 1851 1 I051 2051
Iull 'Time (111l1) 20 I 20 I 24 I 25 20 27.03 .. 12 , f'Q , A -. 4 -,5d -3
-.061 .03 .12 -. 33 -.32 -, 0 -. 31-.12 .20 3 . t.02 .-.U5 -.07-. 25 .07 1 .10 .08 .10 .07-. 50 -. 02 .02 .01 0 .04 .01
-1.00 -.01 .03 .02 .04 0
III'vilht tio (--n) -
78
__ *

Table 8,2 (Colntinpld)
JIOIRLY ODSERVATIONS July 25, 1066 O'NEILL,, NEBRASKA
-CST- 20 0005 -70205* ..305 045'
RADIATION ealcin2s c)Inso ation-- - - - -- .00Reflecled . . -- . 1 - - .0000Nut aI~adion -,0014 -. U0014 -. 0009 -.0012 -. 0011 -. 0007
A Si nd SO._TI:MPI,;IATUI(E(_l . _
I Icighl (m) T16.00 27.72 26.75 26.37 25.65 25.07 24.02
8.00 27.63 26,70 26.38 25.56 24.83 23.484.00 27 51 20.60 26.34 25.30 24.63 22,792. 00 27.43 26.42 26.23 25,16 24.45 22,031.00 27.35 26.32 26.16 24.89 24.20 21,31
,50 27,23 26.22 2 6. 09 24.69 24.07 20.65.25 27.11 26.05 26.00 24.42 23.94 20.27.12 27.03 25.93 25.91 24.25 23.78 20.02
-. 03 27.16 26.32 25.44 25.20 24.75 24.02-. 06 27 14 26.57 25.C69 |2.44 25.0 24.67-. 12 26.46 26.11 25,711 25.411 25.26 25.07-. 25 23.08 24.00 24.17 24.15 24.0 24.05-.50 21.14 21.17 21,33 21.34 21.37 21.42
-2.00 i,.U _ . 08 19.1 1 19.19 19 20 19.21
V A I 1l1 IIIEU I? E.ob16.0 i;.29- 15.-1 1 7.73 15.75 15.38 14-.558.00 15.23 15.87 17.75 1 5. 84 15.481 14. 19 04.00 15.24 15.111 1775 iA 15.46 15.052.uo 15.28 15.82 17.7: 15.87 ,5.51 15 .161.02) 15.31 15.8u 17 73 15.118 15.48 15.16
150 15.22 15.81 17.75 , !JH 15.54 15.18,25 15.26 15.77 17.77 15 92 15.48 15.13
.12 _____ 15.21 15.75 17.214 9517 15. 60 15.181 ___
WIND SPEE.D (7 (41(')
-1(OO -1084. 1041 968 I f, 1 6- 3i.00 931 233 4 ,2' 550 287
4.00 864 V 4 2153 4:32 457 2382.00 724 739 757 400 411 1911,00 6 06 6%: 0 342 351 150,.50 516 -5 /5.76s"'t 295s 29 l 9 s' 2
2 463 1 454 2. 1 0 t_ 242 -. 72
_______ OJ 0'_ % _ ,!L. (1 -____
WIND JI)ll(1f~ ION id{'g) |. . ..-1o15 1 ° 1 7 ' 1 H" t6-T ',, 1 210 I l .. . .Will. TEM PERATUR~lE ClIANGE T.-ii,,~~o2253 I 23 5U0 15 9(o!0.T- 0o3 S0 45
I)t u 1,, rb 23 { 26 2 G z 213 I-23. .- Ui 2l -.27 -'1 7 -.38 I.,06 -. 18 l -. 13 -. 14 l , { -.20
-.12 1. 1 -" 1 .01 i -12 I , o I -.06-.2.5 ,U2 I .o, .03 -.04 i -.01 -.0'2-.,50 I 0 .Ol I U U 0I o
•July 26, 1956
'79

Table 8.2 (Continued)
HOURLY OBSERVATIONS 3uly 20, 1050 O'NEILL, NEDRA8KA
CST U_____ 605 07705j 085 00s.L5~ 05RADIATION (cal/cn2se)
Inisolation .0020 T.066607 .02.10 .0150 1.0155 .0035Reflected 1"0000 1.0013 .0013 .0030 I .003 -Not Mdlation -. 0002 .001 .0027 0080 000 .0009
Al and SOIL TENI.,IC,ATIJRES (°C) r16.00 23.44 24.78 26.74 20.84 32.45 29.29
8.00 22.52 24.00 26.85 30.07 32.08 20.35 I4.00 21,78 25.10 26.98 30.263 33.21 29,382.00 21.23 25.28 27.19 30.83 33.83 29,351.00 20.93 25.45 21.57 31.42 34.18 29,38
.50 20.74 25.74 27,93 32.10 34.98 29.40
.25 20.78 25.99 28.25 33.08 30.00 29,42.12 20.78 26.22 214,57 33.81 36.82 29.48
-. 03 23.41 23'. 71 24.76 26.58 30.15 28.71-,06 24.21 23.196 24.24 24.89 1 26.68 28.68-. 12 24 8 94 ;9 24 '18 24 26 24 90 26,38-. 25 24.03 23.94 23.83 23.70 23.54 23'76..'50 21 45 21.45 21.44 21.42 21:16 22.06
-1.o 1921 1o.21 1,.20 1 9.19 19.,5 19.,1
VAI'OR PR.'ISUIII ( ni _
1.00 1 ' 5 14.49 14.70 13.1i 13- 38 14.34C18.00 15.27 14.5S 14.45 14.02 13.57 14.894.00 15.38 14.51 14.50 14.04 13.56 15.072.00 15.50 14.6:1 I 14.06 14.11 13.63 15.211.00 15.54 14.67 14.77 14.21 13.77 15.44
50 15.5 i 14.72 14.89 14.37 14.09 15.58.2i1 15. 62 14.791 15.01 14. 68 14.22 15..71.12 .5.73 14. 96 15.21 1 5.. _ 14.33 - 15.70 6
WIND SPI:ED (clmiuif)
16 00 306 3614 I 301 720A 00 2614 372 326 415 i 32P i 6804.00 212 346 301 374 308 6122.10 179 324 2i1l 371 I 277 ! 53711,00 1126 287 2411 331 2513 471
50 121 272 180 29 1; 234 41 ].25 8 q 2 !74 46 198 332 _ ___
WINI) DII11HUIION (dg)- - .o. .. . .i__,o _ _ i 1 - _ _ _1.2 _______ ~ [ 210j 2U(J 2 235 [320 10D I _______
I PEl HI:IATIJl 1,: CIIANGE - C)
II1;11ltn Time1 05 0 (.1152 10052 [1750Ilun Tien (1ilu) 20 / 28l 211 24 / 26 27
-. 03 -. 24 I .46 I .49 1.20 1 1.40 /-.74
-. 12 -. 10 -. is -. 08 -. 02 6.00 .05 l-. 25 -.01 -. 04 -. 04 -. 05 -.05 j .05-. 50 0 0 -. 01 -. 03 -.01
-1.00 _ ____ 8 9 I o 0 00 oo0 0
Inrprvcii l uill (cnln)' August 0, 1956
80
S. __

Table 8,2 (Continued)
IIOURLY OBSERVATIONS Augusit 6, 1956 O'NEILL, NEBRASKA
CST 1905 2105 2205 2 3 0s 0005* 0305
b~oitc .05 RA ITTON (elcms1
So --, I .. - - I Net Rndation [..0 12 -.I011 rain -. 0007 -L.013
________________ and SOIL TEMPERATU _ .)
Height (m) .116.00 28.18 24.70 22,25 21.67 21.06 17.548.00 28.00 23.67 22.10 21.63 21.05 17.614.00 27.94 22.65 21,99 21.58 21.09 17.61
2.00 27.78 22.44 21.87 21.53 21.03 17,581,00 .27.56 21.97 21.77 21.44 21.02 17.54.50 27.42 21.54 21.59 21.34 20.06 17.50.25 27.25 21.25 21.45 21.26 20.00 17.47.12 27.14 21.01 21.28 21.20 20.88 17.46
-. 03 27.12 23.88 22.96 22.84 22.71 20.57-. 06 27.64 25.22 24.30 23.80 23.52 21.86-. 12 26.38 25.86 25.49 25.13 24.70 23.73-. 25 23,89 24.011 24.15 24.22 24.18 23.83-.50 22.06 22.01 22.06 22.11 22.16 22.06
-1,00 19.93 19.96 20.00 20.11 20.02 20.01
VAPORl PRESSURE (rob)13.47 5 22.93 rain rain 20.27
8.00 13.85 15.54 22.55 rain rain 19.594.00 14.02 15.00 22.58 r-ain raiI 19.592,00 14.14 16.11 22.51 rain rain 19.511.00 14.24 16.31 22.45 rain rain 19.50
.50 14.32 1G.42 22.45 rain rain 10,59
.25 14.38 16.52 22.33 rain rain 19.27
.12 14.45 16.58 22.39 rain rain 19.63
WIND SPEED (. rnsec630 462 r -
8.00 528 367 544 457 697 7004.00 464 308 498 425 660 638
2.00 404 244 437 374 565 5741.00 354 / 6 386 327 491 --
.50 305 106 337 286 428 437_________ j _____ LI. i__.L.~L±.L ..__. i__I i ''I. _"" _____
SWIND DIIH- C1O' (deg) -
_._.._ _....... . 1 .. _ L.___SOIL TEMPEATURE CIlIANG ( C)
"Initial Tineio 1850 25- 2150 --Fi 2250 2350 0250 'Hun Time(n) I) 27 28 27 27 26 26
.013 -. 45 1 *4 -. 41 -.14 00 -.29..12 -05 -.14 -.22 .18 -.14 -.19
-. 00 -.0 00 .00 .09 -.06-.25 t .04 .06 00 -.01 .06 -.14
00 .03 03 0 00 -.02 _
Precipi atilon (cm) .. .. .. .. .. ..'Auguus 7, 1956
81

Table 8.2 (Contltiued)
HOURLY OBSERVATIONS August 7, 1950 O'NEILL, NEBRASKA
CST 045 0505 0005 07 0
RADIATION (cal/cm 2 ocInsolation I -I.--b 0005 1.0048 [.0-092 1 .0125 [
Reflected -- -- --- - - -Not Radiation -.0014 -0012 1-0000 .0019 OU055 .0068 ____
AIR nnd S0I, TEMPERATURFSC)
16.00 17.76 17.19 16.82 11.28 20.67 22.608.00 1.8 3 17.11I 16.70 I 18.41 20.96 22.934.00 17.75 17.00 16.57 I 18.55 21.22 23.152.00 17.69 16.90 10.45I 18.66 21.49 23.411.00 17.62 16.80 10.37 I 18.75 21.73 23.74
50 17.51 16.6 9 16.24 18,84 22.03 23.96-. 517.40 10.51 16.18 18,98 22.34 24.25
1? 17.57 18.53 16.13 19.08 22.70 24.57..03 20.17 19.51 18.02 10.04 20.14 21.64-. 06 21.41 20.91 20.38 20.09 20.41 21.31-112, 22.40 23,09 22.75 22.41 22.16 22.06-. 25 23.75 23.67 23.56 23.42 23.28 j 23.13-. 1 23.0 23001 22.75 22.41 22.11 2206
-. 50 22.06 22.10 22.08 22.06 22.04 22.04
-1.00 20.03 20.03 2O.O. MonUf 201.0 1 20.00_____
VAPOR PIISSURE (mbL1.4 17.60 17.42 17.80 1 7.75 187
8.00 18.62 17.53 18.02 18.14 18.11 18.194.00 18.56 17.53 18.13 18.23 18.23 18.322.00 18.64 17.56 18.08 18.37 18.42 18.491.00 10.67 11,61 18.0 IRo .50 18. 1 18.68.50 18.75 I 17.72 18.06 .18.,77 18.94 15.91.25 18.76 17.75 17.08 I 19.12 19.22 19.25.12 19.02 _ 174.94 17,821 19.21 19.52 19.47
WIND SPEED{in Ictse_
8.00 617 553 50 535 060 j 11344.00 577 611 455 512 00 10402.00 408 436 385 456 542 9151.00 43 I -- -- 431 50o 835.50 410 331 289 :370 420 603
WINI) DIRECTION ideJ)75_85 110 140... ... .
SOIL TI.:MPE, RAru iE CIANGF _ ( __
itTI me 035 .. ~LQL _____ __5_051__5
Run Time (mLn) 21 20 25 24 25 1 25 I-3 -.0' 1 . 0 -.14 /..08 .18 .7 fi .t-.Uo -.19 I .78 l-.08 I-.05 I 27 I.41-.12 -. 11 I..13 -07 -.11 -. 05 00-.25 00 -.013 -i.0 I -.05 -. 04 -.06-. 60 .01 .01 .04 .. 02 .02 -.03
.1.00 .01 00 .10 -. 04 ,3 -.02me0ipit5t7on (0)
82

Table 8.2 (Cntinucd)
NiO1ULY O13SERVATION August ', 1956 O'NEILL, NEBRASKA
1005 1105 1205 1405 iU05 1705
"14I)IATION (~lcisc
-- .--- i -- i- 9I .1f5u0-I - .UlOo HV 1UIf-0- .o0097 I
Not Hta F0 , 021 *l 135
216.00 3.05125.97 27.4 2(.74 1.83 30.658.00 24.24 26.34 25.14 28.38 30,26 28.864.00 34.58 26.82 28.34 24.IJ2 30.52 29.232.00 24.94 27.49 28. G 29.37 31.00 29.621.O0 25.32 28.24 29.27 29.93 31.36 29.95
I .50 2-5.63 28.77 [29. 84 30.78 31 8:5 30.46
.25 16.39 2,25 3U.39 31.62 32.47 30f73
.12 1.07 30.30 30. 09 32.02 3290 31.15-03 23.09 i 25.80 27.62 30.24 31.12 30.65-. 06 '1.71 23.8 2554 21 I 29.48 29.53
.12 i2.13 22.32 22.111 24.21 25.52 25.97".25 22.94 822.7 2 U 22.; 22.96 23.12-. 5 0 21.099 21,92 21 '92 '9,1 .06 21.83 21.87
1.00 19.62 19.92 6:1 14 1 9.9 17.5 20.278
VAPOR PHEI, SIMM', (m. __..
8.00 1 .9l 18.17 { 19 14 17.ll) 1738 19.824.00 19.,19 u 18. 19 W. I.13 17.-97 17.54 20.022.00 19.42 I 18.34 1 fl9, 5 I H. 12 17. GO 20.161.00 1W.62 18. Q 19.- 64 18". 29 17.85 2U.27
.5 19 1) 6 11 ' 9 1 1,1 20.44
.25 20.33 i 19.36 21.14 18.71 18 24 20.60
.12 20. 59 19 65 21).I6 1M.97 11.46 20 H7
w IND SI: ID (Im I'(- .1 63 8 8 13481 137t ) 92
8.00 871 754 773 125 1 171 90 9234.00 111711 707 7111 1135 liS 8412,00 74 I1' 1 51 i'm lo4 1I2! 7391.M 0 71U .9 0 711 773 5Go.5/ 40, 470 54 J (I 768 / 77:1 53M1
________WIND 1)I(IJT (UNdi'1.00 T _5 _7 . T-I -o 15,
- 5(111 1o MI, '.II A'I'IlII,: C IIAN I.'( .1--11Il Tinv _ 0952 1(W,2 j 1150 1 3501 ] 155(1 1650ll hl111c (lii) 24 25 27 27 2 6 _ 21H_.03 o,; . - f+ I + I15)tJ 1 1 M I ,I ." ) I -' 15 - i31ts-. 06 1.41 . 79 .5,14 .27 U97 -,04!-. 12 .:7 I .13 .24 I .36 .21 I .1l1
-.2s~ ~ -os { - , -.07 .02 { J -" .{ 11-. 50 I A7 I -. 04 0 -. 01 .04
I. . l _o,.; -I. .-. ,i L _o._ . l u4_Pl "rill ol l (cm) ...
83

Table 8.2 (Continued)
HOURLY OBSERVATIONS August 7, 1956 O'NEILL, NEBRASKA
CST ______ 1_510 05F20] 2205 0005* 1 1IADIATION (cal/m
2 sc._ _____
Ills o1at10n .0050 .000 ._'000 - - -
______ 1 .j:., o ol I -.008 i-.0014NvtI MidiationUU9 01
____ ~AIRl and SOILTEMP2ERATU~~llllcighIl (ni)
16.00 28,21) 27.U8 .70 24.96 23.01 22.788.00 28.50 27.03 25.40 24.20 23.6 22.C24.00 28. 62 26.95 25.13 23.70 23.12 22.482.00 28.77 26.14 24.96 23.25 22.82 22.27I.Co 28.93 26.77 24.77 22.97 22.52 22.1950 29.12 2 6.65[ 24.57 22.59 22.17 22.03
.25 2U.31 26.54 24.38 22.43 22.02 21.87
.12 20.50 26.48 24.22 22.33 21.80 21.75-.03 28.33 27.82 2C.28 .,,11 24.15 22.08-.06 28.U 28.09[ i 2 26.02 25.16 23.04-. 12 2623 26.29 26. 10 25.03 25.59 24.89-.25 23.30 23.50 23.64 23.80 23.90 23.96-.50 21.85 21.89 21.80 21.00 21.91 21.93
-1.00 20.00 20.04 20.05 20.00 20.08 20.10
VAPOR PRE SSUIRE (mb--T.o -1-- . -- IT-31 19.89 18M_ 18.42 I --
8.00 19.77 20.00 19.50 20.01 20.00 18.594.00 10 84 20.01 I 10.6/ 20.12 20.25 18.602.00 10.89 20.10 I 19.02 20.11 20.20 18.621.00 20.02 20.13 19.64 20.13 20.27 18.06.50 20.21 20.22, 19.75 20.21 20.39 18.74.25 20.22 20.22 19.76 2 .14 20.36 18.74.12 20.27 20.31 19.87 20.22 20.39 18.78
WIND SPE D ____
16.(00 714 697 632 44U 378 19328.00 6 48 3 21 349 298 034.0G 615 554 439 267 238 7452.0(0 544 491 376 214 101 6521.00 5[0 447 342 177 163 589.50 423 378 280 139 128 491.25 3 - 314 232 1 02 .92 .99 .1
WIND I)II.C'TION (de) ,
lmil'~e175 13 145 295 21 J5] Soil, TI.EMI 1E:tA'TURI.CHIANG E ('17) . . .
i aI- i , i le,,, - T 76-- -ia u i n5 -1 o- -05U 215 2 3 --3ItIunll 11 (1)111) 26 26 [ 26 26 1911 23[
-.... 47 _0.6 I - .5.14 -. 44 -. 2e ...
-.6, 3 1 - 4 2 1 -4 2 I -A U -.3 1 8i-.12 .7 -:02 - -.17 5 -.11
-.25 , U8 .09 -.03 ,06 .04 -.0f[ [60 Z UU 00 00 00 -.U2 8
11-cI 1llmh)f (c'n) *August 8, 1956
84

Table 8.2 (Continued)
HOURLY OBSERVATIONS Auist 8, 1957 O'NEIL, NEBRASKA
I' ST010 005 0305-1-04054 050 0605
-AIMAT ION (caIl/cjnI" 2sc
Net Itdiation -.0015 -,0007 _ -..... •0015 -. 001 . .004
Al_{ and SOIL TMPI"I(A'IJIU0 WfT16.00 23.12 18,76 17,77 17(.5 16.51 17.17
8.00 22.80 18,83 17.58 1 G,70 16.11[ 17.114.00 22.58 18.85 17.41 16. 45 15.81] 17.05
2.00 22.33 1 .1 . , 17.30 16.21 15.57 16.951.00 22.07 11.86 17.17 16.00 15.44 16.89.50 21.73 18.85 17.00 15.77 1,.22 16.81.25 21.41 18.83 10,80 15.60 15.12 16.73,12 21.20 18,82 16.77 15.43 15.02 16.65
-. 03 22.37 21.89 21.08 20.12 19.16 19.10-. 06 23.52 22.06 22.43 21.75 21.00| 20.48-. 12 24.74 24.34 24.U2 23.70 23.29 22.84
-. 25 23.94 23. 7 23.8' 23.73 23.62 23.44-. 50 21.05 2195 21.95 21.96 21.95 21.50
-1.00 20.101 20.0 2.11 20.08 21.06J __20.04
_ VA PORlPl :SSJIM (m ) A )16.00 I 17.30 15.20 15.21 15.21 15.71 1 16.408.00 17.43 l5.2 9 15.25 14.in.9 15.52 I G. 424.00 17.51 15.30 I5 30 14.95 15.5.1 16.492.00 17.59 15.31 15,31 141111 15.52 16.62
1.00 17.59 15.32 i 5.31 15 01 1,5.55 16.71.50 17.68 15.34 15.34 15 .1i 15.57 16.72P25 17.'74 15.35 15.36 15. 06 15.58 16f. 76.12 17.75 _ 15.36 15.36 15.15 _15.75 16.77
WIND SIPl-:DL (I - 47 f58.00 438 9M7 451 445 177 4944.00 395 915 397 375 310 I 44o1
P00 340 812 344 :111 255 3791.00 313 729 311 2 83: 229 349.50 255 633 256 23:3 186 214.25 214 533 201 lul 1-12 2318
_______ _____ WIND DIM)II':("I'ION (I'lL.1.00 _T 6 36 A) 5u io _______
SOIl, T MITIHIA'rI I.: (HANGE .CIitial Time [ 0053 1 0154 025 ]0351 1454 0550)
(Itul T1ill' (1111i1) 23 22 23 25 21 27S-.03 -.30 I -. 211 -.i I- .24 -III
-f .. ;;I-.4l
-. 96 -. 20 -. 17 -. 2 .31;, -. 11 -. 16-. 25 -. 02 -. 04 -. 01 -. 05 .ol -. 05
-. 50 O .01 o) -. Ul 0 -,01
-1.00 00 Ou -.0.1. 0L.. 1 00 _W(
PIr'c ipIhI l lllI) --
1[' 85

Tablo 8.2 (Continued)
HOURLY 03SERVATIONS August 8, 1956 O'NEILL, NEBRASKA
CST __ _ 095 It)(5 ito0j 1205 10 L I_ _ _HADIATION (cal/ci 2s{e)
In1solation.03 .05 00 .00 1.02 .28Reflectcd .. .. .. ... .. ..Nt PRadilaton wet 0 088 .0 113 .0110 .0150 .o15o
AI- 'nd SOIl TMPandIATUIlE. ("')
I . Do 18.00 20.84 23.7) 25.28 26.74 27.548.00 1 17.94 21.20 2;1.79 25i. 52 127,23 27.764.00 I 7.96 21.45 24.17 25.b0j .74 28.13
2.00 17.97 21.93 92 4. 46 2612 28.01 28.701.00 17.97 22.19 25.00 26.63 M61 2,0
.50 17.07 22.fi2 25.88 27.52 M.CA6 30.74
.25 17,90t 2 .07 26. b5 28.33 30.83 31.41
.12 17.95 23.55 27.68 28.97 31,67 32.71-. 03 19.30 20.78 24.27 27.44 29.85 31.89-. 06 20,19 20.56 21,76 24. 82 26.71 28.46-,L2 2.22 22.0 21.04 22.38 23.06 23.93-. 25 23.18 22.98 22.82 22.75 22.41 22.01-,50 21,90 21.88 21.132 21.87 2 1.8"1 21.t13
-1.00 210, __20.02 19.0 20.04 20.06 20.05VAPOR I'fI.eSS, _'IL_ _
1I f.0 -- 14. U-.1 14.74 131.28H 12.0 133.1611.0) -- 14.41 15.05 13.55 12.42 13,83 I4.00 -- 14.55 15.26) 1:1.74 13,62 14.03
2.00 -- 14. 3 l,.35 13.85 13.85 14.181.0 -- 14.95 15.58 ! 4.14t 14.04 14.40
.50 - 15.91 15.96 14.66 14.67 14.69,25 - 10.13 11u.46 ) 15.16 15.17 15.08,12 -- 1.8:1 11,.16 15.64 15.72 15.61
WIND ))_SIPEL,) _ __ __in__!_
H).c)l 511 4W)9 368 530 14 7U,00 440 4 6)l 340 '10 5 487 5414.00( .186 444 321 '173 440 4872.00 314 4009 298 436 413 452I. 10 287 381 20 408 301 420
.(1 250 320 245 :44 178 -
.25 12 L.9 I 270 210 i 7 _i ._.. _
W !N DI ICI,TI(N ((hdg _
-Y. O~o 3:1 45 5
_30_, TV_ 10TM PI ':IIA TUIII,: E-LIIANCE " CL 2<,,,,. 011 ,,1,,, 2 27 211 29 21 26 _-03 .16 1.32 f.089 1.00 .8 71
-.06 , ,u5' .23 i .0 I '.1 .70 .70-1213 -.00 .06 .26 .34 .34-. 25 -.07 6 -. 50 -.D .' -.5' 00-.50 .-) I -.03 -. 0i .02 -. 02 -.03
-1.00 1 I -. 1] -02 3 -.02 -.04
pi l)11 t , i loll )ill .... ... .... ...
86

Tablo 8, 2 (Continued)
HOURLY OBSERVATIONS August 9, 1956 O'NEILL, NEBRASKA
CST _1405 ,[ 1505 1 IG05 L1"/05 _lo 1905T"
-. RADIATION al/cm 2BLc)-In .0 Fa 6.017& .013.0 1.0082 ,0052 1 .0012Reflected -- .0033 .0021 . .0013 --Net flai1o .0133 -0110 0077[ 0041 0018 -.0011
AIR and SOIL TEMPERATURES lC_
16.00 28.02 28.86 28.48 27.91 27.14 25.66
8.00 28.44 29.37 29.00 28.28 27.35 25.69
4,00 28.79 29.76 29,;O 28.58 27.58 25.672.00 29.28 3U.31 31).0,1 28.90 27.80 25.661.00 29.92 30.69 30 .ii 29.2C 28.03 25.65.50 31.31 31.40 30.!)9 29.65 28.19 25.83.25 32.09 32.54 31.77 30.0 28.30 25.62.12 33.48 33.55 32.25 10. 43 28.68 25.58-.03 33.29 34.46 34,qii 2.91 30.98 29.02-.06 29.97 31.25 31 98 3.'.3 30 8 29.49-. 12 24.U 25.05 21 3 27.16 27. 5 27.54
22.58 j 22.74 22.91 23.11 23., 4 23.71-. 50 21.79 21.76 21.72 21.169 21. 5 21.76
-1.00 20.01 19.96 19.94 19.93 2.3:, 20.03
VAPOR PRESSURE mbL16.0012.79 1 3.,8 15.40 17,0)8 1 17.40 17.518.00 13.46 13.48 15.89 17 .31 17.65 17.524.00 13.66 13.57 15.95 17.39 17.72 17.522.00 3,6 13.65 1,oz' 17.3 17.77 17 511.00 14.04 13.85 16A.0 17.43 j 17.84 17.5350 i4.50 14.20 16.4 17.58 17.92 17.57.25 14.00 14.47 16.66 17.73 .17.86 17.57
.12 15.58 14.96 16.98 1..J[17.99 1 6 1
__WIND SPEED(cm/aec)16.00 411 205 59 5 ri85 44 70418,00 396 201 547 624 674 6714.00 366 209 508 572 587 6012.00 336 251 467 517 515 5271.00 317 240' 438 483 480 494.50 272 218 178 408 418 419.25 22R - 3 318 346 350 51
________ _ _ - WIND DIRECTION (deg) ....1.004- 5[360] 350 __360
_ _ _ _ _ _SOIL TEMPERATURE CIIANGE (C)Initial Time T1350 1450 1550 1650 1752 15Run Time (min) 26 26 26 26 24 23
-.03 .~ -4 .i .2 -.77..06 .60 .37 I .6 -.26 -,5 -.51-. 12 .36 .30 .28 .15 .08 -.03-.25 .14 .0M .05 .10 .09 .09
-.o-.ol -.3 1.5 -.U4 01 - 00 o.1.00 -,01 ::19 -1O" "'p2i -0 0
Preclpilatlon (ca) . . .. .. .. .. ..
87

Table 8.2 (Continued)
HOURLY OBSERVATIONS August 8, 1956 O'NEILL, NEBRASKA
CST - - 2005 _
RADIATIONJ al/cm2sec)
NtRadiation -01 -. 0010 1-.0010 [-.00085 1 ,03~-0110___________AIR and SOIL TE PERATURES (*C) -
16.00 24.26 23.43 22.45 22.44 21.83 19.688200 23.38 22.43 21.25 20.15 20.35 18.054.00 22.65 21.15 10.74 18.90 t10.86 18.24
2.00 22.22 19.88 18 81 17.83 17.49 17.861.00 21.82 19.08 17.10 16.46 16.38 17.64
.50 21.54 18.01 15.91 15.29 15.84 17.41225 1.24 17.23 15.48 14.77 15.62 17.1,.12 21.02 16.20 15.19 14.34 15.45 17.07
-.03 27.13 25.30 23.89 22.71 21.96 21.70-. 0 28.16 26 75 25.56 24.49 23.58 23.09-. 12 27.34 26,95 26.52 26,00 25.45 f 25.00-.25 23.92 24.07 24.21 24.27 24.25 24.24-. 50 21.80 21.79 21.80 21.80 21.82 21.88
-1.00 20.07 2002 20U,03 20.02. 20.02 20.04
Moo VAPOR PRESSURE (rob)1.65 .84
Too 8.14 17.63I 16.77 15.45 18.65 18.848.00' 17.43 15.89 14.64 17.78 18.364.00 18.41 17.49 15.94 14.65 17.78 18.342.00 18.35 17.51 15.98 14.02 17.76 18.28100 18.35 17.54 16.01 14.68 I 17.77 18.28.50 18.35 17.58 16.01 14.67 17.77 18.34.25 18.28 17 58 16,09 15.63 I 17.71 18.23.12 18.20 17.89 16,53 15.(; t 17.82 [ 18.44
WIND SPEED (cm sec)___ ___ _______
1.00 48'2 296 - 189 118 5528.00 343 225 156 179 1 82 4234,00 256 130 114 139 76 3382.00 197 85 174 109 85 2691.00 15' 36 101 96 i 57 222
.50 132 19 51 44 j 50 U d.25... 1 1 -- 0--1 L
,_ _101 _WIND DIRECTION (dog).0o 40 - ] - - J -- 175 I1__ __ I - _ _ _
,OIL TEMPERATURE CHAW) E (Ci _ _initial Timie 19s5i 2054 2152 12253 2350 0050Run Time (min) 33 25 24 23 28 Io-. 03 -. 53 -. 79 -. 50 . -. 40 - 92 -3.. 06 -. 52 -,50 -. A40 1-4 -. 37 -. 20_2 -. 11 -. 17 - -. 21 -. 26 -.21-. 25 -. 01 .06 .03 00 -.04 -. 04-. 00 .02 .01 00 .3 00 00
.I.00 P04 I ,- -.01 --- DO A1 0 A9Pr=wili~ation (cra) .. . . . . . *August 9, 195,8

Tablo 8.2 (Coltinucd)
HOURLY OBSERVATIONS August 9, 1056 O'NEILL, NEBRASKA
__________03 -. 020 03050 06f05 OO.jI.j~I.
iiTu,- ADIATINCN al/cn 2 c) ..
lfefjocled OO "" 1 "" .'000 1.00035 .0015N t Mldlatun -. 00100 1 .0000 j-.00101 1-.00114 -.00038] .002
All( and SOIL 'IMIIMTUtES ('C)
16.00 19.75 19.04128.36 19
8.00 18.,9 1'.61 10.97 16.01 10.92 10.204.00 17.92 16.97 16.14 16.56 10.70 19.272.00 16.00 16.38 15.46 16.25 16.17 19.341.00 16.08 15.72 14.93 1f.02 15.39 10.42
.50 15.26 15.08 14.47 15 iis 14,05 19.53.25 145 L 14.81 14.30 15.44 14,98 19.77.12 14.39 14.60 14.13 15.22 15.10 19.84
-. 03 21.18 20.22 10.68 10.40 19.01 19,51-. 06 22.61 21.99 21 3,8 20.85 0.9.-4 20.37-.12 24.56 24.18 23. 23.28 22 3 22.63-.25 24.18 24.10 23.88 23.75 23.70 23.53-. 50 21.90 ! 21.92 21.91 2!.92 2?.00 2 .8
-2,00 _ 22 0..1 1. 0 2010
8.00 15.25 14.06 15.41 15.70 16.41 17.304.00 15.25 [14.67 H, 144 |15.70[ 16.48[ 17-46 [2.00 1.5,22 1 4-68 I.5., 15 .70| 16.51 17.49 I) ' m' 1,0 0 15 .2 3 1 4 ,6 15. 3 15 .7 0 / 1 6.4 1 l 1 7 .17 l
15.25 15.20 14.68 15.36 15.,;9 16.21 17.40.12 1.1 .22- 15.38 15-.97 16.12 17.63
fWIND SPIE:D. f m/uuc)-16.00 237 404 471) 425 [ 147 --3088.00 278/ 213 365 33 105 5 284.00 204 ZZ22 218B 250 q76 2632.00 143 I0 2!2 P05 116 245-1.00 96 107 117 1 fU 8 2 J214.50 71 j 88 13i5 1 4.5 6 2 104
.2 11 L.__.__ IL ! ~I I G 290 _ 1 _ _
l __ _ _ _ _ WIND I)II(,;('I'IO-N (d(,11,)
-1.ioo.] -- - - 7-- 300 ]GO- 230U
SOIL TIM11 1: IIA'r.III, (_ IIA (;I-: CC),1 .1,,,,1 I lifl 0150 0250 0:5 40 050o oo 045US.27 2 8. 28 060 26l l,,.03Tl , (4l , -.I1.5 -.2 z -.0 5 -.18] .64
-.0 6;l - 7 . ' -.N -. ti - 1 8 .0 8
...15 -. 17 -.15 -.20 -. 18 -.23 -. 16-.23 - I ".03 -.06 -.06 -.07 -.06.. 50 . I .01 01 -. 04 -.05
-1.00 .01 -.01J.02,00Ir _ili__ll ((0In) .. 01*Wind to light
to turn vane
89

Tablo 8.2 (Continued)
HOURLY O13SERVATIONS August 9, 1956 O'NEILL, NEBRASKA
RADIATION fcal/vm2aec -
insoat o .71 013' .07 .02 2 01 4 .0132flectd ,0015 [.00205 .00335 .0035 .0037 .0023
Net Radiation .037 .0077 .014 t011o .0127 .0060
AIR and qOIL TIMPEIRATU.'19 (C)"-/eight (M) -- -- -- ..
16.00 21,33 23.22 24.75 26.46 27.36 28.058.00 21. 66 23.66 25.13 26.75 27.71 28.294.00 21.82 23.92 25.58 27.01) 28.14 28.742.00 21.82 24.21| 25,.0 27.21 28.26 20.241.00 22.04 24.' 26.35 2I.U3 29.41 20.66.50 22.50 25.28 27,44 29.35 30.27 30,3825 22.01 26.47 28.33 30.67 31.52 30.94.2 23.54 27.16 29.21 31.68 32.79 32.08-.03 20.89 23.10 26.26 29.41 31.98 34.12-.06 20.87 21.918[ 23.12 26.07 28.09 30.21-. 12 22.33 22.25 22.45 22.96 23.63 24.7U-. 25 23.31 23.11 22.1i 22.75 22.68 22.72
-. 50 (21.92 21.87 21 83 21.78 21.78 21.74-1.00 20.03 19.1 963 9 I! 103 __91______ _ .U1.. .. ..... ..(1 10.05
VAPOR PRESSURE (rnb22.62 " G1. 1 l. 1- 14.75- 14.37 "
t 8.00 27.58 17.31 3 (1.53 15.40 14.79 --4.00 27.111 17.50 1 .15 15.461 14,8 J --
2.00 27,7 .H2 1.6 54i,.o772 18l.112 I 7. a / 15,.43) 1,1.T --
1.00 26.91 171i3 1 G.77 ! 5.46 14.8 -
.50 19.11 17.16 17.011 15.78 15.05 --
.25 17.21 18.01 17.30 16,009 15.42 --
17,29 111.34 1 I.17 1U64 15.8 -
14 WIND SI'EEDj9(m/auc)
- 00 38-74 . .3- f22 400 . 36 -8.00 176 339 290 373 31)1 3064.00 148 323 273 360 361 2862.00 153 300 256 330 332 2581.00 13 (273) 231 306 309 235.50 128 246 216 276 282 212
.25 102 204 182 235 239 182
_________ WIND)DIRECT.ION (do _____
211 N0 IULI r 2331 0 w _31
_11, SOLTMP.AI'UI.1 CIIANGEC
1I1I41le07b0 083) 01)0 (05 31413 _TI2 5_
-. 03 .65 1.10 1.261 1.06 | 1.17 22-.- i .f:, .4 .81, .87 Ub .7,-. 12 -.u4 00 I 17 .31 .42 .56
-.01 -. 03 -.0-3 -06 :07 -04.00.. 0 ..2 .--.03 -.2 I - , .03
90

Table 8,2 (Continued)
HOURLY OBSERVATIONS AuguHt 9, 1956 ORNEILL, NEBRASKA
CST I1 0-T 1 1 1 ,oo 6I , 5o.I
RADIATION (cal/cm2seclInsolation U210 U18 ,uotSU .00 07TJDI2 . 125Reflected .0038 .0033 .0016 1 - w0013 .021Net Radiation 0125 .0105 .0030 003 (1038 080
Heliht (m) AIR and SOL TEMPERATURES (C)
16.00 28.81 29.80 29.27 T 27.98 32.09 33.008.00 29.29 30.33 29.64 28.07 32,3 33.264.00 29.59 30.e.9 21,89 28.13 32.59 33.812.00 30.01 30.60 30.11 28.13 32.04 34.321.00 30.27 31.06 30.24 28.18 33.30 34.84.5o 31,03 32.88 30.75 28.18 33,62 35.61.25 33.04 33.2 31.27 28.18 34.00 36.10.12 34.02 34.94 32.12 28.15 34.3 5 36.50
-. 03 35.64 36.77 36.01 33.28 30.82 32.05-,06 31.53 32.79 33.30 32.44 28.54 28.86
12 25.77 26.64 27.46 27.98 25,65 25.70.25 22.76 2.88 2.3.06 23.31 23.10 23,30
-. 50 21.69 21.65 21.60 21.56 21.39 21.51
______ VAPOR PRESSURE_(rob-
1r.-i 13.06 13.60 13.53 14.311 1 2.71 ;3.24 -
8.00 13.85 14.00 13 85 14.55 12.0 13.484.00 13.95 14.17 13.89 14.60 12.94 13.532.00 13.92 14. 16 13.0)4 14. G5 13.00 13.641.00 14.04 14.26 14. 09 14.66 13. U1 13.08.50 14.32 14.50 14.27 14.74 13.13 13.71.25 14.64 I '.. 66 14.51 14.76 13.18 13.77.12 15.05 1.87 14. 8iL 14.83 13.23 13.82 I I
WIND SPEE (cm ec16.00 246 277 154 1 573 75 88 -
8.00 261 279 153 501 727 I 8434.00 244 261 141 463 064 7642.00 230 244 144 416 590 j 6781,00 217 228 1:33 370 522 03 T 7
.50 200 205 125 325 450 527
.25 166 175 101 276 383 440 I
WIND DIRECTION (deg_______ 2 I___ -___! _ -_ o , __ __ [__
SOIL TEMPEItArURE CHANOE (C)Itliail Timeo 1353 1454 15513 1653 1453 1653 1Run Time (mr, 25 24 I 25 2.1 24 23-. 03 .60 .32 -. 50 -1.23 -. 03 -. 4 8
.fA.6 -i6 '16 -. 3 .1.12 .30 .38 .33 .18 .08 .10
-.25 . 03 .05 .11 .1 0 .03 .05
-. 50 -. 03 U00 0 I -,01 00 00-1.00 o_1 -. 04 .. 01 .0l .02 -.02_
Pr'clpltutlon (cm) -- .. .. .. .. . * August 27, 1956

Table 8. 2 (Continued)
HOURLY OBSERVATIONS August 27, 1956 O'NEILL4 NEBRASKA
CST-. ooo9I o2os . ,,1
RADIATION cm/seq)inisolation )07 .00 00 0500 M00W . 0Reflected .0014 ,00 0000 .0o .0000Net Radiation 027 -. 0)1 -00 0 .0008 -. 0006 -.0009
_ AIR and SOIL TEMPERATURES (*C)1.00 33.22 31,13 29.11 21.72 24.46 21.75
8.00 33.32 3055 26.72 24.90 21.38 20.03
4.00 33.60 29.67 24.95 22.57 20.11 19.022.00 33.95 28.94 22.59 20.69 18.83 18.371.00 34.34 27.41 18.84 19.72 18.29 17.05
.50 34.64 25.57 17.45 19,02 17.68 16.78
.25 35,04 24.45 16.86 18,58 17.26 16.47
.12 35,38 23.85 16.28 18.0W 16.94 16.06-. 03 32.19 29.07 25.04 23.77 22.52 21.79-. 00 29.40 28.58 26.26 25.04 23.67 23.14-. 12 25.01 26.36 26.26 25.76 24.96 24.57-. 25 23,38 23.65 23.98 23.06 23.99 23.92-. 50 21.49 21.541 21.60 21.58 21.61 21.62
-1.00 19.44 19.51S 19.77 10.78 10.78 19.78
VAPOR PRE qURE (mb)16.00 13.55 14.87 14.32 -- 14.48 14.498.00 13.70 15.00 10.10 -- 15.20 14.844.00 13.73 14.80 15.76 -- 15.06 14.852.00 13.76 14 48 15.55 -- 14.82 14.711.00 13.81 14.75 14.35 -- 14.70 14.51.50 13.87 14.45 14.08 -- 14.38 14.51.25 13.93 14.22 13.89 .- 14.37 14.53.12 13,98 14.05 13.73 -- 14.32 14.48
_,_ WIND SPEED (c/aec1T.00 825 230 213 320 167 337
8.00 784 201 157 325 138 2654.00 706 163 130 202 103 206
II 2.00 625 147 149 165 100 1691.00 555 83 70 76 66 1131 400 49 33 59 70 99
.25 403 -.. - - 30 52 74
WIND DIRECTION d__
_________ SOIL TEMPERATURE CHANGE ( C)V Initial Time 1652 1850 2050 2150 0000 0050
Run Time (min) 24 27 27 27 26 25-. 03 -. 25 -. 96 -.69 -. 30 -. 27 - 37-,08 .09 -. 40 -.55 -.30 -.27 -.28-.12 .12 .02 -.14 -.15 -.18 -.14-.25 .03 .06 -.03 .04 .00 -.02-.50 -.02 .02 .01 .02 .02 .00
-1.00 -.01 .01 .00 .02 .00 00
Precipitation (cm)* August 28, 1956
92]

Tahlo 8.2 (Coninued)
HOURLY OI.SERIVATIONS Auigm.t 211, 1951 O'NEILL NEBRASKA
cr02U5 05 j4 054 uJ 0505 070
RADIATIONaI/cm 2 _C)_
1,.,,00o 0 .ooo - 0UU00 1.0904 00Uo518efected U.0000 .000UUO .0U00 |.0000 f .UI .0011Net Ladlahton .L00 J-.0004 j -.00,6 /-.00,1 -.0007 .021
AIR and sOll., TEN!PEIHATURES ('C) ....
16.00 23.14 121.3 22.32 21.28 19. 15 19.748.00 21.83 21.04 21.37 20.04 171.71 10.954.00 20.87 19.90 20.27 101.55 1 1. 50 2u. 152.00 19.97 1 B.95 19.01 17.39 15.65 20.28
1.019.30 18.45 16. 01 15.97 14.1)13 20. 51.50 18.591 17.98 14.5U 15.13 13.72 20.84.25 18.lu I1.,SI 13. 92 14.75 13.30 21.14.12 17.76 17.47 13.38 14.43 13.02 21.41-.03 21.23 20.87 2o. r3 19.91 19.42 19.60-, 22.63 22.15 21.11) 21.41 20.94 20. 3-.12 ' ,4 ' . 1 3 :10 22.09 22.710
-.25 23.91 23.f3 23.71 23.61 23.5u 23.38-.50 21.68 21.71 11 73 21 73 z 1. .4
-1.00 1.).82 19 13 1111)3 11 3 11)83 19 85
_VAPCII PRESSURE nb)i6W14.82 f14. 57 14.991 14 7)1 11.187 14.8BU
8.00 15.14 14 70 I 14 71 / .1)0 1i4.83 4.874.00 14.87 15.05 1.1 711 14'711 I. 1 14.)72.00 14.19 15.05 14. W) |4. W T 1:1.58 4.851.00 14.52 14.15 14.51 14 5) 13.02 14.86
.50 14.5U 14.3 14.13 1 ll 12.92 14.90
.25 14.39 14. H5 1:5.112 143:9 12.115 14.87
.12 _ 1 4.3 1 14.83 13. 615 _ 14.37 __ 12.-0 1.4.1 )7 ____J_
SDWIN SPEED (eFnl/ee)- ... 314 422 -T 3 40
8.0) 248 149 1 IN 2 Jil 184 3934.00 192 144 112 301 9 9I 3062.00 158 114 III 23 i I F) I 3261.00 I 101 61; 81 114 41 290
.50 I I 32 4624 4 4 256
.25 A14 36 9 1)7 31 205
-WIND DIiECT[ON ____g
_ .... L ...... F._____ _ 4 0 11 _
SOIt, TEMPERATURE CIlANUk,._g. --
II~ll~ ~ 150 02fJ l0350 0450 (0 005 6Run Timc (mill) 261 26 26 I 26
2 7 f 26 I
-. 03 I ,,1 / .7 ! . v . , .2k .-. 00 -.21 -.111 -.13 -ho -.18 00-.12 -.l2 -.15 -.12 -.i I .1 I -12-. -.02 -.02 ..Ul I-.17 --08 7-08-.00 I .01 o0 I 1 0 0 . I ___l-._0-. 0 - .03 00 . 01 1 0 01) .0 1
' " , ; (l (t m) . .. . .- M ) .. .
93

Tale 8.2 (Continued)
HOURLY OBSERVATrIONS Augusst 211,19513 ONEILL, NEBRASKA
LOs'r T3 1 700: 1 110T _ _115 120 1 13U
InSOS~ln .070 ADIATION ,cl 2 s c)
,u") 105 .0111HIIL d .0015 I .022 1 .0024 .0031I .0020 a01Nt1 IndiIon 035 .061 .0U115 .01 IrS .O10 .O03U
____Alit and SOIL TI:MPEIATU Irf
16.00 20.06 24.9H 2 6. 94 30.363 31.1i 31:348.00 2 1. Ul 25,34 27.25 30.186 :s1.i 51 1.714.00 21.20 25. 62 2 7.1160 31.39 31.80 31.012.00 21.291 26.02 28.07 32.26 3 2. 43 32.2?1.00 21.50 26. 26 28.87 32.90 3 3.3 G 32.56
.bU 2~0 26.78 29J, W3 3.0~j :33*0 33.41
.25 22.05 27.74 30.77 34.42 34.99 34.28
.12 23.20 28.51 31.45 34.98 35.90 34.08-.321.41 24.40 27. 'it 31,211 33,915 35.24
-. 06 21.14 22.41 24.44 2 6,1163 28.62 310.25-. 12 22.40 22.34 22. 52 22.195 23.76 24.61-.25 23.20 2:'.oU2 22.85 22.51 22.70 22.70
f.50 21 73 21 7U 2 1.568 21.58 21.64 21.61
-1.00 112 H)I 19 11 I!11 19.7 4 191.114 10.82
-5.O 5110 76 1 -IT -1Ts 1374-4 14.76 12,318.00 15 92 1(' r7 17.581 14:12 I15.05 12.574.00 16 6,00 I b, -1 17.11(0 14.37 I15. Or U2.572.00 16.0'; 1In.W; 17 163 14.30 1 5.0W 12.581.00 16Ii 1 u 18.09 17. 11 14.1 l,0 12.51).50 j12( 1.1 17 72 14.1 15.I11, 12.66,21 I 6 . 4
31 18.316 17, 80 14.5: 15. 16 12.71
.12 G.51 I1H. 54 17.1111 1-1.7 15. 19 12 M15;
WIND S PE E njsu-- ir,- .im 5SV W40 j 63:7 464.
8.00 1612 1945 :422 41115 5981 4564.00 14H1 183 :107 I4T 7 5531 4332.00 441 171 2h 1 4'1.1 476 3841.00 514 1 It7 2 53 36s5 4:11It 3 39
.50 117 1 T 2:15 3,111 403 3117,25 94 117 207 :101 : 1 W7 2 69
______ N INP EMcTIO~Ac'________
______ ____FO1IL TEMPERATURE CSA NORGE ___
I.W .43. .17. ... .. . ..4 .

Table 8.2 (Continued)
HOURLY OBSERVATIONS Augpst 28, 1956 O'NEILL, NEBRASKA
CS50185 KZZL ZY____e _____ RADIATION(callem
2sec)
.0175 .0157 - - I--Reflected .0029 /.027 I ""Net Radiation .0097 .0083 I - I
AIR and SOIL TEMPERATURES (C)
e1t.00 :31.81 29.63 32.16
8.00 32.29 30.26 33.084.00 33.01 30.67 33,162.00 33.54 31.38 33.181.00 34.01 32.23 :33.22
.50 34.80 32.94 33.26
.25 36.16 33.84 33.28
.12 37.14 34.52 33.32-. 03 35.59 36.25 31.00-. 06 31.11 31,98 29.25-. 12 25.44 26 14 26.24-. 25 22.7b 2 2. U3 23..53-. 50 21.6U 21.59 21.52
-1.00 1 I.I8,.. .1 9.__4 --1_ _ __
VAPOR PRESSURE . lJ
1 3.80 17.16r 3.gZ8.00 f 14.05 17.2H 14.0 I4.00 14.07 17.28 14 II2.00 14.07 17.27 14.121.00 j 14.98 17. 2!) 14.20.50 14.17 17.31 14.23,21 14.24 73'. 14.301.12 14.30 ri7.I1i 14.32
WIND .SPE!ED (cmae/sc_
7.0 9.14 567VT8,0 90 0 1651
4.00 744 893 41;6i2.00 6M1 7.9M 4071.00 593 71I 35I6
so 5,3 62r, 3l,.25 451 5,12 261
WIND DIRIECTION (deg),_00. 2_ _ i- I --a----i I ---____________8011 SO TEMPF'RATURE CHA OEJ __Q
Initial TIme ow--'i 1450 1759 .Run Time (min) 27 2H 27-.03 .'72 -M;i -,57
.6 30 .23 U3 I12 .33 .31 .10
-. 25 .06 ; .04-. 50 .01 I 2 l0
-1.00 U9 - (3 j .,1
Precllitatlon (cn)
95

Table 8.3 Soil moisture and sull density, O'Neill, Nebraska, 1958
D;5te: July 10 July 16
Depth (cm) Soil Soil Soil SoilMoisture Density Moisture Density
D(% ry Wt.) (Gr/e'm3) (% Dry WL.) (Gr/cm3 )
0-10 7.2 1.06 6.8 .9910-20 7.0 1.13 6.3 1.0720-30 3.8 1.28 6.3 1.1130-40 4.2 1.35 4.9 1.1740-50 5.1 1.31 3.9 1.1950-60 3.1 1.43 3.7 1.2060-70 1.9 1.534 3.4 1.2770-80 1.8 1.530 3.2 1.2980-90 2.0 1.53* 4.8 1.4090-100 5,7 1.6311 4.8 1.46
Date; August 6 AUgUSt29
Depth (cm) Soil Soil Soil BollMoisture Density Moisture Density(% Dry Wt.) (Gr/(,m3) (% Dry Wt.) (Gr/cm3)
0-10 9,2 1.03 8.6 1.0510-20 6.6 I'll 6.5 1.1990-30 3.0 1,23 6.0 1.22
90-40 2.8 1.27 4.4 1.3540--50 2.9 1.29 5.6 1.2950-60 3.5 1.32 6.7 1.39
0-0 .2 1.03.8 1.5170-80 3.8 1.35 2.9 1.5680-90 2.6 1.45 9-.4 1,5890-10U 1.8 1. 60 2,4 1.68
oMcn value, 60-100cm.
96

CHAPTER 9
EVALUATION OF THE FLUXES OF SENSIBLE AND LATENT
HEAT FROM MEASUREMENTS OF WIND, TEMPERATURE,
AND DEW POINT PROFILES
M. H. Halstead* and W. H. ClaytonTexas A&M Research Foundation
9.1 Introduction
Inasmuch as the macroparameters of meteorology are, in many
cases, determinable by the microparamctcrs in the near surface layers
of the atmosphere, a great deal of study has been conducted by many
investigators towards better evaluation of these microparameters. A
basic attack on the problem lies in the dctcrmination of the surface
energy budget; and it is the purpose of this paper to present a method
of evaluating the various terms of the energy balance relationship from
measurements of moisture, net radiation, and the vertical gradients of
wind, temperature, and moisture at a particular site for a given time
1 interval.
From conservation of energy requirements, the sum of energy
fluxes entering or leaving the earth's surface must be zero. Or
Rn + qc + qe + qs = 0 (1)
where Rn = net radiative flux of heat,
qc = flux of sensible heat to the air,
qL = flux of latent heat from evaporation orcondensation of water, andqs = conductive heat flux into or out of the ground.
The net radiation is easily measurable directly and need not, concern
us here other than as a measure of the reliability of the other terms in
Eq. (1).
*Present affiliation: U. S. Navy Electronics Laboratory
97
i.___

Measurements of soil heat flux, though not performed directly, are
based on the Fourier conduction equation and the treatment shown inthis paper is no dif ferent from that of previous authors (for example, SuttonS5).
The essential difference between this and previous papers is based
on a definition of turbulent flow first advanced by Halstead. 2 This, in
turn, leads to evaluations of qc and q in a turbulent regime different
from those obtained through the classical concept of equivalence of e-
change coefficients for heat and momentum.
The applicability of these evaluations is shown by heat budget
computations based on data collected during Project Prairie Grass by
personnel of Texas A&M Research Foundation.
9.2 The FWiZ; of Momentum
The transfer rate of molecular momentum within a gas per unit
time and area, in a direction perpendicular to the mean velocity of the
gas (or tangential shear), is proportional to the vertical gradient of the
velocity. That is,
T! = tdu/dz (2)
where A is defined as the absolute viscosity of the gas. Equation (2),
though first presented as an empirical concept, can easily be derived
from kinetic theory.
This derivation shows that
= p E L/3 (3)
where c is the root-mean-square velocity of the molecules comprising
the gas, p is the density, and L is the mem free path. If the scale of
motion within the gas, as characterized by the product uz, where z is
the distance from the bounding surface, exceeds the molecular scale
of motion as shown by cL, by a sufficient amount, the flow ceases to be
laminar and becomes irregular or chaotic or, as usually described,turbulent.
The critical values of this ratio for tubes of various sizes were
first investigated by Reynolds, who found that turbulent motion occurred
98

in a tube of diameter d when
Re = 3ud/dL = p ud/ji > 2000. (4)
Even though turbulent motion is present, a laminar sublayer ad-
jacent to the boundary can still exist. The thickness of this layer is
determinable from R. for flow over smooth surfaces. Assuming a
linear profile within the laminar layer, the surface friction 1 is
To .332ou2/ /Ro.
From integration of Eq. (2), assuming T J T(Z),
To = pELu,/36.
Thus, the localized Rcyrnolds' number is
Rc = 3u, 6/ L = 135. (5)
It should be noted that the flow pattern at z 6 will not be strictly
laminar or turbulent. That is, z = 6 cannot be interpreted as a point
but rather as a region. However, for purposus of discussion here, 6
will be regarded as the thickness of the lamninar layer.
To apply Eq. (2) to a turbulent regime, the molecular viscosity
must !bc replaced by a term, usually referred to as the eddy viscosity,
which will be a function of the distance from the bounding surface.
Inasmuch as division between laminar and turbulent flow does
not occur at a precise point, it appears reasonable that the eddy
viscosity should be so defined that it reduces to the molecular vis-
-osity. That is, Eq. (2) could be written as
r7 K du/dz, (6)
where K will be equal to g at z 0 .
Consider a flow of gas over a smooth surface and assume n
hypothetical surfaces inserted in the gas above the boundary, each a
mean distance 6 units above the layer preceding it. That is, the first
99

surface is coincident with the top of the laminar sublayer, The effect
of turbulence may be tbought of as a factor of area distortion of a
given surface. Hence, the area of the surface at elevation j will begreater than the area of the surface at j - 6 and less than the surface
at elevation j + 5. This is shown in Figure 9.1.
4turbulentboundary
3 layer
2
Slaminarjl, osublayer
Figure 9.1 Distorted Area Pattern
The first surface has the same area as the smooth boundary itself
inasmuch as below z = 6 the flow is laminar. Above z = 6, a given
surface becomes distorted due to the distortion of the preceding surface,plus any inherent distortion of the surface itself.
Let r be the ratio of areas of any two adjacent surfaces. Then
r = An/An. I .
Hence, Eq. (6) may be written Tz = MAn/A du/dz. (7)
Thus, the area of the nth layer at elevation z will be
An =A 1 rn.
100

Since A1 = Ao,
An/A o r z/6. (8)
Substituting Eq. (8) in Eq. (7), we obtain,
T z = rz p/6 du/dz, (9)
as applicable to turbulent flow.
The shearing stress 'z will vary with elevation, being a maximumat z = 0, and decreasing with elevation. For the atmosphere, 'z willvanish at z = H, where H is the geostrophic wind level.
Assuming a linear variation of shearing stress with height*, we
may write,rz = r'(1-z/1I), (10)
where T is the stress at the top of the laminar layer, which for all
practical considerations for the atmosphere will equal the shear stressat the surface. Hence,
! o (1-z/H) p E(Lrz/36) du/dz (01)
Actually, p and c and L will vary with height also, but for the lowerlayers of the atmosphere this variation will be small.
Separating variables and integrating from 6 to z, we obtain,
uz = u6 + 36r o (In z/5 - z/H)/p ELr (12)
From integration of Eq. (7) from z = 0 to z = 6 (To rZ, K
U6 = 3r 06/pEL. (13)
*This is equivalent to assuming a unidirectional mtanvelocity, negligibleCoriolis acceleration, and a uniform horizontal pressure gradient.
101

Thus,
uz = u6 [I + (In z'/ - z/H)/r] (14)
Inasmuch as the discussion is restricted to the region where z is
of the order of a few meters, while H -will be of the order of 500 meters,
z/H of Eq. (14) will be insignificant with respect to In z/6 and the former
term may be neglected. Thus,
u", vu l 1 + (ln /6)rl. (15)
Equation (15) is analogous to the wind profile equation derived
from mixing length concepts, that is,
uz = u,[A - (lnuz/v)/k] (16)
where u = 'j/T/p, k is von Karinaris constant (k = 0.40), and A is a
constant, It is interesting to convert Eqs. (15) and (16) to identical
form, inasmuch as A and k have been evaluated from empirical studies.
From Eqs. (5) and (13),
ub Rcv/6 = u 26/v. (17)
Substituting in Eq. (15)
uz - U,[A + (In zu,/6)k] (18)
wvhich is identical to Eq. (16) when
A u v,,/1[ I - (In u,6/v)/r] (19)
andk = vr/u, 5. (20)
Using Nikuradse's (Sutton 5 ) data for flow near a smooth surface,
A -z 5.5 for k : .40; hence, r = 4.65.
More recent work by Laufer at the Bureau cf Standards affirms
the Nikuradse data and leads to the same r value.
102

Substituting this value in Eq. (15),
uz = u6[1+ (lnz/6)/4.65], z >6 (21)
for flow near a smooth bounding surface.Within the laminar sublayer (z < 6), u is given from Eq. (17)
and using p = 1.8 x 10- gm/cm sec, p 1.2 x 10- 3 gm/cm ,
u6 =. 20.3/6. (22)
Figure 9.2 shows Eqs. (21) and (13) for sevcral T values,plotted as velocity versus the logarithm of elevation. The turbulent andlaminar regimes are separated by the line along which u. 6 = 20.3.
The applicability of Eq. (21) is limited to small elevations andsmooth surfaces. We can rigorously define elevation but not a smooth
surface. Aerodynamically speaking, a smooth surfare mpans asurface that does not physically protrude through the laminar sublayer.However, since the thickness of this layer depends upon the velocity,
a surface consisting of No. 4 sandpaper could be a smooth surface;and, under other flow conditions, a pane of glass could be a rough
surface.While a satisfactory theoretical treatment of the effect of surface
roughness has yet to be developed, it is reasonable to think of thoroughness elements as sinks of momentum which in total are equiva-lent to a "drag velocity." Hence, for the postulated type of flow over a
rough surface, Eq. (21) can be ,iodificd to
1u, = us[ 1 + (In z/6)/4.651 - us, (23)
where us is the drag velocity corresponding to momentum transferredto surface roughness elements, assuming no modification of the rough-ness elements by the flow. Further, the length 6 must then represent,not the thickness of an actual sublayer, but morc generally, the thick-ness of any layer which would give a distortion r. Since it is imi-possible to determine the sink strength of a surface theoretically or to
103

_4 0
b)0
41
C4-
7 -1k
4104

measure us directly, it is necessary to eliminate the "drag velocity"
by solving Eq. (23) simultaneously, for more than one level.
In the presence of a vertical gradient of potential temperature, the
modification of the flow pattern can be sign ificant, as the density, mean
free path, and root mean square velocity of the gas will change with
elevation. That is, a buoyancy term will be present. This will be true
in the laminar as well as in the turbulent region. For the lowerlayers of the atmosphere to which this discussion is restricted, the
effects of buoyancy can be large, varying velocities and transfer rates
'through one or two orders of magnitudes. Fortunately, however, these
effects do not appreciably influence the logarithmic nature of the pro-
files in the layers below one or two meters, hence need not be con-sidered. Actually, this requires that z be no greater than tMe eva-
tion for which u vs In z is linear.
In general, the argument presented implies that turbulent transfer
is not a function of an .xchangc coefficient varying with lateral or verti-
cal displacement but a rate of distortion of laminar flow area which will
vary from case to case, but will remain constant for a given flow pattern.In order to apply the development to measurements of momentum
transfer to the surface, we require the difference in velocity between a
height z and 2z. From Eq. (23)
u2, - uz = (u6 In 2)/r, (24)
Substituting Eq. (23) in (13) and recalling that r - 4.65, then tie total
momentum flux at the surface (or any elevation, z, since Eq. (23) is
essentially based on constancy of shearing stress with height) is given
by
T'z = /3p(u2z- Uz). (25)
Inasmuch as this equation will be used again in the evaluation of
the convective and evaporative fluxes of heat, it will be worthwhile to
repeat the meaning of the various terms entering this equation.
105

'Those are listed below:
uZ = mean wind speed at elevation z,
u5 = mean speed at the top of the laminar sublayer (fictionalfor flow over a rough surface),
r = 4.65, increase in surface area due to turbulent dis-tortion of a single layer of mean thickness 6,
5 = thickness of layer producing a constant distortion r(for flow over smooth surfaces, the thickness of thelaminar sublayer).
9.3 The Flux of Sensible Heat
The rate of vertical transfer of heat (q.) per unit time and unit
area within a gas is proportional to the density ,f the medium, the
specific hcat, and the gradient of potential temperature, or for non-
turbulent flow,
q p - Pc P Cp dT/dz, (26)I where p is density, c is the specific heat at constant pressure, T ispotential temperature, and v is a constant of proportionality related
to the product of molecular mean free path and root-mean-square
velocity, and grenerally referred to as the thermal diffusivity. It has
the same units as kinematic viscosity, cm 2/sec in the cgs system.
If air is in turbulent motion, transfer of heat is still expressible
by Eq. (26) but with a dependency on the scale of motion within the
fluid. That is, heat is transferred by parcels of air as well as by in-
dividual molecules.
As in the case of flux of momentvim, consider a flow of air over
a smooth boundary with hypothetical, equally spaced surfaces sepa-
rating layers of the moving air. For laminar flow, each surface will
be parallel to every other surface, or each surface will have the same
area. For turbulent flow, however, each surface will have a different
area depending on thu dugree of turbulence. The first of this hyp--
thetical group of surfaces will be parallel to the solid surface itself,
if it is located at the top of the laminar layer, which is at a distance &
106

above the solid boundary. Surface number two, at a mean distance 6
above number one, will be distorted to a degree depending on the scale
of motion between the two surfaces. Surface number three (at a mean
distance 8 above surface two) will be distorted according to the scale
of motion between it and surface one, or between it and number two,
plus the distortion between surfaces one and two.
The area of a surface at a given height, z, is a measure of theopportunity for energy transfer. This area An, divided by the hrea of
surface number one (or the area of the boundary itself, A), will be
equal to rn where r is the fractional increase in area due to turbulentdistortion and n is the numer of surfaces, each a mean distance 8
apart, betwcen the boundary and elevation z.
Thus,
Al = Ao rz/6. (27)
Hence, Eq. (26) may be written as
qe = Kc pcp dT/dz, (28)
where Kc = Pc for z < 5 (laminar flow),
and for turbulent flow (over smooth surfaces) as,
q = v. rz p cp/6 dT/dz. (29)
Restricting the application of Eq. (29) to small values of z, con-
stancy of vPe, p, and cp may be assumed. This, in effect, means
negligibility of any buoyancy terms.
For the same conditions given In the preceding section for stress
varying linearly with elevation, we assume a linear variation of q
with elevation, or
q,,= (I - Z/H) .30)
where H is the thickness of the turbulent layer, or geostrophic wind
level.
107

Substituting Eq. (30) in (29), separating variables, and integrating
from the top of the laminar layer to an elevation z,
T= T,[ 1 + (hi z/6 - z/H)/r] , (31)
where
T6 = qc6/p Cp VC (32)
For small values of z, the term z/H will be negligible in com-
parison with In z/6 and may be omitted. Thus,
Tz = T5 [I + (In z/6)/r] (33)
for flow over smooth surfaces.
For flow over aerodynamically rough sur.faces, we parallel the
previous view concerning momentum. That is, we will regard rough-ness elements to act as sources or sinks of heat, according to the
temperature differences between the elements and the ambient, mid
postulate a potential temperature equivalent to the magnitude of the
sources or sinks. In this view, Eq. (32) may be modified to
Wz = T 6 [I + (Inz/6)/r] + Ts . (34)
Generally, T. will be unknown, but it is not involved when Eq. (34)is applied to potential difference between two levels. For the particu-
lar levels z and 2z,
- T T6 (In 2)/r. (35)
Combining Eqs. (17), (24), (32), and (35), we obtain
qC = Cp Pr p Vc ('12z - Tz) (u2z - uz)/R c v (In 2)2 (36)
for evaluation of the flux of sensible heat.
108

Using the values
p -1.2×10" 3 gm/cm 3
Cp - 0.24 cal/gm deg C,
Vc = 0.21 cm 2/sec,
V - 0.15 cm 2/sec,
r = 4.65, and
Rc = 135,
in Eq. (36)
="124 3 (u2z" uz) (T 2 z - Tz) (37)
with q. in cal/cm 2 sec, velocity in cm/sec, and temperature indegrees Centigrade.
9.4 The Flux of Water VaporEvaporation of a fluid is a measure of the difference of exchange
rates of molecules of the fluid between the surface and the surroundingmedium. For the case in which molecules escaping from the surface ofthe fluid are influenced only by their concentration and the molecularproperties of the surrounding medium (for example, still air over water),the evaporation is given by,
E = ad p'/dz, (38)
where a is the diffusion coefficient, and p' is the density of the fluidvapor. While a will vary slightly with temperature, it may be con-sidered constant for purposes of this discussion. Its value for 15'Cis .250 ca2/AC.
If the air is in turbulent motion, Eq. (38) requires modificationto allow for non-molecular tran..fer. As in the previous cases oftransfer of momentum and heat, we will generalize the laminar flow
109

case to include turbulent flow by introducing a factor to allow for theincreased area of contact between the turbulently distorted layers,
or
E = a r z/6 dp'/dz. (39)
Using the same reasoning that has been applied for the wind and
temperature profiles with respect to variations in E with height,surface roughness, and thermal buoyancy, the evaporation Is given
asE --a(U2z - u. ) (P'2, -Plz ) / 3 ' (40)
where E will be given in gm/cm 2 sec for pt in gm/cm 3 , and u in
cm/see.In order to compute the flux of latent heat by evaporation, Eq. (40)
must be multiplied by the latent heat of vaporization of water for the
particular temperature concerned. Using 20'C as an average tem-
perature and converting absolute humidity to an equivalent vapor
pressure by use of
p'-- eM/RT (41)
where
M = 18, molecular weight of water,
R = 8.31 x 10⁻⁷ erg deg, universal gas constant,
T = 293'K,
o = vapor pressure (millibars), and
ge = evaporative flux of heat,
we can write approximately,
240 ,10 (42)qe'401 (u2, z'zJe2z'-ez)'
2when qe is given in cal/cm. sec.
110

9.5 Soil Heat FluxInasmuch as transfer of heat energy within the soil is by conduc-
tion, the equation for heat flux in the soil is given by tke Fourier
re lation,
D T/Ot = v V 2 T (43)
where T = temperature, and vc = thermal diffusion coefficient. If22 2 2=a T/D x = T/8y 0, using Eq. (26) to define the heat flux, and
considering z to increase positively with height,Ioqo = qz + f P C p ( 8T/a t) dz. (44)
0
Since It is desirable to determine the surface hcat flux from soil
temperature difference with time, q must equal zero. That is,
measurements must cover the range from the surface to a point
where OT/8z = 0. Hence,0
qo f P C1 (OW/ t)dz. (45)z
9.6 Computation of Surface Heat Budgets
During the 70 gas releases of Project Prairie Grass, personnel
of the Texas A&M Research Foundation made measurements of net
radiation as well as of wind velocity, vapor pressure, air tempera-
ture, and soil temperature at several levels. These data have been
used in the energy balance equation as a measure of the applicability
of the expressions developed for evaluating the fluxes of sensible
and evaporative heat.The systems of measurement employed in the study are de-
scribed in Chapter 7 of this report and need not be repeated here. The
method of analysis of the data as pertinent to te various flux compu-
tations, however, is given below.Referring to Eq. (37), evaluation of Au (u2z - u,7) and AT (T2 z - Tz)
111

is all that is required to evaluate the flux of sensible heat. These
values, of course, are obtainable from profile measurements of windspeed and air temperature. Specifically, the mean values of u and T at12.5, 25, 50, 100, 200, 400, 800, and 1600 centimeters were measured
for a 20- to 30-minute nterval surrounding the gas release intervals
and plotted versus the logarithm of elevation. Inasmuch as the de-veloped relationships apply in the region where u is linear with In z,
the portions of the profiles significant to the study are straight lines,
and the double-level variation is merely the abscissa increment be-tween any two successive levels along the profile.
To minimize plotting and reading errors, the increments were
read betwkeen four levels and divided accordingly. Of course, not all
profiles were strictly linear. In such cases the "best sight" fit to alinear profile was used with greatest weight given to the lowest levelswhere deviation from linearity was a minimum.
In the u evaluation, extrapolation of the profile to u = 0 gives
the roughness parameter zo, as can be seen from
u = (u lnz/z o)/k, (46)
which is another form of Eq. (16). A value of 0.6 cm was found to be
the zo value for the measuring station location. This value represents
the average value of the In z versus u intercepts of 16 profiles that
were essentially linear at all levels. Hence, all wind profiles were
drawn as straight lines from the point z = 0.6 cm, u = 0, through thelower four points of u versus the logarithm of z.
The increment of vapor pressure Ae = (e2 z - ez ) was obtained
similarly from measurements of vapor pressure at the same eleva-tions used for wind speed and air temperature.
The soil heat flux at the surface is given by Eq. (45). Both p
and c. vary with depth but so slightly, for the interval considered,1'
that they may be Created as constant. For the type of soil in question
(O'Neill loam, upland phase), p cp = 0.28, as determined from six
112

different soil tests performed during the period covered by the data.
Thus, the value of soil heat flux is proportional to the area betweenprofiles of temperature versus depth at the beginning and the end of thesampling period. The above, of course, is based on the assumptionthat 8T/Oz = 0 at some levol z.
Soil temperatures were measured at 3.12, 6.25, 12.5, 25, 50, and100 centimeters. If a maximum or minimum occurred at a depth ofless than 100 centimeters, then the integral is represented by the areabetween the two profiles from the surface to the critical depth. If nomaximum or minimum temperature occurred, then the integral wasevaiuated to 100 centimeters, provided the temperature at that depthdid not vary significantly with time during the gas release period. In-
asmuch as surface temperature was not measured, this point on the
profile was obtained from a graph of surface temperature versustime of day for that location as given by an analog computer 4 fromlocal input data.
Table 9.1 gives a summary of the analysis for 48 release periodsfor which complete data were available. The fluxes in this table are
given in kilocalories per square centimeter per second. To facilitatecomparison of these fluxes with values determined by the Universityof Wisconsin group, the fluxes are presented in calories per square
centimeter per minute in Table 9.2.The line of best fit* of the data of Table 9.1 is y = .99 x, where
y represents the net radiation values and x is the negative of the sum
of the fluxes of latent heat, sensible heat, and soil heat,. The averageerror (that is, between the net radiation values and the sum of the
fluxes) is 0.43 X 10- 3 cal/cm 2 sec. Lf release No. 10, which is obvi-ously suspect, is omitted, the line of best fit is y = 0.97x and average
error is 0.36 X 10- 3 cal/cm 2 sec.
*Determined by the method of last squares. The second significant fig-ure in the equation of best fit should not be taken to imply an accuracyof 1 percent, but is given only as a means of comparison with other equa-tions based on different methods of evaluating heat fluxes.
113

Table 9.1. Heat budget data collected by the Texas A&M Research Foundation
Gas Au A As qc qe qS rqi Rn R n + Z qi
Kcal Kcal Kcal Keal Kcal KcalRel. em- °C mb 2 2 22 22
No. sec cm sec cm sec cm 2see cm 2sec cm 2sec cm 2sec
2 23 - .28 -. 42 - .80 -2.32 .07 - 3.05 2.90 .157 54 -1.07 -. 33 - 7.16 -4.28 -1.58 -131.02 12.80 .228 54 - .51 -. 20 - 3.41 -2.59 .23 - 5.77 5.70 .079 84 - .53 -. 23 - 5,52 -4.64 -1.18 -11.34 11.40 - .06
10 57 - .90 -. 13 - 6.35 -1.78 -1.39 - 9.53 12.80 -3.2715 40 - .70 -. 09 - 3.47 - .86 -1,11 - 5.44 5.00 .4416 42 -1.03 -. 23 - 5.36 -2,32 -2.38 -10.00 10.00 .0619 73 - .60 -. 10 - 5.43 -1.75 -1.08 - 8.26 8.10 .1620 112 - .83 -. 05 -11.53 -1.34 -1.43 -14.30 13.70 .6021 72 .10 -. 01 .89 - .17 .22 .94 - .90 - .0422 83 .15 -. 02 1.54 - .40 .28 1.42 - 1.40 - .0225 34 - .52 -. 48 - 2.19 -3.92 .03 - 6.08 6.20 - .1226 79 - .63 -. 30 - 6.17 -5.09 -1.06 -12.92 12.6u .3227 73 - .82 -. 18 - 7.42 -3.15 -2,68 -13.25 12.30 .9530 83 - .70 -. 25 - 7.20 -4.98 -1.52 -13.70 12,90 .8031 99 -. 38 -. 14 - 4.66 -3.33 - .95 - 8,94 9.20 -. 2632 20 .33 -. 06 .82 - .29 .99 1.52 - 1.30 - .2233 90 - .48 -. 30 - 5.36 -6.48 .78 -11.00 10.00 .1634 710 .55 -.15 7.50 .1 .35 -ii,81 11.30 .5135s 44 .12, -.04 .65 - 2 .76 -99 - .70 - .2935 10 .12 .07 , .10 3 -0.82 .97 - .01 .036 16 .23 -. 06 .46 - .23 .61 .84 - .85 .0138 48 .10 .00 .60 .00 .35 .9 - .85 - .104S9 22 .26 -.02 .71 - . 1 .78 1.38 - 1.35 - .0340 90 .53 -. 01 .57 19 .70 1.03 1.14 .0641 42 .16 -. 01 .83 - .10 .51 1.24 - 1.23 - .0142 70 .15 -. 01 1.30 - .17 .26 1.39 - 1.92 .5343 65 - .83 -. 17 - 6.69 -2.65 - .63 - 9.97 10.80 .0344 71 .85 -. 07 - 7.48 -1.19 -1.35 -10.02 9.70 .3245 70 .20 -. 03 - 1.74 - .50 .68 - 1.58 1.50 -15
46 66 .13 -. 04 1.06 63 1.34 1.77 - 1.40 .3745 38 .77 -. 34 - 3.23 -3.10 -1.54 - 8.27 7.00 1.2748 91 -. 51 -. II1 - 5.75 -2.40 -1.01 - 9.,16 8,10 L.0G49 2 .76 -. 15 - 7.73 -2.95 -1.67 -12.35 12.90 - .5550 81 .90 -. 13 - 9.04 -2.53 -1.33 -12.90 12.80 .1051 22 .67 -13 - 6.81 -2.56 - .52 - .89 8.80 1.0952 55 -1.25 -. 19 - 8.52 -2.51 -,68 -11.71 I1.00 .7161 21 .43 -. 03 1,12 - .15 .28 1,93 11.50 -. 4554 46 .17 .00 .97 .00 .67 1.64 1.70 -0.55 C69 .15 .00 1.28 .00 .55 i. 83 -1.50 -.33
56 53 .10 .04 .61 .54 .64 1.87 - 1.40 - .757 05 -. 13 -. 02 - 1.37 - .Al .34 - 1.44 1.30 .1459 26 .26 -. 01 .84 - .0(1 .58 1.36 -1.40 .0460 54 .17 -. 01 1.14 - .13 .52 1.53 -1.40 -.1361 96 -. 70 -. 0 $ - 8.33 -1.84 -1.21 -.11,38 II.900 .52G 2 63 -,37 -. 17 - 2.89 -2,57 - .60 -6.06 7.20 -1.1463 3 .83 A,7 .31 .,54 .95 1.60 - 1.10 - .5064 3 .43 .18 .16 .13 .96 1.25 - .50 -. 75
114

Table 9.2. heat budget data collected by the Toexas A&M Rtesearch Foundation
Gas qc q0 qS .n
cal cal cal calRelease 2 2ri iNo. cn 111mn DIM 1111 C"", 2
2 -.0,18 -.139 .004 .1747 -. 430 -. 257 -. 095 .7UB8 -. 205 -. 155 .014 .3429 -. 331 -. 278 -. 071 .684
10 -. 382 -. 107 -. 083 .76815 ... 208 -. 052 -. 067 .30016 -. 322 -. 139 -. 143 .0019 -.326 -.105 -.065 .48620 -. 692 -.080 -. 086 .82221 .053 -. 010 .013 -. 05422 .092 -. 024 .017 -. 08425-.131 -. 235 .002 .37226 -.370 -.341 -.064 .75627 -.445 -.180 -.161 .738S30 -A432 -. 299 -. 091 .776
'31 -. 280 -. 200 -. 057 .552
32 .040 -.017 .059 -.0783322 -.389 .0407 5434 -.450 -. 238 -.021 .67835s .039 -.025 .046 -.01235 .009 .000 .049 -.055
36 .028 -.014 037 -05138 .036 .000 .021 -.051
39 .043 -.007 .047 -.0140 .034 -.011 .042 -.06841 .050 -.006 .031 -.07442 .078 -.010 .016 -.11543 -.401 -.159 ..038 .64844 -. 449 -.071 -..081 .502
45 -.104 -.030 .040 .08446 .064 -.038 .080 -.08448s .018 -.025 .092 4048 .35 -.144 -.061 -. 849 -.464 -.177 -.100 .77450 -.542 -.152 -.070 .71,
51 -.409 -.154 -.031 .5205 2 -.Gil -.151 -.041 .660
53 .067 -. 009 .059 -.090r,4 .058 .000 .040 -.10255 .077 000 .033-.956 .041 .032 ,03^0 -.08457 -.082 .025 .020 .07859 .050 -.004 .035 -.08460 .068 -. 008 .031 -. 08,461 -.500 - llu -.073 .71462 -.173 -.154 -.03G .4 3263 .ig .020 .057 -.066
04 .010 .008 .058 -.030
115

Figure 9.3 is a scatter diagram of the data of Table 9.1.A comparison of Eq. (40) with the Thornthwaite-Holzman evapo-
ration formula shows that the latter relation differs from the formerby a constant factor. The equations are, respectively,
qle o /3vAupl (46)
q2e = (pk2 AuAh)/(ln 2)2 (47)
where Ah is the difference in specific humidity between elevations zand 2z, and all other symbols have the meanings previously used.
Replacing h in Eq. (47) by the ratio of absolute humidity to air density
q le/q2e = a/v (in 2) 2 / 3k (48)
That is,
l a/iv q2e (49)
At 200C, the ratio of u/v is equal to 1.6 or
qle - l'6q2ea (50)
Hence, the evaporation amout aid the flux of latent heat, as computL d
by the developments in this paper, are approximately 50 percentgreater than the corresponding values obtained by the Thornthwaite-
Holzman equation.The sensible heat flux, according to the developments of this
paper, also differs from the usual computations based on equivalence
of the eddy conduction of heat and momentum by approximately 50 per-
cent. That is,
qlh c K Cp p dO/dz (51)
where KH is the eddy coefficient for heat. Assuming that Km = KI1ku*z, where the subscript m refers to momentum, then
1lh ku, z cpp dO/dz (52)
i __!_

o 61
\ N
F 117

Comparing this with Eq. (29)
q 2h = P. r(z/6) p cp dO/dz
and using Eq. (20) to evaluate ku.,
qlh/q2 h = v/v c m /KI. , (53)
which is the Prandtl number for air (.7 11). Hence,
~ l.~ 1~P(54)q2hi = l'4qlh' (54I
or, as noted above, the sensible heat flux based on the reasoning of
this paper is approximately one and one-half times the flux compu-.
tatlons based on equivalence of the Austauch values for heat and
momentum. Figure 9.4 is a scatter diagram of the O'Neill databased on the latter concept.
The supposition that the exchange coefficients for heat and
momentum are equal or nearly so probably dates from the Reynolds'
analogy, that is,
T/p= (v + K) du/dz = K du/dz (55)
-uid
-q/c p = (vc + K) dO /dz = KH d 0/dz. (56)
Assuming that v and v. represent insignificant contributions to the
coefficients, K1 t and Km should be nearly equal.
The development used in this paper is equivalent to the postulate
that
Trp - K du/dz - K du/dz, (57)
midand
-q/p Cp = 1'c K de/dz = KH dO/dz, (58)
hence, using Eqs. (9) and (29).
ii ~i

4
Cu x
N1JV~3N

Km/K H = v/vc. (59)
It is not intended to imply that the equivalence of the eddy co-efficients for momentum and heat has been universally accepted in
the past. Swinbark 6 from experiments conducted in Australia says"... there is a certain notable consistency about the manner in whichKH exceeds Km. Not only is this order of the coefficients main-
tained from one occasion to another, but also, broadly, the propor-
tionality among them." From five measurements of Km and K. 1 ,his average ratio is
KH/K m = 1.8, (60)
which is certainly of tie magnitude of the ratio of vr to v.
Data obtained by Rider 4 at Cardington, England, also supportsthis value of the ratio of Km and Kif, although Rider did not interpret
the results as support for the non-equivalence of the two coefficients.
From averaging of nine evaluations of KH and Km (at 75 centimeters)from observed energy balance computations, Rider finds as an average
ratio
Kin/K 1 .70.
While this value is indeed near unity, it is remarkably near the
Prandtl number (.711) for air.
While detailed profiles of wind, temperature, and humidity have
been utilized in verifying the turbulent transfer equations, the equa-tions themselves require measurements at only two levels. Since
measurement of a detailed profile requires a large number of highly
accurate instruments and a comparable amount of technical time and
attention, it would seem important to determine the degree of accuracy
with which the various terms in the energy budget would have b lanced
had only two levels been available. Further, the data available should
be sufficient to determine the optimum levels at which measurements
could have been made,.
120

The matter of optimum levels must require a compromise which
will minimize three possible sources of error. First, the lowest levelneeds to be far enough above the surface that irregularities in thatsurface do not cause an appreciable uncertainty in determining theheight of that level. Second, tht. difference in height between the twolevels needs to be sufficiently great (in terms of doubled levels) so that
errors caused by instrument inaccuracies and sampling errors are nottoo great. Third, the top level needs to be as low as possible so as to
avoid the effect of buoyancy.To study the combined effect of these Lhree error sources, the data
of the previous section have been treated in the following way. Valuesof Au, Ae, and Ae have been obtained from the 21 pairs of levels; 25 to50 cm, 25 to 100 cm, 25 to 200 cm, 25 to 400 cm, 25 to 800 cm, 25 to1600 cm, 50 to 100 cm, 50 to 200 cm, 50 to 400 cm, 50 to 800 cm, 50 to1600 cm, 100 to 200 cm, 100 to 400 cm, 100 to 800 cm, 100 to 1600 em,200 to 400 cm, 200 to 800 cm, 200 to 1600 cm, 400 to 800 cm, 400 to
1600 cm, and 800 to 1600 cm. The number of Au's, AO's and Ae's, ob-tained in this manner (per pair of levels) that fall within 10 percent ofthe corresponding profile determinations are shown in Table 9.3.
As can be seen from this table, the levels at 25 and 100 cm appear
to give the most satisfactory representation of the entire profiles. Thisis further substantiated by Table 9.4 which lists the best fit equationsand average error for the four best level pairs, as well as that obtained
from use of the profiles to determLne Au, A9, and Ae.9.7 Conclusion
The method developed in this paper appears to he satisfactory forcalculating the turbulent transport of sensible and latent heat over therange of conditions represented by the data available.
However, since it differs from earlier methods by approximately50 percent and since the test data are restricted to a summer seasonwith exclusively southerly winds, it would appear desirable that it betested further, preferably by other workers in the field.
121
-- --

Table 9,3. Percentage of double-level values within 10 percent ofprofile values
Level Au AO Ae % Level Au A Ae 9Pair Pair(cm) cm/sec 'C mb (cm) cm/sec 'C mb
25-50 17 19 19 38 100-200 15 12 10 2625-100 25 25 18 47 100-400 15 14 8 2625-200 28 20 17 45 100-800 8 8 15 2225-400 24 18 11 37 100-1600 7 8 12 1925-800 12 17 11 28 200-400 12 9 9 2125-1600 12 15 15 29 200-800 6 10 12 1950-100 18 13 8 27 200-1600 3 6 14 1650-200 17 13 13 30 400-800 4 5 6 1050-400 19 1.7 11 33 400-1600 4 4 6 1050-800 10 11 12 2n 800-1600 4 3 6 950-1600 9 8 8 17
Table 9.4. Statistical analysis of heat budget balance
Average Error
2 LevelsMethod Line of Best Fit* (cal/cm sec) Employed
CLASSICAL y = 1.37X 1.60 x 10- 3 ProfilesDISTORTED AREA y = .92X 1.14 x j0- 3 25-50 cmDISTORT.SD AREA y = 1.0 X 1.00 x jo-3 25-100 cmDISTORTED AREA y = 1,0 X 1.25 x 10- 3 25-200 cmDISTORTED AREA y = 1.0 X 1.40 x 10-3 25-400 cmDISTORTED AREA y = .99X .43 x 10-3 Profiles
*Line of regression
122
___
REFERENCES
1. Blasius, H., Z. Math. u. Physik 56 1908.
2. Halstead, M. H., "The Fluxes of Momentum, Heat, and WaterVapor in Micrometeorology." Publications in Climatology 7,No. 2, The Johns Hopkins University Laboratory of Climatology,Seabruok, New Jersey, 1954.
3. Halstead, M. H., et al., "A Preliminary Report on the Design ofa Computer for Micrometeoroiogy." Scientific Report No. 1,Project 93, Texas A&M Research Foundation, College Station,Texas, 1956.
4. Rider, N. E., "Eddy Diffu.-jion of Momentum Water Vapor, andHeat Near the Ground." Proc. Roy. Soc. A246, 481-501, 1954.
5. Sutton, O. G., Micrometeorology, McGraw-Hill, New York,198 and 80, 1953,
6. Swinbank, W. C., "The Measurement of the Vertical Transferof Heat, Water Vapor, and Momentum by Eddies in the LowerAtmosphere, with Some Results." Geophysical ResearchPapers No. 19, Geophysics Research Directorate, AF CambridgeResearch enter, 363, 1952.
123

CHAPTER 10
HEAT BUDGET DETERMINATIONS MADE BY THEUNIVERSITY OF WISCONSIN GROUP
V. E. Suomi and P. M. KuhNUniversity of Wisconsin
10.1 Instrumentation
The instrumentation used in heat budget determinations duringProject Prairie Grass was, with two exceptions, the same as thatused by the University of Wisconsin during the Great Plains Tur-bulence Field Program in 1953. 1 The exceptions are as follows:
a. In 1953 the thermocouples in the psychrometers were wiredto give the dry bulb temperature difference and the difference in the
wet bulb depressions. During these experiments the thermocouples
were wired to give the dry bulb temperature difference and the wetbulb temperature difference so that the vapor pressure difference isgiven by the relation
Ae= (K+ k) ATw - k ATd (1)
where k is the psychrometric constant and K is the slope of -the vaporpressure vs. temperature curve at the mean wet bulb temperature.
Every 10 minutes the positions of the two psychrometers were
reversed but the connection to the recorder was not. This has the
effect of doubling the sensitivity and yet eliminating dead zone and
zero errors. Therefore, the vapor pressure and temperature gradi-
ents obtained during the Prairie Grass experiments are more accurate
than those obtained in 1953. This is especially true during those times
that the gradient is small.
b. Soil heat flow was obtained by measuring the change in the
heat content of the layer 0-5 cm and the heat flux through the -5 cm
124

level. The change in mean temperature of the 0-5 cm layer was meas-
ured using 12 space-integrating thermometers similar to those used in
1953. Instead of a manual balancing of a Wheatstone bridge, the out-of-
balance current was recorded on the 12-point Brown recorder. The out-
of -balance current depends on battery voltage as well as resistance;however, the former was held constant by employing mercury alkalinebatteries. The heat flow through the -5 cm layer was measured using 5heat flux plates connected in series. The soil term C listed in the tables
in Section 10.2 is the sum of the change in the heat content of the layer 0to -5 cm and the heat flux through the -5 cm level.
10.2 Heat Budget DataThe heat budget values listed in Table 10.1 are 20-minute averages
centered, in each case, on the period of gas release. Estimated values
are shown in parentheses. Missing values, duc to instrument failure,
are denoted by dashes. Positive signs indicate fluxes toward the air-earth interface; negative signs indicate fluxes away from the interface.
125

II
Table 10.1 Heat budget data* collected by the Universityof Wlsconsin
Gas Release Date Time I RN L E GNumber (CST)
i 3 7/5 2200 -. 104 7/6 0100 -. 105 7/6 1400 1.30 1.086 7/6 1700 .73 .507 7/10 1400 1.35 .82 -. 39 -. 26 -. 128 7/10 1700 .75 .36 -. 23 -. 12 .019 7/11 1000 1.06 .61 -. 30 -. 18 -. 13
10 7/11 1200 1.23 .76 -. 38 -. 24 -. 1411 7/14 0800 .72 .39 -.21 -. 12 -. 0512 7/14 1000 65 .73 -. 3B -. 21 -. 1413 7/22 2000 .03 -.08 .01 0 .0614 7/22 2200 0 -. 07 .01 .01 .0515 7/23 0800 .70 .38 -. 19 -. 08 -. 1016 7/23 1000 1.15 .70 -. 36 -. 18 -. 1617 7/23 2000 .05 -. 06 0 .01 .0518 7/23 2200 0 -. 09 .. .. .0419 7/25 1100 1.10 .69 -40 -. 16 -. 1420 7/25 1300 1.30 .85 -. 52 -. 26 -. 0621 7/25 2200 0 -. 05 .02 .01 .0222 7/26 0000 0 -. 07 02 .01 .0523 7/29 2100 0 -. 09 .04 .02 .0224 7/29 2300 0 -. 08 .03 .02 .0225 8,/1 1300 .72 .46 -. 19 -. 23 -. 0426 8/2 1200 .86 .61 -. 20 -. 33 -. 0827 8/2 1400 :97 .64 -. 19 -. 37 -. 0828 8/3 0000 0 -. 09 .. .. ..29 8/3 0200 0 -. 06 .. .. .0130 8/3 1300 1.22 .84 -. 34 -. 39 -. 1031 8/3 1500 .89 .58 -. 25 -. 31 -. 0332 8/6 2000 .02 (-.09) -. . .0433 8/7 1300 1.09 .83 -. 39 -. 35 -. 0834 8/7 1500 1.10 .84 -. 44 -. 36 -. 0535 8/11 2130 0 -. 06 .02 .01 .0336 8,/11 2330 0 -. 07 .01 0 .0537 8/12 0300 0 -. 05 .. .. .0238 8/12 0500 .01 -. 07 .. .. .0239 8/13 2230 0 0 -. 01 -. 02 .0340 8/14 0030 0 -. 01 -. 01 -. 02 .0441 8/14 0300 0 -. 01 -. 01 -. 01 .0242 8/14 0500 0 0 -. 01 -. 01 .02
126

Table 10.1 Heat budget data* collected by the Universityof Wisconsin (cont)
Gas Release Date Time I RN L E GNumber (CST)
43 8/15 1200 1Il .93 .. . ..44 8/15 1400 1.13 .03 .. ...45 8/15 1200 .41 .25 .. .. ..46 8/15 1845 .05 -.03 .. .. .0447 8/20 1000 .85 .45 -. 21 -. 14 -. 1148 8/21 0900 .39 .21 -. 11 -. 05 -. 04
* All heit budget entries are in langleys per minute.R represents insolationRN represents net radiation
L represents convective heat transferE represents evaporationG represents soil heat transfer'f ( )denotes estimated value
, -- denotes missing data due to instrument failure
REFERENCE
1. Lettau, H. H. and Davidson, B. Enjlorintg mAttnosphere's FirstMIit. ]Pergamon Press, New York, i'7, Volume , Chapters 2,3, and 4.
127

CHAPTER 11OPTICAL MEASUREMENTS OF LAPSE RATE
R. G. FleagleUniversity of Washington*
11.1 IntroductionDetailed and very accurate observations of temperature structure
in the lowest 50 cm of the atmosphere have been made above a cold
water surface by an optical method. 1 These observations reveal a
minor anomaly in the temperature profile at a height of about 10 cm of
air (equivalent to an optical path length of 10-4 gm cm-2 of watervapor) which is consistent with simple numerical calculations based on
extrapolated radiative absorption coefficients for water vapor. At thisheight above a cold surface, the air conls by radiation at several de-
grees Centigrade per hour; and, this cooling is reflected in the observed
anomaly in the temperature profile.Optical observations were incorporated in Project Prairie Grass
to determine the detailed temperature :.tructure above a warm land
surface. The method used was essentially that described in reference
1, but certain modifications in detailed technique were necessary. Theinstrument used was a field artillery range finder operated in the verti-
cal position. In lapse conditions the two light paths from instrument to
target diverge from their respective straight-line directions as shown in
Figure 11.1, whereas in inversions the light paths converge from their
respective straight-line directions. The instrument is mechanically
* Personnel of the Texas A&M Research Foundation, under the directionof Professor Maurice Halstead, enntructed t:he optical targets andmadc Lhe tlie zer'ies observations.Max Scoggins, General Electric Company Richland, Washington, helpedin installation of the equipment and in maling the profile observations.
128
I,.

limited to measuring converging angles; consequently, in lapse conditionsit was necessary to use targets separated by a vertical distance less thanthe separation of the lenses. The separation used in lapse conditions was90 or 95 cm, whereas the separation of lenses is 100 cm. For this reason,in lapse conditions the upper path sloped slightly with respect to the lowerpath, but not enough to affect the measurements appreciably. From Figure
11.1 and Eq. (1) of reference 1, it follows that
h, x1 xx' (n-1) aThi = - - -+x 2nT [_
where n represents index of refraction for air; T, absolute temperature;z, height coordinate; x, horizontal distance between instrument and target;and x', apparent distance to point of convergence of tangent lines (instru-mental reading). Also, Figure 11.1 shows that
h ' - h 1 = (Z-L) - Z (3)
x
where L represexts the vertical separation at the target lines and Z thevertical separation of the lenses. Substitution of Eqs. (1) and (2) in Eq.(3) gives
(;Z) Z 4)1 x(n= 1) - (4
For L = Z, Eq. (4) reduces to Eq. (5) of reference 1. Nine targets, eachconsisting of two (or more) horizontal black lines on white backgroundswere mounted at varying distances from the instrument. The black linesare indicated as target lines in Figure 11.1. Flashlight bulbs were in-stalled at a vertical separation of 100 cm for night observations. Heightsof the lower black line, equal to height of the lower lens, were chosen as
1 2

indicated in the accompanying data. In order to minimize effects of in-
homogeneities in terrain, targets were placed as close as was feasible
to a radial line running outward from the instrument. For the first 50yards the land was extremely flat, the main obstructions to vision being
small tufts of grass, On July 11, the grass was cut to lawn height alongthe light path out to about 100 yards permitting observations at a mean
height of about 6 cm above the soil. Between 50 and 300 yards the ]. nd
was flat except for a few areas of small scale roughness. Between 300and 500 yards a ridge in the terrain may have influenced the 500 yard(50 cm) readings. However, the portion of the light path near the target
is less important than the portion near the lenses, so that the effect of
inhomogeneous terrain probably was small compared with the effect ofvariations in time.11.2 Observations
The differences in lapse rates at the heights of the upper and lower
4! lenses computed from Eq. (1) are tabulated in rables 11.1, 11.2, and
11.3. Five of the nine profiles are shown in Figure 11.2. On July 10 at
1715 CST, prior to grass cutting, the anomaly was unmistakable at about
16 cm. On July 11 and 12, after the grass was cut, the anomaly was
present at a height of about 12 cm; but the height of the anomaly above
the effective radiating surface was comparable to the earlier observa-
tions.
In order to develop the temperature profile from the differences in
lapse rate, the lapse rate at one height must be lkown. Che lapse rate
at 150 cm was approximated by extrapolating the curves of the type
shown in Figure 11.2 linearly to 150 cm and assuming that this value
represents the lapse rate at this height. Although this assumption may
be grossly in error, the lapse rate is in any case small enough in magni-
tude at this height that subsequent calculations are not significantly
affected. Numcrical integration then gives the temperature profiles shown
in Figure 11.3. The anomaly is evident on all but the inversion profile,
and in ithis case the data reveal a slight anomaly at about 25 cm height.
130

A time series of observations at 12 cm (50 yard range) was mac n
25 July, 26 July, and 2 August. On 2 At!gust four observations were takenduring each 5 minutes for 25 minutes out of each hour between 1155 and 1620CST. These data are tabulated and are shown in Figure 11.4. They showthat the variations encountered in 25 minutes are as large as one-fourth to
one-half of the difference on lapse rate, itself. It must be concluded thatthe profiles shown in Figures 11.2 and 11.3 are subject to error from time
variation in lapse rate. However, the reality of the anomaly is not in doubtbecause the anomaly appeared consistently and because the anomaly inlapse rate exceeds the variation in time by roughly an order of magnitude.
REFERENCE
1. Fleagle, R. G. "The temperature distribution near a cold surface."J. Meteor. 11, 160-165, 1956.
131

Table 11.1 Values of A(b T/8z) Found by Optical Method*
Lower Lens Distance A(0T/0z)Height ... . .. __
(en) (yd) ("C/cm)
1715 1110 1845 2155 1130 1550 213510,tily 11 July 11 July 11 July 12 July 12July 12 July
100 500 1.00050 500 -.008 -. 02'750 300 .015 .021to.024 t.005 -. 006 .00 f.011 -. 1103U 200 .025 .040 to.049 .011 .00 1.050 .017 -. 600 to +.00420 125 .041 .0591o.009 .024 .00 .074to.090 .029 +.00718 75 0l017 50 .07015 75 .073 I(j.02 .042 -. 025 .110 .040 +.01814 30 .013'12 50 .120tu,159 .050 -. 048 .170 .045 -. '8012 IM .40210 30 .121 .00 -.060 .105 .016 .008 25 .021 -.0110 .309 .090 -1.206 20 1.29 .09G -' .438 24-.48to -2.1
I
13
...................~-.___________ I

Table 11.2 Vales of &(8T/Oz) Found by Optical Method*
Lower LensDate Time Height Dstmce A(BT/oz)
(CST) (cm) (Yd) (°C/cm)
21 July 1300 6 20 +.2801309 12 50 .1001425 12 50 .255
23 July 0800 12 50 .0730803 0 20 .2610905 8 25 .140080H 10 30 '0980810 12 50 .1100813 15 75 .0640815 20 125 ,0500819 30 200 .0340822 50 300 .0200905 8 25 .200
0908 10 30 .1800913 12 50 .1270917 15 75 .0980921 20 125 .0640025 30 200 .0470055 12 50 .1451007 12 50 .1381015 12 50 ,1741200 12 50 .1501210 12 50 .188
1355..1400 12 50 .158,.171,.171,.176,.2001510 12 s0 .160,.180,,1351555 12 50 .130,.138,.128
so55 .105,097,1031755 12 50 .063,.065,.058
31 July I13iA 6 20 .200
133

NJ0CI 9 t' 0) to 7 1 t-99- 09.n .q9"),,) In .i~090
If)9 91 U>inC M ,I 1nm-,I r 9 (Ti 111
MC)N1t nCS i; i l ;c 4I;r l(9c9-i t909-Jimt c.. C9r; .6C90I-
C.) 99-t9. ,,, m. 9.9 (0 M)~O
t,)UM2-( II gf 990)D,9V.9N99')12(,w-JC.N0 NO O OO Q p ~-"-p-
900
v N W 09CC9- p 0I7.lI n5 n1 n 'InI-I ---In~n0 (5 19 ~ In ( c . Vd9 In Z n., 9 U,
C'41 20 '0' 2 0'~. ~~ T -'~'~ -09~~C- 995905NO NN 9
'B Lrl~ h9.90 '~ ~ O.o c-~9a
9999In'9 -n~94
99r
C4 049~4 10 I l
t -;% ri 0 rCI -f ) rgC ; mmb
9999 0n - dn'~ 911. __ ! oU
to, C. X99999Wm n
I. . . . . .(5 .~9 . V .'6 .( 9 .4 .. ... . . ir) C4 N 0 In toM' I w m(A0 t I C1 0 000 00 -''.5
1818,494,9. .081 49 m 9990~~~~4 C, C!_!. !- Rt
. s ~ n t -( 5 ( 9 1 5 ( 5 9 9 9 ( * f 9 ( 5 f l 9 5 9 9 I ( 5 9 ( 5 ( 5 9 5 9 ( 9 9 9 ~ ' U ) ) ~ I n n ~ t 9 9 0 5 9 5 9 5 9 .9 I n 9 9I( 5 -~ 9l0 (5 9(5.5 9 (5U.-.(...,,,.9(5-9 99 999 ~9*(59(. f4o.9 w 599.99t5(99 9
~~~~~~~~C . . .Urr09999 9 0. .'N 0 0. 9 9. ,9 9.. o 9 o o9' 0 0 9;0n0 . .. .9( O O I O- .9I.. .'NN 0 9 0 0. '9
+3

IVI
I zI
i N - I c
IIIL I
x jcc
Uw
w ta
135

IXI
I C
0LL C30 0in-- en AS
136

02
.0
W &4w Cz
I. c'1
& R
CYw
1374Lf

cuC
I),-
0
8 W- 4-I
w ~C
138-
13810r

CHAPTER 12
RAWINSONDE DATA
P. A. GiorgioGeophysics Research Directorate
Air Force Cambridge Research Center
The table in this chapter contains rawinsonde measurementsmade by the 6th Weather Squadron (Mobile), Tinker AFB, Oklahoma.A rawinsondc ascent was made at the test site for all gas releases
except those numbered 35s and 48s. For each ascent, GMD-1A equip-ment was used and tabular data computed according to the instruc-
tions contained in the USWB Circular P and Air Weather ServiceAddenda. The computations were reviewed by an independent group
using the same techniques.
Values of pressure, height, temperature and relative humidity
are given for the significant and mandatory levels. The pressureis given in whole millibars, the height in meters above the ground
(elevation of site above mean sea level is 603 meters), the tempera-ture in tenths of degrees centigrade and the relative humidity in
percent.
Values of tho wind are given for standard heights. The heightis given in meters above the ground, the direction in degrees(360 degree compass) to the nearest ten degrees, and the speed
to the nearest tenth of a meter per second.
11$9

Table 12.1
Gas Release No, I Gan luleaso No. 2
3 July 1950 1050C 3 July 1050 1450C
Z T R. If p Z T R- A(inb) (W) (CC) (%) (rob) (m) (C)
045 0 22.5 65 945 0 24.0 66934 20.0 67 933 21.8 01900 420 17. 6 78 900 423 10.0 '12860 14 . 91 850 012 14.7 86850 9(1 13 9 91 844 14.3 88800 141C, 11.1l 93 Bo(U 1423 11.5 93744 7.9 94 771 94 96
730 5.5 81 720 7.5 100706 3.8 45 700 2530 5.4 100700 2522 4.7 52 679 3.9 1f0694 5.5 58 655 3.5 100638 1.6 61 620 - 1.6 2001600 3767 1.1 70 G09 - 1.5 07
604 0.0 89600 3778 - 0.1 82
Wids Winds
Z ddd ft Z ddd If(m) (deg) (h','5'c) m) (deg) (rn/sec)
SFC 02 120 1. S.C 02 140 1.6350 1,10 27 370 120 2.0630 160 2, 2 690 140 2.6920 180 3.01 960 170 3.1
1200 19go 3.9 1250 160 2.6
1470] 200 4 1 1530 100 2.11770 19U 3.5 1APf1 170 2.3205) 220 2.6 2120 190 2.22320 250 3.2 2410 230 2.72630 250 3.4 2710 250 3.92920 230 3 2 3030 270 8.83100 210 3.0 3320 260 10.63470 290 2.9 3620 250 9.03750 190 2.1 3930 270 10.3402U 100 3.2
140

Table 12.1 (Continued)
Gas Retenasu No. 3 Gas Release No. 4
5 July 1056 2150C 6 July 1950 O050C
P Z T RIf. P z T R, If.(mb) (m) CC) (%) (inb) (m) (c) (CO)
948 19 8 9.17 19.1 94040 24.8 01 i,0 25.8 74900 454 2 1.9 ,2 90 446 23.4 61882 20,5 0 :80 21.6 52850 948 18. , 4 f .l1 19.0 63
8^0 17. 5 0 850 941 19.0 63805 I,15 511 BOO 1459 15.6 56
800 1464 14.A 51 731 10.6 45762 11.9 ,15 700 25711 8.2 44725 9. 0 69 fl1 4.1 42700 2578 6 i 0 82 0. .j 57695 I, G,; l1 0.9 35672 1 0 (;. I.0 0 313 1 - 0. 1 35636 0. U 54600 3823 - 3.1 55
Winds Wind": .
z d11d f Z ddd if(I) (dvg) (-, "aa) (M) (deg) (II/H ue)
SFC 02 140 1 81. 02 100 2250 140 ' 3H0 1O0 5 4
160 1:0 1810 4.38110 1PO 1.9 9 10 170 3.8
10801 140 1. i 1170 160 3.21380 130 2 2 Nat Datha1630 1N 0 6 21t)90 290 9.00A0 270 0 , 32M0 290 8.1
2220 3100 4 5 3601 310 9.52460 210 J 0 3850 300 10.82710 1() 5 22980 291 5.03230 300 5.23490 3(O 6.0373o 280 '2
141

Table 12.1 (Continued)
Gas Release No. 5 Gas Release No. 6
a July 1956 1350C 6 July 1956 1650C
p z TH ll, P Z T R.H.
(nib) (m) (IC) (%) (mb) (m) (6C) (%)
946 0 31.1 34 944 0 31.5 34032 27.5 38 900 425 20.8 42900 440 24.1 43 866 23.1 50885 22.0 44 850 926856 22.0 33 822 20.8 39850 938 21.5 34 800 1449 20.2 45800 1462 17.8 47 734 13.1 38720 11.5 7 700 2579 10.0 42700 2501 9.4 71 660 6.0 5O660 4.9 76 600 38,13 2.5 34632 2.8 47600 3849 0.0 40
Wi(In Winds
z ddd if Z ddd ff
(m) (deg) ((/sMc) (m) (deg) (m/aec)
SFC 02 160 .1 SFC 02 170 5280 170 7.4 300 180 11.8550 170 6.8 700 10 13.4850 190 6.2 Signa1 1 iur
1130 200 6.2 No Data1,170 210 5. 111800 210 5.92100 220 7.72440 220 H 02750 230 10. 63050 240 0.113380 230 13.93700 230 16.0,jn!,3 220 15.6
142

Table 12,1 (Contimed)
Gas Release No. 7 Gas Roleaso No, 8
10 July 1956 1350C 10 1 July 1956 1(350C,
P z T It., P Z T L..(nib) (I) ("?() (nib) (mr) CrC) (0,)
9 6 0 3 l.0 to 9 ,45 0 3 ,6 3o93.1 26.8 2[{ 930 28.0 30
9204 24.5 35 900 271 25.9 35901 439 24.1 37 11 i01 20,U 42850 935 1 . 49 1:7 19.4 45800 1,133 .i. 59 8.21 8.6 52732 7.,A 7i 800 1 5 1G.7 55702 55 1 C5 1.0 4.!700 2561 5 , I 700 2571 7.3 65
00 41. 1 23 171 4.5 596515 , I fi7 655 305 32633 3, ti fi' 644 4.5 21
200 381's i.0 lilt Wu 38 24 1.1 fil3
V.. (Idd f f Z ddd ff'
i } ~~(II) Wv,'t (Im ".4,,c)( ) l ) ( , ,')
SFC 02 190 1, 1 i I c 02 1.90 7. 1310 210 {, I 4I1.IU 330 1.76170 11 ! iu 3|] 330 5.8 4
J05 1011) 1 7 v1'o 20 7.2I1,': 220 .{ .{i ) 22n1 r,'I
17Mll 260:. 17 IO 23o 0 . 8
2,|16 :1 0 1 5 2.i00 2i 11 9. ,12BOO 310 ,1:!660~f 1l I1 7 If
31 JOl 31 o9 5 1 !fl 33o U, 1:1450 3 1), i 3200 330 8 ,I3 7 "q ::00 3 : ,1160 320 7.64120 :10, I;) 1 31720 320 7. 1
4000 33o 7.4
_ __4__3
143

Table 12.1 (Continued)
1a lele'ase No. 9 Gas fRleiso No. 10
11 July 1156 0150C 11 July 1956 11502
1) Z Tit. 11. 1)Z T 11,1IL '-
( h) 010 ("') (01i ) 1
941 27. 2 2)t 0 W 1.8 44930 1) 1, 1, 5 2E ,5 I 47900 90 22, 2 52 1)0 394 24.4 5289 0 21. ..1 14 i;50 892 19.9 61
1374 V3.1 57 :16 19.4 64850 118. 1 122803 2(1: S H06 I 580 ~ . 0
' 117f; 16.5 I 43
716 ( 1 12l I 5c,700 25.11 :0.9 700 25 45 0.7 52"M -) .1 , i I (A M1 11 . 1 [ 4 6
w)O12 (1 12 2{ GOO) o.2 65
2d0 IWIf z ddd 6.( ) (d(",),,I) (III 's'} (bn) (deg) (m/flec) I
s2. I I I S 1 12 220 3.0150 211 II 1) Il280 2310 6.11 )31 / 1i 1051 220 . 99 if 231) " ' 900 220 ,.120 '10 ,1220 210 70i ,.).{ : I,)}I, I ;(Mt 210{) 7.8
]272(1J 2:'o "/ 1. I:1(1 220 0.52 : ) 23, /7 2300 2410 6.72,1 1 ',8{ ;2 ,6:) 7 If 2S-) 7.5
27 0"(( , . .0012 19.53000 7Th I 3 3310 270 11.232,10 201 1 5 3110 280 11.23.10 2I o 4071) 290 13.237(1-(0 2[) I 19 2,2 )1) ,!!2
144

'rable 12,1 (Continued)
Gas Release No. 11 Gas Releaseo No. 1214 July 1050 0750C 14 Jly 1956 0950c
z T IHt. P Z T R.(nib) (m) ( %) (mb) () Cc) (%)
944 0 24.5 00 044 0 30.0 48033 22.4 05 930 26.0 56002 22.8 08 900 421 22.9 67.900 417 22.P O 890 I 22.5 08850 910 21.7 48 800 23. 15 048 10 20.8 34 850 920 23,1 35800 1,142 10.4 36 843 23.1 30
70 12.2 42 800 144B 19.0 30700 2570 0.4 52 752 15.8 32
064 5.3 3 700 2577 10.3 49624 3.4 '(4 ,544 4.4 66
1oo 3820 1.2 0 .;24 3.2 42101 14 60
20O 3830 I 54
Winds Winds
z ddd If z ddd if(II) (dog) (O/hwc) Wm (deg) (m/see)
SFC 02 180 4.6 SFC 02 190 3.6300 100 1I. 8 300 200 11.0
630 210 14.7 380 200 12.8940 210 12.0 1030 200 12.5121 710 10 0( 1400 200 10.3
1350 210 6.8 1780 210 .51900 2 10 4.7 2130 210 5.02250 210 4. r 2470 220 4.42600 230 3.5 2850 250 4.42080 9.10 3.5 3270 280 5.23350 28u 6.5 3530 310 9.43730 290 8.5 3850 200 9.84080 300 1 45
145

Table 12.1 (Contlziuod)
Gas Release No. 13 Gas Release No. 1422 July 1956 1950C 22 July 1056 2150C
PTl. P z T R. I.(nob) (V) (°C) (O) (mb) (W) (C)
940 0 21.9 09 950 0 16.4 89940 22.8 50 940 22.2 6400 459 10.0 5 900 407 19.8 58
850 950 , 5.3 898 10.7 57hOU 1462 11.8 82 060 057 15.7 70747 7.1 02 802 11.5 86700 2566 4.4 80 S(0 1468 11.4 85615 3.4 70 700 2509 4 0645 - 0.4 80 6 , 0,2634 1.0 dO 631 0.5 49622 - 0.1 34 6 p0 0.0 21601 - 0.6 22 600 3807 - 0.8 nb600 3807 - 0.6 mb
'Witini Wirds
Z dI Z ddd ft(m) (dn)(msvc) (m) (dleg) (m/Bcc)
SFC 02 170 1.0 S1"' 02 100 1.0350 180 4.6 200 170 4.8700 180 4 fi 610 180 4.5
1020 180 5.0 00) 10 3,01340 180 4 0 1211) 230 3.21660 180 3.0 150O 260 2.919060 190 Il 1800 270 1.32270 260 1.1 2100 300 2.12670 310 2,9 2390 310 5.02860 320 4.7 P60 310 7.53200 320 6.0 2030 310 8.23520 340 7 0 3210 310 7.83840 340 9.3 3500 310 7.0
3800 330 8.3

Table 12.1 (Continued)
Gas Release No. 15 Gas Release No. 1023 July 1950 0750C 23 July 1956 0950C
p Z T R. If P z T J.U.
(mb) m) (C) ( (mb) (M) (°C) (%)
949 21.0 64 9,18 0 26.5 48940 10.4 66 935 23,3 54024 21.1 17 900 454 20.,3 60900 458 20.8 5D ar5 945 10.7 60897 20.7 581 141 15.9 70853 17.0 66 810 14.4 33850 D48 16.8 65 BO0O 14158 13,6 34800 14882 13.0 48 769i 10.9 38
728 7.2 19 7211 7.1 5970u 2509 0.13 1, 715 0.7 50698 I 7 nil 7011 6.4 27044 4.0 700 2564 6.4 26600 3820 0.0 ..l) 0a1 6.4 22
6511 3.9 46600 "11112 0.5 37
1;-- _______ WiI I
'IZ ddd it z dldd if
(n) (deg) (misr,c) (i) (deg) (r/sue)
SFC 02 230 2 I 01" 1)2 180 2.1300 230 ,O 4 3i1u 200 2.6000 240 P. 610 190 2.6010 23(0 I 1 950 190 2.0
1210 230 1. 0 1300 180 1.11500 260 0 9 1650 360 4.21800 330 2,0 1981) 110 7.32090 300 4,7 221m 010 10.62380 360 'TO1 2600 010 12.52680 350 0.5 2010 010 13.52980 3 611 10.7 3230 010 13.23290 340 10.9 3570 010 12.43580 360 10.0 3880 350 10.23850 350 8.9
147

- -. ~._ - - ---.... ,_ _ - _ _ _ _ _ _
Table 12.1 (Continued)
Gnas Rehlaso No. 17 Gas R'elease No. 18
23 July 1956 1950C 23 July 1950 2150C
P z T R.Ii. P Z T IJLH.(1,b) (n) (mb)(
cb(in) "M (M) Vc)
943 0 28.0 39 943 0 23.6 54928 29,0 32 920] 27.6 35
g00 414 27.0 35 900 411 26.0 33850 916 23,1 40 898 25.9 33804 19,5 43 850 oil 23.1 30
800 1441 1 45 841 22.8 30700 2571 208 64 800 1435 18.9 47600 3820 -0.7 85 700 2564 9.0 04084 2755 7.2 67
wincim Winds
z ddd ffz ddd ff(m) (dog) (M/e) ( deg) (m/ace)
SFC 02 170 2.1 SFC 02 180 2. 1310 190 9.8 300 200 13, 1820 200 1.5 650 120 15.2930 220 12.5 1000 240 13.2
1280 230 13.[ S 310 200 13.61620 250 12.0 1070 280 15.02000 270 10.4 2000 290 14,52330 31I0 10.8 2310 300 14.52070 320 13.03010 320 15.83350 320 16.83700 320 18.1I4060 230 19.9
148

Table 12.1 (Continued)
Gas Release No. 19 Gas felcuaa No, 2025 July 1956 1050C 25 July 1956 1250C
p z T i.H. P If.(rnb) Wi) (CC) (11) (rob) (W) CC) ()
945 0 28,8 38 942 0 31.0 30932 25.8 41 917 360 33900 420 22.8 47 900 400 25.1 35878 20.5 51 670 22.0 38850 923 20.5 26 850 004 22,3 27 1823 20.8 21 8, 38 22.5 18800 1447 19.1 24 804 21.2 2371 11.9 38 800 1430 20.0 24700 2577 11.1 30 700 2565 11.5 316678 9.5 28 6817 10.6 24600 3844 2.A 30 610 2.6 31
____--- - - - 600 3827 1,'S 34
W.1 -SWinds Winds
z ddd If Z ddd IfI (mn) (deg) (n/Ic i) (deg) (m/800c
SFC 02 1 cm 3.0 FC 02 160 6.7320 170 6.3 300 180 12.8620 180 7. 700 180 11.2900 180 8 a 0200 10 9.6
1130 100 9.0 1370 200 6.81380 190 0.6 1700 240 5.51020 210 2. 3 2050 250 5.11820 220 2.0 2420 260 4.82000 250 1.4 2770 2170 5.72280 300 2.0 3140 270 7.02480 310 2.3 3380 270 7.42700 300 2.4 3630 270 7.82880 300 30 3900 200 10.03000 290 4.53260 280 5.03430 250 4.0
149

Table 12.1 (Continued)
Gas Release No. 21 Gas Roleaseo No. 22
25 July 1956 2150C 25 July 1956 2350C
p Z T I.H. p Z T RjL,(nib) (m) (C) (%) (nib) (i) (WC) (%)
938 0 20.0 41 037 0 26,5 45911 7,71 39 910 215.5 45900 367 28.3 34 000 355 26.3 43889 29.6 30 U9w 20.8 42801 28 4 27 850 850 25.2 36b50 875 20.5 27 800 1390 23.4 27844 25.5 27 749 19.0 29806 24.8 25 700 2532 13.4 38800 1408 24,2 20 636 5.7 50728 1II R 35 600 3800 2.0 55700 2557 14.0 41678 11.6 44632 4,7 59620 3563 3.0 70
Win(i Winds
Z ddd if Z ddd If
(W) (dog) (m/acc) (W) (deg) (m/eec)
SFC 02 180 4.1 SFC 02 170 4.6160 200 8.0 300 190 20.0370 220 11.3 660 200 25.0540 220 12.3 030 210 24.6780 230 12.3 1220 220 25.3
1030 250 14.4 1500 240 22.01300 200 17.0 1800 260 16.01630 260 14.0 2080 260 16.02020 260 15.0 2360 250 18.82380 265 20.8 2630 250 21.02600 200 17.5 2030 250 19.52950 270 9.0 3180 250 17.03150 270 12.0 3450 250 17.03340 260 195 3750 250 p.03550 260 10.5 4080 270 11.4
150

Table 12.1 (Continued)
Gas Rolease No. 23 Gas Release No. 24
29 Juily 1956 2050( 20 July 1956 2250C
p Z T 1I. P Z I T 'I..(nib) (m) (C) (') (uib) (m) CC) (%)
944 0 23.9 70 945 0 22.2 8000 417 21.7 78 30 22.4 80
860 19,4 84 900 124 10.9 85H50 911 19.5 812 897/ 19.7 85838 19A 80 1154 20.9 75804 17.5 72 850 919 20.9 75
800 1432 17.6 70 815 19.5 65776 18.; 47 100 1,143 18.5 69700 2507 11.9 45 774 16.3 72096 11.4 ,44 750 15,9 (04685 1.1 5,4 700 2576 / 11.1 66.614 3.9 63 (10 9.6 67600 3837 2.2 65 650 7.0 57
600 3842 1.0 72
Windsi Winds
Z (dd if Z ddd f(m) (deg) (m/se!) (m) (deg) 0ms0e)
SFC 02 120 4 6 SIU 02 130 3.8
2900 0 13,1 290 150 13.3Goo I20 15. 0 600 160 14.4'890 U90 11I, fi 30 [90 13.7
1190 07?0 I1 r)f 127O 210 1,4.21480 050 11, 1 1620 2:10 12.4,!730 020 7.8 1920 2!i1) 10.22020 030 5.1) 2270 260 8.12?,90 030 1. 1 =G0o 260 6. 12520 020 3.7 2910 20 5.32820 010 5.3 :3230 200 5.33100 010 6.4 3590 270 5.73360 300 0,6f 31160 270 6. 0363o 3 60 6 5
3920 360 6.0
151

Table 12,1 (Continued)
Uas Release No. 25 Gas Release No. 20
1 Aug 1U66 1257C 2 Aug 1956 ISOC
p1 Z T f.If. P Z T RH.
(nb() (C) ('i,) (nib) (M) (0 C) (%)
946 0 24.7 G0 042 0 30.3 58034 22.4 70 922 25.4 64900 436 10.7 78 goo0 '04 23.6 70
078 1100 84 883 22.1 73850 927 16.6 64 AS5 901 20.7 70800 1443 UI .9 84 800 1424 18,4 64
700 2550 1P.2 83 790 18.0 62694 7. 4 83 705 10 7636 3.8 83 700 2555 10.1 79
020 34 79 148 5.9 85600 381 1.8 71 Goo 3H22 2.4 83
1t ,v iit1 ,inds
iZ ddid if' Z ddd ff
2(m) (d2g) /Av0 (M) (deg) (m /see)
Sf'0 230 12 11 AC 02 170 36.00350 190 4.5 230 180 9.7
]680 200 [;v I 500 190 11.2900 200 G;. 5 770 200 11.0
1 200 210 5.6 1030 200 11.51,450 210 5.9 1 300 210 12.5178 0 220 6. 9j 1500 ,1110 13.82120 220 7 ? 1010 210 13.52420 220 7.1 2210 210 13.52720 220 1.0 2520 210 14.73080 '230 11. *9 2820 23(1 16.03460 220 9.3 3130 230 17.031370 220 a,, 1420 210 17,0
3090 220 5.5 3730 230 18.04030 230 0.0
15

Table 12.1 (Continued)
Gas Releane No. 27 Gas Roleaso No. 282 Aug 1950 1350C 3 Aug 1950 0035C
P z T R11.. P z T - R. t(nib) (m) (°C) () (nob) m) (0C) ()
941 0 32.2 48 040 0 2.9 ea034 29.6 52 025 28,f) 59900 398 26.t6 5 00 385 20.6 55850 898 22.0 00 802 20. 1 54813 10.5 65 878 20.6 51800 14Z1 10.6 56 850 889 24.2 51700 2551 10 5 or) 810 21.0 51868 7.7 73 800 1416 20.0 54600 3817 2.6 72 721 13.1 74
700 2551 11.1 78Wo3 4.1I 90
U 00 3818 1.9 I oWifild Winds
2 ddd If Z ddd If(M) (d(:g) I (m/'5u) (m) (deg) (rn/see)
SFC I 5.1 S , 02 170 3.1IGO 100 9.2 3)0 200 13.2580 180 7.0 590 210 18.4880 1o0 6,5 830 210 22.2
1200 190 2.0 1090 210 21.31600 200 13, 9 1320 210 20.51800 210 14.0 1510 210 20.12100 210 15.6 1870 220 21.52420 210 17.0 M00 220 24.02720 210 18.5 2490 220 20.03020 220 1. 1t 2770 210 18.53320 97., 3020 210 18.5
Tth, 3300 210 18.719.3 3550 210 18.7
3820 210 17,0
I1
1 153

P R. P T R. 11.(in) (%) (rob) m) CC) (%)
941 0 25.5 61 941 0 34.6 30928 26.11 56 932 31.0 42900 393 25.4 54 900 401 28.7 49893 2,. 1 53 350 906 23.0 5G870 25.1 48 846 23.5 57850 895 23.0 50 800 1432 10.1 63800 1422 20.4 54 757 14.8 70787 19.4 55 732 14.3 60700 2557 10.9 72 700 2564 11.5 62Goa 7.5 80 630 4.8 68601 1.9 79 607 3.7 66o00 3824 1.8 80 600 3H34 3,0 66
Winds Winds
z ddd ff z ddd If(II) (dog) (W/c) (i) (deg) (m/sec)
SFC 02 180 4.3 S 02 190 5.1300 200 16,0 290 190 9.5620 210 20 50 100 11.7950 210 23 0 810 190 11.8
1270 210 23.8 1180 100 8.41000 220 21.0 1450 200 8.61900 220 1 9,0 18)0 200 13.42210 220 19.0 2150 210 18.525.10 220 18.0 2480 210 18.52850 220 15.5 2780 210 18.53150 210 16.2 3010 210 19.03470 210 17.0 9!0"1 210 21.0
3780 200 19.0 3500 220 20.0,1100 200 19.0 3810 220 20.5
41(00 220 20.8
154

Table 12.1 (Continued)
Gas Releane No. 31 Gas Release No. 323 Aug 1956 1450C 0 Aug 1956 1950C
P z T R.H. P z T I R.H.(rob) (M) 1 ( C) ( .)(rb) '(M) (IC) M
941 0 34.0 37 945 0 24.3 30932 31.5 40 933 27.0 35900 400 28.8 40 900 430 24.7 38850 906 24.2 50 850 929 21.0 43800 1..33 19.7 66 800 1450 17.3 48738. 13.6 80 783 16.0 49700 2565 10.5 76 770 15.0 41617 3.5 68 758 14.4 51600 3833 2.7 72 700 2570 0.2 0
647 4,1 67600 3834 0.3 53
Winds Winds
z ddd if Z ddd It(M) (dog) (m/sec) (M) (deg) (m/aec)
SFC 02 200 5.1 SFC 02 130 2.1320 200 9,7 300 170 11,0690 210 0.0 630 160 14.5
1010 210 10.1 980 160 17.01360 210 12.0 1300 190 IG.01690 210 12 0 1680 140 16.22000 210 11,8 2030 130 16.22300 210 12.9 2400 130 13,12620 220 13.6 2720 140 0.82930 220 15.9 3080 160 8.83390 220 15,5 3470 220 9.63620 220 13.5 3840 260 12.23940 230 15.0
155b

Table 12.1 (Continued)
Gas Belease No. 33 Gas Release No. 34
7 Aug 1950 1258C 7 Aug 19586 1455C
P z T RH, p Z T R.HIL(mb) (in) (C) (% (mb) (M) (C) ()
944 0 28.8 48 944 0 30.5 38900 422 24.2 49 928 28.0 46894 23.6 49 900 422 23.6 53864 23.3 38 868 20.7 58850 921 22.2 40 850 918 20,3 56800 1444 18.0 48 800 1440 18.7 42700 2570 9.0 66 708 18.8 41677 6.9 70 700 2569 10.3 48640 5.5 51 620 3.3 55600 3832 1.8 43 600 3833 1.0 57
Winds Winds
z cidd If z ddd ff() (deg) (m/see) (M) (deg) (m/sec)
SFC 02 170 4.6 SFC 02 170 4,6300 170 13.3 340 150 13.0600 170 215.2 620 I0 15.4960 170 !4.5 900 170 15.51320 180 14.5 1290 180 13,8
1700 190 14.0 1630 10 1192080 180 8.4 130 240 11.02450 150 5.3 2210 210 12.1
28M0 150 7.2 2600 220 14.13170 170 8.0 2800 230 13.73470 200 7.8 3060 240 12.03800 230 7.3 3330 240 9,6
3620 240 6.8390 240 6.1
156

Table 12.1 (Continued)
Gaa Release No. 35 Cal Release No. 30I I Aur 1956 2122C 11 Aug 1956 2328C
p z T .11. p 1 Z T R. H.(nib) (m) ("C) %) (mb) (i) (°C) (%)
045 0 20.0 62 943 0 18.8 85938 24.8 50 030 23.5 79900 420 000 406 21.8 74850 920 860 19.5 66800 15 0 67 850 000 19.0 G8800 1430 800 14111 15.7 74700 2549 5.4 00 738 11, 3 83
082 4.0 77 700 2537 7.A 70656 4.0 24 693 68 68G00 3799 1.3 lib 677 6.3 24
650 G.0 lib618 3.4 24Goo 3794 1.3 30
Millis Windsi
z ddd fl z didd f
(m) (deg) (im/ic) (M) (deg) (__!Be_)
SFC 02 170 1.6 SFC 02 10 1.6300 160 I 61 350 180 11.3630 180 7.0 00 100 10.0940 200 7.0 hh0 200 8.01240 220 8.6 1170 220 7.01580 240 9.8 1420 240 9.01950 250 10,1 1700 250 13.02250 200 11.9 2000 260 15.72510 260 11..5 2300 260 15,02700 260 11.4 260 200 13.33000 270 11.2 2930 270 12.03260 280 13.1 3270 280 12.03480 290 10.2 3580 360 13.83710 300 17.8 31100 300 10,2
157

Table 12.1 (Contlnued)
Gas Roleavu No, -37 Gas Release No. 38
12 Atq 1956 0250( 12 Aug 1956 0450C
P z T HI. p z T R.II.(mb) (M) (1C) (%) (rob) (W) (°C) (%)
912 0 20.0 75 942 0 20,0 81912 22.8 77 905 22,5 55900 308 22.2 71 900 305 22.5 51883 21.3 61 Boo 22.5 45850 804 10.3 61 1152 20.5 45123 17.0 62 850 81 20.3 45
800 1413 16.0 60 S0on 1411] 16,9 59726 11.0 81 735 12A 78702 9.3 69 712 10.5 54700 2538 9 0 64 700 2534 9.1 50677 7.6 23 673 0.0 66622 2.0 30 656 5.0 34G00 37U4 - 0.1 41 633 3.5 24
G00 3787 0.2 33
V/,mlsWinds
Z ddd If z ddd ff(W) (dog) (Wn/M,,') (i) (dog) (m/scc)
SYC 02 10 3.1 SF(V 02 180 3.6300 190 14.9 330 180 14.0630 100 15, 8 c6io 1.0 18.3050 200 12.1 1020 200 19.7
1240 220} 13.A 1370 210 17.51520 230 15.4 1670 230 12.51830 250 14.8 1950 240 10.02140 270 12.5 2300 250 8.82410 270 11.2 2600 260 8.52700 200 10.0 2}00 .240 10.0M00 260 0.0 3220 240 g.03300 2o0 7.6 3480 240 10:03640 260 7.4 3760 230 13.03960 260 0.8 4000 230 14.6
158

Table 12,1 (Continued)
Gas Release No. 39 Gas lelease No. 4013 Aug 10,6 2220C 14 Aug 195B 0020C
p z If R. H. p Z T R. Ii.(rnb) (in) VC) () (rnb) (W) VC) (%)
948 0 20.5 41 948 0 20.6 62937 25.4 38 040 25.5 49030 27.4 35 032 27 6 40g00 157 25.i 3u 900 457 25. ! 42880 24.6 28 850 055 21.0 40850 955 21.9 36 f05 17.0 49800 1477 17.0 48 800 1476 16.9 50701 14.5 56 763 ,5.0 56700 2599 B. 6 69 700 25981 8.4 49080 6.4 71 676 5.8 46637 2.5 26 628 0.1 53Goo 3849 ,-0.2 24 609 0.0 24
R00 3849 - 0.0 mb
Winds1
z ddd I f z ddd if(m) (deg) (n/wc) (Wn (deg) (rnBc)
SFC 02 160 2.6 SF( )2 200 2.0420 150 10.3 300 200 12.8850 170 9.0 600 210 14.2
1200 200 9.0 900 910 ' 13.81580 230 10.3 1230 210 12.32030 200 12.0 1570 230 10 22460 280 13.0 1870 270 9.5270 21)0 13 0 2100 M0o 9.331'1 u 300 14.0O 2470 310 11, ,13580 300 111.6 2760 320 14.04000 310 14.0 r.470 320 16.5
3400 320 16.53700 320 15.5399U 320 12.5
159

Table 12.1 (Continued)
Gas Release! No, 41 Cisu Rolease No. 42
14 Aug 1956 0250C 14 Au 1956 0450C
PZ T R, If. r z T1 P.H(nib) (11) (°10 M% (rob) Wra (CO)
947 0 20.0 n 047 0 277I.7 5
033 24.2 60 920 26.6 .1915 26.0 40 00 440 26.0 30900 446 25.3 40 869 24.9 30850 9146 22.8 36I 850 948 22.0 418,10 22.2 3G 841 22.0 46800 1470 18.9 52 800 1473 20.0 53793 18.2 55 792 19.5 54700 2597 9 3 59 '133 12,7 67096 8.9 59 -11 11.I 53600 3850 - 2.3 65 700 2603 10.0 52
674 7.1 51614 - 0.8 73c0 3858 - 2.0 69
Winds Winds
Z ddd If Z ddd If(nil (Wog) ("i'st) (In) (dog) (m/8ec)
SFC 02 18 ) 3 1 SC 02 210 4.6280 210 13.2 340 230 20.9530 22l 1,I.2 60 230 20.68.1 22(0 14.0 1020 240 16.3
1130 240 12.2 1330 210 17.11450 260 11.0 1680 260 16.51780 270 1()r 8 2000 270 14.02100 280 12.0 2330 270 12.42430 299 12.8 2630 270 11.02730 290 14.0 2940 280 12.0:1050 300 14.2 3270 200 12.03400 310 15.0 3590 290 14.036110 11) 1 5.0 3110 300 15.540(10 310 1. 5
160

Table 12.1 (Continued)
Gas Release No. 43 Gaa Release No. 44
15 Aug 1056 1ISOC 15 Aug 1956 1350C
p Z T RH. P Z T R.I1.(nb) (i) (C) () (rob) (W) (AC) (%)
945 a 34.5 24 943 0 36.8 19031 31 4 26 030 31.9 22000 436 27.6 30 000 418 29.1 25850 937 22.0 35 874 26.8 27846 22.4 30 80 922 24.5 30832 23.3 18 806 20.6 35800 1462 20.1 24 800 1448 20, 1 57702 17.2 49 746 16.5 52740 10.1 41 7111 13.3 54705 12.0 56 700 2585 11.9 43700 259 11,8 53 695 11.6 40685 10.7 47 658 8.5 37630 4.2 53 00 3853 1.2 64600 3863 0.9 69
zi WInds Winds
Iz c ddd if z/ ddd if
(m) (dog) (m/Bsee) (m) (deg) (m/sec)
SVc 02 160 1 .5 "F 02 150 4.1210 160 5.0 2110 150 6.0570 150 4.2 570 150 8.6750 140 5.0 880 160 9.2
1130 150 5.8 1210 170 8.31430 . 4.4 1550 200 7.71720 220 5.7 1020 2.10 8.42050 251 7.0 2300 2., 10.22390 2(60 8.7 2650 250 11.92700 260 9.8 3000 240 11.53000 260 1).7 3380 240 10.23300 260 11.2 3720 250 9.23600 20 11.2 4080 250 10.13910 210 11.2
161

Table 12.1 (Continued)
Gas ",,'vae No. 45 Gas Rtelease No. 4615 Aug 11156 160C( 9Ai 1956 .1835C~
(___b) (111) CC (nb (II)(T
400 M 5 12 3.5 2903,622 0113:1. 2 22
il!)392 .:uI. o 2A !:00 371)1 1. i N
8,2 7.1 i 3 1 50 81M: 9G.
1129 22.01 i 1!) 110 11(20i70f251 121 011 591 1277
602C7770212I 1)( 9 1G2
I "J 41 1;71 1 G.5
6001 3113- 2:.' 2 1) S U
401 1 ,1lI .
62 1 1(0 16.
980--- 1:100I'll :1

Table 12.1 (Continued)
Gas Release No, 47 Gas Release Nu. 4823 Aug 1956 1005C 21 Aug 1056 O8OC
P Z T Ri, P z T IL1. 1(nib) (M) (IC) %) (mb) (VC) (C) (%)
9550 19.0 5o 947 0 18.8 59045 16.5 40 930 15.8 5900 102 13.1 51 -1133 1 69850 079 9.1 G3 1)108 14.5 U',842 8.4 65 8150 915 12.3 48
800 1,177 4.0 60 1849 12.3 48754 0.9 56 1:24 10.5 51729 - 0.4 75 1112 10.9 22106 * .l; 43 HjO 1420 11.8 tub700 2550 I.I 39 792 12.3 fil,694 - 0.5 34 756 11.6 i666 - 3.1 24 716 8.li ib645 - 3.3 nb 700 2532 8.0 mb600 37(38 - 6.5 lO 686 7.7 mb
(1110 1.6 nib(iu() 37/87 0. 5 If 11
[ ~~~~~ ~' d:g ms)) (deg) (/ec
SFC 02 250 3,AI SC 02 80 5.7320} 230 .3. 7 330 210 0.0690 250 n 6810 230 10.8
OR5; 260 .81030 240 12.31420 010 2.7 1400 250 11.0800 350 2.11 1730 260 9,7
2150 320 3.9 2050 260 9.02530 320 61.5 230 290 1 1.22900 31,10 8).9 2"730 290 14.03270 3, 4to)5 3050 290 WO
2620 34 11 0 3400 290 16.53:0 340 11.4 3710 300 16.8
4030 300 16.0
_______......... ..... __________ _________ ___________
! '

Tablo 12.1 (Continvled)
Gas Iolease No. 49 Gas Release No. 5021 Aug 1050 1050C 21 Aug 1956 1350C
P -. T R.'H. P Z T H, I Ibub) (m) (C) M' (rb) (M) (CC) M
940 0 23.8 44 943 0 29.0 38012 17.1 44 337 25,7 40900 430 10.5 48 900 408 22.3 48874 14.9 54 896 21.9 40800 15.3 54 850 001 19.0 40850 914 14,8 50 828 17.4 35800 1424 11.2 65 800 1417 14.1 37796 11,0 66 793 13.3 37782 9.0 20 704 11.9 20767 11. m) 7,12 11.0 mb71,9 8.8 I lb 700 2533 8.13 mb715 0.8 ]t 60 3700 0.9 mb700 2533 8.6 m008 1,4 mb600 3788 0.5 ls
7Vi~rl Winds
'()K) -m/ev) (de (rn/aec)
SFC 02 10 57 SI1 02 200 5.1330 210 7.8 230 200 &,0700 230 10,5 480 220 80103 250 12.2 700 240 7.0140(] 260 13.8 950 250 0.7
1 730 2 0 13.3 1200 270 1 7.52120 270 13 2 1480 280 11.02480 280 13.2 1750 200 12.021100 290 14.5 2010 .100 13.,5
3130 290 15.3 2200 300 15.0L3480 200 16. 5 2590 100 14.8
3800 290 MS , 2870 200 13.53110 300 16.03320 300 1'7.5
S3620 300 18.5
3910 300 17.0
164

Tnble 12.1 (Continued)
Gas Release No. 51 Gas Release No 5221 Aug 1956 1520C 24 Autl 18511 1105C
P z TI R.l. P Z T R. If.(rob) (M) V°C) M% (rob) Wm V°C) ')
942 0 31.0 33 952 0 25.0 22932 26.7 3 032 20.7 29goo 403 23.9 41 900 485 18,2 33850 G99 19.4 50 850 971 14.1 39ale 10.4 57 B8 13.9 39800 1417 14.6 0)0 800 1482 13.3 .15770 1 1.6 60{ 793 13. 1 50)733 8.3 5 4 7,10 8.5 60O
722 8.3 22 713 8.9 25700 2530 7.0 ni) 700 2593 7.4 42695 7.5 1h 688 6. 5 30600 3784 0.8 fih 676 5.5 11
600 38,12 - 2.7 5,
Wllld Wi wil1
Z ddd if Z ddd ff
() (deg) (rn/31-) W_ (deg) (mivc)
SFC 02 240 4.6 S F ( 02 140 3.11 320 240 9.5 400 IL 6 1680 250 13.0 760 110 5.0
1010 250 13.5 100 0110 2.81710 270 10,4 ii:) :120 5.9
2050 28l0 9. 5 a190) 310 7.22400 290 1 I. fI ;?(100O 310 8.52780 300 12.0 1020 330 8.43010 300 1.1,2 ' ,( I 3u 8,1
3400 31 10 14.5 37;0 :330 9.2.1790 !1.1
4030 310 17 0
165

Table 12.1 (Continued)
Gas Releae No. 53 Gas Release No. 5424 Aug 1950 1950C 24 Aug 1956 2150C
P z T R.H. P Z T P .H.(mb) (m) VC) (%) (mb) (M) °C) (%)
948 0 18.0 44 949 0 20.0 51940 22.7 41 918 20.8 42850 941 17.2 42 900 450 19,8 35
825 15.1 45 850 950 17.3 43800 1455 14.4 42 800 1406 14.0 A 50774 13.8 38 772 13.6 32700 2572 8.0 41 700 2583 8.7 42686 7.0 42 000 3833 -2,0 67600 3822 - 1.4 63
MOBd Winds
ddd Z ddd | fi(m) (dog) (ni/aic) (m) (deg) (m/soc)
SFC 02 150 3.1Equipmo F.ilur, 380 100 12.5Nn Sndli ig 730 180 13.2
1080 190 9.21450 210 4.9i760 240 2.02100 270 3.02400 280 5.92800 300 7.33160 310 8.93520 320 10.23000 320 11.6
166

Table 12.1 (Continued)
Gas Release No, 55 Gas Release No. 5025 Aug 1950 0055C 25 Aug 1956 0250C
I
P Z T R.1I. P Z T R,.(nib) (") CC) (') (nib) (in ) V C))
048 0 17.0 60 948 0 15.0 IA904 20.0 43 900 444 20,0 47900 440 19.9 43 850 936 1.9.4 40862 19.0 40 815 18., 50RSO 938 1A 4 49 800 1457 1.7.2 51800 1456 15.0 52 761 13.3 56756 11.9 56 726 10.7 44? 10 9.2 41 700 207 8.2 50700 2576 8.2 50 600 3829 - 2.1 74694 7.3 54615 - 0.5 70coo 3825 - 2.1 70
w... ... .i- W inds
Z ddd If Z ddei if
W (dog) (II/sec) (W) (dog) (m/sec)
SFC 02 150 8.2 SFC 02 160 6.03130 160 14.3 20 170 11.15700 I1 1Z.0 500 0 14.6
1030 200 10.2 1040 200 12.01350 210 U. 2 1500 220 8,11680 220 1i 0 1900 230 7.51080 230 4.0 2370 240 8.62280 240 4.6 2700 240 8.52000 250 5.8 3100 250 7.02900 260 5.7 350 270 0.03230 270 7.0 3000 290 0.53000 200 7.73020 300 7.4
1
167

Table 12.1 (Continued)
Gas Release 1o. 57 Gas Release No, 5825 Aug 1956 1720C 25 Aug 1950 1920C
P z T R.H. P Z T R.H.
940 0 34.5 18 939 0 29.2 25900 390 30.5 22 932 31.5 25850 897 25.2 30 900 379 29.0 27800 1425 19.9 39 850 884 25,0 30784 18.0 42 800 1410 20.0 33738 15.0 23 762 17.1 30700 2557 11.1 31 744 15.5 23600 3819 0.4 50 700 2540 11.3 33
610 20.0 52600 3812 1.0
Winds Wuljds
Z ddd Ii Z ddd ff(i) (deg) (n/c) (W) (deg) (nm/uec)
SFC 02 200 9.8 SVC 02 180 2.1430 200 13.0 360 200 12.8870 200 13.0 730 200 14,5
1250 210 14.0 1110 210 14.01040 210 17.8 1500 220 15.02200 220 17.5 1900 220 15.02650 230 15 8 220 240 11.93000 240 14u 2630 240 11.13300 250 10.2 3020 250 1,l 43620 200 9.0 3350 250 1.3950 270 8.0 3750 260 8.9
40i0 200 0.5
168
_ _ __.. .. . .. .. . .. ...

Table 12.1 (Continued)
Gas Release No. 59 Gas Roleaso No, 60
25 Aug 1950 2220C 26 Aug 1056 0020C
p zT R,. I Z T I J.L((b) (m) ("C) (M) (mb) (ml
939 0 25.5 38 038 0 25.5 35913 31.0 23 907 20.1 20900 371 30.2 24 900 375 29,0 35855 27.4 24 8600 27.4 25850 886 26.9 25 850 882 26.6 35800 1417 21 9 32 800 1413 22.0 28716 12,0 45 784 20.6 29700 2554 i 1. 3 43 720 14.0 42648 6, 1 37 700 2552 11.8 47600 38 11 0.3 57 co0 3818 (.,4 72
Winds WindR
Z ddd ff z ddd ff
(W) (deg) (/EI (in) (deg) (n/see)
SFC 02 Igo 2.6 SI 02 210 6.2400 200 15.8 440 220 22.5780 210 16.6 850 220 24.1
1170 210 15.3 120K) 220 10.21570 220 15.0 1520 220 21.8100 230 14.0 1850 220 14.22350 240 11.3 2270 220 15.32730 240 11.0 2750 220 11.23160 240 10.8 3150 210 7 036(00 250 8.0 3490 210 8.14000 2W;0 0.0 3850 200 0.0
169

Table 12.1 (Cunt'nued)
Gas Releaao No, 01 Gas Relestae No. 02
27 Aug 1956 1050C 27 Ag 156 1350C
p z T R.H, P Z T t11.(nib) ("I) ("C) M% (nib) Wm C°C) M%
9:14 0 31.8 2C 934 0 20.0 37916 28.0 30 024 28.0 30900 330 2G.0 30 900 329 2.,9 30880 24.5 30 809 25.4 30874 26.2 27 850 831 23.9 32850 832 24.3 29 800 1357 10.6 38800 1358 20.2 32 744 14.5 1 4372345 1.4 39 700 2488 10.3 54700 240'2 10.9 47 635 3.8 716344 '4.8 ?, 600 37'49 0,2 75
COO 1114 - - OA 62
Winds Windl
Z ddd ft Z ddd ifWre (dug) (II/seec) Wm (deg) (in/sce.)
SFC 02 10 5.7 S I' 02 180 1.63.11 20) 9.7 280 210 6.5
090 220 8.0 800 200 3.0
1200 220 7.0 1050 210 4.41600 210 6.7 1250 220 5.01900 210 8.4 1500 230 5.02180 210 9.0 1730 220 5.92490 220 9.2 1950 220 8.02800 220 7.3 2200 220 9.53070 230 7.5 2500 220 10.53370 230 8.0 2u0 230 12.03650 230 9.7 3090 230 11 2MCI5 2'10 "1 1j 111U35 210 11.7
3700 230 12.04,000 220 10.b
170

Table 12, (Conithued)
Gas Rlease No. 63 Gas Releame No, 6427 Aug 1956 1950C 27 Aug 1956 2220C
z T R.H. p z T IL H.(mob) (m) (00) Mo (rb) r (M) CC:) M%
931 0 24.5 47 932 0 10.8 67023 30.7 34 921 29,1 40900 302 29.0 34 000 309 29.6 30853 25.4 34 804 20,7 20850 U07 25.1 34 858 27.3 28800 1335 21.3 32 850 816 26.6 20773 19.1 31 800 1346 22.0 29700 2473 11.8 34 742 16.5 29654 6.0 36 700 2484 11.0 35600 3730 1.1 45 600 3747 6,0 4 1
't Wi~d., Winds
z ddd it Z ddd q 2Sm) (deg) (m/sec) Wm (deg) [, ( /sec)
SFC U 240 1.0 SFC 02 Calm230 230 3.4 3G0 ?30 3.0480 220 5.0 720 230 4.6720 210 6. 1 1080 230 6.6900 210 7.7 1460 230 8.01290 210 0.0 1780 230 7.71520 210 3.7 2110 240 5.81810 210 3.5 2450 240 5.32L00 210 3.2 2790 240 4.42370 220 3.5 3100 240 3,32660 220 3.5 3490 240 4.62940 230 2.4 3880 230 5's3200 240 1.83450 200 2,53680 280 3.8
3970 280 4.0
171

Table 12.1 (Continued)
Gas Iteloase Nu, 65 Cas 1 lease No. 06
29 Aug 195. 1920C 20 Aulf 1950 2120C
P Z T R.1I. P z TIt.(ib) (m) (1C) (%) (rb) (W) (C) (I)
933 0 20.5 28 93U 0 21.0 4290 315 24.9 32 916 25.6 37850 812 11.0 40 900 3163 24.9 33800 1331 15.8 50 850 1J 22.1 23781 14 4 .52 H4R 22.0 A 3
700 2447 7.1 42 800 1330 18.0 28R58 3.4 39 750 13.4 34
uuu ; - ,.2 24 'iou 2400 8.4 46050 3.0 58600 3711 I - 2.0 56
WI ndIs Winds
z ddd if Z ddd ff(i) (dog) (W/8rC) (m) (dog) (m/nezc)
SFC 02 110 3.1 SFC 02 180 3.6300 180 11.8 380 180 15.3700 180 13.(; 750 190 17.4
1080 190 13 0 1100 200 14.51440 200 13.0 1,120 220 14.11830 220 10.0 11100 220 13.92200 240 21.0 2150 230 10,2
2530 250 11.5 2460 250 0.12900 260 11.2 2750 250 0.6
3220 260 12.2 ;1130 260 12.03580 27U 12.2 3520 260 14.13900 270 10.0 3920 270 15.0
172

Talil 12,1 (Continurd)
Gas Release No, 67 Gas Release No. 68
30 Aug 1056 0020C 30 Aug 1056 0220C
P z T 11,11. P Z RIII(rnb) (M) ("C) (%) (mb) (M) (°C) (%)
932 0 21.0 47 931 0 21.0 45o1l 24,6 37 916 24.2 40900 304 23.8 40 900 205 23.6 37876 91 0 45 850 791 21 3 30850 801 21.1 34 830 20.4 27830 20.5 24 800 1312 17.7 30800 1323 17.8 30 700 2434 8,0 43700 2444 7.0 46 672 5.2 47686 6.4 49 035 2.2 43600 3087 - 2.4 59 00 3685 -1.8 50
MKSWinds
dd If
(m) (dog) (m/Bec) (M) C)
C380 190 16I0 400 210 14.8730 200 16.5 800 220 15.3
1030 210 16,8 1100J 220 12.8
1320 220 17.3 1530 210 13.81880 220 16.4 1920 210 12,72000 220 13.0 22OU 200 10.22300 210 13.0 2640 200 o.12620 210 11.0 3020 210 7.72050 230 7.0 3380 240 6.43230 200 5.0 3770 200 8.33530 250 Lyn3900 230U 7.3
I1
l 173

CHAPTER 13AIRPLANE OBSERVATION DATA
P. J. HarneyGeophysics Research Directorate
Air Force Cambridge Research Center
13.1 Introduction
The aircraft soundings taken at O'Neill, Nebraska at the times of
the diffusion experiments are tabulated on the following pages. The datawere recorded on an AFCRC Aerograph (Kollsman KS-4). In addition,altitude was read from a calibrated sensitive altimeter by an observer
who also noted air conditions.The pattern for the sounding which was regularly followed consis-
ted of horizontal passes at constant airspeed and altitude along the north
mile of te,, site section for altiiudes up to 1000 ft. Then a box climb was
made with observations on each side in level flight for 30 seconds. Unless
clouds ntervened, this was continued to 7000 ft above the site itself (9000
ft mean sea level indicated altitude). A spiral descent followed with one
observation at either 1000 ft or 300 ft and a final traverse at an altitude
similar to the initial run.13.2 Tabulated Data
The first column, Zp, gives the pressure altitude obtained from
altimeter readings. The height of the lowest level was adjusted to match
the pilot's intention to fly by his own calibrated altimeter and by visualreference to 50-foot instrument towers nearby. The other levels were
corrected for scale and installation errors but can be as much as 25 feet
too high due to a lack of up-to-date information on these errors and on
the ailvort elevation.
The Pmb column is the pressure in millibars obtained by converting
altimeter readings through use of a standard altitude table.
174

The T column is the temperature in °C read from a thermistor beadin a stagnation type probe on a boom on the wing. The value represents
an average for the traverse when the trace was changeable and a value at
the end of the traverse when a drift of temperature was noted. The value
represents a free air temperature because it has been corrected fordynamic heating using a recovery factor of 0.85, found to be typical forthe equipment used. The accuracy was of the order k 0.2"C. Part of
this spread was due to a modification to make the recorder more sensi-
tive, which allowed the indicator to hunt through this range during the
time of high ambient temperatures.
A column marked # refers to the behavior of the te.nperature
trace. The code used is similar to the one used for pressure tendencyreports. The first figure indicates the trend shown by the trace during the
traverse, which lasted about 30 seconds. (The time taken to cover the one
,t mile at 100 knots indicated air speed.) The second figure is the amount ofchange (plus or minus) indicated by an oscillating trace or the amount of
jtemperature shift as indicated by the drifting of the trace. The significant
values are given in the legend prefacing the table.
The RH column lists the estimated relative humidity obtained from
a carben-element electric hygrometer. The calibration curve used wasthat for a batch of pre-production elements. This was checked again.0apron values of a sling psychrometer before and after the flights. Com-
parison was made with the daily radiosonde upper air observations
(lithium chloride elements) and th.P calibration curve was shifted to matchthe deviation of the overall average. As is customary, allowance was made fora small temperature shift; also in this RH column an allowance was made
for the increase in probe pressure of 15 nib. The aame element was usedthroughout because no deterioration nor regular shift could be proven in
the field. The accuracy is of the order of 5 percent.The V1 column for vapor pressure in millibars and the DP column
for dew point in 0C are slide rul-e values. They are computed without
allowance for the above mentioned probe-pressure effect. The gradient
175
A
- ---

values are considered good due to the fast response of the humidity
element at these high temperatures. The accuracy of the absolutevalues is limited as noted above.
The TIME shown for each sounding is generally that of the timeof gas release for convenient reference. The sounding actually started
with the first pass; this first pass almost always corresponded with the
start of the ground meteorological observations which was 5 minutes
before gas release tinie. The first traverse followed the radiosonde
balloon release by 5 minutes. The top level of a complete sounding wasreached about 30 minutes and the final run about 45 minutes after the
first traverse.
13.3 RemarksAircraft observations were not made for tests 93, 24, 31, 32, 33,
and 34. At these times the .ireraft wag at Omaha for engine change and
installation of additional instruments. An extra run of note was madeand this is included as Field Test No. 48S
The aircraft used was a standard ISAF L.-20, Instrlmented by thje
Research Airborne Engineering Branch of the Hanscom Air Force Base,
Bedford, Mass. The crew consisted uf LI. George A. Sexton, Lt. E. E.Clark, pilots, and A/ic John I. Knutila, A/Ic Joseph H. Driever, crew
chiefs.
The thermistor used was modified for a response time of about
three seconds and calibrated by James H. Meyer of the Lincoln Labora-
tory. The calibration used with the carbon element was provided by
Alfred Sptola of the Cloud Physics Section of GRD.
176

Table 13.1 Aircraft Observations
LEGEND
Code for the 4 symbol
First Figure Temperature Behavior
2 Unsteady or oscillating trace, may include a jump or a hump.
3 Drift to warmer temperature which is maintained.8 Drift to colder tcmperatir which Js maitained.
dash Smooth trace, no temperature change.
Second Figure Temperature Oscillation Temperature Drift
none ± 0,2C less than 0.5"C
2 *0.3 0.54 ±0.5 1.0
5 ±0.6 1.2
6 ±0.8 1.5
Abbreviations used are those uf the airways teletype code and con-
tractions whose meaning is evident.The observer's ilitials are listed because non-meteorological
aides made frequent flights onwhich their observations are sparse. The
pilots alternated in flying and no difference in techniques was noted.
177

TabIle 13.1 (Cnlit'med)
FIE:LD '1 .-1 ... 1 ;1 JULY 1951 1100 CST
SI I T # RI I III T(10t (nib) (C) () (nb) c)
50 043.5 21.0 07 24.4 20.7
100 941.5 21,3 95 24.4
180 039.0 21,A 2)2 91 23.0 1,390 032.0 20,4 -- 1t .0 ,0(10 924.0 19,2 94 21.2 18.4830 917.0 19,1 98 2119
1000 911.0 18A) .10( 214 1.61520 803.5 17.3 -100 1W.7 17.3 OtnI bump lower levels2015 876.0 16,3 .100 18.5 16.3 In clear
9do 9(; ) If0 1, : . I I . [$ibiam ofl c'{l(nd -ill wispIi.I !iiNgo00 311.5 17.5 '100 20.0 17.5130 U40.5 20.6 >1100 24.3 20.650 943.5 21.1 Ir 24.4 20.750 943.5 21.2 95 21.4 201.7 Spviond pass Oblr P.11.
,t L J..... L__,l I ....... _.. ____ ____ ___
FIEI) TEST NO. 2 3 JlY l,9'0 15100 CST
p T 1 e Romarks
fl)t (mb) CC) (M) (11b) (C)
50 943.0 23.5 82 24.0 20.4115 U4,1.5 23'1 13 2,1.1 20. 5
160 039.0 23.4 83 24. 2M.E Butln430 931.0 22.,1 85 23.2 19.9Wq 0 923 0 1! 86 22,8 110.6840 910.0 .1.1 85 21M 18.8
1021 909.5 20.7 s9 22.0 10.01515 893.5 19.13 82 92 21.2 18.52025 876,5 18.2 06 20.4 17.11 Slendy2535 860.0 17,0 99 11.4 17,0 Oci)l bump3020 844.5 15.7 -- I'M 17.8 15.7 ln cids
3545 1128.0 14.4 -100 10.4 14,4 IThru hole ID clds4065 812.0 13,6 82 .100 15. 6 13.6 T'rhru thin c1lds5040 782.5 11,7 .100 13.7 1 1. i lietwecen elIs
First bump abmut 1200'1000 910,5 18,8 32 *100 21,7 18,8 Memcendh!., 500'Influte60,) 043,0 21.4 22 (it) 25.4 21.4 Abrutpt delevent to here60 P.4 ,0 22.3 94 25.4 21.4 Trav.rso af!.r 30 seconds r
O(sr PH,.
# Seo Lel,,nd No. I & 2
178

Table 13.1 (Continued)
FIELD TEST NO. 3 5 JULY 1956 1100 CST
z p 0 .. 0. .rd Rern...e
(it) (mb) CC) (nib) (°C)
22.4 95 25.7 21.5
220 940.0 26.0 58 10.7 17.3160 942.0 25.8 60 20.2 17.7300 934.5 25.2 21 60 10.6 17.2
SGOO, 927.0 24.5 63 10.7 17.2840 919.0 24.0 62 65 j0.7 17.2
1010 913.0 24.3 00 20.0 17.61520 896.5 2.1.0 82 07 10.1 10.82010 880.0 21.9 82 67 17.9 15.725M5 1 864.0 20.6 179 17. fl !5. 53025 847.5 10.1 I11 16.0 13.0
3505 832.5 18.0 65 13.8 11.74045 815.5 10.5 00 11 5 9.0525 786.0 14.7 I 04 11.0 8,4
0 40.0 2 3 21.8 18.9 Ob_.r P.1H.____7
FIELD TEST NO. 4 6 JUIY 1056 0100 CST
'zp P T 0 1111 l e Td rearks
(i) (b) ( (%) (b) CC)
20.6 D2 21.8 10.0 Equip Oc ±O.2'C por 10 sec-taxiing
180 941.0 25.9 -- 60 20.2 17.7 'imp max on Sdg40a 933.11 2.,1 -- 60 20.4 17.8615 926.0 95.4 -- no0 19.6 17.2820 £19.5 24. 21 60 19.0 16,7
]Of) A13, 1 24.4 22 59 18.5 17.35boo 806.5 23.4 00 17.4 15,3
1995 880.0 122.0 59 15.0 13.8240.; 860.15 20.0 69 16.9 14.93000 848.0 19,2 75 10.6 14.8 Pirep Blight turbo
3505 832.0 17.8 74 15.2 13,3 above 3000'3000 817.0 16.6 71 i3.6 11.55025 785.5 14.4 58 9.8 6.7
190 941.0 23.6 44 82 23.8 20.3 Fireps slight tuirucSharp 2" lwyti, Obair J.D.
L _ ........_ __ __ __ _ _ __ _ _ __ _ _ __ _ _
f See Legend N. 3 & 4
170

'Table 13.1 (Continued)
FIELD TEST NO. 5 6 JULY 1056 1400 CST
z P T # Ri e 'rd Remarks
(ft) (nib) (-C) (3) (mb) V0C) _______________
60 944.0 20.4 47 18.2 10.075 943.5 20.4 47 19.3 17.0 Ocnl gust all levels
170 940.0 29.3 47 19.2 10.9375 933.0 28.5 22 48 18.0 10.5630 924.5 27.8 49 18.6 10.3820 918.0 27.2 22 50 18.2 113.1 rampy below990 912.0 26.2 22 53 18.3 10.1
1500 895.0 25.3 82 52 17.0 1,50 One gust2000 878,5 23.8 82 54 16.3 14.3
# 2505 802.5 223 22 56 15,5 13.3005 840,5 21.2 22 49 12.6 10.43405. M3.0 20.1 22 40 11.5 1
4030 814.5 18.2 49 10,9 8.25045 784.0 17.4 52 10.4 7.8
300 935.5 26.5 32 63 .22.1 19.135 945.0 28.6 32 52 20.0 17.5 Obsr J.D.
FIELD TEST NO. 6 13 JULY 1956 1700 CST -,
Sp P T # e Td Rumarks
t) (ml,) ) ('0) (ob) (IC)
50 942 30.3 22 43 19,5 17.375 041 30.7 -- 40 20.3 17.8
165 938 30.2 46 19,8 17.3375 930.5 29.0 46 18.4 16.2835 922 29.0 82 46 18.6 16.4805 916 28.3 46 17.8 15.7
1005 909.5 27.8 48 18.1 15,91515 892.5 26.7 46 16,3 14.31905 876.5 25.3 82 50 16,4 14.42500 860.5 23.3 82 54 15.A 13.63020 843,5 22.8 50 14.2 12.2
3660 827.0 21.2 46 11.5 9.14000 813.0 29.5 42 10.3 7.45010 783.0 111.3 40 10.4 7.4
275 934,0 27.'1 33 54 20.,11 17.765 941.0 30.0 47 20.0 17.5 Obsr 7,D,
0 See Legend No. 6 & 6
180

Table 13.1 (Continued)
1',:LD 'TEST NO. 7 10 J11Y 1956 1400 CST
7p I1 f I e Td Remarks
(ft) (nib) (10 (%) (Aub) (Cc)________50 944 , 30,1 22 38 16.3 14.390 943.0 29.6 39 16.3 14,3 Obrop sounding
180 940.0 20.2 2:1 40 1(5,0 14,1 Rough aWoft300 (33.0 28.6 39 15.3 13.4500 926.0 27.8 ,I1 I 13.5820 916.0 27.2 22 42 11.4 13.4
1000 012.0 2(1,9 42 11.8 12.0111)2u 894.5 25.3 45 14.4 12.42015 878,5 23.8 22 47 13.8 11.82505 802.5 21.8 50 13.0 10.93005 846.5 20.5 82 52 12.0 10.4
3515 830.5 18.9 82 56 12.4 10.2403l5 814,5 117.3 11. I 0.G50,15 704.0 14.0 82 02 10.4 7.06085 753.5 12.3 82 86 9.6 6 .47090 725.0 0.8 68 8.4 4.5 Turbulence noted
200 1930.0 2 A.4 32 45 15.0 13.6go 943.0 20.1 32 41 17.0 150 .... Obsr J.D,
FE 10 JULY 1050 1400 CST
Z1 p T # IM Renarks
( . (nib) (C M (h) (-c_
50 943.0 30.5 29 39 17,1 15.0 Ocnl bumps and drafts0 9,41.5 30.1 23 3f 16,7 14.7 )raf!ts
180 038.5 20.8 113 I 1 17.4 15.2305 031.0 29.3 22 42 17.3 15.2 O,1 bumpa640 922.5 28,2 43 10.4 14,4830 9111.0 27.8 qz 15.8 13.8 Dumpy
1000 910.5 27.0 44 15.5 13,01500 094,0 25.7 46 14.7 12.t201b 877.0 23.8 48 14.2 12.1 Ocnl yaw2525 800 5 22.1 22 50 13.4 11.33035 844.0 20.5 54 13,4 11.3 mother
3545 82H.0 19j) 99 13 ? 11,0 (in: s4045 8 13.0 17.f! 59 !3 0 10.8 Yawhlg5065 702.0 14,6 li8 110 1. S91 h, some hS, 1 b".s7000 723.5 U.3 70 9.5 0.2 Wl'lwy
320 937.0 29.1 32 30 15.11 13.8 Obsr P.AL95 941,5 30.7 22 39 17.3 15.2
N See ge d NO. 7 &
181
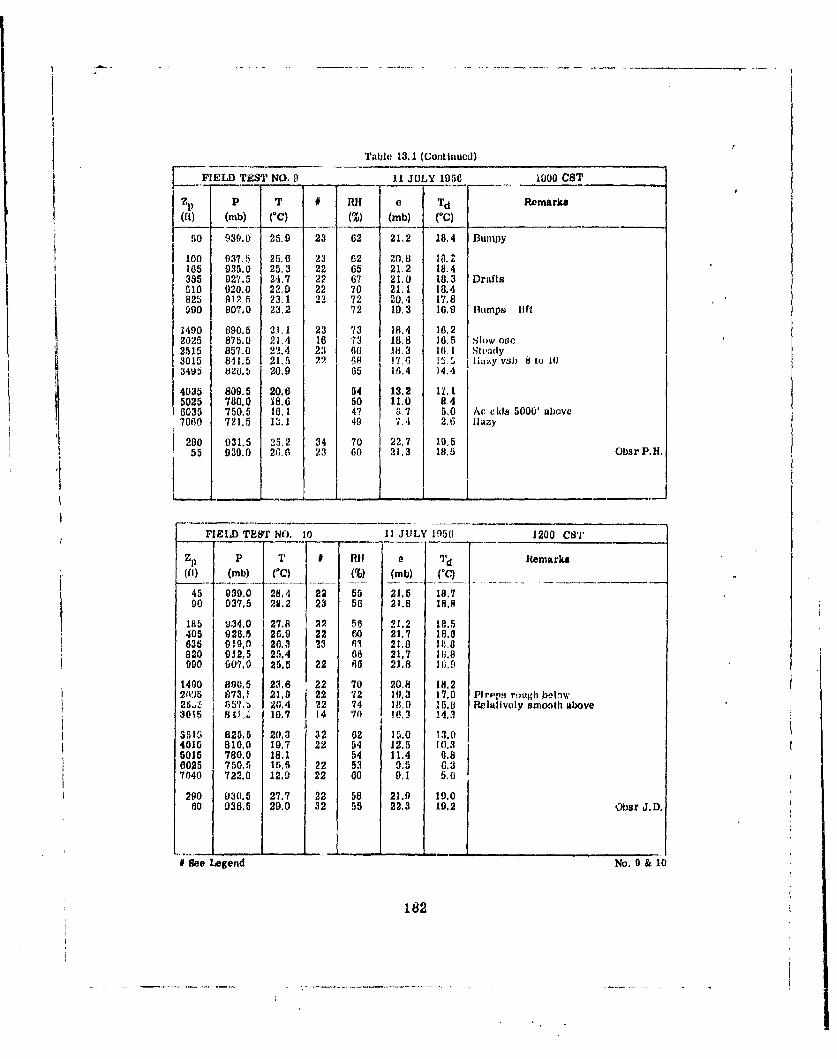
Table 13,1 (Continued)
FIELD TEST NO, 9 11 JULY 1058 1000 CST
P T # I[l 0 Td Remarks
(ft (nib) ('C) () (mb) VC)
-B0 30.0 25.9 23 62 21.2 18.4 3umpy
1o 937.5 25.0 23 62 "0.3 18.2105 935.0 25.3 22 65 21,2 18.4385 027.5 24,.7 22 67 21.0 18.3 DraftsG10 920.0 23.0 22 70 21.1 18.4825 912.5 23.1 22 72 20.4 178900 907.0 23.2 72 10.3 16.9 ilumps lift
1400 690.5 21.1 23 73 18.4 16.22025 875.0 21.4I 16 11'3 18.8 16.5 slHow wec2515 857.0 22.4 23 66 18.3 16. 4Irn'Idy
2015 87150 2.1.5 .9 C1 18.8 1.5 IHz ; io 8~ to
3495 72015 20.9 65 I6.4 4.0S4035 809.5 20.0 54 13.2. Ix. 1
5025 780.0 18.6 50 11.0 840035 7/50.5 1f6.1 47 6i'/ 5,0 Ac elds 5000' above7060 721.5 13.1 40 7.1 2.6 flazy
200 931.5 25.2 34 70 22.7 10,555 939.0 2G. G 23 60 21.3 18.5 Obsr P.H.
--...-. -- .--..
IF1LD TEST NO. 10 1i JULY 11150 1200 CSTr
I 1 I l Rif e Id Remarks(nI) J(mb) (T) 3%) (mb) VC)
45 939.0 28,4 22 55 21.5 18.790 937.5 20.2 23 5 21.8 16.8
186 u34.0 27.8 22 58 21.2 18.5405 920.5 26.9 22 60 21.7 18.863 910,0 20.3 3 6 21.0 111.8820 912.5 25.4 (16 21.7 111.890 907.0 25.5 22 66 21.8 ,11.9
1400 890.5 23.6 22 70 20.H 18.22 J5 9 273, 21,9 22 '12 11,3 17.0 Plrepi rough bolnw25.;f. 157.b t 20,4 22 74 111,0 15.8 Relalivoly smooth above3015 i 1.. 10.7 14 70 M0.3 14.3
3 515 ] 825,5 20,3 32 62 15.0 13.04015 810.0 19.7 22 5.4 12.5 10.35015 780.0 18.1 54 11.4 0.86025 750.5 15,5 22 53 9.5 6.37040 722.0 12.9 22 60 9.1 5.6
290 93(.5 27,7 22 58 21.0 10.060 038.5 20.0 32 55 22.3 10.2 Obs r J. D.
# See Legend No, 0 & 10
182

Table 13.1 (Continucci)
RJEM TEEM NO. 11 14 JULY MW5 0On0 CS'1,
p 1 fu Td Remarlia(ft) I (rb)} I°O) (nib) ("C)
40 942.5 23.i 23 83 24.2 20.6 Bump90 941.0 32.41 23 08 24,2 20. 5
1oi 23.1 22 83 23.7 20.2 Drafts380 931.0 22.4 2 3 84 23.0 1.'s640 022.0 21.8 85 22.4 IV.841 OM5,5 22.4 2384 23.0 IC'.8 Illmps
1040 D08.5 23.1 23 76 21.8 11,8t readier1520 892,5 22.8 32 82 22.8 11). G
2013 870,5 23.6 50 14.8 12.8 Smn'wth2495 22U 446 55 15.2 13.23025 844.0 22.4 42 11.5 0.0
3495 820.0 22.2 42 11.4 8.84036 812.5 20.8 30 0.7 6.5 Oscillation5035 782.5 17.7 46 0.4 6.2 Smooth035 753.0 15.5b 40 8.1 4,.07bO '123.5 12.5 43 0.3 0.4 Osellation bumps at 1300'
200 934.0 23.f 11 5 25.2 21.350 942.5 23.9 83 80 23.8 20.3 Obsr P.11
I A
FIELD TEST NO. 12 14 .1.1,V (-1f 1000 CST
gp P T 2 if 4 Td Remarks
F7 .94.0 .' a 2 D 94 21.,0 ,,,I 360 931,5 26,7 .2 70 2,0 21.0 1,lt I~gh
6 20 922.5 25.9 22 73 24 7 20 9800 910.5 25.4 22 77 25.4 21.4 ;uali :M end
1000 9021 5 4.9 22 78 24.1! 21.01510 892.5 244 24 72 22.2 f19 1 , ',,;;oud buiips2005 876,5 24,6 2.f 52 16,4 14.4 Swimol h2085 1161,0 23,u 22 50 14 4 12.03015 844.0 23, 1 22 39 !1. 1 S tuady
3405 829.0 21.A .) - 38 10.0 7.04030 812.5 21.1 35 8.8 5.95035 702.5 18.4 3!9 0 .4 4.4 Y
6035 MM 16. 1 40 7.3 2.47040 724.5 13.0 48 7.1 2.1 Stady
280 0;:4.0 27.0 34 44 16.4 14.1
70 94 1. 5 20,2 24 50 20.8 18,2 Iunip Obsr P. 11.
# Ser 1.ogend No. I 1 12
183
iI

Tuble 13.1 (Continu:d
.IE) T2I'I_ NO. 13 22 JULY 1050 2000 CST
Z1) P T # 1(1l o Td Remarks
, I ~~~~~~~,1 17.0 23,.3 ... -132..1- _-s,,,,,,,, oo
45 2.3~ 62 18.T 16.0 SC vesperalis 9000'5 0 u915-) 22.8 65 10.2 16,0 Sun low at tihe horizon
180 942.5 23.1 -- 50 17.0 15.0 Smooth400 935.0 23.0 5 9 13.A 14.2620 927.0 21.8 32 62m 16. 0 14.6 Very smooth830 0.00 21.2 G05 16.5 14,5 One lift; smmpt
1000 94.5 20.9 67 16,9 14.01505 867. 5 11.6 82 71 16.5 14.57080 881.0 18.0 72 15.0 13.1. Very light turbo
285 8 i2.3 02 17.0 ii.0 Smooth{I{ 3')? 9 , 5 {5 1 , 12,8 10.0
3505 833,0 13,7 77 12.2 10.0 R If 08cS,045 816.5 12,6 1o 13,3 11.2 Smooth {
5030 78. 10.4 97 12.4 10.16070 5.0 8.1 100 11.3 8.1I Cloud b~ane 58UU
,{7080 727.0 6.3 go 9A4 6.0 Top about ({500 vrbl
'{285 038.,5 22.3 62 17.0 15.0
180 q42.5 22.1 22 60 16.8 14.8 Obsr P.H.
FIELD TESr NO. 14 22 ,1l'Iy 105i 2200 CST
Zp P T 0 fu Td Remarksl
(1) ("11) ("C) ( nib (IC)4
1710 8 43. 5 21.7 422 57 15.0 13.0355 837.0 22.4 54 14.8 12.9G00 928.5 21.8 00 15.6 13.8820 t 02!.O 21.4 22 51) 15 2 14.2985 015.5 21,0 56 14.3 12.3
1500 1198.5 10.6 62 14.4 12.41985 882.5 18.1 73 15.4 13.42485 1166.0 16.7 22 81 15.6 13.6 Light turbo2915 1150.0 15.0 813 14.4 12.4 Light turbo3405 834.0 14.4 90 15.0 13..0
'1005 (l,'O 13. t I 93 15.0 13.14990 718.0 11 1111.2 8.7 Otnil bump abovo6025 758.0 9.4 75 9.0 5.47020 720,5 0.9 87 8. . 5.1
260 940.0 22,3 54 14.8 12.8170 043.5 22,3 22 53 14. 5 12.5 Obsr J,D,
e " ICgi:d No. 13 & 14
184
I.

Table 13.1 (Continued)
-PFL)TRST NO. 45 22 JUi41Y 1050 0800 CST
Zp P 'j, ft RH C cmir(It) (nib) ("C) () (nib) (C)
50 947.0 19.4 22 84 19.2 10.875 042.5 19.2 22 83 18.8 10.5
185 942.0 19.0 84 18.8 10.5305 035.0 18.9 84 18.6 16.4 Occaulornae 11 turbc635 926.5 20.1 22 80 19.1 16.8845 010.5 20.3 81 19.0 17.2
1005 014.0 20.1 82 19.6 17.2 Hazy level not sharp1525 897.0 20.0 05 15.8 13.62020 880.5 10.8 69 15.2 13.22500 865.0 17.1 - 78 15.5 13.53030 848.0 15.0 84 15.3 13.3
3520 832.5 15.2 59 10.4 7.5 Above nmoky layer4050 816.0 13.9 -- 47 7.5 2.85040 788.0 11.7 42 S.9 -0.4000 750.0 9.4 30 4.3 -4.17085 727.0 7. i 32 3.5 -6.5 Few Ac on horzon
285 938.5 20.4 32 84 20,3 17,8 A few litiil bun-p,00 4,5 . 21.3 75 10,3 14.9 Obar P.11.
FIELD TEST NO. 10 23 JULY 1056 1000 CST
P T 4 t Td Remarka
( )) (nib) C) ( (b) (C)
50 040.5 24.4 24 62 19.4 17.0
100 944.5 24,4 24 0fy 19.2 10.0100 3 A 24, 1 22 02 18.8 1,,400 934.0 23.3 22 6.5 18.8 10,0f t1 027.0 22, 82 0 17.8 15,7830 019.5 21.9 22 72 10.3 17.0
1010 013,5 21.5 22 70 19.7 17.3 Obreps ]Jumpy to herr1500 807.0 20.3 22 71 17.6 15.52005 880,5 18,8 22 74 1C.2 14.22405 G4.5 17. 0 - 71 15.5 13.53fl, 84R.O 10,0 711 14.5 12.5
3495 813.0 11.8 22 71 12.2 9.94035 816.0 14.7 42 7,3 2.2 A light layer ofacaitored clouds5025 786.0) 12.4 311 5.5 1.2r"
6045 75B.0 10.3 54 0.9 1.87050 727.0 8.0 74 0,1 3.0
300 937.5 24,4 32 5 p 18,1 10.9SO 040.0 25.0 32 50 16.7 14.7 Obsr J.D.
# Se, Legend No. 15 & 10
185

Tl'ed~ 1'J.1 (Cotiued) __
fll UD TE!STI' N). 17 23 JULY 1956 2000 CST1)p P T # fill1 ! Tdrk
(ft() (1uh I CC (R) (nib) ( ) _
Gf r 9 41.0 29.0 37 14.0 12,680 940.0 28.8 37 14.4 12,4
180 03AL5 29.3 -- 35 14.4 12.4390 o20.0 29.5 22 33 13,.1 .0020 M, 29.4 29 120 6820 D 1i,, 26.0 22 31 12.2 10.0900 909. 5 28.2 33 10.7 10.5
1480 892.6 26.9 22 32 11,9 9.52005 875.5 25.5 34 11.3 8.6 Plrops Iemp 720F2505 859.0 24.8 12 36 11.2 8.7298, 04.0 23.2 id 10.8 8.2
3505 827.5 21.7 38 10.2 7.33905 812.5 20.3 44 10.4 7.65015 781.5 17.5 49 0,9 0, 86005 752.5 14,0 52 11 1 5.47040 723,5 11.8 00 11 4 4.5 Very Igt turbo Pireps63F
280 933.0 28.4 - 35 Lt.7 It 6180 93H.5j 28.4 22 30 14.1 12.1 Obsr J.D.
( ib) (...) V.. (.nb) 'Cc)160 939.0 2 .6 32 39 14.3 12.2 (St Cu drftw' out,345 9 932. 5 I2;7.0 22 :15 | 13.31 11.2| wind varled with605 923.5 27.9 32 31 13.-1 11.2 -lnued '.v,,.815 510.5 27 7 1' '33 12.4 10.29 85 911.0 27.2 22 33 12.1 0,8
1475 894.6 26.4 32 11.U [i .Z6 l bJft1Z1980 1 878.0} p5. ro .- 36 11,7 9.3 I ,1 turhv conjlntufu2400 8 161.5 24.4 39 11,8 9.4 1DumpH not1 jrsts2970 [840.0 23.4 22 39 11.3 Bi (lPrelm all chaligo;s r~iker
tlm|ln altIrped tchlutges
3510 ] 829.0 21. 8 112 42 11. 1 8,64010 0 13.6 20.3 22 40 10.9 8.2 ]hilmlh Hmll lout iItching
5010 783.5 17.4 22 54 10.11 8.2 (hoI)py6010I '754.0 14.6 13! W tO.3 7.4 Walhow7030 I725,5 11.6 05 U.0 5.5 Up & down dr"fqts
2655 935.5 26.4 62 42 14.,4 12.4 Sin otdh ho, hw 11b oil 12 00' I
165 939.0 26.7 43 15 ) 13.1 Obir P.H.
See Logprd No. 17 & 18
186

T1 lC 13.1 ({Con iinW(I)
_,I ,"_ No. 10 25 JULY 1956 110) C'l,
It r(II Td R(emarks
((I mb) C) (5) (l,) C)
50 943,0 27.0 23 10 'I.2 12,1 Cirrus clouds sun (jut75 942.0 26.7 22 '10 1-1.0 11.9 Iouncy
15 939.0 2t3.4 22 41 1,4.0 12.,o90 031.5 25.7 22 42 131 11.9 llumps1'l
62( )23.5 25. 2 43 )1 Ii 11.11850 9110.0 2.4.5 22 15 I 11 12.0 Dir;ft
1000 901. 24,0 '', -.1 , 1:1 : 11.4151) 11911, 22 , 23 50 I 13.1) 11.4 ou 'lcn2015 877.0 21.1 22 53 I:1. 1 11.4250 5 101.0 20.5 24 35 11.4 '1.5 Lv!; drafty3025 8,1.5 5 [) 3 2 1.0 -D.3 R 11 dl,'oubful this
35 15 9j2 9,5 20.0u 22 25 5A9 -0.5403-5 A 13.5 20.0 22 25 5.9 -0.550115 783.) 181.2 12 28 6.0 -0. Smloolh111)45 '153.5 16. 2 31 5.'1 • .)IWO 7 "1. 0 1 :.5 36 f).7 1 ,1.9! Sloew o!;,;
111111H 0: 2500,3100 '1,411 2 ,U3 1,5. 1 13.1 lift ;t 11O100 -1 r, 21w.1 22 ()b.4r P. If.
F1I,.1) "II',TNU. 20 25 JULIY 19561 !1(0) CST]
/T h3 1111 .i llcmurka
II) (mb) (,() ()O IC _____________
7 5 93. .5 291.'d 23 12i, 1il t, msp iwin
175 S f.ql r, 0 2!) 2 . 20 ? 1 ! .
175 D21l ) 211. C1 , it I 1 0.B
P o 9 2 1121.2 27.7 2 , 33 12.1 I80! 911 5 27 0 : 2 19; 12.9 ti.0
1015 910i 5 20.2 22 36 12.. 10.215115 1191 0 25,1 22 35 11.3 1)21)0) H7, 0 23,2 5 1(.2 7,22,1110 859. 21 H 22 13 11.1 0,53II1 I; 142.5 2 i.- 21; 211 7.4 2. ii
: 1190 J27 5 22.0 24 25 f.11 1.04111 8 11... 21.4 23 25 i 0,065020 7f11.1 I 111.4 22 211 ,1 1,(610:10 751 17 0 )1 5.1!1 !.I7045 72:1.0 I 13, "C f 5.1 0..(1
ITizrj litlow 30101) If275 932. 5i 30,o 33 25 111.5 77
115 1 '.1 3 ," 112 211 10.8 11.0 O I,r J,).
II ?.' I.tjliinl NI). 19 I 211
187

T'tabh 13.1 (Conltluolme )
111ll'1.1) TI'T NO. 21 26 J IJIY 1356 2100 CS'/
(f 0 1,b) )("C)175 13 02. G390 92.1.560 3 917.5 Roulh850 0O1.,0 ;M. f 32 3. 13.3 11,2 L.ll, to N
101 9103.5 2!". 5 22 32 1:3.2 11.1 Snlhlth sliddIly1 119I!0 111111. 0 28i. f8 :1 129 11l. 5J 9.020115 870.5 27,7 211 10.4 7. 62490! 855.0 27,(I 2,1 it.) 5.3 ,(1rv dy21993 6i31". 5 2 6,1) 2,1) It. 9 5.3
:14195 82-8.0 25.4 26 1L5 4.f. TInm iil uirp aIx) . 800139f95 M18.},0 24A,, 20 I 8.1 ' 2 :-li)(Al h
510.2 7711.5 21.2 24! :1 7.1 3.4 llumlpy tlhe ttdy604,5 "143.0 1(11 35 7,3 2.1 Itvy ltog to N $n3ml'h
7070 719.5 1035 32 27 5,1 -2.2 -1.5-C imp blip on climbEqu iomi' 3 I nikm OK
295 028.0 28.7 31 12.2 10.0 lluolzjo ii 100'180 932.0 21.7 30 11.8 9A4 Ohsr I).H.
FII'LD TES r NO, 22 21 .LY 151 (i ST....
T p ) T N if Td Rlumairko
L) (nb) .. ..) C%) (m") ('C)
110 f)31.0 27,i 37 1:1.7 1I1.,1 I llr1.ls strJig %v11 . ahlt4)) 02 . , 5 2. 1 22 :37 :3 3 11.1 IMluiu y6,10 915.5 ' 21.1r 35 3.7 1!.9 10.18150 00(1.0 26.4 24 38 13,1 ; 10.'
1030 902.0 21, 2 2 5 33 12.,) 1 1.;1500 U380, 5 27.5 Il(4 I ,'l I ' ! .2
12515 1153.5 27,5 22 2; 9',2 .1
M r,. 837.5 27.0 22 24 3,1; 4.11
S3515 822.5 25.,9 22 23 7 7 :1.2 V, 'y; JIl iiii'liS4035 80 fl, 5 24.9 2 3 7.3 2111 1.10. tludic' ill ,4500''
5025 776.5 21,3; 2:3 !)D -03 1t .1,1 l ht i31 5500'6045 747,0 1!) 22 2:1 5.2 . 17080 719,0 ili.0 22 23 4.4 -.IO 1,1 h1zhg ill 5(1l0)' d'Hrpht
iIIl P hil at. 1;111)32110 027.5 21;.0 -- ,(1 12.0 111.4 (0lOt at.,' 33 r,(3(l'210 1 0),0 26.9 3iG 1:.,11 1().) lumlpH Iai O(1 Obs r . D.
N See L'gund No. 21 l 22
188

'1113)14' 33.1 (colilnludc)
fVWD"2l~TNO. 25 1 AUUUST 1 09M 3IS
1)i Iii T "'d~j Remarks
5, 3 (C)20 Muc
50 04941.0 22, C 22 0 0( 2. ~~w100 IN43. 5 22.6 22 f-"' 21.311 2P.A
100 939-1 I2..0 22 vo 25.5 21.1-M1 032.0 21.4 22 04 24.3 20.(; Drafln and aceler~ation
8-5 017.30 20.0 10 :44 . 11. I'41Jf3y
~1510 1105.0 133.2 1 0') 2'.~ le2 Pso" nh ,bu 60b;, clinL' at) 1750'
and11( drafts1(000 912. 0 1 30.4 1 too 2:1.2 90.4 Bumpy
5 0 D 1-1. 0 22.0 9 32 936 27,.0 22A4 Est 330 it 3w the lower40 It Indicated OliaJr P.11
F31;1AA) TEST1 CO. 26 2 AUG USTI 19561 120 CST
V. p Il fu! I d Iturnarks
50 9)40,0( 27.2 24 0(G 24.- 2.!M011 26.9 23 633 241,4 20. (
39 2,0 26.3 23 72 24,33 2.0 Milupy630 920r.0 265. ) 23 (7 5 24.0 213. Dial
34IM 91, 5(1 21 7 2. 02 uil
1332))0 14 0.3 1.5 " 1,2 0 22005 031.5 27. " 3 l7 1 23 . 4 he( 2Uf3~
2 0 4110,0 1~ 2 4 !1 1)$o-a
3 4 ____ P 5 827K0 18, oO 24ug 81 1.PA11.C1 XIC 1V0603 75.E 1.0 N,0 2- 78 237601
70-4) 72. 5 1I~h 95 12.89, 1I 50t

TAWl 13.1 (C'oltillwid)
,iLD TRS! NO. 27 2 AlIGHIST 1950 1400 C.T_; _
Z ) T '1T II I 'F, Reark
510 939.5 29.9 24 50 21.2 1i.5 HumpyS(0 931.5 30.1 23 49 21.0 18 : I)r:ffH already
175 935,5 29.6 23 50 20.8 18.2'90 027.5 29.2 63 50 20.5 17.8 I)r:ilu615 920.0 27.9 23 52 20.0 17,5 Oecasional fluIis8I.10 913.u 271.5 22 5.1 20.2 17.0 Ups & IDow is
1020 900.5 26.9 22 56 20.4 17.8 Negatlvu C accdhration7500 890,5 25,4 67 22.0 19.0 Ilumpy2015 873.5 23.0 79 23.2 19.02495 858.0 22.1 80 21.4 1V.0 Now under cltahk, 1,111T3025 H1,15 '0} fl, ,i 20, 6 1; b.0
3515 826.0 19.0 22 93 20.7 18.0 Wolh4025 810.5 17.6 98 10.9 17.4 Base 6f clouds just above5035 780,0 16.4 22 72 13.7 11.0 Cloud hawe at 4800 ft6045 750,5 14. 75 12,; ( 1 Chl t (tj 5U00-5!AI0 It7"1, 5 1..5 It 7 .:I 11.3 1.7 Deck Ac est 1UU0 uovoe
.h' u... . tu re c o n iv iii In e ld s290 931.0 30, i 22 50 11.6 18,7 Bu|||ps at 300'
-7 El 8: .5 5 i. U Z.1 49 2 2. 0 19 0 Pllipy Ob.sr 1). If.
VFIJEI_.,D NO. 28 3 AtI;IT 1056 0000 ,7ST
ZI ) 1) r # i! Td Remiarks
( Ub 60) (mb' C"()... ... .... ..... ......... .. .. .
15 934.5 26.4 22 72 25 0 21.1 Humpy31 5 5 917!' ?.c.5 I 22 70 24,(1 20 11 I I rItI ljttp!
,4 2. 70 24.6 20.8 IfumIdIlv jhvu~glsh8 35 ()11.5 26.5 22 65 22.81 1.6
1005 906(1 26.9 61 20 3 17 71505 It tU.5 29.4 22 52 11,2 1(1.0-010 873.5 25.2 51 16.3 14.' iIlnlg Io5 N
24190 11(57.5 U 38 5j 9. tIS 5 f;. OtcI hllpt2980 841,5 23.8 22 51 15A 15 - , .llh
3510 425.0 23,0 49 13.7 118,4030 1109.0 21.4 50 12.8 10.05040 779.0 19,1 54 12.1 9.8 SillontlJi1050 741.5 15.0 76 H,6 1.6 Strong Wind7025 722.0 12.8 82 12.3 10.0 Fro' Itllfg NW "bo a ut 700, due R1475 I1)D0.5 26.4 50 17.2 15 1 700gl iams account wel
175 934.0 27.4 22 55 20.4 17.)) Obsr P.1.
# Sev Legend No. 27 & 28
190

Table 13.1 (Continued)
FIELD TEST NO. 29 3 AUGUST 1956 CS,
zp P T 0 PJll e I T i r
(ut) I (sob) ('C) m%) __ m .
165 935.0 27.4 22 50 18.4 16.2365 928.0 26.8 22 so 17." .595 920.0 26.5 12 ..0, I vus!:;795 913.5 25.9 49 I ;.!, 14. j..995 906.5 26.0 22 5 V I 14.7
1475 890.5 26.2 45 .. 13.4 . .2000 873.5 25.8 3: 45 15 0 13.o2470 658.5 24.2 45 13.3 11.3010 841.0 22.7 46 1,16 10.43490 826.0 21.'- 22 47 12.1 9.4
,0 0 810.5 19.8 4 13 8.8 ITLI-11 ,'co', k, .,I appr~'a.',L,, , *:
965 9" .5 j 26.2 32 48 l(.3 14.3 .iumps t 7,"
I I
HF *1 TVST .30 3 ,\IUUST 195U UST
Zp VF T i if r d Remark,-
cot (,b) C,o 8 42 9.11 17.3 1 ou h ( r P
I . 23 43 19.7 17.2 IOktm-:..' ! €26f ) 4 5 20.- 17.7 ID r. is,2 i 19. O 0.0 23 41 19.5 17.1 !Dra!t
1 "s, 4 5A 20.7 18.0 Dra!ts5 2 8. t 1.3 47 8.5 .1
:.6,-5 : 2".4 2 ' 1.4 R22 I 01 -1 3 ' 1 " .7 ! 2: 54 18 ,2 1G.0 ),?,kals', ;Ja I Y z ps2 S 0; , 7 . .-;..9 22 C- I I " I I rfzs:102 . 2'', I2 4 17..
20.7 72 1';,3 , I.' '
: ,0,0 '.(0 :4 ; ( 4 I I!; .I .+: r :ch. gbaze level at17 IO, 72 ': " : 32. fi I . t ! , i~h1; Edge of FrCu
B~as clds GO0? tops 7000'O2 A No level pass account
I See Legend No. 29 & 30
Best Available Copy191

Table 13.1 (Contnmud)
-VI'I.LD TEST NO, 3'1. ... 12 AUGUST 1956 0300 CST- ---
P T # Wo Td Remarks
fI) (rnb) C 'C) (%) (mb) (VC)
165 936.5 21 1 32 84 21,3 18.5 Burmps ling N & NE385 929.0 22.4 78 21.6 18.705 021.5 22.9 7,1 20.8 111.1]810 014.5 12.0 72 20,4 17.0975 909.0 23.0 58 16.7 14.7
1475 892.5 22.6 -- 54 15.0 13.02000 875.0 21.5 -- 53 13.8 11.8 Lf~t iruic pIrvpI5 20,06 53 13,1 I1.24-) 5 843.0 19.8 53 13.5 10,2
4 i 1 .5 .8,4 ,2 11.2 8.7
S8, . 5 *, i 110 Very light turbo13'; "lt.5 1. 2 7e I . 1 7.3ttn20 7. -' i .1.'2 '4 12,1 9.8
701.0 P7', " l: j WI 21.? 8.7 Ling E
: " , 22.1 277 10.9 18.2A S 0 12 91 ?1.5 111.0 Buinpv Obmr P,.
Fun'. ID hm i U 14c) I? AUJGUST 1966 0500 CST!_____
a.~ I1M Td RemarkT
00 Ij4 !7 1,
.1 907.5 23.6 40 4. 12 '1*si 891.0 24.0 42 12,11 10.4
874.5 22.4 48 13.2 124 5a1. () 21.7 44 M8.9 P4305 843.0 20.0 -- 47 10.9 H. 2
3515 827.0 10.6 50 10.7 8.04015 1111.5 17.8 co 1 12.3. 10.0 Light turbi6025 781.0 16.5 51 ri. 7 0.513035 '1: .b 13s. 1 87 14.0 12. 0 I1IH Jumpi *iiui 5200'7040 723.G 11.2 80 12,0 0.7 1PT 19 p Ig 0 turb T
Hlldrop iibout 5600'90 908.5 22.5 03 17.4 15.3
30 941.0 20.5 82 19 21,8 18,9 ObarJ.D.
49 'i'Lgd No. 37 4 138
193

T able 13.1 (Continued)
"IED TEST NO, 39 ;3, AUGUST 1D50 2200 CST
Z) P i 9'e R Remarks(it) (, I ('C)) (nb) ("C)
190 941.5 20,1.2 12 44 15. 13.4 Ocnl bump at 300',20 933.5 27.1 13 43 15.8 13.8620 027.0 27.3 42 15.3 13.3 Smooth850 919.0 27.3 22 40 14.4 12,4 One hump, ncnl draft
1000 91M(I 26.4 22. 40 13.8 11.811525 0; -- 39 12,8 10.6
04,5 979.0 4.3 39 11.8 U. 4 Silmooth2513 861i.0 'M:., 22 39 U 1 9 0.431'35 847. '9 1 IS -.22 1.G 8.3
3525 832. 0 210.1 47 11.0 8.34040 It1. 0 1[.3 w0 09.6 7.0 Pirep- Rdded power needed50,10 785.5 10.3 ,62 55 10 3 7.4 0s'ev'l- bumps, igt turbo6U0 755,5 14.3 a7 1'.1 6.5 Some baes at 0500, turbc7090 726,5 11.3 72 O,8 0.7 Clds above, turbc, lrafts
1000 914,0 28.4 40 13.7 11.6 lBumps at 500205 941,0 2'3.0 32 14.2 12,2 Turbo noted thruout Obsr P,..
EIL 'Th',ST NO. 40 14 AUGUST 1956 0030 CST
Sjp P T R1a e Td Remarks(ft) (rnb) (C) %) (rob) (oC)
150 942.6 26.4 i;2 44 15.1 13.135 '4.5 2 7 2 22 44 15.3 13.8 No tur'bc noted610 920.1, 27.9 22 43 16. 2 14.2810 919. 5 27.3 22 43 15. A 13.7 Pireps strong, wind
1000 413-5 27.3 22 43 15.0 13.71510 806.5 25.8 45 14,8 12.82010 880.0 24.3 4 A 139 11.7 Pirep lev puwur rqrd2500 864.0 22,7 47 13.2 11.3000 848.0 21.2 47 11.8 0.4 Plrepl, ditto
3400 832.5 20.0 48 11,2 8,74000 817.0 18.4 48 10.2 7.25030 785.5 16.3 63 11.0 i,4 Ocnl draftn6040 75 1,0 14.1 66 10.0 1,1 c4t ilur-bc 5000 ft7070 726.5 11.3 71 9.6 0.4 Dumps, wallowy
980 014.0 26.4 32 47 16.4 4,4150 942.5 24.4 47 14.4 12.4 Turb! at 300' Obsr P.H,
0 See Legand No, 39 & 40
194

Table 13. 1 (CotilUmd)
],IIHI)TITNO. 41 14 AUCUST'I 19)56 0300 CSTI) T 0 UI1 e rd Remarks
(b) l C) (0) (1A1) Cc)
1(i, 11., 5 24 4 AD 15.0 13.0385 9:140, ./45 15.n 13.3 Gusits6 15 2 6,0 27.0 32 '43 15.4 13.4 (widl unt33,5 90.0 '2. 43 15.1 13.1 ling N
* 21115 3I (17 (. S 2.? 41 13.4 11.32615 1!;,'9i 3,9 1! 1.9 10.7 3 ling cvlls N & NE2oo I itm, i 2:1, e/ / 42 12.4 10.23030 1 4 .!) 2 2.7 22 12 11.7 0.32520 03:11.5 21.0 416 11,'D0 , 6
.025 , 15.5 2 0. / 50 11.9 9. G4500 801.0 1 f1. I 53 11.8 9.5025 7835.5 17./3 55 11.31 8.11(0,0 7".03 15.2 -" 67 13 0.4 cuiol draft7005 720.5 12.3 65 0.5 6.2 numpsLgt turbe lurnund 2000'
1015 913.1 0 I 26./ 40 13.7 11.7
175 V 23.1 22 50 14.8 12.8 Sf(-. wlr Ohr 11.11,
SFIElW TEST NO. 42 141 AUGUST 1956 0500 CSTi 0 R II . Remarks
(f (,b) ("C 3) Oib) (C)
IM)0 9,10.5[ 22.6 [52 [14.4 |12,A410 0 32. 5 23.2' 2:1 I 1 , 1 ,.01 12,0650 924. 5 6,1 22 42 14.2 12.2
840 98.01 27,0 37 13.1 11,0
1 0.20) !911.0 26;.7 :1 3 i:3.6 1 '1541 I 04.5 25.8 22 39 12.0 10.821125 078.5 9[ 3 42 12.8 20.f2525 3 (12., 5 24.0 22 3) 11.1, ".23 ' , ." 1 04(;. 6 : 5 :3.1. 4 1 1 1.11 11.5
S,,35 It33o.5 21.' 4 11.3' 3,440,15 1114, r) !131.3 4fl 20.)3 .2 LIA turiw5065 1140 '/.2 32 (4 12.'7 10,56055 7 54. 5 15.6 -- W.) I .3 19,1 Turkc71,10 727.5 1q,7 SO0 1.0 5.4 Tur)(
1000 12.5 2 5. 42 1.1,1 12.03:0 '44.5 22.3 ,'' 12., 31 ,2 Oinr . iil
if sel. l,( cl:Pd No. 41 & 42
195

Table Ia. 1 (coitlued)
F"ElID TETb NO. 43 15 AUGUJST 1950 1200 CS'
;p p 't d Rriarlia
('l) (nb) (10 ft) (mb) )_50 943.5 31.7 22 33 15.4 13.4 (Telmp aljustment tooIl'hj80 042.5 31.7 23 31 15.4 13.3 ac'ura'y L 0,3 lhim run only)
190 038.5 31.2 22 33 15.1 13.2 ilumpy380 D32.0 30.4 22 35 15.4 13.4 Drafts or'id600 924.5 20.7 22 33 1 0 12.0 Dum,820 3 17. 0 21. 12 36 14,6 12.6 Draft
l0u 010.5 28,.4 82 36 14.0 12.0 Smooth over hl1d , 'rd1510 394.0 27.4 32 37 13.3 .11.2 Draft2005 878.0 25.8 22 35 11.8 9. 5 Wallowy2515 86!.5 25.0 23 30 . 6 (.4 ;10 y301 1 845.5 23.7 22 2n '(.3 2.5 Sbiall o'ni gusts
3525 89.5 23.2 13 25 1,1 2. 14015 814,0 21.8 .- 28 1.4 2.65030 783.5 18.7 41 3.9 5.3 Itlatlvly smtooth6035 754.0 17.2 S0 '1 9 A. 147065 725.0 14.81 50 iI 'i 4.7
Diratls notuer at 1500'00 D11.5 29.1 12 35 14.3 12.3 Bouncy75 04?,5 3311 22 33 17.3 15.2
FIELDJ" 'T','T NO. 44 15 AI~flIh~T 1950 1400 cs'r
V.1 .) .... N Rif. e 'rd Remarka(1l) (11s) (CC) VV (nib) ("C)
50 942.5 34.3 2 2 29 6.6 0 Ii (Te''fmplj cli hiy adJusted,15 v41,U 04.2 21 1, 5 13.5 vqpt) t I 0.3'k, per 15 jic
180 038.0 33.11 24 29 15. 1 13.1 (1111or a glgh tenp.)310 91.0 12.8 22 20 14.3 1 't(40 (22.0 32.1 13 21) 13 ti 11.9850 915.U 31. 6 .2 29 13.11 11.5
1000 0M0 30., 22 20 12.7 In 51540 892.0 20.3 33 13,6 1.62015 871.0 27.0 33 12.4 1(.22515 800.5 20,2 22 36 12.2 9.(13025 844,0 24,4 82 1 A 11.0 ().1
3015 829.0 22.8 22 139 (.8 .I4055 812.0 21.2 9' ,
5005 72 47 2. 75COGS 75, 17. so In 0, 7,0
70170 724.0 14.0 fl" iV. 2 7 : 1 It Or 0. I'C A11hluItump)
X,' 910.5 30.9 29 13.11 111.,70 942.0 34.3 33 20 1 il.)l lilght v)'Mllaled Lbor 13,1.
0 Sut Lugend No. 43 & 4
198

Tawo'r 13.1 iContinued)
FIELD TEST NO. 45 16 AUGUST 1950 1700 csT
Z P ',0 # RI 0 T(d Remarks(ft) (nib) (0C (%) (nib) (C)
75 938.0 35.3 22 29 10,4 14.4 Fqtbumps Obsr P.H.
190 934.0 34.0 23 29 15.9 13,9 Ouil draitsId0 027.5 33.9 22, 29 15.1 13.1620 919.5 33.3 22 29 14.8 12.8 Drafht835 912.0 32.4 22 29 14.1 12.1 Drafts
1020 900,0 32.0 22 31 14.8 12.8 Wallow1525 989.0 301 31 13.3 11.2 LAct gusts2035 872.5 211,7 62 33 13.1 11.02490 857,5 27.- 1 12., 10.63025 840,5 25.0 22 35 11.7 9.3
3S26 b250 24.0 3d 11.4 8.9 Draft4025 809.5 2.5 :,: 5 10.7 fl.05045 779,5 110.7 46 10.5 '.76055 749.5 17.0 52 10.2 7.37005 721.0 14.2 61 10. 1 7.1 flrki clds 2000' above
flumpy about 12001005 906. 5 31.6 33 28 13.3 11.2 Steady run
100 937,1) 35.0 63 25 14.4 12.4 Gain 30' on travwrac;gunly
FIELD TE'' NO. 46 15 AUGUST 1956 1840 cm'l'
Zp j P T 0 1lW a Td Remarrk
(ft) (rob) ('C) () (mob) (C)
45 937.5 34.5 22 29 15.7 13.7 Bumpy flight90 9 36.0 34.0 22 25 ! b. !1.6
180 ,933.0 34.0 22 261 13.7 11.6400 025.5 13.4 63 25 13.2 11,1620 918.0 32.6 22 20 14.3 i2.3840 010.5 3 1 (.2 21) 13.4 11.3
1020 [904.5 31.2 - 29 13.1 I101500 888.5 29.8 33 13,9 11,02035 1871.0 28.1 35 134 10.42515 855.5 26. f 39 13.8 11.73025 839.5 25.0 12 30 13,1 11.0
3535 823. 5 24.4 41 12. k 10.44035 BOB(.0 22,0 41 11.4 8.0606(5 777.5 20.1 46 10.8 8.16075 749.0 17,0 55 10.9 8,2 (Cd to eld ling,7080 719.5 14A4 I11 10.2 7.3 strong Ing I'& N,
crow felt static shock1010 005.0 30.8 32 29 12.8 10.6 on final approach)
fJo 937.0 32.8 23 2'1 12.8 10.6 Sprinkling Obar J.D.
il Soo Legeind No. 45 &40
197

.;lFLD TEST' NO. .17 20 AJGUlS' 1950 1000 CST
I T j I 7 On TR Ilemarks
(21) ob) (0 C) (%) (nb) (-C)
50 953.5 15.5 55 9.0 (1.80 052.5 15. i 23 54 9.7 6.6
180 9,19,0 15.2 55 0.7 6. f l;njmp400 941.0 14.7 55 9.4 6.10,10 933.0 13.8 6i0 9.7 .5 .5 Bumps870 025.0 1.3 63 0.8 0.7
1010 920.5 127 M 9.7 3.51520 003.0 21,.0 5A 8.1 3.2025 P86.5 10.5 62 8.1 3,2535 869.5 9,1 (& 7 3.3025 854.0 8. 70 H5 4.7
3525 841.5 7.0 80 8.2 4.14025 822,A 5.0 70 0.7 1.2
5055 791,5 3.6 82 71 5.7 -0.. Lwl s(td eld at 45006055 7(12.0 1.7 71 -2,4708C 7 q?. 1.2 J0 '1 -0.0} 1l4;lIiibe( at 24fl.,0
A )01 1. o .' . ? (i4 9.7 (. 5 'urhe I.10 95-1.5 16.5 sz bi 1R 0I TO 0lmr .D.
FIELD TEST NO CIS 20 AUJGUS"T 19,56 1200 CST
P F T11 I Remarks
(m-- b-) c'rIn Cf J:' 0 |32 49 20.3 1 7.4
50. 051. i 4 .2 -1, 9.2 W,
V75 94 S 11.5 ,11 9.13 ;.H385 9 041.5 1.9 22 419 l1.0 ; 3625 933.0 16.2 51 9.5 6.34.15 !12(1 I 5 S 51 9,2 S.8
1015 92(). 15.0 53 9.2 5.8 rn,'lu16)25 3 902.5 1:.0 02 9.8 7.' Ivy hluAIw2520 870.0 10.8 t0 8.7 5.03020 854,0 0,3 77 9.2 5.8
3510 8318.5 8.0 an0 8.11 5.14030 822.0 6.5 6:1 0. 3 4.05040 79L 5 1,3 3'. 7.5 2.22 ('louI |awvr7040 7362. -9.2 - 0 6. 6 1.) 4600-5400'7075 7.12.5 -0,2 -- 5l f; -0
905 929.5 15. 1 30 !11 0.7 (.0 lurb'as 952.5 18,16 22 49 10,I 7,9 Oimr .,
See Legc d No. 47 & 48i
198

IIl i 3,1 ((,'o itl( i')
FMl) TES, T NO. 481? 21 AUlUsT 1950 0900 CsTr
,P J 'p'd llemarkn
(-I) (fnb) (C C) _ ("go (n1b) ('C) [ __r_____r, chkd
(T1 ell rl'.'I)(nso rMi v2 vhvccl)75 9,14.5 10.2 74 13.9 11.9 Ihlirny - slidenva drauil
185 9.10.5 15. 11 72 13.2 11.0L'105 133.0 15 2 75 1/.2 1.1 Ilneliyill5 925.0 1 I-! 5 79 1I.3 11,2 X.11tiilual IurIbc8130 0 91;, 5 1:;, 8 22 81 1:1.1 11,O
11)15 912 5 1:3,, 12 12.9 If) 7 I'),:-lie1595 895.5 1:3.3 28 ill) 12.4 1O 2 Ilnl'' sii n i' f 0.0C'
ill half litle20,10 1178.5 141.2 65 1O I 11.1 I ninolh l in l M 1)2520 1163 0 1,1.; 1,1 10-53010 816. 0 11.7 65 9.2 5, 0 .-1 ll ith
3540 830.5 11.3 60 8.4 4 1 (VibyexcllptonaIl, 11azo)4050 8!5.0 10.8 .17 3.7 1 0 (1Darlt to 3)
15050 14 11.739 .1 i !.Ih ! 1' i k . horizon)TO(EO 755.0 10.9 : .G 5, 1 -2,2 1
70 5 725.5 i 9.1 ,0 4.6 .-:3,4 ldrop1ltlllli'a l # Il5 0 l" 1995 913.0 14 2 4 13 ! 1 1. I1.2 195 (2 . 17., 32 l i 13. 11.: Gusts 8I)sr P, .
FIEID TEST NO. 89 lUT 9.41, I1if) C51,
,p 1) T # p; l 1 Td p lRillyrkt(ut) .. _(nib)) ° ' . .. . .f .. (nib). _ ("C) . . . . . .
75., 9113.0 20. 23 49 11.0 5 h 'V) 81 ,11ifI
C,11( D117,85 9. 1.( j 22 504 It. 9,1
3040 84,0~l 14t. i 32 750 1.3 .0 t ) K, (hiI62 5 92.5 1H.5 I 1 2 1.l 7I.6835 717.0 10. 1 !5 1.7 -,2 Ilunpy995 912.0 19.5 58 11,1 4,1 rifl
1505 895.0 16. fih~ , I ' 9.8 it stirlp [.'st-9, %vallowv
2-ffN , 11H.5 16. 1; 22 X14 (A C 9.2510 9 2.0 111.5 li12 10. '7.63040 Rl45.O 14,:! 32 70 11. 9.0 I'dl (11rjflt- fl,!l to 3500'
"!;20 f10 4,.0 60 , [,7,IO:l(. i t 8 l,0 , : (13 62 9,5 11 . 9 1? Ihlilp ariound 3800,503:0 7 8, 1 11.7 33 4, 5 -3.,5 IM I dropq aihiiiu t 0'(MlCM { 754.0 I1, .11 4,7 -31,2
7015l 7'15. 9.0 315 4A -4.81 H't /'l( ft.qili 8 0
,ql 912.o 18A,, :14 (if 12 . It , 10 7 U h'llh
H!, 943,0 11,9 49 1213 11.( Oh10r 6,l,
i, fSe ,,.I ' 1. 48P , 40
199

Tabht' 13.1 (Continued)
FIILD TEST NO. 50 21 AUGUST 1956 1400 CBT
Zp p T 7 -;i-~~ e 1 Td lRemrrks(rt) (nib) CC) M (%) (nib) (°C_
110 030.0 I26.3 23 43 14.7 12.*7185 930.5 25,6 23 43 14.1 12.1,90 929.5 25.2 :23 43 13.8 11.8650 ZI.b I 24.3 23 45 13,8 11.7150 14. 217 22 415 13.3 11.2
1020 90,.0 22.9 22 4, ,3.0 10.81530 891.0 21.3 52 (2.6 10.2045 87:3.5 19.8 22 54 12,8 10.62535 V 513.5 18.6 52 11.4 D.93055 842.0 17.8 82 36 7.4 2.6 Sharp temp drop
4045 e11.0 15., 3 1 0.7 1.
5055 o80.5 12.7 38 5.6 -1.06085 750.5 10.8 52 35 4,6 -3.47040 7 2,'. i 10A 2 2q 3.G -4-3
at 3400 tturbc101(1 908a .5 27 45 13.4 1t.2 3
IM) 0 .'; 21.t0 2 3V 11,3 11.2 Oblr J.K.
FIELD TEST NO. 51 21 AUfGUSTI 1956 1630 CST
3 0 .5. . ... .. . ... .
75 931'.0 12. 3 9 14.1 12.1 ~Ykwling in costi wind
17b 93 5.5 27.11 22 30 14.2 12.1 l)rafts, Pireps3615 V29.0 260 . 2 4!:j 14.11 120 Il On395 20. I 6.{ ?, ;J ).n 12.0 flard to hold E'l at 600615 920.5 261.4 23 42 4A 12.5 Wallows, bumps, draftsU l ,,) V141, ) 25,7 41 I 11.0 11.5 Drafts
,o1.,, 007,0 2 5. 1, - 42 13.3 11.21525 81JU.0 23.5 22 43 12.5 10.21090 8,g),1(1 21. 45 11.7 9,42320 858.0 20.4 22 46 11.2 8.6 Hard to hold wings level301e 842.0 18,8 47 1(0.2 7.3
3500 827.0 17,0 5 90 .8 Ilumpy4(015 811,0 15.4 68 12,0 9.11 icky like Ixat5030 780.5 12.9 71 10.8 8.16035 7.,0 9.9 H t l( 1) 7.0 Rocky6075 724.5 8.0 2.! 50 5.5 -1.3 It 11 ltesponse marked6500 737.8 8.4 82 9.3 5.9 In clear (IWISe at 6800')! I iI,, cl-wd tImp dIrops 21t1015 907.1 25.3 3'1)l 12.0 1 I 10.4 L
85 930.5 21. 6 14.. 12A.40 18,rPi-1
# See Lugod No. 50 & 51
200

FligI} TESi' NO. 52 24 AlIuIST 1056 1115 CST
Zl1 T!#fil '-rdla l()) b,4) CC) M (mb).... 9 - ! f10.,5 7.7 --/
115 948.0 22.3 23 38 10.3 7.4175 946.0 20 22 38 10.1 7.1385 938.5 21.4 22 30 10.0 0.9630 930,1) 20,8 22 3 0 9. 6 6.4 13umnp)825 923,5 1q. 8 44 9.6 .3
1015 917.0 19.3 42 0.5 6.21515 900. i 17.8 82 47 9.6 (.4 lrafts2010 884,0 10.{6 45 8.5 4.1b I)ruftt2535 867.0 15.2 ,17 8.2 4.0
3030 851.0 13.6 50 7.0 4 F
3535 835,0 i,2 23 47 7.1 2.1 Undultlin on traverse4030 1119.5 12.8 33 50 7.4 2.7 Siuiooth R It chaige 4500'5060 788.5 12,5 70 10.3 7.4 Shallow Ac lo S at
II6060 759.0 10 3 75; ().f 1; ' 4 Top Imaio layer
7085 9"40.0 u.! co 611, 1. 4 Cold noitd on descent.1005 7.lhllupy aro'ind 4000'1005 917.5 10.5 32 ,12 9.6 '1.4 liral, udlJrall, also
60 051)0 2;1. 1 23 15 .1 7.1 Obsr P.AL.
FIELD TESTr No. 5.9 24 AIRlIST 1956 2000 CST
Z1 ) P T rat Td f Renarksl
37~ V. 1 5.10 12. 5 32. UO O 111 (ne buuo'
391i 0 34.5 22.5 39 10.6 7. 8 Veny smvooth60 020.0 2 1. f; 39 10.1 7.836 919.5 :1.,1 '11 11.3 7.4
1015 fl13.5 20.7 41 16.1 7.1 Smooth152.0 890.5 20. 1 218 1.9 5.42020 880.0 18.6 3if 8.4 4.42520 8 (3. 5 1'.,M 41 8.1 4. 0 Minor hump3030 8.47.5 16.0 '13 7.8 3,4
3530 831.5 15.0 32 '1/ 8. 0 313 inoy hfump4035 810.0 IT.2 22 411 8,3 4.35045 785.5 13,'J 50 8.0 3.806(5 755 5 1 7. 3 43 0.2 0).2
707,9 727. 0 1.1 48 5.9 -(0.4 Alwrvi. haze
995 V 14. 0 20.1] 39 0.6 0.41115 041.5 11.4 42 10 7 8.0 CImrP.A.
See Legurd~5~ No. 52 53
201

Tahfle 13.1 (Cootl)
f IDA T'I sT NO, 54 41 24 .AUUS ni56 ,200 CSTWI- 110 C--1G 94.5 15 1 53 11.2. 8.6 Take off
160 043 19.0 47 11,2 8.A Slighttrbc370 936 20.2 4G 11.3 8. 1GIu) 02B 21.0 41 10.5 7.7820 120.5 20AI 42 10.2 7.4 "monl h990 , 15 20.5 12 10.4 7.5 Bump
2195 875,(3 1,..8 ,13 0.6 G.4
2,195 865. 9 M 1 0 45 9.5 6.23000 840.C 17.4 45 9.1 5.634 9 r 8 q!. !' i7. 0 4 111 I r,.6f
4005 817.5 i,J 45 8.4 4,45005 787.5 14.4 47 8.0 3.76030 7517 I, - 36 5.7 -1.6II 7050 728 10,3 04 8.2 4.1
'4 ( Ptrel:'s higher engine970 9it 2. 42 10.1 7.1 outid rqIrd all trakversqe.q)
1130 94' 1,b 47 10.9 8.2(3 0413,5 wu1 .-- 50 10.8 8.2 Landing Ohmr P.1l,
I .......... .....1 .. ... ... ........ ...... ..... ...... ... .......
Kz1 P T 0 Jul To Remark
/ 16.4 67 12.7 10.6 Tako off
1.15 942.5 17.1 58 11.8 0.4405 934.0 17.4 32 54 11.2 8.60)J.5 2117.0 18.7 50 11.2 81.f845 9 I0.0 19,06 46 10.8 8.,2 'rep turbeinotud below
1015 013.5 1.6 46 10.6 TS1525 8906.0 20.0 43 10,1 7.2
2000 8130.5 19 8 4 n, 10.,i 7. 112490 804.5 19.1 48 10.8 8.13020 847.5 19.2 40 11.2 R Il
3515 832 138.1 49 10.2 7.24025 810.5 17,1 52 10,2 7l Steady going5020 780 15.0 52 0.2 5.70040 756.5 '3,2 48 7.4 2.670b3 728 i1,2 41 5.5 -1,2
985 014,5 19.3 45 10.2 7,2195 041 16.4 62 12,0 I 9.7
1 ' 'b L6.L w I .1.8 9,1 Lutning b .K
Pe Rcc egund Nu. 6i4 & 5
.202

FII, LD TEST NO. 50 25 AUGUST 1956 0300 CST
.. .. ILI 1 .. .. Remarks
(it) (11b) M (C ()_ _(11) Cc(O)
II 948 16.,4 70 13.2 11.2 7nk(n off
155 9,12.5 li.0 08 12,8 10.6 L4,t turbc385 93.,5 17.2 13 12. H 10.6 14t turbe625 926.5 l'. 067 12.0 9.7855 131 .5 9.3 49 i, 1 8.
101:) 913.5 19.t, 17 10,I 8.2 PotsihIr Nei, G1515 MI.3.5 20.3 32 46 1L,0 I.4"A020 580. u 1D.03 *1 li 12s10 u64.0 19.8 49 11,23020 itl7.5 1 .8 11.0 4J '6 I ms.ql)le Ner G
I3510 832.5 18,9 49 10.8 1.3141130 810 18.4 32 48 30,3 7.45040 785.5 10.3 46 8.7 4.9 Some Igi turbcr 4An 79". 13.2 53 8.,a 4.4 Drift7055 727.5 10,? 6 8..5 4.0 Down Draft. USO hIn| I nM n
985 914.5 19.7 (!U:132 103.1 7.710b 012.5 16.2 63 12.3 1 0.6 Rough no.
r3 9,111.0 10.5 1 12.6 10.4 L.anding Obar P.11.
1
FlIlLf TIST NO. 57 25 A;;1,'4T 19136 1730 CST
291 p~ T 11 N h M Td Reomarkse(f t) (nib) c) (IV.C)
"; . 35, i 2 21 13.4 11.3
25 930,5 33.7 11. 1. 1!.4 Turbo
105 933.f 33 1 22 P9 14.6 12,6395 02 ri 5 32,.7 82 211 14.4 12.4615 19.0 32.1 22 29 13.9 11.1845 911.0 31.1 29 13.2 iI.1 T:,rb'c
I0:.5 905.5 30.5 22 29 12.; 10.415,15 888.0 22.8 30 8.4 .52035 872.0 27.6 22 34 ti,2 b.82f1351 850.4' 25.7 34 10.8 0.4,'0.10 4 1.0 2:1,0 31; 10.7 8.0
3050 824.0 22,2 F i'l 10.5 7.74040 809.0 21.'1 38 9.7 0.55070 778.0 18.2 41 1,.1 5,0(070 749.0 10-.2 40 7.3 2,57075 720.5 13.4 31 4.1 -3.0
1015 005.5 30.4 2) 12.7 10.4€0 13,8.0 33.4 29 i 4, 12.9 Obsr J.D.
See Legfznd No. 50 & 57
203

Table 13.1 (Continued)
..ELD TEST NO. 58 25 UST 1056 190
T 1111 c ' T t
00 (rilh) ("(1) (.) (mb) M(") Torip q damping checked OK
190 932. 0 31.1I 31 14.0 12.0 Smoot h410 924.0 32.2 -- 26 12.4 10.1 Anvil cld Wetw(60 9fi.0 32, 1 62 2 12.4 10. 1 Floccum overiead870 909.0 31 ? 22 923 11.11
10810 002.5 30.9 pi 2 29 12.0 10.41500 88'.0 i 29.2 29 11.8 0.4 Blulsh haze noted2055 870.0 27.6 22 29 10.8 6.02545 854 5 2;.2 20 10 7.0I 3070 837.3 i 24.9 33 10.3 7.4 Ouci vry Jg( updraft
3565 822.0 22.7 .15 .9. b,4407 5 606.5 21.2 22 11-4.3 -~ ~ji overheaad53180 776.6 18.l,4 22 35:i 7-4 2.60075 747.5 16.3 - 25 4.7 -3.2_ _ _ _
'100 718.5 13.3 29 4.4 -3.9~Floccus uver~ic~vd
1010 004.5 10.3 62 2H 12. 1 9.8 OcL bump215 931.0 30.1 1. 30 13.8 2 0.6 Oir P.1.
FIELD TMST NO. 5,9 25 AIGJU81' 10563 2230 CST
Zli I T 0 ; J T6 I(emarka(ft) (t ) ("C)I() (mb) (".)
23.P 44 13.0 1(),a
100 1935.0 26,0 3f) 13.A 11.210 D28.0 20. 3, 13.0 10.11630 020.0 ii,.2 26 11.,' 0.28.50 012.5 30.8 26 11.5 0.0
1050 900.0 30.9 26 11.5 9.11530 800.0 20.? -- 20 10,8 8.12030 073,5 28.5 - 1 21 101, '.12525 857.5 26.8 20 10.3 7.43035 041.5 25.4 20 9.2 5.7
3525 820.0 23,9 30 9.0 5. 54025 811.1 22,3 ,2 30 8.2 4.15035 780.5 10.1 22 3r 0 .0 3.6
6075 750.0 15.9 40 7.2 2.270G0 722.0 13.1 - 46 7.0 1,9
T1 lug test (1KIrk in fcw so
FL1020 007.0 30.5 26 11.4 Itl Tlgte. 614 Ii1v e170 930.0 27.1 35 13,2 111 Oomr ,1).
L-euu -- gend No. 58 & 50
204

Table IS. 1 (Contymp+d.)
FIELD TST NO. 60 27 AUGUST 10 00 0 C-_T
Zp) p T 1111 -Id Remarks
0 938.0 24,2 -0+ 2.1 9.8 Take off185 932.0 26.8 34 12,0 9.7 rurbc beilow 600 ft315 925,0 28,1 23 31 11.8 9 4625 917.0 28.8 28 1.I 8.5825 910.0 29.0 20 11,r) 9.2
1015 903.5 28.3 20 11,2 8.61515 887.0 20.0 26 10.3 7.4
,?005 871.0 :'I.9 29 10.9 832490 855.5 26.0 28 9.8 6,73025 838.5 25.3 28 9.1 5 6
3510 823,5 23.8 30 9.0 5.41030 807,.5 22,2 33 8.8 5.25020 777.5 19.1 33 7,2 2.48030 7148.5 10.1 36 6.8 1.2'7085 718.5 13.1 42 .5 0. u
IM1025 903.5 29.9 25 10,1 7.5
105 931.5 26.6 - 34 1 1.8 9b.5.D6 A 36 I 1.9 0.5 Landing Obsr J.1).
FIELD TEST NO. 61 27 AUGUST lOSS 1100 CST
Zp P T # IU V Td Rumarks
(f t) (mb) ('C) (%) (rnb) (1C)
6 934.0 32.5 23 | 3 l0 n, 10.8 Tl;kU off
go 931.0 28.7 23 33 13.2 . 11.0 flouncy
190 927.5 28.6 2: '13 1 I0 10.03M0 921.u 211.0 22 33 126 10.4 LiftG4 i 9I2.i) 2 i. .3 23 J I 1 2. 1 U.j l. 1rVH45 f i luvi ') f 71, r 1 1.2 8,7 G fe l in dia iti
1015 900.0 26.2 22 34 11.8 9.4 Dralmt1525 8us3.0 24.0 24 35 1 1.0 942030 866.5 24.0 62 32 10, 2 7 3 Aliall bulpI)
'24,04 0,1 32 10.0 7.0
304 .14.0 22. 5 - 32 ?38 5.13540 819.0 21.0 3 15 1 4,9 lItmpip with (Ir1ft8
4041 803.5 20.3 22 32 17.8 3.45045 773.5 'l 4 311 7 fl 3 1 Walhowy6050 744 5 14 7 22 47 1 i
7005 710.0 1 liI - .'o0 7.11 1.9 Not timouh
905 (000,r 26.4 33 34 11.8 1.4 ututy & driaiftsg0 031.0 2U.6 14 31 1;&.8 10.7L iii 7'1. r 11.13 I liitlig th'l,. P.1.
q spe Legend No,. 3 0 & C I
205

__..... ~Table 13. 1 (Continued)FIELD TESTNO. _2 ..... . .27 AUGST 1950 1400 CST
2) T RU Td Rlemarks(frt) (1b) (C) (O) (11b) (1C)
6 034.0 2U.9 43 17.0 15.0 Take off90 931.0 28.3 3Q 15.2 13.2 'ri-bo
180 928.0 28.3 22 36 14.0 12.0381) 921.5 27.8 36 13.6 11.6620 913.0 27.8 35 13.2 11.1810 907.0 20.0 31 11.8 9.4
1010 00.0 27.7 31 11.0 9,11505 803.5 23.4 32 32 11.0 8.42015 861,.0 25.5 30 9.0 6.82505 851.5 24.3 I2 30 9.2 5.8
8330 5 . .5 22.U 62 32 8.0 5.2 Dumps
3515 931. u 2 0 36 9.0 5.44025 3013.0 192d4 22 39 88 5.1 DUMPS0035 74.0 11.0 43 8,1 4.06045 44.5 1:3.6 49 7.7 3.27050 710.5 12.2 51 7.4 2.2
Oo0 0 DU . o 0,2L -- 30 11.4 9.7
[5 934.0 3i0.0 ,32 14.2 12.711 0 . 33 13.8 11.8
0FIE TEST NO._63 27 AUG2 ST 6 2000 CST1) l Ti T
_(_ " C ) )
vu ) ('1?,) C)
26 931. 0 25.3 31 11 9 9.6 ake~ff
195 025.0 314 33 15.2 13.2 Smooth385 [1,5 31.2 3j 15. I 13,2 Smooth830 910.0 30,0 31 11.11 11.7605 90, 30.0 33 14.2 2.2
1015 817,0 29.7 - 33 11, 0 11.81525 g0.5 . 29.2 32 33 12.8 10.4 snit~ih2020 364.5 21.8 36 12,6 10-42520 845,5 25.4 3t(1 11.6 9.23950 831.5 23.7 36 1 0.6 7.8 Slght IMP1
3540 a816.5 ?2.5 315 0.6 6.4 Smooth4055 801.0 21,.0 30 8.2 4.0
5050 771.0 18.5 33 6. _._61b010 741-5 l.0, 32 5.0 -0.4 Smooth7075 713.11 11. - 33 -.0 2.4
1105 L,97. 5 29. 32 33 13,4 11.4
6 931 U 28.7 161 5.0 Landing Obar P, l.
I Se,' .,eend No. 02 &63
206

Tleh 1:1.1 (Collflld)
F'IELD TE:T1' NO. 64 27 AUGU3'T 1950 2200 CST
P T. 0 il c 'rd Remarks(1111) Cc) ('nib) (,c)(1 931.0 20.5 69 16.6 14.0 Take off
205 924.0 30.0 33 14.0 12,0435 010.0 30.4 22 33 14.4 12.4 Very steady going670 908.5 30.0 22 31 13 2 11.2890 001.0 30.0 . 2u 12., 10.1
1035 895.0 29.7 20 12.1 9.81560 819.0 28.8 29 11.6 9.1
o2080 862.0 27.5 29 10.7 8.02575 846.0 2,.1 9" 30 10.2 7.33070 830,5 24.8 32 10.0 7.0
35A.11 gq , c 26 9.9 q H4070 800,0 2.8 2 7 7.4 2.75000 760.5 10.7 7.2 2.06080 741.0 18.8 3 5.9 .0.57105 712.5 12.6 40 5.8 -0.5
1045 8906.0 20.9 31 12.5 10.3105 924,5 2,7 24 42 1 .6 13.6S6 {931.0 25.9 43 14.4 12 4 lnmbig Obs;r J.K.
FIELD TEST NO. 65 2fj AUGUhT 150 1900 CST
21) P T # REI Q rd Remarks
(fI) (rnb) (aC) ( l (rib) "C)
6 032.0 21.5 33 10.3 7.4 TI,u off
190 925.5 20.4 22 30 10 2 7. 81110,h 0,1nl hui)Mp$:5 919,0 26.3 28 9.0 0.445 910.0 25.8 28 9.3 6.0 SunsvI 19;12 by tabl.,
1175 002.5 25.2 30 07 W .5
1045 897.0 24.7 12 1u.0 7.01530 881.0 2,1 32 9.0 3.42020 865.0 21.7 36 9.3 6.02510 8,1) 0 20.0 39 9.0 5A3010 832.5 10.6 22 ,13 ,.2 5. 8
3540 817.0 17.5 -- 46 V.2 5.840 801.5 15.8 4 B. i 5,0 "'li dallt5050 771.5 13.3 50 7 6 3.0 u(aHI;id light 1urlt16080 741.5 11.A 13 Uu ) 0.2'1105 712.0 9.4 3111 4' 7.4
.100) 898.0 24.9 32 10. 2 1 .1115 025.5 25.7 33 32 10,1 7.1 .it lurbe
(I 932.0 24.A 33 10.4 7.4 Lading; Obsr P.11.
s ee L.v,,etnr Nu. 04 & 05
207

Tablo 13,1 (Contint d)
FIELD TEST NO, 66t 29 A I I;8 T 1956 2133 CST
1 1 0 101 l Td Romarke(I) | ,,) tCC) (Vi (mb) ("C)
6 932.0 20.7 82 46 11.2 8.8 Takr- nff delay - fal tire
190 925.5 23,6 ,() 10.5 7.6400 918.5 25.8 05 32 10.5 7.8 Gust or hump601 910.5 25.7 30 10.0 7.0 Draft or bump885 902.0 25.2 -- 32 10.4 7.5
10 0 1 B o 21.,1 82 33 10.0 7.0I Z6Fl 880.0 23. 1 13 30 8. Q 4.18209 5 863.0 22.8 13 25 7.0 I M,
2555 8482. 0 . 1 " 25 6.9 I 1.2 nurl33,S] .131.0 20.,' 22 2 1" .1 (0.0
3580 6. 19.4 32 3 ,1 6.9 1.8-090 6l0. 0 13 07.00 32 3 1. R .2 I'S5080 770:5 I15. 2 3 0 6.3 0.2609F 3i2.0 12.6 32 3q 5.7 -0.8 sit turto12+?( 7 '. 5 D.9 ).9 -2.11 Sit turino
2 20 72, 1' 41 407 1. lup wo 01
430 ,, . '.5 24. 5 32 10.0 7.o05 925.0 24.9 12 U I i .5 S1011 turbIA ; f2P 38 10.2 7.2 t .a n~lhg 0)8r 1. 1I.
msI. 'rT NO. (32 .10 ATIfilh;" 7.511 0020 (
zlp 1 T # Ju I , T d Rumarks(it) (III b) C°C) M% (110b) V"C)
6 9_2.01.. 7 -i 4 0 5 8,. .. ... .. .. .... .... .. ..
220 924.5 21.7 41 10.7 8. 0 flui5 Iolow 300 At430 9.11.5 24.6 25 if 11.0 H. ,t Sghtlh hrbw670 90D,6f 24.6 I 82 3l5 10., 8.I,2
8400 902.5 1." 7 I2 37 10.2 1.2 mloithit
1080 7.10 0 23 2 82 36o 10.,4 7.4157o 871, . 21, 6 4 0 , .U u. 62075 603.5 2 i, V 42 I . 5 7.112545 R 4 0.5 26,53 .9 A.53065 832.0 20.0 22 29 1 H I 1.4
2565 h 16,.5 19. fl :J2 75 ! 7 - 1.} 0 i.11l1 SW40mf5 8 () 1).,' MB 4 J2 M1,l 1 , -(1.2 i'IIrvp!1 tilt turlw..50115i 771 .0' 15. 2 ,1 r, f.2 0.0 Sll 111ll,11vG090 74I, 1. <5 12. 6.l 1! 0 4 -l.(671 ih I ti '1 " i 40J , 11 2. !4, Toll' i' 'l . '
IU'i 0 1197.1) 23. ' i I1 '1.7 U. 3
225' 9' 1. ! 22. 1 iU2 ,ii, , ..I 7. 5 ]h1 .,m"1 ;11 2 liuml,..
.Sf', LegvIl No. 08 i. 67
208

F Ii:1rEST NO. 63 30 A 0G!i.' J;ihW.k 0230 CUT
p T ( I1 Remarks(1) (mb C)
0 9 .0 21.6 22 43 11.2 8. 'Tke off Ohm P.H.
200 024.5 22.0 04 3D 10,8 8.1 Ilump not turbo420 9017. 0 23.4 14 a. G W.3 7.A675 908.0 23.8 24 35 10 7.6 'rurlbe880 002.0 JM. 12 320
E050 896 0 23 2 32 9. 1 5. f; "'uribe draft1540 879- . 2 22 32 P, ' 5.020,0 ;t(3.5 22.2 21 7 7 3.2 1.(,' [ ump2525 848.0 22.6 32 25 G. V i u304, 0J31.16 21.4 6 2 ! 2,: .1 10 aIW 1,,,wy
3505 815.5 2.0.2 -- 25 5.) -0.44055 800.5 1U.0 12 26 1 .i 0 4 1Pi'el. rucky5085 7'0.5 10.0 22 28 5.2 -2.0 fDown drift at 45006075 741.0 i3.2 33 .0 -2.37 !00 712 3 10.1I 36i 4.5F -3.8 u l(
( ;tl I in au et((:li10.0 807.0 2.0 23 2., 8 5.0 |I'Poivy20 924.0 25. 6 82 3H{ 11,10 11 4 Down\V draftl M= 250'00 931. 24.1 35 10.6 7.8 IvMlld wid ; hl t nc'uriLr.d.
' I ~ ~it ;ibmizl 2 mih'wi 2 v'yc'hs i I"CI | ,"j, c'vlr ,(- t 725", ly.1,haft
3t., qjg nd No, (O
209

GEOPHYSICA1, IIFS1EARII PAPE~RS
Mi. 1. !sctrnpltc and Non-Isotropic Turbulcrnce in the Atxioo.pleric Suiflce Layer, heinz Lettau, (eo-physics Ilegenreli Iirectrate,IDevurnber 1919.
No. 2. Pi1Iuctjve fladiuation 'Icnperolures of the (Ionowphere over, Nf-w Mexico, Adel, Gcophya4;..il-f, Decembier 1949.
N:. 3. Oiffactin Effects in the Propagatioun of Coressional Waves: in the Atmosphere, Norm:n A.
No 4 voluation ofResults of Joint Air Fo,'ce-Wouthor Buireau (loud Seeding Triais Condueted
No. . Ivesigaionof Sraophee Wn;I andTemeraitrw PnniAvoustira! Propagation Studir.:,
No. A ouldFeuaWaeinFotnfeFPrsMEwnA. P. Crary, S. Katz, and J.
No .Proceedings of tlir Cnfere'nce on lonosiphiorr flteenrch (J)lne 1949), edited by ilradfiid BI.Uinderh~ill and Ral!ph J. Donaldminn, .Jr., (leophyicii Ilemportt D~irectorte, D~ecem~ber 1950.
N (. P. l'rovredingis of the Col Inquitinior, Oll etnsplwric Phymicn, rdited by N. C, r;Praon, G;enphyihRIesearch lDireczoiIte, July' 1951.
No. Q. The 1) i perpsion of Surfiut- WulVVP Ont Nulti.! diyereil kleifli, Normnun A, Hlakell, (.enplyswaIlmoercl; lDirectivatt, August 1951.
No. 10. The Mrtaiuroenn of Strtopheric' lDoniaiy lDimirilutinn with the Searcllight Technique, .lIterinnn, Geopliv-icH lirmonrcb Dijrectorate, Di).embnhr 1951.
No. 1 1. Pro,-ernldinigs of thi C' ;on tereui we on Innorliphe ic PhI~ym i. (.Jul y 1950) Ponur A, edited by N, .I. CGerslon and 1la1phi J. Ionnnldmrn, Jr., G.eophysics Rneearch lDirnctorato, April 19,52.
N.. I P routtolingm of tie Cioriferoince nil Inoiiphof"rii hvir (.1i!Y I 050) I 't Ii l y l UdwiAKngz andi N. C. Gersoin, Geophymicae Binarch D~irectorate, April 1952.
N o. 11. l'rnei-iogoo.'f the (olloquha ore,o Microwatve Nlutrnhology, Anrosol. nvl Cindi I'Iysilc, edlitedhy lhiilph 1. Donnhliaron, Jr., Genjikysicse flnelrch lirectormte, Maiy 1952.
No, 14. At rn ii r ic low I 'mtri ratnil Thei Ili rrea niut ion by Spherical Surfae IHarmvon ics, it.1 lu r-
wit-i uni H1ichard A. Craig, Geoplyslcm flemenrch D~irectorate, July 1952.
No, I.I. livit-inttring of Kk:rrtingnr.tic Wn'.ea Frorn Spheresi ,nif Sphrricai Sheik5 , A. 1-. Aden,
Geophliiq liuiaeuarch lDlretogi, Jul y 10'52.
Nio, I 0. No tv~ onl the, Theory Of I Argr, -Se lb at M rhomc rin A tivo heic PlVow With 'ApplIic utiw urn
Nuriviil Wrfthnr Prediction, Pi'llip fluncitu Thrpilnn, Major, I1. S. Air Fore, tovophynivslti a- r i I ii LtlIftr', f1ully .1952.

CiEzPHIIC~AL, i1F;.'*Af1u PAlbEIC' ((Coutinued)
No, 17. Tht, ( ..,Aavn!4 Miean Field of Motion of the Attrimiphere, Y11l0 Mingt. 4aud Gor'don 1)'nm,(eophyiillenrt L 15irtotaLe, A'jgudt 1952,
No 18. T1he Distribution of 11ndletionsl l'norpernstiore Chongo lia the Northern lHemisphere During March,Jullu~t landoo, ( ophyaicim Himearch Directrate, December 1952.
No. 19U. Intomnat.ail Synspoim on Atmosplheric Tublulence in the iloundnry I .ayer. Ninaisichusetim Ifnoti.tute of TIenninv loy, 4-14 .)rc 19'11, ed"Itoj by E'. W. iuewson, Geophysir" limealrcL lWrectiirute,lnct~imbrr 19,12.
No. 20. "1~ the I~eomr of the Colored Stin, Koaeiolly the ''Illue'' Sun of September 1950, IlsidohIPe1rind~ilrr, (;tiophyCsir" lfemetttch D irectoraatm. April 19153.
No. 21. Absorption Coefficients (if Several Atmopwsrii' Gav.em, K. Wntulluba, Mw-nay Zelikoif and EdXwardC. Y. Ian. G~eophysics Hoioearcb Dinatoeaa., Jose 1963.
No. 22, Afsymptotic Apprniminn for the Elasatic Nonaa,.1 Mudn in aStratified Solid Medium, Norman A.Ilkankell, Cecajihymjrmi firpearch Di~oofat:. Agmt I' W. Fne .I.UgesadI.
No, 23. Forecastinlg lleilationuhippi imtwrlin Uipper L evel Flow andi Su~rfae Meteoirologicul Pcocomiuen,J .George, If 0 ochen, 11. .Vace,1.J at,1.W uk.CI.Bgem dI.M
Wiin g, G h ." I'Nequmr'h MM10ttt, Ali~mit 1 9,L,1
Nn. 24. Ciontrlbutlojiv to thre Study Mf llonetry Atn'ospherle Cireulations, edited by Rlobert MI. White,Grophymic,4 lisacuirch fDirectorno". Novembear V493.
No, 25. T61, Vertical Lh gibsiiion of Mie Panrticleri in the Troposphere, It. Perindorf, Geophysicig Rie-mearvh Ilireretorate, Kircli 1954.
No. ..,6. Study of Atnopherle eImn in a Ncnequilibriun System, C. G. Storgiii, Ueophymics IlesenrchDirectorate, Apvil 1%,,I.
No. 27. liavesi,iin -of Nicroliarometrip. Uicillm,mon in Eamtcrn Massuchu.01tow, V.. A. lurnaud, A, 11.Men,,,, F. A. Crowley, Jr., iind A. 1'. Crary, (;eopliysica Rlesearch D~irectorate, May 1954.
~~o. 28. P.h 'l.ni,~ 'ra~n Spimtrt. 1! Aniioaia in the (P- and Wt-Micron HaieonN, It. G. flrtenc, Jr.,Capt., IMAF. GeolphYsii' Roiroercht Dlrctorztc, juailt 19.14.
No. 20. Seneorosi 'l'ren'l of Temperature, lDen',6ov, and Preximure in the Stratosphere Obtained Witha dirSc,,, h i ilza 1,,,iii, T echIn ifli, L u u is.i' oan is, J1uly a94
Nei. 30. lProee,,dings of the conference an Auroiral P~hysics, edited by N. C. Germon, Geophymics Ile-fpOail DsIirectorate, JulY 1954.
No. 3 1. Fog Modification by (Cold.Wataa Sording, Vernon G. H'ank~. Geophysics Rlesearch D~irectorate,August 1954k

GFO!IIYSCA. , RESEARCH PA.PERS kCnntinu,.',J
No. 32. Adsorption Sta u: b.b.-mrogseeou Phase Treceitiions, S. J. B. B,.tein, Geophysics He-vlurchDirectorate. December 1954.
No. 33. The LAtituinal and Senanal Vatiations of the Absorption ol Solar Radiation by "Ozo.e,j. Pressman, Geophysics Research Dimetnrato, December 195
No. 34. Synoptic Analysis of Convection in a Rotating Cylinder, D. Fu,tz a,.d J. Corn, Geopysl,,-Research Directorate, January 1955.
No. 35. Balance Requirements of the General Circulation, V. P. Starr a. d It. 'I. White, GeopiV,4.ic:Research Directorate, December 1954.
No. 36. The Mean w 4 rcular Weight of the Upper Atmosphere, Farrrn F. Thom- &on, %,eophy.ics lit -search Directorate, Nky 1955.
No. 37. Proceedings on the Conference on Interfacial Phenomena and Nuc leatior.I. Conferen .e on Nucleation.
I. Conferere on Nuc-lea-;on an,! Surface Tension.Il. Conference on Adsorption.
Edited by If. Reims, Geophysics lesearch D)irectorAte, July 195;.
No. 38. The Soability of a Sim -.: -.' -!it, !,:on Zht." . ... e - 'ihnki .ikeophvs1c.Research Directorate, T. lv l95,5.
No. 39. The Chemistry.and V.rticnl Distribution of ar , d.. .,Miller, Geophysics Re, darch Direct.,rate, A-rii 1955.
No. 40. Near Infrared Transmirsion T, :r gh Synthetic .%tmospt. eres, { \. lloird,Geophysics Re_%-search Directorate, Novi-,tr .
No. 41. The Shift and Shape ,; Spe.. sl Lines, I. G. reene, Ceo 'eics I{c curi-h Directorate,October 1955.
No. 42. Proceedings on the Con'-¢en-.- ,n Amospheric Klectricit%, W. er, W. Smith. CophysicsResearch Directorate, [I%'enriie- 1,9-i.
Nf., 43. Methods and Results of llpne,, ktmosph,.ric lesearch, J. Kapl, :3chilling, If. K c n1a.,Geophysics Research D ;',ctur:,,", Nc; -!mber 195S.
No. ",4. Luminous and Spectral ' .!lerto e as Well as Color.. -f Natural Obje,-ts, It. Prnndof, Geophysics lesearch Direct. .te, rarv ]91956.
No. 45. New Tables of Mie Scatt.ing F nictions for Spherical Particles, it. !'cnndorf, It. Goldberg,Geophysics Research Dir.-r.tc March 1056.
No. 46. Results of Numerica; Foe .. v,& ,g With the arotrnpic and Thermot.opic Modeis, W. Gats1..L. S. Pocinki, C. F. Jenki ,, .; ophysics Ilesearch Directorate, Aptil t956.
Best Available Copy
Copyright © 2022 FDOKUMEN