Assessment of the irrigation performance of transferred schemes in Turkey: a case study analysis

This is one of 126 contributing papers to the World Commission on Dams. It reflects solely the views of its authors. The views, conclusions, and recommendations are not intended to represent the views of the Commission. The views of the Commission are laid out in the Commission's final report "Dams and Development: A New Framework for Decision-Making".
Contributing Paper
Assessment of Irrigation in India
Himanshu Thakkar South Asia Network on Dams, Rivers and People,
India
Prepared for Thematic Review IV.2: Assessment of Irrigation Options
For further information see http://www.dams.org/

World Commission on DamsThematic Review: Assessment of Irrigation Options in India, Draft #1, Date: 08/11/1999
This is a draft working paper of the World Commission on Dams. It was prepared for the commission as part of its informationgathering activity. The views, conclusions and recommendations are not intended to represent the views of the Commission.
1
1. IntroductionIrrigation has acquired increasing importance in agriculture the world over. From just 8 million hectares(M Ha) in 1800, irrigated area across the world increased five fold to 40 Million Hectares (M Ha) (13.4 MHa in India) in 1900, to 100 M Ha in 1950 and to just over 255 M Ha in 1995. With almost one fifth ofthat area (50.1 M Ha net irrigated area), India has the highest irrigated land in the world today (Postel,1999: 40-42). 1
During the last two decades, irrigation�s steady boom has begun to wane. Between 1970 and 1982, globalirrigated area grew at an average rate of 2% per year. But between 1982 and 1994, this rate dropped to anannual rate of 1.3%. Even by optimistic estimates, the global irrigation base is unlikely to grow faster than0.6% a year over the next 25 years. (Postel, 1999: 60) Since 1980, per capita irrigated area has declined,leading to stagnation in per capita cereal production, and thus adding a new dimension to world foodsecurity (Gulati, 1999: 2-1).
1.1 The need for Irrigation Options Assessment
1.1.1 Why and What Kind of Irrigation is Practised
India�s irrigation development this century, and particularly after independence, has seen large number oflarge storage based systems, all by the government effort and money. However, in pre British period inIndia, there were practically no large reservoir projects in India. Even in British period, a few storagestructures were built only in the beginning of this century. Post independence India, however, has seenmore than 60% of irrigation budgets going for Major and Medium (M & M) projects. 2
In contrast, both China and Japan, who also have seen large increase in irrigated area in this century, havehad a long and sustained tradition of water conservancy development through local effort. The projectsrequire beneficiaries to contribute labour and materials for construction even when the government takesup the projects. Large projects account for only a fraction of total effort that has gone into thedevelopment of irrigation. In China, during the mid fifties, surface irrigation accounted for over 80% ofthe irrigated area, over 90% of it consisting of local systems like farm ponds, weirs, small ditches andaqueducts. Similarly, Japanese irrigation systems are large in number and their average size is small.There is hardly any system serving more than 20,000 Ha (Vaidyanathan, 1999: 12-14).
What determines the type of projects that are undertaken is thus very important.⇒ What is necessary for agricultural development is determined by agro - climatic conditions. But evenwithin a given set of agro climatic conditions, there could be more than one option. For example, asPunjab Agricultural University (PAU) recommends, in stead of predominantly paddy wheat cycleprevalent in Punjab, Maize wheat or Groundnut wheat would be more desirable cropping patterns.However, the price - procurement support of the government has overwhelmingly supported paddy wheatcropping pattern, not the optimum or sustainable or even equitable cropping pattern. Different croppingpatterns dictate different kinds of water needs hence different kinds of irrigation projects.⇒ What is feasible is conditioned by topography, geology, hydrology and the state of the art in hydraulicengineering. However, the available topography, ecology, geology, hydrology may offer a number ofoptions.⇒ What is selected from feasible options is decided by political economy, more than anything else.
India, with a geographical area of 3.3 million square Kilometres (Km), experiences extremes of climate.Annual average rainfall in the country is of the order of 1170 mm, which is equivalent to nearly 4000

World Commission on DamsThematic Review: Assessment of Irrigation Options in India, Draft #1, Date: 08/11/1999
This is a draft working paper of the World Commission on Dams. It was prepared for the commission as part of its informationgathering activity. The views, conclusions and recommendations are not intended to represent the views of the Commission.
2
cubic Km of water. However, the rainfall varies from 100 mm in Western Rajasthan to over 8000 mm atCherrapunji in Meghalaya, considered wettest spot on earth. (Gulati 1999: 2-3)
It is suggested (for example, by Vaidyanathan 1999: 16-18) that the reason large storage based system aredominantly appropriate in Indian conditions is due to the prevalent climatic conditions in which exceptthe four monsoon months, for the rest of the year, Evapo - Transpiration needs are higher than rainfall.Hence to make the rainwater available across the year, it is important to store it to make it available forrest of the eight, non - monsoon months.
This is too simplistic an explanation, of course. The conditions across India are different evenclimatically. The above description of Indian climate does not apply uniformly across India. Also, climatealone does not decide the appropriate water technology. Hydrology, geology, topography also areimportant factors that are equally important. BC ratio is offered as a tool, but since what criteria is usedand what costs are included and for whose benefit the project is constructed are factors that are decided bythe decision makers, it cannot be considered an objective tool in the present circumstances. Thus morethan anything else, it is the decision making process and its implicit and explicit biases that decide whatkind of irrigation projects are taken up. The level of technology development can only help expand theavailable options.
Indian state has taken over total responsibility of planning, decision - making, finance, construction,operation and maintenance of existing and future irrigation projects of practically all sizes. To put it inmost charitable way, propensity to use these projects for receiving and widening electoral support hasgreatly aggravated the decision making process for optimal, appropriate, sustainable, cost effective andequitable irrigation projects. Taking all these factors into account for assessing out of available irrigationoptions is thus essential.
1.1.2 Indian Irrigation Scene
Almost all reviews of India�s irrigation sectors start with words to this effect:
�India�s irrigated agriculture sector has been fundamental to India�s economic development andpoverty alleviation. Some 28% of India�s Gross Domestic Product (GDP) and 67% of employment isbased on agriculture. Agriculture is the primary source of livelihood in rural areas, which account for75% of India�s population and 80% of its poor. And, in turn, irrigation is the base for about 56%,possibly more of total agricultural output. The rapid expansion of irrigation and drainageinfrastructure has been one of India�s major achievements. From 1951 to 1997, gross irrigated area(GIA) (includes double cropping) expanded four - fold, from 23 M Ha to 90 M Ha�.. Increase inirrigation intensity has contributed to the growth in the overall cropping intensity, which increasedfrom 111.07% in 1950-51 to 131.19% in 1993-94. As a result, India has moved from the spectre andactuality of food imports and periodic famines to self sufficiency since the early 1970s, food exportsand progressively more diversified production� (See for example, GOI, 1999: 476; World Bank,1998: i).
The reviews that start with these words go on to make projections for future populations, future demandsof food and water. The reviews do describe some problems with the existing policies, practices and stateof resources. But they invariably conclude that the only way to meet future projected needs is to createmore huge Storages, to transfer water from projected water surplus to projected water deficit basins, inaddition to paying lip service to the issue of productivity increase from existing irrigation (World Bank,1998: 8).

World Commission on DamsThematic Review: Assessment of Irrigation Options in India, Draft #1, Date: 08/11/1999
This is a draft working paper of the World Commission on Dams. It was prepared for the commission as part of its informationgathering activity. The views, conclusions and recommendations are not intended to represent the views of the Commission.
3
While the intentions of trying to meet the future needs is unexceptionable, the problem starts when thesolutions are predetermined and not based on any analysis of past experience.
Irrigation in a tropical, developing country like India has been practised over centuries. Here it needs tobe noted that irrigation does not just mean large-scale storage and transfer of water over long distances, asit has come to mean for engineer - dominated vision and works of our times. A storage and transferdominated perspective also neglects the crucial parts of irrigation, namely actual users and dynamics ofsociety, soil characteristics and cropping practices. The issue is provision of required water to requiredcrops at optimum times in cropped areas. This does not necessarily mean transferring water over largedistances. The process of irrigation is not only the transfer of water, but also the construction ofstructures, which store, harvest or hinder the natural flow of water. Any human intervention in the naturalhydrological flow for the purpose of providing water to the soil or the plan for crop production has to beincluded in the definition of irrigation (Singh, 1997: 7-8).
The water resource potential of the country, which occurs as a natural runoff in the rivers is 1869, BCMas per the latest CWC (1996) estimates. Of this, only 1122 cubic Km is utilisable. Over 90 % of annualrunoff in peninsular rivers and over 80% of the annual runoff in Himalayan rivers occur during fourmonsoon months of June to September.
1.2 Emerging Challenges
The most important challenge that most reviews of India�s irrigation and agricultural scene put forward isthat of exploding population. India�s current population of about 990 million is expected to stabilise atsome stage. The projected peak is 1700 million as per the World Bank. The question that asked is, canIndia support that kind of population? The important subsidiary question that is generally not asked is,what needs of such population are to be satisfied and what are the options?
Interestingly, FAO study of carrying capacities of the countries concluded in 1983 that assuming lowlevels of inputs (low yielding varieties, low chemical inputs, no long term soil conservation measures,declining soil productivity and high labour and low energy intensity) India can support 1038 million.Similarly, assuming medium level of inputs, India can support 1800 million and assuming high level ofinputs, India can support 2621 million population (Chopra et al, 1991: 128-9). While some of theseprojections, particularly the last one can be questioned, the important point to note is that we need torealise the capacity of soil and water to support if managed properly. The operative word is of course thelast one: properly. What are proper management practices and what options we have? That is the questionwe will try to examine in this paper.
The official response to this challenge is in terms of more of the means used in the past: More irrigation,more storages, inter - basin transfer of water when Major dam sites in a basin are exhausted, more HighYielding Varieties (HYV) seeds, more fertilisers, more pesticides and so on. But there is not attempt tosee if it is possible to go on this path and what would be the consequences if that path is followed. It isalso not asked if this path is appropriate looking at our social, economic, climatic, hydro - geologic andenvironmental situation.
The major challenge Govt. of India has set itself is to meet the Ninth Plan target of 4.5% growth rate perannum for agriculture to successfully meet domestic demand and take advantage of export opportunities,as against the historical growth rate of 3%. (GOI, 1999: 477; World Bank, 1998: 8) This has to beachieved in the face of overall land resource base of agriculture declining, partly due to land degradationand partly due to shift of farm lands to non farm uses. The area devoted to rainfed agriculture is actuallydeclining. The per capita arable land and irrigation water resources are also declining, in addition, biotic

World Commission on DamsThematic Review: Assessment of Irrigation Options in India, Draft #1, Date: 08/11/1999
This is a draft working paper of the World Commission on Dams. It was prepared for the commission as part of its informationgathering activity. The views, conclusions and recommendations are not intended to represent the views of the Commission.
4
and abiotic stresses are expanding. In Global terms, India already has 16% of the human population, 15%of farm animal population, 2% of the geographical area, 1% of rainfall, 0.5% of forests and 0.5% ofgrazing land. Malthusian prophesies may have been proved wrong but it is notable that India at 990million today has more population than the world at 980 M Had when Malthus made his famousprophesies in 1798.
The largest increase in Irrigated area across the world in next few years is expected in India, with 17.3 MHa, as public investment in irrigation has remained relatively strong and private investment ingroundwater has been rapid. However, even in India, the projected 1995 to 2020 rate of growth inirrigated area of 1.2 % per year is well below the rate of 2.0 % per year during 1982-93. (Gulati, 1999: 2-2) Even India, as we will see, the per annum increase in canal irrigated areas is rapidly falling.
The most severe problem facing Indian canal irrigation is not so much the slow down in its growth, butthe rapid deterioration of systems that have already been created. Maintenance is being woefullyneglected, leading to poor capacity utilisation, rising incidence of water logging and salinity and lowerwater use efficiency (WUE). On the whole large canal based irrigation is threatening to becomeunsustainable physically, environmentally as well as financially. (Gulati, 1-2)
Various projections for future water demands have been made. National Commission for Integrated WaterResources Development Plan appointed by the GOI in 1996 has made projections (see Table 1) for futurewater demands for irrigation.
Table 1.Future Water Demand Projections
(Billion Cubic Meters: BCM)Scenarios Year 2010 Year 2025 Year 2050Low 489 619 830Medium 536 688 1008High 556 734 1191
Source: GOI, 1999b: 8-9
Note: 1. Low, Medium and High Scenarios represent Low, Medium and Medium population projects and 4, 4.5 and5% growth rates in expenditure.2. Figures above should be compared with the total average utilisable water resources of 1086 BCM per annum. In1990, availability level was 520 BCM per annum.
In the chapter on �Optimism for meeting challenges� the Planning Commission states that it should befeasible to produce foodgrains at lease at a level of 3 tonnes per Ha from a GIA of 60 M Ha, 1.5 to 2tonnes per Ha from 20 M Ha of assured rainfall area and 1.25 to 1.5 tonnes per Ha from 25 M Ha ofmoderately dependable rainfall area. Thus a total of about 105 M Ha of land should suffice to yield 235 to250 million tonnes (MT) of foodgrains (Sharma, 1997: 64-65).
India�s ultimate irrigation development potential till recently was estimated at 113.5 M ha. This hasrecently been upgraded to 139.9 M ha, comprising of 58.46 M Ha through M & M irrigation and 81.43 MHa from minor irrigation (17.38 M Ha from surface water and 64.05 M Ha from groundwater, up from 15M Ha and 40 M Ha respectively, as assessed earlier). With creation of irrigation potential of 89.56 M Haby 1996-97, India has the largest irrigated area among all the countries in the world. The major increasehas been made in potential due to groundwater irrigation development and also due to minor surfacepotential (GOI, 1999: 477). One reason for the compulsion to raise the UIP due to minor irrigation could

World Commission on DamsThematic Review: Assessment of Irrigation Options in India, Draft #1, Date: 08/11/1999
This is a draft working paper of the World Commission on Dams. It was prepared for the commission as part of its informationgathering activity. The views, conclusions and recommendations are not intended to represent the views of the Commission.
5
be that the minor irrigation potential was expected to go upto 61 M Ha by 1997 as against the UIP fromminor systems at 55 M Ha projected till then (Dhawan, 1993: 50).
Table 2 gives region - wise figures of ultimate irrigation potential (UIP) as % of cultivable area andcreated potential as % of UIP. It is clear that irrigation development is below national level in all regionsexcept the Northern one, where it has reached over 95%.
Statewise achievement of irrigation potential achieved by the end of Eighth Plan is given in Annexure 6.
However many researchers have questioned the UIP estimates. Seasonal imbalance in flow of rivers,geographic incongruity between regions with undeveloped water potential and those with irrigable lands;increasing competition for land and water from non irrigation sector, and possible over - assessment dueto non - conjunctive assessment of surface and groundwater are some of the factors leading to suchprobable overassessment (World Bank, 1998: 9). The inter - linked nature of groundwater and surfacewater is not recognised in India. Exploitation of one affects the potential development of the other, yeteach is measured independently (World Bank, 1991a: 15).
Table 2.Region � Wise Figures of UIP
Region States UIP as % ofcultivable area
Created potentialas % of UIP
Eastern Bihar, Orissa, Sikkim, West Bengal 116.6 53.24North Eastern Arunachal Pradesh, Assam,
Manipur, Meghalaya, Mizoram,Nagaland, Tripura
66.97 28.65
Northern Haryana, HP, J&K, Punjab,Rajasthan, UP
84.81 95.32
Southern AP, Karnataka, TN, Kerala 64.37 54.59Western Goa, Gujarat, MP, Maharashtra 58.58 39.95India 64Source: GOI, 1999: 491-92
There are some problems with the enhanced UIP estimates also. For example, the ultimate minorirrigation potential as per these enhanced UIP was 19.2 M Ha in UP. However, the Eighth plan projectedthat by 1997, minor irrigation potential of 22.2 M Ha was to be created in UP (Dhawan, 1993: 49-50).
The figures routinely trotted out for UIP are also questionable, as they are not based on any river basinwide planning or survey. Comprehensive planning on river basin level has not been done in case of anyriver basin in India. Most of the time what is passed out as river basin wide planning in India is really acollection of few large projects, whose sites are first identified on the basis of suitable dam sites, alongwith a few other projects thrown in the name of minor projects. In reality, what is passed off as minor hasactually become MAJOR irrigation source in India today, as is evident from tables in Annexure 2 & 3. Allthe various estimates of UIP, thus are ad hoc figures based on sites identified for various sizes of damsand similar ad hoc estimates of groundwater development potential based on water balance formula.
Having exhausted large proportion of the available large dam sites, the government now also talks aboutinter - basin transfer of water from �surplus� to �deficit� basins. It is estimated that an additional 35 M Hacan be brought under irrigation through such measures (GOI, 1999: 492). To talk about inter - basin

World Commission on DamsThematic Review: Assessment of Irrigation Options in India, Draft #1, Date: 08/11/1999
This is a draft working paper of the World Commission on Dams. It was prepared for the commission as part of its informationgathering activity. The views, conclusions and recommendations are not intended to represent the views of the Commission.
6
transfers is indeed a mockery of planning process when comprehensive river basin plan has not beenprepared for a single basin.
When faced with increasing challenges of ills affected large projects based irrigation strategies, thedefence of the Indian dam supporters is focussed around a single out of some 3303 odd dams constructedsince Independence. That dam, Bhakhra along with Nangal and Pong is supposed to have beenresponsible for the food production rise, for the green revolution (GR). But does that mean that rest of the3300 dams were not justifiable? The pro dam lobby has shied away from putting forward economy wideevidence (Dhawan, 1993: 77).
1.3 Emerging Perspectives
Looking at the policy and practices of water resources development in India and even elsewhere, over lastfive decades and more, it is clear that there is need for a more holistic perspective. We have seenengineers - bureaucrats - politicians taking more of the decisions, in which not only people have very littlesay, but other disciplines have little say.3 Agriculturists or soil scientists rarely have part in decisionmaking process about irrigation projects. Sociologist role is to only talk about issues around displacementand rehabilitation, that role has also got some place only in recent years, Environmentalists have only tobother about environmental issues, economists tend to deal only with money matters in which social andenvironmental issues have little place. The issue of political economy has of course the least of the place.Skills in basin planning, hydrology, water management, financial planning, O & M institutions andsustainable development issues are totally lacking in irrigation departments (World Bank, 1998: 5). Andpeople, in whose name the projects are pushed, justified and constructed, have no place at all.
Secondly, the performance and experience of such projects almost never inform the decisions about damsin the past. In fact, for no project in India, has there been comprehensive post facto evaluation done to seewhat has been the costs, benefits and impacts of these project as projected before the dams wereconstructed and what were the actual costs, benefits and impacts and how these were distributed.
Thirdly there is no options assessment process about the projects. The usual decision making processabout dams in India involves first looking for sites for large dams then projecting what kind of benefitscan be obtained from such projects, then pushing these projects for these projected benefits. No optionsassessment is done and if ever the question is raised, the decision-makers get away with bland answer ofTINA: There Is No Alternative. Since no one is accountable for the statements they make, they get awaywith them.
That brings us to the third issue of accountability. There is absolutely no accountability about the projectsand their performance.
These are a few of the reasons as to how we reached where we are today. Before looking for options forfuture, a rational step would be to see how we reached where we are today. If we do not do that, there islittle scope or hope for better future.
An issue of special significance is that of hydraulic rights or water rights. In India, generally those whoown the land gets all the benefits related to irrigation. The surface irrigation is provided to all the land thatmay be commanded by the scheme, irrespective of who owns how much of it. State pays all the expenses.The issue of betterment levy, that exists on paper remains only on paper. As far as groundwater isconcerned, similarly, those who own the land and access to necessary capital own the groundwater too.The situation here is worst in the sense that they not only use groundwater that may be due to them, butthey may use as much as it pleases them to use, depriving the neighbouring poorer farmers who may not

World Commission on DamsThematic Review: Assessment of Irrigation Options in India, Draft #1, Date: 08/11/1999
This is a draft working paper of the World Commission on Dams. It was prepared for the commission as part of its informationgathering activity. The views, conclusions and recommendations are not intended to represent the views of the Commission.
7
have the means of going deep. No effective groundwater regulation exists. In the process, irrigation on thewhole has become a process through rich (large landholders) invariably get richer. Irrigation that nowexists thus has only increased the existing inequities.
However, this need not necessarily be so. There have been a few experiments in India in this regard wherewater rights were given irrespective of land holdings, thus creating a force for equitable development instead of a force to increase inequities. Pani Panchayat, Sukhomajri and Baliraja are a few such examples(Singh, 1997).
Whenever the issue of alternatives is raised, the question is asked, could the alternatives producecomparable results? The problem with this question is that the answer will have to be hypothetical. Thepossible alternative path was never taken. So it is difficult to illustrate what would have been possible hadan alternative path been taken. It was not taken even for those regions where M & M projects were nevergoing to be real. So we have to rely on stray examples and projections to illustrate what could have beenachieved had we taken an alternative path.
Along with the claimed benefits mentioned above have come some real problems, which we go into inchapter three. There we also go into the claims made on account of irrigation benefits from M & Mprojects.
There are some nightmares that Indian decision-makers have refused to take into considerations. One ofthem is that unlike the propaganda and belief that dams are forever, it is now increasingly realised thatdams have limited life. Dams are getting silted up, Canals are getting silted up, the mismanagement andlack of attention is leading to destruction of created irrigation potential, in addition to the nightmare ofwaterlogging and salinisation.4 When these nightmares start hurting badly, the consequences would bequite serious for the nation and people.
In a social situation where issues of equity and ecology (also an equity issue for future generations) are ofparamount importance, different irrigation systems have to be looked at to see which are suitable to oursituation. Technological progress may expand the available viable options, but the past experienceincluding the knowledge of traditions and issues affecting justifiability of certain choices that shoulddepend on social priorities can be of great use in arriving at appropriate solutions.

World Commission on DamsThematic Review: Assessment of Irrigation Options in India, Draft #1, Date: 08/11/1999
This is a draft working paper of the World Commission on Dams. It was prepared for the commission as part of its informationgathering activity. The views, conclusions and recommendations are not intended to represent the views of the Commission.
8
2. How Irrigation Has Developed over Time in IndiaGrowth rate of irrigated area continues to fall from 4.23 % per year during the 1970s to 3.08% per year in1980s and to 2.56% in the 1990s (Singh, 1997: 99).
2.1 The Place of Large Dams
In 1950-51 most of the canal irrigated area (8.3 M ha) were located in deltaic tracts of east flowing riversin peninsular India and the Indo - Gangetic plain. They drew water supply by diverting the river flow withthe aid of low barrages. Large storage reservoirs were relatively rare; the capacity of all types of storagesin 1950-51 is placed at no more than 30 BCM, about half of which was accounted by tanks. About 80%of the canal-irrigated areas were diversion structures based and only about a fifth were based on storagestructures.
Till the end of Eighth Five year plan (March 1997), India has spent Rs. 1,378,088.1 billion at constant1996-97 prices and Rs. 580,851.3 billion at the current price levels on M & M Irrigation Projects alone.5This includes expenditure on Command Area Development (CAD), which is mostly in the commandareas of M&M projects. Plan wise break up on irrigation projects in India since planned developmentstarted in India in 1951 is given in Annexure 2. It is clear that an overwhelming proportion (over 63% atconstant 1996-97 prices) of the expenditure in irrigation sector has gone for M&M projects. India hasconstructed some 3303 additional large dams by May 1994 (there were 293 large dams in India in 1950)with 695 more large dams in pipeline (GOI, 1996 Vol. II: 478, Water and Related Statistics, CentralWater Commission (CWC), GOI, quoted in CSE, 1999 Vol. II: 47).
In terms of irrigation potential created, however, large dams do not have such a prominent position.Annex. 2 show the plans wise addition to irrigated areas by various sources.
The total storage capacity in the country due to completed M & M irrigation projects is 174 BCMProjects under construction could add another 72 BCM and the projects under consideration could add132 BCM.
Two marked watersheds in development of M & M irrigation projects in India occurred in mid sixties.First was the evident acceleration in investment in irrigation projects and the second was the declarationof the New Agricultural Strategy. The acceleration in irrigation projects also coincided with the change inevaluation criteria of M & M project from rate of return method to BC ratio method, which some see asdilution of criteria. Singh also sees this as leading to acceleration in dam building activity. Both were ofcourse linked with the dawn of the GR agriculture, which was water intensive in nature and depended ontimely and assured supply of water (Singh, 1997: 77-81).
2.2 The Place of Groundwater Irrigation
Annex table 3A and 3B show that by 1996-97, groundwater irrigated over half of all irrigated areas. Thisdominance has come about with the acceleration of groundwater based irrigation since mid sixties,through encouragement through institutional finance and rural electrification. In annual growth rate inirrigation since independence, the groundwater has contributed more than two thirds share. If we take thefigures for 1984-85 to 1993-94, the contribution of groundwater to overall annual addition in net irrigatedarea is at 78%. These are striking figures.

World Commission on DamsThematic Review: Assessment of Irrigation Options in India, Draft #1, Date: 08/11/1999
This is a draft working paper of the World Commission on Dams. It was prepared for the commission as part of its informationgathering activity. The views, conclusions and recommendations are not intended to represent the views of the Commission.
9
However, it is becoming increasingly clear that the groundwater development is no longer sustainable inincreasing no. of regions, in spite of the rather optimistic picture presented by the Central GroundwaterBoard of Govt. of India. Thus, there remain large areas with huge unexploited groundwater availability,for example the eastern India. Parts of Northern, Western and Southern region, however, are alreadyshowing signs of exhaustion. The current rate of groundwater expansion, highest since independence, at0.72 M Ha per annum, is clearly unsustainable.
2.3 Local Water Systems Including Traditional Systems
�Small and medium irrigation works have an important part to play in developing irrigation in thecountry. They have many advantages. They provide a large amount of dispersed employment. Theyinvolve smaller outlay and can be executed in a comparatively shorter period. Being spread over thecountry, they confer widespread benefit, and it is, therefore, easier to mobilise public co - operation intheir construction.�
Planning Commission, 1953 (GOI, 1961)
There is a reason why only canals among the indigenous techniques were adopted by modern engineerswhile others were not. Canal irrigation allows centralised management, which goes well with bureaucraticcontrol.
Sengupta, 1993: 10
The first census (1986-87) of Minor irrigation schemes shows that there were 5,07,212 minor irrigationtanks in use in the country (except in Rajasthan where no census was done). The Southern regionconsisting of Andhra Pradesh (AP), Tamil Nadu (TN), Karnataka and Kerala accounted for about 60% ofthe irrigated area under tanks in the country. These and MP, Maharashtra, UP and West Bengal togetheraccounted for 97% of the total tank population. A fresh census is now underway, whose results areawaited.
In 1960-61, sources other than government canals, wells and tubewells irrigated 8.2 M Ha in India. Thisarea is all likely to have been irrigated by what is called traditional water systems. The area declined to6.24 M Ha by 1987-88, which shows that these sources have been neglected over the years. (Sengupta,1993: 14) Corroborating evidence for these falling figures are available from other sources. For example,the World Bank (1991b: 2) notes that area irrigated by tanks have fallen from 4.6 M Ha in 1960-61 to 3.3M Ha in 1984-85.
While at national level, the area served by the traditional sources looked small at 14.5 % in 1987-88, if wedisaggregate the figures, these are practically the only sources of irrigation in the Himalayan states ofHimachal Pradesh, Sikkim, Assam, Arunachal Pradesh, Nagaland, Mizoram, Meghalaya, Tripura andManipur. In states like Jammu and Kashmir and Kerala, they account for over half the net irrigated area.In Bihar, Karnataka, Tamil Nadu & West Bengal, they account for over a quarter of net irrigated areas ofthose states. In Madhya Pradesh (MP) and AP too, they constitute over 20% of net irrigated area. In UP,these sources irrigate over 400,000 Ha of net irrigated area, most of which is in the hilly northern districts,where other irrigation sources are scant. In Rajasthan too, these sources account for most of the irrigationfacilities available in region around Aravalli ranges (Sengupta, 1993: 14-17). Rajasthan has 4600 minorirrigation tanks with a CCA of 630,000 ha. Most of these projects involve building of small dams tocreate reservoir or a tank. More than 50% of them were built before independence, but share of irrigationfrom these sources is only 189,000 ha. (Gulati 1999: 2-10 to 2-11) During 1996-97, some 40,825 minorirrigation works irrigated 930,000 Ha in Karnataka (Gulati, 2-15).

World Commission on DamsThematic Review: Assessment of Irrigation Options in India, Draft #1, Date: 08/11/1999
This is a draft working paper of the World Commission on Dams. It was prepared for the commission as part of its informationgathering activity. The views, conclusions and recommendations are not intended to represent the views of the Commission.
10
There is a lot of evidence of neglect of these systems since British times (for details, see CSE, 1997). Thehigh state subsidy and encouragement by the state in other ways for the M & M projects and groundwateruse as against the minor surface water systems have lead to neglect of these systems and also made themseem uneconomical. In many places, the M & M projects have overtaken the areas irrigated by minorsystems. And many other instances, the overuse of groundwater systems have made the minor surfacesystems less useful and unsustainable. Tubewells have thus replaced tanks at many places and sincetubewells largely benefit the bigger landholders, the result has been loss of community institutions andthe poor (e.g. Singh, 1997: 102-3).⇒ In Kalahandi district in drought prone western Orissa, tanks irrigated about 40,000 Ha in 1960-61; by1976-77 this area had declined to 7,481 ha. Similarly, the area under wells had declined from 3642 Ha to1681 Ha during the same period (Shiva, 1989: 196).⇒ In Karnataka, a study by Indian Institute of Management, Bangalore noted that �over half of theestimated 43,000 odd tanks in the state have been found to more or less silted up, resulting in area of 0.23M Ha having lost to irrigation (Dhawan, 1993: 135).⇒ It is widely accepted that the traditional systems have deteriorated because of the weakening oftraditional arrangements for managing these facilities, the cumulative effects of neglect of upkeep andrepair of damages to structures, and siltation of storages and channels. The government has not doneanything to solve these problems after taking over the systems themselves (Vaidyanathan, 1999: 96).⇒ India�s vulnerability to regional water scarcity is well illustrated by the case of Rajasthan. The state issituated in one of the most inhospitable arid zones of the world. In 1990, the state�s population reachedalmost 44 million. Per capita water use at the same time amounted to 562 cubic metres, a level nearlycommensurate with absolute scarcity. But that state also has many of the finest traditions of technologiesand management systems of local water harvesting (Singh, 1997: 102).⇒ Figures show that in 1962-63 the area under tank irrigation reached an all time high of 4.78 M Hawhich came down to 3.071 M Ha in 1985-86. It clearly indicates that the upkeep of tanks has not beenattended to properly.⇒ In Tamil Nadu, Tanks contribute 0.531 M Ha of net irrigated area and 0.617 M Ha of GIA as in 1990-91. Tanks irrigation is a major source of irrigation in Ramnad, Tirunalveli, Kanyakumari, Chingleput andNorth Arcot districts. The deterioration of tank irrigation here too is evident from the fact that the tankirrigated area reached, which was 0.565 M Ha in 1950-51 reached a peak of 0.936 M Ha in 1960-61,steadily reducing thereafter. Even the irrigation intensity reached a peak in that same year (World Bank,1995 Vol. 2: 295).
A neglect of the manipulation of monsoonal and flood water, which is associated with food crop, smallholding, and generally sustainable production expresses an inherent bias that British development in Indiareflected. This bias on the part of British rulers lead to focus on the transfer of large quantities of water tohitherto uncultivated areas or areas where less water consuming crops like jowar and bajra werecultivated (Singh, 1997: 8).
2.3.1 Relevance of Tanks across the country
As Mishra, one the most respected and energetic chroniclers of tank system in northern and central Indiasays (Mishra, 1993 and 1995), tanks were relevant across the country and in the beginning of this century,there were at least 1.1 to 1.2 million tanks of various sizes in the country. Most of the tanks were built bythe local rulers or community and all were maintained by the community. The tradition of tanks buildingas a social work goes back to at least 5th century and continued till the beginning of this century. Mishraeloquently describes the tank making tradition in different parts of Indian society.⇒ Rajasthan is one of the most drought prone areas of India. Eleven districts of the state are in aridregions. Among these, Jaisalmer is one of the driest of the districts. The Gazetteer gives ratherfrightening description of Jaisalmer: �There is not a single perennial river here. Groundwater is 125-250

World Commission on DamsThematic Review: Assessment of Irrigation Options in India, Draft #1, Date: 08/11/1999
This is a draft working paper of the World Commission on Dams. It was prepared for the commission as part of its informationgathering activity. The views, conclusions and recommendations are not intended to represent the views of the Commission.
11
ft deep and at some places 400 ft deep. The rainfall is unbelievably low at 164 mm. As per study of last70 years 355 out of 365 days each year are dry.� In that district, all but one of the 462 inhabited villageshave their own water management arrangement based on local resources. (Mishra, 1993: 60-61)⇒ In these days when Participatory Irrigation Management (PIM) is being followed like a blind fashionby many, Mishra describes the social institutions and norms that created and sustained the tanks indifficult terrain for many centuries. It is true that the tanks were part of social culture, customs, rituals,norms and they also had religious connotations at some places. The tanks had respect in society. It is truethat the process of deterioration of the systems that created and sustained these tanks have slowly dieddown.⇒ Describing this process, Mishra (1993: 82) says, first the respect for these system was taken away bythe British. Mysore State had over 39,000 tanks in 1800. It was said that the system of tanks here was soremarkable that if a drop of water falls anywhere in the state, there is some tank somewhere to harvest it.The state used to generously support maintenance of the tanks. When British took over the state, one ofthe first steps they took was to reduce this allocation by half. Then in 1863 when Public WorksDepartment (PWD) was opened, the ownership of all the tanks were handed over to it. Thus, the statetook away the resources for, and then ownership of the tanks away from the society. Thus, communitieswere no longer able to maintain the tanks.⇒ The deterioration that started in British times only accelerated under new rulers after the British left.

World Commission on DamsThematic Review: Assessment of Irrigation Options in India, Draft #1, Date: 08/11/1999
This is a draft working paper of the World Commission on Dams. It was prepared for the commission as part of its informationgathering activity. The views, conclusions and recommendations are not intended to represent the views of the Commission.
12
3. Development Effectiveness of Large Dams as a Source ofIrrigation
3.1 The Planning and Decision Making of Large Dams
The World Bank (1991a: 9-10, 12) notes that there are fundamental problems with project planning andappraisal. Basic weaknesses in data, project design, detailed engineering and planning have resulted ininappropriate projects. Project appraisal has often been conducted before all design and institutionalfeatures have been finalised. As a result, the re - estimated economic rate of returns (ERRs) for evenWorld Bank funded projects, which tend to fare better than government funded projects, have been poor.Of the nine projects assessed in 1989, seven had unacceptable ERRs , all below opportunity cost ofcapital in India. Cost and time overruns, poor implementation, reduction in irrigated areas, reduction inyields, downward adjustments in cropping patterns, were some of the reasons. Similar or worse resultshave been noted in government funded projects. The most reasonable conclusion is that projectperformance and economic viability has been poor all along for most projects. The projects are based onoverly optimistic design assumptions on water availability and irrigation efficiency. Design needs to bemore realistic and costs of alternatives needs to be assessed against benefits.
Faced with a demand for expanding irrigation far in excess of what can be accommodated with availableresources, governments have responded by starting too many projects, many of them without properinvestigation, and spreading available resources thinly among them; and a striking reluctance to faceconflict ridden problems of land reforms, participatory decision making, collection of water charges andbetterment levies. The management of India�s irrigation sector is a highly centralised structure withauthority to make and implement decision resting with bureaucracy that is answerable only to thepoliticians (for example, Vaidyanathan, 1999: 23-26). There is no participation of the users inmanagement of irrigation systems. By contrast, small systems almost everywhere tend to be managedinformally with scarcely any bureaucracy (Vaidyanathan, 1999: 46).
The World Bank further notes (1991a: 22), in irrigation project planning, �sensitivity analysis is rarelyperformed. These (benefit/ cost) ratios are calculated at the end of project preparation, rather than as adecision making aid during project identification and when evaluating design alternatives. A commonpractice is to ensure project acceptance by inflating benefits and underestimating costs� scrutiny of keytechnical assumptions is often weak. Economic and financial evaluation are also weak�. (Emphasisadded.)
The irrigation systems are often designed on the basis of inadequate or even unreliable information onwater supply, yield responses, irrigation efficiency, etc. In any case, few systems are equipped withcontrol structures or measurement devices to permit regulation of water delivery by volume(Vaidyanathan, 1999: 33). Few systems appear to be able to conform to allocations visualised in originaldesign. The planned allocations are based on assumptions regarding, (a) the likely availability of water inthe system, its seasonal distribution, and variability; (b) the losses in conveyance, distribution, and fieldapplication of water which together determine the technical efficiency of the system; (c) the waterrequirements of different crops; and (d) the pattern of cropping in different sections of the command area.Many of these turn out erroneous and mutually inconsistent. The available information on rainfall, streamflow, and crop water needs are often inadequate or unreliable. In the post independence period,inadequacy of time and staff devoted to the surveys and design in relation to the volume of workinvolved, along with laxity in the technical and economic scrutiny of projects before approval havecontributed to a significant lowering in the quality of designs. Such defects in design are compounded bydifficulties in enforcing the planned crop patterns (Vaidyanathan, 1999: 42).

World Commission on DamsThematic Review: Assessment of Irrigation Options in India, Draft #1, Date: 08/11/1999
This is a draft working paper of the World Commission on Dams. It was prepared for the commission as part of its informationgathering activity. The views, conclusions and recommendations are not intended to represent the views of the Commission.
13
In theory, projects are supposed to be given investment clearance only after ensuring that they are basedon adequate investigations, that the technical designs and cost estimates are sound, and that the project iseconomically viable. The experience of the last 50 years shows that in reality the standards of scrutinyand evaluation are lax, that project proposals without adequate hydrological data and preparatoryinvestigation have been approved under political pressure, that many projects have been initiated by stateswithout approval from Technical Advisory Committee, which is supposed to be mandatory, and thatchanges in the scope, design, and cost estimates are large and frequent. Institutional memory is poor aboutpast experiences and their lessons. It is surprising but true that there are no rigorous and detailed analysesof the factors responsible for revision in cost estimates or the justification for the large divergencebetween projected and actual costs. Large construction projects also happen to be a convenient means formobilising funds for party and other uses. Since the consequences of bad investment decisions or delayedimplementation rarely visit the individual ministers/ officials who make the decisions, there is little checkon undesirable tendencies.
The entire project evaluation process is strictly internal to the government agencies. There is nomechanism for public scrutiny, nor are the details of the appraisal available to interested citizens andorganisations to permit relevant issues being raised publicly.
Due to this utter lack of transparency, the project authorities get away with underestimation of costs andexaggeration of benefits of large projects, just to show them more beneficial then they actually are.Auranga, Bedthi, Sardar Sarovar and Tehri are only some of the projects where this is well documented(Singh, 1997: 116-7).
In a number of cases, the work on the project is started much before the projects are sanctioned. Thus,when the projects come up for clearance, it is already a fait accomplice and is presented as such toincrease the pressure to get necessary sanctions. For example, work on Nagarjunasagar project in APstarted in 1955 when the approval came in 1960. Approval for Kosi project in Bihar came three yearsafter the work was started in 1955. Construction on Malprabha project in Karnataka started three yearsbefore the approval came in 1963. Clearance for the Tawa project in MP and Kangasabati in West Bengalcame four to five years after the commencement of construction work. In case of Sardar Sarovar Project(SSP), even though final sanctions came only in 1988, the work on the project was started much earlier in1978, the United Nations Development Programme (UNDP) funded studies started in 1980 and the WorldBank loan got approved in 1985. This also shows the attitude of the institutions like the World Bank andthe UNDP for national approval mechanisms (Singh, 1997: 117 and Kothari Ashish, his presentation atthe South Asia Public Hearing organised by the WCD in Colombo in December 1998).
The underestimation of costs leads to higher than projected costs for irrigation projects. A study by PublicAccounts Committee of 32 projects showed cost escalation of 500% and beyond. Other studies have alsoshown high cost escalations. Being aware of the increase in cost escalations, the Government of India(GOI) appointed a Committee of Experts to probe into the issue. That Committee singled out an increasein cost due to inadequate investigations and surveys as �one factor that has caused significant deviationsfrom the original estimated cost of projects�. Even CWC and Central Board of Irrigation and Power havepointed out that the quality of project reports is going down, the technical studies are left incomplete, thecommand area surveys are not completed and drainage and downstream issues are never addressed(Singh, 1997: 118-125).
The fact that in stead of improving the quality of cost benefit calculations have only deteriorated showsthat possibly the underestimation of the costs were deliberate and not unintended.

World Commission on DamsThematic Review: Assessment of Irrigation Options in India, Draft #1, Date: 08/11/1999
This is a draft working paper of the World Commission on Dams. It was prepared for the commission as part of its informationgathering activity. The views, conclusions and recommendations are not intended to represent the views of the Commission.
14
Moreover, the large dam projects have invariably taken very long to be completed. The Public AccountsCommittee of the Parliament mentioned earlier noted that not a single project have been completed sinceindependence within the stipulated target date. Singh (1997: 128-130) has noted that average delay in thelarge dam projects studied have been 160%. Singh (1997: 130-1) has also noted from official documentsthat irrigation area achieved by large dams have been about 64.4% of the projected irrigation area.
In India, estimates of available utilisable and utilised water resources leave much to be desired. Theestimates of surface flows continue to be based largely on empirical formulae relating rainfall to surfacerun off pioneered by A N Khoshla in the 1950s. The lack of data based on measurement of actual flowremains one of the most serious handicaps in the planning of water resource development (WRD)(Vaidyanathan, 1999: 107, 124-5).
Legislatures and the Comptroller and Auditor General, who are supposed to keep a watch overgovernment decisions, have proved largely ineffective (Vaidyanathan, 1999: 130).
Even supporters of large dams like Dhawan (1993: 75) agree that due to the decision to expand irrigationcapacity in an accelerated manner after 1971, pre-investment investigative work in connection withprojects got neglected. Unsatisfactory quality of many construction work and managerial/supervisoryquality neglect is visible in completed works.
Some interesting observations about the decision making process and planning documents of the mostcelebrated large dam project of India, namely Bhakra Nangal project, can be seen in Annex 9. Here itwould be sufficient to say that even these projects saw exaggeration of benefits, underestimating of costs,lack of basic appraisal even about economic aspects of the project and lack of options assessment (Raj,1960).
3.1.1 The Decision making criteria
The criteria for considering a project viable or not has also changed with time and changing concerns.• Under the British rules, the economic return of revenue for the government was chief criteria used forsanctioning projects. The irrigation projects used to generate between 4 and 6 % returns on investment,even after deducting the working expenses.• As provision of irrigation was deemed to be a responsibility of the state and a conduit to socialwelfare, the minimum acceptable rate of return on the capital investment was lowered from the pre-independence level of 6% to 3.75% in 1949.• The norm was again raised to 4.5% in 1954 and further to 5% in 1960.• In 1964 the Gadgil committee asserted that a minimum acceptable rate of return on capital criterionfor sanctioning irrigation projects was highly inappropriate from a social welfare point of view. Afterdeducting charges for land levelling, interest on capital, depreciation and administrative expenses, itrecommends a BC ratio of 1:5 for considering a project viable. This change was facilitated by the entry ofthe World Bank and other international financial institutions into the area.• However, this new approach also did not take into account the social and environmental costs. Therewere many manipulations even in this method to push otherwise unjustified projects as the method andthe data continued to remain outside public scrutiny.• In 1972, the Irrigation Commission decided that the BC ratio of 1 should be considered acceptable fordrought prone areas.• In 1983 the Public Accounts Committee recommended that irrigation works must recover their M &E and depreciation charges and some interest on capital invested.• In 1983 the BC ratio criterion for sanctioning irrigation projects was replaced by the internal rate ofreturn criterion. To qualify, projects were required to yield a minimum IRR of 9 %, while irrigation

World Commission on DamsThematic Review: Assessment of Irrigation Options in India, Draft #1, Date: 08/11/1999
This is a draft working paper of the World Commission on Dams. It was prepared for the commission as part of its informationgathering activity. The views, conclusions and recommendations are not intended to represent the views of the Commission.
15
projects located in drought prone areas, hilly tracts, and in areas where 75% of the dependable flows ofthe basin had already been tapped a lower IRR of 7% was allowed (Gulati, 1999: 4-14 to 4-15; Singh,1997: 68-72).
While deciding about the construction of any new large irrigation project, economists have to considercertain other factors. One of them is uncertainty and irreversibility of investment. Most econometricmodels of investments are based on implicit assumption that investment expenditure are reversible.However, most large irrigation projects are irreversible, once started. They can of course be restructured,but not completely shifted. Water resources projects are particularly vulnerable to conditions ofuncertainty from geophysical processes.
Project evaluations should also include energy audit around a project, including the energy spent inproject construction and energy to be produced in its working life. The evaluations should also be takinginto account the cost escalations, delays and unachieved targets of past projects (Singh, 1997: 73-6).
3.2 Social, Environmental, Economic and Opportunity Costs
3.2.1 Capital Costs
The biggest single malady in the M & M irrigation sector right from the First Plan has been the continuedtendency to start more and more new projects resulting in wanton proliferation of projects, thin spreadingof resources and consequent time and cost overruns. Though all the Plans, without exception, declaredtheir intention to give priority to complete the ongoing schemes, the addition of new schemes continuedunabated.
Planning Commission (1992, as quoted in Dhawan, 1993: 47)
The Planning Commission of India evaluates irrigation during a Plan period by the potential createdduring that same period. The Planning Commission�s capital cost estimation procedure suffers from manyserious limitations. It neglects gestation lag that exists between the time investment is undertaken and thetime irrigation potential is created and it fails to recognise that society values investments differently astime passes, among others. Analysis of 346 M & M irrigation projects show that a fixed period of 12years between the time investment is made and potential created is representative of most irrigationworks. Analysis suggest that the capital costs have gone up from its lowest levels at Rs. 51,000 per Ha in1978-79 to over Rs. 214,000 per Ha in 1995-96, both at constant 1995-96 prices and both represent threeyear moving averages. The costs continue to show rising trend. This suggests that the capital cost per Haof incremental potential created will rise at even faster rate. CWC and Planning Commission grosslyunderstate the real cost of irrigation development through M & M projects. The costs reported by CWCare 183 % lower than the real costs (Gulati, 1999: 3-2 to 3-4).
The Planning Commission also accepts that the cost of creation of one Ha of irrigation through M & Mprojects have gone upto at least 365% since the early planning period. It attributes reasons like change inscope of projects, rise in provisions, increase due to price rise, change in design, among others for thiscost escalation (GOI, 1999: 498-99).
Part of reason for the increase in cost is that too many projects are taken up to satisfy various politicaldemands, thus resulting in delay and thin spreading of available resources. Since the inception of planperiod, lip service has been paid for not starting new projects, but with little practical implication, as canbe seen in Annexure 7, where plan wise no of projects started are given. (GOI 1999: 499) To illustrate thepoint, three years after 1985 resolution of planning commission not to start any new projects till

World Commission on DamsThematic Review: Assessment of Irrigation Options in India, Draft #1, Date: 08/11/1999
This is a draft working paper of the World Commission on Dams. It was prepared for the commission as part of its informationgathering activity. The views, conclusions and recommendations are not intended to represent the views of the Commission.
16
completion of ongoing projects is achieved, the costliest irrigation project ever undertaken in history ofIndia, namely SSP, was taken up in 1988.
There are relatively few detailed and comprehensive studies of this phenomenon of difference betweenprojected and actual costs. One such study that examined 30 completed projects found the actual cost tobe more than twice that of the original estimate. The estimated average time taken for completing theprojects (based on a study of eight projects in one state) was nearly 11 years, about 4.5 years more thantwice the original estimates (Vaidyanathan, 1999: 90).
3.2.2 Operation and Maintenance Expenses
It appears as if irrigation fees are charged to farmers to recover variable costs while costs like bettermentlevy/ land revenue etc. are charged to recover fixed costs (capital costs). These are the direct costs withrelation to canal irrigation. The indirect methods of taxing in this respect include taxes on output (Manditax), income from fishing and recreation facilities and also implicit taxes through trade & exchangecontrols, etc. These include those on agriculture directly and those on industry, which can be consideredimplicit tax on agriculture. The problem with this form of financing, which is heavily tilted in favour ofindirect methods, is that it neither promotes efficiency, nor equity. On the other hand, with indirectmethods to finance irrigation, even farmers not benefiting directly from canal irrigation are made to payfor it. This only creates greater inequity. Further, the indirect method of financing canal irrigation seversthe link between what farmers pay for water and what type of service they get. Thus the irrigationbureaucracy, politicians, contractors, consulting firms of developed world and even several employees ofthe donor agencies thrive and get away with their sub optimal decisions, sub standard construction andhigh levels of corruption (Gulati, 1999: 4-6).
The behaviour of O & M expenses per Ha has exhibited an upward trend over the entire period, from Rs.230 per Ha in 1960-61 to Rs. 620 per Ha in 1994-95, both at 1995-96 prices. As various departmentsundertake O & M tasks of irrigation schemes (eg Jawahar Rozgar Yojana under the Ministry of RuralEmployment), for precise estimates, the expenses incurred by other departments must be examined, notusually done by anybody. On incorporation of such costs, the escalation in O & M costs will become evenmore steep. What is even more troublesome is that the share of Maintenance and Repair part of O & Mexpenses have been dropping from about 65% in 1960s to a mere 27% in 1985-86, rising marginallythereafter. Share of Extension & Improvement remained 15% throughout, rising only in 1985-86. Theshare of Machinery and Equipment remained at 2.5 % throughout the period. Most worryingly, the shareof Direction and Administration costs kept rising from about 35% in 1960s to 47.4% in 1986-87 andfurther upto 60% in 1990s. These trends imply that the quality of service that the irrigation network isable to provide only deteriorates with time (Gulati, 1999: 3-8, 4-1).
The Tenth Finance Commission (1995-2000) has suggested the norms for O & M cost of works at thelevel of Rs. 300 per Ha in case of utilised potential and Rs. 100 per Ha for unutilised potential with 30%increase for hilly areas and suitable increases for insulating inflation. Accordingly, estimated total O & Mcost per annum for country would be about Rs. 25-30 billion. Against this requirement, the O & M fundsbeing provided are actually less than even one-fourth of the required with wide variation across states.This is one of the reasons for the deterioration in the performance of irrigation systems (GOI, 1999: 486).
3.2.3 Cost Recovery
Gross receipts from irrigation department services are constituted of direct and indirect receipts. Indirectreceipt includes betterment levies, irrigation cess, portion of land revenue due to irrigation works andother receipts. Between 1974-75 and 1986-87, indirect receipts composed of only 8% of gross receipts at

World Commission on DamsThematic Review: Assessment of Irrigation Options in India, Draft #1, Date: 08/11/1999
This is a draft working paper of the World Commission on Dams. It was prepared for the commission as part of its informationgathering activity. The views, conclusions and recommendations are not intended to represent the views of the Commission.
17
the all India level, the remainder constituted of direct receipts. Direct receipts include sale of water forirrigation, domestic and other purposes, sale of proceeds from canal plantation, navigation, among others.
During the British period, canal irrigation was giving a direct commercial rate of return of about 6% oncapital. Even in early 1950, rate of return was around 3.75%. It has consistently declined thereafter(Gulati, 1999: 4-4).
The profile of direct receipts per Ha at 1995-96 prices reveal almost downward trend from 1960-61 to1995-96, with the decline getting accelerated during the mid 1970s. The cost recovery ratio (receipts/ O &M expenses) was more than one till 1966-67, after which it declined below unity, so that receipts werelower than O & M expenses. There was some improvement in this situation in mid seventies, but the ratiohas declined even further since then. By early 1990s, the ratio had declined below 0.1, excluding anycharge for the interest on capital deployed. Irrigation Commission of 1972 had recommended that at least25% of the gains in value productivity from irrigated lands should be the minimum charges for water. Thecharges have been much lower, ranging from 0.2% in case of Tamil Nadu to maximum of 7.1% in case ofUttar Pradesh (UP) (Gulati, 1999: 3-10 to 3-14).
As a result of this, the allocation in this sector in real terms is declining. The result is a rapidlydeteriorating system (Gulati, 1999: 3-15).
In India, fixing a water rate is state prerogative and it is generally a political decision. Also, the waterrates are based on per Ha basis, based on crops cultivated. Thus, marginal cost of an extra unit of waterfor the farmer is zero. Thus, if one works out pricing of water on the basis of per unit of water consumedby different crops, then it turns out that water intensive crops are paying lower prices for water on per unitof water used than the low water consuming crops. For example, in Karnataka water charges per unitvolume (Ha cm) of water used, comes to Rs. 1.44 and 1.12 for crops like Paddy and Sugarcane, comparedto Rs. 1.63 for coarse cereals and Rs. 1.97 for oilseeds. The water rates remain unchanged for decades.Collection rates are very low with collections being much below assessed rates. Actual assessed rates aremany times much below what they should be based on cropping pattern and irrigated lands(Vaidyanathan, 1999; World Bank, 1991; Gulati, 1999: 4-11 to 4-12). Revenue receipts from irrigationcovered only about 5% of current expenditure in Karnataka in 1993-94 (World Bank, 1998: 6).
The seriousness of the problem is underscored by the fact that in mid eighties, according to NationalInstitute of Public Finance and Policy, unrecovered costs on irrigation (Rs. 47 billion) amounted to aquarter of the total state Plan outlays and larger (by about 40%) then the state Plan outlays on irrigation.By 1993-94, losses on account of irrigation had increased to Rs. 124 billion (Vaidyanathan, 1999: 101).
The figures from the World Bank (1991b: 59) are even more disturbing. Thus, whereas at the beginningof the debate, most expenditures (78%) on M & M irrigation went on investments, by 1988-89, only 55%of irrigation expenses came under the Plan (investment) budget, the rest being on recurrent (non - Plan)expenditures. Revenue as % of non-plan expenditure had gone down to 7.5% and rest (92.5%) was beingpaid out of plan outlays.
Some of the recommendations made to improve this state of affairs include the following.• Regular and independent assessment of sample areas irrigated by M & M projects;• Use of remote sensing to obtain an objective estimate of the extent of irrigated area;• Assessment and collection of water charges should be responsibility of the same agency thatmaintains the system;• The agency should be allowed to retain a certain portion for betterment of the system (Gulati, 1999:4-12 to 4-13).

World Commission on DamsThematic Review: Assessment of Irrigation Options in India, Draft #1, Date: 08/11/1999
This is a draft working paper of the World Commission on Dams. It was prepared for the commission as part of its informationgathering activity. The views, conclusions and recommendations are not intended to represent the views of the Commission.
18
As a result of low water rates and low recovery, financial losses of M & M projects amounted to Rs. 22billion in 1989-90 (World Bank, 1998: 7).
3.2.4 Gap between Targets and Achievements
There are far too many cases in which it has taken ten years or more after the dam was completed for thewater actually to reach the farmers. The drama of harnessing a major river may be more exciting than theprosaic task of getting a steady trickle of water to a parched hectare, but to millions of small holders thatis what is going to make the difference between success and failure.
Robert McNamara, the then World Bank President(& Former US defence secretary) in 1972, quoted in
How the other half dies: The real reasons for world hunger,Susan George, Penguin Books, 1985.
It is well known that the M & M projects that show optimistic returns at appraisal, mainly to justifysanctions to the project rarely perform to that level. Since comprehensive post facto evaluation ofgovernment funded projects never get done, it is difficult to put figures. However, some of the WorldBank funded irrigation projects have had the benefit of post project audit in the form of ProjectCompletion Reports. Table 3 summarises the comparison between Appraisal Economic Rate of Return(ERR) and Completion ERR of 1989. It is clear that the projects are performing far from projected orsatisfactory results. Two points are important. Firstly, as the World Bank notes, the project performancehas only further deteriorated with time. Secondly, the government - funded projects generally performworse than the Bank funded projects as the Bank funded projects have better appraisal of the projects,they have better fund flows and supervision. Thus, the performance of other M & M irrigation projects islikely to be only worse than what these figures show.
Table 3.Comparison of Appraisal ERRs and Re - estimated ERRs at
Project Completion for Selected World Bank AssistedIrrigation Projects in India
No. Project Appraisal ERR Re - Estimated ERRBased on PCR
1. Mahanadi Barrage (Orissa) 21.0 14.12. Subernarekha (Bihar and Orissa) 17.3 7.23. Gujarat II 18.0 3.24. AP Irrigation and CAD 15.0 3.25. M.P. Chambal II (Modernisation) 35.0 9.96. M.P. Medium 18.0 5.17. Kallada Irrigation and Tree Crops 20.0 7.28. Karnataka Tanks 20.0 3.6Source: World Bank, 1991b: 46
In ex - post analyses of government financed projects, generally completed at slightly earlier periods,Daines and Pawar also found disappointing results. Only two out of fourteen projects examined had ERRsgreater than 12% (World Bank, 1991b: 46).

World Commission on DamsThematic Review: Assessment of Irrigation Options in India, Draft #1, Date: 08/11/1999
This is a draft working paper of the World Commission on Dams. It was prepared for the commission as part of its informationgathering activity. The views, conclusions and recommendations are not intended to represent the views of the Commission.
19
These statistically observed implementation deficiencies (project delays, cost overruns, reduced commandareas and lower productive impacts) are themselves products of a variety of institutional and technicaldeficiencies. The World Bank thus concludes, �Based on field observations and analysis of themethodology used for calculating earlier completion report ERRs, the most reasonable conclusion is thatproject performance and resultant economic viability has been poor all along for most projects. There arenevertheless, some trends of particular concern. Construction quality and maintenance standards havedeteriorated over the past two decades and water management has been critically deficient on mostsurface schemes. Institutional performance has also deteriorated� (World Bank, 1991b: 47).
The World Bank further goes on to conclude that most attractive future investments in irrigation projectsis in water management in existing projects and in groundwater development. Second priority could becompletion of selected on going projects. As far as new M & M surface water projects are concerned, atbest they can have moderate ERRs of 5-10% even if better project preparation and implementation areassured. Are such returns acceptable? The Bank goes on to answer that, �At the level of marginalinvestment analysis �where to put the next dollar � the answer would appear to be negative� (WorldBank, 1991b: 47-8).
Additional irrigation potential created during the Eighth Five-Year Plan was 1.95 M Ha (38%) as againstthe target of 5.088 through M & M schemes. The gap has been across the states, highest being in AP(89%), Haryana (85%), Rajasthan (86%), Bihar (88%) and Gujarat (77%) (GOI, 1999: 500-1).
In AP, currently the gap between the potential created and the gross area actually used for irrigation isabout 40% percent. State�s effective irrigation area declined from 4.3 M Ha in 1992 to 3.9 M Ha in 1995(World Bank, 1998b: 5). The decline was almost entirely due to drop in public surface irrigation area,which peaked in 1990 at 2.9 M ha, but dropped to 2.3 M Ha in 1994 (World Bank, 1997: 4).
In Tamil Nadu also the net irrigated area dropped from 2.57 M Ha in 1980-81 to 2.373 M Ha in 1990-91.The drop was in all sources of irrigation, but was maximum in case of canal irrigated area, which droppedfrom 0.889 M Ha to 0.769 M ha (World Bank, 1995 Vol. 2: 296).
A 1987 study by the Gujarat State Legislature found wide discrepancies between the amount of land thatplanners said would be watered by irrigation projects and the amount that actually was. Panam Dam, innorthern Gujarat State, for example, was expected to deliver water to 118,490 acres, but in fact irrigatedless than half that area. Damanganga Dam, also in Gujarat, was to irrigate 135,900 acres of land; in factonly 1,336 acres were ever actually irrigated. Both these dams were funded by the World Bank. Thereasons for the shortfalls are many. Planners overestimate the amount of water required by or available tothe system; contractors carry out substandard work; and, in the Bank's own words, "most irrigationschemes have been poorly operated and maintained."
Some relevant facts reflecting on the development effectiveness of some specific large irrigation projectscan be found in Annexure 17.
3.2.5 Gap Between Utilisation and Created Potential
The persistent gap between the created potential especially under M & M projects and area reported to beactually irrigated has attracted much attention. The Planning Commission estimates show that between1953 and 1993, one eighth of the additional potential has not been used. The gap is much larger when wecompare Land Use Statistics (LUS) estimates of GIA with the Planning Commission estimate of potential(Vaidyanathan, 1999: 64).

World Commission on DamsThematic Review: Assessment of Irrigation Options in India, Draft #1, Date: 08/11/1999
This is a draft working paper of the World Commission on Dams. It was prepared for the commission as part of its informationgathering activity. The views, conclusions and recommendations are not intended to represent the views of the Commission.
20
An analysis of eight projects in AP showed that the actual irrigated area was 11 to 70% short of potential.A part of the gap arose from the divergence of actual from planned crop patterns, but even after includingthat factor, utilisation was substantially below the potential. The problems highlighted by these projectsare quite wide spread. Numerous examples can be cited from all over the country corroborating the aboveobservations (Vaidyanathan, 1999: 65-66).
The Eighth Five plan also notes, �There is considerable evidence to show that the crop patterns actuallyadopted by farmers are often much more water intensive than assumed and this is one important reasonwhy actual area irrigated is smaller than designed potential� (Vaidyanathan, 1999: 67).
3.2.6 Relative Cost of Irrigation through M & M Projects and Minor Projects
The present cost of development of irrigation through minor projects is Rs. 18,000 per Ha as per PlanningCommission (GOI, 1999 501-2) at current prices. As noted by Gulati, the cost of irrigation developmentthrough M & M project at current prices come to Rs. 2,14,000 per ha. Even as per Planning Commissioncost of development of one Ha of irrigation through M & M projects is over Rs. 31,000 at 1980-81 prices.The difference is clearly visible. While the quality and duration of irrigation available from M & M andthose from Minor project are different, the latter is not necessarily inferior. The quality of irrigation fromGroundwater is better then that from M & M project. Also, if the hidden costs behind M & M projects areincluded, the M & M projects would prove even more costly.
3.2.7 Socio - Ecological costs: Submergence & Displacement
No authentic figures are available as to how much forest lands have been taken up by river valley projectssince independence. Government has no information on this. It has been roughly calculated that big rivervalley projects have swallowed about 0.5 M Ha of forest land in India between 1951 and 1976. These areindeed very conservative estimates. This destruction has multiple implications. In India, tribalspredominantly depend on forestlands for their survival. With this destruction, the forest in the contiguousarea would come under increasing pressure. This would also mean increased soil erosion, increasedrunoff, which would mean further soil erosion. At micro level, as per a UNESCO study, a forestedwatershed releases 1-3% of runoff, while deforested watershed in similar conditions release over 90% ofrunoff. While these figures would change with conditions of kind of forest, topography, meteorology, etcand also the macro picture such figures would not apply at macro level, it does show the kind of impactforests have on soil erosion, runoff and water conservation (Singh, 1997: 135).
The World Bank (1991b: 78-9) notes that in storage structures, land equal to 3-8% of the irrigatedcommand is taken away for submergence. However, this figure can go upto 12% as in case ofSuvernarekha project. In addition, 2-5% equivalent of irrigated command area goes for canals and relatedinfrastructure. However, this figure can go upto 10%, as is happening in case of upcoming SSP. About 6families are displaced per 100 families provided with irrigation, of which an estimated average of 3families are displaced due to submergence of land for reservoirs and a further 3 families due to canalinfrastructure. No account is available of the cumulative figures of the 3303 large dams constructed inIndia since Independence. From available figures, it seems likely that the figures of those displaced bythese dams would have exceeded 40 million, as was accepted by GOI�s Rural Development Secretary inearly 1999. No account is available as to what has happened to these people, but once again the sameofficial accepted that over 80% of them were never rehabilitated. India still does not have a nationalrehabilitation policy, nor a mandatory law for resettlement of the displaced. It is well documented that adisproportionately high % of displaced come from the poorer and weaker classes like Schedule Castesand Schedule Tribes (ST). These issues are rarely part of decision making process of M & M projects.

World Commission on DamsThematic Review: Assessment of Irrigation Options in India, Draft #1, Date: 08/11/1999
This is a draft working paper of the World Commission on Dams. It was prepared for the commission as part of its informationgathering activity. The views, conclusions and recommendations are not intended to represent the views of the Commission.
21
3.2.8 Socio - Ecological Costs: Health Impacts
Canals are known to lead to many health impacts. Spread of Malaria due to canal irrigation has beenknown since British times. In the upper Bari Doab Canal area in 1908, the malaria deaths are reported tohave claimed 12,000 people (eg, Singh, 1997: 47-48). Large-scale water projects are known to increasethe incidence of water borne diseases like malaria, filariasis, encephalities, flurosis, yellow fever, dengue,river blindness and schistosomiasis in many areas. Studies by Indian Council of Medical Research,National Institute of Nutrition have recorded several instances of health impacts of irrigation projects.Systematic studies and information are lacking (World Bank, 1991a: 42; World Bank, 1991b: 76; Singh,1997: 149-50). Health costs, appraisals of health impacts and mitigation measures are rarely part ofirrigation projects, if at all.
The downstream socio - ecological impacts of dams include reduction of fresh water flows, salinityingress, pollution concentration, reduction in groundwater recharge, destruction of mangroves, destructionof navigation routes and destruction of fisheries. Suffice to note here that these impacts are rarely part ofappraisal, BC calculation and mitigation measures are never part of the projects.
The most important point to be stressed with respect to Socio - Ecological costs is that these costs havenever been part of the BC equation of M & M projects. If at all, they are mentioned only in the namesake.However, it is not the case that the costs were not known. Even the first irrigation commission of 1901mentions many of these impacts like water logging and salinisation, health impacts, etc, but without goinginto details of any of these, it is claimed that the benefits will overweigh the costs (Singh, 1997: 48).
The situation is not much different almost a century latter. Even in case of SSP, the most controversialand considered most modern by the project authorities, the socio - ecological costs have little place. Incase of most of the impacts, basic impact assessment study are yet to be completed, leave aside thequestion of formulating appropriate action plans and implementing them.
3.3 Contribution in Food Production
Historically, the GR represented a choice to breed seed varieties that produce high yields under optimumconditions. It was a choice not to start by developing seeds better able to withstand drought or pests. Itwas a choice not to concentrate first on improving traditional methods of increasing yields, such as mixedcropping. It was a choice not to develop technology that was productive, labour intensive, andindependent of foreign input supply. It was a choice not to concentrate on reinforcing the balanced,traditional diets of grain plus legumes.
FM Lappe and J Collins, Food First, London, Abacus, 1980: 114Quoted in Shiva, 1989: 134
The latest review of India�s irrigation sector notes that ascertaining precise contribution of irrigation isdifficult (World Bank, 1998: 2). �This is in part because there are no official Indian statistical data thatgives the break down of agricultural production under irrigated or rainfed conditions. Nevertheless,various estimates point to a contribution from irrigated agriculture to overall agricultural production ofabout two - thirds, and under some estimates an even higher contribution�, the report noted. This 1998review went on to say that as per their estimates, in 1992-93 irrigated agriculture would have contributed78% of total food production and 95% of non-food production, using one - third of the gross croppedland. These were strange figures, not substantiated in the report, but contradicts World Bank�s ownestimate in its 1991 India Irrigation Sector Review that estimated irrigated agriculture�s contribution to beabout 55% (World Bank, 1991b: 5). This matches with the Planning Commission (GOI, 1999) figure of58% of food production coming from irrigated area.

World Commission on DamsThematic Review: Assessment of Irrigation Options in India, Draft #1, Date: 08/11/1999
This is a draft working paper of the World Commission on Dams. It was prepared for the commission as part of its informationgathering activity. The views, conclusions and recommendations are not intended to represent the views of the Commission.
22
India�s foodgrains production has increased from 50.82 MT in 1950-51 to almost 202.5 MT in 1998-99.This is no mean achievement. An impression is sought to be created by many that this achievement is dueto large dams. In this section we will try and see what is the contribution of large dams based irrigation inthis.
For this exercise, we look at the period between 1950-51 and 1996-97, for which we have figuresavailable about foodgrains production and area irrigated by various sources. Foodgrains production inthese two years was 50.82 MT and 199.32 MT respectively. (Food Production in 1967-68, at theinception of the GR period, was 95 MT already (Singh, 1997: 80).) The latter figure is the highestachieved foodgrains production till that year, the production in the following year dropping to 193.12MT.Thus, additional foodgrains production in the period is 148.50 MT. However, there are many contributorsin this achievement.
As can be seen in Annex 3A, the GIA in India in 1951 was 22.6 M Ha (20.9 M Ha was net irrigated area),comprising of 9.71 M Ha (8.3 M Ha net) by M and M Projects, 6.4 M Ha by minor surface waters and 6.5M Ha by groundwater.
Here it is useful to note that a very large proportion of the irrigation by M & M projects at the time ofindependence was not from storage based structures but was based on diversion structures like barrages.Such irrigation included 0.6 M Ha from Sirhind canal, 0.33 M Ha from Upper Bari doab, 1.35 M Ha fromSon canal, 0.68 M Ha from Yamuna canals and 0.7 M Ha from upper Ganges canal. (Vaidyanathan 1999:51) Total irrigation from diversion based systems was about 80% of the M & M irrigation. (See Annex3C) Needless to add, the social and environment impacts of barrage based structures are much less thanthose from big dam projects.
At the end of 1996-97, 80.75 M Ha gross land was irrigated, out of which 28.44 M Ha was irrigatedthrough M & M schemes and 52.31 M Ha through minor irrigation, including surface water (10.71 M Ha)and groundwater (41.60 M Ha) schemes.
However, there are discrepancies in the figures irrigated areas of 1996-97 given out by the UnionMinistry of Water Resources and CWC, as against the figures given by Directorate of Economics andStatistics, Ministry of Agriculture (MOA). For example, the difference between GIAs claimed in 1984-85by CWC (58.82 M Ha) and MOA (54.1 M Ha) (World Bank, 1991) is substantial at 8.02 % of the CWCfigure. Such discrepancies are not very unusual in India�s water resources sector (for a detailed discussionon irrigation data related issues, see Sengupta, 1993: 19-29).
In Annexure 3A, the last column gives the figures of actual irrigated area as per LUS. It can be seen thatthe difference between the irrigation utilisation figures and the area actually irrigated as per LUS isgrowing from almost nil to 12.5 % by 1996-97. While there are problems with both the figures, namelyirrigation utilisation as per the Planning Commission and those as per LUS provided by agricultureministry, (for a detailed discussion on this, see Vaidyanathan, 1999) it is generally accepted that sinceagriculture ministry is the actual user of irrigation, their figures are likely to reflect the situation in a moreaccurate way.
There are many reasons for these gaps. Since the planning commission estimates utilisation separately forsurface and groundwater, there is the possibility of overestimating the total irrigated area due to doublecounting. In the Eighth Five Year Plan, the Planning Commission accepted that such double counting isactually happening and that �the estimates of potential reported in the Plan documents are not strictly

World Commission on DamsThematic Review: Assessment of Irrigation Options in India, Draft #1, Date: 08/11/1999
This is a draft working paper of the World Commission on Dams. It was prepared for the commission as part of its informationgathering activity. The views, conclusions and recommendations are not intended to represent the views of the Commission.
23
comparable with those reported under land use and cropping statistic (Dhawan, 1993: 54-55;Vaidyanathan, 1999: 59).
However, since the LUS do not give separate figures for groundwater and surface water, we will have toapply the correction for all sources proportionately. Applying that correction to the 1996-97 figures givenby CWC, more realistic estimate of total gross irrigation in 1996-97 would be 70.64 M Ha and grossirrigation by M & M projects would come to 24.88 M Ha. Similarly, the area irrigated by groundwaterand minor surface water projects would come to 36.6 M Ha and 9.4 M Ha respectively.
Thus in 46 years since 1950-51, M & M irrigation projects have added 15.17 M Ha to GIA. This,incidentally, comes to 21.48% of GIA of the country in 1996-97.
The productivity of canal irrigated areas is not the same as productivity of groundwater irrigated areas.Land irrigated from groundwater has notably higher productivity than from canals, as Table 4 shows.
Table 4.Land Productivity Per Net Irrigated Hectare by Sources of Irrigation
(Ton/Ha in Foodgrains Energy Equivalent Units)
State Wells (private) Canal Irrigation TanksAP 5.7 (67.6) 3.4 2.0Tamil Nadu 6.5 (150) 2.6 2.3Punjab 5.5 (71.9) 3.2 -Haryana 5.7 (137.5) 2.4 -MP 2.8 (40) 2.0 1.5Karnataka 4.2 (20) 3.5 2.3
Source: The World Bank, 1991 Vol. II: 7
Note: Figures in bracket in second column are % by which productivity in well - irrigated areas is higherthan canal irrigated areas.
Many documents have noted the higher productivity of groundwater irrigated areas (World Bank 1998c:2-4, GOI 1999, Vaidyanathan 1999). The main reason for this is that in case of groundwater irrigation, thewater is available whenever farmer wants (and when fuel (electricity/ diesel) is available). As a result,groundwater irrigation also encourages complementary investments in fertilisers, pesticides and HYV.Unpredictability of canal supplies and its ill impacts are also noted by many.
Dhawan (1993: 100) notes that groundwater irrigated 2.21 M Ha in Punjab produced 14 MT foodgrains in1984-85 at about 6.5 tons per net irrigated ha. The corresponding estimate for output from 1.4 M Hacanals irrigated area may be placed at 4.9 MT at 3.5 tons per ha.
In Tamil Nadu, when one reckons with the higher land productivity under well irrigation, nearly twothirds of the state agricultural output turns out to be from groundwater irrigated lands. At 6.5 tonsfoodgrains equivalent units per ha, the well irrigated lands produced about 6.95 MT in late seventies(Dhawan, 1993: 102).
Thus, even if we assume average figures, groundwater irrigated lands have at least 70% higherproductivity than canal irrigated areas, 15.17 M Ha of canal irrigated land would be equivalent to 8.92 MHa of groundwater irrigated area. Similarly, the productivity of groundwater irrigated areas is about 135%

World Commission on DamsThematic Review: Assessment of Irrigation Options in India, Draft #1, Date: 08/11/1999
This is a draft working paper of the World Commission on Dams. It was prepared for the commission as part of its informationgathering activity. The views, conclusions and recommendations are not intended to represent the views of the Commission.
24
higher than the productivity of tank irrigation. Thus, 9.4 M Ha of tank irrigated area would be equivalentof 4.23 M Ha of groundwater irrigated area. Thus, in terms of groundwater equivalent terms, the totalirrigated area in 1996-97 was 53.64 M ha, of which the M & M canals constructed since independencecontributed only 16.63 %.
GOI (1999: 476-7) has said that 56% of agricultural production and 60% of foodgrains production comesfrom irrigated areas. Thus, the contribution to food production today from large dams based canalirrigation created since 1950 comes to (16.63 X 0.6 =) 9.98%. Thus, gross contribution from canalirrigated areas to food production is 19.89 MT, less than ten % of food production. The assumption wehave made above that large dams based canal irrigated areas would have contributed to foodgrainsproduction in proportion of their proportion in irrigated areas is not unjustified if we look at someavailable data.
An argument that some researchers (for example, see Dhawan 1993: 74) have made that a lot ofgroundwater irrigation in actuality is possible due to seepage from canals based on large dams raisesmany issues. Firstly, there are no scientific studies quantifying the contribution of large dams based canalirrigation to groundwater seepage. (Vaidyanathan 1999: 95) Secondly, the large dams were notconstructed to first store water flowing in the river (which itself was recharging huge areas), then conveyit through canals over long distances at considerable expense and then encouraging seepage in those areasso that wells would be dug and that water would be lifted to irrigate farms in and around command area.If that was the aim than local rainwater - harvesting measures is a much more cost effective, quicker, lessdestructive and much more sustainable and sensible way of achieving those objectives.
In India, there is little research about the relation between rivers and aquifers. (World Bank, 1995c; WorldBank, 1998c) Adjacent areas in Punjab, Haryana, Rajasthan and Gujarat are known to have water loggingconditions in one area and water table falling due to groundwater overdraft in adjacent area. (World Bank,1998c) This puts big question mark over the claim that a lot of groundwater used comes from canalseepage.
Thus, the claim made by a number of supporters of large projects that India has achieved food productionof today due to large dams based irrigation is quite erroneous looking at the facts. The gross contribution,this calculation shows, is less than 10%.
A part of this 10% contribution from canals of M & M projects is actually from barrage based projectsconstructed after independence, as against those from storage based projects. Sharada Sahayak canal isone example of this. We will ignore this since information is not available as to how many of the M & Mbased projects were barrage based and what is their contribution in canal irrigation.
Secondly, to arrive at net contribution made by canal irrigation from M & M projects, we should subtractthe production these lands would have yielded anyway.
Thirdly, Lands lost to canal and drainage infrastructure schemes typically represent 2-5% of the irrigatedcommand area created. With schemes involving reservoirs, a further 3-8% of land is lost. Total land lostannually to reservoir inundation is estimated at 50,000 ha (World Bank, 1991: 78).
Thus going by World Bank (1991a: 41-2) estimates, land equal to at least 5-13% of irrigated areas ofthese projects is lost for either submergence (3-8%) or canals and other infrastructure (2-5%). Forexample, in case of SSP, while submergence would take up land equal to about 2.1% of area (39,000 ha)to be irrigated (1.8 M Ha), the total canal infrastructure is to take up 1,86,000 Ha (land equal to 10.3% ofprojected command area of the project). Thus utilisation of this additional 24.88 M Ha of irrigation

World Commission on DamsThematic Review: Assessment of Irrigation Options in India, Draft #1, Date: 08/11/1999
This is a draft working paper of the World Commission on Dams. It was prepared for the commission as part of its informationgathering activity. The views, conclusions and recommendations are not intended to represent the views of the Commission.
25
potential would have taken out of production at least 1.99 M Ha of land, at 8% of additional irrigationutilised. This figure of 1.21 M Ha too seems to be an underestimate, as going by another of the WorldBank estimate of land lost due to reservoir inundation at 50,000 Ha per annum, over a period of fiftyyears, reservoir inundation alone would have taken out of production 2.5 M Ha. Though not all landsgoing under submergence is cultivable, a substantial part is. As far as land taken away for canals isconcerned, almost all of it is cultivable land lying in the potential command of the project.
In post independence India, due to domination of large dam centered irrigation projects, there has beenutter neglect of local rainwater harvesting systems. Thus, the area under tank irrigation has gone downfrom 4.8 M Ha in 1962-63 to 3.1 M Ha in 1986-87. Other sources give even higher amount of loss in areairrigated by minor surface schemes. Thus this loss of 1.7 M Ha of actual irrigated area too must go in theaccount of large irrigation dam projects. Actual figure thus lost from irrigated area is likely to be muchlarger, but for lack of reliable data, we will assume this loss to be only 1.7 M ha.
Another loss we have incurred in the process of achieving this M & M projects based irrigation is in termsof lands going out of production due to waterlogging and salinisation.
What is important to remember is that while thus adding less than 10.0% of additional foodgrainsproduction, we have lost an opportunity of developing our water resources over a much larger area, muchmore equitably, sustainably, in a much more participatory and cost effective manner. The social,environmental and even economic costs incurred would have been much lower. The additional foodgrainsproduction that would have been possible, if we had taken the alternative path, would have been muchlarger, it can be safely said. Unfortunately, it is very difficult to come up with figures of what alternativepath would have produced, as it was just not tried.
In conclusion, it is clear that canal irrigation areas have made only marginal (less than 10%) contributionto food production in India since independence. If we subtract the losses we have incurred in the processof achieving this production from this achievement, the figure would be even less than 5%.
3.3.1 Success in the Northwest
The success story in the Northwest was made possible by the major development of surface irrigation inthe 19th and early 20th centuries. Other important factors for this success story including the intensive useof other inputs like HYV seeds, fertiliser usage, better infrastructure availability and most importantly,state support for massive groundwater development. It can be seen from the figures above that nearly60% of area covered by irrigation in this belt was irrigated by groundwater. And groundwater here is atleast 70% more productive than canal irrigation.
• That area is already experiencing plataueing in general and decline in foodgrains production growthrates in specific areas.
• The large project based WRD has left over 65% of cultivators high and dry.• 22.7% of the potential created (30.5 M Ha) by M & M projects remained unutilised in 1984-85. The
gap in minor and groundwater schemes was only 6%.• Total irrigation benefits to tribal sub plan areas (133 districts of the country) is 0.37 M Ha, which is
less than half percent of total area brought under irrigation. As against this, the tribals constitute 6.9% of country�s population. (1984-85 figures.)
• A total of 99 districts in 13 states of the country have been identified as drought prone. These districtscover a total geographical area of 108 M Ha (33%) against the country�s geographical area of 329 MHa and cultivable area of 77 M Ha (42%) against the country�s cultivable area of 184 M Ha.
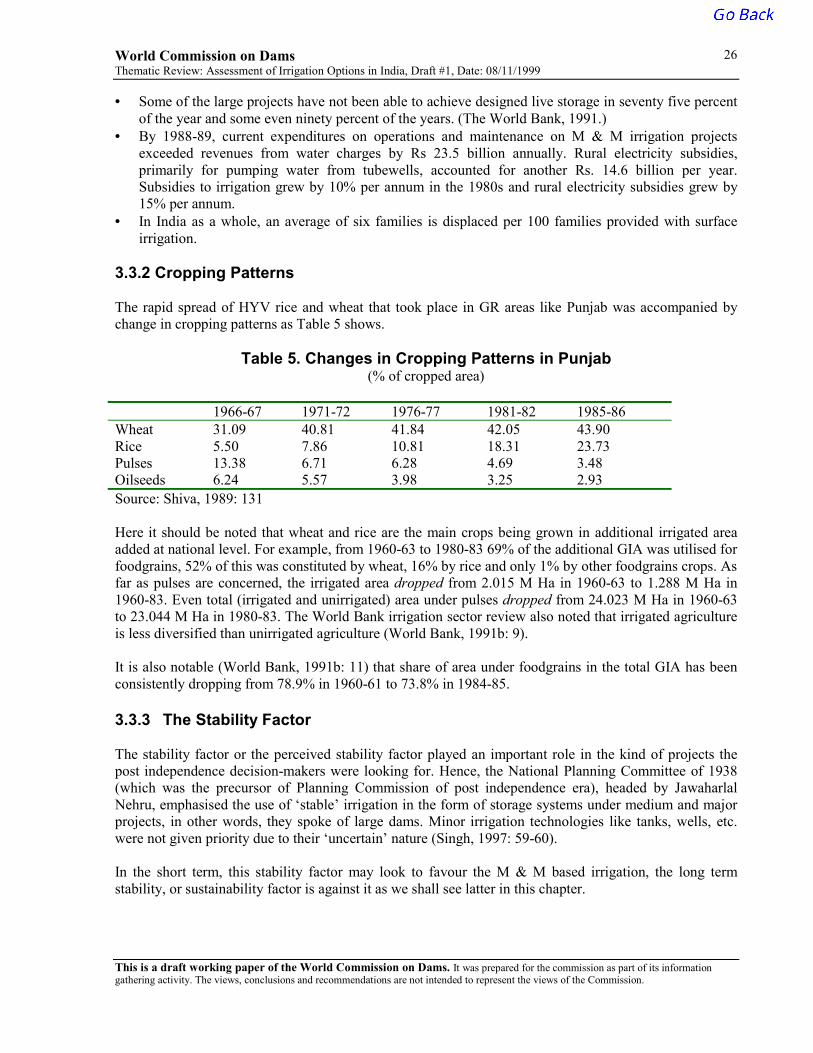
World Commission on DamsThematic Review: Assessment of Irrigation Options in India, Draft #1, Date: 08/11/1999
This is a draft working paper of the World Commission on Dams. It was prepared for the commission as part of its informationgathering activity. The views, conclusions and recommendations are not intended to represent the views of the Commission.
26
• Some of the large projects have not been able to achieve designed live storage in seventy five percentof the year and some even ninety percent of the years. (The World Bank, 1991.)
• By 1988-89, current expenditures on operations and maintenance on M & M irrigation projectsexceeded revenues from water charges by Rs 23.5 billion annually. Rural electricity subsidies,primarily for pumping water from tubewells, accounted for another Rs. 14.6 billion per year.Subsidies to irrigation grew by 10% per annum in the 1980s and rural electricity subsidies grew by15% per annum.
• In India as a whole, an average of six families is displaced per 100 families provided with surfaceirrigation.
3.3.2 Cropping Patterns
The rapid spread of HYV rice and wheat that took place in GR areas like Punjab was accompanied bychange in cropping patterns as Table 5 shows.
Table 5. Changes in Cropping Patterns in Punjab(% of cropped area)
1966-67 1971-72 1976-77 1981-82 1985-86Wheat 31.09 40.81 41.84 42.05 43.90Rice 5.50 7.86 10.81 18.31 23.73Pulses 13.38 6.71 6.28 4.69 3.48Oilseeds 6.24 5.57 3.98 3.25 2.93Source: Shiva, 1989: 131
Here it should be noted that wheat and rice are the main crops being grown in additional irrigated areaadded at national level. For example, from 1960-63 to 1980-83 69% of the additional GIA was utilised forfoodgrains, 52% of this was constituted by wheat, 16% by rice and only 1% by other foodgrains crops. Asfar as pulses are concerned, the irrigated area dropped from 2.015 M Ha in 1960-63 to 1.288 M Ha in1960-83. Even total (irrigated and unirrigated) area under pulses dropped from 24.023 M Ha in 1960-63to 23.044 M Ha in 1980-83. The World Bank irrigation sector review also noted that irrigated agricultureis less diversified than unirrigated agriculture (World Bank, 1991b: 9).
It is also notable (World Bank, 1991b: 11) that share of area under foodgrains in the total GIA has beenconsistently dropping from 78.9% in 1960-61 to 73.8% in 1984-85.
3.3.3 The Stability Factor
The stability factor or the perceived stability factor played an important role in the kind of projects thepost independence decision-makers were looking for. Hence, the National Planning Committee of 1938(which was the precursor of Planning Commission of post independence era), headed by JawaharlalNehru, emphasised the use of �stable� irrigation in the form of storage systems under medium and majorprojects, in other words, they spoke of large dams. Minor irrigation technologies like tanks, wells, etc.were not given priority due to their �uncertain� nature (Singh, 1997: 59-60).
In the short term, this stability factor may look to favour the M & M based irrigation, the long termstability, or sustainability factor is against it as we shall see latter in this chapter.

World Commission on DamsThematic Review: Assessment of Irrigation Options in India, Draft #1, Date: 08/11/1999
This is a draft working paper of the World Commission on Dams. It was prepared for the commission as part of its informationgathering activity. The views, conclusions and recommendations are not intended to represent the views of the Commission.
27
Even in short term, a number of papers in early eighties noted that M & M irrigation did not necessarilyimpart stability to agriculture. This is because while more capital intensive inputs used in irrigatedagriculture may mean good yields in favourable years, but are riskier than traditional practices in badyears. This is seen to be so in Bihar, MP and AP. While national level data show stabilising effects ofirrigation, desegregated picture with respect to different sources of irrigation in different regions is notavailable (World Bank, 1991b: 8).
3.4 Contribution in Food Security
It is often presumed that famines have been eliminated in independent India through a revolutionaryincrease in food production. There certainly has been some rise in food production per capita sinceIndependence (and the �GR� has been effective in the production of wheat in particular), but the increasein food production per head has not been very large. Indeed, the average per capita food availability inIndia today is not substantially greater than in the late 19th century (a decline over the first half of thiscentury having been balanced by an increase after independence). The causes of success of Indian famineprevention policy have to be sought elsewhere � in the process of entitlement protection through variousmeasures of income generation and price stability, and the compulsion generated by adversarial politicsthat ensures early public intervention.
Amartya Sen and Jean Dreze (Sen, 1995: 28-9)6
Govt. of India claims that the fact that the country has not witnessed famine and acute starvation on amassive scale in the last decades is the most eloquent testimony for the success of Government efforts foreradication of famines (GOI, 1999: 529).
It is now increasingly argued that at macro level, there is no foodgrains constraint in India. In fact, theReport of the Working Group on Foodgrains Requirements by 2000 AD expressed optimism that Indiahas an exportable surplus of foodgrains to the tune of 20 MT (around 10% of foodgrains production) andthat this is likely to go further up by the year 2000 (Shah, 1998: 45).
Food security is to be interpreted to mean adequate availability of basic food items particularly,foodgrains in the country as a whole and also availability of purchasing power to meet the foodrequirements at the household level (GOI, 1999: 441).
According to Govt., the essential elements of food security are: (a) adequate availability of food, (b)efficient distribution through trade and / or public distribution system (PDS), and (c) availability ofadequate purchasing power in the hands of the people. (GOI 1999: 531) This reduction of the foodsecurity into three separate steps has lead to its failure. What is missed out is that all three are linked andin addition it is assumed that there is perfect market mechanism in place, which is just not there. Lopsidedavailability of credit and insurance, transport bottlenecks, inadequate storage capacities, inadequatedistribution of food corporation of India centres, almost total lack of credible regulatory mechanisms,total lack of transparency & accountability in the functioning of PDS and abysmal poverty are only someof the market imperfections. And then for markets human compassion or food insecurities are not relevantissues. Particularly in a thickly populated country like India, where food production is a means oflivelihood for a large section of peasant cultivators and agricultural labourers, food production wouldhave to be decentralised.
In fact, in a path - breaking study based on 1961-2 data, it was shown that the per capita calorie intake in astate was determined by the level of per capita foodgrains output from that state. The failure of the marketmechanism in food meant that having a higher per capita income did not translate into a higher per capitafoodgrains consumption. And also that a higher national availability of food did not translate into higher

World Commission on DamsThematic Review: Assessment of Irrigation Options in India, Draft #1, Date: 08/11/1999
This is a draft working paper of the World Commission on Dams. It was prepared for the commission as part of its informationgathering activity. The views, conclusions and recommendations are not intended to represent the views of the Commission.
28
local availability or consumption. Recently this finding has been confirmed using data for the period1973-89. It appears that the income levels of the poor in the deficit states are still too low to attract foodfrom surplus states via the market, despite the almost complete halting of compulsory procurement indeficit states (Shah, 1998: 45).
Thus, Planning Commission accepts that there is a need to disperse the foodgrains production base in thedeficit regions in order to ensure physical access to food for all at affordable prices. The associationbetween regional self - sufficiency in production and the level of regional prices is quite strong. Thismeans that the consumers in the deficit regions have to pay substantially higher prices for foodgrains thanthose in the surplus regions. The data from the National Sample Survey (NSS) 43rd round on consumerexpenditure show that the consumers in the rural areas of many deficit states paid significantly higher unitprices than their counterparts in the surplus regions. For example, the price of cereals in rural areas in1987-88 in surplus states like Punjab, Haryana and UP was between Rs. 2.15 to Rs. 2.35, the price indeficit and poor states like Bihar, Assam and West Bengal it was between Rs. 3.4 and Rs. 3.7. For thePoor consumers in the deficit regions higher prices of foodgrains may imply lower consumption of foodand consequent poor intake of nutrition.
To overcome these problems, food security strategy will have to expand food production in deficitregions, the planning commission accepts. (GOI 1999: 537) Direct implication this would that theirrigation source will also have to be decentralised across the country. However, we see no evidence ofany attempt or appropriate resource allocations to achieve this objective.
The strategy of dispersal of production base has several other spin off benefits, the planning commissionaccepts. First, hitherto deficit regions will increasingly contribute to incremental production, since yieldrates in the traditional surplus regions have plateued. Second, large transaction costs involved intransporting foodgrains from a few surplus pockets to all corners of the country can be avoided.Administrative costs in this venture typically constitute about 20% of the pooled economic cost offoodgrains. Third advantage is the widely dispersed employment and income effects, implicit in such astrategy (GOI, 1999: 538).
The Ninth Five-Year Plan goes on to admit:⇒ The population still lacks balanced food.⇒ There has been a fall in the per capita consumption of pulses. It is not only important improve pulseproduction but also make them available at affordable cost.⇒ The production and consumption of vegetables and fruits continue to remain low.⇒ Poverty and lack of purchasing power have been identified as two major factors responsible for lowdietary intake.⇒ Studies indicate that supply of subsidised food given through PDS has not resulted in improvement inhousehold level food security. Self-sufficiency of foodgrains at national level has not got translated intohousehold level food security for the poor.
It is thus clear that the increase in food production itself has not ensured food security for the poor, asadmitted by the Government. The PDS that existed till recently has been widely criticised for its failure toserve the population below the poverty line, its urban bias, iniquitous distribution, poor coverage, lack oftransparency and accountability (GOI, 1999: 539).
The government hopes that the new targeted PDS will ensure better household food security for familiesliving below poverty line (GOI, 1999: 529). However, there is little convincing evidence that the TargetedPublic Distribution System will succeed where PDS failed. Primarily because there is no mechanism totake care of the problems with PDS listed in earlier paragraph.

World Commission on DamsThematic Review: Assessment of Irrigation Options in India, Draft #1, Date: 08/11/1999
This is a draft working paper of the World Commission on Dams. It was prepared for the commission as part of its informationgathering activity. The views, conclusions and recommendations are not intended to represent the views of the Commission.
29
The problem is with the whole attitude of looking at the production, distribution and supply systemsseparately. It is assumed that if macro level production is ensured, and if it is supplied to consumptionpoints, food security will be ensured. It is forgotten that the production processes are closely linked withemployment generation and purchasing/ retaining capacity of the poor to get access to necessary food.The issue of control of production/ distribution processes also assumes crucial importance here.
Assumption that macro level production sufficiency will help reach food security is at the heart of supportfor large dams based irrigation systems. The failure of that assumption has lead to impoverishment andfood insecurity for millions in India.
As Sen and Dreze conclude (Sen 1995: 93) from their study of drought of Bihar (1966-67) andMaharashtra (1970-3) that the growth of food production alone would have fallen far short of ensuring theprevention of famines in India in the last few decades. There is little evidence of increasing rural incomesand employment in unirrigated areas, which still cover around two thirds of the total cropped area. Theseregions have also experienced huge ecological problems of deforestation, soil erosion and falling watertables against a background of rapidly growing population. Neither rapid economic growth, nor rapidgrowth in agriculture, not even rapid growth in food production is by themselves an adequate safeguardagainst famines. The key to famine prevention is the public policy for recreating lost entitlements, noteSen and Dreze. (Sen 1995: 29) Unfortunately, the disappearance of large scale famines in India hasindeed coexisted with the reselient persistence of mass poverty and hunger (Sen, 1995: 155).
Even in the heart of GR region of Punjab, the food abundance for the market has not been translated intonutrition for the girl child within the house. A study done in 1978 in Ludhiana district of Punjab showsthat the percentage of female children who were undernourished was higher than that of undernourishedmale children within the same economic group (Shiva, 1989: 117).
The increasing food surplus, according to prominent economist VKRV Rao, is a myth because it iscreated by lack of purchasing power. Dr. C Gopalan, India�s leading nutritionist, has also stressed that ourbuffer stocks are apparently more an indication of poverty of our masses than of real food surplus.
With the grain silos overflowing, the country�s foodgrains kitty had swelled to a peak of 35 MT in 1995(Sharma, 1997: 19).
⇒ As late as in Aug. 1996, an opposition leaders alleged that nearly 500 tribal children in Dharni andChikaldhara sub - divisions of Amravati district, Maharashtra, had died of malnutrition in the months ofMay and June (Sharma, 1997: 29).⇒ In 1996, India�s National Human Rights Commission reported that most of the cases theyinvestigated after allegations of starvation deaths in Kalahandi district in Orissa that year had turned outto be cases of starvation deaths.⇒ Spectre of famine hounted Bihar�s Palamu district in 1991-92 so severely that the Prime Minister hadto air dash to the region to look into the issue (Sharma, 1997: 30-31).⇒ The UNICEF has said that at least 5,000 children die every day in India from diseases that are thedirect result of malnutrition (Singh, 1997: 128).⇒ The actual requirement of foodgrains that needs to be distributed among the poor in India, based onthe minimum nutritional norms projected by Indian Council of Medical Research, should exceed 52 MTevery year. Does it not mean that all these years we have been deliberately pushing down the per capitafoodgrains availability among the poor (Singh, 1997: 151)?⇒ A recent study concludes that in the eastern states and MP, the poorest two decile groups of thepopulation do not get any PDS support worth mentioning (Shah, 1998: 45).

World Commission on DamsThematic Review: Assessment of Irrigation Options in India, Draft #1, Date: 08/11/1999
This is a draft working paper of the World Commission on Dams. It was prepared for the commission as part of its informationgathering activity. The views, conclusions and recommendations are not intended to represent the views of the Commission.
30
One of the important factors for food security for the poorer people is production of coarse cereals. Butthe GR paradigm has obvious bias against this �inferior� kind of food. With an average yield of 923 kgper ha, India�s productivity in coarse grains is about 43% of the average in developing countries;productivity in India has declined over the years (Sharma, 1997: 66).
Similar is the treatment meted out to pulses as is evident in the steady decline in the availability andproduction of pulses. Per capita availability of pulses have declined from 70 grams in 1956 to 37 grams in1991-3. Growing pulses in India is important as 80% of population depends on it for the intake of proteins(Sharma, 1997: 67).
There is thus increasing evidence that shows that it is the local food production that has the greatestchance of assuring food security. However, GOI�s policy on food self sufficiency says, �Foodgrains self -sufficiency refers only to the country as a whole and there is no need for self sufficiency at the State orregional level� (GOI, 1999: 449).
Expansion in agricultural output as a result of irrigation has also helped keep food prices down. Between1970 and 1986, for example, food grains prices in India fell by about 20% relative to the price index forall commodities (World Bank, 1991a: 5). The contribution for such impacts, of course come from allsources of irrigation and is not limited to M & M projects. The problem with the M & M kind of projectsis that they create islands of prosperity among the sea of poverty. This is not going to assure food securityas above analysis shows.
3.5 Contribution in Equity
Land holding pattern in India is very inequitable. In 1982, about 3.98% of the top rural households ownedas much as 33.46% of the land. The top 20% of rural households owned as much as 73.19% of the land,while the bottom 40% held a mere 1.2% of the total landholdings. About 81.34% of the rural householdshad either no or less than 2 ha, amounting to 28.67% of the cultivated area (Singh, 1997: 77). There isincreasing evidence that shows that the irrigation development in India has only increasing inequities inlandholdings. Following is some of the pointed evidence that shows how canal irrigation is increasing theinequities.⇒ Research (G S Bhalla, Changing Structure of Agriculture in Haryana: A Study of the Impact of theGR, Chandigarh, Punjab University, 1972, quoted in Shiva, 1989: 116) has shown that in both HYVwheat and HYV rice areas, the distribution of operated land has shifted in favour of big farmers.⇒ Even a Planning Commission study on irrigation projects has shown that size of land holdingsincrease in the command area. In the Tribeni canal project areas, the size of the average farm in thecommanded zone is 12.14 acres, higher in comparison to the average farm in the uncommanded zone,9.84 acres. In the Sarda canal project, the sample holding in the commanded zone has on an average anarea of 4.6 acres as against 2.9 acres in the uncommanded zone. The study also points out that peoplefrom outside the command zone come and buy out large chunks of land on arrival of canal irrigation.Other researchers have noted in case of Bhakhra and Kosi canals that that the holdings of the larger andmore powerful landlords often were closest to the head of the watercourse and they receive more waterper acre of holdings that the smaller farmers (Singh, 1997: 176-7).⇒ This author has seen in case of upcoming SSP how the canal alignments also get changed to suit thelarger farmers.⇒ Many have suggested that allocation of scarce irrigation water in over designed systems is biased infavour of larger and more powerful owners. While it would seem difficult that the allocation is biasedspecifically to lands of large farmers in gravity distribution systems, it is noted that the large land owners

World Commission on DamsThematic Review: Assessment of Irrigation Options in India, Draft #1, Date: 08/11/1999
This is a draft working paper of the World Commission on Dams. It was prepared for the commission as part of its informationgathering activity. The views, conclusions and recommendations are not intended to represent the views of the Commission.
31
do take over land (through purchase or otherwise) in the head reaches of canals (for example, seeVaidyanathan, 1999: 44).⇒ There is evidence to show that there is significant bias in favour of large farmers as far as distributionof groundwater irrigation is concerned. Also, in general, large farmers seem to be the principle source ofsale of well water to others (Vaidyanathan, 1999: 85).⇒ Though historically, small farmers have had a higher proportion of their land under irrigation than thelarge ones, the large farms have experienced much larger increase in the irrigation ratio by both sources(surface water and groundwater) than small holdings. This tendency is more pronounced in the case ofsurface water irrigation than groundwater irrigation. (Vaidyanathan 1999: 88) This proves that theirrigation development in post independence India have favoured large landholders.⇒ Thus, while small and marginal holders of land have experienced 6.7% and 0.28% respectivelyincrease in proportion of their land irrigated by surface water, the large land holders (holdings more than10 ha) have experienced 254.21% increase. Similarly, while the small and marginal holders haveexperienced 171.64% and 192.15% respective increase in proportion of their land irrigated bygroundwater, large landholders have experienced 416.46% increase (Vaidyanathan, 1999: 88).⇒ Thus, Vaidyanathan (1999: 101) reaches the conclusion that hardly one-fifth of the Indian farmersbenefit from canal irrigation, and among those that do, the better off farmers, receive bulk of the benefits.⇒ Compounding this with the fact that the net income per Ha increases with larger irrigated farm size(despite a tendency for cropping intensity to fall) (World Bank, 1991b: 13-4) we see how irrigation leadsto further inequities.
On another front, violence against women related to dowry issues has been found to be highest in the GRregion of the north - west India and is part of the general violence that is becoming endemic in Punjab.Other researchers have noted that the north western states of Punjab and Haryana rank amongst thehighest in terms of the adoption of new GR technology�.. However, it is precisely the northwesternregions where discrimination against female is most noted, both historically and in the recent period(Shiva, 1989: 118).
3.5.1 Contribution to Tribal Development
In pursuit of large dams based irrigation systems, Indian planning have neglected drylands. Within thedrylands, the implications of environmental degradation are to be most acutely felt in the tribal areas. Theattempted integration of the tribal communities into the national mainstream must be regarded as thebiggest failures of Indian planning (Shah, 1998: 1-2).
The implications of this neglect are serious as half the additional supply of foodgrains required to meetthe projected demand at the beginning of the next millennium would have to come from the drylands ofIndia (Shah, 1998: 4).
The drylands development can have three fold objectives: increase the productivity of small farms, thusincrease food production, increase employment generation, and reduce poverty. The drylands now arecharacterised by lowest levels of productivity even while employing nearly 50% of the labour force inIndian agriculture. Drylands represent vast unutilised potential, which in the recent wave of liberalisationseems further overlooked (Shah, 1998: 44).
The focus of the drylands related works must be on carrying out public works on the lands of the poorestfarmers. Latest data from Rural Labour Enquiry, 1987-88 reveal that the proportion of the landed amongthe agricultural labour households (Households which possess land but derive a majority of their incomefrom agricultural labour.) had risen to as high as 79% in 1987-88. According to the NSS 48th round data,in 1992 as many as 72% of the rural households in the country owned less than 1 Ha of land. Thus, an

World Commission on DamsThematic Review: Assessment of Irrigation Options in India, Draft #1, Date: 08/11/1999
This is a draft working paper of the World Commission on Dams. It was prepared for the commission as part of its informationgathering activity. The views, conclusions and recommendations are not intended to represent the views of the Commission.
32
increasing number of small and marginal farmers, operating low productivity holdings are being forced toenter the labour market. These landed labourers occupy an estimated 8 M Ha (Shah, 1998: 46).
The inequities of development in the lands where tribal population dominate can be seen from thefollowing.⇒ There is a steady increase in the proportion of Gross Sown Area (GSA) in district area as the share oftribal population falls in the district population.⇒ GIA as a proportion of GSA of the district falls steadily as the share of tribal population in the districtrises.⇒ The Report of the study group on agricultural strategies for the Eastern Region shows that the growthrate of agricultural output in districts between 1970-73 and 1980-82 in eastern UP, Bihar, Orissa and WestBengal is inversely related to the proportion of ST in the population (Shah et al, 1998: 159-60).⇒ Indeed, distinguishing feature of tribal peasants is that, in general, they hold land of a very poorquality. Tribals also inhabit the ecologically most difficult terrain in the country (Shah et al, 1998: 163).⇒ The Rural Labour Enquiry 1987-8 reveals that 83% of the tribal households, who derived a majorityof their income from agricultural labour, were landed. This proportion is the highest for Scheduled Tribe(ST) households even though their share in marginal operational holdings is the lowest. This suggests thatamong tribals, not just marginal but some of the small and semi medium landholders might also bederiving a majority of their earnings from agriculture labour (op cit: 164).
3.6 Contribution in Balanced Regional Development
M & M projects based irrigation potential itself being inherently balanced by region, the impact of M &M projects is bound to be regionally imbalanced (World Bank, 1991a: 5). This is made doubly so by thegovernment�s lopsided investment priorities. Punjab, Haryana and UP, which account for less than 13%of total geographical area and 17.6% of the net sown area in the country, have 38% of the net irrigatedarea (Sengupta, 1993: 14, see also Annex table 4).
Productivity data show that top 26 productive districts have 18.34% of total GIA and bottom 29 districtshave just 4.13% of total GIA. This is in spite of the fact that top 26 districts have lower (8.33%)proportion of gross cropped area compared to 11.22% gross cropped area in the bottom 29 districts(World Bank, 1991b: 16).
The Productivity growth rates of agriculture for the period 1962-65 to 1980-83 show that while thenational growth rate for the period was 2.01% per annum the rate was highest at 4.51% in Punjab and thelowest at (-) 0.30% in Orissa. Thus, the productivity actually declined in poorer states like Orissa and waslow at 0.37 in whole of eastern region. In fact, all regions except the northwestern region experiencedlower than national productivity growth rates. This kind of lopsided development was the direct result ofthe investment concentration for irrigation development in the Northwest India. Thus, while national levelincrease in % net sown irrigated area was 9%, the same was 29% in Punjab and 4% in Orissa. This isspite of the fact the Orissa and other eastern region states are richer in terms of rainfall and potential forirrigation development than any other region. That this productivity potential is real and not theoretical isillustrated by the small proportion of farmers who have access to groundwater use and who have achievedproductivity comparable to those in Northwest India. World Bank notes that this has been due to �unevenrates of past irrigation development initially concentrated in the northwest� (World Bank, 1991b: 18-20).
A glance at Annexure 6 shows that irrigation development has been concentrated in northern region, evenas whole country needs agricultural and irrigation development. The table also shows that even though thepoorer eastern region states of Orissa, Bihar and Eastern UP have large untapped potential of irrigationdevelopment, the potential continues to remain unutilised as most of the available resource keep getting

World Commission on DamsThematic Review: Assessment of Irrigation Options in India, Draft #1, Date: 08/11/1999
This is a draft working paper of the World Commission on Dams. It was prepared for the commission as part of its informationgathering activity. The views, conclusions and recommendations are not intended to represent the views of the Commission.
33
concentrated in already irrigation - wise, agriculturally and otherwise resource rich northern region. Thetrend continued even in the eighth plan. Ninth Five Year Plan (GOI, 1999: 500) notes that even in EighthFive Year Plan, states like Punjab, Haryana, Tamil Nadu, AP and Maharashtra incurred more expenditurethan the approved outlays. In the major eastern states, which are already lagging behind the nationalaverage of 56% in terms of creation of irrigation potential through M & M projects, the level of actualexpenditure was 43% in case of Bihar, 40% in case of Orissa and 64% in case UP, of the approved outlay.
This kind of imbalanced development continues even within states, with already resource rich areasgetting more of additional resources. For example, in Gujarat, the really drought prone areas areSaurashtra, Kutch and North Gujarat. It was in the name of the needs of these regions that a veryambitious and expensive SSP was pushed forward and justified. And most of the benefits of the project isnow likely to go not to these regions, but to the already resource rich central Gujarat region. And withover 70% of irrigation budget of the state going for SSP, there is no money for the possible and availableoptions in the drought prone areas of Gujarat.
Similarly in Orissa, while the western Orissa districts like Kalahandi and Bolangir continue to reel inpoverty in spite of average annual rainfall of 1200 mm, the World Bank funded Orissa Water ResourcesConsolidation Project has assured that most of the future resources for water resources development willgo to the already developed coastal Orissa region.
The point is that this is due to the very character of the M & M projects. Such projects invariably needlarge proportions of available resources, they demand and get them, even though the overwhelmingproportion of areas, where too both rain falls and where too needs of water resources, irrigation anddevelopment are acute, are left out.
In the Eighth Five Year plan, 70% of money was allocated for M & M projects, even when it is clear thatalmost two thirds of irrigation is coming from what the government chooses to call Minor projects. Thus,when projects, which would benefit at the most 11% of land area take up 70% of available resources,large part of the country is bound to suffer. The Ninth Plan outlay allocates even higher funds for M & Mprojects and Command Area Development Programme (CADP), the total outlay under these two heads(Rs. 458.61 billion), both going for M & M projects, is 78.84% of total Ninth Plan outlay for irrigationsector (Rs. 581.64 billion) (GOI, 1999: 518).
3.6.1 Hills Development vs Plains Development
Large dams are often constructed in the upstream mountainous regions for the benefit (for irrigation,flood control, power and drinking water needs) of the people in the flood plains. Constructing dams in thefragile mountainous region leads to a series of environmental impacts. First among the serious impacts areof course the submergence of large tracts of lands, forests and riverine ecosystems. A large storagestructure increases moisture content in the upstream regions leading to increasing and changingvegetation pattern thus creating new ecology. In addition, the increasing moisture content in the upstreamwill bring about new morphological changes, increasing landslides, and emergence of stream formationsand increasing silt.
Large Dams have also meant neglect of development needs of hill areas. In a sense, thus, the planners anddecision makers have almost always given higher priority to the development of the plains compared tohill regions. This has also happened because, the only irrigation development options in hill regions areinvariably local projects, unlike in plain areas, where both local and macro development options areavailable. Bandyopadhyay and Gyawali (1994) recommend, �It is contended that any managementapproach must begin at the micro level in the upper reaches of the rivers and extend downward through

World Commission on DamsThematic Review: Assessment of Irrigation Options in India, Draft #1, Date: 08/11/1999
This is a draft working paper of the World Commission on Dams. It was prepared for the commission as part of its informationgathering activity. The views, conclusions and recommendations are not intended to represent the views of the Commission.
34
the length and breadth of the entire drainage basin. In this way, the micro level and macro levelmanagement will be bound together ecologically and will be seen as interdependent.�
It is important to note here that such dichotomy between the development of plains areas at the expense orneglect of hill areas has also implied severe costs for the dams built for the plains areas. Siltation is onlyone of the consequences of the neglect of the hill region for the large dams. Other impacts include higherdeforestation for the needs of plains area and due to the neglect of hill area development.
Moreover, relatively little resources are allocated for the irrigation development needs of hill area.Dhawan (1993: 24) agrees that development work on the hillside of river basin gets neglected.
3.7 Contribution in Poverty Alleviation
A significant inverse relation between the incidence of poverty and the extent of irrigation has beenclaimed based on both districts and agro climatic zones. It is claimed that while the incidence of povertyis as high as 69% in districts with less than 10% cropped area under irrigation, it is about 26% in districtswhere irrigation covers more than 50% of cropped area, and just 10% in Punjab and Haryana with over70% of their cropped area under irrigation (World Bank, 1998: 4; World Bank 1991a: 5).
The problem with these data is that they do not give figures of relative impact on poverty among variousoptions available for irrigation. Hence, even if irrigation may have impact on poverty alleviation, whatrelative impacts the various irrigation options have is something that remains unanswered. Unfortunately,these figures are invariably used to push status quo position vis a vis irrigation development, which as wehave seen above, is not justified looking at the contribution of large dams based irrigation in agriculturaldevelopment or foodgrains production.
The World Bank (1991b: 22) notes that an exception to the largely regionally bound nature of irrigation�simpact has been its influence on food prices. Between 1970 and 1986, foodgrains prices fell by about20% relative to the price index for all commodities in India. This issue, however, have a number ofdimensions. Firstly, the lowering of the food prices has not had the most beneficial impact for the poorfarmers in the poorer regions. It has meant lower returns on the foodgrains they sell and there is lessencouragement for them to increase productivity. This is also so as the government procurementmachinery, overactive in the richer Northwest India, has been seen to fail in the poorer regions like Orissaand Bihar. Secondly, the PDS system, as noted elsewhere, has been a failure in most poor rural areas.Thus, the poor farmers, with little capacity to hold on their produce, are at the mercy of the exploitativelocal merchants when they need foodgrains for their consumption.
Thus, the conclusion of the World Bank (1991b: 22) that, �Nevertheless, for the large areas in India likelyto remain without irrigation, addressment of poverty will need to rely on improving the productivity ofrainfed agriculture� is most apt.
There is other evidence that show how the number of poor in India has been increasing.⇒ It has been found that while real wages of agricultural workers in Punjab rose significantly in theearly phase of GR, they virtually stagnated after the mid 1970s due to an increase in mechanisation andmigration to Punjab of agricultural labour (World Bank, 1991b: 21). It is also known that the migratorylabour face undue hardship, exploitation and their family also suffer. Thus, migratory labour is not themost positive sign of development as far as agricultural labour is concerned and the Bank�s contention(1991b: 22) that �Labour movements to higher growth areas have also helped reduce inequalities� isunacceptable.

World Commission on DamsThematic Review: Assessment of Irrigation Options in India, Draft #1, Date: 08/11/1999
This is a draft working paper of the World Commission on Dams. It was prepared for the commission as part of its informationgathering activity. The views, conclusions and recommendations are not intended to represent the views of the Commission.
35
⇒ The no of poor sliding below the poverty line has increased by an estimated 30 million between 1991and 1994 (Singh, 1997: 151).⇒ According to Planning Commission estimates which are based on the NSS data, about 36% of thepeople were below the poverty line in 1993, which went up to 40% in 1998 (Indian Express, 10 October1999).⇒ According to Human Development Report 1999, 52.5% of population in India is below poverty lineby the norm of one dollar a day (Business Line 12 October 1999).
Thus, even if we take planning commission figures, at least 390 million people live below the poverty linein India today. This is higher than India�s total population fifty years ago. It is true that populationincrease has been absorbing some of the impacts of economic growth. But to blame theunderdevelopment at the doorstep of the population increase alone is to enter a vicious circle. Even highpopulation densities do not have to mean high poverty rates is shown by a no. of states like Kerala. On thecontrary, higher development has increasingly seen to mean lower population growth rates. Thus, byconcentrating the scarce resources in a few pockets and keeping the rest of the areas underdeveloped, thedecision makers are guilty of population rise and poverty in such areas.
3.8 Contribution in Employment Generation
The incremental employment generated by the irrigated potential created during eighth plan has beenestimated by the government at 8.7 million person years (World Bank, 1998: 4). Since irrigationdevelopment forges inter - sectoral and inter - regional linkages through output growth and income flow,its employment and income impacts have powerful multiplier effects (World Bank, 1991: 5), it is claimed.
The problem with these reports is that none of them compare the employment generation possible fromvarious options available for irrigation and agricultural development. In absence of such analysis, thesefigures are not helpful to arrive at decision among various options.
Some idea about the quantum of additional employment generated by irrigated crops is available fromfollowing figures from Maharashtra (World Bank, 1991b: 12-3). Rice 21-26 person days/ ha, Wheat 5-6person days/ ha, Oilseeds 10 person days/ ha, Pulses 10-20 person days/ ha. Other figures in case ofKarnataka show that labour usage before and after well irrigation has much higher labour use figures. Thelow additional labour requirement under wheat noted above is noteworthy as wheat occupies 52% inadditional irrigated area. This is explained by mechanisation in wheat farms.
From the above figures we get an indication that on farm employment generation potential is much higherin case of groundwater irrigation compared to M & M projects based irrigation. This contention is furtherstrengthened by the fact the cropping intensity is much higher in groundwater irrigated areas than in M &M projects based irrigation areas. It is well known (see for example, Shah et al 1998) that minor irrigationprojects and soil & conservation works invariably have higher employment generation in creating thesystems.
In table in Annex 12 we have given comparative figures of area irrigated, value of production andemployment generation if, for example, sugarcane were to be replaced by other less water intensive crops.It is clear that area irrigated, value of production and employment generation would all be much higher.That the government and market forces are favouring inappropriate cropping patterns in India is obvious.As we write this today (28 October 1999), there is a news that the sugar lobby is demanding that sugarimports be banned and that permission to export 2 MT (out of production of some 16 MT) be given(Singh, 1997: 165-168). This would only mean export of water and also employment potential from waterand employment scarce regions.

World Commission on DamsThematic Review: Assessment of Irrigation Options in India, Draft #1, Date: 08/11/1999
This is a draft working paper of the World Commission on Dams. It was prepared for the commission as part of its informationgathering activity. The views, conclusions and recommendations are not intended to represent the views of the Commission.
36
3.9 Contribution to Growth and Exports
Agriculture as whole has been an important contributor to country�s exports. The exports of agricultureproducts contributed Rs. 250.4 billion during 1996-97 accounting for 21% of the total exports. In the postliberalisation period, the share of agricultural exports has been continuously rising. A number of policychanges have been introduced to encourage agricultural exports (GOI, 1999: 473).
In 1995-96, India exported more than 5 MT of rice, becoming the second largest exporter of rice in theworld (World Bank, 1998c: 2).
The problem with these kinds of developments is that they hide the reality of water, irrigation, capital, andemployment scarcity in vast areas of India. Whether agricultural exports are the best development optionsfor a country like India and who is benefiting in the process are questions that need to be asked. Theanswer would lead us to question the kind of irrigation options India has perused till date.
3.10 Impact of Green Revolution
The success story of agricultural in the Northwest (India) was made possible by the major development ofsurface irrigation in the 19th and early 20th centuries.
World Bank, 1991b: 48
The formula used under GR is largely exhausted.World Bank, 1998: 15
It is increasingly difficult to obtain any sizeable incremental production from the conventional GR areas.GOI, 1999: 446
Irrigation has surely played an important role in India�s GR. However, all types of irrigation has playedits role and if we see the spread of groundwater use since mid sixties when GR technologies wereintroduced, we see that groundwater has played more significant role than M & M projects. Also, as theWorld Bank notes (1991a: 3), �Irrigation development, while crucial was only one of the factors affectingagricultural development. Other factors include availability of suitable improved varieties, fertiliser andother inputs, and support services such as extension, research and credit. Rural infrastructure such asroads, availability of markets, electrification, schooling and health services have also played an importantrole�.
Long term trends show that the agricultural growth in Punjab, the showpiece of India�s GR, is plateauingout. Productivity growth in Punjab was 5.5% per annum between 1962-65 and 1970-73 and subsequentlyslowed down to 3.7% per annum between 1970-73 and 1980-83 (World Bank, 1991b: 17).
3.10.1 Contribution in Increasing Cropping Intensity
The irrigation has also contributed to increase in cropping intensity, thus making it possible to grow morethan one crop in a year on the same land. However, a lot of increase in cropping intensity was due togroundwater irrigation. In Northwest India and also elsewhere, the contribution of groundwater irrigationis much greater in raising the cropping intensity (World Bank, 1991a: 4). In above sections, since in mostplaces we have used GIA and gross cropped areas, the contribution of the M & M irrigation due toincreased cropping intensity gets covered.

World Commission on DamsThematic Review: Assessment of Irrigation Options in India, Draft #1, Date: 08/11/1999
This is a draft working paper of the World Commission on Dams. It was prepared for the commission as part of its informationgathering activity. The views, conclusions and recommendations are not intended to represent the views of the Commission.
37
Interestingly, looking at the trends of irrigation intensity (GIA/ Net irrigated area) over the years, (WorldBank, 1991b: 2), the irrigation intensity reduced from 110 in 1951-52 to 105 in 1965-66. From then on,increased to 129 in 1984-85. From this, it seems that the groundwater use (which accelerated after midsixties) has had much greater impact on irrigation intensity than M & M projects based irrigation. Thecropping intensity (Gross Cropped area/ Net Cropped area) had also increased only marginally from 112in 1951-2 to 114 in 1965-66 and then increased to 125 by 1984-5. Here too, the impact of increase ingroundwater use since mid sixties seems more significant. The World Bank (1991b: 55) accepts that thehigh cropping intensity in the Northwest is due to rise in tubewell irrigation.
Not all the double-cropped area is in the irrigated regions. Only 60% is likely to be from irrigated area asrainfed double cropping is also expected to have contributed to the double cropped areas (World Bank,1991b: 3).
3.10.2 Bias of Green Revolution
Many researchers have said that the GR technology was biased in favour of big farmers, high inputfarming and developed regions. In fact, some go to the extent of claiming that the GR was �a developmentpolicy made to order for the better off peasant cultivator in the existing high yield areas�. Vandana Shiva(Shiva, 1989: 116) notes that excluding the poorer regions and poorer classes was an explicit, not a tacit,bias of the GR. In 1959, when a Ford Foundation mission of thirteen North American agronomists cameon a mission to India, they rejected the alternative of simultaneous agricultural development in all ofIndia�s 5,50,000 villages. In stead, they advised subsidisation of technical inputs in those areas that werewell irrigated. Thus in the mid-Sixties, India�s New Agricultural Strategy to promote new seed varietiesended up concentrating on already privileged farmers, who in GR language became progressive farmers.The rest were forced to move backward for lack of resources to maintain or increase the available wateror other resources in their areas.
3.11 Sustainability Issues
Strange as it may sound, in substantial parts of India, areas experiencing water logging & salinisation dueto excess of water are in close proximity with areas experiencing groundwater overdraft. This can beshown to be the case in Gujarat, Rajasthan, Haryana and Punjab.
World Bank, 1998c: 14
The GR approach has converted a recycling, self renewing food system into a production line withhybrids and chemicals as inputs, and food commodities as outputs. Nature�s food chains have beenbroken as multinational corporate �food chains� gain control over the production and distribution of food.
Shiva, 1989: 120
In this section we will examine the sustainability of the large dams based irrigation systems from differentangles. First we will look at the trends in Rice and Wheat productivity in India as these crops representthe largest area brought under GR agriculture and under M & M projects based irrigation.

World Commission on DamsThematic Review: Assessment of Irrigation Options in India, Draft #1, Date: 08/11/1999
This is a draft working paper of the World Commission on Dams. It was prepared for the commission as part of its informationgathering activity. The views, conclusions and recommendations are not intended to represent the views of the Commission.
38
3.11.1 Rice: Falling Growth in Productivity at All India Level
Table 6. Annual Growth Rates in Rice Production in India
Annual Compound Growth (%)Zone1970-80 1980-90 1990-97
ProductionNorth 6.81 5.03 2.11South 2.04 2.19 1.15East 0.10 6.51 1.90West 0.69 1.42 2.34India 1.98 3.63 1.84ProductivityNorth -4.10 4.20 1.29South -0.98 2.88 0.80East -0.02 4.06 1.97West 0.41 0.96 2.12India -1.10 3.25 1.60Source: Siddiq, 1999: 39
Rice has been consistently contributing 45% of India�s cereal production. The last decade has seen steepfall in growth rates of production, productivity and area under rice cultivation. The zone wise and allIndia figures for growth rates in production and productivity are given Table 6.
The above figure from the Directorate of Rice Research, Hyderabad (India) clearly show that Productiongrowth rate in the nineties has dropped at all India level and also in three of the four zones listed above.Similarly, the Productivity growth rate of rice (1,851 kg/ Ha at all India level) has dropped in the ninetiesat all India level and also in three of the four zones listed above. Thus, the rice production andproductivity are reaching a plateau in spite of increasing use of fertilisers and other inputs. Thus, the fearthat the productivity may start falling in due course is not unfounded.
Some of the important reasons identified for plateauing of rice productivity include:⇒ Depletion of organic matter content, particularly in the rice � wheat areas;⇒ Over - mining of native nutrient reserve;⇒ Emergence of macro and micro nutrient deficiency problems;⇒ Increasing problems of salinity � alkalinity in the command areas.
3.11.2 Wheat: Falling Growth Rates of Production
According to Director of Directorate of Wheat Research, Haryana (Nagarajan, 1999: 49), following arethe important issues around wheat productivity.⇒ Punjab and Haryana have achieved high productivity, but future gains are going to be marginal.⇒ In fact, Karnal district in Haryana has seen a drop in productivity of wheat.⇒ Increasing crop intensity, decline in soil organic content and mining of micronutrients from the soilhave come in the way of increasing wheat yields.⇒ In the north - western India, there are about a million tubewells pumping out the fossil water frombelow the soil.

World Commission on DamsThematic Review: Assessment of Irrigation Options in India, Draft #1, Date: 08/11/1999
This is a draft working paper of the World Commission on Dams. It was prepared for the commission as part of its informationgathering activity. The views, conclusions and recommendations are not intended to represent the views of the Commission.
39
⇒ The traditional system of water harvesting and recharging through village ponds, temple tanks andlocal fishponds should be revived so as to promote recharging of groundwater and to normalise watertable. The surface run - off rainwater can be collected in wells to recharge the aquifers. (Emphasisadded.)⇒ Nearly half a M Ha are sprinkler irrigated in MP and Rajasthan.
What is clear from the above is that the wheat productivity also has reached a plateau, particularly in theIndo - Gangetic plain, which has about 18.5 M Ha under wheat, and there is limited scope unlessunsustainable practices of the past are reversed.
The combined annual growth rate in wheat production fell from 4.8% between 1967-68 and 1994-95 to3.7% between 1980-81 and 1994-95 (Sharma, 1997: 65).
3.11.3 Water Logging and Salinisation
David Hopper, World Bank�s vice president for South Asia, said that in South Asian conditions the rate -of - return criterion would generally not allow the Bank to support an irrigation project with adequatedrainage because the drainage added too much to present costs in relation to its discounted long - termbenefits. Rather, the Bank had to put in the irrigation system and wait for salinity and water logging totake land out of production. Then it could justify a drainage project. This sounded preposterous: it wouldobviously take many years for land made unfit for cultivation by salinity and water logging to becomeproductive again once drainage is put in, and it costs five times as much to construct adequate drainage asit does to irrigate in the first place (Wade, 1997).
That large canal based irrigation systems lead to waterlogging and salinisation was known andexperienced in India even before independence. But far from learning any lessons from these experiencesand at least incorporating proper studies, drainage systems and ensuring appropriate cropping patterns, thepost independence India has seen worsening situation in as can be seen from the following. The estimatesof waterlogging and salinity show a wide variation depending upon how they have been defined andestimated by various expert committees and authors studying the problems.⇒ Irrigation commission (1972) estimated that 4.84 M Ha of land is affected by waterlogging andsalinisation (Vaidyanathan, 1999: 104).⇒ In Punjab and Haryana alone, by 1970s, about a M Ha of land had become waterlogged (Rao, 1975:120).⇒ The National Commission on Agriculture (1976) estimated that about 5.98 M Ha of land was affectedby waterlogging, in both irrigation commands as well as in unirrigated lands. Out of this, 2.6 M Ha wasfound to be affected due to higher water table and the rest due to surface run - off stagnation.⇒ World Bank (1991b: 73) estimates that the figures of Agriculture Commission could be a substantialunderestimate. Some 3 M Ha are estimated to be waterlogged on irrigated lands, but only part of thewaterlogging is said to be induced by irrigation.⇒ The MOA estimated that in 1990, 8.53 M Ha was affected by waterlogging and salinisation. In orderto be able to isolate the effects of over irrigation, the Ministry of Water Resources estimated the areaaffected in irrigation commands and came up with figures of 1.5 M Ha for water logging, 3.1 M Ha forsalinity and 1.3 M Ha for alkalinity (Vaidyanathan, 1999: 104, Shah, 1998: 51).⇒ The working groups constituted by the Ministry of Water Resources (1991) estimated that about 2.46M Ha in irrigated commands suffered from waterlogging. The areas include from Punjab, UP, Haryana,Rajasthan and Maharashtra. The working group also estimated that 3.3 M Ha had been affected bysalinity/ alkalinity in irrigation commands.

World Commission on DamsThematic Review: Assessment of Irrigation Options in India, Draft #1, Date: 08/11/1999
This is a draft working paper of the World Commission on Dams. It was prepared for the commission as part of its informationgathering activity. The views, conclusions and recommendations are not intended to represent the views of the Commission.
40
⇒ According to the Eighth Five year Plan (GOI, 1992), a total of 17.61 M Ha of area is suffering fromthe problems associated with irrigation such as waterlogging (8.53 M Ha), alkalinity (3.58 M Ha) andsalinity and sandy area (5.5 M Ha). (Gulati, 1999: 1-2)⇒ Official estimates reckon the command area lost in waterlogging and salinity to be around 3 to 4 MHa, while another study estimated that 7 M Ha have already gone out of farm production, and 6 M Ha arebeing seriously threatened (World Bank, 1998: 5).⇒ The Ninth Five Year Plan (GOI, 1999: 490) has accepted that there has been no systematic orcomprehensive survey undertaken so far to assess the conditions of these areas and to assess cost effectiveway to remove the water logged conditions. However, the Five-Year Plan contains no step to remedy thissituation.
What is problematic is that the same sentences used in the Ninth Five Year Plan are also used in theEighth Five Year plan about lack of any survey undertaken in this regard (Dhawan, 1993: 61). Thus, evenas the extent of problem of water logging and salinisation keep increasing, as is evident from abovefigures, there is absolutely no attempt on the part of the authorities to take action even to learn as to whatexactly is the situation. The basic reason for the waterlogging of the canal commands is that drainageaspect has not been given proper attention in irrigation commands in India (Vaidyanathan, 1999: 104).
It is claimed that the spread of conjoint use of groundwater with surface water especially in Punjab,Haryana and western UP is hoped to have substantially reduced water logging, but there are no studies toestablish this. On the contrary, it is feared that the increasing spread of paddy wheat rotation andsugarcane cultivation in this region will damage the soil and the current level of productivity may not besustainable.
The World Bank�s review of India�s irrigation sector (1991b: 73) is more candid.
While in most parts of India, such problems on irrigated lands are localised to particular commands and mostfrequently to localised areas in such commands, a particularly serious problem is developing in parts ofNorthwest India (large parts of Punjab (mainly Southwest part of the state) and Haryana and parts of Rajasthanand Gujarat). Before irrigation development, water tables were generally at more than 25 meters (m) depth. Therate of rise of the water table since irrigation began in the late 19th century, has in some areas been of the orderof 25 to 30 cm/year. This had no impact until the water table reached the root zone from saline groundwatersources. The first signs of irrigation induced waterlogging and salinisation were reported in the 1920s and theproblem began to become widespread in certain districts of Punjab and Haryana from 1950s. Yields are affectedand some areas can no longer be cultivated. Over 0.6 M Ha in Northwestern India are estimated to be affectedby waterlogging.
The 1891 commission appointed by the British concluded that inefficient drainage was the problem.Solution was in making the canals follow the naturally drainage lines, as Indians had done before theBritish canals were built, or construction of fresh drainage facilities (Goldman, 1994: 69-70).
The Bank goes on to note that part of the serious usar lands problem (highly sodic salinised soils formingeventually a highly salinised hard pan preventing crop growth) in UP is also due to irrigation, the solutionof which is in better drainage facilities. In large parts of Northwest India including Punjab, Haryana andRajasthan, where conditions of poor natural drainage is coupled with poor groundwater quality, largeinvestments in major drainage works are a must. Such investments are yet to start and even in India�sNinth Five-Year Plan, there is no provision for this.
According to the World Bank estimates, at least 3% of canal irrigation commands are severely affected bywaterlogging and salinisation. Thus, at least 0.75 M Ha of irrigated land is severely affected by

World Commission on DamsThematic Review: Assessment of Irrigation Options in India, Draft #1, Date: 08/11/1999
This is a draft working paper of the World Commission on Dams. It was prepared for the commission as part of its informationgathering activity. The views, conclusions and recommendations are not intended to represent the views of the Commission.
41
waterlogging and salinisation. In reality, the lands affected by waterlogging and salinisation has beenmuch larger, as noted earlier.
This figure is likely to be gross underestimate, as Sandra Postel (Bio Science, Aug. 1998) says, 20% ofcommand is likely to be affected by salinisation and severe effects with reduction in crop yields havebeen the result in at least 10% of the commands.
In Punjab, it is estimated that about 286,000 Ha have a water table depth of less than 1.5 m even in thedry and hot month of June. The water table further rises by 0.5 to 1.2 m during monsoon. These areas arenormally subjected to water logging, the degree depending upon the topography of the area.
Table 7.Distribution of Waterlogged Areas in Different Districts
of Punjab (Water Table less then 1.5 m, June 1983)
District Waterlogged area (ha) % of total waterloggedarea in Punjab
Faridkot 112,000 39.16Ferozepur 102,000 35.66Bhatinda 32,000 11.19Total 246,000 86.01Source: Shiva, 1989: 148
There is reason a lot of evidence that shows that the problem is becoming widespread and acute.⇒ Recent studies have indicated that there has been a considerable increase in the water table in anumber of irrigation command areas all over the country due to improper water management. Accordingto Ministry of water resources, in AP, the Krishna River delta has experienced a 2 to 4.4 m rise in thewater table. In Karnataka, the Chitradurga area has experienced 2 to 6.8 m increases. In MP, the rise hasbeen 2 to 9.3 m in certain areas. In Faridkot, Punjab, the rise has been 2 to 11.2 m (Vaidyanathan, 1999:105).⇒ In the Tungabhadra project in Karnataka, 33 000 Ha have been waterlogged (Shiva, 1989: 149).⇒ In large parts of Haryana, the impact of irrigation over many decades has caused the groundwatertable to rise, resulting in severe waterlogging and salinisation. Crop yields have declined significantly.Already, water logging problems have developed on about 250 000 Ha of land in northwest India, and itis foreseen that some 3 M Ha may be in jeopardy over the next 30 to 50 years. The incidence of floodingalso increases as the water table approaches land surface (World Bank, 1994: 3).⇒ As per Haryana Minister for Agriculture, about 0.2 M Ha of land were seriously affected bywaterlogging and salinisation. A Dutch govt. funded project called Haryana Operational Pilot Project waslaunched to reclaim about 2 000 Ha of land at an estimated cost of Rs. 250 million. The project involvedlaying collector pipes to drain out excess water from the pilot area (The Hindu, Sept. 2, 1997).⇒ About 1.2 M Ha in UP (7% of net cultivable area) are not used because of high concentration ofexchangeable sodium, which is also described as alkaline conditions (World Bank, 1998: 80).7
⇒ In Tamil Nadu saline and alkaline soils are spread over in 0.41 M Ha and acidic soils occur in 0.12 MHa (World Bank, 1995 Vol. 2: 299).⇒ In Orissa, water logging is a major problem of the irrigated delta of the coastal zones: about 85,000Ha of the Mahanadi delta is affected (World Bank, 1995b: 5).⇒ These kind of problem soils are increasing in both old (e.g. Chambal, Tungabhadra) and new (e.g.UKP and Indira Gandhi Nahar Pariyojana) irrigation projects (Vaidyanathan, 1999; Gulati, 1999: 2-7).

World Commission on DamsThematic Review: Assessment of Irrigation Options in India, Draft #1, Date: 08/11/1999
This is a draft working paper of the World Commission on Dams. It was prepared for the commission as part of its informationgathering activity. The views, conclusions and recommendations are not intended to represent the views of the Commission.
42
Some of the supporters of large dams (see for example Dhawan, 1994: 30-32) contend that the waterlogging may not be entirely due to canal irrigation alone and role of drainage blockage due to roads,railways and colonies may also be significant. However, when canal irrigation introduced in any area, theplanners have to take into account the drainage situation in the command area and provide wherevernecessary, additional drainage measures to drain out excess water from canal irrigation and to compensatefor the drainage lines blocked by the canals. That most irrigation projects do not even study this aspect,leave aside the question of including the drainage component in the project is well known. When they do,under pressure from critics, they invariably cut corners by underdesigning the drainage facilities. In caseof SSP, for example, while the full necessary vertical and horizontal facilities necessary as per impactassessment reports are not provided for, the impacts of inadequate cross drainage facilities across maincanal are already visible in terms of waterlogged areas along the canals of the project.
Investment in drainage has been widely neglected, and where such investment has been made, poormaintenance has caused many drainage systems to become silted. In addition to crop failure, the morewidespread problem is that excessive water imposes limitations on varietal choice, fertiliser application,and cropping patterns, all affecting yields (World Bank, 1991a: 8).
Benefits from proper drainage systems can be substantial. For example, subsequent to severe floods of1995, Haryana undertook an emergency programme before 1996 monsoon to augment the state�s drainageand flood control system. This resulted in dramatic reduction in flooded area in the subsequent two years.Against 2.2 million acres affected by floods during 1995, the area affected by floods in 1996 was only200,000 acres and less than 50,000 acres in 1997 (World Bank, 1998: 75).
3.11.4 Soil Micro Nutrients
The little earthworm working invisibly in the soil is actually the tractor and fertiliser factory and damcombined.
Shiva, 1989: 108
Deficiency in soil of micro nutrients such as zinc, iron, boron, manganese and copper are widely reportedin GR areas of Punjab and Haryana, raising questions about sustained benefits of canal irrigation in theseareas. Lack of micronutrients in the soil is also inhibiting ability of soils to absorb conventional fertilisers,in addition to leading to decline in yields. In the saline, sodic and alkaline soils, boron and molybdenumtoxicity in crops has also been reported. The depletion of soil micronutrients is likely to lead to serioushealth problems as per PAU. Inappropriate cropping pattern, HYV, no or low use of organic manure anduse of fertilisers rich in Nitrogen, Phosphorous and Potassium are some of the reasons cited for thisdepletion (Singh, 1997: 85, Shiva, 1989, Jamwal, 1999: 22-23).
3.11.5 Soil Organic Content
In Punjab, increased irrigated motivated farmers to adopt wheat - paddy rotation disregarding the time -tested, highly effective system of crop rotation based on soil fertility measures like green manuring. Thewheat - rice cropping pattern is now adding to farmers� problems. One of the major reasons for theconsiderably higher productivity of crops in China as compared to India is the higher organic mattercontent in their soils. As against 1.5 to 2.5% in China, the proportion of organic matter in Punjab soils, forinstance, is less than 0.5%, much of it even below 0.2% (Singh, 1997: 105).

World Commission on DamsThematic Review: Assessment of Irrigation Options in India, Draft #1, Date: 08/11/1999
This is a draft working paper of the World Commission on Dams. It was prepared for the commission as part of its informationgathering activity. The views, conclusions and recommendations are not intended to represent the views of the Commission.
43
3.11.6 Siltation
Planning Commission accepts that sedimentation rate in a number of reservoirs is higher than thoseenvisaged at the planning stage. This statement, however, is qualified by saying that the sedimentationrates may be high in initial 15-20 years of operation of the reservoir. No data is given in support of thisqualification. More significantly, there is no mention about managing the catchment to reducesedimentation or the cost of losing reservoir storage due to sedimentation (GOI, 1999: 500).
Vaidyanathan (1999: 102) also notes that there is evidence that several important reservoirs are gettingsilted up at a much faster rate than was originally estimated. The effective life of reservoir will be muchshorter than expected. The scale of catchment area treatment projects taken up till date is inadequate inrelation to the magnitude of the problem and the effectiveness of the schemes remain to be established.
Dhawan (1993: 37) reports figures from Irrigation Research Institute, Roorkee, showing that the empiricalformula used for estimating the rate of sedimentation grossly understates the actual, observed rates duringconstruction and after construction of reservoirs and the rate becomes constant after some time.
India is losing soil at the rate of 4.7 billion tons per annum, the highest soil loss rate in the world (Singh,1997: 91). This has direct implication for reservoirs, their useful storage capacity and useful life.
The World Bank (1991b: 74-6) also notes that in seven out of eight cases that it studied, the expected lifeof the reservoir is likely to be one third or less of the design life. In case of the Nizamsagar project in AP,the expected life is likely to be even lower at 6% of the design life. See Annex table 11 for details ofdesigned and observed siltation rates and how they affect both the dead and live storage of a number ofreservoirs. It is clear from the table that in all cases the observed siltation rate has been at least 50%higher than the projected and in at least 50% of the cases it is higher than 200% of the projected values.The reduced storage capacity available at the dam means that the irrigation capacities would go downfaster than originally envisaged.
Increasing number of soil scientists agree that no dam should be built until all the catchment areaupstream of the dam is properly treated. While the government also now accepts this position, the dambuilders are not yet ready to foot the bill for the catchment area treatment. (for example, see Dhawan1993: 20-26) In case of SSP for example, the project authorities are now ready, after much pressure, totreat the catchment pari passu with the construction of the project, they are not ready to pay for theexpenses involved in treating catchment except the catchment draining directly into the reservoir. Inactual practice very little of the catchment treatment is happening and there is no monitoring of the same.
3.11.7 Conflict with Other Areas, Uses
The CWC estimates that community needs would double and industrial and power requirements wouldincrease almost seven fold by 2025. While the total water demand for community use (forecast to be 40BCM/ year in 2025) is not high compared to the total water resources (930 BCM/ year in 2025), localisedand regional demands could lead to cuts in availability of water for irrigation (World Bank, 1995: 1-2).
The need to maintain minimum flows in rivers for flushing pollutants, dilution of waste water and otherenvironmental reasons such as the requirements of regenerative capacity of the ecology has beenneglected till date in planning, executing and operating M & M projects and will have to be recognised infuture. The fact that such demands remain unquantified also go to show that these important demandshave been neglected (World Bank, 1991b: 28). The upcoming SSP is a good example of this neglect,where no water is allocated for the 180 Km of the river downstream from the dam. In another part of

World Commission on DamsThematic Review: Assessment of Irrigation Options in India, Draft #1, Date: 08/11/1999
This is a draft working paper of the World Commission on Dams. It was prepared for the commission as part of its informationgathering activity. The views, conclusions and recommendations are not intended to represent the views of the Commission.
44
Gujarat, in Sabarmati basin, the people in the catchment are strongly protesting against diversion of theSabarmati river waters for Ahmedabad City.
Rapidly expanding urban, industrial and power sectors are affecting the availability of water for irrigationat number of places across the country.⇒ Some examples of this include the water supply to Delhi from Yamuna, water supply to Chennai fromTelugu Ganga, water supply to Ahmedabad and Gandhinagar from Dharoi project on Sabarmati river,water supply to Bhilai plant from Mahanadi and conflicts in Sone sub basin of Ganga. Share of irrigationin total water supply, is thus likely to go down from 83% in 1990 to 74% by 2025 (GOI, 1999: 483;World Bank, 1998: 10-11).⇒ In the arid Saurashtra region of Gujarat, reservation of water in reservoirs for urban water use andthus diversion from irrigation and resulting conflicts has been a feature at least in last ten years.⇒ Some conflicts between heavy industry and irrigation are already developing, for example, in theBihar part of the Subernarekha basin. Similarly, while the actual consumptive water use of hydropowerfacilities is small, optimum facility operation requirements for power releases are in conflict with waterrelease demands for irrigation (World Bank, 1991b: 28).⇒ Tirupur, in the southern state of Tamil Nadu, facing water deficit of some 0.022 BCM a year, hasbegun to import more water from outside the city. Many farmers within 35 kilometres of the city haveabandoned farming and instead sell their groundwater to urban and industrial users (Postel, 1999: 114).
3.11.8 Physical Constrains
�Most surface irrigation and drainage infrastructure is in a severe state of disrepair and in urgent need ofmaintenance. The problems are due in part to poor design and construction quality, but the primary factor is thecumulative effects of deferred maintenance over many years. Canals and drains are heavily silted, and thestructures are eroded and collapsing, limiting the capabilities of the irrigation and drainage systems as reliablewater capture, storage, delivery and disposal mechanisms. Poor maintenance of irrigation facilities has severelyhampered scheme management, reduced irrigation efficiency, led to excessive irrigation in head reaches, tounpredictable service to all farmers, and particular inequalities to tail - end farmers� (World Bank, 1998: 4-5).
More severe indictment of state of canal irrigation would be difficult to find. The consequences of theseare even more alarming: �The extent of the irrigated area being lost due to broken down distributionsystems, storage situation, waterlogging and salinisation is largely neutralising the additional area beingbrought under irrigation through new projects�.
Some states like AP have even commented on such declines in irrigated area. The state�s GIA declinedfrom 4.3 M Ha in 1991-92 to 3.9 M Ha in 1993-94. Of the state�s 4.8 M Ha of net irrigated area created,only 2.8 M Ha are actually being irrigated. This is due to years of neglect of maintenance of irrigationsystems (World Bank, 1998: 11). In Tamil Nadu also the net irrigated area dropped from 2.57 M Ha in1980-81 to 2.373 M Ha in 1990-91. The drop was in all sources of irrigation, but was the maximum (62%of the total drop) in case of canal irrigated area, which dropped from 0.889 M Ha to 0.769 M Ha (WorldBank, 1995 Vol. 2: 296).
3.11.9 Pollution of Water resources
⇒ Changes in water quality has been observed in major agricultural belts as a result of over use offertilisers, pesticides and insecticides in agriculture.⇒ The groundwater quality has also been affected in some parts of the country due to salinity ingressalong the coastal area of some of the states like Saurashtra in Gujarat and Tamil Nadu (GOI, 1999: 491).

World Commission on DamsThematic Review: Assessment of Irrigation Options in India, Draft #1, Date: 08/11/1999
This is a draft working paper of the World Commission on Dams. It was prepared for the commission as part of its informationgathering activity. The views, conclusions and recommendations are not intended to represent the views of the Commission.
45
Increased use of fertilisers and pesticides that the GR/ large canals have lead to have also resulted inpollution of both surface and groundwater sources. It is known that a large part of the nitrogenousfertilisers leach out to the water resources, though not much research on the quantification of this impactis done. It has been established that excess nitrates in drinking water is unsafe and causes birth defects,nervous breakdown and may be cancer. One study by the PAU had established that between 1975 and1982, water from 10% of wells in Ludhiana had become unsafe due to excess nitrogen leaching fromfertilisers used in farms (Singh, 1997: 106).
3.11.10 Energy Intensity
The success of the GR, along with that of the M & M irrigation, is dependent on energy intensive inputs.Such inputs include chemical fertilisers, pesticides, mechanisation and hybrid seeds. The pumping ofgroundwater is energy intensive. Many scholars have questioned the sustainability of this kind ofdevelopment. The energy intensive systems have low environmental security, which itself endangers thefood security, the basis of justification of GR and M & M systems (for example, see Singh 1997; Sharma,1997; Shiva, 1989).
3.11.11 Soil Erosion
The Netherlands based International Soil Reference Information Centre has estimated that some 80% ofIndia�s cultivated lands is being slowly reduced to unproductive parched terrain due to wind and watererosion. Overuse of fertilisers and pesticides and declining organic matter content (0.3-0.5%) as a resultof the GR agriculture (M & M irrigation along with groundwater being principle inputs in that) are alsoresponsible for this erosion. The loss of surface soil has caused a significant chemical deterioration withthe result that more inputs are required to sustain agricultural production. In most cases, physicaldeterioration of the soil has also occurred. More energy is required to cultivate the land, and a higherproportion of rainwater is lost as runoff. Thus a vicious self - destructive cycle of natural resource basehas been triggered off (Virmani, 1999: 203).
3.11.12 Minimum Instream Flows in Rivers
Dams built on rivers affect the flow of water in the downstream areas. In India, where most of the riversare monsoon fed, this can have particularly serious impact in non-monsoon months, leading toenvironmental and water related impacts for the communities living on the banks of the rivers.⇒ On the Periyar River in Kerala, where 11 dams have been built, seawater now moves 20 milesupstream during the dry season, forcing factories near Cochin dependent on the river water to close down.The deep-water port at Cochin is also silting up.⇒ Similarly, the flows in Ganga are increasingly inadequate, particularly downstream of the diversionstructures. Flows now reaching Farakka barrage on the Ganga River during January - May are inadequateto meet the combined requirements of flushing of Calcutta port and the needs of Bangladesh (WorldBank, 1991b: 75).⇒ Similar issues in Gujarat around the Narmada and the Sabarmati rivers are noted above.
3.12 Contribution to Drought Proofing
Drought proofing is one of the stated aims and claims of the large dam supporters. However, there isincreasing evidence that shows that M & M projects have played little role in this and groundwater hasplayed much larger role.

World Commission on DamsThematic Review: Assessment of Irrigation Options in India, Draft #1, Date: 08/11/1999
This is a draft working paper of the World Commission on Dams. It was prepared for the commission as part of its informationgathering activity. The views, conclusions and recommendations are not intended to represent the views of the Commission.
46
For example, the World Bank notes that Development of groundwater has led to increased droughtproofing of India�s agricultural economy. The importance of in the India context can be gleaned from theimpacts of droughts. In the 1960s groundwater was a relatively insignificant source of irrigation,particularly in eastern India. In 1965-66, rainfall was 20% below normal, leading to drought conditions.Foodgrains production declined 19% at the national level over the previous years� level. In contrast, in1987-88, rainfall dropped almost 18% below normal, but foodgrains production declined only 2% overthe previous years� level. This can be attributed to the spread of groundwater irrigation in particular(World Bank, 1998c: 2).
The World Report also notes that the degree of instability in irrigated agriculture between 1971 and 1984was less than half that in unirrigated agriculture. This is especially so in areas served by groundwaterirrigation, the report notes (World Bank, 1998c: 3).
Historically, it has been argued that the canals the British constructed in India have lead to reduction infamines (for example, Ian Stone, �Canal Irrigation in British India: Perspectives on technological changein a peasant economy, Cambridge: Cambridge University Press, 1986, as quoted in Goldman 1994). Bythe mid 1800s when the British sought to intervene assertively into the productive countryside of thenorth - west, inundation canals of the Punjab alone aggregated some 2500 miles in length, and irrigatedmore than a million acres. Within next seventy years the British had redesigned and expanded upon theseinundation canals to produce one of the largest perennial irrigation canal systems � 74,656 miles of maincanals and distributaries serving approximately 13.12 M Ha (Goldman, 1994: 54-57).8
Elizabeth Whitcombe argues that these interventions did not alleviate famine for the majority of poorpeasants � small landholders, pastoralists, landless labourer. Whatever British innovations offeredmedium and large peasants, they had the net effect of reducing the production of locally consumed foods,expediting the privatisation of common pastures and fields, and commercialising rural market relations.All three tendencies negatively impacted the poor majority (Goldman, 1994: 60-61).
Furthermore, canals can be an inappropriate technological intervention for the majority of small producerswho depended upon earthen wells. During the initial canal years, hundreds of wells collapsed in areaswhere the irrigation canals passed. Though some sectors of the poor were maintained during faminesthrough wage work on irrigated farms, the majority could no longer effectively produce, or afford topurchase, their food and supplies. Pastoral practices also suffered from canal construction. The role of theirrigation canals was to develop agricultural sector for British profits abroad (Goldman, 1994: 61-67).

World Commission on DamsThematic Review: Assessment of Irrigation Options in India, Draft #1, Date: 08/11/1999
This is a draft working paper of the World Commission on Dams. It was prepared for the commission as part of its informationgathering activity. The views, conclusions and recommendations are not intended to represent the views of the Commission.
47
4. Scope for Non - Large Dam Options Today9
4.1 Options for What?
While talking about options we need to be clear as to what is it that we are looking options for. Whensupporters of large irrigation projects ask the question as to what is the alternative to producing sameamount of irrigation that the objected project was going to produce. But this would be wrong a question.
The attempt in this chapter is to see what are the options available today for India to fulfil food, justifiedagricultural development and water needs in a sustainable, equitable and humane way. In this attempt, theexisting large dams are taken as given and an attempt is made to see what are the possibilities for betterresults from these structures.
We have also described and listed what are the non-large dams options today. Here we have brieflynarrated some of the successful attempts in that direction. However, when it comes to the issue ofderiving scope at national level for such options, that is more difficult questions. In most cases, noagency, including the government has even gone into this question. And since most of the relevantinformation necessary for such arriving at such estimates remain with the government, it would bedifficult for any other body to arriving at figures of scope of non-large dams options. So here we have tostop with more general statements rather than precise figures of scope.
4.1.1 Stopping Foodgrains Wastage
Huge amounts of foodgrains produced in India today gets wasted in storage and transit. A number ofreports (e.g. the Hindu, 29 October 1999) show that at least 15% of foodgrains produced gets wasted.Techniques are available to reduce this wastage substantially and this should obviate the need for thatmuch additional production.
4.1.2 Improving Water Availability Across the Year
One of the arguments in favour of large dams have been that in a tropical country like ours, most (80-90%depending on whether the river is monsoon fed or snow fed) of the average annual water available in ariver flows away in four monsoon months. While this is true for large rivers, there is considerable scopefor improving the flow regimes of the smaller rivers by better management of catchment. Since properattempt has not been made in this direction, it is difficult to put a figure for this. Various authors havegiven different figures about various attempts. For example, Dhawan (1993: 36) reports about a papersaying soil and water conservation efforts leading to 79 % reduction in peak flow. Though, suchattenuation would not be feasible in case of large rivers, this shows the kind of potential that exists in caseof smaller rivers.
4.2 Various Kinds of Non Large Dams Options
In this section we will try to look at the issues around non large dams options like minor surfaceirrigation, traditional technologies, watershed development, soil & water conservation measures andrainfed farming. The issue of improvements possible in large dams, technological improvements (treadlepumps (TPs), drip and sprinkler irrigation, etc) and issues around groundwater irrigation are dealt with inseparate sections. Specific examples of success stories are taken up in another section.

World Commission on DamsThematic Review: Assessment of Irrigation Options in India, Draft #1, Date: 08/11/1999
This is a draft working paper of the World Commission on Dams. It was prepared for the commission as part of its informationgathering activity. The views, conclusions and recommendations are not intended to represent the views of the Commission.
48
4.2.1 Revival of Diverse and Community - Based Irrigation Systems
Techniques of irrigation management were traditionally developed to harvest every possible source ofwater from rainwater to groundwater, stream to river water and floodwater. These technologies werediverse and suited the local ecological conditions, in contrast to the contemporary programmes thatemphasis on technocentric approach for irrigation management. These options were diverse dependingon the terrain and climatic conditions, were evolved depending on the socio - ecological conditions andsuited the economic needs of the region. These traditional systems are still in existence at different scalesof functional intensity. What is important in the context of failure of the contemporary irrigation policy isto facilitate the existing institutions, learn from the traditional techniques and promote participatorygovernance system in the irrigation department.
This traditional system was basically that of local storage - based, diversion - based or subsurface liftirrigation systems (Sengupta, 1993), which has been the backbone of agricultural development in mostparts of the country. These systems called, as minor irrigation systems (as it irrigates less than 2000hectare of command area) were largely community managed. The crucial role of community - basedminor irrigation has been recognised by various irrigation committees. Notable among them was theGrow More Food Enquiry Committee (1952), which recognised that minor irrigation will help inaugmenting food production within a short time (GOI, 1961:7). In addition, they had recognised thatthese irrigation systems can be executed in a short time period and they also cost less. They are alsoimportant as they yield returns in a short span of time, can be executed with locally available resourcesand technical skills, generate dispersed employment in the region (GOI, 1961:11) and enable communityto monitor and regulate. This reduces need of government intervention and burden on its financialexchequer.
Minor irrigation are classified in four categories; as tanks, wells (but not after 1970�s because dugwellsare overtaken by tubewells), private canals and other sources. These systems were a dominant source ofirrigation in the country, covering 59% of the net irrigated area in the country in 1920-21 (GOI, 1961:7).As a result of canal irrigation in 1930�s the proportion had declined to 55 and 52 per cent in 1930-31 and1942-43. However, their contribution rose again after partition of the country, which led to transfer toPakistan of areas like West Punjab and Sind with heavy incidence of canal irrigation. Therefore, afterindependence, their contribution (including tube well irrigation) has risen to 66 per cent has remainedstable till 1986-87 (Figure. 1). However, the increase in number of tubewells through various incentivesand subsidies should be noted for its significant contribution towards increase in irrigated area. Minorirrigation has also been justified in terms of the cost of creating one hectare of irrigation potential.Compared to that of M & M irrigation projects, minor project costs less (Annex Table 2C). However, itshould be noted that many of the community based minor systems involved much of cost borne bycommunities towards maintenance and management. In addition, a comparison in the degree ofutilisation of irrigation potential by major and minor irrigation (excluding tubewells), from sample casestudies in 1959-60, reveals that the utilisation of irrigation potential has been higher in minor irrigationsystems (Annex Table 3F).
It is estimated that between 1950 and 1996-7 about Rs. 1456 billion (at constant 1996-7 prices) has beenspent for creation of 200 BCM of storage capacity through M & M projects. However in the recent Five-year plans it is recognised that creation of any additional potential is becoming obsolete and that it hasonly resulted in loss of 0.6 M Ha of even the potential that was created in the previous plan (Vohra,1996:1398). In addition, as per the ministry of water resources own information only 78 per cent of thepotential created has been utilised by 1990, thus with a gap of 22 per cent. While the more reliable LUSreveals a gap of 40 per cent (Ibid.). The total outlay in the 7th plan for the M & M irrigation project hasbeen Rs. 111 billion and this has created a potential of 0.262 M Ha, as per LUS. This works out the cost

World Commission on DamsThematic Review: Assessment of Irrigation Options in India, Draft #1, Date: 08/11/1999
This is a draft working paper of the World Commission on Dams. It was prepared for the commission as part of its informationgathering activity. The views, conclusions and recommendations are not intended to represent the views of the Commission.
49
of creating one hectare under M & M irrigation at Rs. 0.4 million (Ibid.: 1399). In view of thesedevelopments, the time has obviously come to reconsider our irrigation options to overcome the problemof conserving water for irrigation.
The survey of minor irrigation was conducted in 1986-87. It enumerated 678,000 of such category that isexisting in the country.10 However, this census had excluded Bihar, Rajasthan and Assam. The censusplaced about 625,000 of minor irrigation structures with an irrigation potential of 7.6 million hectare inuse at present, which comprises 148,000 tanks, 95,000 diversion works and 350,000 surface lift schemes(Vaidyanathan, cited in CSE, 1997: 320). In view of vast majority of rural population deficient innutrition and millions of marginal farmers still depended on the rainfed agriculture, it is important toconserve and utilise water resources. One of foremost effort to be made in this direction is to rehabilitatethe existing community - based irrigation systems, which involves less capital outlay and maintenancecosts (GOI, 1952:74; Vaidyanathan, cited in CSE, 1997:317). Second, evolve irrigation managementtechniques that are diverse and location specific, rather than spending time and finance on large scaleirrigation project which takes years to complete (Annex Table 13). Third, promote irrigation policies thatfacilitate the community - based institutions for irrigation management, through a watershed approach.Finally, build capacities of the irrigation departments that able to promote a participatory governancesystem.
A major effort at renewing and improving traditional local systems is necessary. Such a programmeshould focus on the following elements: hand over the systems to local gramsabhas or user groups afterbringing back the system in usable condition, reforestation of the catchment areas of the tanks; restoringthe inlet channels to their original capacity by clearing them of weed and silt and removingencroachments; strengthening and improving the tank bunds and other associated structures; andundertaking such improvements or corrections in the distribution network as the users feel to be necessary(Vaidyanathan, 1999: 115).
4.2.1.1 Groundwater recharge
The decline in traditional irrigation systems like tanks and inundation canals has meant, besides reductionin irrigation benefits, substantial reduction in groundwater recharge. This has also implication forincreasing the monsoon runoff, which in turn also accelerates soil erosion.
4.2.2 Rainfed farming
Nevertheless, for the large areas in India likely to remain without irrigation, addressment of poverty willneed to rely on improving the productivity of rainfed agriculture.
The World Bank, 1991b: 22
The rainfed lands in India produce 42% of the country�s food. Nearly 83% of sorghum, 81% of pearlmillet, 69% of cotton, 92% of pulses and 90% of oilseeds are grown in these areas. About 90 M Ha of netcropped area is rainfed out of total net cropped area of about 140 M ha. About two thirds of country�scropped area is rainfed. Rainfed lands support at least half the rural agriculture employment. Rainfedlands produce between 400 and 800kg of grain per Ha on an average.
Since the mid 1960s, the main policy thrust in Indian agriculture has been the irrigation intensive GRstrategy. As for areas with limited water endowments, the approach has been to either indiscriminatelyextend the GR technology or to give them up as the forsaken sector of Indian agriculture (Shah et al,1998: 196).

World Commission on DamsThematic Review: Assessment of Irrigation Options in India, Draft #1, Date: 08/11/1999
This is a draft working paper of the World Commission on Dams. It was prepared for the commission as part of its informationgathering activity. The views, conclusions and recommendations are not intended to represent the views of the Commission.
50
There is strong case for improving yields of rainfed lands in India. Besides increasing the yield from vastmajority of Indian lands that are unlikely ever to get irrigated, the case for improving rainfed farmingrests on the issue of sustainable growth (including implied intergenerational equity) and spatial equity ingrowth in a diverse polity. Such improvements in yields are likely to be both in level and in stabilityterms (Dhawan, 1993: 70-71).
The World Bank notes (1991b: 52-3) that in aggregate, productivity growth of rainfed agriculture wasabout 1%. The limited progress of rainfed agriculture was mainly because there was little progress orencouragement for water harvesting technology to conserve insitu soil moisture. However, there are betterprospects of yield improvements in store in future if proper emphasis is given to local water harvesting,with which, susceptibility to drought periods during the rainy season can be reduced and the crop growingperiod extended due to longer retention of moisture by the soils. The techniques involve low investmentsand are easily replicable at farm level. The Bank (1991b: 5) also notes that investments that provide someoff - season water in rainfed drier regions would have greater impacts on gross copped areas than inwetter areas.
An early transformation in drylands is possibly only if effective measures are taken to overcome theproblems of drainage, soil erosion and residual moisture management, for which govt. has to provideinvestment (Singh, 1997: 74).
4.2.2.1 Importance of soil moisture
It is estimated that earthworms increase soil - air volume by upto 30%. Soils with earthworms drain fourto ten times faster than soil without earthworms and their water holding capacity is higher by 20 %(Shiva, 1989: 108).
It is not often realised that of the total water resources of the country, estimated at 4000 BCM, over 40%(1700 BCM) is retained in the form of soil moisture. Water used for irrigation from surface andgroundwater sources together, even at their fullest development, would come to less than 20% of the total(770 BCM). We must, therefore, devise new strategies which optimise the utilisation of soil moisture(Shah et al, 1998: 108-9).
Various types of on farm soil and water conservation technologies can reduce peak runoff rates and soilloss by 60-80% and raise crop yield by 30-40% through a combination of mechanical and vegetativemeasures. For example, contour bunds can reduce soil loss by 78% and runoff by 63%. Annex 10 givessome figures about the possible impact of soil and water conservation works on crop yields, runoff andsoil loss (Shah et al, 1998: 212).
Farm ponds are a low cost and labour intensive method of runoff harvesting for drought proofing in thedry regions. They provide a critical life saving supplemental irrigation (5 cm) in the years of drought. Theeffect of one 5 - cm irrigation from water harvested in farm ponds on various crops in a few drylandlocations showed that yields were higher by 60-70% and WUE averaged nearly 18 kg/ha/mm.
Projections made by scientists show that there exists potential to harvest 63.2 BCM of precipitationequivalent runoff at the farmer field level in regions receiving 1000 mm rain per annum. The runoff ifharvested can provide two life saving irrigation of 5 cm each for more than 60% of the total rainfed area(Shah et al, 1998: 223).
Other similarly relevant local water harvesting techniques include stop dams, Naala Bund, Undergroundpuddled Dykes, Erosion control structures, etc.

World Commission on DamsThematic Review: Assessment of Irrigation Options in India, Draft #1, Date: 08/11/1999
This is a draft working paper of the World Commission on Dams. It was prepared for the commission as part of its informationgathering activity. The views, conclusions and recommendations are not intended to represent the views of the Commission.
51
4.2.2.2 Dryland areas
Dryland areas are those that depend on rainfall for their requirements. However, this is a rather crudedefinition as rainfall within dryland areas varies significantly. A method that takes account of waterbalance � rainfall, Potential Evapo - Transpiration (PET) and soil moisture � would be more appropriate.These variables together determine the period in which the moisture of the soil is adequate for supportingplant growth, called the Length of Growing Period (LGP). The growing period starts when rainfallexceeds 50% of PET and ends with the utilisation of stored soil moisture after rainfall falls below PET(Shah et al, 1998: 116).
Based on criteria of LGP less than 180 in the arid, semiarid and some of the sub - humid areas and thosehaving less than 40-50% of their grown sown area getting irrigation, this method arrives at 177 drydistricts in India. Thus, 42% of districts in India covering 56% of the total geographical area fall in thedrylands (Shah et al, 1998: 121). Together, these districts account for nearly 80% of the output of coarsecereals, nearly 50% of maize, 65% of gram and arhar, 81% of groundnut, 88% of soyabean and over halfof the cotton. Soil and Water conservation works has great potential for these areas.
4.2.2.3 Employment generation
Soil and Water conservation technologies have a tremendous and relatively unutilised potential for raisingland productivity. It is also the basic nature of these technologies that they are labour intensive. In thebackward and environmentally degraded drylands of India, the Total Watershed Plan approach offers acomprehensive and powerful employment strategy centred on natural resource management andregeneration.
Village level studies of International Crop Research Institute for Semi - Arid Tropics show thatemployment of farm labourers nearly doubled with the adoption of the improved watershed technology inplace of the traditional farming practices. In absolute terms employment went up by 300-400 person hoursper ha. Indirect effects through backward and forward linkages are not reflected in this data. Stability ofemployment as well seems to be higher with improved technologies (Shah et al, 1998: 241).
As per the plan made by Samaj Pragati Sahayog, an Non Government Organisation (NGO) based on theirexperience in MP, seven states (MP, Rajasthan, Maharashtra, AP, Karnataka, Tamil Nadu an Gujarat)together account for 86% of the total drylands in India. The total area of drylands in these states is about153 M Ha. At the norm of Rs. 4,000 per ha, the cost of watershed treatment of the drylands in these sevenstates would be about Rs. 612 billion at 1994-95 prices. With a wage: non - wage ratio of 70:30, thisprogram has the potential to generate about 14,280 million person days of employment. Total no of Ruralunemployed in these states is 6.97 million as per NSS data of 1994. At the rate of 150 days of workguarantee per person per year, the unemployed can be engaged in watershed development in the drylandsof these seven states for fourteen years. The total cost per year would come to 0.63% of the GDP and3.16% of central government�s annual budget (Shah et al, 1998: 277-9).
These are of course only normative, framework kind of figures. However, these figures show that it ispossible to engage the rural unemployed through working on their own lands for the national goal of foodsecurity. Since most of the expenditure on irrigation and watershed development is done by thegovernment, it would not be too much to expect that government take up this plan. The crucial question isof course, how to make this effective and not like any other government scheme.

World Commission on DamsThematic Review: Assessment of Irrigation Options in India, Draft #1, Date: 08/11/1999
This is a draft working paper of the World Commission on Dams. It was prepared for the commission as part of its informationgathering activity. The views, conclusions and recommendations are not intended to represent the views of the Commission.
52
A number of scholars have shown that the state will continue to play important role in implementation ofsuch programmes, though the role will have to go through substantial change. The grassroots levelpeople�s representative organisations, the NGOs, the judiciary and the media will have to play significantrole too. The 73rd constitutional amendment, the constitutional amendment for tribal self rule in tribalareas, will have to be actually implemented, which has not been done till now. Shah et al suggest (1998:314) that central to the whole structure of implementation is the establishment of a district level People�sEmpowerment Centre, run by resource people capable of bringing together experts, administrators and thepeople, to act as the nucleus of the process.
4.2.3 Watershed Development
The All India Soil and Land Use Survey Organisation of the Department of Agriculture has developed anation - wide system of delineation and codification of watersheds at different levels of aggregation.
Each watershed can be further divided into sub - watersheds (10,000 to 50,000 Ha), milli - watersheds(1,000 to 10,000 Ha) and micro - watershed (upto 1,000 Ha).
The Report of the Committee on Twenty Five Years Perspective Plan for the Development of Rainfedareas, appointed by the Planning Commission has estimated that development of rainfed areas comprisingof 75 M Ha would require Rs. 375 billion at an average cost or Rs. 5000 per Ha. The Ninth Plandocument states that it is not possible to develop the entire area. It is aimed that in the next ten years, 30M Ha would be taken up for such development (GOI, 1999: 464-5).
Table 8. System of Classification of Watersheds in India
Category Number Size Ranges (M Ha)Regions 6 27-113Basins 35 3-30Catchments 112 1-5Sub - Catchments 500 0.2-1Watersheds 3,237 0.05-0.2Source: Shah et al, 1998: 199
Many reports of failures of watershed development efforts are available. Singh (1997: 90-91) has reportedthat this is mainly as the efforts ignored the time tested indigenous technologies. Vaidyanathan (1999:116) notes that these investments have been badly planned and implemented, and that not enough is doneto make them effective. There is much need for diverting much greater resources and attention towatershed development right from village to basin level. These, however, pose major challenges toinstitutional reforms.
In situ soil and moisture conservation works, provided they are properly conceived and implemented,would make a substantial difference to the level and pattern of water utilisation. Illustratively, if theamount of water supply available to rainfed arable land can be increased (through increased soil moisturestorage and through water harvesting for local irrigation) by even as little as 5 cm per ha, the effectiveutilisation of water will increase by nearly 50 BCM, which is about 10% of the current effective use fromall sources of irrigation (Vaidyanathan, 1999: 142). We have noted above how 5 cm irrigation can maketremendous change in the productivity of drylands.

World Commission on DamsThematic Review: Assessment of Irrigation Options in India, Draft #1, Date: 08/11/1999
This is a draft working paper of the World Commission on Dams. It was prepared for the commission as part of its informationgathering activity. The views, conclusions and recommendations are not intended to represent the views of the Commission.
53
A number of watershed development programmes have been taken up across the country by a number ofdepartments of various state governments and union ministries. Union Agriculture department, minorirrigation department, rural development department, environment and forest ministry, soil andconservation department, revenue department are some of the relevant departments. However, there islittle co-ordination between these various programmes. The Sukhomajri model was totally dependent on asociological perspective, which was not acceptable to the technical departments of the Government.Though there exists broad consensus on the desirability of people�s involvement in watershedprogramme, in reality, even consultation with the beneficiary community is minimal. One is yet to seeany concrete indication of the mechanisms of interaction between the departments concerned and withincommunities on the basis of which we can look forward to improving the past record (Vaidyanathan,1999: 146-56). This failure is at the heart of the failure of most watershed programmes.
Most of these projects can be merged into a single local area development programmes. Pooling all theresources under a single programme will help reduce the duplication, fragmentation and resulting wastethat characterises the existing dispensation (Vaidyanathan, 1999: 154).
There are also legal impediments to local initiatives in constructing small and water harvesting works.Under the existing law all rivers, including streams and rivulets, are government property. There is needto substantially amend this to actually hand over responsibility of local water resources development andmanagement to the local governance institutes. This has not happened in most states in spite of the 73rd
and 74th constitutional amendments.
Requiring individual beneficiaries to meet all or a substantial part of the costs of improvements effectedon their private land, with the state or the community bearing the cost of improvements to common land,clearly helps equity and sustainability of the works. Yet another technique, which is reported to have beenfairly successful in Sukhomajri and Daltonganj is to require a substantial part of the incremental producefor further investment in community assets. Lessons need to be learnt from such experiences andincorporated into watershed programmes (Vaidyanathan, 1999: 162).
The work of various committed catalysts (individuals and organisation) is notable in enhancing thecapacity of the community institution to solve the combination of poverty, unemployment andindebtedness in the region through watershed development.
4.2.3.1 Model of Ralegoan Siddhi
Ralegaon Siddhi, is village located in a small watershed with a population of about 1508 and 234households in the poor and semi-arid region of Ahmednagar in Maharashtra. The village, once poverty-stricken is now blooming with agricultural activity. The land under irrigation has gone up to 850 acresfrom 50 acres in 1975, yield per acre has increased from 3-4 quintals to 15-20 quintals, two crops insteadof one crop, decrease in out - migration and emergence of agro - based industries in the region are someof the visible impacts (Pangare & Vasudha, 1992: 2). Such transformation in a decade would not havebeen possible without the commitment of Anna Hazare. He believed in conservation and appropriateutilisation of water resources in watershed to eradicate drought, a major reason for poverty in the country.Some of the major intervention were local management of water through nala bunding, contour bunding,land shaping, afforestation and pasture development. Convinced by the intervention of these measures,people laid plans for more of such measures. In 1990�s, the village has 45 nala bunds with an estimatedstorage capacity of 282.182 cubic metre. Social and economic change in the village has been welldocument by a number of institutions and individuals.

World Commission on DamsThematic Review: Assessment of Irrigation Options in India, Draft #1, Date: 08/11/1999
This is a draft working paper of the World Commission on Dams. It was prepared for the commission as part of its informationgathering activity. The views, conclusions and recommendations are not intended to represent the views of the Commission.
54
4.2.3.2 Options for Equitable Water Distribution
Innovations have also been made to maintain equity in the availability of irrigation water, through PaniPanchayat model. Though the term refers to mobilisation of groups of farmers for the formulation andimplementation of community irrigation projects, today it largely symbolises equitable distribution ofwater. The model, from the experiment of lift irrigation scheme in Naigaon in Maharashtra, is based onthe fact that water is common - pool resource therefore all the members in the village irrespective of landownership could gain access to the utilisation of water resource. Each member in the village wasallocated water that would be sufficient to irrigate half an acre of area. These water rights were tradedamong the members for use. This enabled the landless to have equal rights over water and to enable tobenefit from the common - pool resource (Pangare, et al, 1996).
4.2.3.3 National Programme on Watershed Development
Learning from the success stories of the watershed development efforts, government policies have beenpromoted towards community - based watershed management in co - ordination with the NGOs. TheNational Water Policy 1987 is a step in this direction. The policy for the first time, aims to plan, developand conserve the scarce water resources in an integrated and environmentally sound basis. The Policyrecognises the importance of people�s participation in the development programme. The NationalWatershed Development Programme (NWDP) was introduced in 1994. It emphasised the importance ofpeople�s participation through Watershed Associations in planning and management. The NWDPcombined the features of the Desert Development Programmes, Drought Prone Area Programme andIntegrated Watershed Development Programme. Although the focus of the programme differs, the primeobjective remains land and water resource management (GOI, 1994).
This programme has set up three tiers of institutions to co - ordinate the implementation of WatershedDevelopment: Implementation and Review Committee at the state level, the District Rural DevelopmentAgency or Zilla Parishad at the district level and Project Implementation Agencies (government or non -government organisation) at the project level. The Project Implementing Agency at the micro level, isexpected to be of multi - disciplinary team (plant sciences, animal sciences, civil or agriculturalengineering and social sciences) designated as Watershed Development Team. This team is expected toform Watershed Associations at micro level. This formal institution is expected to ensure participationand its task covers preparing watershed development plan, monitoring and reviewing its progress, solvingany problems that arise, mobilising funds and for operating and maintaining the assets. To ensureeffectiveness of the participation, the project called for training of the project staff and the villagecommunity on various techniques, such as, record keeping, conducting meetings and liasoning with otheragencies. The programme has been implemented in the Himalayan states with the help of differentfunding agencies, such as World Bank, European Economic Community (EEC) and the government. Inaddition, the Minor Irrigation department under their Farmer Managed Irrigation Systems programme hasbeen promoting Water Users Association (WUA) to modernise and rehabilitate minor irrigationstructures.
The Ninth five - year plan in addition to watershed management emphasises the importance ofcommunity - based water harvesting in its programmes (GOI, 1999). The agriculture programmementions the importance of soil and water conservation to enhance and sustain the productivity of theavailable land stock, degradation caused by soil erosion, deterioration of hydrologic balance andincreasing competing demand for land. The irrigation programme stresses the need to improve waterefficiency by progressive reduction in conveyance and application loss of water, restoration andmodernisation of the old irrigation structures, introduction of water rationing and promotion of PIM withfull involvement of the water user. On minor irrigation the plan calls for restoration and improvement of

World Commission on DamsThematic Review: Assessment of Irrigation Options in India, Draft #1, Date: 08/11/1999
This is a draft working paper of the World Commission on Dams. It was prepared for the commission as part of its informationgathering activity. The views, conclusions and recommendations are not intended to represent the views of the Commission.
55
minor irrigation systems as part of the micro - watershed development, involvement of community,awareness on judicious use of groundwater and promotion of crop diversification in favour of less waterintensive crops. The trouble with all these wise words is that firstly, there is little understanding that onlycommunity participation can make these programmes successful and secondly there is little reflection orco - ordination of these with other components of the plan.
4.2.4 Use of Sewage Water for Irrigation
In Punjab, 34 million litres of industrial effluents and municipal wastewater is used for irrigation.However, since most of it is untreated, toxic elements enters the food chain through plants (Singh, 1997:100).
In Gujarat (around Baroda and Ahmedabad) and Tamil Nadu (around Chennai) also, industrial andmunicipal effluent water is used for agriculture with or without treatment, with mixed results. The impactof presence of chemicals in such water on the soils, crops and groundwater is not known or researched.
4.3 Some Examples of Successful Options Implementation
4.3.1 Options in Hill and Mountainous Region
Irrigation in hill and mountainous region were characterised by techniques that harvest water in - situ anddiverts water, with the help of simple engineering tools, into artificial channels that would take waterdirectly to the agricultural fields. When the streams became little bigger and turned into a river,technologies became more sophisticated and diversion systems became larger. The limitation in theavailability of groundwater, due to rugged terrain, has given them the only option to conserve water in -situ and with minimal soil and water conservation measures.
In - situ conservation of water for irrigation has been the principle in the mountainous and regions ofIndia, through terrace cultivation of crops. One of the simplest means of terrace cultivation practised inthe north - eastern part of India is Angami system, a form of terrace cultivation (CSE, 1997:58). Theterraces are cut along the rugged hills. These terraces are leaned up against the stone retaining walls atdifferent levels to protect the soil from being eroded and help in regularise distribution of water.Channels, sometimes bamboo pipes, are laid to divert water from the streams or rivulets to irrigate theseterraces. The average cost for constructing one-kilometre long terraces cost about Rs. 4,000. Asophisticated means of terrace cultivation is practised in the villages of Nagaland, called zabo system.Zabo means impounding water. This system is a �combination of forest, agriculture and animalhusbandry with a well founded conservation base, soil erosion control, water resources development, andmanagement and protection of environment� (Sonowal, et.al. 1989, cited in CSE, 1997:59). The sourceof water for these terraces is from local streams, natural springs and ponds.
Diversion - based irrigation is also practised in the hill and mountainous rainfall regions to tap varioussources of water available. A unique form of irrigation is practised in Himachal Pradesh called as Kulirrigation. The Kuls (diversion channels) are used to transport water from the glaciers to the village. TheseKuls sometimes are 10 Km long and irrigate about 100 ha. The catchments of these Kuls are maintaineddebris free and lined with stones to prevent clogging and seepage. These diversion - based hill irrigationsystems, which have evolved over a long period and have been extensively found in many parts ofHimachal Pradesh and UP hills are simpler in designs, easy to operate and have a very low maintenancecost (Pande, 1995). In addition to the above technologies, the cold desert regions of the HimachalPradesh divert spring water into small reservoirs for latter use, build small reservoirs above their fields tocollect soils to be scattered on their field to thaw the snow and also to enable the seeds to take roots, and

World Commission on DamsThematic Review: Assessment of Irrigation Options in India, Draft #1, Date: 08/11/1999
This is a draft working paper of the World Commission on Dams. It was prepared for the commission as part of its informationgathering activity. The views, conclusions and recommendations are not intended to represent the views of the Commission.
56
line the channels through wet soil (Ibid. 19). In the northeastern regions of the country, natural springwater is diverted through Bamboo pipes for irrigating the plantation crops (beetle leaf and black peppercrops) in Meghalaya. These bamboo pipes are widely prevalent and are so perfected that 18-20 litres ofwater entering the pipe gets reduced to 20-80 drops per minute at the site of plantation (CSE, 1997: 64-7).
These community - based irrigation management contributes 73 per cent of the net area irrigated in theregion (however it should be noted that tubewells do not always promote community managed systemsand they sometimes destroy the useful of hill irrigation systems by lowering the groundwater level)(Annex Table 14). In spite of increasing number of tubewells, contribution of private canals and irrigationfrom other sources is notable, which exhibits vast potential for revival of the existing irrigation in theregion.
The importance of revival of these structures had been recognised by government in 1970�s. In UP hillsand Himachal Pradesh government proposed to modernise these structures supported by state - controlledlegislation, the Kumaon and Gharwal Water (Collection, Conservation and Distribution) Act of 1975.The measures to modernise included permanent (concrete) lining of canals by government. However,such a measure did not make any difference in the improvement of the overall picture of irrigatedagriculture in the region. The Act (1975) stabilised the state control over the community - based systemsand promoted permanent structures in a dynamic ecological region, such as Himalayas.11 Thoughparticipatory management is now attempted in this region, participation is largely paying only lip serviceto community role in WRD management. In addition, technical interventions are promoted withoutunderstanding the inter - linkage of the water rights of the community (Pande, 1995).
Sukhomajri
Sukhomajri (Population in early eighties: 455, average annual rainfall: 1200 mm), a tiny sleepy villagenestling in the Shivalik hills in Ambala district of Haryana, was almost barren in the early 1980s. Landerosion had washed out several acres. Villagers had no alternative but to fell the remaining trees on thehill slopes for fuel and fodder needs. The village had no well for its drinking water requirements. Thehigh siltation rate was filling up Chandigarh�s Sukhna Lake, lying in the same watershed. A project thatbegan essentially to save the lake has become a model of hope for rest of the country.
PR Mishra, who had earlier failed in his attempts to stop the soil erosion, was soon successful when hestarted enlisting people�s co - operation in all his efforts. Three earthen dams were built to harvestrainwater and stop soil erosion. The water of the reservoir was distributed among all the villagers equally,irrespective of land holdings. The landless also got equal benefits, who sell their water to those who needmore water.
The once denuded slopes are now covered with vegetation, thanks to social fencing by the community.Crop yields have increased three to four fold and some farmers also grow two crops a year. Theecological benefits outweigh the economic gains and also ensure stability. Economists have also hailed itas an efficient cost benefit model of development.
Inspired by Sukhomajri, the state governments of Punjab, Haryana and Himachal Pradesh, with thesupport from World Bank, tried to replicate the model in parts of the lower Shivalik hills. But the effortdid not succeed, as people�s participation was not assured in the effort (Singh, 1997: 159-163).

World Commission on DamsThematic Review: Assessment of Irrigation Options in India, Draft #1, Date: 08/11/1999
This is a draft working paper of the World Commission on Dams. It was prepared for the commission as part of its informationgathering activity. The views, conclusions and recommendations are not intended to represent the views of the Commission.
57
4.3.1.1 Irrigation Through Man - Made Glaciers
In the Trans - Himalayan region the melting water from the glaciers or snow is skilfully utilised forirrigation. In Ladakh, the melting water is diverted from these glaciers with the help of guiding channelsduring the daytime, towards the evening the water is stored in a small tank, called zing (CSE, 1997: 30).The stored glacier water is used the following day for irrigating their fields. Each village in Ladakh has alarge number of channels and Zings. Sometimes the Zings in these region looks like artificial glaciers.About 19,000 Ha of land in the region is depended on these artificial glaciers or other forms of diversionchannels (CSE, 1997).
4.3.1.2 Jal Talais for Irrigation
In the UP hills, people have evolved various techniques for conservation and utilisation of the availablewater. For instance, Doodhatoli Lok Vikas Sansthan have evolved jal talais to sustain and conserve theample water reserves in the mountainous region. In the past three years, the people of the region built anetwork of jal talais along the face of the hillsides. Built as an earthen pit with 2 metre in length with 1metre in width and 1 metre in depth it looks like small basins. This jal talais built on the upper catchmentarea serves to regenerate vegetation, retards excess surface drainage and nourish the land with enoughmoisture throughout the year (PWMTA & FARM, 1998:126). The stored water is trapped through gulsor irrigation channels in the downstream. These guls irrigate about 20 per cent of the land owned by eachhousehold. This is supported by rotation of crops to suit the availability of water and to retard theexhaustion of soil in the region.
4.3.1.3 Haveli System in Madhya Pradesh
In the upper part of Narmada valley in the MP, traditional water harvesting method called haveli stillfunctions. Rainwater from the wet season is held in fields by earthen embankments constructed on all foursides. These embanked fields vary in size from 2 to 12 ha. In early October, farmers drain the water off,and then plant their crops, thus making a winter crop possible. Covering an area of about 140,000 Ha invarious districts of MP, the system necessitates co - operation between various farmers in a drainagesystem.
The haveli areas have become one of the largest sprinkler irrigated tracts, but without the groundwaterrecharge resulting from inundating the fields for several months, the functioning of the sprinklers could bein danger (Postel, 1999: 221-2).
4.3.2 Options in Flood Plains
The plains and the flood plains are the most important zones of largest concentration of people. Theregion encompasses the Indo - Gangetic plains and the eastern coastal plains of the country.
In the northern part of the Indo - Gangetic plains, with low rainfall areas privately owned open wells,operated manually or by animal power and storage based systems were the principal source of water forirrigation. In the flood prone areas of the region agriculture was largely supplementary from surfacesources, not just to irrigate their fields but also to fertilise their fields, wash off salinity in the region andcontrol diseases like malaria by making use of fish in the floodwater (see for detailed account, Willcocks,1930).
The high water table in numerous regions in the upper Gangetic plains enabled small private low - liftirrigation systems called as �overflow� irrigation (Bottrall, 1992:228) to dominate. The traditional

World Commission on DamsThematic Review: Assessment of Irrigation Options in India, Draft #1, Date: 08/11/1999
This is a draft working paper of the World Commission on Dams. It was prepared for the commission as part of its informationgathering activity. The views, conclusions and recommendations are not intended to represent the views of the Commission.
58
methods facilitated drainage � both by horizontal and vertical methods (Sengupta, 1995). One of themajor modes of irrigation in the plains was through well irrigation that facilitated �vertical drainage� ofwater. It is stated that a normal open well could irrigate about two - thirds of an acre (CSE, 1997). Naturalprecipitation was retained through water harvesting structures like ponds and tanks. These structuresensured the supply of best leaching agent, the rainwater, to overcome salinity in this area (Sengupta,1995), thus facilitating horizontal drainage.
Irrigation was dependent on the floodwaters and jhalars or shallow wells excavated on the banks of thestream, from which water was lifted through Persian wheels. Irrigation was also practised through tanksin certain parts of the region, like in Haryana. The tanks were basically used to grow crops along thebanks and to recharge the wells.
In the central part of the Gangetic plains wells were main source of irrigation, because ground water wasvery high, and hence boring of wells was easy and cheap in most districts, excepting in sandy tracks alongthe river banks. Many a times, earthen wells get destroyed during the rains. Wells existed in conjunctionwith the Tanks in many parts of the region. It varied in size and generally was more than 6 metre deep.The water from the tank was taken to the field through dauri, a shallow round basket made of wicker orbamboo matting. The other sources of irrigation were natural jheels, swamps and small watercourses.
Flood irrigation assumed prominence in the lower part of the flood plains. Different kinds of the floodirrigation were practised. Abi is a peculiar system of flood irrigation used in conjunction with wells. Theriver water is diverted into the well and in the winters a small bund was sometimes thrown across theriver to arrest the water. In addition, people have evolved different mechanisms to keep the excess floodwater out. The riverbed was divided into number of areas surrounded by high and strong embankments,called kunds. These kunds were primarily to hold water during the floods and during water needs a smallhole was made from the embankment to irrigate the paddy crops. Embankments were also constructed toa substantial length not only for flood protection but also for flood irrigation. These embankments built byzamindars were deepened and maintained through significant investments by community. However, inrecent years embankments have lures the engineers, in spite of the fact that many studies have pointed outthe ill effects of them.
Enthused by Grand Anicut along the Cauvery, the Colonial rulers planned to expand such schemes in thenorthern plains to tap perennial snow - fed rivers amenable to low cost gravity flow. Availability of fertilesoils, medium to low watertable and low rainfall were the other encouraging features. First such greatscheme was that of Upper Ganga Canal in 1847. Though the scheme became a dominant mode ofdevelopment in latter years, it was criticised on environmental grounds (Bottrall, 1992:231).
4.3.2.1 Inundation Canals
Inundation canals are based on simple technology: river banks are seasonally breached and the overflowis channelled to low lying areas for kharif crop. The watercourses disappear after the monsoon and arerebuilt the following year. Much of the irrigated agriculture in Punjab occurred in the doabs, the lowlands lying between rivers. An adaptation later emerged: the two season perennial systems, in whichcanals are built with permanent headwork that withstand, but do not dam, the flood flows of the rivers. Bythe mid 1800s when the British sought to intervene assertively into the productive countryside of thenorthwest, inundation canals of the Punjab alone aggregated some 2500 miles in length, and irrigatedmore than a million acres. (Goldman 1994: 54-57) Even at the time of Independence in 1947, there were120 inundation canals in Indus basin, of which 9 came to India and the rest went to Pakistan after partition(Rao, 1975: 60).

World Commission on DamsThematic Review: Assessment of Irrigation Options in India, Draft #1, Date: 08/11/1999
This is a draft working paper of the World Commission on Dams. It was prepared for the commission as part of its informationgathering activity. The views, conclusions and recommendations are not intended to represent the views of the Commission.
59
What Willcocks calls overflow irrigation, irrigated over 180,000 Ha of land in Ganges and Damodardeltas in the Bengal since 3000 years is now in complete disuse. In fact, the prosperous delta of Tanjor issaid to be a system designed in the mould of overflow irrigation in western Bengal. In his celebratedlectures published in 1930, Willcocks goes on to say how right till 1815, the Bengal Agriculture was themost productive in India and Tanjor delta was only second. That irrigation not only used to assureabundant crops, but also used to keep Malaria away from the area. Willcoks goes on to narrate how it ispossible to recreate that system and that is the only way to put Bengal irrigation back onto the track ofprosperity (Willcocks, 1930).12
4.3.3 Options in Arid and Semi - Arid Region
In plains of the arid tracks of western India, irrigation is largely rainfed and is through subsurface storage.In arid climate like the desert region of the Western India, where monsoon rains are inadequate anderratic, without irrigation agriculture in the region becomes risky and difficult affair. Sengupta (1993)points out that in these regions submergence tanks (where soil moisture rather than surface water is themajor benefit from tank storage) is said to have predominated over the gravity - based storage tanks andgroundwater irrigation. In addition, sub surface dams were constructed to block the flow of surface andsub - surface water in stream beds, which results in increased percolation of water into the sub - soil andrejuvenation of wells (Sengupta, 1993: 48). However, these systems have declined over a period of time.
4.3.3.1 Harvesting Water Locally for Irrigation
Khadin Mode of Irrigation
Khadin is an earthen embankment built across the general slope, which conserves the maximum possiblerainwater runoff within the agricultural field. It is usually 1.5-3.5 metre high and made on the lower threesides of a gently sloping field, the fourth being left open for water to drain in from the surroundingcatchment area. The catchment area of a Khadin is usually gravely and rocky upland, as is characteristicof the Thar Desert. The flooded area itself is a gently sloping plain, with topsoils suited to cropcultivation. Cultivation takes place in the flooded area itself, making use of the enhanced soil moisturecaused by the collection of runoff in the enclosed area. The additional benefit of the Khadin bund � theretaining embankment - is that soil eroded from the catchment area is deposited in the flooded area. Thismakes for a deeper and more fertile layer of topsoil, and the flooded area is thus suited for cultivation. Itis important to note here that while collection and retention of runoff are what makes agriculture possiblein the Khadin system, only about 50-60% of the total runoff collected can be utilised. Thus for successfulKhadin cultivation, a flooded area: catchment area ratio of 1:15 is required. The Khadin bund is providedwith a spillway for the disposal of excess runoff, so that the safety of the bund itself is not threatened bypressure of the floodwaters. Another advantage of Khadin cropping is that salinity in the Khadin floodedarea is seen to be significantly lower than outside it. This is probably due to seepage waters flushing saltsout of the inundated area. Also, soil levels inside the flooded area are higher than outside it, which alsocontributes to control of levels of salinity inside the Khadin area (Sengupta 1995, Mishra 1995). Aspecific cropping system is a corollary to the Khadin system of irrigation. Sowing takes placeimmediately after the first monsoon rain, and coarse cereals, pulses and oilseeds are sown in a mixedpattern. In years of good rainfall, a winter crop may also be obtained. Yields from Khadin cultivation canbe from 300-500 kilograms per hectare of coarse cereal, in year of average rainfall. While this is not anexceptionally large yield, it is significant that this yield is obtained without inputs of fertilisers and otheroverheads (CSE, 1997:136-138).
In Rajasthan, wells (excluding tubewells) irrigate about 51 per cent of the net irrigated area in the state in1989-90 compared to tanks and other sources of irrigation that contributes only 5 per cent for the same

World Commission on DamsThematic Review: Assessment of Irrigation Options in India, Draft #1, Date: 08/11/1999
This is a draft working paper of the World Commission on Dams. It was prepared for the commission as part of its informationgathering activity. The views, conclusions and recommendations are not intended to represent the views of the Commission.
60
year (Ballabh & Kameshwar, 1999:13). These minor irrigation sources (excluding tubewells) aredepended on the rainwater harvested locally in a variety of ways through communities.
Khadin system of farming is one among them. The system is based on the principle of harvestingrainwater on farmland and subsequent use of water - saturated land for crop production. The systemsenables to store the floodwater in an enclosed embankment built across the slope, utilises the soilmoisture and the fertile topsoil for cultivation (see Box �Khadin Mode of Irrigation�).
Rainfed agriculture is practised in most parts of the semi - arid regions of the western India. In this dryregion, measures for irrigation options have to conserve water in small - scale storage structures and byevolving options that suits the region. Communities and NGOs have evolved efforts in that direction inthese semi - arid tracks.
4.3.3.2 Johads � Reviewing Traditions
In the state of Rajasthan, at the eastern edge of the Aravalli mountain range, the once semi - aridlandscape of Alwar region has been transformed into a luxuriant Perennial River and rich vegetationregion. It all began with the work Tarun Bharat Sangh (TBS), a NGO based in Alwar. They realised the(once) important johads, a water harvesting structure to store rainwater run - off. In this system,inundation tanks called johads are created at various locations in and around a village. Tracts of landinundated by the construction of an earthen or masonry embankment, and dug retention ponds are bothreferred to as johads. In addition, raising the height of the embankments that form the field boundaryinundates some fields. Such inundation results in significant groundwater recharge in this semi - arid tractwith fairly sharp relief, where rainfall would otherwise be lost as rapid runoff. The recharged groundwateris then used to irrigate crops in times of water shortage and recently even during the dry winter season.Cultivated crops also benefit from the enhanced soil moisture that results from the inundation of fields.Irrigation from johads is supplemented by diversion of water from ephemeral streams. Weirs locallyreferred as anicuts, have been built across the numerous non - perennial streams in the region, and thewater is diverted to fields for irrigation. The weir also reduces velocity of the flowing water and thusallows for some additional recharge to take place. These johads built on the indigenous knowledge systemhas transformed the ecology, agriculture, economics and general well - being of the people in severalvillages in the region (UN - IAWG � WES, 1998:4; Taneja, 1999).
Evaluation of these systems by engineers (for example, by Dr G D Agarwal, former Professor & Head ofthe Civil Engineering Dept, Indian Institute of Technology, Kanpur) have indicated that: over 60 per centof these systems were compatible with engineering standards of storage construction and costs less (Rs.0.95 per cubic metre of water storage, average for 166 structures). The Engineering soundness of thesestructures was tested in 1995 and 1996 monsoon when numerous government constructed structures inadjoining areas got washed away but the TBS structures stood. They have the capacity to improve thestorage capacity in the groundwater table at the rate of 20 feet per 1000 to 1500 cubic metre per hectare ofwater storage (CSE, 1997). A Geophysicist has shown that these structures has enabled an additionalrecharge of groundwater to the tune of 20 per cent, 17 per cent of additional seepage of rainfall in the non- monsoon period and has reduced the seasonal runoff from 35 to 10 per cent (Mahapatra, 1999:38). Atpresent TBS has constructed more than 2500 johads in 500 villages. The total expenditure incurred hasbeen Rs. 150 million, with a staggering 73 per cent contribution by the people (in cash and kind) (UN -IAWG - WES, 1998:4). These johads have recharged the average groundwater table that was 200 feetbelow ground level to 20 feet. It has enabled the farmers to raise food grains (Wheat and barley) duringrabi season than dry crops earlier, and corn, Arhar, jowar, kala jeeree and vegetables in Kharif (Ibid.). Incase of wheat, the average productivity has jumped some areas from 720 kg per acre to 1500 kg per acre(UN - IAWG - WES, 1998:17; Devarajan, in Business Line, 4 November 1999).

World Commission on DamsThematic Review: Assessment of Irrigation Options in India, Draft #1, Date: 08/11/1999
This is a draft working paper of the World Commission on Dams. It was prepared for the commission as part of its informationgathering activity. The views, conclusions and recommendations are not intended to represent the views of the Commission.
61
4.3.3.3 Chaukas in Jaipur
While in Jaipur communities have taken charge of chauka, a rectangular enclosure to protect and developthe pasture lands to sustain the livestock of Lapodia village. The chaukas are simple as any storage tanksand they are inter - connected. This helps in growth of grass around and recharges groundwater aquifers.In addition, restoration of a tank, named Ana Sagar in Lapodia in 1994 has enabled to irrigate 300 Ha in1996 for the first time in 20 years. Two more adjoining tanks (Singh & Jagbir, 1999:8) followed therestoration of the Ana Sagar.
4.3.3.4 Water Management in Gujarat
In Gujarat, check dams, percolation tanks and other minor irrigation schemes created an irrigationpotential of 167,452 ha. (Ballabh & Kameshwar, 1999:6). It is also pointed out that the largest portion ofthe area currently irrigated in Gujarat is well irrigated. One estimate places the proportion at two - thirds(Raju, 1998) while another estimates that 77% of irrigation in Gujarat is from groundwater. Theincreasing stress on the groundwater resources has led some of them to evolve options to rechargetubewells, whereby surface waters can be directed to aquifers. This reduces transit and evaporation lossesand makes sure that groundwater recharge is faster than would occur if infiltration were to take place inthe normal fashion (Raju, 1998).
4.3.3.5 Ground water management in Kutch
A description of the recharge tubewells installed in the Kutch region of Gujarat is provided in Annex 15.Another method is the construction of subsurface dykes in ephemeral streambeds. This leads to thecapture of base flows in these rivers, which then recharges the highly permeable aquifers of the river bedsand the wells that are often located in the riverbeds. The advantages of these and other individual wellrecharge techniques are that there is no submergence of land beyond the river bed, there are noconveyance and/or evaporation losses and the maintenance costs are low (around Rs. 10,000 annually).There is also optimum utilisation of available rainfall as the recharge structures can accommodate morethan one flood discharge (Raju, 1998). The efficacy of these direct recharge methods is demonstrated byan evaluation of the Moti Rayan site in Kutch, where the quantum of water recharged increased 3 timesfrom 1989 to 1990, while rainfall in 1990 was only 60% of that received in 1989 (Annex 15). Thisincrease in recharge is traced to the construction of two percolation ponds with recharge tubewells, and asubsurface dyke with four recharge tubewells (Raju, 1998). It is important to note that groundwater levelshave not gone down in spite of continuous use of groundwater. Groundwater quality also has improved.
An economic evaluation of the groundwater recharge activity carried out by VIKSAT in response tooverdraft of groundwater in north Gujarat has shown that the income/ cost ratio of check dams for a givenyear is approximately 3:1. The benefit: cost ratio of 3:1 does demonstrate the efficacy of the rechargestructures (Chopde, et al. 1998).
4.3.3.6 Demand Side Management in North Gujarat
The flip side of increasing water availability for irrigation is the issue of demand management. It has beenpointed out that this concern has attracted less attention than the practice of augmenting supplies, but thatproper attention to managing the demand for irrigation water would result in more efficient use ofavailable irrigation. This is illustrated by an evaluation of irrigation practice in Mehasana district inGujarat, where it was pointed out that change in cropping pattern would have a significant impact on theuse of water. For example, it was found that the water used to irrigate one hectare of alfalfa could be used

World Commission on DamsThematic Review: Assessment of Irrigation Options in India, Draft #1, Date: 08/11/1999
This is a draft working paper of the World Commission on Dams. It was prepared for the commission as part of its informationgathering activity. The views, conclusions and recommendations are not intended to represent the views of the Commission.
62
to irrigate four Ha of wheat or eight Ha of mustard. The dimensions of the border strips on fieldboundaries can also be adjusted with regards to the soil type, slope and discharge from the strip itself -selection of appropriate size of border strip is shown to increase the crop yield (Chopde, et al. 1998).
4.3.3.7 Ground Water Management by AKRSP
The importance of ground water management is also being realised by NGOs. Aga Khan Rural SupportProgramme (AKRSP) began with the restoration and construction of huge percolation tanks - or artificialponds to raise the level of the water tables. The technical excellence of the schemes reassuredparticipating farmers and encouraged them to try other techniques, such as rebuilding canals, trappingrainwater from rooftops, deepening streams and installing drip irrigation outlets. This was in addition tomeasures such as, contour bunding on sloping fields, field levelling, gully plugging and contourploughing to trap the rainwater, prevent soil loss and deepen the absorptive capacity of the agriculturalland. All these have had perceptible impact on villages in Surendranagar, Junagarh and Bharuch district inGujarat where AKRSP is active.
4.3.3.8 Sadguru - Reviving Rivers
Realising the inadequacy in availability of water as the limiting factor for agricultural and ruraldevelopment, the N.M.Sadguru Water and Development Foundation (hereafter called as Sadguru), anNGO based in tribal dominated Panchmahals district in Gujarat, used community - based innovativemeans to harvest water as an entry point for initiating and fostering economic development in the region.The major intervention of the Foundation has been lift irrigation, constructing water - harvestingstructures, promoting watershed development activities through village institutions. These community -based activities of water harvesting have revived the Kali River in the region and have created numeroustangible and intangible impacts on the economic and social well being of the tribal people in the region.
One of the interventions of the Foundation has been lift - irrigation in the region. The intervention hasprovided farmers water for cultivating all season crops instead of one season crop. The lift - irrigationco-operative of Mota Dharola has led to 78% increase in the value of agricultural production (see Table9).
Table 9. Financial Position of Mota Dharola Lift Irrigation* Scheme
Impact of Lift Irrigation SchemeItemBefore After
Value of agriculture production 8,99,150 74,00,000Per household agriculture production. 9,773 71,154
* Capital cost of lift - irrigation at Mota Dharola under Jawahar Rozghar Yojana �III was Rs. 3 million.Source: Saini, 1998.
Though agriculture development is one of the direct outcomes, trickle down impact towards change incropping pattern and improvement in living standard through diverse on - farm and off - farm activities innotable in the region. Introduction of three lift irrigation schemes at village Chanasar, a group of 146household with 1270 population size, has changed the lifestyle of the people in the village. The area underirrigation has increased to 330 Ha compared to 4 Ha (mainly by wells) before the introduction of liftscheme. Beneficiaries who were unable to grow crops before the intervention are now in a position togrow more crops in Kharif and Rabi season. Farmers are now able to raise three crops in a year, havebeen able increase the yield and have introduced inter - cropping (Fig. 3) (Patel, 1998). The situation hasnot been different in Dhabudi village, where checkdams were introduced as an option for irrigation

World Commission on DamsThematic Review: Assessment of Irrigation Options in India, Draft #1, Date: 08/11/1999
This is a draft working paper of the World Commission on Dams. It was prepared for the commission as part of its informationgathering activity. The views, conclusions and recommendations are not intended to represent the views of the Commission.
63
(Fig.4) (Sadguru, 1999:15). This improvement in the agriculture has enabled improvement in thelivestock conditions of the village. The introduction of improved high breeds� varieties has enabled a neweconomic opportunity through dairy farming (see Table 10). Though new breeds have been introduced,it is not clear from the study how the high breed variety are able to support farmers in terms of ploughingand other agriculture activity. However, there has been improvement in terms of increase in ownership ofassets among the people (ibid.).
Table 10. Improvement in Diary Farming in Chanasar Village
Particulars Before L I Scheme After L I SchemeBreed and Typeof Cattle
Local goats, buffalo, cow andbullocks
Improved breeds like Gir & Mehsana
Milk Production 1 to 1.5 litres per cow per day 3.5 to 4 litres per cow per dayFodder Scarcity of fodder Enough fodder for consumption and excess
available for sale.Source: Patel, 1998.
Transformed Village - Shankerpura
Shankerpura, is a small village of 200 tribal households in Panchamahals district of Gujarat. Of the totalgeographical area of 588 Ha, 260 Ha were of wasteland and none of the land was irrigated. Sadgurucommissioned lift irrigation scheme in 1976 and later watershed development programme. In 17 years,about 260 Ha of wasteland has been afforested and brought under cultivation and an equal amountbrought under irrigation in 1993. A sample survey in the village indicated that tree plantation was ahighly profitable activity for the farmers with an average net present value of Rs. 11,144 per acre perannum and a financial rate of return of 33 per cent. As a result of increased availability of timber, some160 houses was constructed using timber valued Rs. 3 million and man - days of employment generatedwere of order of 41 per Ha per annum. The increased area under irrigation and tree plantation hasgenerated so much employment that the rate of seasonal migration has come down from 75 per cent in1976 to about 5 per cent in a normal year in 1993.
Today, there are over 70 people who are employed outside and many of them send money back home,increased attendance in school up to 200 per cent and people have the ability to cope with adverse effectsof drought and other exigencies.
Source: Singh & Gupta, 1997: 10.
Reviving Rivers
River Kali - II once a perennial river (before 50 years) has in the recent past flowed only for 6 months.However now the river flows almost full to its potential. Such change has been brought out byappropriate technological interventions in the form of series of small masonry water harvesting structuresalong the entire length of the river. This is not an isolated case for the Sadguru, but one among 35 riversin the Gujarat and Rajasthan. The water harvesting structures, each benefiting more than about 100families, has increased the area under irrigation, availability of water round the year, food self sufficiencyand reduced the migration of people from 70 per cent to 10 per cent.
(Jagawat, 1999)
Though these are piece meal examples, Sadguru integration of watershed development programme adds anew dimension to their activities in promoting soil and water conservation programme and afforestation

World Commission on DamsThematic Review: Assessment of Irrigation Options in India, Draft #1, Date: 08/11/1999
This is a draft working paper of the World Commission on Dams. It was prepared for the commission as part of its informationgathering activity. The views, conclusions and recommendations are not intended to represent the views of the Commission.
64
in private and community lands. It has transformed once semi - arid backward region to an agriculturallyadvanced green oasis over a period of 17 years (see Box below). A combination of all these activitiesincluding income generation has enabled to revive Kali River in the region. Once non - perennial rivershave been flowing full to its potential in recent years.
4.3.4 Options in Peneplains and Coastal Region
The peneplain regions exist between a mountainous and the plains, where the irrigation system is anoutcome of the natural conditions and physical configuration of the region. Parts of these regions arecharacterised by rain shadow region, have a rapid gradient that lets off water quickly due to the terrain (asin the Deccan Plateau, the Shivaliks, the eastern coastal plains and Chottanagpur Plateau in the east). Dueto marked slope in the region and torrential rains, a number of rainfed streams emerge from the hills andintersect the region. Many a times these streams and rivers swells up in discharging rainwater and alsoeroding the landscape. The communities have evolved a system whereby the runoff water is impoundedfor use through storage or by diverting the stream water for use.
The State of Maharashtra, having large portion under the Deccan Plateau, has a larger portion of theirrigation potential created by minor irrigation projects (2.394 M Ha.) as opposed to the potential createdby M & M projects (1.986 M Ha.). The percentage utilisation of this irrigation potential is also morefavourable for minor irrigation (89.6%) than for M & M irrigation projects (51.2%). Groundwater is themost important source of irrigation in Maharashtra, irrigating more land than even canals (Ballabh &Kameshwar, 1999:9).
The northern part of State is dominated by channel irrigation based on diversion weirs called bandharasfor many years. These bandharas are either masonry or earthen in nature built across the streams or riversto divert water into irrigation channels or to impound water to a large reservoir. This system was fairlywidespread, but is no longer now because effectiveness of river regimes have been altered due to theconstruction of large dams and reservoirs. Channelling of water (from 2 to 12 km in length) to the canal isachieved by raising a diversion weir (bandhara), by which the level of water is raised to allow them toflow into the canals that are excavated. Irrigation water reaches tracts of fields called phads. Regulationof water supply is achieved by the construction of specific distributaries.
The Baliraja Dam in Western Maharashtra is an interesting example of how people can on their own plan,finance and execute a dam. The idea for this dam arose as a response to recurring drought in the commandof the Yerala River in 1987. The communities developed a plan to construct a dam on the Yerala River,once a perennial river but only flowing seasonally by the early 1980s. This dam, 4.5 m high, 120 metreslong, has a live storage of 20.5 million cubic feet. It�s irrigation potential is 390 ha. The Baliraja dam hasa masonry base topped by low �cost shutters made of timber and cement, and is higher than a bandhara,however it is blended with the bandhara system insofar as the upstream Balwadi bandhara (alreadyexisted before Baliraja was built) trapped silt and reduced the siltation rates for the Baliraja Dam. Alongwith the establishment of the Baliraja dam, a water use arrangement was instituted. According to thisarrangement, water was to be divided equally among all families, protective irrigation for non - waterintensive crops like groundnut and coarse cereals was to be provided, and water was to be supplied onlyfor drinking after the 15th of January (Thukral & Sakate, 1992).
In eastern Maharashtra, a diversion - based system called gata was practised, which diverted a stream�sflow to create a flood. In this system streams in valleys with gently sloping sides were dammed withtimber and embankments of earth then used to join the dam to the valley sides. The banks of the streamwould then be temporarily flooded, keeping the soil moist and suitable for cultivation (Sengupta,1993:37).

World Commission on DamsThematic Review: Assessment of Irrigation Options in India, Draft #1, Date: 08/11/1999
This is a draft working paper of the World Commission on Dams. It was prepared for the commission as part of its informationgathering activity. The views, conclusions and recommendations are not intended to represent the views of the Commission.
65
In the semi - arid tract of northern MP an irrigation system, locally called the haveli system, prevails inwhich the crop is taken during the winter season using soil moisture collected through inundation duringthe monsoons. As the land begins to dry, water is collected in the fields with embankments. The residualmoisture is utilised for crop growth. This system is practised on clayey soils. The retention of water onblocks of land for long periods also leads to groundwater recharge and weed control on the inundated land(CSE, 1997: 167). Two kinds of tank construction fall under the haveli system. In the areas of undulatingterrain, embankments (bundhies) are about 2m high and hold upto 1m of water, collected from acatchment area. However, the submergence area itself has a gentle slope not more than 0.5%. The othervariety of submergence storage is constructed in level areas, on a slope of 1-3%. Here the embankmentsare only about a metre high, and only the water that rains on the bunded area itself is contained. Themaximum depth of water retained is half a metre (Sengupta, 1993: 53-54).
4.3.4.1 Reviving Ahar - Pynes: Storage cum Diversion - Based Systems
Sengupta documents a traditional canal irrigation technology, from his research in South Bihar. These arecalled pynes, which are led off from points facing the current of the local rivers to the agricultural fields.These can be an amazing 20-30 km long, with a number of distributaries, and in some cases, irrigatedupto a hundred villages (Singh, 1997: 227-228).
One of the practices of irrigation is based on bunds called ahar, which vary greatly in size. The areairrigated by an ahar ranges from less than a hectare to 40 Ha. These storages are in the nature of gravityirrigation tanks (Sengupta, 1993), wherein water is released from the storage to the crop fields throughoutlets. Diversion channels leading out of the tank storage, called pynes, are also a part of the irrigationsystem. These outlets are kept closed while irrigation was not needed, but were opened, e.g. when therains failed, or at transplantation time (CSE, 1997:178). An analysis of the rainfall patterns in the regionshow high variability of rainfall in September, and deficits during this period can be compensated byrainfall collected in the ahar during the months of July and August. Thus the system is suited to theclimatic characteristics of the place (PSI, n.d.: 17). It is interesting to note that water availability in theahar system has allowed for improved seed varieties to be used by the farmers (PSI, n.d.: 33). After thepaddy season is over, the reservoir is drained and the bed of the reservoir cultivated with winter cropssuch as barley and wheat (CSE, 1997:178).
The area irrigated by the ahar - pyne system has declined significantly since the 1960s, at the rate of 1600Ha a year (PSI, n.d.: 20). The productivity of ahar - irrigated lands in one section of Palamau district hasbeen calculated at 9.26 quintals per acre, with manure and fertiliser inputs. This figure comparesfavourably with the average productivity for Bihar of 4 quintals per acre, and also with the all Indiaaverage paddy yield of 10.3 quintals per acre in 1988 (PSI, n.d.: 35-36). In recent years, these minorirrigation has witnessed decline from irrigating 35 per cent of the 2.5 M Ha of cropped land in the early20th Century to less that 3.5 per cent of the 3 million hectare land (Pant, 1998).
Satpath, a rural social development initiative has been working on renovating the ahar - pyne in Bihar thathas been dilapidated for 30 years. Through volunteered labour contribution they have succeeded inirrigating 3,200 Ha in 10 village. Besides the crop production rising significantly, cultivation of pulseshas been possible after a gap of 30 years. The expenditure on fertilisers has come down, groundwater isrecharged and water table has risen considerably. Satpath plans to renovate 8 more paynes and 6 aharssoon (Bhushan, 1999:12).

World Commission on DamsThematic Review: Assessment of Irrigation Options in India, Draft #1, Date: 08/11/1999
This is a draft working paper of the World Commission on Dams. It was prepared for the commission as part of its informationgathering activity. The views, conclusions and recommendations are not intended to represent the views of the Commission.
66
4.3.4.2 Network of Kata in Orissa
In Orissa, there exist a wide network of tank storages, of the gravity irrigation type (called kata) as well asof the submergence type (bundhies, similar to those in the neighbouring state of Madhya Pradhesh). Thekata are similar to ahars in that these are also strong earthen embankments. Katas are built across adrainage line, to hold - up an irregular shaped sheet of water. Through an opening in one end of theembankment the water is led, either by a small channel or from field, to field along terraces. A uniqueform of groundwater utilisation is also witnessed in western Orissa, a technique developed by the Gondtribals. This chahal technique envisages a shallow channel, approximately 10 m. long, dug in sandyriverbeds where the hills streams go underground. Water is lifted from the chahal, earlier by wooden liftsand now by pump sets (CSE, 1997: 183). This technique would obviously be limited to humid areas withshallow water tables, or indeed sandy riverbeds alone.
4.3.4.3 Tanks and Anicuts in South India
A more sophisticated system, compared to bandharas, to divert water from the streams and rivers isthrough anicuts. From these anicuts, long systems of channels and tanks were extended to water distantregions. These anicuts dominant in the peneplains and the coastal plains of Southern India were able �topush the water into the channels which were dug on one or both sides of the anicuts� (Ludden, 1979, citedin CSE, 1997: 255). He also points out these sophisticated systems grew in a �cellular segmentedmanner� with increase in population and irrigated area. These anicuts ranged from earthen type to that ofconcrete structures like the Grand Anicut on Cauvery River. These anicuts diverted water through aartificial channel (called as varattu kal, vaikal, Pynes in different parts of the country) to reservoirs (callederies, kanmoi, keres, katas, Ahars etc.) for irrigation purpose. These reservoirs are constructed by erectingan embankment across the slope with two sided embankments along the sides, which gradually loses itsheight to suit the gradient. The upstream part of the embankment is left open for drainage water to enterthe reservoir. The water from these reservoirs is utilised for irrigation through an outlet or sometimesirrigated through natural seepage. These reservoirs vary in size and their ability to irrigate from less than 1hectare to about 1000 hectare and above.
What is important of these reservoirs is that diversion and storage structures exist in combination. Thesesystems not only serve as an irrigation structure but enables to recharge ground aquifers, arrest the erodedsoil, reduce the amount of flood water and finally provides a source of revenue for the people. Thesereservoirs in Tamil Nadu have been classified as individual tanks, systems tanks and tank cascades(Saravanan, 1994:12) based on the hydrological characteristics. The individual tanks are rainfed and havetheir own catchment area. Man - made perennial rivers largely fed the system tanks, while the tankcascades receive water from the rainfed non - perennial river systems. Many a times these tank cascadesare largely found in the coastal plains, due to gentle gradient. These reservoirs though are marked byengineering ingenuity and require regular maintenance through desilting of the channels and the bed,removing encroachments and maintaining the catchments. Though surface water was a major source forirrigation in the region, ground water use was perfected, where soil conditions permit, for conjunctivewater use.
The area irrigated by these systems is witnessing decline in southern states, especially in the last fiftyyears due to increasing centralisation and technocentric grand schemes of irrigation system. In TamilNadu the area irrigated by these storage structures called as tanks has declined from contributing 60percent of the irrigated area in 1950�s to less than 30 per cent in 1989 (Saravanan, 1994).

World Commission on DamsThematic Review: Assessment of Irrigation Options in India, Draft #1, Date: 08/11/1999
This is a draft working paper of the World Commission on Dams. It was prepared for the commission as part of its informationgathering activity. The views, conclusions and recommendations are not intended to represent the views of the Commission.
67
4.3.4.4 Rehabilitating Tanks
In recent years rehabilitation of tanks (known by different names in different parts of the country)dominant in southern India and in Southern Bihar is gaining prominence through a watershed approach.
Though the need to restore these systems were realised since 19th Century, the importance of community -based restoration (or currently termed as �rehabilitation�) has only been realised in the 1990�s due toimportance of participatory governance and impending water crisis.13 There has been increasing aid frominternational community (EEC, Ford Foundation and recently World Bank) with the support of thegovernment departments. These tanks which have been irrigating about 1/3rd of the irrigated area in thesouthern states. Experience in rehabilitation of these tanks offers a potential solution to increasing foodand water crisis in the region.
The tanks, which now contribute about 25 per cent of the total irrigated area, have been classified basedon administrative convenience in Tamil Nadu. The Panchayat Union (PU) maintains tanks withcommand area of less than 40 Ha that are rainfed or are fed by non - perennial streams, while the PWDmaintains both rainfed and canal fed tanks with command area of more than 40 Ha. Tank modernisation(more appropriate word would be rehabilitation) has been undertaken through Centre for Water Resourceand Ocean Management, Anna University in co - ordination with PWD for only the PWD maintainedtanks in phased manner. Until the end of Phase II of the project about 422 tanks have been rehabilitated.An evaluation from the sample of 13 tanks at the end of the Phase II of the project indicates improvementin the: irrigation efficiency from 29 per cent (pre - project period) to about 45 per cent (post projectperiod), increase of 6 per cent of the area under cultivation, decrease in the overall amount of water usedby 10 per cent, and more optimum water use. The crop yield has increased from average 3362 kilogramper hectare to 4311 in the post project period. The net return has increased by 20 per cent from therehabilitation of the PWD tanks (Annex16) (Anna University, 1997). There have been signs of increasedinvolvement of the farmers in the tank maintenance and management.
Benefits of Desiltation in Margondanahalli
Water Management Committee of the village initiated the programme of desiltation of their tank withfinancial assistance of Rs.3,95,000 (Rs. 1,02,000 or 25 per cent includes peoples contribution) in March1990. Till 1992, about 9000 cubic metre of silt was excavated from the tank. About 6000 cubic metrewas used as manure in the catchment area and the rest for non - farm uses. The silt sold as manure earnedRs. 23,275 to the water users group. To reduce siltation in the tank, the people constructed 6 silt traps onthe inlet channels, carried out plantation on the catchment area. The income earned through the use ofusufruct rights (selling silt, use of silt for brick making, from cultivation of fish in tank bed) has earned anincome of Rs. 1,40,790 in 1992 with a recurring annual income of Rs. 49,000. The desiltation generatedadditional benefits through employment generation of about 4391 person - days and scope for increasedirrigation.
Source: Gowda, et.al, 1995: 218
Rehabilitation of the PU tanks have been carried out jointly with NGOs involved in different parts inthese states has shown significant improvement. Tank Rehabilitation Programme of Margondanahalliimplemented during 1989 is classic case where desiltation and catchment restoration of the tank hasenabled innumerable social and economic benefits and in overall development of the village (Box below)(Gowda et.al, 1995:218). Enhancing the capacity of the community to rehabilitate their tank in TamilNadu has encouraged them to take up other development - related work, such as improving the villagedrinking ponds and increased socio - cultural activities in Vellanipatty village in the Madurai District. Inrecent years the importance of comprehensive management of tank in a watershed and tank cascades over

World Commission on DamsThematic Review: Assessment of Irrigation Options in India, Draft #1, Date: 08/11/1999
This is a draft working paper of the World Commission on Dams. It was prepared for the commission as part of its informationgathering activity. The views, conclusions and recommendations are not intended to represent the views of the Commission.
68
a sub - basin has been realised (Saravanan, 1993 & 1994). At present tank rehabilitation in the cascadehas been given priority by funding agencies. The efforts of DHAN Foundation, an NGO in Tamil Nadu iseven encouraging in evolving a basin level institution. The PWD of Tamil Nadu and NGOs are involvedin carrying our research on the hydrological dimensions of the tank cascades and on the socialinstitutions.
4.3.4.5 Surangams of Kerala
In the Western Ghats of Kerala a unique system of farming is emerging, called as Surangams, a tunneldug through a laterite rock to tap the moisture and seepage water for irrigation. These Surangams,though a traditional practise have been and are still being used successfully in the comparatively dry areasof northern Malabar in Kerala. The Centre for Water Resources Development and Management inKozhikode reveals that there has been increase in Surangams in the region. Of the total 388 Surangamsexisting, only 17 per cent of them existed prior to 1950�s. Since 1980�s about 56 per cent of them wereadded (Fig.1). These Surangams in addition to providing drinking water needs to the local population inKasaragod, irrigate about 136.48 Ha of principle crops, arecanut, coconut and paddy.
4.3.4.6 The Jaldhar Model in Orissa
Some innovative programmes have been launched by NGOs in promoting options for irrigation. InOrissa, NGOs have introduced Jaldhar and Five Per Cent model in the medium uplands and lowlandregions (Gnanarethinam & Ray, 1995:19). These models are based on the principle to utilise as muchrainwater falling on a plot of land as possible. In a plot of 1200 to 1400 square.ft. a collection pit of 105cu.ft. is constructed at the lower end of the plot and the earth excavated from it is used for bunding aroundthe plot. A provision is made for excess water to flow away. The rainfall in the region is assumed to beabout 4 inches in three consecutive days. Thus it is assumed that 1200 square feet of plot get 400 cubicfeet (cu.ft.) of water. Of these, 100 cu.ft. is stored in a collection pit of 105 cu.ft. and the rest 300 cu. ft. isstored in the plot of land If one assumes, the soil depth to be of 4 feet, then the plot could hold about1600 cu.ft of water. Thus, based on this principle crops are being promoted in the region. In case of Five- Percent model, rainwater is collected in a tank with three and a half feet deep - water tank constructed infive per cent of the total land for which irrigation is required. This collected water enables life - savingirrigation for crops, recharges the soil moisture for sub - surface irrigation and enables to collect theseepage water from upstream for irrigation.
4.3.5 Other Successful Cases
From the Planning Point of view, the estimation is of importance that if just 3% of total land area is usedfor making tanks/ ponds, it can usefully store about 10% of our total rainfall, i.e. about 400 BCM of waterper year. (GOI, 1999: 504) The significance of this figure can be seen from the fact that total annualutilisation surface water potential of India is estimated at 690 BCM.
Vanvasi Sewa Ashram, a voluntary organisation in Mirzapur, has constructed some 750 small dams, eachcosting about 60,000 and irrigating about 40 acres of land. This experiment has not only changed thelifestyle of the beneficiaries for the better, but has also regenerated the vegetation of the region. (Singh,1997: 219)
In Karnataka, a water-harvesting programme in about 600,000 ha, based on low - cost techniques hasnearly doubled the cropping intensity in the area (Singh, 1997: 226). Also in Karnataka, theChikkapadasalati barrage, irrigating 10,500 Ha was constructed with voluntary contributions by farmersand local businesses in 1988-89 (Gulati, 1999: 7-2).

World Commission on DamsThematic Review: Assessment of Irrigation Options in India, Draft #1, Date: 08/11/1999
This is a draft working paper of the World Commission on Dams. It was prepared for the commission as part of its informationgathering activity. The views, conclusions and recommendations are not intended to represent the views of the Commission.
69
A number of successful watershed development efforts are documented by Hinchcliffe, et al (1999).
4.4 Technological Options
4.4.1 Treadle Pumps
One of the recent technological innovations in micro - irrigation is the TP. It provides an efficient meansto deliver water for poor farmers who cannot afford wells and pumps. The TP is a foot operatedreciprocating pump. Two pedals connect twin cylinders through piston and lever mechanism. Theoperator pedals the lever in standing position, thus utilising the entire body weight to operate the pump.The TP was first introduced in Bangladesh in the 1980s. TPs are available in 3.5� cylinder diameterbamboo type, 3.5� and 5� metallic type, and 5� concrete type. These pumps can draw water only from adepth of 15-20 feet. They are thus useful in areas where the water table is fairly high.
They are now increasingly used in Eastern India, in the states of Bihar, UP, Orissa and Assam. The TPsystem has brought lands under irrigation in households that depended on rainfall previously, and hasreplaced other traditional manual systems and even hired diesel pump irrigation in some cases. The TPirrigates only about 0.1-0.2 Ha of land, and the investment per pump is between Rs.950 and Rs. 1350(1996 figures). The operating costs of the TP are significantly lower than that of hired diesel pumps whichhave been replaced. The operating costs of bamboo pumps are higher due to higher maintenance cost andlower discharge than those of concrete and metallic pumps. Most users of TPs are small and marginalfarmers. Large farmers who use TPs prefer to use it for specific applications. The functionality rate of thedevice has been found to be 95 per cent, which indicates high user acceptability of this system. Theoutput of the TP varies from 33-56 litres per minute (lpm) for bamboo pumps, to 89 lpm for the metallicand concrete pumps. The environmental benefit of TPs is it saves 114 to 132 litres of diesel in 100 hours.With about 80,000 installations of TPs in India, the diesel savings amounted to approx. 10.5 million litres.As the discharge of the TP is limited, the TP is used to irrigate crops with low but regular waterrequirements, such as vegetables. The rapid returns gained from vegetable crops have meant relativelyquick prosperity for the farmers using TPs (Srinivas, et al, 1996).
Designed by a Norwegian engineer, the pump was first introduced in Bangladesh in early eighties. Thepump useful for poor farmers costs $ 35 and typically irrigates half an acre. Farmers have purchased morethan 1.2 million TPs in Bangladesh alone. The pumps contributed to the groundwater revolution thatfuelled the 136% rise in Bangladesh�s irrigated area between 1975 and 1995. International DevelopmentEnterprise (IDE) is behind this success in Bangladesh and also in India, with its well - managed marketingstrategy, which called the pump Krishak Bandu (farmers� friend). IDE believes that total market for TPsmay number 10 million, including 6 million in India and 3 million in Bangladesh (Postel, 1999: 205-9).
4.4.2 Drip Irrigation
The use of drip irrigation in India started in 1970 with experiments in Tamil Nadu University inCoimbtore. The use went upto 55,000 Ha in 1992 and 225,000 Ha by 1998. The Indian Committee onIrrigation and Drainage estimates a potential for drip irrigation in India of 10.5 M Ha. To stimulate itswider adoption, the Govt. of India has provided subsidies for drip irrigation in sixth, seventh and eightfive year plans (World Bank, 1998: 116-118). Experiments have shown that use of drip irrigation can leadto cut in water use by 30-70% and to increase crop yields by 20-90% (Postel, 1999: 174). Annex 8 givesthe water productivity gains from drip irrigation in case of a number of crops in India.

World Commission on DamsThematic Review: Assessment of Irrigation Options in India, Draft #1, Date: 08/11/1999
This is a draft working paper of the World Commission on Dams. It was prepared for the commission as part of its informationgathering activity. The views, conclusions and recommendations are not intended to represent the views of the Commission.
70
More affordable designs of drip systems, designed and marketed by IDE is another reason for recentspread in drip irrigated area. Otherwise costing $2,500 per ha, IDE designs are available at $ 50 per halfacre, or about $ 250 per ha. The system is under use for mulberry cultivation in AP and also in HimachalPradesh (Postel, 1999: 178).
Drip irrigation is about two and half times more expensive than canal irrigation on per Ha basis andrequires 50% more electricity. Its wide-scale appropriateness in India when the country is cash and energystrapped is also questionable (Singh, 1997: 94).
4.4.3 Some Other Innovations
Recent years have seen technological innovations for promoting techniques that are appropriate to thelocation and the physical specifics of any place. Scientists from the Central Soil and Water ConservationResearch and Training Institute have demonstrated the viability of small dams involving participatoryapproach for WRD. Though their experiences started from Sukhomajri in Haryana, they continue to buildon with diverse regions. From their experience in Relmajra watershed in Ropar district of Punjab, theyhave demonstrated the feasibility of rainwater harvesting, storage and distribution in small scale andimproving the productivity of catchment as well as command area (Sikka, et.al, 1996:81).
The Centre for Applied Systems Analysis in Development, Bombay has introduced techniques that useslocally available materials and costs less. These include the use of timber or bamboo gabions for bundconstruction. These have proven useful for a height of 2m and an overflow depth of 1.5 m. Similarlybamboo reinforcement grids can be used in earthen retaining walls, which increases the longevity of thewall. Natural fibres such as jute, sisal and coir, along with natural minerals, have been used to line pondsand irrigation channels. Concrete and PVC pipes have in places been replaced by pipes made of thin filmsstrengthened by jackets of natural fibres. There is however a constraint of size on these pipes, as thediameter cannot be larger than 600mm, and these pipes are able to service a field of only 0.1 ha.
4.5 Scope for Greater Benefits from Existing Reservoirs
The latest review of India�s irrigation sector (the World Bank, 1998: 1) begins with this observation, �Theanalysis of this report has found there is need for a major shift in India�s irrigation strategy. There is aneed for shift from the past near exclusive reliance on irrigation expansion to a strategy emphasisingimproving the performance of irrigation and irrigated agriculture�. The World Bank�s 1991 irrigationsector review (1991a: 12) is more emphatic: �Since the productivity of irrigation is a more importantdeterminant of agricultural growth than its rate of expansion, actions should concentrate on productivityof existing infrastructure�.
The review goes on to claim scope for significant improvement in a number of states in area irrigated,reduction in waterlogged/ flooded area, increase in yields and general improvement in water availability.Rajasthan, Haryana, Orissa, AP, Gujarat, West Bengal, Karnataka and UP are some of the states wheresuch scope for improvements has been claimed. The point is to note that there is significant scope ofimproving performance of existing schemes (World Bank, 1998: 12-14).
The earlier review of Indian irrigation scene by the World Bank (1991b: 56-8) was more candid.⇒ Expansion of net irrigated area at the past growth rates would have less growth impact than increasesin productivity of existing irrigation. At the time of that review, the rate of expansion of net irrigated areawas thought to be 0.76 M Ha per annum, constituted of expansion at 0.22 M Ha in M & M projects and0.58 M Ha in Groundwater irrigation. The growth rate in the period thereafter has been 0.92 M Ha perannum for expansion of net irrigated area. However, the rate of expansion of irrigation due to M & M

World Commission on DamsThematic Review: Assessment of Irrigation Options in India, Draft #1, Date: 08/11/1999
This is a draft working paper of the World Commission on Dams. It was prepared for the commission as part of its informationgathering activity. The views, conclusions and recommendations are not intended to represent the views of the Commission.
71
canals has dropped since then to 0.13 M Ha per annum. The higher expansion of the net irrigated area hasbeen possible only due to higher rate of expansion of the groundwater-based irrigation at 0.72 M Ha perannum (See Annex 3E).⇒ For surface commands, improved water management will be particularly important.⇒ Improved performance of rainfed agriculture will be a factor in future agricultural growth and isparticularly important from a welfare perspective as the bulk of the Indian net farmed area is and willremain under rainfed conditions.
4.5.1 Future Prospects for New Surface Irrigation Investments
Investments in storage reservoirs can be expected to have higher development costs and marginal rates ofreturn. Further, the social and environmental problems associated with large surface schemes are going tomake their feasibility difficult. (World Bank, 1991a: 7) In fact the World Bank (1991a: 13) goes on tonote that generally, �there is no justification in the medium term for new surface irrigation investments�.
4.5.2 Better Management of Catchments
The created reservoir storage capacities, both live and dead, are filling up with silt much more rapidlythan envisaged, as can be seen from Annex table 11. The solution to this problem is also well known:better management of catchment areas of these reservoirs. Unfortunately, there is move in the direction bythe government. As we noted earlier, even in case projects now under construction or planned, catchmentarea treatment is not part of the projects and the project authorities are refusing to pay for the treatment ofcatchments, so vital for the health and longevity of the reservoirs being created. Better management ofcatchment can have many other advantages too. The soil and water conservation measures there wouldhelp the local people and ecology. The flow regime in the river would improve and groundwater rechargewould also improve.
4.5.3 Optimum operation issues
An important issue around the operation of the existing reservoirs is about the operating rules of thereservoirs. Drawdown agriculture is practised in case of all reservoirs and the area and effectiveness ofthis is dependent on the operating rules of the reservoirs. In deciding the optimum operation rules of anyreservoirs, this factor should also be taken into account, which rarely is done. A substantial area that isunder reservoir water can thus become useful. The longevity of reservoir storage from the point of viewof siltation would also be a point to be considered in this respect.
A centrally sponsored CAD program was launched in 1974-75 with the main objective of improvingutilisation of irrigation potential and optimising agricultural productivity and production from irrigatedareas by integrating all functions related with irrigation agriculture. Beginning with 64 M & M projects in1974, the program included 204 projects at the end of 1995-96 with a total CCA of 21.25 M Ha.
An analysis of time series data on productivity in respect of selected projects under the CAD programindicated that staple crops like paddy and wheat have registered an increase in productivity by 50 % (inPench, Maharashtra) and 85% (Gurgaon, Haryana) respectively (Gulati, 1999: 2-7).
Thus, while the advantages of CADP are evident, the performance of the programme 25 years after it waslaunched is hardly notable. In fact, a number of scholars (Vaidyanathan, 1999) have questioned the pointin continuing the programme in present form. The main problem is utter lack of participation or control ofthe local people in the programme. While PIM programmes now being launched are supposed to addressthis lacuna, PIM in practice now does not inspire great confidence.

World Commission on DamsThematic Review: Assessment of Irrigation Options in India, Draft #1, Date: 08/11/1999
This is a draft working paper of the World Commission on Dams. It was prepared for the commission as part of its informationgathering activity. The views, conclusions and recommendations are not intended to represent the views of the Commission.
72
4.5.3.1 Participatory Irrigation Management
Deficient water management is a widespread problem on some 10-13 M Ha of irrigated land, about 50%of India�s net surface irrigated area, that are performing below potential. Very large gains are possible inall irrigated lands through better water management. The nature and extent of the problems vary. Whereirrigated water is not getting to farmers, production is restricted to rainfed conditions. Where land isgetting too much water, waterlogging and salinisation is affecting the lands. The most pervasive situationis where farmers are getting water but in unreliable or poorly timed amounts (World Bank, 1991a: 31).
While large scale systems managed by government agencies have been the predominant form of irrigationdevelopment since the 1950s, the performance of many such systems in terms of efficiency, equity, costrecovery, sustainability, participation and accountability has been poor (Gulati, 1999: 6-2).
Farmer participation measures have a range of potential benefits, including improvements in the physicalinfrastructure, water supply delivery, control over water, farm productivity and income, conflictresolution and empowerment of the farmers, reduction in govt. expenditure in irrigation, increasinggovernment fee collection (Gulati, 1999: 4-24, 6-1).
4.5.3.1.1 Command Area Development Programme
The Irrigation Commission of 1972 that went into the problems faced by M & M irrigation projects atsome length, argued that utilisation is impeded by deficiencies in the design and implementation ofprojects, including completion of reservoirs ahead of canal networks, lack of field channels to carry waterfrom the government outlets to the individual farms, etc. Based on this diagnosis and commissionsuggestion, a CADP was started in 1974-75 to achieve speedier utilisation of irrigation potential andensure proper use of water. Upto the end of Eighth Plan (1996-97), Rs. 54.2 billion were spent on at1996-97 prices (GOI, 1999: 478). The achievements of CADP are consistently below targets. The EighthPlan noted that the progress in terms of land improvements and improvement of drainage facilities hasbeen meagre, and so has the effort and research in evolving and propagating cropping patterns foroptimum use of water. There are few evaluations of the impact of CAD on the extent of utilisation andadoption of desired cropping patterns.
The CADP identified farmer involvement in system management as part of the program when it wasstarted in 1974. By 1991, there were 54 CADAs covering 131 command areas representing a totalcommand area of 18.5 M ha. In practice, many have not succeeded. Unless fundamental changes aremade, for most CADAs, there is no strong case for retaining them (World Bank, 1991a: 50). Nosignificant efforts were made in the direction of PIM. All the five - year plans since the sixth five yearplan, various committees made recommendations for PIM, but progress was achieved only around 1996when the Ninth Five year Plan formulation started. For the first time in India history, the PlanningCommission set up a separate working group on PIM to review and suggest the strategies for the NinthPlan (Gulati, 1999: 6-4).
Thus, the rationale for special CAD clearly needs review. The measures being taken up under CADshould be part of the project right from the planning stage, which has not happened even subsequent toCADP (Vaidyanathan, 1999: 93-94).
The Planning Commission working group made detailed recommendations to promote PIM. It projectedan expenditure of Rs. 7800 per ha, totalling to Rs. 7460 million in the ninth plan, out of which the central

World Commission on DamsThematic Review: Assessment of Irrigation Options in India, Draft #1, Date: 08/11/1999
This is a draft working paper of the World Commission on Dams. It was prepared for the commission as part of its informationgathering activity. The views, conclusions and recommendations are not intended to represent the views of the Commission.
73
government�s contribution is to be Rs. 5461 million and of the state Rs, 1490 million, the rest to comefrom the Water User Associations (WUAs) (Gulati, 1999: 6-6).
In AP, the government had formed some 10,792 WUAs and 172 distributary committees by Nov. 1997through innovative legislation. The two acts that AP enacted for this were: �AP Water ResourcesDevelopment Corp. Act 1997� and The AP Farmers Management of Irrigation Systems Act, 1997�. Thefirst one paved the way for formation of the AP Water Resources Development Corp, which was tohandle all aspects of water resources under its umbrella. However, the corp. does not include managementof groundwater, has not specified water rights regime and has no measures for transparency,accountability or efficiency. A major problem with the second act is that the farmers had no role indecision making about the rules of the associations. The associations also have little say in macro leveldecisions. They have had no say in the decisions about the systems, which now they are asked to manage.Others (Jairath 1999: 2836) have reported that only supply side solutions are being implemented in APwith little assurance of sustainability of whatever improvement is being achieved in system functioning.Some other states like Gujarat, Tamil Nadu and Haryana have also made some, but slower progress.There are some types of PIM programs in all 14 states (Gulati, 1999: 6-5 to 6-10).
In Tamil Nadu the Agricultural Engineering Department has reported 3300 outlet WUAs and 118distributary canal WUAs largely financed by CADA program. Funds from CADA and external agencieslike the World Bank and USAID has been driving force behind pushing PIM (Gulati, 1999: 6-11 to 6-12).
However, many researchers have doubted if there is room for optimism regarding success of PIM inachieving equity, efficiency and sustainability of irrigation systems. The optimism that stems from theplethora of meetings, reports, expert groups and WUAs is not sufficient condition for success of PIM. Theoptimistic picture stems, in part, from a selection bias in the empirical studies on farmer participation.(Gulati 1999: 7-3) But the examples form a very miniscule part of the total irrigation system. Also, whilea lot gets written about some successful cases like Mohini distributary in Ukai command in south Gujarat,nobody writes about the hundreds of failures there and elsewhere. Even in case of Mohini, seriousproblems have been reported with 85% of the command taking up water intensive crop like sugarcane,while 15% was the maximum stipulated. While hundreds of visitors from all over created an image ofsuccessful example, the irrigation department also provided more support to this case then it did for all theother cases around. There have been few studies to look at all the costs and benefits with respect tosuccessful cases of PIM. (Gulati 1999: 7-1 to 7-5) Most attempts at PIM continue to be limited in thedegree of farmer management, and are more paternalistic than partnership oriented (World Bank, 1998:6).
Vaidyanathan (1999: 101) notes that in the M & M projects, the available supplies can serve only afraction of the command area. A substantial part of the investment in distribution network is infructuousand wasteful. Corruption in the award and execution of construction contracts add to the costs. The userscannot in fairness be expected to pay for these costs.
About the effectiveness of National Water Management Project the Planning Commission has this to say:
�The area covered by these initiatives is very small, less than 1% of the area irrigated at present. . . For themost part the outlet and canal committees are there only in name; their functions are vague; they seldom meet;they are not consulted on substantive issues; nor are department officers required to follow their advice. There isalso considerable reluctance, if not opposition, from the operational staff of irrigation departments to involvingusers in management. . .� (Vaidyanathan, 1999: 136-7).
It has been suggested that the following conditions are likely to help success of PIM:

World Commission on DamsThematic Review: Assessment of Irrigation Options in India, Draft #1, Date: 08/11/1999
This is a draft working paper of the World Commission on Dams. It was prepared for the commission as part of its informationgathering activity. The views, conclusions and recommendations are not intended to represent the views of the Commission.
74
• Areas with moderate water scarcity have higher chances of success. At times of high scarcity, evenwell coordinated institutions can fail. At times of plenty, there is little incentive for organisation.• Smaller groups are more likely to succeed than larger ones. Particularly in India, where smaller landholdings dominate the number of landholders.• Where farmers irrigating from a common irrigation unit have a common social background, it iseasier to develop patterns of co-operation for irrigation (Gulati, 1999: 7-6 to 7-12).
4.5.3.1.2 Some Examples
Perhaps the most dramatic example of PIM in India was in the Paliganj distributory of the Sone commandarea of Bihar where, through the Water and Land Management Institute�s efforts, a WUA was formedwith a two tier structure (outlet and distributary levels) covering over 4800 ha. It does maintenance ofcanal structures, and farmers report that after WUA formation, water conflicts have been reduced andirrigated area has increased. Other notable examples from south Asia include Chhatis Mauja, a 7500 Hasystem in Nepal, Gal Oya in Sri Lanka, among others (Gulati, 1999: 7-2). See Annex table 18 for resultsat Paliganj distributary after irrigation management transfer.
In Kerala, the Kerala State CAD Act of 1986 encouraged user participation. About 2000 farmerassociations in 10 completed irrigation project were established, but only 30 % of them are functional(Gulati, 1999: 7-5).
In Sriramsagar Project in Karimnagar district of AP, reported irrigated area jumped from 38,000 Ha in1996 to 89,000 Ha in 1997 after the Irrigation Management Transfer effected in June 1997, even as watersupplied decreased by about 35%. It is likely that a significant contribution in this increase comes fromgreater willingness on the part of farmers to report actually irrigated area. Other factors like systemsimprovement could also be playing their role (World Bank, 1998: 81).
Similarly, two pilot PIM projects covering an area of 16,000 Ha were launched in AP under WB fundedAP Irrigation III project. It is claimed that the projects could irrigate 25% more land consequently (WorldBank, 1998b: 26).
4.5.4 Water Use Efficiency
The World Bank (1991a: 37-8) notes,
�Concern about ensuring adequate benefit/ cost ratio, exacerbated by political concerns to maximise plannedirrigated areas, adds pressures to overextend proposed command areas and use unrealistic design assumptions.Irrigation efficiency in India has often been assumed at 60%� Most irrigation commands in India probablyhave an irrigation efficiency of 20-35%. If assumed efficiency is 60% and actual efficiency is 30%, actual wateravailability will be half the assumption at design. Another common deficiency is that potential irrigable area isoften based on a standard 75% probability level for water availability. This has no necessary relationship withwhat is optimal for the command and often results in overestimation of potentially irrigable area�.
Dhawan reports following losses of canal irrigation in Punjab and Haryana: Main and Brach canals: 17%,Distributaries: 8%, Water courses (field channels) 20%, Field Seepage 17%, Total 62% (Dhawan, 1993:242).
GOI estimates WUE in canal command areas to be only 38-40 % at present (GOI, 1999 Vol. II: 482).According to GOI, (1999 Vol. II: 483; World Bank, 1998: 12), on a rough basis, it is expected that with a10% increase in the present level of WUE, an additional 14 M Ha area can be brought under irrigationfrom the existing irrigation capacities. This can be achieved at a very moderate investment compared to

World Commission on DamsThematic Review: Assessment of Irrigation Options in India, Draft #1, Date: 08/11/1999
This is a draft working paper of the World Commission on Dams. It was prepared for the commission as part of its informationgathering activity. The views, conclusions and recommendations are not intended to represent the views of the Commission.
75
the investment that would be required for creating equivalent potential by way of new schemes. India�sNinth five year plan goes on to add, �Thus, there is a need to improve the WUE in most of the existingirrigation projects through modernisation, renovation and upgradation to realise optimum benefits on theone hand and mitigate the consequential side effects like water logging etc. on the other�. Increase inWUE is the first point in Govt. of India�s irrigation strategy for the Ninth Plan (GOI, 1999: 476).
A related National Water Management Project was taken up during the period 1987-95 in 11 states,covering 114 irrigation projects with a command area of about 3.348 M Ha at a cost of Rs. 5878.1 M atcurrent prices. Though the project achieved only 15% of its target, in the 9 schemes implemented underthe project, increase in farm income was found to have gone up by between 8% and 89% directly due tothe project.
A concurrent 25% improvement in both crop yields and WUE (WUE from 35% to 43%) could yield anadditional foodgrains output of 88 MT. This could represent some 44% of current foodgrains productionin India. The key point is that productivity enhancement could have significant impact (World Bank,1998: 12).
4.5.5 Renovation and Modernisation
GOI estimates (GOI, 1999 Vol. II: 484) that about 21 M Ha of irrigated area from M & M projects frompre - Independence period and those completed 25 years ago, require renovation/ upgradation/ restoration.Great extents of the areas have gone out of irrigation, either partly or fully, due to deterioration in theperformance of the systems. It is hoped that the water resources consolidation projects underway inHaryana, Tamil Nadu and Orissa and also the WB funded irrigation - drainage projects in AP and Punjabwould lead to a substantial improvement in this regard.
Normally, if the existing systems are running much below their potential, simple rules of economics tellus that the most cost - effective method is usually to improve upon the existing ones rather than createnew ones. According to the World Bank, it is possible to increase the irrigated area in Haryana by155,000 Ha in Bhakhra and Western Yamuna Canal Commands by reducing seepage losses andincreasing the safe carrying capacity of the canals (World Bank. 1994: 23).
The Haryana Water Resource Consolidation Project funded by the World Bank undertook a programmein 1995 to desilt, improve and restore the canals, rehabilitate ineffective structures and repair of damagedcanal linings. The efficiency improvements were significant. With the same amount of water supplied asin previous years, an additional 600,000 acres were brought under irrigation during 1996-97 kharif andrabi seasons combined (World Bank, 1998: 75).
The estimated ERR of the Irrigation Rehabilitation and Maintenance project in AP under the WorldFunded AP Economic Restructuring project comes to 38% (World Bank, 1998b: 19). This is an indicationof kind of returns possible from rehabilitation and maintenance of existing irrigation systems.
In Tamil Nadu, the WB funded Tamil Nadu Water Resources Consolidation Project aims to achievesubstantial benefits by system improvement measures. Thus, about 107,000 Ha of land would changefrom partial to full irrigation and an additional 34,000 Ha presently not receiving any water, wouldreceive irrigation (World Bank, 1995: 35).

World Commission on DamsThematic Review: Assessment of Irrigation Options in India, Draft #1, Date: 08/11/1999
This is a draft working paper of the World Commission on Dams. It was prepared for the commission as part of its informationgathering activity. The views, conclusions and recommendations are not intended to represent the views of the Commission.
76
4.5.6 Cropping patterns
Vast areas of Punjab and substantial areas of Haryana are under Paddy Wheat combination of crop, whichconsumes 2.25 m of water as per Punjab Agriculture University (PAU). As against such high waterdemanding combination, groundnut wheat combination would require 0.7 m, maize wheat combinationwould require 0.85 m and cotton wheat would require 0.9 m of water, which are all crops recommendedby PAU. However, unless these alternative crop sequences are made as profitable as the paddy wheatsequence, farmers would not take them. In fact, Maize was main kharif crop of Punjab prior to the rise inpaddy cultivation. However, since Maize was not supported by price cum procurement scheme, whichwas allowed for paddy and wheat, the paddy wheat combination has thrived in Punjab (Dhawan, 1993:247-8).
Sugar growers in Maharashtra occupy 10% of cropped area and use 50% of irrigation water (World Bank,1991a: 16). Data from Maharashtra suggest that sugarcane, which requires eight times as much irrigationwater as seasonal crops like jowar and bajra, and six times that of other seasonal crops, is estimated togenerate among the lowest net farm business incomes, per unit of water consumed. It has been argued thatif any of the many seasonal crop combinations/ rotations are adopted in place of sugarcane, not only willthe net total income from the given quantum of water be higher; it will cover a wider net irrigated area aswell (Vaidyanathan, 1999: 89-90). See Annex table 12 for figures supporting this case.
Sugarcane cultivation in India occupied 3.8 M Ha in 1995-96, much of it in UP and Maharashtra. To meetthe sugar mills� expansion plan for 2000, area under cane will have to be raised to 4.3 M Ha. Sugarproduction has multiplied five times in last 30 years, from 3.232 MT in 1964-65 to 14.75 MT in 1994-95.Per capita sugar consumption has gone up from 4.8 kg in 1960-61 to 12.4 kg in 1993-94 (Singh, 1997:70).
The amount of water needed to cultivate one rice crop is enough to water five crops of cotton or maize,ten crops of kharif pulses or fodder, eight crops of arhar, fruit crops for two years. Punjab is keen to bringmore area under sugarcane, another groundwater depleter, and has applied for setting up at least 50 newsugar mills. Considering that the evapo transpiration requirement of sugarcane alone is 180 cms comparedto 123 cms for wheat rice rotations, Punjab�s agriculture is heading towards greater problems (Singh,1997: 84).
In the neighbouring Haryana, the water table is falling at equally alarming rate in 40 blocks. In 35 blocks,it is stable, but the water quality is bad and in the remaining blocks water table is rising. More than 1.78M Ha is affected by water logging. Nearly 65% of Haryana faces the problem of saline groundwater(Singh, 1997: 84).
4.5.7 Equity
Equity is necessary in canal commands between the head enders and tail enders. This can be achieved bymore efficient working of the canal commands. Equity is also necessary between those in the irrigatedcommands and those who are out of it. This can be achieved by making the irrigators pay for theirrigation directly. For maximising benefits across generations, it is necessary to ensure sustainability ofcanal commands. One of the ways is to ensure economy of water use and proper functioning of canal anddrainage infrastructure so as to avoid water logging and salinisation.
To increase the efficient and equitable use of irrigation facilities, it is important to note that croppingintensities are greater in smaller farms than in larger farms (World Bank, 1991b: 5). Thus, implementationof land ceiling laws and land redistribution would also help more efficient use of irrigation facilities.

World Commission on DamsThematic Review: Assessment of Irrigation Options in India, Draft #1, Date: 08/11/1999
This is a draft working paper of the World Commission on Dams. It was prepared for the commission as part of its informationgathering activity. The views, conclusions and recommendations are not intended to represent the views of the Commission.
77
4.5.8 Scope for Improving Crop Yields
The productivity of Indian agriculture is below, in some cases half, the levels attained in other Asiancountries and elsewhere. For example, irrigated paddy yields average 2.5 t/Ha in India, compared to 5.5t/Ha in China and 4.1 t/Ha in Indonesia. While conditions are not always comparable, these figuresindicate major scope for improvement. This is confirmed by the large gap noted between research yieldsand farmer yields (World Bank, 1991a: 31; World Bank, 1998: 12-13).
It is feasible to attain an output growth per Ha from existing irrigation lands of 1.5% per annum. Thenational average for irrigated foodgrains in 1984-85 was just under 2 t/ha, though some states hadachieved about 2.5 t/Ha and areas in Punjab had 3 t/Ha yields. Similarly, it is possible to increase thenational cropping intensity figures at the rate of 1 % per annum (World Bank, 1991b: 55).
4.5.9 Drainage Improvements
As vast areas irrigated by M & M projects and elsewhere suffer water logging and salinisation andsubstantial areas have also gone out of production, there is large scope in increasing agriculturalproduction through drainage improvements. In the eastern Gangetic plain, as per the World Bank (1991a:8, 11), investment in surface drainage is likely to have larger productive impact, and lower cost, thaninvestment in surface irrigation. Such investments are economically viable in 5-10 M Ha. Additionally,parts of northwest India and UP (250,000 � 500,000 ha) are affected by a build up of saline groundwater,in extreme conditions land has gone out of production. In these areas, more expensive groundwaterdrainage is required if agriculture is to remain sustainable.
Drainage improvements, thus, can bring about increase in productivity, bring more areas undercultivation, effect water conservation and make the irrigation more sustainable. However, till date, there ispractically no attention or investment in this direction.
4.5.10 Completion of Canal Networks
As per the World Bank (1991a: 12), On most commands, the development of micronetworks is animportant call on investment, in essence to complete utilisation and magnify returns at the local levels. Nofigure is available about how much additional area can be brought under cultivation this way, but it couldbe in millions of Ha as the gap between the potential created and utilisation in case of M & M irrigationprojects shows.
4.6 Groundwater Options
4.6.1 Development till Date
The contribution of ground water to irrigated agriculture, with about 17 million energised wellsnationwide, is now as high as around 50 %. With its higher agricultural productivity, the ground waterirrigation contributes significantly to the country�s total agricultural output. In addition, ground water isthe primary source of water availability in drought years. Nearly 80% of rural water supply and over 50%of urban water supply is met from groundwater sources (GOI, 1999: 505-6).
During the period 1951-97, the number of dug wells have increased from 3.86 million to 11.28 million,that of shallow tubewells from a mere 3000 to 6.52 million and public tubewells from 2,400 to 168,000.

World Commission on DamsThematic Review: Assessment of Irrigation Options in India, Draft #1, Date: 08/11/1999
This is a draft working paper of the World Commission on Dams. It was prepared for the commission as part of its informationgathering activity. The views, conclusions and recommendations are not intended to represent the views of the Commission.
78
Number of electric pumpsets increased from 21000 to 11.36 million and diesel pumpsets increased from66,000 to 4.99 million (GOI, 1999: 506).
Out of 7063 Blocks/ Mandals/ Talukas/ Watersheds in the country, 283 have been categorised as overexploited or red blocks (where the stage of exploitation exceeds the annual replenishable limit) and 145are dark where the stage of development is more than 85%. At this rate it is feared that by 2020 AD,about a third of the blocks may turn red or dark (GOI, 1999: 506-7). However, these are Central GroundWater Board (CGWB) figures, which, as we shall see below, are underestimating the ground wateroverexploitation.
According to some estimates, 70-80 % of the value of irrigated production in India may depend ongroundwater irrigation (Dains and Pawar, 1987, Economic Returns to Irrigation in India, USAID, NewDelhi, quoted in World Bank, 1998c: 2).
4.6.2 Future Potential
Current proposals of CGWB envision that by 2007, full irrigation potential from groundwater would havebeen developed. Investment of Rs. 347 billion is proposed by the government either directly or throughNational Bank for Agriculture and Rural Development. Energising the proposed new pumps is estimatedto require 33.5 billion KWHrs of electricity and 3.5 billion litres of diesel (World Bank, 1998c: 9).
As per the re - assessment recently made by the Ministry of Water Resources, the total annual utilisableground water resource of the country is tentatively placed at 431.9 BCM. Besides the provision of 70.9BCM (16.4%) for domestic, industrial and other use, the groundwater resource available for irrigationcomes to 360.8 BCM, of which the utilisable quantity is 324.7 BCM (90%). With this, the totalgroundwater irrigation potential is estimated 64.05 M Ha. With about 70% of potential having beenrealised by the end of Eighth Plan, 30% remains to be realised (GOI, 1999: 506). Here it should be notedthat the estimation of irrigation potential from groundwater till 1989 was 40 M ha, which was raised in1989 to 80.38 M Ha and brought down to 64.05 M Ha in 1995. Improved database in said to be the reasonfor this refinement. A number of reservations have been expressed about these figures (Shah, et al, 1998:64).
The CGWB has assessed that there is a feasibility of installing 9.1 million groundwater structuresincluding 6.4 million dug wells, 2.6 million shallow tubewells and 0.1 million deep tubewells in theEastern region of the country. With these, irrigation potential of about 20 M Ha can be put together, out ofwhich about 14 M Ha is from shallow and deep tubewells (GOI, 1999: 506).
The largest scope for remaining groundwater potential is in the eastern and central India. The World Bank(1991a: 8) however, qualifies this by saying that the development needs to be confined to areas whereexploitation would not adversely affect dry - season Ganga River flows. (While this is laudable objective,it sounds troublesome for these regions as since these regions have till now lagged behind in utilisation oftheir groundwater potential, now they are asked to give it.)
4.6.3 An Alternative Estimation
However, there are serious criticisms of the Groundwater estimation and development methodologies.The estimation is done by Groundwater Estimation Committee based on water balance methodology. Oneimportant conceptual weakness of the methodology is that it treats development units as independentunits and ignores dynamic interactions between units. The methodology also ignores the water used bynatural wild vegetation in the development unit. There is also a definite problem that surface water and

World Commission on DamsThematic Review: Assessment of Irrigation Options in India, Draft #1, Date: 08/11/1999
This is a draft working paper of the World Commission on Dams. It was prepared for the commission as part of its informationgathering activity. The views, conclusions and recommendations are not intended to represent the views of the Commission.
79
groundwater availability are not assessed conjunctively, and this results in double accounting and overestimation of the total water resource. The methodology uses assumptions rather than information forseasonal variation in levels. Implicit objective of full development is another fundamental flaw. Thisassumption again neglects the dynamics of groundwater between development units (generally blocks)and completely ignores their interaction with environmental and socio - economic systems. Base flowdepletion, saline water intrusion and declines in groundwater level may all reach unacceptable levelsmuch before full development is reached. Moreover, the amount of water required may be less than theamount of water available in many of the blocks. The estimated level of groundwater developmentderived from these estimates could err by upto 30-40% (World Bank, 1995c: 2-3; World Bank, 1998c: 38-9).
The CGWB estimations are plagued by a number of other problems, some of which include the following.⇒ CGWB uses constant state - wide figures for depth of irrigation, irrespective of different crops anddifferent situations.⇒ CGWB assumes that 30% of the gross draft is presumed to go as return seepage to the groundwaterregime in all districts of the country. Such an assumption makes no sense in negative water balance areasof the country, which constitute virtually 80% of the country (Shah, 1998: 66-8).
In first ever independent estimation of its kind (Shah, et al, 1998: 66) in which district wise croppingpatterns, the irrigation depths for each district for each crop were used to arrive at estimates ofgroundwater irrigated areas in each district and then arrive at the volume of groundwater used in eachdistrict. In most districts in India, the alternative methodology yields figures for groundwater irrigationdevelopment, which are much higher than those of the CGWB methodology. As per alternativemethodology:⇒ As many as 50 districts are already in over exploited category.⇒ Another 53 districts are fast approaching this level as they have exploited over 65% of availablegroundwater.⇒ On the whole, 35% of districts (296) for which data are available, fall in the range where furthergroundwater development must be very cautiously undertaken.⇒ UP has 12 over exploited districts, Punjab 10, Haryana and Rajasthan have 9 each.⇒ Punjab (83%) and Haryana (75%) have the highest proportion of over exploited districts. The heart ofGR is faced with a serious crisis of groundwater exploitation (Shah, et al, 1998: 69-71).⇒ Among the hard rock districts (70) depending on groundwater for more than 50% of their irrigatedarea, where groundwater recharge rates are lower and recharge takes difficult paths, 18 have crosseddanger mark of 85% exploitation and 13 are fast approaching it.⇒ Tubewells form 18% of groundwater irrigation in hard rock districts (138). Between 1977-9 and1988-90, the tubewell - irrigated area in hard rock districts has grown by four times from 0.33 M Ha to1.37 M Ha, i.e. by 316%, at an explosive rate of 14% per annum (Shah, et al, 1998: 74-76). Subsequentfigures show that the trend of tubewell dependence in hard rock districts continue to rise alarmingly.
4.6.4 Equity and poverty alleviation
Groundwater use supports employment generation and thus poverty alleviation. In India, while 76% ofthe operational landholdings are small and marginal farms of less than 2 ha, they operate only 29% of thearea. They constitute 38% of net area irrigated by well and account for 35% of the tubewells fitted withelectric pumpsets (World Bank, 1998c: 4). Thus in relation to operational area, small and marginalfarmers are well represented in groundwater irrigation in greater proportion than their representation inlandholdings.

World Commission on DamsThematic Review: Assessment of Irrigation Options in India, Draft #1, Date: 08/11/1999
This is a draft working paper of the World Commission on Dams. It was prepared for the commission as part of its informationgathering activity. The views, conclusions and recommendations are not intended to represent the views of the Commission.
80
Groundwater development also promotes direct and indirect employment of skilled and unskilled persons.According to the Working Group on Minor Irrigation for Formulation of the Ninth Plan (1997-2002),about 32% of the cost of construction in minor irrigation consist of unskilled labour and 12% of skilledlabour. The working group estimates that if the target of 12 M Ha of minor irrigation to be created in theNinth plan is realised, it would mean direct employment in construction phase itself of about 2.1 billionperson - days.
4.6.5 Issues Around Future Options
4.6.5.1 Sustainability
With rapid expansion in groundwater extraction, development related problems have begun to emerge.The number of critical and overexploited blocks have gone up from 253 in 1984-85 to 383 in 1992-93,which represents 5.5% growth rate in increase of problem blocks. Thus, though the number of criticalblocks represent small part of the total number of 4248 blocks in the country, the rate of increase ispossibly showing the signs of things to come. However, in Bihar and UP, the no. of critical blocks havegone down in the period mentioned above (World Bank, 1998c: 10-11). Alternative assessment showsmuch more grave groundwater crisis than what is represented in these figures.
Substantial declines in level of water and fluctuations in water table can occur long before extractionexceeds recharge. Also, impact of agricultural pumping on urban and rural drinking water availability hasbeen documented at a no. of location specific cases. The problem in arid and hard rock zones isparticularly serious. Estimates made for the study on rural water supply and sanitation in India suggestthat in 1995 perhaps 37 million people lived in areas classified as dark and that this number has increasedby 2.6 million each year since 1991. Drying up of drinking sources can also occur in areas where limits ofextraction have not been reached as water tables can fluctuate and go down (World Bank, 1998c: 11).
No. of areas where agricultural groundwater use is in conflict with competing uses are increasing. InGujarat, in addition to Ahmedabad, aquifers developed to supply 200 km long rural water supply schemesconstructed by the Indo Dutch project is in danger due to groundwater exploitation for agricultural uses.Tensions between farmers and Jodhpur municipal authorities over the Rampura - Mathan aquifer havebeen present for more than a decade. Chennai has to invest in a USD 400 million project for water supplyeven though the Arani - Korteliyar aquifer near Chennai has a comparable sustainable use capacity(World Bank, 1998c: 12).
There were 5.42 lakh wells in Maharashtra in 1960-61. This number increased to 8.16 lakh in 1980.Though the number of wells have increased by about 51 %, area irrigated by them has nearly doubledduring the same period as wells were now fitted with mechanical devices like diesel engines and electricmotors (Shiva, 1989: 197).
Over exploitation of groundwater creates scarcity conditions. As the then Chief Minister of Maharashtrastated at a National Development Council meeting, in the Sixth Plan 17,112 villages were facing drinkingwater problems; of these, 15,302 villages were to be covered during the Sixth Plan that should leave 1810villages with drinking water problems at the end of Sixth Plan. In stead, the number increased tostaggering 23,000 villages (Shiva, 1989: 200).
In Punjab, excessive pumping of groundwater during the kharif rice - growing season has already forcedfarmers to go still deeper in search of water. Already the water table has gone below the critical level of30 ft for shallow tubewells in 90 blocks of the state. Of the remaining 26 blocks, the groundwater is salinein at least 18 blocks (Singh, 1997: 83).

World Commission on DamsThematic Review: Assessment of Irrigation Options in India, Draft #1, Date: 08/11/1999
This is a draft working paper of the World Commission on Dams. It was prepared for the commission as part of its informationgathering activity. The views, conclusions and recommendations are not intended to represent the views of the Commission.
81
In early 1990s, village surveys found that water tables are dropping 0.6-0.7 m per year in parts of Haryanaand half a m per year across large parts of Punjab (Postel, 1999: 74).
To date, most management responses to overdraft have focused on supply side solutions such asgroundwater recharge. Conjunctive approaches involving the operation of surface systems can improvethe availability of both surface and groundwater. Demand side interventions are of equal importance,including improvements in irrigation efficiency, expansion of low water consuming crops andconservation. Overall groundwater management approaches need to focus on the inter - linked hydrologicand use systems (World Bank, 1998c: ii).
4.6.5.2 Recharging Options
Recharge is an important component of groundwater management. The Eighth five-year plan proposedinitiating projects in 200 gray, dark and over exploited blocks, transferring surplus monsoon runoffbetween sub basins within river systems, and storing the water in available aquifers. But no mentioncould be found about this or follow - up measures in the Ninth Plan. The urgency of groundwatersituation is yet to be realised, it seems. The huge potential that additional groundwater that can be madeavailable through recharge represent and it sustainability is neither estimated, nor acted upon.
NGOs in many arid sections of the country support active and often very innovative projects forgroundwater recharge. In Rajasthan, many local communities have well-established traditions of waterharvesting and groundwater recharge that are of direct relevance to current needs. There are large scalefarmer based movements in areas such as Saurashtra in Gujarat for recharging groundwater by divertingmonsoon runoff into existing wells. Some examples are described above in section 4.2.
4.6.5.3 Regulation
There is no ground water regulation worth the name in the country in spite of some rather feeble efforts ofthe central and some state governments.
On Dec. 10, 1996, the Supreme Court of India passed an order wherein the direction was issued to theMinistry of Environment and Forests to constitute CGWB as an authority under section 3 (3) of theEnvironment Protection Act, 1986. The Authority is to exercise all powers under the Act necessary for thepurpose of regulation and control of ground water management and development (GOI, 1999: 507). Lackof regulation has serious implications for equity, quality and sustainability of groundwater use.Regulation can also use to more efficient use of groundwater. There is not much evidence available toshow that this authority is very active or effective in its functioning.
4.6.5.4 Groundwater Quality Issues
Deterioration of quality of groundwater due to pumping rates and declines and fluctuations in the waterlevel is also an issue of major concern. According to CGWB, �Fluoride levels in the groundwater areconsiderably higher than the permissible limit in vast areas of AP, Haryana, and Rajasthan and in someplaces in Punjab, UP, Karnataka and Tamil Nadu. Arsenic is also a critical problem in eight districts ofWest Bengal. Various other quality problems, in particular iron and salinity affect large areas� (WorldBank, 1998c: 12). Saline intrusion is a major problem in coastal Kutch and Saurashtra areas like Mandaviand Mundra (World Bank, 1998c: 16). Competitive pumping by tubewell owners led to massive salinityingress from the sea, precipitating an ecological disaster in the hard rock regions of coastal Saurashtra andthe south Indian peninsula (Shah, et al, 1998: 60). Salinity ingress following over exploitation of

World Commission on DamsThematic Review: Assessment of Irrigation Options in India, Draft #1, Date: 08/11/1999
This is a draft working paper of the World Commission on Dams. It was prepared for the commission as part of its informationgathering activity. The views, conclusions and recommendations are not intended to represent the views of the Commission.
82
groundwater leading to displacement of rural communities, as their lands became saline is reported fromTamil Nadu also (Singh, 1997: 158).
In parts of Haryana, overexploitation of groundwater has lead to salinisation of groundwater, as loweraquifers at many places are saline (World Bank, 1994: 14-5). Roughly 65% of the agricultural area ofHaryana is underlain by saline groundwater (World Bank, 1998c: 14).
No agency in India seems to be monitoring the pollution of groundwater due to non point sources likefertiliser and pesticides use in agriculture. Two decades ago the prospects of groundwater pollution fromagricultural chemicals was raised as pressing issue. No data was available then and the situation is nodifferent in that regard now. The situation has only worsened as the fertiliser consumption has increasedmanifold and in some areas have gone beyond fertiliser consumption levels even in US (World Bank,1998c: 15-16).
4.6.5.5 Impact on Instream Flows
Groundwater and surface water are integral parts of the same hydrologic systems. Dropping water levelsdue to groundwater extraction often have major implications for the base flows of streams. Unless baseflows are maintained, downstream users can lose access to water at critical times and pollution of bothsurface and groundwater is likely to increase.
In Gujarat, water levels in Ahmedabad City have been dropping at 1.5-2 m a year for the past fewdecades. As groundwater extraction in Ahmedabad Municipal Area increased, flow in the SabarmatiRiver declined to nearly zero. Model results suggest that in 1984 roughly 19% of groundwater extractedin Ahmedabad was derived from induced seepage from Sabarmati river. Pollution concentration inremaining Sabarmati River has increased. Efforts to restore Sabarmati quality levels will need to ensureminimum flows at all points and at all times in the river. Groundwater management would be central tothis objective (World Bank, 1998c: 12-13).
Modelling activities currently under way indicate that dry season flows in the Ganges River could declineapproximately 75% if historical patterns of development continue. If the results, though based on limitedamount of hydrologic and geologic data, prove accurate, unmanaged groundwater development in theGanges basin could have major impact on instream flows, fisheries, aquatic ecosystems, pollution loadsand water availability for downstream uses (World Bank, 1998c: 13).
In case of Kshipra river near Dewas in western MP, due to indiscriminate use of groundwater for urbanand agricultural use, the river has been converted from a gaining river to a losing river (Shah, et al, 1998:63-64).
Thus, for future groundwater development to be successful, it is essential that river aquifer interactionstudies be done in case of all basins. It is also essential that the groundwater use should be sustainablewith respect to minimum instream flows in the rivers.
4.6.5.6 Power Supply Deficiencies
Cuts in power supply and consequent unreliability lead to lower than possible productivity fromgroundwater irrigated areas. Unreliable power also means more than necessary exploitation ofgroundwater when power is available and installation of electric pumps of higher than necessary capacity(World Bank, 1998c: 6-7).

World Commission on DamsThematic Review: Assessment of Irrigation Options in India, Draft #1, Date: 08/11/1999
This is a draft working paper of the World Commission on Dams. It was prepared for the commission as part of its informationgathering activity. The views, conclusions and recommendations are not intended to represent the views of the Commission.
83
Connected with power supply quality is of course the pricing and losses of state electricity boards. Theagricultural flat rates or no rates are routinely blamed for the huge losses of the electricity boards.However, there is evidence that suggests that the agricultural use of power may be much lower than thoseclaimed by the electricity boards. The actual use in UP is estimated to be only 17% of claimed use and thefigure in Gujarat is likely to be only 20% (World Bank, 1998c: 44-45).
4.7 Arguments Against Minor Surface Irrigation
Here we will try to address some of the criticisms made by the proponents of large dams against theefficacy of smaller projects.
4.7.1 Area of Submergence and Evaporation Losses
Since the volume of water stored per unit area of submergence of smaller dams is going to be lower thanthe same for large dams, it is said that for achieving similar storage capacities, much large submergencearea will be required in case of large number of smaller dams. Similarly, it is argued that large no. ofsmaller schemes will have greater surface area than a single large dam and hence will have greaterevaporation rates. The following points address both the issues.
Firstly, it needs to be noted that the dead storage in case of large dams are always much larger than thesame for smaller projects. Secondly, we need to remember that we need to include in the calculation thewater recharged into the aquifer due to small projects and not just water stored. Recharge capacities ofsmaller projects is much higher. Also, the recharges affected by smaller projects are used in the nearbydownstream area. The recharge affected by large projects are less likely to be useful in the command areaas the use of groundwater in case of large project commands is minimal and also that the aquifer of thecommand and reservoirs of large projects are more likely to be disjointed. Aquifers are increasingly beingaccepted as much more sustainable and less destructive storage option than the reservoirs. There is ofcourse little research available in India on this aspect. The third point in this respect is that there muchgreater effective use of smaller projects than the larger projects. The smaller reservoirs generally getsfilled up and emptied (for use in command area and/or for groundwater recharge) more than once in onemonsoon itself. Thus, while comparing storage of various dams, we need to compare the efficiency oftotal storage (surface and subsurface) use not just physical availability of surface storage capacities.
Fourthly, it needs to be remembered that the much larger proportion of the drawdown land from smallerprojects is available than is the case for large dams.
Fifthly, while comparing large and small systems, we need to take into account both the land going undersubmergence and also the land taken up for canals. The proportion of lands that go for canals is invariablymuch higher for larger projects. Similarly, for larger projects, the lands going for colonies, roads andrelated works will also be much larger than that of smaller projects. For example, in case of upcomingSSP, the land going under reservoir is 39,000 ha, the land going for canals is over 4.5 times larger at1,87,000 ha. The large canal network also means greater evaporation losses. Thus, while measuringevaporation losses, we need to measure evaporation losses across the system and not just that of thereservoir.
As far as issue of water conservation is concerned, it needs to be stressed that while comparing large andsmall systems, we will also have to compare the water wastage through larger systems and also thewaterlogging and salinisation that results thereby.

World Commission on DamsThematic Review: Assessment of Irrigation Options in India, Draft #1, Date: 08/11/1999
This is a draft working paper of the World Commission on Dams. It was prepared for the commission as part of its informationgathering activity. The views, conclusions and recommendations are not intended to represent the views of the Commission.
84
Those supporters of the large dams who attempt to denigrate the role of smaller projects, do not take theseissues into account. Rise in total submergence in case of smaller projects too is not as high as some largedam supporters may like us to believe (see for example: Dhawan, 1993: 37, Singh, 1997: 217-219).
4.7.2 Limited Reliability and Flexibility
Many scholars (for example, see Vaidyanathan, 1999: 69) have said that broadly speaking, tanks andother water surface works that depend mostly upon local rainfall offer inherently limited scope foraugmenting soil moisture, in terms of their reliability and flexibility in adjusting to the needs of crops inspecific locations and specific times. However, Vaidyanathan also notes that in this respect, groundwateris unquestionably the best source. The point to note is that most minor surface irrigation works are veryimportant groundwater recharging instruments, so important for the sustainable use of groundwater.Moreover, it is accepted that groundwater is the most important drought proofing measure (see forexample, World Bank, 1998c). Availability of groundwater in such needy times can be ensured only if theavailable rainfall is recharged to groundwater in a decentralised way, a role best performed by minorsurface water systems.

World Commission on DamsThematic Review: Assessment of Irrigation Options in India, Draft #1, Date: 08/11/1999
This is a draft working paper of the World Commission on Dams. It was prepared for the commission as part of its informationgathering activity. The views, conclusions and recommendations are not intended to represent the views of the Commission.
85
5. Enabling Conditions for Realistic Options Assessment
5.1 Factors Affecting Future Irrigation Development
The factors that influence future irrigation development in India include population increase, increasingper capita demands, poverty, unemployment, food insecurity, markets issues around sustainability ofpresent practices, particularly with respect to M & M projects and groundwater use, imbalances inregional development, pollution of water, competition for water from other sectors and land availability.The biggest factor is of course the government policies that decide the direction of development to a largeextent. There are many actors that influence government policies, including the national and internationalmarket, the national and international business and international donors. We have described most of thesefactors in earlier chapters. Here we will briefly state them and then go onto the issue of optionsassessment.
5.1.1 Population, Poverty, Employment, Sustainability & Regional Development
India�s population is already about 990 million and is growing. In around May 2000, it will cross a billionmark and by 2050 it is likely to touch 1500 mark, subsequently stabilising at 1700 mark. Provisions haveto be made for this population increase. However, even for control and development of the population,regionally balanced development plays very crucial role. And agricultural development is minimumnecessary developmental condition in all regions of India. It is true, as we saw earlier that irrigationdevelopment has strong links with poverty and poverty has strong links with development populationincreases. However, looking at the past experiences and agro - ecological - climatic conditions in variousregions, the first and foremost priority has to be local water harvesting and watershed developmentincluding soil and water conservation works. This is also important from the point of view ofsustainability of present M & M projects and groundwater use. We have also seen that this kind ofpriority has great potential for employment generation and foodgrains production.
5.1.2 Poverty
Evidence shows that poverty levels in India are rising in the 1990s. The population under poverty line hasbeen continuously rising since independence.⇒ While the Ninth Plan states that level of poverty in 1993-94 was 37% (GOI, 1999: 446), it puts nofigures for reduction in poverty levels. However, by 1998, the poverty level had already gone upto 38% asper the Planning Commission, based on the latest NSS data (Indian Express, 10 October 1999).
Thus it is clear that past poverty alleviation plans have failed and there is need for a break from the past.Sustainable soil and water management practices, decentralised and participatory development, landredistribution and local water harvesting will have to be backbone of new poverty alleviation plans.
5.1.3 Land Related Issues
India has 106.6 million agricultural land holdings. The holdings of small and marginal farmers togetherconstitute around 80% of the total holdings and their average size is less than one Ha (GOI, 1999: 447).
Small farms make more efficient use of resources than large farms. This proposition has well knownpolicy implication: an agricultural development strategy that promotes small rather than large farms canserve both growth and distribution objectives.

World Commission on DamsThematic Review: Assessment of Irrigation Options in India, Draft #1, Date: 08/11/1999
This is a draft working paper of the World Commission on Dams. It was prepared for the commission as part of its informationgathering activity. The views, conclusions and recommendations are not intended to represent the views of the Commission.
86
A survey in India, as per UNDP Human Development Report 1996 (quoted in Singh, 1997: 143-144)indicates that farms of 0-5 acres had output of Rs. 737 per acre, and farms over 25 acres only Rs. 346 peracre. Both land use intensity and labour intensity in smaller farms are higher.
Strange as it may sound, in spite of this evidence, several state governments in India, under pressure frommultinational corporations, are going for raising the land ceilings so that large corporations can hold moreland. Maharashtra (1996) and Karnataka (1995) are notable examples of such attempts.
Since the early eighties, India has become a significant producer of intensively farmed prawns,encouraged by the Governments, the World Bank and the corporations. In 1995, it was the fourth largestproducer in Asia, producing 60,000 tonnes. This has lead to a lot of destruction of agricultural land andwater. Prawn farms have provided little employment and have in fact forced the local landowners tomigrate out (Singh, 1997: 132).
Tendencies described in the two paragraphs above will have to be reversed if efficiency, sustainabilityand equity are to the norms in future.
5.1.4 Sustainability Issues
In chapter three we described the issues affecting sustainability of M & M based and groundwater basedirrigation. It is clear that the past practices are no longer sustainable and irrigation from both thesesources, which constitute about 80% of irrigation today. To reverse this trend, it is urgently necessary tochange the priorities in the direction described in section 4.8.
5.1.5 Food Security and Role of market
Food security is one of the fundamental goals of Indian development. However, there are many problemswith present policies on food security and role of markets.⇒ Market forces also govern trade in food. And the markets operate outside the ambit of humancompassion. With the result that traders prefer to sell food in those areas where people can buy food at ahigher price instead of areas where human food needs are maximum. Thus, western Orissa district ofKalahandi, in grip of severe drought in 1996, was, as in most other years, exporting rice.⇒ As Amartya Sen has noted, the rice crop in Bengal in 1941 was worse than the crop in 1943, but thefamine did not occur in 1941, but it did occur in 1943 due to trebling of foodgrains prices in theintervening period.⇒ It is true that during the years of British rule in India, India was struck by famine many times. 1876 to1879 were famine years. But India was net exporter of foodgrains in those years. The export earnings rosefrom Rs. 36 M in 1859-60 to Rs. 99 M 1979-80 (Singh, 1997: 148).⇒ Indian government policy of flooding the rest of the country with wheat and rice from surplus areas ofnorthwest to the deficit areas has not helped food production in the deficit areas. A policy of buying thefood produced in those areas to make available through PDS there itself would have helped better (Singh,1997: 140-148).
GOI policy is that domestic markets should be free and there should be free movement of commodities.�We must proceed towards a full national market by removing unnecessary restrictions�, says India�sNinth Five Year Plan (GOI, 1999: 449). The GOI also says that there is no need for local food securityfrom local food production and national food production self sufficiency is sufficient. However, pastexperience, we have described earlier shows that this has not worked and in fact, if food security is thegoal that local food production is the surest way of assuring that. The irrigation and agricultural policieswill have to be reoriented in view of this.

World Commission on DamsThematic Review: Assessment of Irrigation Options in India, Draft #1, Date: 08/11/1999
This is a draft working paper of the World Commission on Dams. It was prepared for the commission as part of its informationgathering activity. The views, conclusions and recommendations are not intended to represent the views of the Commission.
87
5.1.6 Government Priorities
Having briefly seen the factors that should be important in future irrigation options, let us see what aregovernment priorities for future.
As per India�s Ninth Five Year Plan, foodgrains production target for 2007-08 is 300 MT, the break upfor Rice, Wheat, Coarse Cereals and pulses being 130 MT, 109 MT, 41 MT and 20 MT respectively.(GOI 1999: 442) These targets thus show the bias of the Indian planners in favour of wheat (65.1% highertarget than that for eighth plan) and rice (47.7%) compared to coarse cereals (abysmally low increase of5.1%) and pulses (17.6%).
The Ninth Plan target is 234 MT of foodgrains production by 2001-02 at a growth rate of 3.26%. Toachieve this target, the area under foodgrains would have be 126 M Ha. A large part of incrementalproduction is to come from the rainfed areas (GOI, 1999: 451). To achieve these targets, the governmenthas divided the country into four agro - climatic regions.
5.1.6.1 High Productivity Zone (North - West & Coastal Region)
This zone is characterised by either high irrigation - low rainfall or low irrigation - high rainfall situation,spread over 103 districts of the NorthWest and coastal areas including AP and Tamil Nadu. Here thethrust will be on diversification of agriculture towards high value crops through creation of relevantinfrastructure. New seed varieties, better water management including large scale use of sprinklers toavoid water logging and salinity problems, latest production technology, intensive use of agriculturalinputs like fertilisers and augmenting the irrigation facilities to cover 90% of the gross cropped area aresome of the aspects of strategy in this area (GOI, 1999: 442-3).
5.1.6.2 Low Productivity High Potential Zone
The productivity here is low despite abundant water availability and good soil. This zone would include181 districts from Eastern MP, Central and Eastern UP, the Bihar Plains, Assam, West Bengal and someparts of other states. The strategy here would focus on flood control, drainage management, improvedirrigation facilities, particularly, minor irrigation and a better input delivery system. Fertiliser applicationhas to substantially go up and irrigation to cover 50% of GCA. About one million tubewells will be sunkto irrigate about 4 M Ha. Large - scale adoption of drip and sprinkler irrigation is to be taken up (GOI,1999: 443).
5.1.6.3 Low Productivity Zone (Central Plateau Region)
In 79 districts here, productivity is low due to water scarcity. Here the emphasis will be on developmentof efficient water harvesting and conservation methods and technologies, suitable irrigation packages andwatershed approach and farming system that economise on water use. About 10 M Ha is to be broughtunder scientific treatment of soil and water conservation during Ninth Plan. Million wells scheme is tomake useful contribution to increase groundwater use (GOI, 1999: 443-4).
5.1.6.4 Ecologically Fragile Regions Including Himalayan and Desert Areas
On the basis of existing irrigation facilities and the level of fertiliser consumption in various agroeconomic zones, about 212 districts have been identified for priority action for intensifying irrigation

World Commission on DamsThematic Review: Assessment of Irrigation Options in India, Draft #1, Date: 08/11/1999
This is a draft working paper of the World Commission on Dams. It was prepared for the commission as part of its informationgathering activity. The views, conclusions and recommendations are not intended to represent the views of the Commission.
88
facilities and yield raising inputs including fertiliser consumption for accelerated growth of food output(GOI, 1999: 444).
5.1.6.5 Achievements in the First Three Years of Ninth Plan
The achievement two years into the Ninth Plan in 1998-99 was about 205 MT, which means just about1% growth rate in the first two years of Ninth Plan in spite of both years being good monsoon years. Inthe third year of the Ninth Five Year Plan, in 1999-2000, foodgrains production is already projected todecline by 0.1% due to erratic distribution of rainfall as per India�s Centre for Monitoring IndianEconomy (The Hindu, 12 October 1999). This growth rate far too low compared to the projected growthrate of 3% in demand of foodgrains (GOI, 1999: 451).
5.1.6.6 Business as Usual Approach
What is clear from the above is that the plan is to continue in the same path that was followed in the past.More large irrigation and groundwater use projects, more HYV seeds, and more fertilisers, more of otherinputs. There is no analysis of the past experiences. Nor is there attempt to learn lessons from pastperformances. Secondly, if one looks at the resource allocation, we see that the resource allocation is notin line with the objectives set out above. For example, there is little attempt to effectively promote localwater harvesting, though one would find mention of this at many places. Necessary institutional orgovernance structure is not in place for promoting local water harvesting. Thirdly, overwhelmingevidence suggests and the plan document itself says that the existing irrigation infrastructure is in a stateof disrepair and there is huge scope in increasing irrigation from better repair, maintenance, operation anduse of existing infrastructure, for which there is no priority in above strategies. There is no attempt toachieve food security through decentralised food production, no attempt for groundwater recharge, nostep for tackling increasing waterlogging and salinisation problems and no attempt to tackle soildegradation processes on urgent basis.
5.2 Institutional issues
The appropriateness of institutional forms cannot be decided independently of the agro - climatic,technological, and land tenure conditions (Vaidyanathan, 1999:4). However, traditionally, whenever issueof institutions in irrigation is mentioned, the assumption is to talk about institutions for water control, foroperation and management of the irrigation systems. It is seldom analysed as to what role the variousinstitutions play in the decision making process to take up a certain irrigation system among the availableoptions. Similarly, issues of water allocation, pricing and conflict resolution are key points whereinstitutions play important role.
In India water is a state subject. The role of the central government is mainly pertaining to interstateprojects. Almost all major rivers in India flow through more than one state. The central government alsohas a lot of financial clout. The central government also has the sanctioning and monitoring role withrespect to technical (CWC) social (Ministry of Welfare) and environmental (Ministry of Environment andForests) aspects of the M & M projects. The Centre also makes the decisions with respect to CommandArea Development projects. The major research institutes are also under central government. In effectcentral government has substantial influence on state policies and practices with respect to irrigationsector. And yet, the World Bank advocates nationalisation of the water sector.
The problem with irrigation is not that of less centralisation but that of too much of it. Even at state level,all decisions are in the hands of the bureaucrats - engineers - politicians in the state capitals. There is

World Commission on DamsThematic Review: Assessment of Irrigation Options in India, Draft #1, Date: 08/11/1999
This is a draft working paper of the World Commission on Dams. It was prepared for the commission as part of its informationgathering activity. The views, conclusions and recommendations are not intended to represent the views of the Commission.
89
practically no role for the people in decisions about M & M projects. In fact, most engineers would scoffat such an idea. What do people know about irrigation, they would ask.
Not only people have no role, but experts from other crucial disciplines like agriculture, soil science,hydrology, geology, environmentalists or sociologists have very little role in decisions about irrigationprojects. Thus there is dire need to decentralise the planning and decision - making processes aboutirrigation projects. This can also bring about some level of transparency in the decision making process.
5.2.1 Project Level Institutions and Privatisation
Attempts at involving private sector in irrigation projects have not succeeded till date, though thegovernment continues to encourage private parties to invest in irrigation projects. Over the years, thestates that had important ongoing projects established autonomous corporations to mobilise finances.Some of these, for example, Maharashtra Krishna Valley Development Corporation (MKVDC) forKrishna Valley Projects in Maharashtra, Krishna Bhagya Jal Nigam Ltd (KBJNL) for Upper KrishnaProject in Karnataka and Sardar Sarovar Narmada Nigam Ltd (SSNNL) for SSP in India have enteredequity market to mobilise funds for their respective projects. These attempts, though successful in thebeginning, are proving to be very costly and they only postpone the problem of funds for these projectstemporarily (Gulati, 1999: 5-1 to 5-9; GOI, 1999: 487).
The experiment of KBJNL, SSNNL and MKVDC are not the first attempts in this direction. AP StateIrrigation Development Corp. was registered in 1974 to function on corporate lines and access private andinstitutional finance. But cost recovery never even approached actual expenses; the corporationaccumulated heavy losses and could not service its bank loans. The Gujarat Water ResourcesDevelopment Corporation, whole owned by the Gujarat Government, has been facing worsening financialand operational conditions ever since its inception in 1975. The 1994 finance committee suggested that itshould be wound up. The corporation has annual wage bill of Rs. 220 M and annual gross income of Rs.60 M. It has accumulated a loss of Rs. 700 M (Gulati, 1999: 5-11).
Do the new corporations like KBJNL usher in reforms in canal irrigation that can lead to higherefficiency, greater equity and sustainability in the use of canal waters? The answer is no. They didsucceed in mobilising finances for rapid construction of the projects at hand, but did not pay attention tothe financial, physical or institutional sustainability of the system. Some promises were made aboutraising water rates and forming water user associations, but these were not kept, no serious attempt madein that direction. When increase in water rates (irrigation utilisation to the tune of 145,000 ha, 28% of thetarget, has been achieved) were proposed, the state government rejected the proposal. Thus, thecorporation has failed to generate enough resources even to pay the interest, leave aside the question ofprincipal amount. In fact, water rates do not pay even for 5% of the current O & M expenses (Gulati,1999: 5-12 to 5-14).
5.2.2 The World Bank and Other International Donors
The World Bank has been playing major role in influencing irrigation projects in India right since fifties.The Bank has funded most of the major irrigation projects of India. Now, finding it more difficult to fundlarge projects directly, the Bank is funding large irrigation sector or water resources projects in severalstates in India including Orissa, Haryana, Tamil Nadu and AP. Major part of the funds from these projectsalso go for M & M projects. While the Bank projects are supposed to be better appraised, in reality, theyhave performed quite badly. Issues of drainage, catchment area treatment, downstream areas, social and &environmental impacts or issues affecting the sustainability of India�s irrigation sector performance havebeen largely neglected by the Bank projects also.

World Commission on DamsThematic Review: Assessment of Irrigation Options in India, Draft #1, Date: 08/11/1999
This is a draft working paper of the World Commission on Dams. It was prepared for the commission as part of its informationgathering activity. The views, conclusions and recommendations are not intended to represent the views of the Commission.
90
But most importantly, the Bank is as much responsible for bias we see in India in favour of large projects,if not more. In fact, if we see the list of projects funded by the Bank in irrigation sector in India in past,we see that the Bank has consistently kept away from funding minor surface projects and only fundedlarge projects. If we see the Bank documents about the state wide water resources consolidation projectsthat it is now funding, we see this bias even more pronounced. We shall not go here into the issues as towhy the Bank favours only large projects. The point we would like to stress is that the Bank has played avery major role and continues to play that role even today in influencing India�s irrigation sector in favourof large projects and away from local projects. What is true for the Bank is also almost equally true forother multilateral and bilateral financial bodies.
5.3 Financing Trends
As a result of intense budgetary constrains from other sectors, the share of irrigation investment in totalplan expenditure declined from 22% in the first plan to 11% in the sixth plan and to 7% (5% in real termsas per Gulati (1999: 4-1)) in the Eighth plan. The absolute volume of resources (at constant prices) hasbeen declining since its peak in 1986. From 1980-81 to 1993-94, capital expenditure in irrigation in realterms fell in Bihar by 6.7% per annum, in UP by 6.5%, in Haryana by 4.4%, and in Orissa by 3.4%. Moreworrying is the fall in allocation for O & M expenses (World Bank, 1998: 11, 41).
GOI figures also support these trends. Public investment in agriculture actually declined in real termsfrom Rs. 17.96 billion in 1980-81 to Rs. 13.29 billion in 1994-95. Fixed capital formation in agriculturewhich was Rs. 45.37 billion in 1980-81 increased in real terms to only Rs. 61.33 billion in 1995-96,representing an annual compound growth rate of about 2% (GOI, 1999: 533).
• The fiscal crisis that India faced in 1990s meant that the central and the state governments could nolonger afford the massive subsidies that have been going to irrigation.• Yet massive outlay for M & M projects in irrigation sector in Ninth Plan continues. Thus out of totalNinth Plan (1997-2002) of Rs. 581.64 billion for irrigation sector, Rs. 458.61 billion (78.85%) is allocatedfor M & M projects (GOI, 1999 Vol. 2: 518).• The average annual net irrigation potential created through M & M schemes slowed down during the1990s, falling from almost 0.225 M Ha per annum (average) till early seventies to about 0.13 M Ha perannum (average) during the 1990s.• The increasing O & M expenses is displacing the expenditure from the irrigation budgets. Thus, whilein early eighties 78% of irrigation budget outlay used to go to generation of new storages, by late eightiesthat had dropped to just 55%.
During the eighth plan, the externally aided irrigation projects accounted for 18% of the total estimatedcost of ongoing projects. The share of irrigation in the total external aid annually was around 7-8%. TheNinth Five Year Plan emphasised the need for �vigorous efforts to attract more external investments inirrigation sector� (GOI, 1999: 485).
There are compelling reasons for giving much greater attention and resources to small scale surfaceirrigation schemes, notes Vaidyanathan (1999: 115). The reported decline in area under this category ofworks is a reflection of past neglect. These works have not received much attention under the Plans, andinvestments in this category have been meagre in relation to the magnitude of the problem. Substantialinvestments in system improvement are necessary for improving the quality of surface irrigation, and thismust be given priority over the construction of new systems (Vaidyanathan, 1999: 132-3).

World Commission on DamsThematic Review: Assessment of Irrigation Options in India, Draft #1, Date: 08/11/1999
This is a draft working paper of the World Commission on Dams. It was prepared for the commission as part of its informationgathering activity. The views, conclusions and recommendations are not intended to represent the views of the Commission.
91
A proposal was put forward in 1988 to establish an Irrigation Finance Commission, but the PlanningCommission did not approve it (Gulati, 1999: 5-1 to 5-9).
The Centre gives some money to the states as direct investment in some of the projects of nationalimportance. Lately, in 1996-97, the Centre also started the Accelerated Irrigation Benefit Scheme byextending Rs. 5 billion, which was raised to Rs. 13 billion in 1997-98 and Rs. 15 billion in 1998-99. Theother sources of funds, namely external lending agencies such as the World Bank, Asian DevelopmentBank, or bilateral arrangements with some countries. But this source too has been shrinking of late(Gulati, 1999: 4-26).
The recommendation to create Financially Autonomous Irrigation Agency as a powerful institutionalreform measure from the efficiency and financial mobilisation perspective has been done by many (seefor example, Gulati, et al, 1999: 5-10).
In recent years, a very large amount of money is going to the states from the Centre in the form of RuralInfrastructural Development Fund (RIDF). RIDF I was launched in 1995-96 and had a corpus of Rs. 20billion. RIDF II, RIDF III and RIDF IV, launched in 1996-97, 1997-98 and 1998-99 had Rs. 26 billion,Rs. 25 billion and Rs. 30 billion respectively. Most of these funds have been allocated for irrigationprojects (GOI, 1999: 482).
5.4 Governance Issues
5.4.1 Transparency
The effectiveness of planning process will be greatly enhanced if steps were taken to make the processmore transparent and open to public scrutiny. Transparency requires that, (a) the information concerningthe design of each projects, its scope, the proposed water use and related regulations as well as costs areaccessible to all interested organisations and individuals; (b) a credible mechanism such as publichearings through which affected parties can seek clarifications, raise objections, ask for consideration ofalternatives, and get an opportunity to be heard; and (c) the project planners be required to meet theseobjections and clarify doubts before a project proposal is considered for appraisal by the PlanningCommission or financial institutions (Vaidyanathan, 1999: 131). The Eighth Plan document accepts this:
The process of decision making on the projects need to be made open so that public at large and in particularthose directly affected by the projects can have access to more information about the assumptions andcalculations on which a project is judged by the authorities to be technically and economically viable, satisfythemselves that sufficient safeguards have been built into the project to take reasonable care of those who areaffected by the projects and also the potential adverse ecological consequences flowing from the constructionof the project and its operation; and gives them the opportunity to place their objections before the concernedauthorities along with concrete suggestions for alternative designs/ safe ways of achieving the objectives whichthe project is supposed to serve (Vaidyanathan, 1999: 131).
In addition, there is also need to inform the decisions about experience of irrigation projects in the past.Suffice to add there is no move in this direction either on behalf of the central government or the variousstate governments in spite of these words and demand of the people for greater transparency.
5.4.2 Participation in Decision Making: Recent Trends
We have already noted above how people have too little role to play in decisions pertaining to India�sirrigation sector. Now, as if to address that criticism and also to address various other criticisms that largeprojects in India face, there is a move towards PIM. The World Bank is at the forefront of that bandwagon

World Commission on DamsThematic Review: Assessment of Irrigation Options in India, Draft #1, Date: 08/11/1999
This is a draft working paper of the World Commission on Dams. It was prepared for the commission as part of its informationgathering activity. The views, conclusions and recommendations are not intended to represent the views of the Commission.
92
at international level and it is promoting PIM in many countries across the World. Even in India, the Bankis acting as engine for promoting PIM. Moves are afoot in a number of steps in that direction and AP is atthe forefront of that development.
Participation of farmers in management of irrigation is a welcome step, no doubt. But there are too manybuts in the way it is happening now. Firstly, people are asked to participate and share costs in projects, inwhich they had no role right from its planning to its completion and operation for several years. They arethus asked to share the cost whether the decisions to construct those projects were right or wrong,whatever may have been the costs inefficiencies, mismanagement and corruption in these projects.Secondly, only the farmers are asked to participate. The rest of the members of rural community have norole. Thirdly, they have had no role in the formulation of principles or laws governing PIM. Fourthly,they have no role at operation of the irrigation at macro level. Fifthly, in states like Orissa, the PIM rulessay that if holders of 50% of land in the command come together, the system would be handed over tothem. This would only mean that the large landlords in the system can take over the system and thesmaller farmers would remain at the mercy of the large landlords. These are but a few of the problems.
Independent scholars like Vaidyanathan and Jairath (1999) also share these concerns. As Vaidyanathan(1999: 133) notes, though the WUAs has assumed responsibility for repair and maintenance andimprovement of the main structures where PIM policies are being implemented, it is not involved at all orinvolved only minimally, in the water management within command.
5.4.3 Performance Evaluation of Past Projects and Accountability
As we have noted earlier, out of some 3303 large dams constructed in India since independence,comprehensive post facto evaluation has not been done for a single project. Such reviews are necessary tosee how effective have been the planning, implementation and operation of the projects. What had beenthe projected and actual costs, benefits and impacts? Who all have benefited and who all have paid thecosts? These reviews could also beneficially inform the future decision making processes. In fixingaccountability for the various decisions involved in these projects too, such reviews can be of great help.None of these are possible today because no reviews have been done.
Earlier there used to be a practice of preparing project completion reports under the PlanningCommission. Though not comprehensive, these reviews at least used to provide some understandingabout the project performance. However, that practices also stopped several decades back. AsVaidyanathan (1999: 128) notes, there is a strong case for reviving the practice of preparing projectcompletion reports after a project is commissioned. Objectively examining the deviations from theoriginal specifications, time schedule and cost estimates of the project, and analysing the factorsresponsible for the deviations is valuable in improving planning and avoiding past mistakes.
5.5 Other Suggestions
Some other suggestions that some of the scholars have made with respect to irrigation sector include thefollowing.⇒ Use of remote sensing technology to get better picture of land and water use, cropped lands andcropping patterns.⇒ Irrigation Sector Policy and Plans should be prepare by the central and state governments.⇒ Annual targets and reports should be made public by the irrigation departments with construction,maintenance, and financial plan details.

World Commission on DamsThematic Review: Assessment of Irrigation Options in India, Draft #1, Date: 08/11/1999
This is a draft working paper of the World Commission on Dams. It was prepared for the commission as part of its informationgathering activity. The views, conclusions and recommendations are not intended to represent the views of the Commission.
93
⇒ Social and Environment impact assessment, Options assessment, mitigation plan, implementationauthorities and independent monitoring mechanisms, all in a transparent way must be part of all irrigationand agricultural plans and projects. That it is not so even today is clear from India�s Ninth Five Year Plan.⇒ One suggestion put forward by Gulati et al (1999: 4-29) is the idea of Independent RegulatoryCommission for Canal Irrigation. The aims of the IRCCI could be to distance the canal irrigation issuesfrom the politicians, to ensure transparency in canal irrigation issues and to act as a dispute settlementbody between the users and the irrigation agency. There could be a central commission and also statelevel or project level commissions.
5.6 Options for Future
In earlier chapter, we have tried to look at the various non - large dams available in India today. We havealso tried to show the potential of additional productivity from existing large structures. Where available,we have given some brief case studies that show the viability and characteristics of different options. Atsome places, where available, we have also given order of magnitude of additional water that can beharvested/ used or additional irrigation capacities that can be added without going for additional largestorage. We have also tried to show limitations of the options we are mentioning.
When we come to the issue of scope of the options mentioned, we do not have very clear picture. Themajor limitation here is that in India, it is the government that acts as owner, manager, decision - makerand custodian of all water resources. In most cases, it is also the sole repository of information aboutwater resources development. And it is very difficult to get useful information from the government.Under the circumstances, it is not possible to arrive at precise figures of scope of various options.
This task is made even more difficult by the fact that the path of non large dams options remain anuntravelled path. The government dismisses it as something that can be at the most applicable for small,localised areas. It refuses to look at the alternatives with any seriousness.
• What is the total local rainwater harvesting potential in the country?• What is the total benefit possible from watershed development in the country?• What is the total potential of various local irrigation technologies that were evolved, developed,managed and sustained by communities or various governments across the country?• What would make such alternative (including better management of existing large projects) systemspossible and sustainable and how they stand with respect to large storages?• How can it be assured that such assessment is made before any decision is made about future largeprojects? How can it be assured that such assessment is done in an objective, transparent, open andparticipatory way?
These are very important questions that this review has to answer. However, in the conditions described atthe beginning of this section, the answers would have to be conjectures. Conjectures guided by theexperience till date and by the conditions prevailing in various regions in the country. Conjectures guidedby the experience till date with respect to management of our water resources. Conjectures guided bysocially acceptable priorities.
Under these limitations, the prioritised options could be as follows.

World Commission on DamsThematic Review: Assessment of Irrigation Options in India, Draft #1, Date: 08/11/1999
This is a draft working paper of the World Commission on Dams. It was prepared for the commission as part of its informationgathering activity. The views, conclusions and recommendations are not intended to represent the views of the Commission.
94
5.6.1 Complete Stop to Investments in New Large Systems
This is essential because firstly, we have no idea what has been the result of overwhelming emphasis ininvestment for M & M projects till date. All evidence suggest that all kinds of costs have been high,benefits far from those envisaged, development has been inequitable socially and lopsided regionally.Most importantly, the sustainability of the benefits is in grave doubt.1.1 No further investment should be made in ongoing projects. A thorough review of all ongoing
projects should be taken up to see what restructuring options are available to minimise the social,environmental and economic costs. Only in those cases, where with minimum additional costs,can be get benefits that fit into the prioritised needs of the society and region.
1.2 If food security is the objective than national level food security alone will not help. Local foodsecurity based on local food production is the surest way to ensure food security for the poorest.This overarching goal will have to be at the backdrop of future irrigation strategies.
1.3 Some of the overarching norms for future irrigation strategies will have to include exhaustion oflocal water harvesting first, equitable hydraulic rights, local decision making, transparency andaccountability.
5.6.2 Existing M & M Projects
2.1 Post facto comprehensive evaluation of M & M projects already implemented.2.2 Complete Catchment Area Treatment of the reservoirs2.3 Optimum operating rules for reservoirs2.4 Repair and renovation of canals and related structures after assuring its sustainable use. Desilting
of canals should also be considered under this.2.5 Completion of the canal incomplete canal network where the completion would be useful in the
sense that there is sufficient water available in the reservoir for the incomplete areas.2.6 Conjunctive use of groundwater in a sustainable way.2.7 Canal lining where it is beneficial from the point of view of water conservation, saving water
logged area and BC analysis.2.8 Drainage issues in the canal commands. Priority should be given to those areas where
waterlogging is already present or is imminent.2.9 Use of canals to divert waters to existing unused storages in the command areas. This could lead
to use of monsoon runoff without creating new storages.2.10 Change to appropriate cropping patterns. While this will not be possible by direct enforcement,
but appropriate incentive/ disincentive measures can be adopted to achieve desired results.2.11 Enforcement of land ceiling rules in the command areas and also levying of the betterment levy.2.12 The water rights to the canal should be distributed among all the residents of the community
equally, irrespective of land holding. Thus, the landless can sell their water rights to those farmerswho have more land than his share of water can irrigate. This will not only ensure equity, but alsomore efficient use of water resources. While this and such other measures look very difficult toimplement, these are the most just and best measures from the point of view of equity, efficiency,agricultural/ foodgrains production and sustainability. Pani Panchayat, Sukhomajri and Balirajaexperiences have already shown the way.
2.13 Some of these measures could include handing over the local systems to local communities,charging of water rates to take care of O & M expenses and also some additional revenues to beleft to the decision of the community. Measures will have to be taken to see that the communityfeels a sense of ownership towards the water resources.
2.14 In this, control of all local water resources should be in the hand so the community. Thus,community will also have right to take decisions about local rainwater harvesting, local surfaceand groundwater use, etc.

World Commission on DamsThematic Review: Assessment of Irrigation Options in India, Draft #1, Date: 08/11/1999
This is a draft working paper of the World Commission on Dams. It was prepared for the commission as part of its informationgathering activity. The views, conclusions and recommendations are not intended to represent the views of the Commission.
95
2.15 Appropriate institutional changes to make the above possible. Some of these are mentioned in thenext chapter.
5.6.3 Groundwater Use
3.1 For ensuring quality and sustainability of groundwater use, it is essential to mandate it for allusers to ensure that they ensure equivalent recharge of groundwater. This would be bestensured at community level.
3.2 Electricity/ fuel charges for groundwater pumping should be at levels so that the state does nothave to pay unbearable subsidy.
3.3 There is need to ensure appropriate cropping patterns even in case of groundwater use. Thiscan lead to extension of groundwater use to more areas and also ensure sustainability ofgroundwater availability. State incentives/ disincentives can influence this substantially.
3.4 For equity in groundwater use, hydraulic rights will have to be equitable. How to make thispossible in case of groundwater is more difficult than it is in case of canal water.
3.5 Studies are necessary to understand the relation between surface water use, rivers andgroundwater. This will also help in making it possible to prioritise groundwater use as perwater policy priorities.
3.6 Regular monitoring is also necessary about groundwater quality.3.7 The results of such studies and information about groundwater availability and use will have to
made available to people.
5.6.4 Local Irrigation/ Rainwater Harvesting Systems/ Watershed Development
4.1 First charge on new WRD investment should be for local soil and water conservation measures.This will be for the benefit of the vast drylands of India, firstly. This is bound to go a long way inagricultural development, equitable and balanced regional development and also for sustained lifeof watersheds, forests, rivers, aquifers and reservoirs.
4.2 Second charge on new investment in surface systems should be for local systems. These would bedifferent in different regions, depending on local situations of climate, topography, geology, pastdevelopment and use of water resources. The local community should be final decision-makers inall such decisions, but state should allocate resources for creation and maintenance of suchsystems.
That the scope of benefits from such a prioritised investment plan is immense is obvious from thefollowing facts:1. As per GOI, 14 M Ha additional lands can be brought under canal irrigation if WUE is increased by
10%, which is feasible.2. At lease half the canal irrigated areas are in such a serious state of disrepair that new investments are
almost infructuous in increasing canal irrigated areas. In AP and TN, the canal irrigated areas arealready dropping.
3. Millions of Ha of land is water logged. Only option for them to create proper drainage systems. Morelands where waterlogging/ salinisation is imminent can be saved.
4. Existing reservoir capacities are fast depleting due to high rates of siltation.5. For almost two thirds of rainfed lands, there is no option but to go for soil and water conservation
measures. That it is possible to almost double the productivity of these lands can be seen from theexamples we have described and also according to the agricultural potential of these areas. Over halfof the additional foodgrains production will have to come from rainfed areas.
6. For mountains, hills and most of plateau areas, there is no scope of M & M projects based irrigation.These areas constitute about half of India�s land area. For health, productivity of these areas and for

World Commission on DamsThematic Review: Assessment of Irrigation Options in India, Draft #1, Date: 08/11/1999
This is a draft working paper of the World Commission on Dams. It was prepared for the commission as part of its informationgathering activity. The views, conclusions and recommendations are not intended to represent the views of the Commission.
96
the sustainability of existing M & M and even minor surface systems, it is essential that soil andwater conservation measures and local rainwater harvesting systems are taken up in these areas.
7. Local water harvesting is also essential even for groundwater irrigated areas, which irrigate over halfof all irrigated lands today and which have very high productivity.

World Commission on DamsThematic Review: Assessment of Irrigation Options in India, Draft #1, Date: 08/11/1999
This is a draft working paper of the World Commission on Dams. It was prepared for the commission as part of its informationgathering activity. The views, conclusions and recommendations are not intended to represent the views of the Commission.
97
ReferencesBooks, Reports:
Aggarwal, G.D. undated. An Engineer�s - Evaluation of Water Conservation Efforts of Tarun BharatSangh in 36 Villages in Alwar District, Unpublished document. Alwar, Rajasthan: Tarun BharatSangh
Ballabh, Vishwa & Kameshwar, Choudhary. 1999. Consultation Workshop on Small Water HarvestingStructures: Technology, Institution and Management, Proceedings of a Workshop held at theInstitute of Rural Management, Anand, October 7-8, 1998, Anand, Gujarat: Institute of RuralManagement and New Delhi: Society for Promotion of Wastelands Development.
Bandyopadhyay, Jayant and Gyawali, Dipak. 1994. �Ecological and Political Aspects of HimalayanWater Resource Management�, in Water Nepal, Vol. 4: 1, 7-24.
Bandyopadhyay, J. 1999. Approach to Sustainable Human Development in the Indian Himalaya: Withfocus on the Himalayan Areas of Uttar Pradesh, A concept Paper, (Unpublished draft) Calcutta:Indian Institute of Management, Pg. 21.
Bhushan, Chandra. 1999. �Ancient Ahar and Payne Irrigation System of Bihar in India�, AsianWATMANET, Newsletter No.18, March/April, Pg.12.
Bottrall, Anthony. 1992. Fits and Misfits over Nature - Irrigation Policies in South Asia, ContemporarySouth Asia.
Central Water Commission. 1997. Storages in River Basins of India, New Delhi: Central WaterCommission.
Centre for Science and Environment. 1997. Dying Wisdom: Rise, Fall and Potential of India�s TraditionalWater Harvesting Systems, New Delhi: Centre for Science and Environment.
Centre for Science and Environment. 1999. The Citizens� Fifth Report Vol. I and II, New Delhi: CSE.
Centre for Water Resources and Ocean Management. 1997. Monitoring and Evaluation of TankModernisation � Interim Report Phase - II & Phase � II Extension, Chennai: Anna University.
Chopde, S.K., Anandi, Mehra and Anjal, Prakash. 1998. �Augmenting Water Supplies at the Local Level:a Study of Small Water Harvesting Structures in a Village in the Semi - Arid Region of Gujarat�,Paper for the Consultation Workshop on Small Water Harvesting Structures: Technology,Institution and Management, October 7-8, 1999, Anand, Gujarat: Institute of Rural Management.
Chopra, Ravi and Sen, Debashish. 1991. Natural Bounty and Artificial Scarcity: Population and India�sWater Resources, Dehra Dun, Uttar Pradesh: People Science Institute.
Dhawan, B. D. 1993. Indian Water Resource Development for Irrigation: Issues Critiques and Reviews,New Delhi: Commonwealth Publishers.
Ganguly, Thukral E. & Sakate, M.D. 1992. �Baliraja: a People�s Alternative� in Ganguly Thukral E. (ed)Big Dams, Displaced People: Rivers of Sorrow, Rivers of Change, New Delhi: Sage Publications.

World Commission on DamsThematic Review: Assessment of Irrigation Options in India, Draft #1, Date: 08/11/1999
This is a draft working paper of the World Commission on Dams. It was prepared for the commission as part of its informationgathering activity. The views, conclusions and recommendations are not intended to represent the views of the Commission.
98
George, Susan. 1985. How the Other Half Dies: The Real Reasons for World Hunger, London: PenguinBooks.
Gnanarethinam, J.L. & Ray, Bharati. 1995. �Traditional Systems of Water Management in Orissa�, inPundarikanthan, N.V. & Jayasekar, L. (eds) Proceedings of the National Workshop on TraditionalWater Management for Tanks and Ponds, Chennai: Centre for Water Resources and OceanManagement, Anna University.
Goldman, Michael. 1994. There�s a Snake on Our Chests�: State and Development Crisis in India�sDesert, unpublished dissertation, Santa Cruz, USA: University of California.
Government of India. 1952. Report on the Grow More Food Enquiry Committee, New Delhi: PlanningCommission, GOI.
------------------. 1961. Study of the Problems of Minor Irrigation. Programme Evaluation Organisation,New Delhi: Planning Commission, Government of India.
------------------. 1994. Guidelines for Watershed Development. Ministry of Rural Areas and Employment,New Delhi: Department of Wastelands Development, GOI.
------------------. 1999, Ninth Five Year Plan 1997-2002 Vol. I and II, New Delhi: Planning Commission,GOI.
------------------. 1999b, Water Resources Development Plan of India: Policy and Issues, New Delhi:National Commission for Integrated Water Resources Plan, Ministry of Water Resources, GOI.
Gulati, Ashok, Ruth, Meinzen - Dick, Raju, K.V. 1999. From Top Down to Bottoms Up: InstitutionalReforms in Indian Canal Irrigation, Delhi: Institute of Economic Growth.
Indian Water Resources Society, 1998, Five Decades of Water Resources Development in India, NewDelhi: IWRS.
Hinchcliffe, Fiona, Thompson, John, Pretty Jule, Guijt, Irene, and Shah Parmesh. 1999. Fertile Ground:The Impacts of Participatory Watershed Management, London: Intermediate TechnologyPublications Ltd.
Jagawat, Harnath. 1999. Revial of Rivers: An illustrative story of the Revival of Several Rivers andRivulets through an Appropriate and Effective Strategy in Water Harvesting in the Tribal Regionsof Western India, N.M.Sadguru Dahod, Gujarat: Water and Development Foundation.
Jairath, Jasveen. 1999. �Participatory Irrigation Management: Experiments in Andhra Pradesh�, inEconomic and Political Weekly, Vol. 34, No. 40 (Oct.2-8 1999), Mumbai: Sameeksha TrustPublication.
Jamwal, Nidhi. 1999, �Dying Fields�, in Down to Earth, Vol. 8, No. 11, pp. 22-23 (Oct. 31).
Mahapatra, Richard. 1999. �Waters of Life� in Down to Earth, March 15.
McCully, Patrick. 1996. Silenced Rivers: The Ecology and Politics of Large Dams, London: Zed Books.

World Commission on DamsThematic Review: Assessment of Irrigation Options in India, Draft #1, Date: 08/11/1999
This is a draft working paper of the World Commission on Dams. It was prepared for the commission as part of its informationgathering activity. The views, conclusions and recommendations are not intended to represent the views of the Commission.
99
Mishra, Anupam. 1993. Aaj bhi Khare Hain Talaab (Hindi), New Delhi: Gandhi Peace Foundation.
Mishra, Anupam. 1995. Rajasthan ki Rajat Bundain (Hindi), New Delhi: Gandhi Peace Foundation.
NMSWDF. 1999. Triangular Institutional Co - operation Project � Water Harvesting Study. Field Report,Dahod, Gujarat: N.M.Sadguru Water and Development Foundation.
Pande, U.C. 1995. Design by Experience � Hill Irrigation in the Indian Himalayas. A Monograph onGravity Irrigation Systems in Himachal Pradesh & Uttaranchal. New Delhi: Joginder Sain & Bros.
Pandey, Rakesh. Undated. An Experience in Participatory Watershed Development Programme in DistrictPanchmahal, Dahod, Gujarat: N.M. Sadguru Water and Development Foundation.
Pangare, Ganesh and Lokur, Vasudha. 1996. The Good Society: The Pani Panchayat Model ofSustainable Water Management, New Delhi: Indian National Trust for Art and Cultural Heritage.
Patel, Mukesh. 1998. Trickle Down Impact of Lift Irrigation Schemes at Village Chanasar, Dahod,Gujarat: N.M.Sadguru Water and Development Foundation.
Peoples Science Institute. Undated. Surface Water Management in Palamau: A Study of the AharTechnology, Dehradun, Uttar Pradesh: People�s Science Institute.
Postel, Sandra. 1999. Pillar of Sand: Can the Irrigation Miracle Last?, New York & London: WW Norton& Company.
PWMTA & FARM. 1998. Ripples of the Society: People�s Movements in Watershed Development inIndia. New Delhi: Gandhi Peace Foundation & Food and Agriculture Organisation.
Rai, Mangala and Mauria, S. 1999. �Coarse Cereals: Not for the Poor Alone�, in The Hindu Survey ofAgriculture 1999, pp: 55-59, Chennai: The Hindu.
Raj, K.N. 1960. Some Economic Aspects of the Bhakra Nangal Project, New Delhi: Asia PublishingHouse.
Raju, K.C.B. 1998a. �Proper Management of the Critical Ground Water Resources Requires GroundWater Harvesting� Paper for the Consultation Workshop on Small Water Harvesting Structures:Technology, Institution and Management, October 7-8, 1999, Anand, Gujarat: Institute of RuralManagement.
------------. 1998b. �Groundwater Recharge, Development and Management through People�sParticipation�, Paper presented at Workshop on Peoples Participation in irrigation systemsmanagement to enhance agricultural production, Pune, 1998.
Rao, K.L. 1975. India�s Water Wealth: Its Assessment, Uses & Projections, New Delhi: Orient Longman.
Saini, Harmeet. 1998. Moving Ahead � A Study of Well Managed Irrigation Co � operative, Dahod.Gujarat: N.M.Sadguru Water and Development Foundation.

World Commission on DamsThematic Review: Assessment of Irrigation Options in India, Draft #1, Date: 08/11/1999
This is a draft working paper of the World Commission on Dams. It was prepared for the commission as part of its informationgathering activity. The views, conclusions and recommendations are not intended to represent the views of the Commission.
100
Saravanan,V.S. 1994. Selection Methodology for Rehabilitation of Rainfed Tank Irrigation Systems � ACase Study of Madurai District in Tamil Nadu, Masters Diploma Dissertation, Pune, Maharashtra:Centre for Development Studies, University of Pune.
------------------. 1998. Sustaining Community - Based Resource Management � Case of Tank IrrigationSocieties in Tamil Nadu, M.Phil dissertation, Cambridge, United Kingdom: University ofCambridge.
Sen, Amartya, Dreze, Jean and Hussain, Athar. 1995. The Political Economy of Hunger: Selected Essays,(edited), New Delhi: OUP.
Sengupta, Nirmal. 1995. �Environmental Contributions of Some Traditional Techniques�, Paperpresented at the Seventh International Conference of the International Rainwater CatchmentSystems Association, Beijing, June 19-25 1995.
---------1993. �User �Friendly Irrigation Designs�, New Delhi: Sage Publications.
Shah, Mihir, Banerji, Debashis, Vijayshankar, PS and Ambasta, Pramathesh. 1998. India�s Drylands:Tribal societies and Development through Environmental Regeneration, New Delhi: OxfordUniversity Press.
Sharma, Devinder. 1997. In the Famine Trap, New Delhi: The Ecological Foundation.
Shiva, Vandana. 1989. Staying alive: Women, Ecology and Survival in India, New Delhi: Kali forWomen.
Siddiq, E.A. 1999. �Not a distant dream�, in The Hindu Survey of Indian Agriculture 1999, pp: 39-47,Chennai: The Hindu.
Sikka, Alok K., Bansal, R.C. & Samra, J.S. 1996. �Small Water Harvesting Dams for ResourceConservation and Irrigation in Shiwalik Watersheds�, in Proceedings of the paper presented at theSixth National Water Convention held at Bhopal, New Delhi: National Water DevelopmentAgency, Pg. 81-88.
Singh, Katar & Gupta, K.K. 1997. The Sadguru Model of Community - Based Natural ResourcesManagement (unpublished), Dahod, Gujarat: N.M.Sadguru Water and Development Foundation.
Singh, Laxman & Jagbir, Singh. 1999. �A Community Takes Charge� in Asian WATMANET NewsletterNo.18, March/April, Pg.8.
Singh, Satyajit. 1997. Taming the Waters: The Political Economy of Large Dams in India, New Delhi:OUP.
Sonowal, et.al. 1989. �Zaboo � An Indigenous Farming System of Nagaland�, in Indian Journal of HillFarming, Vol II, No.I., cited in CSE 1997. Dying Wisdom: Rise, Fall and Potential of India�sTraditional Water Harvesting Systems, New Delhi: Centre for Science and Environment.
Srinivas, S.N., Gupta, A.K., Pal, R.C., Singh, P.B. & Vasishta, R.P. 1996. Alternatives to Micro -Irrigation in India: a Critical Assessment of the Treadle Pump Option, New Delhi. Tata EnergyResearch Institute.

World Commission on DamsThematic Review: Assessment of Irrigation Options in India, Draft #1, Date: 08/11/1999
This is a draft working paper of the World Commission on Dams. It was prepared for the commission as part of its informationgathering activity. The views, conclusions and recommendations are not intended to represent the views of the Commission.
101
Srivastava, L.P., Brewer, Jeffrey. 1994. Irrigation Management Transfer at Paliganj Canal, Bihar, India,Colombo, Sri Lanka: International Irrigation Management Institute.
Taneja, B. 1999. �Restoring Watersheds and Streams: Environmental Recovery in NorthWest India�,unpublished Master�s thesis, New Jersey, USA: Rutgers University.
Vaidyanathan, A. 1997. �Washed Aside�, in CSE 1997, Dying Wisdom: Rise, Fall and Potential ofIndia�s Traditional Water Harvesting Systems, New Delhi: Centre for Science and Environment.
Vaidyanathan, A. 1999. Water Resources Management: Institutions and Irrigation Development in India,New Delhi: Oxford University Press.
Virmani, S.M. 1999. �Watershed Management for Sustainable farming�, in The Hindu Survey of IndianAgriculture 1999, pp: 203-6, Chennai: The Hindu.
Vohra, B.B. 1996. �Better Resource Management for Poverty Alleviation�, Economic Political Weekly,June 8, pp. 1397-1404.
Wade, Robert. 1997. �Greening the Bank: The Struggle over the Environment, 1970-1995�, in The WorldBank: Its First Half Century, Kapur Devesh, et al, Washington: Brookings Institution Press.
Willcocks, Sir William. 1930. Lectures on the Ancient System of Irrigation in Bengal and its Applicationto Modern Problems, Calcutta: University of Calcutta.
World Bank. 1991a. India Irrigation Sector Review Vol. I, Washington: The World Bank.
World Bank. 1991b. India Irrigation Sector Review Vol. II, Washington: The World Bank.
World Bank. 1994. Haryana Water Resources Consolidation Project: Staff Appraisal Report, New Delhi:the World Bank.
World Bank. 1995. Tamil Nadu Water Resources Consolidation Project: Staff Appraisal Report, NewDelhi: the World Bank.
World Bank. 1995b. Orissa Water Resources Consolidation Project: Staff Appraisal Report, New Delhi:the World Bank.
World Bank. 1995c. Hydrology: Staff Appraisal Report, New Delhi: the World Bank.
World Bank. 1997. Third Andhra Pradesh Irrigation Project: Staff Appraisal Report, New Delhi: theWorld Bank.
World Bank. 1998. India � Water Resources Management Sector Review: Irrigation Sector, New Delhi:The World Bank.
World Bank. 1998b. Andhra Pradesh Economic Restructuring Project: Staff Appraisal Report, NewDelhi: The World Bank.

World Commission on DamsThematic Review: Assessment of Irrigation Options in India, Draft #1, Date: 08/11/1999
This is a draft working paper of the World Commission on Dams. It was prepared for the commission as part of its informationgathering activity. The views, conclusions and recommendations are not intended to represent the views of the Commission.
102
World Bank. 1998c. India � Water Resources Management Sector Review: Groundwater Regulation andManagement, New Delhi: the World Bank.
Media Reports:
Indian Express, 10 October 1999, Number of People Below Poverty Line Up 4 pc.The Hindu, 12 October 1999, CMIE Scales Down GDP Growth.Devarajan P, The Business Line 4 November 1999, They Turn Dark Zones Bright.AND MANY OTHERS

World Commission on DamsThematic Review: Assessment of Irrigation Options in India, Draft #1, Date: 08/11/1999
This is a draft working paper of the World Commission on Dams. It was prepared for the commission as part of its informationgathering activity. The views, conclusions and recommendations are not intended to represent the views of the Commission.
103
Notes 1 Throughout this report, net irrigated area refers to land area. GIA refers to cropped area. Thus, where 1.5irrigated crops are grown per annum on a 1,000 Ha irrigated land, net irrigated area would be 1,000 Haand the GIA would be 1,500 ha.2 A Major project is defined in India as that having command area larger than 10,000 Ha and a mediumproject is defined as that having a command area between 2000 Ha and 10,000 ha.3 Singh (1997: 66-7) points out that Indian Planners are largely to be blamed. The First, Second and theThird Five year plans pointed out that for development of India�s irrigation, there will be so manythousand engineers required. However, no mention can be found as to the need of agriculturists,sociologists, economists or historians who could have been called upon to render valuable service. Theimpact of this was soon to be seen when engineers dominated the decision making processes in issuesconcerning large dams with practically no role for the other specialist. Ideally, engineers could berequired only for locating sites for projects and for designing necessary sites. But when they become thedecision makers, the mess could be created could be imagined.4 Early in 1999, India�s the then water resources minister Sompal more than once said publicly thatHaryana should not be bothered too much about Punjab not giving it the due share of water through SutlejYamuna link canal. He said that in very few years, Punjab will come begging to Haryana to take the wateraway from it due to the already imminent waterlogging becoming a reality. What he was telling ratherjokingly could be big nightmare for India�s decision makers as Punjab is one of the biggest contributor toIndia�s food production.5 In India, Major irrigation project is defined as that having command area larger than 10,000 ha. Projectswith command area larger than 2,000 Ha are defined as medium projects.6 Sen and Dreze go on to give credit for famine removal to two factors. One is the formation and strictimplementation of the famine code of 1885. The second is the role of media and adversarial politics thatcame to India after Independence in 1947.7 By March 1997, a total of 37,000 Ha of such lands were reclaimed under World Bank funded UP SodicLands Reclamation Project, started in 1993, it is claimed.8 India of British period included present day Pakistan and Bangladesh.9 Contribution from Bansuri Taneja and V S Sarvanan on behalf of SANDRP in parts of this chapter isgratefully acknowledged.10 The census has made a good beginning in enumerating the minor irrigation inspite of the fact that someof these data have been found to contain errors in terms of numbers and the area irrigated. Thediscrepancy in the area irrigated is quiet natural as the command of the minor irrigation fluctuates as perclimatic conditions prevailing in the year.11 This has been documented widely by Pande, U.C.(1992) and also in CSE (1997).12 In fact, Willcocks goes on to say that the Cholas actually ruled Bengal a few centuries before theyreplicated what they saw in the Ganges and Damodar deltas in Bengal to Tanjor delta in south muchlatter, about 300 AD.13 The restoration of these tanks have been attempted through �Kudimaramath Act� (in 1880�s) �TankRestoration Scheme� (1960�s) and irrigation modernisation (in 1980�s).

World Commission on DamsThematic Review: Assessment of Irrigation Options in India, Draft #1, Date: 08/11/1999
This is a draft working paper of the World Commission on Dams. It was prepared for the commission as part of its informationgathering activity. The views, conclusions and recommendations are not intended to represent the views of the Commission.
ANNEXURES
Annexure 1 Agriculture Land Use Figures of India
⇒ Total geographical Area 328.76 M ha⇒ Land area 297.319 M ha⇒ Total cultivable area (92-93) 184.376 M ha⇒ Total net sown area 118.75 M ha in 1950-51
140.27 M ha in 1970-71140 to 142.5 M ha (1971-93)
⇒ Gross Cropped area 131.89 M ha in 1950-51185.48 M ha in 1990-91
⇒ Gross Area under foodgrain crops 97 M ha (50-51)125 M ha (70-71)Around 129 M ha (71 to 93)
⇒ Gross area under foodcrops/ gross 67%Cropped area under all crops
⇒ Irrigated food crops/ gross irrigated area 70%⇒ Rainfed food crops/ gross rainfed area 66%⇒ March 1995, irrigation potential 42.2 M ha (surface water)
42.9 M ha (ground water)85.1 M ha
⇒ Ultimate irrigation potential 75.9 M ha (surface water)64.1 M ha (ground water)140.0 M ha
Source: GOI, 1999b: 7

World Commission on DamsThematic Review: Assessment of Irrigation Options in India, Draft #1, Date: 08/11/1999
This is a draft working paper of the World Commission on Dams. It was prepared for the commission as part of its informationgathering activity. The views, conclusions and recommendations are not intended to represent the views of the Commission.
Annexure 2AInvestment Through Plan periods in Irrigation Sector
at Current Prices
(Rs. Million)Minor IrrigationPlans Period M & M
Irrigation Public Sector Institutional TotalCAD Total
First 1951-56 3 762.4 656.2 Negligible 656.2 - 4 418.6Second 1956-61 3 800.0 1 422.3 193.5 1 615.8 - 5 415.8Third 1961-66 5 760.0 3 277.3 1 153.7 4 431.0 - 10 191.0Annual 1966-69 4 298.1 3 261.9 2 347.4 5 609.3 - 9 907.4Fourth 1969-74 12 423.0 5 122.8 6 610.6 11 733.4 - 24 154.4Fifth 1974-78 25 161.8 6 308.3 7 787.6 14 095.8 - 39 257.5Annual 1978-80 20 785.8 5 015.0 4 804.0 9 819.0 3 629.6 34 234.4Sixth 1980-85 73 688.3 19 792.6 14 375.6 34 168.2 7 430.5 115 287.0Seventh 1985-90 111 072.9 31 183.5 30 609.5 61 793.0 14 475.0 187 340.9Annual 1990-92 54 591.5 16 804.8 13 495.9 30 300.7 6 194.5 91 086.7Eighth 1992-97 210 718.7 64 083.6 53 310.0 117 393.6 21 459.2 34 9571.5
TOTAL (at currentprices)
526,062.5 156 928.3 134 687.7 291 616.0 54 188.8 870 867.3
TOTAL (at constant1996-97 prices)
1,323,899.3 394 928.9 338 957.7 733 886.6 133 856.6 2 191 642.0
Source: GOI, 1999 Vol. II: 478
Annexure 2BInvestment Through Plan periods in Irrigation Sector
at Constant 1996-97 Prices(Rs. Billion)
Minor IrrigationPlans Period M & MIrrigation Public Sector Institutional Total
CAD Total
First 1951-56 78.0342 13.6099 Negligible 13.6099 - 91.6441Second 1956-61 60.1398 22.5097 3.0624 25.5721 - 85.7119Third 1961-66 66.7484 37.9782 13.3694 51.3476 - 118.0960Annual 1966-69 39.4390 29.9310 21.5396 51.4706 - 90.9096Fourth 1969-74 79.7641 32.8918 42.4345 75.3263 - 155.0884Fifth 1974-78 125.1942 31.3874 38.7467 70.1341 - 195.3283Annual 1978-80 79.4967 19.1802 18.3732 37.5534 13.8816 130.9317Sixth 1980-85 196.2550 52.7139 38.2667 90.9806 19.7897 287.2386Seventh 1985-90 212.0715 59.5387 58.4427 117.9814 27.6285 357.6814Annual 1990-92 81.2560 25.0129 20.0878 45.1007 9.2201 135.5768Eighth 1992-97 310.5763 94.4522 78.5731 173.0252 31.6285 515.2300
TOTAL 1 323.8993 394.9289 338.9577 733.8866 133.8566 2 191.6425Source: GOI, 1999 Vol. II: 478

World Commission on DamsThematic Review: Assessment of Irrigation Options in India, Draft #1, Date: 08/11/1999
This is a draft working paper of the World Commission on Dams. It was prepared for the commission as part of its informationgathering activity. The views, conclusions and recommendations are not intended to represent the views of the Commission.
Annexure Table 2CCost for Creation of One Hectare of Irrigation Potential
under Various Plan Period
Cost for Creating One Hectare of IrrigationPotential (in Rupees)
Plan Period
Major/ MediumIrrigation
Minor Irrigation
First Plan (1950-55) 311* 54Second Plan (1955-60) 265 96Third plan 350 193Annual Plan (1966-69) 240 171Fourth Plan (1969-74) 598** 218Fifth Plan (1974-78) (1978-79)
983@377
23183
Annual Plan (1979-80) 405 87Sixth Plan (1980-85) 2464 481Seventh Plan (1985-90) 3321 610* Inclusive of Rs. 800 million incurred during the pre-plan period.** Excludes plan outlay on unapproved Kaveri basin Projects.@ Excludes non-plan outlay on unapproved Kaveri basin Projects.Figures for Minor Irrigation pertain to government outlays only.Source: Government of India. 1995. Cited in Singh, 1997:110

World Commission on DamsThematic Review: Assessment of Irrigation Options in India, Draft #1, Date: 08/11/1999
This is a draft working paper of the World Commission on Dams. It was prepared for the commission as part of its informationgathering activity. The views, conclusions and recommendations are not intended to represent the views of the Commission.
Annexure 3APlan - wise Development of Gross Irrigation
(In Million Ha)Minor IrrigationM & M
Ground water Surfacewater
TotalTotal
IrrigationYear
P U P U P U P U P U
Gross irrigationas per landutilisationstatistics
Pre Plan 9.7 9.7 6.5 6.5 6.4 6.4 12.9 12.9 22.6 22.6 22.56 (99.8)1955-56 12.2 10.98 7.66 7.66 6.4 6.4 14.06 14.06 26.26 25.0425.64 (102)1960-61 14.33 13.05 8.28 8.28 6.47 6.47 14.75 14.75 29.08 27.8 27.98 (101)1965-66 16.57 15.17 10.5 10.5 6.5 6.5 17.0 17.0 33.57 32.1730.9 (96.1)1973-74 20.7 18.69 16.44 16.44 7.06 7.06 23.5 23.5 44.2 42.1940.28 (95.5)1984-85 27.7 23.57 27.82 26.24 9.7 9.01 37.52 35.25 65.22 58.8254.53 (92.7)1991-92 30.74 26.32 38.89 36.25 11.46 10.29 50.35 46.54 81.09 72.8665.68 (90.1)1996-97 32.96 28.44 44.65 41.60 11.95 10.71 56.60 52.31 89.56 80.7570.64 (87.5)Source: GOI 1999 Vol. II: 479, IWRS 1998: 21
Note: 1. Upto 1978-80, the potential creation and its utilisation for minor irrigation are shown asshown. After consultation with the States the Planning Commission fixed the base figure for 1984-85for potential created and utilised.2. Figures in the bracket in last column are % of gross irrigated area as per LUS as against irrigatedutilisation figures.
Annexure 3BPlan - wise Net Irrigated Area under Different Sources
(M ha)Canals Groundwater
Govt. Private TotalTanks
Tubewells Otherwells
TotalOtherSources
Netirrigatedarea
Grossirrigatedarea
‘50-‘51 7.2 1.1 8.3 3.6 - 6.0 6.0 3.0 20.9 22.6‘55-‘56 8.0 1.4 9.6 4.4 - 6.8 6.8 2.2 22.8 25.6‘60-‘61 9.2 1.2 10.4 4.6 0.2 7.2 7.4 2.4 24.8 27.9‘65-‘66 9.8 1.1 10.9 4.4 - 8.6 8.6 2.5 26.8 30.9‘70-‘71 12.0 0.9 12.9 6.1 4.5 7.4 11.9 2.3 31.2 38.2‘75-‘76 12.9 0.9 13.8 4.0 6.8 7.6 14.4 2.4 34.6 43.4‘80-‘81 14.5 0.8 15.3 3.2 9.5 8.2 17.7 2.6 38.8 49.8‘90-‘91 16.1 0.3 16.1 3.3 14.2 9.9 24.1 2.8 46.3 60.7‘93-‘94 16.6 0.5 17.1 3.2 15.0 10.7 26.5 3.2 50.1 67.9Source: GOI, Ministry of Agriculture, as given in Vaidyanathan, 1999: 61

World Commission on DamsThematic Review: Assessment of Irrigation Options in India, Draft #1, Date: 08/11/1999
This is a draft working paper of the World Commission on Dams. It was prepared for the commission as part of its informationgathering activity. The views, conclusions and recommendations are not intended to represent the views of the Commission.
Annexure 3CPre-Plan M & M Projects
Basin State Project Year ofCompletion
Area irrigated(M Ha)
Storage(BCM)
Indus J & K Ranbir Canals and others 1904 0.1027 Neg.Punjab Upper Bari Doab 1859 0.3352 Neg.Punjab Sirhind Canal 1832 0.6002 Neg.Punjab Eastern Canal 1933 0.1414 Neg.Rajasthan Gang Canal 1928 0.3035 Neg.
Ganga Bihar Son Canal 1879 0.3472 Neg.Haryana Western Yamuna Canal and
its extension scheme1879 0.4883 Neg.
Uttar Pradesh Upper Ganga Canal 1854 0.6995 Neg.Uttar Pradesh Eastern Yamuna Canal 1830 0.1915 Neg.Uttar Pradesh Agra Canal 1873 0.1384 Neg.Uttar Pradesh Lower Ganga Canal 1878 0.5279 Neg.Uttar Pradesh Sarda Canal 1926 0.6125 Neg.Uttar Pradesh Betwa Canal and others 1886 1.2770 0.867West Bengal Midnapur Canal and others 1889 0.1522 Neg.
Brahmani& BaitarniBasins
Orissa Orissa Canal System 1868 0.1681 Neg.
Godavari Andhra Pradesh Godavari delta system 1890 0.5585 Neg.Andhra Pradesh Nizamsagar 1931 0.1113 1.979
Krishna Andhra Pradesh Krishna Delta 1855 0.5564 Neg.Cauvery Karnataka Krishnarajsagar etc. 1932 0.1455 2.363
Tamil Nadu Cauvery delta system 1889 0.5150 Neg.Tamil Nadu Cauvery Mettur 1934 0.1294 5.356TOTAL IRRIGATION WITHOUT STORAGE 6.4385
TOTAL 8.1017Source: Rao, 1975; CWC, 1997
Notes: 1. Neg. in the last column means storage is less than 10 Mcum, as in CWC (1997).2. Only those projects are mentioned that were listed in Rao (1975).3. In addition to the above, 0.1691 Mha were irrigated by pumped canal schemes (Ghaghra canal,Dohrighat canal, Tanda canal, Kuwana canal are some of these). All of these were non storage basedschemes. If we add these to 8.1017 Mha listed above, we arrive at the figure of 8.2808 Mha, close to8.3 M ha figure irrigated by M & M canals in 1951. It is useful to note that only about a fifth of thisirrigation was based on storage dams. In case of one of the storage schemes, namely Betwa Canal, thestorage (867 Mcum) was disproportionately small compared to the large irrigated area of 1.277 Mha.For all practical purposes, this scheme too can be described as non-storage scheme.

World Commission on DamsThematic Review: Assessment of Irrigation Options in India, Draft #1, Date: 08/11/1999
This is a draft working paper of the World Commission on Dams. It was prepared for the commission as part of its informationgathering activity. The views, conclusions and recommendations are not intended to represent the views of the Commission.
Annexure 3DRelative Increase in Gross Irrigation Potential (M ha)
1950-51 1996-97Irrigation sourcePotential Utilisation Potential Utilisation
% increasein potential
M & M Diversion/ lift systems 7.76 7.76 7.76 7.76 NilM & M Storage systems 1.94 1.94 25.20 20.68 1199.0Minor surface water 6.40 6.40 11.95 10.71 86.7Total Surface Water Systems 16.10 16.10 44.91 39.15 178.9Groundwater 6.50 6.50 44.65 41.60 586.9Total Irrigated area 22.60 22.60 89.56 80.75 296.3Notes: 1. This table is adopted from Annexure 3A and 3C.2. The area irrigated by M & M diversion/ lift schemes in 1950-51 is taken from table 3C. In absenceof desegregated data for 1996-96 with respect to M & M diversion/ lift schemes, it is assumed thatthere is no increase in this category since 1950-51. This assumption is not likely to be very wrong,though to whatever extent it is wrong, it will add inaccuracy in the proportion of M & M storageirrigated areas.3. Over emphasis on M & M storage based systems (basically meaning big dams) is very evidentfrom the last column above.4. If the fourth column gives any impression that M & M storage systems are the mainstay of India’sirrigation, that impression is dispelled by the last but one column, which shows that these systemsconstitute only about a quarter of total irrigated area after taking away over 60% of money spent onirrigation sector in India since Independence.
Annexure 3EPast Rates of Development of New Irrigation (1950-51 to 1993-94)
Average Annual Increase in M ha
1950-51 to1970-71
1970-71 to1984-85
1984-85 to1993-94
1950-51 to1993-94
Total Gross Irrigated Area 0.78 1.14 1.53 1.05Total Net Irrigated Area 0.51 0.76 0.92 0.68Net Canal irrigated Area 0.225 0.22 0.13 0.20Net Groundwater Irrigated Area 0.295 0.58 0.72 0.48Net Irrigated Area from Other Sources (-)0.01 (-)0.04 0.06 Neg.Source: World Bank, 1991b: 54 and Annex table 3B above, both quoting Ministry of Agriculture,Directorate of Economics and Statistics, Govt. of India.
Note: While rates of both total gross and net irrigation area show rising trend, this is due to risingtrend in groundwater irrigated areas. The rates of canal irrigated area from M & M schemes showfalling trend.

World Commission on DamsThematic Review: Assessment of Irrigation Options in India, Draft #1, Date: 08/11/1999
This is a draft working paper of the World Commission on Dams. It was prepared for the commission as part of its informationgathering activity. The views, conclusions and recommendations are not intended to represent the views of the Commission.
Annexure Table 3FDegree of Utilisation of Irrigation Potential in 1959-60
(Percentage of Potential Area Irrigated in 1959-60)
Kharif Rabi Weighted Average of SeasonsSample Areas inStates Canal Minor Works Canal Minor Works Canal Minor Works
Andhra Pradesh 94.9 78.7 9.3 84.2 52.1 80.4Madhya Pradesh 73.0 10.5 0.0 69.5 36.5 39.4Punjab 8.7 45.2 5.0 47.0 6.8 46.1Rajasthan 0.0 8.6 25.3 99.8 12.6 54.2Uttar Pradesh 102.4 69.7 30.3 79.5 66.3 75.0Source: GOI, 1961.

World Commission on DamsThematic Review: Assessment of Irrigation Options in India, Draft #1, Date: 08/11/1999
This is a draft working paper of the World Commission on Dams. It was prepared for the commission as part of its informationgathering activity. The views, conclusions and recommendations are not intended to represent the views of the Commission.
Annexure 4Relative Role of Irrigation Sources by States, 1990-91
% of Net irrigated by various sourcesMajor States Net AreaSown (mha)
Net Irrigatedarea (mha) Canals Tanks Wells Others1
Andhra Pradesh 11.02 4.31 43.41 22.49 30.27 3.83Arunachal Pradesh 0.15 0.03 100.00Assam 2.71 0.57 100.00Bihar 7.70 3.35 32.57 3.44 45.38 18.61Goa 0.13 0.02 25.00 0.00 75.00 0.00Gujarat 9.29 2.49 18.93 1.16 79.78 0.12Haryana 3.58 2.60 51.44 0.04 47.98 0.54Himachal Pradesh 0.58 0.10 23.23 1.01 4.04 71.72Jammu & Kashmir 0.73 0.30 93.62 0.67 0.34 5.37Karnataka 10.38 2.11 40.80 11.36 33.74 14.10Kerala 2.25 0.33 32.43 14.71 19.52 33.33Madhya Pradesh 19.56 4.31 35.61 3.64 49.77 10.99Maharashtra 17.94 2.04 22.25 15.23 55.60 6.93Manipur 0.14 0.07 100.00Meghalaya 0.20 0.05 100.00Mizoram 0.07 0.01 100.00Nagaland 0.19 0.06 100.00Orissa 6.30 1.93 46.74 14.94 38.31 0.00Punjab 4.22 3.91 39.05 0.00 57.11 3.84Rajasthan 16.38 3.90 35.13 3.48 60.74 0.65Sikkim 0.10 0.02 100.00Tamil Nadu 5.58 2.37 32.41 22.38 44.63 0.59Tripura 0.27 0.04 63.41 4.88 17.07 14.63Uttar Pradesh 17.30 10.54 30.29 0.99 65.77 2.96West Bengal 5.33 1.91 37.42 13.76 37.26 11.46All India 142.23 47.43 35.63 6.84 51.04 6.49Source: Directorate of Economics and Statistics, Ministry of Agriculture, as quoted in World Bank,1998: 128
1 Includes area being irrigated by streams, ponds, and other surface water bodies other than tanks.

World Commission on DamsThematic Review: Assessment of Irrigation Options in India, Draft #1, Date: 08/11/1999
This is a draft working paper of the World Commission on Dams. It was prepared for the commission as part of its informationgathering activity. The views, conclusions and recommendations are not intended to represent the views of the Commission.
Annexure 5ADistribution of Area under the Principal Crops into
Irrigated and Unirrigated Segments (M Ha)
Total Area Irrigated Segment Unirrigated SegmentCrops71-72 81-82 91-92 71-72 81-82 91-92 71-72 81-82 91-92
Food Crops 78.91 85.60 85.91 26.53 34.47 42.9 52.38 51.13 43.01Paddy 37.79 40.80 42.00 14.66 16.93 19.66 23.13 23.87 22.34Wheat 19.10 22.10 24.50 10.28 15.63 20.70 8.82 6.47 3.80Jowar 16.50 16.80 13.00 0.67 0.71 0.82 15.83 16.09 12.18Maize 5.52 5.90 6.00 0.92 1.20 1.31 4.60 4.70 4.69Non-food crops 20.50 22.34 26.93 4.28 7.74 11.23 16.22 14.6 15.7Groundnut 8.00 7.20 8.50 0.59 0.96 1.63 7.41 6.24 6.87R.seed & Mustard 1.70 3.64 5.80 0.41 1.71 3.34 1.29 1.93 2.46Cotton 8.40 8.00 8.00 1.56 2.22 2.66 6.84 5.78 5.34Sugarcane 2.40 3.50 4.10 1.72 2.85 3.60 0.68 0.65 0.50Total 99.41 107.94 111.90 30.81 42.21 53.72 68.60 65.73 58.18Source: World Bank, 1998: 129
Annexure 5 BAverage Irrigated and Unirrigated Yield Levels
of the Principal Crops (tons/ Ha)
Irrigated segment Unirrigated segmentCrops71-72 81-82 91-92 71-72 81-82 91-92
Food CropsPaddy 1.65 1.91 2.09 0.70 0.90 1.05Wheat 2.40 2.77 3.18 1.04 1.54 1.83Jowar 1.33 1.48 1.32 0.63 0.93 1.08Maize 1.02 1.64 1.98 0.66 0.99 1.56Non-Food CropsGroundnut 1.46 1.59 1.83 0.81 0.90 0.96R.seed and Mustard 0.54 0.75 0.99 0.24 0.32 0.48Cotton 0.85 1.37 1.87 0.32 0.68 0.73Sugarcane 41.41 58.37 63.84 37.47 41.33 46.87Source: World Bank, 1998: 129

World Commission on DamsThematic Review: Assessment of Irrigation Options in India, Draft #1, Date: 08/11/1999
This is a draft working paper of the World Commission on Dams. It was prepared for the commission as part of its informationgathering activity. The views, conclusions and recommendations are not intended to represent the views of the Commission.
Annexure 5CIrrigated Crop Patterns in Early 1960s, 1970s and 1980s
(% of gross irrigated area)
1960-1 to 1962-3 1970-1 to 1972-3 1987-8 to 1989-90Rice 45.3 37.0 27.7Wheat 15.3 26.9 31.7Other cereals & Millets 11.4 9.7 13.6Total Cereals & Millets 72.0 73.6 73.0Total Pulses 7.0 5.0 3.6Sugarcane 5.6 4.7 5.2Fruits & Vegetables 1.7 2.8 4.1Cotton 3.6 4.1 4.1Total Oilseeds 1.6 2.9 7.3Other crops 8.3 6.7 2.7Total 100.0 100.0 100.0Source: GOI, Ministry of Agriculture, as tabulated in Vaidyanathan, 1999: 68
Annexure 5DArea, Production and Yield of Major Crops (1996-97)
Crop/Commodity Area(M Ha) Production (MT) Yield (kg/Ha) % coverage under irrigation (‘94-95)Rice 43.28 81.31 1879 49.8Wheat 25.93 69.27 2671 85.2Coarse Cereals 32.10 34.27 1068 10.4Sorghum 11.57 11.09 958 6.7Pearl Millet 10.00 7.91 791 5.5Maize 6.25 10.61 1698 20.5Pulses 23.19 14.46 623 12.7Foodgrains 124.51 199.32 1601 39.6Oilseeds 26.81 24.96 931 25.0Cotton 9.12 14.25 266 34.2Sugarcane 4.17 277.25 6651 87.9Source: Agricultural Statistics at a glance (March 1998), Union Ministry of Agriculture, as quoted inRai, et al, 1999: 57

World Commission on DamsThematic Review: Assessment of Irrigation Options in India, Draft #1, Date: 08/11/1999
This is a draft working paper of the World Commission on Dams. It was prepared for the commission as part of its informationgathering activity. The views, conclusions and recommendations are not intended to represent the views of the Commission.
Annexure 5EChanges in Productivity of Mainly Rainfed Crops
Crop Average Yield fortriennium ending1960-61 (kg/ha)
Average Yield fortriennium ending1986-87 (kg/ha)
Average YieldGrowth perannum (%)
Proportion of CropArea Irrigated in1986 (%)
Maize 892 1,290 1.5 NASorghum 506 638 0.9 4Pearl Millet 317. 438 1.3 5Chick Pea 638 686 0.3 14Pigeon Pea 745 767 0.1 3Groundnut 760 821 0.3 16Source: World Bank, 1991b: 53
Note: Crops grown wholly or almost wholly as rainfed crops. Yield averages include yields fromirrigated areas.

World Commission on DamsThematic Review: Assessment of Irrigation Options in India, Draft #1, Date: 08/11/1999
This is a draft working paper of the World Commission on Dams. It was prepared for the commission as part of its informationgathering activity. The views, conclusions and recommendations are not intended to represent the views of the Commission.
Annexure 6M & M Irrigation achievement upto 8th plan
(Thousand ha)Sr No State UIP Achievement to the end of 8th plan % of UIP achieved1 Andhra Pradesh 5000 3045.1 612 Arunachal Pradesh - - -3 Assam 970 196.67 204 Bihar 6500 2802.5 435 Goa 62 13.02 216 Gujarat 3000* 1350.00 457 Haryana 3000 2078.79 698 Himachal Pradesh 50 10.55 229 J & K 250 173.70 6910 Karnataka 2500* 1666.02 6711 Kerala 1000 513.31 5112 Madhya Pradesh 6000 2317.60 3913 Maharashtra 4100 2313.00 5614 Manipur 135 63.00 3815 Meghalaya 20 - -16 Mizoram ** - -17 Nagaland 10 - -18 Orissa 3600 1557.75 4319 Punjab 3000 2512.85 8420 Rajasthan 2750* 2273.88 8321 Sikkim 20 - -22 Tamil Nadu 1500* 1545.51 10323 Tripura 100 2.30 224 Uttar Pradesh 12500 7059.00 5625 West Bengal 2300 1444.08 6326 Union Territories 98 18.51 19
TOTAL 58465 32956.83 56Source: GOI, 1999: 497
Notes: 1. * Indicates that actual would be more.2. ** Included in Union Territories3. The figures in bold in the last column indicate that the achieved % is above national average of56%.

World Commission on DamsThematic Review: Assessment of Irrigation Options in India, Draft #1, Date: 08/11/1999
This is a draft working paper of the World Commission on Dams. It was prepared for the commission as part of its informationgathering activity. The views, conclusions and recommendations are not intended to represent the views of the Commission.
Annexure 7Number of M & M Projects Taken Up in Various Plans
Plan Period Major MediumFirst Plan 44 169Second Plan 33 102Third Plan 32 44Annual Plans (1966-69) 11 30Fourth Plan (1969-74) 32 73Fifth Plan (1974-78) 70 300Annual Plans (1978-80) 13 52Sixth Plan (1980-85) 30 91Seventh Plan (1985-90) 12 33Annual Plans (1990-92) 1 -Eighth Plan (1992-97) 14 50Total 292 944Source: GOI, 1999: 499

World Commission on DamsThematic Review: Assessment of Irrigation Options in India, Draft #1, Date: 08/11/1999
This is a draft working paper of the World Commission on Dams. It was prepared for the commission as part of its informationgathering activity. The views, conclusions and recommendations are not intended to represent the views of the Commission.
Annexure 8Water Productivity Gains from Drip Irrigation in India
Crops % change in yield % change in water use %Change in WaterProductivity
Banana +52 -45 +173Cabbage +02 -60 +150Cotton +27 -53 +169Cotton +25 -60 +255Grapes +23 -48 +134Potato +46 -00 +046Sugarcane +06 -60 +163Sugarcane +20 -30 +070Sugarcane +29 -47 +091Sugarcane +33 -65 +205Sweet Potato +39 -60 +245Tomato +05 -27 +049Tomato +50 -39 +145Source: Postel, 1999: 175Notes: Water productivity measured as crop yield per unit of water supplied.

World Commission on DamsThematic Review: Assessment of Irrigation Options in India, Draft #1, Date: 08/11/1999
This is a draft working paper of the World Commission on Dams. It was prepared for the commission as part of its informationgathering activity. The views, conclusions and recommendations are not intended to represent the views of the Commission.
Annexure 9Some Observations about Planning of Bhakra Nangal Project
Following observations by KN Raj (Raj, 1960), the then Professor at Delhi School of Economics, onthe planning and project estimates of the Bhakra Nangal project are self explanatory. Theseobservations are relevant in view of the criticisms levelled against large dams today. The fact thatBhakra Nangal project is cited by the supporters of large dams in India and elsewhere as the mostsuccessful of large dams make these observations even more relevant.
“The irrigation facilities which have been promised appear to be in excess of what can be actuallyprovided” (Raj, 1960: 54).
“The estimates of the total output, it will be noticed, are lower than those given in the project report of1953, in regard to both foodgrains and cotton. In foodgrains, the above estimate of 0.85 M T is about 25%lower than the earlier estimate of 1.13 MT, and for cotton the estimates output is about 40% lower” (Raj,1960: 102).
“As we have seen (in chapter 3), there may be a shortage of water of the order of about 9% even in yearswhen the reservoir could be filled to the full extent, and even on the earlier assumptions regarding thepattern of release of water. On an average, the shortage might be as high as 25% and, in years of lowrainfall, more than 50%. No study has been made of the likely effect of these shortages on the proposedsupplies of water in the different regions.”
(Irrigation efficiency of the project is likely to be 38.5%.) (p 92-93).
“Apart from the detailed information obtained on the nature of soil in each tract, this survey has revealedthat nearly 10 lakh acres out of the 33 lakh acres surveyed have a high salt and alkaline content, and theseareas would therefore require reclamation before being put under normal cultivation” (p 96).
“With the larger provision for storage of surplus water, it was also clear that the river would almost dry upbelow Rupar, where the canals were to take off, and that this would create more difficulties for the BistDoab area which was already facing a sinking spring level” (p49).
“Thus almost every aspect of the original conception has undergone some change, and to that extent hasaffected the rationale of the project design” (Raj, 1960: 66).
“Over a longer period, the benefits of irrigation in this area will depend to a large extent on preventingseepage of water into the soil on the scale that is normally likely to take place. For such seepage wouldraise the level of the sub-soil water, cause waterlogging, and damage the structure of the soil. This hashappened on a very extensive scale in West Punjab (now in Pakistan), where the soil conditions are similar.To prevent this, some further investment will be necessary for lining the smaller canals and water coursesand for constructing drains… Then there also the areas with soils having a high salt and alkaline content,which will need to be reclaimed before being put under normal cultivation. Without a more detailedtechnical appraisal of these requirements, it is therefore difficult to venture an estimate of the furthersupplementary investment that may be necessary for the full utilisation of the irrigation facilities offered bythe project” (Raj, 1999: 106).
“It would also appear that, at the margin, there were in fact some alternatives open from the technical pointof view, even in the case of Bhakra Nangal project, and that some of them might have been preferred if thecriteria indicated in this study had been kept in mind from the beginning. Thus, if the nature of the demandfor power in the more distant areas covered by the project had been carefully investigated, and moreadequate weight given, in the implementation of the project, to the need for avoiding locking-up ofresources over long periods, other sources of power might have been considered….” (Raj, 1960: 127).
“It is here that one feels most doubtful whether the implications of the choice were gone into adequately,either at the time when the original estimates regarding water releases were made, or when they weresubsequently altered. We have noticed earlier that, in the Punjab, it was not the supply of water that was

World Commission on DamsThematic Review: Assessment of Irrigation Options in India, Draft #1, Date: 08/11/1999
This is a draft working paper of the World Commission on Dams. It was prepared for the commission as part of its informationgathering activity. The views, conclusions and recommendations are not intended to represent the views of the Commission.
sought to be adjusted to a desired change in crop pattern but the other way round. Similarly, the forecasts ofpower demand in the region have not only been revised frequently, but no study appears to have been madeas to the difference that would be made to industrial production by the provision of cheaper hydro electricpower, or the kind of industries which, if set up, would make possible the fullest utilisation of the powermade available by the project. The decisions of the project authorities, at each stage, thus seem to havebeen largely in the nature of ad hoc decisions taken in response to problems as they emerged, withoutadequate consideration of their consequences” (Raj, 1960: 128).
“It is thus fairly clear that the irrigation facilities originally promised were somewhat in excess of whatcould be actually provided… It would seem, therefore, that it might have been worthwhile to provideassured supplies of water to a smaller area than to cover a larger area with less assurance regarding thesupplies likely to be available. The revisions necessitated by the changes in outlook on the power side arelikely to have adverse effects on irrigation.”
“The figure which has often been used to indicate the power potential of the project is that of the proposedinstalled capacity, which is over 1 million kW. Unlike in the case of most other projects, the actual firmpower that can be supplied by the Bhakra Nangal project is considerably lower than its installed capacityfor generating power, on account of the large variations in the operating head of the turbines. That, on thebasis of the water flows required to meet the commitments made in regard to irrigation, even the estimatedfirm power of 400,000 kW could not be generated appears to have been recognised only towards theclosing stages of the First Five Year Plan. The correct estimate would have been at the most about 250,000kW at 100 % load factor. This has since been raised to 364,000 kW, presumably by changing the pattern ofwater releases.”
This “is about the project reports on the basis of which investment decisions are now taken. These reportsnot only give no indication of the various alternatives open from the technical point of view but oftenconceal more than they reveal. The economic implications of the projects are indicated in the most generalterms, and in ways in which any changes that are made later are not even obvious. Both the technical andeconomic implications of a project or project design are spelt out, if at all, only long after the basicdecisions have been taken, and very often only when required to justify some change involving moreexpenditure than originally indicated. On this basis, no considered decisions can be taken by those who arein charge of the larger policy questions and who are ultimately responsible for the decisions” (Raj, 1999:130).

World Commission on DamsThematic Review: Assessment of Irrigation Options in India, Draft #1, Date: 08/11/1999
This is a draft working paper of the World Commission on Dams. It was prepared for the commission as part of its informationgathering activity. The views, conclusions and recommendations are not intended to represent the views of the Commission.
Annexure 10Impact of various measures of Soil and Water Conservation
Contour Cultivation: Reports from World Bank funded projects in India suggest that this practicealone reduces surface runoff by 25%. Some available evidence on this aspect is given in table 10Abelow.
Contour bunding is one of the standard watershed measures to impound runoff so that the storedwater is applicable when slopes are less than 6%.
Table 10AImpact of Contour Farming on Crop Yields
Crop Rise in yield (%)Sorghum 35Potatoes 6Maize 46Barley 15Source: Shah, et al, 1998: 215
Table 10BImpact of Mechanical Structures on Crop Yields (kg/ha)
in Deep Black Soils at Bellary
Crop Unbunded Contour Bunded Graded Bunded Broad base terraceRabi Jowar 245 184 280 362Cotton 131 92 163 151Sufflower 192 117 215 583Source: Shah, et al, 1998: 217
Table 10CEffect of Grass Cover on Runoff and Soil Losseson 9% slope, Dehradun (Average for three years)
Treatment Rainfall (mm) Water Loss as% of Rainfall
Soil Loss as % ofControl
Cynodon dactylon 1250 27.1 1.34Natural Grass Cover 1250 21.2 0.65Bare fallow 1250 71.2 27.19Bare fallow ploughed (control) 1250 59.5 100.00Source: Shah, et al, 1998: 217
Similar impressive impacts of tillage practices, crop spacing, Mulching and water harvesting practiceson runoff, soil loss and crop yeilds can be seen as per results reported by Shah et al (1998: 217-21)

World Commission on DamsThematic Review: Assessment of Irrigation Options in India, Draft #1, Date: 08/11/1999
This is a draft working paper of the World Commission on Dams. It was prepared for the commission as part of its informationgathering activity. The views, conclusions and recommendations are not intended to represent the views of the Commission.
Annexure 11Siltation Data of Selected Reservoirs
Annual Rate of Silting in ha m/100 sq km
% Loss of storagecapacigy till 1975
Reservoirs Year ofImpou-ndment Assumed Observed % increase Dead Live Total
Bhakra (68) 1959 4.29 6.00 39.9 16.42 2.50 6.00Panchet (21) 1956 2.47 9.92 301.6 38.90 19.67 13.02Maithon (11) 1956 1.62 13.10 708.6 27.37 2.63 10.50Mayurakshi (27) 1955 3.61 20.09 456.5 44.50 9.00 13.00Matatila 1958 1.43 3.50 144.8 16.17 9.16 11.04Shivajisagar 1961 3.42 15.24 345.6 NA NA NATungabhadra (24) 1953 4.29 6.54 52.4 97.00 9.30 10.30Hirakud 1956 2.52 3.84 52.4 NA NA 7.80Gandhisagar 1960 3.61 10.05 178.4 30.60 1.33 4.30Ramganga (25) 1974 4.29 17.30 303.3 NA NA 0.67Kangsabati 1965 3.27 6.73 105.8 NA NA 2.24Ghad 1966 3.61 15.15 319.7 NA NA 28.10Dantiwada 1965 3.61 6.32 75.1 NA NA 4.33Ukai (34) 1971 1.47 4.97 238.1 NA NA 2.18Tawa 1974 3.61 8.10 124.4 NA NA 0.63Beas Unit II 1974 4.29 15.10 252.0 NA NA 0.68Source: Central Board of Irrigation and Power, as quoted by Singh (1997: 140-1)
Note: The figures in the Bracket next to the name of the project indicate the expected life of thereservoir as % of design life. These figures shockingly show that expected life in most cases is likelyto less than one third of the design life. For Nizam Sagar Project in AP (not mentioned in tableabove), the expected life is likely to be just 6% of the design life. These figures are all from WorldBank, 1991b: 75.

World Commission on DamsThematic Review: Assessment of Irrigation Options in India, Draft #1, Date: 08/11/1999
This is a draft working paper of the World Commission on Dams. It was prepared for the commission as part of its informationgathering activity. The views, conclusions and recommendations are not intended to represent the views of the Commission.
Annexure 12Value and Employment Generated per Unit Water Used
Value of Production Days of Employment generatedCrop Area (ha)irrigated with 300
ha cm of WaterFrom Areairrigated
Per unit ha cmof water used
From areairrigated
Per unit ha cmof water used
Sugarcane 1.0 25,000 83.33 360 1.20Grapes 1.5 90,000 300.00 2,160 7.20Fruits 1.5 45,000 150.00 1,080 3.60Vegetables 2.8 28,000 93.33 1,008 3.36Cotton 4.2 42,000 140.00 630 2.10Onion 4.2 50,400 168.00 1,680 5.60Rice 4.2 29,400 98.00 420 1.40Potato 7.1 106,500 355.00 1,278 4.26Wheat 8.5 34,000 113.33 1,020 3.40Maize 8.5 63,750 212.50 765 2.55Groundnut 10.6 56,175 187.25 963 3.21Sorghum 14.2 51,120 170.40 1,704 5.68Gram 20.0 50,000 166.67 1,800 6.00Millet 30.0 75,000 250.00 2,700 9.00Source: Gram Gaurav Pratisthan, as cited in Singh, 1997: 168
Notes: 1. 300 ha cm (100 cubic meters) is used as on ha of sugarcane takes that amount of water peryear in Maharashtra.2. While the above figures would be different today, the proportional representation given by abovefigures would not give much different figures.3. The above figures would also vary in different agro-climatic situations, but the proportionalrepresentation would not be very different. The point is that non water intensive crops generallyproduce more value and employment than Sugarcane, grapes, banana or paddy. As we write this,there is demand in India today (Oct. 28, 99) from the sugarcane lobby that sugar imports be bannedand permission to export 2 million tonnes of sugar be given.

World Commission on DamsThematic Review: Assessment of Irrigation Options in India, Draft #1, Date: 08/11/1999
This is a draft working paper of the World Commission on Dams. It was prepared for the commission as part of its informationgathering activity. The views, conclusions and recommendations are not intended to represent the views of the Commission.
Annexure Table 13Options for Irrigation Management
Regions Agro-climaticZones
Areas Covered Primary Measures forIntervention
Mountainousand HillRegions
WesternHimalayas
EasternHimalayas
8 hill districts of Uttar Pradesh,Jammu and Kashmir andHimachal Pradesh.7 sisters in Northeast, Sikkim,parts of Bihar, Jalpaiguri andDarjeeling in West Bengal
Renovation and construction ofwater diversion schemes, rainwaterretention structures anddevelopment of springs.
Plains Lower GangeticPlainMiddle GangeticPlain
Upper GangeticPlain
West Bengal
26 north districts of Bihar in thealluvial plains, 12 districts ofeastern UP plainsCentral and western UP plains.
Rehabilitation of old tanks selectionof appropriate sites for tank toalleviate flood inundation. Measuresfor recharge of ground water in dryzones.
Arid andSemi-aridRegions
Western DryRegion
9 dry desert districts ofRajasthan and parts of Gujarat.
In-situ conservation of waterthrough surface and sub-surfacestorage. Measures for recharge ofground water in dry zones.
Peneplains Eastern Plateauand hill regions
Central Plateauand hills
Western Plateauand hills
Southern Plateauand hills
Gujarat Plainsand hill division
Chotanagpur Plateau coveringparts of Bihar, West Bengal,Orissa and Madhya Pradesh.Bhandara and Gadchirolidistricts of Maharashtra.South Western UP, 25 districtsin Madhya Pradesh, Eastern andSouth-eastern Rajasthan22 districts of Maharashtra, 11districts in Madhya Pradesh andJhalawar district in Rajasthan.Telengana, Rayalseema,Chittoor district in AndhraPradesh, inland districts ofTamil Nadu and 14 plateaudistricts of Karnataka.Gujarat, Daman and Diu
Rehabilitation of existing tanks,check dams and percolation tanks torecharge of groundwater, andartificial recharge of ground watersin coastal regions.
CoastalPlains
Eastern CoastalPlains and hill
Western CoastalPlains and Ghatregion.
4 Coastal districts of Orissa, 5districts of Andhra Pradesh, 8districts of Tamil Nadu andPondicherry.Kerala, Kanyakumari and theNilgiris. 5 coastal districts ofKarnataka and 5 districtsMaharashtra.
Rehabilitation of Existing Tanks andimprovement in the diversion-basedirrigation structures.
Islands Islands Andaman and Nicobar, andLakshadweep Islands
Development of surface waterthrough storage and diversionssystem.
Source: Modification from Planning Commission Classification (cited in CSE, 1997:319).

World Commission on DamsThematic Review: Assessment of Irrigation Options in India, Draft #1, Date: 08/11/1999
This is a draft working paper of the World Commission on Dams. It was prepared for the commission as part of its informationgathering activity. The views, conclusions and recommendations are not intended to represent the views of the Commission.
Annexure Table 14Net Area Irrigated (in 000 Ha) by Sources in Himalayan States
CanalsStatesGovernmentCanals
PrivateCanals
TotalTank Wells
(includingtube wells)
OtherSources
Total
Jammu & Kashmir 130 159 289 3 3 15 310Himachal Pradesh - - - - 11 88 99UP Hill 108 - 108 5 118 592 823Arunachal Pradesh - - - - - 32 32Nagaland - - - - - 56 56Manipur - -- - - - 65 65Mizoram - - - - - 8 8Tripura 28 - 28 2 7 6 43Meghalaya - - - - - 50 50Sikkim - - - - - 16 16Total 266 159 425 10 139 928 1502Source: Bandyopadhayay, J., 1999.

World Commission on DamsThematic Review: Assessment of Irrigation Options in India, Draft #1, Date: 08/11/1999
This is a draft working paper of the World Commission on Dams. It was prepared for the commission as part of its informationgathering activity. The views, conclusions and recommendations are not intended to represent the views of the Commission.
Annexure 15Recharging Tubewells
A recharge tubewell is constructed by drilling a bore - hole of approximately 0.50 m diameter. Thecasing assembly is specifically designed to provide slotted sections against the aquifers. The depth ofthe recharge tubewell depends on the present depth of the bore-wells in the area. The depth of therecharge tubewell is normally 30 m below the depth of the water table. The space between the bore -hole and the pipe is filled with gravel, to act as a filter mechanism. An additional filter mechanism isprovided at the ground surface: a pit is dug around the tubewell, and is filled with small roundedboulders, stone chips and sand. The top 1 m of the casing assembly in this pit is blank and the slottedsection below this is wrapped with coir, then surrounded by a 10 cm gravel pack, and then topped bysand upto the filter bed. This filter clarifies the water entering the recharge well and makes sure thatthe water reaching the aquifer is of high quality (Raju, 1998a).
The number of fillings and quantity percolated in theRainwater structures in Rayan project
CD No. Capacity(cu.m.)
Quantity of water recharged in cubic metres.1989 1990 1991 1992 1994 1997
1 2280 5657 2422 2033 5358 6439 50002 114 2471 1165 1083 2679 4153 18003 1064 1889 1064 826 2281 4198 18004 1129 1430 1128 707 1978 4694 13005 763 1540 1528 776 1598 2906 14006 1750 1568 1750 1456 3509 6306 30007 1208 2365 1207 1006 2624 3872 20008 1547 2953 1547 1237 4156 5623 40009 689 1346 689 661 1509 2631 140010 420 876 420 304 420 1170 40011 3465 9422 3465 3323 8470 8470 750012 1888 3166 1888 1583 3861 8810 330013 3375 5940 5989 2970 3375 8760 450014 2856 6944 4985 2530 5388 8026 450015 4959 1319 4959 2050 12301 13596 1100016 2486 4054 2486 2372 6185 7982 500017 1228 2328 1226 1085 1228 4580 110018 1346 2246 2283 1132 3088 3596 2000PT-1 11098 8901 5750 - 16326 33078 30000PT-2 10080 - 31752 - 25325 44197 40000PT-3 20718 - 23248 - 12657 19933 15000PT-4 53800 - - - - - 175000Subsurface dyke 51507 - 103014 49907 100160 141644 85000
180820 66415 203965 77041 224476 344664 406000Rainfall (mm) 310 191 62 716 1014 611Source: Raju, 1998b

World Commission on DamsThematic Review: Assessment of Irrigation Options in India, Draft #1, Date: 08/11/1999
This is a draft working paper of the World Commission on Dams. It was prepared for the commission as part of its informationgathering activity. The views, conclusions and recommendations are not intended to represent the views of the Commission.
Annexure 16Irrigation and Water-Use Efficiency – Phase II Tanks of Tamil Nadu
Average ValuesPWD Tank Ex-Zamin Tank
Description Unit
Pre -Project
Post -Project
Pre –Project
Post –Project
Remarks
ConveyanceEfficiency
% 52.98 88.57 51.12* 75.99* *The difference is small dueto partial lining of channels.
Field ChannelEfficiency
% 67.21 83.58 76.23* 76.23* *No lining was done.
FieldApplicationEfficiency
% 77.35 80.76 80.89* 79.10* *Reduction is due toclimatic factors which leadto more percolation losses.
IrrigationEfficiency
% 27.33 59.76 31.90* 45.25* *This difference in smalldue to partial lining
Crop Yield Kg/ha 3362 4311 3250 2968* *Due to deficient rainfall.Water-useEfficiency
Kg/ha-cm
19.61 26.96 22.58* 24.14* The difference is small dueto poor tank storages.
Relative WaterSupply
No. 1.46 1.38 1.22 1.02* Due to the deficient rainfall.
CroppingIntensity
% 100.16 117.66 65.19* 37.3* Reduction due to poor waterstorage.
Net Return Rs. 6314.50 7732.0 3759.6• 1962.40• • Reduction due to waterscarcity.
Equity Ratio - 1.53 1.1s7 1.12 1.27Source: Centre for Water Resources and Ocean Management, 1997.

World Commission on DamsThematic Review: Assessment of Irrigation Options in India, Draft #1, Date: 08/11/1999
This is a draft working paper of the World Commission on Dams. It was prepared for the commission as part of its informationgathering activity. The views, conclusions and recommendations are not intended to represent the views of the Commission.
Annexure 17Some Specific M & M Projects
In what follows, some relevant information about some of the large irrigation projects is given to givean idea about the development effectiveness of some of the M & M projects in India. Minimuminformation is given and lot more could be added. More projects could also be added.
Gandhisagar Project
The project had been planned to irrigate 445,000 ha annually. 38 years after commissioning of the projectin 1960-61, a maximum of only 272,000 ha, a mere 61% of the planned area could be irrigated. Even thiscreation of irrigation did not increase agriculture production to the expectations envisaged. The factorsresponsible were poor drainage conditions leading to water logging, lack of on farm development,inadequate transport network, improper water management, unsatisfactory maintenance of canals andfield drains and lack of farmers’ participation (Gulati, 1999: 2-12).
Indira Gandhi Nahar Pariyojana
Even the US bureau of Reclamation, no prudent preservationist, noted that there had been no adequatesurveying, planning or acknowledgement of the extreme ecological and technological limits and dangersto make the desert bloom, as was conceived in case of IGNP. The desert – with its porous soils, deficientorganic matter, shifting sands, subsurface hardpan, extreme hot temperatures and high evaporation rates,circumspect drainage channels – might not be the best place to reroute half the Indus River System.
Goldman, 1994: 81
When confronted with severe water logging in IGNP irrigated areas in Rajasthan, the engineers admittedthat they had ‘forgotten’ to study the geological situation in the command area of IGNP. With more than33% of the command becoming waterlogged, the canal has caused grave ecological problems. TheRajasthan Groundwater department has estimated that by the year 2000, the extent of critical area (wherethe water table is less than two metres would be around 396,000 ha. Independent surveys carried out by aconsultancy organisation show that nearly 34% of the gross command area of 3544 sq kms has hard pansat shallow depths (Singh, 1997: 96-97).
Sharda Sayayak Irrigation system
Soon after the canal was inaugerated by the then Prime Minister Indira Gandhi, a very large part of areaon both sides of the canal got water logged and the poor farmers had no option but to shift from whatcultivation to fish rearing. The engineers then suggested that some 10,000 tubewells be dug in thecommand area to pump out the water. The then Chief Minister Shripad Mishra said that if he had theresources to dig 10,000 tubewells, where was the need for a canal (Singh, 1997: 95-96)?
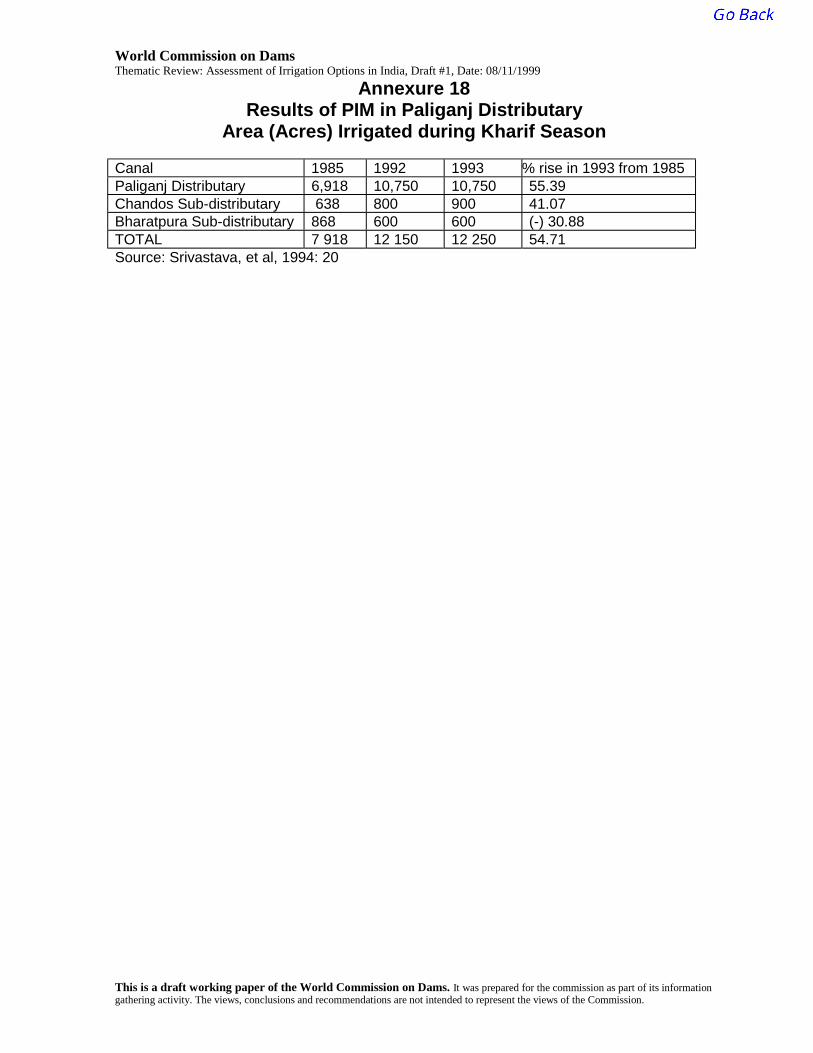
World Commission on DamsThematic Review: Assessment of Irrigation Options in India, Draft #1, Date: 08/11/1999
This is a draft working paper of the World Commission on Dams. It was prepared for the commission as part of its informationgathering activity. The views, conclusions and recommendations are not intended to represent the views of the Commission.
Annexure 18Results of PIM in Paliganj Distributary
Area (Acres) Irrigated during Kharif Season
Canal 1985 1992 1993 % rise in 1993 from 1985Paliganj Distributary 6,918 10,750 10,750 55.39Chandos Sub-distributary 638 800 900 41.07Bharatpura Sub-distributary 868 600 600 (-) 30.88TOTAL 7 918 12 150 12 250 54.71Source: Srivastava, et al, 1994: 20
Copyright © 2022 FDOKUMEN