EFFECT OF IRRIGATION AND LARGE DAMS ON THE BURDEN OF MALARIA ON A GLOBAL AND REGIONAL SCALE
15
EFFECT OF IRRIGATION AND LARGE DAMS ON THE BURDEN OF MALARIA ON A GLOBAL AND REGIONAL SCALE JENNIFER KEISER, MARCIA CALDAS DE CASTRO, MICHAEL F. MALTESE, ROBERT BOS, MARCEL TANNER, BURTON H. SINGER, AND JÜRG UTZINGER Swiss Tropical Institute, Basel, Switzerland; Department of Geography, University of South Carolina, Columbia, South Carolina; Saint Antony’s College, Oxford University, Oxford, United Kingdom; Water, Sanitation and Health, World Health Organization, Geneva, Switzerland; Office of Population Research, Princeton University, Princeton, New Jersey Abstract. Human-made ecologic transformations have occurred at an unprecedented rate over the past 50 years. Prominent among them are water resource development projects. An estimated 40,000 large dams and 800,000 small dams have been built, and 272 million hectares of land are currently under irrigation worldwide. The establishment and operation of water projects has had a history of facilitating a change in the frequency and transmission dynamics of malaria, but analyses of these environmental risk factors are sparse. Here, we present a comprehensive review of studies that assessed the impact of irrigation and dam building on malaria prevalence or incidence, stratified by the World Health Organization’s (WHO) sub-regions of the world, and link these studies with the latest statistics on disability adjusted life years, irrigated agriculture, and large dams. We also present estimates of the population at risk due to proximity to irrigation schemes and large dam reservoirs. In WHO sub-regions 1 and 2, which have 87.9% of the current global malaria burden, only 9.4 million people are estimated to live near large dams and irrigation schemes. In contrast, the remaining sub-regions concentrate an estimated 15.3 million people near large dams and up to 845 million near irrigation sites, while here only 12.1% of the global malaria burden is concentrated. Whether an individual water project triggers an increase in malaria transmission depends on the contextual determinants of malaria, including the epide- miologic setting, socioeconomic factors, vector management, and health seeking behavior. We conclude that in unstable malaria endemic areas, integrated malaria control measures, coupled with sound water management, are mandatory to mitigate the current burden of malaria in locations near irrigation or dam sites. INTRODUCTION Currently, more than two billion people live at risk of con- tracting malaria, and the estimated global annual incidence of clinical malaria is greater than 300 million cases. More than one million people die every year from the direct causes of malaria, with children less than five years of age living in sub-Saharan Africa at highest risk. 1 The disease accounts for an estimated loss of 46.5 million disability adjusted life years (DALYs) with almost 90% currently concentrated in sub- Saharan Africa. 2 Approximately 90% of this burden is related to environmental factors. 3 The establishment and operation of water resource development projects represents an impor- tant aspect of these factors, since dams and irrigation schemes transform ecosystems and can substantially change the nature of malaria risk proximal to their location. There is a substan- tial body of literature documenting the facilitation of in- creases in malaria incidence and prevalence as a consequence of such projects. 4 In 2001, the total area under irrigation worldwide was es- timated at 272 million hectares (ha) compared with 139 mil- lion ha in 1961 (http://apps.fao.org/page/collections?subset agriculture). Concurrently, it is estimated that at least 40,000 large dams (i.e., defined as impoundments more than 15 meters high or storing more than 3 million m 3 of water) and 800,000 small dams have been built worldwide. The ma- jority of the large dams serve irrigation purposes. Most of the large dams were constructed after 1950, during the post-war development era, when large-scale infrastructures were re- garded as symbols of patriotic pride and technological ad- vance. More than 400,000 km 2 have been inundated by res- ervoirs worldwide. 5 These ecologic transformations go hand- in-hand with the creation of new mosquito breeding sites. Water resources development is usually also coupled with demographic changes, and thus alters human-vector-parasite contact patterns. The potential for negative health impacts of water projects must also be juxtaposed with the positive effect that dams and irrigation schemes contribute substantially to renewable energy production, food security, and social and economic development. This, in turn, can provide rural households with greater capacity to purchase essential com- modities, including drugs and insecticide-treated nets (ITNs), as well as improved access to health care services and educa- tion. Reliable analyses of environmental risks to health are fun- damental for the prevention and control of diseases, for evi- dence-based guidance of health policy and planning, and for the promotion of intersectoral action for the reduction of transmission. However, to our knowledge, an in-depth analy- sis of the malaria burden attributable to the development and operation of water projects has not been carried out. In this report, we present the outcomes of a systematic review of the literature spanning the past 25 years by linking malaria prevalence and incidence data in relation to major water projects, with an emphasis on irrigation and large dams. The global database on the effect of small dams and flood control is inadequate to support generic conclusions from a systematic review. Our primary objectives are 1) to estimate the size of the populations at risk of malaria due to their proximity to irrigation schemes and large dams, and 2) to assess the impact of irrigation and large dams on the burden of malaria at global and regional scale. We use the 14 sub- regions articulated in the statistical analyses of the annual World Health Report of the World Health Organization (WHO). 2 In the next section, we describe our data sources and meth- odology for producing estimates of the sizes of at-risk popu- lations and the impact of large dams and irrigation schemes on the burden of malaria. Detailed illustrations of our calcu- lations are given in Appendix 1. After presenting our results in the subsequent section, we conclude with a discussion of a myriad of unresolved issues that need to be addressed if the Am. J. Trop. Med. Hyg., 72(4), 2005, pp. 392–406 Copyright © 2005 by The American Society of Tropical Medicine and Hygiene 392
-
Upload
independent -
Category
Documents
-
view
0 -
download
0
Transcript of EFFECT OF IRRIGATION AND LARGE DAMS ON THE BURDEN OF MALARIA ON A GLOBAL AND REGIONAL SCALE

EFFECT OF IRRIGATION AND LARGE DAMS ON THE BURDEN OF MALARIA ONA GLOBAL AND REGIONAL SCALE
JENNIFER KEISER, MARCIA CALDAS DE CASTRO, MICHAEL F. MALTESE, ROBERT BOS, MARCEL TANNER,BURTON H. SINGER, AND JÜRG UTZINGER
Swiss Tropical Institute, Basel, Switzerland; Department of Geography, University of South Carolina, Columbia, South Carolina;Saint Antony’s College, Oxford University, Oxford, United Kingdom; Water, Sanitation and Health, World Health Organization,
Geneva, Switzerland; Office of Population Research, Princeton University, Princeton, New Jersey
Abstract. Human-made ecologic transformations have occurred at an unprecedented rate over the past 50 years.Prominent among them are water resource development projects. An estimated 40,000 large dams and 800,000 smalldams have been built, and 272 million hectares of land are currently under irrigation worldwide. The establishment andoperation of water projects has had a history of facilitating a change in the frequency and transmission dynamics ofmalaria, but analyses of these environmental risk factors are sparse. Here, we present a comprehensive review of studiesthat assessed the impact of irrigation and dam building on malaria prevalence or incidence, stratified by the WorldHealth Organization’s (WHO) sub-regions of the world, and link these studies with the latest statistics on disabilityadjusted life years, irrigated agriculture, and large dams. We also present estimates of the population at risk due toproximity to irrigation schemes and large dam reservoirs. In WHO sub-regions 1 and 2, which have 87.9% of the currentglobal malaria burden, only 9.4 million people are estimated to live near large dams and irrigation schemes. In contrast,the remaining sub-regions concentrate an estimated 15.3 million people near large dams and up to 845 million nearirrigation sites, while here only 12.1% of the global malaria burden is concentrated. Whether an individual water projecttriggers an increase in malaria transmission depends on the contextual determinants of malaria, including the epide-miologic setting, socioeconomic factors, vector management, and health seeking behavior. We conclude that in unstablemalaria endemic areas, integrated malaria control measures, coupled with sound water management, are mandatory tomitigate the current burden of malaria in locations near irrigation or dam sites.
INTRODUCTION
Currently, more than two billion people live at risk of con-tracting malaria, and the estimated global annual incidence ofclinical malaria is greater than 300 million cases. More thanone million people die every year from the direct causes ofmalaria, with children less than five years of age living insub-Saharan Africa at highest risk.1 The disease accounts foran estimated loss of 46.5 million disability adjusted life years(DALYs) with almost 90% currently concentrated in sub-Saharan Africa.2 Approximately 90% of this burden is relatedto environmental factors.3 The establishment and operationof water resource development projects represents an impor-tant aspect of these factors, since dams and irrigation schemestransform ecosystems and can substantially change the natureof malaria risk proximal to their location. There is a substan-tial body of literature documenting the facilitation of in-creases in malaria incidence and prevalence as a consequenceof such projects.4
In 2001, the total area under irrigation worldwide was es-timated at 272 million hectares (ha) compared with 139 mil-lion ha in 1961 (http://apps.fao.org/page/collections?subset�agriculture). Concurrently, it is estimated that at least 40,000large dams (i.e., defined as impoundments more than15 meters high or storing more than 3 million m3 of water)and 800,000 small dams have been built worldwide. The ma-jority of the large dams serve irrigation purposes. Most of thelarge dams were constructed after 1950, during the post-wardevelopment era, when large-scale infrastructures were re-garded as symbols of patriotic pride and technological ad-vance. More than 400,000 km2 have been inundated by res-ervoirs worldwide.5 These ecologic transformations go hand-in-hand with the creation of new mosquito breeding sites.Water resources development is usually also coupled withdemographic changes, and thus alters human-vector-parasitecontact patterns. The potential for negative health impacts of
water projects must also be juxtaposed with the positive effectthat dams and irrigation schemes contribute substantially torenewable energy production, food security, and social andeconomic development. This, in turn, can provide ruralhouseholds with greater capacity to purchase essential com-modities, including drugs and insecticide-treated nets (ITNs),as well as improved access to health care services and educa-tion.
Reliable analyses of environmental risks to health are fun-damental for the prevention and control of diseases, for evi-dence-based guidance of health policy and planning, and forthe promotion of intersectoral action for the reduction oftransmission. However, to our knowledge, an in-depth analy-sis of the malaria burden attributable to the development andoperation of water projects has not been carried out.
In this report, we present the outcomes of a systematicreview of the literature spanning the past 25 years by linkingmalaria prevalence and incidence data in relation to majorwater projects, with an emphasis on irrigation and large dams.The global database on the effect of small dams and floodcontrol is inadequate to support generic conclusions from asystematic review. Our primary objectives are 1) to estimatethe size of the populations at risk of malaria due to theirproximity to irrigation schemes and large dams, and 2) toassess the impact of irrigation and large dams on the burdenof malaria at global and regional scale. We use the 14 sub-regions articulated in the statistical analyses of the annualWorld Health Report of the World Health Organization(WHO).2
In the next section, we describe our data sources and meth-odology for producing estimates of the sizes of at-risk popu-lations and the impact of large dams and irrigation schemeson the burden of malaria. Detailed illustrations of our calcu-lations are given in Appendix 1. After presenting our resultsin the subsequent section, we conclude with a discussion of amyriad of unresolved issues that need to be addressed if the
Am. J. Trop. Med. Hyg., 72(4), 2005, pp. 392–406Copyright © 2005 by The American Society of Tropical Medicine and Hygiene
392

impact of major water projects on the burden of malaria is tobe estimated with greater precision than is currently feasible.The requirement for such measurement is directly connectedto ongoing policy debates about the pressing need for defen-sible health impact assessments associated with developmentprojects quite generally.
MATERIALS AND METHODS
Systematic literature review. We systematically reviewedthe literature with an emphasis on research findings publishedover the past 25 years on any form of water resource devel-opment and management and its effect on the frequency andtransmission dynamics of malaria. Publications were searchedthrough Medline (National Institutes of Health, Bethesda,MD), the Environmental Sciences and Pollution Manage-ment Database (Cambridge Scientific Abstracts, Cambridge,MA) and the website of the World Commission on Dams(http://www.dams.org/). Pertinent dissertation abstracts, bookchapters, and unpublished documents (“gray literature”)were also consulted. We only included those studies that as-sessed malaria prevalence or incidence before and after theconstruction of a water project, or compared two or moresettings that primarily differed with regard to a water re-source development project.
Malaria-endemic countries according to WHO sub-regions. We used the recent WHO classification of countriesinto 14 epidemiologic sub-regions, which is based on a com-bination of WHO regions, and child and adult mortality rates,as described in the annexes of the annual World Health Re-port.2 From this list we included only those countries with
high and moderate malaria transmission and excluded coun-tries with sporadic malaria risk (e.g., Kazakhstan). The coun-tries included in our review are located in 10 of the 14 sub-regions in the WHO classification and are listed in Table 1.
Irrigated areas and affected population. For each countrywe compiled data on the total, agricultural, irrigated, andrice-harvested areas, and the potential area for irrigation us-ing the latest Food and Agricultural Organization (FAO) da-tabases (http://www.fao.org). We calculated the sum of theareas for each individual sub-region using data for the year2000. Data on DALYs and the total population were ob-tained from the World Health Report.2
We gathered statistics on population assigned to mixed ir-rigation schemes (areas that combine cropping with livestockwith at least 10% of the area irrigated) from a global data setof irrigated areas.6 To have a second range (since the irriga-tion population provided by Thornton and others6 might beoverestimated by a factor as high as 10), we based our calcu-lations on the irrigated area of each country and a hypotheti-cal average population density of 200 people/km2 in the irri-gated areas. The later figure is justified as follows. Althoughrural population densities vary from province to province andcountry to country, in general irrigation schemes are well-developed and highly attractive areas, and the villages mightbe even overcrowded. For example, in the Bura and Mweairrigation schemes in Kenya, population densities of 223people/km2 and 320 people/km2 have been reported, whereasthe overall population density in Kenya is several-fold lower,namely 54 people/km2 as of 2002.7,8
To determine the population living in proximity to irriga-tion schemes in malaria-endemic areas, we retrieved data foreach country on the percentage of the population living in
TABLE 1Countries included in our analysis based on World Health Organization (WHO) epidemiologic sub-regions and propensity for malaria
transmission*
AfricaPercentages of the population in malaria endemic areas available at http://www.rbm.who.int/amd2003/amr2003/table6.htmWHO sub-region 1: Angola, Benin, Burkina Faso, Cameroon, Chad, Comoros, Equatorial Guinea, Gabon, Gambia, Ghana, Guinea, Guinea-Bissau, Liberia, Madagascar, Mali, Mauritania, Niger, Nigeria, Sao Tome and Principe, Senegal, Sierra Leone, TogoWHO sub-region 2: Botswana, Burundi, Central African Republic, Congo, Côte d’lvoire, Democratic Republic of the Congo, Eritrea,Ethiopia, Kenya, Malawi, Mozambique, Namibia, Rwanda, Swaziland, Uganda, (South Africa), United Republic of Tanzania, Zambia,Zimbabwe
The AmericasPercentages of the population in malaria endemic areas available at http://165.158.1.110/english/hcp/hctmalaria.htmWHO sub-region 4: (Argentina), Belize, Brazil, Colombia, Costa Rica, Dominican Republic, French Guiana, Guyana, Honduras, Mexico,(Panama), Paraguay, (Suriname), (Venezuela)WHO sub-region 5: Bolivia, (Ecuador), Guatemala, Haiti, Nicaragua, Peru
Eastern MediterraneanPercentages of the population in malaria endemic areas available at http://www.emro.who.intWHO sub-region 6: Saudi ArabiaWHO sub-region 7: Afghanistan, Djibouti, (Islamic Republic of Iran), (Iraq), (Somalia), Sudan, Pakistan, Yemen
EuropePercentages of the population in malaria endemic areas available at http://www.emro.who.int/rbm/meetings/muscat02/Presentations/Sunday/Malaria%20Situation%20in%20EUR%20(M.Ejov).pptWHO sub-region 9: Georgia, Tajikistan, Turkey, (Uzbekistan)
Southeast AsiaPercentages of the population in malaria endemic areas available at http://whqlibdoc.who.int/searo/2002/SEA_MAL_229.pdfWHO sub-region 11: Indonesia, Sri Lanka, (Thailand)WHO sub-region 12: Bangladesh, (Bhutan), Democratic People’s Republic of Korea, India, Myanmar, Nepal
Western PacificPercentages of the population in malaria endemic areas available at http://www.wpro.who.int/themes_focuses/theme1/focus2/t1f2country.aspWHO sub-region 14: Cambodia, (China), Lao People’s Democratic Republic, (Malaysia), Papua New Guinea, (Philippines), Solomon Islands,Viet Nam
* Countries in parentheses have < 20% of the population at risk of malaria.
IRRIGATION AND LARGE DAMS AND MALARIA BURDEN 393

malaria risk areas. The sources of these data are given inTable 1. We then determined for each country the populationat risk by multiplying the sizes of the irrigation populations bythe fraction of the population living in malaria-endemic areas.
Populations at risk of malaria due to their proximity toreservoirs of large dams. Components of dam sites includethe reservoir, upper catchment area, irrigation schemes, andflood plains. To estimate the size of the at-risk populations ofmalaria, we focus on the environment immediately surround-ing the reservoir.
In a first step, we got an estimate of the population densitynear dam sites stratified by WHO sub-regions that are en-demic for malaria by collecting information on displacementand resettlement of population in relation to the size of thereservoir for many dams for 8 of the 10 relevant sub-regions(Table 2).9,10 For each individual dam we standardized thecalculated population density according to the year 2000, us-ing the average annual rate of change of the rural popula-tion.11 We then calculated the median for each relevant WHOsub-region.
In a second step, we collected data on the area of the res-ervoirs and the length of the dam for WHO sub-regions 1 and2 by consultation of the World Register of Dams. For theSouth African dams, we used the geo-referenced database onAfrican dams (FAO; http://www.fao.org) and the malaria riskmap generated by the “Mapping Malaria Risk in Africa”(MARA; http://www.arma.org.za) to examine, which of thedams are located in the malaria-endemic area.
Figure 1 shows how we estimated the area of risk near damreservoirs. A detailed description of our calculations of theat-risk populations of malaria and 2 examples are given inAppendix 1.
RESULTS
Causal web. The various levels of causality between ma-laria and different types of water projects are shown in Figure2. As detailed earlier, the current review focuses on irrigationschemes and large dam sites. In principle, proximity to a dam,including command areas and/or an irrigation scheme, impliesproximity to new bodies of standing water that can serve asAnopheles larval development sites. Whether this general ex-pectation is realized largely depends on the ecology of thelocal vectors. In particular, it requires that the new bodies ofstanding water have pH, sunlight or shade, surrounding veg-etation, turbidity, etc., compatible with the larval habitats forat least one local vector species. Consequently, the creation ofnew breeding sites might have an effect on the developmentof vector species and survival rates, and tradeoffs among themin terms of their role in local transmission. In addition, damsand irrigation schemes operate in the presence of diversecombinations of preventive and curative interventions againstmalaria. The details of these intervention packages vary sub-stantially from one location to another in the malarious re-gions of the world. Interventions and also the social and eco-nomic changes that occur will affect the pool of parasites inhumans and the human-vector-parasite contact patterns.
Population density near large dam sites. We present dataon the number of displaced people in relation to the size ofthe reservoir for 71 large dams in Table 2. Between 1,000(Epupa dam, Namibia) and 1.2 million people (Three Gorgesdam, People’s Republic of China; currently under construc-
tion) have been, or will be, displaced due to large dam build-ing. When we standardized the populations from the year ofconstruction of the individual dams to the year 2000, we foundthat the densities are as low as 1.2 people/km2 and as high as2,478 people/km2. The median population density calculatedfor each relevant WHO sub-region ranges from 25.8 people/km2 in WHO sub-region 2 to 764 people/km2 in WHO sub-region 7.
Irrigated areas, large dam sites, malaria burden, and peopleat risk in endemic WHO sub-regions. Sub-Saharan Africa(WHO sub-regions 1 and 2). Table 3 summarizes estimatedDALYs lost due to malaria, total surface area, agriculturalarea, irrigated area, rice-harvested area, as well as total popu-lation, irrigation population, and irrigation population in ma-laria-endemic areas (“population at risk”). At present, irri-gated agriculture or rice harvested areas are marginal inWHO sub-regions 1 and 2 because they represent only0.2−0.5% of the total surface area. While some countries havevirtually no areas under irrigation (e.g., Central African Re-public � 0.02%), irrigation is more pronounced in others(e.g., South Africa � 1.5%). However, as irrigation providesan opportunity for agriculture in arid areas and stabilizesyields in regions with unpredictable rainfall (e.g., Sahel), ir-rigated areas continue to grow in sub-Saharan Africa: thepredicted irrigation potential of WHO sub-regions 1 and 2 is39.3 million ha (Table 3). This represents a 10-fold increase ofthe current irrigated area.
In sub-Saharan Africa 1,039 large dams have been con-structed, more than half of them are located in South Africa.Employing the geo-referenced database provided by FAO,we found that of the 539 South African dams only 25 arelocated in the malaria-endemic parts of the country. For 287large dams, information on the size of the reservoir and thelength of the dams is given in the World Register of Dams.12
These dams have a total reservoir size of 24,792 km2. Thecalculated mosquito risk area comprises 45,594 km2 from theborders of the reservoirs at full water level in endemic areas(Table 4 and Appendix 1).
Our literature review found 11 studies that have been car-ried out in areas of stable malaria transmission and 2 in un-stable malaria transmission areas in WHO sub-regions 1 and2 that compared malaria incidence or prevalence rates amongpeople living close to an irrigation project with those ob-served in distant villages (Table 5). The cross-village compari-sons assume that prior to the water project, the two sets ofsites were approximate ecologic replicates in terms of factorsinfluencing malaria transmission. None of the 11 studies instable transmission areas found a higher malaria prevalencein the irrigated villages compared with non-irrigated villages.For example, in the Kou valley in Burkina Faso, malariaprevalence rates ranged from 16% to 58% in an irrigatedvillage, compared with 35−83% in a non-irrigated village.13 Intwo study villages in Senegal, children were found to have amalaria prevalence of 8.7% in the irrigated village and 16.5%in the non-irrigated village.14 Furthermore, in Mali, a two-fold reduction in the annual malaria incidence was observedafter the implementation of irrigation, although rice cultiva-tion changed transmission from seasonal to perennial.15 Alower malaria incidence or prevalence in the irrigated villageswhen compared with non-irrigated villages (the so-called“paddies paradox”16) has been explained by improved socio-economic status, effective vector control programs, or
KEISER AND OTHERS394
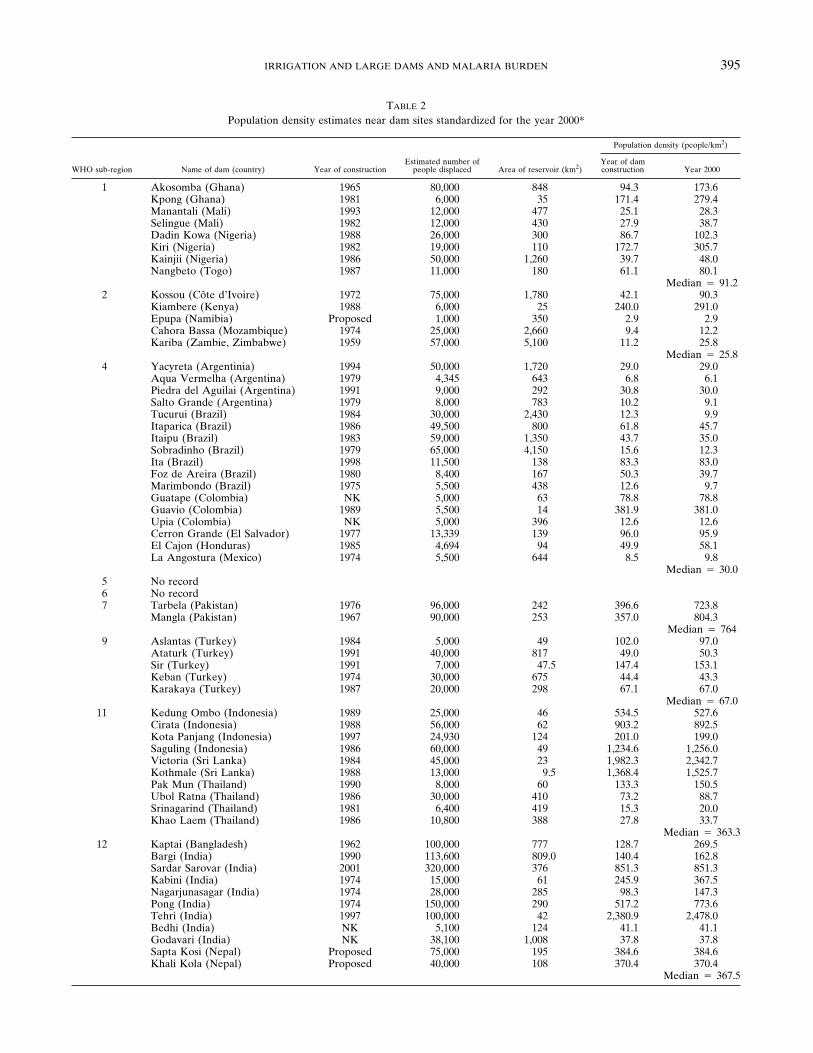
TABLE 2Population density estimates near dam sites standardized for the year 2000*
WHO sub-region Name of dam (country) Year of constructionEstimated number of
people displaced Area of reservoir (km2)
Population density (people/km2)
Year of damconstruction Year 2000
1 Akosomba (Ghana) 1965 80,000 848 94.3 173.6Kpong (Ghana) 1981 6,000 35 171.4 279.4Manantali (Mali) 1993 12,000 477 25.1 28.3Selingue (Mali) 1982 12,000 430 27.9 38.7Dadin Kowa (Nigeria) 1988 26,000 300 86.7 102.3Kiri (Nigeria) 1982 19,000 110 172.7 305.7Kainjii (Nigeria) 1986 50,000 1,260 39.7 48.0Nangbeto (Togo) 1987 11,000 180 61.1 80.1
Median � 91.22 Kossou (Côte d’Ivoire) 1972 75,000 1,780 42.1 90.3
Kiambere (Kenya) 1988 6,000 25 240.0 291.0Epupa (Namibia) Proposed 1,000 350 2.9 2.9Cahora Bassa (Mozambique) 1974 25,000 2,660 9.4 12.2Kariba (Zambie, Zimbabwe) 1959 57,000 5,100 11.2 25.8
Median � 25.84 Yacyreta (Argentinia) 1994 50,000 1,720 29.0 29.0
Aqua Vermelha (Argentina) 1979 4,345 643 6.8 6.1Piedra del Aguilai (Argentina) 1991 9,000 292 30.8 30.0Salto Grande (Argentina) 1979 8,000 783 10.2 9.1Tucurui (Brazil) 1984 30,000 2,430 12.3 9.9Itaparica (Brazil) 1986 49,500 800 61.8 45.7Itaipu (Brazil) 1983 59,000 1,350 43.7 35.0Sobradinho (Brazil) 1979 65,000 4,150 15.6 12.3Ita (Brazil) 1998 11,500 138 83.3 83.0Foz de Areira (Brazil) 1980 8,400 167 50.3 39.7Marimbondo (Brazil) 1975 5,500 438 12.6 9.7Guatape (Colombia) NK 5,000 63 78.8 78.8Guavio (Colombia) 1989 5,500 14 381.9 381.0Upia (Colombia) NK 5,000 396 12.6 12.6Cerron Grande (El Salvador) 1977 13,339 139 96.0 95.9El Cajon (Honduras) 1985 4,694 94 49.9 58.1La Angostura (Mexico) 1974 5,500 644 8.5 9.8
Median � 30.05 No record6 No record7 Tarbela (Pakistan) 1976 96,000 242 396.6 723.8
Mangla (Pakistan) 1967 90,000 253 357.0 804.3Median � 764
9 Aslantas (Turkey) 1984 5,000 49 102.0 97.0Ataturk (Turkey) 1991 40,000 817 49.0 50.3Sir (Turkey) 1991 7,000 47.5 147.4 153.1Keban (Turkey) 1974 30,000 675 44.4 43.3Karakaya (Turkey) 1987 20,000 298 67.1 67.0
Median � 67.011 Kedung Ombo (Indonesia) 1989 25,000 46 534.5 527.6
Cirata (Indonesia) 1988 56,000 62 903.2 892.5Kota Panjang (Indonesia) 1997 24,930 124 201.0 199.0Saguling (Indonesia) 1986 60,000 49 1,234.6 1,256.0Victoria (Sri Lanka) 1984 45,000 23 1,982.3 2,342.7Kothmale (Sri Lanka) 1988 13,000 9.5 1,368.4 1,525.7Pak Mun (Thailand) 1990 8,000 60 133.3 150.5Ubol Ratna (Thailand) 1986 30,000 410 73.2 88.7Srinagarind (Thailand) 1981 6,400 419 15.3 20.0Khao Laem (Thailand) 1986 10,800 388 27.8 33.7
Median � 363.312 Kaptai (Bangladesh) 1962 100,000 777 128.7 269.5
Bargi (India) 1990 113,600 809.0 140.4 162.8Sardar Sarovar (India) 2001 320,000 376 851.3 851.3Kabini (India) 1974 15,000 61 245.9 367.5Nagarjunasagar (India) 1974 28,000 285 98.3 147.3Pong (India) 1974 150,000 290 517.2 773.6Tehri (India) 1997 100,000 42 2,380.9 2,478.0Bedhi (India) NK 5,100 124 41.1 41.1Godavari (India) NK 38,100 1,008 37.8 37.8Sapta Kosi (Nepal) Proposed 75,000 195 384.6 384.6Khali Kola (Nepal) Proposed 40,000 108 370.4 370.4
Median � 367.5
IRRIGATION AND LARGE DAMS AND MALARIA BURDEN 395

changes in health-seeking behavior in the irrigated villages.17
In addition, as described earlier, the epidemiologic setting, inparticular the entomologic parameters, are key contextual de-terminants whether an irrigation project causes an increase inthe malaria incidence or prevalence. A water resource devel-opment project may also cause a change toward less endo-philic and anthropophilic malaria vectors, thereby resulting ina lower vectorial capacity, as for example the replacement ofAnopheles funestus by An. arabiensis.16 In addition, a greaterlarval competition in irrigated areas might result in reducedadult longevity. Furthermore, in irrigated villages in sub-Saharan Africa, high An. gambiae and An. arabiensis densi-ties were correlated with low anthropophily, a decrease in theparity rate, low sporozoite indices, and low mosquito survivalrates.18 Again, significant use of ITNs or antimalarial drugsdue to a greater wealth in irrigated villages, or a higher com-pliance to ITN use, often driven by the nuisance caused by ahigher mosquito density, might play an important part inthese findings.19 Another explanation for lower malaria trans-mission in irrigated villages might also be differing presenceof cattle in the villages. Domestic animals are often kept closeto the house and ITNs might divert mosquitoes away to theunprotected animals.17,19
In areas of unstable malaria transmission, the introductionof irrigation was found to place the non-immune populationat a high risk of acquiring the disease. It may alter malariatransmission from seasonal to perennial, and malaria ende-micity from mesoendemic to hyperendemic, as observed in
Rosso, Richard Toll, and Podor in the Senegal River Basin.20
Irrigated villages in the Rusizi Valley of Burundi, an area ofunstable malaria transmission, had higher malaria preva-lences and a 150-fold higher vectorial capacity of An. arabi-ensis compared with a neighboring non-irrigated village.21 InMadagascar, since 1878 several malaria epidemics have oc-curred on the plateau where rice is grown in monoculture. Ahuge increase in the level of malaria transmission in theserice-irrigated settings was found to be essentially related tothe proliferation of An. funestus, a much more anthropoph-agic and endophagic vector than An. arabiensis. The parityrate of An. funestus was greater than 75% throughout thewhole year.18
We found only three studies assessing the impact of largedams in WHO sub-regions 1 and 2 (Table 6). No malariatransmission was observed in a village near the Gleita dam inMauritania in 1984 in the fifth month of the dry season, al-though the malaria situation in the region is unstable.22 InCameroon, a malaria prevalence of 36% was observed nearthe Bamendjin dam compared with a malaria prevalence of25% in a village located 14 km away from the dam.23 Inaddition, year round malaria transmission was observed invillages near the Manantali dam reservoir in Mali, which werepreviously characterized by seasonal transmission.24
In addition, one study examined the effect of small dams: inthe unstable malaria transmission Tigray region of northernEthiopia at altitudes above 1,800 meters, numerous smalldams and irrigation systems were put in place with the broadaim of reducing dependence on rain-fed agriculture, and thusimproving food production. Comparative appraisal of a seriesof cross-sectional malaria surveys among children carried outin villages in close proximity to these newly constructed smalldams and in villages farther away showed a seven-fold in-crease in malaria risk for those residing near dams.25
We estimate that of the 637.3 million people living in WHOsub-regions 1 and 2, approximately 9 million people (1.4%)live close to irrigation schemes (Table 3). Approximatelytwo-thirds of these people live in malaria-endemic areas, andthus are at a risk of the disease. In addition, 3.1 million peopleare living near large dam sites in malaria endemic areas. InFigure 3, we depict these key numbers in relation to the ma-laria burden.
FIGURE 1. Estimation of the area at risk of malaria near damreservoirs.
TABLE 2Continued
WHO sub-region Name of dam (country) Year of constructionEstimated number of
people displaced Area of reservoir (km2)
Population density (people/km2)
Year of damconstruction Year 2000
14 Sambor (Cambodia) Proposed 5,120 880 5.7 5.7Strung Treng (Cambodia) Proposed 9,160 640 14.3 14.3Three Gorges (China) 1994–2008 1,200,000 1,084 1,107.0 1,107.0Shuikoi (China) 1993 67,000 94 712.8 695.0Yantan (China) 1995 40,000 121 330.6 322.1Dongiian (China) 1989 53,000 160 331.2 323.1Sanmenxia (China) 1960 319,000 799 399.2 591.8Wuqiangxi (China) 1996 306,000 170 1,800.0 1,746.0Longtan (China) 2005 73,392 370 198.3 198.3Nam Ngum (Lao PDR) 1994 4,400 58 75.9 83.2Nam Theun 2 (Lao PDR) 2007 (planned) 5,700 450 12.7 12.7Nam Ou 2 (Lao PDR) 2007 (planned) 26,200 107 244.8 244.8Hao Bin (Viet Nam) 1994 58,000 52,700 1.1 1.2
Median � 244.8* WHO � World Health Organization; NK � not known; PDR � People’s Democratic Republic.
KEISER AND OTHERS396

As the review of studies has shown and as depicted in Fig-ure 2, the impact of irrigation schemes or a large dam site onmalaria depends on several contextual determinants sincepersonal protective measures, access to effective treatment,and acquired immunity factors strongly counterbalance nega-tive effects. Although studies on large dam sites in sub-Saharan Africa are rare, we can conclude that irrigation pro-jects and dam sites in general might not present a risk toinhabitants of stable malaria areas, in particular when controlprograms have been launched simultaneously. It has recentlybeen estimated that approximately 10% of the African popu-lation lives in epidemic, unstable, malaria risk areas.26 Wetherefore assume that currently approximately 0.9 millionpeople live near irrigation and large dam sites in unstablemalaria transmission areas. Without the implementation ofmalaria control programs, inhabitants, particularly youngchildren, in these settings are at high risk of disease-associated morbidity and mortality. Since the irrigated area insub-Saharan Africa is anticipated to increase strongly, in par-ticular in arid and semi-arid environments, this number islikely to increase significantly.
Southeast Asia (WHO sub-regions 11 and 12). In contrastto WHO sub-regions 1 and 2, irrigated agriculture plays amuch greater role in southeast Asia: 10.6% of the total sur-face area is currently irrigated, mainly for rice production.The irrigated area is expected to further grow significantly,potentially up to 22.4% of the total area (Table 3). A total of4,431 large dams have been built in the selected countries ofWHO sub-regions 11 and 12; the large majority of them inIndia (n � 4,010) (Table 4). At maximum capacity the res-ervoirs constitute a total area of 53,265 km2. Between 145.1and 771 million people have been assigned to irrigationschemes, and 122.9–659.6 million (7.7–41.5% of the totalpopulation) live in malaria-endemic areas. We furthermoreestimate that 10.9 million people are at risk of malaria due tolarge dam sites (Figure 3). However, this number of people atrisk may be overestimated because dams and irrigationschemes are not distributed homogenously between malaria-endemic and non-endemic areas. For example, in the eastern
belt and coastal belt of India, characterized by large areasunder irrigation, the risk of acquiring malaria is very small.27
An estimated 6.0% of the estimated global malaria burdenrests in WHO sub-regions 11 and 12.2 Whether irrigation anddam sites present a risk factor for malaria in these sub-regionsagain depends on contextual determinants, which make theattribution of the fraction to these potential risk factors pres-ently impossible. First, there is a great diversity of vectors inWHO sub-regions 11 and 12 and several of these (e.g., siblingsof An. culicifacies or An. stephensi) have limited breeding inirrigated rice fields.27 Conversely, a shift in vector speciescomposition may occur. In addition, the review of studies inthese two WHO sub-regions has shown that the local setting,malaria endemicity, the deployment of control programs, andknowledge on the disease were key determining factors.
We retrieved studies that assessed the impact of surfaceirrigation projects in India28–31 or Sri Lanka.32–34 We are notaware of studies assessing the impact of irrigation on malariaprevalence or incidence in Bangladesh, Bhutan, Indonesia,Myanmar, Nepal, the People’s Democratic Republic Korea,or Thailand.
Sharma and others have analyzed data over a 21-year pe-riod, commencing in 1963 in 25 states of India, representingstate-wide annual parasite incidence and the area under riceirrigation. Significant positive associations were only found inthe two states of Punjab and Nagaland.27 However, paddycultivation did not cover a huge area and the relationship,which was generally poor, was only found when both sets ofdata were pooled at the state level.27,31 Studies focusing onindividual irrigation projects have demonstrated the impactirrigation has on malaria: after the implementation of theMahi-Kadana project in India, the annual parasite index in-creased from 0.01 in 1961 to 37.9 in 1976. As a consequence,a malaria control program was stepped up. Two years later,the annual parasite index in the Mahi-Kadana irrigation proj-ect had decreased to 11.4.29 In Meerut and Gurgaon, theincidence in canal irrigated villages increased up to nine-fold.28 Of particular concern are reports of malaria outbreaksdue to irrigation schemes from areas that have been only
FIGURE 2. Causal web (relationship between malaria and different types of water projects).
IRRIGATION AND LARGE DAMS AND MALARIA BURDEN 397

mildly prone to malaria, e.g., the Thar desert in the RajastanState of India. As many as 13 epidemic outbreaks have beenreported in this area up to 2002 because extensive irriga-tion has altered the physiography and malaria transmis-sion parameters. An. culicifacies, which was previously un-known in the desert, has taken over from the original vectors,causing a high percentage of the Plasmodium falciparum ma-laria.31
In Sri Lanka, a five-fold higher malaria incidence was re-ported following the introduction of the Mahaweli Systems Hand B.33 Another study comparing the malaria prevalences infour villages, two relatively new villages and two ancient vil-lages, of which two were irrigated and two non-irrigated,showed a prevalence of 4.8% in the irrigated compared with2.5% in the non-irrigated villages. However, the new villages,in irrigated but also non-irrigated areas, had much highermalaria prevalences compared with the old villages, whichwas explained by changing livelihoods, less knowledge on ma-laria, and fewer personal protection measures in the new vil-lages.32 In a more recent study, irrigated rice cultivation in theUda Walawe region was found to have a lower malaria riskthan non-irrigated areas.34 As in the African cases discussedbefore, these claims also presume that the two groups of com-munities were approximate ecologic replicates prior to theintroduction of irrigation. Several studies have assessed theimpact on dam building in southeast Asia (Table 6). For ex-ample, the Bargi dam in India has been studied in consider-able detail: after the construction of the Bargi dam, a 2.4-foldincrease in malaria cases and a more than four-fold increasein annual parasite incidence among children were recorded invillages closer to the dam (head end) compared with moredistant villages (tail end). In addition, there was a strong in-crease in the prevalence rates in partially submerged villages,as seen from routinely collected malaria data in the nearbyhospital.35,36
Again, integrated vector management or other control in-terventions were found to have a strong influence on themalaria transmission parameters. For example, a study car-ried out in Uttaranchal, India comparing the parasitologicindices in a dam area with those in forest or plain areasshowed a prevalence and annual parasite incidence of 0 in thedam area. An elevated economic status, indoor residualspraying, and more awareness of malaria risk were reported
TA
BL
E3
Mal
aria
burd
en, i
rrig
ated
area
s,an
dpo
pula
tion
atri
skst
rati
fied
acco
rdin
gto
Wor
ldH
ealt
hO
rgan
izat
ion
(WH
O)
sub-
regi
ons
WH
Osu
b-re
gion
DA
LY
sdu
eto
mal
aria
in20
02*
(×10
3 )T
otal
surf
ace
area
(×10
3km
2 )†
Agr
icul
tura
lar
eain
2000
(×10
3km
2 )†
Are
ari
cepa
ddie
sin
2000
(×10
3km
2 )†
Irri
gate
dar
eain
2000
(×10
3km
2 )†
Pot
enti
alar
eafo
rir
riga
tion
(×10
3km
2 )†T
otal
popu
lati
onin
2002
(×10
6 )*
Est
imat
edpo
pula
tion
inir
riga
ted
agri
cult
ural
area
(×10
6 )‡P
opul
atio
nat
risk
(×10
6 )§
120
,070
(43.
2%)
9,70
23,
853
(39.
6%)
50.9
(0.5
2%)
20.0
(0.2
1%)
209.
2(2
.1%
)27
8.2
4.0
(1.4
%)
4.0
(1.4
%)
220
,785
(44.
7%)
9,18
44,
092
(44.
5%)
18.2
(0.2
0%)
24.7
(0.2
7%)
183.
5(2
.0%
)35
9.1
4.9
(1.4
%)
2.3
(0.6
%)
486
(0.2
%)
16,5
226,
397
(38.
7%)
50.1
(0.3
0%)
131.
7(0
.80%
)59
1.5
(3.6
%)
414.
826
.3–2
8.8
(6.3
–6.9
%)
12.0
–12.
9(2
.8–3
.1%
)5
25(0
.05%
)1,
650
889
(53.
8%)
9.5
(0.5
8%)
24.8
(1.5
0%)
253.
3(1
5.6%
)¶73
.84.
9–5.
4(6
.6–7
.3%
)3.
3–3.
5(4
.4–4
.7%
)6
92(0
.2%
)2,
150
1,73
7(8
0.0%
)N
ore
cord
16.2
(0.7
5%)
No
reco
rd23
.53.
2–3.
5(1
3.6–
14.9
%)
1.8–
2.0
(7.6
–8.5
%)
72,
158
(4.6
%)
7,23
03,
318
(45.
8%)
29.7
(0.4
1%)
341.
5(4
.7%
)10
5.9
(1.5
%)#
327.
868
.3–1
39.9
(20.
8–42
.6%
)47
.6–1
14.0
(14.
5–34
.7%
)**
920
(0.0
5%)
1,43
574
2(5
1.7%
)2.
0(0
.14%
)99
.6(6
.9%
)10
6.1
(7.3
%)
107.
419
.7–1
9.9
(18.
3–18
.5%
)4.
8–6.
2(4
.4–5
.8%
)11
502
(1.1
%)
2,48
365
9(2
6.5%
)22
3.8
(9.0
%)
104.
7(4
.2%
)27
5.2
(11.
4%)
298.
220
.9–1
32.3
(7.0
–44.
3%)
7.0–
61.1
(2.3
–20.
4%)
122,
275
(4.9
%)
4,42
22,
085
(47.
1%)
639.
4(1
4.5%
)63
6.0
(14.
4%)
1,24
8.6
(28.
2%)
1,29
1.5
127.
2–63
9.5
(9.8
–49.
5%)
117.
6–59
8.5
(9.1
–46.
3%)
1444
1(1
.0%
)11
,469
5,84
3(5
1.2%
)45
3.3
(4.1
%)
597.
6(5
.4%
)74
5.7
(6.5
%)
1,51
0.7
119.
5–92
8.4
(7.9
–61.
4%)
6.4–
46.8
(0.4
–3.1
%)
*So
urce
:Wor
ldH
ealt
hR
epor
t,20
042 .
†So
urce
:htt
p://w
ww
.fao.
org.
‡R
ange
obta
ined
from
“Map
ping
Peo
ple,
Liv
esto
ckP
rodu
ctio
nSy
stem
s,L
ives
tock
and
Pov
erty
—th
eG
loba
lP
ictu
re”
and
anes
tim
ated
popu
lati
onde
nsit
yof
200
peop
le/k
m2
inir
riga
ted
area
s.§
Mul
tipl
icat
ion
wit
hth
efr
acti
onof
popu
lati
onliv
ing
inm
alar
ia-e
ndem
icar
eas.
¶T
hepo
tent
ial
irri
gati
onar
eafo
rN
icar
agua
was
esti
mat
edfr
omda
taon
the
tota
lpo
tent
ial
cult
ivab
lear
ea.
#T
hepo
tent
ial
irri
gati
onar
eafo
rP
akis
tan
was
esti
mat
edfr
omth
eto
tal
pote
ntia
lcu
ltiv
able
area
;no
data
for
Afg
hani
stan
,Yem
en,D
jibou
ti,a
ndth
eIs
lam
icR
epub
licof
Iran
wer
ein
clud
ed.
**N
oda
taon
the
perc
enta
geof
the
popu
lati
onat
risk
was
avai
labl
efo
rIr
aq;w
ees
tim
ated
that
appr
oxim
atel
y20
%of
the
irri
gati
onpo
pula
tion
isat
risk
.
TABLE 4Number of large dams, estimated area of mosquito flight range, and
population at risk for the different malaria-endemic World HealthOrganization (WHO) sub-regions
WHOsub-region
Numberof largedams*
Estimated area of mosquito flight rangefor all dams in malaria-endemic area
at full water level (km2)Population at riskat full water level
1 179 28,932 2,638,5982† 346 16,662 429,8874 1,389 12,789 383,6705 60 2,823 98,837‡7 156 2,509 1,916,8769 656 8,053 539,577
11 346 967 351,21112 4,085 28,846 10,600,53714 1,974 5,626 1,377,245
Total 9,191 107,207 18,336,438* Source: World Register of large dams.12
† Only the 25 South African dams located in malaria-endemic areas have been included.‡ The population density of WHO sub-region 4 has been applied.
KEISER AND OTHERS398

TABLE 5Effect of irrigation on malaria prevalence and/or incidence in Africa (World Health Organization [WHO] sub-regions 1, 2, and 7)*
Study site,period, reference Population sample
Irrigation scheme orconstruction
Overall malaria prevalence and/or incidence
CommentIrrigated village Non-irrigated village
WHO sub-region 1Kou valley,
Burkina Faso,1985–198613
Children (ages 0–14years) from 31families
Rice fields Prevalence: 16%(May); 58%(October)
Prevalence: 35.4%(May); 82.5%(October)
High consumption ofchloroquine due tobetter socio-economic status
Kou valley,Burkina Faso57
2,362 individuals Rice fields Prevalence: 44.5%(January); 33.9%(October)
Prevalence: 60.5%(January); 58.5%(October)
Epidemiologic paradox:bed nets and shift inbiting behavior?
SEMRY ricedevelopment,Cameroon198158
924 individuals (all agegroups)
SENRY I, II:35,000-ha lakezone for ricedevelopment;5,300-ha rice
Prevalence: 3.0–7.6%(April) (3 villagesclose to lake andrice irrigation)
Prevalence: 3.1%(April) (50 kmfrom lake)
SEMRY II riceschemeMayo-DanaiCameroon1979–198559
4,611 children (ages2–9 years)
SENRY I, II:35,000-ha lakezone for ricedevelopment;5,300 ha rice
Before irrigation:Prevalence: 13.8%
(March 1979)After irrigation:Prevalence: 30.1%
(November 1979),11.5% (March1981), 7.1%(November 1981),12.9% (April 1985)
The Gambia,199160
1,465 children (ages1–4 years)
River Gambiaand riceswamps
Prevalence: 34.2% Prevalence:28.7–71.2%
Low prevalence ratesclose to productivebreeding sites (couldbe explained by useof bed nets)
Niono, Mali199515
3,669 children (ages0–14 years)
Rice irrigation Prevalence: 31.3%Annual incidence: 0.3
per 1,000
Prevalence: 46.5%Annual incidence:
0.7 per 1,000Senegal river
central valley,Senegal14
Children (ages 0–9years)
Rice irrigation Prevalence: 8.7%(July); 8.3%(November)
Prevalence: 16.5%(July); 7.1%(November)
No increase intransmission
Ferlo’s waterlaunching,Senegal, 199661
1,548 children (ages0–14 years)
Prevalence: 37.6%(September,October)
Prevalence: 34.3%(September,October)
Moyamba district,Sierra Leone,199162
1,106 individuals Rice swamps Prevalence 38.8–58%(several swampsites)
Prevalence: 57.1%
WHO sub-region 2Burundi, 198163 Not given Rice fields Prevalence: 24.4%
(February); 69.2%(June)
Prevalence: 4.5%(January); 29.6%(July)
Cote d’lvoire64 Rice productionsystems
Single cropping:annual malariaincidence: 0.6 per1,000
Double cropping:annual malariaincidence 0.8 per1,000
No irrigation:annual malariaincidence 0.9 per1,000
Different immunityacquisition within the3 rice agro-eco-systems, doublecropping systemextends malaria riskin the beginning ofthe dry season
Lower Moshiarea Tanzania1994–199517
2,951 children (ages1–4 years)
Rice fields andsugar canefields
Prevalence: 12.5%(rice field); 16.9%(sugar cane)
Prevalence: 29.4% Use of bed nets due toelevated socio-economic status
WHO sub-region 7Gezira, Sudan40 Population of Gezira:
estimated at 2million
Rice, groundnut,and vegetables
Before irrigation:malaria was not animportant healthproblem in thearea
After introduction ofirrigation: malariaprevalence upto 20%
* ha � hectare.
IRRIGATION AND LARGE DAMS AND MALARIA BURDEN 399

to be the main factors accounting for the lack of malariatransmission at the dam site.37 In addition, in Thailand, noincrease of malaria incidence was observed near the NongWai dam and the Ubol Ratana dam. However, this is prob-ably because all walls inside of houses were sprayed withDDT compared with the Srinagarind dam, where an increasein malaria prevalence was reported, but where there was nomention of any vector control measures.38,39
Eastern Mediterranean (WHO sub-regions 6 and 7). Irri-gated areas range from 0.04% of the total surface area inDjibouti, 0.45% in Somalia, 0.94% in Yemen, 1.5% in Sudan,4.6% in the Islamic Republic of Iran, 6.2% in Afghanistan,and 8% in Iraq to 22% in Pakistan. These percentages cor-respond to an estimated irrigation population ranging from0.09% in Yemen to 73% in Pakistan. We allocated between71.5 and 143.4 million people (with the great majority in Pak-istan) to irrigation (Table 3); 49.4–116 million of these live inmalaria-endemic areas.
There are 156 large dams located in these countries, whichreport malaria as a health problem and are part of WHOsub-region 7. The majority of these large dams are located inPakistan (n � 71) and the Islamic Republic of Iran (n � 66).We estimate that in these regions 1.9 million people livewithin the estimated mosquito flight range of 2,509 km2, andthus might be at risk of acquiring malaria (Table 4). We couldnot retrieve data on the size of the reservoirs for the 38 largedams in Saudi Arabia (WHO sub-region 6).
The Eastern Mediterranean (WHO sub-regions 6 and 7)have 4.8% of the current estimated global malaria burden.2
New water resource development projects were reported toincrease malaria transmission in Afghanistan and in theGezira scheme in Sudan.27,40 However, this data is insuffi-cient to determine the attributable fraction of irrigation andlarge dam sites to the malaria burden; thus, further studies arewarranted.
The Americas, Europe, and the Western Pacific sub-regions(WHO sub-regions 4, 5, 9, and 14). Only 1.3% of the globalmalaria burden is currently estimated to occur in WHO sub-regions 4, 5, 9, and 14.2 Irrigated areas account for less than1% (WHO sub-region 4) and up to 6.9% (WHO sub-region 9)of the total surface area, as shown in Table 3. A large popu-lation (170.4–982.5 million people) can be associated with ir-rigation. However, the majority of these individuals live inparts of the countries where no malaria transmission occurs(e.g., in the non-malarious parts of China); only 1.2–3.3% ofthe irrigation population (26.5–69.4 million people) is esti-mated to live in malaria-endemic areas.
A total of 4,079 large dams have been constructed in thecountries of WHO sub-regions 4, 5, 9, and 14 and are includedin our review. The countries with the highest number of largedams in these regions are China (n � 1,905), Turkey (n �625), Brazil (n � 594), and Mexico (n � 536). The reservoirareas range from 385 km2 (large dams of WHO sub-region 5)to 58,480 km2 (large dams of WHO sub-region 12). We esti-mate that a total of 2.3 million people are living close enoughto reservoirs in endemic areas; thus, they are at risk of malariatransmission (Table 4 and Figure 3).
We retrieved only three studies assessing the impact ofirrigation on the malaria incidence and prevalence in the se-lected countries of these WHO sub-regions. The first is arecent study conducted in a dry coastal area of Peru, wheremalaria incidence was found to be five-fold higher in villages
where houses were located closely to fields and irrigationcanals compared with villages in the dry areas.41 The secondstudy was carried out in the Lao People’s Democratic Repub-lic. The malaria infection rate was higher in villages sur-rounded by rice fields compared with non-irrigated villages.42
Finally, in Turkey, the implementation of a network of irri-gation channels and a subsequent domestic migration frommalaria-endemic regions to the area caused a serious epi-demic outbreak.43
The health impacts of three large Brazilian dams, namely 1)the Balbina power plant, 2) the Itaipú dam, and 3) the Tucu-ruí Hydropower dam have been studied in detail. We sum-marize data on the malaria incidence before and after theirconstruction in Table 6. An increase of malaria cases wasreported at all three sites.44–47 Overall, these studies showthat despite a limited malaria burden and a small populationat risk, irrigation and large dam sites might have a stronginfluence on disease parameters in WHO sub-region 4.
DISCUSSION
We have presented a systematic review of the literature toprovide numbers of the current population living at risk ofmalaria due to proximity to irrigated agro-ecosystems andlarge dams, and to assess the impact of these types of waterresource development on the burden of malaria at regionaland global scale. We have highlighted that the estimated totalpopulation living in proximity to the reservoirs of large damsin malaria-endemic areas is small, namely 18.3 million people,with the majority of them living in India. Conversely, as manyas 851.3 million people live in or close to irrigation systems inmalaria-endemic areas. In WHO sub-regions 1 and 2, where87.9% of the currently estimated global malaria burden isconcentrated, only 9.4 million people are living near largedam reservoirs and irrigation sites. In contrast, the remainingWHO sub-regions of the world, where malaria is also en-demic, have a maximum of 860.3 million people near largedam and irrigation sites, but here, only 12.1% of the globalmalaria burden rests.
It was not possible to quantify the attributable fraction ofthe malaria burden due to dam building and irrigation for theindividual WHO sub-regions (e.g., using the methodology ofcomparative risk assessment)48 due to many confounding fac-tors and the scarcity of the currently available global data-base. Sadly, even the extensive report authored by the WorldCommission on Dams, derived from 17 exhaustive reviews ondams, allocates a mere 2 pages to health.49 At a given loca-tion, if malaria incidence or prevalence data are availableboth before and after the introduction of a dam and/or anirrigation scheme, we can ascertain the impact of the envi-ronmental transformation. However, most extant studiesbased their results on the comparison of two villages. Care isneeded in the interpretation of these results because manystudies comparing malaria rates in villages proximal to a wa-ter resource development project with villages that are rela-tively distant do not give a clear picture of the extent to whichnearby villages were approximate ecologic matches/replicatesof the distant villages prior to the introduction of the waterresource project. There might be subtle differences in eco-logic, epidemiologic, and socioeconomic features; thus, result-ing in different transmission characteristics, even in neighbor-
KEISER AND OTHERS400

TA
BL
E6
Eff
ect
ofla
rge
dam
cons
truc
tion
onm
alar
iapr
eval
ence
orin
cide
nce
indi
ffer
ent
Wor
ldH
ealt
hO
rgan
izat
ion
(WH
O)
sub-
regi
ons
Stud
ysi
te,
peri
od, r
efer
ence
Pop
ulat
ion
sam
ple
Cha
ract
eris
tics
ofda
m
Mal
aria
prev
alen
ce/in
cide
nce
Bef
ore
cons
truc
tion
Aft
erco
nstr
ucti
on
WH
Osu
b-re
gion
1B
amen
djjin
dam
area
,C
amer
oon2
356
7in
divi
dual
sD
amw
ith
rete
ntio
nla
keco
mpl
eted
in19
74to
regu
late
Ede
ahy
droe
lect
ric
pow
er
Pre
vale
nce:
villa
gecl
ose
tola
ke(3
6%)
com
pare
dw
ith
dist
ant
villa
ge14
kmfr
omla
ke(2
5%)
Gle
ita
dam
,Mau
reta
nia
1984
22
525
indi
vidu
als
Dam
acro
ssG
orgo
lR
iver
com
plet
edin
1980
,com
pris
esre
tent
ion
lake
10km
long
and
15km
wid
eto
faci
litat
egr
avit
yir
riga
tion
.Dis
plac
emen
tof
9,00
0pe
ople
Uns
tabl
em
alar
iatr
ansm
issi
on(o
nly
duri
ngra
iny
seas
onJu
ly–S
epte
mbe
r)
Pre
vale
nce:
0%(f
ifth
mon
thof
dry
seas
on)
Mal
iM
anat
ali
dam
area
24
Man
atal
ida
mco
mpl
eted
in19
87to
prov
ide
hydr
opow
eran
dir
riga
tion
Seas
onal
tran
smis
sion
,lit
tle
tran
smis
sion
from
Janu
ary
toJu
lyP
reva
lenc
e:in
July
1994
upto
47%
arou
ndth
ela
ke,s
ugge
stin
gye
ar-r
ound
tran
smis
sion
,com
pare
dto
27.3
%an
d29
.6%
dow
nstr
eam
ofth
eda
m,
resp
ecti
vely
St.L
ouis
Dia
ma
dam
,Se
nega
l65
Dia
ma
dam
com
plet
ed19
86fo
rir
riga
tion
alon
gth
eri
ver
and
topr
even
tsa
line
wat
erfr
omfl
owin
gin
land
Gre
atup
war
dtr
end
innu
mbe
rof
mal
aria
case
sin
all
dist
rict
s,ho
wev
er,n
ogr
eate
rth
annu
mbe
rof
case
sin
resp
irat
ory
dise
ase
WH
Osu
b-re
gion
2K
enya
Tan
ari
ver
lake
area
66
Tan
aR
iver
lake
s(e
.g.,
Mas
inga
dam
1981
)A
ugus
t19
81:1
43ca
ses
inR
iaka
nau
heal
thce
nter
1981
–198
4:83
7ca
ses;
num
ber
ofca
ses
incr
ease
dan
nual
lyby
21%
WH
Osu
b-re
gion
4It
aipu
dam
,Par
ana
Stat
e,B
razi
l45
,46
Itai
puda
m(h
eigh
t�
176
met
ers,
leng
th�
1.5
km);
arti
fici
alla
keco
mpl
eted
in19
83
Mal
aria
was
epid
emic
wit
hse
ason
alep
isod
esaf
ter
floo
ding
even
ts.
1975
–197
6:th
epo
siti
vity
inde
xw
as1.
15%
,alt
houg
hit
incl
uded
som
em
unic
ipal
itie
sen
dem
icfo
rm
alar
iath
atw
ere
only
indi
rect
lyaf
fect
edby
Itai
pu
Pre
cari
ous
cont
rol
mea
sure
son
the
Par
agua
yan
side
cont
ribu
ted
toth
ein
trod
ucti
onof
case
son
the
Bra
zilia
nsi
de.
Num
ber
ofau
toch
thon
ous
case
s:B
razi
lian
side
:43
in19
86,1
,084
in19
89.
Par
agua
yan
side
:1,7
07in
1986
,4,8
83in
1989
Mal
aria
inci
denc
ein
crea
sed
in19
88,a
ndan
outb
reak
was
regi
ster
edin
1989
;thu
s,D
DT
spra
ying
was
rein
trod
uced
Bal
bina
pow
erpl
ant,
Pre
side
nte
Fig
ueir
edo
mun
icip
alit
y,B
razi
l44
Con
stru
ctio
nof
the
pow
erpl
ant
init
iate
din
1977
;res
ervo
irco
nstr
ucti
onco
mm
ence
din
1981
,pr
ojec
tbe
gun
oper
atio
nin
1989
.A
fter
regi
ster
ing
anan
nual
para
site
inde
x(A
PI)
of19
2.7
whe
nth
efi
rst
wor
kers
cam
eto
the
area
;con
trol
mea
sure
sw
ere
init
iate
d
In19
72th
epo
pula
tion
was
smal
lan
dth
epo
siti
vity
inde
xw
as0.
13.
Pos
itiv
ity
inde
xw
as6.
8in
1977
and
0.8
in19
82.
AP
Iw
as19
2.7
in19
77,1
31.1
in19
78,0
in19
80,7
.5in
1982
,and
4.4
in19
89
Tuc
uruí
Hyd
ropo
wer
,T
ucur
uím
unic
ipal
dist
rict
,Par
aSt
ate,
Bra
zil,
1975
47
Tuc
uruí
dam
for
hydr
opow
er.P
hase
Ico
nstr
ucti
onw
asst
arte
din
1975
and
was
com
plet
edin
1984
.Pha
seII
bega
nin
1998
.
106
posi
tive
case
sin
1962
and
251
in19
75.
AP
Iw
as29
.6in
1970
.
Num
ber
ofca
ses
incr
ease
daf
ter
cons
truc
tion
,pea
king
tom
ore
than
10,0
00ca
ses
in19
84.
AP
Iw
as60
.4in
1980
and
26.7
in19
96.
WH
Osu
b-re
gion
11K
hon
Kae
nP
rovi
nce,
Tha
iland
38
8,93
1in
divi
dual
sN
ong
Wai
dam
,Ubo
lR
atan
ada
mco
mpl
eted
1966
–196
7fo
rir
riga
tion
purp
oses
Pre
vale
nce
in19
67–1
968:
1.2%
(0.4
–2.1
%,
depe
ndin
gon
villa
ge).
In19
68–1
969:
0.6%
(0.2
–1.1
%,d
epen
ding
onvi
llage
).L
owpr
eval
ence
due
toD
DT
spra
ying
IRRIGATION AND LARGE DAMS AND MALARIA BURDEN 401

ing villages. In addition, the possible presence of multiplemalaria control interventions in the two sets of localitiesmakes clear interpretation of claims about impact of damsand irrigation schemes on at-risk population difficult to inter-pret, since most studies do not give sufficient attention to thisissue.
Our calculations depended on a number of assumptionsand they are therefore inevitably subject to a level of uncer-tainty. The possibility that we have overestimated the riskcannot be ruled out. First, we assumed that the whole popu-lation assigned to irrigation in malaria-endemic areas is at riskof the disease. However, not all forms of irrigation actuallypresent a risk for the local population. There are three com-mon classes of irrigation systems, namely 1) pressurized dis-tribution as in sprinkler or trickle systems, 2) gravity flowdistribution as in surface irrigation, and 3) subsurface irriga-tion. If they are well maintained, sprinkler irrigation, dripirrigation, and subsurface irrigation provide irrigation waterwithout creating suitable breeding sites for Anopheles vec-tors.50
Second, we did not include annual fluctuations of the waterlevel of the reservoir, which in turn has important implica-tions for the estimation of the population at risk from largedam sites. At the end of the low water period, the area of thereservoir, and thus the mosquito flight range area is, in gen-eral, considerably reduced. For example, the reservoir area ofthe Manantali dam in Mali decreases from 477 km2 to 275km2 at the minimum operating level of the dam.24 Further-more, not every dam reservoir might actually be a goodbreeding site for malaria vectors. Each Anopheles species ischaracterized by specific habitat preferences, including expo-sure to sunlight, turbidity of the water, presence of vegetation,pH, and nitrate and phosphate concentrations of the water.51
These environmental factors are specific for each dam and itsshoreline. In addition, settlement around the reservoirs mightnot be possible at certain locations due to topography andother reasons.
Third, we have assumed that the population densitiesaround dams are similar to the ones of the resettled commu-nities and that the population near the dam is subjected to thesame population growth as the rural areas of the respectivecountries. New villages might have been constructed furtheraway than the 2 km (estimated mosquito flight range, Appen-dix 1) from the dam sites and, consequently, the populationwould not be at risk attributable to the dam. Conversely, damsites are characterized by marked demographic impacts, inparticular during the construction and early operationalphases. These sites attract visitors, fishermen, and farmerswho often have low immunities to malaria. Thus, during con-struction, the population might be larger than before. As thedam ages, however, temporary workers leave and the popu-lation density consequently decreases.
Fourth, since a geo-referenced database exists only for theAfrican dams, it is difficult to determine the exact populationat risk from dams in countries that are only partially endemicfor malaria on the remaining continents. Without knowledgeof the geographic coordinates, we would have presumed that� 20% or more than 100 of the 539 South African large damsand their reservoirs are located in malaria-endemic areas. Inreality, however, only 25 (< 5%) of these are located in areaswhere malaria transmission occurs. Similarly, calculation ofthe irrigation population at risk in partially malaria-endemicK
anch
anar
iP
rovi
nce,
Tha
iland
39
602
indi
vidu
als
Srin
agar
ind
dam
com
plet
edin
1978
Pre
vale
nce
in19
72: 1
6%(p
relim
inar
ysu
rvey
)P
reva
lenc
ein
1976
: 25%
(on
dam
site
)
WH
Osu
b-re
gion
12Ja
balp
ur, B
argi
dam
35
,36
,67
2,01
6bl
ood
smea
rsfr
omfe
brile
case
s.1,
714
bloo
dsm
ears
from
febr
ileca
ses.
379
child
ren
for
mas
sbl
ood
surv
ey.
Act
ive
case
dete
ctio
nin
10vi
llage
s
Bar
gida
mm
ulti
purp
ose
hydr
opow
eran
dir
riga
tion
proj
ects
com
plet
edin
1988
Hos
pita
lpr
eval
ence
indr
yvi
llage
s:39
%.
Hea
lth
post
reco
rds
for
Nar
anya
nga
dist
rict
:184
case
sin
1979
Hos
pita
lpr
eval
ence
inpa
rtia
llysu
bmer
ged
villa
ges:
49.4
%;i
nsu
bmer
ged
villa
ges:
71.4
%.
Hea
lth
post
reco
rds
for
Nar
anya
nga
dist
rict
:4,2
79in
1996
.P
reva
lenc
e:38
%(m
ass
surv
eyof
child
ren)
Num
ber
ofca
ses
inhe
aden
d(4
4–50
kmfr
omda
m):
2.4-
fold
high
erco
mpa
red
tota
ilen
dvi
llage
s(7
5–78
km)
Utt
aran
chal
,Ind
ia3
756
bloo
dsm
ears
from
febr
ilepa
tien
tsin
dam
area
;272
info
rest
area
and
849
inpl
ain
area
Nan
akM
atta
dam
(cre
ated
swam
py,
mar
shy
cond
itio
ns)
Pre
vale
nce:
0%in
dam
area
com
pare
dto
48.5
%in
fore
stvi
llage
and
1.8%
inpl
ain
area
Tha
rde
sert
68
,69
Can
aliz
atio
npr
ojec
tw
ith
3m
ajor
cana
lsy
stem
s(G
ang,
Sirh
ind
feed
er,I
ndir
aG
hand
i)fo
rir
riga
tion
,hyd
ropo
wer
,w
ater
supp
ly
In19
61:8
,494
posi
tive
case
sin
Raj
asth
anst
ate
In19
94:2
29,7
72po
siti
veca
ses
inR
ajas
than
stat
e(p
opul
atio
nha
sin
crea
sed
by2.
5%)
Pre
vale
nce:
85%
(in
two
villa
ges
near
Indi
raG
hand
ica
nal;
thus
,rec
ent
foca
lm
alar
iaou
tbre
ak)
KEISER AND OTHERS402

countries is based on the assumption that the total populationand the population living near irrigation schemes are equallyat risk of the disease.
It is also conceivable that we might have underestimatedthe actual population at risk of malaria from water resourcedevelopment, which is justified on the following grounds.First, we could not include the impact of a large dam onmalaria downstream of the project site. However, the changeof the water regimen can stretch for many kilometers andstrongly influence larval breeding.
Second, it is unfortunate that no systematic inventory ofsmall dams and only very few studies assessing their cumula-tive impact on malaria are currently available. Their impacton the frequency and transmission dynamics of malaria couldbe significant because their total shoreline is much greaterwhen compared with large dams. For example, 1,110 Nigeriansmall dams were described to have an area of 400,000 hacompared with a surface area of 116,000 ha of 34 large dams.
Furthermore, an estimated 15,000 small dams have been con-structed in Zimbabwe, and more than 50,000 small dams werebuilt in Kenya within three years during the late 1950s.52
Finally, studies investigating the consequences of the con-struction of flood control, water projects for recreational pur-poses, or pumps and drains for water supply and sanitation onmalaria have, to our knowledge, not been conducted. It fol-lows that no estimates of their impact on malaria could bepresented in this review.
When irrigation schemes and dams are proximal to areas ofunstable transmission, integrated multiple-intervention ma-laria control holds promise for mitigation. In several of thestudies, which we have reviewed here, malaria control pro-grams, consisting mainly of early diagnosis and treatment,residual spraying, or distribution of ITNs, have been success-fully conducted. It is important to note that environmentalmanagement presents an additional option for malaria con-trol in such settings. For example, vector control by means of
FIGURE 3. Malaria burden and estimated at-risk populations due to proximity to irrigation and large dam sites in the different World HealthOrganization (WHO) sub-regions where malaria is endemic. DALYs � disability adjusted life years.
IRRIGATION AND LARGE DAMS AND MALARIA BURDEN 403

water management has been carried out with success for sev-eral decades, particularly in areas where malaria is unstable.The first studies on intermittently irrigated rice fields, whichled to greatly reduced Anopheles densities and often in-creased rice yields, were carried out more than 70 years ago.53
At the same time, elimination of mosquito breeding sites hasbeen achieved in rivers and streams of Sri Lanka and Malay-sia by means of different types of siphons and small dams.54
Significant reductions of Anopheles breeding sites has beenachieved in the reservoirs of the Tennessee River Valley byimplementation of several types of environmental and watermanagement measures. Among them was an integrated op-erating rule consisting of a fluctuation cycle with an amplitudeof 0.3 meters over 7−10-day periods.24,55
We conclude that future water resource development proj-ects should include in-depth assessment of potential healtheffects, positive or negative, including malaria, where this dis-ease is endemic. Indeed, institutionalization of health impactassessments for development projects quite generally, analo-gous to environmental impact assessments, would lead to in-formation requirements that could fill many of the data gapsdescribed in this report.56 Introduction of sound monitoringand surveillance systems proximal to such water projectswould facilitate systematic evaluation of the impact of theseecosystem interventions over time. This, in turn, wouldgreatly improve our understanding of the role of dams andirrigation systems in either promoting or reducing malariatransmission. In addition, mitigation strategies to alleviate po-tential negative health effects, of which malaria might be onlyone component, are mandatory to reduce the current burdenof malaria in settings near irrigation or dam projects, particu-larly in areas where malaria transmission is unstable.
Received April 9, 2004. Accepted for publication August 13, 2004.
Financial support: This work was part of the project Burden of Wa-ter-Related Vector-Borne Diseases: An Analysis of the Fraction At-tributable to Components of Water Resources Development andManagement, which was kindly funded by the World Health Orga-nization. Marcia Caldas de Castro is grateful to the Center for Healthand Wellbeing at Princeton University and Jennifer Keiser and JürgUtzinger to the Swiss National Science Foundation (Project no.PMPDB-106212 and PPOOB–102883) for financial support.
Authors’ addresses: Jennifer Keiser, Marcel Tanner, and Jürg Utz-inger: Swiss Tropical Institute, PO Box, CH-4002 Basel, Switzerland.Marcia Caldas de Castro Department of Geography, University ofSouth Carolina, Callcott Hall-125, Columbia, SC 29208. Michael F.Maltese, St. Antony’s College, Oxford University, Oxford OX2 6JF,United Kingdom. Robert Bos, Water, Sanitation and Health (WSH/PHE), World Health Organization, Avenue Appia 20, CH-1211Geneva 27, Switzerland. Burton H. Singer, Office of Population Re-search, Wallace Hall, Princeton University, Princeton, NJ 08544.
Reprint requests: Jennifer Keiser, Swiss Tropical Institute, PO Box,CH-4002 Basel, Switzerland, Telephone: 41-61-225-2666, Fax: 41-61-225-2678, E-mail: [email protected].
REFERENCES
1. Breman JG, 2001. The ears of the hippopotamus: manifestations,determinants, and estimates of the malaria burden. Am J TropMed Hyg 64 (Suppl): 1–11.
2. WHO, 2004. The World Health Report 2004 - Changing History.Geneva: World Health Organization.
3. WHO, 1997. Health and Environment in Sustainable Develop-ment. Geneva: World Health Organization.
4. Service MW, 1991. Agricultural development and arthropod-borne diseases: a review. Rev Saude Publica 25: 165–178.
5. Gujja B, Perrin M, 1999. A Place for Dams in the 21st Century.Discussion Paper. Washington, DC: World Wildlife Fund.
6. Thornton PK, Kruska RL, Henninger N, Kristjanson PM, ReidRS, Atieno F, Odero AF, Ndegwa T, 2002. Mapping Povertyand Livestock in the Developing World. London: Departmentfor International Development.
7. Mwadime RK, Omwega AM, Kielmann N, Korte R, 1996. Pre-dictors of nutritional status among participants in a rice irriga-tion scheme in Kenya. Ecol Food Nutr 35: 263–274.
8. Waiyaki PG, 1987. The history of irrigation development inKenya and the associated spread of schistosomiasis. Effects ofAgricultural Development on Vector-Borne Diseases. Seventhannual meeting of the Joint WHO/FAO/UNEP Panel of Ex-perts on Environmental Management for Vector Control.Rome: FAO, 23−26.
9. Cernea M, 1997. Hydropower Dams and Social Impacts. A So-ciological Perspective: Washington, DC: The World Bank.
10. Cernea M, 1997. African Involuntary Population Resettlement ina Global Context: Washington, DC: The World Bank.
11. United Nations, 2002. World Urbanization Prospects: The 2001Revisions. New York: Population Division Department ofEconomics and Social Affair of the United Nations.
12. International Commission on Large Dams, 1998. World Registerof Dams (computerized version). Paris: International Commis-sion on Large Dams.
13. Boudin C, Robert V, Carnevale P, Ambroise-Thomas P, 1992.Epidemiology of Plasmodium falciparum in a rice field and asavanna area in Burkina Faso. Comparative study on the ac-quired immunoprotection in native populations. Acta Trop 51:103–111.
14. Faye O, Fontenille D, Herve JP, Diack PA, Diallo S, Mouchet J,1993. Malaria in the Saharan region of Senegal. 1. Entomo-logical transmission findings. Ann Soc Belg Med Trop 73: 21–30.
15. Sissoko MS, Dicko A, Briet OJ, Sissoko M, Sagara I, Keita HD,Sogoba M, Rogier C, Touré YT, Doumbo OK, 2004. Malariaincidence in relation to rice cultivation in the irrigated Sahel ofMali. Acta Trop 89: 161–170.
16. Ijumba JN, Lindsay SW, 2001. Impact of irrigation on malaria inAfrica: paddies paradox. Med Vet Entomol 15: 1–11.
17. Ijumba JN, Shenton FC, Clarke SE, Mosha FW, Lindsay SW,2002. Irrigated crop production is associated with less malariathan traditional agricultural practices in Tanzania. Trans R SocTrop Med Hyg 96: 476–480.
18. Marrama L, Jambou R, Rakotoarivony I, Leong Pock Tsi JM,Duchemin JB, Laventure S, Mouchet J, Roux J, 2004. Malariatransmission in southern Madagascar: influence of the envi-ronment and hydro-agricultural works in sub-arid and humidregions. Part 1. Entomological investigations. Acta Trop 89:193–203.
19. Dolo G, Briet OJT, Dao A, Traoré SF, Bouaré M, Sogoba N,Niare O, Bagayogo M, Sangare D, Teuscher T, Toure YT,2004. Malaria transmission in relation to rice cultivation in theirrigated Sahel of Mali. Acta Trop 89: 147–159.
20. USAID, 1994. Senegal River Basin Health Master Plan Study.Washington, DC: United States Agency for International De-velopment.
21. Coosemans M, Mouchet J, 1990. Consequences of rural develop-ment on vectors and their control. Ann Soc Belg Med Trop 70:5–23.
22. Baudon D, Robert V, Darriet F, Huerre M, 1986. Impact ofbuilding a dam on the transmission of malaria. Malaria surveyconducted in southeast Mauritania. Bull Soc Pathol Exot Fil-iales 79: 123–129.
23. Atangana S, Foumbi J, Charlois M, Ambroise-Thomas P, RipertC, 1979. Epidemiological study of onchocerciasis and malariain Bamendjin dam area (Cameroon). Malacologic fauna andrisks of schistosomian introduction. Med Trop (Mars) 39: 537–543.
24. Jobin WR, 1999. Dams and Disease: Ecological Design andHealth Impacts of Large Dams, Canals, and Irrigation Systems.London: Routledge.
25. Ghebreyesus TA, Haile M, Witten KH, Getachew A, YohannesAM, Yohannes M, Teklehaimanot HD, Lindsay SW, Byass P,1999. Incidence of malaria among children living near dams in
KEISER AND OTHERS404

northern Ethiopia: community based incidence survey. BMJ319: 663–666.
26. Snow RW, Craig M, Deichmann U, Marsh K, 1999. Estimatingmortality, morbidity and disability due to malaria among Af-rica’s non-pregnant population. Bull World Health Organ 77:624–640.
27. Sharma VP, Srivastava A, Nagpal BN, 1994. A study of the re-lationship of rice cultivation and annual parasite incidence ofmalaria in India. Soc Sci Med 38: 165–178.
28. Sharma VP, Uprethy HC, 1982. Preliminary studies on irrigationmalaria. Indian J Malariol 19: 139–142.
29. Jayaraman TK, 1982. Malaria impact of surface irrigation pro-jects: a case study from Gujarat, India. Agric Environ 7: 23–34.
30. Mistry JF, Purohit MU, 1990. Environmental effects of the Mahi-Kadana and Dharoi projects at Gujarat, India. Water Re-sources J 164: 93–97.
31. Tyagi BK, 2004. A review of the emergence of Plasmodium fal-ciparum-dominated malaria in irrigated areas of the Thar Des-ert, India. Acta Trop 89: 227–239.
32. Dixon RA, Pinikhana JP, 1994. Malaria and proximity to irriga-tion projects: a parasitaemia prevalence study from Sri Lanka.Mosq Borne Dis Bull 11: 116–121.
33. International Irrigation Management Institute, 1986. Proceedingsof the Workshop on Irrigation and Vector-Borne DiseaseTransmission. Colombo, Sri Lanka: International IrrigationManagement Institute.
34. Klinkenberg E, van der Hoek W, Amerasinghe FP, 2004. A ma-laria risk analysis in an irrigated area in Sri Lanka. Acta Trop89: 215–225.
35. Singh N, Mehra RK, Sharma VP, 1999. Malaria and the Nar-mada-river development in India: a case study of the Bargidam. Ann Trop Med Parasitol 93: 477–488.
36. Singh N, Mishra AK, 2000. Anopheline ecology and malariatransmission at a new irrigation project area (Bargi Dam) inJabalpur (central India). J Am Mosq Control Assoc 16: 279–287.
37. Shukla RP, Sharma SN, Kohli VK, Nanda N, Sharma VP, Sub-barao SK, 2001. Dynamics of malaria transmission underchanging ecological scenario in and around Nanak Matta Dam,Uttaranchal, India. Indian J Malariol 38: 91–98.
38. Harinasuta C, Jetanasen S, Impand P, Maegraith BG, 1970.Health problems and socio-economic development in Thai-land. Southeast Asian J Trop Med Public Health 1: 530–552.
39. Bunnag T, Sornmani S, Pinithpongse S, Harinasuta C, 1979. Sur-veillance of water-borne parasitic infections and studies on theimpact of ecological changes on vector mosquitoes of malariaafter dam construction. Southeast Asian J Trop Med PublicHealth 10: 656–660.
40. el Gaddal AA, Haridi AAM, Hassan FT, Hussein H, 1985. Ma-laria control in the Gezira-Managil irrigated scheme of theSudan. J Trop Med Hyg 88: 153–159.
41. Guthmann JP, Llanos-Cuentas A, Palacios A, Hall AJ, 2002.Environmental factors as determinants of malaria risk. A de-scriptive study on the northern coast of Peru. Trop Med IntHealth 7: 518–525.
42. Kobayashi J, Somboon P, Keomanila H, Inthavongsa S, Nam-banya S, Inthakone S, Sato Y, Miyagi I, 2000. Malaria preva-lence and a brief entomological survey in a village surroundedby rice fields in Khammouan province, Lao PDR. Trop MedInt Health 5: 17–21.
43. Gratz NG, 1987. The effect of water development programmeson malaria and malaria vectors in Turkey. Effects of Agricul-tural Development on Vector-Borne Diseases. Seventh AnnualMeeting of the Joint WHO/FAO/UNEP Panel of Experts onEnvironmental Management for Vector Control. Rome: FAO,27−28.
44. Chagas JA, Barroso MAB, Amorim RD, Robles CRQ, 1982.Controle da malária em projeto hidrelétrico no Estado doAmazonas. Rev Bras Malariol Doencas Trop 34: 68–81.
45. Consolim J, Luz E, Pellegrini NJ, Torres PB, 1991. The Anoph-eles (Nyssorhynchus) darlingi root, 1926 and malaria in theItaipú lake, Paraná, Brazil: a revision. Arq Biol Tecnol 34:263–286.
46. Hunter JM, 1993. Parasitic Diseases in Water Resources Develop-
ment: The Need for Intersectoral Negotiation. Geneva: WorldHealth Organization.
47. World Commission on Dams, 2000. Tucurui Hydropower Com-plex Brazil. Cape Town, South Africa: World Commission onDams.
48. Ezzati M, Lopez AD, Rodgers A, Vander Hoorn S, Murray CJM,Comparative Risk Assessment Collaborating Group, 2002. Se-lected major risk factors and global and regional burden ofdisease. Lancet 360: 1347–1360.
49. Sleigh AC, Jackson S, 2001. Dams, development, and health: amissed opportunity. Lancet 357: 570–571.
50. Amerasinghe FP, 1987. Changes in irrigation techniques as ameans to control disease vector production. Effects of Agricul-tural Development on Vector-Borne Diseases. Seventh AnnualMeeting of the Joint WHO/FAO/UNEP Panel of Experts onEnvironmental Management for Vector Control. (Rome:FAO), 82−86.
51. van der Hoek W, Amerasinghe FP, Konradsen F, AmerasinghePH, 1998. Characteristics of malaria vector breeding habitatsin Sri Lanka: relevance for environmental management. South-east Asian J Trop Med Public Health 29: 168–172.
52. Jewsbury JM, Imevbore AMA, 1988. Small dam health studies.Parasitol Today 4: 57–59.
53. Keiser J, Utzinger J, Singer BH, 2002. The potential of intermit-tent irrigation for increasing rice yields, lowering water con-sumption, reducing methane emissions, and controlling ma-laria in African rice fields. J Am Mosq Control Assoc 18: 329–340.
54. Konradsen F, van der Hoek W, Amerasinghe FP, Mutero C,Boelee E, 2004. Engineering and malaria control: learningfrom the past 100 years. Acta Trop 89: 99–108.
55. Kitron U, Spielman A, 1989. Suppression of transmission of ma-laria through source reduction: antianopheline measures ap-plied in Israel, the United States, and Italy. Rev Infect Dis 11:391–406.
56. Kemm J, Parry J, Palmer J, 2004. Health Impact Assessment:Concepts, Theory, Techniques and Applications. Oxford,United Kingdom: Oxford University Press.
57. Carnevale P, Robert V, 1987. Introduction of irrigation inBurkina Faso and its effect on malaria transmission. Effects ofAgricultural Development on Vector-Borne Diseases. SeventhAnnual Meeting of the Joint WHO/FAO/UNEP Panel of Ex-perts on Environmental Management for Vector Control.(Rome: FAO), 57−67.
58. Couprie B, Claudot Y, Same-Ekobo A, Issoufa H, Leger-Debruyne M, Tribouley J, Ripert C, 1985. Epidemiologic studyof malaria in the rice-growing regions of Yagoua and Maga(North Cameroon). Bull Soc Pathol Exot Filiales 78: 191–204.
59. Audibert M, Josseran R, Josse R, Adjidji A, 1990. Irrigation,schistosomiasis, and malaria in the Logone Valley, Cameroon.Am J Trop Med Hyg 42: 550–560.
60. Thomson MC, D’Alessandro U, Bennett S, Connor SJ,Langerock P, Jawara M, Todd J, Greenwood BM, 1994. Ma-laria prevalence is inversely related to vector density in TheGambia, West Africa. Trans R Soc Trop Med Hyg 88: 638–643.
61. Faye O, N’Dir B, Correa J, N’Dir O, Gaye O, Bah IB, Dieng T,Dieng Y, Diallo S, 1998. Evaluation of parasitic risks related tothe revitalization of the Ferlo fossil valley (Senegal). DakarMed 43: 183–187.
62. Gbakima AA, 1994. Inland valley swamp rice development: ma-laria, schistosomiasis, onchocerciasis in south central SierraLeone. Public Health 108: 149–157.
63. Coosemans MH, 1985. Comparison of malarial endemicity in arice-growing area and a cotton-growing area of the RusiziPlain, Burundi. Ann Soc Belg Med Trop 65: 187–200.
64. Henry MC, Rogier C, Nzeyimana I, Assi SB, Dossou-Yovo J,Audibert M, Mathonnat J, Keundjian A, Akodo E, TeuscherT, Carnevale P, 2003. Inland valley rice production systemsand malaria infection and disease in the savannah of Côted’Ivoire. Trop Med Int Health 8: 449–458.
65. Sow S, de Vlas SJ, Engels D, Gryseels B, 2002. Water-relateddisease patterns before and after the construction of theDiama dam in northern Senegal. Ann Trop Med Parasitol 96:575–586.
66. Roggeri H, 1985. African Dams: Impacts in the Environment: The
IRRIGATION AND LARGE DAMS AND MALARIA BURDEN 405

Social and Environmental Impact of Dams at the Local Level:A Case Study of Five Man-Made Lakes in Eastern Africa. Nai-robi, Kenya: Environment Liaison Centre.
67. Singh N, Shukla M, Chand S, Sharma V, 1997. Outbreak of fal-ciparum malaria in submerged villages of Narayanganj PHC,district Mandla due to Narmada irrigation project, central In-dia (Madhya Pradesh). Curr Sci 73: 686–691.
68. Tyagi BK, Chaudhary RC, 1997. Outbreak of falciparum malariain the Thar Desert (India), with particular emphasis on physi-ographic changes brought about by extensive canalization andtheir impact on vector density and dissemination. J Arid En-viron 36: 541–555.
69. Tyagi BK, Yadav SP, Sachdev R, Dam PK, 2001. Malaria out-break in the Indira Gandhi Nahar Pariyojna command area inJaisalmer district, Thar Desert, India. J Commun Dis 33: 88–95.
70. Cho SH, Lee HW, Shin EH, Lee HI, Lee WG, Kim CH, Kim JT,Lee JS, Lee WJ, Jung GG, Kim TS, 2002. A mark-release-recapture experiment with Anopheles sinensis in the northernpart of Gyeonggi-do, Korea. Korean J Parasitol 40: 139–148.
71. Roberts DR, Manguin S, Rejmankova E, Andre R, Harbach RE,Vanzie E, Hakre S, Polanco J, 2002. Spatial distribution ofadult Anopheles darlingi and Anopheles albimanus in relationto riparian habitats in Belize, Central America. J Vector Ecol27: 21–30.
72. WHO, 1982. Manual on Environmental Management for Mos-quito Control. Geneva: World Health Organization.
APPENDIX 1ESTIMATION OF AT-RISK POPULATION DUE TO
PROXIMITY OF LARGE DAM SITES (TWOEXAMPLES FOR WORLD HEALTH
ORGANIZATION (WHO) SUB-REGIONS 2 AND 4)
An estimated 346 large dams are located in the malaria-endemic countries of WHO sub-region 2. Only 25 of the 539South African dams are included in this number because onlythese are located in areas where malaria is endemic. We clas-sified 226 of the dams (where detailed information on thearea of the reservoir is available12) according to their reser-voir surface into four groups as follows: 1) <1 km2, 2) 1–10km2, 3) 10–100 km2, and 4) >100 km2 (see table below). As-suming a reservoir with a hypothetical rectangular shape (Fig-ure 1), we calculated for each dam the base b of the reservoiraccording to b � A/l, where A represents the area of thereservoir and l the length of the dam (both parameters havebeen obtained from the World Register of Dams12). To get anidea of the shape of the reservoirs (whether the rectangle hasa long or short perimeter), we then calculated for each groupthe median of the ratio b/l [A/(l × l)] of the dams’ reservoirs.
We found that those dams with a reservoir size <1 km2 wereclose to square shapes (median ratio b/l � 2.5). Those damswith reservoir sizes >100 km2 had a much longer base thanlength (median b/l � 0637.4).
We assumed a mosquito flight range of 2 km, which isjustified on the following grounds. First, some individual mos-quito species might have a very long flight range, up to 12 kmhave been reported for Anopheles sinensis; however, the greatmajority (66.5%) of An. sinensis were recaptured 1–3 kmfrom their release points.70 Second, An. darlingi and An. al-bimanus were abundant in houses <1 km from the river andnot present in houses further away.71 Third, WHO has sug-gested to locate villages 1.5–2 km from the edge of the res-ervoir, which has proven successful in reducing malaria inci-dence.72 Thus, we calculated the area 2 km around the hypo-thetically rectangular reservoirs for all four groups applyingthe following formula: Area at risk � 2 × (b × 2) + 2 ×(l × 2) + 22� (Figure 1).
For the 226 large dams in WHO sub-region 2, we deter-mined a total flight range area of 11,578 km2 (mean � 51km2/reservoir). Since we have no data on the reservoirs of theremaining 120 dams in this WHO sub-region, we assume thatthey have a similar average flight range, namely 51 km2/reservoir. Consequently, the estimated total area for all 346registered large dams in WHO sub-region 2 is 17,726 km2.Using the percentage of population in malaria-endemic re-gions for each country, we obtained an estimate of the mos-quito flight range around large dams in endemic areas. In ourexample of WHO sub-region 2, we assume that 94% of thedams’ surface areas are located in endemic areas.
Multiplication of the mosquito flight range in malaria-endemic areas with the obtained population density for WHOsub-region 2 (25.8 persons/km2; Table 2) gave an estimate ofthe at-risk population of 429,887.
For WHO sub-regions 4–14 we classified all large dams inthese countries into only two categories (since there are sev-eral thousand dams), namely 1) area of the reservoirs �100km2, and 2) area of the reservoirs >100 km2. For each groupwe calculated the area of a 2-km mosquito flight range withthe aid of two hypothetical rectangles of A1 � 15 l × l (for thesmall reservoirs �100 km2) and A2 � 500 l × l (for the largereservoirs >100 km2) (see example for WHO sub-region 4below). The calculation of the people at risk has been con-ducted as described above for WHO sub-region 2.
Reservoir sizes(×103 m2)
Numberof dams
Total size ofreservoirs(×103 m2)
Estimated medianbase/length
of dam
Area flight range(×103 m2)
(full water level)
Area flight rangefor all dams
(×103 m2) (full water level)*
Area flight rangefor endemic dams
(×103 m2) (full water level)At risk population(full water level)
25–100,000 516 4,643,105 15 1,138,457100,000– 53 23,772,133 500 13,830,507
569 28,415,238 14,968,964 36,541,108 12,789,387 383,670* No data were available on the area of the reservoir of 820 dams.
Reservoir sizes(×103 m2)
Numberof dams*
Total size ofreservoirs(×103 m2)
Medianbase/length
of dam
Area flightrange at fullwater level(×103 m2)
Area flightrange for alllarge dams at
full water level(×103 m2)†
Area flight rangefor dams located in
malaria-endemic areasat fullwater level
(×103 m2)
At-riskpopulation
at fullwater level
25–960 100 47,396 2.5 73,4141,010–8,700 95 279,681 7.1 215,808
10,000–91,050 23 706,151 36.1 668,796120,000–5,100,000 8 11,005,700 637.4 10,620,121
226 12,038,928 11,578,139 17,725,823 16,662,273 429,887* Only the 25 South African dams located in malaria-endemic areas have been included.† No data were available on the area of the reservoir of 120 dams.
KEISER AND OTHERS406