Assessment of the irrigation performance of transferred schemes in Turkey: a case study analysis
12
ASSESSMENT OF THE IRRIGATION PERFORMANCE OF TRANSFERRED SCHEMES IN TURKEY: A CASE STUDYANALYSIS y BELGIN CAKMAK 1 * , AYSEGUL KIBAROGLU 2 , BERNA KENDIRLI 1 AND ZEKI GOKALP 1 1 Department of Farm Structure and Irrigation, Faculty of Agriculture, University of Ankara, Ankara, Turkey 2 Department of International Relations, Middle East Technical University, Ankara, Turkey ABSTRACT Efforts to increase the amount of irrigation schemes transferred to irrigation associations (IAs) in Turkey have been motivated by the poor performance – in terms of cost recovery, equity, efficiency in operation and maintenance (O&M) and repairs – of many large irrigation schemes by government agencies, namely the State Hydraulic Works (DSI). The objective of this study is to assess the irrigation system performance of transferred irrigation schemes in the DSI Fifth Regional Directorate service area mainly for the year 2003 with benchmarking indicators. According to the findings of the study, relative water supply was recorded as 1.5–8.4 respectively. The financial performance indicators including cost recovery ratio, maintenance expenditure to revenue ratio, operating cost per unit area, total cost per person employed on water delivery, revenue collection performance and service area per personnel were found to be 1.0–10.6%, 0.7–12.5%, US$6.5–53.3 ha 1 , US$636.0–7045.9 per person, 78–95%, 67–13 000 ha per person, respectively. As regards productive performance, output per unit command area, output per unit irrigated area, output per unit irrigation supply and output per unit water consumed were determined as US$325.2–2745.1, US$1028.03–5070.9 ha 1 , US$0.2–0.7 m 3 and US$0.2–2.6 m 3 respectively. Water quality classes were found to be C 3 S 1 in all schemes. The results of the case study show that following the transfer of irrigation schemes to the user organizations, significant improvements are recorded in irrigation water fee collection rates and financial cost reduction in the systems operated by the IAs. Mixed results are observed in terms of irrigation ratios. While there are improvements in two irrigation schemes, there are evident increases in the water supply ratio in six other irrigation schemes. Management, operation and maintenance (MOM) costs in general and the maintenance costs per se have increased compared to the collected water fees in the case-study irrigation schemes. Copyright # 2008 John Wiley & Sons, Ltd. key words: Turkey; irrigation associations; water delivery performance; financial performance; productive performance Received 13 June 2007; Revised 13 July 2008; Accepted 14 July 2008 RE ´ SUME ´ Les efforts visant a ` augmenter le nombre de pe ´rime `tres irrigue ´s transfe ´re ´s a ` des associations d’irrigants ont e ´te ´ motive ´s par la mauvaise performance en termes de recouvrement des cou ˆts, d’e ´quite ´, d’efficacite ´ dans l’exploita- tion et la maintenance (O&M) de nombreux grands pe ´rime `tres ge ´re ´s par les organismes gouvernementaux, a ` savoir la DSI. L’objectif de cette e ´tude est d’e ´valuer les performances des syste `mes d’irrigation dans les pe ´rime `tres transfe ´re ´s dans la re ´gion 5 de DSI principalement pour l’anne ´e 2003 avec des indicateurs de benchmarking. Selon les conclusions de l’e ´tude le ratio de distribution d’eau relatif a e ´te ´ enregistre ´ de 1.5 a ` 8.4. Les indicateurs de performance financie `re suivants ont e ´te ´ trouve ´s: le ratio de re ´cupe ´ration des cou ˆts1.0–10.6%, le ratio de ´penses IRRIGATION AND DRAINAGE Irrig. and Drain. 59: 138–149 (2010) Published online 17 November 2008 in Wiley InterScience (www.interscience.wiley.com) DOI: 10.1002/ird.452 *Correspondence to: Dr. Belgin Cakmak, Department of Farm Structure and Irrigation, Faculty of Agriculture, University of Ankara, 06110 Ankara, Turkey. E-mail: [email protected] y E ´ valuation de la performance des pe ´rime `tres irrigue ´s transfe ´re ´s en Turquie: une e ´tude de cas. Copyright # 2008 John Wiley & Sons, Ltd.
Transcript of Assessment of the irrigation performance of transferred schemes in Turkey: a case study analysis
IRRIGATION AND DRAINAGE
Irrig. and Drain. 59: 138–149 (2010)
Published online 17 November 2008 in Wiley InterScience (www.interscience.wiley.com) DOI: 10.1002/ird.452
ASSESSMENT OF THE IRRIGATION PERFORMANCE OF TRANSFERREDSCHEMES IN TURKEY: A CASE STUDY ANALYSISy
BELGIN CAKMAK1*, AYSEGUL KIBAROGLU2, BERNA KENDIRLI1 AND ZEKI GOKALP1
1Department of Farm Structure and Irrigation, Faculty of Agriculture, University of Ankara, Ankara, Turkey2Department of International Relations, Middle East Technical University, Ankara, Turkey
ABSTRACT
Efforts to increase the amount of irrigation schemes transferred to irrigation associations (IAs) in Turkey have been
motivated by the poor performance – in terms of cost recovery, equity, efficiency in operation and maintenance
(O&M) and repairs – of many large irrigation schemes by government agencies, namely the State Hydraulic Works
(DSI). The objective of this study is to assess the irrigation system performance of transferred irrigation schemes in
the DSI Fifth Regional Directorate service area mainly for the year 2003 with benchmarking indicators.
According to the findings of the study, relative water supply was recorded as 1.5–8.4 respectively. The financial
performance indicators including cost recovery ratio, maintenance expenditure to revenue ratio, operating cost per
unit area, total cost per person employed on water delivery, revenue collection performance and service area per
personnel were found to be 1.0–10.6%, 0.7–12.5%, US$6.5–53.3 ha�1, US$636.0–7045.9 per person, 78–95%,
67–13 000 ha per person, respectively. As regards productive performance, output per unit command area, output
per unit irrigated area, output per unit irrigation supply and output per unit water consumed were determined as
US$325.2–2745.1, US$1028.03–5070.9 ha�1, US$0.2–0.7 m�3 and US$0.2–2.6 m�3 respectively. Water quality
classes were found to be C3S1 in all schemes. The results of the case study show that following the transfer of
irrigation schemes to the user organizations, significant improvements are recorded in irrigation water fee
collection rates and financial cost reduction in the systems operated by the IAs. Mixed results are observed in
terms of irrigation ratios. While there are improvements in two irrigation schemes, there are evident increases in the
water supply ratio in six other irrigation schemes. Management, operation and maintenance (MOM) costs in
general and the maintenance costs per se have increased compared to the collected water fees in the case-study
irrigation schemes. Copyright # 2008 John Wiley & Sons, Ltd.
key words: Turkey; irrigation associations; water delivery performance; financial performance; productive performance
Received 13 June 2007; Revised 13 July 2008; Accepted 14 July 2008
RESUME
Les efforts visant a augmenter le nombre de perimetres irrigues transferes a des associations d’irrigants ont ete
motives par la mauvaise performance en termes de recouvrement des couts, d’equite, d’efficacite dans l’exploita-
tion et la maintenance (O&M) de nombreux grands perimetres geres par les organismes gouvernementaux, a savoir
la DSI. L’objectif de cette etude est d’evaluer les performances des systemes d’irrigation dans les perimetres
transferes dans la region 5 de DSI principalement pour l’annee 2003 avec des indicateurs de benchmarking.
Selon les conclusions de l’etude le ratio de distribution d’eau relatif a ete enregistre de 1.5 a 8.4. Les indicateurs
de performance financiere suivants ont ete trouves: le ratio de recuperation des couts1.0–10.6%, le ratio depenses
* Correspondence to: Dr. Belgin Cakmak, Department of Farm Structure and Irrigation, Faculty of Agriculture, University of Ankara, 06110Ankara, Turkey. E-mail: [email protected] de la performance des perimetres irrigues transferes en Turquie: une etude de cas.
Copyright # 2008 John Wiley & Sons, Ltd.

IRRIGATION PERFORMANCE OF TRANSFERRED SCHEMES IN TURKEY 139
de maintenance sur recettes 0.7–12.5%, les couts d’exploitation par unite de surface 6.5–53.3 US$ ha�1, le cout
total par personne employee pour la distribution de l’eau 636.0–7045.9 US$/personne, le recouvrement des recettes
de fonctionnements 78–95%, la surface de service par personne 67–13 000 ha/personne. En ce qui concerne la
performance de production, ont ete determines: la production par ha domine 325.2–2745.1 US$ ha�1, la production
par ha irrigue 1028.0–5070.9 US$ ha�1, la production par m3 livre 0.2–0.7 US$ m�3 et la production par m3
consomme 0.2–2.6 US$ m�3. La classe de qualite de l’eau a ete trouve en C3S1 dans tous les perimetres.
Les resultats de l’etude de cas montrent qu’a la suite du transfert aux associations d’irrigants, des ameliorations
significatives sont enregistrees dans les taux de recouvrement des redevances d’irrigation et dans la reduction des
couts d’exploitation. Des resultats mitiges sont observes en terme de taux d’irrigation. Bien que des ameliorations
soient constatees dans deux perimetres, il est clair que le taux d’approvisionnement en eau augmente dans les six
autres perimetres. Les couts de gestion, d’exploitation et d’entretien (OMM) en general et les couts de maintenance
en particulier ont augmente par rapport aux redevances collectees dans les perimetres de cette etude. Copyright #
2008 John Wiley & Sons, Ltd.
mots cles: Turquie; association d’irrigants; performance de la distribution d’eau; performance financiere; performance de production
INTRODUCTION
Many recent critiques of the water sector have pointed to the poor attention paid by government agencies to
operations including delivery of irrigation water services, management and maintenance of water resource systems.
Hence, efforts to increase user participation have been spurred by poor functioning in terms of efficiency, equity,
cost recovery and accountability of many large-scale irrigation systems administered by government agencies. As
observed through various country experiences, management of state-operated irrigation projects were not able to
provide the expected benefits. Therefore, irrigation management transfers to different organizations such as water
user associations, cooperatives and municipalities were initiated. In this context, a set of performance indicators
was developed by the International Water Management Institute (IWMI), and likewise a new set of performance
indicators called ‘‘benchmarking indicators’’ was developed by the International Commission of Irrigation and
Drainage (ICID) to assess the performance of irrigation schemes (Molden et al., 1998; Burton et al., 2000).
IWMI performance indicators have been used for assessment of transferred irrigation schemes in many countries
under different conditions (Kloezen and Garces-Restrepo, 1998; Molden et al., 1998; Vermillion and Garces-
Restrepo, 1998; Cakmak, 2001; Svendsen and Murray-Rust, 2001). To illustrate, Vermillion et al. (2000) have
assessed the effects of a transfer programme on performance of irrigation schemes with 500 ha or less land area in
Indonesia. They assessed the agricultural performance based on income corresponding to per unit area and they did
not come up with any significant change in post-transfer performance.
Benchmarking is a beneficial tool to assess the performance of irrigation schemes. It is about improving the
performance of organizational processes and identifying the gap between current and achievable performance, and
making changes to realize the higher standards of performance. In 2004 the ICID published a special issue about
benchmarking in the irrigation and drainage sector (Cakmak et al., 2004). Leading international case studies using
benchmarking indicators set by the IWMI were included in that issue.
Cakmak (2001) applied the irrigation system performance assessment indicators developed by the IWMI in the
Konya irrigation associations, Turkey, and assessed the system performance for the years 1995–99. In the study,
equivalent gross production value was between US$195 and 5391 ha�1, actively irrigated area equivalent
production value was between US$359 and 6197 ha�1, equivalent gross production value corresponding to the
diverted water was between US$0.2 and 1.3 m�3, equivalent gross production value corresponding to irrigation
water need was between US$0.1 and 2.3 m�3, water supply ratio was between 0.3 and 7.8 and irrigation ratio was
between 36 and 104%.
Murray-Rust and Svendsen (2001) carried out a performance assessment study on the six irrigation associations
(Sarigol, Alasehir, Adala, Turgutlu, Manisa and Menemen) in the Gediz Basin in Turkey. The study found the water
productivity rate to be US$20–40 ha�1. The authors also stated that irrigation performance were not significantly
changed due to the diversity in irrigation association practices of the management of individual systems within the
Copyright # 2008 John Wiley & Sons, Ltd. Irrig. and Drain. 59: 138–149 (2010)

140 B. CAKMAK ET AL.
basin. However, costs were recorded to be largely reduced, and production of economically valuable crops played a
supporting role in this regard.
Svendsen and Murray-Rust (2001) assessed the effectiveness of the national transfer programme in Turkey. They
indicated that the water fee in irrigation associations was US$78 ha�1, and this price was 13% higher in the DSI-
managed schemes; the water fee collection rate was 79% in irrigation associations and 43% in the DSI-managed
schemes. They also stated that a regular monitoring programme was needed in the transferred irrigation schemes.
Yercan et al. (2004) carried out a case study on the performance criteria in irrigation schemes of the Gediz Basin
to assess the performance of the schemes before and after irrigation management transfer. They reported the results
as a doubling of irrigation fee collection rates and a shifting of operation and maintenance expenditures from the
public to the users; an accumulation of reserves in some irrigation associations for future capital purchases; a
reduced wage for operation and maintenance personnel; and indications of expansions of irrigated area in some
transferred schemes.
Cakmak et al. (2004) assessed irrigation performance in the DSI Tenth Regional Directorate Irrigation Schemes
with benchmarking indicators for the years 1996–2000. Benchmark values for performance were identified in
Batman-Silvan, Devegecidi, Derik-Kumluca, Nusaybin-Cagdas and Cinar-Goksu irrigation associations. Their
analyses showed that, in general, all the schemes were performing well according to the benchmarking
performance indicators used in the case study.
In this paper, system performance of transferred irrigation schemes in the DSI Fifth Regional Directorate service
area mainly for the year 2003 is determined and assessed with benchmarking performance indicators. Data and
some assessments for the years 2000, 2001 and 2002 are also provided to see the changes brought by the transfer
programmes. Due to lack of reliable data, some performance indicators can be calculated only for the year 2003.
BACKGROUND
Agriculture plays a key role in the socio-economic development of Turkey. Yet the sector depends greatly on
climatic conditions. Average annual precipitation is 643 mm, ranging from 250 mm in the south-eastern part of the
country to over 3000 mm in the north-eastern Black Sea coastal area. Water is a limiting factor for agriculture
throughout much of the country. Under these circumstances, irrigation has gradually been expanded. Turkey has
developed its present base of irrigated agriculture very rapidly over the past 50 years and in so doing has established
a valuable source of technical expertise. Irrigation development in Turkey is carried out by the public sector
institutions, namely the General Directorate of State Hydraulic Works (DSI) and the General Directorate of Rural
Services (GDRS) and by the farmers and groups of farmers. Systematic water resources management in Turkey
started with the establishment of the DSI in 1954, which was attached to the Ministry of Energy and Natural
Resources. The DSI is responsible for almost all aspects of water resources development in Turkey. It is empowered
to plan, design, construct and operate dams, hydroelectric power plants and domestic water and irrigation schemes
(Bayazit and Avci, 1997).
In 1960 the General Directorate for Soil and Water was established which in 1985 was reconstituted as the
General Directorate for Rural Services (GDRS) under the Ministry of Agriculture, Forestry and Rural Affairs. From
1993 until recently, the GDRS operated under the Prime Minister’s Office. The GDRS was abolished in 2005 and its
tasks especially as regards to the activities at village level were reassigned to the Special Provincial
Administrations. Its headquarters is organized under the concerned department at the Ministry of Agriculture and
Rural Affairs. The GDRS was concerned with soil surveys and conservation; on-farm development activities
including on-farm drainage construction; the construction of small dams/reservoirs, and the construction of minor
surface and groundwater irrigation schemes which have been turned over to autonomous farmers’ associations or
groundwater cooperatives respectively (Kibaroglu et al., 2005).
According to comprehensive studies carried out by the DSI, 8.5 million ha of land could be economically
irrigated. As of 2007, 4.97 million ha of the 8.5 million ha area have been equipped with irrigation facilities, of
which 2.85 million ha have been developed by the DSI, 1.1 million ha by the GDRS, and about 1.0 million ha by
small-scale privately owned irrigation schemes. Moreover, 6.5 million ha of the 8.5 million ha of land are envisaged
Copyright # 2008 John Wiley & Sons, Ltd. Irrig. and Drain. 59: 138–149 (2010)

IRRIGATION PERFORMANCE OF TRANSFERRED SCHEMES IN TURKEY 141
for development by the DSI, 1.5 million by other state agencies, and 0.5 million ha by small-scale privately owned
irrigation schemes by the year 2030 (State Hydraulic Works, 2007: 13).
The DSI has the primary task of management and operation of the irrigation systems including the collection of
water fees and water delivery to farmers. However, by the Establishment Law Code 6200 (1954), it is entitled to
transfer the operation and maintenance (O&M) of irrigation systems to irrigation management organizations
(IMOs) such as village administrations, municipalities, cooperatives, and irrigation associations (IAs). Thus, since
the early 1960s, the DSI has had a programme to transfer O&M responsibility for secondary and tertiary canals to
IMOs. However, up until 1993, it was only able to transfer O&M irrigation systems of some 70 000 ha to various
types of IMOs. This process has gained momentum since 1993 and within the past 15 years nearly 2 million ha
irrigation schemes have been transferred to local administrations or to IAs: the innovative form of transfer used,
where the irrigation scheme covers more than one local administrative unit (e.g. village or municipality).
Significant developments were achieved in transfer processes, and while 95.2% of irrigated areas were operated by
the DSI in 1993 this ratio decreased to below 10% (Figure 1).
Key background conditions leading to irrigation management transfer include: a national budgetary crisis that
led to severe limitations on financial allocations to the DSI in general and to the O&M Department in particular, and
progressive deterioration of the irrigation infrastructure due to the deferred maintenance. The IAs in Turkey have
been established through the existing local government structures. They are not a product of any grass-roots
movement or organization. DSI staff were the major initiator and executor of the transfer programme. There were
intensive negotiations between the agency (DSI) and local communities including the representatives from local
governments concerning the terms of transfer.
MATERIAL
In this study, performance of the transferred irrigation schemes, namely the Kalecik, Akinci, Asartepe, Gokceoren,
Koprukoy right bank and left bank, Bolu, Kizilirmak and Kumbaba IAs, serving under the DSI Fifth Regional
Directorate are assessed (Table I). The DSI Fifth Regional Directorate is geographically located in the Central
Anatolian and Western Black Sea regions (Figure 2). Its service area covers the watersheds of the Sakarya,
Kizilirmak and Yesilirmak rivers. Annual average precipitation in the region is about 455 mm.
Table II includes characteristics of the irrigation schemes. Data on irrigation area, irrigated land, water diverted
to schemes, irrigation water need, and cropping pattern for the years 2000, 2001, 2002 and 2003 are gathered from
the DSI monitoring and evaluation reports; yield and unit price data are gathered from the records of the DSI Fifth
Regional Directorate State Hydraulic Works (DSI, 2003a, b, 2004a, b).
METHOD
In this study, the approach recommended by the International Programme for Technology and Research in
Irrigation and Drainage (IPTRID) for performance evaluation in the irrigation and drainage sector is utilized
Figure 1. Distribution of transferred schemes based on undertaking organization (DSI, 2005)
Copyright # 2008 John Wiley & Sons, Ltd. Irrig. and Drain. 59: 138–149 (2010)

Table I. Irrigation schemes in the study area
Irrigation facility Starting date for operation Date of transfer Type of irrigation organization
Kalecik 1970 15.08.2002 Kalecik central irrigation cooperativeAkinci 1970 09.01.1998 Akinci plain irrigation associationAsartepe 1983 24.06.1996 Ayas Asartepe irrigation associationGokceoren 1983 22.07.2003 Gokceoren agricultural development cooperativeKoprukoy 1970–84 06.02.1998 Koprukoy right bank irrigation association
Kesikkopru K. Kecili irrigation associationBolu 1970–85 20.06.2003 Bolu plain irrigation associationKizilirmak 1994 31.10.1994 Kizilirmak irrigation associationKumbaba 1980 22.07.2003 Kumbaba irrigation cooperative
Source: DSI records.
142 B. CAKMAK ET AL.
(Malano and Burton, 2001). Environmental performance is not evaluated due to lack of reliable data. Related data
for performance evaluation are taken from the records of the irrigation association. The benchmarking performance
indicators used in performance assessment of irrigation schemes are given in Table III.
RESULTS AND DISCUSSION
Table IV displays the water supply ratios, which are determined by the dividing total amount of water diverted to an
irrigation system by total irrigation water need. The maximum ratio was 8.4 in Kumbaba and the minimum 1.5 in
Kalecik in 2003. While the relative water supply ratio was over 2.0 in pre-transfer, this ratio decreased to about
1.5 in the Kalecik irrigation scheme. This may be evaluated as an improvement brought by the transfer.
Cost recovery ratios, which are obtained by comparing collected water fees with expenses spent on O&M, are the
indicators of success rates for irrigation operations. The ratios were maximum in the Kizilirmak irrigation scheme
Figure 2. Map and provinces of the study area
Copyright # 2008 John Wiley & Sons, Ltd. Irrig. and Drain. 59: 138–149 (2010)

Table II. Characteristics of evaluated irrigation schemes
Name ofirrigation
Waterresource
Irrigationarea (ha)
Conveyanceand distributionnetwork
Cropping pattern Irrigationmanagement
Irrigationsystem
Kalecik Kizilirmak river 600 Classic(open canal)
Sugar beet, cereal, Free flow(furrow)
Pumping
Akinci Kurt bogazi 2800 Classic Garden, sugar beet, vegetable,sunflower
Free flow Gravity
Asartepe Ilhan 1500 Classic Cereal, corn, sugar beet, sapling Free flow Gravity –Pumping
Gokceoren Kizilirmak 350 Classic Sugar beet, garden, corn, vineyard Free flow PumpingKoprukoy Kizilirmak 3750 Classic Cereal, bean, sun flower, sugar beet Free flow Gravity –
PumpingBolu Buyuksu/mudurnu 8600 Classic
(lifted open canal)Sugar beet, corn, potato, vegetable Free flow Gravity –
PumpingKizilirmak Kizilirmak 4840 Classic Garden, bean, vegetable Free flow Gravity
Kumbaba Kizilirmak 550 Classic Sugar beet, vegetable, vineyard Free flow Pumping
Source: DSI records.
IRRIGATION PERFORMANCE OF TRANSFERRED SCHEMES IN TURKEY 143
with 10.6 and minimum in the Gokceoren irrigation scheme with 1.0 (Table V). Cost recovery ratios of the year
2000 were higher than those of the years 2001, 2002 and 2003 due to lower MOM costs. Hence, it is possible to infer
that after the year 2000, MOM costs have increased compared to the collected water fees in the case study irrigation
schemes.
Table VI presents the maintenance expenditure to revenue ratios, which are obtained by dividing the total amount
of collected water fees by maintenance costs. The highest maintenance/income ratio was obtained in the Kizilirmak
Table III. Benchmarking performance indicators used in the case study and data required (Burton et al., 2000)
Activity area Performance indicator Data required
Water deliveryperformance
Annual relative water supply Total annual inflow volume to system/Volume of annualirrigation water required by crop
Financialperformance
Cost recovery ratio Total revenue collected from water users/Total management,operation and maintenance (MOM) cost
Maintenance expenditure to revenue ratio Total maintenance expenditure/Total revenue collected fromwater users
Operating cost per unit area ($ ha�1) Total operation expenditure/Total command area serviced bythe system
Total cost per person employed on waterdelivery ($/person)
Total cost of MOM personnel/Total number of peopleemployed
Revenue collection performance Total service revenue collected/Total service revenue dueService area per personnel (ha/person) Total number of MOM staff/Total command area serviced
by systemProductiveperformance
Output per unit command area ($ ha�1) Gross value of agricultural production/Total cultivablecommand area
Output per irrigated area ($ ha�1) Gross value of agricultural production /Total irrigated crop areaOutput per unit irrigation supply ($ m�3) Gross value of agricultural production/Total inflow volume
of waterOutput per unit water consumed ($ m�3) Gross value of agricultural production/Total volume of
water required by cropEnvironmentalperformance
Water quality: salinity of supply anddrainage water
Electrical conductivity of periodically collected Measurementof periodically daily inflow water to scheme
Copyright # 2008 John Wiley & Sons, Ltd. Irrig. and Drain. 59: 138–149 (2010)

Tab
leIV
.A
nn
ual
rela
tive
wat
ersu
pp
lyra
tio
s
Irri
gat
ion
sch
eme
20
00
20
01
20
02
20
03
To
tal
wat
erin
pu
tto
the
syst
em(m
3)
To
tal
irri
gat
ion
wat
ern
eed
(m3)
Rel
ativ
ew
ater
sup
ply
rati
o
To
tal
wat
erin
pu
tto
the
syst
em(m
3)
To
tal
irri
gat
ion
wat
ern
eed
(m3)
Rel
ativ
ew
ater
sup
ply
rati
o
To
tal
wat
erin
pu
tto
the
syst
em(m
3)
To
tal
irri
gat
ion
wat
ern
eed
(m3)
Rel
ativ
ew
ater
sup
ply
rati
o
To
tal
wat
erin
pu
tto
the
syst
em(m
3)
To
tal
irri
gat
ion
wat
ern
eed
(m3)
Rel
ativ
ew
ater
sup
ply
rati
o
Kal
ecik
25
08
68
61
23
79
59
2.0
39
50
77
51
54
60
25
2.6
18
86
03
91
43
64
89
1.3
14
23
69
59
49
50
01
.5G
ok
ceo
ren
31
49
18
61
65
86
44
1.9
38
07
36
42
04
65
92
1.9
28
61
79
98
06
20
03
.51
32
53
29
85
85
00
1.5
Bo
lu9
28
63
88
36
81
54
42
.51
46
74
21
63
46
57
80
4.2
12
57
52
42
10
20
60
00
1.2
18
59
29
50
46
07
40
04
.0K
um
bab
a5
59
35
03
61
97
91
.51
14
43
50
10
61
78
61
.11
27
35
04
09
57
80
.37
89
54
39
45
00
8.4
Kop
ruk
oy
63
12
00
00
38
28
43
80
1.7
46
65
50
00
12
08
92
80
3.9
77
56
12
80
28
96
45
28
2.7
89
07
40
80
35
72
50
02
.5A
sart
epe
97
87
00
04
94
91
06
2.0
59
62
27
23
97
00
50
0.2
86
86
71
49
24
00
00
0.9
11
26
46
98
36
54
00
02
.5A
kın
cı8
00
67
16
22
16
03
83
.68
19
04
78
23
69
43
03
.51
05
10
06
06
96
00
00
1.5
10
03
12
56
15
78
57
46
.4
Kız
ılır
mak
Tim
arli
44
72
70
00
11
27
17
30
4.0
44
87
00
00
10
94
83
36
4.0
68
50
00
00
15
26
34
58
4.5
86
20
00
00
13
29
20
20
6.5
Tab
leV
.C
ost
reco
ver
yra
tio
Irri
gat
ion
sch
eme
20
00
20
01
20
02
20
03
To
tal
coll
ecte
dw
ater
fee
(US
$)
To
tal
MO
Mco
st(U
S$
)
Co
stre
cover
yra
tio
(%)
To
tal
coll
ecte
dw
ater
fee
(US
$)
To
tal
MO
Mco
st(U
S$
)
Co
stre
cover
yra
tio
(%)
To
tal
coll
ecte
dw
ater
fee
(US
$)
To
tal
MO
Mco
st(U
S$
)
Co
stre
cover
yra
tio
(%)
To
tal
coll
ecte
dw
ater
fee
(US
$)
To
tal
MO
Mco
st(U
S$
)
Co
stre
cover
yra
tio
(%)
Kal
ecik
68
51
31
51
32
1.7
23
51
45
17
86
24
.53
63
99
13
69
04
26
.64
83
42
42
71
66
11
.1G
ok
ceo
ren
97
87
55
72
61
7.6
31
73
97
32
95
54
.39
35
94
51
29
47
18
.36
40
14
63
60
42
41
.0B
olu
21
26
36
28
39
33
.85
45
35
10
61
55
15
.13
27
10
25
82
40
12
.71
57
62
85
83
60
42
2.7
Ku
mb
aba
25
87
97
47
26
.51
01
68
94
28
81
.16
72
26
30
53
99
22
.01
09
07
00
Kop
ruk
oy
20
93
86
71
07
31
.25
37
05
14
31
02
37
.57
79
25
97
05
65
8.0
67
71
91
02
95
34
6.6
Asa
rtep
e3
67
49
42
07
88
7.3
38
59
92
76
89
01
3.9
73
93
14
33
78
81
7.0
77
14
97
98
74
99
.7A
kın
cı1
47
95
27
48
45
3.8
23
96
81
66
41
71
4.4
31
09
52
76
81
91
1.2
39
45
34
31
44
19
.1
Kız
ılır
mak
Tim
arli
31
09
51
01
72
43
0.6
38
44
51
53
88
62
5.0
79
98
56
50
17
61
2.3
99
29
39
38
51
51
0.6
Copyright # 2008 John Wiley & Sons, Ltd. Irrig. and Drain. 59: 138–149 (2010)
144 B. CAKMAK ET AL.
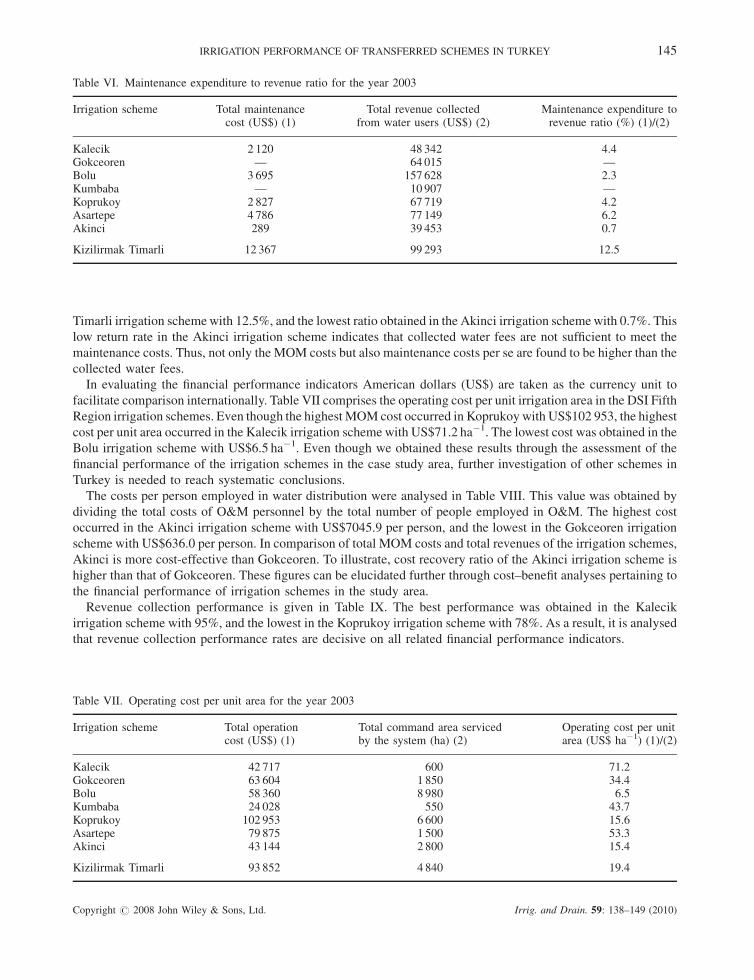
Table VI. Maintenance expenditure to revenue ratio for the year 2003
Irrigation scheme Total maintenancecost (US$) (1)
Total revenue collectedfrom water users (US$) (2)
Maintenance expenditure torevenue ratio (%) (1)/(2)
Kalecik 2 120 48 342 4.4Gokceoren — 64 015 —Bolu 3 695 157 628 2.3Kumbaba — 10 907 —Koprukoy 2 827 67 719 4.2Asartepe 4 786 77 149 6.2Akinci 289 39 453 0.7
Kizilirmak Timarli 12 367 99 293 12.5
IRRIGATION PERFORMANCE OF TRANSFERRED SCHEMES IN TURKEY 145
Timarli irrigation scheme with 12.5%, and the lowest ratio obtained in the Akinci irrigation scheme with 0.7%. This
low return rate in the Akinci irrigation scheme indicates that collected water fees are not sufficient to meet the
maintenance costs. Thus, not only the MOM costs but also maintenance costs per se are found to be higher than the
collected water fees.
In evaluating the financial performance indicators American dollars (US$) are taken as the currency unit to
facilitate comparison internationally. Table VII comprises the operating cost per unit irrigation area in the DSI Fifth
Region irrigation schemes. Even though the highest MOM cost occurred in Koprukoy with US$102 953, the highest
cost per unit area occurred in the Kalecik irrigation scheme with US$71.2 ha�1. The lowest cost was obtained in the
Bolu irrigation scheme with US$6.5 ha�1. Even though we obtained these results through the assessment of the
financial performance of the irrigation schemes in the case study area, further investigation of other schemes in
Turkey is needed to reach systematic conclusions.
The costs per person employed in water distribution were analysed in Table VIII. This value was obtained by
dividing the total costs of O&M personnel by the total number of people employed in O&M. The highest cost
occurred in the Akinci irrigation scheme with US$7045.9 per person, and the lowest in the Gokceoren irrigation
scheme with US$636.0 per person. In comparison of total MOM costs and total revenues of the irrigation schemes,
Akinci is more cost-effective than Gokceoren. To illustrate, cost recovery ratio of the Akinci irrigation scheme is
higher than that of Gokceoren. These figures can be elucidated further through cost–benefit analyses pertaining to
the financial performance of irrigation schemes in the study area.
Revenue collection performance is given in Table IX. The best performance was obtained in the Kalecik
irrigation scheme with 95%, and the lowest in the Koprukoy irrigation scheme with 78%. As a result, it is analysed
that revenue collection performance rates are decisive on all related financial performance indicators.
Table VII. Operating cost per unit area for the year 2003
Irrigation scheme Total operationcost (US$) (1)
Total command area servicedby the system (ha) (2)
Operating cost per unitarea (US$ ha�1) (1)/(2)
Kalecik 42 717 600 71.2Gokceoren 63 604 1 850 34.4Bolu 58 360 8 980 6.5Kumbaba 24 028 550 43.7Koprukoy 102 953 6 600 15.6Asartepe 79 875 1 500 53.3Akinci 43 144 2 800 15.4
Kizilirmak Timarli 93 852 4 840 19.4
Copyright # 2008 John Wiley & Sons, Ltd. Irrig. and Drain. 59: 138–149 (2010)

Table VIII. Total cost per person employed on water delivery for the year 2003
Irrigation scheme Total cost of MOMpersonnel (US$)
Total number of peopleemployed person
Cost per personnel(US$/person)
Kalecik 6 743 9 749.2Gokceoren 1 272 2 636.0Bolu 19 081 8 2 385.2Kumbaba 1 731 1 1 731.5Koprukoy 50 177 11 4 561.5Asartepe 29 941 8 3 742.7Akinci 28 184 4 7 045.9
Kizilirmak Timarli 42 049 6 7 008.3
Table IX. Revenue collection performance for the year 2003
Irrigation scheme Total collected waterfee from the users (US$) (1)
Total water fee to becollected (US$) (2)
Revenue collectionperformance (%) (1)/(2)
Kalecik 45 936 48 342 95Gokceoren 53 452 64 015 83Bolu 140 548 157 628 89Kumbaba 9 501 10 907 87Koprukoy 53 244 67 719 78Asartepe 61 452 77 149 79Akinci 37 006 39 453 93
Kizilirmak Timarli 89 94 94
146 B. CAKMAK ET AL.
Irrigation service areas and service areas per personnel are indicated in Table X. Of the DSI Fifth Region IAs,
Bolu IA has the highest personnel need and Kalecik IA the lowest. In the research area, service areas per O&M
personnel are quite large and it indicates that IAs have insufficient personnel.
The highest output per unit of command area was obtained from the Asartepe irrigation scheme with
US$2745.1 ha�1, and the lowest from the Gokceoren irrigation scheme with US$325.2 ha�1 (Table XI). The highest
output per unit of irrigated area was obtained from the Asartepe irrigation scheme with US$5070.9 ha�1 and the
lowest from Kizilirmak Timarli irrigation scheme with US$1028.0 ha�1 (Table XII). Based on the calculations of
Table X. Service area per personnel for the year 2003
Irrigation scheme Total number of personnelemployed in operation and
maintenance (1)
Irrigation area (ha) (2) Service area per personnel(ha/person) (2)/(1)
Kalecik 9 600 67Gokceoren 2 1 850 925Bolu 8 8 980 1 122Kumbaba 1 550 550Koprukoy 11 6 600 600Asartepe 8 1 500 188Akinci 4 2 800 700
Kizilirmak Timarli 6 4 840 806
Copyright # 2008 John Wiley & Sons, Ltd. Irrig. and Drain. 59: 138–149 (2010)

Table XI. Output per unit command area for the year 2003
Irrigation scheme Annual total agriculturalproduction (US$)
Irrigationarea (ha)
Output per unitcommand area (US$ ha�1)
Kalecik 1 001 367 600 1,669.0Gokceoren 601 583 1 850 325.2Bolu 6 627 355 8 980 738.0Kumbaba 283 694 550 515.8Koprukoy 2 211 394 6 600 335.1Asartepe 4 117 585 1 500 2,745.1Akinci 1 178 830 2 800 421.0
Kizilirmak Timarli 1 855 601 4 840 383.4
Table XII. Output per unit irrigated area for the year 2003
Irrigation scheme Annual total agriculturalproduction (US$)
Irrigationarea (ha)
Output per unitirrigated area (US$ ha�1)
Kalecik 1 001 367 211 4 745.8Gokceoren 601 583 202 2 978.1Bolu 6 627 355 2 194 3 020.7Kumbaba 283 694 63 4 503.1Koprukoy 2 211 394 1 429 1 547.5Asartepe 4 117 585 812 5 070.9Akinci 1 178 830 566 2 082.7
Kizilirmak Timarli 1 855 601 1 805 1 028.0
IRRIGATION PERFORMANCE OF TRANSFERRED SCHEMES IN TURKEY 147
annual total agricultural production and total amount of water diverted to the network, incomes per unit of water
diverted to the network are given in Table XIII. The Kalecik irrigation scheme had the highest income per unit of
irrigation water diverted to the network with US$0.7 m�3 and Kizilirmak Timarli and Koprukoy irrigation schemes
had the lowest income with US$0.2 m�3. The outputs per unit of consumed irrigation water are given in Table XIV.
The highest income was obtained from the Kumbaba irrigation scheme with US$2.6 m�3, and the lowest from
Kizilirmak Timarli irrigation scheme with US$0.2 m�3. Tables XI–XIVenable comparison of all irrigation schemes
in terms of command area, irrigated area, diverted water to network and irrigation water consumed.
Table XIII. Output per unit of irrigation supply for the year 2003
Irrigation scheme Annual total agriculturalproduction (US$)
Total amount of waterdiverted to network (m3)
Output per unit ofwater diverted (US$ m�3)
Kalecik 1 001 367 1 423 695 0.7Gokceoren 601 583 1 325 329 0.5Bolu 6 627 355 18 592 950 0.4Kumbaba 283 694 789 543 0.4Koprukoy 2 211 394 89 074 080 0.2Asartepe 4 117 585 11 264 698 0.4Akinci 1 178 830 10 031 256 0.1
Kizilirmak Timarli 1 855 601 86 200 000 0.2
Copyright # 2008 John Wiley & Sons, Ltd. Irrig. and Drain. 59: 138–149 (2010)

Table XIV. Output per unit of water consumed for the year 2003
Irrigation scheme Annual total agriculturalproduction ($)
Irrigation waterneed (m3)
Output per unit of waterconsumption (US$ m�3)
Kalecik 1 001 367 1 089 000 0.9Gokceoren 601 583 1 419 500 0.4Bolu 6 627 355 3 147 900 2.1Kumbaba 283 694 108 000 2.6Koprukoy 2 211 394 2 092 500 1.1Asartepe 4 117 585 3 838 500 1.1Akinci 1 178 830 1 467 014 0.8
Kizilirmak Timarli 1 855 601 11 149 096 0.2
148 B. CAKMAK ET AL.
Irrigation water resources of the DSI Fifth Regional Directorate service area are provided by the Kizilirmak river.
In this respect, irrigation salinity values in all irrigations were recorded to be almost the same. Salinity classes of all
irrigation schemes were determined as C3S1.
CONCLUSIONS AND RECOMMENDATIONS
The role of irrigation management transfer in reducing the financial burden on government as well as in improving
water use efficiency and equity through farmers’ involvement has been recognized by the concerned public
institutions in Turkey since the early 1990s. Hence, the DSI, the central water agency, has managed to transfer the
management, operation and maintenance of the irrigation systems at secondary and tertiary levels to the irrigation
associations.
Results of irrigation applications should be analysed to assess the operational success of the transferred irrigation
schemes. Commonly used performance indicators such as the irrigation ratio, irrigation efficiency, cost recovery
ratio and maintenance costs are particularly important for assessment of facility success. Accordingly, the results of
this study show that significant improvements are recorded in irrigation water fee collection rates and financial cost
reduction in irrigation systems operated by the IAs. Mixed results are observed in terms of irrigation ratios. While
there are improvements in two irrigation schemes, i.e. Kalecik and Gokceoren, there are evident increases in the
water supply ratio in six other irrigation schemes. Moreover, the MOM costs in general and the maintenance costs
per se have increased compared to the collected water fees in the case study irrigation schemes. It is observed that
the IAs, in the case study area, have been allocating very little from their revenues (collected water fees) to the
maintenance of the schemes. In this respect, works towards the modernization and rehabilitation of facilities
transferred by the DSI will be beneficial to increase the operational effectiveness of IAs in the future. Revenue
collection performance rates of the IAs are much higher (78% minimum) than the public institutions’ (DSI) overall
performance, which averaged 43% in 1993. Another key finding is that service areas per O&M personnel are quite
large, indicating that the IAs have insufficient personnel employed in O&M in the case study area.
This study includes the analyses of the irrigation performance of the schemes in only one of the Regional
Directorates of the DSI, and more systematic and comparative research needs to be conducted in order to be able to
analyse the whole set of irrigation schemes in Turkey. To illustrate, the study displays the comparison of the
financial performance indicators of the irrigation schemes such as the command area, irrigated area, diverted water
to network and consumed irrigation water in the case study area. Yet, further investigation of the other schemes in
Turkey is necessary to reach systematic conclusions pertaining to financial performance.
In a larger context, at national level, the desired benefits of transfers are not sufficiently achieved. Water fees are
far behind the current reliable values. In general, water measurement facilities allowing measured water
distribution are available in IAs, however they are not used effectively. Some IAs lack water measurement
infrastructure. Water fees are based on irrigated land area and crop type. Yet, ‘‘irrigation duration-hour’’ (TL h�1)
based pricing is applied in a few of them. Infrastructure for transition to volume-based (m3 or hour) pricing should
be established.
Copyright # 2008 John Wiley & Sons, Ltd. Irrig. and Drain. 59: 138–149 (2010)

IRRIGATION PERFORMANCE OF TRANSFERRED SCHEMES IN TURKEY 149
Participation of farmers in operations and management in the irrigation sector helps to ensure the sustainability
of the system, reduce public expenditure and improve efficiency, equity and standards of service. Thus,
sustainability of water resource management depends not only on appropriate technology, but also on the
institutions involved in irrigation management at local levels. Although it must be clear that IAs have great benefits
in managing water effectively in the irrigation sector, it should be equally emphasized that for sustainable IAs the
existence of a facilitating social, political and legal framework is essential. In Turkey, strategies related to irrigation
operations were not effectively put into action. Legal, technical and socio-economic infrastructure were not
strengthened enough. In this respect, the proposed ‘‘Irrigation Associations Law’’ can play an important role in
providing the necessary framework for the IAs to function properly.
REFERENCES
Bayazit M, Avci I. 1997. Water resources of Turkey: potential, planning, development and management. International Journal of Water
Resources Development 13(4): 443–452.
Burton M, Molden D, Scutsch J. 2000. Benchmarking irrigation and drainage system performance. Position Paper, International Programme on
Technology and Research in Irrigation and Drainage. IPTRID-FAO-WB, Report on a Workshop 3–4 August 2000, FAO, Rome, Italy.
Cakmak B. 2001. Konya Sulama Birliklerinde Sulama Performansinin Degerlendirilmesi. A.U.Ziraat Fakultesi Tarim Bilimleri Dergisi 7(3):
111–117, Ankara, Turkey.
Cakmak B, Beyribey M, Yildirim EY, Kodal S. 2004. Benchmarking performance of irrigation schemes: a case study from Turkey. Irrigation and
Drainage 53(2): 155–164.
Kibaroglu A, Scheumann W, Klaphake A, Kramer A, Carius A. 2005. Cooperation on Turkey’s Transboundary Waters. Berlin Technical
University, Federal Ministry for Environment, Nature Conservation and Nuclear Safety: Berlin, Germany.
Kloezen W, Garces-Restrepo C. 1998. Assessing Irrigation Performance with Comparative Indicators: the Case of the Alto Rio Lerma Irrigation
District, Mexico. Research Report 22. International Water Management Institute: Colombo, Sri Lanka.
Malano H, Burton M. 2001. Guidelines for Benchmarking Performance in the Irrigation and Drainage Sector. International Programme for
Technology and Research in Irrigation and Drainage (IPTRID), FAO: Rome, Italy; 44 pp.
Molden DJ, Sakthivadiel R, Perry C, Fraiture J. 1998. Indicators for Comparing the Performance Irrigated Agriculture. IWMI Research Report
20, Sri Lanka.
Murray-Rust DH, Svendsen M. 2001. Performance of locally managed irrigation in Turkey: Gediz case study. Irrigation and Drainage Systems
15: 373–388, the Netherlands.
State Hydraulic Works (DSI) Fifth Regional Directorate. 2003a. Irrigation Results. Ankara.
State Hydraulic Works (DSI) Fifth Regional Directorate. 2003b. Evaluation Report of Irrigation Schemes Operated by DSI and Transferred.
General Directorate of DSI, Operation and Maintenance Unit: Ankara, Turkey.
State Hydraulic Works (DSI) Fifth Regional Directorate. 2004a. Bolu-Golkoy Study. Ankara, Turkey.
State Hydraulic Works (DSI) Fifth Regional Directorate. 2004b. Cropping Pattern and Plantation Report. Ankara, Turkey.
State Hydraulic Works (DSI) Fifth Regional Directorate. 2005. Evaluation Report of Irrigation Schemes Operated by DSI and Transferred.
General Directorate of the State Hydraulic Works, Operation and Maintenance Unit: Ankara, Turkey.
State Hydraulic Works (DSI) Fifth Regional Directorate. 2007. The role of the General Directorate of State Hydraulic Works in development of
water resources of Turkey. In: Proceedings of the International Congress on River Basin Management, Antalya; 9.
Svendsen M, Murray-Rust DH. 2001. Creating and consulting locally managed irrigation in Turkey: the national perspective. Irrigation and
Drainage Systems 15: 355–371, the Netherlands.
Vermillion DL, Garces-Restrepo C. 1998. Impacts of Colombia’s Current Irrigation Management Transfer Program. International Water
Management Institute, Research Report 25, Colombo, Sri Lanka.
Vermillion DL, Samad M, Pusposutardjo S, Arif SS, Rochdyanto S. 2000. An Assessment of the Small-Scale Irrigation Management Turnover
Program in Indonesia. International Water Management Institute, Research Report 38, Colombo, Sri Lanka.
Yercan M, Dorsan F, Ul MA. 2004. Comparative analysis of performance criteria in irrigation schemes: a case study of the Gediz River Basin in
Turkey. Agricultural Water Management 66(2004): 259–266.
Copyright # 2008 John Wiley & Sons, Ltd. Irrig. and Drain. 59: 138–149 (2010)