Assessment of basin-scale hydrologic impacts of CO 2 sequestration, Illinois basin
15
International Journal of Greenhouse Gas Control 4 (2010) 840–854 Contents lists available at ScienceDirect International Journal of Greenhouse Gas Control journal homepage: www.elsevier.com/locate/ijggc Assessment of basin-scale hydrologic impacts of CO 2 sequestration, Illinois basin Mark Person a,∗ , Amlan Banerjee a , John Rupp b , Cristian Medina b , Peter Lichtner c , Carl Gable c , Rajesh Pawar c , Michael Celia d , Jennifer McIntosh e , Victor Bense f a New Mexico Institute of Mining and Technology, Department of Earth & Environmental Science, 801 Leroy Place, Socorro, NM 87801, USA b Indiana Geological Survey, Indiana University, 611 North Walnut Grove, Bloomington, IN 47405-2208, USA c Los Alamos National Laboratory, EES-16, Las Alamos, NM 87545, USA d Princeton University, Department of Civil Engineering, E-208 E-Quad, Princeton, NJ 08544, USA e University of Arizona, Department of Hydrology and Water Resources, 1133 E. James E. Rogers Way, Tucson, AZ 85721, USA f School of Environmental Sciences, University of East Anglia, Norwich, NR4 7TJ, England, UK article info Article history: Received 26 June 2009 Received in revised form 1 April 2010 Accepted 7 April 2010 Available online 14 May 2010 Keywords: Mount Simon Illinois basin CO2 Earthquakes Pressure Brine transport abstract Idealized, basin-scale sharp-interface models of CO 2 injection were constructed for the Illinois basin. Porosity and permeability were decreased with depth within the Mount Simon Formation. Eau Claire confining unit porosity and permeability were kept fixed. We used 726 injection wells located near 42 power plants to deliver 80 million metric tons of CO 2 /year. After 100 years of continuous injection, deviatoric fluid pressures varied between 5.6 and 18 MPa across central and southern part of the Illinois basin. Maximum deviatoric pressure reached about 50% of lithostatic levels to the south. The pressure disturbance (>0.03 MPa) propagated 10–25 km away from the injection wells resulting in significant well–well pressure interference. These findings are consistent with single-phase analytical solutions of injection. The radial footprint of the CO 2 plume at each well was only 0.5–2 km after 100 years of injection. Net lateral brine displacement was insignificant due to increasing radial distance from injection well and leakage across the Eau Claire confining unit. On geologic time scales CO 2 would migrate northward at a rate of about 6 m/1000 years. Because of paleo-seismic events in this region (M5.5–M7.5), care should be taken to avoid high pore pressures in the southern Illinois basin. © 2010 Elsevier Ltd. All rights reserved. 1. Introduction The Illinois basin is host to dozens of coal-fired power plants which generate about 300 million metric tons (MT) of CO 2 annually (squares in Fig. 1A). As part of the Department of Energy’s Geo- logical Sequestration Regional Partnership program, the Midwest Geological Sequestration Consortium (MGSC), a partnership that includes the three state geological surveys in the Illinois basin, is investigating the technical constraints on the injection of CO 2 into deep (>1.5 km) reservoirs under supercritical conditions (Midwest Geological Sequestration Consortium, 2005). The Mount Simon Sandstone, a Cambrian siliciclastic unit that is present through- out the basin, is a saline water filled aquifer that is a candidate reservoir for geological sequestration (Fig. 1B). At these depths, the Mount Simon pore fluids are often in excess of 100,000 mg/L (chloride concentrations of about 1700 mM; Hanor, 1987; Hanor and McIntosh, 2006). Simple back of the envelope calculation sug- gests that there is adequate pore space to accommodate the amount of annual CO 2 production. Assuming that CO 2 is emplaced as a ∗ Corresponding author. Tel.: +1 575 835 6506; fax: +1 575 835 6436. E-mail address: [email protected] (M. Person). supercritical fluid having a density of 500 kg/m 3 into a 500 m thick Mount Simon Sandstone having an average porosity of 10%, 80 mil- lion metric tons of CO 2 (about 25% of the CO 2 produced across the basin) could displace all of the brines from an area surround- ing a well field and would have an approximate aerial footprint of about 1.8 km × 1.8 km each year. Assuming a simple geometry for the Mount Simon and Illinois basin (500 km × 600 km × 500 m) and a piston-type displacement, of this volume of CO 2 would result in the displacement of brines out of the center of the Illinois basin towards its outer margins at a rate of about 0.003 m/year. This cal- culation does not account for more rapid solute migration along permeable pathways (e.g. Liu et al., 2004) and must be considered as a minimum estimate. It is critical to ensure that fluid pressures near the CO 2 injection wells do not exceed 66% of lithostatic levels in order to minimize the potential of hydrofracturing of the overlying Eau Claire confin- ing unit or inducing earthquakes (e.g. Hsieh and Bredehoeft, 1981; Nicholson and Wesson, 1990; Zoback and Harjes, 1997). More site- specific studies are required to delineate maximum pressures of hydrofracturing. In case of pre-existing fractures or faults, this value would be much smaller. This is particularly important for the southern Illinois basin which hosts active seismogenic zones including the Wabash Valley and New Madrid Seismic Zones (Fig. 2; 1750-5836/$ – see front matter © 2010 Elsevier Ltd. All rights reserved. doi:10.1016/j.ijggc.2010.04.004
-
Upload
independent -
Category
Documents
-
view
0 -
download
0
Transcript of Assessment of basin-scale hydrologic impacts of CO 2 sequestration, Illinois basin
A
MRa
b
c
d
e
f
a
ARRAA
KMICEPB
1
w(lGiidGSort(ago
1d
International Journal of Greenhouse Gas Control 4 (2010) 840–854
Contents lists available at ScienceDirect
International Journal of Greenhouse Gas Control
journa l homepage: www.e lsev ier .com/ locate / i jggc
ssessment of basin-scale hydrologic impacts of CO2 sequestration, Illinois basin
ark Persona,∗, Amlan Banerjeea, John Ruppb, Cristian Medinab, Peter Lichtnerc, Carl Gablec,ajesh Pawarc, Michael Celiad, Jennifer McIntoshe, Victor Bensef
New Mexico Institute of Mining and Technology, Department of Earth & Environmental Science, 801 Leroy Place, Socorro, NM 87801, USAIndiana Geological Survey, Indiana University, 611 North Walnut Grove, Bloomington, IN 47405-2208, USALos Alamos National Laboratory, EES-16, Las Alamos, NM 87545, USAPrinceton University, Department of Civil Engineering, E-208 E-Quad, Princeton, NJ 08544, USAUniversity of Arizona, Department of Hydrology and Water Resources, 1133 E. James E. Rogers Way, Tucson, AZ 85721, USASchool of Environmental Sciences, University of East Anglia, Norwich, NR4 7TJ, England, UK
r t i c l e i n f o
rticle history:eceived 26 June 2009eceived in revised form 1 April 2010ccepted 7 April 2010vailable online 14 May 2010
eywords:
a b s t r a c t
Idealized, basin-scale sharp-interface models of CO2 injection were constructed for the Illinois basin.Porosity and permeability were decreased with depth within the Mount Simon Formation. Eau Claireconfining unit porosity and permeability were kept fixed. We used 726 injection wells located near42 power plants to deliver 80 million metric tons of CO2/year. After 100 years of continuous injection,deviatoric fluid pressures varied between 5.6 and 18 MPa across central and southern part of the Illinoisbasin. Maximum deviatoric pressure reached about 50% of lithostatic levels to the south. The pressure
ount Simonllinois basinO2
arthquakesressurerine transport
disturbance (>0.03 MPa) propagated 10–25 km away from the injection wells resulting in significantwell–well pressure interference. These findings are consistent with single-phase analytical solutions ofinjection. The radial footprint of the CO2 plume at each well was only 0.5–2 km after 100 years of injection.Net lateral brine displacement was insignificant due to increasing radial distance from injection well andleakage across the Eau Claire confining unit. On geologic time scales CO2 would migrate northward at arate of about 6 m/1000 years. Because of paleo-seismic events in this region (M5.5–M7.5), care should be
press
taken to avoid high pore. Introduction
The Illinois basin is host to dozens of coal-fired power plantshich generate about 300 million metric tons (MT) of CO2 annually
squares in Fig. 1A). As part of the Department of Energy’s Geo-ogical Sequestration Regional Partnership program, the Midwesteological Sequestration Consortium (MGSC), a partnership that
ncludes the three state geological surveys in the Illinois basin, isnvestigating the technical constraints on the injection of CO2 intoeep (>1.5 km) reservoirs under supercritical conditions (Midwesteological Sequestration Consortium, 2005). The Mount Simonandstone, a Cambrian siliciclastic unit that is present through-ut the basin, is a saline water filled aquifer that is a candidateeservoir for geological sequestration (Fig. 1B). At these depths,he Mount Simon pore fluids are often in excess of 100,000 mg/L
chloride concentrations of about 1700 mM; Hanor, 1987; Hanornd McIntosh, 2006). Simple back of the envelope calculation sug-ests that there is adequate pore space to accommodate the amountf annual CO2 production. Assuming that CO2 is emplaced as a∗ Corresponding author. Tel.: +1 575 835 6506; fax: +1 575 835 6436.E-mail address: [email protected] (M. Person).
750-5836/$ – see front matter © 2010 Elsevier Ltd. All rights reserved.oi:10.1016/j.ijggc.2010.04.004
ures in the southern Illinois basin.© 2010 Elsevier Ltd. All rights reserved.
supercritical fluid having a density of 500 kg/m3 into a 500 m thickMount Simon Sandstone having an average porosity of 10%, 80 mil-lion metric tons of CO2 (about 25% of the CO2 produced acrossthe basin) could displace all of the brines from an area surround-ing a well field and would have an approximate aerial footprint ofabout 1.8 km × 1.8 km each year. Assuming a simple geometry forthe Mount Simon and Illinois basin (500 km × 600 km × 500 m) anda piston-type displacement, of this volume of CO2 would result inthe displacement of brines out of the center of the Illinois basintowards its outer margins at a rate of about 0.003 m/year. This cal-culation does not account for more rapid solute migration alongpermeable pathways (e.g. Liu et al., 2004) and must be consideredas a minimum estimate.
It is critical to ensure that fluid pressures near the CO2 injectionwells do not exceed 66% of lithostatic levels in order to minimizethe potential of hydrofracturing of the overlying Eau Claire confin-ing unit or inducing earthquakes (e.g. Hsieh and Bredehoeft, 1981;Nicholson and Wesson, 1990; Zoback and Harjes, 1997). More site-
specific studies are required to delineate maximum pressures ofhydrofracturing. In case of pre-existing fractures or faults, thisvalue would be much smaller. This is particularly important forthe southern Illinois basin which hosts active seismogenic zonesincluding the Wabash Valley and New Madrid Seismic Zones (Fig. 2;
M. Person et al. / International Journal of Greenhouse Gas Control 4 (2010) 840–854 841
Fig. 1. (A) Basemap showing location of power plants and sharp-interface model domain. (B) Salinity patterns (in mM Cl−1) within the Cambrian-Ordovician aquifer acrosst bro-Ot r Chico ig. 1AC nd Ba
EdtdaFcwEebwbcCSeeptast
aoSS
he Illinois Basin profiles within Illinois Basin. (C) Drawdown patterns (in m) in Camhe Ironton Galesville and Mount Simon formations. Drawdown exceeds 183 m nean the same order of magnitude as CO2 produced from power plants (squares in Fhicago Illinois (after Visocky, 1997). (E) Mount Simon head patterns (after Gupta a
ager et al., 2006; Cramer et al., 1992). Carbon-14 dating of sandikes and other liquefaction features near fault zones suggestshat a series of high magnitude (M5.5–M7.5) earthquakes occurreduring the Holocene across the southern Illinois basin (Wheelernd Cramer, 2002; Obermeier et al., 1992; Munson et al., 1992;ig. 2). The largest historic earthquake on North America is asso-iated with the Reelfoot Rift system (New Madrid Seismic Zone)hose northern margin extends into the southern Illinois basin.
ager et al. (2006) suggest that the tight clustering of recent micro-arthquakes (∼M1.1) along the Wabash Valley Seismic zone maye due to secondary injection of water associated with water floodsithin the Illinois basin. Several seismic events (M4.3–M2.8) are
elieved to be the result of 11 MPa of induced pore pressure asso-iated with pumping of 164 m3/day of hazardous waste into alass-I injection site in the basal Paleozoic reservoir (not the Mountimon Formation) in Ohio (Nicholson and Wesson, 1990; Nicholsont al., 1988; Seeber et al., 2004). These authors report that thesearthquakes occurred 2 km below Mount Simon formation along areviously unmapped Precambrian fault zone. What is troubling ishat the induced pore pressures were far below lithostatic levelsnd that some of the faults within the southern Illinois basin areub-parallel to the maximum horizontal compressive stress direc-ion (Zoback and Hickman, 1982; Zoback and Zoback, 1989a,b,c).
There are reasons to be concerned that pore pressures couldpproach the lithostatic pressure (fracture pressure) as a resultf large-scale CO2 injection within the Cambrian Mount Simonandstone. First, the average core permeability of the Mountimon reservoir is relatively low (less than 100 mD) and (as dis-
rdovician aquifer system near Chicago. Drawdrown patterns around Chicago withinago (after Lloyd and Lyke, 1995) due to municipal water well withdraws which are). (D) Cumulative freshwater withdraws from Cambro-Ordovician aquifer system,ir, 1997).
cussed below) core permeability values decrease with depth.Second, 20th century water withdrawals from the Illinois basinCambro-Ordovican aquifer system (which includes the MountSimon Formation; Walton, 1962) resulted in large regions (50 kmby 50 km) of significant sub-hydrostatic fluid pressures aroundChicago (Olcott, 1992; Visocky, 1982; Fig. 1C) due to freshwa-ter withdrawals (Visocky, 1997; Fig. 1D). The annual withdrawalsfrom municipal water supply wells from deep siliciclastic aquifersbeneath cities of Chicago (e.g. 235 million metric tons of H2O;Fig. 1D) are of the same order of magnitude as the mass of CO2 gen-erated across the Illinois basin by coal-fired power plants. Freshwater withdraws have modified regional groundwater flow pat-terns and resulted in a decrease of as much as 45 m (0.45 MPa)in the Mount Simon Sandstone potentiometric surface in a lim-ited area around the Twin Cities of Minneapolis/St. Paul, and byover 182 m (1.8 MPa) in the Chicago area. Would CO2 injectionfrom more regionally distributed power plants result in comparableincreases in heads and modification in groundwater flow direc-tions? While CO2 injection would presumably occur over a muchmore distributed area, the Mount Simon is probably less perme-able to the south of Chicago where many coal-fired power plantsare located.
The purpose of this study is to assess some of the hydrologic
and potential seismogenic consequences of CO2 injection into theMount Simon Formation at the sedimentary basin-scale. Whilea number of studies have quantified the effects of CO2 injectioninto subsurface reservoirs around the world (e.g. Chadwick et al.,2003; Hovorka et al., 2001; Lu and Lichtner, 2007), these studies
842 M. Person et al. / International Journal of Greenhouse Gas Control 4 (2010) 840–854
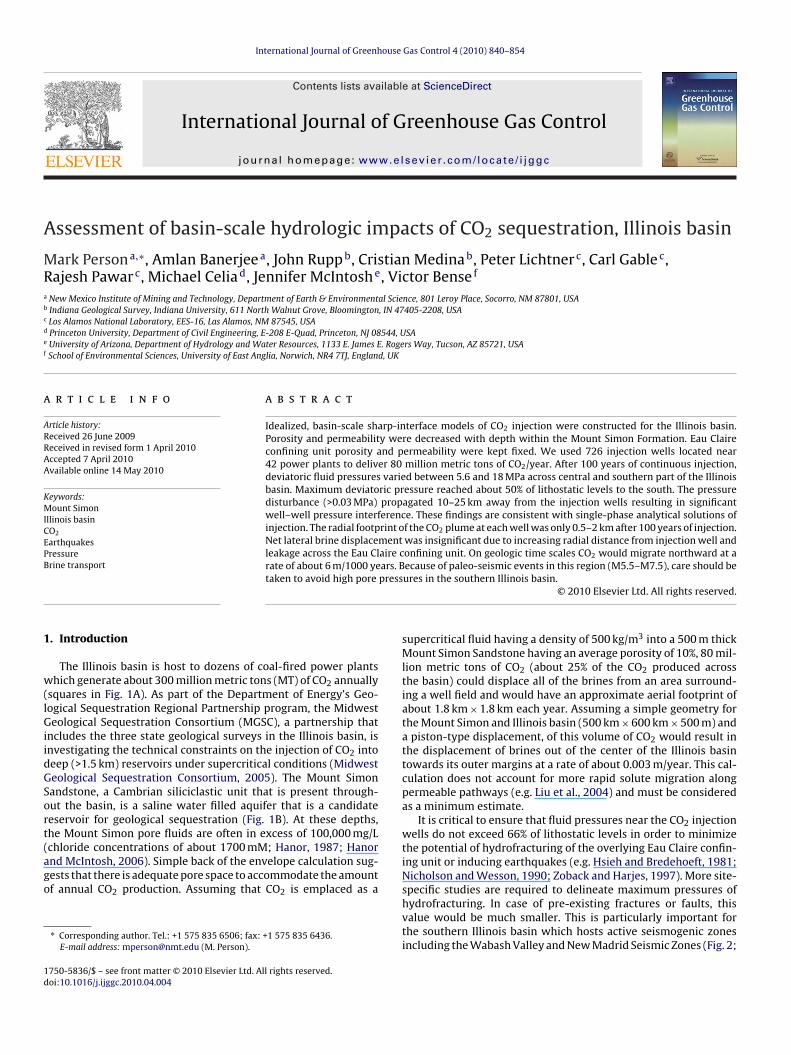
Fig. 2. (A) Locations, estimated magnitudes, and age of Holocene earthquake activity across southern Illinois basin. Major fault systems include the Rough Creek (RC) andLusk Creek (LC) Fault Systems. The shaded patterns denote active fault systems or seismogenic zones. Earth quake magnitudes and ages are based on scale and 14C age dateso eeler at ss infW e rea
h1wt2adtsrsWsSbtwbntactp
(nu
f liquefaction features such as sand dikes in the vicinity of fault systems (after Whhe southern Illinois basin. Blue lines indicate direction of maximum horizontal stre
esson, 1990). (For interpretation of the references to color in this figure legend, th
ave focused on localized regions (up to about 10 km by 10 km by00 m in the x-, y-, and z-directions, respectively) around injectionells and have neglected the impact of pore pressure increase on
he regional flow field. With exception of (Birkholzer et al., 2008,009a,b; Birkholzer and Zhou, 2009; Nicot, 2008; Yamamoto etl., 2009), we are aware of no quantitative models that have beeneveloped to consider the consequences of large-scale CO2 injec-ion at the sedimentary basin-scale. A secondary objective of thistudy is to demonstrate the efficacy of numerical sharp-interfaceepresentations of CO2 injection. We propose to address severalpecific questions regarding basin-scale CO2 injection in this study:
ill large-scale CO2 injection result in the generation of near litho-tatic pressures in relatively low permeability regions of the Mountimon Sandstone reservoir or will pressure anomalies be mitigatedy leakage across the overlying Eau Claire confining unit? What ishe likely radius of pressure disturbance away from CO2 injectionells? Will there be significant well–well interference within- or
etween-injection well centers? Does CO2 injection result in sig-ificant displacement of brines towards the margins of the basino the North where the Mount Simon Sandstone is exploited as
water resource? Will CO2 injection result in significant verti-al brine displacement across the Eau Claire confining unit? Arehere optimal regions of the basin that would likely minimize pore
ressure generation and the potential for induced seismic activity?As noted by the ground breaking studies of Birkholzer et al.2008) and Birkholzer et al. (2009a,b) some of these questionseed to be addressed at the sedimentary basin-scale to ensure thatnforeseen well–well interactions do not occur while others can be
nd Cramer, 2002). The red circles denote the estimated earthquake magnitudes inerred from borehole stress tests and borehole elongation data (from Nicholson andder is referred to the web version of the article.)
addressed with more localized analysis. We argue below that thereare alternatives to using computationally expensive, multi-phasesimulators to address these issues at the sedimentary basin-scale.Recently, Nordbotten et al. (2004, 2005) argued that simple, ana-lytical models based on sharp-interface theory are of great value inproviding order of magnitude estimates of the hydrologic and envi-ronmental consequences of CO2 injection. By using sharp-interfacetheory, these authors were able to capture much of the relevantphysics of the CO2 injection problem without relying on numericalmethods. In this study, we addressed the questions presented aboveby developing sharp-interface models of CO2 injection across theIllinois basin. Our calculations are compared to multi-phase modelsincluding TOUGH2 (Birkholzer et al., 2008). Our study does not con-sider the effects of CO2 leakage along abandoned petroleum wells(Nordbotten et al., 2004, 2005). We also compare our model resultsto single-phase analytical solutions of Hantush and Jacob (1955).
2. Study area
The Illinois basin is an intercratonic Paleozoic basin whichformed in response to thermal subsidence and Appalachian tecton-ics (Kolata and Nelson, 1990; Beaumont et al., 1988). It is slightlyelongated in a NW–SE direction. It is about ∼620 km long, 375 km
wide, and over 4.5 km in depth. Our analysis focuses on the basalCambrian Mount Simon Sandstone reservoir and overlying EauClaire confining unit which overlies the Precambrian basement(Lloyd and Lyke, 1995). The slope of the Mount Simon is low (0.006).Mount Simon depth varies from 800 to >4000 m (Fig. 3a) while its
M. Person et al. / International Journal of Greenhouse Gas Control 4 (2010) 840–854 843
F n Forms
tMibfpitaiamiit
ig. 3. Spatial variations in (a) depth (m) and (b) thickness (m) of the Mount Simohown (red line).
hickness varies from 50 to 610 m from South to North (Fig. 3b).edina and Rupp (2009) subdivided the Mount Simon Sandstone
nto three subunits based primary on the gamma ray response fromorehole geophysical logs. A generalization of the subunits is asollows: the upper unit has a relatively high value of gamma rayossibly due the admixture of more argillaceous material result-
ng from the transition from a high energy, open marine settingso a quieter more clay-rich depositional environment (Bowen etl., 2009; Fischietto et al., 2009). The middle unit was defined byts lower gamma ray values that result from a cleaner sandstonend probably constitutes the main flow unit, whereas the lower-
ost unit was defined by gamma ray values that progressivelyncreases with depth to the base of the formation. This increases due to the increased non-quartz fractions in the formation ashe top of the Precambrian basement complex is approached. In
ation across the Illinois basin. The boundary of the sharp-interface model is also
this study, we focused on CO2 injection into the middle unit ofthe Mount Simon. The Eau Claire Formation, a unit that is domi-nantly shale, functions as a confining unit over the Mount Simon.The Eau Claire thickness varies between 50 and 100 m. Permeabil-ity data on the Eau Claire is not plentiful and there is considerableuncertainty in how it changes with depth and with scale (Birkholzeret al., 2008). The few available permeability measurements of EauClaire permeability range between 1.4 × 10⁻¹⁸ and 6.7 × 10⁻²⁰ m2
(0.0014–0.00067 mD) as reported by Witherspoon et al. (1962),Walton (1962), Mandle and Kontis (1992) and Witherspoon andNeuman (1967). Birkholzer et al. (2009a,b) argued that the pres-
ence of fractures could increase the effective basin-scale verticalpermeability of the Eau Claire by about two orders of magnitudecompared to pore-scale estimates. These two units are overlain bya sequence of Ordovician to Pennsylvanian—age sandstones, shales,
8 of Gree
aiaeptaMtsPaaRaW
bKapwvllbwdhltIpes(mMwbmsmafchaa(s
saectv(daSMoib
represent those facies that are most common and laterally exten-sive. A preliminary intraformational subdivision of this unit intothree has been completed recently by MGSC (Leetaru et al., 2008a,b;Medina and Rupp, 2009). Within these basin wide subdivisions
Fig. 4. Porosity–depth relationship of the Mount Simon Sandstone based on core
44 M. Person et al. / International Journal
nd carbonate and coal units. Estimates of sediment compressibil-ty for the Mount Simon Formation summarized by Birkholzer etl. (2008) range from 3.7 × 10⁻¹⁰ to 6.0 × 10⁻¹⁰ Pa−1. These values,stimated from pumping tests, are exceptionally low (the com-ressibility of water is 4 × 10⁻¹⁰ Pa−1). A thin veneer of Pleistoceneo Quaternary-age unconsolidated sediments overlies the basin,long the northern glaciated margin, in stream valleys, and theississippian Embayment to the south. The surface topography of
he basin is relatively subdued, with less than 300 m of relief. Theouthern margin of the Illinois basin was deformed during the latealeozoic through Mesozoic by tectonic uplift of the Pascola Archnd downwarping of the Mississippian Embayment. Uplift wasccommodated, in part, by the generation of the Cottage Grove andough Creek-Shawneetown fault systems which trend east–westnd extends from the Precambrian basement to the surface. Theabash Valley fault system was also rejuvenated at this time.Four prior basin-scale hydrogeologic models within the Illinois
asin have been developed by Bethke et al. (1991), Mandle andontis (1992), Gupta and Bair (1997), and Breemer et al. (2002),nd Birkholzer and Zhou (2009). The study of Gupta and Bair (1997)resented drill-stem test (DST) data suggesting hydraulic headsithin the Mount Simon were near hydrostatic levels (Fig. 1E). Ele-
ated freshwater heads vary from about 200 to −50 m above seaevel (Fig. 1E). Head gradients across the Mount Simon are ratherow (0.0003). Within the water table aquifer across the Illinoisasin (not shown), flow is generally from the north to south butith significant local flow systems associated with surface waterrainage networks. Bethke et al. (1991) argued that brines andydrocarbons migrated through the Illinois basin over relatively
ong geologic time scales (millions of years) and over 600 km dis-ance, driven by tectonic uplift of the Ouachitas and Pascola Arch.t is also likely that Pleistocene glaciations have influenced salinityatterns across the Illinois basin (McIntosh et al., 2004; Schlegelt al., 2008). The Illinois basin was overrun by the Laurentide iceheets at least twice during the late Pleistocene. Breemer et al.2002) developed a series of NE–SW cross-sectional hydrologic
odels across the Illinois basin following the traverse of the Lakeichigan Lobe of the Laurentide Ice Sheet. The goal of this studyas to assess the development of basal pore pressures conditions
eneath the ice sheet to better understand sliding and basal sedi-ent deformation mechanisms beneath this ice lobe. Their results
uggest that the asymmetric salinity pattern from north to southay have been caused by ice sheet derived infiltration (Person et
l., 2009). Stable isotope composition and Na–Ca–Cl–Br relations oformation waters within the Illinois basin are indicative of evapo-oncentrated seawater, suggesting that these Paleozoic-age fluidsave not been completely flushed by meteoric recharge (Stuebernd Walter, 1994). Membrane filtration has also been proposed asmechanism for high brine concentrations within the Illinois basin
Bredehoeft et al., 1963) although this has not been confirmed bytable isotope data or salinity patterns.
Birkholzer et al. (2008) presented models evaluating the basin-cale consequences of CO2 injection across the Illinois basin usingparallel version of TOUGH2. Like this study, these authors consid-red CO2 injection into the Mount Simon and overlying Eau Claireonfining unit. CO2 was injected into 20 sites located in the center ofhe Illinois basin in south central Illinois and Indiana. These authorsaried the rate of CO2 injection of 5 million metric tons/year/well2.7–8.2 × 104 m3/day) (Birkholzer and Zhou, 2009) adjusting CO2ensity of as a function of pressure, temperature and salinity. Theyssigned a permeability to the Eau Claire of 10−18 m2. The Mount
imon was discretized into 24 layers. The total thickness of theount Simon that received CO2 was about 95 m. The permeabilityf the member of the Mount Simon that received CO2 was var-ed between 100 mD around injections sites and set to 500 mDeyond a radius of 5 km. A uniform value of 500 mD was used for
nhouse Gas Control 4 (2010) 840–854
all 24 Mount Simon layers away from the injection site. The watersaturated aquifer compressibility was assigned a value of about5 × 10−10 Pa−1 based on the results of a long-term pump test. Owingto the high permeability of the Mt Simon (1 Darcy) computed pres-sures propagated across the entire Illinois basin (>200 km) after 30years of continuous injection. Pore pressures never exceeded 3 MPaowing to the relatively permeable conditions represented in theirmodel. The separate-phase CO2 plume was confined to a narrowregion around the injection well (about 3 km radial distance).
As part of the MGSC (Midwest Geological Carbon SequestrationConsortium) assessment, published information, core analyses, andgeophysical well logs from the Mount Simon Sandstone (Cambrian)in the Illinois basin were analyzed to determine the spatial anddepth related trends of porosity and permeability of the reser-voir throughout the basin (Bowersox, pers. comm., 2008; Hoholicket al., 1984). Porosity data suggest that the average pore volumedecreases with depth from 0.27 in the shallow northern portion ofthe basin to 0.02 in the deep southern part of the basin following anAthy-type (Athy, 1930) relationship (Line A, Fig. 4). This relation-ship (expressed as an exponential function) is attributed primarilyto mechanical compaction and diagenetic changes. Some of theporosity reduction is an expression of the formation of quartz over-growths within the pore structure. Medina et al. (2008) used thedata presented in Fig. 4 to develop a best fit relationship betweenporosity–depth. For this study, however, we used a more idealizedlinear porosity–depth relation (line B in Fig. 4). The relationshipof permeability with depth in the Illinois basin was establishedby extrapolating the regional porosity–permeability relationshipestablished by Medina et al. (2008) (line A, Fig. 5) for the extent ofthe Mount Simon outside of the Illinois basin. The permeability val-ues for the area located to the east of the deep Illinois basin showeda variation between 10,000 and 0.01 mD within the Mount Simon.Within the portions of the Illinois basin below 2500 m where per-meability data is available (e.g. Marion Co., IL, Gibson Co., IN andKnox Co., IN) the Mount Simon has porosity values below 0.05 andpermeability values of less than 5 mD (Bowen et al., 2009). Thesedata confirm the porosity–permeability relationship establishedoutside of the Illinois basin. Again, we choose to use a simple linearpermeability–depth relationship for this study (line B; Fig. 5).
As the Mount Simon is composed of a variety of different litho-facies, the values chosen for use in the modeling were designed to
analyses from wells in the Illinois basin. These data indicated an (Athy-type) expo-nential relationship between porosity and depth shown by red line A (data compiledby Bowersox, 2008, pers. comm.). We used a simple linear porosity–depth relation-ship for sharp-interface modeling as shown by black line B. (For interpretation ofthe references to color in this figure legend, the reader is referred to the web versionof the article.)

M. Person et al. / International Journal of Gree
Fig. 5. Porosity–permeability data for Mount Simon Formation (Medina et al, 2008).Tppw
tftstldbimdbdscBpaeoctt
3
irttiasowiwb(
3
fiicT
he red line A is the best fit regression line while black line B is obtained from theorosity–permeability relationship used for the sharp-interface model. (For inter-retation of the references to color in this figure legend, the reader is referred to theeb version of the article.)
here is the possibility for the presence of non-quartz dominatedacies, such as arkosic units as defined by Leetaru et al. (2008a,b)hat were encountered within the ADM well at the Decatur testite. As these arkosic intervals do not appear in the deeper pene-rations of the Mount Simon in the southern part of the basin, theow porosity and permeability, highly cemented quartz sandstoneominated lithofacies were chosen to represent that part of theasin in the modeling efforts. A zone of 1 Darcy plus permeabil-
ty was encountered in the ADM and rocks of a similar characteray be present in the shallow portion of the Illinois basin but no
ata confirms its extent to the south into the deeper part of theasin. Because the calculated exponential relationship is based fun-amentally on the formation of quartz overgrowth cements in cleanandstones, it does not take into account the complexities asso-iated with porosity preservation and formation in arkosic units.ecause of this complex relationship between permeability andorosity with burial depth, we simplified these trends by assuminglinear relationship bounded by the extreme values for these prop-rties found within the study area. Future studies are necessary inrder to incorporate the complexities observed in the petrophysi-al properties of the porous media aiming to assess the impact thathese elements of the conceptual model may have on the propaga-ion of the pressures within the basin.
. Methods
We developed both single-phase and multi-phase (sharp-nterface) models of CO2 injection. The single-phase modelepresents injection into the Mount Simon and leakage acrosshe Eau Claire confining unit. These calculations provide groundruth for our numerical models discussed below. Some simplify-ng assumptions are required as the hydrologic properties mustssigned assuming either a CO2 or H2O dominated fluid for theingle-phase analysis. The sharp-interface model overcomes somef these limitations, in part, in that hydrologic properties can varyith CO2 and brine lens thickness. However, even in the sharp-
nterface model, CO2 and H2O density and viscosity were not variedith depth. We developed sharp-interface models of the Illinois
asin for both intermediate scale (∼3000 km2) and basin scale∼230,000 km2) (Fig. 1A).
.1. Analytic single-phase models
Our analysis of the Mount Simon aquifer and Eau Claire con-ning unit begins by developing simple analytical models of CO2
njection into a homogenous, isotropic aquifer overlain by a leakyonfining unit following the approach of Hantush and Jacob (1955).he approach is idealized because it assumes a single fluid phase
nhouse Gas Control 4 (2010) 840–854 845
under conditions of steady-state leakage across a confining unit.The Eau Claire is assigned a constant thickness and permeability.The governing equation describing radial flow under conditions ofsingle-phase fluid injection and leakage across an overlying confin-ing unit is given by Hantush and Jacob (1955):
S
T
∂s
∂t= 1
r
∂s
∂r+ ∂2s
∂r2− K ′
Tb′ s (1)
where S is the storativity (L3 L−3), r is radial distance (L) from theinjection well, t is time (T), s is change in head above hydrostatic (L),T is aquifer transmissivity (L2 T−1), K′ in the hydraulic conductivityof the confining unit (L T−1), and b′ is the thickness of the confin-ing unit (L). These authors solved Eq. (1) subject to the followingboundary conditions:
s(r = ∞, t) = 0
r∂s
∂r= − Q
2�Tlim r → 0
(2)
where Q is the volumetric CO2 injection rate (L3 T−1). We assumehydrostatic initial conditions (i.e. s(r, t = 0) = 0 m). Hantush andJacob (1955) found that the solution to Eq. (1) is given by:
s = Q
4�TL(u, v) (3)
where
u = r2S
4Tt, v = r
ˇ, ˇ =
√T
b′
K ′ (4)
Values of the function L(u, v) are provided by Walton (1960).We assigned transmissivity, saturated thickness, and leakance val-ues assuming a water saturated phase. We hypothesize that waterwill be the dominant phase away from the injection well wherethere is abundant opportunities for leakage. We varied the storagecoefficient between a range of values consistent with either a CO2or water saturated system.
3.2. Sharp-interface model
As outlined by Nordbotten et al. (2005, 2008) and demon-strated by Birkholzer et al. (2009a,b) CO2 injection will result ina largely water wet system with regions of high CO2 saturationconfined to relatively small regions near the injection well annu-lus. While the sharp-interface approach uses only end-point valuesof relative permeability and phase saturation, detailed comparisonsbetween sharp-interface and multi-phase codes have shown excel-lent agreement between computed and observed pore pressuresand CO2 plume geometry when common petrophysical param-eters are used (Gasda et al., 2008). The main limitation of thesharp-interface approach is its inability to represent the initialdynamics of vertical segregation of phases within a formation,and the limited representation of inter-formational vertical het-erogeneity through expressions for effective relative permeabilitythat result from vertical averaging. Recently, sharp-interface theoryhas been used to quantify the potential of CO2 leakage along aban-doned oil and gas wells within sedimentary basins (Nordbotten etal., 2004, 2005). These authors developed analytical solutions basedon sharp-interface equations to quantify reservoir injection pres-sures and supercritical CO2 lens thickness within a homogenous,isotropic reservoir as well as determine CO2 loses associated froman adjacent leaky well bore. Because well density can be quite high
in some reservoirs, these authors argued that numerical solutionsare impractical. We have extended the approach of Nordbotten etal. (2004) by developing numerically based sharp-interface modelsof CO2 injection. The rational for developing a numerical sharp-interface model is to represent the effects of spatial variations in
8 of Gree
pe
ctLpaalizhwwC(o
et
(
�
worfics(
CceiciCgstggHf
h
w(
o
h
46 M. Person et al. / International Journal
ermeability/porosity associated with burial depth and facies het-rogeneity within the Mount Simon Sandstone.
The governing equations describing CO2 injection into a leaky,onfined aquifer within a sedimentary basin using sharp-interfaceheory we used here are similar to the methodology outlined byedoux et al. (1990). This approach has also been applied to two-hase petroleum (oil–water) systems (Lehner et al., 1987; Rhea etl., 1994). We invoke some restrictive simplifying assumptions inpplying sharp-interface theory to the CO2–brine transport prob-em. First we assume that the top of the reservoir or carrier beds flat with an elevation of zero. The CO2 heads are initially set toero (i.e. no regional head gradients are imposed). Elevated CO2eads are due solely to the effects of supercritical injection. Weill address the effects of buoyancy and hydrodynamic driven flowithin the Mount Simon Sandstone on long-range, separate-phaseO2 migration later using an approach first presented by Hubbert1953) described below. Gasda’s (2008) sharp-interface model hasvercome these simplifying assumptions.
In our sharp-interface approach, two, transmissivity-based flowquations describing changes in CO2 head (hc) as well as the posi-ion of the CO2–brine (zic) interface are solved:
CO2 transport:
zt − zic)Scs
∂hc
∂t−�
∂zic
∂t= ∂
∂x
[Tc
�f
�c
∂hc
∂x
]+ ∂
∂y
[Tc
�f
�c
∂hc
∂y
]+ qc (5)
Brine transport:
∂zic
∂t= ∂
∂x
[Ts
�c
�s
∂hc
∂x+ Ts
(�s − �c
�c
)∂zic
∂x
]
+ ∂
∂y
[Ts
�c
�s
∂hc
∂y+ Ts
(�s − �c
�c
)∂zic
∂y
]− ql (6)
here hc – CO2 heads (L), zic – brine–CO2 interface (L), zt – elevationf the top of the reservoir (L), ϕ – porosity (L3 L−3), qc – injectionate of CO2 into aquifer (L3 T−1 L−2), ql – brine leakance across con-ning bed (L T−1), Sc
s – specific storage which includes CO2 fluidompressibility (L−1), �c – density of CO2 phase (M L−3), �s – den-ity of brine phase (M L−3), Tc – CO2 transmissivity (L2 T−1; see Eq.10)), Ts – brine transmissivity (L2 T−1; see Eq. (10)).
Our sharp-interface approach assumes brine and supercriticalO2 flow occurs only in the horizontal direction. While CO2 densityhanges considerably with pressure and temperature (Nordbottent al., 2005), our model assumed that fluid properties were spatiallynvariant. Our analysis considers changes in CO2 storage due tohanges in saturation and compressibility effects although the laters relatively small in comparison. Our analysis neglects diffusion ofO2 into the brine phase (Lu and Lichtner, 2007) and fluid-rockeochemical reactions which may be significant on geologic timecales. Our analysis also neglects brine compressibility. We madehis assumption because changes saturated lens thickness (analo-ous to specific yield changes in an unconfined aquifer) are muchreater that changes in storage due to H2O compressibility effects.owever, this assumption can lead to an inaccurate prediction of
ar-field brine heads.The head of CO2 presented in Eqs. (5) and (6) is given by:
c = P
�cg+ z (7)
here P – CO2 fluid pressure (M L−1 T−2), g – gravity constantL T−2), z – elevation (L).
The head of the brine phase (hs) is explicitly related to the headf CO2 as follows:
s = �c
�shc + �s − �c
�szic (8)
nhouse Gas Control 4 (2010) 840–854
Capillary forces are neglected in Eqs. (7) and (8). We calculate therate of brine leakage across the Eau Claire using a one-dimensionalexpression of Darcy’s Law:
ql = −Kz
b′ (hs − ho) (9)
where Kz – vertical hydraulic conductivity of the brine phase withinthe confining unit (L T−1), ho – is the head above the confining unit(L), hs – is brine head (L), b′ is the thickness of the confining unit (L).
Like the Hantush–Jacob analytical solution if a CO2 lens of 1mor more exist around the annulus of the well, we reduced the ver-tical hydraulic conductivity by a factor of 1000. Our approach alsoneglects transient storage changes on flow within the confiningunit. If the CO2 lens thickness at the top of the reservoir exceeds1 m, we reduce the vertical hydraulic conductivity of the confiningunit by three orders of magnitude to minimize leakage in regionswhere CO2 is present at the top of the reservoir. We do not considerseparate-phase CO2 migration across the Eau Claire Formation. Thetransmissivities and specific storage for the CO2 and brine phasesare defined as:
Tc = Kc[zT − zic]Ts = Ks[zic − zb]
Sss = �sg[˛s� + ˇ]
Scs = �cg[˛c� + ˇ]
(10)
where Ks and Kc – vertically averaged saturated hydraulic conduc-tivities of the brine and CO2 fluid phases (L T−1), Ki = k�ig/�i; wherei refers to the respective fluid phase, ki is intrinsic permeability (L2),g is gravitational constant, �i is fluid density, �i is dynamic viscos-ity(M L−1 s−1), zb – base of aquifer (L), ˇ – reservoir compressibility(L T2 M−1), ˛c – CO2 compressibility (L T2 M−1), ˛s – brine compress-ibility (L T2 M−1), SS
S – brine specific storage which includes brinecompressibility (L−1).
If the computed interface falls below the bottom of the reser-voir, a maximum saturated thickness based on the total formationthickness is assigned in determining the reservoir transmissivity.We reduced the porosity by a factor of 100 in elements wherethe interface reached the bottom of the Mount Simon to minimizemass balance errors and promote lateral spreading of the CO2–brineinterface (Ledoux et al., 1990). The reader is referred to Ledoux etal. (1990) for a more in depth discussion of this procedure. We alsomaintain a minimum saturated thickness for each fluid phase (5%of total thickness) to permit the lateral movement of pressure andthe CO2 phase.
Eqs. (5) and (6) provide an estimate of heads and interface nearthe injection wells where the CO2 lens is non-zero. However, theydo not provide an accurate prediction of far-field brine heads (hs)because the CO2 phase is zero away from the injection well. Toovercome this limitation, we adopted the approach of Gasda (2008)and also solve a single, transmissivity-based flow equation for brinehead (hs) summing CO2 and brine transmissivity and storativity:
∂
∂x
[(Ts + Tc)
∂hs
∂x
]+ ∂
∂y
[(Ts + Tc)
∂hs
∂y
]+ qc
= [(zt − zic)Scs + (zic − zb)Ss
s]∂hs
∂t(11)
Because the CO2 compressibility is several orders of magnitudehigher than water, the storage coefficient can vary considerablyaround the annulus.
3.3. Numerical methods
We solved the above system of Eqs. (5), (6) and (11) usingthe finite-element method (Taylor and Person, 1996; Person et al.,1998). We solved Eqs. (5) and (6) simultaneously given that there

f Gree
afiCwmmP
3
Cdmea
3
ftaloCsatmo((Hccaw
�
wMtWrf
wofid
3
ic(bS(
and Jacob (1955) presented in Section 3.1. Since there is signifi-cant uncertainty in the permeability of the Mount Simon aquiferand Eau Claire confining units we varied their values between 5to 125 mD and 0.0001 to 0.01 mD, respectively (Table 1). We alsovaried storativity. One option was to assign a storativity based
Table 1Aquifer and confining unit properties used in single-phase sensitivity analysis.
Run k (mD) k′ (mD) Sa
1 50 0.001 0.052 50 0.001 0.0053 125 0.0001 0.05
M. Person et al. / International Journal o
re two unknowns in each equation (hc, zic). We solved for far-eld brine heads separately (Eq. (11)) using the freshwater andO2 lens thicknesses computed in Eqs. (5) and (6). The unknownsere solved simultaneously using Gaussian elimination. For ele-ents associated with injection wells, the volume of CO2 injectedust be divided by element area. We validated our model using
FLOTRAN/FEHM for a single well injection as described below.
.4. Boundary and initial conditions
For the basin-scale model we specified a constant head andO2 lens thickness of zero along the northern edge of our solutionomain. All other boundaries were no flow. For intermediate-scaleodels (Fig. 1A), the same boundary and initial conditions were
nforced. For all simulations a hydrostatic initial condition wasssumed.
.5. Hubbert CO2 potential
The simplifying assumptions described above prevent usrom computing the long-range migration pathways CO2 dueo buoyancy and hydrodynamic effects. Even if these restrictivessumptions were not enforced, computational limitations wouldikely prevent predicting long-range CO2 migration on time scalesf 103 years or more. We quantified long-range separate-phaseO2 migration away from injection wells due to buoyancy (i.e. bedlope) and due to regional groundwater flow patterns using thepproach of Hubbert (1953). Hubbert’s oil potential has been usedo assess the relative effects of groundwater flow on petroleum
igration and entrapment over geological time scales in a numberf petroleum basins around the world including the Williston basinBerg et al., 1994), Alberta basin (Beleke et al., 2002), Illinois basinBethke et al., 1991), and Paris basins (Bekele et al., 1997). Followingubbert’s approach, we assume here that buoyancy driven super-ritical CO2 migration within porous, permeable reservoir rocks, isontrolled primarily by the slope of the top of the reservoir as wells the density contrast between supercritical CO2 and formationaters:
C = �w
�CZwt − �w − �C
�Czt (12)
here �c is Hubbert’s CO2 heads, h is hydraulic head within theount Simon, �s is brine density, �C is CO2 density, zt is the eleva-
ion of the top of the reservoir, and Zwt is the water table elevation.e assume here that the water table mimics the land surface topog-
aphy. We explicitly computed the lateral CO2 migration rates asollows:
qx = −KC
�
∂�c
∂x
qy = −KC
�
∂�c
∂y
(13)
here KC is the CO2 conductivity and qx, and qy are the componentsf CO2 velocities in the x- and y-directions. We used the velocityeld from Eq. (13) to produce particle trajectories indicating theirection of long-range CO2 migration across the Illinois basin.
.6. Model verification
We attempted to verify, our sharp-interface model, by attempt-ng to reproduce a simple a numerical injection experiment
arried out using PFLOTRAN (Lu and Lichtner, 2007) and FEHMPawar, 2007). These codes include equations of state for CO2 andrine phases, relative permeability, and residual saturation effects.upercritical CO2 was injected into a reservoir at a rate of 2.3 kg/s370 m3/day assuming a density of 748 kg/m3) for a period of 10nhouse Gas Control 4 (2010) 840–854 847
years. The hydrostatic pressure at the top of the 63-m thick reser-voir was set as 20 MPa (depth of 2 km). No vertical leakage waspermitted. The PFLOTRAN and FEHM solutions domain extended1000 m away for the injection well. The PFLOTRAN/FEHM grid hada constant vertical cell dimension of 2 m and used 32 rows of ele-ments. It employed a uniform grid with a lateral dimension of 2 m(i.e. Cartesian grid). The permeability and porosity of the reservoirwas set at 10 mD (10−14 m2) and 0.15, respectively. We used a tele-scoping finite-element grid consisting of 2847 nodes with a cell sizevarying from 5 to 30 m. We used a water and CO2 viscosity of 0.001and 0.00007 Pa s, respectively.
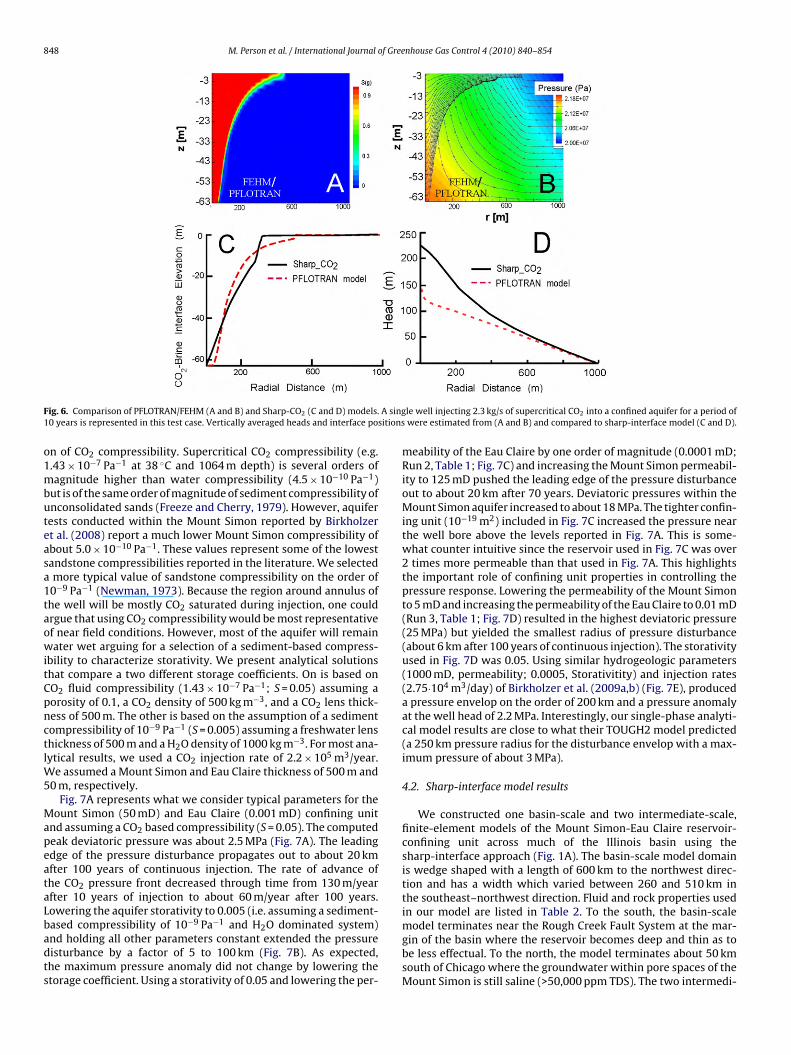
PFLOTRAN/FEHM computed pressures (Fig. 6B) had to be verti-cally averaged and converted to CO2 heads to compare to Sharp-CO2(Fig. 6D). The CO2–brine interface was inferred to be located nearthe 0.5 CO2 saturation (Fig. 6A and C). Near the well bore, the max-imum excess head computed by PFLOTRAN was about 150 m whilethe CO2 head from our sharp-interface model was about 230 m.Both codes predicted a linear variation in head out beyond theregion of CO2 saturation (Fig. 6D). The computed position of theCO2–brine interface in all three models compared favorably. TheCO2 lens was restricted to the narrow region around the well andthe pressure pulse propagated out much further. We conclude thatour sharp-interface model will produce results that are order ofmagnitude accurate when compared to 3D multi-phase codes.
There are several differences between PFLOTRAN/FEHM and oursharp-interface code that could account for the discrepancies inmaximum computed pressure. The pressure differences could bedue to pressure-dependent fluid properties that are not repre-sented in our sharp-interface code. Our code assumes a constantvolume of the injected fluid whereas PFLOTRAN and FEHM specifya mass of injected fluid. PFLOTRAN and FEHM use the control vol-ume method to approximate solutions to the flow equations whichis locally mass conservative (Patankar, 1980). Our sharp-interfacecode uses the finite-element method which is not locally mass con-servative (Narasimhan, 1978). Our model assumes horizontal flowwhereas FEMH and PFLOTRAN are fully three-dimensional. It is dif-ficult to isolate the individual effects. It is worth pointing out thatthe discrepancies we found (less than a factor of 2) are not unusuallylarge when compared to findings from other CO2 model intercom-parison studies. In a CO2 model intercomparison study presentedby Class et al. (2009), which 14 multi-phase and sharp-interfacecodes were compared, differences of up to a factor of 2 in computedCO2 fluxes were found between different codes.
4. Results
4.1. Single-phase analytic injection models
We begin our analysis with the analytical solutions of Hantush
4 5 0.01 0.055 1000 0.001 0.0005
Horizontal (k) permeability of the Mount Simon and vertical (k′) permeability of theEau Claire confining unit.
a Bulk storativity of Mount Simon assuming Mount Simon thickness of 500 m.
848 M. Person et al. / International Journal of Greenhouse Gas Control 4 (2010) 840–854
F A sing1 sitions
o1mbuteasa1taowitCpnctlW5
MapeataLbadts
ig. 6. Comparison of PFLOTRAN/FEHM (A and B) and Sharp-CO2 (C and D) models.0 years is represented in this test case. Vertically averaged heads and interface po
n of CO2 compressibility. Supercritical CO2 compressibility (e.g..43 × 10−7 Pa−1 at 38 ◦C and 1064 m depth) is several orders ofagnitude higher than water compressibility (4.5 × 10⁻¹⁰ Pa−1)
ut is of the same order of magnitude of sediment compressibility ofnconsolidated sands (Freeze and Cherry, 1979). However, aquiferests conducted within the Mount Simon reported by Birkholzert al. (2008) report a much lower Mount Simon compressibility ofbout 5.0 × 10⁻¹⁰ Pa−1. These values represent some of the lowestandstone compressibilities reported in the literature. We selectedmore typical value of sandstone compressibility on the order of0−9 Pa−1 (Newman, 1973). Because the region around annulus ofhe well will be mostly CO2 saturated during injection, one couldrgue that using CO2 compressibility would be most representativef near field conditions. However, most of the aquifer will remainater wet arguing for a selection of a sediment-based compress-
bility to characterize storativity. We present analytical solutionshat compare a two different storage coefficients. On is based onO2 fluid compressibility (1.43 × 10⁻⁷ Pa−1; S = 0.05) assuming aorosity of 0.1, a CO2 density of 500 kg m−3, and a CO2 lens thick-ess of 500 m. The other is based on the assumption of a sedimentompressibility of 10−9 Pa−1 (S = 0.005) assuming a freshwater lenshickness of 500 m and a H2O density of 1000 kg m−3. For most ana-ytical results, we used a CO2 injection rate of 2.2 × 10⁵ m3/year.
e assumed a Mount Simon and Eau Claire thickness of 500 m and0 m, respectively.
Fig. 7A represents what we consider typical parameters for theount Simon (50 mD) and Eau Claire (0.001 mD) confining unit
nd assuming a CO2 based compressibility (S = 0.05). The computedeak deviatoric pressure was about 2.5 MPa (Fig. 7A). The leadingdge of the pressure disturbance propagates out to about 20 kmfter 100 years of continuous injection. The rate of advance ofhe CO2 pressure front decreased through time from 130 m/yearfter 10 years of injection to about 60 m/year after 100 years.owering the aquifer storativity to 0.005 (i.e. assuming a sediment-
ased compressibility of 10−9 Pa−1 and H2O dominated system)nd holding all other parameters constant extended the pressureisturbance by a factor of 5 to 100 km (Fig. 7B). As expected,he maximum pressure anomaly did not change by lowering thetorage coefficient. Using a storativity of 0.05 and lowering the per-le well injecting 2.3 kg/s of supercritical CO2 into a confined aquifer for a period ofwere estimated from (A and B) and compared to sharp-interface model (C and D).
meability of the Eau Claire by one order of magnitude (0.0001 mD;Run 2, Table 1; Fig. 7C) and increasing the Mount Simon permeabil-ity to 125 mD pushed the leading edge of the pressure disturbanceout to about 20 km after 70 years. Deviatoric pressures within theMount Simon aquifer increased to about 18 MPa. The tighter confin-ing unit (10−19 m2) included in Fig. 7C increased the pressure nearthe well bore above the levels reported in Fig. 7A. This is some-what counter intuitive since the reservoir used in Fig. 7C was over2 times more permeable than that used in Fig. 7A. This highlightsthe important role of confining unit properties in controlling thepressure response. Lowering the permeability of the Mount Simonto 5 mD and increasing the permeability of the Eau Claire to 0.01 mD(Run 3, Table 1; Fig. 7D) resulted in the highest deviatoric pressure(25 MPa) but yielded the smallest radius of pressure disturbance(about 6 km after 100 years of continuous injection). The storativityused in Fig. 7D was 0.05. Using similar hydrogeologic parameters(1000 mD, permeability; 0.0005, Storativitity) and injection rates(2.75·104 m3/day) of Birkholzer et al. (2009a,b) (Fig. 7E), produceda pressure envelop on the order of 200 km and a pressure anomalyat the well head of 2.2 MPa. Interestingly, our single-phase analyti-cal model results are close to what their TOUGH2 model predicted(a 250 km pressure radius for the disturbance envelop with a max-imum pressure of about 3 MPa).
4.2. Sharp-interface model results
We constructed one basin-scale and two intermediate-scale,finite-element models of the Mount Simon-Eau Claire reservoir-confining unit across much of the Illinois basin using thesharp-interface approach (Fig. 1A). The basin-scale model domainis wedge shaped with a length of 600 km to the northwest direc-tion and has a width which varied between 260 and 510 km inthe southeast–northwest direction. Fluid and rock properties usedin our model are listed in Table 2. To the south, the basin-scale
model terminates near the Rough Creek Fault System at the mar-gin of the basin where the reservoir becomes deep and thin as tobe less effectual. To the north, the model terminates about 50 kmsouth of Chicago where the groundwater within pore spaces of theMount Simon is still saline (>50,000 ppm TDS). The two intermedi-
M. Person et al. / International Journal of Greenhouse Gas Control 4 (2010) 840–854 849
F h leakH r (A–Dn orizon
attmi9sIaC
ttMf1S(t
ig. 7. Analytical calculations of CO2 injection into the Mount Simon reservoir witantush and Jacob (1955). Fluid was injected at a constant rate of 2.2 × 10⁵ m3/yeaumbers on the lines (A–E) are years since the time since injection. Note that the h
te (64 by 47 km and 50 by 70 km) models were also constructedo study well–well interference patterns and CO2 lens geome-ry at a higher spatial resolution. The basin-scale finite-element
esh is comprised of 8160 nodes and 16,122 elements. The twontermediate-scale grids were composed of between 8081 and077 nodes and 16,058 and 18,042 elements. The intermediate-cale models are located in the middle and deep sections of thellinois basin. This was done to evaluate the impacts of permeabilitynd porosity trends with depth on computed excess pressures andO2–brine interface positions using a more highly resolved grid.
We allowed thickness, permeability, and porosity to vary spa-ially across the basin. The Eau Claire confining unit varies inhickness from south to north from 61 to 152 m. We allowed the
ount Simon reservoir permeability to decrease in a linear fashionrom 125 to 5 mD from north to south. Porosity also decreases from
5% to 5% from north to south. The thickness of the Mount Simonandstone varies from south to north from less than 150 to 610 mFig. 3b). The maximum thickness of the Mount Simon occurs nearhe northern edge of the Illinois basin (Fig. 3b).Table 2Fluid, rock, and injection well properties used in Illinois basinsimulations.
CO2 viscosity 0.004 MPa sCO2 density 500 kg/m3
CO2 compressibility 1.43 × 10⁻⁷ Pa−1
Brine viscosity 0.25 MPa sBrine density 1100 kg/m3
Brine compressibility 4 × 10⁻¹⁰ Pa−1
Injection well rate 283.47 m3/day
age across the overlying Eau Clair confining unit using leaky aquitard solution of) and 2.75 × 10⁴ m3/year (E) for a period of 100 years (A–D) and 30 years (E). The
tal axis limit of Fig. 7A, C–D differs Fig. 7B, E.
We represented the effects of CO2 injection from 42 powerplants in our model using 726 injection wells. These wells werespaced in radial patterns between 2 and 4 km from the power plantsites. Some wells were removed if they were located within 1 kmof another injection well from an adjacent power plant. Prelimi-nary models that used between 1 and 12 injection wells per powerplant to emplace the 80 million metric tons of CO2 per year resultedin simulated pore pressures that exceeded lithostatic pressures insome locations.
We injected continuously for a period of 100 years. We then shutthe wells in for 100 years to determine the long-term fate of porepressures and CO2 lens position. Computed deviatoric pressuresafter 100 years were highest (up to 16.4 MPa in Figs. 8A and 9A) inthe deepest part of the basin where permeability is lowest (about5 mD). In the middle of the basin at intermediate depths (perme-ability about 50mD), excess pressures reached only about 4.4 MPa(Figs. 8A and 9C) after 100 years. The maximum radial distance ofpressure disturbance (>0.03 MPa or 3m of freshwater head) awayfrom individual injection wells was on the order of 9–13 km acrossthe basin. The wells were shut in after 100 years of injection. After200 years (100 years of shutin) fluid pressures dissipated and theregion of pressure disturbance increased out to radial distancesof about 15–30 km (Figs. 8B, 9B and 9D). Maximum fluid pres-sures decreased to between 3.6 and 9.8 MPa at intermediate anddeep portions of the Illinois basin. The net diameter of the pres-
sure disturbance envelop around the injection well centers wasabout 50 km and there is significant well–well pressure disturbancebetween adjacent injection well centers. Intermediate-scale simu-lations provide higher resolution images of pressure disturbancepatterns. After 100 years of shutin it is difficult to see the positions
850 M. Person et al. / International Journal of Greenhouse Gas Control 4 (2010) 840–854
F of injes n.
otb
iSdra
FnwsT
ig. 8. Basin-scale simulated deviatoric fluid pressures (in MPa) after 100 yearsharp-interface models of the Illinois basin presented in Figs. 9 and 10 is also show
f individual wells at all depths (Fig. 9B and D). However, note thathe pressures will never return to hydrostatic conditions due touoyancy effects.
The thickness and geometry of the computed CO2 lens showsmportant differences across the basin (Fig. 10). Because the Mount
imon is thinnest (only 50 m thick) and of low porosity (0.05) in theeepest, southern most part of the basin, the CO2–brine interfaceeaches the base of the formation before displacing brines later-lly (Fig. 10A). At intermediate depths, the CO2 lens does not reachig. 9. Deviatoric pressures at deep (A) and intermediate (C) depths within the Illi-ois basin after injection of 80 million metric tons/year of CO2 using 726 injectionells over a 100 year period using refined grids. Fluid pressures after 100 years of
hutin (200 years) are presented in Fig. 10B and D for deep and intermediate depths.he locations of the models are shown in Fig. 8.
ction (A) and 100 years of shutin (B). The boundaries of the intermediate-scale,
the base of the Mount Simon and attains a maximum thicknessof 60 m. At intermediate depths, it spreads further laterally due tothe increased Mount Simon permeability and porosity (Fig. 10C).The radius of the CO2 plume varies between the deep and inter-mediate parts of the basin between about 0.5 and 2 km dependingon local porosity levels and permeability conditions. There is lit-tle well–well interference between individual CO2 lenses after 100years. After 100 years of shutin, the CO2 lens has spread con-siderably at intermediate depths (Fig. 10D). The CO2 lens lateralmigration is much less in the deepest part of the basin (Fig. 10B).The maximum thickness of the CO2 lens at intermediate depth isonly 12 m after 100 years of shutin. The CO2 lens footprint is stillmuch smaller when compared to the region pressure disturbance(compare Figs. 9 and 10 after 100 years of shutin).
Simulated vertical leakage of brines across the Eau Claire con-fining units was highest (10−5 m/day) around the injection wellsjust beyond the CO2 lens terminates and dissipated quickly. After100 years brines would have moved about 0.5 m into the Eau Claireformation. Brine displacement was negligible at a radial distanceof about 5 km from an injection well. This is due, in part, to leak-age represented across the Eau Claire confining unit and the radialnature of flow.
To assess the potential that CO2 injection could induce earth-quakes, we plotted pore pressure verses depth for the twointermediate-scale models. These show that pore pressures exceedhydrostatic pressures in the deepest part of the basin (Fig. 11) butare close to hydrostatic at intermediate depths. Fluid pressuresreach 46% of lithostatic pressure between 3000 and 3500 m depth.We also plotted pore pressures generated at the hazardous wasteinjection wells near Lake Erie reported by Nicholson and Wesson(1988, 11 MPa, open circle). This value is far below lithostatic levels.
One potential effect of increased fluid pressures is uplift of theland surface. We estimated the amount of uplift within the MountSimon by using the following relation:
L = b P ˇ (14)
where L is the amount of uplift (m), P is the deviatoric porepressure (Pa), b is the local thickness of the Mount Simon formation(m) and ˇ is the formation compressibility (Pa−1). The compress-
ibility we used (10−9 Pa−1) was taken from our basin-scale model.We used maximum deviatoric pore pressures presented in Fig. 9to compute uplift. The local value of Mount Simon thickness wasalso used. Results indicate that a maximum uplift of 1.0 m of upliftwould occur. The magnitude of uplift was similar for the interme-
M. Person et al. / International Journal of Greenhouse Gas Control 4 (2010) 840–854 851
F ars of continuous injection of 80 million metric tons/year of CO2 and (B) after 100 yearso of the basin where the formation thickness is only 50 m. At intermediate depths (B), thel f these intermediate scale models are shown in Fig. 8.
ddpociIa
4h
euagp
F(roSh1
ig. 10. (A) Simulated CO2 lens thickness across the Illinois basin following 100 yef shutin. The CO2 lens reaches the bottom of the aquifer in the deepest (A) portionens spreads further laterally due to higher permeability conditions. The locations o
iate and deep portions of the basin due to the offsetting effect ofecreasing Mount Simon formation thickness with increasing poreressure to the south. The amount of uplift should be viewed as anrder of magnitude estimate. However, it is not unrealistic whenompared to land subsidence observations in response to changesn head associated with water abstractions (Galloway et al., 1999).t does not consider long-term pressure changes in the Eau Clairend associated confining unit deformation.
.3. Long-range CO2 migration due to buoyancy andydrodynamic drives
Our sharp-interface models were unable to represent the
ffects of long-range separate-phase CO2 migration because of thenderlying assumptions described above (i.e. a constant elevationssigned to the Mount Simon Formation and no regional headradients). However, using Hubbert (1953) (Eqs. (12) and (13))otential theory, we were able to estimate the rate of separate-ig. 11. Computed fluid pressure verses depth (solid black squares) for intermediate1700–200 m depth) and deep (2900–3500 m depth) reservoirs. Deviatoric pressureeached about 46% of lithostatic levels in the deepest part of the basin after 100 yearsf continuous CO2 injection. Also plotted (circle) is inferred pressure within Mountimon hazardous waste injection well near Ashtabula, Ohio which is believed toave generated M2.6–M4.3 earthquakes between 1987 and 2001. Injection result in0 MPa of deviatoric pressure (after Nicholson and Wesson, 1990).
Fig. 12. Plan view contour map of Hubbert CO2 heads (in m) and separate-phase
CO2 migration directions (lines with arrows) due to buoyancy and hydrodynamiceffects. Stream traces indicate that most of the CO2 would be captured in gentlestructural traps at the intermediate depth within the Illinois Basin.phase CO2 migration. We found that separate-phase migrationwould be induced primarily due to the effects of buoyancy (bedslope). The buoyant drive is low due to the gentle slope on theMount Simon from North to South (about 0.008 m/m). Howeverthe hydrodynamic drive is even less due to the low hydraulic gra-dients within the Mount Simon (Fig. 1A; about 0.0008 m/m). Ouranalysis suggests that separate-phase CO2 within the deepest por-tion of the basin would migrate up gradient to the north beforebecoming entrapped within gentle structures in the middle of thebasin. The migration rates are small (6 m/1000 years, Fig. 12) andit is likely that much of the CO2 would either diffuse into the waterphase, be trapped in the capillary pore spaces, or become fixed inthe reservoir as a solid mineral phase on these time scales (Rubinet al., 2005).
5. Discussion and conclusions
We had originally suspected that the injection of 80 millionmetric tons of CO2 per year over a period of 100 years at 42 siteswould lead to significant displacement of brines towards the mar-
gins of the basin and basin-scale pressure anomalies. However,because of leakage of brine across the Eau Claire confining unitand the distributed nature of power plant locations across theStates of Illinois and Indiana, our models indicated that long-range(>5 km) lateral movement of brines and pressure anomalies will
8 of Gree
nowa
wiCwdm
t(ailBoastosbmettc
pmBthovolh
dmaicIctpbdii
nuac2ttsre
52 M. Person et al. / International Journal
ot develop. That said, the model predicts that pressures in excessf about 18 MPa would occur in the deepest parts of the basin andell–well pressure interference patterns would emerge between
djacent injection wells in the more permeable center of the basin.While computed pore pressures from our sharp-interface model
ere far below lithostatic levels, the existence of paleo-seisimicndicators across the southern Illinois Basin warrants concern forO2 sequestration projects. Recently, a magnitude 3.4 earthquakeas induced by geothermal hydrofracturing experiments at 3 kmepth near Basal Switzerland. The earthquake resulted in the ter-ination of that EGS project (Giardini, 2009).Our calculated maximum pressure anomaly was about 6
imes higher than that predicted by simulations using TOUGH2Birkholzer et al., 2009a,b; 3 MPa) while our computed pressurenomalies were restricted to a distance of about 25 km fromnjection wells in our sharp-interface models. Since the ana-ytical results presented in Fig. 7, were able to closely matchirkholzer et al. (2009a,b) 2-phase simulation results as well asur sharp-interface results (using different aquifer permeabilitynd storativity), we suspect that discrepancies between these twotudies model predictions are mostly due to the differences in selec-ion of petrophysical parameters (e.g. Mount Simon permeabilityf 100–500 mD for Birkholzer et al. (2008) verses 5–125 mD for thistudy). In addition, when we incorporated the parameters reportedy Birkholzer et al. (2008) using our basin-scale sharp-interfaceodel (not shown), the pressure disturbance propagated to the
dge of our model domain. As illustrated in the model verifica-ion exercise (Fig. 6), some of the differences could also be dueo differences in physical processes represented between the twoodes.
One of the biggest surprises of our study is how well sim-le single-phase analytic solutions can approximate the results ofore complex multi-phase simulations. Both our study and that of
irkholzer et al. (2008) present plausible arguments for the selec-ion of petrophysical parameters used, respectively. While there areundreds of reservoir core permeability measurements, there arenly a few measurements on confining unit permeability and reser-oir compressibility data. Yet these parameters have a large effectn computed pore pressures. Future work should be focused on col-ection of additional petrophysical parameters and characterizingow these changes with effective stress.
Significant anomalous pressures due to CO2 injection onlyeveloped in the deepest part of the Illinois basin where the per-eability is lowest (Figs. 8A and 9A). While excess pressures were
bout 50% of the lithostatic load, they would have been much higherf fewer wells had been used. Relatively low deviatoric pressureonditions to the north suggest that the middle portion of thellinois basin is probably the best venue for injection. This is espe-ially true if one considers seismic hazards which are concentratedo the south. If CO2 transmission costs are not prohibitive, thenower utilities should consider focusing on the middle of the Illinoisasin for long-term injection programs. It may also be necessary toevelop injection scenarios that limit flow rates to ensure that flu-
ds pressures do not exceed lithostatic levels. This may substantiallyncrease the number or required wells.
Long-range CO2 migration by buoyancy or hydrodynamics doesot appear to be an important concern. Our models did predict thepward displacement of brines into the Eau Claires confining unit,lbeit at a slow rate. Salinity within low porosity confining units isapable of producing high osmotic pressures up to 20 MPa (Neuzil,000) if significant concentration gradients develop. This could lead
o unanticipated consequences such as hydrofracturing. While ver-ical brine leakage rates are low, the presence of abandon wells maytill be a factor (Nordbotten et al., 2004, 2005) in CO2 leakage. If CO2emains in a separate phase over geologic time scales, buoyancyffects would cause it to travel at a rate of 6 m/1000 years to thenhouse Gas Control 4 (2010) 840–854
north. The effects of groundwater flow on CO2 migration are smalldue to the gentle head gradients.
Our basin-scale model was able to represent 200 years ofCO2 injection, migration, and pore pressure development at thesedimentary basin-scale using desktop computing. Equivalent two-phase simulations representing 30 years of injection required theuse of high performance computing. While our sharp-interfacemodel is relatively simple and only order of magnitude accurate,they could be used to perform first cut assessments of optimallocation and type (horizontal verse vertical) of CO2 injection wellsacross the Illinois basin. It serves as an end member, a worst-casescenario, in the set of linked analyses that must ultimately considerthe effects of dissolution into the brine, capillary entrapment andmineral precipitation in the overall performance of fluid migra-tion in a basin. If a system of pure piston-like displacement hassuch minimal effects on pressure and brine migration, when othermitigating factors as itemized above are integrated, the migrationscenarios should be even less distinct. More work could also bedone in the Illinois basin extending our analysis to multiple for-mation targets for CO2 injection (e.g. the Knox carbonate section,New Albany Shale and Pennsylvanian coals) and calibrating ourmodel to match available pressure (Gupta and Bair, 1997) andsalinity data. This would involve linking multiple sharp-interfacereservoirs/confining unit models together at the basin-scale.
Our choice of aquifer parameters may not be representative ofactual conditions within the Illinois Basin. We used simple linear,depth-dependent variations in porosity and permeability for theMt. Simon. The sediment compressibility value we used, while typ-ical of sandstones, was twice the value reported by aquifer testsfrom the Mount Simon Formation (Birkholzer et al., 2008). Thus,our model results should be viewed as illustrative rather than ofa prediction of actual conditions within the Illinois Basin. Futuremodeling work should attempt to match historic drawdown pat-terns within the Illinois Basin near Chicago (Fig. 1C) as well asregional head patterns (Fig. 1A) and salinity conditions (Fig. 1B)before attempting to predict future CO2 injection scenarios.
Acknowledgements
This work was supported by a Department of Energy grant toMark Person, John Rupp, and Michael Celia under DE-FE0001161.We also wish to acknowledge the comments of two anonymousreviewers and Dr. Chris Neuzil of the US Geological Survey.
References
Athy, L.F., 1930. Density, porosity, and compaction of sedimentary rocks. AmericanAssociation of Petroleum Geologists Bulletin 14, 1–23.
Beaumont, C., Quinlan, G., Hamilton, J., 1988. Orogeny and stratigraphy: numericalmodels of the Paleozoic in the eastern interior of North America. Tectonics 7,389–416.
Bekele, E., Person, M., de Marsily, G., 1997. Petroleum migration pathways and chargeconcentration; a three-dimensional model; discussion. American Association ofPetroleum Geologists Bulletin 83, 1015–1019.
Beleke, E., Person, M.A., Rostron, B.J., Barnes, R., 2002. Modeling secondary oil migra-tion with core-scale data: Viking Formation, Alberta Basin. American Associationof Petroleum Geologists Bulletin 86 (1), 55–74.
Berg, R.R., DeMis, W.D., Mitsdarffer, A.R., 1994. Hydrodynamic effects on MissionCanyon (Mississippian) oil accumulations, Billings Nose area, North Dakota.American Association of Petroleum Geologists Bulletin 78, 508–518.
Bethke, C.M., Reed, J.D., Oltz, D.F., 1991. Long-range petroleum migration in the Illi-nois Basin. American Association of Petroleum Geologists Bulletin 75, 925–945.
Birkholzer, J.T., Zhou, Q., 2009. Basin-scale hydrogeologic impacts of CO2 storage:capacity and regulatory implications. International Journal of Greenhouse GasControl.
Birkholzer, J.T., Zhou, Q., Tsang, C.-F., 2009a. Large-scale impact of CO2 storage in
deep saline aquifers: a sensitivity study on pressure response in stratified sys-tems. International Journal of Greenhouse Gas Control 3, 181–194.Birkholzer, J., Zhou, Q., Rutqvist, J., Jordan, P.D., Zhang, K., Tsang, C., 2008. ResearchProject on CO2 Geological Storage and Groundwater Resources: Large-scaleHydrological Evaluation and Modeling of Impact on Groundwater Systems.eScholarship Repository, University of California.

f Gree
B
B
B
B
C
C
C
E
F
FG
G
G
G
G
H
H
H
H
H
H
H
K
L
L
L
L
L
L
M. Person et al. / International Journal o
irkholzer, J., Zhou, Q., Zhang, K., Jordan, P., Rutqvist, J., Tsang, C.F., 2009b. Large-scaleHydrological Evaluation and Modeling of the Impact on Groundwater SystemsNETL Project Annual Report, October 1, 2007 to September 30, 2008.
owen, B.B., Rupp, J.A., Ochoa, R., Fischietto, N.E., 2009. Depositional and diageneticvariability within the Cambrian Mount Simon Sandstone in the Illinois Basin:implications for carbon dioxide sequestration. In: Proc. AAPG Eastern SectionMeeting, Evansville, IN, September 20–22.
redehoeft, J.D., Blyth, C.R., White, W.A., Maxey, G.B., 1963. Possible mechanismfor concentration of brines in subsurface formations. Bulletin of the AmericanAssociation of Petroleum Geologists 47, 257–269.
reemer, C.W., Clark, P.U., Haggerty, R., 2002. Modeling the subglacial hydrology ofthe late Pleistocene Lake Michigan Loge, Laurentide Ice Sheet. Geological Societyof America Bulletin 114, 665–674.
hadwick, R.A., Zweigel, P., Gregersen, U., Kirby, G.A., Holloway, S., Johannesen, P.N.,2003. Geological characterization of CO2 storage sites: lessons from Sleipner,northern North Sea. In: Gale, J., Kaya, Y. (Eds.), Proceedings of the 6th Inter-national Conference on Greenhouse Gas Control Technologies (GHGT-6). 1–4October 2002, Kyoto, Japan. Pergamon, v. I, pp. 321–326.
lass, H., Ebigbo, A., Helmig, R., Dahle, H.K., Nordbotten, J.M., Celia, M.A., Audigane,P., Darcis, M., Ennis-King, J., Yaqing Fan, Y., Bernd Flemisch, B., Gasda, S.E., Jin,M., Krug, S., Labregere, D., Naderi Beni, A., 2009. A benchmark study on prob-lems related to CO2 storage in geologic formations. Comput Geosci 13, 409–434,doi:10.1007/s10596-009-9146-x.
ramer, C.H., Wheeler, R.L., Mueller, C.S., 1992. Analysis for seismic hazard in thesouthern Illinois Basin. Seismological Research Letters 73, 792–805.
ager, K., Pavlis, G., Hamberger, M., 2006. Evidence of possible induced seismicityin the Wabash Valley Seismic Zone from improved microearthquake locations.Bulletin of the Seismological Society of America 96, 1718–1728.
ischietto, N.E., Bowen, B.B., Rupp, J.A., 2009. Facies analysis and reservoir char-acterization of the Cambrian Mount Simon Formation in the Illinois basin:implications for CO2 sequestration and storage. In: Proc. AAPG Annual Conven-tion and Exhibition, Denver, CO, June 7–10, 2009.
reeze, R.A., Cherry, J.A., 1979. Groundwater. Prentice-Hall, NJ, 604 pp.iardini, D., 2009. Geothermal quake risks must be faced. Nature 462, 848–849,
doi:10.1038/462848a.alloway, D., Jones, D.R., Ingebritsen, S.E., 1999. Land Subsidence in the United States,
vol. 1182. US Geological Survey Circular, 165 pp.asda, S.E., 2008. Numerical Models for Evaluating CO2 Storage in Deep, Saline
Aquifers: Leaky Wells and Large-Scale Geological Features, Ph.D. Dissertation,Princeton University.
asda, S.E., Nordbotten, J.M., Celia, M.A., 2008. Upslope plume migration and impli-cations for geological CO2 sequestration in deep saline aquifers. IES Journal A:Civil and Structural Engineering 1, 2–16.
upta, N., Bair, E.S., 1997. Variable-density flow in the midcontinent basins andArches region of the United States. Water Resources Research 33, 1785–1802.
anor, J.S., 1987. Origin and Migration of Subsurface Sedimentary Brines, SEPM ShortCourse No. 21. Society of Economic Paleontologists and Mineralogists, Tulsa, OK,247 pp.
anor, J., McIntosh, J.C., 2006. Are secular variations in seawater chemistry reflectedin the compositions of basinal brines? Journal of Geochemical Exploration 89,153–156.
antush, M.S., Jacob, C.E., 1955. Non-steady radial flow in an infinite leaky aquifer.American Geophysical Union Transaction 36, 95–100.
oholick, J.D., Metarko, T., Potter, P.E., 1984. Regional variations of porosity andcement: St. Peter and Mount Simon Sandstones in Illinois Basin. AAPG Bulletin68 (6), 753–764.
ovorka, et al., 2001. Evaluation of Brine-bearing Sands of the Frio Formation, UpperTexas Gulf Coast for Geological Sequestration of CO2, DOE/NETL-2001/114.
sieh, P.A., Bredehoeft, J.D., 1981. A reservoir analysis of the Denver earthquakes: acase of induced seismicity. Journal of Geophysical Research 86, 903–920.
ubbert, M.K., 1953. Entrapment of petroleum under hydrodynamic conditions.American Association of Petroleum Geologists Bulletin 37, 1954–2026.
olata, D.R., Nelson, W.J., 1990. Tectonic history of the Illinois Basin. In: Leighton,M.W., Kolata, D.R., Oltz, D.F., Eidel, J.J. (Eds.), Interior Cratonic Basins, vol. 51.American Association of Petroleum Geologists Memoirs, pp. 263–285.
edoux, E., Rivera, E., de Marsily, G., 1990. A compatible single-phase/two-phasenumerical model. Ground Water 28, 79–87.
eetaru, H., Frailey, S.M., Damico, J., Mehnert, E., Birkholzer, J.T., Zhou, Q., Jor-dan, P.D., 2008a. Understanding CO2 plume behavior during sequestrationprojects through the use of reservoir fluid modeling. Energy Procedia 1, 1799–1806.
eetaru, H.E., Frailey, S.M., Damico, J., Finley, R., McBride, J.H., Morse, D.G., 2008b.Developing a geological model for the phase III (ADM) saline sequestration val-idation site. In: Proceedings of the 7th Annual Conference on Carbon Captureand Sequestration, Pittsburgh, PA, May 2008.
ehner, F.K., Marsal, D., Hermans, L., Van Kuyk, A., 1987. A model of secondary hydro-carbon migration as a buoyancy-driven separate phase flow. In: Doligez, B. (Ed.),Migration of Hydrocarbons in Sedimentary Basins. Editions Technip, Paris, pp.457–471.
iu, G., Zheng, C., Gorelick, S.M., 2004. Limits of applicability of the
advection–dispersion model in aquifers containing connected high-conductivity channels. Water Resources Research 40, W08308,doi:10.1029/2003WR002735.loyd Jr., O.B., Lyke, W.L., 1995. Ground water Atlas of the United States, Segment10—Illinois, Indiana, Kentucky, Ohio, and Tennessee. U.S. Geological SurveyHydrologic Investigations Atlas 730-K, p. 30.
nhouse Gas Control 4 (2010) 840–854 853
Lu, C., Lichtner, P., 2007. High resolution numerical investigation on the effect ofconvective instability on long term CO2 storage in saline, Aquifers. Journal ofPhysics: Conference Series 78, doi:10.1088/1742-6596/78/1/012042.
Mandle, R.J., Kontis, A.L., 1992. Simulation of regional ground-water flow in theCambrian-Ordovician aquifer system in the northern Midwest, United States.Professional Paper 1405-C, U.S. Geological Survey, USA.
McIntosh, J.C., Walter, L.M., Martini, A.M., 2004. Extensive microbial modificationof formation water geochemistry: case study from a Midcontinent sedimentarybasin, United States. Geological Society of America Bulletin 116, 743–759.
Medina, C.R., Rupp, J.A., 2009. Carbon dioxide storage capacity in the Upper Cambrianbasal sandstone of the Midwest region: a county-based analysis:. In: Proc. AAPGEastern Section Meeting, Evansville, Indiana.
Medina, C.R., Barnes, D.A., Rupp, J.A., 2008. Depth relationships in porosity and per-meability in the Mount Simon Sandstone (basal sand) of the Midwest region:applications for carbon sequestration. In: Proc. AAPG Eastern Section Meeting,Pittsburgh, PA.
Midwest Geological Sequestration Consortium, 2005. An Assessment of Geologi-cal Carbon Sequestration Options in the Illinois Basin: Final Report, Phase I,December 31, 2005. Urbana, IL, USA.
Munson, P.J., Munson, C.A., Bleuer, N.K., Labitzke, M.S., 1992. Distribution and datingof prehistoric earthquake liquefaction in the Wabash Valley of the central U.S.Seismological Research Letters 63, 337–342.
Narasimhan, T.N., 1978. A perspective on numerical analysis of the diffusion equa-tion. Advances in Water Resources 1, 147–155.
Neuzil, C.E., 2000. Osmotic generation of ‘anomalous’ fluid pressures in geologicalenvironments. Nature 403, 182–184.
Newman, G., 1973. Pore-volume compressibility of consolidated, friable, and uncon-solidated reservoir rocks under hydrostatic loading. Journal of PetroleumTechnology 16, 129–134.
Nicholson, C, Roeloffs, E., Wesson, R.L., 1988. The Northeastern Ohio Earthquake of 31January 1986: was it induced? Bulletin of the Seismological Society of America78, 188–217.
Nicholson, C., Wesson, R.L., 1990. Earthquake Hazard Associated with Deep WellInjection: A Report to the U.S. Environmental Protection Agency. U.S. GeologicalSurvey Bulletin 1951. U.S. Geological Survey, Reston, VA, 74 pp.
Nicot, J.P., 2008. Evaluation of large-scale carbon storage on fresh-water section ofaquifers: a Texas study. International Journal of Greenhouse Gas Control 2 (4),582–593.
Nordbotten, J., Celia, M., Bachu, S., 2004. Analytical solution for leakage rates throughabandoned wells. Water Resources Research 40, WO4204.
Nordbotten, J., Celia, M., Bachu, S., Dahle, H., 2005. Semi-analytic solution for CO2
leakage through an abandoned well. Environmental Science and Technology 39,602–611.
Nordbotten, J.M., Kavetski, D., Celia, M.A., Bachu, S., 2008. A Semi-analytical ModelEstimating Leakage associated with CO2 Storage in Large-scale MultilayeredGeological Systems with Multiple Leaky Wells, published online 17th December2008, Environmental Science and Technology, 2008.
Obermeier, S.F., Munson, P.J., Munson, C.A., Martin, J.R., Frankel, A.D., Youd, T.L.,Pond, E.C., 1992. Liquefaction evidence for strong Holocene earthquake(s) in theWabash Valley of Indiana–Illinois. Seismological Research Letters 63, 321–335.
Olcott, P.G., 1992. Ground Water Atlas of the United States, Segment 9—Iowa, Michi-gan, Minnesota, and Wisconsin. U.S. Geological Survey Hydrologic InvestigationsAtlas 730-J, p. 31.
Pawar, R., 2007. Multiphase flow simulations of large-scale CO2 sequestration oper-ation: how do you incorporate details of Wellbores in coarse grids? In: AmericanInstitute of Chemical Engineers, Annual Meeting, Salt Lake City (abstract 518b).
Patankar, S.V., 1980. Numerical heat transfer and fluid flow. In: Minkowycz, W.J.,Sparrow, E.M. (Eds.), Series in Computational and Physical Processes in Mechan-ics and Thermal Sciences. Taylor & Francis, p. 197.
Person, M., Taylor, J., Dingman, S.L., 1998. Sharp-interface models of salt water intru-sion and well head delineation on Nantucket Island, Massachusetts. GroundWater 36, 731–742.
Person, M., Schlegel, M., McIntosh, J., Rupp, J., 2009. Ice-sheet aquifer interactionswithin the Illinois basin. Geological Society of America Abstracts with Programs41 (7), 701.
Rhea, L., Person, M., de Marsily, G., Ledoux, E., Galli, A., 1994. Geostatistical models ofsecondary petroleum within heterogeneous carrier beds: a theoretical example.American Association of Petroleum Geologists 78, 1679–1691.
Rubin, E., Meyer, L., de Coninck, H., 2005. IPCC Special Report on Carbon Dioxide Cap-ture and Storage: Prepared by Working Group III of the Intergovernmental Panelon Climate Change, Intergovernmental Panel on Climate Change, Cambridge.
Schlegel, M., McIntosh, J., Person, M., Ballentine, C., Zheng, Z., 2008. Investigating thesource and timing of freshwater recharge into saline aquifers in the glaciatedIllinois Basin. Geochimica et Cosmochimica Acta 72, A832.
Seeber, L., Armbruster, J.G., Kim, W.Y., 2004. A fluid-injection-triggered earthquakesequence in Ashtabula, Ohio: implications for seismogenesis in stable continen-tal regions. Bulletin of the Seismological Society of America 24, 76–87.
Stueber, A.M., Walter, L.M., 1994. Glacial recharge and paleohydrologic flow systemsin the Illinois Basin—evidence from chemistry of Ordovician Carbonate (Galena)formation waters. Geological Society of America Bulletin 106, 1430–1439.
Taylor, J., Person, M., 1996. Capture Zone delineation on island aquifer systems.Ground Water 36, 722–730.
Visocky, A., 1982. Impact of Lake Michigan allocations on the Carbro-OrdivicianAquifer System. Ground Water 20, 668–674.
Visocky, A., 1997. Water-level trends and pumpage in the deep bedrock aquifers inthe Chicago region. Illinois State Water Survey Circular 182, 45.

8 of Gree
W
W
W
W
W
Y
54 M. Person et al. / International Journal
alton, W.C., 1962. Future water-level declines in deep sandstone wells in ChicagoRegion. Ground Water 2, 13–20.
alton, W.C., 1960. Leaky artesian aquifer conditions in Illinois. Illinois State WaterSurvey Report Investigation 39, 27.
heeler, R.L., Cramer, C.H., 2002. Updated seismic hazard in the southern Illi-nois Basin; geological and geophysical foundations for use in the 2002USGS national seismic-hazard maps. Seismological Research Letters 73, 776–791.
itherspoon, P., Neuman, S., 1967. Evaluating a lightly permeable caprockin aquifer gas storage. 1. Caprock of infinite thickness. Trans. AIME 240,949.
itherspoon, P.A., Mueller, T.D., Donovan, R.W., 1962. Evaluation of underground
gas storage conditions in aquifers through investigations of groundwaterhydrology. Journal of Petroleum Technology 14, 555–562.amamoto, H., Zhang, K., Karasaki, K., Marui, A., Uehara, H., Nishikawa, N., 2009.Numerical investigation concerning the impact of CO2 geologic storage onregional groundwater flow. International Journal of Greenhouse Gas Control 3(5), 586–599.
nhouse Gas Control 4 (2010) 840–854
Zoback, M.D., Harjes, H.-P., 1997. Injection induced earthquakes and crystal stressat 9 km depth at the KTB deep drilling site, Germany. Journal of GeophysicalResearch 102 (18), 477–491.
Zoback, M.D., Hickman, S., 1982. In-site study of the physical mechanisms con-trolling induced seismicity at Monticello Reservoir, South Carolina. Journal ofGeophysical Research 87, 6959–6974.
Zoback, M.D., Zoback, M.L., 1989a. In: Jacob, K.H., Torstar, C.J. (Eds.), In site Stress,Crustal Strain and Seismic Hazard Assessment in Eastern North America, Earth-quake Hazards and the Design of Constructed Facilities in the Eastern UnitedStates, vol. 558. Annals of the New York Academy of Sciences, NY, 54–65, 457pp.
Zoback, M.D., Zoback, M.L., 1989b. State of stress in the earth’s lithosphere. In:
Encyclopedia of Solid Earth Geophysics, James, D.E. (Ed.), Encyclopedia of EarthSciences Series, Footbridge, R.W. (Series Ed.), Van No strand Reinhold Co., NewYork, pp. 1221–1232.Zoback, M.D., Zoback, M.L., 1989c. Tectonic stress field of the continental U.S. In:Pokier, L., Mooney, W. (Eds.), Geophysical Framework of the Continental UnitedStates, vol. 172. GSA Memoir, pp. 523–539.