An Integrated Hydrologic Modeling and Data Assimilation Framework
Upload
independentCategory
view
4download
0
NGUYEN, Dzung Urban form & hydrologic performance in Saigon River Basin 49th ISOCARP Congress 2013
1
Size, Shape and Dispersion: Urban form evolution in Saigon River
Basin and its impacts on hydrologic performance from 1990 to 2010
Dzung Do NGUYENi, CPG Consultants, Vietnam/Singapore
Abstract:
Urban form evolution causes hydrologic effects. Therefore, an understanding of this critical relationship can provide planning and design solution to make communities more sensitive and resilient to flooding. While several studies have raised concerns on the impact of rapid and uncontrolled urbanization in Ho Chi Minh City on the rise of Saigon River's water level, none has tried to quantify the urbanization process at basin-scale and associate this spatial phenomenon with water upheaval. In addition, the search for a hydrologic-optimal urban form is critical for Ho Chi Minh City region given the low infiltration rate of soil and rapid urbanization so that minimizing impervious surface is a less relevant solution. Response to this research gap and base on landscape ecology approach, this paper provides an empirical study of urban form evolution in term of size [urbanized area], shape [compactness and fractal] and dispersion [aggregation] within 2503 sqkm of Saigon River Basin during a 20-year period of rapid urbanization. During this period, impervious surface increased by 4 and 8 times in the whole basin and in the flood-prone areas respectively while the population increased by 2 folds only. Urban development in the Basin also became less compact, more fractal but more aggregated. Using 5 landscape metrics and a hydrologic index demonstrating run-off coefficient, the author presents potential relationship between those form variables and the hydrologic performance of the Basin. The result of this paper highlights that a more compact and concentrated urban form for Saigon River Basin may result in lower flood risk for Ho Chi Minh city.
Key words: Ho Chi Minh City, hydrology, landscape ecology, urban form;
Saigon River Basin is home to Ho Chi Minh City, the largest city of Vietnam. The Basin is the land of a sophisticated interlacement between human settlements, interconnected watercourses, wetlands and crop lands. From 1990 to 2010, one can observe an aggressive invasion of urban development into low lands and water territory within the Basin boundary. As the consequence, the hydrologic system has taken an unexpected turn at the end of the 20th century. The river water has suddenly and frequently risen to inundate thousands hectares of land and disrupting lives of almost two millions people. The urban cause of this disaster, however, is yet understood and quantified.
Therefore, the purpose of this research is to relate the spatial evolution of urban form in the Basin with the hydrologic performance of Saigon River. An understanding of this interconnection will shape an informed urban planning and design interventions, which will hopefully lead the city into a more resilient future in the wake of climate change and sea-level-rise.
1. The city and its flooding challenge
In two decades from 1990 to 2010, Ho Chi Minh City experienced a rapid population growth and fast-paced urban development. The city’s population is estimated to grow at an annual average rate of 3% and increase almost by two folds from 4.1 to 7.4 million in this period. These numbers can be much higher if we take into account unregistered population and commuters from neighboring provinces, which are estimated to be approximately 2 million in 2008 (Dapice, Gomez-Ibanez et al. 2009).

NGUYEN, Dzung Urban form & hydrologic performance in Saigon River Basin 49th ISOCARP Congress 2013
2
In addition to rapid urbanization, Saigon River Basin has a very complicated hydrologic system characterized by powerful semi-diurnal tidal influence, interconnected watercourses, seasonally extreme rainfalls, and extensive amount of wet and low lands.
Saigon River begins in the highland of Loc Ninh, near Vietnam-Cambodia border. The river then flows downstream along the western boundary of Binh Duong before entering the territory of Ho
Chi Minh City [Figure 1]. In Dau Tieng
District of Tay Ninh Province, the river is dammed to create Dau Tieng Reservoir, whose functions are flood control and irrigation for agricultural production in Ho Chi Minh City region. Dau Tieng Reservoir usually discharges into Saigon River during the months of October and November. For the rest of the year, water elevation of Saigon River is influenced mostly by semi-diurnal tidal, which change four times a day (Truong 2008). Besides tidal influence, flows volume of Dong Nai River also contributes significantly to the variation of water elevation on Saigon River (Ho 2010).
The city has a tropical monsoon climate with wet and dry seasons. The average annually precipitation is as high as 2000 mm (Office 2010). However, rainfall distributes unequally throughout the year. Over 90% of annual rainfall is
concentrated in the wet season that usually ranges from May to November. This period also coincides with high tide season (Ho 2008, Luong 2009), causing floods in the city.
Ho Chi Minh City is at high risk of inundation caused by heavy rainfall, upstream discharge and high tides. Over 60% of the provincial area has a 1.5-meter elevation or lower, while daily average peak water elevation on Saigon River rose quickly, as high as 1.58 m recorded on November 26, 2011 (Vnexpress 2011). Since the 1990s, floods have occurred all over the city with increasing frequency (Ho 2008). A report in 2006 revealed that a total of 35 sqkm of urbanized area and 230 sqkm of agricultural land had been flooded (Research 2006). In terms of the administration unit and population, 154/322 of wards and 1.8 million people, 28% of the city’s registered population, are affected by floods (Research 2006, Management 2010).
High tides and extreme rainfalls are usually blamed for causing inundation (Truong 2008, Luong 2009). Data, however, show that peak the water elevation of Saigon River in Ho Chi Minh City segment has increased at a much faster rate than those upstream or along other rivers in Saigon-Dong Nai River basin and has no statistical correlation with peak sea-level, which in average has slightly decreased in the last 20 years (Ho 2010). Base on this statistical analysis, Ho (2010) hence concludes that urban flooding in Ho Chi Minh City is a product of local processes instead of global climate change. One question thus arises among researchers and in the public that if the fast-paced urbanization in Ho Chi Minh City is the cause of the dramatic hydrologic change of Saigon River. However, no empirical study has been done on the relationship between the size of impervious surface in particular and urban growth in general and the hydrologic change.
Figure 1: Topography and stream networks in Ho Chi Minh City region. Cartography by the author;
NGUYEN, Dzung Urban form & hydrologic performance in Saigon River Basin 49th ISOCARP Congress 2013
3
While an understanding of the impact of impervious surface in term of land area on hydrology is important, this knowledge may not be sufficient to contribute to planning and design interventions in Ho Chi Minh City. For such a dense urbanism in Ho Chi Minh City, there is little space to be converted into permeable surface. Even if we can reduce impervious surface in Ho Chi Minh City, the impact of urbanization on hydrology may not change significantly, since the groundwater table in the region is high and thus the infiltration capacity of the soil is low (Ho 2012). Therefore, the fundamental question to the city’s planners is not only about the size of impervious surface, but also what kind of shape, pattern, and dispersion of impervious surface patches which do the most and the least harm to the hydrologic system.
2. Landscape ecology and the study of
urban form - hydrology interrelationship
The relationship between urban development and hydrologic performance has studied heavily (Booth 1991, Arnold Jr and Gibbons 1996, Paul and Meyer 2001, Alberti, Booth et al. 2007). Literature on this subject summarizes this relationship in three aspects. First, the pavement of land surface and soil compaction due to buildings and infrastructures reduce the infiltration rate and thus increase surface run-off significantly (Alberti 2008). Second, compacted, stripped and paved soil has lower storage capacity so that even if infiltration rate of land surface is maintained, the soil reaches saturated state at a much faster rate (Booth 1991, Arnold Jr and Gibbons 1996). Therefore, urbanization generates more run-off and causes storm-water overflow. Third, urbanization alternates natural drainage with artificial ones that allow storm-water to flow fast and intensively in paved and straighten channels (Arnold Jr and Gibbons 1996, Alberti 2008). These modern modifications of natural drainage system increase the peak flow,
transport more storm-water downstream and reduce the lag time to reach peak volume. The artificial drainage system thus ultimately causes flooding downstream.
In these studies, urban development is merely represented by aggregate measurements such as impervious area. However, landscape ecologists have made an important argument that not only aggregate characteristics of a city’s urbanized area such as total impervious area and population density but also the structure and urban form pattern of that city affect the hydrologic condition (Whitford, Ennos et al. 2001, Alberti 2005, Greve 2012). In the last ten years, landscape ecologists and planning scholars have tried to quantify the relationship between urban form and ecological performance (Alberti 2008). The study conducted by Alberti, Booth et al. (2007) show significant statistical relationships between spatial configurations of urban pattern and streams’ ecological conditions throughout 42 sub-basins of Puget Sound basin in Washington State [US]. Studying the same basin, Greve (2012) finds linear relationship between the fraction of the year that annual mean discharge is exceeded and Floor-Ration-Area, lot coverage, and dwelling unit density. The fraction variable also has strong inverse relationship with Aggregation Index of high-and-medium density urban areas. Schueler (1994) and Klein (1979) generalize the impervious surface percent as a major indicator of aquatic health of the ecosystem: 10%-30% indicating
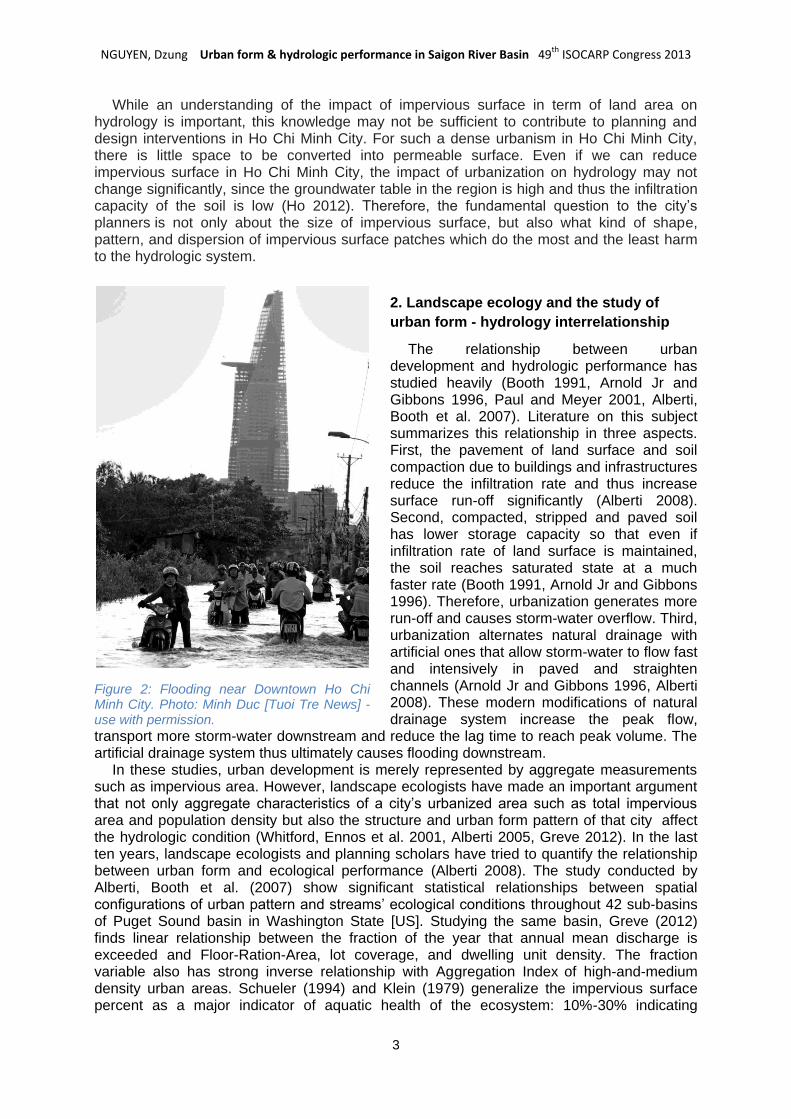
Figure 2: Flooding near Downtown Ho Chi Minh City. Photo: Minh Duc [Tuoi Tre News] - use with permission.

NGUYEN, Dzung Urban form & hydrologic performance in Saigon River Basin 49th ISOCARP Congress 2013
4
‘impacted’, and 30%-100% ‘degraded’ condition. Recent study by Olivera and DeFee (2007) on the impact of urbanization over hydrological changes reaffirms the significance of impervious surface and its 10-percent landscape threshold of an ecosystem to maintain its hydrologic function.
3. Research design
Three following research questions will be addressed in this paper:
1. How has Ho Chi Minh City metropolitan area grown from 1990 to 2010, particularly in hydrologically sensitive areas: wetland, low land, and upstream?
2. How has the form of Ho Chi Minh City metropolitan area evolved over 20 years period, from 1990 to 2010, when the city experienced rapid population growth?
3. How do these changes of the urban form affect the hydrological regime?
Hypothesis: The overall hypothesis of this paper is that the change in landscape composition and spatial configuration and the dispersion of urbanized areas in 1990 - 2010 period cause negative impacts on hydrological regime. I also speculate that a ratio of incremental water elevation between Phu An and Nha Be over the regional average precipitation can be an alternative indicator of hydrologic performance while run-off data is unavailable.
Spatial scale of analysis is 2503 sqkm of Saigon River Basin which contain the most developed area of Ho Chi Minh City metropolitan
region. There are 2 rationales for this selection:
Spatial extent of urban and hydrological changes: The research is focused on area along Saigon River in Ho Chi Minh City and Binh Duong province where rapid urbanization and hydrologic changes are observed. Saigon River forms the backbone of the area of which its northern edge is defined by Dau Tieng Reservoir and its southern edge by urban districts of Ho Chi Minh City. More importantly, upstream inlet of Saigon River is controlled by Dau Tieng Reservoir which discharges only few times a year, and the downstream outlet flow is measured by Phu An Station of which data is accessible to the public [Figure 3].
Intervention possibility: Understanding the connection between human activities and, hydrological changes at this metropolitan scale is critical. It is because there is clearly a window for policy intervention and recommendation since the city administration is under pressure to take immediate actions to address flooding problem and future climate change challenges.
Temporal scale of analysis: This research is focused on the 1990-2010 period when Ho Chi Minh City region experienced rapid population growth and dramatic hydrological change and thus the impact of urbanization on water system are observable. In addition, Dau Tieng Reservoir was only completed in 1989 and thus made the studied area hydrologically independent from upstream storm events.
Figure 3: Stream network in the studied area which is defined by the catchment area along Saigon River and between Dau Tieng Reservoir and Phu An hydrologic station.

NGUYEN, Dzung Urban form & hydrologic performance in Saigon River Basin 49th ISOCARP Congress 2013
5
Hydrologic data: There are 2 hydrological stations on Saigon River in the studied area, Thu Dau Mot station locating in Binh Duong province and Phu An station in Ho Chi Minh City’s downtown [Figure 3]. These stations record only water elevations per hour. There is no data on flow quantity available due to the complication of measurement caused by diurnal tide. In addition, there are 2 nearby stations: Nha Be locating downstream on Nha Be River into which Saigon River empties, and Vung Tau in the coastal city of Vung Tau to record sea-level. Boundaries of watersheds within Ho Chi Minh City jurisdiction are provided by Center for Water Resources and Climate Change [National University of Ho Chi Minh City]. The data take into account hydraulic system and man-made topography in defining watershed boundaries. Boundaries for upstream watersheds are delineated from NASA SRTM Digital Elevation Model data [90-meter resolution] using ArcGIS.
Year Data source Major Satellite Major acquisition date
Band used Cell size
1990 USGS GLS Landsat 5 1/16/1989 2,3,4 30.0
1993 USGS Landsat Pr. Landsat 4 2/4/1993 1,2,5 30.0
1996 USGS Landsat Pr. Landsat 5 2/21/1996 3,5,6 30.0
2000 USGS GLS Landsat 7 11/6/2000 2,3,4 26.9
2002 USGS Landsat Pr. Landsat 7 2/13/2002 2,4,5 26.9
2005 USGS Landsat Pr. Landsat 7 1/4/2005 1,2,4 26.9
2010 USGS GLS Landsat 5 12/9/2009 2,3,5 26.9
Table 1: Satellite Data Sources and Characteristics. Source: USGS Earth Explore.
Development Data: To compare development states over a 20-year period, it is fundamental that data have the same resolution and level of details over time. Therefore, the author decides to use Landsat Global Land Survey [GLS] dataset and other Landsat data which covers the entire world and accessible to the public. This satellite imagery contains multi-spectral and multi-temporal information that allows different image classification purposes and land-cover comparison over time. For the purpose of this research, the author use GLS Enhanced imagery of 1990, 2000 and 2010 and original Landsat 4, 5 and 7 images of 1993, 1996, 2002 and 2005 respectively [Table 1].
4. Measurements
4.1. Urban form measurement
To measure urban and landscape’s spatial configurations, one basic unit is patch. Patch is defined as a nonlinear discrete area of relatively homogeneous environmental conditions and is relevant to a given organism or an ecological phenomenon (Forman (1995), p.39; Alberti (2008) p.100). Patch characteristics are important to the understanding of ecological processes because size, shape and dispersion of patches affect ecological regeneration and succession (Forman, 1995). Saigon Basin contains 5 major types of patches: built-areas, bare soil, vegetation, wetland and water.
Using image classification tool in ArcGIS and Landsat satellite data, landcover raster data, which contain different compositions of 5 landscape patches in 1990, 1993, 1996, 2000, 2002, 2005, and 2010, are produced [Figure 4]. Among these landscape components, only urban patches are investigated in this research. Although spatial configurations of landscape patches such as vegetated areas, wetlands and water-bodies also affect hydrologic performance, they are not included in this research due to their seasonal variations caused by agricultural activities and monsoon rainfall. The urban components of landscape composition are then separated into single-value raster data for further analysis.
Base on literature review, we select 5 metrics [Table 2] to measure urban form or spatial configurations of urban patches that relate to their impacts on hydrologic performance. Except compactness, all metrics are calculated in FRAGSTATS Software using its pre-defined formulas [Table 2]. The results of calculation are presented in Table 3.

NGUYEN, Dzung Urban form & hydrologic performance in Saigon River Basin 49th ISOCARP Congress 2013
6
Metrics Formula Explanation
SIZE: Total size [CA]
[hectare]
aij = area of patch ij
CA and PLAND comprising a landscape mosaic are perhaps the most fundamental measurements of the spatial extent of urban development and its impacts on hydrologic system.
SIZE: Landscape percentage
[PLAND] [%]
Pi = proportion of the landscape occupied by urban patch. aij = area of patch ij. A = total landscape area
Since PLAND is a relative measure, it may be a more appropriate measure of landscape composition than total area for comparing among landscapes of varying sizes. Previous studies affirm that landscape percentage of urbanized patches can determine ecosystem's capability to maintain its hydrologic function (Arnold Jr and Gibbons 1996, Olivera and DeFee 2007).
SHAPE: Compactness
[K]
K = 2√[πCA/10,000]/TE CA: Class area [hectare] TE: Edge length [m]
K is ecologically meaningful for the urban patch form because it concentrates the built area in a more enclosed form and conserve land for the ecosystem’s hydrologic functions such as retain and filter storm-water run-off (Yang 2007).
An example of urban patch shape and corresponding compactness scores.
An example of complex urban edge in an unplanned settlement north of Ho Chi Minh City.
SHAPE: Fractal [D]
D = log CA / log TE CA: Class area [hectare] TE: Edge length [m]
D is the measurement of edge complexity. The implication of Fractal dimension of urban form in regarding to hydrologic performance is not yet known. Greater fractal value could mean an increase of accessibility to natural landscape for urban run-off, and thus a reduction of peak volume and flow velocity.
DISPERSION: Aggregate index [AI]
gii = number of like adjacencies between pixels of urban patch.
max-gii = max number of like adjacencies between pixels of urban patch.
AI measures the probability that urban patches are adjacent to each other throughout a landscape. Previous studies confirm that aggregated urban area has a negative impact on stream conditions and result in higher storm-water discharge volume (Alberti, Booth et al. 2007, Greve 2012).
Table 2: Variables and metrics to measure urban patch configurations. Formula Source: Mcgarigal, Cushman et al. (2002) and Forman (1995);
Results: In 20 years, from 1990 to 2010, Saigon River Basin has experienced an unprecedented increase of impervious surface in terms of the total land area, landscape percentage, and the number of patches, regional distribution, and low land occupation. Base on the classification of Landsat images, a spatial evolution of urbanization process in the Basin is drawn out [Figure 4, Figure 5 & Table 3].

NGUYEN, Dzung Urban form & hydrologic performance in Saigon River Basin 49th ISOCARP Congress 2013
7
Figure 4: Landcover of Saigon River Basin in 1990, 2000 and 2010.
Figure 5: The expansion of urban patches in Saigon River Basin from 1990 to 2010.
In general, impervious surface or urban land cover has increased from 67 sqkm or only 2.69% of the Basin landscape in 1990 to 296 sqkm or 11.80% in 2010. Thus, impervious surface expanded by 4.4 times. Within the same period, the population was estimated to increase approximately 2.2 times only. In addition, over 44 sqkm of low land [below 1.3 meter] had been drained out to build housing and factories. As a result, the settlement area below flooding alarming rate III [1.3 meter] increased by almost 400%. Urban development also occurred in the upstream catchment area of Saigon River, especially in Binh Duong Province. About 70 sqkm of land here were urbanized from 1990 to 2010. The greatest rate of urbanization usually found in 1996 to 2010 when we also observe significantly increasing trend of Saigon River's water level. In total, 229 sqkm of agricultural and wetland were converted into impervious surface within 20-year period.
The urbanized areas in Saigon River Basin were not only changed in term of size, but also in term of shape and dispersion. Overtime, the compactness of the Basin's urban areas as well as Ho Chi Minh City urban area had been reduced from the score of 0.11 and 0.043 in 1990 to 0.07 and 0.026 in 2010 respectively. Figure 6 explains the decrease of the city’s compactness as the result of urban developments, perhaps unplanned ones, along major transportation corridors such as Highway No.1 and No. 13 in the outskirt of the city – a popular phenomenon in Vietnam due to the limit access to basic infrastructure in rural areas far from transportation corridors. In contrast to the Compactness Index K, Fractal measurement D in general increased slightly during the 20 years of urbanization following a sine curve. The K value increased from 1.27 in 1990 to 1.32 in 2010. The increase of Fractal dimension might reflect the increasing dominance of informal developments along the urban edge during the 20-year period.
NGUYEN, Dzung Urban form & hydrologic performance in Saigon River Basin 49th ISOCARP Congress 2013
8
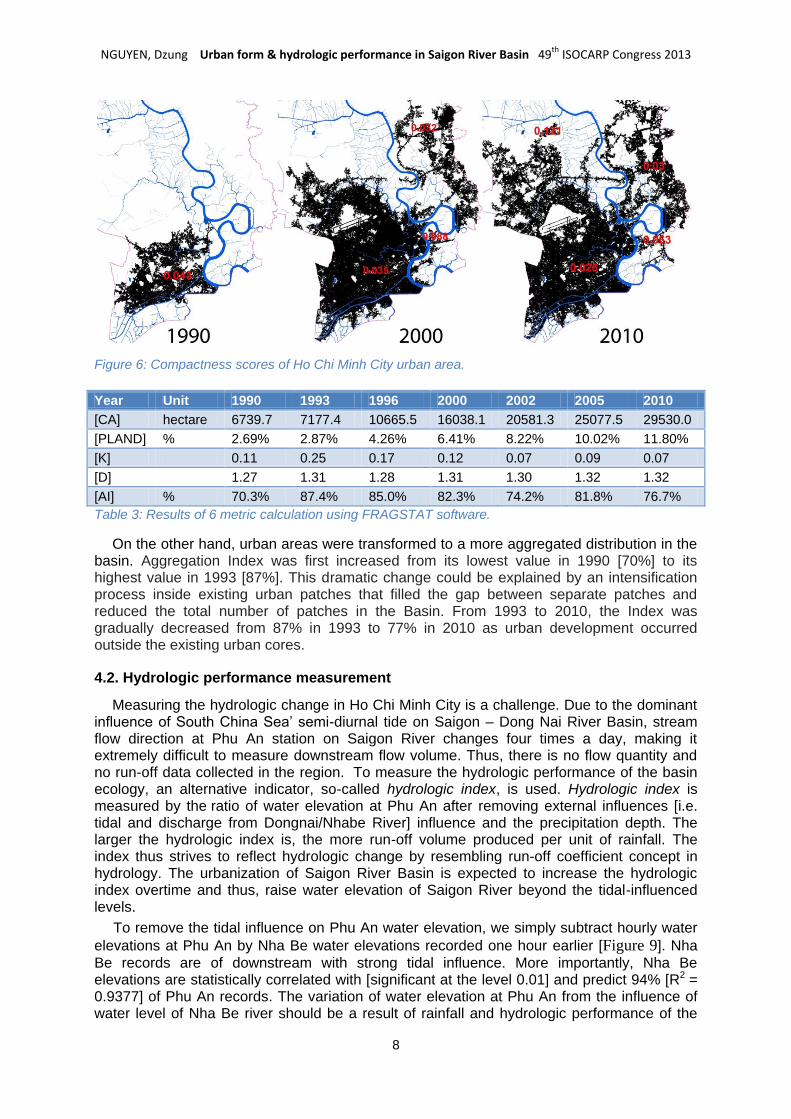
Figure 6: Compactness scores of Ho Chi Minh City urban area.
Year Unit 1990 1993 1996 2000 2002 2005 2010
[CA] hectare 6739.7 7177.4 10665.5 16038.1 20581.3 25077.5 29530.0
[PLAND] % 2.69% 2.87% 4.26% 6.41% 8.22% 10.02% 11.80%
[K] 0.11 0.25 0.17 0.12 0.07 0.09 0.07
[D] 1.27 1.31 1.28 1.31 1.30 1.32 1.32
[AI] % 70.3% 87.4% 85.0% 82.3% 74.2% 81.8% 76.7%
Table 3: Results of 6 metric calculation using FRAGSTAT software.
On the other hand, urban areas were transformed to a more aggregated distribution in the basin. Aggregation Index was first increased from its lowest value in 1990 [70%] to its highest value in 1993 [87%]. This dramatic change could be explained by an intensification process inside existing urban patches that filled the gap between separate patches and reduced the total number of patches in the Basin. From 1993 to 2010, the Index was gradually decreased from 87% in 1993 to 77% in 2010 as urban development occurred outside the existing urban cores.
4.2. Hydrologic performance measurement
Measuring the hydrologic change in Ho Chi Minh City is a challenge. Due to the dominant influence of South China Sea’ semi-diurnal tide on Saigon – Dong Nai River Basin, stream flow direction at Phu An station on Saigon River changes four times a day, making it extremely difficult to measure downstream flow volume. Thus, there is no flow quantity and no run-off data collected in the region. To measure the hydrologic performance of the basin ecology, an alternative indicator, so-called hydrologic index, is used. Hydrologic index is measured by the ratio of water elevation at Phu An after removing external influences [i.e. tidal and discharge from Dongnai/Nhabe River] influence and the precipitation depth. The larger the hydrologic index is, the more run-off volume produced per unit of rainfall. The index thus strives to reflect hydrologic change by resembling run-off coefficient concept in hydrology. The urbanization of Saigon River Basin is expected to increase the hydrologic index overtime and thus, raise water elevation of Saigon River beyond the tidal-influenced levels.
To remove the tidal influence on Phu An water elevation, we simply subtract hourly water
elevations at Phu An by Nha Be water elevations recorded one hour earlier [Figure 9]. Nha
Be records are of downstream with strong tidal influence. More importantly, Nha Be elevations are statistically correlated with [significant at the level 0.01] and predict 94% [R2 = 0.9377] of Phu An records. The variation of water elevation at Phu An from the influence of water level of Nha Be river should be a result of rainfall and hydrologic performance of the
NGUYEN, Dzung Urban form & hydrologic performance in Saigon River Basin 49th ISOCARP Congress 2013
9
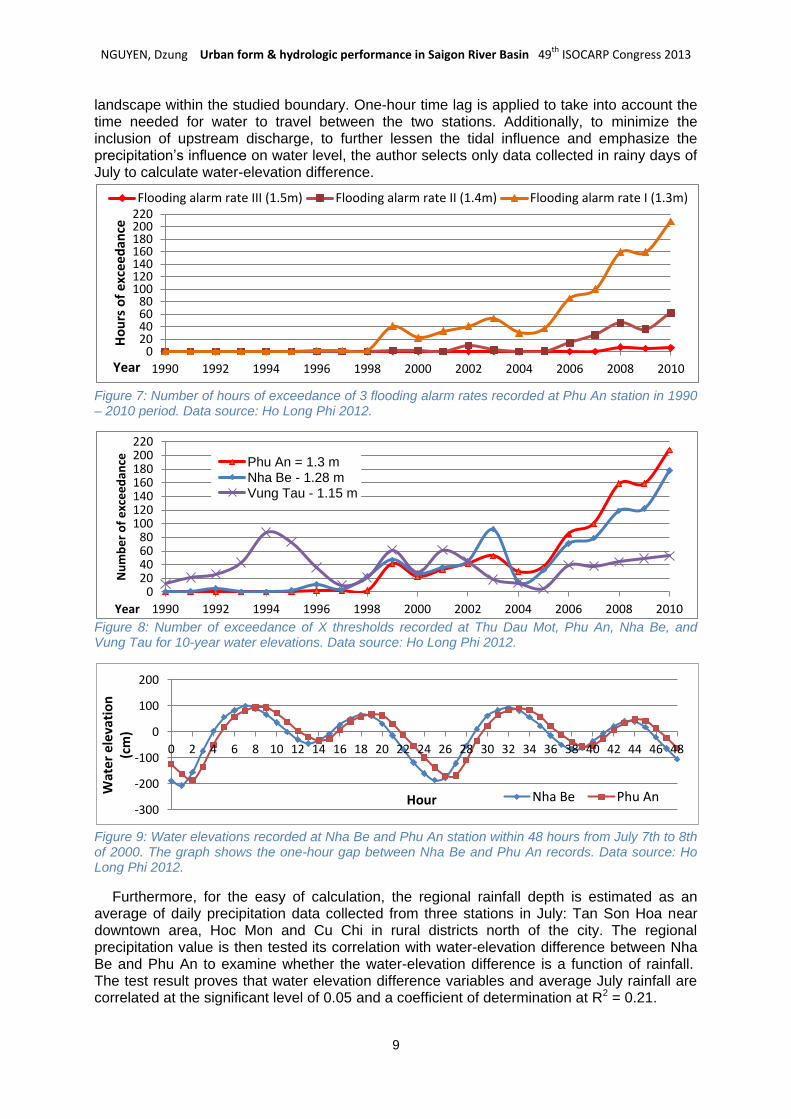
landscape within the studied boundary. One-hour time lag is applied to take into account the time needed for water to travel between the two stations. Additionally, to minimize the inclusion of upstream discharge, to further lessen the tidal influence and emphasize the precipitation’s influence on water level, the author selects only data collected in rainy days of July to calculate water-elevation difference.
Figure 7: Number of hours of exceedance of 3 flooding alarm rates recorded at Phu An station in 1990 – 2010 period. Data source: Ho Long Phi 2012.
Figure 8: Number of exceedance of X thresholds recorded at Thu Dau Mot, Phu An, Nha Be, and Vung Tau for 10-year water elevations. Data source: Ho Long Phi 2012.
Figure 9: Water elevations recorded at Nha Be and Phu An station within 48 hours from July 7th to 8th of 2000. The graph shows the one-hour gap between Nha Be and Phu An records. Data source: Ho Long Phi 2012.
Furthermore, for the easy of calculation, the regional rainfall depth is estimated as an average of daily precipitation data collected from three stations in July: Tan Son Hoa near downtown area, Hoc Mon and Cu Chi in rural districts north of the city. The regional precipitation value is then tested its correlation with water-elevation difference between Nha Be and Phu An to examine whether the water-elevation difference is a function of rainfall. The test result proves that water elevation difference variables and average July rainfall are correlated at the significant level of 0.05 and a coefficient of determination at R2 = 0.21.
0 20 40 60 80
100 120 140 160 180 200 220
1990 1992 1994 1996 1998 2000 2002 2004 2006 2008 2010
Ho
urs
of
exc
ee
dan
ce
Year
Flooding alarm rate III (1.5m) Flooding alarm rate II (1.4m) Flooding alarm rate I (1.3m)
0 20 40 60 80
100 120 140 160 180 200 220
1990 1992 1994 1996 1998 2000 2002 2004 2006 2008 2010
Nu
mb
er
of
exc
ee
dan
ce
Year
Phu An = 1.3 m Nha Be - 1.28 m Vung Tau - 1.15 m
-300
-200
-100
0
100
200
0 2 4 6 8 10 12 14 16 18 20 22 24 26 28 30 32 34 36 38 40 42 44 46 48
Wat
er
ele
vati
on
(c
m)
Hour Nha Be Phu An
NGUYEN, Dzung Urban form & hydrologic performance in Saigon River Basin 49th ISOCARP Congress 2013
10
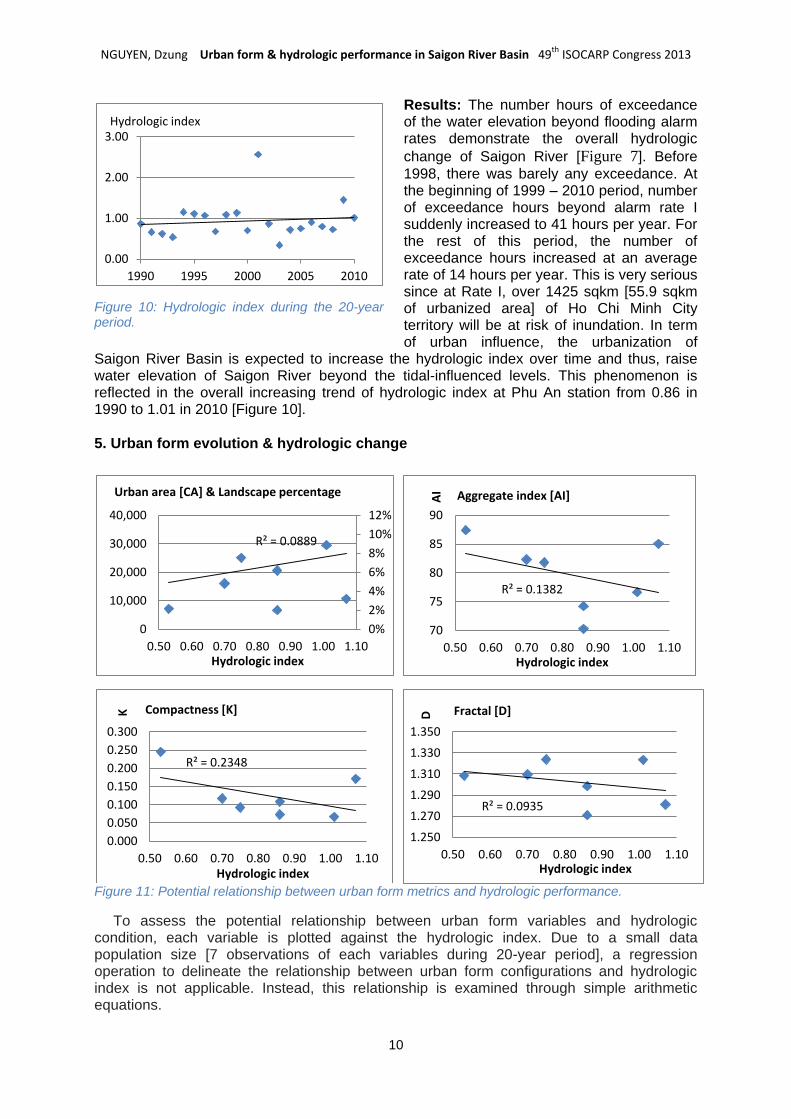
Results: The number hours of exceedance of the water elevation beyond flooding alarm rates demonstrate the overall hydrologic
change of Saigon River [Figure 7]. Before
1998, there was barely any exceedance. At the beginning of 1999 – 2010 period, number of exceedance hours beyond alarm rate I suddenly increased to 41 hours per year. For the rest of this period, the number of exceedance hours increased at an average rate of 14 hours per year. This is very serious since at Rate I, over 1425 sqkm [55.9 sqkm of urbanized area] of Ho Chi Minh City territory will be at risk of inundation. In term of urban influence, the urbanization of
Saigon River Basin is expected to increase the hydrologic index over time and thus, raise water elevation of Saigon River beyond the tidal-influenced levels. This phenomenon is reflected in the overall increasing trend of hydrologic index at Phu An station from 0.86 in 1990 to 1.01 in 2010 [Figure 10].
5. Urban form evolution & hydrologic change
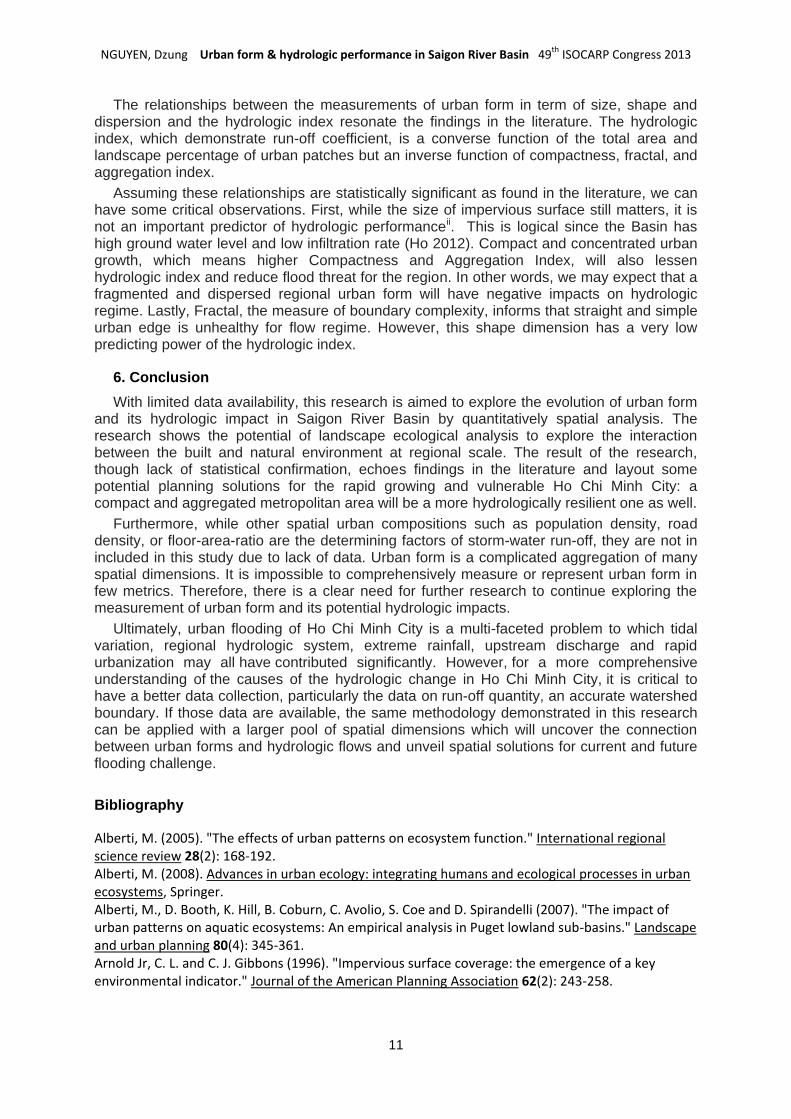
Figure 11: Potential relationship between urban form metrics and hydrologic performance.
To assess the potential relationship between urban form variables and hydrologic condition, each variable is plotted against the hydrologic index. Due to a small data population size [7 observations of each variables during 20-year period], a regression operation to delineate the relationship between urban form configurations and hydrologic index is not applicable. Instead, this relationship is examined through simple arithmetic equations.
R² = 0.0889
0%
2%
4%
6%
8%
10%
12%
0
10,000
20,000
30,000
40,000
0.50 0.60 0.70 0.80 0.90 1.00 1.10 Hydrologic index
Urban area [CA] & Landscape percentage
R² = 0.1382
70
75
80
85
90
0.50 0.60 0.70 0.80 0.90 1.00 1.10
AI
Hydrologic index
Aggregate index [AI]
R² = 0.2348
0.000
0.050
0.100
0.150
0.200
0.250
0.300
0.50 0.60 0.70 0.80 0.90 1.00 1.10
K
Hydrologic index
Compactness [K]
R² = 0.0935
1.250
1.270
1.290
1.310
1.330
1.350
0.50 0.60 0.70 0.80 0.90 1.00 1.10
D
Hydrologic index
Fractal [D]
Figure 10: Hydrologic index during the 20-year period.
0.00
1.00
2.00
3.00
1990 1995 2000 2005 2010
Hydrologic index
NGUYEN, Dzung Urban form & hydrologic performance in Saigon River Basin 49th ISOCARP Congress 2013
11
The relationships between the measurements of urban form in term of size, shape and dispersion and the hydrologic index resonate the findings in the literature. The hydrologic index, which demonstrate run-off coefficient, is a converse function of the total area and landscape percentage of urban patches but an inverse function of compactness, fractal, and aggregation index.
Assuming these relationships are statistically significant as found in the literature, we can have some critical observations. First, while the size of impervious surface still matters, it is not an important predictor of hydrologic performanceii. This is logical since the Basin has high ground water level and low infiltration rate (Ho 2012). Compact and concentrated urban growth, which means higher Compactness and Aggregation Index, will also lessen hydrologic index and reduce flood threat for the region. In other words, we may expect that a fragmented and dispersed regional urban form will have negative impacts on hydrologic regime. Lastly, Fractal, the measure of boundary complexity, informs that straight and simple urban edge is unhealthy for flow regime. However, this shape dimension has a very low predicting power of the hydrologic index.
6. Conclusion
With limited data availability, this research is aimed to explore the evolution of urban form and its hydrologic impact in Saigon River Basin by quantitatively spatial analysis. The research shows the potential of landscape ecological analysis to explore the interaction between the built and natural environment at regional scale. The result of the research, though lack of statistical confirmation, echoes findings in the literature and layout some potential planning solutions for the rapid growing and vulnerable Ho Chi Minh City: a compact and aggregated metropolitan area will be a more hydrologically resilient one as well.
Furthermore, while other spatial urban compositions such as population density, road density, or floor-area-ratio are the determining factors of storm-water run-off, they are not in included in this study due to lack of data. Urban form is a complicated aggregation of many spatial dimensions. It is impossible to comprehensively measure or represent urban form in few metrics. Therefore, there is a clear need for further research to continue exploring the measurement of urban form and its potential hydrologic impacts.
Ultimately, urban flooding of Ho Chi Minh City is a multi-faceted problem to which tidal variation, regional hydrologic system, extreme rainfall, upstream discharge and rapid urbanization may all have contributed significantly. However, for a more comprehensive understanding of the causes of the hydrologic change in Ho Chi Minh City, it is critical to have a better data collection, particularly the data on run-off quantity, an accurate watershed boundary. If those data are available, the same methodology demonstrated in this research can be applied with a larger pool of spatial dimensions which will uncover the connection between urban forms and hydrologic flows and unveil spatial solutions for current and future flooding challenge.
Bibliography
Alberti, M. (2005). "The effects of urban patterns on ecosystem function." International regional science review 28(2): 168-192. Alberti, M. (2008). Advances in urban ecology: integrating humans and ecological processes in urban ecosystems, Springer. Alberti, M., D. Booth, K. Hill, B. Coburn, C. Avolio, S. Coe and D. Spirandelli (2007). "The impact of urban patterns on aquatic ecosystems: An empirical analysis in Puget lowland sub-basins." Landscape and urban planning 80(4): 345-361. Arnold Jr, C. L. and C. J. Gibbons (1996). "Impervious surface coverage: the emergence of a key environmental indicator." Journal of the American Planning Association 62(2): 243-258.
NGUYEN, Dzung Urban form & hydrologic performance in Saigon River Basin 49th ISOCARP Congress 2013
12
Booth, D. B. (1991). "Urbanization and the natural drainage system--impacts, solutions, and prognoses." Dapice, D., J. A. Gomez-Ibanez, X. T. Nguyen and U. V. Nam (2009). Ho Chi Minh City: The Challenges of Growth, United Nations Development Programme in Vietnam. Forman, R. T. T. (1995). Land mosaics: the ecology of landscapes and regions, Cambridge Univ Pr. Greve, A. I. (2012). "Linking urban form, land cover pattern, and hydrologic flow regime in the Puget Sound Lowland." Urban Ecosystems: 1-14. Ho, L. P. (2008). Impacts of Climate Changes and Urbanisation on Urban Inundation in Ho Chi Minh City. 11th International Conference on Urban Drainage, Edinburg, UK. Ho, L. P. (2010). "Local climate changes in Ho Chi Minh City: a statistical analysis." Ho, L. P. (2012). Personal communication. Klein, R. D. (1979). "URBANIZATION AND STREAM QUALITY IMPAIRMENT1." JAWRA Journal of the American Water Resources Association 15(4): 948-963. Luong, V. V. (2009). "Analyse the fluctuation and water level trend in Saigon-Dong Nai river system." Luong, V. V. (2009). Ảnh hưởng của sự phát triển đô thị và biến đổi khí hậu toàn cầu đến gia tăng cường độ mưa và việc xây dựng biểu đồ mưa thiết kế cho Thành phố Hồ Chí Minh (The influence of urban development and Climate Change to the increase of precipitation intensity in Ho Chi Minh City). 11th Southern Institutre of Metoerology, Hydrology and Environment Scientific Seminar, Ho Chi Minh City, Southern Institutre of Metoerology, Hydrology and Environment Management, I. C. f. E. (2010). Ho Chi Minh City Adaptation to Climate Change. Mandaluyong City, Phillipines, Asia Development Bank. Mcgarigal, K., S. Cushman, M. Neel and E. Ene (2002). "FRAGSTATS: spatial pattern analysis program for categorical maps." Office, H. S. (2010). Niem Giam Thong Ke 2010 (2010 Statistics Yearbook). H. S. Office. Ho Chi Minh City, HCMC Statistics Office. Olivera, F. and B. B. DeFee (2007). "Urbanization and Its Effect On Runoff in the Whiteoak Bayou Watershed, Texas1." JAWRA Journal of the American Water Resources Association 43(1): 170-182. Paul, M. J. and J. L. Meyer (2001). "Streams in the urban landscape." Urban Ecology: 207-231. Research, H. I. o. E. (2006). "Conference Report: Urban flooding in Ho Chi Minh City - Causes and Solutions." Schueler, T. R. (1994). "The importance of imperviousness." Watershed protection techniques 1(3): 100-111. Truong, H. (2008). Nghien cuu anh huong cua mua, trieu den ngap ung va thoat nuoc do thi thanh pho Ho Chi Minh (Research on the impacts of rainfall and tidal to urban flooding and drainage in Ho Chi Minh City). Doctor thesis, Vietnam Institute of Meteorology, Hydrology and Environment. Vnexpress (2011). Trieu cuong ky luc, thanh pho Ho Chi Minh ngap sau (Tide reaches a new record, HCMC sinks deep in water). Whitford, V., A. R. Ennos and J. F. Handley (2001). "“City form and natural process”—indicators for the ecological performance of urban areas and their application to Merseyside, UK." Landscape and Urban Planning 57(2): 91-103. Yang, P. (2007). Hydrological effects of new urban form and landscape change. Atlanta, GA, Georiga Institute of Technology.
i Email: [email protected] ii Perhaps, the amount of wetland and water areas, both seasonal and permanent, converted into
urban development may be a better predictor of hydrologic performance in Saigon River Basin. These areas, however, can only be detected fully in the wet season when Landsat images of the Basin are covered with clouds.
Copyright © 2022 FDOKUMEN