Are MIS research instruments stable? An exploratory reconsideration of the computer playfulness...
9
Are MIS research instruments stable? An exploratory reconsideration of the computer playfulness scale Alexander Serenko a, * , Ofir Turel b a Faculty of Business Administration, Lakehead University, Thunder Bay, Ontario P7B 5E1, Canada b College of Business and Economics, California State University-Fullerton, Fullerton, CA 92834-6848, USA Received 18 November 2005; received in revised form 28 February 2007; accepted 17 August 2007 Abstract Computer systems have changed significantly in the past decades and this means that MIS research instruments developed when surveying users of legacy systems could be out-of-date. However, these instruments are often considered stable. We undertook an empirical exploratory investigation of the unidimensionality of the computer playfulness scale because several academics had reported inconsistent item loadings that they could not explain. As a result of our investigation, we concluded that the original computer playfulness construct consists of two correlated but distinct factors when administered to today’s IS users. Negatively worded items had no impact on the properties of the scale. Temporal structural stability was hypothesized as an explanation of the observed shift in this construct’s psychometric properties. # 2007 Elsevier B.V. All rights reserved. Keywords: Computer playfulness; Temporal structural stability; Scale validation; Factorial invariance; Factor analysis; Measurement instruments; Resourcefulness 1. Problem statement MIS researchers and practitioners rarely come across a study that fails to achieve its purpose or invalidates a previously supported theory that has been considered a standard. In most journals, a successful application of existing models, methodologies, and instruments is required for paper acceptance. Editors seem reluctant to accept papers that invalidate well-established princi- ples, and reviewers tend to attribute failures to poor study designs [14,23]. Poor study design, however, is not the only source of misfit of well-established research models and instruments. Contemporary literature in reference disciplines such as sociology often reports on the temporal structural instability of measures. This is in line with the holistic construal of construct validation that suggests it is impossible to find measures that do not vary over time and across contexts [4]. Interpretation of multiple time-point data has a long- standing tradition [28]. For example, the Journal of Sociological Methods and Research devoted an entire issue to the investigation of the reliability and stability of survey items over time [5]. One of the early conceptualizations of this phenomenon is a model for the instability assessment of a variable observed at multiple points in time. It suggests that a variable consists of two components: the true variable score and a random error. The true score is an additive function of two components: the true score at the previous point in time and the disturbance score representing item www.elsevier.com/locate/im Available online at www.sciencedirect.com Information & Management 44 (2007) 657–665 * Corresponding author. Tel.: +1 807 343 8698; fax: +1 807 343 8443. E-mail address: [email protected] (A. Serenko). 0378-7206/$ – see front matter # 2007 Elsevier B.V. All rights reserved. doi:10.1016/j.im.2007.08.002
-
Upload
independent -
Category
Documents
-
view
0 -
download
0
Transcript of Are MIS research instruments stable? An exploratory reconsideration of the computer playfulness...

Are MIS research instruments stable? An exploratory
reconsideration of the computer playfulness scale
Alexander Serenko a,*, Ofir Turel b
a Faculty of Business Administration, Lakehead University, Thunder Bay, Ontario P7B 5E1, Canadab College of Business and Economics, California State University-Fullerton, Fullerton, CA 92834-6848, USA
Received 18 November 2005; received in revised form 28 February 2007; accepted 17 August 2007
www.elsevier.com/locate/im
Available online at www.sciencedirect.com
Information & Management 44 (2007) 657–665
Abstract
Computer systems have changed significantly in the past decades and this means that MIS research instruments developed when
surveying users of legacy systems could be out-of-date. However, these instruments are often considered stable. We undertook an
empirical exploratory investigation of the unidimensionality of the computer playfulness scale because several academics had
reported inconsistent item loadings that they could not explain. As a result of our investigation, we concluded that the original
computer playfulness construct consists of two correlated but distinct factors when administered to today’s IS users. Negatively
worded items had no impact on the properties of the scale. Temporal structural stability was hypothesized as an explanation of the
observed shift in this construct’s psychometric properties.
# 2007 Elsevier B.V. All rights reserved.
Keywords: Computer playfulness; Temporal structural stability; Scale validation; Factorial invariance; Factor analysis; Measurement instruments;
Resourcefulness
1. Problem statement
MIS researchers and practitioners rarely come across
a study that fails to achieve its purpose or invalidates a
previously supported theory that has been considered a
standard. In most journals, a successful application of
existing models, methodologies, and instruments is
required for paper acceptance. Editors seem reluctant to
accept papers that invalidate well-established princi-
ples, and reviewers tend to attribute failures to poor
study designs [14,23]. Poor study design, however, is
not the only source of misfit of well-established
research models and instruments.
* Corresponding author. Tel.: +1 807 343 8698;
fax: +1 807 343 8443.
E-mail address: [email protected] (A. Serenko).
0378-7206/$ – see front matter # 2007 Elsevier B.V. All rights reserved.
doi:10.1016/j.im.2007.08.002
Contemporary literature in reference disciplines
such as sociology often reports on the temporal
structural instability of measures. This is in line with
the holistic construal of construct validation that
suggests it is impossible to find measures that do not
vary over time and across contexts [4].
Interpretation of multiple time-point data has a long-
standing tradition [28]. For example, the Journal of
Sociological Methods and Research devoted an entire
issue to the investigation of the reliability and stability
of survey items over time [5]. One of the early
conceptualizations of this phenomenon is a model for
the instability assessment of a variable observed at
multiple points in time. It suggests that a variable
consists of two components: the true variable score and
a random error. The true score is an additive function of
two components: the true score at the previous point
in time and the disturbance score representing item

A. Serenko, O. Turel / Information & Management 44 (2007) 657–665658
temporal instability. Also, indicator reliability may vary
when the same instrument is administered to different
populations [29]: the structural stability of a survey
instrument may depend on the period of time when the
survey took place and the subject population.
There is also a question of the temporal stability of
psychological measures. Although personality traits are
considered generally stable [17], their intensity may
vary over a person’s lifespan [19], e.g., young people
exhibit a lower degree of trait stability, and some traits
have a higher degree of temporal stability than the
others [9]. Further, the same survey instrument
administered to two dissimilar populations may
produce different factor structures [6].
At least five mechanisms are believed to affect trait
consistency over time: genetics, identity structure,
psychological factors, the environment, and person–
environment interactions [20]. Out of these, the
environment and person–environment interactions
matter because they may influence the individual traits
of computer users. A stable environment usually leads
to a high level of trait consistency whereas a changing
environment results in long-term modification of traits
[18]. Person–environment transactions affect traits
because people tend to modify their personalities to
fit their new environments.
The environment has changed for software users; the
software industry has undergone dramatic changes from
simple DOS-based applications to virtual reality
environments. Therefore, it may be presumed that
changes in the computing field might affect people’s
computer-related traits. Individuals who employed
older computer systems and today’s users may be
two distinct populations exhibiting different computer-
related traits. As such, structural instrument stability,
also termed factorial invariance, could be compromised
if the same standardized scale is administered to
different subgroups. Hence, some MIS research instru-
ments may need to be updated to reflect changes.
It has been found, though, that scales developed in
the 1980s are generally as reliable as contemporary ones
[8]. However, reliability is not sufficient for determining
unidimensionality or other facets of validity. Overall,
little is known about the temporal structural stability of
most MIS scales.
In our investigation, temporal structural stability was
assumed to be an explanation for changes in the
psychometric properties of a well-known MIS research
instrument: the computer playfulness scale (CPS) [27].
The initial study clearly established its validity. A
number of follow-up projects seemed to support these
conclusions. However, when the short version of the
original computer playfulness questionnaire was used,
it was found that three out of the seven items had
somewhat lower loadings [22]. An analogous problem
with the factor structure was reported in another
independent investigation [21]. Woszczynski [30]
documented a similar dilemma in her doctoral
dissertation. Three US professors stated that they had
to exclude the CPS from three of their publications
because item loadings were low and inconsistent, and
another reported the existence of two factors instead of
one. None of them could explain this discrepancy, but
all these studies were conducted after 1999, whereas the
computer playfulness instrument was developed by
investigating users of older software environments in
the late 1980s. The purpose of our study was to
understand this phenomenon by conducting an explora-
tory investigation of the current dimensionality of the
CPS.
To accomplish our task, we conducted a systematic
literature review of journal publications that reported
the use of the CPS and conducted an empirical
investigation of the factor structure of the instrument
and its predictive validity.
2. Computer playfulness
Computer playfulness explains an individual’s
tendency to interact spontaneously, intensively, openly,
creatively, and imaginatively with computers. It
emerged from the body of research on play. Playfulness
is an appropriate construct in the study of human–
computer interactions because computers are relatively
easy to use, provide quick responses, offer personaliza-
tion, and incorporate playful features such as multi-
media, graphics, and animation. It was originally
operationalized as a trait, expected to be relatively
stable over time; in our study, it was also. When the
scale was developed, evidence was provided for the
construct reliability and validity by conducting five
independent studies with over 400 participants. How-
ever, recently, confirmatory factor analysis of the CPS
revealed that a number of item loadings were lower than
that frequently accepted (a threshold of 0.7) (see
Table 1).
Loadings above 0.71 are considered excellent, 0.63
very good, 0.55 good, 0.45 fair, and 0.32 poor [24]. The
loadings in the studies were generally considered ‘very
good’, but there were items which may be only ‘fair’. A
subsequent exploratory factor analysis resulted in the
emergence of two factors (principal component analysis
was applied with an eigenvalue criterion of one,
unspecified number of factors). These observations
A. Serenko, O. Turel / Information & Management 44 (2007) 657–665 659
Table 1
CPS item loadings in three recent studies
Item Serenko [21], n = 75 Serenko et al. [22], n = 237 Woszczynski [30], n = 127
CPS1-spontaneous 0.568 0.572 0.513
CPS2-unimaginative 0.883 0.756 0.616
CPS3-flexible 0.692 0.62 0.725
CPS4-creative 0.832 0.809 0.716
CPS5-playful 0.601 0.516 0.593
CPS6-unoriginal 0.883 0.732 0.869
CPS7-uninventive 0.871 0.752 0.857
suggested that the CPS might no longer be unidimen-
sional.
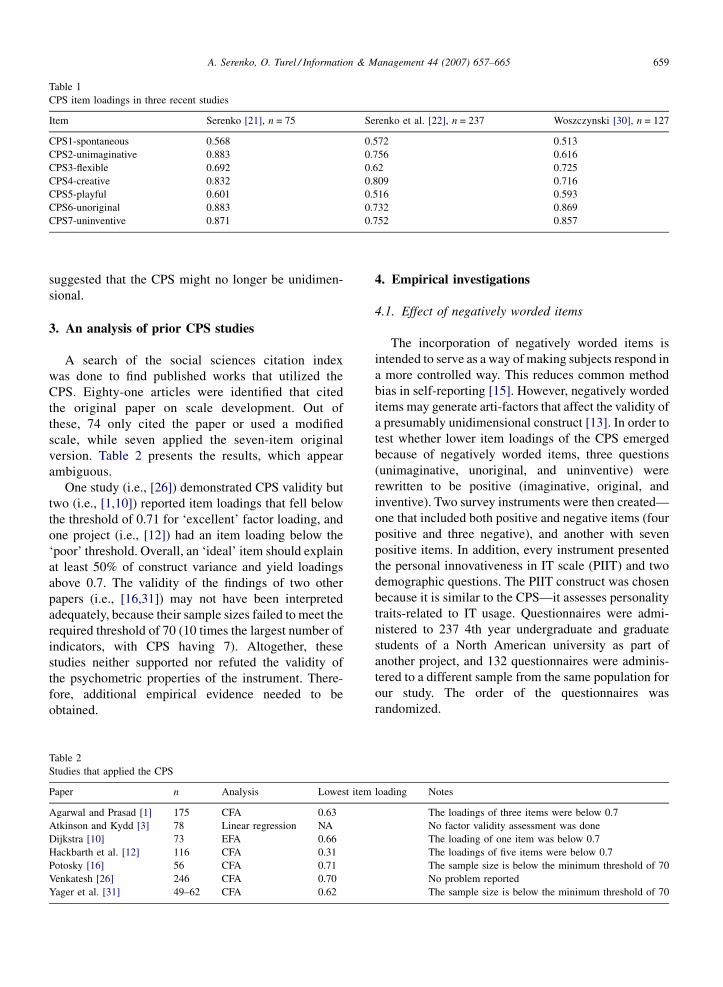
3. An analysis of prior CPS studies
A search of the social sciences citation index
was done to find published works that utilized the
CPS. Eighty-one articles were identified that cited
the original paper on scale development. Out of
these, 74 only cited the paper or used a modified
scale, while seven applied the seven-item original
version. Table 2 presents the results, which appear
ambiguous.
One study (i.e., [26]) demonstrated CPS validity but
two (i.e., [1,10]) reported item loadings that fell below
the threshold of 0.71 for ‘excellent’ factor loading, and
one project (i.e., [12]) had an item loading below the
‘poor’ threshold. Overall, an ‘ideal’ item should explain
at least 50% of construct variance and yield loadings
above 0.7. The validity of the findings of two other
papers (i.e., [16,31]) may not have been interpreted
adequately, because their sample sizes failed to meet the
required threshold of 70 (10 times the largest number of
indicators, with CPS having 7). Altogether, these
studies neither supported nor refuted the validity of
the psychometric properties of the instrument. There-
fore, additional empirical evidence needed to be
obtained.
Table 2
Studies that applied the CPS
Paper n Analysis Lowest item
Agarwal and Prasad [1] 175 CFA 0.63
Atkinson and Kydd [3] 78 Linear regression NA
Dijkstra [10] 73 EFA 0.66
Hackbarth et al. [12] 116 CFA 0.31
Potosky [16] 56 CFA 0.71
Venkatesh [26] 246 CFA 0.70
Yager et al. [31] 49–62 CFA 0.62
4. Empirical investigations
4.1. Effect of negatively worded items
The incorporation of negatively worded items is
intended to serve as a way of making subjects respond in
a more controlled way. This reduces common method
bias in self-reporting [15]. However, negatively worded
items may generate arti-factors that affect the validity of
a presumably unidimensional construct [13]. In order to
test whether lower item loadings of the CPS emerged
because of negatively worded items, three questions
(unimaginative, unoriginal, and uninventive) were
rewritten to be positive (imaginative, original, and
inventive). Two survey instruments were then created—
one that included both positive and negative items (four
positive and three negative), and another with seven
positive items. In addition, every instrument presented
the personal innovativeness in IT scale (PIIT) and two
demographic questions. The PIIT construct was chosen
because it is similar to the CPS—it assesses personality
traits-related to IT usage. Questionnaires were admi-
nistered to 237 4th year undergraduate and graduate
students of a North American university as part of
another project, and 132 questionnaires were adminis-
tered to a different sample from the same population for
our study. The order of the questionnaires was
randomized.
loading Notes
The loadings of three items were below 0.7
No factor validity assessment was done
The loading of one item was below 0.7
The loadings of five items were below 0.7
The sample size is below the minimum threshold of 70
No problem reported
The sample size is below the minimum threshold of 70

A. Serenko, O. Turel / Information & Management 44 (2007) 657–665660
Table 3
Comparisons of positive and negative items
Wording Mean Standard t-Value Significant
CPS1 Spontaneous 4.87 1.28 0.174 0.862
Spontaneous 4.84 1.28
CPS2 Imaginative 4.79 1.44 0.659 0.511
Unimaginative 4.89 1.37
CPS3 Flexible 5.58 1.23 0.661 0.509
Flexible 5.49 1.24
CPS4 Creative 5.49 1.23 0.310 0.757
Creative 5.45 1.25
CPS5 Playful 5.38 1.21 0.130 0.897
Playful 5.40 1.25
CPS6 Original 4.74 1.28 0.293 0.769
Unoriginal 4.78 1.27
CPS7 Inventive 4.81 1.36 0.230 0.817
Uninventive 4.78 1.33
Table 5
PFA—only positive items
Factor
1 2
CPS1 0.159 0.570CPS2 0.534 0.343
CPS3 0.081 0.768CPS4 0.470 0.472
CPS5 0.156 0.403CPS6 0.900 0.093
CPS7 0.799 0.192
Overall, 369 usable responses were obtained. Of
these, 187 questionnaires had both positive and negative
items and 182 had only positive. In order to analyze
whether negative item wording had an impact on the
psychometric properties of the instrument, three tests
were conducted. The first test identified differences in
the means of positive and negative items. For this, an
independent sample t-test was conducted for each
questionnaire item. As Table 3 shows, there are no
statistically significant differences in the means of items
CPS2, CPS6, and CPS7. Thus positively and negatively
worded items produced similar means.
The second test analyzed and compared factor
structures produced by the two sets of data: (a)
containing positive and negative items and (b) contain-
ing only positive. For this, PFA with Varimax rotation
was performed individually on each dataset with
unspecified number of factors. With respect to the
former dataset, two factors were extracted that
explained 60.4% of the variance with eigenvalues of
3.04 and 1.19, for factors 1 and 2 respectively (see
Table 4). Note that CPS4 loaded almost equally on both
Table 4
PFA—positive and negative items
Factor
1 2
CPS1 0.102 0.502CPS2 0.444 0.402
CPS3 0.123 0.662CPS4 0.488 0.496
CPS5 0.165 0.445CPS6 0.916 0.090
CPS7 0.763 0.247
factors. The dataset with only positively worded items
also consisted of two factors that explained 62.2% of the
variance with eigenvalues of 3.08 and 1.27 for factors 1
and 2, respectively (see Table 5).
The third test compared the reliability of the scale
with both positive and negative items to that with only
positive ones; the Cronbach’s alpha coefficients were
0.775 and 0.783, respectively. Therefore, these scales
behaved reliably and generated similar reliability
scores.
This demonstrated that the negatively worded
computer playfulness questionnaire items did not have
any impact on the instrument’s psychometric properties.
4.2. Dimensionality assessment
Lower item loadings may occur because the variance
that each indicator shares with the others does not
entirely relate to a specific construct—there may be
other unspecified latent variables capturing a significant
proportion of the uncommon variance of several items.
When there is a significant lack of unidimensionality,
the conclusions may be unwarranted, unreliable, biased,
or unstable [11]. Therefore, it was important to re-
examine the dimensionality of the CPS.
Five hundred and seventy-one data points from four
independent studies were pooled to assess the CPS
dimensionality. Ten observations with missing data
were excluded, and thus the final sample size was 561.
Table 6 gives the data sources and descriptions.
Cronbach’s alpha of this dataset was 0.83, an acceptable
level of reliability. However, this high reliability
coefficient does not warrant unidimensionality. All
the studies utilized the PIIT scale, and no PIIT
dimensionality problems were observed.
A preliminary assumption of PFA is that variables
have linear relationships with one another and the
factors. Because Likert-type scales with seven discrete
scores were used, the observations were jittered (a small
amount of noise was added to the discrete values) [7],

A. Serenko, O. Turel / Information & Management 44 (2007) 657–665 661
Table 6
Data source and description
Source n Subjects Sex (M%/F%) Average age
Serenko [21] 75 Users of an agent-based technology 80/20 43
Serenko et al. [22] 237 University students 58/42 25
Woszczynski [30] 127 University students 43/57 22
Present study 132 University students 60/40 25
and the relationships between the items were plotted in
a scatter-plot matrix. The plots demonstrated some non-
linear relationships and skewed distributions. Given that
the CPS items did not have units of measurement, it is
reasonable to transform them to linear relationships
without impacting interpretability. An estimation of the
required multivariate unconditional power transforma-
tions to multi-normality by the method of maximum
likelihood yielded an optimal transformation vector.
This vector of powers was used for transforming the
observations using the Box-Cox power transformation
[2]. A visual inspection of the obtained scatter-plot
matrix revealed two key observations: all items were
relatively normally distributed and relationships among
the items were reasonably linear. Therefore, the
transformed data were appropriate for factor analysis.
PFA with no rotation was applied to the transformed
dataset of 561 observations, with a Kaiser Criterion of
eigenvalues greater than one. The analysis yielded two
factors with eigenvalues of 3.60 and 1.12, respectively.
The first captured 51.4% of the variance and the second
captured an additional 15.9%, together explaining about
two-thirds of the variance. The factor structure for the
entire dataset was similar to the factor structures
observed in the individual studies. Items CP2, CP6, and
CP7 seem to be different from the rest of the items, since
they have negative loadings on factor two (see Table 7).
It is reasonable to assume that these two factors are
correlated. The factors were previously considered to be
a single factor, and all seven items were believed to be
consistent. Thus, some correlation is expected between
Table 7
Principal factor analysis—unrotated solution
Factor-loadings Factor-items
1 2 1 2
CPS1 0.613 0.375 Spontaneous
CPS2 0.756 S0.281 Unimaginative
CPS3 0.647 0.487 Flexible
CPS4 0.791 0.112 Creative
CPS5 0.582 0.495 Playful
CPS6 0.780 S0.480 Unoriginal
CPS7 0.810 S0.414 Uninventive
the emerging factors. Also, the clustering of the items in
the non-rotated factor plots indicated that the orthogo-
nal axis system might not be the best fit. A principal
factor analysis procedure with oblique rotation (PRO-
MAX, Kappa = 4) was applied to the data in order to
enable correlation between the factors. Again, two
appeared. The first captured 45.7% of the variance in the
data and the second captured an additional 10.1%.
Altogether, a reasonable portion of the variance was
captured by the two factors. Table 8 presents the pattern
matrix of the oblique solution.
The correlation between the two factors that emerged
was 0.60. Overall, we felt that the obliquely rotated
model accurately portrayed the relationships between
the constructs, and between the items and the
constructs. Fig. 1 presents the two-factor oblique model.
The PFA procedure illustrated that a two-factor
oblique model was superior to a single-factor con-
ceptualization of computer playfulness. However, there
might be an overarching playfulness construct (a
second-order factor) that drives the correlation between
the two factors: CPS-a and CPS-b. Second-order models
are often employed in various contexts, including MIS
[25]. To examine this option, a model-comparison
approach was taken, using the structural equation
modeling facilities of LISREL.
As such, four plausible structural models were a-
priori specified and tested.
� T
Ta
Pr
C
C
C
C
C
C
C
he first assumed that all seven CPS items loaded on a
single factor.
ble 8
incipal factor analysis with oblique rotation
Factor
1 2
PS1 0.065 0.540PS2 0.557 0.207
PS3 �0.106 0.801PS4 0.270 0.566PS5 �0.019 0.600PS6 0.986 �0.126
PS7 0.866 0.015
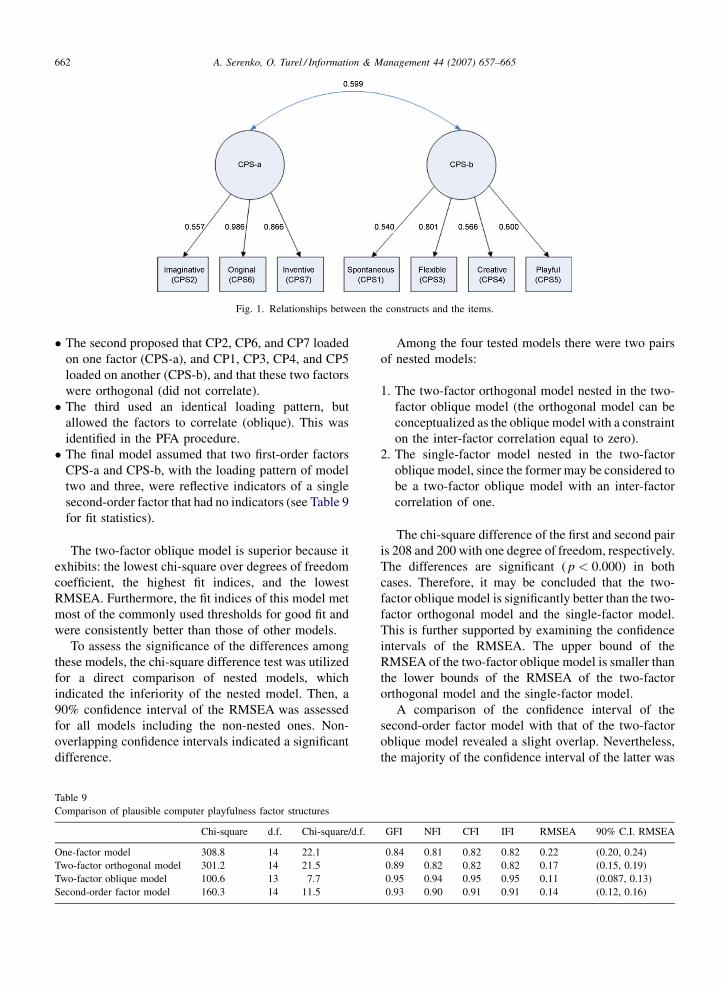
A. Serenko, O. Turel / Information & Management 44 (2007) 657–665662
Fig. 1. Relationships between the constructs and the items.
� T
Ta
C
O
Tw
Tw
Se
he second proposed that CP2, CP6, and CP7 loaded
on one factor (CPS-a), and CP1, CP3, CP4, and CP5
loaded on another (CPS-b), and that these two factors
were orthogonal (did not correlate).
� T
he third used an identical loading pattern, butallowed the factors to correlate (oblique). This was
identified in the PFA procedure.
� T
he final model assumed that two first-order factorsCPS-a and CPS-b, with the loading pattern of model
two and three, were reflective indicators of a single
second-order factor that had no indicators (see Table 9
for fit statistics).
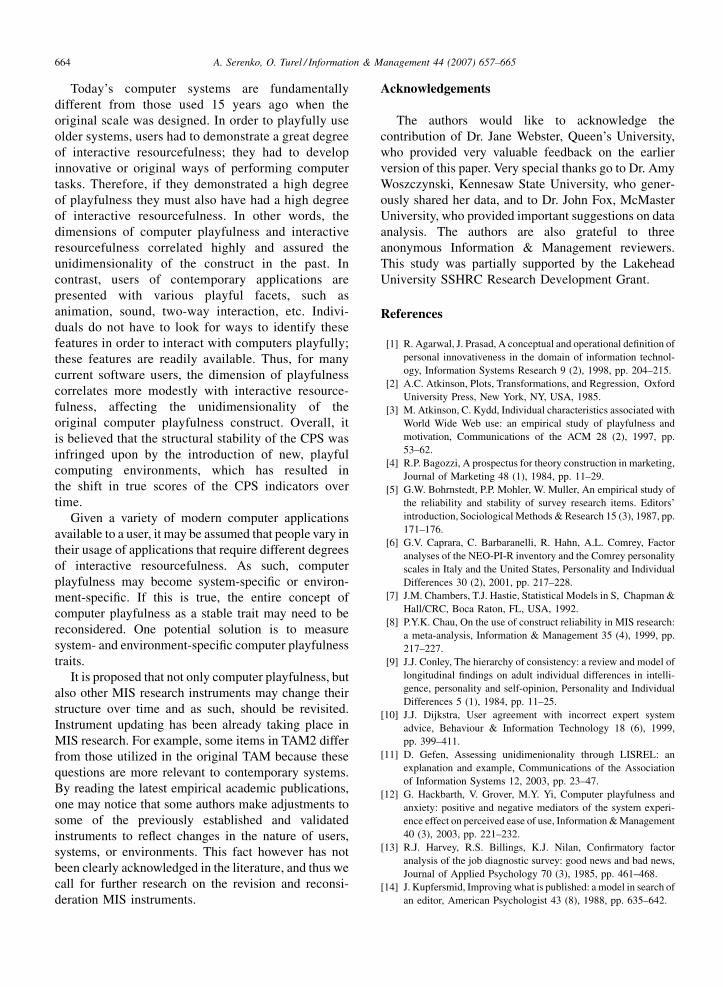
The two-factor oblique model is superior because it
exhibits: the lowest chi-square over degrees of freedom
coefficient, the highest fit indices, and the lowest
RMSEA. Furthermore, the fit indices of this model met
most of the commonly used thresholds for good fit and
were consistently better than those of other models.
To assess the significance of the differences among
these models, the chi-square difference test was utilized
for a direct comparison of nested models, which
indicated the inferiority of the nested model. Then, a
90% confidence interval of the RMSEA was assessed
for all models including the non-nested ones. Non-
overlapping confidence intervals indicated a significant
difference.
ble 9
omparison of plausible computer playfulness factor structures
Chi-square d.f. Chi-square/d.f.
ne-factor model 308.8 14 22.1
o-factor orthogonal model 301.2 14 21.5
o-factor oblique model 100.6 13 7.7
cond-order factor model 160.3 14 11.5
Among the four tested models there were two pairs
of nested models:
1. T
G
0.
0.
0.
0.
he two-factor orthogonal model nested in the two-
factor oblique model (the orthogonal model can be
conceptualized as the oblique model with a constraint
on the inter-factor correlation equal to zero).
2. T
he single-factor model nested in the two-factoroblique model, since the former may be considered to
be a two-factor oblique model with an inter-factor
correlation of one.
The chi-square difference of the first and second pair
is 208 and 200 with one degree of freedom, respectively.
The differences are significant ( p < 0.000) in both
cases. Therefore, it may be concluded that the two-
factor oblique model is significantly better than the two-
factor orthogonal model and the single-factor model.
This is further supported by examining the confidence
intervals of the RMSEA. The upper bound of the
RMSEA of the two-factor oblique model is smaller than
the lower bounds of the RMSEA of the two-factor
orthogonal model and the single-factor model.
A comparison of the confidence interval of the
second-order factor model with that of the two-factor
oblique model revealed a slight overlap. Nevertheless,
the majority of the confidence interval of the latter was
FI NFI CFI IFI RMSEA 90% C.I. RMSEA
84 0.81 0.82 0.82 0.22 (0.20, 0.24)
89 0.82 0.82 0.82 0.17 (0.15, 0.19)
95 0.94 0.95 0.95 0.11 (0.087, 0.13)
93 0.90 0.91 0.91 0.14 (0.12, 0.16)

A. Serenko, O. Turel / Information & Management 44 (2007) 657–665 663
Fig. 2. Predictive validity model.
below the confidence interval of the former, and the
overlap was relatively minor. In addition, the fit indices
of the two-factor oblique model were consistently better
than those of the second-order factor model. It was
concluded that, although both models were viable, the
two-factor oblique model was superior to the second-
order factor and all other models.
4.3. Predictive validity
Because the computer playfulness scale was found to
currently consist of two distinct factors, the predictive
validity of each was investigated. For this, three
constructs: the original CPS, CPS-a (CPS2, CPS6,
and CPS7) and CPS-b (CPS1, CPS3, CPS4, and CPS5)
were linked to other well-established MIS factors:
Table 10
Predictive validity
Study Construct P
Serenko [21], n = 75 Original construct 0
CPS-a 0
CPS-b 0
Serenko et al. [22], n = 237 Original Construct �CPS-a �CPS-b �
perceived enjoyment (PE) perceived usefulness (PU),
and perceived ease of use (PEOU). Non-transformed
data were used in this analysis. Data for PE, PU, and
PEOU were collected as part of two other studies
[21,22]. The model (see Fig. 2) was tested by using PLS
Graph version 03.00. PLS was chosen because of the
small sample sizes of the individual studies (as low as
75). Jackknifing was done to derive t-statistics (see
Table 10). The results show that, in some cases, the
employment of different constructs generated different
structural relationships. This further demonstrated the
independence of both factors. The Pearson correlation
between PIIT and the original CPS, CPS-a, and CPS-b
were 0.60, 0.51, and 0.54, respectively, significant at
0.01 levels.
5. Discussion and conclusions
Our purpose was to re-explore the computer
playfulness scale because several recent studies had
reported on the inadequate psychometric properties of
the instrument. To accomplish this, a review of studies
utilizing the CPS instrument was conducted and an
empirical investigation completed. Overall, we con-
cluded that the original computer playfulness construct
represents two correlated yet distinct factors when
administered to today’s computer users.
We attempted to theoretically explain the obtained
two-factor structure. Items that load on CPS-b strongly
relate to the initial definition of playfulness (i.e.,
spontaneous, flexible, creative, and playful). Therefore,
this factor can be labeled ‘computer playfulness’. Items
that load on CPS-a refer to user resourcefulness, and are
more associated with the way people approach
computer-related problem solving (i.e., imaginative,
original, and inventive). This factor can be termed
‘interactive resourcefulness’ and defined as user
capability to challenge the traditional way of doing
things in human–computer interaction. Interactive
resourcefulness explains how people use their imagina-
tion, originality, and inventiveness to complete com-
puter-related tasks.
E PU PEOU
.33 ( p < 0.05) 0.24 ( p < .1) 0.24 (ns)
.23 (ns) 0.24 ( p < .1) 0.20 (ns)
.36 ( p < .05) 0.19 (ns) 0.248 (ns)
0.15 ( p < .05) 0.18 (ns) Not tested
0.10 (ns) 0.17 ( p < .01) Not tested
0.16 (ns) 0.13 (ns) Not Tested
A. Serenko, O. Turel / Information & Management 44 (2007) 657–665664
Today’s computer systems are fundamentally
different from those used 15 years ago when the
original scale was designed. In order to playfully use
older systems, users had to demonstrate a great degree
of interactive resourcefulness; they had to develop
innovative or original ways of performing computer
tasks. Therefore, if they demonstrated a high degree
of playfulness they must also have had a high degree
of interactive resourcefulness. In other words, the
dimensions of computer playfulness and interactive
resourcefulness correlated highly and assured the
unidimensionality of the construct in the past. In
contrast, users of contemporary applications are
presented with various playful facets, such as
animation, sound, two-way interaction, etc. Indivi-
duals do not have to look for ways to identify these
features in order to interact with computers playfully;
these features are readily available. Thus, for many
current software users, the dimension of playfulness
correlates more modestly with interactive resource-
fulness, affecting the unidimensionality of the
original computer playfulness construct. Overall, it
is believed that the structural stability of the CPS was
infringed upon by the introduction of new, playful
computing environments, which has resulted in
the shift in true scores of the CPS indicators over
time.
Given a variety of modern computer applications
available to a user, it may be assumed that people vary in
their usage of applications that require different degrees
of interactive resourcefulness. As such, computer
playfulness may become system-specific or environ-
ment-specific. If this is true, the entire concept of
computer playfulness as a stable trait may need to be
reconsidered. One potential solution is to measure
system- and environment-specific computer playfulness
traits.
It is proposed that not only computer playfulness, but
also other MIS research instruments may change their
structure over time and as such, should be revisited.
Instrument updating has been already taking place in
MIS research. For example, some items in TAM2 differ
from those utilized in the original TAM because these
questions are more relevant to contemporary systems.
By reading the latest empirical academic publications,
one may notice that some authors make adjustments to
some of the previously established and validated
instruments to reflect changes in the nature of users,
systems, or environments. This fact however has not
been clearly acknowledged in the literature, and thus we
call for further research on the revision and reconsi-
deration MIS instruments.
Acknowledgements
The authors would like to acknowledge the
contribution of Dr. Jane Webster, Queen’s University,
who provided very valuable feedback on the earlier
version of this paper. Very special thanks go to Dr. Amy
Woszczynski, Kennesaw State University, who gener-
ously shared her data, and to Dr. John Fox, McMaster
University, who provided important suggestions on data
analysis. The authors are also grateful to three
anonymous Information & Management reviewers.
This study was partially supported by the Lakehead
University SSHRC Research Development Grant.
References
[1] R. Agarwal, J. Prasad, A conceptual and operational definition of
personal innovativeness in the domain of information technol-
ogy, Information Systems Research 9 (2), 1998, pp. 204–215.
[2] A.C. Atkinson, Plots, Transformations, and Regression, Oxford
University Press, New York, NY, USA, 1985.
[3] M. Atkinson, C. Kydd, Individual characteristics associated with
World Wide Web use: an empirical study of playfulness and
motivation, Communications of the ACM 28 (2), 1997, pp.
53–62.
[4] R.P. Bagozzi, A prospectus for theory construction in marketing,
Journal of Marketing 48 (1), 1984, pp. 11–29.
[5] G.W. Bohrnstedt, P.P. Mohler, W. Muller, An empirical study of
the reliability and stability of survey research items. Editors’
introduction, Sociological Methods & Research 15 (3), 1987, pp.
171–176.
[6] G.V. Caprara, C. Barbaranelli, R. Hahn, A.L. Comrey, Factor
analyses of the NEO-PI-R inventory and the Comrey personality
scales in Italy and the United States, Personality and Individual
Differences 30 (2), 2001, pp. 217–228.
[7] J.M. Chambers, T.J. Hastie, Statistical Models in S, Chapman &
Hall/CRC, Boca Raton, FL, USA, 1992.
[8] P.Y.K. Chau, On the use of construct reliability in MIS research:
a meta-analysis, Information & Management 35 (4), 1999, pp.
217–227.
[9] J.J. Conley, The hierarchy of consistency: a review and model of
longitudinal findings on adult individual differences in intelli-
gence, personality and self-opinion, Personality and Individual
Differences 5 (1), 1984, pp. 11–25.
[10] J.J. Dijkstra, User agreement with incorrect expert system
advice, Behaviour & Information Technology 18 (6), 1999,
pp. 399–411.
[11] D. Gefen, Assessing unidimenionality through LISREL: an
explanation and example, Communications of the Association
of Information Systems 12, 2003, pp. 23–47.
[12] G. Hackbarth, V. Grover, M.Y. Yi, Computer playfulness and
anxiety: positive and negative mediators of the system experi-
ence effect on perceived ease of use, Information & Management
40 (3), 2003, pp. 221–232.
[13] R.J. Harvey, R.S. Billings, K.J. Nilan, Confirmatory factor
analysis of the job diagnostic survey: good news and bad news,
Journal of Applied Psychology 70 (3), 1985, pp. 461–468.
[14] J. Kupfersmid, Improving what is published: a model in search of
an editor, American Psychologist 43 (8), 1988, pp. 635–642.

A. Serenko, O. Turel / Information & Management 44 (2007) 657–665 665
[15] P.M. Podsakoff, D.W. Organ, Self-report in organizational
research: problems and prospects, Journal of Management 12
(4), 1986, pp. 531–544.
[16] D. Potosky, A field study of computer efficacy beliefs as an
outcome of training: the role of computer playfulness, computer
knowledge, and performance during training, Computers in
Human Behavior 18 (3), 2002, pp. 241–255.
[17] A.I. Rabin, Enduring sentiments: the continuity of personality
over time, Journal of Personality Assessment 41 (6), 1977, pp.
563–572.
[18] B.W. Roberts, A. Caspi, Personality continuity and change
across the life course, in: L.A. Pervin, O.P. John (Eds.), Hand-
book of Personality: Theory and Research, Guilford Press, New
York, 1999, pp. 300–326.
[19] B.W. Roberts, A. Caspi, The cumulative continuity model of
personality development: striking a balance between continuity
and change in personality traits across the life course, in: R.M.
Staudinger, U. Lindenberger (Eds.), Understanding Human Devel-
opment: Lifespan Psychology in Exchangewith Other Disciplines,
Kluwer Academic Publishers, Dordrecht, NL, 2003, pp. 183–214.
[20] B.W. Roberts, W.F. DelVecchio, The rank-order consistency of
personality traits from childhood to old age: a quantitative
review of longitudinal studies, Psychological Bulletin 126 (1),
2000, pp. 3–25.
[21] A. Serenko, A model of user adoption of interface agents for
email, in: Proceedings of the 34th Annual Conference of the
Administrative Sciences Association of Canada (ASAC), Banff,
Canada, 2006.
[22] A. Serenko, N. Bontis, B. Detlor, End-user adoption of animated
interface agents in everyday work applications, Behaviour &
Information Technology 26 (2), 2007, pp. 119–132.
[23] D. Sohn, Significance testing and the science, American Psy-
chologist 55 (8), 2000, pp. 964–965.
[24] B.G. Tabachnick, L.S. Fidell, Using Multivariate Statistics,
Allyn and Bacon, Boston, MA, 2001.
[25] O. Turel, A. Serenko, N. Bontis, User acceptance of wireless
short messaging services: deconstructing perceived value, Infor-
mation & Management 44 (1), 2007, pp. 63–73.
[26] V. Venkatesh, Determinants of perceived ease of use: integrating
control, intrinsic motivation, and emotion into the technology
acceptance model, Information Systems Research 11 (4), 2000,
pp. 342–365.
[27] J. Webster, J.J. Martocchio, Microcomputer playfulness—devel-
opment of a measure with workplace implications, MIS Quar-
terly 16 (2), 1992, pp. 201–226.
[28] B. Wheaton, B. Muthen, D.F. Alwin, G.F. Summers, Assessing
reliability and stability in panel models, Sociological Methodol-
ogy 8, 1977, pp. 84–136.
[29] D.E. Wiley, J.A. Wiley, The estimation of measurement error in
panel data, American Sociological Review 35 (1), 1970, pp.
112–117.
[30] A.B. Woszczynski, Exploring the theoretical foundations of
playfulness in computer interactions, Doctoral Dissertation,
Clemson University, 2000, unpublished.
[31] S.E. Yager, L.A. Kappelman, G.A. Maples, V.R. Prybutok,
Microcomputer playfulness: stable or dynamic trait? Commu-
nications of the ACM 28 (2), 1997, pp. 43–52.
Alexander Serenko is an assistant profes-
sor of Management Information Systems in
the Faculty of Business Administration,
Lakehead University, Canada. He holds a
MSc in computer science, an MBA in
electronic business, and a PhD in manage-
ment information systems. Dr. Serenko’s
research interests pertain to user technol-
ogy adoption, knowledge management, and
innovation. Alexander’s articles appeared
in various refereed journals, and his papers received awards at
Canadian and international conferences. In 2007, he received the
Lakehead University Contribution to Research Award that recognized
him as one of top three university researchers.
Ofir Turel is an associate professor of
Information Systems and Decision
Sciences at the College of Business and
Economics, California State University,
Fullerton. He holds a BSc in industrial
engineering, an MBA in technology man-
agement, and a PhD in management infor-
mation systems. Before joining the
academia, he has held senior positions in
the information technology and telecom-
munications industries. His research interests include behavioral and
managerial issues in the domains of online collaboration and mobile
commerce. His award-winning works have been published in several
peer-reviewed journals, such as the Journal of MIS, Communications
of the ACM, Information and Management, Telecommunications
Policy, and Group Decision and Negotiation, and presented at various
international conferences.