Understanding User's Perceived Playfulness toward Mobile ...
199
Understanding Users Perceived Playfulness toward Mobile Information and Entertainment Services in New Zealand Jacky, Po Ching Chou A thesis submitted to Auckland University of Technology in fulfilment of the degree of Master of Philosophy in Computer and Information Sciences September 2006
-
Upload
khangminh22 -
Category
Documents
-
view
3 -
download
0
Transcript of Understanding User's Perceived Playfulness toward Mobile ...

Understanding User�s Perceived Playfulness toward Mobile Information and Entertainment
Services in New Zealand
Jacky, Po Ching Chou
A thesis submitted to Auckland University of Technology in
fulfilment of the degree of Master of Philosophy in
Computer and Information Sciences
September 2006

The fear of the LORD is the beginning of wisdom, and knowledge of the Holy One is understanding.
Proverbs 9:10

Table of Contents
i
Table of Contents...................................................................................... i Acknowledgements ...................................................................................v Abstract�����������������������.. ...... vii List of Tables............................................................................................ix List of Figures ...........................................................................................x Abbreviations...........................................................................................xi Chapter 1: Introduction ...........................................................................1
1.1 Chapter Overview .........................................................................................1 1.2 Importance of the Research ..........................................................................1 1.3 Purpose of the Study......................................................................................6 1.4 Research Problem..........................................................................................7 1.5 Contributions and Possible Implications of the Study .................................8 1.6 Outline of Thesis ............................................................................................9
Chapter 2: Literature Review & Research Questions ..........................11
2.1 Chapter Overview .......................................................................................11 2.1.1 Chapter Outline .................................................................................. 12
2.2 Development of the Original Technology Acceptance Model.....................13 2.2.1 Constructs of Technology Acceptance Model...................................... 15 2.2.2 Applying Technology Acceptance Model in different contexts.............. 17 2.2.3 Significance of the TAM constructs ..................................................... 17 2.2.4 TAM studies focused in E-Commerce................................................. 18
2.2.4.1 Extrinsic and Intrinsic Motivations...........................................18 2.2.4.2 Perceived Playfulness as a New Intrinsic Motivater..................20
2.2.5 Exploring the Antecedents of Perceived Playfulness........................... 22 2.2.5.1 Importance of Perceived Playfulness in Mobile Commerce.......23
2.3 Mobile Commerce or Mobile Internet? ......................................................25 2.3.1 Mobile Internet Services in New Zealand............................................ 26
2.4 Research development in Mobile Internet..................................................27 2.4.1 The Unique Role of Entertainment...................................................... 29 2.4.2 Mobile Information and Entertainment Services.................................. 30
2.5 Theoreticical Perspectives ...........................................................................32 2.5.1 Flow and Autotelic Personality ............................................................ 33
2.5.1.1 Individual Differences and Autotelic Personality in Flow ....... 35 2.5.2 Perceived Service Quality................................................................... 40 2.5.3 Perceived Technology Compatibility ................................................... 44 2.5.4 Social Influence .................................................................................. 47 2.5.5 Motivation for Using............................................................................ 49
2.6 Development of Research Problems ...........................................................52 2.7 Chapter Summary .......................................................................................54
Chapter 3: Conceptual Model and Hypotheses ....................................55
3.1 Chapter Overview .......................................................................................55 3.1.1 Chapter Outline .................................................................................. 55
3.2 Development of Theoretical Model����������������...56

ii
3.3 Research Questions and Hypotheses...........................................................58 3.3.1 Autotelic Personality as a Reflective Second-Order Structure ...............63 3.3.2 Perceived Service Quality as a Formative Second-Order Structure.......69
3.4 Chapter Summary .......................................................................................81 Chapter 4: Methodology ........................................................................82
4.1 Chapter Overview .......................................................................................82 4.1.1 Chapter Outline .................................................................................. 83
4.2 Research Approach......................................................................................84 4.2.1 Sampling ............................................................................................ 85 4.2.2 Pilot Test of Questionnaire.................................................................. 85
4.2.2.1 Data collection method.............................................................86 4.2.2.2 Ethical Consideration in Data Collection .................................86
4.2.3 Measurement Items............................................................................ 87 4.2.3.1 Data Analysis Method ..............................................................89
4.3 Structural Equation Modelling (SEM) .......................................................90 4.3.1 Contrasting PLS and CBSEM............................................................. 91
4.4 Detailed Discussions of Partial Least Squares............................................95 4.4.1 Measurement Model........................................................................... 97
4.4.1.1 Individual item reliabilities.......................................................98 4.4.1.2 Convergent and Discriminant Validities....................................99
4.4.2 Second Order Factors .......................................................................100 4.4.3 Structural Model.................................................................................101
4.4.3.1 Mediation Test in PLS.............................................................102 4.4.3.2 Multi-group Comparison ........................................................103
4.5 Consistency at Large .................................................................................104 4.6 Chapter Summary .....................................................................................104
Chapter 5: Data analysis ......................................................................105
5.1 Chapter Overview .....................................................................................105 5.1.1 Chapter Outline .................................................................................106
5.2 Demographic Information of Respondents ..............................................107 5.3 Normality and Linearity of Data ..............................................................110 5.4 Terminologies used in This Chapter ........................................................110 5.5 Data Analysis of Proposed Research Model ............................................. 111
5.5.1 Measurement Validation ....................................................................112 5.5.1.1 Individual item reliabilities.....................................................112 5.5.1.2 Convergent Validity................................................................113 5.5.1.3 Discriminant Validity..............................................................116
5.5.2 Revised Measurement Model ............................................................116 5.6 Testing Second Order Factors ...................................................................119
5.6.1 Autotelic Personality ..........................................................................119 5.6.2 Perceived Service Quality..................................................................122
5.7 Structural Model .......................................................................................124 5.7.1 Variance Explained in Dependent Variables.......................................125
5.7.1.1 Significance Test � Bootstrapping ..........................................125 5.7.2 Standardized Path Coefficients..........................................................126 5.7.3 The Mediating Role of Perceived Technology Compatibilities ............128
5.8 Examine the Moderating Effects of Motivation of Using.........................130 5.9 Chapter Summary .....................................................................................133

iii
Chapter 6: Discussion of Results .........................................................134 6.1 Chapter Overview .....................................................................................134
6.1.1 Chapter Outline .................................................................................134 6.2 Validating the Research Model in the Context of MIES ..........................135 6.3 Contributions and Implications ................................................................145 6.4 Limitations and Implications for Future Research ..................................148 6.5 Chapter Summary .....................................................................................150
Chapter 7: Conclusion..........................................................................151
7.1 Chapter Overview .....................................................................................151 7.2 Summary of Research Findings ................................................................152 7.3 Implications for Management ...................................................................157 7.4 Limitation of the Research ........................................................................160
7.4.1 Sample design...................................................................................160 7.4.2 Limited Resources on Proposed Second Order Constructs ...............160 7.4.3 Results obtained via Measurement Scales ........................................161
7.5 Recommendations for Future Research ...................................................163 7.6 Concluding Remarks .................................................................................165
Appendix 1 Example of Questionnaire................................................167 Appendix 2 Normality and Linearity of Data .....................................171 Reference List .......................................................................................173

iv
�I hereby declare that this submission is my own work and that, to the best of my knowledge and belief, it contains no material previously published or written by another person (except where explicitly defined in the acknowledgements), nor material which to a substantial extent has been submitted for the award of any other degree or diploma of a university or other institution of higher learning.�
Jacky Chou

Acknowledgements
v
There are several people whom I would like to thank for contributing to the work
presented in this thesis. There are also some special people to whom I am very grateful,
since without their help and support it would not have been possible to finish this thesis.
First and foremost, I would like to express my greatest thankfulness to my supervisor,
Professor Felix Tan, for being very supportive and helpful during the work process. I
offer my grateful thanks to him for being a great source of inspiration and knowledge.
Without him, this thesis, which is actually based on his previous research, would not
have been possible.
I also give my most sincere gratitude to Stuart Young at Auckland University of
Technology. He has been very kind, generous and helpful, offering me considerable
advice about how to deal with statistical problems.
I also thank Zacky Chen, a friend of my family, for being a great mentor and friend.
Without his help it would not be possible for me to conclude this work. Special thanks
to Francis Loh, specialist from Microsoft New Zealand for formatting this document for
me in time for me to complete this thesis.
I also thank the lecturing staffs at Computer and Information Sciences at Auckland
University of Technology for their assistance with my data collection, photocopying and
all the support necessary to render this thesis possible. Ethical approval was granted by
AUTEC on 24/12/2004 for a period of two years (Reference No. 04/223).

vi
I would like to take this opportunity to thank my parents for all their love and support
over the years, and for always standing behind me. And my fiancée, Lina, thank you for
your constant love and the incredible patience over such a long period of time.
Furthermore, I never got the chance to thank, my now deceased grandfather, who is the
greatest influence on my choice to pursue a masters degree. This thesis is written to
fulfil his last wish for me.
Thanks to all the brothers and sisters in my church. Thank you all for always praying for
me when I was struggling with my thesis. I really experienced the oneness of the body
of Christ.

Abstract
vii
The convergence of mobile commerce and internet technologies has promised users
unprecedented convenience and greater enjoyment. Over the past few years, the
development of mobile information and entertainment services (MIES) has been
phenomenal. Recently, research has been conducted into ways toward better acceptance
of these services by users. However, many of these studies are technical driven, without
discussing important end user needs.
To understand users� perception associated with mobile information and entertainment
services the author extended and empirically tested a new antecedent model of
Perceived Playfulness�an intrinsic motivator toward technology acceptance by users,
based on previous research. It has been shown that user�s Perceived Playfulness toward
information technologies has a direct impact on his/her subsequent use. Using the new
antecedent model of Perceived Playfulness, the author argues users� Autotelic
Personality, Perceived Service Quality, Perceived Technology Compatibility, their
Motivation for Using and tolerance of Social Influence affect their Perceived
Playfulness when interacting with MIES.
A questionnaire was administered to students in business and computing schools at
Auckland University of Technology. The closed-ended questions within the
questionnaire were used to validate the proposed research model. The data were
analyzed using Partial Least Squares. Most of the proposed hypotheses were supported,
rendering several significant findings in this thesis.

viii
In this study, it has been found that individuals who are more innovative and confident
about using MIES are more likely to develop a positive image toward these services.
They also value services that are useful and easy to use and demonstrate high
enthusiasm for more personalized mobile services. More importantly, their perceptions
toward MIES can be further reinforced if their mobile phone functionalities are highly
compatible with these services. Therefore, service providers should strive to create a
seamless MIES experience for users. Furthermore, given that mobile phones have their
own strengths and limitations, the motivation behind user�s choices of various
applications becomes an important issue for service providers to consider. It has been
shown that the importance of service attributes vary with user�s motivations of using
MIES. This study therefore focuses on several important end user issues which are not
well explored in the research of mobile internet services.
Overall, this study contributed to existing research into user�s perception toward MIES
as an information technology based on his/her intrinsic motivator. Several important
antecedents have been identified to influence user�s Perceived Playfulness in this
context. Limitations and suggestions for future studies are considered at the end of this
thesis. Implications are also discussed.

List of Tables
ix
Table 2-1 Use of Personal Innovativeness, Self Efficacy, Control and Focused
Attention in Different Studies ................................................................... 38
Table 2-2 Mobile Internet Service Categories........................................................... 40
Table 2-3 Distinction between goal-oriented and experientially-directed
behaviours. ............................................................................................... 50
Table 4-1 Research Variables and Measurements...................................................... 89
Table 4-2 Three main Components in Structure Equation Modeling ......................... 91
Table 4-3 PLS vs. COSEM....................................................................................... 94
Table 5-1 Demographic Information of Respondents.............................................. 108
Table 5-2 Usage of MIES in New Zealand ............................................................. 109
Table 5-3 Terminologies used in Chapter 5............................................................. 110
Table 5-4 Internal Composite Reliability for Latent Variables ................................ 112
Table 5-5 AVEs for latent constructs in Research Model ........................................ 113
Table 5-6 Loadings and cross-loadings of indicators .............................................. 114
Table 5-7 Correlation matrix and Average Variance Extracted for Latent
Variables................................................................................................. 117
Table 5-8 Validities and t-values for Autotelic Personality (4 first order factors, 1
second order factor)................................................................................ 121
Table 5-9 R-squares for dependent variables .......................................................... 125
Table 5-10 Path coefficients and Standard Errors ................................................... 132
Table 5-11 Statistics of Differences in Path Coefficients......................................... 132

List of Figures
x
Figure 1-1 Thesis Outline.........................................................................................10
Figure 2-1 Chapter Outline ......................................................................................12
Figure 2-2 Technology Acceptance Model ...............................................................14
Figure 2-3 Theory of Reasoned Action.....................................................................14
Figure 2-4 Extended Technology Acceptance Model................................................21
Figure 2-5 Proposed model of antecedents of Perceived Playfulness ........................22
Figure 2-6 Internet Connectivity Outlook.................................................................26
Figure 2-7 Mobile Internet Service Functions ..........................................................30
Figure 2-8 Research Objectives and Possible Research Areas...................................53
Figure 3-1 Chapter Outline ......................................................................................55
Figure 3-2 Using the Proposed Model to Explain User�s Perceived Playfulness
toward MIES ..........................................................................................57
Figure 3-3 Personal Innovativeness mediates Perception about Innovation...............59
Figure 3-4 Autotelic Personality and Its Dimensions ................................................64
Figure 3-5 Perceived Service Quality and Its Dimensions ......................................71
Figure 4-1 Chapter Outline ......................................................................................85
Figure 4-2 Comparison between latent and emergent constructs...............................93
Figure 5-1 Chapter Outline .................................................................................... 106
Figure 5-2 The second order reflective nature of Autotelic Personality ................. 120
Figure 5-3 The mediation effect of Autotelic Personality........................................ 120
Figure 5-4 The second order formative nature of Perceived Service Quality........... 122
Figure 5-5 Results of Data Analysis ....................................................................... 124
Figure 5-6 The mediating role of Perceived Technology Compatibility .................. 128
Figure 5-7 The Mediating Role of Perceived Technology Compatibility in the
nomological network ............................................................................ 129
Figure 5-8 Results of Data Analysis: Goal-oriented vs. Experientially-directed
Users .................................................................................................... 130
Figure 6-1 Chapter Outline .................................................................................... 134
Figure 6-2 The Explanatory and Predictive Power of Research Model .................. 135
Figure 6-3 Summary of Hypotheses 5a, 5b, 5c, 5c, 5d, 5e, 5f ................................. 141
Figure 8-1 Normal Q-Q Plots.....................................................................................171
Figure 8-2 Scatter Plots..............................................................................................172

Abbreviations
xi
CDMA
Code-division multiple-access technology
GPRS
General Packet Radio Service
GSM
Global System for Mobile Communications
MIES
Mobile Information and Entertainment Services
MMS
Multi-Media Services
PLS
Partial Least Squares
SEM
Structural Equation Modelling
SMS
Short Message Services
TAM
Technology Acceptance Model
TRA
Theory of Reasoned Action
WAP
Wireless Application Protocol
W-CDMA
Wideband Code-Division Multiple Access Technology
WIMD
Wireless Internet via Mobile Devices
3G
Third Generation Mobile Networking Technologies

Chapter 1: Introduction
1
1.1 Chapter Overview This chapter emphasizes the importance and main purpose of the research.
Contributions made to existing literature in the area and potential implications of the
study are also discussed. The structure of this thesis is outlined by providing a brief
description of each chapter.
1.2 Importance of the Research Over the past few years, the progress in mobile internet services has been phenomenal,
both in terms of technology and applications development (Shim and Shim, 2003). The
introduction of real-time video-calling, Mobile TV, Multi Media Services and many
other exciting offerings has seen the realization of faster mobile internet services
through Third Generation Mobile Networking Technologies (3G). Among these
services, mobile information and entertainment services are gaining in popularity
among mobile phone users (Garcia-Macias, 2003; Baldi and Thaung, 2002).
Mobile information and entertainment services (MIES) can be defined as �the delivery
of information and entertainment from specially formatted content sources (Internet
sites, SMS, MMS, etc.) via the mobile telecommunication network to a mobile user�
(Van de Kar et al. 2003). While New Zealand is ranking high among other OECD
countries in terms of multimedia mobile phones saturation (69% compare to the global
average 53%), it is still ranking low in terms of using them to access data and
entertainments (Newbery, 2005). Therefore, research into ways in which users might be
more inclined to use these services has major implications for service providers.

2
A large amount of literature so far is still �technical-driven� and most research
conducted on the mobile internet elaborates on technological requirements without
discussing important end-user issues (Ng-Krülle et al. 2004). There is therefore a need
for more research efforts into those underlying �drivers� that motivates users to adopt
these services. According to Methlie and Pedersen (2005), users are unlikely to adopt
these services if they do not perceive their true value.
One most widely adopted theory on user adoption of information systems is the
Technology Acceptance Model (TAM) proposed by Davis in 1989. Since then, TAM
has been successfully validated and explicated by other researchers across a wide range
of IT/IS settings. However, the fact that TAM was originally proposed in an
organizational context raised criticism of it being overtly extrinsically-focused (e.g.
toward performance and rewards). Research should pursue meaningful actual usage,
rather than materialized usage of system (Lee et al. 2003; Malone, 1981). Until recently,
researchers applied TAM on internet as a technology and found that technology
acceptance can also be intrinsically motivated (Teo et al. 1999; Lin et al. 2005). Moon
and Kim (2001) extended the original Technology Acceptance Model (TAM) into the
World-Wide-Web context by adding an intrinsic motivational factor �Perceived
Playfulness�. Their findings suggest Perceived Playfulness has a stronger predictive
power than Perceived Usefulness.
Other researchers have called for more research efforts into the �hedonic values�
associated with the usage of mobile internet services (Ng-Krülle et al. 2004; Pagani,
2004). In their study of online retail shopping behaviour, Childers et al. (2001) found
shoppers described �hedonic values� associated with shopping such as fun and
enjoyment are emerged in the experience rather than the achievements of any

3
pre-specified goal. In the mobile context, Nysveen et al. (2005b), in their study of four
mobile services, found enjoyment plays an important role. Fang et al. (2006)
categorized mobile tasks that can be performed on handheld devices into three broad
types: general task, transactional task and gaming task. They found Perceived
Playfulness is significant when users perform gaming tasks. Both studies extended
TAM in the context of mobile internet services.
Despite the importance and significance of Perceived Playfulness in mobile internet
services has attracted the attention of several researchers, none of them investigated the
�cause� of the occurrence of Perceived Playfulness. Methlie and Pedersen (2005)
studied network effects and intrinsic attributes of mobile services. Several intrinsic
attributes mentioned in their study include: Personalization, Usefulness, Enjoyment, and
technical specifications such as Speed and Capacity. However their study was focused
on the relationships between business models and service attributes only.
Based on Moon and Kim�s work, Chung and Tan (2004) moved a step further to
examine the antecedents of Perceived Playfulness in the context of general information
search website. Their results suggest all the antecedents identified can be separated into
three broad categories: Cognitive Aspects, Website Characteristics, and Motivation for
Searching. Their findings provided a convenient theoretical base for future research into
the effects of an intrinsic motivator on information systems. MIES is also a kind of
information system; and people often use their mobile phones for the purpose of
entertainment (Fang et al. 2006). As a result, it has been found that the antecedent model
proposed in Chung and Tan (2004) was particularly useful in the context of this study.
However, some changes are deemed necessary to adapt this model for the context of
MIES.

4
In Chung and Tan (2004), Focused Attention and Control were identified as antecedents
of Perceived Playfulness under Cognitive Aspects. In the mobile context, other
researchers found Personal Innovativeness and Self Efficacy are also important
individual factors in determining user�s intention to use mobile internet services (Lu et
al. 2003; Methlie and Pedersen, 2005). Based on the literature of flow, it has been found
that a person�s Autotelic Personality served to be an essential part of his/her flow
experience (Csikszentmihalyi, 1988; Asakawa, 2004). As Perceived Playfulness is
similar to flow, Autotelic Personality was proposed as an antecedent of Perceived
Playfulness. Furthermore, it has been proposed that Autotelic Personality is jointly
reflected by Personal Innovativeness, Self Efficacy, Control and Focused Attention.
This study provides empirical evidence for the effect of Autotelic Personality on
Perceived Playfulness and its core dimensions in the context of MIES. It hypothesizes a
person with higher Autotelic Personality is more likely to experience Perceived
Playfulness (Csikszentmihalyi, 1988).
The importance of service characteristics has also been identified in Chung and Tan�s
(2004) study. In fact, among the proposed antecedents, most of them were identified
under Website Characteristics category. According to Van de Kar et al. (2003), MIES is
also a kind of electronic service. It is believed that most of the website characteristics
will still hold true in the context of MIES. To adapt Website Characteristics in the
context of MIES, this study proposes Perceived Service Quality as another antecedent
of Perceived Playfulness. In terms of the exact nature of the Perceived Service Quality
structure, it is jointly formed by Perceived Usefulness, Perceived Ease of Use, Content,
Variety, Feedback, Speed, Experimentation and Personalization. The existence of this
higher order construct indicates the user forms an overall perception of service quality
toward MIES rather than making a judgement based on a single service attribute.

5
Prompted by the unique features of MIES, this research delved into the current literature
on mobile commerce and found perceived compatibility between MIES and mobile
phone functionalities and Social Influence are equally important determinants of user�s
intrinsic motivation. In this study, Perceived Technology Compatibility is proposed as
an antecedent of Perceived Playfulness. It denotes the degree of integration between
MIES and mobile phone functionalities. Users often form unrealistic expectations about
MIES because of the product images created by marketing campaigns (Danielyan,
2003). Several researchers have pointed out that the perceived differences between
anticipated services and those delivered, as perceived by users constitute the main
obstacle of wide mobile service adoption (Koivisto and Urbaczewski, 2004; Pagani,
2004). Based on Lu et al.�s (2003a) study, this research also tests the mediating effect of
Perceived Technology Compatibility between Perceived Service Quality and Perceived
Playfulness. Given that the mobile phone resembles an interpersonal tool, Social
Influence has been well studied in the context of mobile commerce. However, it has not
been well explored in flow literature. This study will fill this gap in the context of
MIES.
Individuals will perceive MIES differently depending on their goals for using these
services (Fang et al. 2006). Motivation for Searching is another antecedent category in
Chung and Tan�s (2004) model. They suggest only experientially-directed tasks are
relevant for user�s Perceived Playfulness. According to Hoffman and Novak (1996),
flow experience can be divided into two types: goal-oriented and experientially-directed
behaviours. Chae et al. (2002) in their study suggest the relative importance of mobile
information quality varies according to different goals of using. Although Motivation
for Researching was proposed as an antecedent of Perceived Playfulness, it is more
appropriate to follow the approach adopted in previous research and assess its

6
moderating effect (Nysveen et al. 2005b; Fang et al. 2006; Chae et al. 2002). This study
built upon previous research and proposes Motivation for Using as a moderating factor
that moderates key relationships between Perceived Playfulness and its antecedents in
the context of MIES (Hoffman and Novak, 1996; Nysveen et al. 2005b; Chae et al.
2002).
1.3 Purpose of the Study
Although Chung and Tan�s (2004) model provides a convenient theoretical base for this
study, some changes are deemed necessary to adapt the model for the context of this
study (MIES). If the new model can be validated, the constructs (1) Autotelic
Personality (2) Perceived Service Quality (3) Perceived Technology Compatibility and
(4) Social Influence can be used to predict user�s Perceived Playfulness of mobile
information and entertainment services. Motivation for Using will be used as a
moderating factor that moderates the relationships between Perceived Playfulness and
its antecedents. Perceived Technology Compatibility and Social Influence have both
been identified in the literatures of flow and mobile commerce. Perceived Technology
Compatibility will mediate the relationship between Perceived Service Quality and
Perceived Playfulness. The inclusion of these two factors along with Chung and Tan�s
(2004) findings in the new model will increase the predictive power of the proposed
research model.

7
1.4 Research Problem The following research questions will be examined based on the two purposes of this
study.
(1) Does Autotelic Personality influence Perceived Playfulness in the context of
mobile information and entertainment services? (Research Purpose 1)
(2) Does Perceived Service Quality influence Perceived Playfulness in the context of
mobile information and entertainment services? (Research Purpose 1)
(3) Does Perceived Technology Compatibility influence Perceived Playfulness in the
context of mobile information and entertainment services? (Research Purpose 2)
(4) Does Social Influence (Peer Influence and External Influence) affect Perceived
Playfulness in the context of mobile information and entertainment services?
(Research Purpose 2)
(5) Does user�s Motivation for Using moderate their Perceived Playfulness in the
context of mobile information and entertainment services? (Research Purpose 1)

8
1.5 Contributions and Possible Implications of the Study The study contributes to current research in a number of ways. First, proposing a new
antecedent model of Perceived Playfulness based on Chung and Tan (2004) in a new
context (i.e. mobile information and entertainment services) and provides evidence that
the model is robust and delivers valuable information from a user perspective regarding
the key antecedents of Perceived Playfulness.
Secondly, the new model is a more parsimonious and meaningful model with the
proposition of two second order factors: Autotelic Personality and Perceived Service
Quality. Each of them indicates the existence of an overall construct and is indicated by
its first order beliefs respectively. This study explored the dimensions of Autotelic
Personality and proves that autotelic persons are more likely to experience Perceived
Playfulness. The existence of Perceived Service Quality indicates users form overall
perceptions of MIES rather than arbitrarily basing their judgements on any single
aspect.
Thirdly, Perceived Technology Compatibility is a significant mediator between
Perceived Service Quality and Perceived Playfulness. In the presence of Perceived
Technology Compatibility, the positive impacts of Perceived Service Quality on
Perceived Playfulness will reduce significantly. The inclusion of this construct is
necessary to reinforce the predictive power of the research model.
Finally, user�s Motivation for Using (goal-oriented vs. experientially-directed
behaviours) has also been examined in terms of those key relationships in the research
model. A related finding derived from this is that Social Influence (Peer Influence and

9
External Influence) affect Perceived Playfulness differently under different motivations.
Goal-oriented users are more influenced by External Influence but less by Peer
Influence, and vice versa for experientially-directed users.
Several stakeholders may benefit from the outcomes of this study. Service providers of
mobile information and entertainment services may gain insights into what factors
affect user�s Perceived Playfulness. When this goal is attained, the outcome is a highly
playful MIES perceived by mobile phone users. Consequentially, higher Perceived
Playfulness will likely lead to higher acceptance of these services. Mobile phone
manufacturers need to work closely with service providers to create a seamless MIES
experience for mobile phone users by increasing their Perceived Technology
Compatibility. Academics can also learn from this new model of Perceived Playfulness
and future research in this direction will benefit from the significant findings of this
work.
1.6 Outline of Thesis
This thesis consists of seven chapters. The study starts with an Introduction (Chapter 1),
outlining the purpose and importance of the research at a more abstract level. Chapter 2
consists of a comprehensive literature review of past research. Based on this literature
review, several gaps can be identified. Corresponding research objectives and research
questions are raised to fill these gaps. In Chapter 3, a theoretical model is developed
based on research questions developed in Chapter 2. A list of hypotheses will be
proposed and relationships between key variables are articulated using supporting
citations. Chapter 4 states the research methodology that will be used in this study.
Research approach, data collection as well as research design of the questionnaire will
be discussed in this chapter. Chapter 5 moves onto the analysis of data collected from

10
questionnaire. Specifically, Partial Least Squares will be employed to test the
hypotheses specified in Chapter 4. Chapter 6 then presents an overall discussion of the
findings obtained from the data analysed in the previous chapter (Chapter 5). Finally,
Chapter 7 provides an overall conclusion to this study. The implications of research
outcomes, limitations of the research and avenues for future research are discussed. It is
believed that this study contributes significantly to the literature of flow and Perceived
Playfulness in Technology Acceptance Model (TAM). Figure 1-1 depicts the structure
and flow of this thesis:
Figure 1-1 Thesis Outline
Chapter 1: Introduction
Chapter2: Literature Review and Research Questions
Chapter 3: Conceptual Model and Hypotheses
Chapter 4: Methodology
Chapter 5: Data Analysis
Chapter 6: Discussion of Results
Chapter 7: Conclusion

Chapter 2: Literature Review & Research Questions
11
2.1 Chapter Overview This chapter reviews existing literature of the Technology Acceptance Model (TAM)
and its development in different contexts. As TAM was initially a model driven by
utilitarian values, researchers found intrinsic motivations on user acceptance of IT/IS
are equally important. Based on the flow theory, Moon and Kim (2001) extended the
TAM model with Perceived Playfulness as an intrinsic motivation. To accelerate the
understanding of Perceived Playfulness, Chung and Tan (2004) moved a step further to
explore the antecedents of Perceived Playfulness.
This study is based on Chung and Tan�s (2004) model with a focus on a new
technology�mobile information and entertainment services (MIES). Because research
in this field is relatively naïve, more substantive, theory-based research and a deeper
understanding of consumer behavior with regard to mobile commerce are needed
(Pagani, 2004). The fact that MIES is largely recreation-driven makes Chung and Tan�s
model particularly suitable for the context of this study. Reviews of existing literatures
in mobile internet and flow theory identified several weaknesses. Research questions
will be derived from these gaps in the current literature.

12
2.1.1 Chapter Outline
Figure 2-1 Chapter Outline
2.1 Chapter Overview 2.1.1 Chapter Outline
2.2 Development of the Original TAM 2.2.1 Constructs on TAM 2.2.2 Applying TAM in different contexts 2.2.3 Significance of TAM Constructs 2.2.4 TAM Studies focused in E-commerce 2.2.4.1 Extrinsic and Intrinsic Motivations 2.2.4.2 Perceived Playfulness as a New Intrinsic Motivational Construct
2.2.5 Exploring the Antecedents of Perceived Playfulness 2.2.5.1 Importance of Perceived Playfulness in Mobile Commerce
2.3 Mobile Commerce or Mobile Internet? 2.3.1 Mobile Internet Services in New Zealand
2.4 Research development in Mobile Internet 2.4.1 The Unique Role of Entertainment 2.4.2 Mobile Information and Entertainment Services (MIES)
2.5 Theoretical Perspectives 2.5.1 Flow and Autotelic Personality
2.5.1.1 Individual Differences and Autotelic Personality in Flow 2.5.2 Perceived Service Quality 2.5.3 Perceived Technology Compatibility 2.5.4 Social Influence 2.5.5 Motivation for Using
2.7 Chapter Summary
2.6 Development of Research Questions

13
2.2 Development of the Original Technology Acceptance Model In any cutting-edge technology, functionalities alone will not be sufficient for the user
to adopt it. To understand user acceptance of IT/IS, a number of studies have proposed
theoretical models. Davis (1989) established the Technology Acceptance Model with
Perceived Usefulness and Perceived Ease of Use as two determinants motivating users
to adopt a new technology in the workplace (Fig 2-2).
TAM is theoretically based on the Ajzen and Fishbein�s (1980) Theory of Reasoned
Action (TRA), which suggests that social behavior is (1) motivated by an individual�s
attitude toward carrying out that behavior, (2) a function of one�s beliefs about the
outcome of performing that behavior and (3) an evaluation of the value of those
outcomes (Fig 2-3). The Reasoned Action Theory was originated from the field of social
psychology. Social psychologists attempt to find the explanations of how and why an
individual�s attitude impacts on behaviour.
According to Ajzen and Fishbein (1980), gaining a deeper understanding of those
factors influence behavior requires that we search for the determinants of the attitudinal
and normative components. These determinants, according to Ajzen and Fishbein
(1980), are beliefs individuals hold about themselves and the external environment.
Consistent with TRA, user�s beliefs determine their attitudes toward using information
technology in TAM (Moon and Kim, 2001).

14
Figure 2-2 Technology Acceptance Model (Davis, 1989)
Figure 2-3 Theory of Reasoned Action (Ajzen and Fishbein, 1980)
TAM was initially developed by Davis in 1989 and has received extensive empirical
support through �validation, application, and replication for its predictive power of the
acceptance of information systems� (Lu et al. 2003a). Of all the theories, TAM is
considered the most influential and commonly employed theory for describing an
individual�s acceptance of information systems (Pijpers et al. 2001; Lee et al. 2003).
Subjective Norm
Behavioral Intention
ActualBehavior
Beliefs and evaluations
Normative belief and motivation to comply
Perceived Usefulness
Perceived Ease of Use
Attitude toward Using
Behavioural Intention to Use
Actual System Use
External variables
Attitude towardBehavior

15
2.2.1 Constructs of the Technology Acceptance Model Although TAM was developed based on the rationale of TRA, it differs from TRA in
several ways. In the TRA theory, a person�s attitude toward a behavior consists of (1) a
belief that that particular behavior leads to a certain outcome and (2) an evaluation of
the outcome of that behavior. A person will participate in actual behaviour if he/she
believes the outcome is beneficial based on his/her evaluation. Another determinant of
user�s attitude toward behavior is the notion of the subjective norm. According to Ajzen
and Fishbein (1980), it is a function of normative beliefs which refers to a person's
�perception that most people who are important to him think he should or should not
perform the behavior in question�.
TAM adapted the generic TRA model and focus on the domain of user acceptance of
computer technology. The attitudinal determinants were also replaced by a set of two
variables: Perceived Usefulness and Perceived Ease of Use. These two constructs were
found to be more relevant in the context in which the study was taken (e.g. IT usage at
workplace), whereas belief and evaluation constructs were more suitable for general
purposes (Davis et al. 1989). Subjective norm was deliberately omitted from TAM
because its influence is insignificant (Davis et al. 1989). Subjective norm was also
considered problematic when it comes to determining whether it is triggered by direct
influence or through attitude on intention indirectly (Ajzen and Fishbein, 1980).

16
Therefore, TAM was found to be much simpler, easier to use, and more powerful model
of the determinants of user acceptance of computer technology than TRA (Davis et al.
1989). Perceived Usefulness and Perceived Ease of Use were defined as follows:
Perceived Ease of Use: �The degree to which a person believes that using a particular
system would be free of effort.� In other words, if an application is easier to use the chance for
the user to accept it is likely to increase (Davis, 1989).
Perceived Usefulness: �The degree to which a person believes that using a particular system
would enhance his or her job performance.� If an application is thought to be useful for their
job tasks by users, they are more likely to accept it (Davis, 1989).
Similar to the TRA, TAM includes the constructs Attitude toward using, Behavioural
Intention to Use and Actual Usage. The following definitions for these constructs are
adapted from Davis (1989):
Attitude toward using: �The degree of evaluative affect that an individual associates with
using the target system when performing the job.� In other words, the higher the individual�s
outcome expectations, the higher his/her use of computers (Compeau and Higgins, 1995; Davis,
1989).
Behavioural intention to use: �The strength of one�s willingness to use a system.� (Moon
and Kim, 2001)
Actual Use: �A self-reported measurement of usage of the system.� (Davis, 1993)
Instead of measuring actual usage many TAM related studies relied mainly on
self-reported usage of the system, assuming it effectively reflects actual usage (Szajna,
1996). However, the risk of distorted research findings when employing self-reported
usage instead of measuring actual usage was emphasized by several studies (Karahanna

17
and Straub, 1999; Szajna, 1996).
2.2.2 Applying TAM in different contexts Research replicating the original TAM with different technologies has found TAM
constructs showed results consistent with previous studies (Mathieson, 1991; Taylor and
Todd, 1995; Venkatesh and Davis, 1996). Therefore, it is believed that using TAM as
the basis for studying user acceptance of IT/IS technologies is a highly valid approach.
A number of recent studies have successfully adopted TAM to study the acceptance of
internet-related technologies, such as Email, World Wide Web, electronic commerce
and virtual store (Teo et al. 1999; Chen et al. 2002). Another important technology trend
occurring during the last decade has been the growth and development mobile
commerce. Recently, the significance of TAM was validated by several researchers in
the research of mobile commerce (Wu and Wang, 2004; Ng-Krülle et al. 2004; Fang et
al. 2006; Nysveen et al. 2005a; Nysveen et al. 2005b).
2.2.3 Significance of the TAM Constructs TAM assumes that beliefs about usefulness and ease of use are always the primary
determinants of IT/IS in organizations. These two constructs have been validated by
several researchers and proved to be statistically distinct dimensions (Adams et al. 1992;
Davis, 1989). Davis (1989) concluded that Perceived Usefulness exerts stronger
influence on usage than Ease of Use. Perceived Ease of Use has direct influence on
Perceived Usefulness and through Perceived Usefulness on behavioural intention
indirectly. Both constructs influence actual usage through behavioural intention
indirectly. Davis (1989) concluded attitude does not fully mediate the effect of
Perceived Usefulness and Perceived Ease of Use on behaviour, which reflects that

18
beliefs do not necessarily influence behaviour only through attitude.
2.2.4 TAM studies focused in E-Commerce One of the most phenomenal trends in personal computer usage during the last ten years
has been the internet. It is perhaps the best known and most popular networking
technology as it provides an easy and efficient way of delivering a wide variety of
services to billions of connected users1. As a result, TAM was used by many researchers
to investigate user acceptance of internet-related technologies, such as email, virtual
stores, online shopping, and general information search website (Trevino and Webster,
1992; Chen et al. 2002; Bhatnagar et al. 2000; Chung and Tan, 2004). These studies
validated and extended the original model, and providing a richer and more
comprehensive picture of TAM to explain user acceptance of information systems.
2.2.4.1 Extrinsic and Intrinsic Motivations In technology acceptance research, most of the work has been conducted from an
extrinsic motivation perspective (Moon and Kim, 2001). Therefore, one of the
weaknesses of TAM lies in the fact that it is largely extrinsically focused. Lee et al.
(2003) also urge research should continue to pursue meaningful actual usage, rather
than materialized usage of system. Igbaria and Guimaraes (1995) found computer
experience significantly affects ease of use. Hackbarth et al. (2003) subsequently found
that significant impact from system experience on ease of use is no longer significant in
the presence of playfulness. Other researchers found fun and playfulness should also be
considered as possible influences over computer training outcomes (Webster and
Martocchio, 1992; Venkatesh, 1999).
1Internet World Stats News, One Billion Internet Users, Monthly News Letter , 14 January, 2006 Retrieved 7, February, 2006 from: http://www.internetworldstats.com/pr/edi014.htm
19
Davis et al. (1989) examined the impact of enjoyment as an intrinsic motivational factor
on usage intention. They conclude that perceived enjoyment is an intrinsic motivation
factor for user acceptance of computers in workplaces. However, perceived enjoyment
does not reflect a comprehensive set of intrinsic motivations (Davis et al. 1992).
Recently, research progress on how intrinsic beliefs motivate user acceptance of
technology in the context of e-commerce has been phenomenal. As browsing on the
WWW can be described as useful, fun, exciting, entertaining and challenging,
researchers are inclined to learn more about the role of intrinsic beliefs in motivating
internet acceptance (Atkinson and Kydd, 1997).
Koufaris (2002) found emotional response to web shopping can also have the same
effect as pure utilitarian values associated with the website. The results show an
enjoyable shopping experience is enough to make online shoppers return.
Teo et al. (1999) defined extrinsic motivation as:
�The performance of an activity because it is perceived to be instrumental in achieving valued
outcomes that are distinct from the activity itself�;
Whereas intrinsic motivation refers to:
�The performance of an activity for no apparent reinforcement other than the process of
performing the activity per se�
A number of researchers studied several intrinsic motivators in IT/IS adoption. One
such intrinsic motivator is known as flow. Flow can occur in practically any activity,
including browsing on the website. It can be described as the �optimal experience�

20
which is the �holistic sensations that people feel when they act with total involvement�
Csikszentmihalyi (1990). Agarwal & Karahanna (2000) proposed a construct, Cognitive
Absorption, which derived from theories such as flow, absorption and cognitive
engagement. Webster and Ho (1997) studied audience engagement in multimedia
presentations and suggest engagement entails a kind of playfulness. In fact, the notion
of playfulness has been substantially investigated in relation to user�s intrinsic
motivations and deeply rooted in flow theory (Webster et al. 1993; Webster and
Martocchio, 1992). Chung and Tan (2004) pointed out all these theories are
considerably overlapped.
Chen et al. (2002) stated that playfulness is an important factor motivating users to
utilize a system. However, it is difficult to characterize playfulness, as it can be seen as
a personal trait or a situational factor (Moon and Kim, 2001; Lin et al. 2005). Webster
and Martocchio (1992) studied microcomputer playfulness as an individual trait rather
than as a state. However, they argue constructs of playfulness should also be studied as
state as well.
2.2.4.2 Perceived Playfulness as a New Intrinsic Motivator Moon and Kim (2001) extended the TAM in the context of World Wide Web; they
suggest people use the internet not only for utilitarian purposes but also for leisure and
recreation. Based on the concept of flow, they consider playfulness as an intrinsic belief
or motive, which is shaped by the individual�s experiences with the environment. A new
intrinsic motivation factor�Perceived Playfulness, is introduced into the original TAM.
Their finding suggests intrinsic motivations had a stronger effect than extrinsic
motivation. In other words, Perceived Playfulness had a more significant effect on

21
individual�s attitudes than Perceived Usefulness.
Moon and Kim defined Perceived Playfulness as:
�The extent to which the individual perceives that his or her attention is focused on the
interaction with the World-Wide-Web; is curious during the interaction; and finds the
interaction intrinsically enjoyable or interesting�
They propose Perceived Ease of Use influences both Perceived Usefulness and
Perceived Playfulness (Fig 2-4). Bruner and Kumar (2005) studied consumer
acceptance of handheld internet devices and suggest an important way to increase fun is
to increase Ease of Use. Lin et al. (2005) included �Perceived Playfulness� in
expectation-confirmation theory when studying continued use of web portals. While
most web portals provide functions and capabilities at the same level, making it more
enjoyable or playful may contribute more to the user�s satisfaction level.
Figure 2-4 Extended Technology Acceptance Model (Source: Moon and Kim, 2001)
Perceived Usefulness
Perceived Ease of Use
Perceived Playfulness
Attitude toward using
Actual Use
Behavioural Intention to Use

22
2.2.5 Exploring the Antecedents of Perceived Playfulness In an attempt to explore antecedents toward Perceived Playfulness, Chung and Tan
(2004) validated the extended TAM and the significance of Perceived Playfulness in the
context of general information searching websites. Based on a comprehensive literature
review in the literature of flow, Perceived Playfulness and cognitive absorption, a list of
possible antecedents of Perceived Playfulness were identified. All the antecedents were
grouped into three broad categories: Cognitive Aspects, Website Characteristics and
Motivation for Searching. Using a priori coding scheme, they proposed the antecedent
model of Perceived Playfulness based on content analysis (Fig 2-5). Chung and Tan
(2004) explicitly mentioned in the end of their paper that some antecedent categories in
the prior coding scheme were excluded due to their assumed irrelevance to the context
of their study (internet for information searching).
Figure 2-5 Proposed Model for Antecedents of Perceived Playfulness (Chung and Tan, 2004)
Subcategory 1: Cognitive Aspects ! Focused attention ! Control
Subcategory 2: Website Characteristics ! Content ! Speed ! Ease of Use ! Experimentation ! Variety ! Feedback ! Perceived Usefulness ! Navigation
Perceived Playfulness
Antecedents
Subcategory 3: Motivation for Searching ! Experientially-directed tasks

23
2.2.5.1 Importance of Perceived Playfulness in Mobile Commerce Although there have been several attempts to replicate TAM in understanding user
adoption of mobile commerce in general (Pagani, 2004; Chae and Kim 2003; Chae et al.
2002; Wu and Wang, 2004; Lu et al. 2003a) few of them take into account the influence
of intrinsic motivation on attitude and intention to use. Given that recreational services
largely account for mobile commerce, the need to investigate user�s intrinsic motivation
in mobile context becomes apparent (Nysveen et al. 2005b). Several researchers have
included intrinsic motivator in their studies of mobile internet services. Nysveen et al.
(2005b), in their study of four mobile services, found enjoyment plays an important role
in determining intention to use. Fang et al. (2006) categorized mobile tasks that can be
performed on handheld devices into three broad types: general task, transactional task
and gaming task. They found Perceived Playfulness is significant when users
performing gaming tasks. Both studies extended TAM in the context of mobile internet
services.
Despite the importance and significance of Perceived Playfulness in mobile internet
services has attracted the attention of several researchers, none of them investigated the
�cause� of the occurrence of Perceived Playfulness. Methlie and Pedersen (2005)
studied network effects and intrinsic attributes of mobile services. However, their study
was mainly focused on the relationships between business model and service attributes
only. In this regard, the antecedent model proposed by Chung and Tan�s (2004) provides
a convenient theoretical base for future research into the effects of an intrinsic motivator
on the information systems. Therefore, it is the goal of this study to explore antecedents

24
of Perceived Playfulness in a new technology context.
Given that a variety of mobile devices have overlapping functionalities; it becomes
increasingly difficult to draw a line between mobile phones and other mobile devices.
Nevertheless, this study focused on mobile phones only. My view of a mobile phone is
of a device that is capable of making standard voice calls, with additional but optional
functionalities to use services such as SMS, wireless internet access and MMS etc. It
should be distinguished from business handheld devices such as Smart phone or PDA
that are capable of performing more complex functions.
25
2.3 Mobile Commerce or Mobile Internet? Mobile commerce can be broadly defined �the use of mobile hand-held devices to
communicate, inform, transact and entertain using text and data via connection to
public and private networks� (Chiu et al. 2001). Up until now, the terms mobile internet,
wireless internet and mobile commerce have been used interchangeably. Mobile internet
is defined as the usage of internet via handheld devices (Chae and Kim, 2003). The
conveniences necessitated by ubiquitous internet access come along with emerging
applications such as mobile information access, real-time multimedia communications,
networked games, immersion worlds and cooperative work. However, a clear
distinction should be made between mobile internet and wireless internet because the
latter can only represent fixed internet access through a wireless medium (Chiu et al.
2001).
In this study, the term mobile internet is preferred as the research topic for two reasons.
First, mobile commerce can be seen as a subset of electronic commerce. Studies have
shown mobile commerce transactions do not exist independent of the internet (Wu and
Wang, 2004; Barnes and Huff, 2003). Van de Kar (2004) also suggests mobile
information and entertainment services can be seen as a kind of E-services. Second,
while mobile commerce includes voice services in a broader sense, this study only
interested in mobile content services. Chae et al. (2002) defined these services as the
wireless access of digitized contents of the internet via mobile devices. Mobile internet
service has been evaluated as one with high potential for its ability to carry out multiple
services and to be truly convenient from a user�s point of view. The convergence of
mobile commerce and internet create new market opportunities and services for
business and users (Barnes and Huff, 2003).

26
2.3.1 Mobile Internet Services in New Zealand Mobile penetration is starting to reach near saturation levels and the number of mobile
phone users in New Zealand had reached over three million by the end of 20042. Users
in New Zealand have demonstrated enthusiasm for mobile services such as short
message services (SMS), with users sending approximately 900,000 messages a day. As
subscriber growth slows, Vodafone and Telecom New Zealand aim to derive greater
value from users by introducing advanced mobile data services such as Video Calling
and Mobile TV. The launch of third generation mobile network has begun to see
significant growth in revenues from mobile internet services by Telecom�s T3G and
Vodafone�s �Vodafone live!� services. Over the past 12 months, game services have
drawn 35,000 new users a month on average. The service is charged on a per-use basis
and, as of June 2002, accounted for about 60% of WAP revenues or between $1.2
million and $3 million over the last financial year. Sports, weather and news comprise
another 30% of WAP revenues (Struneski, 2005). The phenomenon that wireless rather
than fixed internet is favoured by users is illustrated by the breakeven point between
years 2002 and 2003 in Fig 2-6.
Figure 2-6 Internet Connectivity Outlook (Kikta et al. 2002)
2 New-Zealand-Telecommunications-Key-Statistic (n.d.), Retrieved November 10th, 2005 from http://www.budde.com.au/Reports/Contents/New-Zealand-Telecommunications-Key-Statistics-890.html

27
2.4 Research development in Mobile Internet Although the rapid growth of mobile internet attracted researcher�s attention, most of
the research works so far are �technology centric� as pointed out by Ng-Krülle et al.
(2004). Thus, it presents a need for developing a more comprehensive method to make
sense of user�s perception toward mobile internet services. Pagani (2004) called for
more substantive, theory-based research and a deeper understanding of consumer
behavior with regard to mobile commerce is needed. The current literature on mobile
commerce in general revealed that some areas need more research efforts to improve the
understanding of their impacts on mobile internet services (Kim and Jee, 2006; Pagani,
2004; Lu et al. 2003a; Pedersen et al. 2003; Ng-Krülle et al. 2004). Specifically, these
are users, services, compatibility between service and device, social influence and
different motivations for use.
Understanding user characteristics is a prerequisite for developing portable internet
service (Kim and Jee, 2006). Lu et al. (2003a) in their study of mobile internet via
mobile devices (WIMD) suggesting experienced users are likely to be skillful and used
to WIMD. Methlie and Pedersen (2005) identified personal innovativeness as an
important intrinsic attribute toward perceived value of mobile services. In terms of
services, entertainment accounts for a large proportion of mobile internet service
offerings (Baldi and Thaung, 2002). Mobile internet differs from E-commerce in terms
of usage and communication style, users can have access to mobile internet services
anywhere and anytime. The success of SMS with young people, including their use in
downloading ringing tones and screen savers, caused European and subsequently US
service providers to recognize the importance of young users and entertainment contents
(Funk, 2004). On the other hand, technology is the enabling force for the development

28
of new mobile internet services. In the field of mobile commerce, mobile technologies
have been a major topic in line of this research (Lamming et al. 2000; Ng-Krülle et al.
2004; Van de Kar et al. 2003; Lu et al. 2003a). Lu et al. (2003a) pointed out that the
main problem can be attributed to the incompatibility between mobile devices and
mobile data services. As the entry point to the services, their own capabilities as well as
limitations serve as an indispensable link between mobile internet services and users�
expectations.
Mobile devices are inherently communication devices. Thus opportunities exist for
locating users and facilitating communication between them (Lee and Benbasat, 2004).
Several studies have found Social Influence impact positively on an individual�s IT
usage (Taylor and Todd, 1995; Venkatesh and Morris, 2000). In Taylor and Todd�s
study (1995), Social Influence were equivalent to subjective norm and were defined as
other people�s opinion, superior influence, and peer influence. As an interpersonal
communication tool, research suggests Social Influence plays a pivotal role in mobile
commerce (Lu et al. 2003b). Evidences has shown Social Influence is especially
prevalent among the youth segment (Taylor and Harper, 2002; Carroll et al. 2002).
Schmidt et al. (1999) suggest that the limited resources of mobile internet services and
the various contexts of mobile information environments increase the importance of the
user�s goal. Chae et al. (2002) point out that users with different goals require radically
different information especially when the users have to use limited resources within
widely varying environments. Wolfinbarger and Gilly (2001) investigated usage of web
shopping behaviour and discovered that experientially-directed behaviour is more
significant among web shoppers. However, the authors suggest goal-oriented behaviour
is more likely to occur in mobile commerce.

29
2.4.1 The Unique Role of Entertainment There is growing evidence that the entertainment and business are becoming
increasingly mixed (Baldi and Thaung, 2002). Childers et al. (2001) pointed out that
while the instrumental aspects of the new media are important predictors of online
attitudes, the hedonic aspects of new media play at least an equal role. Bruner and
Kumar (2005) demonstrated that apart from Perceived Usefulness, fun as a hedonic
aspect played a more important role contributing to consumer adoption of an internet
enabled handheld device. Results of these studies suggest intrinsic motivator is a
significant determinant of user�s attitude toward mobile internet services.
Several researchers have conducted research on user�s adoption of mobile internet
services using TAM (Nysveen et al. 2005b; Fang et al. 2006). These studies have
confirmed the importance of Perceived Playfulness in determining users� intention to
use these services. Despite its significance, none of these studies investigated the
�cause� of the occurrence of Perceived Playfulness. In this regard, the antecedent model
proposed by Chung and Tan�s (2004) provides a convenient theoretical base for future
research into the effects of an intrinsic motivator on the information systems. Therefore,
it is my goal to explore antecedents of Perceived Playfulness in the context of mobile
internet services, with a focus on adapting the antecedent model in Chung and Tan
(2004) and empirically testing the new model.

30
2.4.2 Mobile Information and Entertainment Services (MIES) According to Chiu et al. (2001), mobile internet service is a very broad term comprising
four basic functions: information, communication, transaction, and entertainment (Fig
2-7). Current mobile internet services are a combination of these functions. Since my
interest lies within the hedonic aspects of mobile internet services, I will conduct
research with a focus on information and entertainment only. The definition provided by
Van de Kar et al. (2003) will be adopted in this study. Mobile information and
entertainment services (MIES) can be defined as �the delivery of information and
entertainment from specially formatted content sources (Internet sites, SMS, MMS, etc.)
via the mobile telecommunication network to a mobile user�. While New Zealand is
ranking high among other OECD countries in terms of multimedia mobile phones
saturation (69% compare to the global average 53%), it is still ranking low in terms of
using them to access data and entertainments (Newbery, 2005). Therefore, the goal of
this research is to understand and reveal mobile phone users� perceptions of these
services.
Figure 2-7 Mobile Internet Service Functions
Information
Mobile Internet Services
Transaction
Communication Entertainment

31
From the literature reviewed, strengths and weaknesses were identified in each section.
In brief, although Chung and Tan (2004) provide a useful model to investigate user�s
intrinsic motivation, it needs to be adapted to suit other research contexts. Thus, the
following research objectives become apparent for this study. In the next section, I will
examine each antecedent category in Chung and Tan (2004).
Research Objective 1: Examine Perceived Playfulness and its antecedents with a
focus on adapting the proposed model in Chung and Tan (2004) and explicitly testing
the new model in the context of mobile information and entertainment services.
After identifying gaps in current research of mobile commerce in general, it is clear that
technology factors and Social Influence should be integrated with the antecedent model
in Chung and Tan (2004) for a better understanding of user�s Perceived Playfulness
toward MIES.
Research Objective 2: Examine the effects of Social Influence and the compatibility
between service and technology on Perceived Playfulness in the context of mobile
information and entertainment services.

32
2.5 Theoretical Perspectives Having discussed the importance of intrinsic motivators and current research streams in
MIES, the purpose of investigating Perceived Playfulness and its antecedents in this
research was justified. This section will proceed to theoretical considerations for
Perceived Playfulness. In order to develop my model, I will draw upon specific
characteristics of MIES, the antecedent model in Chung and Tan (2004) and the flow
theory that their model was based on. Through this way, the antecedents that influence
user�s Perceived Playfulness of MIES are determined. First and foremost, it is important
to consider Autotelic Personality which reflects those variations on individual tendency
to experience flow (Nakamura and Csikszentmihalyi, 2002). Second, Perceived Service
Quality which encompasses the service attributes that are deemed important on user�s
Perceived Playfulness (Chung and Tan, 2004). Third, as mobile phones act as the entry
point to MIES, their own capabilities as well as limitations serve as an indispensable
link between mobile internet services and users� expectations (Lu et al. 2003a). This
suggests mobile phone functionalities not only impact on user�s belief (e.g. Perceived
Playfulness) directly; it also mediates the relationship between user�s expectation of
MIES quality and their belief about these services. Thus, the notion of Perceived
Technology Compatibility falls into the interest of this study. Then, the fact that mobile
phone users are connected to one another motivates us to exploring the effect of Social
Influence on their beliefs in the context of this study. Finally, the various contexts of
mobile information environments increase the importance of user�s goal (Schmidt et al.
1999). Wolfinbarger and Gilly (2001) stated that consumer motivation is largely
goal-oriented or experientially-directed. They further pointed out that given the
transactional nature of mobile commerce, goal-oriented behaviours will be more
eminent. This claim has later received empirical support in Fang et al.�s (2006) study.

33
As a surrogate for Perceived Usefulness, Perceived Playfulness can be used to measure
extrinsic outcome expectancy for gaming tasks. These theoretical issues, which will be
incorporated in my conceptual model, are discussed in turn below.
2.5.1 Flow and Autotelic Personality Initially proposed by Csikszentmihalyi (1988), flow represents an optimal experience
when a person is unconsciously engaged in an activity that moment become so
engrossed which almost made that person lost the sense of self. Flow experience can
usually occur in structured activities such as games, ritual events, sports and artistic
performances (Csikszentmihalyi, 1988). The flow theory assumes that the world is
essentially in a state of chaos and that humans are intrinsically motivated to seek out
those experiences that add order to consciousness to account for this chaos. Therefore,
humans will tend to seek out those experiences with the most opportunity to achieve a
flow experience.
The theory assumes that it is within the ability of the subjective conscious to control, or
provide order to, external stimuli. It claims that a flow state occurs when the challenges
of a situation match the skills of the participant. If the challenges of a certain situation
are above the participant�s skills, then anxiety will be perceived by the participant.
Conversely, when the skills of the person are higher than that of the challenges of the
situation, boredom will result. In the past, flow has been studied in various technology
settings, such as personal computers, e-commerce, WWW, electronic library and
Computer�Mediated Environment (CME) (Ghani, 1995; Koufaris, 2002; Hoffman and
Novak, 1996; Trevino and Webster, 1992). All these studies unanimously support the
importance of flow in determining user�s intrinsic motivation toward technology use.

34
Autotelic Personality characterises a person �who is able to enjoy what he is doing
regardless of whether he will get external rewards from it and who thus is more likely to
experience flow for a given activity� (Hoffman and Novak, 1996). Czikszentmihalyi
(1990), in his long study of happiness identified what an 'autotelic' personality is�a
person who set their own goals, whether short-term or long-term, and then had great fun
in achieving them. Although Autotelic Personality is identified as an essential part of the
flow theory by Csikszentmihalyi, very little research explored the underlying
dimensions of Autotelic Personality (Finneran and Zhang, 2005; Nakamura and
Csikszentmihalyi, 2002). As Csikszentmihalyi stated:
�...the complexity of a flow activity is limited by the degree of challenge it can provide, and by
the willingness and �creativity� of the person to create challenges in an activity. A person who
can do this well, or who has the ability to enter a flow state relatively easy, is said to have an
�Autotelic Personality� (Csikszentmihalyi 1988).�
Finneran and Zhang (2005) reviewed the flow literature and flow-elated models. In their
paper, they pointed out the true difference among individuals is not merely in their skills,
but also their underlying life attitude, or their �Autotelic Personality�. Therefore, to gain
a better understanding of the role of Autotelic Personality in MIES, it is imperative to
identify those individual differences likely to make up Autotelic Personality and
contribute to the emergence of Perceived Playfulness. Furthermore, the validation of
Autotelic Personality in the context of this study will be used as an indication of the
existence of an overall construct which is indicated by its first order beliefs respectively
(Chin and Gopal, 1995).

35
2.5.1.1 Individual Differences and Autotelic Personality in Flow Individual differences refer to factors such as personality, situational, and demographic
variables that influence user�s beliefs about and use of information technology. In the
context of flow, Webster and Martocchio (1992) studied microcomputer playfulness and
suggest microcomputer playfulness act as an individual� tendency to interact
spontaneously, inventively and imaginatively with microcomputers. It is a situation
specific individual characteristic which represents a type of cognitive playfulness. They
went further, suggesting a distinction should be made between trait and state. Ghani
(1991) measured the state of absorption (a construct similar to flow) and suggest if a
person has a higher trait of absorption, he/she will have a higher chance to enter into the
flow state than a person with lower trait of absorption.
In this regard, Thatcher and Perrewe (2002) pointed out the difference between stable
individual differences and dynamic individual differences. Thatcher and Perrewe (2002)
stated dynamic individual differences reflect malleable dispositions that affect responses
to stimuli within a specific situation. Evidence suggests dynamic individual differences
can be a function of both stable individual differences and other dynamic individual
differences (Argawal et al. 2000). Moon and Kim (2001) proposed Perceived
Playfulness as a state of playfulness based on flow theory. This suggests Perceived
Playfulness can be seen as a dynamic individual difference which is occurred when user
interacting with MIES. Hence, identifying those individual characteristics that lead to
the occurrence of Perceived Playfulness may provide insight into Perceived Playfulness
as a dynamic individual difference.

36
Despite the lack of research, current literatures suggest some individual differences will
lead to flow experience and are likely to constitute Autotelic Personality. Recall that the
most important condition for a flow state to occur is when the challenge of a situation
matches the skill of the participant. Self Efficacy is similar to skill which has been well
studied in research on flow (Koufaris, 2002; Ghani et al. 1991; Hoffman and Novak,
1996; Novak et al. 2000). Self Efficacy can be further distinguished into general
self-efficacy and computer self-efficacy (CSE). While the former being an overall
judgement of an individual on efficacy across multiple computer application domains,
the latter represents the judgement on specific task in the domain of general computing.
Agarwal et al. (2000) pointed out that there is a significant support for a relationship
between Self Efficacy and individual beliefs about IT. Their result suggests software
specific self-efficacy will have a stronger effect than the initial general self-efficacy due
to the �carryover� effect, i.e. the accumulated application specific self-efficacy will
eventually displace the effects of initial belief with the passage of time. Because of this
reason, Computer Self Efficacy (CSE) is preferred over Skill as the latter may convey
the meaning of general competency on everyday tasks.
The flow experience usually occurs in structured activities such as games, ritual events,
sports and artistic performances (Csikszentmihalyi 1988). It does not normally occur in
everyday life because challenges and skills are rarely balanced. However, even if skills
and challenges are balanced, it does not guarantee a flow experience occurring. This is
due to the fact that activities only provide the challenges; it is still up to the individual to
recognize the challenge, provide the skills, and extract enjoyment from the activity.
Therefore, challenge is more related to the perceived complexities provoked by the
activity rather than the individual per se. As Csikszentmihalyi (1988) stated; the
complexity of a flow activity is limited by the degree of challenge it can provide, and by

37
the willingness and �creativity� of the person to create challenges in an activity. Only
when individuals �perceive� that the situation contains challenge congruent with their
skills can flow potentially occur. Because of this reason, Personal Innovativeness
introduced by Agarwal and Prasad (1998) was deemed important in the context of this
study. Personal Innovativeness in the domain of information technology is
conceptualized as an individual trait reflecting a willingness to try out any new
technology. Furthermore, Agarwal and Karahanna (2000) provide empirical support of
its influence on cognitive absorption, which is a construct similar to flow. In this regard,
Pagani (2004) suggests individual innovativeness can be seen as willingness to adopt
3G multi-media services. Lu et al. (2003a) have also stressed the importance of Personal
Innovativeness in their study of wireless internet via mobile device.
Hoffman and Novak (1996) developed a theoretical mode of flow within the
hypermedia context. In this model, challenges, skills and Focused Attention have been
modeled as the primary antecedents of flow. Other secondary antecedents (interactivity
and telepresence) were also added in accordance to the literature of hypermedia. The
consequence of flow leads to increased learning, perceived control, exploratory
behaviour and positive experience. However, their earlier work is exploratory in nature
therefore all the hypothesized relationships were not empirically tested. Novak et al.
(2000) later revised the original model and changed Control as a primary antecedent of
flow. The revised model was then tested and results showing all these four antecedents
exert positive and significant on flow. A somewhat interesting finding is that they model
Control and Skill together as a higher order construct (i.e. Skill/Control) However, a
distinction should be made between these two, control capturing an individual�s
perception that he/she exercises control over the interaction with environment (Webster
et al. 1993) whereas Self Efficacy (Skill) is the judgement on specific task in a specific
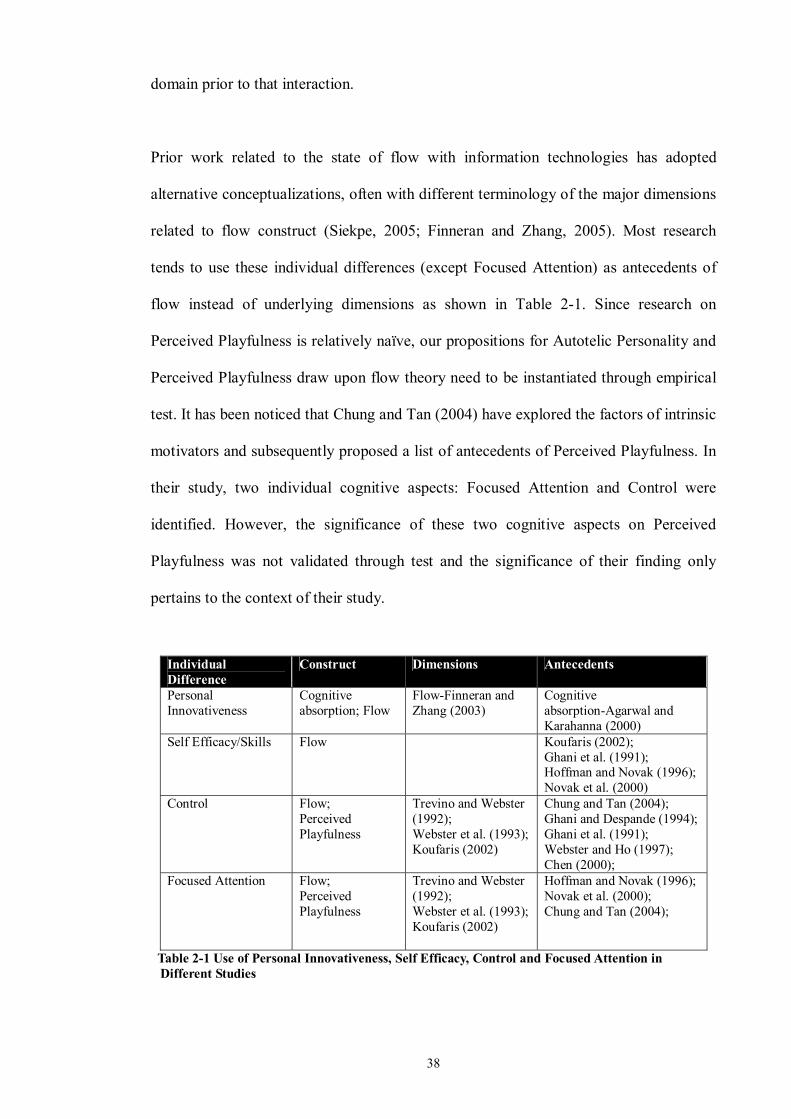
38
domain prior to that interaction.
Prior work related to the state of flow with information technologies has adopted
alternative conceptualizations, often with different terminology of the major dimensions
related to flow construct (Siekpe, 2005; Finneran and Zhang, 2005). Most research
tends to use these individual differences (except Focused Attention) as antecedents of
flow instead of underlying dimensions as shown in Table 2-1. Since research on
Perceived Playfulness is relatively naïve, our propositions for Autotelic Personality and
Perceived Playfulness draw upon flow theory need to be instantiated through empirical
test. It has been noticed that Chung and Tan (2004) have explored the factors of intrinsic
motivators and subsequently proposed a list of antecedents of Perceived Playfulness. In
their study, two individual cognitive aspects: Focused Attention and Control were
identified. However, the significance of these two cognitive aspects on Perceived
Playfulness was not validated through test and the significance of their finding only
pertains to the context of their study.
Individual Difference
Construct Dimensions Antecedents
Personal Innovativeness
Cognitive absorption; Flow
Flow-Finneran and Zhang (2003)
Cognitive absorption-Agarwal and Karahanna (2000)
Self Efficacy/Skills Flow Koufaris (2002); Ghani et al. (1991); Hoffman and Novak (1996); Novak et al. (2000)
Control Flow; Perceived Playfulness
Trevino and Webster (1992); Webster et al. (1993); Koufaris (2002)
Chung and Tan (2004); Ghani and Despande (1994); Ghani et al. (1991); Webster and Ho (1997); Chen (2000);
Focused Attention Flow; Perceived Playfulness
Trevino and Webster (1992); Webster et al. (1993); Koufaris (2002)
Hoffman and Novak (1996); Novak et al. (2000); Chung and Tan (2004);
Table 2-1 Use of Personal Innovativeness, Self Efficacy, Control and Focused Attention in Different Studies

39
Throughout this chapter, directions for research emerge and research questions will be
developed accordingly. Based on the discussions above, it leads to my first research
question:
Research Question 1: Does Autotelic Personality influence Perceived Playfulness in
the context of mobile information and entertainment services?

40
2.5.2 Perceived Service Quality Perceived Service Quality can be defined as �the overall quality of services that user
perceive or experience toward MIES�. Methile and Pedersen (2005) mentioned that
service attributes are emerged from two different sources: intrinsic attributes and
extrinsic attributes. While extrinsic attributes emerge from the networks that provide
and use network services, intrinsic attributes refer to the inherent attributes of the
service itself. This study will focus on the intrinsic service attributes and treat Perceived
Service Quality as a multidimensional construct that integrates these intrinsic service
attributes. Table 2-2 shows the breakdown of mobile entertaining services in Baldi and
Thaung (2002). Note that communication has been categorised as a mobile entertaining
service as well in their study (e.g. SMS).
Category Type Examples Audio Ring tones, Languages courses Video Movie trailers, Webcam Images Instant Photos, Photo Mailing
Multimedia
Text Recipes, Travel Guides, Information, News Transaction-oriented Shopping Coupons, Auctions Communication Messaging E-Mail, SMS, Instant Messaging, Conferences
Table 2-2 Mobile Internet Service Categories (Rource: Baldi and Thaung, 2002)
Chung and Tan (2004) studied Perceived Playfulness and its antecedents in the context
of general information search websites (e.g. Yahoo and google). They conducted a
comprehensive review of flow and flow-related constructs such as Cognitive Absorption
(Agarwal and Karahanna, 2000) and Perceived Playfulness (Moon and Kim, 2001).
Using a priori coding scheme, they proposed the antecedent model of Perceived
Playfulness using content analysis. Among the proposed antecedents, most of them
were identified as website characteristics category. This emphasizes how important
service characteristics are on determining user�s Perceived Playfulness of general
information search websites.

41
However, limited research has been conducted on the effect of Perceived Service
Quality on Perceived Playfulness. On the other hand, owing to contextual difference and
the lack of empirical support, cautions need to be exercised as to the extent to which
Website Characteristics category can be used to substitute Perceived Service Quality. In
this regard, the research most closely related to mine includes one study in the mobile
music industry that have examined a project named MUSICAL (Multimedia Streaming
of Interactive Content Across Mobile Networks) partly funded by European
Commission which was carried out in 2005 (Vlachos and Vrehopoulos, 2005). The
project leveraged existing media technologies and mobile standards and developed
value-added application components in order to fully exploit the capabilities of the new
generation networks. In particular, MUSICAL focuses on information delivery but
mainly mobile entertainment content such as songs (MP3), streaming video clips and/or
music news. A conceptual model postulates service quality has a direct and positive
impact on perceived value and satisfaction which in turn influences behavioural
intentions was developed and tested. Among all the antecedents of service quality;
content quality, device quality, privacy, connection quality and contextual quality are all
significant in the hypothesized relationships. In particular, the most important factor
when evaluating the overall superiority of the service experienced is content quality.
Perceived Service Quality was deemed to have the most significant effect on
behavioural intentions followed by satisfaction and value perceptions.
One of the important aspects in this study is the explicit focus on Perceived Playfulness
as an intrinsic motivator. This has made the antecedent category in Chung and Tan
(2004) particularly useful in this study. Initially most of the antecedents (those under
Website Characteristics category) were identified in past flow or flow-related research.
Therefore, their influences on user�s Perceived Playfulness in the MIES context are

42
foreseeable. At the same time, these antecedents are also proved to be positive and
significant in the mobile context except navigation (refer to Fig 2.5). According to
Buchanan et al. (2001), navigate the mobile internet via mobile phones can be a
daunting experience given the constraints of small screen display and cumbersome input
mechanisms. A common criticism of early WAP sites was that they involved too many
selections and moves between menus and submenus, for the user to achieve their
desired contents. They suggest that one of the most important factors that discourage
use of a WAP site was the number of �clicks� that had to be made to accomplish tasks.
Their study found that a substantial proportion of the trial users gave up after each click.
Many unique intrinsic attributes characterising mobile services have been mentioned in
similar contexts to MIES. For example, the lack of constraints related to time and space
of mobile services has been suggested as the basis for their usefulness (Pedersen and
Nysveen, 2003). Bruner and Kumar (2005) also found Perceived Ease of Use associated
with handheld devices will affect the perception of fun toward wireless internet.
Consistent the findings in Vlachos and Vrehopoulos (2005), Content is an important
element of mobile internet services (Baldi and Thaung, 2002; Wu and Dixit, 2003). In a
similar context, Webster and Ho (1997) found that user engagement in hypermedia can
be encouraged by Feedback and Variety of the system. While Feedback emphasizes the
importance of interactivity; Variety in hypermedia will relate to flow, because novel,
surprising, and complex stimuli preserve arousal. Nordman and Liljander (2003)
suggest that dial-up speed and configuration settings are important intrinsic attributes
for mobile service quality. Furthermore, Webster et al. (1993) claimed Experimentation
positively correlates with flow. Evidence has shown flow experience will encourage
exploratory behaviours. MIES users who experience their interaction as higher in flow
are more involved in what they are doing, expanding their time and efforts on exploring

43
new features and experimenting new possibilities of what they can do with MIES.
One feature that was not included in Chung and Tan�s (2004) study was context aware
services. Yet many researchers in the field of mobile commerce have stressed the
importance of providing context aware services (Pedersen et al. 2003; Sacher and
Loudon, 2002; Ho and Kwok, 2003; Ng-Krülle et al. 2004). Pedersen et al. (2003)
found context aware services can best be described by three dimensions: time, place and
personalization. While many studies focused on the first two dimensions (time and
place), they found the significance of Personalization dimension is most consistent
across different mobile data services. Similarly, Venkatesh and Ramesh (2003) pointed
out the significance of made-for-the-medium (tailoring a wireless website to fit a
particular user�s needs) in the wireless context was due to the personalization
sub-category. In sum, the significance of Perceived Service Quality and these
antecedents on Perceived Playfulness has been justified by previous research in similar
contexts (e.g. microcomputer, computer-mediated environment, hypermedia,
multimedia presentation software, mobile commerce and wireless internet). This leads
to my research question 2:
Research Question 2: Does Perceived Service Quality influence Perceived
Playfulness in the context of mobile information and entertainment services?

44
2.5.3 Perceived Technology Compatibility Although researchers are generally agreed upon the significance of flow and its merits
in the domain of technology, studies have shown that the extent to which user engage in
flow activities can vary not only due to individual or service-related factors, but the
technologies involved as well. A research conducted by Trevino and Webster (1992) in
which electronic email and voice mail systems were compared and their relative effects
on user�s flow experience were assessed shown that difference between technology
types will directly impact flow. Based on previous research findings, Webster et al.
(1993) suggest users may enjoy software that can be tailored to suit their individual
needs. They proposed perceived software characteristics (flexibility and modifiability)
as a correlate of flow and the result of their study has implications for information
system development.
The functionalities of mobile phones play a distinctive role in the context of MIES.
According to Anckar and D�Incau (2002), mobile benefits can be categorized in two
groups: wireless values and mobile values. While wireless values refer to the use of
wireless technology; mobile values arise from the mobile use of technology in meeting
users� time-critical needs, spontaneous needs, entertainment needs, efficiency needs, and
mobility needs. Bruner and Kumar (2005) showed the fun associated with accessing the
internet and performing a task can vary with the device used. Compared to desktop PC,
they found handheld devices provide greater intrinsic motivation to consumers, as the
relative novelty and mobility of a handheld device will result in an element of discovery
associated with their usage.
According to Khalifa and Liu (2003), both customer desires and expectations form

45
comparison standard for perceived performance at adoption in the disconfirmation
process. The disconfirmation process stipulates that satisfaction is mainly determined by
the gap between perceived performance and cognitive standards. A high level of
perceived service performance at adoption leads to positive expectation disconfirmation
and desire disconfirmation because good service performance helps to match or exceed
customer expectations and desires. Perceived service performance at adoption,
expectation disconfirmation, and desire disconfirmation contribute directly to positive,
overall customer satisfaction at adoption. In addition, based on the result of Khalif and
Liu (2003), the effect of perceived performance on satisfaction is not fully mediated by
expectations or desire disconfirmation. When expectations are low, the role of perceived
performance becomes more dominant in explaining customer satisfaction. Previous
research found in addition to factors related to quality of service, factors related to the
information system used (medium) are also important for explaining and predicting
satisfaction with internet-based services (Khalif and Liu, 2003). More recently, Lin et al.
(2004) incorporated Perceived Playfulness in to the expectation-confirmation theory and
found the confirmation of expectation and perceived performance will lead to Perceived
Playfulness which in turn drives user�s satisfaction. In regard with the above findings,
the author believes the functionalities of mobile phone can reinforce or lessen perceived
performance of MIES therefore it is the perceived compatibility between MIES services
and mobile phone functionalities that expectation or desire disconfirmations are based
on.
Similar to the notion in Khalif and Liu (2003), Perceived Service Quality can be fully
mediated by users� expectation disconfirmation, which is the �fit� between MIES and
mobile phone functionalities. As suggested by Chiu et al. (2001) in their study of
mobile internet, customer needs and technological possibilities need to align to make a

46
good product. Lu et al. (2003a) pointed out that the main problem can be attributed to
the compatibility between mobile device and mobile services. As a result, they
subsequently proposed �system complexities� which denotes the degree of integration
between wireless internet and mobile technologies in a TAM context. According to Lu
et al. (2003a), this construct comprised of four sub-constructs: data transfer efficiency,
system functionality, interface design, and mobile device capacity. The proposed
construct has also been tested and validated in their subsequent empirical study (Lu et al.
2003b). Since this study focuses on mobile phones only, this construct will be adapted
in my research and redefined as �the perceived degree of integration between mobile
information and entertainment services and mobile phones�. For the purpose of this
study, a new construct called Perceived Technology Compatibility is proposed based on
Lu et al.�s (2003b) work.
Research Question 4: Does Perceived Technology Compatibility influence Perceived
Playfulness in the context of mobile information and entertainment services?

47
2.5.4 Social Influence Social influence in mobile commerce has been studied in many forms. Weilenmann and
Larsson (2000) found sending and receiving of text messages can be seen as an
expressive communication activity in exchange of social capital and display style or
social identity. Other researchers studied social phenomena in the forms of ritual gift
giving, social learning and development and subjective norms (Taylor and Harper, 2001;
Ling and Yttri, 2002; Hung et al. 2003). Trevino and Webster (1992) suggest Social
Influence are more influential in explaining the adoption and use of new media. This
demonstrates the relationship between Social Influence and mobile commerce as well as
the need to incorporate it in the study of MIES. Recently, Nysveen et al. (2005a) studied
mobile chat services using TAM and TRA and they examined expressiveness and
normative pressure as �non-utilitarian� motive and motivation to comply social
pressures respectively. When people using mobile chat services the way they exchange
messages is an expressive communication activity to display style and social capital.
Normative pressure refers to a person�s perception that most people who are important
to him/her think he/she should or should not perform the behaviour in question. While
the study was interested in knowing the moderating effect of gender differences,
perceived expressiveness was found to be more significant among male segment and
normative pressures are salient to the female segment only. They further pointed out that
it is crucial to conceptually distinguish these two as they have been used
interchangeably. In the case of male, a service or technology can very well be perceived
as instrumental for expressing the users� personal or social identity while at the same
time they may not necessarily perceived social pressure towards using. Given that
mobile chat services can also be considered as a type of MIES, their view will be
adopted in this study.

48
Hsu and Lu (2004) investigated the role of Social Influence and flow in the context of
online games adoption. However, they did not examine the relationship between flow
and Social Influence. Chung and Tan (2004) studied Perceived Playfulness and
proposed an antecedent model based on a comprehensive review of flow related
literatures. However, the fact that Social Influence was not emergent in the final model
shows that it was not well explored in the flow literature. In their study of flow, Trevino
and Webster (1992) suggest it is not enough for a technology to be designed with flow
capabilities, perceptions of flow may depend on Social Influence, individual differences,
and task characteristics. Motivated by this finding, this study will integrate Social
Influence into Chung and Tan�s (2004) model and examine the impacts. Hung et al.
(2003) studied Social Influence on WAP (Wireless Application Protocol) adoption in
terms of Peer Influence and External Influence. Given that some mobile information
and entertainment services are still in early development (e.g. Mobile TV), service
providers will leverage the power of advertisements and commercials to raise users�
awareness of new services. Therefore, it makes sense to study Peer Influence and
External Influence separately. This leads to the following research question:
Research Question 5: Does Social Influence (Peer Influence and External Influence)
influence Perceived Playfulness in the context of mobile information and
entertainment services?
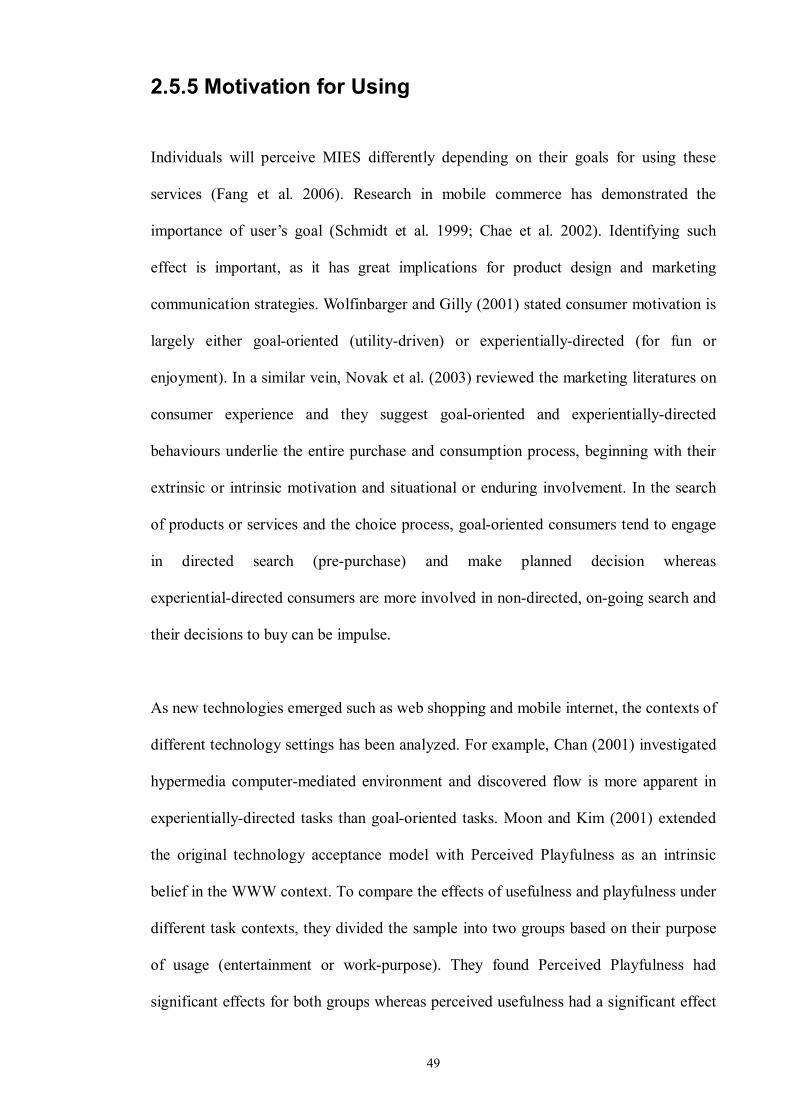
49
2.5.5 Motivation for Using Individuals will perceive MIES differently depending on their goals for using these
services (Fang et al. 2006). Research in mobile commerce has demonstrated the
importance of user�s goal (Schmidt et al. 1999; Chae et al. 2002). Identifying such
effect is important, as it has great implications for product design and marketing
communication strategies. Wolfinbarger and Gilly (2001) stated consumer motivation is
largely either goal-oriented (utility-driven) or experientially-directed (for fun or
enjoyment). In a similar vein, Novak et al. (2003) reviewed the marketing literatures on
consumer experience and they suggest goal-oriented and experientially-directed
behaviours underlie the entire purchase and consumption process, beginning with their
extrinsic or intrinsic motivation and situational or enduring involvement. In the search
of products or services and the choice process, goal-oriented consumers tend to engage
in directed search (pre-purchase) and make planned decision whereas
experiential-directed consumers are more involved in non-directed, on-going search and
their decisions to buy can be impulse.
As new technologies emerged such as web shopping and mobile internet, the contexts of
different technology settings has been analyzed. For example, Chan (2001) investigated
hypermedia computer-mediated environment and discovered flow is more apparent in
experientially-directed tasks than goal-oriented tasks. Moon and Kim (2001) extended
the original technology acceptance model with Perceived Playfulness as an intrinsic
belief in the WWW context. To compare the effects of usefulness and playfulness under
different task contexts, they divided the sample into two groups based on their purpose
of usage (entertainment or work-purpose). They found Perceived Playfulness had
significant effects for both groups whereas perceived usefulness had a significant effect

50
only for work purpose group. This suggests playfulness also motivates the work purpose
users. On the other hand, Novak et al. (2003) compared goal-oriented flow and
experiential flow in the web context and although flow experiences were found in both
types of activities; they found more evidence of flow for task-oriented (goal-oriented)
activities than recreational activities. Clearly, these researchers have demonstrated the
value in considering both goal-oriented and experientially-directed behaviours when
evaluating user experience in the ever expanding technology setting.
Goal-directed Experiential Extrinsic motivation Intrinsic motivation Instrumental orientation Ritualized orientation Situational involvement Enduring involvement Utilitarian benefits/values Hedonic benefits/values Directed (pre-purchase) search Non-directed (on-going) search; browsing Goal-directed choice Navigational choice Work Fun Planned purchases; repurchasing Compulsive shopping; impulse buys
Table 2-3 Distinction between goral-oriented and experientially-directed behaviours (Novak et al. 2003)
In the mobile internet context, Chae et al. (2002) studied different user goals (i.e.
utilitarian or hedonic) with respect to the relative weight of importance assigned to
information quality aspects. The structural models with different user goals indicate
users with utilitarian goals value more the content quality of the services while those
with hedonic goals value more the interaction quality. Wolfinbarger and Gilly�s (2001)
studied goal-oriented and experiential-directed behaviours among users shopping online.
Although their study mainly focused on online shopping, they pointed out early and
heavy users of internet tend to have a strong internal locus of control and thus are more
goal-oriented personalities. Goal-oriented online shopping can also be described as lack
of sociality and compare to experientially-directed online shopping the latter are more
socially involved (for example, virtual communities formed by users with similar
backgrounds and interests). Hoffman and Novak (1996) also suggest that goal-oriented
users more concerned about the medium through which they are interacting with due to

51
their instrumental orientation to media compares to experientially-directed users.
Although Chung and Tan (2004) anticipated that experiential-directed task will be more
influential in driven users� Perceived Playfulness of general information search website,
there is no empirical evidence to support this claim. Given that people often use
information search websites (e.g. Yahoo and Google) with a purpose, goal-oriented
tasks should, at least, play an equal role. Other researchers called for continued study of
the contrast between goal-directed and experiential processes as it helps to further
enhance consumer researchers� understanding of the fundamentals of compelling flow
experiences (Novak and Hoffman, 2001; Trevino and Webster, 1992). Wolfinbarger and
Gilly�s (2001) further claimed the limited resources and transactional nature of mobile
internet made goal-oriented activities more likely to occur.
Research Question 3: Does user�s Motivation for Using moderate other determinants
of their Perceived Playfulness in the context of mobile information and entertainment
services?

52
2.6 Development of Research Questions Several possible research areas were identified in the literature review in previous
sections. Based on these findings research questions were developed to address these
possible research areas. The research results will contribute to the current knowledge
base in mobile internet services, specifically, mobile information and entertainment
services. As little research has been grounded in the intrinsic motivator in the context of
mobile commerce, Chung and Tan (2004) provides a theoretical foundation for this
study. Built on this foundation, a comprehensive literature review was conducted based
on flow and mobile internet literatures. This study proposes Autotelic Personality,
Perceived Service Quality, Perceived Technology Compatibility and Social Influence
(Peer Influence and External Influence) as the antecedents of Perceived Playfulness in
the context of mobile information and entertainment services. A flow diagram is
presented in Fig 2-8 to depict the current directions that have been identified in
literatures and corresponding research areas.

53
Figure 2-8 Research Objectives and Possible Research Areas
TAM was extended with an intrinsic motivation construct Perceived Playfulness (PP) in the context of general information search website
Studies of PP are relatively scarce in other contexts. With the proliferation of MIES, study PP in this context is an important research direction
Chung and Tan (2004) proposed 3 antecedent categories of PP in the context of internet
Can PP be applied in the context of MIES?
The applicability of these antecedent categories in othertechnology contexts remain unknown
Can Chung and Tan (2004) be adapted and validated in the context of MIES?
Research in m-commerce stress the importance of device characteristics and its influence on intrinsic motivators
Service-technology compatibility will impact on users� attitude toward mobile internet services as well as their intrinsic motivation
Can Perceived Technology Compatibility (PTC) influences PP in MIES?
Social Influence was not incorporated in the original Chung and Tan�s (2004) Model
Social influence has been identified as an important element in the context of mobile commerce and flow literature
Can Social Influence(Peer Influence + External Influence) affect PP in the context of MIES?
Research Objective 1: Exploring the antecedents of PP in the context of MIES
Research Objective 2: Examine the impacts of Social Influence and PTC on PP in the context of MIES
Fill in the gaps in current literature
Fill in the gaps in current literature
Fill in the gaps in current literature
Fill in the gaps in current literature
Research objectives & possible research areas
Emergence of a new antecedent model of PP for MIES

54
2.8 Chapter Summary Current literature on both technology acceptance model and flow were discussed in this
chapter. Encouraged by Chung and Tan�s (2004) findings, this study intends to
empirically extend their model in the context of mobile information and entertainment.
Several important factors have been proposed along with the original model in Chung
and Tan (2004) because of their importance in Mobile commerce. This allows us to
investigate the research topic thoroughly. Furthermore, this study departs from a user�s
perspective as it is interested in knowing individual user�s perception toward Perceived
Playfulness in the context of MIES. Based on the literature reviews, research questions
based on the literature weaknesses were specified. The following chapter discusses the
theoretical framework formed from these research questions and the methodology used
in this study.

Chapter 3: Conceptual Model and Hypotheses
55
3.1 Chapter Overview The gaps identified in the preceding chapter set new directions for future research on
Perceived Playfulness. The theoretical foundation of this research is based on Chung
and Tan (2004). In essence, this study intends to empirically test and adapt their model
in the context of mobile information and entertainment services. Several changes have
been made to adapt their model in the new context. Based on the research questions
formed in Chapter 2, this chapter covers the development of the theoretical model for
this study. A set of hypotheses drawn from previous research was developed to test the
relationships among constructs.
3.1.1 Chapter Outline
Figure 3-1 Chapter Outline
3.1 Chapter Overview 3.1.1 Chapter Outline
3.4 Chapter Summary
3.2 Development of Theoretical Framework
3.3 Research Questions and Hypotheses ! Research Question 1: Proposition 1 and Hypothesis 1 3.3.1 Autotelic Personality as a Reflective Second-Order Structure ! Research Question 2: Proposition 2 and Hypothesis 2 3.3.2 Perceived Service Quality as a Formative Second-Order Structure ! Research Question 4: Hypotheses 3a, 3b and 3c ! Research Question 5: Hypotheses 4a and 4b ! Research Question 3: Hypotheses 5a, 5b, 5c, 5d, 5e and 5f

56
3.2 Development of Theoretical Model From the research questions identified in Chapter 2, a theoretical model was developed
(Fig 3-2). Consistent with the research purpose of exploring the antecedents of
Perceived Playfulness in the context of MIES, Perceived Playfulness will be specified
as the dependent variable. Drawing upon the flow literatures, Autotelic Personality has
been identified as an essential part of the flow theory (Csikszentmihalyi, 1988).
Research has shown autotelic persons are more likely to have flow experience than
those non-autotelic ones (Asakawa, 2005). Therefore, it is identified as a key
independent variable to explain Perceived Playfulness. While MIES is gradually gaining
popularity among mobile users, the overall quality of services that user perceive or
experience toward MIES is likely to influence their perception toward MIES (Vlachos
and Vrehopoulos, 2005). As a result, Perceived Service Quality is posited as another
independent variable that can impact on Perceived Playfulness. Further, the importance
of mobile technology has been empirically identified as a significant factor in
explaining technology adoption of mobile internet services (Fang et al. 2006; Lu et al.
2003a). The discussion in chapter 2 leads us to believe that user�s expectation, which is
derived from Perceived Technology Compatibility, is strongly influenced by Perceived
Service Quality. Therefore, Perceived Technology Compatibility is posited as an
independent variable that can lead to Perceived Playfulness. It also mediates the effect
of Perceived Service Quality on Perceived Playfulness indirectly. This research also
draws upon previous research on Social Influence in similar contexts (Hung et al. 2003;
Nysveen et al. 2005a). Social Influence is incorporated into the proposed new model
and separated into two constructs, Peer Influence and External Influence. Finally, this
study wishes to understand users� motivations of using MIES, Motivation for Using was
specified as a moderating variable that may influence the key relationships between

57
those independent variables and Perceived Playfulness.
Chin (1998) warned that the practice of providing hypothesis statements for each
structural path should be avoided as the proposed relations or path in a model should be
theoretically justified based on literature reviews. The inclusion of Autotelic Personality
and Perceived Service Quality in the research model reflected my thinking on this.
Since these higher order factors and their relationships with associated first order factors
have been theoretically justified in Chapter 2, this study will not provide hypotheses for
each structural path between a second order factor and its associated first order factors.
This practice seems to be followed by several SEM papers published in IS research
(Pavlou and El Sawy, 2005; Zhu et al. 2006, Pavlou and Fygenson, 2006).
Figure 3-2 Using the Proposed Model to Explain User�s Perceived Playfulness toward MIES
Perceived Technology
Compatibility
Motivation for Using
Perceived Playfulness
Perceived Service Quality
Autotelic Personality
Research Question 1
Research Question 2
Research Question 3
Peer Influence
ExternalInfluence
Research Question 5
Research Question 4

58
3.3 Research Questions and Hypotheses
Research Question 1: Does Autotelic Personality influence Perceived
Playfulness in the context of mobile information and entertainment
services?
A person with high autotelic personality tends to experience flow more easily than
non-autotelic person. Therefore, this research proposes Autotelic Personality as an
antecedent for Perceived Playfulness in MIES (as represented by the top left box in
figure 3-2). Furthermore, this research will look at those dimensions which jointly
reflect an existing overall individual personality construct�Autotelic Personality (Chin
and Gopal, 1995). In doing so, four individual differences have been considered in
Chapter 2. These four individual differences: Personal Innovativeness, Self Efficacy,
Control and Focused Attention are conceptualized as the dimensions of Autotelic
Personality.
Personal Innovativeness
Innovation refers to new things and ideas and new ways of behaving and interacting
with things. Just like any other new technology, MIES can be seen as innovations.
Research has shown that a successful innovation process is often characterized by
extensive communication (Carter et al. 2001). Identification of innovation
characteristics that influence diffusion and adoption decisions has been a focus of
research not only in marketing but also across the applied social sciences. The
innovation diffusion theory posits that five perceived characteristics of an innovation
affect adoption behaviour: relative advantage, compatibility, complexity, trialability and
observability (Rogers, 1983; Rogers, 1995). Tornatzky and Klein (1982) conducted a
meta-analysis of innovation characteristics and found only three innovation
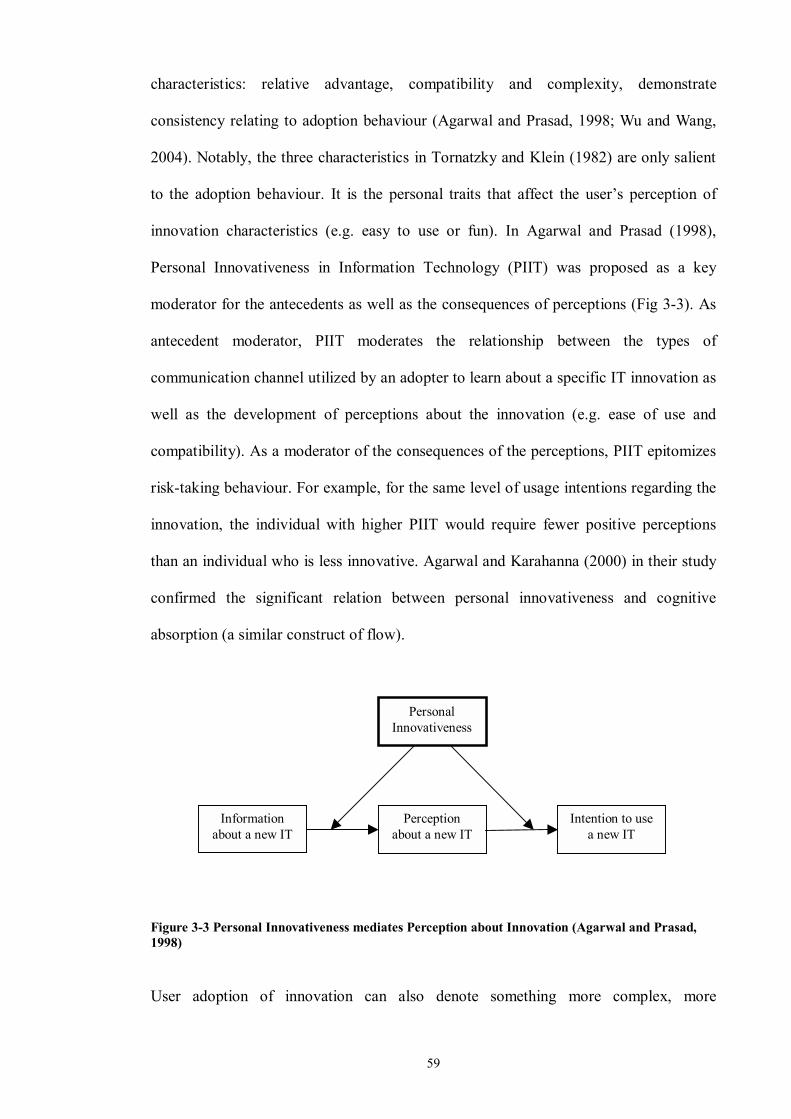
59
characteristics: relative advantage, compatibility and complexity, demonstrate
consistency relating to adoption behaviour (Agarwal and Prasad, 1998; Wu and Wang,
2004). Notably, the three characteristics in Tornatzky and Klein (1982) are only salient
to the adoption behaviour. It is the personal traits that affect the user�s perception of
innovation characteristics (e.g. easy to use or fun). In Agarwal and Prasad (1998),
Personal Innovativeness in Information Technology (PIIT) was proposed as a key
moderator for the antecedents as well as the consequences of perceptions (Fig 3-3). As
antecedent moderator, PIIT moderates the relationship between the types of
communication channel utilized by an adopter to learn about a specific IT innovation as
well as the development of perceptions about the innovation (e.g. ease of use and
compatibility). As a moderator of the consequences of the perceptions, PIIT epitomizes
risk-taking behaviour. For example, for the same level of usage intentions regarding the
innovation, the individual with higher PIIT would require fewer positive perceptions
than an individual who is less innovative. Agarwal and Karahanna (2000) in their study
confirmed the significant relation between personal innovativeness and cognitive
absorption (a similar construct of flow).
Figure 3-3 Personal Innovativeness mediates Perception about Innovation (Agarwal and Prasad, 1998)
User adoption of innovation can also denote something more complex, more
Perception about a new IT
Information about a new IT
Intention to use a new IT
Personal Innovativeness
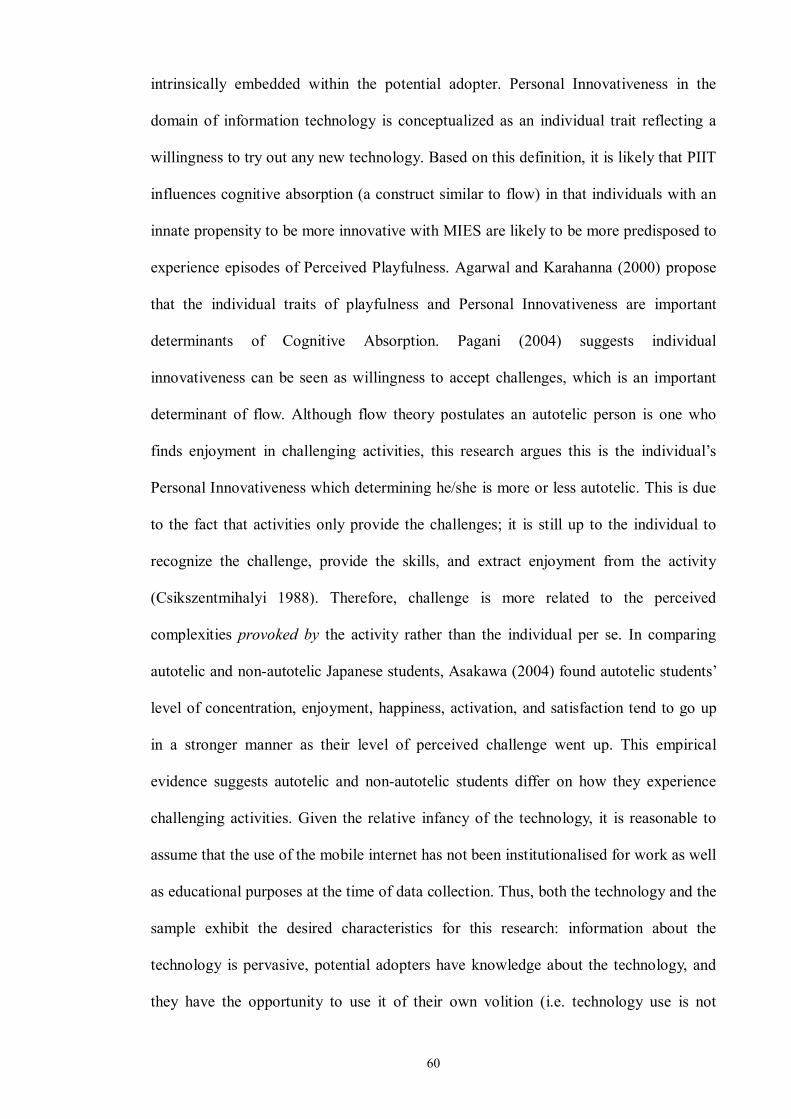
60
intrinsically embedded within the potential adopter. Personal Innovativeness in the
domain of information technology is conceptualized as an individual trait reflecting a
willingness to try out any new technology. Based on this definition, it is likely that PIIT
influences cognitive absorption (a construct similar to flow) in that individuals with an
innate propensity to be more innovative with MIES are likely to be more predisposed to
experience episodes of Perceived Playfulness. Agarwal and Karahanna (2000) propose
that the individual traits of playfulness and Personal Innovativeness are important
determinants of Cognitive Absorption. Pagani (2004) suggests individual
innovativeness can be seen as willingness to accept challenges, which is an important
determinant of flow. Although flow theory postulates an autotelic person is one who
finds enjoyment in challenging activities, this research argues this is the individual�s
Personal Innovativeness which determining he/she is more or less autotelic. This is due
to the fact that activities only provide the challenges; it is still up to the individual to
recognize the challenge, provide the skills, and extract enjoyment from the activity
(Csikszentmihalyi 1988). Therefore, challenge is more related to the perceived
complexities provoked by the activity rather than the individual per se. In comparing
autotelic and non-autotelic Japanese students, Asakawa (2004) found autotelic students�
level of concentration, enjoyment, happiness, activation, and satisfaction tend to go up
in a stronger manner as their level of perceived challenge went up. This empirical
evidence suggests autotelic and non-autotelic students differ on how they experience
challenging activities. Given the relative infancy of the technology, it is reasonable to
assume that the use of the mobile internet has not been institutionalised for work as well
as educational purposes at the time of data collection. Thus, both the technology and the
sample exhibit the desired characteristics for this research: information about the
technology is pervasive, potential adopters have knowledge about the technology, and
they have the opportunity to use it of their own volition (i.e. technology use is not

61
mandated).
Self Efficacy
In the research of flow experience, the level of individual skills has been determined as
one of the most important antecedents. These skills possessed by users cannot be
measured by objective test, to the contrary, they are perceived by users themselves. The
social cognitive theory defines Self Efficacy as one�s belief to perform a specific
behaviour (Compeau et al. 1999). It recognizes that our expectations of positive
outcomes of behaviour will be meaningless if we doubt our ability to successfully
execute the behaviour in the first place. Koufaris (2002) tested the relationship between
web skills with flow measurements. He suggests web skill is similar to Self Efficacy
which is �an individual judgment of one�s capability to use a computer�. He concludes
perceived web skills and positive challenges are positively related with shopping
enjoyment (an intrinsic belief) and concentration of online consumers (Koufaris, 2002).
Computer Self Efficacy has been found to affect computer use, often through its effect
on the emotional state of the user by, for example, reducing his computer anxiety
(Venkatesh, 2003). Computer Self Efficacy beliefs have been included in Webster and
Martocchio (1992) where the positive relationship between computer Self Efficacy
beliefs and microcomputer playfulness has been confirmed. While mobile phones have
made the MIES relatively easy to use, for a novice, performing an intended task could
still be daunting. Therefore, it is reasonable to assume one�s confidence in his/her
capabilities to use MIES will influence his/her Perceived Playfulness of MIES. Using
the ESM�s correlation-coefficient-as-variable analysis, Asakawa�s (2004) finding
suggested there was no significant difference between autotelic and non-autotelic
Japanese students in average Z-transformed correlation coefficients between their
perceived skills and flow dimensions. However, they also compared the same groups on

62
how they balanced perceived challenges and skills at the same time. The result indicated
that autotelic students� levels of perceived challenges and skills were more balanced
than those non-autotelic students. Because autotelic person are those who enjoyed
challenges and who could improve their quality of experience by facing challenging
situations in their daily lives, they are more likely to possess higher level of Self
Efficacy (skill) corresponding to their high personal innovativeness than non-autotelic
persons in order to achieve a more balanced match between perceived challenges and
skills.
Control & Focused Attention
Control refers to the extent to which the user feels in charge of the interaction with
MIES (Chung and Tan, 2004). The concept of control is central to theories of intrinsic
motivation that view people as seeking to control their own actions and choices
(Trevino and Webster, 1992). The significance of this variable has been widely accepted
in many other investigations (Agarwal and Karahanna, 2000; Ghani et al. 1991; Ghani
and Deshpande, 1994; Trevino and Webster, 1992; Webster et al. 1993; Koufaris, 2002;
Hoffman and Novak, 1996). In flow research, perceived control has been defined as the
level of one�s control over the environment and one�s action. When the user experiences
flow, his/her attention tends to focus entirely on an involving activity. Similar to Control,
Focused Attention as an antecedent of flow has been validated in many previous studies
(Hoffman and Novak 1996, Webster and Ho, 1997). While the user tends to concentrate
on certain stimuli, irrelevant messages will be filtered out. Webster et al. (1993) suggest
that the computer screen itself serves as a limited stimuli field where users interact with
and attain their cognitive resources. In the context of this study, I believe Focused
Attention is important for MIES because mobile phones generally have a much smaller
screen to interact with. Effective design can catch an individual�s attention as their

63
cognitive efforts stay focused on the phone screen (Trevino and Webster, 1992). In his
analysis, Asakawa (2004) compared autotelic and non-autotelic groups of students on
their overall experience as well as their experience in various types of activities they
engaged in during the week period. They discovered that autotelic students on average
were more concentrated, felt more control, felt more enjoyment, were more active, felt
more satisfaction and felt more importance for the future than their non-autotelic
counterparts. However, when looked more closely at the differences between the two
groups in their flow experience while doing specific activities, some characteristics of
the autotelic individuals became more apparent. When engaged in all the activities such
as watching television, doing school work and doing maintenance activities, the
autotelic group�s levels of concentration and perceived control of the situation were
significantly higher than those of the non-autotelic group�s. In the context of TAM,
Chung and Tan (2004) also identified Focused Attention and Control as two Cognitive
Aspects in their proposed antecedent model of Perceived Playfulness.
3.3.1 Autotelic Personality as a Reflective Second-Order Structure
Many researchers have pointed out the importance of Autotelic Personality in the flow
literature as it relates to one�s tendency to experience flow (Finneran and Zhang, 2005).
As Perceived Playfulness is similar to flow, it is envisaged that Autotelic Personality is
an important antecedent of Perceived Playfulness in this study. The present study views
Personal Innovativeness, Self Efficacy, Focused Attention and Control as first order
factors of Autotelic Personality (Fig 3-4). This suggests that when asked to assess the
level of Autotelic Personality present in a situation, one forms his/her judgment by
reflecting on his or her perceptions of levels of these underlying factors (Barki and
Hartwick, 2001). According to Edwards (2001), superordinate constructs are common

64
in research on personality. As a person�s Autotelic Personality is unique to that
individual, the combination of these four beliefs is unique for each individual. A
one-to-one correspondence exists between the Autotelic Personality and each first order
factor. Chin and Gopal (1995) described this kind of model as a �molecular model�
where each belief represents a separate attitudinal dimension which reflects an existing
overall attitude. It is hypothesized that an overall latent construct exists and is indicated
by the first order beliefs. Thus, the following hypothesis and proposition are proposed:
H1: Autotelic Personality is positively related to the user�s Perceived Playfulness
toward MIES
P1: Autotelic Personality is a second order reflective structure constituted by Personal
Innovativeness, Self efficacy, Control and Focused Attention
Figure 3-4 Autotelic Personality and Its Dimensions
Autotelic Personality
Personal Innovativeness
SelfEfficacy Control
Focused Attention

65
Research Question 2: Does Perceived Service Quality influence Perceived
Playfulness in the context of mobile information and entertainment
services?
Service characteristics could be the more important part in driving users� perceptions
toward MIES. Perceived Service Quality has been recognized as a major driver of
satisfaction in mobile entertainment services (Vlachos and Vrehopoulos, 2005). In this
study, Perceived Service Quality is proposed as a multidimensional construct that
integrates intrinsic service attributes that were identified in flow literature and mobile
commerce. This construct assembles the core values that stipulate users to develop
positive image toward MIES and most likely lead to the adoption of these services. For
these reasons, the antecedent category Website Characteristics in Chung and Tan (2004)
provides a theoretical foundation for Perceived Service Quality in this study. The
significance of these antecedents toward flow has been identified in other technology
contexts similar to mobile information and entertainment services.
Perceived Usefulness & Perceived Ease of Use
Chung and Tan (2004) identified Perceived Usefulness as one of the important
antecedents of Perceived Playfulness. The high face validity of Perceived Usefulness
has been endorsed by a vast amount of research papers (Lee et al. 2003). Although it
was an important belief construct in the original TAM, several researchers tested its
significance as an antecedent toward other belief construct in other technology context
as well. For example, Davis et al. (1992) found a positive relationship between
Perceived Usefulness and Enjoyment. The significant relationship between Perceived
Usefulness and Enjoyment has been affirmed by Pagani (2004) in the context of MMS.

66
This is consistent with Agarwal and Karahanna�s (2000) findings that usefulness and
Cognitive Absorption are highly correlated. Pedersen and Nysveen (2003) suggest the
lack of constraints related to time and space of mobile services can be seen as the basis
for their usefulness of mobile services.
Trevino and Webster (1992) and Webster (1989) confirmed the role of Ease of Use in
flow experience during computer interaction. As the current development of MIES in
New Zealand still seems premature, it is likely that Ease of Use will become a
significant determinant of user�s belief toward MIES in the early stage. Research has
shown that functionalities that are easy to use will increase user�s intrinsic motivation of
internet usage (Bruner and Kumar, 2005). More recently, Fang et al. (2006) categorized
mobile tasks that can be performed on handheld devices into general tasks, transactional
tasks and gaming tasks and the result indicated Perceived Ease of Use is influential
when gaming tasks were performed.
Content
Chae et al. (2002) suggested Content was important regardless of whether a site was
web-based or wireless. However, on delving into the sub-categories of content,
Venkatesh and Ramesh (2002) found relevance was significantly more important in the
wireless context than in the web context. Chae et al. (2002) categorized information
quality of mobile internet services into four dimensions: connection quality, content
quality, interaction quality and contextual quality. The results indicated content quality
significantly determines users� attitude toward mobile information quality. Similar
findings have been reported in Vlachos et al.�s (2003) and Chan and Ahern (1999). In
the context of mobile entertainment services, content is regarded as the most influential
factor for consumers when evaluating the overall superiority of the services (Vlachos

67
and Vrehopoulos, 2005).
Variety and Feedback
Webster and Ho (1997) conducted research on audience engagement (a similar
construct to state of playfulness) in multimedia presentations and suggest audience
engagement can be increased by developing presentations that provide more challenge,
feedback, presenter control and variety. Through comparison between two different
applications, they suggest these features of multimedia (e.g. variety) can be manipulated
to be more or less engaging for users. Given the limited display space of mobile phones,
Lee and Bendasat (2004) recommend that use of multimedia mix can overcome the
constraints of ineffective mobile interface design and furthers the state of flow. Clearly,
the audio and visual elements in MIES can preserve users� arousal and attract their
attention. Methlie and Pedersen (2005) included service variety as an important attribute
of perceived value of mobile services. Chan and Ahern (1999) also pointed out
multimedia can used to alleviate boredom and maintain user�s motivation.
Several researchers regarded feedback as relevant, suggesting that the provision of
feedback is particularly relevant in a computer-mediated environment (CME) (Hoffman
and Novak, 1996; Webster and Ho, 1997). MIES is one type of CME. Hence, Feedback
is highly relevant to interactivity in the MIES context. For example, mobile phone users
will be informed of their billing status as soon as a SMS request is sent to the service
provider via their mobile phones. For service providers, it exhibits the potential to build
links between mobile retailers and their customers because retailers can utilize this link
to promote their offerings (Lee and Benbasat, 2004). Carroll (1982) found that
responsiveness of computer systems is related to exploratory activities on computers.
Given that flow is subjective psychological experience that characterizes the

68
human-computer experience as playful and exploratory (Webster et al. 1993), it is
believed that Feedback is an important aspect of Perceived Service Quality.
Speed
Hoffman and Novak (1996) developed a theoretical model of flow within the
hypermedia environment of the web and proposed interaction as a secondary antecedent
of flow. They proposed interactivity as an important intrinsic service attribute and
suggest interactive speed could lead to flow indirectly through focused attention,
telepresence, time distortion. Based on their revised model of Hoffman and Novak
(1996), Novak et al. (2000) proposed that interactive speed could lead to flow and
indirectly through focused attention, telepresence, time distortion. However, the
empirical evidence attested only the direct influence of interaction speed on flow. Stable
and speedy responses from a service are especially important to mobile internet because
of the instant accessibility characteristic of the mobile information environment (Pagani,
2004). Nordman and Liljander (2003) suggest dial up speed and configuration settings
are both important intrinsic service attributes for mobile service quality. Hung et al.
(2003) found connection speed as a significant determinant for users to adopt WAP
services in Taiwan.
Experimentation
According to Csikszenmihalyi (1990), flow will encourage exploratory behaviours.
Several researchers have demonstrated that flow experience is associated with
exploratory behaviours (Webster et al. 1993; Ghani, 1991). Webster et al. (1993)
explored the dimensionality and correlates of flow in human computer interactions.
Specifically, they proposed control, attention focus, curiosity, and intrinsic interest as
the four dimensions of a flow state in the first study. Correlates of flow such as
perceived technology characteristics, experimentation and voluntary use were also

69
proposed in the second study. All correlates were significantly related to flow. Both
studies employed actual software (spreadsheet software and electronic mail) therefore it
adds credibility to the results. In the context of MIES, Experimentation refers to the
extent to which users can experiment with MIES (Chung and Tan, 2004).When users
unconsciously devoted their time and efforts to the tasks on hand they also engaged in
exploring what the new options are and experimenting with them (Webster et al. 1993).
Personalization
Because the mobile phone is a highly personalized device it is expected that its usage is
highly relevant to the user�s context. Personalized mobile services are context-specific
services to each individual. A system is considered context-aware if it can �extract,
interpret and use context information and adapt its functionality to the current context of
use� (Ng-Krülle et al. 2004). Venkatesh and Ramesh (2002) applied Microsoft Usability
Guidelines to the wireless websites. They suggested the fact that it is made for the
medium/personalization is also an important characteristic of a wireless website whose
content is customized for users. For some MIES services, personalization means the
amount of information sent to the customers will be reduced. The users will no longer
receive numerous irrelevant messages. With fewer messages, the users can view the
message title, and hence select information based on their preferences more easily (Ho
and Kwok, 2003). According to Mittal and Lassar (1996), personalization is one of the
most important determinants of service quality.
3.3.2 Perceived Service Quality as a Formative Second-Order Structure In terms of the nature of Perceived Service Quality in MIES, a second order structure is
proposed. This suggests that the first-order facets must be cumulatively examined, and

70
not as isolated systems (Pavlou and El Sawy, 2005). To support a unitary construct, the
relationships among the first-order facets should be mutually reinforcing. For example,
Carroll (1982) found responsiveness of computer systems related to exploratory
behaviours (Experimentation). In assessing the moderating effects of gender, Nysveen
et al. (2005a) found Perceived Ease of Use have a direct and positive influence on
Perceived Usefulness in the context of mobile chat services. Methlie and Pedersen
(2005) suggest usefulness is mainly determined by the content of mobile services
(functionalities). Lee and Benbasat (2003) pointed out providing product information
relevant to the user�s specific mobile setting is a type of appeal mix, in that it can be
used to attract the user�s attention. Also, visual and non-speech sound are all related to
content (Lee and Benbasat, 2003). Their effects are likely to be most effective when all
facets are utilized simultaneously, taking advantage of their complementarities. Given
the convergence of these facets, they cumulatively contribute to a unitary higher-order
structure, which can more parsimoniously explain their joint influences. Pavlou and El
Sawy (2005) pointed out second-order structure can provide a parsimonious description
of a complex construct. Given that user�s Perceived Service Quality is likely to place
different weights on the eight facets, the importance assign to each facet is proposed to
influence Perceived Service Quality in a formative fashion. According to Chin (1998), a
change in any first order factor does not necessarily imply a similar directional change
in others for a formative model. This leads to the following hypothesis and proposition:
H2: Perceived Service Quality is positively related to the user�s Perceived Playfulness
toward MIES
P2: Perceived Service Quality is a second order formative structure formed by
Perceived Usefulness, Perceived Ease of Use, Content, Variety, Feedback, Speed,

71
Experimentation and Personalization
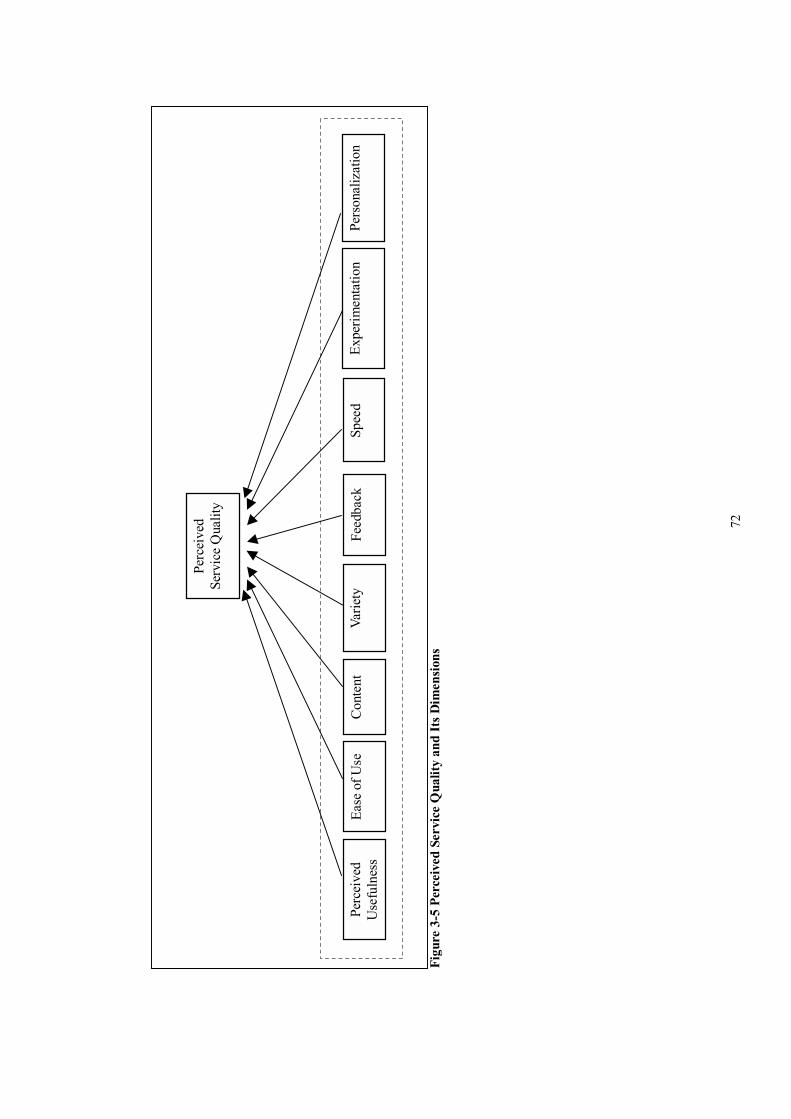
72
Fi
gure
3-5
Per
ceiv
ed S
ervi
ce Q
ualit
y an
d It
s Dim
ensi
ons
Perc
eive
d Se
rvic
e Q
ualit
y
Pers
onal
izat
ion
Feed
back
Sp
eed
Ease
of U
seVa
riety
Con
tent
Pe
rcei
ved
Use
fuln
ess
Expe
rimen
tatio
n

73
Research Question 3: Does Perceived Technology Compatibility
influence Perceived Playfulness in the context of mobile information and
entertainment services?
In research question 3, I have proposed Perceived Technology Compatibility which
accounts for the degree of integration between MIES and mobile phones on Perceived
Playfulness. The impact of system characteristics has been widely recognized in studies
on technology user acceptance (Davis et al. 1989; Davis, 1993). On the other hand,
studies on the effects of system characteristics on intrinsic motivators can be traced
back specifically to Trevino and Webster (1992). A positive influence of perceived
technology characteristics on flow was found in their study. Based on Ghani�s (1991)
findings, Webster et al. (1993) suggest users� perceptions of the program�s flexibility
and modifiability may contribute to flow experience. The result indicates that if the
functionalities of a technology are more aligned with users� needs it will facilitate their
experiences of flow. Similarly, Agarwal and Karahanna (1998) reported that
technologies perceived to be compatible with various aspects of individual�s
experiences and work styles are likely to induce feelings of familiarity and positive
affect. Wu and Wang (2004) adopted compatibility in IDT which denotes the degree to
which innovation is perceived to be consistent with the potential users� existing values,
previous experiences and needs. Based on my findings in literature, the following
hypothesis is formed:
H3a: Perceived Technology Compatibility is positively related to user�s Perceived
Playfulness toward MIES
Improving user satisfaction is the ultimate goal of improving application performance
on wireless devices (Raisinghani and Iyer, 2004). Lin et al. (2004) incorporated

74
Perceived Playfulness in to the expectation-confirmation theory and found the
confirmation of expectation and perceived performance will lead to Perceived
Playfulness which in turn drives user�s satisfaction. However, Perceived hardware and
software functionalities have been identified as one of the main perceived obstacles by
mobile users (Pagani, 2004; Lu et al. 2003a). According to Levy (2005), the overall
performance requirements have raised users� expectations about digital entertainment
services, which include mobile phones. Ironically, users expecting more from their
phones are influenced by the extensive marketing campaigns of service providers.
Koivisto and Urbaczewski (2004) found inconsistent quality of services perceived and
delivered caused stress and discomfort when users interacted with mobile internet
services.
Most research conducted on mobile internet elaborate on technology requirements
without discussing important end-user needs. Kettinger and Lee (1995) present a model
where gaps can occur between IT services delivered and user�s perception of the service
expected. However, their study was focused on building a strategic model rather than on
IT-User relationship. In his study of human computer interaction, Te�eni (1989) pointed
out perceived complexities always exist as an intermediate variable between users�
perception of the system and system itself. Two variables, mode of presentation and
number of windows, were examined in his study. His findings suggest the congruence
between user�s perception and the functionalities offered will subsequently impacts on
outcome. Their study further pointed out that the usefulness of information/system
characteristics perceived by users is a major component in the formation of perceived
complexities. Mobile phone serves to be the entry point when users interacting with
MIES. If their perceived compatibility between MIES and mobile phone is consistent
with their expectation, it will reinforce a positive image of MIES. Based on the above

75
discussion, the following hypothesis is proposed:
H3b: Perceived Service Quality is positively related to user�s Perceived Technology
Compatibility toward MIES
The intermediate role of Perceived Technology Compatibility stimulates my interest to
test its mediating effect between Perceived Service Quality and Perceived Playfulness.
The fact that Perceived Technology Compatibility intervenes between Perceived
Service Quality and Perceived Playfulness, according to Baron and Kenny (1981), is a
mediation relationship. If the mediating effect is significant, the influence from
Perceived Service Quality on Perceived Playfulness will be lessened significantly in the
presence of Perceived Technology Compatibility. Encouraged by this finding, the
following hypothesis is proposed:
H3c: Perceived Technology Compatibility significantly mediates the effect of Perceived
Service Quality on Perceived Playfulness

76
Research Question 4: Does Social Influence (Peer Influence and
External Influence) affect Perceived Playfulness in the context of mobile
information and entertainment services?
Malhotra and Galletta (1999) found changes in attitudes and actions produced by Social
Influence may occur at three levels: compliance, identification and internalization, even
though the resulting overt behaviour may appear to be the same. Although several
studies unanimously confirmed the unique role of Social Influence in TAM, the roles of
Social Influence on intrinsic motivators have not been well explored. For the purpose of
present study, Social Influence is divided into Peer Influence and External Influence
based on Hung et al.�s (2003) study on WAP services adoption.
Peer Influence is a form of identification and compliance process (Hsu and Lu, 2004).
This process occurs when an individual accepts influence in exchange for recognition or
acknowledgement in a social group. In a mobile context, this kind of Social Influence
has been well studied by many researchers in different forms (Sacher and Loudon, 2002;
Taylor and Harper, 2002; Ling, 2001). External Influences can be seen as a form of
internalization process which is disseminated through information such as mass media
reports, expert opinions and other non-personal information. This influence will occur
when users perceive the information they receive enhances their knowledge more than
that of reference groups (Hsu and Lu, 2004).
Ho and Kwok (2003) investigated External Influence such as the amount and the
perceived usefulness of general advertisements. However, their study focused on its
influence on user�s subscription to switch to new mobile service providers. Nevertheless,
in a mobile setting, Pedersen (2005) suggests studying both Peer Influence and External

77
Influence seem more appropriate. Based on the discussions above, two hypotheses are
proposed:
H4a: Peer Influence is positively related to user�s Perceived Playfulness toward MIES
H4b: External Influence is positively related to user�s Perceived Playfulness toward
MIES

78
Research Question 5: Does user�s Motivation for Using moderate other
determinants of Perceived Playfulness in the context of mobile
information and entertainment services?
Few researchers have conducted motivational research on mobile commerce in general
(Nysveen et al. 2005b; Fang et al. 2006; Chae et al. 2002). Fang et al. (2006) suggest
considering user task is crucial for wireless handheld devices as the limited cognitive
resources of users made their choices of applications important. They proposed
Perceived Usefulness, Perceived Ease of Use, Perceived Playfulness and Perceived
Security as determinants of user�s intention to use wireless applications via handheld
devices. Their findings suggest only Perceived Usefulness, Perceived Security and
Perceived Playfulness significantly determine user�s intention. Since their study covers
a wide range of wireless applications, this suggests users generally perform utilitarian
and hedonic activities in the context of mobile internet.
Users tend to have different goals when using services; their goals are often achieved
through perceived congruence between the values they have and those offered by the
services. Chae et al. (2002) pointed out the same information quality may have different
impacts depending on different goals held by users in the context of mobile internet
services. It is important to recognize flow can occur in either type of behaviours:
goal-oriented or experientially-directed. Hoffman and Novak (1996) defined a
goal-directed process as characterized by instrumental orientation with a focus on
utilitarian benefits, whereas experiential processes are characterized by ritualistic
orientation and hedonic benefits. Fang et al. (2006) provided empirical support for this
in their study on mobile internet. Specifically, they found Perceived Usefulness is
significant in transactional tasks, whereas Perceived Playfulness is more significant in
mobile gaming tasks.

79
Experientially-directed behaviours are not guided by goals, but by the process itself.
Hoffman and Novak (1996) claimed that for intrinsically motivated people, choices are
intuitive and spontaneous and do not involve any conscious and deliberate thinking. In
contrast, goal�oriented users are very task-specific, their behaviours are often
characterized by situational involvement and directed goals. This suggests Focused
Attention could differ between these two groups of users. Furthermore, when using
goal-oriented services, users depend on the functionalities of the services (Nysveen et al.
2005b). This reflects on their ability/skills to take control of the environment when
using goal-oriented services. For experientially-directed users, lack of skill is less
harmful and sometimes more challenge provides even more fun (e.g. game).
Wolfinbarger and Gilly�s (2001) studied motivations on online shopping and pointed out
early and heavy users of internet tend to have a strong internal locus of control and thus
are more goal-oriented personalities. Given the relative infancy of the technology, it is
reasonable to assume that the early adopters of MIES exhibit strong internal locus of
control and tend to be more goal-oriented. Furthermore, goal-oriented behaviour is
associated with risk-taking behaviours, which is a characteristic exhibits by innovative
person (Hoffman and Novak, 1996). In our study of MIES, Personal Innovativeness,
Control, Focused Attention and Self Efficacy are both proposed as underlying
dimensions of Autotelic Personality.
H5a: User�s Motivation for Using MIES will moderate the hypothesized relationship
between Autotelic Personality and Perceived Playfulness
Goal-oriented services have a relatively stronger weight on utilitarian benefits than do
experiential services. Fang et al. (2006) found there are stronger direct effects of
Perceived Usefulness on intention to use goal-directed mobile services than on intention

80
to use experiential mobile services. On the other hand, for experientially-directed
services Ease of Use will have stronger direct effects on intention to use than Perceived
Usefulness (Nysveen et al. 2005b; Fang et al. 2006). This suggests when performing
MIES tasks, experientially-directed users value Ease of Use more than do goal directed
users, whereas goal-directed users value Perceived Usefulness more than do
experientially-directed users. Chan et al.�s (2002) study revealed that users with
utilitarian goals value more the content quality of the services while those with hedonic
goals value more the interaction quality. On the other hand, there is no difference in
terms of connection quality between the two groups in their study. Since all these
characteristics are proposed as service attributes of Perceived Service Quality, I put
forward the following hypothesis:
H5b: User�s Motivation for Using MIES will moderate the hypothesized relationship
between Perceived Service Quality and Perceived Playfulness
Hoffman and Novak (1996) pointed out that goal-directed process is characterized by
situational involvement whereas experiential process is characterized by enduring
involvement. In terms of instrumental and ritualized orientation to media, goal-directed
users tend to focus more on the content whereas experientially-directed users are more
concern about the medium. This suggests experientially-directed users are more
concerned about Perceived Technology Compatibility than goal-oriented users. More
importantly, these findings pertain to the context of CME (Computer�Mediated
Environment), which to some extent is similar to MIES. The two hypotheses are
proposed:
H5c: User�s Motivation for Using MIES will moderate the hypothesized relationship
between Perceived Technology Compatibility and Perceived Playfulness

81
H5d: User�s Motivation for Using MIES will moderate the hypothesized relationship
between Perceived Service Quality and Perceived Technology Compatibility
In terms of Social Influence, Nysveen et al. (2005b) stated that �Perceived
Expressiveness� on intention to use is more relevant for experientially-directed tasks.
Using an SMS-based service as an example, its use often occurs in experiential mode
rather than goal-oriented context (Taylor and Harper, 2002; Nysveen et al. 2005b). This
non-utilitarian influence suggests use of SMS can be seen as a way of establishing
identity within a social group, which is very relevant to Peer Influence. On the other
hand, it is not clear whether External Influence is more relevant to goal-oriented or
experiential-directed services. In a study of mobile service by early adopters, Pedersen
(2005) found a significant relationship between External Influence and Perceived
Usefulness. Since Perceived Usefulness is a more significant indicator of intention to
use for goal-directed behaviours (Fang et al. 2006; Nysveen et al. 2005b), it is believed
that External Influence is more relevant to goal-oriented behaviours. Chae et al. (2002)
studied mobile information quality and found goal-oriented users more concerned about
content quality (credibility and objectivity) of information than are
experientially-directed users. Hence, two hypotheses are proposed:
H5e: User�s Motivation for Using MIES will moderate the hypothesized relationship
between Peer Influence and Perceived Playfulness
H5f: User�s Motivation for Using MIES will moderate the hypothesized relationship
between External Influence and Perceived Playfulness

82
3.4 Chapter Summary
In this chapter, a research model was developed based on research questions set out in
Chapter 2. Following that, a set of hypotheses were developed under each research
question. In the next chapter, the research methodology employed in this study will be
introduced which will contain a step by step research plan and the data analysis method
employed in this research.

Chapter 4: Methodology
83
4.1 Chapter Overview This chapter describes the research methodology used for this study to test the
hypotheses specified in Chapter 3. Research methodology refers to the overall approach
to the research process, from the theoretical underpinning of the research approach to
the collection and analysis of the data (Collis and Hussey, 2003). To start with, an
explanation of research design was provided in the beginning of this chapter, followed
by a brief description of data collection method and ethical considerations. The data
analysis employed in this study will also be discussed.

84
4.1.1 Chapter Outline
Figure 4-1 Chapter Outline
4.1 Chapter Overview 4.1.1 Chapter Outline
4.2 Research Approach 4.2.1 Sampling 4.2.2 Pilot Test of Questionnaire 4.2.2.1 Data collection method 4.2.2.2 Ethical Consideration in Data Collection
4.2.3 Measurement Items 4.2.3.1 Data Analysis Method
4.3 Structural Equation Modelling 4.3.1 Contrasting PLS and CBSEM
4.4 Detailed Discussion of Partial Least Square (PLS) Technique 4.4.1 Measurement Model 4.4.1.1 Individual Item Reliabilities 4.4.1.2 Convergent and Discriminant Validities
4.4.2 Testing Second Order Factors 4.4.3 Structural Model 4.4.3.1 Mediation test in PLS 4.4.3.2 Multi-group comparison
4.5 Consistency at Large
4.6 Chapter Summary

85
4.2 Research Approach The research will be carried out through a theoretical model and an empirical study. The
empirical study will involve questionnaires. This study aims to explore the antecedents
of Perceived Playfulness in the context of mobile information and entertainment
services (MIES). It explains the relationships among variables and constructs in a
theoretical model and examines the differences between two groups. Therefore, the
purpose of this research is hypothesis testing, based on our extensive knowledge of the
variables and their relationships in the theoretical model.
According to Cavana et al. (2001), there are three types of investigations: clarification,
correlational and causal. Although originally borrowed from Technology Acceptance
Model (TAM), little theory has been grounded in Perceived Playfulness in the context of
MIES. Therefore, the focus of this study will be identifying the antecedents of user�s
Perceived Playfulness toward MIES. This study is also cross-sectional in nature. It
means data is only gathered at one point in time (spanning one week). In such a study,
data is collected at a certain period of time from a selected sample to describe the large
population of interest. The unit of analysis is the major entity investigated in a study.
For the purpose of this study, this will be individual mobile phone user in New Zealand.

86
4.2.1 Sampling The sample consisted of university students in business school who attend information
system and business lectures at Auckland University of Technology. Past research has
shown that students are the most active mobile phone users3. Students attending six
undergraduate lectures, four MIS lectures and two business lectures were invited to
participate in this study. Only students attending these lectures were given a chance to
participate in the study. Due to time and budget constraints the use of a probability
sample was not attainable. An alternative approach suggested by Cavana et al. (2001) is
based on convenience and accessibility. However, the results obtained from this sample
will not be generalisable to the whole population.
4.2.2 Pilot Test of Questionnaire
All measurement items were developed based on a comprehensive review of the
literature as well as on expert opinion. One internal (Auckland University of
Technology) and one external academic staff (University of Auckland) were approached
for their expertise on questionnaire design. Each of the items on the questionnaire was
reviewed by the two staffs for its content, scope, and purpose (content validity).
Prior to administering the survey, a pilot test was conducted in a postgraduate class at
Auckland University of Technology to determine whether the instruments were
capturing the phenomena desired. This pilot test was conducted at end of October 2005.
One lecturer and eleven master students pre-tested the pilot questionnaire. Respondents
were asked to evaluate a version of the questionnaire item-by-item. After filling in the
pilot questionnaire the participants were invited to complete another feedback sheet as
3 http://www.mmetrics.com/press/PressRelease.aspx?article=20060306-games

87
well. All feedbacks were deemed useful for reconstruction of the actual questionnaire to
be used for data collection. Same flaws pointed out by several respondents were taken
note of. Specifically, the descriptive questions on the front page are proved to be
misleading and redundant. On the other hand, some respondents also get confused with
some items as to their relations to MIES services or technologies. Those pointless
questions are singled out and new areas of inquiry were also suggested by respondents.
Depending on participants� completion rate, the completion time has been changed from
15 minutes to 10 minutes. Through successive stages of theoretical specifications,
statistical testing and refinement, this is expected that the three validities (content
validity, construct validity and reliability) are met in this research (Straub, 1989).
4.2.2.1 Data collection method Data was collected via personally-administered questionnaires in class. According to
Cavana et al. (2001), the advantage of this method was that both the cost and required
time were low. The data collection was conducted in November 2005 at Auckland
University of Technology. Students from six classes were invited to do the questionnaire.
A total of 168 questionnaires were returned. Incomplete questionnaires were discarded,
leaving 149 usable responses.
4.2.2.2 Ethical Consideration in Data Collection The ethical guidelines published by Auckland University of Technology Ethics
Committee (AUTEC) were strictly adhered throughout the data collection process.
Ethical approval was granted by AUTEC on 24/12/2004 for a period of two years
(reference no 04/223).

88
4.2.3 Measurement Items
According to Cavan et al. (2001) the questionnaire is commonly used by researchers as
an effective hypothesis-testing method. In this study the questionnaire was used to
collect data for the same purpose (refer to Appendix 1). A brief introduction of the
purpose of the research and definitions of MIES were provided on the front page of the
questionnaire. The questionnaire focused on the task of mobile information and
entertainment services as this is the subject of the study. Confidentiality and anonymity
are clearly stated at the beginning of the questionnaire. Demographic questions are
placed at the end of questionnaire because it is better to keep respondents� minds on the
purpose of the questionnaire at the beginning (Sudman and Bradburn, 1982).
When structuring the questions, extra care has been taken to avoid the use of technical
jargon. Wording of the questions, scales being used and the general appearance of the
questionnaire were all carefully considered. Throughout the questionnaire, close-ended
questions were used to help the respondents make quick decisions when answering the
questionnaire (Cavana et al. 2001). Babbie (1990) suggested this type of question also
provides great uniformity thereby making data processing easier.
Given that Short Message Service (SMS) is so popular nowadays, it has been purposely
singled out from other mobile information and entertainment services to avoid excessive
responses focused on SMS only. Respondents were asked to state a specific mobile
information and entertainment service they have most recently used. When respondents
chose one of those �more advanced� MIES, they can answer the following questions
with this task in mind. Only if they have not used any of these �more advanced� MIES
will then be directed to the next question and asked if they have used SMS-based

89
services4. In this way, they can still carry on with the remaining questions if they have
used SMS-based services. This allows greater accuracy in answers given (Churchill,
1979).
In terms of measurement, all items were constructed as agree-disagree statements on a
seven-point Likert scale. Since the variables of interest have been previously validated
under different contexts, mirroring the same items in a new context is straightforward.
To ensure measurement reliability, items validated in previous research have been used.
The measures for Personal Innovativeness, Self Efficacy, Control, Focused Attention,
Perceived Usefulness, Feedback, Ease of Use, Speed, Content, Peer Influence, External
Influence, Perceived Technology Compatibility (Lu. June, email, July 20th, 2005) and
Perceived Playfulness were taken from or based on previous IS research (Table 4-1) and
were modified to suit the MIES context. Multiple items were used for each variable
whenever possible, and were grouped together on the questionnaire. Adopting the same
measures as others instead of creating new measures may enhance the comparability of
the paper with others, specifically when existing measures already become a field
standard (Churchill et al. 1999).
However, modifications to Variety and Experimentation have been made for this
particular study because the original instruments were too context-specific in previous
research (Webster and Ho, 1997; Webster et al. 1993). In addition, the measures for
Personalization were developed based on Ng-Krülle et al. (2004) and Venkatesh and
Ramesh (2002). Churchill et al. (1999) suggest if previous measures have obvious
deficiencies and are insufficient to address the interested underlying relationship
between constructs, creating a more meaningful and precise measure is necessary.
4 One of the currently most popular services accessed using SMS-based text messaging is mobile chat services (Nysveen et al. 2005a)

90
Finally, Autotelic Personality and Perceived Service Quality are multidimensional
constructs and cannot be directly measured. This will be discussed in a later section.
Variable Source Personal Innovativeness Agarwal and Prasad (1998) Self Efficacy Hung et al. (2003) Control Agarwal and Karahanna, 2000 Focused Attention Webster et al. (1993) Perceived Usefulness Koufaris (2002) Feedback Webster and Ho (1997) Variety Webster and Ho (1997); Chung and Tan (2004) Ease of Use Moon and Kim (2001) Speed Hung et al. (2003) Content Chae et al. (2002); Chung and Tan (2004) Experimentation Chung and Tan (2004); Webster et al. (1993) Personalization Ng-Krülle et al. (2004); Venkatesh and Ramesh (2002) Perceived Technology Compatibility Lu et al. (2003b) Peer Influence Hung et al. (2003) External Influence Hung et al. (2003) Perceived Playfulness Moon and Kim (2001)
Table 4-1 Research Variables and Measurements
4.2.3.1 Data Analysis Method The data analysis method employed in this study is a Structural Equation Modelling
(SEM) technique. SEM allows complicated relationships among variables to be
expressed through hierarchical or non-hierarchical, recursive or non-recursive structural
equations, allow a more complete picture of the research model to be shown (Gefen et al.
2000). Partial Least Squares (PLS), an alternative approach to SEM, will be used for
data analysis in this study. While several methods can be used to analyze the data, PLS
was chosen for two reasons. First, my model has formative constructs; PLS uses
components-based algorithms and can estimate formative constructs (Chin, 1998).
Second, PLS is more appropriate when the research model is in an early stage. A review
of the literature suggests that empirical tests of Perceived Playfulness and its
antecedents are still sparse. Hence, the use of PLS for this research is deemed
appropriate.

91
PLS places minimal demands on statistical requirements such have measurement scales,
sample size, and residual distributions. However, to assess the quality of data on hand,
normal probability plot and scatter plots will be used respectively to confirm the
normality of data distribution. Here, univariate analysis was performed for individual
metric variables (normality) and bivariate scatterplot of the variables of interest were
examined (linearity). Descriptive statistics were entered onto Excel sheet for the
purpose of analyzing demographic information, for example, respondents� background
information and their usage of MIES.
4.3 Structural Equation Modelling (SEM) Due to the proliferation of software packages to perform covariance-based (e.g.
LISREL and AMOS) and component-based (e.g., PLS-PC, PLS-Graph) analysis, an
increasing number of publications and submissions on IT/IS have employed SEM
techniques (Chin, 1998). The SEM techniques represent an integrative approach that
combines the perspective of two research streams: econometric perspective focusing on
prediction and psychometric perspective that emphasises model concepts using latent
variables (Diamantopoulos, 1994). The result after combining both perspectives is that
researchers are able to perform path analytic modelling with latent variables. SEM
provides the researcher with the flexibility to accommodate (1) complex interdependent
relationships, (2) latent variables that cannot be measured directly and (3) measurement
errors for observed variables. It also (4) statistically tests a priori substantive/theoretical
and measurement assumptions against empirical data (Chin and Newsted, 1999). Due to
its flexibilities, SEM has been termed the second generation analysis tool following first
generation analysis techniques such as multiple regressions (Hair et al. 1998).

92
Because SEM techniques has the abilities to model complex multiple interrelated
dependence relationships, causal relationships between indicators and constructs can be
best illustrated by path diagrams (Chin, 1998). A path diagram is a visual portrayal of
the predictive relationships among constructs as well as the correlations between
constructs and indicators. The three components in a path diagram include constructs,
variables and arrows. These components as shown in Table 4-2 depict the three primary
components in SEM: latent variables, indicators and path relationships.
Indicators (variables) Each indicator represents a particular question on the questionnaire. They are also called items or observed measures
Latent variables (construct)
These variables represent phenomena that can not be measured directly.
Path relationships (correlation)
Relationships among constructs and between constructs and indicators
Table 4-2 Three Main Components in Structure Equation Modeling
According to Gefen et al. (2000), the two most widely employed SEM techniques in IS
research are LISREL and PLS. However, they represent two distinct approaches to SEM:
covariance-based SEM (CBSEM) and component-based SEM respectively. In the next
section, these two SEM approaches will be compared to see which one is appropriate
for data analysis in this study.
4.3.1 Contrasting PLS and CBSEM According to Chin and Newsted (1999), PLS and CBSEM differ in nine aspects:
objective, approach, assumption, parameter estimates, latent variable scores, epistemic
relationship between a latent variable and its measures, implications, model complexity
and sample size.

93
Objective and Implications
The objective of PLS is prediction-oriented, whereas CBSEM pays more attention to
causal explanation. Over-reliance on overall model fit in CBSEM has been criticised by
for only focusing on significance instead of strength. PLS is optimal for prediction
purposes, whereas CBSEM is optimal for parameter accuracy. Chin (1998) warns that
closer attention should be paid to the predictiveness of a research model.
Approach and Assumption
CBSEM attempts to minimize the difference between sample covariances and those
predicted in the theoretical model. In contrast, PLS attempts to obtain the best weight
estimates for each block of indicators corresponding to each latent variable. In PLS, the
predictor specification only requires a linear relationship between dependent and
independent variables. Haenlein and Kaplan (2004) stated that this condition can be
considered as fulfilled in most cases. CBSEM places more stringent requirements on
statistical conditions. Typical CBSEM requires multivariate normal distribution and
independent observations to be met.
Latent variable scores and Parameter estimates
Latent variables can be directly measured in PLS. They are estimated as exact linear
combinations of its indicators. However, CBSEM requires indicators in reflective mode.
Thus latent variable scores are indeterminate. The determinate nature of the PLS
approach avoids parameter identification problems that can occur with CBSEM.
Identification problems imply zero covariances among some indicators or the existence
of equivalent models.
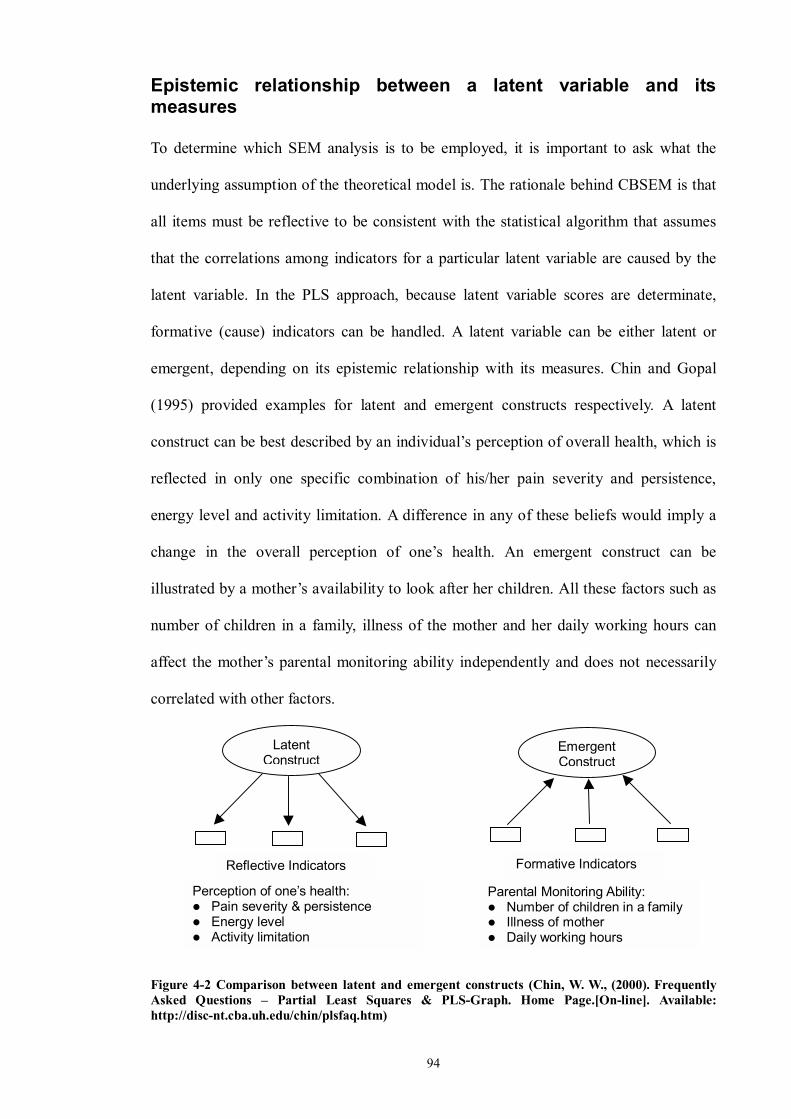
94
Epistemic relationship between a latent variable and its measures To determine which SEM analysis is to be employed, it is important to ask what the
underlying assumption of the theoretical model is. The rationale behind CBSEM is that
all items must be reflective to be consistent with the statistical algorithm that assumes
that the correlations among indicators for a particular latent variable are caused by the
latent variable. In the PLS approach, because latent variable scores are determinate,
formative (cause) indicators can be handled. A latent variable can be either latent or
emergent, depending on its epistemic relationship with its measures. Chin and Gopal
(1995) provided examples for latent and emergent constructs respectively. A latent
construct can be best described by an individual�s perception of overall health, which is
reflected in only one specific combination of his/her pain severity and persistence,
energy level and activity limitation. A difference in any of these beliefs would imply a
change in the overall perception of one�s health. An emergent construct can be
illustrated by a mother�s availability to look after her children. All these factors such as
number of children in a family, illness of the mother and her daily working hours can
affect the mother�s parental monitoring ability independently and does not necessarily
correlated with other factors.
Figure 4-2 Comparison between latent and emergent constructs (Chin, W. W., (2000). Frequently Asked Questions � Partial Least Squares & PLS-Graph. Home Page.[On-line]. Available: http://disc-nt.cba.uh.edu/chin/plsfaq.htm)
Emergent Construct
Perception of one�s health: ! Pain severity & persistence ! Energy level ! Activity limitation
Parental Monitoring Ability: ! Number of children in a family! Illness of mother ! Daily working hours
Reflective Indicators Formative Indicators
Latent Construct

95
Model complexities and Sample size
PLS is superior to CBSEM due to the inability of CBSEM to handle excessively large
numbers of indicators (Chin and Newsted, 1999; Haenlein and Kaplan, 2004). The
minimal recommendation for sample size in PLS ranges from 30 to 100 cases. It is
considered much smaller than those required in CBSEM where minimal
recommendation usually ranges from 200 to 800 cases. With regard to sample size in
PLS, Chin (1998) recommends the minimum sample size for a PLS analysis should be
the larger of (a) ten times the number of items for the most complex construct or (b) ten
times the largest number of independent variables impacting on a dependent variable.
As a result, PLS is preferred over CBSEM and deemed appropriate for this particular
study since: (1) our sample is convenience-based, it is likely the data is not normal and
sample size is small; (2) our theoretical model contains latent constructs that cannot be
directly measured and, (3) there are formative as well as reflective indicators in our
model. Table 4-3 provides a summary of their differences across these nine aspects:
Criterion PLS CBSEM Objective Prediction oriented Parameter oriented Approach Variance based Covariance based Assumptions Predictor Specification (non
parametric) Typically multivariate normal distribution and independent observations
Latent Variable Scores
Explicitly estimated Indeterminate
Parameter Estimates
Consistent as indicators and sample size increase (i.e. consistency at large)
Consistent
Epistemic relationship between a latent variable and its measures
Can be modelled in either formative or reflective mode
Typically only with reflective indicators
Implications Optimal for prediction accuracy Optimal for parameter accuracy Model Complexities
Large complexity (e.g. 100 constructs and 1000 indicators)
Small to moderate complexities (e.g. less than 100 indicators)
Sample Size Power analysis based on the portion of the model with the largest number of predictors. Minimal recommendations range
Ideally based on power analysis of specific model-minimal recommendations range from 200 to 800

96
from 30 to 100 cases Table 4-3 PLS vs. COSEM (Chin and Newsted, 1999. In Hoyle, R. (Ed.), Statistical Strategies for Small Sample Research, Sage Publications, pp. 307-341)
4.4 Detailed Discussions of Partial Least Squares PLS is a recent technique that generalizes and combines features from principal
component analysis and multiple regressions (Thompson et al. 1995). The PLS
approach provides a means for directly estimating latent variable component scores. The
procedure is partial in a least square sense because, given proxies or fixed estimates for
the other parameters; each step of the procedure minimizes a residual variance with
respect to a subset of the parameters being estimated. A latent variable component score
for each latent variable is created based on a weighted sum of their associated
indicators.
Chin (1998) stated all latent variable path models in PLS consist of three sets of
relations: inner model, outer model and the weight relations. The inner model depicts
the relationship among latent variables based on substantive theory, whereas the outer
model defines how each block of indicators relates to its latent variable. While these
two models provide the specifications followed in the PLS estimation algorithm, for
completeness, weight relations need to be defined.
According to Haenlein and Kaplan (2004), the most crucial part of PLS analysis is the
estimation of the weight relations. It starts with outside approximation then inside
approximation to determine weights repeatedly until convergence of the case values (i.e.
estimated values for each latent variable in each data set) is achieved. During each
iteration, the inner model estimates are used to obtain the outside approximation
weights, whereas the outer model estimates are used to obtain the inside approximation
weights.

97
There are three primary inside approximation weighting schemes available to use:
centroid weighting, factor weighting and path weighting. The purpose of these schemes
is to combine neighbouring latent variables to obtain an estimate for a specific latent
variable (Chin and Newsted, 1999). For the purposes of our study, the path-weighting
scheme is considered best in describing models with hypothesized causal relations. On
the other hand, if no propositions are made regarding the associations among the latent
variables, a factor weighting scheme would be the logical choice (Chin, 1998).
Partial Least Square is a technique comprised of measurement and structural models
(Gefen et al. 2000). The aim of testing the measurement model is to specify how the
latent variables are measured in terms of the observed variables, and how these are used
to describe the measurement properties (validity and reliability) of the observed
variables. The structural model investigates the strength and direction of the
relationships among theoretical latent variables.

98
4.4.1 Measurement Model It is important to ensure our measurement items are reliable and are measuring the
associated constructs. Therefore, individual item reliabilities, discriminant and
convergent validities, must be established. Researchers need to clearly separate
constructs from measures in order to properly test the nomological validity of both
(Hulland, 1999). A critical aspect is to assess whether the survey items represent the
underlying constructs they were developed to measure.
The measurement model attempts to represent the relationships between the latent and
observed variables. The latent variables are empirical measures of the constructs of the
proposed model. Neither can be measured directly but both can be measured by a set of
observable variables, namely, the scale items of questionnaires. The aim of testing the
measurement model is to specify how the latent variables are measured in terms of the
observed variables, and how these are used to describe the measurement properties
(validity and reliability) of the observed variables.

99
4.4.1.1 Individual item reliabilities Reliability is the assurance that the items posited to measure a construct are sufficiently
related to be reliably considered as a set of items reliably (Cronbach, 1951). Internal
consistency will be used to examine reliability through Internal Composite Reliability
(ICR) Scores in PLS. Chin (1998) suggests individual item loadings and internal
consistencies greater than 0.70 are considered adequate. For latent variables with
reflective indicators, it is appropriate to examine the loadings as they represent the
correlation between the indicators and component score. Any indicator with low loading
indicates it has little relationship with the latent variable component score in terms of
variance explained.
On the other hand, the interpretation of formative indicators should be based on weight,
as it provides information regarding the importance of each indicator in the formation of
the component. The difference between formative and reflective indicators is that with
formative indicators, omitting an indicator is omitting a part of the construct, whereas
reflective indicators are essentially interchangeable. Diamantopoulos and Winklhofer
(2001) stated the correlations among formative indicators are not characterized by
specific patterns of signs or magnitude. Therefore, examination of correlations or
internal consistency is inappropriate and illogical (Chin 1998). Inspecting loadings
(correlations) of formative constructs is inappropriate because the intraset correlations
were never considered in the estimation process (Chin, 1998).

100
4.4.1.2 Convergent and Discriminant Validities Convergent and discriminant validity are both considered subcategories of construct
validity. Construct validity assesses the extent to which a construct measures the
variable of interest. In other words, there should be high correlations between items of
the same construct to establish convergent validity, and low correlations between items
of different constructs to establish discriminant validity.
Average Variance Extracted (AVE) can be used to gauge the percentage of explained
variance by indicators relative to measurement errors. To establish convergent validity,
AVE should be greater than 0.5 as suggested by Chin (1998). On the other hand, the
square root of AVE should be greater than the corresponding correlations among latent
variables (Chin, 1998).
In addition, Diamantopoulos and Winklhofer (2001) suggest that a feasible approach to
validation of a formative measurement model is to focus on nomological aspects, which
involves linking it to other constructs with which it would be expected to be linked (i.e.
antecedents and/or consequences). The sign and magnitude represents the theoretical
relationship between these two constructs. This will be examined when analyzing the
structural model.

101
4.4.2 Testing Second Order Factors Second order factors represent higher order factors that cannot be directly measured.
However, these factors can be approximated using various procedures. In our study, the
two second order factors proposed in the research model are Autotelic Personality and
Perceived Service Quality. Chin (2000) suggests the method of repeated indicators is
the easiest to implement. Essentially, higher order constructs can be measured by using
all items of its lower order constructs. Experience with second-order latent variables
suggests their reliabilities can be low (e.g., Rindskopf and Rose, 1988).
To test the existence of second order factors, the following steps recommended by
Pavlou and El Sawy (2005) will be followed:
! First, correlations among the first order factors are examined. High correlations
suggest that the first-order factors may belong to the same set. However, for
formative indicators, first order factors need not be correlated.
! Second, correlations between the lower and higher order factors are examined. For
reflective indicators, these paths should be above 0.70 to achieve an adequate model.
However, for formative factors these correlations may be lower since the first order
factors do not necessarily move in the same direction.
! Finally, using a mediation test in PLS, this study tests whether the second order
factor fully mediates the impact of the underlying factors. This step ensures the
second order factor is a more parsimonious representation of the first order factors
and that it fully mediates their predictive power on the dependent variable

102
(Perceived Playfulness) it is theorized to predict.
Doll et al. (1994) suggest for second or higher order factors, the proportion of variance
(i.e. R-square) in the latent variables that is accounted for by the higher order construct
influencing them can be used to estimate the reliabilities of the latent factors.
Furthermore, the standard structural coefficients of factors on higher order constructs
can be used as estimates of the validity of the factors. It is important to acknowledge the
use of higher order factors is merely trying to explain the covariation among the first
order factors in a more parsimonious way. Note that the above discussion in Doll et al.
(1994) applies to the reflective model only. For second order factor in formative mode,
the general approach is to compare the weights of different indicators (Sambamurthy
and Chin, 1994).
4.4.3 Structural Model The structural model investigates the strength and direction of the relationships among
theoretical latent factors. The structural model and hypotheses are tested by examining
the path coefficients (which are standardized betas β). In addition to the individual path
tests, the explained variance (R-squares) in the dependent factors is assessed as an
indication of the overall predictive strength of the model. Re-sampling procedures
(Bootstrap) will be used to examine the stability of estimates. Re-samples of 200 will be
used as recommended by Chin (2001).
PLS does not generate a single goodness of fit metric for the entire model. Chin (2000)
raised concerns about two issues when considering model fit in PLS analyses. First, the
existing goodness of fit measures is related to the ability of the model to account for the

103
sample covariances and therefore assumes that all measures are reflective. Therefore, fit
indices dealing with explaining covariation among measures cannot be used if the
constructs are not being modeled as reflective. Second, fit measures only relate to how
well the parameter estimates are able to match the sample covariances. They do not
relate to how well the latent variables or item measures are predicted. Therefore, models
with low R-square and/or low factor loadings can still yield excellent goodness of fit.
As a result, indices commonly available in CBSEM tools for goodness-of-fit are not
included in PLS to avoid confusion (Chin, 2000). The key approach is to demonstrate
strong loadings, significant weights, high R-squares and substantial/significant
structural paths (Chin, 1998).
4.4.3.1 Mediation Test in PLS Based on my hypothesis, Perceived Technology Compatibility was proposed as a
mediator between Perceived Service Quality and Perceived Playfulness. The mediation
test in PLS is relatively naïve and few researchers have incorporated this in their
research model (Pavlou and El Sawy, 2005; Pavlou and Fygenson, 2006). Nevertheless,
since PLS is a derivation of regression techniques, the rules of conducting a mediation
test in regression analysis can be followed. It has been found that the approach
suggested by Baron and Kenny (1986) is particularly useful and the study of Hackbarth
et al. (2003) proved a good example.
Essentially, a variable functions as a mediator when (1) variations in levels of the
independent variable significantly account for variations in the presumed mediator (i.e.
Perceived Service Quality��Perceived Technology Compatibility); (2) when variations

104
in the mediator significantly account for variations in the dependent variable (i.e.
Perceived Technology Compatibility��Perceived Playfulness) and, (3) when (1) and (2)
are controlled, a previously significant relation between the independent and dependent
variables is no longer significant. This test will be carried out in our data analysis.
4.4.3.2 Multi-group Comparison One of the goals in this study is to compare users with different motivations for using
MIES. The full sample is split into two sub-samples based on their motivations
(goal-oriented or experientially-directed). Path coefficients must be tested to see if there
exists any significant difference. In this study the multi-group comparison
recommended by Chin (2000) will be followed. Essentially, this involves running
bootstrap re-samplings for each sub-sample and treating the standard error estimates
from each re-sampling in a parametric sense via t-tests. The pooled estimator will then
need to be calculated for the variance. The t-values can be obtained by subtracting the
paths for the two samples and dividing their difference by pooled estimator for the
variance (Sp)* Square root of (1/m + 1/n)5. The degree of freedom is (m+n-2) where m
and n represent sample size of the two sub-groups.
5 Sp =Square root of {[square of (m-1)/(m+n-2)]*square of SE for sample1 + [square of (n-1)/(m+n-2)]*square of SE for sample2}

105
4.5 Consistency at Large Because case values for the latent variables in PLS are aggregates of other latent
variables containing measurement errors, they must be considered inconsistent
(Haenlein and Kaplan, 2004). Therefore, the path estimates in PLS can only converge
when both sample size and the number of indicators of each latent variable increase to
infinite�a problem known as consistency at large. On the other hand, this problem
would no longer be an issue if sufficiently large numbers of indicators are presented in
the model, because the choice of weight ceases to have any influence on the parameters
of the path model (Haenlein and Kaplan, 2004).
4.6 Chapter Summary
This chapter discusses the research methodology employed in this study to test those
hypotheses in Chapter 3. Details of research methodology such as research design,
sampling choice and questionnaire design, data collection process, ethical consideration ,
pilot testing of the questionnaire and data analysis method were discussed in detail. In
the next chapter the results of data analysis will be presented. Specifically, PLS-GRAPH
(Version 3.0 build 1126 of 2003) developed by Chin (2001) will be used for the purpose
of data analysis.

Chapter 5: Data Analysis
106
5.1 Chapter Overview This chapter tests the specified hypotheses and answers research questions using the
research methodology in Chapter 4. A summary of respondent backgrounds will be
presented followed by the results of data analysis. The results will be presented in terms
of the measurement model and then the structural model as commonly seen in SEM
studies. The study is focused on mobile information and entertainment services in the
New Zealand context. Specifically, an antecedent model of Perceived Playfulness built
on Chung and Tan (2004) will be assessed in this study. The mediating role of
Perceived Technology Compatibility and the moderating effect of Motivation for Using
will also be examined.

107
5.1.1 Chapter Outline
Figure 5-1 Chapter Outline
5.1 Chapter overview 5.1.1 Chapter Outline
5.2 Demographic Information of Respondents
5.3 Normality and Linearity of Data
5.5 Data Analysis of Proposed Research Model 5.5.1 Measurement Validation 5.5.1.1 Individual item reliabilities 5.5.1.2 Convergent Validity 5.5.1.3 Discriminant Validity
5.5.2 Revised Measurement Model
5.6 Testing Second Order Factors 5.6.1 Autotelic Personality 5.6.2 Perceived Service Quality
5.7 Structural Model 5.7.1 Variance Explained in Dependent Variables 5.7.1.1 Significance Test�Bootstrapping
5.7.2 Standardized Path Coefficients 5.7.3 The Mediating Role of Perceived Technology Compatibility
5.8 Examine the Moderating Effects of Motivation for Using (MIES)
5.9 Chapter Summary
5.4 Terminologies Used in This Chapter

108
5.2 Demographic Information of Respondents Questionnaires were administered to students undertaking undergraduate studies at
Auckland University of Technology. In total, 189 questionnaires were handed out to
participants in six classes and 168 questionnaires were returned. The returned
questionnaires were then screened for usability and reliability and 149 were found to be
complete and usable, rendering a response rate of 79%. This sample size is deemed
satisfactory in social sciences research (Pinsonneault and Kraemer, 1993) and meets the
requirement of PLS. Table 5-1 provides demographic information of respondents.
In terms of phone categories, about 60% of all the respondents specified they have
WAP-enabled mobile phone or GPRS phone. Respondents holding a 3G mobile phone
came second in the list, with a significant proportion of 12% among the respondents. 3G
phones represent an important driver for mobile phone users to adopt MIES. Users of
the CDMA mobile phone are relatively few, only 7% compared to other phone
categories. At the same time, 21% of all the respondents are not sure about the phones
they are using. When asked whether their phone provides a feature with which to access
MIES services, 83% of the respondents answered �Yes� to this question. This indicates
the wide availability of mobile internet capable phones in the New Zealand market.

109
Frequency Percent (%) Cumulative (%)
Gender Male 99 66.4 66.4 Female 50 33.6 100
Age 20 or less 45 30.2 30.2 21-30 90 60.4 90.6 31-40 10 6.7 97.3 41-50 3 2.0 99.3 51 or above 1 0.7 100
Highest education Primary school 4 2.7 2.7 Secondary school 32 21.4 24.1 Undergraduate degree 108 72.5 96.6 Postgraduate degree 5 3.4 100
Computer experience (years) 1 or less 12 8 8 2-3 22 15 23 4-5 33 22 45 6-7 35 23 68 8 or above 47 32 100
Average time of using MIES per week None 16 11 11 1 or less 57 38 49 2-4 50 34 83 5-7 11 7 90 8 or above 15 10 100
Average time of using MIES per day Never/almost none 42 29 29 Less than 1/2 hour 61 41 70 1/2~1 hour 33 22 92 1~2 hours 9 6 98 2~3 hours 2 1 99 More than 3 hours 2 1 100
Ethnic origin NZ European 28 19 19 NZ Maori 5 3 22 European 9 6 28 Asian 83 56 84 Indian 12 8 92 Other 12 8 100
Table 5-1 Demographic Information of Respondents

110
The descriptive statistics also provide usage of various MIES in New Zealand. Five
most popular MIES were provided for selection: mobile email, MMS, information
services, download and SMS-based services6. MMS is the most popular among all
MIES services with a total of 38% population rate; twenty-six percent of respondents
followed by MMS chose SMS-related services as their most recently used MIES service.
According to IDC New Zealand (2004), the average number of SMS messages sent per
day in New Zealand during 2003 was 3.6 million and this is expected to rise to 13.8
million by 2008. The numbers of people using mobile email, information searching and
mobile downloading are 9%, 10% and 17% respectively. Table 5-2 provides the relative
proportion of MIES usage among mobile phone users in New Zealand.
MIES Category Frequency Percent (%) Mobile Email 14 9 MMS 57 38 Information searching 15 10 Downloading 25 17 SMS-based services 38 26
Table 5-2 Usage of MIES in New Zealand
6 SMS bases services include ringtones, subscription-based information alerts, send/receiving text messages and SMS-based m-commerce (http://web.dis.unimelb.edu.au/pgrad/yanssy1/)

111
5.3 Normality and Linearity of Data To assess the quality of data on hand, normal probability plot was used to confirm the
normality of data distribution. Univariate analysis was performed for individual metric
variables. The results indicate the combinations of all paired variables were normally
distributed. Scatter plots of paired variables did not show significant non-linearity.
Results are shown in Appendix 2. Since PLS is robust with non-normality of data, this
small statistical inadequacy is not of concern in this study.
5.4 Terminologies Used in This Chapter To ease the interpretation of data analysis, the following terminologies in Table 5-3 will
be used throughout this chapter.
Personal Innovativeness PerInnov Self Efficacy SE Control Ctrl Focused Attention FoA Perceived Usefulness PU Personalization Pson Variety Var Content Contnt Experimentation Expt Feedback Febak Perceived Ease of Use PEOU Speed Spd Perceived Technology Compatibility PTC Peer Influence PeerInf External Influence ExtInf Perceived Playfulness PP Table 5-3 Terminologies Used in Chapter 5

112
5.5 Data Analysis of Proposed Research Model Data collected from the complete questionnaire was entered onto a plain ASCII file and
saved as raw data file for PLS-GRAPH program. Most of the questions were based on a
7-point Likert scale, so the numbers entered by the respondents were entered as their
response to that question. Some of the questions were reverse-coded. These include the
first two questionnaire items for Focused Attention (FoA1 and FoA2), the second
questionnaire item for Control (Ctrl2), and the first, second and last questionnaire item
for Perceived Technology Compatibility (PTC1, PTC2 and PTC10).
The analysis of PLS statistics is often carried out at two levels: measurement model and
structural model. At the first level, measurement items (indicators) used for each latent
variable were estimated in terms of item loadings, internal consistency and convergent
and discriminant validities (AVE analysis). The second level is the structural level,
where path estimates and explained variances (R-squares) will be inspected.
Implications of all these measures have been discussed in sections 4.4.1 and 4.4.3.

113
5.5.1 Measurement Validation In this section, individual items reliabilities will be inspected first. Two validities need
to be captured in the measurement model: convergent validity and discriminant validity.
Essentially, they estimate how well the measurement items relate to the constructs. PLS
performs confirmatory factor analysis to establish factorial validity regarding these two
validities (Gefen and Straub, 2005). The two second-order factors (Autotelic Personality
and Perceived Service Quality) are higher order factors and their validities will be
examined separately from other latent variables.
5.5.1.1 Individual item reliabilities To measure internal consistency of a given block of indicators, internal composite
reliability (ICR) scores were obtained through PLS-GRAPH to assess the reliabilities of
each latent variable. Where the internal consistency of any latent variable exceeds 0.70,
this indicates tolerable reliability (Fornell and Larcker, 1981). All latent variables in the
model have internal consistencies greater than 0.7 as shown in Table 5-4. This indicates
all constructs have high reliabilities.
Latent variables ICR Latent variables ICR
Personal Innovativeness 0.896 Experimentation 0.931 Self Efficacy 0.953 Feedback 0.942 Control 0.864 Perceived Ease of Use 0.941 Focused Attention 0.751 Speed 1.000 Perceived Usefulness 0.934 Perceived Technology
Compatibility 0.839
Personalization 0.874 Peer Influence 0.925 Variety 0.939 External Influence 0.909 Content 0.853 Perceived Playfulness 0.808 Table 5-4 Internal Composite Reliability for Latent Variables

114
5.5.1.2 Convergent Validity Reliability tests look only at the items in the scale and do not compare across constructs.
In convergent validity, this test involves a comparison with other variables. There
should be high correlations between items of the same construct to establish convergent
validity. To test convergent validity of the measures associated with each construct, the
loadings and cross loadings of each indicator on the latent variables must also be
examined. This is shown in table 5-6. Convergent validity is shown when the t-values of
these loadings are above 1.96 (Gefen and Straub, 2005). AVE can also be used to
measure the amount of variance that a latent variable component captures from its
indicators. Fornell and Larcker (1981) suggest AVE should be greater than 0.5 to
account for 50% or more variance of indicators. Table 5-5 lists the AVEs for all latent
variables:
Latent variables AVE Latent variables AVE
Personal Innovativeness 0.683 Experimentation 0.870 Self Efficacy 0.870 Feedback 0.890 Control 0.679 Perceived Ease of Use 0.799 Focused Attention 0.520 Speed 1.000 Perceived Usefulness 0.741 Perceived Technology
Compatibility 0.401
Personalization 0.698 Peer Influence 0.804 Variety 0.886 External Influence 0.769 Content 0.743 Perceived Playfulness 0.452 Table 5-5 AVEs for latent constructs in Research Model
The results in Table 5-6 show almost all measurement items exhibit very high
convergent validity on their measured latent variables. However, it has been noticed that
the first measure of Focused Attention (FoA1), the second measure of Perceived
Playfulness (PP2) and the three measures of Perceived Technology Compatibility
(PTC1, 2 and 10) have very low loadings.

11
5
Ta
ble
5-6
Loa
ding
s and
cro
ss-lo
adin
gs o
f ind
icat
ors (
grey
are
as in
dica
te g
roup
of i
ndic
ator
s use
d fo
r m
easu
ring
eac
h la
tent
var
iabl
e)

11
6
Ta
ble
5-6
Loa
ding
s and
cro
ss-lo
adin
gs o
f ind
icat
ors (
cont
inue
d)

117
5.5.1.3 Discriminant Validity The way to establish discriminant validity is to examine the square root of the AVE of
each construct to the correlations of this construct to all other constructs. In the
PLS-GRAPH, the AVEs can be easily obtained by performing a bootstrap re-sampling.
Fornell and Larcker (1981) suggest that the square root of AVE should be greater than
the corresponding correlations among the latent variables. The results shown in Table
5-7 demonstrate all latent variables exhibit high discriminant validities. The diagonal
cells in the correlation matrix are the square root value of AVE for each latent variable.
5.5.2 Revised Measurement Model So far the data obtained were tested for reliability and validity using PLS-GRAPH. A
total of 56 items were used describing the seventeen latent variables (not including
second order factors) in the research model. The initial test of the measurement model
using confirmatory factor analysis indicated that some construct revisions were needed.
The loadings and cross-loadings of some indicators in Table 5-6 showed relatively low
correlations on the latent constructs they were meant to describe. Essentially, this result
presents a need to re-specify the instruments. The approach described in Churchill
(1979) is to purify the measures. Items that do not share equally in the common core
should be eliminated. As suggested by Straub et al. (2004), this approach can be applied
to PCA, PLS and covariance-based SEM. Chin and Marcolin (1995) also provide a
reasonable discussion of this in their paper.

11
8
Dis
crim
inan
t Val
idity
of L
aten
t Var
iabl
es
Pe
rInno
v SE
C
trl
FoA
PU
Pson
Va
r C
ontn
tEx
pt
Feba
k PE
OU
Sp
d PT
C
Peer
Inf
ExtIn
f PP
Pe
rInno
v0.
826
SE
0.
480
0.93
2
C
trl
0.46
2 0.
492
0.82
4
FoA
0.23
4 0.
064
0.39
10.
720
PU
0.33
8 0.
209
0.50
40.
326
0.86
0
Pson
0.
375
0.20
7 0.
405
0.31
80.
604
0.83
5
Va
r 0.
423
0.45
9 0.
377
0.24
30.
301
0.36
80.
941
C
ontn
t 0.
261
0.38
0 0.
406
0.15
10.
425
0.45
90.
291
0.86
1
Ex
pt
0.41
4 0.
387
0.37
60.
284
0.32
30.
401
0.46
10.
086
0.93
3
Feba
k 0.
447
0.36
3 0.
487
0.37
10.
503
0.56
50.
370
0.26
6 0.
280
0.94
3
PE
OU
0.
538
0.79
4 0.
711
0.25
50.
363
0.31
50.
479
0.43
1 0.
376
0.42
8 0.
894
Sp
d 0.
120
-0.0
93 0
.149
0.15
70.
305
0.47
10.
202
0.26
1 0.
054
0.35
2 -0
.018
1.
000
PTC
0.
391
0.49
5 0.
443
0.16
60.
444
0.51
80.
470
0.58
6 0.
363
0.42
0 0.
548
0.22
80.
633
Pe
erIn
f 0.
349
0.28
3 0.
469
0.22
50.
556
0.53
30.
388
0.41
7 0.
457
0.37
5 0.
417
0.15
20.
543
0.89
7
Ex
tInf
0.39
5 0.
091
0.40
80.
337
0.46
90.
532
0.24
40.
238
0.34
5 0.
504
0.29
5 0.
343
0.26
30.
418
0.87
7
PP
0.45
1 0.
525
0.54
80.
304
0.51
80.
579
0.37
80.
569
0.44
4 0.
469
0.58
2 0.
134
0.65
10.
573
0.45
7 0.
672
The
diag
onal
ele
men
ts in
bol
d (th
e sq
uare
roo
t of
aver
age
varia
nce
extra
cted
) sh
ould
exc
eed
the
inte
r-co
nstru
ct c
orre
latio
ns b
elow
and
acr
oss
them
to a
chie
ve
adeq
uate
dis
crim
inat
e va
lidity
.
Tab
le 5
-7 C
orre
latio
n m
atri
x an
d A
vera
ge V
aria
nce
Ext
ract
ed fo
r La
tent
Var
iabl
es

119
The initial measurement validation shows that Focused Attention, Perceived Technology
Compatibility and Perceived Playfulness have some insignificant indicators (low
t-statistics). The indicators correlate poorly with other peer indicators that measure the
same latent constructs. These include FoA1, PTC1, PTC2, PTC10, and PP2. Their low
loadings on measured latent variables have also been noticed.
Speed was retained in our model even though it has only one indicator. Hair et al. (1998)
stated reliability cannot be empirically estimated for construct with a single item
measure. They continued by suggesting if this construct has been used extensively its
reliability can be assured. Since this instrument is borrowed from Hung et al. (2003) and
has been validated in a similar context, its reliability is known before use. As a result,
FoA1, PTC1, PTC2, PTC10 and PP2 will be eliminated in the revised model. Compared
to the original measurement items, the great majority of items are still retained. Doll and
Xia (1997) stated that measurement models can vary across samples and research
contexts.

120
5.6 Testing Second Order Factors The two second order factors proposed in my research model are Autotelic Personality
and Perceived Service Quality. The difference between them is that Autotelic
Personality is reflective in nature and Perceived Service Quality is a formative construct
(see 3.3.1 and 3.3.2). Each of them will be tested respectively in this section.
5.6.1 Autotelic Personality When testing second order constructs, they need to be assessed at two different levels.
As suggested by Chin (1998), the first step is to reapply the formative/reflective
question at the higher order level. Analogous to the situation with formative indicators,
a second order model being caused by first order factors cannot be analyzed by SEM
techniques. The percentage of the paths should be at 0.70 or above to establish the
convergent validities of the first order factors. The steps suggested by Chin (1998) and
Pavlou and El Sawy (2005) are used to test the existence of second order factors here
(Section 4.4.2).
First, the correlations among first order factors were tested. The results indicate they are
significantly correlated at the 0.01 level (0.48~0.50). A reflective model would assume
that the first and second order constructs are extremely highly correlated (Chin, 1998).
As shown in Fig 5-2, the correlations between Personal Innovativeness, Self Efficacy,
Control and Autotelic Personality are highly correlated because the 0.70 threshold has
been met. Since a reflective model would assume the first and second constructs are
extremely highly correlated, a formative model seems less likely for Autotelic
Personality. The low loading from Autotelic Personality on Focused Attention (after
measurement revision) casts further doubt on its role in reflecting Autotelic Personality.

121
Figure 5-2 The second order reflective model of Autotelic Personality
Next, a mediation test was performed to see if the second order construct fully mediates
the relationship between the first order factors and the theorized dependent variable
(Chin, 1998). Fig 5-3(a) shows the impact of each first order factor on Perceived
Playfulness individually. Personal Innovativeness, Self Efficacy, Control and Focused
Attention were all showing significant effects on Perceived Playfulness at the 0.01 level.
Figure 5-3 The mediation effect of Autotelic Personality (PI: Personal Innovativeness SE: Self Efficacy Ctl: Control FA: Focused Attention)
In Fig 5-3(b), Autotelic Personality is used as a more parsimonious second order factor
and it shows significant correlation with all first order factors. As a surrogate of its first
order factors, Autotelic Personality strongly influences Perceived Playfulness and is
highly significant (β=0.647, t=11.2900). This aggregate measure is the only significant
First order factors of AP
Perceived Playfulness
First order factors of AP
Perceived Playfulness
Autotelic Personality
0.4960.5700.5610.417
0.8200.7970.7920.395
(a)
(b)
-0.405-0.141-0/015-0.122
0.657
PI SECtlFA
PI SECtlFA
PI SECtlFA
Autotelic Personality
Self Efficacy
Focused Attention
Personal Innovativeness Control
0.797*** 0.398*** 0.820*** 0.792***
*** Significant at p<.01

122
predictor of Perceived Playfulness when all first order factors are controlled for. This is
indicated by the weak correlation (dotted line) between first order factors and Perceived
Playfulness in the presence of Autotelic Personality.
For observed variables, Table 5-8 shows item loadings and their corresponding t-values.
Item loading with a t-value above 2.0 is considered significant (Doll et al. 1994). All
items have large and significant loadings on their corresponding factors indicating
evidence of good construct validities (Doll et al. 1994). For the latent variables, Table
5-8 presents the standard structure coefficients and their corresponding t-values and
R-Square values. With t-values above 2.0 being considered significant, all factors
except Focused Attention have large and significant structural coefficients, indicating
good construct validity. The R-square values showing three of the four first order
factors (Personal Innovativeness, Self Efficacy and Control) can be reliably explained
by Autotelic Personality.
Observed Variables (PI, SE, Ctrl & FoA) Latent Variables (Autotelic Personality) Item Item loading t-statistics Factor Std Structure
Coefficient R-Square (Reliability)
PerInnov1 0.7744 16.3283 PerInnov2 0.8685 39.6413 PerInnov3 0.8166 28.0138 PerInnov4 0.8469 22.1562
Personal Innovativeness
0.820 (23.41) 0.672
SE1 0.9354 72.7521 SE2 0.9073 27.8973 SE3 0.9603 91.6832
Self Efficacy 0.797 (15.64) 0.636
Ctrl1 0.8370 31.1400 Ctrl2 0.7903 22.3422 Ctrl3 0.8157 20.3454
Control 0.792 (20.47) 0.627
FoA2 0.6491 1.9574 FoA3 0.9623 3.7664
Focused Attention
0.398 (2.90) 0.158
Table 5-8 Validities and t-values for Autotelic Personality (4 first order factors, 1 second order factor)

123
5.6.2 Perceived Service Quality The test of Perceived Service Quality was carried out with the same set of tests in Chin
(1998) and Pavlou and El Sawy (2005). Since Perceived Service Quality is formative in
nature, each first order factor represents an aspect of Perceived Service Quality.
Therefore, low correlations among first order factors are expected (Gefen et al. 2000).
The correlations between those first order factors and Perceived Service Quality were
tested. The results shown in Fig 5-4 indicate all first order factors are highly correlated
with Perceived Service Quality (p<0.01). The formative role of the eight first order
factors on Perceived Service Quality is s significant at the 0.01 level. For formative
model, Chin and Gopal (1995) suggest the relative weight of each first order factor
indicate their relative importance toward the higher order construct (Perceived Service
Quality).
Figure 5-4 The second order formative nature of Perceived Service Quality
Next, a test was conducted to see whether Perceived Service Quality fully mediates the
link between those first order factors and Perceived Playfulness. This is confirmed by
the highly significant path coefficient of Perceived Service Quality on dependent
Perceived Service Quality
Perceived Usefulness
*** Significant at p<.01
Perceived Ease of
Use
Content Variety Feedback Speed Experimentati
Personalization
0.339*** 0.307***0.127***
0.137*** 0.150*** 0.038*** 0.127*** 0.204***

124
variable (β=0.679, t=12.0473) and the fact that Perceived Service Quality is the only
significant predictor when all other first order factors are controlled for. The impact of
each individual first order factor on Perceived Playfulness becomes insignificant in the
presence of Perceived Service Quality. To assess its external validity, we need to look at
the structural model which is discussed in next section.

125
5.7 Structural Model The structural model depicts the sets of dependence relationships linking the
hypothesized model�s constructs. For clear exposition, the item loadings/weights of
each construct will not be shown since most of them met the recommended level in
Chin (1998). Re-sampling procedure will be used to assess the stability of estimates7.
The results shown in Fig 5-5 include latent variables, standardized path coefficients and
R-square values for dependent variables.
Figure 5-5 Results of Data Analysis
7 In PLS-GRAPH, formative higher order factor will have a R-square of 1.000.�Chin, W. W. (2000).
* Significant at p<.10 ** Significant at p<.05
*** Significant at p<.01

126
5.7.1 Variance Explained in Dependent Variables In assessing the structural model, R-square is used to measure the amount of variance
explained in the latent variable. They can be interpreted like R-square in a regression
analysis sense (Chin, 1998). The two dependent variables in the research model are
Perceived Technology Compatibility and Perceived Playfulness. Table 5-9 shows their
R-squares are 0.462 and 0.576 respectively. This indicates approximately 46% of the
variance for Perceived Technology Compatibility is accounted for by other variables in
the model. For Perceived Playfulness, 58% of the variance is explained by the
associated independent variables. In general, low R2 values are common in behavioral
science research and many TAM-based investigations report low R2 (Moon and Kim,
2001).
Perceived Technology Compatibility Perceived Playfulness R-square 0.462 0.576
Table 5-9 R-squares for dependent variables
5.7.1.1 Significance Test � Bootstrapping It is important to note that this study used the method of bootstrapping (N=200) to
generate t-statistics for testing the significance levels of indicators� loadings/weights on
their measured latent variables and standardized path estimates. The reason for using
bootstrap is because it also generates the AVEs in the latest version of PLS-GRAPH
(Gefen and Straub, 2005). During the process of Bootstrapping, N samples sets are
created in order to obtain N (200) estimates for each parameter in the PLS model. Each
sample is obtained by sampling with a replacement form the original data set (Chin,
1998).
127
5.7.2 Standardized Path Coefficients
The interpretation for standardized path estimates is identical to that of traditional
regression. All the path coefficients between the research constructs are expressed in a
standardized form to allow comparison of their relative strengths. To validate the
research model and proposed hypotheses, the path coefficients between each construct
needs to be statistically significant.
The results of the structural model in Fig 5-5 provide supports for most of the
hypotheses. Hypothesis 1 states that Autotelic Personality is positively related to
Perceived Playfulness. With a path coefficient of 0.245 the impact of Autotelic
Personality on Perceived Playfulness is significant at the 0.1 level (t=1.7055). In
contrast, Perceived Service Quality does not have a significant direct impact on
Perceived Playfulness (t=0.1177). However, this outcome was expected because its
influence on Perceived Playfulness is mediated by Perceived Technology Compatibility.
This will be further discussed in section 5.7.3.
Perceived Service Quality has a considerable impact on Perceived Technology
Compatibility with a path coefficient of 0.679 (t=11.5881). Perceived Technology
Compatibility is predicted by Perceived Service Quality (R²=0.46). Perceived
Playfulness is influenced by Perceived Technology Compatibility with a path coefficient
of 0.239, significant at the 0.01 level (t=2.6170).The strong effects of Perceived
Usefulness (β=0.339) and Perceived Ease of Use (β=0.307) on Perceived Service
Quality implicitly suggest their important roles in contributing to the formation of
Perceived Playfulness. This finding is consistent with other researchers� findings
(Bruner and Kumar, 2005; Moon and Kim, 2001; Davis et al. 1992; Fang et al. 2006).

128
Perceived Service Quality is also significantly affected by Experimentation, Variety,
Feedback, Content and Speed. Nevertheless, their impacts on Perceived Service Quality
are not as strong as Perceived Usefulness and Ease of Use, ranging from 0.038 to 0.150.
While their importance in similar technology contexts has been attested (Webster et al.
1993; Webster and Ho, 1997), this study provides further evidence of their importance
in the context of MIES.
A new construct proposed in addition to the original Chung and Tan (2004) is
Personalization; it has a moderate effect of 0.204 on Perceived Service Quality. The
importance of Personalization has been stressed in the service sector (Mittal and Lassar,
1996). Many mobile commerce-related studies have stressed the importance of
Personalization (Pagani, 2004; Schubert and Ginsburg, 2000). The current study
empirically tested this factor in the context of MIES.
Social Influence in this study is comprised of Peer Influence and External Influence. It
has been found that External Influence affects Perceived Playfulness significantly at the
0.05 level (t=2.1940). However, there is no significant evidence to back up the effect of
Peer Influence on Perceived Playfulness.

129
5.7.3 The Mediating Role of Perceived Technology Compatibility To validate the key mediating role of Perceived Technology Compatibility, three
competing models were compared. The mediation test strictly followed the guidelines
provided in Baron and Kenny (1986). In Fig 5-6(a), a strong and positive impact of
Perceived Service Quality on Perceived Playfulness was shown (β=0.716; t=16.7859).
In terms of variance explained, Perceived Playfulness is predicted by Perceived Service
Quality (R²=0.513). This provides support for Hypothesis 2.
Next, Perceived Technology Compatibility was introduced as a mediating factor
between Perceived Service Quality and Perceived Playfulness. As Fig 5-6(b) attests, the
second model mediated by Perceived Technology Compatibility is superior to the first
model in terms of variance explained. The �Perceived Technology Compatibility
model� has a R² value of 0.530 which is slightly better than the first model. Also, a
significant decrease in magnitude from Perceived Service Quality to Perceived
Playfulness has been noticed.
Figure 5-6 The Mediating Role of Perceived Technology Compatibility
Perceived Service Quality
Perceived Playfulness
Perceived Service Quality
Perceived Playfulness
PerceivedTechnology
Compatibilities
.513
.530
0.716***
0.184***
0.688*** 0.228*** * Significant at p<.10
** Significant at p<.05*** Significant at p<.01.474
(b)
(a)

130
To further test the significance of Perceived Technology Compatibility, I examined its
mediating effect between Perceived Service Quality and Perceived Playfulness in a
nomological network. This is shown in Fig 5-7. The direct impact of Perceived Service
Quality on Perceived Playfulness is no longer significant in the presence of Perceived
Technology Compatibility (β=0.186; t=1.0157). This suggests the mediating role of
Perceived Technology Compatibility not only holds true when tested in a nomological
network but its effect is also strengthened. Note that the R² value increased significantly
to 0.581. Furthermore, the significant impact of Perceived Service Quality on Perceived
Technology Compatibility and Perceived Playfulness also provides evidence of external
validities for Perceived Service Quality as a formative second order construct
(Diamantopoulos and Winklhofer, 2001).
Figure 5-7 The Mediating Role of Perceived Technology Compatibility in the Nomological Network
Perceived Service Quality
Perceived Playfulness
Perceived Technology
Compatibilities
Autotelic Personality
Peer Influence
External Influence
0.119
0.160**
0.232***
0.255*
0.688*** 0.186
.581
* Significant at p<.10 ** Significant at p<.05 *** Significant at p<.01

131
5.8 Examining the Moderating Effects of Motivation for Using (MIES) When eliciting responses from respondents, they were asked whether their use of MIES
is utilitarian or is experientially directed. This extra piece of information allowed us to
examine the moderating effects of Motivation for Using on users� Perceived Playfulness
of MIES. The full sample was split into two sub-samples based on different motivations.
The number of goal-oriented users (N=60) and experientially-directed users (N=66) are
almost equal8. I then ran the model on the two sub-samples respectively. The results are
shown in Fig 5-8. The path estimates for experientially-directed users are those included
in parentheses.
Figure 5-8 Results of Data Analysis: Goal-oriented vs. Experientially-directed Users
8 It has been found some respondents did not answer the question on their motivation for using therefore leaving a total number of 126 only. Note this will not invalidate other statistical results in this study.

132
As indicated by the path weights, Autotelic Personality shows positive effect on
Perceived Playfulness in both sub-samples. In terms of Autoteic Personality,
goal-oriented users tend to have stronger Personal Innovativeness, Self Efficacy and
Control. However, they possess weaker Focused Attention when compared to
experientially-directed users.
With respect to Perceived Service Quality, goal-oriented users demand more utilitarian
values of MIES (possess stronger Perceived Usefulness than experientially-directed
users). Experientially-directed users are more concerned about the Ease of Use of MIES
and they favour more personalised MIES services.
It has also been found that Experimentation means more for the goal-oriented user. It is
consistent with the fact that they possess stronger Personal Innovativeness than
experientially-directed users do. Also, compared to goal-oriented users Speed has a
significant influence on experientially-directed users (β=0.061, t=3.7003).
The path from Perceived Service Quality to Perceived Technology Compatibility is very
significant in each sub-sample with a high path magnitude. This is consistent with the
full sample result, thus providing further support for Hypothesis 3b. The impact of
Perceived Technology Compatibility on Perceived Playfulness is significant for
goal-oriented users. However, evidence shows that this may be less important for
experientially-directed users.
Social Influence plays a distinctive role in each sun-sample. For goal-oriented users,
External Influence has a major effect on Perceived Playfulness. However, it has also
been found that Peer Influence has a negative but insignificant impact on Perceived

133
Playfulness. Peer Influence is more influential than External Influence for
experientially-directed users as indicated by its higher path magnitude. Nonetheless,
both of them are non-significant for experientially-directed users.
Lastly, Perceived Service Quality has significant and positive effect on Perceived
Playfulness in both groups. On the other hand, despite its high path magnitude, the
effect of Autotelic Personality on Perceived Playfulness is insignificant in both groups.
Relationship Goal-oriented Experientially-directed β S.E β S.E AP �� PP PSQ �� PP PSQ �� PTC PTC �� PP PeerInf �� PP ExtInf �� PP
0.240 0.384 0.634 0.251 -0.158 0.358
0.2153 0.2257 0.1277 0.1153 0.1713 0.1377
0.276 0.118 0.674 0.190 0.183 0.115
0.3038 0.3044 0.0714 0.2052 0.1687 0.1323
Table 5-10 Path coefficients and Standard Errors
The differences of path coefficients between the two sub-groups also need to be tested
to see if they are significantly different. Table 5-10 contains the summary of path
coefficients and standard errors for all the proposed relationships in the research model.
These figures are used to calculate the t-values so as to test the significance of the
differences. The calculated t-statistics of difference in path coefficients between the two
groups are shown in Table 5-11.
Hypotheses Relationship t-statistics Assessment 5a AP �� PP 1.075 n/s 5b PSQ �� PP 7.82 s 5c PTC �� PP 2.904 s 5d PSQ �� PTC 3.149 s 5e PeerInf �� PP 15.93 s 5f ExtInf �� PP 14.21 s
Table 5-11 statistics of differences in path coefficients (s: significant n/s: non-significant)

134
The differences in path coefficients of all the proposed relationships are significant at
the 0.01 level. The only path that shows no significant difference between the two
subgroups is from Autotelic Personality to Perceived Playfulness (t=1.075, p<0.1). It
indicates Autotelic Personality as an individual personality construct is relatively stable
regardless different Motivations for Using.
5.9 Chapter Summary This chapter tests the specified hypotheses and answers research questions using the
research methodology stated in Chapter 4. The results have been discussed in steps
according to the research objectives and level of abstraction. Firstly, the proposed
research model is validated in the context of mobile information and entertainment
services in New Zealand. The significance of proposed relationships among latent
variables is examined. Also of considerable interest is the fact that this study has
performed a mediation test for Perceived Technology Compatibility as well as a
moderating test for Motivation for Using. Their significance in the research model has
led to some interesting findings which will be discussed in the next chapter.

Chapter 6: Discussion of Results
135
6.1 Chapter Overview This chapter discusses the results of the data analysis in Chapter 5. Within the five
research questions identified in Chapter 2, a set of hypotheses was developed to verify
each of them. As our data is convenience-based, caution has to be exercised when
interpreting the results. Consistency with previous studies and new findings are reported
throughout this chapter.
6.1.1 Chapter Outline
Figure 6-1 Chapter Outline
6.1 Chapter Overview 6.1.1 Chapter Outline
6.2 Validating the Research Model in MIES Context ! Research Question 1 ! Research Question 2 ! Research Question 3 ! Research Question 4 ! Research Question 5
6.3 Contributions and Implications
6.4 Limitations and Implications for Future Research
6.5 Chapter Summary

136
6.2 Validating the Research Model in the Context of MIES The empirical results of the full and split samples (Motivation for Using) lead to several
significant findings. Drawing upon previous research, both similar and inconsistent
findings provide opportunities for future research in related fields. Implications will be
discussed. Figure 6-2 illustrates the results of data analysis.
Figure 6-2 The Explanatory and Predictive Power of the Research Model
AutotelicPersonality
Perceived Technology
Compatibility
Perceived Service Quality
Perceived Playfulness
Peer Influence
External Influence
Focused Attention
Control
Self Efficacy
Personal Innovativeness
Perceived Usefulness
Ease of use
Personalization
Feedback Variety Content Speed
Experimentation
H1*
H2*
H3a***
H3b***H3c
H4a
H4b**
* Significant at p<.10 ** Significant at p<.05
*** Significant at p<.01
P1
P2

137
Research Question 1: Does Autotelic Personality influence Perceived
Playfulness in the context of mobile information and entertainment
services?
Chin and Gopal (1995) suggest the relative importance of the reflective model is
established by contrasting the loadings from the overall latent belief with each of the
individual beliefs. Each belief represents a separate attitudinal dimension which reflects
an existing overall attitude. My findings suggest all underlying factors (Personal
Innovativeness, Self- Efficacy, Control and Focused Attention) significantly correlated
with Autotelic Personality. However, high correlations were only identified between
Personal Innovativeness, Self Efficacy and Control and Autotelic Personality. This is
consistent with Asakawa (2004) that autotelic students are those felt more in control of
the situation and positive about challenges as compared to their non-autotelic
counterparts. Acknowledging that an autotelic person perceived challenge situation
differently from non-autotelic person, this study integrated Personal Innovativeness as
one of the underlying dimension of Autotelic Personality (Agarwal and Karahanna,
2000). The higher loading of Autotelic Personality on Personal Innovativeness and
Control indicates both constructs are important in reflecting Autotelic Personality.
Rotter (1966) introduced locus of control as a personality trait in the context of his
social learning theory. It is defined as �an individual�s general expectancy of the
outcome of the event as being either within or beyond his personal control and
understanding�. A person with an internal locus of control personality trait tends to
believe that the event is contingent upon his or her own relatively permanent
characteristics. This study is consistent with this view.
Asakawa (2004) also assessed autotelic and non-autotelic students on their perceived

138
skill and flow experience dimensions and found no difference between the two groups.
However, they discovered autotelic students have more balanced level of perceived
challenges and perceived skills suggesting the latter is an important dimension of
Autotelic Personality. In this study, the author provides empirical evidence that Self
Efficacy, which is similar to skill, is a significant dimension of Autotelic Personality in
the context of MIES. More importantly, Autotelic Personality is reflected in only one
combination of these measures: Personal Innovativeness, Self Efficacy and Control and
positively related to Perceived Playfulness. This study thus empirically proves the
existence of this important construct and the predisposition of its core dimensions to
lead to the occurrence of Perceived Playfulness in the context of MIES. It is suggested
that these individual differences within Autotelic Personality stimulate users to engage
in MIES activities for the Perceived Playfulness that accompanies these activities. A
person who is more innovative and confident about using MIES is more likely to have
Autotelic Personality and develop a positive image toward MIES. Thus, the results
support Hypothesis 1(H1) and Proposition 1 (P1) is partly supported.
Finally, the loading of Focused Attention indicate it is not an important underlying
belief in reflecting Autotelic Personality compare to other factors. In the context of
MIES, it has been suggested that Focused Attention is limited by the screen size on
mobile phones (Buchanan et al. 2001). Sweeney and Crestani (2006) pointed out that
there is an associated cost when user interacts with mobile content. As user navigates
page-to-page (vertical or horizontal scrolling to view) it is not only consuming their
cognitive resources but also causes them disorientation and lost within the content.

139
Research Question 2: Does Perceived Service Quality influence Perceived
Playfulness in the context of mobile information and entertainment
services?
Second, Perceived Service Quality as a higher order factor has been validated in this
study�answering Proposition 2. It also significantly impacts on Perceived Playfulness.
Thus Hypothesis 2 is supported. To probe deeper into the determinants of Perceived
Service Quality, this study tested its underlying factors. Our findings suggest Perceived
Usefulness, Ease of Use and Personalization with relatively higher path magnitudes are
the major determinants of Perceived Service Quality. To create a positive image of
MIES for mobile phone users, service providers in New Zealand should focus on
improving the usefulness and ease of current MIES service offerings. More importantly,
they should explore the opportunities to offer more personalized services. Current
practice among service providers seems to be offering one for all standard wireless
portals for MIES (e.g. Vodafone Live!). Other dimensions of Perceived Service Quality
such as Content, Variety, Experimentation and Speed are all significantly related to
Perceived Service Quality. However, they do not weight as importantly as Perceived
Usefulness, Ease of Use and Personalization. This study empirically tested all these
factors and provides evidence of the existence of this latent construct. It indicates the
user forms an overall perception of service quality toward MIES rather than an attitude
based on a single service attribute.

140
Research Question 3: Does Perceived Technology Compatibility
influence Perceived Playfulness in the context of mobile information and
entertainment services?
It is noteworthy that Perceived Technology Compatibility fully mediates the effect of
Perceived Service Quality on Perceived Playfulness. The indirect effect of Perceived
Service Quality on Perceived Playfulness via Perceived Technology Compatibility
provides empirical support for this. Therefore, hypotheses 3a, 3b and 3c were all
supported. The implication is that although users may have higher Perceived Service
Quality of MIES and may experience higher Perceived Playfulness, this has no
significant effect on Perceived Playfulness over and above the effects mediated by
Perceived Technology Compatibility. This suggests service providers should emphasise
provision of seamless MIES experience through closely integrated mobile phone
functionalities and services. While many researchers investigated the direct impacts of
service and technology factors in parallel on intention to use mobile internet services
(Van de Kar et al. 2003; Methlie and Pedersen, 2005; Pagani, 2004), this study provides
empirical evidence that Perceived Technology Compatibility fully mediate the impacts
of Perceived Service Quality on Perceived Playfulness. Future research should pay close
attention to the interaction between these two.

141
Research Question 4: Does Social Influence (Peer Influence and
External Influence) affect Perceived Playfulness in the context of mobile
information and entertainment services?
Our findings also suggest External Influence plays a more significant role than Peer
Influence on Perceived Playfulness of MIES. This is inconsistent with Hung et al.�s
(2003) study of WAP adoption, that Peer Influence has a stronger influence over
External Influence. However, it has been found that their study was conducted in
Taiwan. I believe this is attributed to the different business environments in New
Zealand and Taiwan. It could well be the fact that given that MIES is still in its early
development in New Zealand, the �critical mass� of MIES users has not emerged yet.
Essentially, the critical mass theory states that the value of technology to a user should
increase with the number of adopters (Lou et al. 2000). Methlie and Pedersen (2005)
tested this �network effect� in mobile services adoption. They conclude network effect
is crucial during the design of business models for service providers.
In Taiwan, the prosperity of the mobile phone service sector may well indicate the
existence of a large number of users in the market. As a result, greater Peer Influence
may result from greater �critical mass� of users. In New Zealand, the greater effect of
External Influence on Perceived Playfulness suggests that MIES users in New Zealand
are relying more on mass media coverage than on personal experience of prior adopters.
This is evidenced by the aggressive marketing promotions run by Vodafone and
Telecom New Zealand.
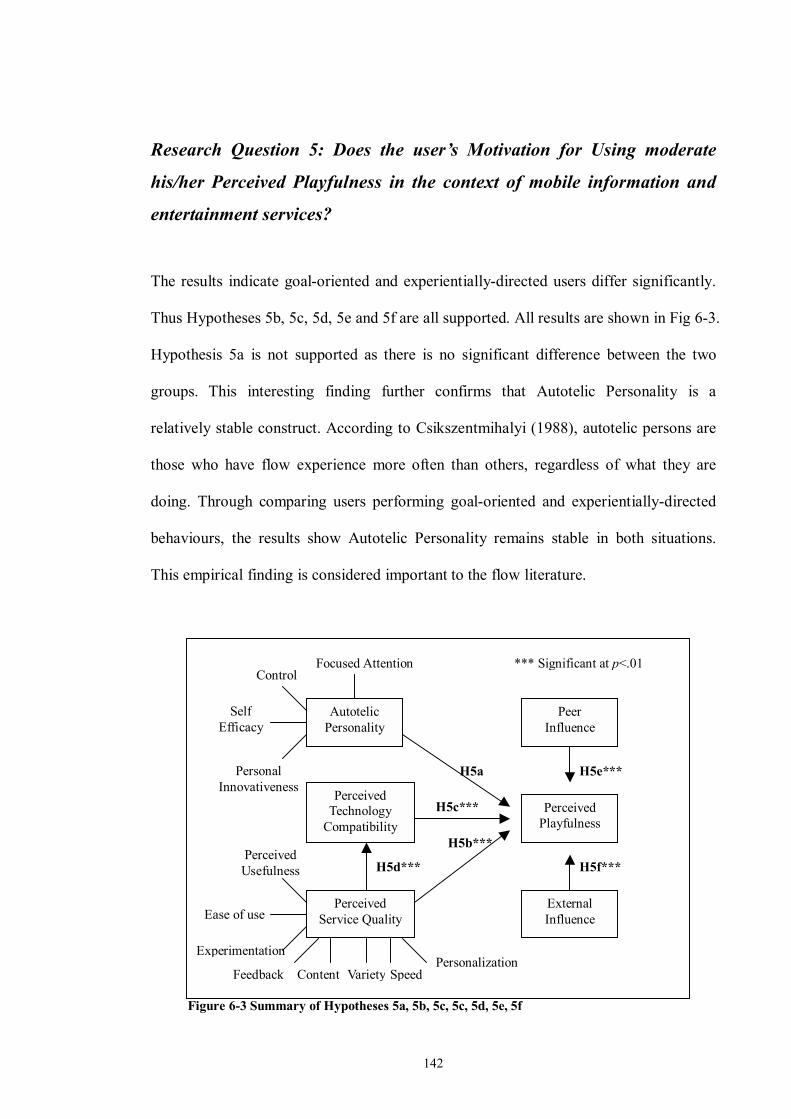
142
Research Question 5: Does the user�s Motivation for Using moderate
his/her Perceived Playfulness in the context of mobile information and
entertainment services?
The results indicate goal-oriented and experientially-directed users differ significantly.
Thus Hypotheses 5b, 5c, 5d, 5e and 5f are all supported. All results are shown in Fig 6-3.
Hypothesis 5a is not supported as there is no significant difference between the two
groups. This interesting finding further confirms that Autotelic Personality is a
relatively stable construct. According to Csikszentmihalyi (1988), autotelic persons are
those who have flow experience more often than others, regardless of what they are
doing. Through comparing users performing goal-oriented and experientially-directed
behaviours, the results show Autotelic Personality remains stable in both situations.
This empirical finding is considered important to the flow literature.
Figure 6-3 Summary of Hypotheses 5a, 5b, 5c, 5c, 5d, 5e, 5f
External Influence
Perceived Technology
Compatibility Perceived
Playfulness
Peer Influence
AutotelicPersonality
Perceived Service Quality
H5a
H5c***
H5b***
H5d***
H5e***
H5f***
*** Significant at p<.01 Focused AttentionControl
Self Efficacy
Personal Innovativeness
Perceived Usefulness
ContentPersonalization
Experimentation
Feedback
Ease of use
Variety Speed

143
Generally speaking, goal-oriented and experientially-directed users have similar
demands in terms of service attributes. They both demand useful, easy to use, and
personalized services. Nevertheless, it has been found that goal-directed users value
usefulness more than ease of use whereas experientially-directed users value ease of use
more than the usefulness of MIES. This finding is consistent with other researchers
(Nysveen et al. 2005b; Chae et al. 2002). Goal-oriented users demand more extrinsic
values whereas experientially-directed users value intrinsic values.
Furthermore, for goal-directed users, Experimentation weighs more importantly in
terms of Perceived Service Quality. Numerous studies have confirmed that
Experimentation will lead to exploratory behaviours, which correlates highly with flow
experience (Webster et al. 1993; Ghani and Deshpande, 1994; Ghani et al. 1991).
Hoffman and Novak (1996) suggest the implication of this increased exploratory
behaviour will be increased risk-taking in goal-directed behaviours. For
experientially-directed users, a broader exposure to content is likely to happen. Based
on the results, it showed that goal-directed users on average have higher Personal
Innovativeness than experientially-directed users, indicating they are more willing to
accept challenges. Therefore, this study provides empirical evidence for their claim. On
the other hand, there is some difference between goal-oriented and
experientially-directed users in terms of the importance of Content. However, it is not
clear what the result is of �broader exposure to content� by experientially-directed users,
as in Hoffman and Novak (1996).

144
The effects of Perceived Technology Compatibility on Perceived Playfulness between
goal-oriented and experientially-directed users were examined and a significant
difference was found (Hypothesis 5c). A significant difference from Perceived Service
Quality to Perceived Technology Compatibility has also been found between these two
groups (Hypothesis 5d). Furthermore, the influence of Perceived Service Quality on
Perceived Playfulness also varied significantly with the two groups (Hypothesis 5b).
Because of these significant differences, it is worthwhile to look further at each
subgroup in order to come up with some explanations.
For goal-oriented users, Perceived Service Quality has a significant impact on Perceived
Playfulness regardless the presence of Perceived Technology Compatibility. This
finding is consistent with Hoffman and Novak (1996) that goal-oriented users are more
concerned about the content rather than the medium. The implication of this is that
goal-oriented users are very values-driven. For example, business users might be more
concerned about the accuracy of the stock information they received on the phone than
about the way of obtaining it. Experientially-directed users are more concerned about
the medium. The higher the Perceived Service Quality they have, the higher the
Perceived Technology Compatibility they would expect. On the other hand, higher
Perceived Service Quality and Perceived Technology Compatibility do not necessarily
result in higher Perceived Playfulness for experientially-directed users. Thus, this
research argues goal-oriented flow is more apparent in the MIES context. This view
seems to be consistent with Fang et al. (2006). They suggest Perceived Playfulness can
be used as a surrogate for Perceived Usefulness. As an example, Perceived Playfulness
can be used to measure extrinsic outcome expectancy for gaming tasks.

145
Pedersen (2005) studied External Influence and Interpersonal Influence in the context of
mobile internet services. However, they did not examine their influence on user�s
intrinsic motivation nor consider the importance of their motivation for using
(goal-oriented and experientially-directed). This research found Peer Influence has a
positive effect on Perceived Playfulness for experientially-directed users. On the other
hand, External Influence has a greater influence over Peer Influence for goal-directed
users. Surprisingly, there is a negative correlation between Peer Influence and Perceived
Playfulness for goal-oriented users. Though this impact is insignificant, it still warrants
the attention of marketers. If the first experience of MIES for those early adopters is
proven to be unsatisfactory, these users might generate negative word-of-mouth effects
among their peers (Laczniak et al. 2001). Future research should explore this in the
context of MIES.
Experientially-directed users are however more influenced by Peer Influence. In his
study of early adopters of mobile services, Pedersen (2005) pointed out that less
innovative subjects may rely more upon user friendliness of services, be more
influenced by their peers and put more weight on the self-identifying or social
identifying role of mobile services use. This is evidenced by the low Personal
Innovativeness of experientially-directed users when compared with goal-oriented users.
However, the effects of both Peer Influence and External Influence for
experientially-directed users are non-significant which indicates experientially-directed
behaviours are less apparent than goal-directed behaviours in the context of MIES.
146
6.3 Contributions and Implications Autotelic Personality is important in flow literature and this study represents the first
attempt to explore this important individual construct in the context of MIES. Our
results suggest Personal Innovativeness, Self Efficacy and Control are all stable,
situation- specific individual differences which are highly relevant to the Autotelic
Personality. Therefore, it is possible to use these measures to address the unique needs
of different user groups. For example, it might be a possibility to categorize MIES users
according to the importance of Personal Innovativeness, Self Efficacy and Control when
designing marketing strategies for service offerings. As Hoffman and Novak (1996)
suggest, this has crucial implications for market segmentation.
To the best of my knowledge, no research has been carried out on Perceived Playfulness
and its antecedents in the context of MIES. This study found user�s Perceived
Playfulness of MIES can be largely influenced by Autotelic Personality, Perceived
Service Quality, Perceived Technology Compatibility and External Influences. In terms
of services, Perceived Usefulness, Ease of Use and Personalization are the three most
important service quality aspects that influence Perceived Playfulness. Therefore,
service providers in New Zealand need to provide useful, user-friendly, and
personalized MIES for users. Current practice among service providers seems to be
providing a �one site for all� wireless portal. Smyth and Cotter (2004) pointed out the
need for Personalization to overcome this problem. On the other hand, the existence of
Perceived Service Quality as a second order construct indicates users form overall
service quality perceptions rather than judging on the basis of any single service aspect.

147
One of this study�s primary contributions is the mediating role of Perceived Technology
Compatibility in the context. In the presence of this construct, the significance of
Perceived Service Quality on Perceived Playfulness dropped considerably. As Fang et al.
(2006) attested; service providers need to consider the effect of different tasks and user
needs in interface design. Many researchers investigated the direct impacts of service
and technological attributes on user�s perception and overlooked the interaction between
these two factors. This research suggests it is important to pay closer attention to this
area.
It has been found that External Influence plays a more significant role than Peer
Influence on Perceived Playfulness. For service providers, it means current marketing
efforts work out well. On the other hand, it also pointed out that the critical mass of
MIES users has not emerged yet in the New Zealand market. As the market competition
becomes more intensive, it will eventually lead to price drops and perhaps an increase in
the number of users (as well as the importance of Peer Influence). However, a
longitudinal study is required to investigate this.
This research also revealed that there is a significant difference between goal-oriented
and experientially-directed behaviours. The only insignificant finding is the effect of
Autotelic Personality on Perceived Playfulness. However, this suggests Autotelic
Personality is a very stable construct in spite of different motivations for using MIES.
Consistent with most other research, this study revealed that goal-oriented users demand
extrinsic values whereas experientially-directed focus more on the intrinsic aspects of
services. This research also provides empirical evidence for many claims in Hoffman
and Novak (1996). For example, Experimentation leads to an increased risk taking in

148
goal-oriented behaviours and increased content exposure for experientially-directed
users. Goal-oriented users also value Content more than the medium that delivered the
content and vice versa for experientially-directed users. In terms of Social Influence,
goal-oriented users are more affected by External Influence whereas
experientially-directed users are influenced by their Peers. More importantly, it has been
found that goal-oriented flow is more apparent in the context of MIES when examining
the key relationships in the research model. This supports the finding in Fang et al.
(2006) that Perceived Playfulness can be used as a surrogate of Perceived Usefulness
for measuring extrinsic outcome expectancy.

149
6.4 Limitations and Implications for Future Research
First, the most apparent limitation of this study is its cross-sectional nature and the use
of a convenience sample. Thus, caution must be exercised when generalizing my
findings. With the increasing varieties of MIES and rapid advancing rate of mobile
handsets, it is likely that users will have a higher Perceived Playfulness when using
MIES. Therefore, future research is encouraged to explore this using the proposed
model. However, the practice of using small sample size means that results should be
interpreted cautiously.
Second, this study focused on the perception of mobile information and entertainment
services, but did not examine the adoption of these services. Therefore, the significance
of Perceived Playfulness in the context of MIES adoption was not examined. Future
research on this can shed new light on user adoption of MIES in New Zealand.
Third, it has been found that Perceived Technology Compatibility to be a significant
antecedent toward Perceived Playfulness. It denotes the degree of integration between
services and mobile phone functionalities. Research on impacts of technological factors
on intrinsic motivators in the context of mobile commerce is relatively naïve (Bruner
and Kumar, 2005). In their study of system complexities, Gupta and Karahanna (2004)
suggest the higher the perceived risk of use embedded within the system, the less likely
users are to engage in exploratory behaviours. However, their study was extrinsically
focused and empirical results were not presented. Our study fills this gap by suggesting
the compatibility of MIES with mobile phone functionalities as perceived by users will
impact significantly on Perceived Playfulness.

150
Fourth, to strengthen the Autotelic Personality argument, future research should include
more specific variables for measuring Autotelic Personality, such as those previously
identified in flow literature. This view also holds true for Perceived Service Quality.
Autotelic Personality is indeed a complex phenomenon and my proposition of the four
first order factors is by no means exhaustive. Deci and Ryan (1985) mentioned that a
large number of personality characteristics are related to motivation.
Autotelic Personality and Perceived Service Quality only have moderate influences on
Perceived Playfulness in this study. I believe this is attributed to the issue of consistency
at large, which has been discussed in Chapter 4 (Chin and Newsted, 1999). This is
because (1) my sample is small and convenience-based and (2) other antecedents of
intrinsic beliefs, which might be significant in MIES context, have not been included in
this study. Future research should use larger sample sizes to validate this view.
Finally, the small sample size poses some threats to the analysis results on Motivation
for Using. Although the full sample size is considered appropriate for the purpose of the
software, Chin (2003) in his paper warned that both sample and effect size impact on
power. The power to detect structural path differences drops when sample size
decreases. Furthermore, when the true difference in path increases, the detection power
increases accordingly. I think the implication of this when applied to my case is two
fold. First, it is likely that the true difference between the two groups is so small that the
use of smaller sample size is unable to detect a difference between the two groups on
the effect of Autotelic Personality on Perceived Playfulness. However, this does not
explain other significant findings of path differences between other variables. Therefore,
I believe this insignificant difference between the two sub-groups on Autotelic
Personality to Perceived Playfulness is due to the fact that Autotelic Personality is a

151
relatively stable construct that does not differentiate between different motivations for
using.
6.5 Chapter Summary This chapter discussed the findings from Chapter 5. These findings gave answers to the
research objectives proposed in Chapter 2� that (1) the proposed new antecedent
model of Perceived Playfulness is significant in the context of mobile information and
entertainment services and (2) both Perceived Technology Compatibility and Social
Influence (External Influence) affect Perceived Playfulness in the new context.
All research questions have been answered and proved to be informative. Autotelic
Personality and Perceived Service Quality have significant impacts on Perceived
Playfulness. Perceived Technology Compatibility not only influences Perceived
Playfulness but also mediates the path between Perceived Service Quality and Perceived
Playfulness. It has been found that of the two Social Influences only External Influence
significantly affects Perceived Playfulness. Thus Research Question 4 is partially
answered. Finally, my findings suggest goal-oriented users behave differently from
experientially-directed users. In the next chapter, I will give an overall summary of the
research study and concluding remarks.

Chapter 7: Conclusion
152
7.1 Chapter Overview This chapter summarises the entire research study. First, an outline of the research
findings is discussed, which encompasses the two research objectives: to (1) validate the
new antecedent model of Perceived Playfulness built on Chung and Tan (2004) in a
mobile internet context, specifically services related to entertainment and information
aspects, and (2) to include and test the significance of Perceived Technology
Compatibility to account for the compatibilities between software and hardware. Under
the proposed model, Social Influences were also assessed and significant findings were
reported.
Secondly, the contributions of this study are two fold. For academics, the
knowledgebase of intrinsic motivation studies on IT/IS is further extended. For
practitioners, a practical model to increase user�s Perceived Playfulness of mobile
information and entertainment services (MIES) is provided. The implications of my
results will be presented in terms of study limitations and future research directions.
Finally, it is believed this research contributes significantly to the literature of flow and
Technology Acceptance Model (TAM).

153
7.2 Summary of Research Findings This study proposed two main objectives, based on gaps identified in current literatures:
(1) To validate a new antecedent model of Perceived Playfulness built on Chung and
Tan (2004) using MIES as the application
(2) To investigate the degree of �fit� between MIES services and mobile phone
functionalities by introducing the construct �Perceived Technology Compatibility�
and examining the impact of Social Influence on Perceived Playfulness in the
context of MIES
Findings from a survey conducted by Auckland University of Technology students in
Business School found that the proposed research model was valid for predicting user�s
Perceived Playfulness (of MIES) in New Zealand. The research model is a composition
of five major determinants: Autotelic Personality, Perceived Technology Compatibility,
Perceived Service Quality, Social Influence (External Influence and Peer Influence) and
Motivation for Using.

154
Based on the overview of literatures in Chapter 3, the following propositions and
hypotheses were proposed. All hypotheses were supported except H4a.
! P1: Autotelic Personality is a second order reflective structure constituted by
Personal Innovativeness, Self Efficacy, Control and Focused Attention.
! P2: Perceived Service Quality is a second order formative structure formed by
Perceived Usefulness, Perceived Ease of Use, Feedback, Variety, Content,
Experimentation, Personalization and Speed.
! H1: Autotelic Personality is positively related to user�s Perceived Playfulness
toward MIES
! H2: Perceived Service Quality is positively related to user�s Perceived Playfulness
toward MIES
! H3a: Perceived Technology Compatibility is positively related to user�s Perceived
Playfulness toward MIES
! H3b: Perceived Service Quality toward MIES is positively related to Perceived
Technology Compatibility
! H3c: Perceived Technology Compatibility significantly mediates the effect of
Perceived Service Quality on Perceived Playfulness
! H4a: Peer Influence is positively related to user�s Perceived Playfulness toward
MIES
! H4b: External Influence is positively related to user�s Perceived Playfulness toward
MIES

155
Hypotheses 5a to 5f were proposed to assess the effects of different motivations
(goal-oriented and experientially-directed) on Perceived Playfulness and its antecedents.
All hypotheses were supported except H5a.
! H5a: User�s Motivation for Using MIES will moderate the hypothesized
relationship between Autotelic Personality and Perceived Playfulness
! H5b: User�s Motivation for Using MIES will moderate the hypothesized
relationship between Perceived Service Quality and Perceived Playfulness
! H5c: User�s Motivation for Using MIES will moderate the hypothesized
relationship between Perceived Technology Compatibility and Perceived
Playfulness
! H5d: User�s Motivation for Using MIES will moderate the hypothesized
relationship between Perceived Service Quality and Perceived Technology
Compatibility
! H5e: User�s Motivation for Using MIES will moderate the hypothesized
relationship between Peer Influence and Perceived Playfulness
! H5f: User�s Motivation for Using MIES will moderate the hypothesized relationship
between External Influence and Perceived Playfulness

156
Some caution is required in interpreting results for Hypothesis 1, Hypothesis 2,
Hypothesis 5a, 5e and 5f. Hypothesis 1 and 2 states, Perceived Playfulness toward
MIES will increase when the user possesses higher Autotelic Personality and Perceived
Service Quality respectively. However, their impacts on Perceived Playfulness were
only significant at the 0.1 level. I believe this is due to the effect of consistency at large
(Section 4.5). As suggested by Chin (1998), the path estimates will approach the true
latent variable scores as both the number of indicators per block and the sample size
increase. Better estimates cannot simply be obtained by increasing sample size. Both
more indicators and more cases are needed (Chin and Newsted, 1999).
Given that Autotelic Personality and Perceived Service Quality are proposed as higher
order factors, their explanatory power will increase if more indicators are identified and
incorporated. Furthermore, because the sample size being employed in this study is
small and convenience-based, their medium significance on Perceived Playfulness was
deemed reasonable.
Hypothesis 5a states that user�s motivation for using MIES will moderate the
hypothesized relationships between Autotelic Personality and Perceived Playfulness.
However, the result indicates there is no significant difference in the hypothesized
relationship between Autotelic Personality and Perceived Playfulness for goal-oriented
and experientially-directed users. Initially, it was believed the use of smaller sample size
may be the cause of this insignificant result. The power for detecting structural path
differences drops when sample size decreases. Furthermore, when the true difference in
path increases, the power for detection increases accordingly (Chin, 2003). However,
the above explanation does not stand equally for other significant findings relating to
different motivations for using MIES. Therefore, it is believed that Autotelic Personality

157
is a relatively stable construct that does not differentiate between different Motivations
for Using.
H5e and 5f state user�s Motivation for Using MIES will moderate the hypothesized
relationships between Peer Influence and Perceived Playfulness and between External
Influence and Perceived Playfulness respectively. When examining each sub-group, it
has been found that goal-oriented users are significantly influenced by External
Influence whereas experientially-directed users are heavily influenced by Peer Influence.
However, this is an insignificant result. Furthermore, there is a negative correlation
between Peer Influence and Perceived Playfulness for goal-oriented users. Although this
relationship is insignificant, the fact that negative word-of-mouth effect may generate
adverse consequence within user�s social groups cannot be ignored.

158
7.3 Implications for Management The 2005 A.T. Kearney Mobinet study9 reveals that the marketing of new data services
significantly lags behind technology development. With the right marketing strategies,
operators can protect their core business and tap into the trend by offering new data
services. In this way, operators can meet consumer expectations and their own business
goals. My study shows that goal-oriented behaviours are more apparent in the context of
MIES. This suggests users may perceive MIES to be playful if there is extrinsic
expectancy at work. Service providers should take this into account when designing
MIES offerings.
On the other hand, as my findings suggest, the image created by news reports, mass
media, and popular press positively influence users� perceptions of MIES. However, if
the perceived compatibility between MIES and mobile phone functionalities is low, it is
likely to hamper their Perceived Playfulness of MIES. Therefore, service providers
should work closely with manufacturers to create a seamless MIES experience for
MIES users.
While users� personalities remain a complex phenomenon, this study shows that
studying their Autotelic Personality sets a new direction for market segmentation. These
users are genuinely high on Personal innovativeness, Self Efficacy and Control.
Furthermore, autotelic users are more likely to have Perceived Playfulness when
interacting with MIES regardless their motivations for using it. Service providers should
focus on identifying this segment, formulating effective marketing strategies to better
target this segment. As commonly agreed by many other researchers in mobile
9 AT Kearney website, Mobinet 2005: Raising the Stake (Publications). Retrieved 12 January, 2006 from:
http://www.atkearney.com/main.taf?p=5,3,1,121,1

159
commerce, the youth segment is likely to be the segment with the greatest potential
(Taylor and Harper, 2002; Berg et al. 2003; Sieber and Sabatier, 2003). They have more
opportunities to interact with new technologies, have better education and are more
innovative.
External Influence plays a more significant role than Peer Influence on Perceived
Playfulness. Given that MIES is still in its infancy, it is reasonable to assume that the
�critical mass� has not emerged yet. Therefore, mobile phone users in New Zealand are
more influenced by news reports, mass media, and popular press. This is evidenced by
the extensive marketing campaigns run by Vodafone and Telecom New Zealand.
Walker et al. (1999) mentioned that the adoption process involves the attitudinal
changes experienced by individuals from the time they first hear about a new product,
service or idea until they adopt it. Specifically, there are five stages in this adoption
process: awareness, interest, evaluation, trial, and adoption. They suggest commercial
sources of information are important at the outset, but less commercial and more
professional sources are sought to validate the proclaimed merits of the new products,
especially during the evaluation stage. Peer Influence may become an important source
of Social Influence when the number of user increases.
Although the merits of this research yield an insightful understanding of the causes of
Perceived Playfulness, extrinsic values remain an important driver of MIES in terms of
adoption. Many mobile commerce papers and press suggest cost is ultimately the
determinant for users to widely adopt MIES (Cheong and Park, 2005). This leads to the
next question, are the current offerings compelling enough in exchange for users
willingness to pay? Since one of the objectives of this study is to focus on MIES, the

160
weight of each factor toward Perceived Service Quality reflects the value of its
respective claim to be considered in MIES service design. The results in this study
suggest service providers should focus on usefulness, ease of use and more customized
services for MIES users.
In addition, these services must be offered at a user-friendly rate. Current MIES service
charges are still too high (Northmore, 2005). Nevertheless, service providers such as
Vodafone can benefit from economies of scale and experience in overseas countries and
thereby lower by per unit cost at a faster rate. Telecom New Zealand, on the other hand,
claims its 3G coverage in New Zealand has nearly reached 100%. Clearly, it has built its
distribution advantages over other competitors. According to Walker et al. (1999), these
are all marketing strategies for new market entries. This is foreseeable that competition
will be more intense in the near future. Consequently, prices will be dropped and the
number of users of MIES will increase. It is suggested that technology advancements
and marketing strategies must work in parallel to achieve that goal.
161
7.4 Limitations of the Research Several limitations have been identified of this study. These are lack of generalisability
of the sample, limited resources on the second order constructs, and results obtained via
measurement scales.
7.4.1 Sample design My sample was taken on a convenience basis, due to time and cost consideration. The
advantage of using a convenience sample is that information can be collected quickly
within a short period of time. However, Cavana et al. (2001) stated that this method is
probably the least reliable of all sampling methods because the results obtained cannot
be generalised. The demographic information obtained from the respondents indicates
the sample is overly represented by Asian students. In addition, most of them were
within the age range of 20 to 29. Therefore, a limitation of this research was that the
sample was not generalisable to the overall population.
7.4.2 Limited Resources on Proposed Second Order Constructs Limited resources were focused directly on the topic of Autotelic Personality. Other
materials referring to closely related topics would be used to probe the underlying
dimensions of Autotelic Personality, such as the materials on flow and intrinsic
motivational studies. A number of individual differences have been identified in
contexts similar to MIES in these studies. Future research should investigate the
possibilities of probing more important underlying dimensions of Autotelic Personality.
This view also holds true for Perceived Service Quality and for similar reasons.

162
7.4.3 Results obtained via Measurement Scales
! The measurement scales for some of the underlying dimensions of Perceived
Service Quality were structured based on (1) validated instruments used in previous
research and (2) respondent�s answers to open-ended questions on the survey used
in Chung and Tan (2004) to adapt to the context of this study. This indicates the way
they were measured may not be representative of these constructs. These factors
include Content, Variety, Experimentation and Personalization. However, the
validity tests show that they exhibit acceptable reliability and validity.
! Speed as an underlying dimension of Perceived Service Quality has only one
measurement item. Hair et al. (1998) mentioned that with single item measure it is
not possible to empirically estimate reliabilities in structural equation modelling
(SEM). However, some researchers still use single item measures when applying
SEM techniques to their research models (Chen et al. 2002; Hung et al. 2003). Hair
et al. (1998) went on to suggest that some estimates of the reliability of single item
measure should be made. The use of measurement scale from Hung et al. (2003) to
measure Speed was due to the fact that both studies were conducted in similar
contexts (WAP). The single item construct (Speed) was retained in the research
model. However, a more stringent statistical test is required if the single item
construct is used in future research.

163
! With respect to Perceived Technology Compatibility, it was originally proposed by
Lu et al. (2003a) and was not validated from any other research found. Some of the
individual items were also overlapping with items of other constructs. They have
also warned this construct should be adapted to suit the context of specific study. In
addition, some measurement items were worded negatively and the intent of Lu et al.
(2003b) with these items was not clear. While the decision was made to have these
items reverse coded, this may not necessarily have been correct.
! During factor analysis, some of the individual scales of Perceived Technology
Compatibility (PTC1, PTC2 and PTC10), Focused Attention (FoA1) and Perceived
Playfulness (PP2) were dropped because of their low and insignificant loadings on
their associated constructs. This indicates a lack of construct validity for these three
latent variables. Thus the measurement models for these three constructs were
revisited. The revised measurement models exhibit satisfactory reliabilities and
validities.

164
7.5 Recommendations for Future Research Recommendations for future studies are made in this section, based on the research
findings and research limitations. These will be discussed below:
! The research findings suggest a distinction between stable and dynamic individual
differences should be made to better understand Autotelic Personality and Perceived
Playfulness. Based on Asakawa (2004) and Csikszentmihalyi�s (1988), Autotelic
Personality has been empirically tested and some preliminary findings were
presented in this study. Drawing a distinction between stable and dynamic individual
differences is a useful way to better understand the nature of Autotelic Personality
construct. Future research can therefore follow this approach to better understand
the nature of Autotelic Personality. On the other hand, as MIES offerings become
more mature and widely adopted by users, there are potentially other factors which
could affect their Perceived Service Quality. Hence, future research should also
explore the possibilities of augmenting this construct.
! This study demonstrated the significant role of Perceived Technology Compatibility
in a mobile internet context. However, factors pointing toward this perceived
compatibility were not explored. While many researchers have highlighted the direct
impact of technology factors on individual users, it is suggested this phenomenon
can be further understood by focusing on the interaction between MIES and mobile
phones. For example, using a value chain perspective by taking all potential actors
(e.g. customer, suppliers and mobile phone manufacturers) into account (Van de Kar.
2004). Future research is encouraged to extend this thinking further.

165
! Lastly, the results of this study should be tested for generalisability by use of other
populations. There are two main reasons for the need to further test the proposed
research model. First, as mentioned previously, using students as sample subjects
cannot be generalised to the overall population. Second, the significance of
Autotelic Personality, Perceived Service Quality, Perceived Technology
Compatibility, External Influence and Motivation for Using toward Perceived
Playfulness may become insignificant in another context. Therefore, future research
is encouraged to apply this research model in different contexts to assess its
robustness.

166
7.6 Concluding Remarks This research investigated the antecedents toward user�s Perceived Playfulness on
mobile information and entertainment services. Initially borrowed from the Technology
Acceptance Model literature, Chung and Tan (2004) proposed an antecedent model of
Perceived Playfulness based on Moon and Kim (2001). This study moved a step further
on this subject built on Chung and Tan�s (2004) study and proposed a new antecedent
model of Perceived Playfulness in the context of mobile information and entertainment
services.
The findings suggest individuals with higher Autotelic Personality are more likely to
develop Perceived Playfulness of these services. They also exhibit some characteristics
in common, such as felt confident about their ability to perform, felt more in control and
willing to take challenges. Given the fact that MIES is still in its infancy, user�s
experience with these services will be limited. Therefore, their perceptions of these
services are likely to be significant determinants, as has been confirmed by this study.
Generally speaking, users value services that rated highly in terms of usefulness, ease of
use and personalized content. However, it has been found the perceived compatibility
between these services and mobile phone functionalities has a stronger influence over
users� attitudes toward these mobile internet services. It is also recommended that users
may perceive MIES to be playful if there is extrinsic expectancy at work. Service
providers should take this into account when designing MIES offerings.
This study provides evidence of Social Influence on users� intrinsic motivation.
Although users in New Zealand are influenced by mass media coverage, it is envisaged
that Peer Influence will play a more pivotal role in the near future. Overall, the findings

167
provided in this study will enable mobile internet service providers to create services
that increase user�s Perceived Playfulness toward MIES through the understanding of
relationships between Autotelic Personality, Perceived Service Quality, Perceived
Technology Compatibility, External Influence and Perceived Playfulness. This will
therefore promote the image that mobile information and entertainment services are fun
and entertaining for users.

Appendix 1� Example of Questionnaire
168
Auckland University of Technology
Research on Users� Experience of Mobile Internet Services in New Zealand
Purpose
The objective of this questionnaire is to investigate users� experience of mobile information and entertainment
services via mobile phones (PDA and Pocket PC are not included) in New Zealand. Participation will only take ten
minutes and your response to this questionnaire will provide information for my study. All responses from the survey
are anonymous and will be kept strictly confidential.
Definition of Mobile Information and Entertainment Services (MIES)
Mobile information and entertainment services (MIES) may be defined as the delivery of information and
entertainments from specially formatted content sources (such as e-mail, MMS, SMS-based services,
screen graphics and ring tones downloading, news, weather reports, and internet sites etc) via the mobile
telecommunication network to a mobile phone user.
1. Which of the following applies to your mobile phone? (Please circle the one applicable)
a) WAP-enabled mobile phone or GPRS capable phone
b) 3G Mobile phone
c) CDMA mobile phone
d) None of these or Not Sure
2. Does your mobile phone provide a feature (for example: WAP) that allows you to access mobile information and
entertainment services on your mobile phone?
Yes □ No □ (Please tick one only)
3. Which of the following mobile information and entertainment services did you use most recently? (Please circle
one only)
a) Mobile E-mail
b) MMS (e.g. PXT)
c) Information services (news, entertainments, sports, lifestyle etc)
d) Download (music and tones, screen tattoos or java games etc)
e) None of these services
4. Have you ever used SMS-based services on your mobile phone? (Examples: request information of account
balance, unused free minutes or sending/receiving text messages etc)
Yes □ No □ (Please tick one only)

169
If you have never used any of those services specified in Questions 3 and 4, you are NOT required to do the
following questions below. Please return the questionnaire back to instructor. Otherwise, please continue.
5. What is your motivation behind using Mobile information and entertainment services? (Please circle one only)
a) I use these services for some practical value
b) I use these services just for fun and recreation
The following questions relate to the Mobile Information and Entertainment Service (MIES) you have selected in
Question 3. However, if you selected �none of these services� in question 3, you can use SMS-based services
as a mobile information and entertainment service to answer the following questions.
Please indicate your agreement with the next set of statements by circling the appropriate number:
Rating scale Item
Strongly
Agree
Neutral
Strongly
Disagree
Personal Innovativeness
Among my peers, I am usually the first to try out new information
technologies
1 2 3 4 5 6 7
If I heard about a new information technology, I would look for ways
to experiment with it 1 2 3 4 5 6 7
In general, I am hesitate to try out new information technologies 1 2 3 4 5 6 7
I like to experiment with new information technologies 1 2 3 4 5 6 7
Experimentation
When using MIES it led me to new things I did not think about
1 2 3 4 5 6 7
When using MIES it provides related cues for other things that I
could possibly do on my mobile phone 1 2 3 4 5 6 7
Variety (of service)
The MIES incorporates variety of visual or sound elements
1 2 3 4 5 6 7
The MIES incorporates variety of presentation styles 1 2 3 4 5 6 7
Self Efficacy
I would feel comfortable using MIES on my own
1 2 3 4 5 6 7
I will be able to use MIES even if there was no one around to help me 1 2 3 4 5 6 7
I would be able to use MIES reasonably well on my own 1 2 3 4 5 6 7
Focused Attention
When using MIES , I thought about other things
1 2 3 4 5 6 7
When using MIES, I was aware of distractions 1 2 3 4 5 6 7
When using MIES, I was totally absorbed in what I was doing 1 2 3 4 5 6 7
Speed
I would accept current connection speed of MIES
1 2 3 4 5 6 7

170
Rating scale Item
Strongly
Agree
Neutral
Strongly
Disagree
Control
When using MIES I feel in control
1 2 3 4 5 6 7
I feel that I have no control over my interaction with MIES 1 2 3 4 5 6 7
The MIES allow me to control my mobile phone interaction 1 2 3 4 5 6 7
Peer Influence
My peers/colleagues/friends think that I should use MIES
1 2 3 4 5 6 7
People I knew thought that using MIES was a good idea 1 2 3 4 5 6 7
People I knew influenced me to try out MIES 1 2 3 4 5 6 7
Perceived Usefulness
Using MIES improves my task quality
1 2 3 4 5 6 7
Using MIES improves the performance of my task 1 2 3 4 5 6 7
Using MIES enables me to accomplish tasks more quickly 1 2 3 4 5 6 7
Using MIES improves my task productivity 1 2 3 4 5 6 7
Overall, I found MIES useful 1 2 3 4 5 6 7
Perceived Technology Compatibilities
My mobile phone is weak in capacity (battery power, processing and
storage memory) to fully utilize MIES
1 2 3 4 5 6 7
The display of my mobile phone is too small 1 2 3 4 5 6 7
MIES provides strong roaming capabilities to support mobility 1 2 3 4 5 6 7
MIES provides interoperability to allow any mobile phones 1 2 3 4 5 6 7
The interfaces of the MIES applications are easy to use 1 2 3 4 5 6 7
My mobile phone incorporates a variety of visual/sound elements 1 2 3 4 5 6 7
The screen design of the mobile devices is effective 1 2 3 4 5 6 7
Mobile devices have nice input features for me to use MIES 1 2 3 4 5 6 7
The terminology used on MIES is easy to understand 1 2 3 4 5 6 7
The processing speed of my mobile phone is slow 1 2 3 4 5 6 7
Perceived Ease of Use
Learning to use MIES would be easy for me
1 2 3 4 5 6 7
My interaction with MIES is clear and understandable 1 2 3 4 5 6 7
It would be easy for me to become skilful at using MIES 1 2 3 4 5 6 7
I find the MIES is easy to use 1 2 3 4 5 6 7
External Influence
I read/saw news reports that using MIES was good
1 2 3 4 5 6 7
Mass media reports influenced me to try out MIES 1 2 3 4 5 6 7
The popular press depicted a positive sentiment for using MIES 1 2 3 4 5 6 7
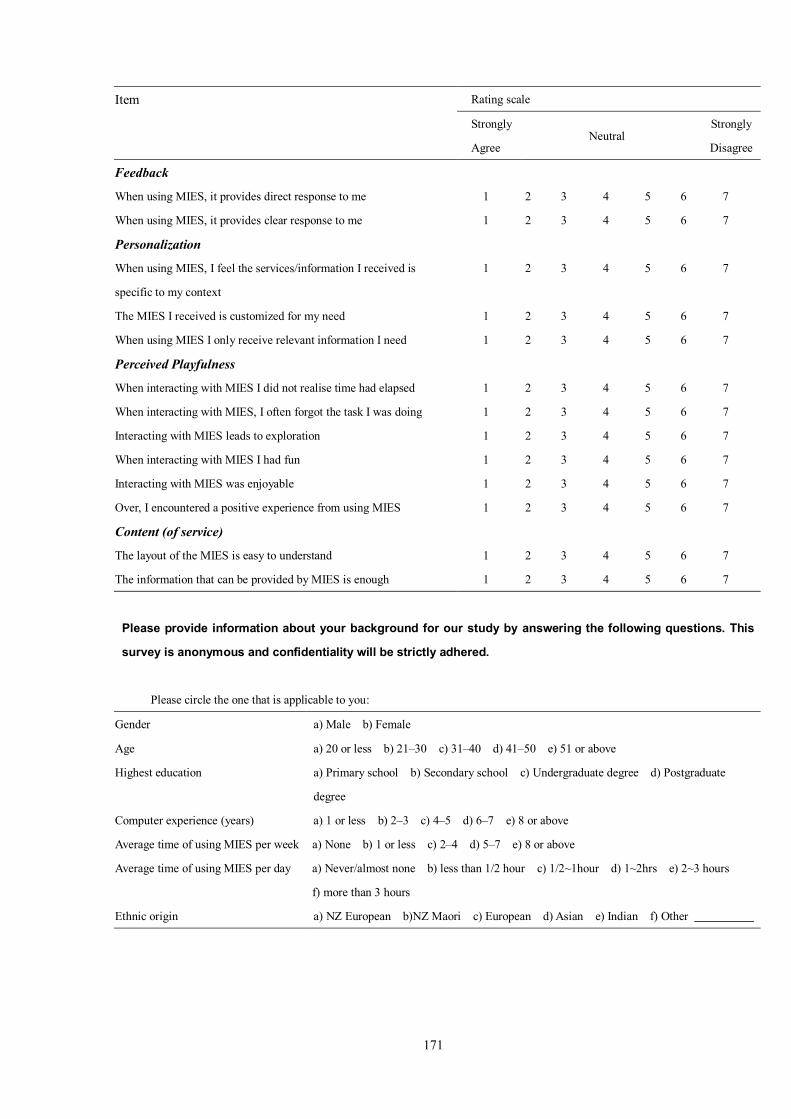
171
Rating scale Item
Strongly
Agree
Neutral
Strongly
Disagree
Feedback
When using MIES, it provides direct response to me
1 2 3 4 5 6 7
When using MIES, it provides clear response to me 1 2 3 4 5 6 7
Personalization
When using MIES, I feel the services/information I received is
specific to my context
1 2 3 4 5 6 7
The MIES I received is customized for my need 1 2 3 4 5 6 7
When using MIES I only receive relevant information I need 1 2 3 4 5 6 7
Perceived Playfulness
When interacting with MIES I did not realise time had elapsed
1 2 3 4 5 6 7
When interacting with MIES, I often forgot the task I was doing 1 2 3 4 5 6 7
Interacting with MIES leads to exploration 1 2 3 4 5 6 7
When interacting with MIES I had fun 1 2 3 4 5 6 7
Interacting with MIES was enjoyable 1 2 3 4 5 6 7
Over, I encountered a positive experience from using MIES 1 2 3 4 5 6 7
Content (of service)
The layout of the MIES is easy to understand
1 2 3 4 5 6 7
The information that can be provided by MIES is enough 1 2 3 4 5 6 7
Please provide information about your background for our study by answering the following questions. This
survey is anonymous and confidentiality will be strictly adhered.
Please circle the one that is applicable to you:
Gender a) Male b) Female Age a) 20 or less b) 21�30 c) 31�40 d) 41�50 e) 51 or above Highest education a) Primary school b) Secondary school c) Undergraduate degree d) Postgraduate
degree
Computer experience (years) a) 1 or less b) 2�3 c) 4�5 d) 6�7 e) 8 or above
Average time of using MIES per week a) None b) 1 or less c) 2�4 d) 5�7 e) 8 or above
Average time of using MIES per day a) Never/almost none b) less than 1/2 hour c) 1/2~1hour d) 1~2hrs e) 2~3 hours
f) more than 3 hours
Ethnic origin a) NZ European b)NZ Maori c) European d) Asian e) Indian f) Other

Appendix 2- Normality and Linearity of Data
172
To access the normality of the metric variables, normal Q-Q plot are examined using
SPSS (Release 13.0). All variables have been inspected on the plots. However, due to
limitation of space, only plots for Personal Innovativeness, Self Efficacy, Focused
Attention (FoA1 is not shown) and Control are drawn (from left to right; top down).
Other variables have been examined using the same method and shows high normality
of distribution.
Normal Q-Q Plots
7654321
Observed Value
7
6
5
4
3
2
1
Ex
pec
ted
No
rmal
Val
ue
Normal Q-Q Plot of PerInov1
76543210
Observed Value
7
6
5
4
3
2
1
0
Ex
pec
ted
No
rmal
Val
ue
No rmal Q-Q Plot of PerInov2
7654321
Observed Value
7
6
5
4
3
2
1
Ex
pec
ted
Nor
mal
Val
ue
Normal Q-Q P lot of PerInov3
86420-2
Observed Value
6
4
2
0
-2
Ex
pec
ted
No
rmal
Val
ue
Normal Q-Q Plot of PerInov4
86420-2
Observed Value
6
4
2
0
Ex
pect
ed N
orm
al V
alu
e
Normal Q-Q Plot of SE1
86420-2
Observed Value
6
4
2
0
Ex
pec
ted
Nor
mal
Val
ue
Normal Q-Q Plot of SE2
7654321
Observed Value
7
6
5
4
3
2
1
Ex
pec
ted
No
rmal
Val
ue
Normal Q-Q Plot of SE3
7654321
Observed Value
7
6
5
4
3
2
1
Ex
pec
ted
No
rmal
Val
ue
Normal Q-Q Plot of FoA2
86420-2
Observed Value
7
6
5
4
3
2
1
0
Exp
ecte
d N
orm
al V
alu
e
Normal Q-Q Plot of FoA3
7654321
Observed Value
7
6
5
4
3
2
1
Ex
pec
ted
No
rmal
Va
lue
Normal Q-Q Plot of Ctrl1
86420-2
Observed Value
8
6
4
2
0
-2
Ex
pec
ted
Nor
mal
Val
ue
Normal Q-Q Plot of Ctrl2
654321
Observed Va lue
6
5
4
3
2
1
Ex
pec
ted
No
rmal
Val
ue
Normal Q-Q Plot of Ctr l3
Figure 8-1 Normal Q-Q Plots

173
Scatter plots were used to examine the bivariate relationships between any two variables.
Scatter plots of paired variables are generally following a straight line and there is no
severe curvature. Due to the limitation of space, scatter plots for only the first variables
of Personal Innovativeness (PerInov1), Self Efficacy (SE1), Control (Ctrl1), Focused
Attention (FoA1) and Perceived Playfulness (PP1) are shown here.
Scatter Plots
PP1FoA1Ctrl1SE1PerInov1
Per
Inov
1S
E1
Ctr
l1FoA
1PP1
Figure 8-2 Scatter Plots

Reference List
174
Adams, D. A., Nelson, R. R., & Todd, P. A. (1992). Perceived usefulness, ease of use,
and usage of information technology: A replication. MIS Quarterly, 16, 227-247. Agarwal, R., & Karahanna, E. (1998). On the multi-dimensional nature of compatibility
beliefs in technology acceptance. Proceedings of the 19th Annual International Conference on Information Systems, 13-16.
Agarwal, R., & Karahanna, E. (2000). Time flies when you�re having fun: Cognitive
Absorption and Beliefs about Information Technology Usage. MIS Quarterly, 24, 665-694.
Agarwal, R., & Prasad, J. (1997). The Role of Innovation Characteristics and Perceived.
Voluntariness in the Acceptance of Information Technologies. Decision Science, 28(3), 557-582.
Agarwal, R., & Prasad, J. (1998). A Conceptual and Operational Definition of Personal
Innovativeness in the Domain of Information Technology. Information Systems Research, 9(2), 204-215.
Agarwal, R., Sambamurthy, V., & Stair, R. (2000). Research report: The evolving
relationship between general and specific computer self-efficacy - An empirical assessment. Information Systems Research, 11(4), 418-430.
Ajzen, I., & Fishbein, M. (1980).Understanding Attitudes and Predicting Social
Behavior. Englewood Cliffs: Prentice-Hall. Anckar, B. and D�Incau, D. (2002). Value creation in mobile commerce: Findings from
a consumer survey, Journal of Information Technology Theory & Application, 4(1), 43-64.
Asakawa, K. (2004). Flow experience and Autotelic Personality In Japanese College
students: How Do They experience challenges In Daily life?. Journal of Happiness studies, 5(2), 123-155.
Atkinson, M., & Kydd, C.T. (1997). Individual Characteristics Associated with World
Wide Web Use: An Empirical Study of Playfulness and Motivation. DataBase: The DataBase for Advances in Information Systems, 28(2), 53-62.
Babbie, E. (1990). Survey Research Methods (2nd Ed.). Belmont, California: Wadsworth
Publishing Company. Baldi, S., & Thaung, H. P. P. (2002). The entertaining way to m-commerce: Japan's
approach to the mobile internet � a model for Europe?. Electronic Markets, (12)1, 6-13.
. Barki, H., & Hartwick, J. (2001). Interpersonal Conflict and Its Management in
Information System Development. MIS Quarterly, 25(2), 195-228.

175
Berg, S., A. A. Taylor and R. Harper (2003). Mobile Phones for the Next Generation: Device Design for Teenagers. CHI, Ft. Lauderdale, Florida, USA, ACM.
Barnes, S., & Huff, S. (2003). Rising sun: iMode and the wireless Internet.
Communications of the ACM, 46(11), 78-84. Baron, R. M., & Kenny, D. A. (1986). The Moderator-Mediator Variable Distinction in
Social Psychological Research: Conceptual, Strategic, and Statistical Considerations. Journal of Personality and Social Psychology, 51(6), 1173-1182.
Bhatnagar, A., Misra, S., & Rao, H. R. (2000). On Risk, Convenience and Internet
Shopping Behavior. Communications of the ACM, 43(11), 98-105. Buchanan G, Jones M., Thimbleby H., Farrant S. & Pazzani M. (2001). Improving
mobile Internet usability. Proceedings of the 10th International Conference on World Wide Web, Hong Kong, May 2001, pp 673-680. ACM Press.
Carroll, J. M. (1982). The adventure of getting to know a computer. IEEE Computer,
15(11),49-58. Carroll, J.M., Howard, S., Vetere, F., Peck, J., & Murphy, J. (2002). Just what do the
youth of today want? Technology appropriation of young people. Proceedings of the 35th Hawaii International Conference on Systems Sciences, 1-9.
Carter, F. J. Jr., Jambulingam, T., Gupta, V. K., & Melone, N. (2001). Technological
Innovations: A Framework for Communicating Diffusion Effects. Information & Management, 38(5), 277-287.
Cavana, R. Y., Delahaye, B. L., & Sekaran, U. (2001). Applied Business Research:
Qualitative and Quantitative Methods. Australia: John Wiley & Sons. Chae, M., & Kim, J. (2003). What's so different about the mobile Internet?
Communications of the ACM, 46(12), 240-247. Chae, M., Kim, J., Kim, H., & Ryu, H. (2002). Information Quality for Mobile Internet
Services: A Theoretical Model with Empirical Validation. Electronic Markets, 12(1), 38-46.
Chan, C. Y. N. (2001). An empirical investigation of interactivity and consumer online
experience in hypermedia computer-mediated environments. The Department of Marketing Thesis, University of Auckland, Auckland.
Chan, T., & Ahern, T. (1999). Targeting motivation: Adapting Flow Theory to
Instructional Design. Journal of Educational Computing Research, 21(2), 151-163. Chen, L., Gillenson, M.L., & Sherrell, D.L. (2002). Enticing online consumers: an
extended Technology acceptance perspective. Information and Management, 39,705-719.

176
Cheong, J. H., & Park, M. (2005) Mobile Internet acceptance in Korea. Internet Research: Electronic Networking Applications and Policy, 15(2), 125-140.
Childers, T. L., Carr C. L., Peck J., & Carson S. (2001). Hedonic and utilitarian
motivations for online retail shopping behaviour. Journal of Retailing, 77(4), 511-535.
Chin, W. W. (1998). Issues and Opinion on Structural Equation Modeling. MIS
Quarterly, 22(1), pp. vii � xvi. Chin, W. W. (2000). Frequently Asked Questions � Partial Least Squares & PLS-Graph
[On-line]. Available:http://disc-nt.cba.uh.edu/chin/plsfaq.htm [2005 October 10] Chin, W. W. (2001). PLS-Graph User's Guide Version 3.0. Houston, TX: C.T. Bauer
College of Business, University of Houston. Chin, W. W. (2003). A Permutation Procedure For Multi-Group Comparison Of PLS
Models. In Valares, M., Tenenhaus, M., Coelho, P., Vinzi, V., & Morineau, A. (Ed.), PLS and Related Methods, Proceedings of the PLS''03 International Symposium -- "Focus on Customers"(pp. 33-43). Lisbon.
Chin, W. W., & Gopal, A. (1995). Adoption intention in GSS: Relative importance of
beliefs. The Data Base for Advances in Information Systems, 26(2/3), 42-64. Chin, W. W., & Marcolin, B. L. (1995). The holistic approach to construct validation in
IS research: Examples of the interplay between theory and measurement, Administrative Sciences Association of Canada - 23rd Conference, IS Proceedings, 16(4), 33-43.
Chin, W. W., & Newsted, P. R. (1999). Structural Equation Modeling analysis with
Small Samples Using Partial Least Squares. In Rick Hoyle (Ed.), Statistical Strategies for Small Sample Research (pp. 307-341). New York: Sage Publications.
Chiu, P. L., Güll, M., & Wanniger C. (2001). Mobile Internet- for Technique Freaks or
Mass Market?. Master Thesis, School of Economics and Management, Lund University, Sweden.
Chung, J., & Tan, F. B. (2004). Antecedents of Perceived Playfulness: An Exploratory
Study on. User Acceptance of General Information-Searching Websites. Information & Management, 41(7), 869-881.
Churchill, G. (1979). A paradigm for developing better measures of marketing
constructs. Journal of Marketing Research, 16, 64-73. Churchill, G. (1999). Marketing Research: Methodological Foundation. New York: The
Dryden Press. Cronbach, L. J. (1951). Coefficient alpha and the internal structure of tests.
Psychometrika, 16, 297-334.

177
Collis, J., & Hussey, R. (2003). Business Research: A practical guide for undergraduate and postgraduate students. (2nd Ed.). New York: Palgrave Macmillan.
Compeau, D., & Higgins, C. (1995). Computer Self-Efficacy: Development of a
Measure and Initial Test. MIS Quarterly, (19:2), 189-211. Compeau, D., Higgins, C., & Huff, S. (1999). Social Cognitive Theory and Individual
Reactions to Computing Technology: A Longitudinal Study. MIS Quarterly, (23:2), 145-158.
Csikszentmihalyi, M. (1988). The Future of Flow. In Csikszentmihalyi, M., &
Csikszentmihalyi, I. S. (Eds.), Optimal Experience: Psychological Studies of Flow in Consciousness (pp.364-383). New York.
Csikszentmihalyi, M. (1990). Flow: The Psychology of Optimal Experience. New York:
Harper and Row. Danielyan, E., (2003) WAP: Broken Promises or Wrong Expectations? The Internet
Protocol Journal, 6(2), 10-19. Davis, F. (1989). Perceived Usefulness, Perceived Ease of Use, and User acceptance of
Information Technology. MIS Quarterly, 13, 318-339. Davis, F. (1993). User acceptance of information technology: system characteristics,
user perceptions and behavioural impacts. International Journal of Man-Machine Studies, 38, 475-487.
Davis, F., Bagozzi, R., & Warshaw, P. (1989). User acceptance of computer technology:
a comparison of two theoretical models. Management Science, 35, 982-1003. Davis, F. D., Bagozzi, R. P., & Warshaw, P. R. (1992). Extrinsic And Intrinsic
Motivation To Use Computers In The Workplace. Journal of Applied Social Psychology, 22 (14),1111-1132.
Deci E.L., & Ryan R.M. (1985). Intrinsic Motivation and Self-Determination in Human
Behavior. New York: Plenum. Diamantopoulos, A. (1994). Modelling with LISREL: a guide for the uninitiated.
Journal of Marketing Management, 10, 105-136. Diamantopoulos, A., & Winklhofer, H. (2001). Index Construction with Formative
Indicators: An Alternative to Scale Development. Journal of Marketing Research, 38 (2), 269-277.
Doll, W.J., Xia, W., & Torkzadeh, G. (1994). .A Confirmatory Factor Analysis of the
End-User Computing Satisfaction Instrument. MIS Quarterly, 18, 453-461. Edwards, J. R. (2001). Multidimensional constructs in organizational behavior research:
An integrative analytical framework. Organizational Research Methods, 4, 144�192.
178
Ellis, G. D., Voelkl, J. E., & Morris, C. (1994). Measurement and Analysis Issues with Explanation of Variance in Daily Experiences Using the Flow Model. Journal of Leisure Research, 26(4), 337-356.
Fang, X. W., Chan, S., Brzezinski, J., & Xu, S. (2006). Moderating Effects of Task
Types on Wireless Technology Acceptance. Journal of Management Information Systems, 22(3), 123-157.
Finneran, C. M., & Zhang, P. (2005). Flow in computer-mediated environments:
Promises and challenges. Communications of the Association for Information Systems, 15, 82-101.
Fornell, C., & Larcker, D. F. (1981) Evaluating Structural Equation Models with
Unobservable Variables and Measurement Error. Journal of Marketing Research, 18, 39-50.
Funk, J. (2004). Key Technological Trajectories and the Expansion of Mobile Internet
Applications. Info - The journal of policy, regulation and strategy for telecommunications, 6(3), 208-215.
Garcia-Macias, J. A., Rousseau, F., Berger-Sabbatel, G., Toumi, L., & Duda, A. (2003).
Quality of Service and Mobility for the Wireless Internet. Wireless Networks, 9, 341-352.
Gefen, D., & Straub, D. (2005). A Practical Guide to Factorial Validity Using
PLS-Graph: Tutorial and Annotated Example. Communications of the Association for Information Systems, 16(5), 91-109.
Gefen, D., Straub, D., & Boudreau, M.C. (2000). Structural Equation Modeling and
Regression: Guidelines for Research Practice. Communications of the Association for Information Systems, 4(7), 1-80.
Ghani, J. (1991). Flow in human computer interactions: test of a model. In: Carey, J.
(Ed.), Human Factors in Information Systems: Emerging Theoretical Bases. New Jersey: Ablex Publishing Corp.
Ghani, J., & Deshpande, S. (1994). Task Characteristics and the Experience of Optimal
Flow in Human-Computer Interaction. The Journal of Psychology, 128, 381-391. Ghani, J., Supnick, R., & Rooney, P. (1991). The Experience of Flow in
Computer-Mediated and in Face-to-Face Group. In Degross, J., Benbasat, I., DeSanctics, G., & Beath, C. (Eds.), Proceedings of the Twelfth International Conference on Information Systems (pp. 229-238). New York.
Gupta, S., & Karahanna, E. (2004).Technology Adoption in Complex Systems.
Proceedings of the 7th Annual Conference of the Southern Association for Information Systems (pp.162-169). Savannah, GA.
179
Hackbarth, G., Grover, V., & Yi, M. Y. (2003). Computer playfulness and anxiety: positive and negative mediators of the system experience effect on perceived ease of use. Information & management, 40(3), 221.
Haenlein, M., & Kaplan, A. M. (2004). A Beginner’s Guide to Partial Least Squares
Analysis. Understanding Statistics, 3(4), 283-297. Hair, J., Anderson, R., Tatham, R., & Black, W. (1998). Multivariate Data Analysis
(5th Ed.). New Jersey: Prentice-Hall. Hamilton, A. J., Haier, R. J., & Buchsbaum, M.S. (1984). Intrinsic Enjoyment and
Boredom Coping Scales: Validation With Personality, Evoked Potential and Attention Measures. Personality and Individual Differences, (5)2, 183-193.
Ho, S.Y., & Kwok, S.H. (2003). The attraction of personalized service for users in
mobile commerce: an empirical study. ACM SIGecom Exchanges, 3(4), 10-18. Hoffman, D. L., & Novak T. P. (1996). Marketing in Hypermedia Computer-Mediated
Environments: Conceptual Foundations. Journal of Marketing, 60, 50-68. Hsu, C. L., & Lu, H. P. (2004). Why do people play on-line games? An extended TAM
with Social Influence and flow experience. Information & Management, 41(7), 853-868.
Hulland, J. (1999). Use of partial least squares in strategic management research: a
review of four recent studies. Strategic Management Journal, 20(2), 195-204. Hung, S. Y., Ku, C. Y., & Chang, C. M. (2003). Critical factors of WAP services
adoption: An empirical study. Electronic Commerce Research and Applications, 2, 42-60.
IDC New Zealand, (2004, September 20th). IDC forecast over 5 billion text messages
will be sent in 2008 and non-voice revenues to grow at 27.8%, [Press release]. Auckland: IDC New Zealand.
Igbaria, M., & Guimaraes, T. (1995). Testing The Determinants Of Microcomputer
Usage Via A Structural Equation Model. Journal of Management Information Systems, 11 (4), 87-115.
Khalifa, M. and Liu, V. (2003). Satisfaction with Internet-based services: The role of
expectations and desires, International Journal of Electronic Commerce, 7(2), 31-49. Karahanna, E., & Straub, D. (1999). The Psychological Origins of Perceived Usefulness
and Ease of Use. Information and Management, 35, 237-250. Kettinger, W., & Lee, C. (1995). Exploring a Gap Model of Information Services
Quality. Information Resources Management Journal, 8(3), 5-16.

180
Kikta, R., Fisher, A., & Cortney, M. (2002). Wireless Internet Crash Course: A common-sense roadmap to the confusing world of wireless internet. New York: McGraw-Hill.
Kim, M. K., & Jee, K. Yong. (2006). Characteristics of Individuals Influencing
Adoption Intentions for Portable Internet Service. ETRI Journal, 28(1), 67-76. Koivisto, M., & Urbaczewski, A. (2004). The relationship between quality of service
perceived and delivered in mobile internet communications. Information Systems and e-Business Management, 2, 309-323.
Koufaris, M. (2002). Applying the technology acceptance model and flow theory to
online consumer behavior. Information Systems Research, 13(2), 205-23. Kwon, H. S., & Chidambaram, L. (2000). A test of the technology acceptance model:
The case of cellular telephone adoption. Proceeding of the 33rd Hawaiian International Conference on System Sciences, 3-6.
Laczniak, R. N., DeCarlo, T. E., & Ramaswami, S.N. (2001). Consumer�s Responses to
Negative Word-of-Mouth Communications: An attribution Theory Perspective. Journal of Consumer Psychology, 11(1), 57-73.
Lamming, M., Eldridge, M., Flynn, M., Jones, C., & Pendlebury, D. (2000). Satchel:
providing access to any document, any time, anywhere. ACM Transactions on Computer-Human Interaction, 7(3), 322�352.
Lee, Y. E., & Benbasat, I. (2004). A framework for the study of customer interface
design form mobile commerce. International Journal of Electronic Commerce, 8(3), 79-102.
Lee, Y., Kozar, K.A., & Larsen, K.R.T. (2003).The Technology Acceptance Model:
Past, Present, and Future. Communications of the Association for Information Systems, 12(50), 752-780.
Limayem, M., & Khalifa, M. (2000). Business-to-Consumer Electronic Commerce: A
Longitudinal Study. The Fifth IEEE Symposium on Computers and Communications, 286-290.
Lin, C., Wu, S., & Tsai, R. (2005). Integrating Perceived Playfulness into
expectation-confirmation model for web portal context. Information & Management, 42(5), 683-693.
Ling, R. (2001). We Release Time Little by Little: Maturation and Gender Identity as
Seen in the Use of Mobile Telephony. Pervasive and Ubiquitous Computing, 5, 123-136.
Ling, R., & B. Yttri. (2002). Micro and hyper-coordination through the use of the
mobile telephone. In Katz, J. E., & Aakhus, M. (Eds.), Perpetual Contact: Mobile communication, private talk, and public performance (pp.139-169). Cambridge: Cambridge University Press.

181
Lou, H., Luo, W., & Strong, D. (2000) Perceived critical mass effect on groupware acceptance. European Journal of Information Systems, 9(2), 91-103.
Lu, J., Liu, C., Yu, C. S., & Yao, J. E. (2003b). Exploring the Factors Associated with
Wireless Internet via Mobile Technology Acceptance in Mainland China. Communications of the International Information Management Association, 3(1), 101-120.
Lu, J., Yu, C. S., Liu, C., & Yao, J. E. (2003a). Technology acceptance model for
wireless internet. Internet Research: Electronic Networking Applications and Policy, 13(3), 206-222.
Maitland, C. F., Van de Kar, E. A. M., Wehn de Montalvo, U., & Bouwman, H. (2005).
Mobile Information and entertainment services: business models and service networks. International Journal of Management and Decision Making, 6(1), 47 - 64.
Malhotra, Y., & Galletta, D. F. (1999). Extending the technology acceptance model to
account for Social Influence: theoretical bases and empirical validation. Proceedings of the Hawaii International Conference on System Sciences, 32, 6-19.
Malone, T. (1981). Toward A Theory of Intrinsically Motivating Instruction. Cognitive
Science, 4, 333-369. Mathieson, K. (1991). Predicting user intentions: comparing the technology acceptance
model with the theory of planned behavior. Information Systems Research, 2 (3), 173-91.
McNickel, D. (2005, December). Telecom or Vodafone - which 3G for you? Retrieved
January 12, 2006 from http://www.istart.co.nz Methlie, L.B., & Pedersen, P.E. (2005). Network effects and intrinsic attributes of
mobile services: Mapping perceived service values on business model choices. Presented at the Hong Kong Mobility Roundtable.
Mittal, B., & Lassar, W. M. (1996). The Role of Personalization in Service Encounters.
Journal of Retailing, 72(1), 95-109. Moon, J. W., & Kim, Y. G. (2001). Extending the TAM for a World-Wide-Web context.
Information & Management, (38)4, 217-230. Nakamura, J., & Csikszentmihalyi, M. (2002). The concept of flow. In C.R. Snyder &
S.J. Lopez (Eds.), Handbook of positive psychology (pp. 89-105). New York: Oxford University Press.
Newbery, A. (2005, November 20). Landlines the latest victims of cell phones. New
Zealand Herald. Retrieved January 25, 2006, from:http://www.nzherald.co.nz/ topic/story.cfm?c_id=261&ObjectID=10356112

182
Ng-Krulle, G., Swatman, P., Hampe, J. F., & Rebne, D. (2004). End-user Perspectives on the Adoption of Wireless Applications: Price of Convenience and a Model for Contextual Analysis. In The 15th Australasian Conference on Information Systems 2004 (ACIS04), Hobart: Tasmania.
Nordman, J., & Liljander, V. (2003). Mobile Service Quality � A Study of Contributing
Factors. Working Paper, Marketing Dep., Hanken Swedish School of Economics and Business Administration, Helsinki, Finland.
Northmore, D., (2005) What Price WAP? MyMobile, 30-33, June Novak, T. P., Hoffman, D. L., & Yung, Y.-F. (2000). Measuring the Customer
Experience in Online Environments: A Structural Modeling Approach. Marketing Science, 19(1), 22-42.
Nysveen, H., Pedersen, P. E., & Thorbjørnsen, H. (2005a). Explaining intention to use
mobile chat services: moderating effects of gender. Journal of Consumer Marketing, 22(5), 247-256.
Nysveen, H., Pedersen, P. E., & Thorbjørnsen, H. (2005b). Intentions to Use Mobile
Services: Antecedents and Cross-Service Comparisons. Journal of the Academy of Marketing Science, 33(3), 330-346.
Pagani, M. (2004).Determinants of Adoption of Third Generation Mobile Multimedia
Services. Journal of Interactive Marketing, 18(3), 46-59. Pavlou, P. A., & El Sawy, O.A. (2005). From IT Competence to Competitive Advantage
in Turbulent Environments: A Dynamic Capabilities Model. Information Systems Research, (under 3rd round of review). Forthcoming.
Pavlou, P. A., & Fygenson, M. (2006). Understanding and Predicting Electronic
Commerce Adoption: An Extension of the Theory of Planned Behavior. MIS Quarterly, 30(1), 1-38.
Pedersen, P. E. (2005). Adoption of mobile Internet services: An exploratory study of
mobile commerce early adopters. Journal of Organizational Computing and Electronic Commerce, 15(3), 203-221.
Pedersen, P.E., Nysveen, H. and Thorbjørnsen, H. (2003). Identity expression in the
adoption of mobile services: The case of multimedia messaging services. SNF Working Paper No. 26/03. Foundation for Research in Economics and Business Administration, Bergen, Norway.
Pedersen, P.E. and Nysveen, H. (2003). Usefulness and self-expressiveness: extending
TAM to explain the adoption of a mobile parking service. Presented at the 16th Electronic Commerce Conference, Bled, Slovenia, June 9-11.
Pijpers, G., Bemelmans, T., Heemstra, F., & van Montfort, K. (2001). Senior executives�
use of information technology. Information and Software Technology, 43(15), 959-971.

183
Pinsonneault, A., & Kraemer, K. (1993). Survey research methodology in management information systems: An assessment. Journal of Management Information Systems, 10(2), 75-106.
Privette, G. (1983). Peak Experience, Peak Performance, and Flow: A Comparative
Analysis of Positive Human Experiences. Journal of Personality and Social Psychology, 45(6), 1361-1368.
Raisinghani, V. T., & Iyer, S. (2004). Cross-layer design optimizations in wireless
protocol stacks. Computer Communications, 27, 720-724. Rindskopf, D. and Tedd, R. (1988), Some Theory and Applications of Confirmatory
Second-Order Factor Analysis, Multivariate Behavioral Research, 23, 51-67. Rogers, E. M. (1983). Diffusion of Innovations. (3rd Ed.), New York: Free Press Rogers, E. M. (1995). Diffusion of Innovations. (4th Ed.), New York: Free Press. Rotter, J. B. (1966). Generalized expectancies for internal versus external control of
reinforcement. Psychological Monographs: General and Applied, 80, 1-28. Sacher, H., & Loudon, G. (2002). Uncovering the New Wireless Interactions Paradigm.
Interactions, 9(1), 17-23. Sieber, S. and J. V. Sabatier (2003). Uses and Attitudes of Young People toward
Technology and Mobile Telephony. 16th BLED International Conference on Electronic Commerce: eTransformation, Bled, Slovenia.
Straub, D.W., (1989) Validating Instruments in MIS Research, MIS Quarterly, 13(2),
147-169 (new) Sambamurthy, V., & Chin, W. W. (1994). The Effects of Group Attitudes Toward
Alternative GDSS Designs on the Decision-making Performance of Computer-Supported Groups. Decision Sciences, 25(2), 215-241.
Schmidt, A., Beigl, M., & Gellersen, H.W. (1999). There is More to Context Than
Location. Computer and Graphics, 23(6), 893�901. Schubert, P., & Ginsburg, M. (2000). Virtual Communities of Transaction: The Role of
Personalization in Electronic Commerce. Electronic Markets, 10(1), 45-55. Shim, J. P., & Shim, J. (2003). M-commerce around the World: Mobile Services and
Applications in Japan, Korea, Hong Kong, Finland, and the United States. Decision Line, September/October issue.
Siekpe, J. S. (2005). An Examination of The Multidimensionality of Flow Construct in a
Computer-Mediated Environment. Journal of Electronic Commerce Research, 6(1), 31-43.

184
Smyth, B., & Cotter, P. (2004). MP3 - Mobile Portals, Profiles and Personalization. Web Dynamics, 411-434.
Straub, D., Boudreau, M.-C., & Gefen, D. (2004). Validation Guidelines for IS Positivist
Research. Communications of AIS, (13)24, 380-427. Struneski, L. (2005, September 16). New Zealand Telecommunications Market,
STAT-USA Market Research Reports. STAT-USA Market Research Reports. Retrieved October 25, 2005, from: http://strategis.ic.gc.ca/epic/internet/inimr-ri.nsf/en/gr127242e.html
Sudman, S. and Bradburn, N. Asking Questions: A Practical Guide to Questionnaire
Design. San Francisco, CA: Jossey-Bass Inc., 1982 Sweeney, S., Crestani, F. (2006), Effective search results summary size and device
screen size: Is there a relationship? Information Processing & Management, 42(4), 1056-1074
Szajna, B. (1996). Empirical Evaluation of the Revised Technology Acceptance Model.
Management Science, 42(1), 85-92. Taylor, A. S., & Harper, R. (2002). Age-old Practices in the New World: A Study of
Gift-Giving Between Teenage Mobile Phone Users, In Proceedings of the Conference on Human Factors in Computing Systems, 439-446.
Taylor, S., & Todd, P. (1995). Decomposition and crossover effects in the theory of
planned behavior: A study of consumer adoption intentions. International Journal of Research in Marketing, 12(2), 137-156.
Te'eni, D. (1989). Determinants and consequences of perceived complexity in
human-computer interaction. Decision Sciences, 20, 166-181. Teo, T., Lim, V., & Lai, R. (1999). Intrinsic and extrinsic motivation in Internet usage.
Omega: International Journal of Management Science, 27(1), 25-37. Thatcher, J.B., & Perrewé, P.L. (2002). An Empirical Examination of Individual Traits
as Antecedents to Consumer Anxiety and Computer Self-Efficacy. MIS Quarterly, 26(40), 381-396.
Thompson, R., Barclay, D., & Higgins, C. (1995). The partial least squares approach to
causal modeling: personal computer adoption and use as an illustration. Technology studies: special issue on research methodology, 2(2), 284-324.
Tornatzky, L.G. & Klein, K.J. (1982). Innovation characteristics and innovation
adoption implementation: a meta-analysis of findings. IEEE Transactions on Engineering Management, 29(1), 28-45.
Trevino, L. K., & Webster, J. (1992). Flow in Computer-Mediated Communication.
Communication Research, 19(5), 539-573.

185
Van de Kar, E. A. M. (2004). Designing mobile information services; An Approach for Organisations in a Value Network, Doctoral dissertation. Delft University of Technology; Faculty of Technology, Policy and Management. Delft: The Netherlands.
Van de Kar, E. A. M., Maitland, C., Wehn de Montalvo, U., & Bouwman, H. (2003).
Design guidelines for Mobile Information and Entertainment Services; Based on the Radio538 ringtunes i-mode service case study. In Sadeh, Norman (Ed.); Proceedings of the Fifth International Conference on Electronic Commerce; 414-422.
Venkatesh, V. (1999). Creation of Favorable User Perceptions: Exploring the Role of
Intrinsic Motivation, MIS Quarterly, 23(2), 239-260. Venkatesh, V. (2000). Determinants of. Perceived Ease of Use: Integrating Control,
Intrinsic Motivation, and Emotion into the Technology Acceptance Model. Information Systems Research, 11(4), 342-365.
Venkatesh, V. (2003), User acceptance of information technology: toward a unified view,
MIS Quarterly, 27(3), 425-478. Venkatesh, V., & Davis, F. D. (1996). A model of the antecedents of perceived ease of
use, Development and test. Decision. Sciences, 27, 451-481. Venkatesh, V., & Morris, M. G. (2000). Why don�t men ever stop to ask for directions?
gender, Social Influence, and their role in technology acceptance and usage behavior. MIS Quarterly, 24(1), 115-139.
Venkatesh, V., Morris, M. G., Davis, G. B., & Davis, F. D. (2003). User acceptance of
information technology: Toward a unified view. MIS Quarterly, 27(3), 425-478. Venkatesh, V., & Ramesh, V. (2002). Usability of Web and Wireless Sites: Extending the
Applicability of the Microsoft Usability Guidelines Instrument. Information Systems Technical Reports and Working Paper. Retrieved June 2, 2005, from: http://www.kelley.iu.edu/ardennis/wp/
Vlachos, P., & Vrehopoulos, A. (2005). Special issue on Consumers' Behavioral
Intentions in the Mobile Internet Services Market, The Hermes Newsletter, ELTRUN, Athens University of Economics and Business, available at: http:// www.eltrun.aueb.gr
Vlachos, P., Vrechopoulos, A.,& Doukidis, G. (2003). Exploring Consumer Attitudes
towards Mobile Music Services. International Journal on Media Management, 5(2), 138-148.
Walker, O., Boyd, H., & Larreche, J. (2003). Marketing Strategy-Planning and
Implementation. (4th Ed.). Irwin: McGraw �Hill. Webster, J., & Ho, H. (1997). Audience Engagement in Multimedia Presentations. The
DATA BASE for Advances in Information Systems, 28(2), 63-77.

186
Webster, J., & Martocchio, J. (1992). Microcomputer playfulness: Development of a measure with workplace implications. MIS Quarterly, June, 201-226.
Webster, J., & Martocchio, J. (1993). Turning Work into Play: Implications for
Microcomputer Software Training. Journal of Management, 19(1), 127-147. Webster, J., Trevino, L. K., & Ryan, L. (1993). The dimensionality and correlates of
flow in human-computer interactions. Computers in Human Behavior, 9(2), 411-426. Weilenmann, A., & Larsson, C. (2000). On Doing �Being Teenager�- Applying
Ethnomethodology to the Analysis of Young People�s Use of Mobile Phones. In Svensson, L., Snis, U., Sørensen, C., Fägerlind, H., Lindroth, T., Magnusson, M., Östlund, C. (Eds.), Proceedings of IRIS 23. University of Trollhättan Uddevalla.
Wolfinbarger, M., & Gilly, M. C. (2001). Shopping Online for Freedom, Control, and
Fun. California Management Review, 43(2), 34-55. Wu, J. H., & Wang, S.C. (2004). What drives mobile commerce? An empirical
evaluation of the revised technology acceptance model. Information & Management, 42(5), 719-729.
Wu, T., & Dixit, S. (2003). The Content Driven Mobile Internet. Wireless Personal Communications, 26, 135-147.
Zhu, K., Kraemer, K. L., Gurbaxani, V., & Xu, S. (2006).Migration to Open-Standard
Interorganizational Systems: Network Effects, Switching Costs and Path Dependency. MIS Quarterly, (forthcoming).