Archived Statistical Report 2009 | Revenue
137
Archived Statistical Report 2009 (Year ended 31st December 2009)
-
Upload
khangminh22 -
Category
Documents
-
view
2 -
download
0
Transcript of Archived Statistical Report 2009 | Revenue
Archived Statistical Report 2009
(Year ended 31st December 2009)

This document is a collated archive of the 2009 statistical reports.
The original layout of the statistical reports placed the information in a series of documents across
the relevant different sections of the website. For the sake of accuracy, Revenue changed nothing
when combining these documents.
However, this will mean that the page numbering at the bottom of each page is not in alignment.
We recommend that you use the index below in your document reading software.
Table of Contents Total Revenue .............................................................................................................................. 3
Excise ........................................................................................................................................ 11
Stamp Duties ............................................................................................................................. 36
Capital Acquisitions Tax ............................................................................................................. 40
Residential Property Tax ............................................................................................................ 43
Income Tax ................................................................................................................................ 44
Income Distribution Statistics ..................................................................................................... 66
Corporation Tax ....................................................................................................................... 120
Corporation Tax Distribution statistics ...................................................................................... 122
Capital Gains Tax ..................................................................................................................... 127
Value Added Tax ...................................................................................................................... 130
Sheriff and Solicitor Enforcement ............................................................................................. 135
Environmental Levy ................................................................................................................. 137
Revenue Commissioners Statistical Report 2009
Total Revenue
• Table TR1 Gross Receipts
• Table TR2 Net Receipts
• Table TR3 Net Receipts as a percentage of GDP
• Table TR4 Gross Receipts and Cost of Administration
• Table TR5 Cost of Administration (main elements)
• Table TR6 Net receipts from PAYE, VAT, Income Tax, Corporation Tax, and Capital Gains Tax in 2009 by Trade Sector
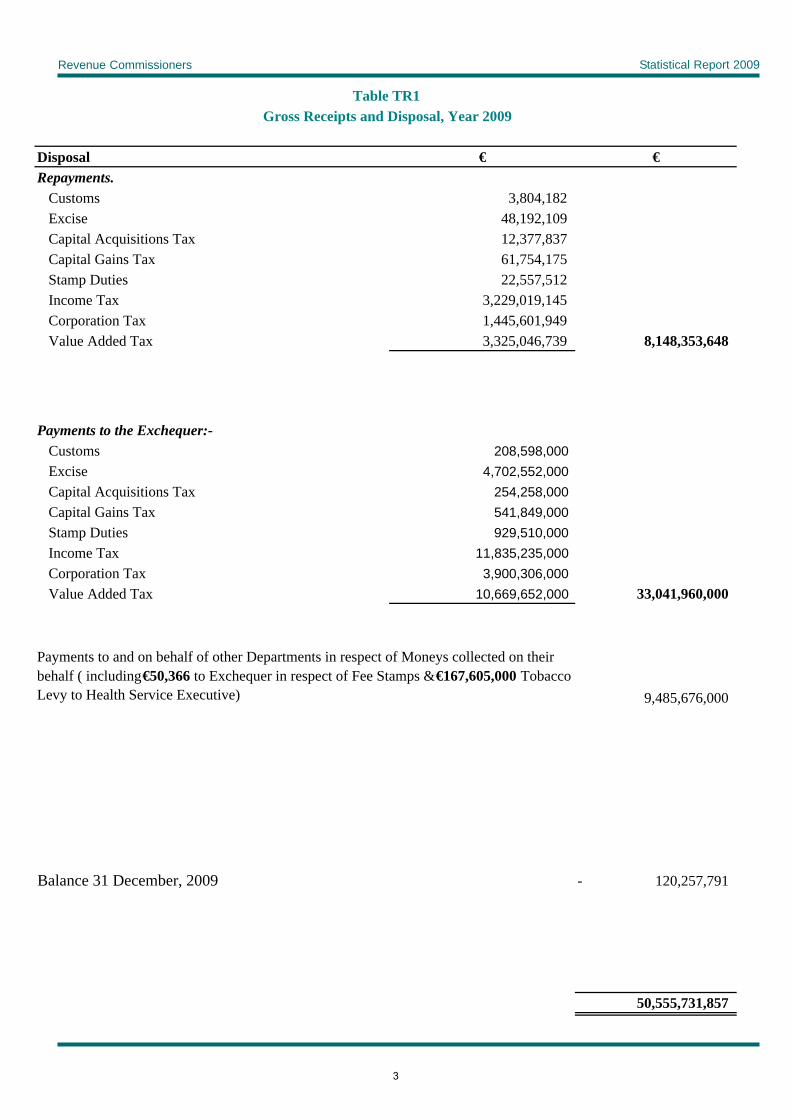
The particulars of the Revenue Receipts in the year ended 31 December 2009 are given in Table TR1.
Table TR2 contains net receipts of revenue for year ended 31 Dec 2009. Particulars are also given for the three preceding financial periods.
The "Gross Receipts" of any tax or duty for any given financial year means the aggregate amount of duty or tax actually collected or brought into the Revenue accounts within that year, no matter for what year the duty or tax may have been assessed or charged. It thus includes arrears of previous years.
The "Net Receipts" means the "Gross Receipts" after deduction of drawbacks, repayments etc. made within the same year. These drawbacks, repayments etc. may similarly relate to duty or tax in previous years.
1

Revenue Commissioners Statistical Report 2009
Table TR1Gross Receipts and Disposal, Year 2009
Gross Receipts € €
Balance on 1 January 2009 188,286,693-
Gross Receipts of Duties:-Customs (incls €1,664,245 Customs Duties on Agri Products) 211,975,316 Excise 4,949,535,509 Capital Acquisitions Tax 267,995,710 Capital Gains Tax 606,420,208 Stamp Duties 1,023,426,187 Income Tax 15,068,373,982 Corporation Tax 5,335,053,291 Value Added Tax 13,962,909,752 41,425,689,955
Gross Receipts of Moneys received and collected on behalf of other Departments (including Fee Stamps, €81,860) 9,318,328,595
50,555,731,857
2
Revenue Commissioners Statistical Report 2009
Table TR1Gross Receipts and Disposal, Year 2009
Disposal € €Repayments.
Customs 3,804,182 Excise 48,192,109 Capital Acquisitions Tax 12,377,837 Capital Gains Tax 61,754,175 Stamp Duties 22,557,512 Income Tax 3,229,019,145 Corporation Tax 1,445,601,949 Value Added Tax 3,325,046,739 8,148,353,648
Payments to the Exchequer:-Customs 208,598,000 Excise 4,702,552,000 Capital Acquisitions Tax 254,258,000 Capital Gains Tax 541,849,000 Stamp Duties 929,510,000 Income Tax 11,835,235,000 Corporation Tax 3,900,306,000 Value Added Tax 10,669,652,000 33,041,960,000
Payments to and on behalf of other Departments in respect of Moneys collected on their behalf ( including €50,366 to Exchequer in respect of Fee Stamps & €167,605,000 Tobacco Levy to Health Service Executive) 9,485,676,000
Balance 31 December, 2009 120,257,791-
50,555,731,857
3
Revenue Commissioners Statistical Report 2009
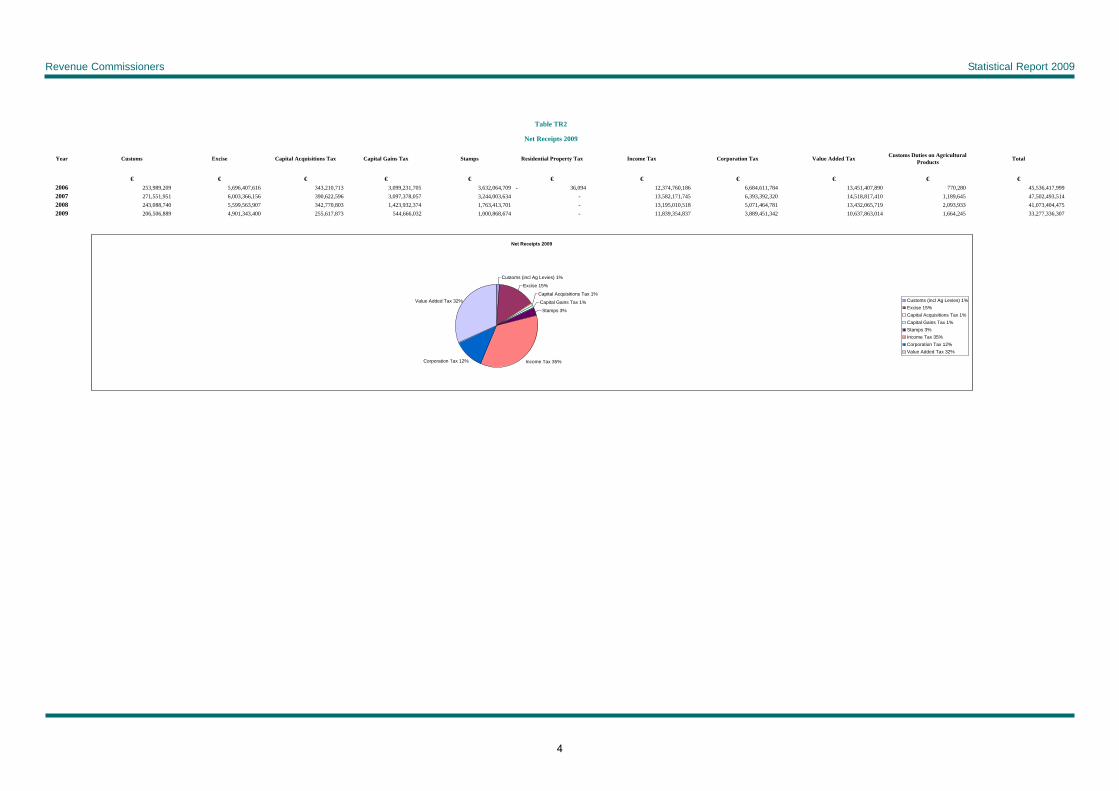
Table TR2
Net Receipts 2009
Year Customs Excise Capital Acquisitions Tax Capital Gains Tax Stamps Residential Property Tax Income Tax Corporation Tax Value Added Tax Customs Duties on Agricultural Products Total
€ € € € € € € € € € €2006 253,989,209 5,696,407,616 343,210,713 3,099,231,705 3,632,064,709 36,094- 12,374,760,186 6,684,611,784 13,451,407,890 770,280 45,536,417,999 2007 271,551,951 6,003,366,156 390,622,596 3,097,378,057 3,244,003,634 - 13,582,171,745 6,393,392,320 14,518,817,410 1,189,645 47,502,493,514 2008 243,088,740 5,599,563,907 342,770,803 1,423,932,374 1,763,413,701 - 13,195,010,518 5,071,464,781 13,432,065,719 2,093,933 41,073,404,475 2009 206,506,889 4,901,343,400 255,617,873 544,666,032 1,000,868,674 - 11,839,354,837 3,889,451,342 10,637,863,014 1,664,245 33,277,336,307
Net Receipts 2009
Customs (incl Ag Levies) 1%
Excise 15%
Capital Acquisitions Tax 1%
Capital Gains Tax 1%
Stamps 3%
Income Tax 35%Corporation Tax 12%
Value Added Tax 32% Customs (incl Ag Levies) 1%Excise 15%Capital Acquisitions Tax 1%Capital Gains Tax 1%Stamps 3%Income Tax 35%Corporation Tax 12%Value Added Tax 32%
4
Revenue Commissioners Statistical Report 2009
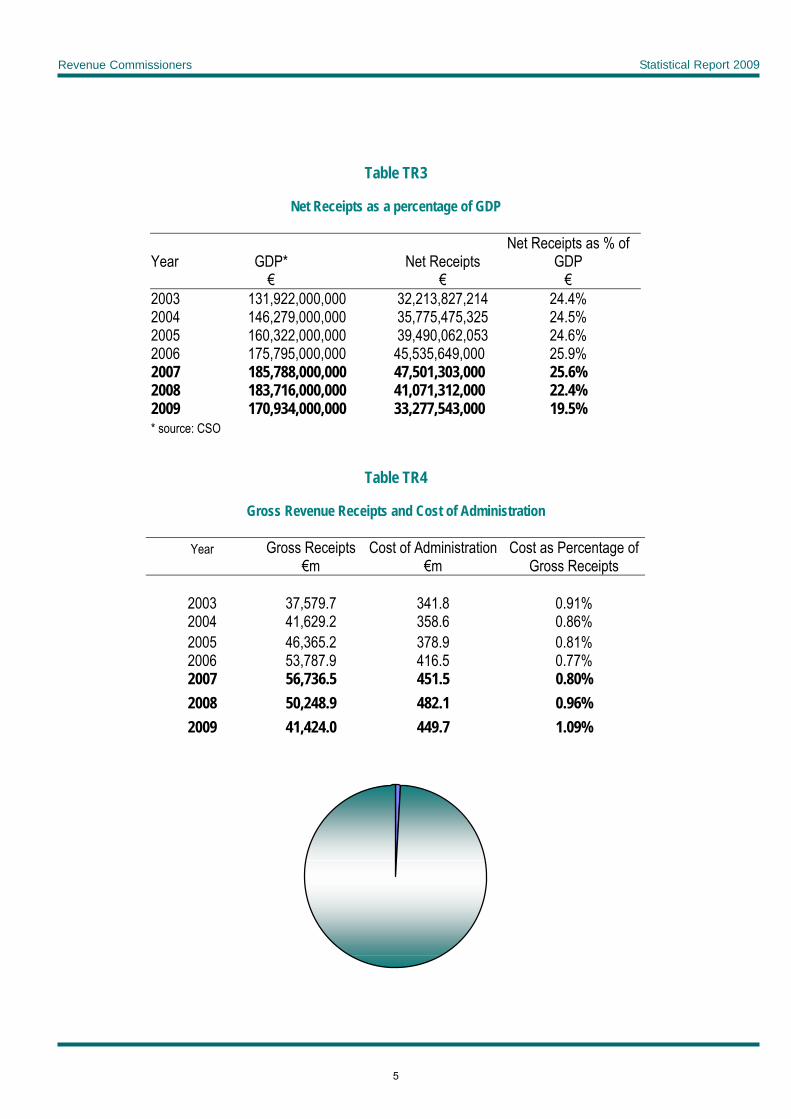
Table TR3
Net Receipts as a percentage of GDP
Year GDP* Net Receipts Net Receipts as % of
GDP € € € 2003 131,922,000,000 32,213,827,214 24.4% 2004 146,279,000,000 35,775,475,325 24.5% 2005 160,322,000,000 39,490,062,053 24.6% 2006 175,795,000,000 45,535,649,000 25.9% 2007 185,788,000,000 47,501,303,000 25.6% 2008 183,716,000,000 41,071,312,000 22.4% 2009 170,934,000,000 33,277,543,000 19.5% * source: CSO
Table TR4
Gross Revenue Receipts and Cost of Administration
Year Gross Receipts Cost of Administration Cost as Percentage of €m €m Gross Receipts
2003 37,579.7 341.8 0.91% 2004 41,629.2 358.6 0.86% 2005 46,365.2 378.9 0.81% 2006 53,787.9 416.5 0.77% 2007 56,736.5 451.5 0.80% 2008 50,248.9 482.1 0.96% 2009 41,424.0 449.7 1.09%
5
pdoher01
Text Box
Cost of Administration as % of Gross Receipts 1.09%
Revenue Commissioners Statistical Report 2009
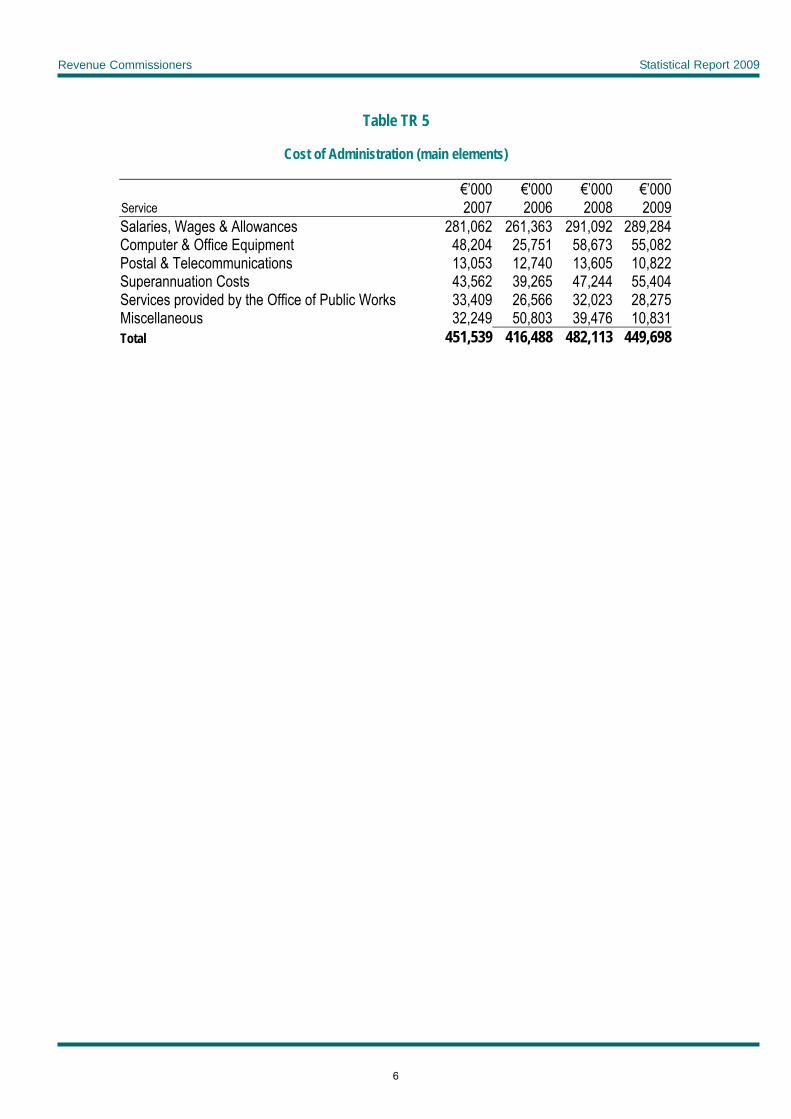
Table TR 5
Cost of Administration (main elements)
S ervice €’000
2007€'000 2006
€’0002008
€’000 2009
Salaries, Wages & Allowances 281,062 261,363 291,092 289,284 Computer & Office Equipment 48,204 25,751 58,673 55,082 Postal & Telecommunications 13,053 12,740 13,605 10,822 Superannuation Costs 43,562 39,265 47,244 55,404 Services provided by the Office of Public Works 33,409 26,566 32,023 28,275 Miscellaneous 32,249 50,803 39,476 10,831 Total 451,539 416,488 482,113 449,698
6
Revenue Commissioners Statistical Report 2009
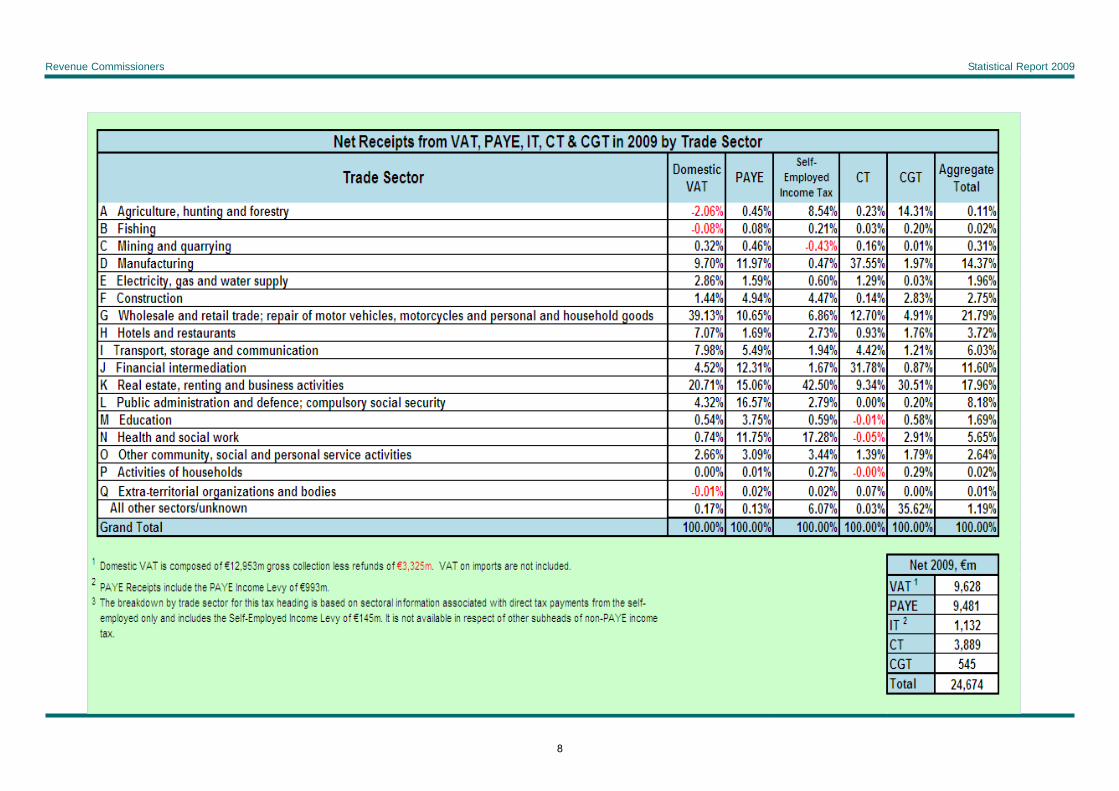
Table TR6
Net Receipts from Domestic VAT, PAYE, Self-Employed Income Tax (IT), Corporation Tax (CT) and Capital Gains Tax (CGT) in 2009 by Trade Sector
Table TR6 contains an estimated breakdown of the net receipts from PAYE (Inc. the PAYE Income Levy), Domestic VAT, IT, CT and CGT on a percentage basis by trade sector for the year ended 31 December 2009. A corresponding breakdown is not available for Stamp Duty, VAT on Imports, Customs or Capital Acquisitions Tax. The sector identifier used on the tax records is based on the 4 digit “NACE code (Rev. 1.1)” which is an internationally recognised economic activity code system. The NACE codes are not essential for the assessment and collection of taxes and duties and the correct allocation and maintenance of these codes is subject to the limit of available resources. NACE code classifications in tax records are compiled by reference to the primary area of economic activity reported by individual and corporate taxpayers on their own behalf. The taxes collected are allocated to those codes without reference to the precise economic activity that generated them. While the accuracy of the NACE codes on tax records is sufficient to underpin broad sector-based analyses there will undoubtedly be some inaccuracies at individual level. This should be borne in mind when considering the information provided.
7
Revenue Commissioners Statistical Report 2009
8
Revenue Commissioners Statistical Report 2009
Excise • Table EX1 Main Excise Duty Rates • Table EX2 Excise Duty Net Receipts Excise Duty on Beer • Table EX3 Net Duty Paid Quantities and Net Excise Receipts • Table EX4 Incidence of Duty and VAT per Pint of Stout • Table EX5 Incidence of Duty and VAT per Pint of Lager
Excise Duty on Spirits • Table EX6 Quantities Retained for Home Use and Net Excise Receipts • Table EX7 Incidence of Duty and VAT per Standard Measure of Whiskey • Table EX8 Incidence of Duty and VAT per Bottle of Whiskey
Excise Duty on Wine, Intermediate Products and Other Fermented Beverages • Table EX9 Quantities Retained for Home Use and Net Excise Receipts Excise Duty on Cider and Perry • Table EX10 Quantities Retained for Home Use and Net Excise Receipts Excise Duty on Betting, Bookmaking Premises and Bookmakers Licences • Table EX11 Betting Duty, Bookmaking Premises Duty and Bookmakers Licences
Duty Excise Duty and Vehicle Registration Tax (VRT) on Motor Vehicles and Motor Cycles • Table EX12 Motor Vehicle Registration Tax – Gross Registrations and Net Receipts • Table EX12A Motor Car Registration Tax – Gross Registrations 2008 • Table EX12B Motor Car Registration Tax – Gross Registrations 2009 Excise Duty on Mineral Hydrocarbon Light Oils • Table EX13 Quantities Retained for Home Use and Net Excise Receipts • Table EX14 Incidence of Duty and VAT per Litre of Unleaded Petrol Excise Duty on Hydrocarbon Oils Other Sorts • Table EX15 Quantities Retained for Home Use and Net Excise Receipts • Table EX16 Incidence of Duty and VAT per Litre of Auto Diesel Excise Duty on Gaseous Hydrocarbons in Liquid Form (LPG) • Table EX17 Quantities Retained for Home Use and Net Excise Receipts Excise Duty on Tobacco Products • Table EX18 Quantities Retained for Home Use and Net Excise Receipts • Table EX19 Incidence of Duty and VAT per Packet of 20 Cigarettes Excise Licences • Table EX20 Numbers and Net Receipts 1. Customs Duties and Excise Duties, are, generally speaking, imposed in respect of transactions or events and
not by reference to any period of time. The general statistics of these duties, for any year, thus relate, broadly, to the actual cash receipts, etc., of revenue within that year.
2. In Tables relating to Excise duties the quantities of commodities shown as retained for home use (i.e. net
quantities on which duty was paid after allowing for quantities on which duty was repaid, e.g. as drawback) in the respective financial years may differ from the quantities actually consumed in these years, owing to clearances being delayed or advanced, as the case may be, e.g., in anticipation of Budget changes or because of international developments.
1

Revenue Commissioners Statistical Report 2009
MAIN EXCISE DUTY RATES
TABLE EX1 w/e/f 15/10/08 w/e/f 8/04/09
COMMODITY TYPE 2007 2008 2008 2009
€ € € €ALCOHOL PRODUCTS TAX
1 BEER (per hectolitre percent of alcohol) 19.87 19.87exceeding 1.2% vol but not exceeding 2.8% vol 9.93 9.93exceeding 2.8% vol 19.87 19.87
2 SPIRITS (per Litre of alcohol) (with effect from 1 July 1996) 39.25 39.25 39.25 39.25Not exceeding 5.5% volume (with effect from 1 July 1996) 39.25 39.25 39.25 39.25
3 WINE (per hectolitre) - Of an alcoholic strength by volume:Still and Sparkling not exceeding 5.5% 90.98 90.98 109.34 109.34Still exceeding 5.5% but not exceeding 15% 273.00 273.00 328.09 328.09Still exceeding 15% 396.12 396.12 476.06 476.06Sparkling exceeding 5.5% 546.01 546.01 656.18 656.18
4 Other Fermented Beverages(a) CIDER AND PERRY (per hectolitre) - Of an alcoholic strength by volume:Still and Sparkling, not exceeding 2.8% vol 41.62 41.62Still and Sparkling, exceeding 2.8% but not exceeding 6% vol 83.25 83.25Still and Sparkling not exceeding 6% 83.25 83.25Still and Sparkling exceeding 6% but not exceeding 8.5% 192.47 192.47 192.47 192.47Still exceeding 8.5% 273.00 273.00 273.00 273.00Sparkling exceeding 8.5% 546.01 546.01 546.01 546.01(b) Other than CIDER AND PERRY (per hectolitre) - Of an alcoholic strength by volume:Still and Sparkling not exceeding 5.5% 90.98 90.98 109.34 109.34Still exceeding 5.5% 273.00 273.00 328.09 328.09Sparkling exceeding 5.5% 546.01 546.01 656.18 656.18
5 Intermediate BeveragesStill not exceeding 15% 273.00 273.00 328.09 328.09Still exceeding 15% 396.12 396.12 476.06 476.06Sparkling 546.01 546.01 656.18 656.18
TOBACCO PRODUCTS
1 CIGARETTESSpecific duty per 1,000 cigarettes 151.37 160.57 175.30 183.42Ad Valorem duty as percent of retail price 17.78% 17.92% 18.28% 18.25%
2 CIGARS (per kilogram) 217.388 229.917 250.729 261.0663 FINE CUT TOBACCO FOR ROLLING OF CIGARETTES (per kilogram) 183.443 194.016 211.578 220.3014 OTHER SMOKING TOBACCO (per kilogram) 150.815 159.507 173.946 181.117
MINERAL OIL TAXMINERAL HYDROCARBON LIGHT OILS (per 1,000 Litres)
1 LEADED PETROL 553.04 553.04 553.042 UNLEADED PETROL 442.68 442.68 508.79 508.793 SUPER UNLEADED 547.79 547.79 547.79
HYDROCARBON OILS OTHER SORTS (per 1,000 Litres)
1 HEAVY OIL (AUTO DIESEL) 368.05 368.05 368.05 409.20Auto Diesel - (non Low Sulphur) with effect from 1 March 2002 420.44 420.44 420.44Auto Diesel - Scheduled passenger road transport services 22.72 22.72 22.72
2 HEAVY OIL (NON AUTO USE - REBATE RATE) Transport Services 47.36 47.36 47.36 47.36KEROSENE (with effect from 1 December 1999) 0.00 0.00 0.00 0.00
3 FUEL OIL Industrial 14.78 14.78 14.78 14.78For the use in the Generation of Electricity for sale 14.78 14.78 14.78 14.78
4 AUTO LPG AND METHANE 63.59 63.59 63.59 63.595 OTHER LPG 0.00 0.00 0.00 0.006 COAL (with effect from 01/07/2005)*
For business use (per tonne) 4.18 4.18 4.18 4.18For other use (per tonne) 8.36 8.36 8.36 8.36
10 Electricity (with effect from 01/10/2008) **For business use (per Megawatt hour) 0.50 0.50 0.50For other use (per Megawatt hour) 1.00 1.00 1.00
For alcohol products, the classification are those which apply since 1 July 2004, when the new Alcohol Products Tax law came into force. The classification of "Other Fermented Beverage" ( with Cider and Perry as a sub-category) and the old "Made Wine" classification was abolished. There was however no change to the rate applied to any alcohol product as a result of this reclassification
2
Revenue Commissioners Statistical Report 2009
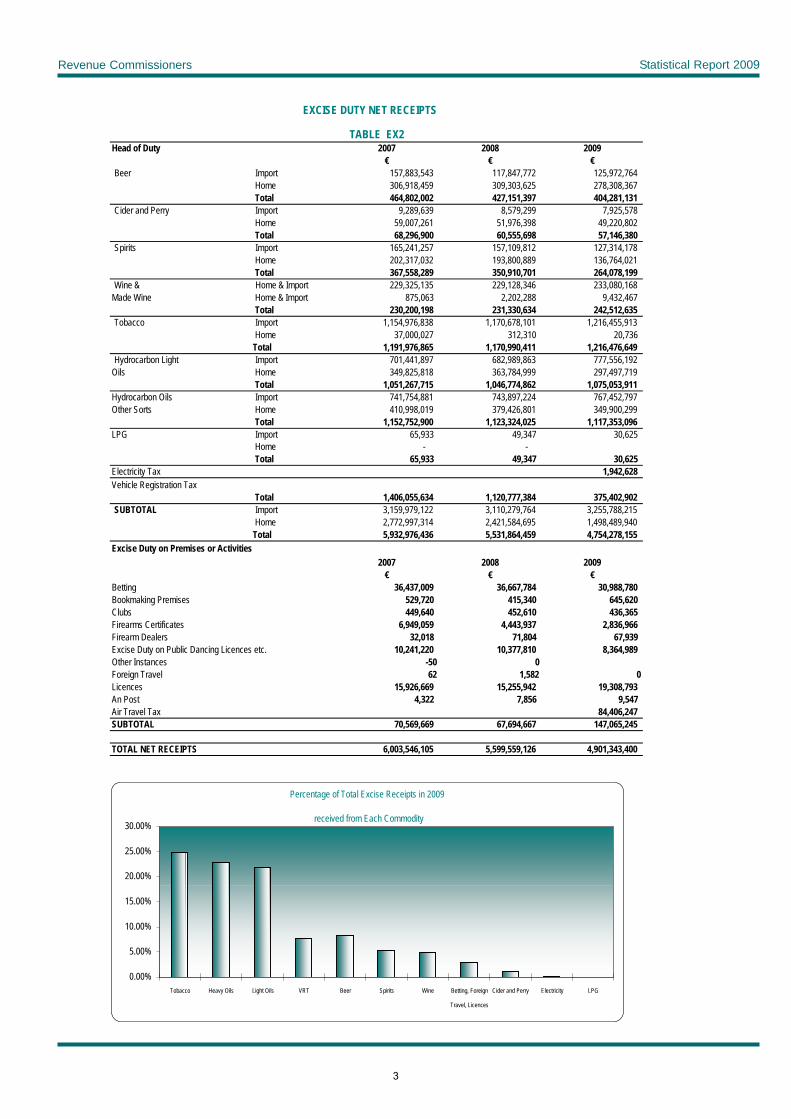
EXCISE DUTY NET RECEIPTS
TABLE EX2Head of Duty 2007 2008 2009
€ € €Beer Import 157,883,543 117,847,772 125,972,764
Home 306,918,459 309,303,625 278,308,367 Total 464,802,002 427,151,397 404,281,131
Cider and Perry Import 9,289,639 8,579,299 7,925,578 Home 59,007,261 51,976,398 49,220,802 Total 68,296,900 60,555,698 57,146,380
Spirits Import 165,241,257 157,109,812 127,314,178 Home 202,317,032 193,800,889 136,764,021 Total 367,558,289 350,910,701 264,078,199
Wine & Home & Import 229,325,135 229,128,346 233,080,168 Made Wine Home & Import 875,063 2,202,288 9,432,467
Total 230,200,198 231,330,634 242,512,635 Tobacco Import 1,154,976,838 1,170,678,101 1,216,455,913
Home 37,000,027 312,310 20,736 Total 1,191,976,865 1,170,990,411 1,216,476,649
Hydrocarbon Light Import 701,441,897 682,989,863 777,556,192 Oils Home 349,825,818 363,784,999 297,497,719
Total 1,051,267,715 1,046,774,862 1,075,053,911 Hydrocarbon Oils Import 741,754,881 743,897,224 767,452,797 Other Sorts Home 410,998,019 379,426,801 349,900,299
Total 1,152,752,900 1,123,324,025 1,117,353,096 LPG Import 65,933 49,347 30,625
Home - - Total 65,933 49,347 30,625
Electricity Tax 1,942,628 Vehicle Registration Tax
Total 1,406,055,634 1,120,777,384 375,402,902 SUBTOTAL Import 3,159,979,122 3,110,279,764 3,255,788,215
Home 2,772,997,314 2,421,584,695 1,498,489,940 Total 5,932,976,436 5,531,864,459 4,754,278,155
Excise Duty on Premises or Activities2007 2008 2009
€ € €Betting 36,437,009 36,667,784 30,988,780 Bookmaking Premises 529,720 415,340 645,620 Clubs 449,640 452,610 436,365 Firearms Certificates 6,949,059 4,443,937 2,836,966 Firearm Dealers 32,018 71,804 67,939 Excise Duty on Public Dancing Licences etc. 10,241,220 10,377,810 8,364,989 Other Instances -50 0Foreign Travel 62 1,582 0Licences 15,926,669 15,255,942 19,308,793 An Post 4,322 7,856 9,547 Air Travel Tax 84,406,247 SUBTOTAL 70,569,669 67,694,667 147,065,245
TOTAL NET RECEIPTS 6,003,546,105 5,599,559,126 4,901,343,400
Percentage of Total Excise Receipts in 2009
received from Each Commodity
0.00%
5.00%
10.00%
15.00%
20.00%
25.00%
30.00%
Tobacco Heavy Oils Light Oils VRT Beer Spirits Wine Betting, Foreign
Travel, Licences
Cider and Perry Electricity LPG
3
Revenue Commissioners Statistical Report 2009
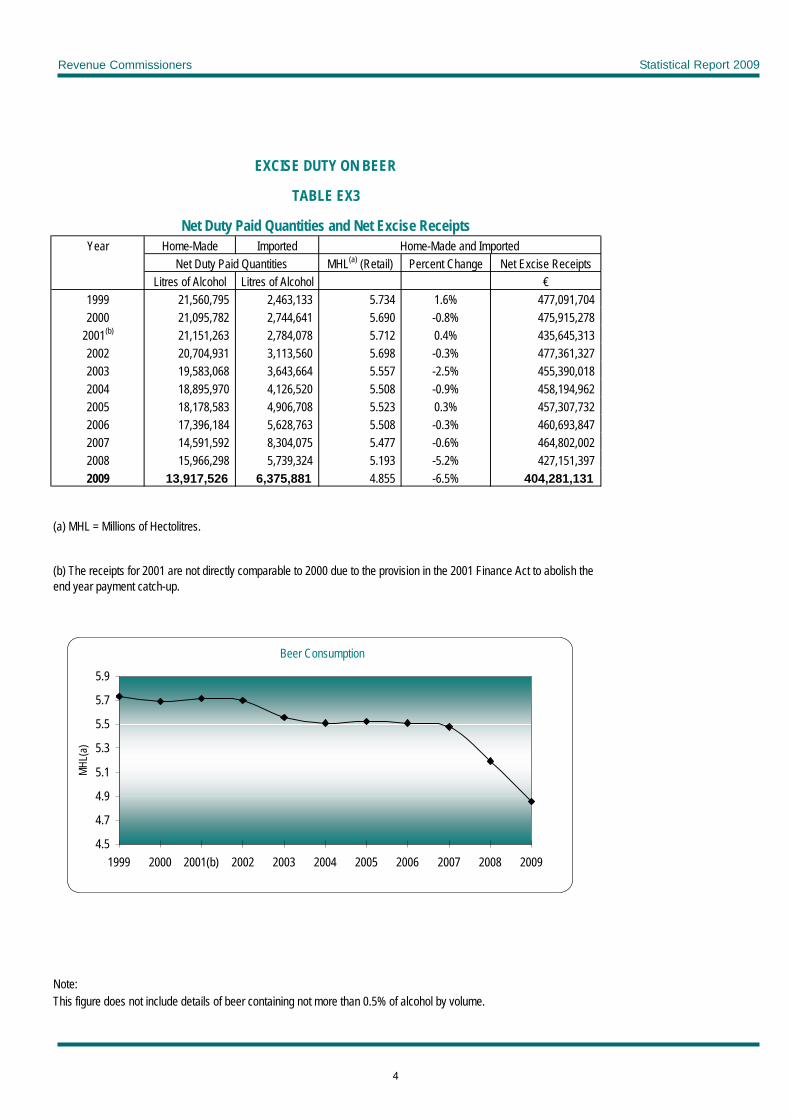
EXCISE DUTY ON BEER
TABLE EX3
Net Duty Paid Quantities and Net Excise ReceiptsYear Home-Made Imported Home-Made and Imported
Net Duty Paid Quantities MHL(a) (Retail) Percent Change Net Excise ReceiptsLitres of Alcohol Litres of Alcohol €
1999 21,560,795 2,463,133 5.734 1.6% 477,091,704 2000 21,095,782 2,744,641 5.690 -0.8% 475,915,278
2001(b) 21,151,263 2,784,078 5.712 0.4% 435,645,313 2002 20,704,931 3,113,560 5.698 -0.3% 477,361,327 2003 19,583,068 3,643,664 5.557 -2.5% 455,390,018 2004 18,895,970 4,126,520 5.508 -0.9% 458,194,962 2005 18,178,583 4,906,708 5.523 0.3% 457,307,732 2006 17,396,184 5,628,763 5.508 -0.3% 460,693,847 2007 14,591,592 8,304,075 5.477 -0.6% 464,802,002 2008 15,966,298 5,739,324 5.193 -5.2% 427,151,397 2009 13,917,526 6,375,881 4.855 -6.5% 404,281,131
(a) MHL = Millions of Hectolitres.
(b) The receipts for 2001 are not directly comparable to 2000 due to the provision in the 2001 Finance Act to abolish the end year payment catch-up.
Note:This figure does not include details of beer containing not more than 0.5% of alcohol by volume.
Beer Consumption
4.5
4.7
4.9
5.1
5.3
5.5
5.7
5.9
1999 2000 2001(b) 2002 2003 2004 2005 2006 2007 2008 2009
MHL(
a)
4
Revenue Commissioners Statistical Report 2009
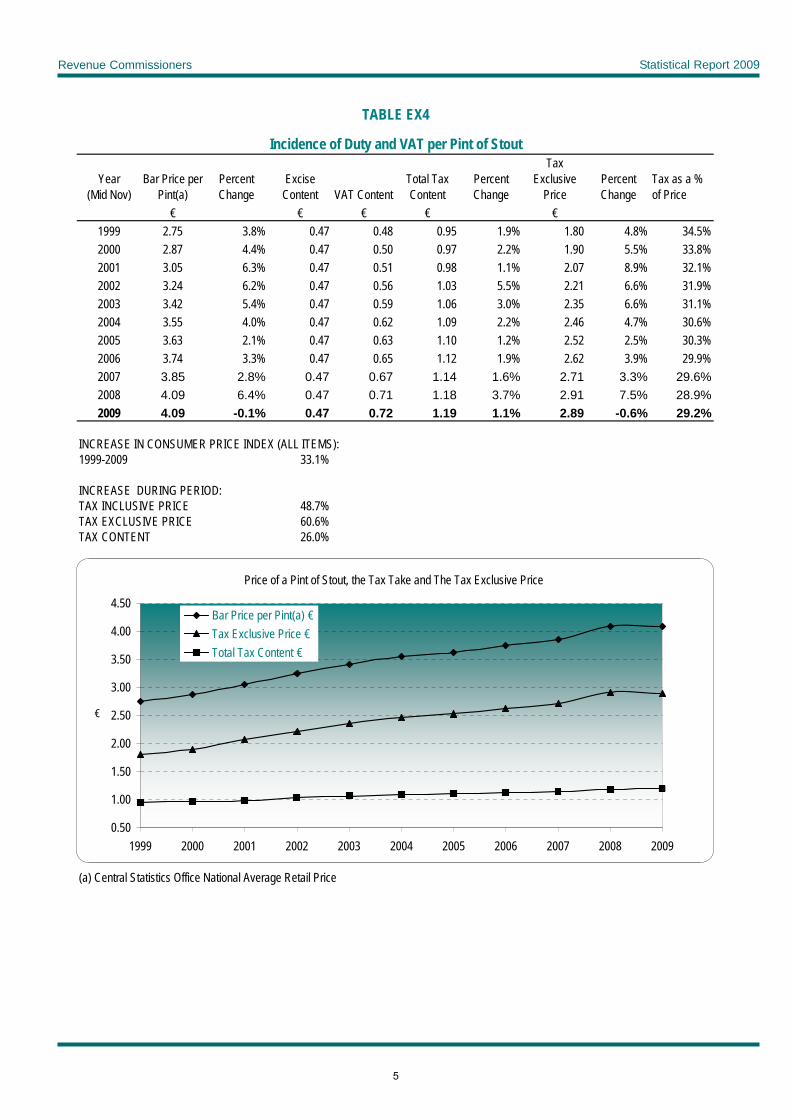
Incidence of Duty and VAT per Pint of Stout
Year (Mid Nov)
Bar Price per Pint(a)
Percent Change
Excise Content VAT Content
Total Tax Content
Percent Change
Tax Exclusive
PricePercent Change
Tax as a % of Price
€ € € € €1999 2.75 3.8% 0.47 0.48 0.95 1.9% 1.80 4.8% 34.5%2000 2.87 4.4% 0.47 0.50 0.97 2.2% 1.90 5.5% 33.8%2001 3.05 6.3% 0.47 0.51 0.98 1.1% 2.07 8.9% 32.1%2002 3.24 6.2% 0.47 0.56 1.03 5.5% 2.21 6.6% 31.9%2003 3.42 5.4% 0.47 0.59 1.06 3.0% 2.35 6.6% 31.1%2004 3.55 4.0% 0.47 0.62 1.09 2.2% 2.46 4.7% 30.6%2005 3.63 2.1% 0.47 0.63 1.10 1.2% 2.52 2.5% 30.3%2006 3.74 3.3% 0.47 0.65 1.12 1.9% 2.62 3.9% 29.9%2007 3.85 2.8% 0.47 0.67 1.14 1.6% 2.71 3.3% 29.6%2008 4.09 6.4% 0.47 0.71 1.18 3.7% 2.91 7.5% 28.9%2009 4.09 -0.1% 0.47 0.72 1.19 1.1% 2.89 -0.6% 29.2%
INCREASE IN CONSUMER PRICE INDEX (ALL ITEMS):1999-2009 33.1%
INCREASE DURING PERIOD:TAX INCLUSIVE PRICE 48.7%TAX EXCLUSIVE PRICE 60.6%TAX CONTENT 26.0%
(a) Central Statistics Office National Average Retail Price
TABLE EX4
Price of a Pint of Stout, the Tax Take and The Tax Exclusive Price
0.50
1.00
1.50
2.00
2.50
3.00
3.50
4.00
4.50
1999 2000 2001 2002 2003 2004 2005 2006 2007 2008 2009
€
Bar Price per Pint(a) €Tax Exclusive Price €Total Tax Content €
5
Revenue Commissioners Statistical Report 2009
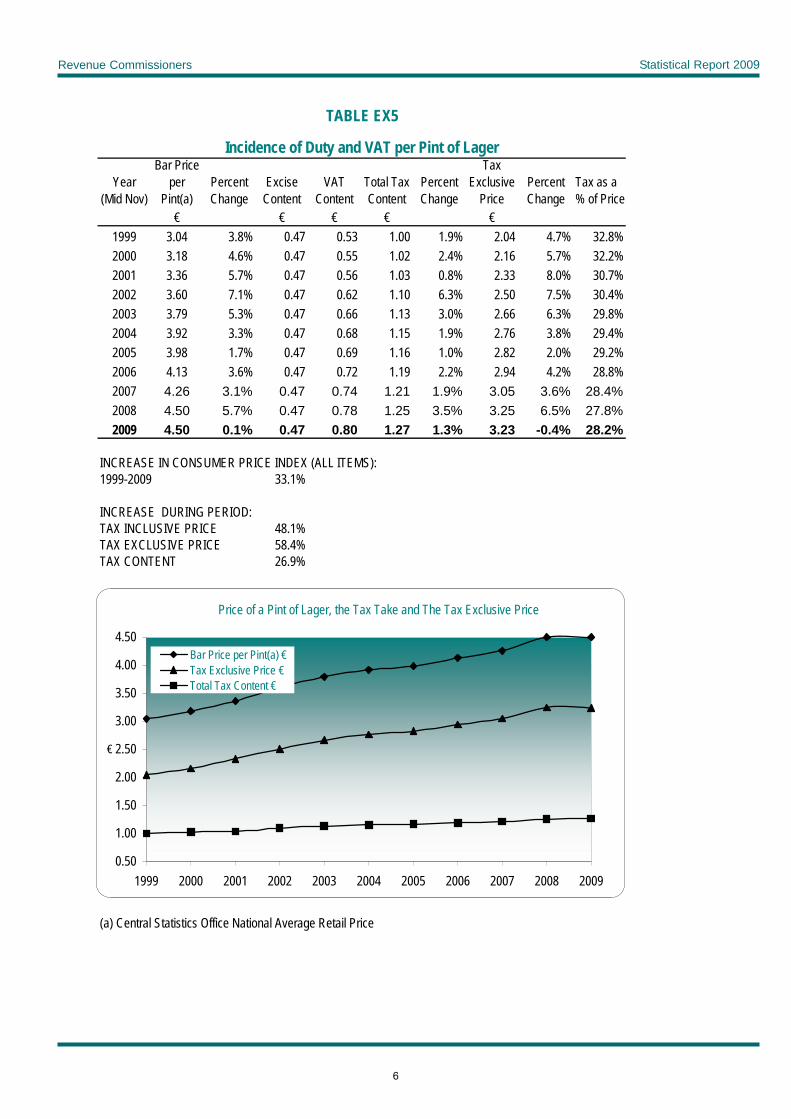
Incidence of Duty and VAT per Pint of Lager
Year (Mid Nov)
Bar Price per
Pint(a)Percent Change
Excise Content
VAT Content
Total Tax Content
Percent Change
Tax Exclusive
PricePercent Change
Tax as a % of Price
€ € € € €1999 3.04 3.8% 0.47 0.53 1.00 1.9% 2.04 4.7% 32.8%2000 3.18 4.6% 0.47 0.55 1.02 2.4% 2.16 5.7% 32.2%2001 3.36 5.7% 0.47 0.56 1.03 0.8% 2.33 8.0% 30.7%2002 3.60 7.1% 0.47 0.62 1.10 6.3% 2.50 7.5% 30.4%2003 3.79 5.3% 0.47 0.66 1.13 3.0% 2.66 6.3% 29.8%2004 3.92 3.3% 0.47 0.68 1.15 1.9% 2.76 3.8% 29.4%2005 3.98 1.7% 0.47 0.69 1.16 1.0% 2.82 2.0% 29.2%2006 4.13 3.6% 0.47 0.72 1.19 2.2% 2.94 4.2% 28.8%2007 4.26 3.1% 0.47 0.74 1.21 1.9% 3.05 3.6% 28.4%2008 4.50 5.7% 0.47 0.78 1.25 3.5% 3.25 6.5% 27.8%2009 4.50 0.1% 0.47 0.80 1.27 1.3% 3.23 -0.4% 28.2%
INCREASE IN CONSUMER PRICE INDEX (ALL ITEMS): 1999-2009 33.1%
INCREASE DURING PERIOD:TAX INCLUSIVE PRICE 48.1%TAX EXCLUSIVE PRICE 58.4%TAX CONTENT 26.9%
(a) Central Statistics Office National Average Retail Price
TABLE EX5
Price of a Pint of Lager, the Tax Take and The Tax Exclusive Price
0.50
1.00
1.50
2.00
2.50
3.00
3.50
4.00
4.50
1999 2000 2001 2002 2003 2004 2005 2006 2007 2008 2009
€
Bar Price per Pint(a) €Tax Exclusive Price €Total Tax Content €
6

Revenue Commissioners Statistical Report 2009
EXCISE DUTY ON SPIRITS
TABLE EX6
Quantities Retained for Home Use and Net Excise Receipts
Year Home-Made Imported Home Made and ImportedQuantity
(Litres of Alcohol)Quantity
(Litres of Alcohol) Total Quantity (Litres
of Alcohol) Percent ChangeNet Excise Receipts
€1999 4,942,313 3,053,211 7,995,524 14.2% 217,950,162 2000 5,227,603 3,766,404 8,994,007 12.5% 247,086,036
2001(a) 5,453,943 3,857,932 9,311,875 3.5% 220,918,042 2002 5,528,741 4,263,433 9,792,174 5.2% 266,461,434 2003 4,397,020 3,429,447 7,826,467 -20.1% 305,025,639 2004 4,483,198 3,566,251 8,049,449 2.8% 314,906,447 2005 4,719,672 3,522,485 8,242,157 2.4% 319,779,101 2006 4,909,376 3,743,038 8,652,414 5.0% 338,040,281 2007 5,208,496 4,065,576 9,274,072 7.2% 367,558,289 2008 4,702,231 3,885,116 8,587,347 -7.4% 350,910,701 2009 3,617,722 3,383,126 7,000,848 -18.5% 264,078,199
Note:The quantities shown do not include perfumed spirits, spirits delivered for methylation, scientific purposes fortifying wines or use in arts and manufacture, and other spirits (including spirits contained in goods) delivered without payment of duty.
For excise purposes, the strength of spirits is expressed by reference to alcoholic strength by volume and the rates of excise duty in terms of alcoholic content. “Alcoholic strength by volume” means the ratio of the volume of alcohol present in a product at a temperature of 20°C to the total volume of the product at the same temperature, the ratio being expressed as a percentage and “alcohol” means pure ethyl alcohol.
(a) The receipts for 2001 are not directly comparable to 2000 due to the provision in the 2001 Finance Act to abolish the end year payment catch-up.
Spirit Consumption
5,000,000
6,000,000
7,000,000
8,000,000
9,000,000
10,000,000
1999 2000 2001(a) 2002 2003 2004 2005 2006 2007 2008 2009
Litre
s of A
lcoho
l
7
Revenue Commissioners Statistical Report 2009
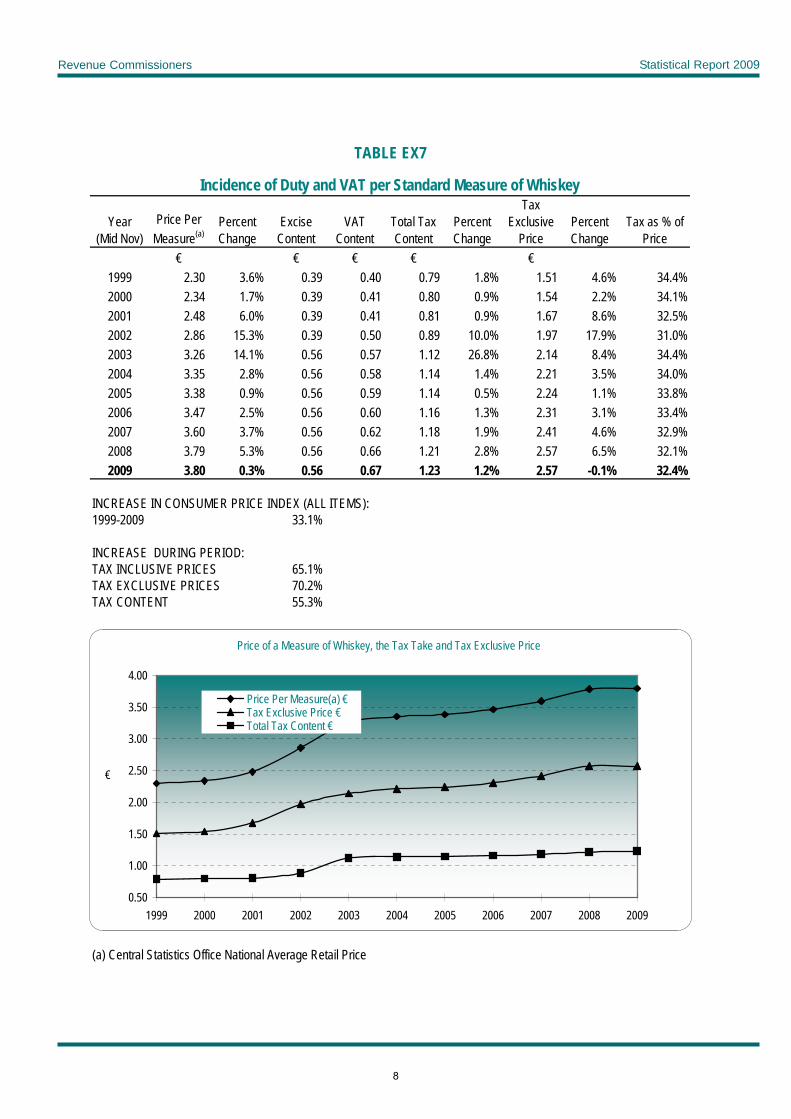
TABLE EX7
Incidence of Duty and VAT per Standard Measure of Whiskey
Year (Mid Nov)
Price Per Measure(a)
Percent Change
Excise Content
VAT Content
Total Tax Content
Percent Change
Tax Exclusive
PricePercent Change
Tax as % of Price
€ € € € €1999 2.30 3.6% 0.39 0.40 0.79 1.8% 1.51 4.6% 34.4%2000 2.34 1.7% 0.39 0.41 0.80 0.9% 1.54 2.2% 34.1%2001 2.48 6.0% 0.39 0.41 0.81 0.9% 1.67 8.6% 32.5%2002 2.86 15.3% 0.39 0.50 0.89 10.0% 1.97 17.9% 31.0%2003 3.26 14.1% 0.56 0.57 1.12 26.8% 2.14 8.4% 34.4%2004 3.35 2.8% 0.56 0.58 1.14 1.4% 2.21 3.5% 34.0%2005 3.38 0.9% 0.56 0.59 1.14 0.5% 2.24 1.1% 33.8%2006 3.47 2.5% 0.56 0.60 1.16 1.3% 2.31 3.1% 33.4%2007 3.60 3.7% 0.56 0.62 1.18 1.9% 2.41 4.6% 32.9%2008 3.79 5.3% 0.56 0.66 1.21 2.8% 2.57 6.5% 32.1%2009 3.80 0.3% 0.56 0.67 1.23 1.2% 2.57 -0.1% 32.4%
INCREASE IN CONSUMER PRICE INDEX (ALL ITEMS):1999-2009 33.1%
INCREASE DURING PERIOD:TAX INCLUSIVE PRICES 65.1%TAX EXCLUSIVE PRICES 70.2%TAX CONTENT 55.3%
(a) Central Statistics Office National Average Retail Price
Price of a Measure of Whiskey, the Tax Take and Tax Exclusive Price
0.50
1.00
1.50
2.00
2.50
3.00
3.50
4.00
1999 2000 2001 2002 2003 2004 2005 2006 2007 2008 2009
€
Price Per Measure(a) €Tax Exclusive Price €Total Tax Content €
8
Revenue Commissioners Statistical Report 2009
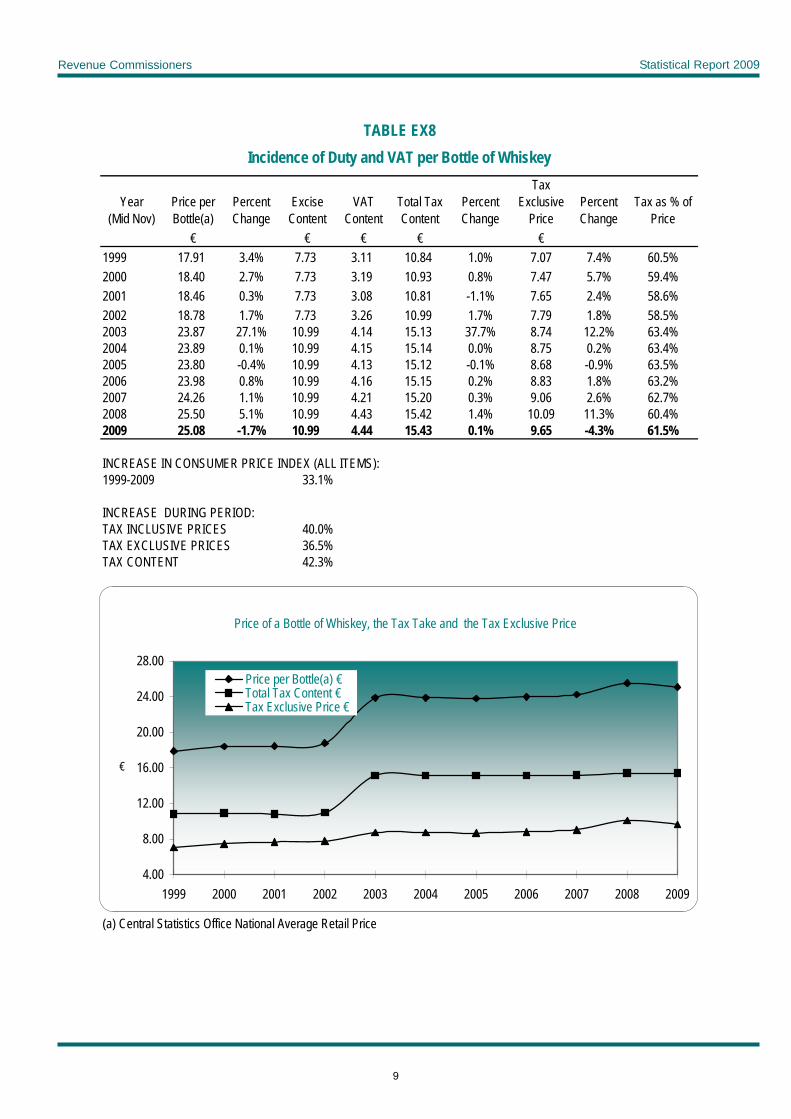
TABLE EX8Incidence of Duty and VAT per Bottle of Whiskey
Year (Mid Nov)
Price per Bottle(a)
Percent Change
Excise Content
VAT Content
Total Tax Content
Percent Change
Tax Exclusive
PricePercent Change
Tax as % of Price
€ € € € €1999 17.91 3.4% 7.73 3.11 10.84 1.0% 7.07 7.4% 60.5%2000 18.40 2.7% 7.73 3.19 10.93 0.8% 7.47 5.7% 59.4%2001 18.46 0.3% 7.73 3.08 10.81 -1.1% 7.65 2.4% 58.6%2002 18.78 1.7% 7.73 3.26 10.99 1.7% 7.79 1.8% 58.5%2003 23.87 27.1% 10.99 4.14 15.13 37.7% 8.74 12.2% 63.4%2004 23.89 0.1% 10.99 4.15 15.14 0.0% 8.75 0.2% 63.4%2005 23.80 -0.4% 10.99 4.13 15.12 -0.1% 8.68 -0.9% 63.5%2006 23.98 0.8% 10.99 4.16 15.15 0.2% 8.83 1.8% 63.2%2007 24.26 1.1% 10.99 4.21 15.20 0.3% 9.06 2.6% 62.7%2008 25.50 5.1% 10.99 4.43 15.42 1.4% 10.09 11.3% 60.4%2009 25.08 -1.7% 10.99 4.44 15.43 0.1% 9.65 -4.3% 61.5%
INCREASE IN CONSUMER PRICE INDEX (ALL ITEMS): 1999-2009 33.1%
INCREASE DURING PERIOD:TAX INCLUSIVE PRICES 40.0%TAX EXCLUSIVE PRICES 36.5%TAX CONTENT 42.3%
(a) Central Statistics Office National Average Retail Price
Price of a Bottle of Whiskey, the Tax Take and the Tax Exclusive Price
4.00
8.00
12.00
16.00
20.00
24.00
28.00
1999 2000 2001 2002 2003 2004 2005 2006 2007 2008 2009
€
Price per Bottle(a) €Total Tax Content €Tax Exclusive Price €
9
Revenue Commissioners Statistical Report 2009
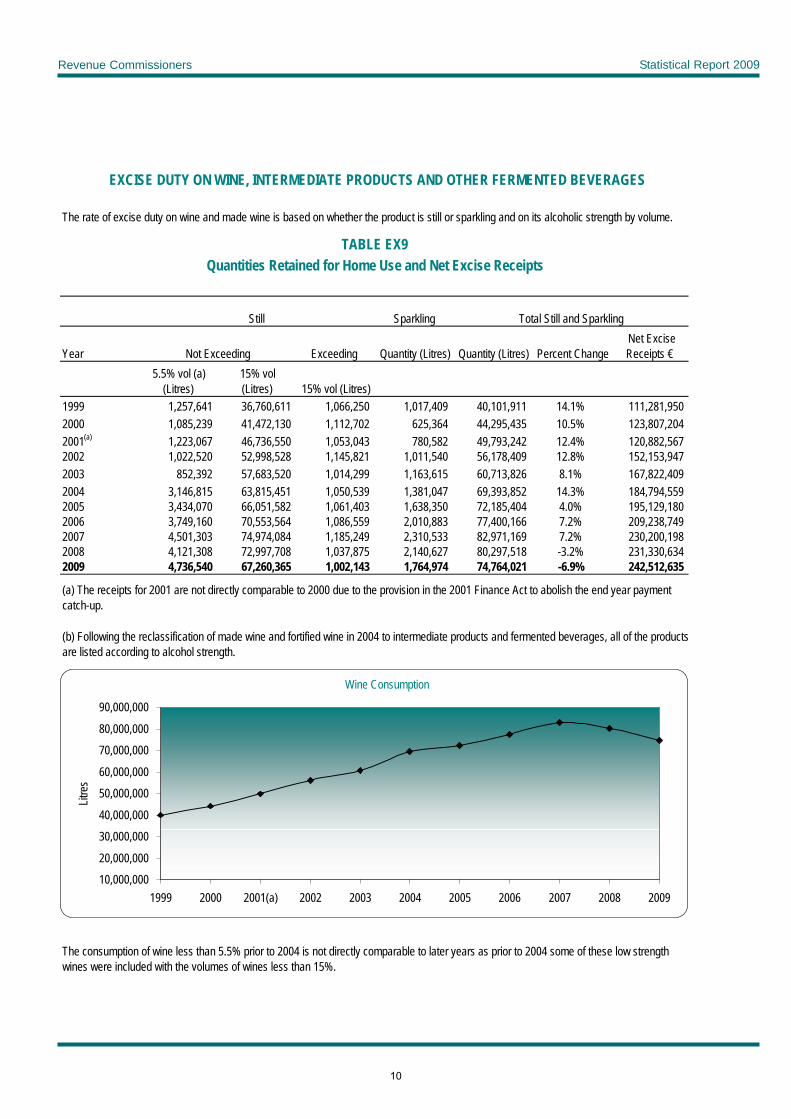
EXCISE DUTY ON WINE, INTERMEDIATE PRODUCTS AND OTHER FERMENTED BEVERAGES
TABLE EX9Quantities Retained for Home Use and Net Excise Receipts
Still Sparkling Total Still and Sparkling
Year Not Exceeding Exceeding Quantity (Litres) Quantity (Litres) Percent Change Net Excise Receipts €
5.5% vol (a) (Litres)
15% vol (Litres) 15% vol (Litres)
1999 1,257,641 36,760,611 1,066,250 1,017,409 40,101,911 14.1% 111,281,950 2000 1,085,239 41,472,130 1,112,702 625,364 44,295,435 10.5% 123,807,204 2001(a) 1,223,067 46,736,550 1,053,043 780,582 49,793,242 12.4% 120,882,567 2002 1,022,520 52,998,528 1,145,821 1,011,540 56,178,409 12.8% 152,153,947 2003 852,392 57,683,520 1,014,299 1,163,615 60,713,826 8.1% 167,822,409 2004 3,146,815 63,815,451 1,050,539 1,381,047 69,393,852 14.3% 184,794,559 2005 3,434,070 66,051,582 1,061,403 1,638,350 72,185,404 4.0% 195,129,180 2006 3,749,160 70,553,564 1,086,559 2,010,883 77,400,166 7.2% 209,238,749 2007 4,501,303 74,974,084 1,185,249 2,310,533 82,971,169 7.2% 230,200,198 2008 4,121,308 72,997,708 1,037,875 2,140,627 80,297,518 -3.2% 231,330,634 2009 4,736,540 67,260,365 1,002,143 1,764,974 74,764,021 -6.9% 242,512,635
The rate of excise duty on wine and made wine is based on whether the product is still or sparkling and on its alcoholic strength by volume.
(b) Following the reclassification of made wine and fortified wine in 2004 to intermediate products and fermented beverages, all of the productsare listed according to alcohol strength.
(a) The receipts for 2001 are not directly comparable to 2000 due to the provision in the 2001 Finance Act to abolish the end year payment catch-up.
The consumption of wine less than 5.5% prior to 2004 is not directly comparable to later years as prior to 2004 some of these low strength wines were included with the volumes of wines less than 15%.
Wine Consumption
10,000,000
20,000,000
30,000,000
40,000,000
50,000,000
60,000,000
70,000,000
80,000,000
90,000,000
1999 2000 2001(a) 2002 2003 2004 2005 2006 2007 2008 2009
Litre
s
10
Revenue Commissioners Statistical Report 2009
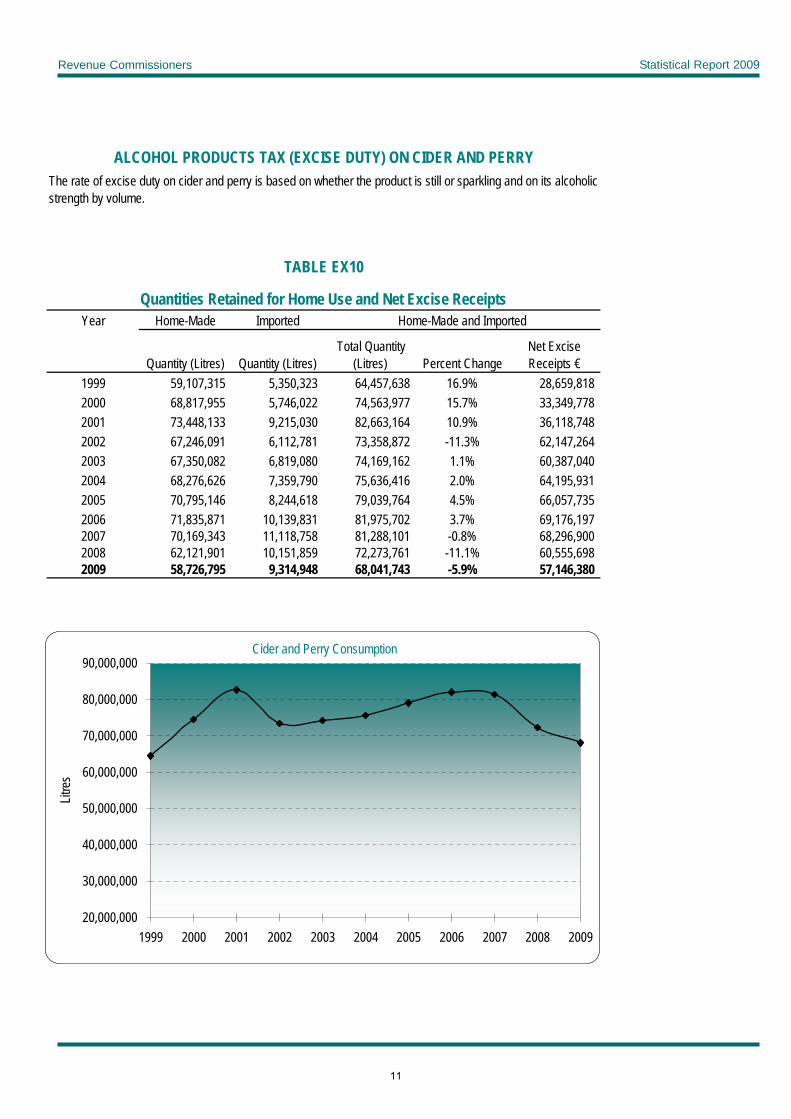
ALCOHOL PRODUCTS TAX (EXCISE DUTY) ON CIDER AND PERRYThe rate of excise duty on cider and perry is based on whether the product is still or sparkling and on its alcoholic strength by volume.
TABLE EX10
Quantities Retained for Home Use and Net Excise Receipts Year Home-Made Imported Home-Made and Imported
Quantity (Litres) Quantity (Litres) Total Quantity
(Litres) Percent ChangeNet Excise Receipts €
1999 59,107,315 5,350,323 64,457,638 16.9% 28,659,818 2000 68,817,955 5,746,022 74,563,977 15.7% 33,349,778 2001 73,448,133 9,215,030 82,663,164 10.9% 36,118,748 2002 67,246,091 6,112,781 73,358,872 -11.3% 62,147,264 2003 67,350,082 6,819,080 74,169,162 1.1% 60,387,040 2004 68,276,626 7,359,790 75,636,416 2.0% 64,195,931 2005 70,795,146 8,244,618 79,039,764 4.5% 66,057,735 2006 71,835,871 10,139,831 81,975,702 3.7% 69,176,197 2007 70,169,343 11,118,758 81,288,101 -0.8% 68,296,900 2008 62,121,901 10,151,859 72,273,761 -11.1% 60,555,698 2009 58,726,795 9,314,948 68,041,743 -5.9% 57,146,380
Cider and Perry Consumption
20,000,000
30,000,000
40,000,000
50,000,000
60,000,000
70,000,000
80,000,000
90,000,000
1999 2000 2001 2002 2003 2004 2005 2006 2007 2008 2009
Litre
s
11
Revenue Commissioners Statistical Report 2009
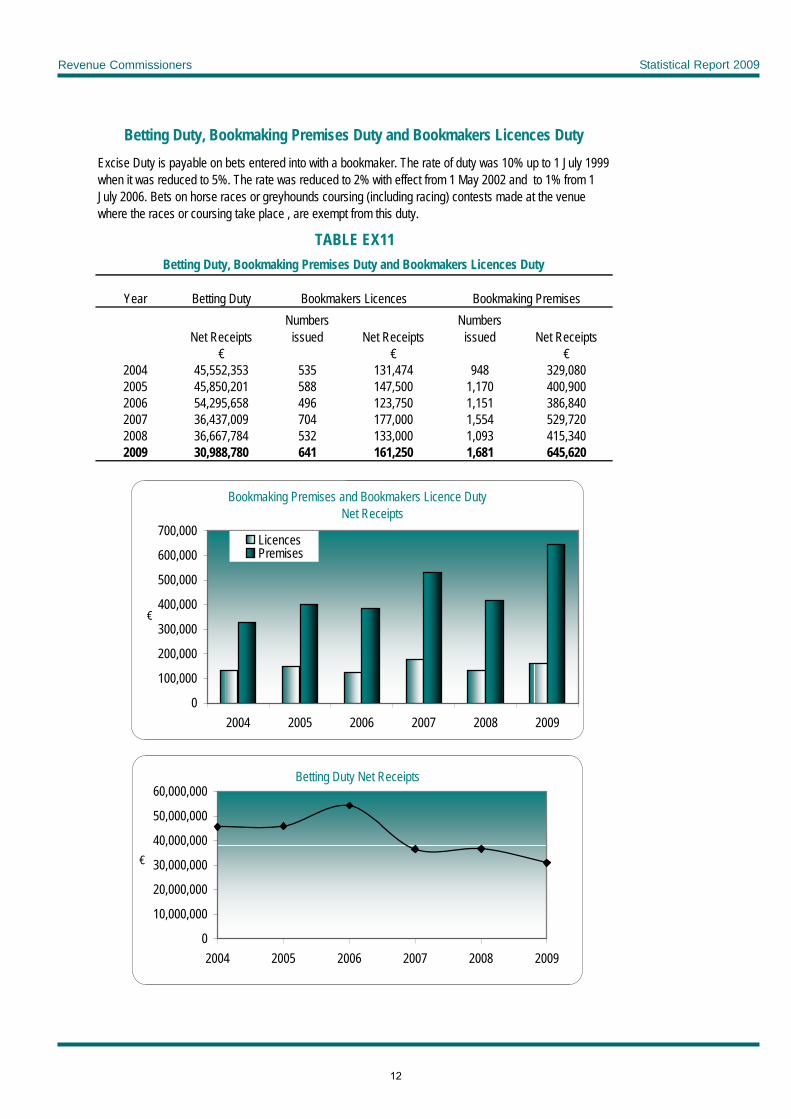
Betting Duty, Bookmaking Premises Duty and Bookmakers Licences Duty
TABLE EX11Betting Duty, Bookmaking Premises Duty and Bookmakers Licences Duty
Year Betting Duty Bookmakers Licences Bookmaking Premises
Net Receipts Numbers
issued Net Receipts Numbers
issued Net Receipts € € €
2004 45,552,353 535 131,474 948 329,0802005 45,850,201 588 147,500 1,170 400,9002006 54,295,658 496 123,750 1,151 386,8402007 36,437,009 704 177,000 1,554 529,7202008 36,667,784 532 133,000 1,093 415,3402009 30,988,780 641 161,250 1,681 645,620
Excise Duty is payable on bets entered into with a bookmaker. The rate of duty was 10% up to 1 July 1999 when it was reduced to 5%. The rate was reduced to 2% with effect from 1 May 2002 and to 1% from 1 July 2006. Bets on horse races or greyhounds coursing (including racing) contests made at the venue where the races or coursing take place , are exempt from this duty.
Bookmaking Premises and Bookmakers Licence Duty Net Receipts
0
100,000
200,000
300,000
400,000
500,000
600,000
700,000
2004 2005 2006 2007 2008 2009
€
LicencesPremises
Betting Duty Net Receipts
0
10,000,000
20,000,000
30,000,000
40,000,000
50,000,000
60,000,000
2004 2005 2006 2007 2008 2009
€
12
Revenue Commissioners Statistical Report 2009
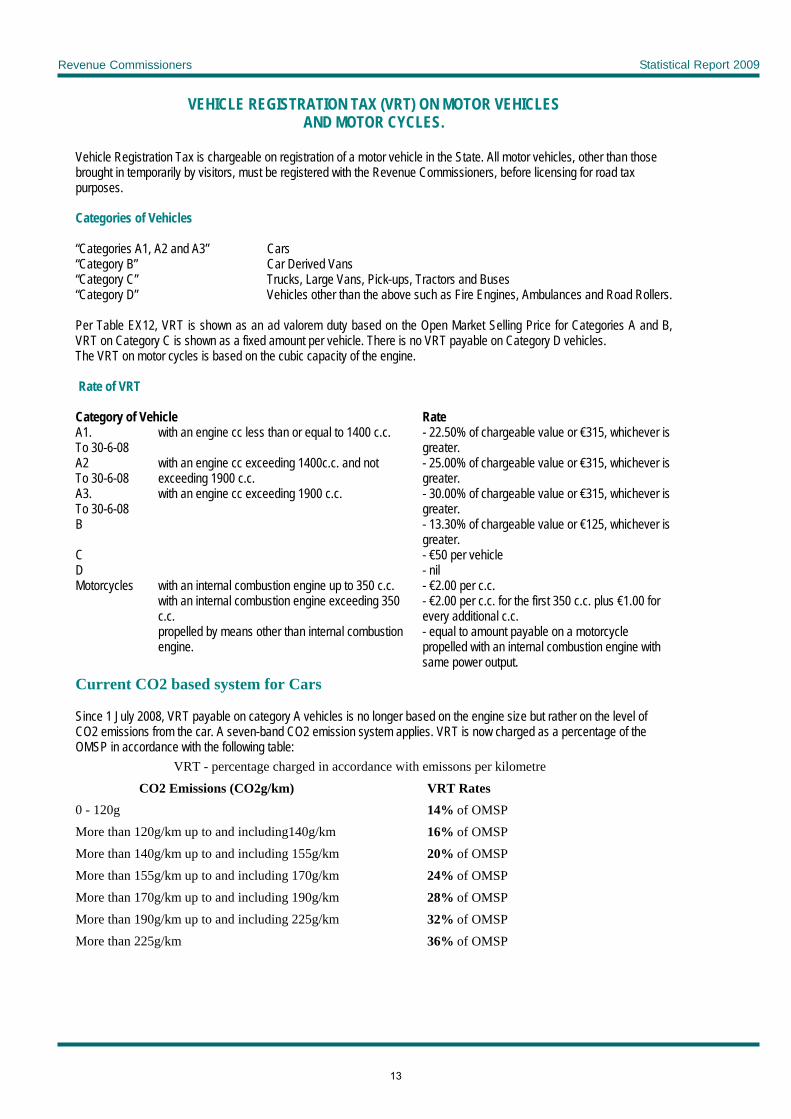
VEHICLE REGISTRATION TAX (VRT) ON MOTOR VEHICLES AND MOTOR CYCLES.
Vehicle Registration Tax is chargeable on registration of a motor vehicle in the State. All motor vehicles, other than those brought in temporarily by visitors, must be registered with the Revenue Commissioners, before licensing for road tax purposes.
Categories of Vehicles “Categories A1, A2 and A3” Cars “Category B” Car Derived Vans “Category C” Trucks, Large Vans, Pick-ups, Tractors and Buses “Category D” Vehicles other than the above such as Fire Engines, Ambulances and Road Rollers. Per Table EX12, VRT is shown as an ad valorem duty based on the Open Market Selling Price for Categories A and B, VRT on Category C is shown as a fixed amount per vehicle. There is no VRT payable on Category D vehicles. The VRT on motor cycles is based on the cubic capacity of the engine. Rate of VRT Category of Vehicle Rate A1. To 30-6-08
with an engine cc less than or equal to 1400 c.c. - 22.50% of chargeable value or €315, whichever is greater.
A2 To 30-6-08
with an engine cc exceeding 1400c.c. and not exceeding 1900 c.c.
- 25.00% of chargeable value or €315, whichever is greater.
A3. To 30-6-08
with an engine cc exceeding 1900 c.c. - 30.00% of chargeable value or €315, whichever is greater.
B - 13.30% of chargeable value or €125, whichever is greater.
C - €50 per vehicle D - nil Motorcycles with an internal combustion engine up to 350 c.c. - €2.00 per c.c. with an internal combustion engine exceeding 350
c.c. - €2.00 per c.c. for the first 350 c.c. plus €1.00 for every additional c.c.
propelled by means other than internal combustion engine.
- equal to amount payable on a motorcycle propelled with an internal combustion engine with same power output.
Current CO2 based system for Cars Since 1 July 2008, VRT payable on category A vehicles is no longer based on the engine size but rather on the level of CO2 emissions from the car. A seven-band CO2 emission system applies. VRT is now charged as a percentage of the OMSP in accordance with the following table:
VRT - percentage charged in accordance with emissons per kilometre CO2 Emissions (CO2g/km) VRT Rates 0 - 120g 14% of OMSP More than 120g/km up to and including140g/km 16% of OMSP More than 140g/km up to and including 155g/km 20% of OMSP More than 155g/km up to and including 170g/km 24% of OMSP More than 170g/km up to and including 190g/km 28% of OMSP More than 190g/km up to and including 225g/km 32% of OMSP More than 225g/km 36% of OMSP
13
Revenue Commissioners Statistical Report 2009
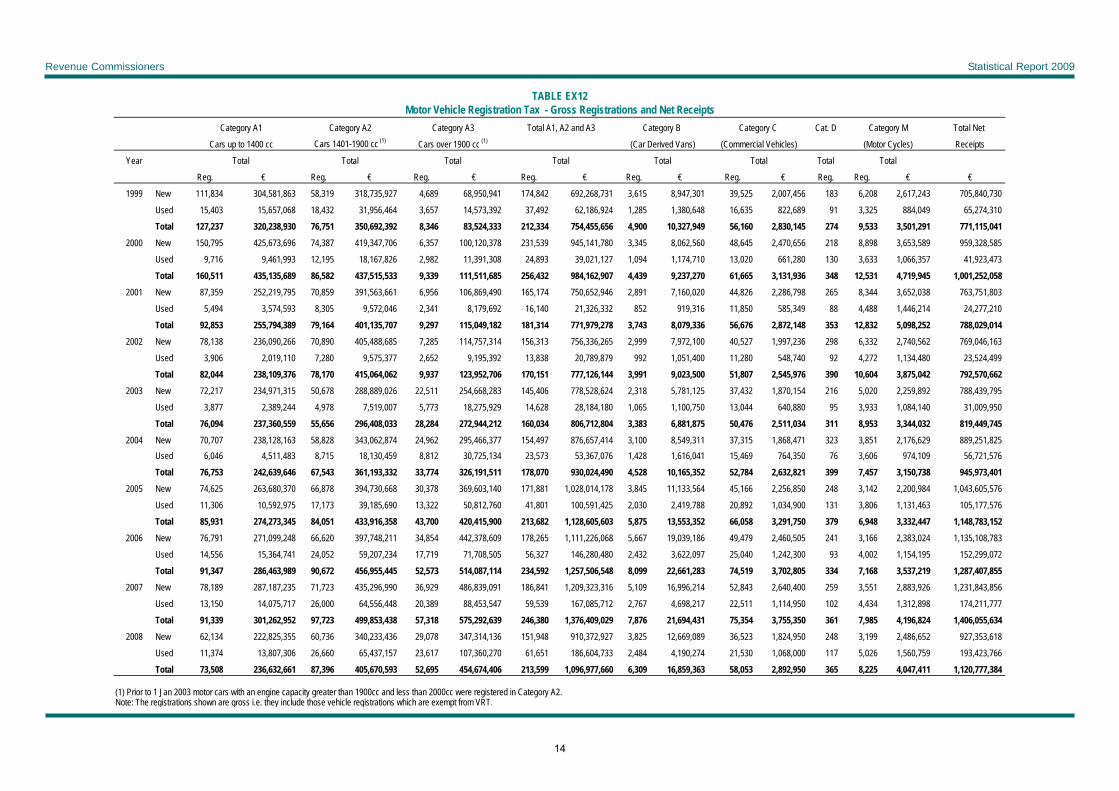
TABLE EX12Motor Vehicle Registration Tax - Gross Registrations and Net Receipts
Category A1 Category A2 Category A3 Total A1, A2 and A3 Category B Category C Cat. D Category M Total Net
Cars up to 1400 cc Cars 1401-1900 cc (1) (Car Derived Vans) (Commercial Vehicles) (Motor Cycles) Receipts
Year Total Total Total Total Total Total Total Total
Reg. € Reg. € Reg. € Reg. € Reg. € Reg. € Reg. Reg. € €
1999 New 111,834 304,581,863 58,319 318,735,927 4,689 68,950,941 174,842 692,268,731 3,615 8,947,301 39,525 2,007,456 183 6,208 2,617,243 705,840,730
Used 15,403 15,657,068 18,432 31,956,464 3,657 14,573,392 37,492 62,186,924 1,285 1,380,648 16,635 822,689 91 3,325 884,049 65,274,310
Total 127,237 320,238,930 76,751 350,692,392 8,346 83,524,333 212,334 754,455,656 4,900 10,327,949 56,160 2,830,145 274 9,533 3,501,291 771,115,041
2000 New 150,795 425,673,696 74,387 419,347,706 6,357 100,120,378 231,539 945,141,780 3,345 8,062,560 48,645 2,470,656 218 8,898 3,653,589 959,328,585
Used 9,716 9,461,993 12,195 18,167,826 2,982 11,391,308 24,893 39,021,127 1,094 1,174,710 13,020 661,280 130 3,633 1,066,357 41,923,473
Total 160,511 435,135,689 86,582 437,515,533 9,339 111,511,685 256,432 984,162,907 4,439 9,237,270 61,665 3,131,936 348 12,531 4,719,945 1,001,252,058
2001 New 87,359 252,219,795 70,859 391,563,661 6,956 106,869,490 165,174 750,652,946 2,891 7,160,020 44,826 2,286,798 265 8,344 3,652,038 763,751,803
Used 5,494 3,574,593 8,305 9,572,046 2,341 8,179,692 16,140 21,326,332 852 919,316 11,850 585,349 88 4,488 1,446,214 24,277,210
Total 92,853 255,794,389 79,164 401,135,707 9,297 115,049,182 181,314 771,979,278 3,743 8,079,336 56,676 2,872,148 353 12,832 5,098,252 788,029,014
2002 New 78,138 236,090,266 70,890 405,488,685 7,285 114,757,314 156,313 756,336,265 2,999 7,972,100 40,527 1,997,236 298 6,332 2,740,562 769,046,163
Used 3,906 2,019,110 7,280 9,575,377 2,652 9,195,392 13,838 20,789,879 992 1,051,400 11,280 548,740 92 4,272 1,134,480 23,524,499
Total 82,044 238,109,376 78,170 415,064,062 9,937 123,952,706 170,151 777,126,144 3,991 9,023,500 51,807 2,545,976 390 10,604 3,875,042 792,570,662
2003 New 72,217 234,971,315 50,678 288,889,026 22,511 254,668,283 145,406 778,528,624 2,318 5,781,125 37,432 1,870,154 216 5,020 2,259,892 788,439,795
Used 3,877 2,389,244 4,978 7,519,007 5,773 18,275,929 14,628 28,184,180 1,065 1,100,750 13,044 640,880 95 3,933 1,084,140 31,009,950
Total 76,094 237,360,559 55,656 296,408,033 28,284 272,944,212 160,034 806,712,804 3,383 6,881,875 50,476 2,511,034 311 8,953 3,344,032 819,449,745
2004 New 70,707 238,128,163 58,828 343,062,874 24,962 295,466,377 154,497 876,657,414 3,100 8,549,311 37,315 1,868,471 323 3,851 2,176,629 889,251,825 Used 6,046 4,511,483 8,715 18,130,459 8,812 30,725,134 23,573 53,367,076 1,428 1,616,041 15,469 764,350 76 3,606 974,109 56,721,576
Total 76,753 242,639,646 67,543 361,193,332 33,774 326,191,511 178,070 930,024,490 4,528 10,165,352 52,784 2,632,821 399 7,457 3,150,738 945,973,401
2005 New 74,625 263,680,370 66,878 394,730,668 30,378 369,603,140 171,881 1,028,014,178 3,845 11,133,564 45,166 2,256,850 248 3,142 2,200,984 1,043,605,576
Used 11,306 10,592,975 17,173 39,185,690 13,322 50,812,760 41,801 100,591,425 2,030 2,419,788 20,892 1,034,900 131 3,806 1,131,463 105,177,576
Total 85,931 274,273,345 84,051 433,916,358 43,700 420,415,900 213,682 1,128,605,603 5,875 13,553,352 66,058 3,291,750 379 6,948 3,332,447 1,148,783,152
2006 New 76,791 271,099,248 66,620 397,748,211 34,854 442,378,609 178,265 1,111,226,068 5,667 19,039,186 49,479 2,460,505 241 3,166 2,383,024 1,135,108,783
Used 14,556 15,364,741 24,052 59,207,234 17,719 71,708,505 56,327 146,280,480 2,432 3,622,097 25,040 1,242,300 93 4,002 1,154,195 152,299,072
Total 91,347 286,463,989 90,672 456,955,445 52,573 514,087,114 234,592 1,257,506,548 8,099 22,661,283 74,519 3,702,805 334 7,168 3,537,219 1,287,407,855
2007 New 78,189 287,187,235 71,723 435,296,990 36,929 486,839,091 186,841 1,209,323,316 5,109 16,996,214 52,843 2,640,400 259 3,551 2,883,926 1,231,843,856
Used 13,150 14,075,717 26,000 64,556,448 20,389 88,453,547 59,539 167,085,712 2,767 4,698,217 22,511 1,114,950 102 4,434 1,312,898 174,211,777
Total 91,339 301,262,952 97,723 499,853,438 57,318 575,292,639 246,380 1,376,409,029 7,876 21,694,431 75,354 3,755,350 361 7,985 4,196,824 1,406,055,634
2008 New 62,134 222,825,355 60,736 340,233,436 29,078 347,314,136 151,948 910,372,927 3,825 12,669,089 36,523 1,824,950 248 3,199 2,486,652 927,353,618
Used 11,374 13,807,306 26,660 65,437,157 23,617 107,360,270 61,651 186,604,733 2,484 4,190,274 21,530 1,068,000 117 5,026 1,560,759 193,423,766
Total 73,508 236,632,661 87,396 405,670,593 52,695 454,674,406 213,599 1,096,977,660 6,309 16,859,363 58,053 2,892,950 365 8,225 4,047,411 1,120,777,384
Note: The registrations shown are gross i.e. they include those vehicle registrations which are exempt from VRT.
Cars over 1900 cc (1)
(1) Prior to 1 Jan 2003 motor cars with an engine capacity greater than 1900cc and less than 2000cc were registered in Category A2.
14
Revenue Commissioners Statistical Report 2009
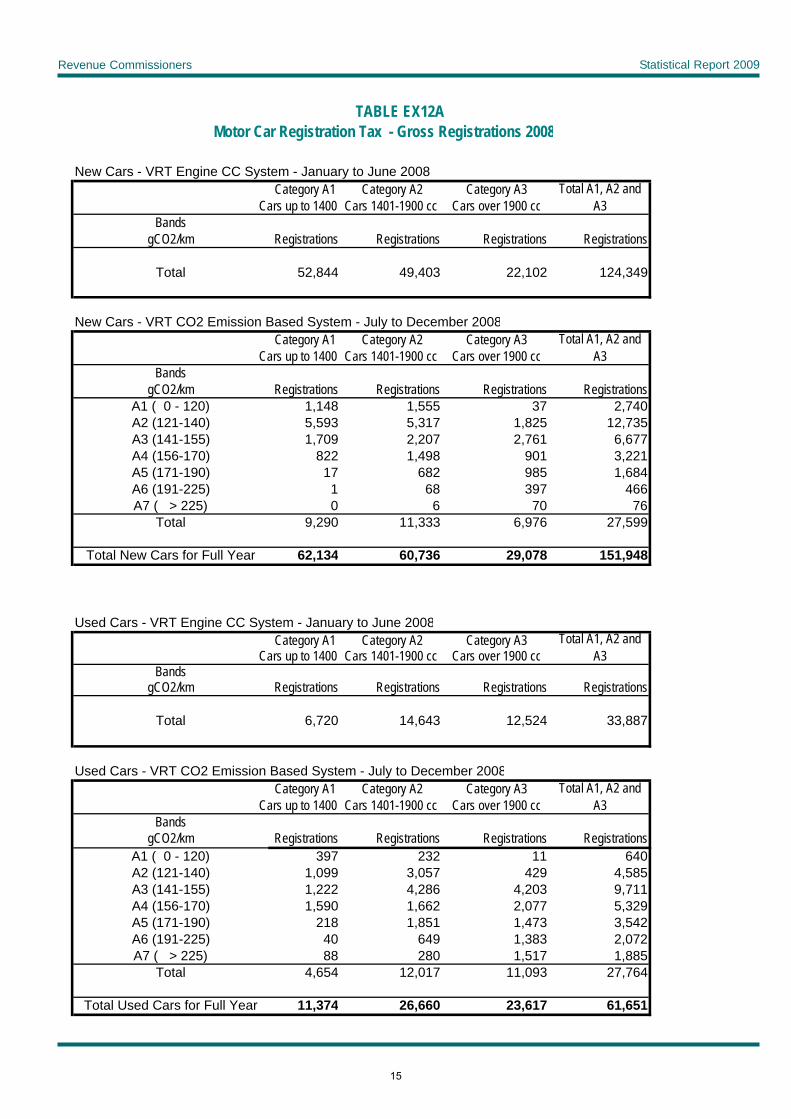
Motor Car Registration Tax - Gross Registrations 2008
New Cars - VRT Engine CC System - January to June 2008Category A1 Category A2 Category A3
Cars up to 1400 Cars 1401-1900 cc Cars over 1900 ccBands
gCO2/km Registrations Registrations Registrations Registrations
Total 52,844 49,403 22,102 124,349
New Cars - VRT CO2 Emission Based System - July to December 2008Category A1 Category A2 Category A3
Cars up to 1400 Cars 1401-1900 cc Cars over 1900 ccBands
gCO2/km Registrations Registrations Registrations RegistrationsA1 ( 0 - 120) 1,148 1,555 37 2,740A2 (121-140) 5,593 5,317 1,825 12,735A3 (141-155) 1,709 2,207 2,761 6,677A4 (156-170) 822 1,498 901 3,221A5 (171-190) 17 682 985 1,684A6 (191-225) 1 68 397 466A7 ( > 225) 0 6 70 76
Total 9,290 11,333 6,976 27,599
Total New Cars for Full Year 62,134 60,736 29,078 151,948
Used Cars - VRT Engine CC System - January to June 2008Category A1 Category A2 Category A3
Cars up to 1400 Cars 1401-1900 cc Cars over 1900 ccBands
gCO2/km Registrations Registrations Registrations Registrations
Total 6,720 14,643 12,524 33,887
Used Cars - VRT CO2 Emission Based System - July to December 2008Category A1 Category A2 Category A3
Cars up to 1400 Cars 1401-1900 cc Cars over 1900 ccBands
gCO2/km Registrations Registrations Registrations RegistrationsA1 ( 0 - 120) 397 232 11 640A2 (121-140) 1,099 3,057 429 4,585A3 (141-155) 1,222 4,286 4,203 9,711A4 (156-170) 1,590 1,662 2,077 5,329A5 (171-190) 218 1,851 1,473 3,542A6 (191-225) 40 649 1,383 2,072A7 ( > 225) 88 280 1,517 1,885
Total 4,654 12,017 11,093 27,764
Total Used Cars for Full Year 11,374 26,660 23,617 61,651
TABLE EX12A
Total A1, A2 and A3
Total A1, A2 and A3
Total A1, A2 and A3
Total A1, A2 and A3
15
Revenue Commissioners Statistical Report 2009
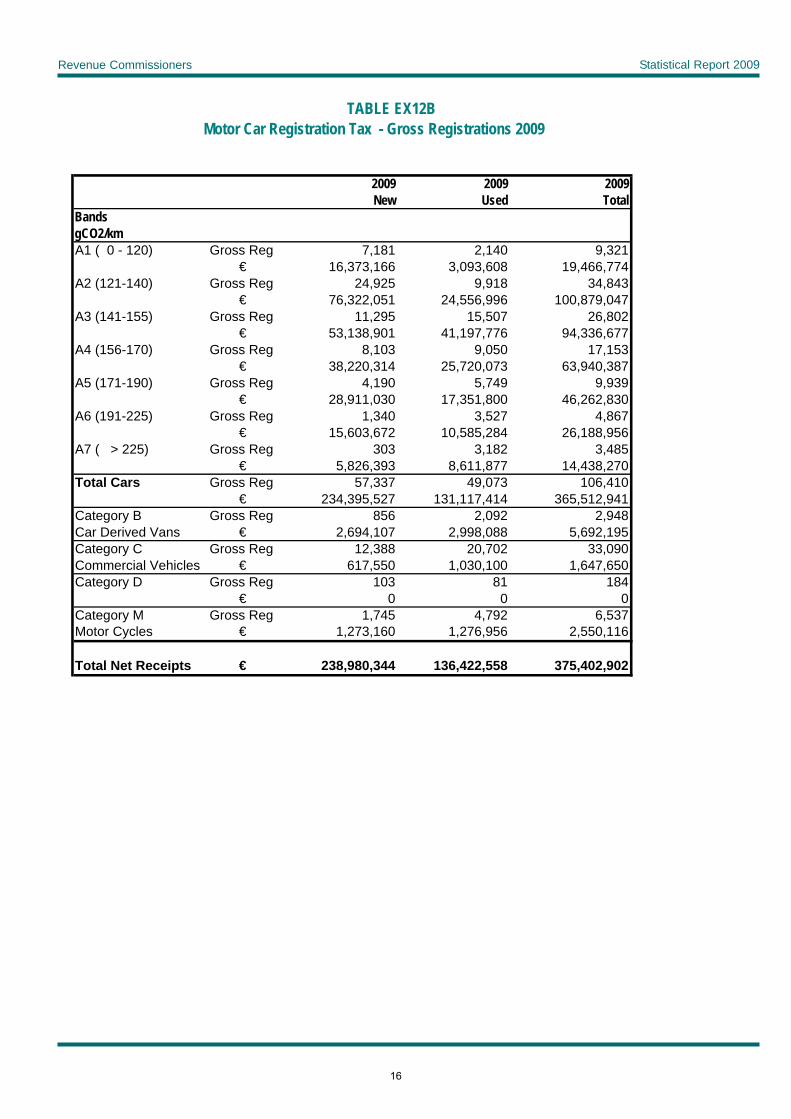
Motor Car Registration Tax - Gross Registrations 2009
2009 2009 2009New Used Total
BandsgCO2/kmA1 ( 0 - 120) Gross Reg 7,181 2,140 9,321
€ 16,373,166 3,093,608 19,466,774A2 (121-140) Gross Reg 24,925 9,918 34,843
€ 76,322,051 24,556,996 100,879,047A3 (141-155) Gross Reg 11,295 15,507 26,802
€ 53,138,901 41,197,776 94,336,677A4 (156-170) Gross Reg 8,103 9,050 17,153
€ 38,220,314 25,720,073 63,940,387A5 (171-190) Gross Reg 4,190 5,749 9,939
€ 28,911,030 17,351,800 46,262,830A6 (191-225) Gross Reg 1,340 3,527 4,867
€ 15,603,672 10,585,284 26,188,956A7 ( > 225) Gross Reg 303 3,182 3,485
€ 5,826,393 8,611,877 14,438,270Total Cars Gross Reg 57,337 49,073 106,410
€ 234,395,527 131,117,414 365,512,941Category B Gross Reg 856 2,092 2,948Car Derived Vans € 2,694,107 2,998,088 5,692,195Category C Gross Reg 12,388 20,702 33,090Commercial Vehicles € 617,550 1,030,100 1,647,650Category D Gross Reg 103 81 184
€ 0 0 0Category M Gross Reg 1,745 4,792 6,537Motor Cycles € 1,273,160 1,276,956 2,550,116
Total Net Receipts € 238,980,344 136,422,558 375,402,902
TABLE EX12B
16
Revenue Commissioners Statistical Report 2009
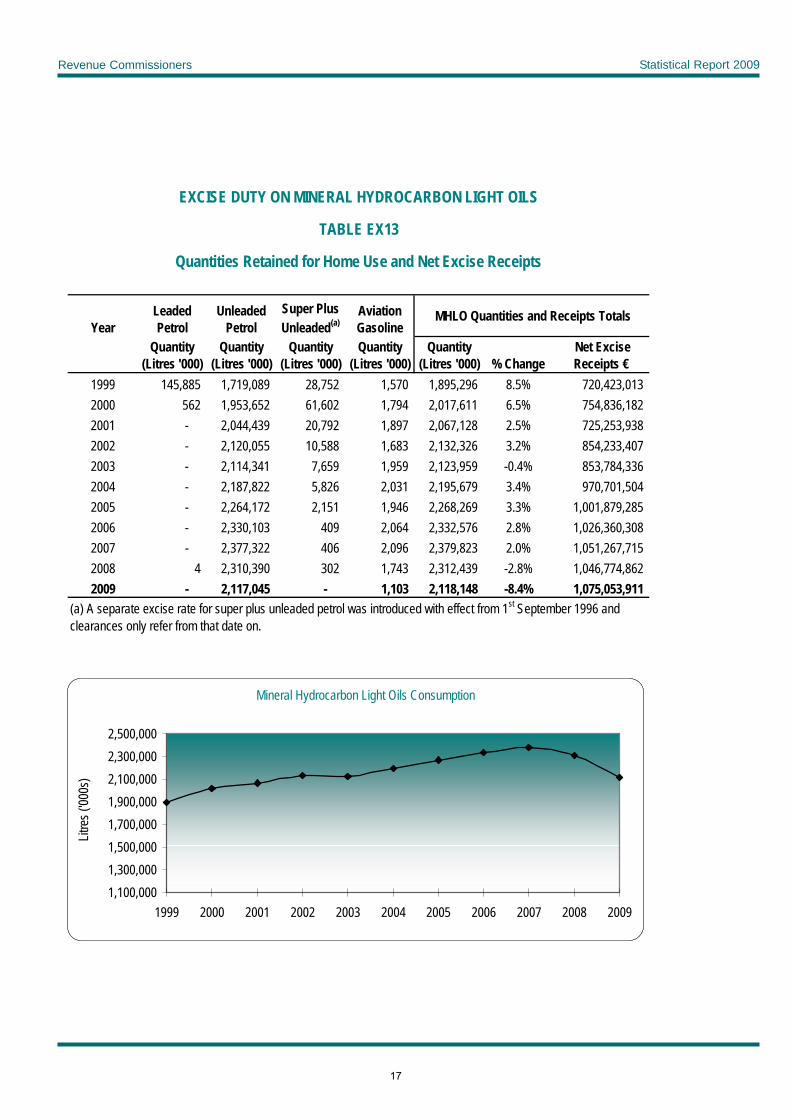
EXCISE DUTY ON MINERAL HYDROCARBON LIGHT OILS
TABLE EX13
Quantities Retained for Home Use and Net Excise Receipts
YearLeaded Petrol
Unleaded Petrol
Super Plus Unleaded(a)
Aviation Gasoline
MHLO Quantities and Receipts Totals
Quantity (Litres '000)
Quantity (Litres '000)
Quantity (Litres '000)
Quantity (Litres '000)
Quantity (Litres '000) % Change
Net Excise Receipts €
1999 145,885 1,719,089 28,752 1,570 1,895,296 8.5% 720,423,013 2000 562 1,953,652 61,602 1,794 2,017,611 6.5% 754,836,182 2001 - 2,044,439 20,792 1,897 2,067,128 2.5% 725,253,938 2002 - 2,120,055 10,588 1,683 2,132,326 3.2% 854,233,407 2003 - 2,114,341 7,659 1,959 2,123,959 -0.4% 853,784,336 2004 - 2,187,822 5,826 2,031 2,195,679 3.4% 970,701,504 2005 - 2,264,172 2,151 1,946 2,268,269 3.3% 1,001,879,285 2006 - 2,330,103 409 2,064 2,332,576 2.8% 1,026,360,308 2007 - 2,377,322 406 2,096 2,379,823 2.0% 1,051,267,715 2008 4 2,310,390 302 1,743 2,312,439 -2.8% 1,046,774,862 2009 - 2,117,045 - 1,103 2,118,148 -8.4% 1,075,053,911
(a) A separate excise rate for super plus unleaded petrol was introduced with effect from 1st September 1996 and clearances only refer from that date on.
Mineral Hydrocarbon Light Oils Consumption
1,100,0001,300,0001,500,0001,700,0001,900,0002,100,0002,300,0002,500,000
1999 2000 2001 2002 2003 2004 2005 2006 2007 2008 2009
Litre
s ('00
0s)
17
Revenue Commissioners Statistical Report 2009
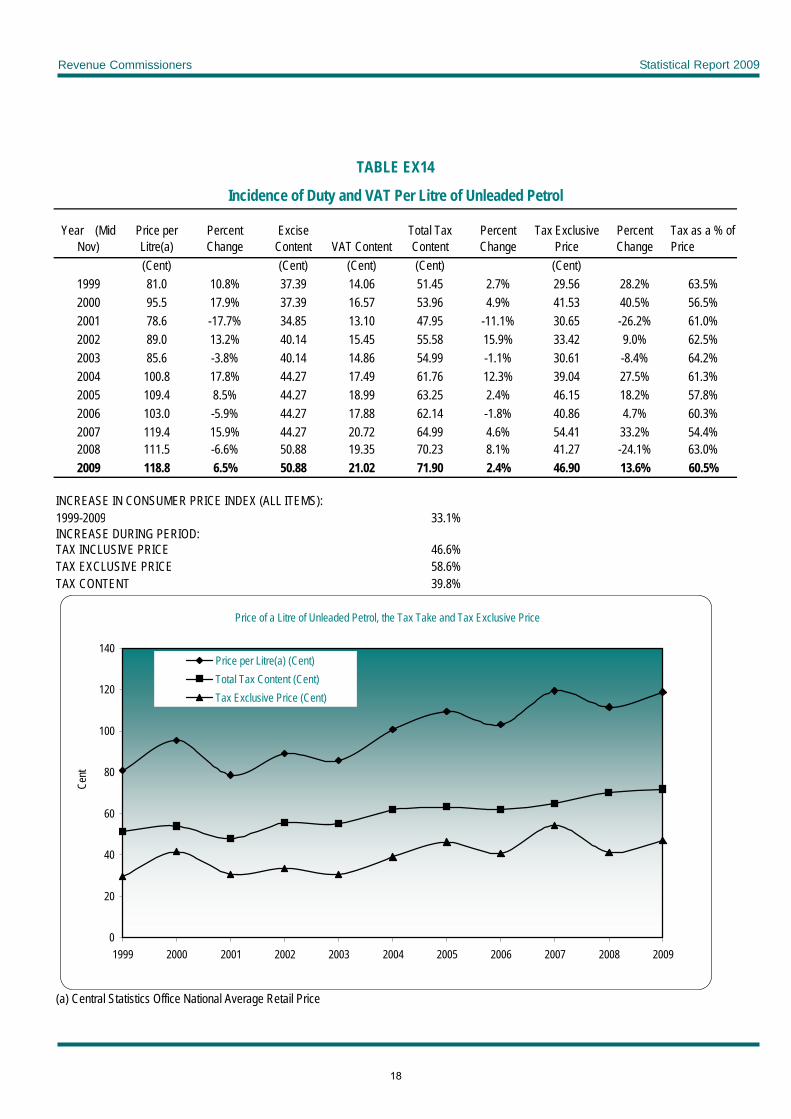
TABLE EX14
Incidence of Duty and VAT Per Litre of Unleaded Petrol
Year (Mid Nov)
Price per Litre(a)
Percent Change
Excise Content VAT Content
Total Tax Content
Percent Change
Tax Exclusive Price
Percent Change
Tax as a % of Price
(Cent) (Cent) (Cent) (Cent) (Cent)1999 81.0 10.8% 37.39 14.06 51.45 2.7% 29.56 28.2% 63.5%2000 95.5 17.9% 37.39 16.57 53.96 4.9% 41.53 40.5% 56.5%2001 78.6 -17.7% 34.85 13.10 47.95 -11.1% 30.65 -26.2% 61.0%2002 89.0 13.2% 40.14 15.45 55.58 15.9% 33.42 9.0% 62.5%2003 85.6 -3.8% 40.14 14.86 54.99 -1.1% 30.61 -8.4% 64.2%2004 100.8 17.8% 44.27 17.49 61.76 12.3% 39.04 27.5% 61.3%2005 109.4 8.5% 44.27 18.99 63.25 2.4% 46.15 18.2% 57.8%2006 103.0 -5.9% 44.27 17.88 62.14 -1.8% 40.86 4.7% 60.3%2007 119.4 15.9% 44.27 20.72 64.99 4.6% 54.41 33.2% 54.4%2008 111.5 -6.6% 50.88 19.35 70.23 8.1% 41.27 -24.1% 63.0%2009 118.8 6.5% 50.88 21.02 71.90 2.4% 46.90 13.6% 60.5%
INCREASE IN CONSUMER PRICE INDEX (ALL ITEMS): 1999-2009 33.1%INCREASE DURING PERIOD:TAX INCLUSIVE PRICE 46.6%TAX EXCLUSIVE PRICE 58.6%TAX CONTENT 39.8%
(a) Central Statistics Office National Average Retail Price
Price of a Litre of Unleaded Petrol, the Tax Take and Tax Exclusive Price
0
20
40
60
80
100
120
140
1999 2000 2001 2002 2003 2004 2005 2006 2007 2008 2009
Cent
Price per Litre(a) (Cent)Total Tax Content (Cent)Tax Exclusive Price (Cent)
18
Revenue Commissioners Statistical Report 2009
Auto Diesel Other Oils (a)(b) Other Oils(c) Fuel Oil Used in the Manufacture
of Alumina(d)
Residual Fuel Oil Generation of Electricity for
Sale
Residual Fuel Oil Other Purposes
Residual Fuel Oil Total Hydrocarbon Oils Other Sorts
Year Quantity (Litres
'000) Auto Diesel %
Change Net Excise Receipts € Quantity (Litres
'000) Net Excise Receipts
€ Quantity (Litres
'000) Net Excise Receipts €
Quantity (Litres '000)
Quantity (Litres '000)
Quantity (Litres '000)
Net Excise Receipts €
Quantity (Litres '000)
Percent Change Net Excise Receipts €
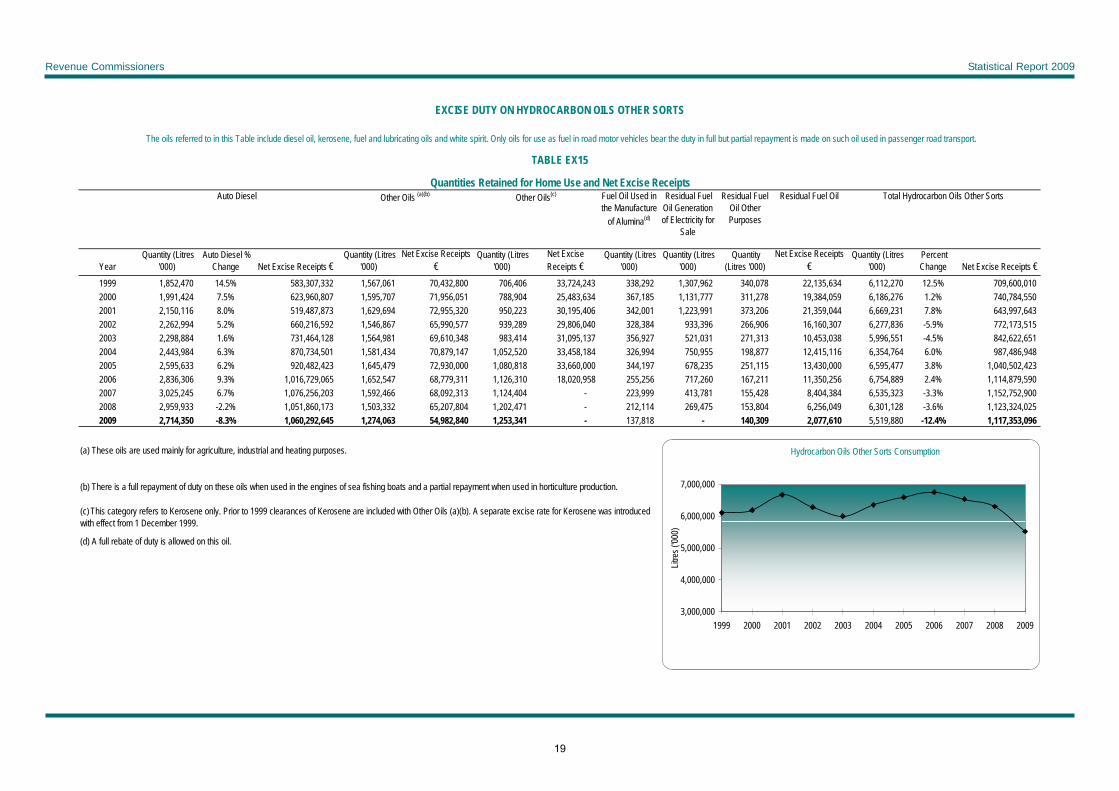
1999 1,852,470 14.5% 583,307,332 1,567,061 70,432,800 706,406 33,724,243 338,292 1,307,962 340,078 22,135,634 6,112,270 12.5% 709,600,010 2000 1,991,424 7.5% 623,960,807 1,595,707 71,956,051 788,904 25,483,634 367,185 1,131,777 311,278 19,384,059 6,186,276 1.2% 740,784,550 2001 2,150,116 8.0% 519,487,873 1,629,694 72,955,320 950,223 30,195,406 342,001 1,223,991 373,206 21,359,044 6,669,231 7.8% 643,997,643 2002 2,262,994 5.2% 660,216,592 1,546,867 65,990,577 939,289 29,806,040 328,384 933,396 266,906 16,160,307 6,277,836 -5.9% 772,173,515 2003 2,298,884 1.6% 731,464,128 1,564,981 69,610,348 983,414 31,095,137 356,927 521,031 271,313 10,453,038 5,996,551 -4.5% 842,622,651 2004 2,443,984 6.3% 870,734,501 1,581,434 70,879,147 1,052,520 33,458,184 326,994 750,955 198,877 12,415,116 6,354,764 6.0% 987,486,948 2005 2,595,633 6.2% 920,482,423 1,645,479 72,930,000 1,080,818 33,660,000 344,197 678,235 251,115 13,430,000 6,595,477 3.8% 1,040,502,423 2006 2,836,306 9.3% 1,016,729,065 1,652,547 68,779,311 1,126,310 18,020,958 255,256 717,260 167,211 11,350,256 6,754,889 2.4% 1,114,879,590 2007 3,025,245 6.7% 1,076,256,203 1,592,466 68,092,313 1,124,404 - 223,999 413,781 155,428 8,404,384 6,535,323 -3.3% 1,152,752,900 2008 2,959,933 -2.2% 1,051,860,173 1,503,332 65,207,804 1,202,471 - 212,114 269,475 153,804 6,256,049 6,301,128 -3.6% 1,123,324,025 2009 2,714,350 -8.3% 1,060,292,645 1,274,063 54,982,840 1,253,341 - 137,818 - 140,309 2,077,610 5,519,880 -12.4% 1,117,353,096
(a) These oils are used mainly for agriculture, industrial and heating purposes.
(b) There is a full repayment of duty on these oils when used in the engines of sea fishing boats and a partial repayment when used in horticulture production.
(c) This category refers to Kerosene only. Prior to 1999 clearances of Kerosene are included with Other Oils (a)(b). A separate excise rate for Kerosene was introduced with effect from 1 December 1999.
(d) A full rebate of duty is allowed on this oil.
EXCISE DUTY ON HYDROCARBON OILS OTHER SORTS
The oils referred to in this Table include diesel oil, kerosene, fuel and lubricating oils and white spirit. Only oils for use as fuel in road motor vehicles bear the duty in full but partial repayment is made on such oil used in passenger road transport.
TABLE EX15
Quantities Retained for Home Use and Net Excise Receipts
Hydrocarbon Oils Other Sorts Consumption
3,000,000
4,000,000
5,000,000
6,000,000
7,000,000
1999 2000 2001 2002 2003 2004 2005 2006 2007 2008 2009
Litre
s ('00
0)
19
Revenue Commissioners Statistical Report 2009
Year (Mid Nov)
Price per Litre(a)
Percent Change
Excise Content
VAT Content Total Tax Content
Percent Change
Tax Exclusive
Price
Percent Change
Tax as a % of Price
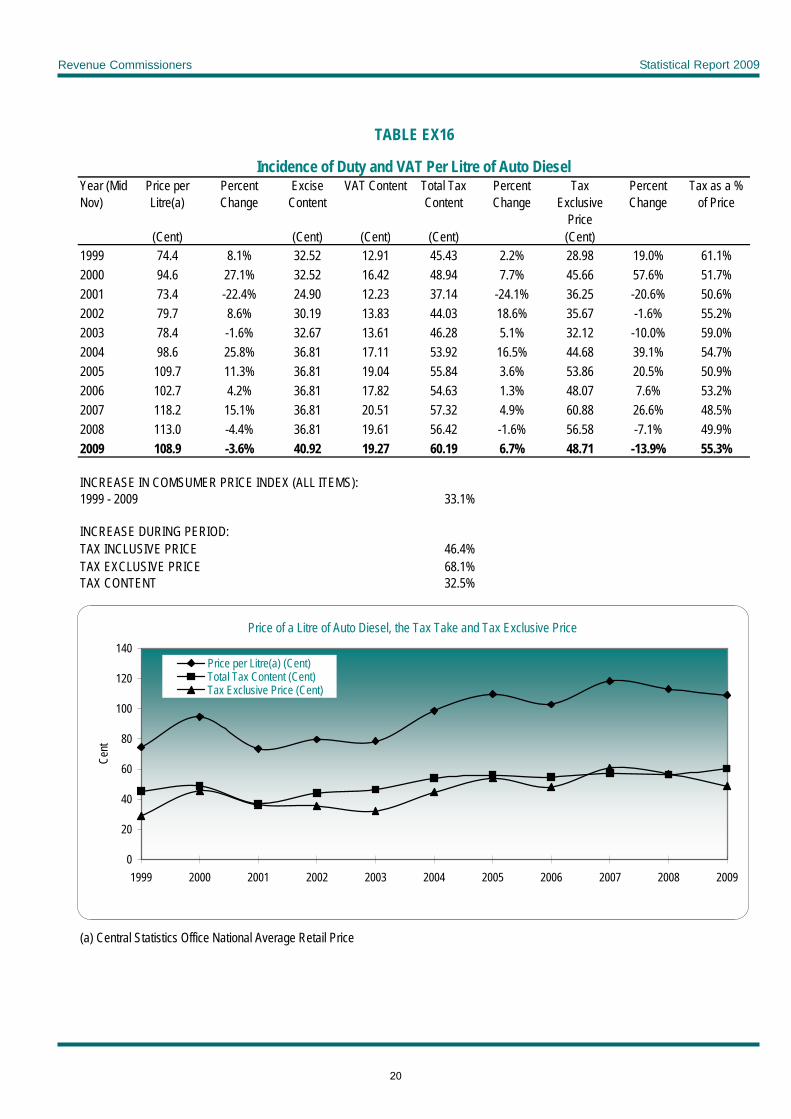
(Cent) (Cent) (Cent) (Cent) (Cent)1999 74.4 8.1% 32.52 12.91 45.43 2.2% 28.98 19.0% 61.1%2000 94.6 27.1% 32.52 16.42 48.94 7.7% 45.66 57.6% 51.7%2001 73.4 -22.4% 24.90 12.23 37.14 -24.1% 36.25 -20.6% 50.6%2002 79.7 8.6% 30.19 13.83 44.03 18.6% 35.67 -1.6% 55.2%2003 78.4 -1.6% 32.67 13.61 46.28 5.1% 32.12 -10.0% 59.0%2004 98.6 25.8% 36.81 17.11 53.92 16.5% 44.68 39.1% 54.7%2005 109.7 11.3% 36.81 19.04 55.84 3.6% 53.86 20.5% 50.9%2006 102.7 4.2% 36.81 17.82 54.63 1.3% 48.07 7.6% 53.2%2007 118.2 15.1% 36.81 20.51 57.32 4.9% 60.88 26.6% 48.5%2008 113.0 -4.4% 36.81 19.61 56.42 -1.6% 56.58 -7.1% 49.9%2009 108.9 -3.6% 40.92 19.27 60.19 6.7% 48.71 -13.9% 55.3%
INCREASE IN COMSUMER PRICE INDEX (ALL ITEMS): 1999 - 2009 33.1%
INCREASE DURING PERIOD:TAX INCLUSIVE PRICE 46.4%TAX EXCLUSIVE PRICE 68.1%TAX CONTENT 32.5%
(a) Central Statistics Office National Average Retail Price
TABLE EX16
Incidence of Duty and VAT Per Litre of Auto Diesel
Price of a Litre of Auto Diesel, the Tax Take and Tax Exclusive Price
0
20
40
60
80
100
120
140
1999 2000 2001 2002 2003 2004 2005 2006 2007 2008 2009
Cent
Price per Litre(a) (Cent)Total Tax Content (Cent)Tax Exclusive Price (Cent)
20

Revenue Commissioners Statistical Report 2009
EXCISE DUTY ON GASEOUS HYDROCARBONS IN LIQUID FORM (LPG)
TABLE EX17
Quantities Retained for Home Use and Net Excise Receipts Fully Duty Paid Partly Rebated(a) Total
Year Quantity (Litres '000)
Net Receipts € Quantity (Litres'000)
Net Receipts € Quantity (Litres '000)
Net Receipts €
1999 4,234 262,993 260,064 4,684,455 264,298 4,947,448 2000 3,577 296,056 284,589 5,015,158 288,166 5,311,214 2001 2,571 135,688 277,311 4,971,042 279,882 5,106,730 2002 2,256 107,602 267,218 4,769,503 269,474 4,877,105 2003 1,958 93,663 273,674 4,970,760 275,632 5,064,423 2004 1,748 77,343 279,022 5,078,898 280,770 5,156,241 2005 1,930 108,426 277,083 5,404,755 279,013 5,513,181 2006 1,505 95,672 276,307 2,829,229 277,812 2,924,901 2007 1,037 65,933 278,852 - 279,889 65,933 2008 799 49,347 241,613 - 242,411 49,347 2009 521 30,625 152,764 - 153,285 30,625 (a) This rate applies to LPG for non automotive use. With effect from 1 July 1991, there is a partial rebate on LPG used in horticultural production.
21

Revenue Commissioners Statistical Report 2009
Cigarettes
Year Quantity Receipts Cigars Fine Cut Other Smoking Total Other Tobacco Total Net Receipts000's Percent Change € Quantity - Kgs Quantity - Kgs Quantity - Kgs Quantity - Kgs Receipts € €
1999 6,868,335 6.9% 830,507,274 79,777 126,128 65,878 271,783 31,004,790 861,512,064 2000 6,848,022 -0.3% 923,092,056 81,644 123,897 60,823 266,364 35,560,329 958,652,385 2001 6,771,984 -1.1% 1,102,290,292 82,644 147,165 60,305 290,114 39,533,438 1,141,823,730 2002 7,015,554 3.6% 1,099,474,355 79,277 135,569 52,570 267,416 37,842,856 1,137,317,211 2003 6,295,263 -10.3% 1,119,452,754 75,965 111,904 47,129 234,998 37,795,038 1,157,247,791 2004 5,330,593 -15.3% 1,024,589,939 56,090 112,321 38,859 207,270 34,562,167 1,059,152,106 2005 5,514,228 3.4% 1,053,565,948 48,761 95,971 38,658 183,390 25,985,239 1,079,551,186 2006 5,604,884 1.6% 1,071,394,609 47,164 109,464 33,825 190,453 31,948,391 1,103,340,167 2007 5,401,702 -3.6% 1,154,976,838 46,622 122,848 32,388 201,858 37,000,027 1,191,976,865 2008 4,940,567 -8.5% 1,131,532,463 44,290 128,502 25,971 198,763 39,457,948 1,170,990,411 2009 4,607,146 -6.7% 1,155,366,383 38,169 219,985 27,598 285,751 61,110,266 1,216,476,649
Note:From 25 February 1993, Other Tobacco Products were reclassified into two new categories, (1) "Fine Cut Tobacco", replaced the existing category "Other Tobacco"and 2) "Other Smoking Tobacco" replaced "Sweetened Tobacco",( "Hard Pressed" and "Other Pipe."
Other Tobacco Products
EXCISE DUTY ON TOBACCO PRODUCTSExcise duty on cigarettes consists of a specific rate of duty levied per one thousand cigarettes together with a fixed percentage of the price at which the cigarettes are sold by retail.All other tobacco products are charged at a specific rate
duty per kilogram.
TABLE EX18
Quantities Retained for Home Use and Net Excise Receipts
Cigarette Consumption
4,500,000
5,000,000
5,500,000
6,000,000
6,500,000
7,000,000
7,500,000
1999 2000 2001 2002 2003 2004 2005 2006 2007 2008 2009
('000
s)
22
Revenue Commissioners Statistical Report 2009
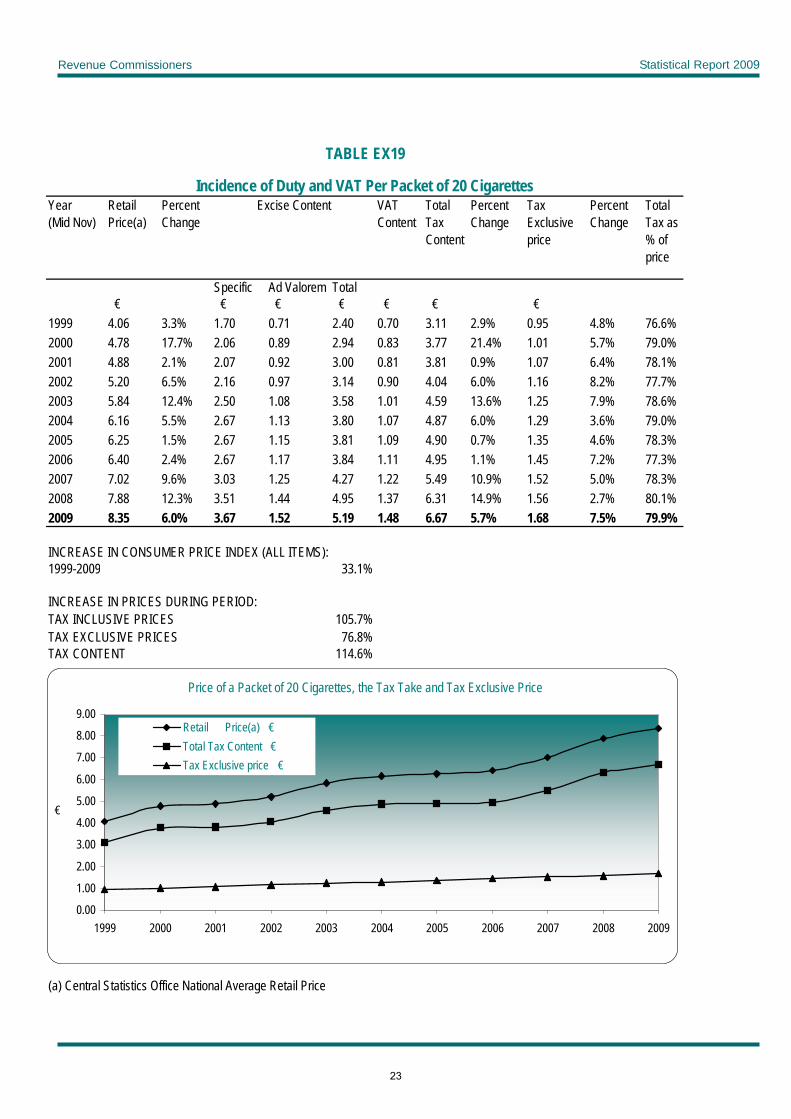
TABLE EX19
Incidence of Duty and VAT Per Packet of 20 CigarettesYear (Mid Nov)
Retail Price(a)
Percent Change
Excise Content VAT Content
Total Tax Content
Percent Change
Tax Exclusive price
Percent Change
Total Tax as % of price
Specific Ad Valorem Total € € € € € € €
1999 4.06 3.3% 1.70 0.71 2.40 0.70 3.11 2.9% 0.95 4.8% 76.6%2000 4.78 17.7% 2.06 0.89 2.94 0.83 3.77 21.4% 1.01 5.7% 79.0%2001 4.88 2.1% 2.07 0.92 3.00 0.81 3.81 0.9% 1.07 6.4% 78.1%2002 5.20 6.5% 2.16 0.97 3.14 0.90 4.04 6.0% 1.16 8.2% 77.7%2003 5.84 12.4% 2.50 1.08 3.58 1.01 4.59 13.6% 1.25 7.9% 78.6%2004 6.16 5.5% 2.67 1.13 3.80 1.07 4.87 6.0% 1.29 3.6% 79.0%2005 6.25 1.5% 2.67 1.15 3.81 1.09 4.90 0.7% 1.35 4.6% 78.3%2006 6.40 2.4% 2.67 1.17 3.84 1.11 4.95 1.1% 1.45 7.2% 77.3%2007 7.02 9.6% 3.03 1.25 4.27 1.22 5.49 10.9% 1.52 5.0% 78.3%2008 7.88 12.3% 3.51 1.44 4.95 1.37 6.31 14.9% 1.56 2.7% 80.1%2009 8.35 6.0% 3.67 1.52 5.19 1.48 6.67 5.7% 1.68 7.5% 79.9%
INCREASE IN CONSUMER PRICE INDEX (ALL ITEMS): 1999-2009 33.1%
INCREASE IN PRICES DURING PERIOD:TAX INCLUSIVE PRICES 105.7%TAX EXCLUSIVE PRICES 76.8%TAX CONTENT 114.6%
(a) Central Statistics Office National Average Retail Price
Price of a Packet of 20 Cigarettes, the Tax Take and Tax Exclusive Price
0.00
1.00
2.00
3.00
4.00
5.00
6.00
7.00
8.00
9.00
1999 2000 2001 2002 2003 2004 2005 2006 2007 2008 2009
€
Retail Price(a) €Total Tax Content €Tax Exclusive price €
23
Revenue Commissioners Statistical Report 2009
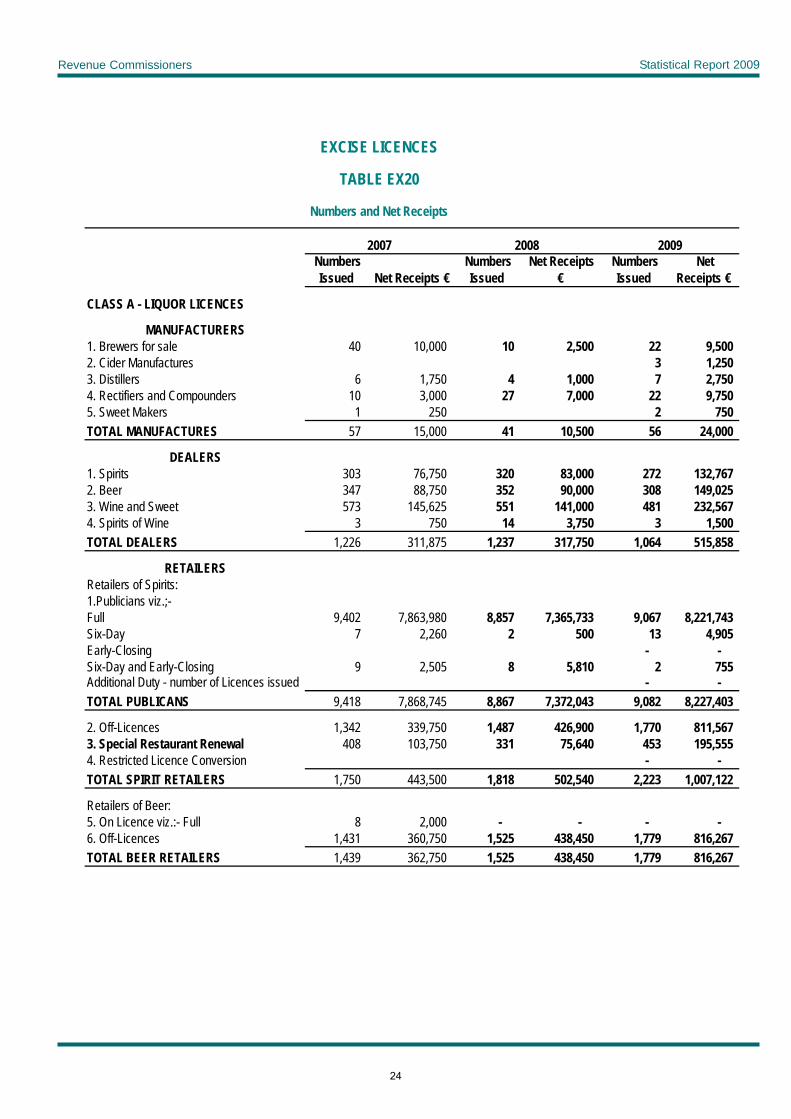
2007 2008 2009 Numbers
Issued Net Receipts € Numbers
Issued Net Receipts
€ Numbers
Issued Net
Receipts €
CLASS A - LIQUOR LICENCES
MANUFACTURERS1. Brewers for sale 40 10,000 10 2,500 22 9,500 2. Cider Manufactures 3 1,250 3. Distillers 6 1,750 4 1,000 7 2,750 4. Rectifiers and Compounders 10 3,000 27 7,000 22 9,750 5. Sweet Makers 1 250 2 750 TOTAL MANUFACTURES 57 15,000 41 10,500 56 24,000
DEALERS1. Spirits 303 76,750 320 83,000 272 132,767 2. Beer 347 88,750 352 90,000 308 149,025 3. Wine and Sweet 573 145,625 551 141,000 481 232,567 4. Spirits of Wine 3 750 14 3,750 3 1,500 TOTAL DEALERS 1,226 311,875 1,237 317,750 1,064 515,858
RETAILERSRetailers of Spirits:1.Publicians viz.;-Full 9,402 7,863,980 8,857 7,365,733 9,067 8,221,743 Six-Day 7 2,260 2 500 13 4,905 Early-Closing - - Six-Day and Early-Closing 9 2,505 8 5,810 2 755 Additional Duty - number of Licences issued - - TOTAL PUBLICANS 9,418 7,868,745 8,867 7,372,043 9,082 8,227,403
2. Off-Licences 1,342 339,750 1,487 426,900 1,770 811,567 3. Special Restaurant Renewal 408 103,750 331 75,640 453 195,555 4. Restricted Licence Conversion - - TOTAL SPIRIT RETAILERS 1,750 443,500 1,818 502,540 2,223 1,007,122
Retailers of Beer:5. On Licence viz.:- Full 8 2,000 - - - - 6. Off-Licences 1,431 360,750 1,525 438,450 1,779 816,267 TOTAL BEER RETAILERS 1,439 362,750 1,525 438,450 1,779 816,267
EXCISE LICENCES
TABLE EX20
Numbers and Net Receipts
24

Revenue Commissioners Statistical Report 2009
2007 2008 2009 Numbers
Issued Net Receipts € Numbers
Issued Net Receipts
€ Numbers
Issued Net
Receipts €
Retailers of Cider & Perry:7. Off-Licences 15 3,750 14 3,950 15 6,700 TOTAL CIDER & PERRY RETAILERS 15 3,750 14 3,950 15 6,700
Retailers of Wine:8. On-Licences viz.:- Full 2,400 615,250 2,307 587,000 2,287 963,007 9. Off-Licences 3,691 935,250 3,718 1,066,050 3,705 1,678,658 TOTAL WINE RETAILERS 6,091 1,550,500 6,025 1,653,050 5,992 2,641,665
Retailers of Sweets:10. On-Licences 1 250 - - 11. Off-Licences 9 2,250 15 3,750 - - TOTAL SWEETS RETAILERS 9 2,250 16 4,000 - -
12. Passenger Vessels - Annual 31 7,750 36 9,000 36 14,500 13. Passenger Aircraft 176 44,500 249 62,250 492 196,750 14. Railway Restaurant Cars 2 500 110 27,500 52 25,750 15. Special Restaurant Fee 42 166,670 44 167,420 38 144,590 16. Pre 1960 Hotel Licence Conversion 4 12,697 2 6,344 2 6,340 TOTAL 255 232,117 441 272,514 620 387,930
TOTAL CLASS A 20,260 10,790,487 19,984 10,574,797 20,831 13,626,945
1 Auctioneers 2,711 679,950 2,527 634,750 2,121 533,250 2 Auction Permits 330 83,250 290 72,250 169 40,000 3 Bookmakers Licences 704 176,750 532 133,000 641 161,250 4 Gaming 108 61,805 105 62,895 91 737,250 5 Gaming Machines 10,267 2,754,685 10,210 2,434,100 8,705 2,069,345 6 House Agents 13 1,500 16 2,000 12 1,500 7 Hydrocarbon Oil Refiners - - 8 Hydrocarbon Oil Vendors 2,249 581,590 2,270 582,500 2,138 539,250 9 Liquid Petroleum Gas Vendors - - 10 Amusement Machines 6,311 781,080 6,127 747,752 6,858 865,880 11 Methylated Spirit Makers 10 3,517 8 1,520 10 1,960 12 Methylated Spirit Retailers 929 11,484 816 10,188 973 11,976 13 Tobacco Manufacturers 3 570 1 190 - - 14 Bookmaker 361A(Tote)15 Other (instances)
TOTAL CLASS B 23,635 5,136,181 22,902 4,681,145 21,718 4,961,661
TOTAL CLASSES A & B 43,895 15,926,669 42,886 15,255,942 42,549 19,308,793
25
Revenue Commissioners Statistical Report 2009
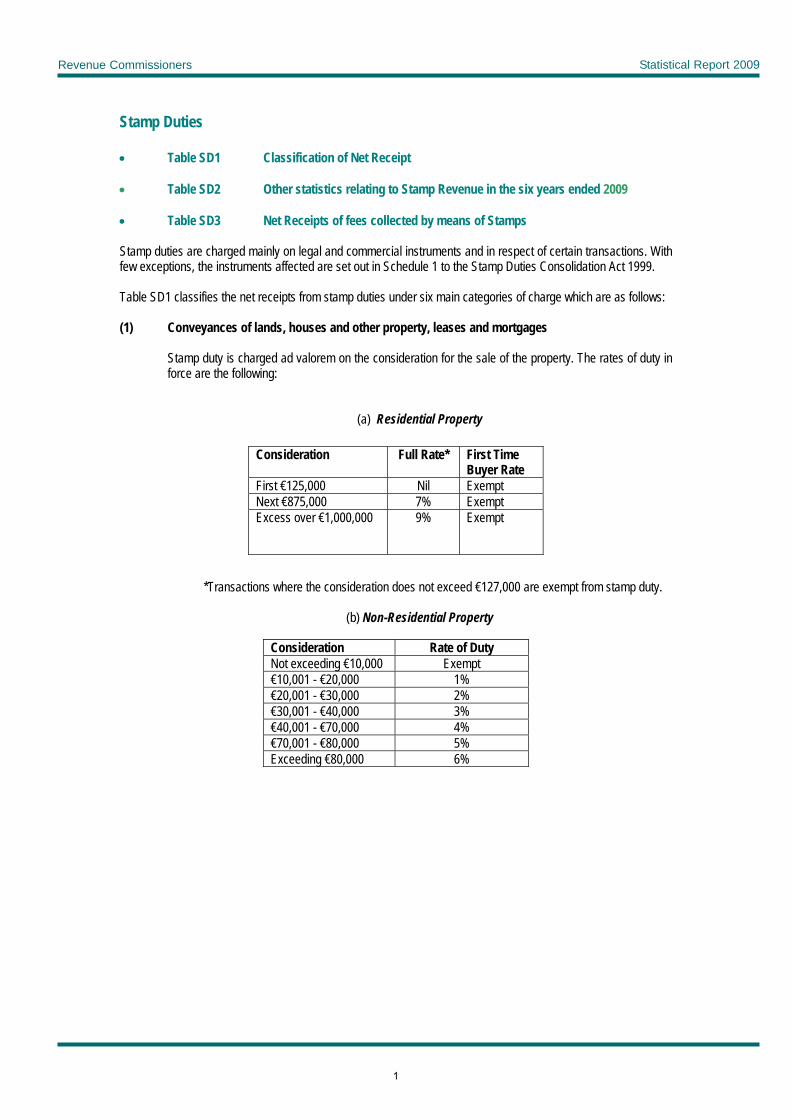
Stamp Duties • Table SD1 Classification of Net Receipt • Table SD2 Other statistics relating to Stamp Revenue in the six years ended 2009 • Table SD3 Net Receipts of fees collected by means of Stamps Stamp duties are charged mainly on legal and commercial instruments and in respect of certain transactions. With few exceptions, the instruments affected are set out in Schedule 1 to the Stamp Duties Consolidation Act 1999. Table SD1 classifies the net receipts from stamp duties under six main categories of charge which are as follows: (1) Conveyances of lands, houses and other property, leases and mortgages
Stamp duty is charged ad valorem on the consideration for the sale of the property. The rates of duty in force are the following:
(a) Residential Property Consideration
Full Rate*
First Time Buyer Rate
First €125,000 Nil Exempt Next €875,000 7% Exempt Excess over €1,000,000 9% Exempt
*Transactions where the consideration does not exceed €127,000 are exempt from stamp duty.
(b) Non-Residential Property
Consideration Rate of Duty Not exceeding €10,000 Exempt €10,001 - €20,000 1% €20,001 - €30,000 2% €30,001 - €40,000 3% €40,001 - €70,000 4% €70,001 - €80,000 5% Exceeding €80,000 6%
1
Revenue Commissioners Statistical Report 2009
In the case of gifts, the duty is charged on the value of the property. Where the transfer is between certain classes of relatives, the maximum duty is one half of the duty otherwise chargeable in accordance with the above tables whether the conveyance is by way of gift or sale. The ad valorem rates apply also to the consideration, other than the rent, in the case of leases. Various exemptions and reliefs have been provided for. For example, certain transfers and leases of houses and apartments are exempt from stamp duty. The rate of duty on mortgages, in excess of €254,000, was 0.1% of the amount secured subject to a maximum duty of €630. The charge on mortgages was abolished for instruments executed on or after 7 December 2006.
(2) Transactions in Stocks and Shares
The main item in this category is transfers of stocks and shares by way of sale. Such transfers attract duty at the rate of 1% of the consideration. In the case of gifts the duty is charged at the same rate on the value of the stocks and shares. There is an exemption from the 1% duty on stock transfer forms executed on or after 24 December 2008 where the duty involved is €10 or less.
(3) Companies Capital Duty
Companies capital duty was imposed at the rate of 0.5% on the assets contributed to a capital company. This duty was abolished with effect from 7 December 2005.
(4) Cheques, Credit cards etc.
Cheques, drafts and orders are chargeable with a stamp duty of 50 cent. Credit cards and charge cards are chargeable with a stamp duty of €30. ATM cards and Debit cards are chargeable with a stamp duty of €2.50. Combined ATM/Debit cards are chargeable with a stamp duty of €5 where both functions are used in a year and €2.50 where only one of the functions is used in a year.
(5) Insurance and Miscellaneous
A stamp duty is levied at the rate of 3% on premiums received by insurance companies from certain classes of non-life insurance business. The 3% levy applies to premiums received on or after 1 June 2009 in respect of offers of insurance or notices of renewal of insurance issued by an insurer on or after 8 April 2009. Prior to 8 April 2009, a 2% levy applied. Policies of non-life insurance are subject to a stamp duty of €1. A stamp duty is levied at the rate of 1% on life assurance premiums, from the quarter ending 30 September 2009. The miscellaneous category includes items such as the levy on “Section 84” loans, penalties and miscellaneous documents which have not been classified.
(6) Levy on Certain Financial Institutions
A stamp duty was levied on certain financial institutions at a rate of 50% of the DIRT payable by each institution in 2001, subject to a ceiling, for the years 2003, 2004 and 2005.
Statistics relating to instruments and to the amount of fees collected by means of stamps are contained in Tables SD2 and SD3 respectively.
2
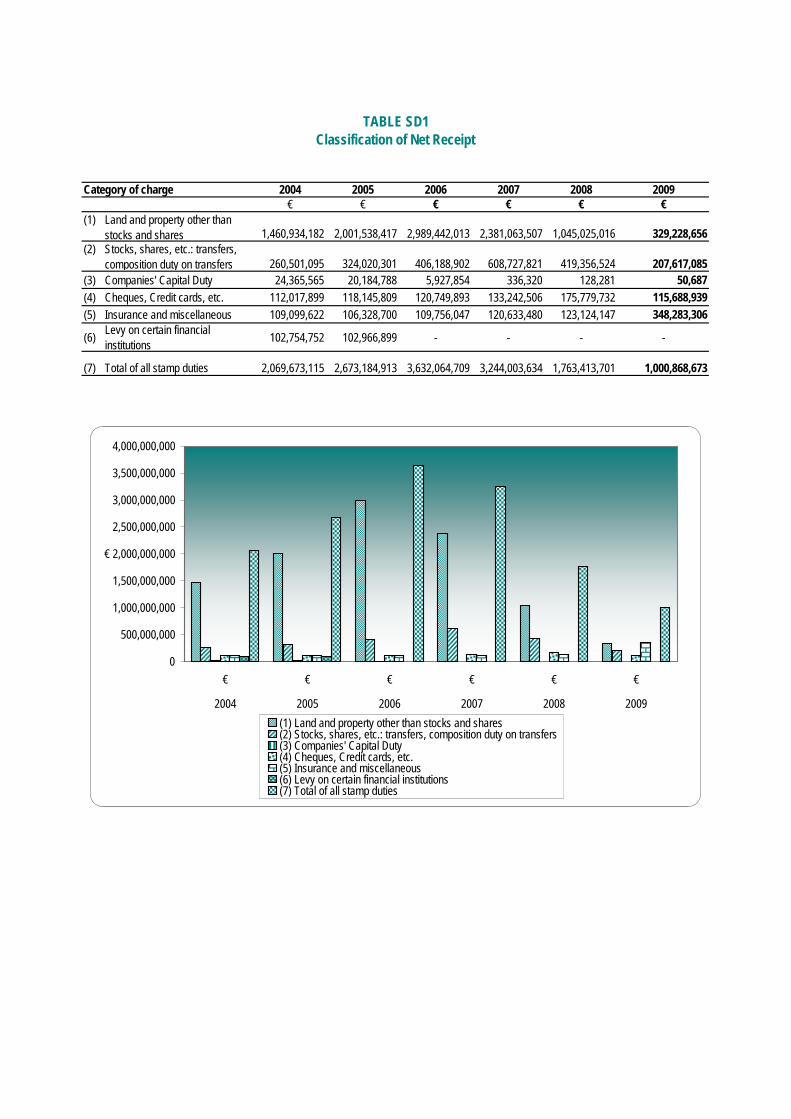
TABLE SD1Classification of Net Receipt
Category of charge 2004 2005 2006 2007 2008 2009€ € € € € €
(1) Land and property other than stocks and shares 1,460,934,182 2,001,538,417 2,989,442,013 2,381,063,507 1,045,025,016 329,228,656
(2) Stocks, shares, etc.: transfers, composition duty on transfers 260,501,095 324,020,301 406,188,902 608,727,821 419,356,524 207,617,085
(3) Companies' Capital Duty 24,365,565 20,184,788 5,927,854 336,320 128,281 50,687(4) Cheques, Credit cards, etc. 112,017,899 118,145,809 120,749,893 133,242,506 175,779,732 115,688,939(5) Insurance and miscellaneous 109,099,622 106,328,700 109,756,047 120,633,480 123,124,147 348,283,306
(6) Levy on certain financial institutions 102,754,752 102,966,899 - - - -
(7) Total of all stamp duties 2,069,673,115 2,673,184,913 3,632,064,709 3,244,003,634 1,763,413,701 1,000,868,673
0
500,000,000
1,000,000,000
1,500,000,000
2,000,000,000
2,500,000,000
3,000,000,000
3,500,000,000
4,000,000,000
€ € € € € €
2004 2005 2006 2007 2008 2009
€
(1) Land and property other than stocks and shares(2) Stocks, shares, etc.: transfers, composition duty on transfers(3) Companies' Capital Duty(4) Cheques, Credit cards, etc.(5) Insurance and miscellaneous(6) Levy on certain financial institutions(7) Total of all stamp duties
Revenue Commissioners Statistical Report 2009
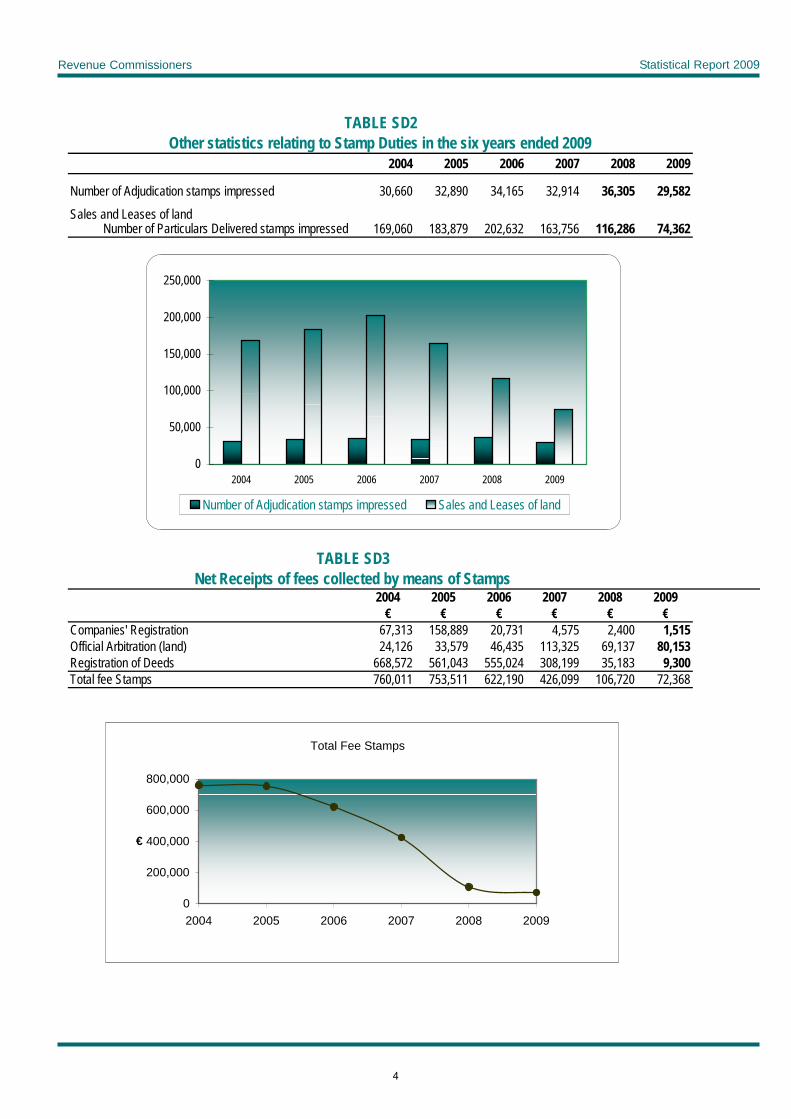
TABLE SD2Other statistics relating to Stamp Duties in the six years ended 2009
2004 2005 2006 2007 2008 2009
Number of Adjudication stamps impressed 30,660 32,890 34,165 32,914 36,305 29,582Sales and Leases of land
Number of Particulars Delivered stamps impressed 169,060 183,879 202,632 163,756 116,286 74,362
TABLE SD3Net Receipts of fees collected by means of Stamps
2004 2005 2006 2007 2008 2009€ € € € € €
Companies' Registration 67,313 158,889 20,731 4,575 2,400 1,515Official Arbitration (land) 24,126 33,579 46,435 113,325 69,137 80,153Registration of Deeds 668,572 561,043 555,024 308,199 35,183 9,300Total fee Stamps 760,011 753,511 622,190 426,099 106,720 72,368
0
50,000
100,000
150,000
200,000
250,000
2004 2005 2006 2007 2008 2009
Number of Adjudication stamps impressed Sales and Leases of land
Total Fee Stamps
0
200,000
400,000
600,000
800,000
2004 2005 2006 2007 2008 2009
€
4

Revenue Commissioners Statistical Report 2009
Capital Acquisitions Tax • Table CAT1 Exchequer Receipt and Net Receipt • Table CAT2 Distribution of Net Receipt for Capital Acquisitions Tax classified under
Inheritance Tax, Gift Tax, Discretionary Trust Tax and Probate Tax • Table CAT3 Gifts and Inheritances taken on or after 1 December 1999 – Rate of Tax Capital Acquisitions Tax comprises Gift Tax, Inheritance Tax, Discretionary Trust Tax and Probate Tax. (a) Gift Tax and Inheritance Tax Gift tax is charged on taxable gifts taken on or after 28 February 1974, and inheritance tax is charged on taxable inheritances taken on or after 1 April 1975. An inheritance is a gratuitous benefit taken on a death and a gift is a gratuitous benefit taken otherwise than on a death. The tax is charged on the taxable value of the gift or inheritance. The taxable value is arrived at by deducting from the market value of the property comprised in the gift or inheritance permissible debts and encumbrances and any consideration paid by the beneficiary. Once the taxable value of the gift or inheritance has been determined the amount of tax payable will depend on whether the appropriate tax-free threshold (known as the “ threshold amount”) has been exceeded and on the rate of tax in force at the time the gift or inheritance is made (see Table CAT3). There are three different group thresholds applying to a gift or an inheritance. Each group threshold is determined by the relationship between the beneficiary and the disponer. The group thresholds are indexed each year in line with inflation. The indexed group thresholds applicable to gifts and inheritances taken in 2009 are as follows:
(a) €542,544 to 7/04/09 (€434,000 from 8/4/09) : this applies where the beneficiary is a child, or a minor child of a deceased child, of the disponer. It also applies in certain circumstances to nephews and nieces of the disponer and to parents who take an inheritance from a deceased child;
(b) €54,254 to 7/04/09 (€43,400 from 8/4/09): included in this class are brothers, sisters,
nephews, nieces, and grandchildren of the disponer; (c) €27,127 to 7/04/09 (€21,700 from 8/4/09): this applies to a beneficiary who does not come
under either of the above group thresholds. All gifts and inheritances taken by a beneficiary on or after 5 December 1991 which come within the same group threshold are aggregated to determine the amount of tax payable on the current gift or inheritance, where that current gift or inheritance is taken on or after 5 December 2001. Various exemptions from gift and inheritance tax have been provided for. For example, the first €3,000 taken as a gift by a beneficiary from a disponer in any one year is exempt from tax as are gifts and inheritances taken by one spouse from the other. In addition to the exemptions various reliefs, which are subject to certain conditions being satisfied, apply i.e.
• Agricultural Relief. The relief operates by reducing the market value of agricultural property by 90%; • Business Relief. The relief is granted by reducing the taxable value of business property by 90%; and
• Dwelling-house Exemption. The exemption applies to a gift or inheritance of a dwelling-house taken on
or after 1 December 1999.
1
Revenue Commissioners Statistical Report 2009
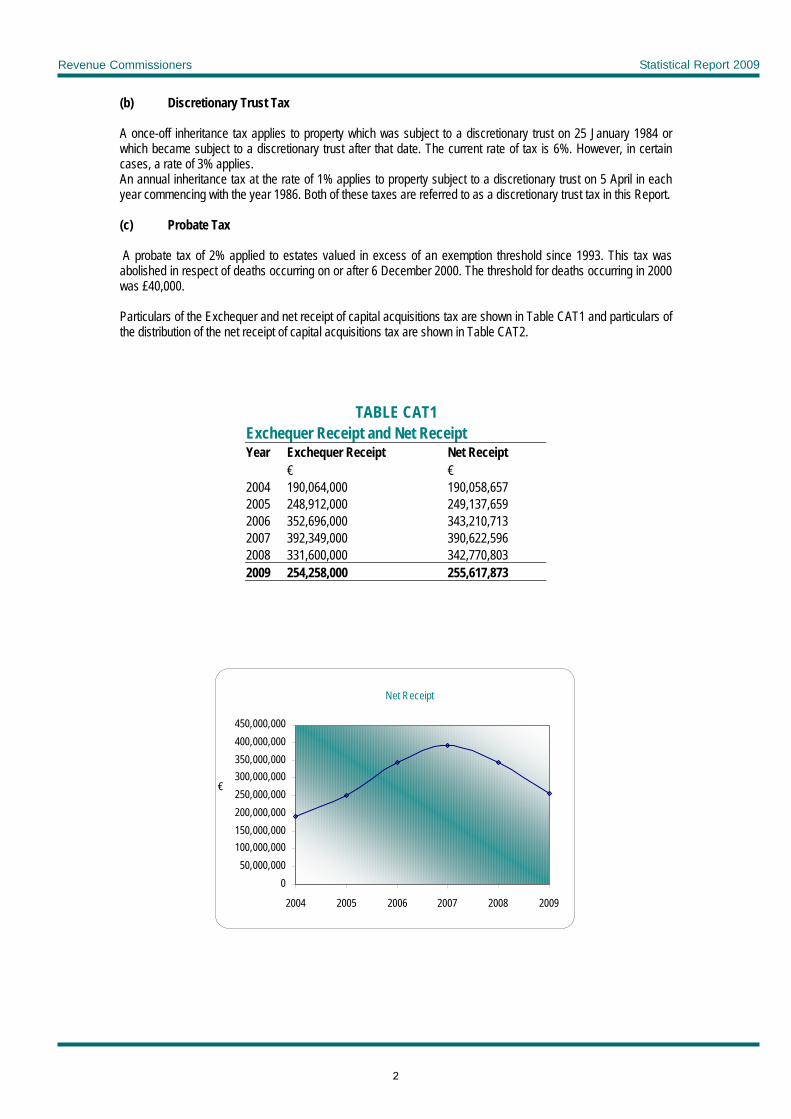
(b) Discretionary Trust Tax A once-off inheritance tax applies to property which was subject to a discretionary trust on 25 January 1984 or which became subject to a discretionary trust after that date. The current rate of tax is 6%. However, in certain cases, a rate of 3% applies. An annual inheritance tax at the rate of 1% applies to property subject to a discretionary trust on 5 April in each year commencing with the year 1986. Both of these taxes are referred to as a discretionary trust tax in this Report. (c) Probate Tax A probate tax of 2% applied to estates valued in excess of an exemption threshold since 1993. This tax was abolished in respect of deaths occurring on or after 6 December 2000. The threshold for deaths occurring in 2000 was £40,000. Particulars of the Exchequer and net receipt of capital acquisitions tax are shown in Table CAT1 and particulars of the distribution of the net receipt of capital acquisitions tax are shown in Table CAT2.
TABLE CAT1 Exchequer Receipt and Net Receipt Year Exchequer Receipt Net Receipt € € 2004 190,064,000 190,058,657 2005 248,912,000 249,137,659 2006 352,696,000 343,210,713 2007 392,349,000 390,622,596 2008 331,600,000 342,770,803 2009 254,258,000 255,617,873
Net Receipt
050,000,000
100,000,000150,000,000200,000,000250,000,000300,000,000350,000,000400,000,000450,000,000
2004 2005 2006 2007 2008 2009
€
2
Revenue Commissioners Statistical Report 2009
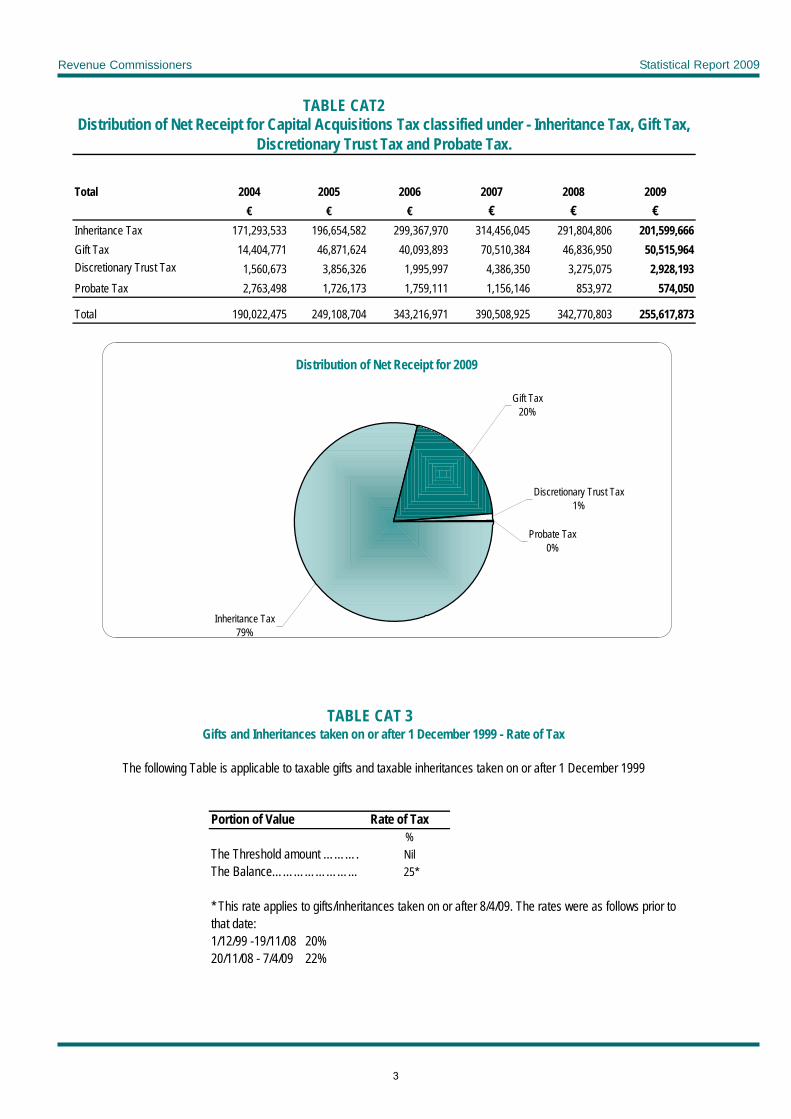
TABLE CAT2Distribution of Net Receipt for Capital Acquisitions Tax classified under - Inheritance Tax, Gift Tax,
Discretionary Trust Tax and Probate Tax.
Total 2004 2005 2006 2007 2008 2009€ € € € € €
Inheritance Tax 171,293,533 196,654,582 299,367,970 314,456,045 291,804,806 201,599,666Gift Tax 14,404,771 46,871,624 40,093,893 70,510,384 46,836,950 50,515,964Discretionary Trust Tax 1,560,673 3,856,326 1,995,997 4,386,350 3,275,075 2,928,193Probate Tax 2,763,498 1,726,173 1,759,111 1,156,146 853,972 574,050
Total 190,022,475 249,108,704 343,216,971 390,508,925 342,770,803 255,617,873
TABLE CAT 3Gifts and Inheritances taken on or after 1 December 1999 - Rate of Tax
The following Table is applicable to taxable gifts and taxable inheritances taken on or after 1 December 1999
Portion of Value Rate of Tax%
The Threshold amount ………. NilThe Balance…………………... 25*
* This rate applies to gifts/inheritances taken on or after 8/4/09. The rates were as follows prior to that date:1/12/99 -19/11/08 20%20/11/08 - 7/4/09 22%
Distribution of Net Receipt for 2009
Probate Tax0%
Discretionary Trust Tax1%
Gift Tax20%
Inheritance Tax79%
3
Revenue Commissioners Statistical Report 2008
Residential Property Tax (RPT) ● Table RPT1 Exchequer Receipt and Net Receipt
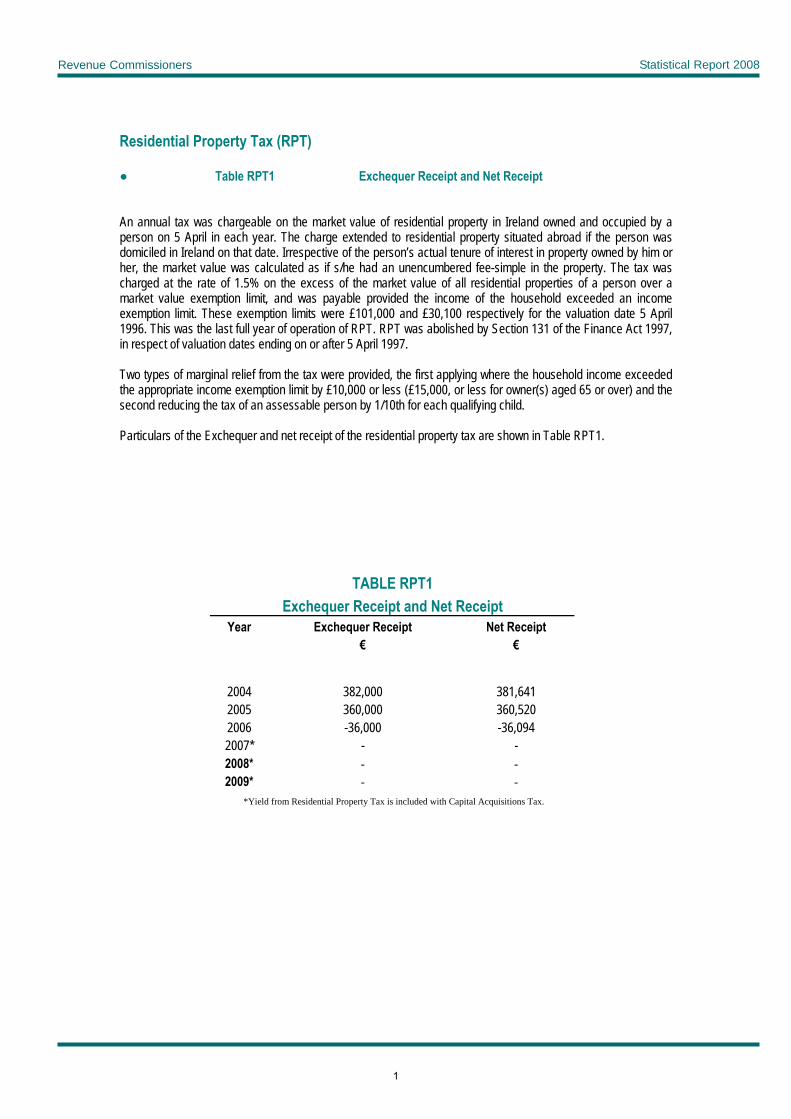
An annual tax was chargeable on the market value of residential property in Ireland owned and occupied by a person on 5 April in each year. The charge extended to residential property situated abroad if the person was domiciled in Ireland on that date. Irrespective of the person’s actual tenure of interest in property owned by him or her, the market value was calculated as if s/he had an unencumbered fee-simple in the property. The tax was charged at the rate of 1.5% on the excess of the market value of all residential properties of a person over a market value exemption limit, and was payable provided the income of the household exceeded an income exemption limit. These exemption limits were £101,000 and £30,100 respectively for the valuation date 5 April 1996. This was the last full year of operation of RPT. RPT was abolished by Section 131 of the Finance Act 1997, in respect of valuation dates ending on or after 5 April 1997. Two types of marginal relief from the tax were provided, the first applying where the household income exceeded the appropriate income exemption limit by £10,000 or less (£15,000, or less for owner(s) aged 65 or over) and the second reducing the tax of an assessable person by 1/10th for each qualifying child. Particulars of the Exchequer and net receipt of the residential property tax are shown in Table RPT1.
TABLE RPT1 Exchequer Receipt and Net Receipt
Year Exchequer Receipt Net Receipt € €
2004 382,000 381,641 2005 360,000 360,520 2006 -36,000 -36,094 2007* - - 2008* - - 2009* - -
*Yield from Residential Property Tax is ncluded with Capital Acquisitions Tax. i
1
Revenue Commissioners Statistical Report 2009
Income Tax
. • Table IT1 Taxation in force for the years 2004 to 2009
. • Table IT2 Income Tax and Income Levy Exchequer Receipt and Net Receipt
. • Table IT3 Pay As You Earn: Gross Receipts and Net Receipts
. • Table IT4 Numbers of Employers and Employees
. • Table IT5 Amount and effective rates of tax on specimen incomes, 2009
. • Table IT6 Cost of allowances and reliefs 2007 and 2008 The law relating to income tax was consolidated in the Taxes Consolidation Act 1997.
Broadly speaking, income tax is charged on -
(i) all income, where ever it arises, accruing to a person (other than a company), resident in the State; and (ii) all income, who ever it accrues to , arising in the State. The application of these principles is modified by various double taxation agreements.
For income tax purposes, income is classified under certain heads or schedules. The four schedules now existing deal with interest (taxed at source) on certain government and other securities (Schedule C), the profits of trades, professions and vocations and certain other income such as rents, interest on loans and income from abroad (Schedule D), income from an office, employment or pension (Schedule E) and income from distributions received from a resident company (Schedule F).
The tax is charged for a year of assessment beginning on 1 January (from 2002 – see below) at graduated rates in the case of individuals and at standard rate in the case of all other chargeable persons.
For individuals, income tax is also graduated by means of various allowances, deductions and reliefs now generally granted by means of tax credits. The allowances and deductions depend on the personal circumstances of the taxpayer and in effect exempt the first slice of income. The amount of the allowances, etc., is deducted from total income in arriving at taxable income. See note below re introduction of tax credits.
Normally the allowances and reliefs are given only to an individual who is resident in the State; but in certain cases, including that of an Irish citizen resident abroad, a proportion of the allowances may be given in the ratio which the taxpayer’s income liable to Irish tax bears to his or her total income.
For married couples three options are available -
(a) to be assessed as single persons, (b) to have the combined incomes of husband and wife treated as the husband’s or wife’s for income tax purposes; in this
event the husband or wife is entitled to a personal allowance amounting to twice that of a single person and to the benefit of double rate bands, and
(c) separate assessment where option (b) is taken but the spouses wish to have the tax apportioned between them and each spouse made responsible for the tax attributable to his or her own income.
Tax Credit System from 6 April 2001
With effect from 6 April 2001, Pay As You Earn (PAYE) tax is deducted from employees under a tax credit system. This tax credit system replaces the Tax-Free Allowance and Tax Table based system, which operated up to 5 April 2001. Tax Tables and Table Allowances are no longer a feature of the PAYE system. The move to a tax credit system has been accomplished by the gradual introduction of standard rated allowances in recent years. The standard rating of allowances equalises the value of tax free allowances to all taxpayers. Thus in such a system every €1,000 of a personal tax allowances is now worth €200 to each taxpayer i.e. €1,000 @ 20%. Calendar Tax Year from 1 January 2002 The income tax year, which previously ran from 6 April to 5 April, is now aligned with the calendar year from 1 January 2002. The first calendar tax year was, therefore, 1 January 2002 to 31 December 2002.
1
Revenue Commissioners Statistical Report 2009
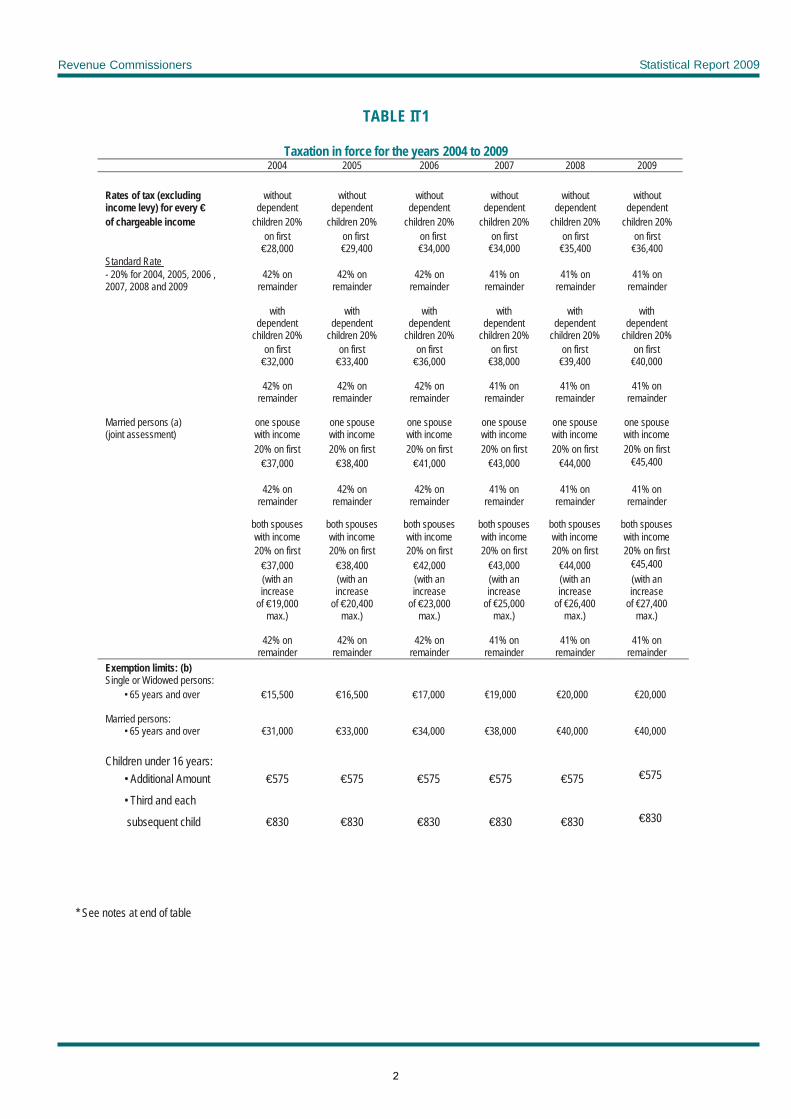
TABLE IT1
Taxation in force for the years 2004 to 2009 2004 2005 2006 2007 2008 2009
Rates of tax (excluding without without without without without without income levy) for every € dependent dependent dependent dependent dependent dependent of chargeable income children 20% children 20% children 20% children 20% children 20% children 20% on first
€28,000 on first
€29,400 on first
€34,000 on first
€34,000 on first
€35,400 on first
€36,400 Standard Rate - 20% for 2004, 2005, 2006 , 2007, 2008 and 2009
42% on remainder
42% on remainder
42% on remainder
41% on remainder
41% on remainder
41% on remainder
with
dependent
with
dependent
with
dependent
with
dependent
with
dependent
with
dependent children 20% children 20% children 20% children 20% children 20% children 20%
on first €32,000
on first €33,400
on first €36,000
on first €38,000
on first €39,400
on first €40,000
42% on
42% on
42% on
41% on
41% on
41% on
remainder remainder remainder remainder remainder remainder
Married persons (a) one spouse one spouse one spouse one spouse one spouse one spouse (joint assessment) with income with income with income with income with income with income
20% on first 20% on first 20% on first 20% on first 20% on first 20% on first €37,000 €38,400 €41,000 €43,000 €44,000 €45,400
42% on
42% on
42% on
41% on
41% on
41% on
remainder remainder remainder remainder remainder remainder
both spouses both spouses both spouses both spouses both spouses both spouses with income with income with income with income with income with income 20% on first 20% on first 20% on first 20% on first 20% on first 20% on first €37,000 €38,400 €42,000 €43,000 €44,000 €45,400 (with an
increase (with an increase
(with an increase
(with an increase
(with an increase
(with an increase
of €19,000 max.)
of €20,400 max.)
of €23,000 max.)
of €25,000 max.)
of €26,400 max.)
of €27,400 max.)
42% on
42% on
42% on
41% on
41% on
41% on
remainder remainder remainder remainder remainder remainder Exemption limits: (b) Single or Widowed persons: • 65 years and over €15,500 €16,500 €17,000 €19,000 €20,000 €20,000
Married persons:
• 65 years and over €31,000 €33,000 €34,000 €38,000 €40,000 €40,000
Children under 16 years:
• Additional Amount €575 €575 €575 €575 €575 €575
• Third and each
subsequent child €830 €830 €830 €830 €830 €830
* See notes at end of table
2
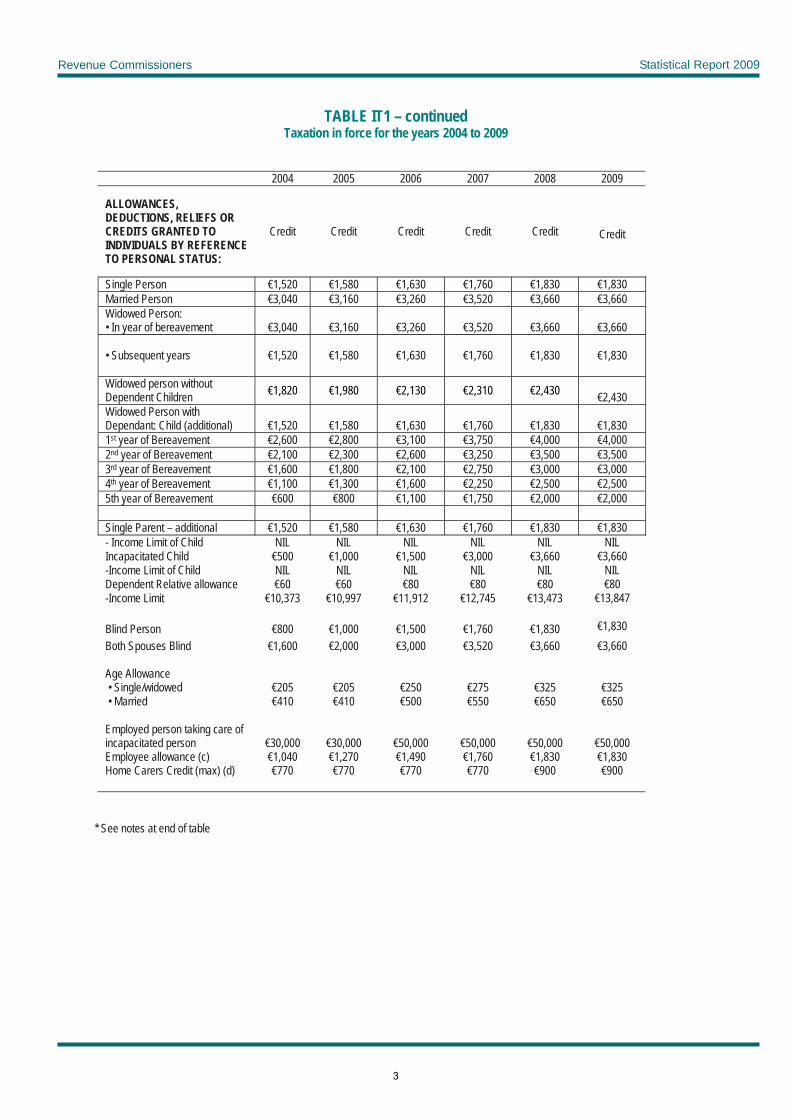
Revenue Commissioners Statistical Report 2009
TABLE IT1 – continued Taxation in force for the years 2004 to 2009
2004 2005 2006 2007 2008 2009
ALLOWANCES, DEDUCTIONS, RELIEFS OR CREDITS GRANTED TO INDIVIDUALS BY REFERENCE TO PERSONAL STATUS:
Credit Credit Credit Credit Credit
Credit
Single Person €1,520 €1,580 €1,630 €1,760 €1,830 €1,830 Married Person €3,040 €3,160 €3,260 €3,520 €3,660 €3,660 Widowed Person: • In year of bereavement
€3,040
€3,160
€3,260
€3,520
€3,660
€3,660
• Subsequent years €1,520 €1,580 €1,630 €1,760
€1,830
€1,830
Widowed person without Dependent Children €1,820 €1,980 €2,130 €2,310 €2,430
€2,430 Widowed Person with Dependant: Child (additional)
€1,520
€1,580
€1,630
€1,760
€1,830
€1,830
1st year of Bereavement €2,600 €2,800 €3,100 €3,750 €4,000 €4,000 2nd year of Bereavement €2,100 €2,300 €2,600 €3,250 €3,500 €3,500 3rd year of Bereavement €1,600 €1,800 €2,100 €2,750 €3,000 €3,000 4th year of Bereavement €1,100 €1,300 €1,600 €2,250 €2,500 €2,500 5th year of Bereavement €600 €800 €1,100 €1,750 €2,000 €2,000 Single Parent – additional €1,520 €1,580 €1,630 €1,760 €1,830 €1,830 - Income Limit of Child NIL NIL NIL NIL NIL NIL Incapacitated Child €500 €1,000 €1,500 €3,000 €3,660 €3,660 -Income Limit of Child NIL NIL NIL NIL NIL NIL Dependent Relative allowance €60 €60 €80 €80 €80 €80 -Income Limit €10,373 €10,997 €11,912 €12,745 €13,473 €13,847 Blind Person €800 €1,000 €1,500 €1,760 €1,830 €1,830 Both Spouses Blind €1,600 €2,000 €3,000 €3,520 €3,660 €3,660 Age Allowance
• Single/widowed €205 €205 €250 €275 €325 €325 • Married €410 €410 €500 €550 €650 €650 Employed person taking care of incapacitated person
€30,000
€30,000
€50,000
€50,000
€50,000
€50,000
Employee allowance (c) €1,040 €1,270 €1,490 €1,760 €1,830 €1,830 Home Carers Credit (max) (d) €770 €770 €770 €770 €900 €900
* See notes at end of table
3
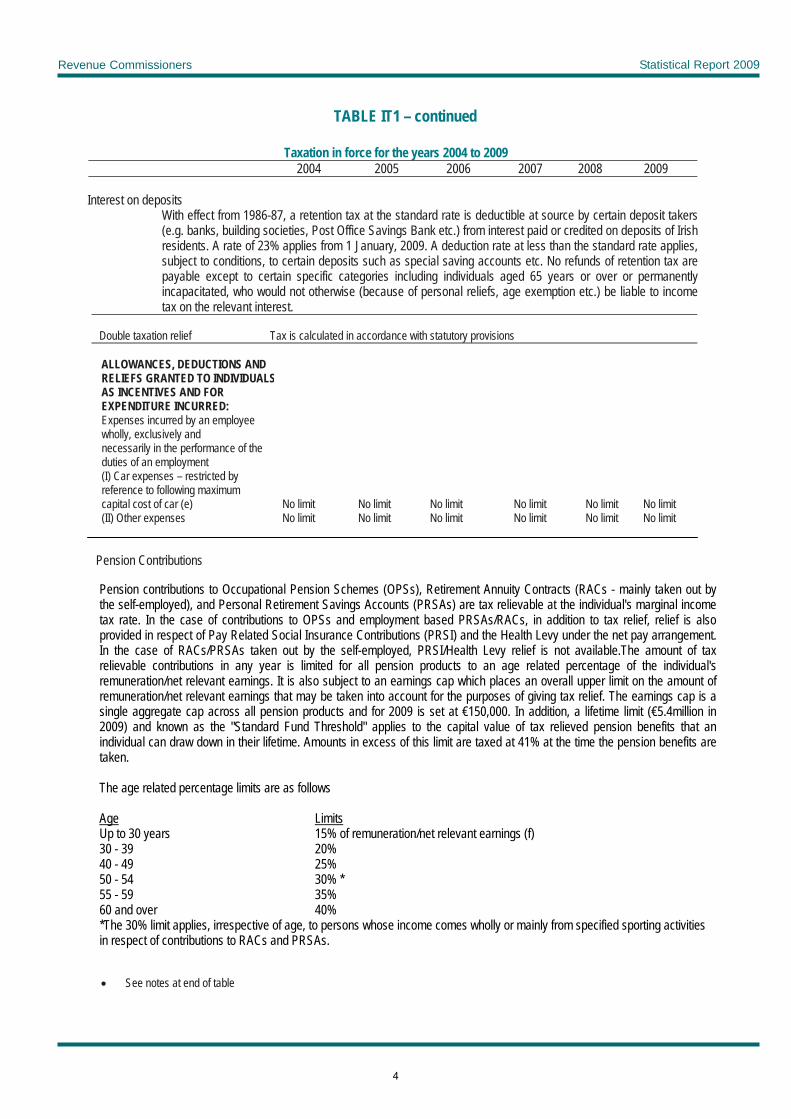
Revenue Commissioners Statistical Report 2009
TABLE IT1 – continued
Taxation in force for the years 2004 to 2009 2004 2005 2006 2007 2008 2009
Interest on deposits
With effect from 1986-87, a retention tax at the standard rate is deductible at source by certain deposit takers (e.g. banks, building societies, Post Office Savings Bank etc.) from interest paid or credited on deposits of Irish residents. A rate of 23% applies from 1 January, 2009. A deduction rate at less than the standard rate applies, subject to conditions, to certain deposits such as special saving accounts etc. No refunds of retention tax are payable except to certain specific categories including individuals aged 65 years or over or permanently incapacitated, who would not otherwise (because of personal reliefs, age exemption etc.) be liable to income tax on the relevant interest.
Double taxation relief Tax is calculated in accordance with statutory provisions
ALLOWANCES, DEDUCTIONS AND RELIEFS GRANTED TO INDIVIDUALS AS INCENTIVES AND FOR EXPENDITURE INCURRED: Expenses incurred by an employee wholly, exclusively and necessarily in the performance of the duties of an employment (I) Car expenses – restricted by reference to following maximum capital cost of car (e) No limit No limit No limit No limit No limit No limit (II) Other expenses No limit No limit No limit No limit No limit No limit
Pension Contributions
Pension contributions to Occupational Pension Schemes (OPSs), Retirement Annuity Contracts (RACs - mainly taken out by the self-employed), and Personal Retirement Savings Accounts (PRSAs) are tax relievable at the individual's marginal income tax rate. In the case of contributions to OPSs and employment based PRSAs/RACs, in addition to tax relief, relief is also provided in respect of Pay Related Social Insurance Contributions (PRSI) and the Health Levy under the net pay arrangement. In the case of RACs/PRSAs taken out by the self-employed, PRSI/Health Levy relief is not available.The amount of tax relievable contributions in any year is limited for all pension products to an age related percentage of the individual's remuneration/net relevant earnings. It is also subject to an earnings cap which places an overall upper limit on the amount of remuneration/net relevant earnings that may be taken into account for the purposes of giving tax relief. The earnings cap is a single aggregate cap across all pension products and for 2009 is set at €150,000. In addition, a lifetime limit (€5.4million in 2009) and known as the "Standard Fund Threshold" applies to the capital value of tax relieved pension benefits that an individual can draw down in their lifetime. Amounts in excess of this limit are taxed at 41% at the time the pension benefits are taken.
The age related percentage limits are as follows Age Limits Up to 30 years 15% of remuneration/net relevant earnings (f) 30 - 39 20% 40 - 49 25% 50 - 54 30% * 55 - 59 35% 60 and over 40% *The 30% limit applies, irrespective of age, to persons whose income comes wholly or mainly from specified sporting activities in respect of contributions to RACs and PRSAs.
• See notes at end of table
4
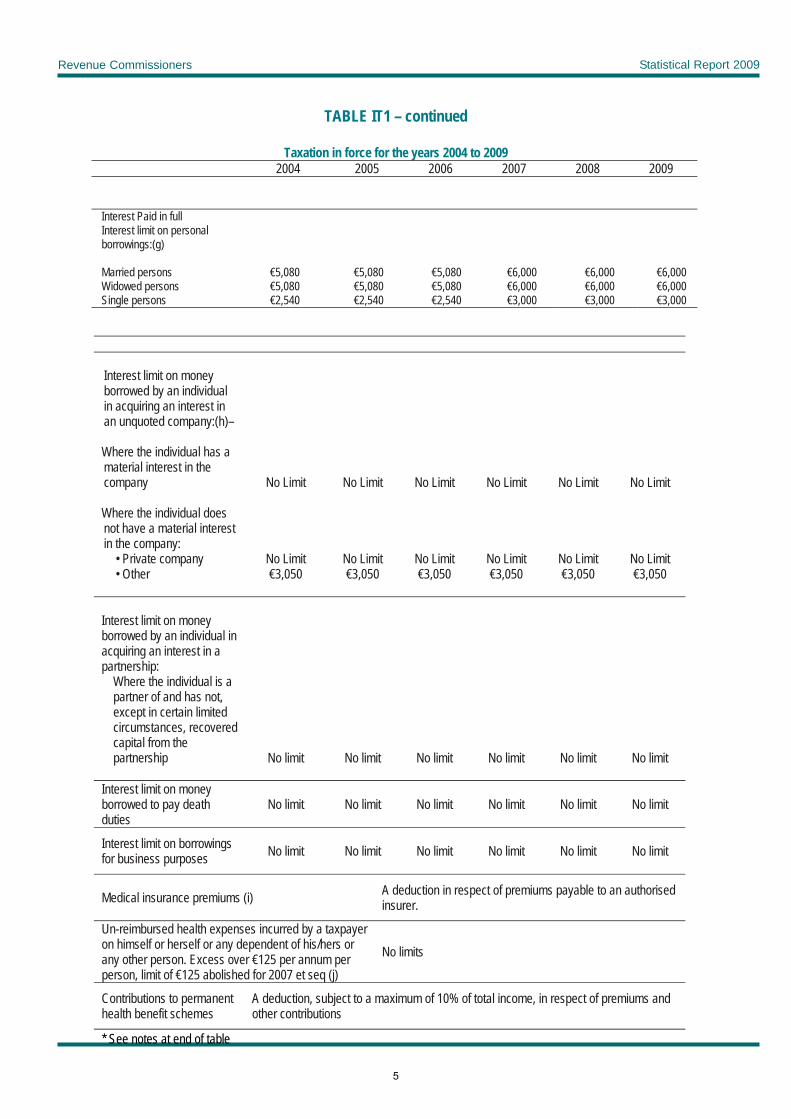
Revenue Commissioners Statistical Report 2009
TABLE IT1 – continued
Taxation in force for the years 2004 to 2009 2004 2005 2006 2007 2008 2009
Interest Paid in full Interest limit on personal borrowings:(g) Married persons €5,080 €5,080 €5,080 €6,000 €6,000 €6,000 Widowed persons €5,080 €5,080 €5,080 €6,000 €6,000 €6,000 Single persons €2,540 €2,540 €2,540 €3,000 €3,000 €3,000
Interest limit on money borrowed by an individual in acquiring an interest in an unquoted company:(h)–
Where the individual has a material interest in the company
No Limit
No Limit
No Limit
No Limit
No Limit
No Limit
Where the individual does not have a material interest in the company:
• Private company No Limit No Limit No Limit No Limit No Limit No Limit • Other €3,050 €3,050 €3,050 €3,050 €3,050 €3,050
Interest limit on money borrowed by an individual in acquiring an interest in a partnership:
Where the individual is a partner of and has not, except in certain limited circumstances, recovered capital from the partnership No limit No limit No limit No limit No limit No limit
Interest limit on money borrowed to pay death duties
No limit No limit No limit No limit No limit No limit
Interest limit on borrowings for business purposes No limit No limit No limit No limit No limit No limit
Medical insurance premiums (i) A deduction in respect of premiums payable to an authorised insurer.
Un-reimbursed health expenses incurred by a taxpayer on himself or herself or any dependent of his/hers or any other person. Excess over €125 per annum per person, limit of €125 abolished for 2007 et seq (j)
No limits
Contributions to permanent health benefit schemes
A deduction, subject to a maximum of 10% of total income, in respect of premiums and other contributions
* See notes at end of table
5
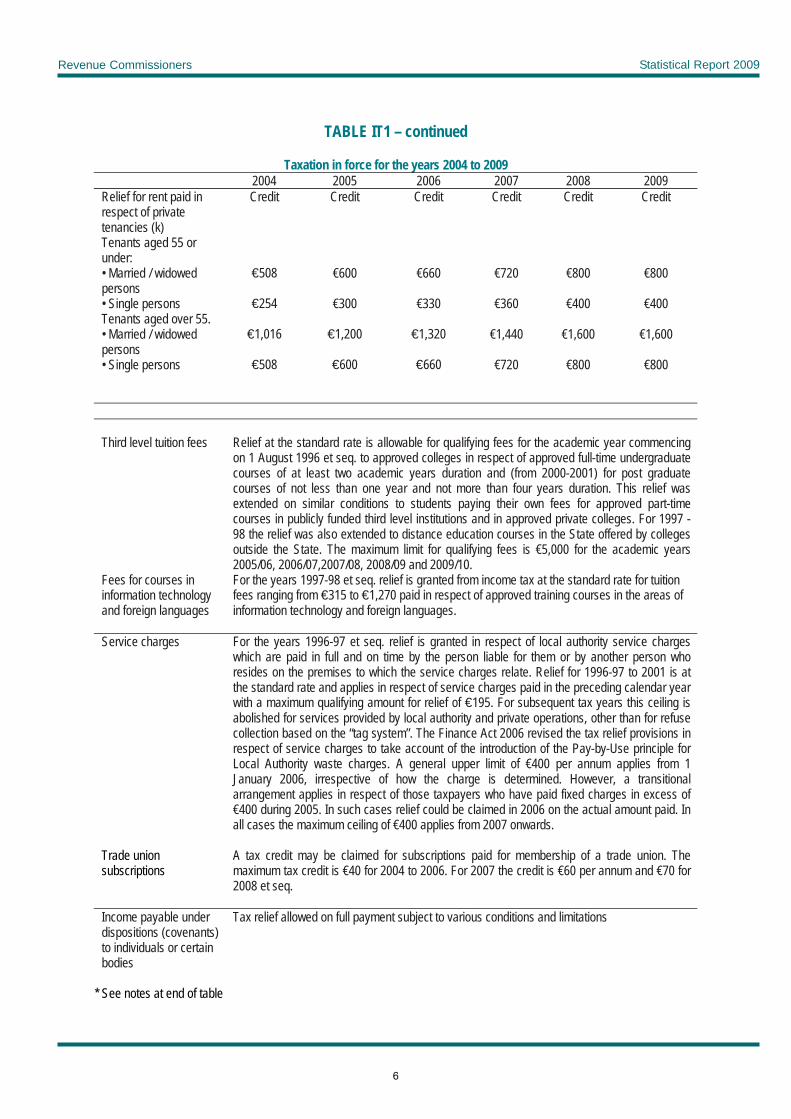
Revenue Commissioners Statistical Report 2009
TABLE IT1 – continued
Taxation in force for the years 2004 to 2009
2004 2005 2006 2007 2008 2009 Credit Credit Credit Credit Credit Credit Relief for rent paid in
respect of private tenancies (k)
Tenants aged 55 or under:
• Married / widowed persons
€508 €600 €660 €720 €800 €800
• Single persons €254 €300 €330 €360 €400 €400 Tenants aged over 55. • Married / widowed persons
€1,016 €1,200 €1,320 €1,440 €1,600 €1,600
• Single persons €508 €600 €660 €720 €800 €800 Third level tuition fees
Relief at the standard rate is allowable for qualifying fees for the academic year commencing on 1 August 1996 et seq. to approved colleges in respect of approved full-time undergraduate courses of at least two academic years duration and (from 2000-2001) for post graduate courses of not less than one year and not more than four years duration. This relief was extended on similar conditions to students paying their own fees for approved part-time courses in publicly funded third level institutions and in approved private colleges. For 1997 - 98 the relief was also extended to distance education courses in the State offered by colleges outside the State. The maximum limit for qualifying fees is €5,000 for the academic years 2005/06, 2006/07,2007/08, 2008/09 and 2009/10.
Fees for courses in information technology and foreign languages
For the years 1997-98 et seq. relief is granted from income tax at the standard rate for tuition fees ranging from €315 to €1,270 paid in respect of approved training courses in the areas of information technology and foreign languages.
Service charges
For the years 1996-97 et seq. relief is granted in respect of local authority service charges which are paid in full and on time by the person liable for them or by another person who resides on the premises to which the service charges relate. Relief for 1996-97 to 2001 is at the standard rate and applies in respect of service charges paid in the preceding calendar year with a maximum qualifying amount for relief of €195. For subsequent tax years this ceiling is abolished for services provided by local authority and private operations, other than for refuse collection based on the “tag system”. The Finance Act 2006 revised the tax relief provisions in respect of service charges to take account of the introduction of the Pay-by-Use principle for Local Authority waste charges. A general upper limit of €400 per annum applies from 1 January 2006, irrespective of how the charge is determined. However, a transitional arrangement applies in respect of those taxpayers who have paid fixed charges in excess of €400 during 2005. In such cases relief could be claimed in 2006 on the actual amount paid. In all cases the maximum ceiling of €400 applies from 2007 onwards.
Trade union subscriptions
A tax credit may be claimed for subscriptions paid for membership of a trade union. The maximum tax credit is €40 for 2004 to 2006. For 2007 the credit is €60 per annum and €70 for 2008 et seq.
Income payable under dispositions (covenants) to individuals or certain bodies
Tax relief allowed on full payment subject to various conditions and limitations
* See notes at end of table
6
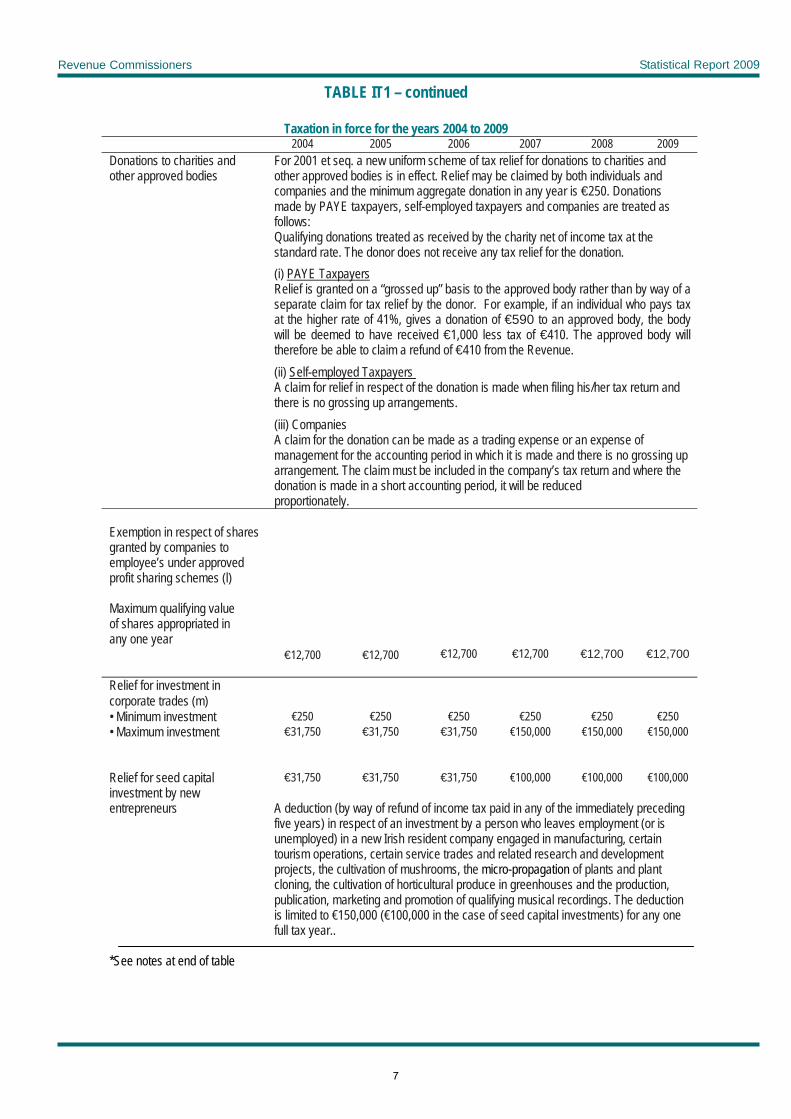
Revenue Commissioners Statistical Report 2009
TABLE IT1 – continued
Taxation in force for the years 2004 to 2009 2004 2005 2006 2007 2008 2009
Donations to charities and other approved bodies
For 2001 et seq. a new uniform scheme of tax relief for donations to charities and other approved bodies is in effect. Relief may be claimed by both individuals and companies and the minimum aggregate donation in any year is €250. Donations made by PAYE taxpayers, self-employed taxpayers and companies are treated as follows:
Qualifying donations treated as received by the charity net of income tax at the standard rate. The donor does not receive any tax relief for the donation.
(i) PAYE Taxpayers
Relief is granted on a “grossed up” basis to the approved body rather than by way of a separate claim for tax relief by the donor. For example, if an individual who pays tax at the higher rate of 41%, gives a donation of €590 to an approved body, the body will be deemed to have received €1,000 less tax of €410. The approved body will therefore be able to claim a refund of €410 from the Revenue.
(ii) Self-employed Taxpayers
A claim for relief in respect of the donation is made when filing his/her tax return and there is no grossing up arrangements.
(iii) Companies
A claim for the donation can be made as a trading expense or an expense of management for the accounting period in which it is made and there is no grossing up arrangement. The claim must be included in the company’s tax return and where the donation is made in a short accounting period, it will be reduced proportionately.
Exemption in respect of shares granted by companies to employee’s under approved profit sharing schemes (l)
Maximum qualifying value of shares appropriated in any one year
€12,700 €12,700
€12,700
€12,700
€12,700
€12,700
Relief for investment in corporate trades (m) • Minimum investment €250 €250 €250 €250 €250 €250 • Maximum investment €31,750 €31,750 €31,750 €150,000 €150,000 €150,000 Relief for seed capital €31,750 €31,750 €31,750 €100,000 €100,000 €100,000 investment by new entrepreneurs
A deduction (by way of refund of income tax paid in any of the immediately preceding five years) in respect of an investment by a person who leaves employment (or is unemployed) in a new Irish resident company engaged in manufacturing, certain tourism operations, certain service trades and related research and development projects, the cultivation of mushrooms, the micro-propagation of plants and plant cloning, the cultivation of horticultural produce in greenhouses and the production, publication, marketing and promotion of qualifying musical recordings. The deduction is limited to €150,000 (€100,000 in the case of seed capital investments) for any one full tax year..
*See notes at end of table
7
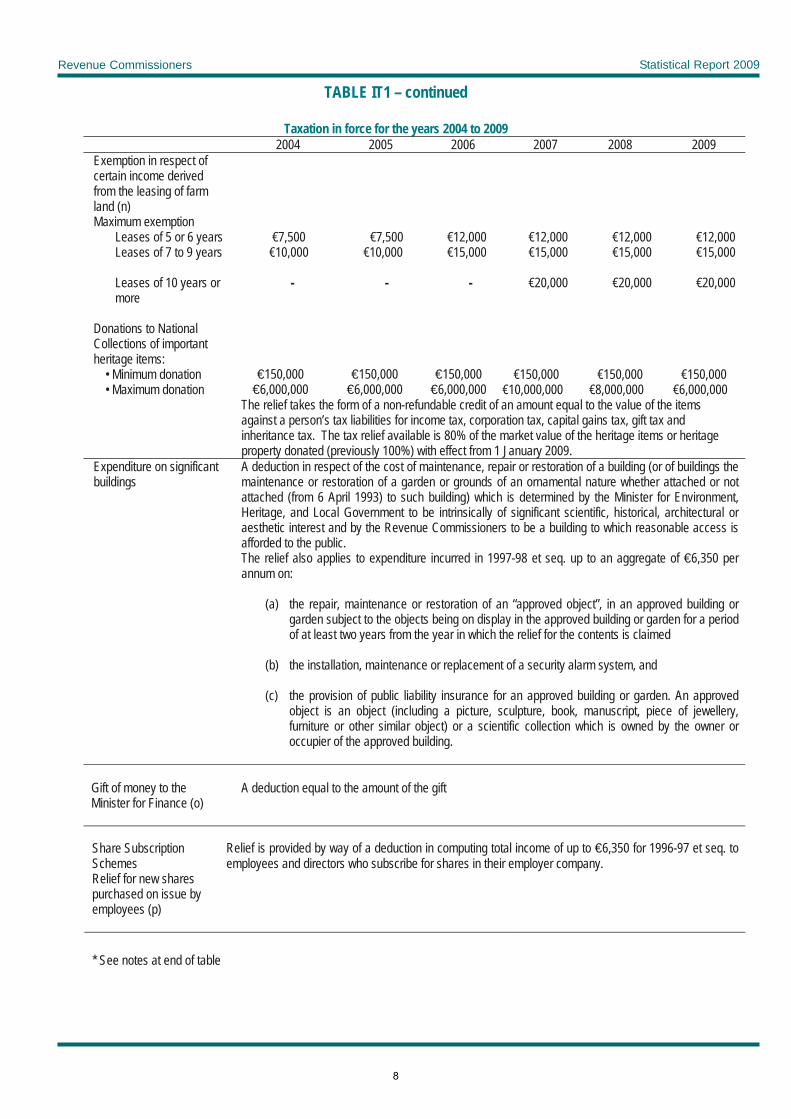
Revenue Commissioners Statistical Report 2009
TABLE IT1 – continued
Taxation in force for the years 2004 to 2009 2004 2005 2006 2007 2008 2009
Exemption in respect of certain income derived from the leasing of farm land (n) Maximum exemption
Leases of 5 or 6 years €7,500 €7,500 €12,000 €12,000 €12,000 €12,000 Leases of 7 to 9 years
€10,000 €10,000 €15,000 €15,000 €15,000 €15,000
Leases of 10 years or more
- - - €20,000 €20,000 €20,000
Donations to National Collections of important heritage items:
• Minimum donation €150,000 €150,000 €150,000 €150,000 €150,000 €150,000 • Maximum donation €6,000,000 €6,000,000 €6,000,000 €10,000,000 €8,000,000 €6,000,000 The relief takes the form of a non-refundable credit of an amount equal to the value of the items
against a person’s tax liabilities for income tax, corporation tax, capital gains tax, gift tax and inheritance tax. The tax relief available is 80% of the market value of the heritage items or heritage property donated (previously 100%) with effect from 1 January 2009.
Expenditure on significant buildings
A deduction in respect of the cost of maintenance, repair or restoration of a building (or of buildings the maintenance or restoration of a garden or grounds of an ornamental nature whether attached or not attached (from 6 April 1993) to such building) which is determined by the Minister for Environment, Heritage, and Local Government to be intrinsically of significant scientific, historical, architectural or aesthetic interest and by the Revenue Commissioners to be a building to which reasonable access is afforded to the public. The relief also applies to expenditure incurred in 1997-98 et seq. up to an aggregate of €6,350 per annum on:
(a) the repair, maintenance or restoration of an “approved object”, in an approved building or garden subject to the objects being on display in the approved building or garden for a period of at least two years from the year in which the relief for the contents is claimed
(b) the installation, maintenance or replacement of a security alarm system, and
(c) the provision of public liability insurance for an approved building or garden. An approved
object is an object (including a picture, sculpture, book, manuscript, piece of jewellery, furniture or other similar object) or a scientific collection which is owned by the owner or occupier of the approved building.
Gift of money to the Minister for Finance (o)
A deduction equal to the amount of the gift
Share Subscription Schemes Relief for new shares purchased on issue by employees (p)
Relief is provided by way of a deduction in computing total income of up to €6,350 for 1996-97 et seq. to employees and directors who subscribe for shares in their employer company.
* See notes at end of table
8
Revenue Commissioners Statistical Report 2009
NOTES ON TABLE IT1 (a) Such couples may elect for separate assessment in which case the tax otherwise payable by the assessable person on
their combined incomes is apportioned between the spouses in accordance with certain rules. The increase in the standard rate tax band for 2002 et seq. is restricted to the lower of €27,400 (for 2009) or the amount of the income of the spouse with the lower income. The increase is not transferable between spouses.
(b) Where the total income slightly exceeds the amounts shown, marginal relief is given by confining the tax charged to 40% of the excess.
(c) Extended for 1991-92 and subsequent years to cross-frontier workers where their employment is of a kind that, within the State, would qualify for the PAYE allowance. Extended, subject to conditions, for 1994-95 and subsequent years to the children of proprietary directors and the self-employed (including farmers) who are full-time employees in the business of their parents.
(d) A tax credit at the standard rate of tax (20%) is available for married couples where: • One spouse (the ‘home carer’) works in the home caring for one or more dependent persons, i.e., a child for whom
they are entitled to Social Welfare child benefit, a person aged 65 or over, or a person who is permanently incapacitated by reason of mental or physical infirmity and the qualifying person normally resides with the couple for the year.
• The home carer’s income is not in excess of €5,080. A reduced tax credit applies where the income is between €5,080 and €6,620.
The tax credit is not available to married couples that are taxed as single persons. Neither is the tax credit available to married couples with combined incomes over €45,400 in the tax year 2009 and who claim the increased standard rate tax band for dual income couples.
(e) In the case of motor expenses incurred during accounting periods ending in the year 2001 for companies and income tax basis periods ending on or after 1 January 2001 to 31 December 2001 for individuals, on cars which cost £17,000 or more, the running expenses are restricted to an amount equal to the expenses multiplied by the cost of the car less £17,000 over the cost of the car.
(f) “Relevant earnings” is defined as non-pensionable earned income. (g) Relief for interest on personal borrowings is confined to loans taken out for the purchase, repair, development or improvement of the borrower’s sole or main residence.
The relief is allowable at the standard rate and since 1 January 2002, is granted at source (TRS). Relief for first time buyers for 2008 is €10,000 single and €20,000 married / widowed.
(h) To qualify for the relief the individual must be a full-time director or employee of the company and must not, except in
certain limited circumstances, have recovered capital from the company. No relief is granted on interest on a loan applied in acquiring shares issued on or after 20 April 1990 if a business expansion scheme relief claim is made in respect of those shares. The interest deduction in arriving at total income is in addition to the deduction allowed for home purchase or improvement etc. The foregoing relief is abolished for loans applied on or after 29 January 1992, if at the time the loan is applied the company is a quoted company or loans applied prior to that date.
(i) Relief was based on the amount of premiums paid in the year preceding this year of assessment. From April 2001,
under new relief at source arrangements, relief is granted on a current year basis. (j) Alternatively, total expenses incurred in excess of €250 by the taxpayer on himself or herself and dependents as a
group, may be claimed. For 2007 et seq. the dependency requirement was abolished.
(k) This relief is granted at the standard rate for 2001 and subsequent years — 20%.
(l) The value of shares appropriated to a qualifying employee is, subject to a maximum limit, exempt from income tax at the time of the appropriation. Any subsequent disposals of the shares may attract tax, which will be ascertained by reference to a tapering scale linking the value of the shares for tax purposes with the length of time the shares were retained by the employee.
(m) Subject to conditions, relief from income tax is available by way of a deduction from total income to individuals who invest long-term risk capital in ordinary shares of unquoted companies resident solely in Ireland and which are engaged in the State in certain manufacturing and /or service industries, certain research and development activities and trading activities on an exchange facility established in the Custom House Docks Area. Where the investment is
9
Revenue Commissioners Statistical Report 2009
made through an investment fund designated by the Revenue Commissioners for the purposes of the relief the minimum limit of €250 does not apply.
(n) This exemption is, subject to certain conditions, available to an individual aged 55 years or over or an individual who is permanently incapacitated by mental or physical infirmity from carrying on a trade of farming. For 2004 et seq. the age limit is 40 years.
(o) The gift must be accepted by the Minister and be for use for any purposes for or towards the cost of which Exchequer funds are provided.
(p) The company issuing the shares must be one whose business consists wholly or mainly of the carrying on in the State of one or more trades or a holding company for such companies. The shares must be new ordinary shares issued at full market value, which are fully paid up and not subject to any special restriction. The amount of €6,350 for 1996-97 et seq. does not have to be invested all at once and may be spread over a number of years of assessment. The individual must hold the shares for a minimum period of 3 years. A disposal of the shares within that period will result in a withdrawal of the relief.
10
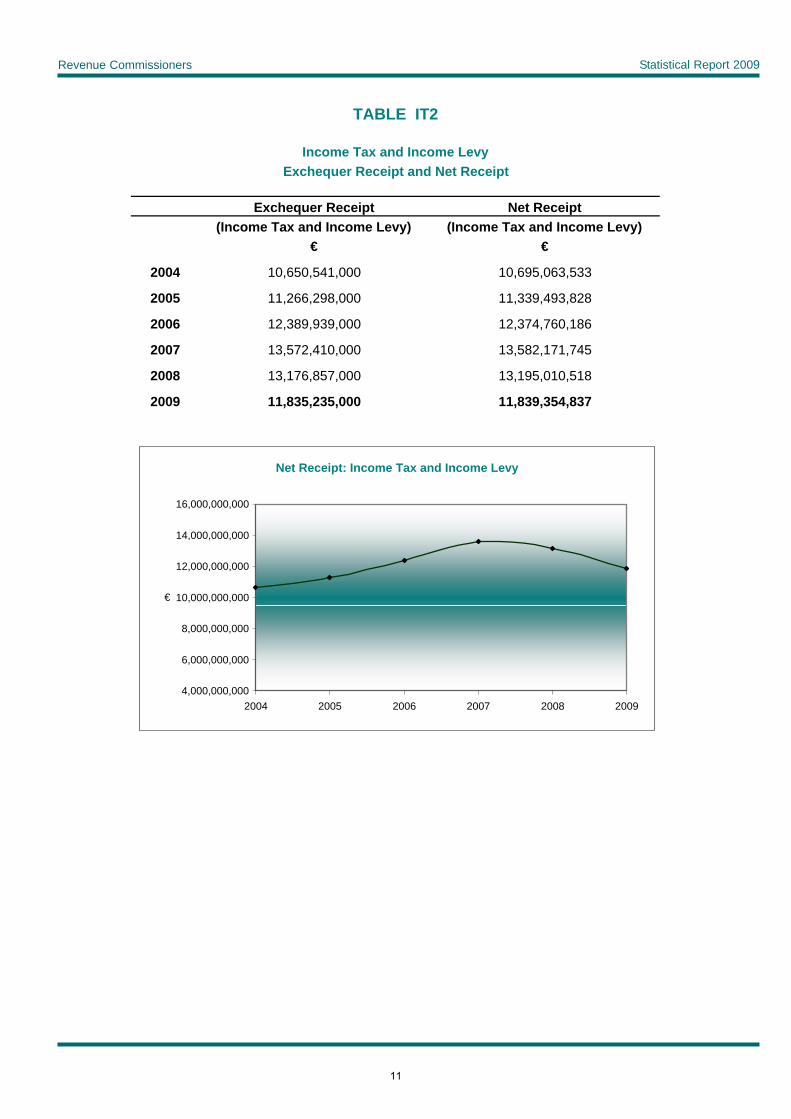
Revenue Commissioners Statistical Report 2009
TABLE IT2
Income Tax and Income LevyExchequer Receipt and Net Receipt
Exchequer Receipt Net Receipt(Income Tax and Income Levy) (Income Tax and Income Levy)
€ €
2004 10,650,541,000 10,695,063,533
2005 11,266,298,000 11,339,493,828
2006 12,389,939,000 12,374,760,186
2007 13,572,410,000 13,582,171,745
2008 13,176,857,000 13,195,010,518
2009 11,835,235,000 11,839,354,837
Net Receipt: Income Tax and Income Levy
4,000,000,000
6,000,000,000
8,000,000,000
10,000,000,000
12,000,000,000
14,000,000,000
16,000,000,000
2004 2005 2006 2007 2008 2009
€
11
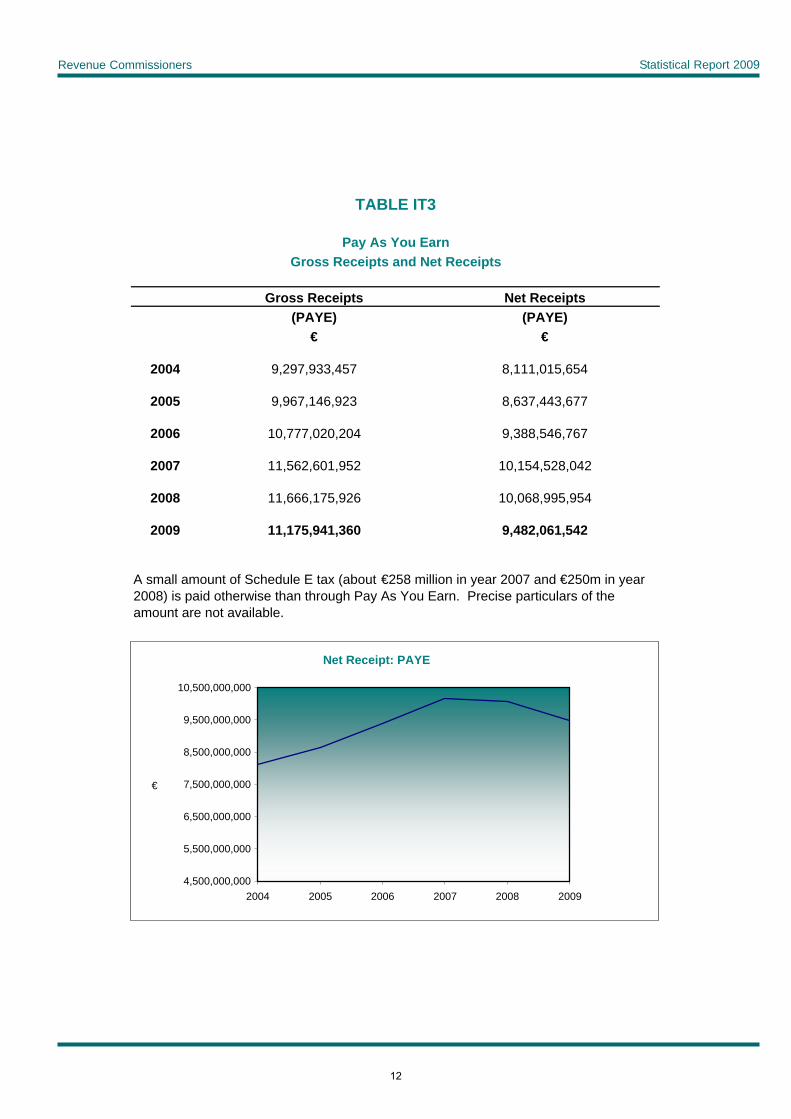
Revenue Commissioners Statistical Report 2009
Gross Receipts Net Receipts(PAYE) (PAYE)
€ €
2004 9,297,933,457 8,111,015,654
2005 9,967,146,923 8,637,443,677
2006 10,777,020,204 9,388,546,767
2007 11,562,601,952 10,154,528,042
2008 11,666,175,926 10,068,995,954
2009 11,175,941,360 9,482,061,542
TABLE IT3
Pay As You EarnGross Receipts and Net Receipts
A small amount of Schedule E tax (about €258 million in year 2007 and €250m in year 2008) is paid otherwise than through Pay As You Earn. Precise particulars of the amount are not available.
Net Receipt: PAYE
4,500,000,000
5,500,000,000
6,500,000,000
7,500,000,000
8,500,000,000
9,500,000,000
10,500,000,000
2004 2005 2006 2007 2008 2009
€
12
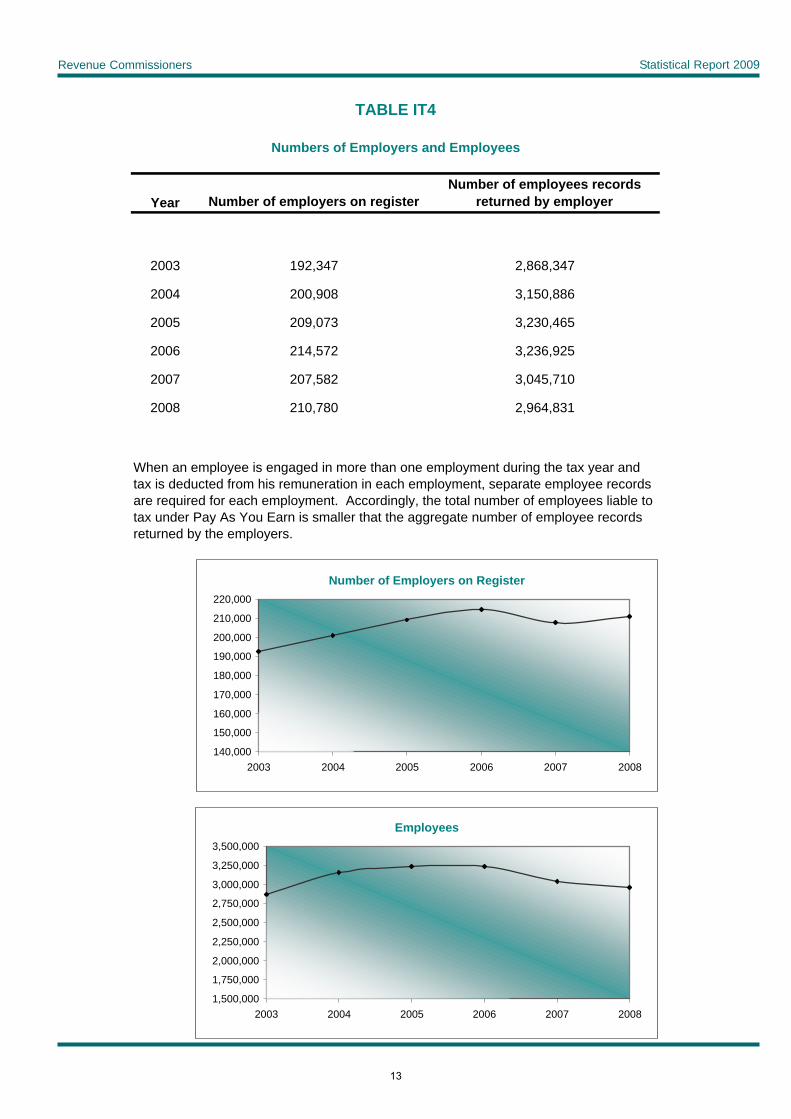
Revenue Commissioners Statistical Report 2009
TABLE IT4
Numbers of Employers and Employees
Year Number of employers on registerNumber of employees records
returned by employer
2003 192,347 2,868,347
2004 200,908 3,150,886
2005 209,073 3,230,465
2006 214,572 3,236,925
2007 207,582 3,045,710
2008 210,780 2,964,831
When an employee is engaged in more than one employment during the tax year and tax is deducted from his remuneration in each employment, separate employee records are required for each employment. Accordingly, the total number of employees liable to tax under Pay As You Earn is smaller that the aggregate number of employee records returned by the employers.
Number of Employers on Register
140,000
150,000
160,000
170,000
180,000
190,000
200,000
210,000
220,000
2003 2004 2005 2006 2007 2008
Employees
1,500,000
1,750,000
2,000,000
2,250,000
2,500,000
2,750,000
3,000,000
3,250,000
3,500,000
2003 2004 2005 2006 2007 2008
13
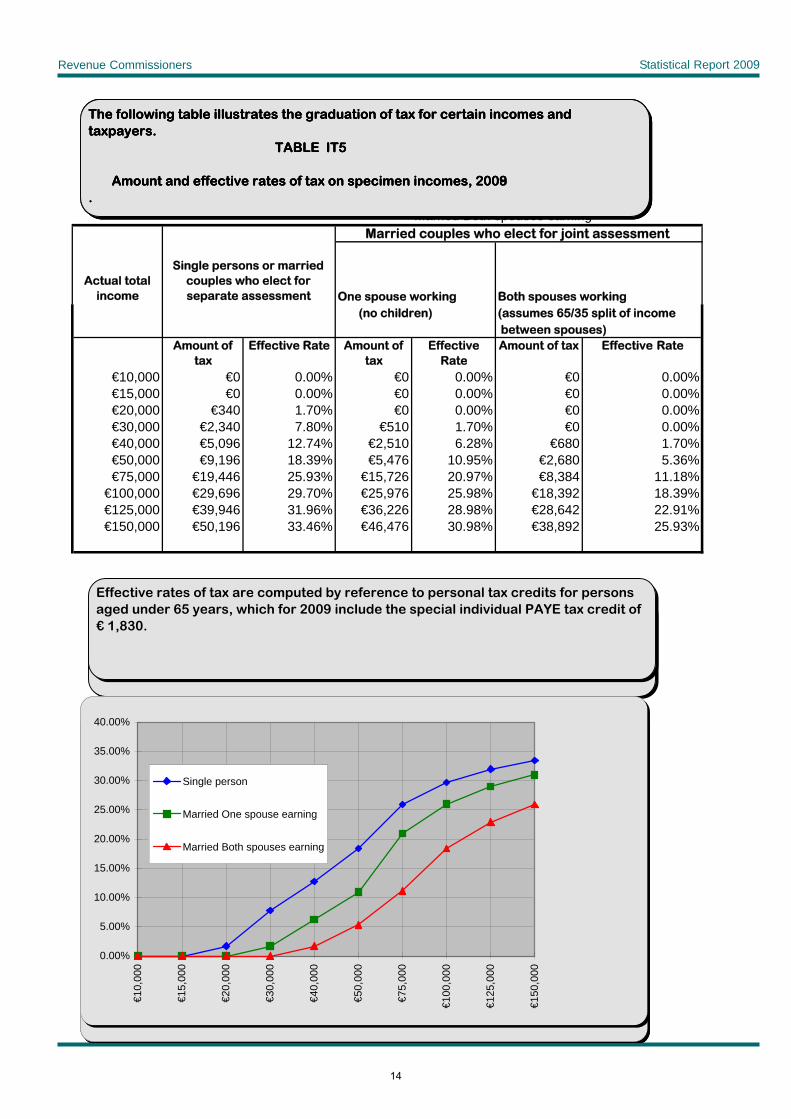
Revenue Commissioners Statistical Report 2009
Single person
Married One spouse earning
Married Both spouses earningMarried couples who elect for joint assessment
Actual total income
Single persons or married couples who elect for separate assessment One spouse working Both spouses working
(no children) (assumes 65/35 split of income between spouses)
Amount of tax
Effective Rate Amount of tax
Effective Rate
Amount of tax Effective Rate
€10,000 €0 0.00% €0 0.00% €0 0.00%€15,000 €0 0.00% €0 0.00% €0 0.00%€20,000 €340 1.70% €0 0.00% €0 0.00%€30,000 €2,340 7.80% €510 1.70% €0 0.00%€40,000 €5,096 12.74% €2,510 6.28% €680 1.70%€50,000 €9,196 18.39% €5,476 10.95% €2,680 5.36%€75,000 €19,446 25.93% €15,726 20.97% €8,384 11.18%
€100,000 €29,696 29.70% €25,976 25.98% €18,392 18.39%€125,000 €39,946 31.96% €36,226 28.98% €28,642 22.91%€150,000 €50,196 33.46% €46,476 30.98% €38,892 25.93%
The following table illustrates the graduation of tax for certain incomes and taxpayers. TABLE IT5
Amount and effective rates of tax on specimen incomes, 2008.
Effective rates of tax are computed by reference to personal tax credits for persons aged under 65 years, which for 2009 include the special individual PAYE tax credit of € 1,830.
0.00%
20.00%
40.00%
60.00%
80.00%
100.00%
120.00%
€1
#REF!#REF!#REF!
The following table illustrates the graduation of tax for certain incomes and taxpayers. TABLE IT5
Amount and effective rates of tax on specimen incomes, 2009.
0.00%
20.00%
40.00%
60.00%
80.00%
100.00%
120.00%
€1
#REF!#REF!#REF!
The following table illustrates the graduation of tax for certain incomes and taxpayers. TABLE IT5
Amount and effective rates of tax on specimen incomes, 2009
Effective rates of tax are computed by reference to personal tax credits for persons aged under 65 years, which for 2009 include the special individual PAYE tax credit of € 1,830.
0.00%
5.00%
10.00%
15.00%
20.00%
25.00%
30.00%
35.00%
40.00%
€10,
000
€15,
000
€20,
000
€30,
000
€40,
000
€50,
000
€75,
000
€100
,000
€125
,000
€150
,000
Single person
Married One spouse earning
Married Both spouses earning
14
Revenue Commissioners Statistical Report 2009
COST OF TAX CREDITS, ALLOWANCES AND RELIEFS 2007 AND 2008 The following table IT 6 shows the estimated cost in terms of revenue forgone of the personal tax credits and the main reliefs and deductions allowable under the income tax system. A number of reliefs which apply both to individuals and companies is also included and the cost shown in relation to these reliefs covers income tax and corporation tax. An adjustment is included in the cost figures applying to income tax to compensate for incomplete numbers of tax returns on record at the time of compiling the estimates. The tax credits and reliefs listed in the table serve varying purposes. Many are essentially structural reliefs through which individual tax liabilities are adjusted to reflect relative taxable capacity. The main personal tax credits are a good example of this since they may be regarded as part of the progressive income tax structure representing a band of income chargeable at a zero rate. Others, such as relief for interest paid in full or investment in corporate trades, are tax-based incentives in favour of specific groups or activities which are designed to promote certain aspects of public policy. In computing taxable profits, account needs to be taken in some way of the depreciation of capital assets incurred in earning those profits. To this extent, the figures in the table of the "costs" of capital allowances should not be regarded as measuring a "loss of tax revenue" on profits. To compute such "loss", regard would have to be had to the excess of the amount of the capital allowances at current rates over the amount of the normal allowances. The figures shown for the basic personal tax credits (married, single and widowed) are the costs of these tax credits as if all other tax credits and the exemption limits did not apply. They do not include individuals who are not on Revenue records because their incomes are below the income tax thresholds. The cost figures for the exemption limits are based on the excess of the exemption limits over the basic personal tax credits. The figures of cost are for 2008 and 2007 and all figures are based on tax due in respect of assessments for each year and not on tax receipts within that year. The figure against each credit or allowance represents the additional tax which would become payable if the tax credit or allowance were withdrawn assuming no consequent change in the behaviour of taxpayers (for example, in relation to the reliefs for savings), or the amounts of payments (for example, interest payable on certain savings schemes might need adjustment to take account of the new tax liability). The numbers of claimants of each credit or relief are shown for both years to the extent that they are available. The numbers included are the taxpayers who would be adversely affected by the withdrawal of the respective credit or relief. In the calculations, each tax credit or allowance has been dealt with separately and on the assumption that the rest of the tax system remained unchanged. It would be therefore inaccurate to calculate the effect of withdrawing all the credits, reliefs and allowances by simply totaling the figures. For example, the costs shown for capital allowances and stock relief are also calculated on the basis of separate withdrawal of these reliefs. Their combined cost would be greater than the sum of the separate costs because allowances are not always fully set off against available profits. For instance, a person with €1,000 gross trading profits, €1,000 capital allowances and €1,000 stock relief would pay no tax if either of the reliefs were withdrawn but would pay tax on €1,000 profits if both reliefs were withdrawn. In this case, the cost of each relief separately is nil but the combined cost is tax on €1,000. Basic data is not available to enable an estimate of the combined cost of these reliefs to be made.
15
Revenue Commissioners Statistical Report 2009
The figures for estimates based on tax returns have been grossed up to an overall expected level to adjust for incompleteness in the numbers of returns on record at the time the data was extracted for analytical purposes. Apart from the artists exemption, these figures do not take account of the application of the restriction of reliefs originally provided for in section 17 of Finance Act 2006, which took effect from 1 January 2007.The restriction was extended by Section 23 Finance Act 2010. Finally, the estimates shown in many cases are tentative and are subject to revision in the light of later information. .
16
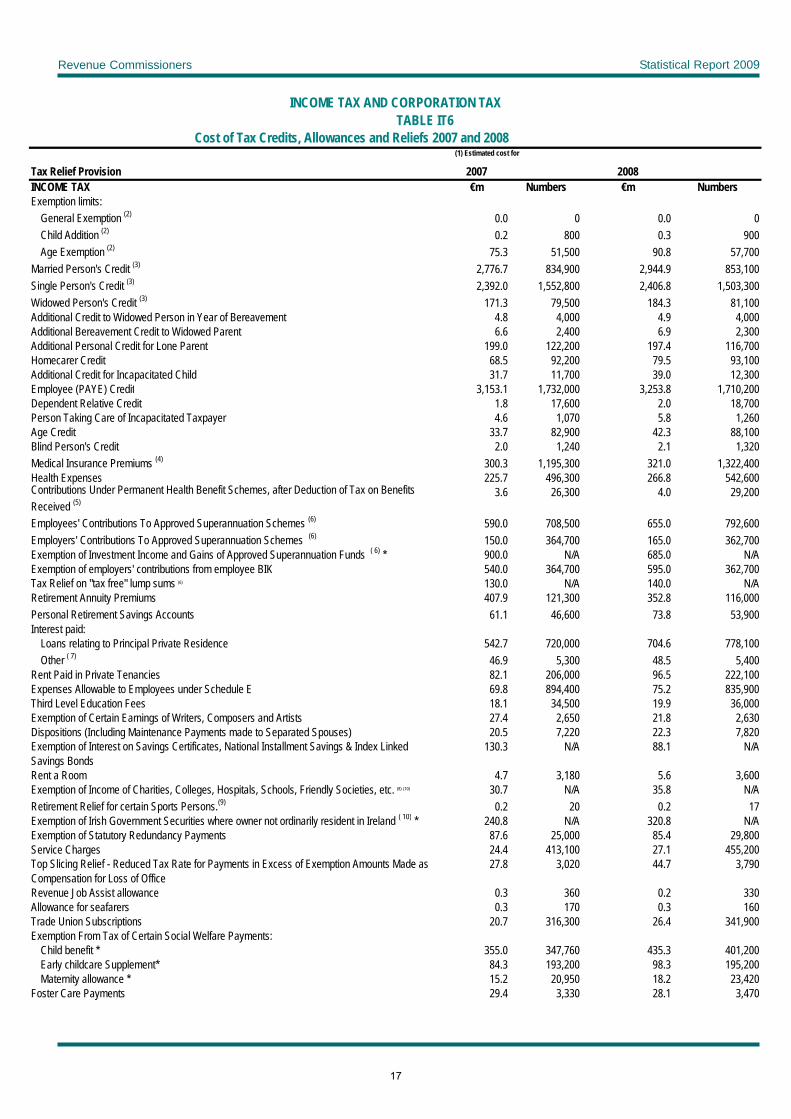
Revenue Commissioners Statistical Report 2009
INCOME TAX AND CORPORATION TAXTABLE IT6
Cost of Tax Credits, Allowances and Reliefs 2007 and 2008 (1) Estimated cost for
Tax Relief Provision 2007 2008INCOME TAX €m Numbers €m NumbersExemption limits:
General Exemption (2) 0.0 0 0.0 0Child Addition (2) 0.2 800 0.3 900Age Exemption (2) 75.3 51,500 90.8 57,700
Married Person's Credit (3) 2,776.7 834,900 2,944.9 853,100Single Person's Credit (3) 2,392.0 1,552,800 2,406.8 1,503,300Widowed Person's Credit (3) 171.3 79,500 184.3 81,100Additional Credit to Widowed Person in Year of Bereavement 4.8 4,000 4.9 4,000Additional Bereavement Credit to Widowed Parent 6.6 2,400 6.9 2,300Additional Personal Credit for Lone Parent 199.0 122,200 197.4 116,700Homecarer Credit 68.5 92,200 79.5 93,100Additional Credit for Incapacitated Child 31.7 11,700 39.0 12,300Employee (PAYE) Credit 3,153.1 1,732,000 3,253.8 1,710,200Dependent Relative Credit 1.8 17,600 2.0 18,700Person Taking Care of Incapacitated Taxpayer 4.6 1,070 5.8 1,260Age Credit 33.7 82,900 42.3 88,100Blind Person's Credit 2.0 1,240 2.1 1,320Medical Insurance Premiums (4) 300.3 1,195,300 321.0 1,322,400Health Expenses 225.7 496,300 266.8 542,600Contributions Under Permanent Health Benefit Schemes, after Deduction of Tax on Benefits Received (5)
3.6 26,300 4.0 29,200
Employees' Contributions To Approved Superannuation Schemes (6) 590.0 708,500 655.0 792,600Employers' Contributions To Approved Superannuation Schemes (6) 150.0 364,700 165.0 362,700Exemption of Investment Income and Gains of Approved Superannuation Funds ( 6) * 900.0 N/A 685.0 N/AExemption of employers' contributions from employee BIK 540.0 364,700 595.0 362,700Tax Relief on "tax free" lump sums (6) 130.0 N/A 140.0 N/ARetirement Annuity Premiums 407.9 121,300 352.8 116,000Personal Retirement Savings Accounts 61.1 46,600 73.8 53,900Interest paid:
Loans relating to Principal Private Residence 542.7 720,000 704.6 778,100Other ( 7) 46.9 5,300 48.5 5,400
Rent Paid in Private Tenancies 82.1 206,000 96.5 222,100Expenses Allowable to Employees under Schedule E 69.8 894,400 75.2 835,900Third Level Education Fees 18.1 34,500 19.9 36,000Exemption of Certain Earnings of Writers, Composers and Artists 27.4 2,650 21.8 2,630Dispositions (Including Maintenance Payments made to Separated Spouses) 20.5 7,220 22.3 7,820Exemption of Interest on Savings Certificates, National Installment Savings & Index Linked Savings Bonds
130.3 N/A 88.1 N/A
Rent a Room 4.7 3,180 5.6 3,600Exemption of Income of Charities, Colleges, Hospitals, Schools, Friendly Societies, etc. (8) (10) 30.7 N/A 35.8 N/ARetirement Relief for certain Sports Persons.(9) 0.2 20 0.2 17Exemption of Irish Government Securities where owner not ordinarily resident in Ireland ( 10) * 240.8 N/A 320.8 N/AExemption of Statutory Redundancy Payments 87.6 25,000 85.4 29,800Service Charges 24.4 413,100 27.1 455,200Top Slicing Relief - Reduced Tax Rate for Payments in Excess of Exemption Amounts Made as Compensation for Loss of Office
27.8 3,020 44.7 3,790
Revenue Job Assist allowance 0.3 360 0.2 330Allowance for seafarers 0.3 170 0.3 160Trade Union Subscriptions 20.7 316,300 26.4 341,900Exemption From Tax of Certain Social Welfare Payments:
Child benefit * 355.0 347,760 435.3 401,200Early childcare Supplement* 84.3 193,200 98.3 195,200Maternity allowance * 15.2 20,950 18.2 23,420
Foster Care Payments 29.4 3,330 28.1 3,470
17
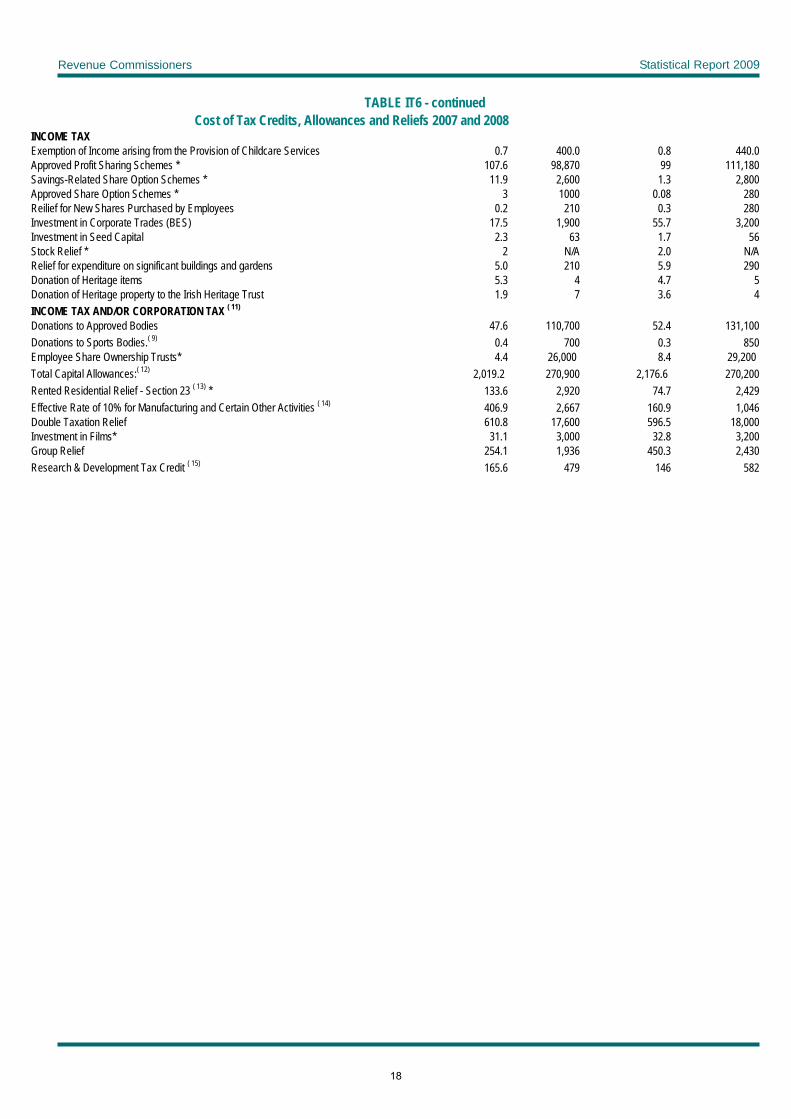
Revenue Commissioners Statistical Report 2009
TABLE IT6 - continuedCost of Tax Credits, Allowances and Reliefs 2007 and 2008
INCOME TAX Exemption of Income arising from the Provision of Childcare Services 0.7 400.0 0.8 440.0Approved Profit Sharing Schemes * 107.6 98,870 99 111,180Savings-Related Share Option Schemes * 11.9 2,600 1.3 2,800Approved Share Option Schemes * 3 1000 0.08 280Reilief for New Shares Purchased by Employees 0.2 210 0.3 280Investment in Corporate Trades (BES) 17.5 1,900 55.7 3,200Investment in Seed Capital 2.3 63 1.7 56Stock Relief * 2 N/A 2.0 N/ARelief for expenditure on significant buildings and gardens 5.0 210 5.9 290Donation of Heritage items 5.3 4 4.7 5Donation of Heritage property to the Irish Heritage Trust 1.9 7 3.6 4INCOME TAX AND/OR CORPORATION TAX ( 11)
Donations to Approved Bodies 47.6 110,700 52.4 131,100Donations to Sports Bodies.( 9) 0.4 700 0.3 850Employee Share Ownership Trusts* 4.4 26,000 8.4 29,200 Total Capital Allowances:( 12) 2,019.2 270,900 2,176.6 270,200Rented Residential Relief - Section 23 ( 13) * 133.6 2,920 74.7 2,429Effective Rate of 10% for Manufacturing and Certain Other Activities ( 14) 406.9 2,667 160.9 1,046Double Taxation Relief 610.8 17,600 596.5 18,000Investment in Films* 31.1 3,000 32.8 3,200Group Relief 254.1 1,936 450.3 2,430Research & Development Tax Credit ( 15) 165.6 479 146 582
18
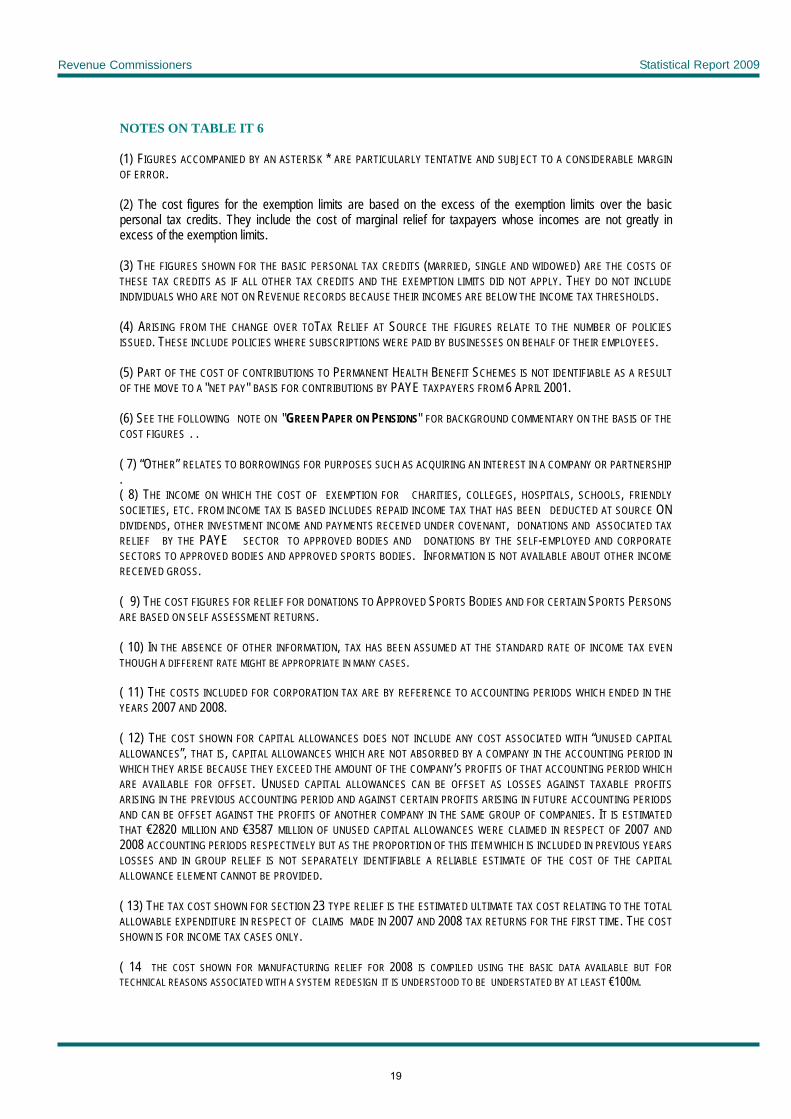
Revenue Commissioners Statistical Report 2009 NOTES ON TABLE IT 6 (1) FIGURES ACCOMPANIED BY AN ASTERISK * ARE PARTICULARLY TENTATIVE AND SUBJECT TO A CONSIDERABLE MARGIN OF ERROR. (2) The cost figures for the exemption limits are based on the excess of the exemption limits over the basic personal tax credits. They include the cost of marginal relief for taxpayers whose incomes are not greatly in excess of the exemption limits. (3) THE FIGURES SHOWN FOR THE BASIC PERSONAL TAX CREDITS (MARRIED, SINGLE AND WIDOWED) ARE THE COSTS OF THESE TAX CREDITS AS IF ALL OTHER TAX CREDITS AND THE EXEMPTION LIMITS DID NOT APPLY. THEY DO NOT INCLUDE INDIVIDUALS WHO ARE NOT ON REVENUE RECORDS BECAUSE THEIR INCOMES ARE BELOW THE INCOME TAX THRESHOLDS. (4) ARISING FROM THE CHANGE OVER TOTAX RELIEF AT SOURCE THE FIGURES RELATE TO THE NUMBER OF POLICIES ISSUED. THESE INCLUDE POLICIES WHERE SUBSCRIPTIONS WERE PAID BY BUSINESSES ON BEHALF OF THEIR EMPLOYEES. (5) PART OF THE COST OF CONTRIBUTIONS TO PERMANENT HEALTH BENEFIT SCHEMES IS NOT IDENTIFIABLE AS A RESULT OF THE MOVE TO A "NET PAY" BASIS FOR CONTRIBUTIONS BY PAYE TAXPAYERS FROM 6 APRIL 2001. (6) SEE THE FOLLOWING NOTE ON "GREEN PAPER ON PENSIONS" FOR BACKGROUND COMMENTARY ON THE BASIS OF THE COST FIGURES . . ( 7) “OTHER” RELATES TO BORROWINGS FOR PURPOSES SUCH AS ACQUIRING AN INTEREST IN A COMPANY OR PARTNERSHIP . ( 8) THE INCOME ON WHICH THE COST OF EXEMPTION FOR CHARITIES, COLLEGES, HOSPITALS, SCHOOLS, FRIENDLY SOCIETIES, ETC. FROM INCOME TAX IS BASED INCLUDES REPAID INCOME TAX THAT HAS BEEN DEDUCTED AT SOURCE ON DIVIDENDS, OTHER INVESTMENT INCOME AND PAYMENTS RECEIVED UNDER COVENANT, DONATIONS AND ASSOCIATED TAX RELIEF BY THE PAYE SECTOR TO APPROVED BODIES AND DONATIONS BY THE SELF-EMPLOYED AND CORPORATE SECTORS TO APPROVED BODIES AND APPROVED SPORTS BODIES. INFORMATION IS NOT AVAILABLE ABOUT OTHER INCOME RECEIVED GROSS. ( 9) THE COST FIGURES FOR RELIEF FOR DONATIONS TO APPROVED SPORTS BODIES AND FOR CERTAIN SPORTS PERSONS ARE BASED ON SELF ASSESSMENT RETURNS. ( 10) IN THE ABSENCE OF OTHER INFORMATION, TAX HAS BEEN ASSUMED AT THE STANDARD RATE OF INCOME TAX EVEN THOUGH A DIFFERENT RATE MIGHT BE APPROPRIATE IN MANY CASES. ( 11) THE COSTS INCLUDED FOR CORPORATION TAX ARE BY REFERENCE TO ACCOUNTING PERIODS WHICH ENDED IN THE YEARS 2007 AND 2008. ( 12) THE COST SHOWN FOR CAPITAL ALLOWANCES DOES NOT INCLUDE ANY COST ASSOCIATED WITH “UNUSED CAPITAL ALLOWANCES”, THAT IS, CAPITAL ALLOWANCES WHICH ARE NOT ABSORBED BY A COMPANY IN THE ACCOUNTING PERIOD IN WHICH THEY ARISE BECAUSE THEY EXCEED THE AMOUNT OF THE COMPANY’S PROFITS OF THAT ACCOUNTING PERIOD WHICH ARE AVAILABLE FOR OFFSET. UNUSED CAPITAL ALLOWANCES CAN BE OFFSET AS LOSSES AGAINST TAXABLE PROFITS ARISING IN THE PREVIOUS ACCOUNTING PERIOD AND AGAINST CERTAIN PROFITS ARISING IN FUTURE ACCOUNTING PERIODS AND CAN BE OFFSET AGAINST THE PROFITS OF ANOTHER COMPANY IN THE SAME GROUP OF COMPANIES. IT IS ESTIMATED THAT €2820 MILLION AND €3587 MILLION OF UNUSED CAPITAL ALLOWANCES WERE CLAIMED IN RESPECT OF 2007 AND 2008 ACCOUNTING PERIODS RESPECTIVELY BUT AS THE PROPORTION OF THIS ITEM WHICH IS INCLUDED IN PREVIOUS YEARS LOSSES AND IN GROUP RELIEF IS NOT SEPARATELY IDENTIFIABLE A RELIABLE ESTIMATE OF THE COST OF THE CAPITAL ALLOWANCE ELEMENT CANNOT BE PROVIDED. ( 13) THE TAX COST SHOWN FOR SECTION 23 TYPE RELIEF IS THE ESTIMATED ULTIMATE TAX COST RELATING TO THE TOTAL ALLOWABLE EXPENDITURE IN RESPECT OF CLAIMS MADE IN 2007 AND 2008 TAX RETURNS FOR THE FIRST TIME. THE COST SHOWN IS FOR INCOME TAX CASES ONLY. ( 14 THE COST SHOWN FOR MANUFACTURING RELIEF FOR 2008 IS COMPILED USING THE BASIC DATA AVAILABLE BUT FOR TECHNICAL REASONS ASSOCIATED WITH A SYSTEM REDESIGN IT IS UNDERSTOOD TO BE UNDERSTATED BY AT LEAST €100M.
19
Revenue Commissioners Statistical Report 2009 ( 15) THE COSTS SHOWN FOR R&D IS FOR CLAIMS FOR R&D ON CORPORATION TAX RETURNS FOR ACCOUNTING PERIODS ENDING IN 2007 AND 2008. HOWEVER, THE COST INCLUDES THE COST ASSOCIATED WITH CLAIMS WHERE THE COMPANY WAS ENTITLED TO THE CREDIT BUT WAS UNABLE TO ABSORB IT IN THAT ACCOUNTING YEAR. Green Paper on Pensions – review of estimates of cost AS PART OF THE WORK ON THE GREEN PAPER ON PENSIONS, A REVIEW WAS CARRIED OUT OF THE CURRENT REGIME OF INCENTIVES FOR SUPPLEMENTARY PENSION PROVISION WITH A VIEW TO DEVELOPING MORE COMPREHENSIVE AND RELIABLE ESTIMATES OF THE COST OF RELIEFS IN THIS AREA. THE REVIEW EXAMINED, AMONG OTHER THINGS, THE CURRENT RELIEFS AND INCENTIVES FOR INVESTMENT IN SUPPLEMENTARY PENSIONS AND THE DATA AVAILABLE ON WHICH TO BASE RELIABLE ESTIMATES OF THE COSTS IN REVENUE FOREGONE TO THE EXCHEQUER. THE REVIEW DREW ON NEWLY AVAILABLE 2006 AGGREGATE DATA ON CONTRIBUTIONS TO PENSION SCHEMES BY EMPLOYERS AND EMPLOYEES ARISING FROM A P35 INITIATIVE INTRODUCED ON FOOT OF PROVISIONS THAT WERE INCLUDED IN FINANCE ACT 2004 WITH A VIEW TO IMPROVING DATA QUALITY. ESTIMATES OF THE COST OF TAX FOR PRIVATE PENSION PROVISION UPDATED FOR 2007 AND 2008 ARE INCLUDED IN TABLE IT6. THE BREAKDOWN AND MAKE-UP OF THESE ESTIMATED COSTS OF RELIEFS DIFFER FROM PRESENTATIONS OF COSTS IN THIS AREA FOR YEARS PRIOR TO 2005 IN A NUMBER OF RESPECTS AND ARE NOT DIRECTLY COMPARABLE FURTHER DETAILS ON THE COST OF TAX AND OTHER RELIEFS AND THE CHANGES IN THE METHODOLOGY ARE CONTAINED IN PAGES 106 AND 107 OF THE GREEN PAPER ON PENSIONS WHICH IS AVAILABLE AT WWW.PENSIONSGREENPAPER.IE.
20
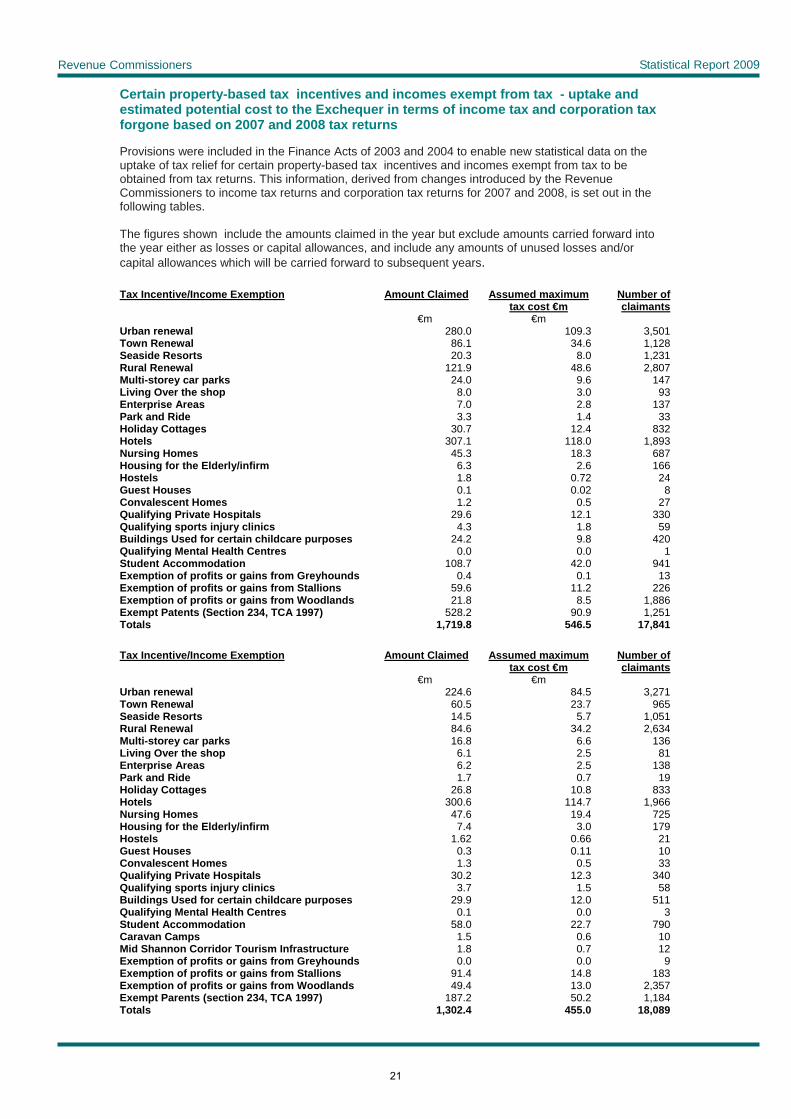
Revenue Commissioners Statistical Report 2009 Certain property-based tax incentives and incomes exempt from tax - uptake and estimated potential cost to the Exchequer in terms of income tax and corporation tax forgone based on 2007 and 2008 tax returns Provisions were included in the Finance Acts of 2003 and 2004 to enable new statistical data on the uptake of tax relief for certain property-based tax incentives and incomes exempt from tax to be obtained from tax returns. This information, derived from changes introduced by the Revenue Commissioners to income tax returns and corporation tax returns for 2007 and 2008, is set out in the following tables. The figures shown include the amounts claimed in the year but exclude amounts carried forward into the year either as losses or capital allowances, and include any amounts of unused losses and/or capital allowances which will be carried forward to subsequent years. Tax Incentive/Income Exemption Amount Claimed Assumed maximum
tax cost €mNumber of claimants
€m €m Urban renewal 280.0 109.3 3,501 Town Renewal 86.1 34.6 1,128 Seaside Resorts 20.3 8.0 1,231 Rural Renewal 121.9 48.6 2,807 Multi-storey car parks 24.0 9.6 147 Living Over the shop 8.0 3.0 93 Enterprise Areas 7.0 2.8 137 Park and Ride 3.3 1.4 33 Holiday Cottages 30.7 12.4 832 Hotels 307.1 118.0 1,893 Nursing Homes 45.3 18.3 687 Housing for the Elderly/infirm 6.3 2.6 166 Hostels 1.8 0.72 24 Guest Houses 0.1 0.02 8 Convalescent Homes 1.2 0.5 27 Qualifying Private Hospitals 29.6 12.1 330 Qualifying sports injury clinics 4.3 1.8 59 Buildings Used for certain childcare purposes 24.2 9.8 420 Qualifying Mental Health Centres 0.0 0.0 1 Student Accommodation 108.7 42.0 941 Exemption of profits or gains from Greyhounds 0.4 0.1 13 Exemption of profits or gains from Stallions 59.6 11.2 226 Exemption of profits or gains from Woodlands 21.8 8.5 1,886 Exempt Patents (Section 234, TCA 1997) 528.2 90.9 1,251 Totals 1,719.8 546.5 17,841 Tax Incentive/Income Exemption Amount Claimed Assumed maximum
tax cost €mNumber of claimants
€m €m Urban renewal 224.6 84.5 3,271 Town Renewal 60.5 23.7 965 Seaside Resorts 14.5 5.7 1,051 Rural Renewal 84.6 34.2 2,634 Multi-storey car parks 16.8 6.6 136 Living Over the shop 6.1 2.5 81 Enterprise Areas 6.2 2.5 138 Park and Ride 1.7 0.7 19 Holiday Cottages 26.8 10.8 833 Hotels 300.6 114.7 1,966 Nursing Homes 47.6 19.4 725 Housing for the Elderly/infirm 7.4 3.0 179 Hostels 1.62 0.66 21 Guest Houses 0.3 0.11 10 Convalescent Homes 1.3 0.5 33 Qualifying Private Hospitals 30.2 12.3 340 Qualifying sports injury clinics 3.7 1.5 58 Buildings Used for certain childcare purposes 29.9 12.0 511 Qualifying Mental Health Centres 0.1 0.0 3 Student Accommodation 58.0 22.7 790 Caravan Camps 1.5 0.6 10 Mid Shannon Corridor Tourism Infrastructure 1.8 0.7 12 Exemption of profits or gains from Greyhounds 0.0 0.0 9 Exemption of profits or gains from Stallions 91.4 14.8 183 Exemption of profits or gains from Woodlands 49.4 13.0 2,357 Exempt Parents (section 234, TCA 1997) 187.2 50.2 1,184 Totals 1,302.4 455.0 18,089
21
Revenue Commissioners Statistical Report 2009 These figures do not take account of the application of the restriction of reliefs originally provided for in section 17 of Finance Act 2006 and which took effect from 1 January 2007.The restriction was extended by Section 23 Finance Act 2010. Notes:
• The figures shown relate to the various reliefs/incentives and exemptions as specified in the 2007 and 2008 form 11 and CT1.
• There were concerns that in some instances the new, separately categorised data on property incentives may not have been correctly entered on the Tax returns. Revenue drew the attention of the relevant tax practitioner bodies to these deficiencies to rectify them in future returns and also increased awareness among its own staff involved in processing tax returns of the need to ensure, through closer examination of the returns, that they are correctly completed.
• The estimated costs have assumed tax foregone at the 41% rate in the case of income tax and 12.5% in the case of corporation tax. This means the figures shown correspond to the maximum Exchequer cost in terms of income tax and corporation tax. However, the actual Exchequer cost could be lower, particularly in relation to the exempt income items, as the income could be subject to deductions for allowable expenses and other costs thereby reducing the level of income that would be actually subject to tax.
• Some of the costs shown above are included in the costs shown for capital allowances and section 23 relief in Table IT6. For example, exempt income included above is not part of capital allowances.
RELIEFS IN RESPECT OF WHICH COSTS ARE NOT CURRENTLY QUANTIFIABLE OR ARE NEGLIGIBLE OR ARE NOT IDENTIFIABLE WITHIN TOTAL AGGREGATES. Relief from averaging of farm profits; Exemption for income arising from payments in respect of personal injuries; Exemption of certain payments made by Hemophilia HIV Trust; Exemption of lump sum retirement payments; Relief for allowable motor expenses; Tapering relief allowable for taxation of car benefits in kind; Reduced tax rate for authorised unit trust schemes; Reduced tax rate for special investment schemes; Exemption of certain grants made by Údarás na Gaeltachta; Relief for investment income reserved for policy holders in life assurance companies; Relief for various business related expenses such as staff recruitment, rent, legal fees, and other general expenses; Exemption in certain circumstances on the interest on quoted bearer Eurobonds; Exemption of payments made as compensation for loss of office; Exemption of scholarship income Exemption for income received under Sceim na bhFoghlaimeoiri Gaeilge.
22

Revenue Commissioners Statistical Report 2009
Income Distribution Statistics Table IDS1 Income Tax 2007 and 2008.Distribution of - (i) number of incomes (ii) gross income charged and (iii) tax, by
range of gross income Table IDS2 Income Tax 2007 and 2008. Distribution of - (i) number of incomes (ii) gross income charged and (iii) tax, by
range of gross income of Self-Employed including Proprietary Directors Table IDS3 Income Tax 2007 and 2008. Distribution of - (i) number of incomes (ii) gross income charged and (iii) tax, by
range of gross income for mainly earned incomes assessed under Schedule D Table IDS4 Income Tax 2007 and 2008. Distribution of - (i) number of incomes (ii) gross income charged and (iii) tax, by
range of gross income for mainly unearned incomes assessed under Schedule D Table IDS5 Income Tax 2007 and 2008. Distribution of - (i) number of incomes (ii) gross income charged and (iii) tax, by
range of gross income for mainly PAYE incomes assessed under Schedule E Table IDS6 Income Tax 2007 and 2008. Distribution of - (i) number of incomes (ii) gross income charged and (iii) tax, by
range of gross income for mainly PAYE incomes assessed under Schedule E (excluding Proprietary Directors on the Schedule E record)
Table IDS7 Income Tax 2007 and 2008. Distribution of - (i) number of incomes (ii) gross income charged and (iii) tax, by
range of gross income of Proprietary Directors Table IDS8 Income Tax 2007 and 2008. Distribution of - (i) number of incomes (ii) “total” income charged and (iii) tax, by
range of “total” income Table IDS9 Income Tax 2007 and 2008. Distribution of - (i) number of incomes (ii) “total” income charged and (iii) tax, by
range of “total” income of Self-Employed including Proprietary Directors Table IDS10 Income Tax 2007 and 2008. Distribution of - (i) number of incomes (ii) “total” income charged and (iii) tax, by
range of “total” income for mainly earned incomes assessed under Schedule D Table IDS11 Income Tax 2007 and 2008. Distribution of - (i) number of incomes (ii) “total” income charged and (iii) tax, by
range of “total” income for mainly unearned incomes assessed under Schedule D Table IDS12 Income Tax 2007 and 2008. Distribution of - (i) number of incomes (ii) “total” income charged and (iii) tax, by
range of “total” income for mainly PAYE incomes assessed under Schedule E Table IDS13 Income Tax 2007 and 2008. Distribution of - (i) number of incomes (ii) “total” income charged and (iii) tax, by
range of “total” income for mainly PAYE incomes assessed under Schedule E (excluding Proprietary Directors on the Schedule E record).
Table IDS14 Income Tax 2007 and 2008. Distribution of - (i) number of incomes (ii) “total” income charged and (iii) tax, by
range of “total” income of Proprietary Directors Table IDS15 Income Tax 2007 and 2008. Interest paid on home loans - relief allowed at the standard rate (in terms of tax
reductions) by range of total income Table IDS16 Income Tax 2007 and 2008. Distribution of - (i) number of taxable incomes (ii) total taxable income and (iii) tax,
by range of taxable income Table IDS17 Income Tax 2007 and 2008. Distribution of - (i) number of income earners (ii) total taxable income and (iii) tax,
by tax band Table IDS18 Income Tax computation for 2007 and 2008
1
Revenue Commissioners Statistical Report 2009
Income Distribution Statistics The information on personal incomes which is given in Tables IDS1 to 18, has been collected in the course of the administration of income tax for the income tax years 2007 and 2008. The tables relate to income assessed in respect of the tax years 2007 and 2008 by reference to tax returns which were processed up to June 2009 and June 2010 respectively. The income taken for the purposes of the tables is in general that of the years 2007 and 2008. The information relating to employees from whose income tax was deducted under Pay As You Earn is based on completed end-of-year returns from employers of which up to 96% were processed at the relevant time. Tables IDS 7 and 14 contain estimated income distributions of proprietary directors of incorporated family businesses, estimated by reference to the level of end-of-year returns received for 2007 and 2008 up to June 2009 and 2010 respectively. The information relating to Schedule D assessments is based on assessed Self-Assessment Returns for 2007 and 2008 representing some 85.8% and 84.0% respectively of the expected total. Proprietary directors, while formally taxed under the PAYE system, are akin to the self-employed and should be taken into account when analysing the income distribution of the self-employed sector generally. This approach is reflected in the compilation of tables IDS 2 and 9. The timeliness of the historical data on incomes and tax included in the tables is directly influenced by the need to have a minimum as close as possible to 90% of tax returns represented in the figures. Because of the return filing date for Self-Assessment returns from Schedule D taxpayers, the most recent years for which relatively complete and comparable data can be provided in this report for both Schedule D and PAYE income distribution is 2007 and 2008. Income related to part only of a year, where there has been a change of employment during the year, is not grossed up to the corresponding annual amount. Following the introduction of standard rating of the main personal and PAYE allowances from 6 April, 1999 and the subsequent conversion of the various standard rated allowances into formal tax credits from 6th April 2001 the numbers of income earners with taxable income is higher than the numbers who are effectively liable to tax. This arises because tax relief is now given by way of a reduction of tax chargeable and not as a deduction from income as was previously the position. The information in the tables for the income tax year 2007 covers over 1,380,600 earners who were effectively liable to income tax for 2007 (see Table IDS17), as compared with a total of over 2,310,700 with taxable income (Table IDS16) and over 2,365,400 included in Table IDS1. The information in the tables for the income tax year 2008 covers just over 1,352,300 earners who were effectively liable to income tax for 2008 (see Table IDS17), as compared with a total of over 2,288,600 with taxable income (Table IDS16) and over 2,333,200 included in Table IDS1. The difference between the figures in Tables IDS1 and IDS16 is accounted for by earners who were found to be not liable to tax because of the operation of exemption limits or personal tax credits and deductions allowable at rates other than the standard rate. A married couple who has elected or who has been deemed to have elected for joint assessment is counted as one tax unit and their incomes are aggregated in the statistics. The following are the definitions adopted for use in connection with the compilation of the statistics set out in the tables. Gross Income is the income brought under the review of the department before adjustments are made in respect of capital allowances, interest paid, losses, allowable expenses, retirement annuities etc. but after deduction of superannuation contributions by employees. It includes certain income belonging to individuals whose total income is below the exemption limits. It does not include certain other income which is not income for tax purposes or is exempt from tax such as profits or gains from stallion fees (pre-August 2008), profits from commercial forestry and certain income from patent royalties, certain investment income arising from personal injuries, child benefit, maternity benefit and unemployment assistance paid by the Department of Social, Community and Family Affairs, certain earnings of writers, composers and artists, bonus or interest paid under Instalment Savings Schemes operated by An Post, interest on certain Government securities, certain foreign pensions which are exempt from tax in the foreign paying country, portion of certain lump sums received by employees on cessation of their employment, statutory redundancy payments and certain military pensions. Other income sources which are either not included or not fully included are employee contributions to pension funds (tax deductible), interest income that does not need to be declared or is not recorded (but from
2
Revenue Commissioners Statistical Report 2009
which tax has been deducted), unemployment benefit and disability benefit (non-recording of non-taxable amounts and of amounts taxed by restriction of repayments or indirectly through employers in the PAYE system), and the incomes of certain self-employed persons, including some farmers, as well as some individuals in receipt of pensions, who are not processed annually on tax records because their incomes are below the income tax thresholds. "Total" income is the total income of taxpayers from all sources as estimated in accordance with the provisions of the Income Tax Acts. It is net of such items as capital allowances, allowable interest which is not subject to relief at the standard rate, losses, allowable expenses, retirement annuities and superannuation contributions. For the purposes of the exemption limits, interest allowable for tax purposes is a deduction in computing total income. Declared interest income received by individuals and any income such as distributions (i.e. dividends plus tax credits) received is included. Benefits-in-kind are also included to the extent that they are chargeable to income tax Taxable Income is that part of income on which tax is actually calculated. It is thus the total income of taxpayers less personal reliefs and other deductions but prior to the application of tax credits and reliefs at the standard rate (which are given by way of a reduction of tax chargeable). Figures of deductions and allowances used in compiling the statistics are of amounts allowed and not of amounts claimed. For example, if a taxpayer has deductions and allowances totaling €6,500 and has income of €6,000, the statistics include an amount allowed of €6,000. Some other features of the tables are: - except in the case of Table IDS16 the information relates to all income earners on tax records, whether liable to tax or not;
in the case of Table IDS16 the information is confined solely to those with taxable income,
- declared exempt income is included in the figure for total income in arriving at the average effective rate of tax; - only the declared interest income of individuals, and the corresponding tax charge, is included; consequently, the bulk of
interest from which deposit interest retention tax was deducted is not included; - particulars of assessments raised during the year in respect of previous years are not included; - amounts of declared income arising under Schedule C are included with Schedule D income and cannot be separately
identified. - Tax Relief at Source (TRS) was introduced in 2001 for medical insurance and in 2002 for mortgage interest. Due to
certain technical difficulties an income related distribution of relief allowed in respect of medical insurance, as provided in previous reports, is not currently available. In the case of mortgage interest relief the figures in Table IDS 15 provide a distribution of the tax credits paid over by Revenue to the lending institutions under the TRS scheme, by reference to the income levels of mortgage holders identified on the main income tax record.
3
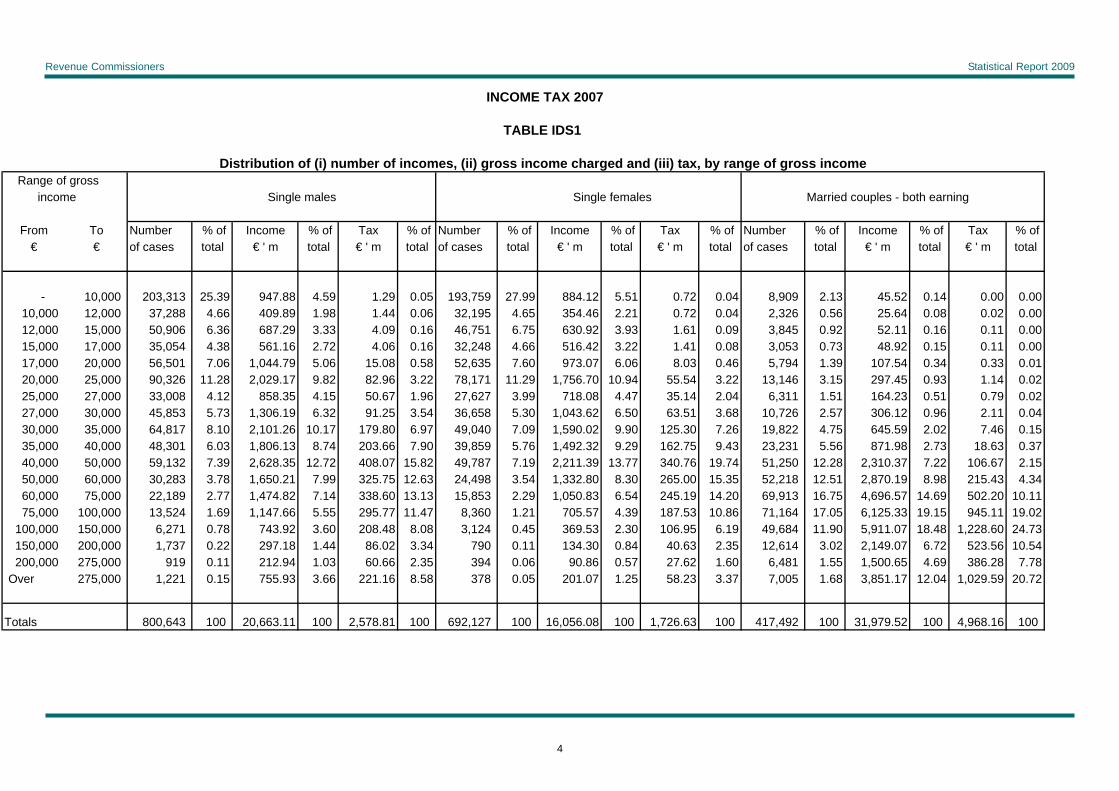
Revenue Commissioners Statistical Report 2009
INCOME TAX 2007
TABLE IDS1
Distribution of (i) number of incomes, (ii) gross income charged and (iii) tax, by range of gross income. Range of gross income Single males Single females Married couples - both earning
From To Number % of Income % of Tax % of Number % of Income % of Tax % of Number % of Income % of Tax % of€ € of cases total € ' m total € ' m total of cases total € ' m total € ' m total of cases total € ' m total € ' m total
- 10,000 203,313 25.39 947.88 4.59 1.29 0.05 193,759 27.99 884.12 5.51 0.72 0.04 8,909 2.13 45.52 0.14 0.00 0.0010,000 12,000 37,288 4.66 409.89 1.98 1.44 0.06 32,195 4.65 354.46 2.21 0.72 0.04 2,326 0.56 25.64 0.08 0.02 0.0012,000 15,000 50,906 6.36 687.29 3.33 4.09 0.16 46,751 6.75 630.92 3.93 1.61 0.09 3,845 0.92 52.11 0.16 0.11 0.0015,000 17,000 35,054 4.38 561.16 2.72 4.06 0.16 32,248 4.66 516.42 3.22 1.41 0.08 3,053 0.73 48.92 0.15 0.11 0.0017,000 20,000 56,501 7.06 1,044.79 5.06 15.08 0.58 52,635 7.60 973.07 6.06 8.03 0.46 5,794 1.39 107.54 0.34 0.33 0.0120,000 25,000 90,326 11.28 2,029.17 9.82 82.96 3.22 78,171 11.29 1,756.70 10.94 55.54 3.22 13,146 3.15 297.45 0.93 1.14 0.0225,000 27,000 33,008 4.12 858.35 4.15 50.67 1.96 27,627 3.99 718.08 4.47 35.14 2.04 6,311 1.51 164.23 0.51 0.79 0.0227,000 30,000 45,853 5.73 1,306.19 6.32 91.25 3.54 36,658 5.30 1,043.62 6.50 63.51 3.68 10,726 2.57 306.12 0.96 2.11 0.0430,000 35,000 64,817 8.10 2,101.26 10.17 179.80 6.97 49,040 7.09 1,590.02 9.90 125.30 7.26 19,822 4.75 645.59 2.02 7.46 0.1535,000 40,000 48,301 6.03 1,806.13 8.74 203.66 7.90 39,859 5.76 1,492.32 9.29 162.75 9.43 23,231 5.56 871.98 2.73 18.63 0.3740,000 50,000 59,132 7.39 2,628.35 12.72 408.07 15.82 49,787 7.19 2,211.39 13.77 340.76 19.74 51,250 12.28 2,310.37 7.22 106.67 2.1550,000 60,000 30,283 3.78 1,650.21 7.99 325.75 12.63 24,498 3.54 1,332.80 8.30 265.00 15.35 52,218 12.51 2,870.19 8.98 215.43 4.3460,000 75,000 22,189 2.77 1,474.82 7.14 338.60 13.13 15,853 2.29 1,050.83 6.54 245.19 14.20 69,913 16.75 4,696.57 14.69 502.20 10.1175,000 100,000 13,524 1.69 1,147.66 5.55 295.77 11.47 8,360 1.21 705.57 4.39 187.53 10.86 71,164 17.05 6,125.33 19.15 945.11 19.02
100,000 150,000 6,271 0.78 743.92 3.60 208.48 8.08 3,124 0.45 369.53 2.30 106.95 6.19 49,684 11.90 5,911.07 18.48 1,228.60 24.73150,000 200,000 1,737 0.22 297.18 1.44 86.02 3.34 790 0.11 134.30 0.84 40.63 2.35 12,614 3.02 2,149.07 6.72 523.56 10.54200,000 275,000 919 0.11 212.94 1.03 60.66 2.35 394 0.06 90.86 0.57 27.62 1.60 6,481 1.55 1,500.65 4.69 386.28 7.78
Over 275,000 1,221 0.15 755.93 3.66 221.16 8.58 378 0.05 201.07 1.25 58.23 3.37 7,005 1.68 3,851.17 12.04 1,029.59 20.72
Totals 800,643 100 20,663.11 100 2,578.81 100 692,127 100 16,056.08 100 1,726.63 100 417,492 100 31,979.52 100 4,968.16 100
4
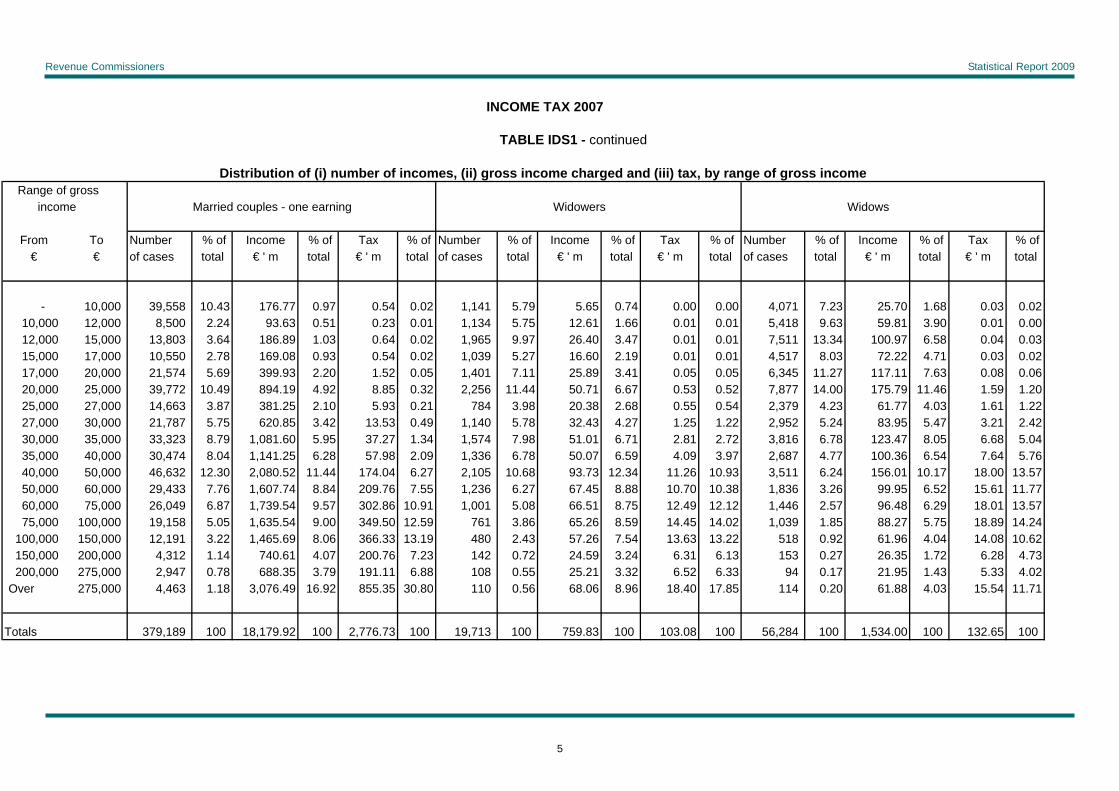
Revenue Commissioners Statistical Report 2009
INCOME TAX 2007
TABLE IDS1 - continued
Distribution of (i) number of incomes, (ii) gross income charged and (iii) tax, by range of gross income. Range of gross income Married couples - one earning Widowers Widows
From To Number % of Income % of Tax % of Number % of Income % of Tax % of Number % of Income % of Tax % of€ € of cases total € ' m total € ' m total of cases total € ' m total € ' m total of cases total € ' m total € ' m total
- 10,000 39,558 10.43 176.77 0.97 0.54 0.02 1,141 5.79 5.65 0.74 0.00 0.00 4,071 7.23 25.70 1.68 0.03 0.0210,000 12,000 8,500 2.24 93.63 0.51 0.23 0.01 1,134 5.75 12.61 1.66 0.01 0.01 5,418 9.63 59.81 3.90 0.01 0.0012,000 15,000 13,803 3.64 186.89 1.03 0.64 0.02 1,965 9.97 26.40 3.47 0.01 0.01 7,511 13.34 100.97 6.58 0.04 0.0315,000 17,000 10,550 2.78 169.08 0.93 0.54 0.02 1,039 5.27 16.60 2.19 0.01 0.01 4,517 8.03 72.22 4.71 0.03 0.0217,000 20,000 21,574 5.69 399.93 2.20 1.52 0.05 1,401 7.11 25.89 3.41 0.05 0.05 6,345 11.27 117.11 7.63 0.08 0.0620,000 25,000 39,772 10.49 894.19 4.92 8.85 0.32 2,256 11.44 50.71 6.67 0.53 0.52 7,877 14.00 175.79 11.46 1.59 1.2025,000 27,000 14,663 3.87 381.25 2.10 5.93 0.21 784 3.98 20.38 2.68 0.55 0.54 2,379 4.23 61.77 4.03 1.61 1.2227,000 30,000 21,787 5.75 620.85 3.42 13.53 0.49 1,140 5.78 32.43 4.27 1.25 1.22 2,952 5.24 83.95 5.47 3.21 2.4230,000 35,000 33,323 8.79 1,081.60 5.95 37.27 1.34 1,574 7.98 51.01 6.71 2.81 2.72 3,816 6.78 123.47 8.05 6.68 5.0435,000 40,000 30,474 8.04 1,141.25 6.28 57.98 2.09 1,336 6.78 50.07 6.59 4.09 3.97 2,687 4.77 100.36 6.54 7.64 5.7640,000 50,000 46,632 12.30 2,080.52 11.44 174.04 6.27 2,105 10.68 93.73 12.34 11.26 10.93 3,511 6.24 156.01 10.17 18.00 13.5750,000 60,000 29,433 7.76 1,607.74 8.84 209.76 7.55 1,236 6.27 67.45 8.88 10.70 10.38 1,836 3.26 99.95 6.52 15.61 11.7760,000 75,000 26,049 6.87 1,739.54 9.57 302.86 10.91 1,001 5.08 66.51 8.75 12.49 12.12 1,446 2.57 96.48 6.29 18.01 13.5775,000 100,000 19,158 5.05 1,635.54 9.00 349.50 12.59 761 3.86 65.26 8.59 14.45 14.02 1,039 1.85 88.27 5.75 18.89 14.24
100,000 150,000 12,191 3.22 1,465.69 8.06 366.33 13.19 480 2.43 57.26 7.54 13.63 13.22 518 0.92 61.96 4.04 14.08 10.62150,000 200,000 4,312 1.14 740.61 4.07 200.76 7.23 142 0.72 24.59 3.24 6.31 6.13 153 0.27 26.35 1.72 6.28 4.73200,000 275,000 2,947 0.78 688.35 3.79 191.11 6.88 108 0.55 25.21 3.32 6.52 6.33 94 0.17 21.95 1.43 5.33 4.02
Over 275,000 4,463 1.18 3,076.49 16.92 855.35 30.80 110 0.56 68.06 8.96 18.40 17.85 114 0.20 61.88 4.03 15.54 11.71
Totals 379,189 100 18,179.92 100 2,776.73 100 19,713 100 759.83 100 103.08 100 56,284 100 1,534.00 100 132.65 100
5

Revenue Commissioners Statistical Report 2009
INCOME TAX 2007
TABLE IDS1 - continued
Distribution of (i) number of incomes, (ii) gross income charged and (iii) tax, by range of gross income. Range of gross income Totals
From To Number % of Income % of Tax % of€ € of cases total € ' m total € ' m total
- 10,000 450,751 19.06 2,085.64 2.34 2.59 0.0210,000 12,000 86,861 3.67 956.03 1.07 2.42 0.0212,000 15,000 124,781 5.28 1,684.58 1.89 6.49 0.0515,000 17,000 86,461 3.66 1,384.39 1.55 6.16 0.0517,000 20,000 144,250 6.10 2,668.34 2.99 25.09 0.2020,000 25,000 231,548 9.79 5,204.00 5.84 150.61 1.2325,000 27,000 84,772 3.58 2,204.07 2.47 94.70 0.7727,000 30,000 119,116 5.04 3,393.17 3.81 174.86 1.4230,000 35,000 172,392 7.29 5,592.96 6.27 359.31 2.9235,000 40,000 145,888 6.17 5,462.12 6.13 454.75 3.7040,000 50,000 212,417 8.98 9,480.38 10.63 1,058.81 8.6250,000 60,000 139,504 5.90 7,628.34 8.55 1,042.25 8.4860,000 75,000 136,451 5.77 9,124.74 10.23 1,419.36 11.5575,000 100,000 114,006 4.82 9,767.64 10.95 1,811.25 14.74
100,000 150,000 72,268 3.06 8,609.43 9.65 1,938.07 15.77150,000 200,000 19,748 0.83 3,372.09 3.78 863.55 7.03200,000 275,000 10,943 0.46 2,539.95 2.85 677.52 5.51
Over 275,000 13,291 0.56 8,014.60 8.99 2,198.27 17.89
Totals 2,365,448 100 89,172.47 100 12,286.06 100
6
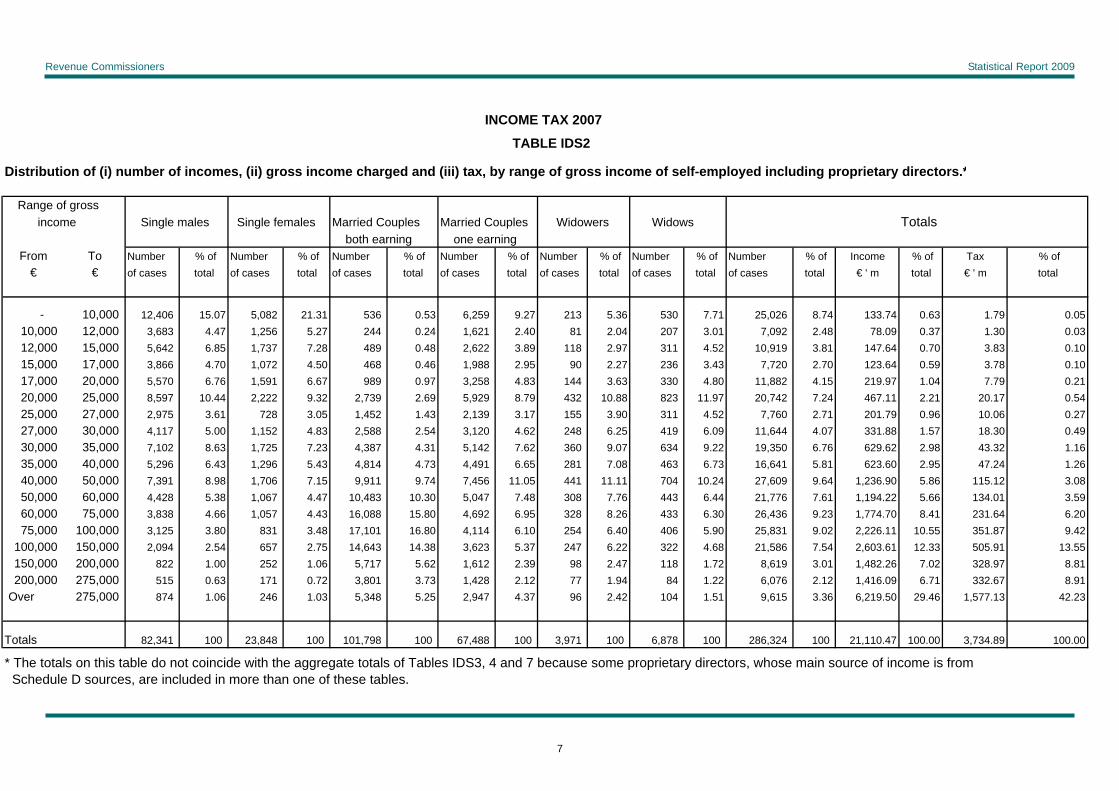
Revenue Commissioners Statistical Report 2009
INCOME TAX 2007
TABLE IDS2
Distribution of (i) number of incomes, (ii) gross income charged and (iii) tax, by range of gross income of self-employed including proprietary directors.*
Range of gross income Single males Single females Married Couples Married Couples Widowers Widows Totals
both earning one earningFrom To Number % of Number % of Number % of Number % of Number % of Number % of Number % of Income % of Tax % of
€ € of cases total of cases total of cases total of cases total of cases total of cases total of cases total € ' m total € ' m total
- 10,000 12,406 15.07 5,082 21.31 536 0.53 6,259 9.27 213 5.36 530 7.71 25,026 8.74 133.74 0.63 1.79 0.0510,000 12,000 3,683 4.47 1,256 5.27 244 0.24 1,621 2.40 81 2.04 207 3.01 7,092 2.48 78.09 0.37 1.30 0.0312,000 15,000 5,642 6.85 1,737 7.28 489 0.48 2,622 3.89 118 2.97 311 4.52 10,919 3.81 147.64 0.70 3.83 0.1015,000 17,000 3,866 4.70 1,072 4.50 468 0.46 1,988 2.95 90 2.27 236 3.43 7,720 2.70 123.64 0.59 3.78 0.1017,000 20,000 5,570 6.76 1,591 6.67 989 0.97 3,258 4.83 144 3.63 330 4.80 11,882 4.15 219.97 1.04 7.79 0.2120,000 25,000 8,597 10.44 2,222 9.32 2,739 2.69 5,929 8.79 432 10.88 823 11.97 20,742 7.24 467.11 2.21 20.17 0.5425,000 27,000 2,975 3.61 728 3.05 1,452 1.43 2,139 3.17 155 3.90 311 4.52 7,760 2.71 201.79 0.96 10.06 0.2727,000 30,000 4,117 5.00 1,152 4.83 2,588 2.54 3,120 4.62 248 6.25 419 6.09 11,644 4.07 331.88 1.57 18.30 0.4930,000 35,000 7,102 8.63 1,725 7.23 4,387 4.31 5,142 7.62 360 9.07 634 9.22 19,350 6.76 629.62 2.98 43.32 1.1635,000 40,000 5,296 6.43 1,296 5.43 4,814 4.73 4,491 6.65 281 7.08 463 6.73 16,641 5.81 623.60 2.95 47.24 1.2640,000 50,000 7,391 8.98 1,706 7.15 9,911 9.74 7,456 11.05 441 11.11 704 10.24 27,609 9.64 1,236.90 5.86 115.12 3.0850,000 60,000 4,428 5.38 1,067 4.47 10,483 10.30 5,047 7.48 308 7.76 443 6.44 21,776 7.61 1,194.22 5.66 134.01 3.5960,000 75,000 3,838 4.66 1,057 4.43 16,088 15.80 4,692 6.95 328 8.26 433 6.30 26,436 9.23 1,774.70 8.41 231.64 6.2075,000 100,000 3,125 3.80 831 3.48 17,101 16.80 4,114 6.10 254 6.40 406 5.90 25,831 9.02 2,226.11 10.55 351.87 9.42
100,000 150,000 2,094 2.54 657 2.75 14,643 14.38 3,623 5.37 247 6.22 322 4.68 21,586 7.54 2,603.61 12.33 505.91 13.55150,000 200,000 822 1.00 252 1.06 5,717 5.62 1,612 2.39 98 2.47 118 1.72 8,619 3.01 1,482.26 7.02 328.97 8.81200,000 275,000 515 0.63 171 0.72 3,801 3.73 1,428 2.12 77 1.94 84 1.22 6,076 2.12 1,416.09 6.71 332.67 8.91
Over 275,000 874 1.06 246 1.03 5,348 5.25 2,947 4.37 96 2.42 104 1.51 9,615 3.36 6,219.50 29.46 1,577.13 42.23
Totals 82,341 100 23,848 100 101,798 100 67,488 100 3,971 100 6,878 100 286,324 100 21,110.47 100.00 3,734.89 100.00
* The totals on this table do not coincide with the aggregate totals of Tables IDS3, 4 and 7 because some proprietary directors, whose main source of income is from Schedule D sources, are included in more than one of these tables.
7

Revenue Commissioners Statistical Report 2009
INCOME TAX 2007
TABLE IDS3
Distribution of (i) number of incomes, (ii) gross income charged and (iii) tax, by range of gross income for mainly earned income assessed under Schedule D.
Range of gross income Single males Single females Married Couples Married Couples Widowers Widows Totals
both earning one earningFrom To Number % of Number % of Number % of Number % of Number % of Number % of Number % of Income % of Tax % of
€ € of cases total of cases total of cases total of cases total of cases total of cases total of cases total € ' m total € ' m total
- 10,000 7,796 14.01 2,486 19.92 334 0.63 3,429 8.34 74 3.89 98 5.47 14,217 8.55 86.10 0.84 0.24 0.0210,000 12,000 2,992 5.38 787 6.30 163 0.31 1,175 2.86 35 1.84 42 2.34 5,194 3.13 57.14 0.56 0.73 0.0512,000 15,000 4,579 8.23 1,129 9.04 333 0.63 1,971 4.79 42 2.21 54 3.01 8,108 4.88 109.65 1.07 2.75 0.1715,000 17,000 3,174 5.70 666 5.34 333 0.63 1,502 3.65 33 1.74 57 3.18 5,765 3.47 92.32 0.90 2.98 0.1917,000 20,000 4,428 7.96 965 7.73 691 1.30 2,493 6.06 75 3.94 69 3.85 8,721 5.25 161.38 1.58 5.96 0.3720,000 25,000 6,751 12.13 1,284 10.29 2,041 3.83 4,463 10.85 254 13.35 291 16.23 15,084 9.08 339.05 3.32 14.46 0.9125,000 27,000 2,248 4.04 382 3.06 1,114 2.09 1,536 3.74 85 4.47 100 5.58 5,465 3.29 142.12 1.39 6.85 0.4327,000 30,000 2,966 5.33 563 4.51 1,953 3.67 2,191 5.33 141 7.41 118 6.58 7,932 4.77 225.73 2.21 11.58 0.7330,000 35,000 4,250 7.64 800 6.41 3,281 6.16 3,322 8.08 195 10.25 198 11.04 12,046 7.25 390.79 3.83 23.58 1.4835,000 40,000 3,407 6.12 614 4.92 3,224 6.06 2,846 6.92 147 7.73 148 8.25 10,386 6.25 388.91 3.81 27.04 1.7040,000 50,000 4,601 8.27 797 6.38 5,992 11.25 4,580 11.14 219 11.51 204 11.38 16,393 9.86 733.28 7.19 60.57 3.8150,000 60,000 2,613 4.70 462 3.70 5,611 10.54 3,007 7.31 158 8.31 120 6.69 11,971 7.20 656.00 6.43 64.97 4.0960,000 75,000 2,151 3.87 469 3.76 7,307 13.72 2,501 6.08 153 8.04 116 6.47 12,697 7.64 850.07 8.33 97.15 6.1175,000 100,000 1,607 2.89 380 3.04 7,821 14.69 1,978 4.81 103 5.42 73 4.07 11,962 7.20 1,029.42 10.09 139.01 8.74
100,000 150,000 1,043 1.87 310 2.48 6,240 11.72 1,502 3.65 86 4.52 44 2.45 9,225 5.55 1,111.18 10.89 187.38 11.78150,000 200,000 389 0.70 138 1.11 2,430 4.56 610 1.48 38 2.00 25 1.39 3,630 2.18 625.24 6.13 126.76 7.97200,000 275,000 248 0.45 105 0.84 1,754 3.29 601 1.46 28 1.47 16 0.89 2,752 1.66 642.78 6.30 144.23 9.07
Over 275,000 410 0.74 146 1.17 2,621 4.92 1,411 3.43 36 1.89 20 1.12 4,644 2.79 2,564.06 25.13 674.09 42.39
Totals 55,653 100 12,483 100 53,243 100 41,118 100 1,902 100 1,793 100 166,192 100 10,205.21 100 1,590.32 100
8
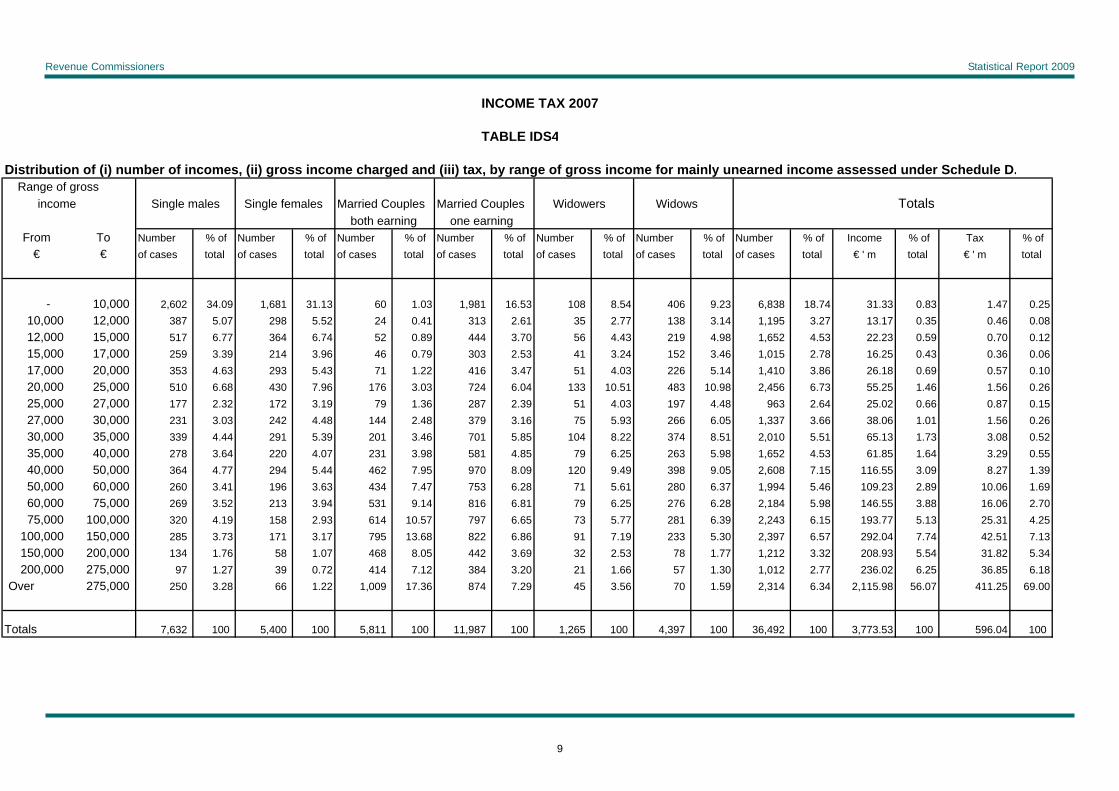
Revenue Commissioners Statistical Report 2009
INCOME TAX 2007
TABLE IDS4
Distribution of (i) number of incomes, (ii) gross income charged and (iii) tax, by range of gross income for mainly unearned income assessed under Schedule D. Range of gross income Single males Single females Married Couples Married Couples Widowers Widows Totals
both earning one earningFrom To Number % of Number % of Number % of Number % of Number % of Number % of Number % of Income % of Tax % of
€ € of cases total of cases total of cases total of cases total of cases total of cases total of cases total € ' m total € ' m total
- 10,000 2,602 34.09 1,681 31.13 60 1.03 1,981 16.53 108 8.54 406 9.23 6,838 18.74 31.33 0.83 1.47 0.2510,000 12,000 387 5.07 298 5.52 24 0.41 313 2.61 35 2.77 138 3.14 1,195 3.27 13.17 0.35 0.46 0.0812,000 15,000 517 6.77 364 6.74 52 0.89 444 3.70 56 4.43 219 4.98 1,652 4.53 22.23 0.59 0.70 0.1215,000 17,000 259 3.39 214 3.96 46 0.79 303 2.53 41 3.24 152 3.46 1,015 2.78 16.25 0.43 0.36 0.0617,000 20,000 353 4.63 293 5.43 71 1.22 416 3.47 51 4.03 226 5.14 1,410 3.86 26.18 0.69 0.57 0.1020,000 25,000 510 6.68 430 7.96 176 3.03 724 6.04 133 10.51 483 10.98 2,456 6.73 55.25 1.46 1.56 0.2625,000 27,000 177 2.32 172 3.19 79 1.36 287 2.39 51 4.03 197 4.48 963 2.64 25.02 0.66 0.87 0.1527,000 30,000 231 3.03 242 4.48 144 2.48 379 3.16 75 5.93 266 6.05 1,337 3.66 38.06 1.01 1.56 0.2630,000 35,000 339 4.44 291 5.39 201 3.46 701 5.85 104 8.22 374 8.51 2,010 5.51 65.13 1.73 3.08 0.5235,000 40,000 278 3.64 220 4.07 231 3.98 581 4.85 79 6.25 263 5.98 1,652 4.53 61.85 1.64 3.29 0.5540,000 50,000 364 4.77 294 5.44 462 7.95 970 8.09 120 9.49 398 9.05 2,608 7.15 116.55 3.09 8.27 1.3950,000 60,000 260 3.41 196 3.63 434 7.47 753 6.28 71 5.61 280 6.37 1,994 5.46 109.23 2.89 10.06 1.6960,000 75,000 269 3.52 213 3.94 531 9.14 816 6.81 79 6.25 276 6.28 2,184 5.98 146.55 3.88 16.06 2.7075,000 100,000 320 4.19 158 2.93 614 10.57 797 6.65 73 5.77 281 6.39 2,243 6.15 193.77 5.13 25.31 4.25
100,000 150,000 285 3.73 171 3.17 795 13.68 822 6.86 91 7.19 233 5.30 2,397 6.57 292.04 7.74 42.51 7.13150,000 200,000 134 1.76 58 1.07 468 8.05 442 3.69 32 2.53 78 1.77 1,212 3.32 208.93 5.54 31.82 5.34200,000 275,000 97 1.27 39 0.72 414 7.12 384 3.20 21 1.66 57 1.30 1,012 2.77 236.02 6.25 36.85 6.18
Over 275,000 250 3.28 66 1.22 1,009 17.36 874 7.29 45 3.56 70 1.59 2,314 6.34 2,115.98 56.07 411.25 69.00
Totals 7,632 100 5,400 100 5,811 100 11,987 100 1,265 100 4,397 100 36,492 100 3,773.53 100 596.04 100
9
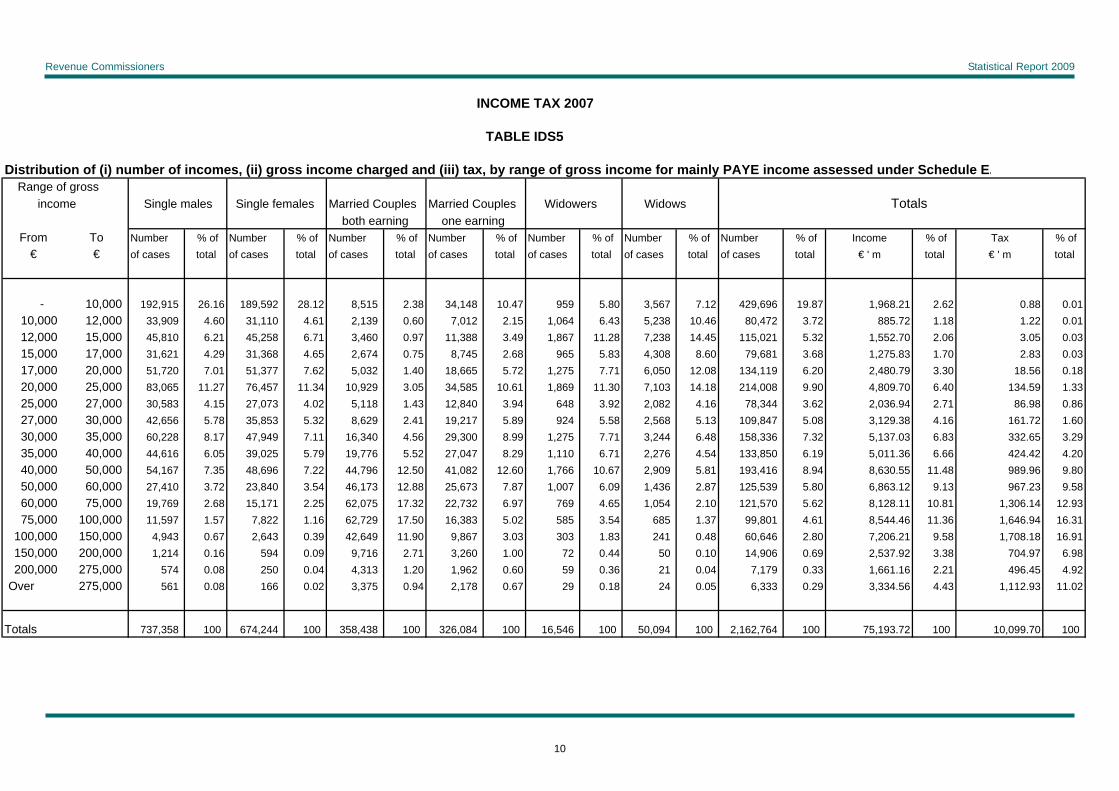
Revenue Commissioners Statistical Report 2009
INCOME TAX 2007
TABLE IDS5
Distribution of (i) number of incomes, (ii) gross income charged and (iii) tax, by range of gross income for mainly PAYE income assessed under Schedule E. Range of gross income Single males Single females Married Couples Married Couples Widowers Widows Totals
both earning one earningFrom To Number % of Number % of Number % of Number % of Number % of Number % of Number % of Income % of Tax % of
€ € of cases total of cases total of cases total of cases total of cases total of cases total of cases total € ' m total € ' m total
- 10,000 192,915 26.16 189,592 28.12 8,515 2.38 34,148 10.47 959 5.80 3,567 7.12 429,696 19.87 1,968.21 2.62 0.88 0.0110,000 12,000 33,909 4.60 31,110 4.61 2,139 0.60 7,012 2.15 1,064 6.43 5,238 10.46 80,472 3.72 885.72 1.18 1.22 0.0112,000 15,000 45,810 6.21 45,258 6.71 3,460 0.97 11,388 3.49 1,867 11.28 7,238 14.45 115,021 5.32 1,552.70 2.06 3.05 0.0315,000 17,000 31,621 4.29 31,368 4.65 2,674 0.75 8,745 2.68 965 5.83 4,308 8.60 79,681 3.68 1,275.83 1.70 2.83 0.0317,000 20,000 51,720 7.01 51,377 7.62 5,032 1.40 18,665 5.72 1,275 7.71 6,050 12.08 134,119 6.20 2,480.79 3.30 18.56 0.1820,000 25,000 83,065 11.27 76,457 11.34 10,929 3.05 34,585 10.61 1,869 11.30 7,103 14.18 214,008 9.90 4,809.70 6.40 134.59 1.3325,000 27,000 30,583 4.15 27,073 4.02 5,118 1.43 12,840 3.94 648 3.92 2,082 4.16 78,344 3.62 2,036.94 2.71 86.98 0.8627,000 30,000 42,656 5.78 35,853 5.32 8,629 2.41 19,217 5.89 924 5.58 2,568 5.13 109,847 5.08 3,129.38 4.16 161.72 1.6030,000 35,000 60,228 8.17 47,949 7.11 16,340 4.56 29,300 8.99 1,275 7.71 3,244 6.48 158,336 7.32 5,137.03 6.83 332.65 3.2935,000 40,000 44,616 6.05 39,025 5.79 19,776 5.52 27,047 8.29 1,110 6.71 2,276 4.54 133,850 6.19 5,011.36 6.66 424.42 4.2040,000 50,000 54,167 7.35 48,696 7.22 44,796 12.50 41,082 12.60 1,766 10.67 2,909 5.81 193,416 8.94 8,630.55 11.48 989.96 9.8050,000 60,000 27,410 3.72 23,840 3.54 46,173 12.88 25,673 7.87 1,007 6.09 1,436 2.87 125,539 5.80 6,863.12 9.13 967.23 9.5860,000 75,000 19,769 2.68 15,171 2.25 62,075 17.32 22,732 6.97 769 4.65 1,054 2.10 121,570 5.62 8,128.11 10.81 1,306.14 12.9375,000 100,000 11,597 1.57 7,822 1.16 62,729 17.50 16,383 5.02 585 3.54 685 1.37 99,801 4.61 8,544.46 11.36 1,646.94 16.31
100,000 150,000 4,943 0.67 2,643 0.39 42,649 11.90 9,867 3.03 303 1.83 241 0.48 60,646 2.80 7,206.21 9.58 1,708.18 16.91150,000 200,000 1,214 0.16 594 0.09 9,716 2.71 3,260 1.00 72 0.44 50 0.10 14,906 0.69 2,537.92 3.38 704.97 6.98200,000 275,000 574 0.08 250 0.04 4,313 1.20 1,962 0.60 59 0.36 21 0.04 7,179 0.33 1,661.16 2.21 496.45 4.92
Over 275,000 561 0.08 166 0.02 3,375 0.94 2,178 0.67 29 0.18 24 0.05 6,333 0.29 3,334.56 4.43 1,112.93 11.02
Totals 737,358 100 674,244 100 358,438 100 326,084 100 16,546 100 50,094 100 2,162,764 100 75,193.72 100 10,099.70 100
10

Revenue Commissioners Statistical Report 2009
INCOME TAX 2007
TABLE IDS6Distribution of (i) number of incomes, (ii) gross income charged and (iii) tax, by range of gross income for mainly PAYE income assessed under Schedule E
(excluding proprietary directors on the Schedule E record). Range of gross income Single males Single females Married Couples Married Couples Widowers Widows Totals
both earning one earningFrom To Number % of Number % of Number % of Number % of Number % of Number % of Number % of Income % of Tax % of
€ € of cases total of cases total of cases total of cases total of cases total of cases total of cases total € ' m total € ' m total
- 10,000 190,907 26.58 188,677 28.23 8,373 2.65 33,299 10.68 928 5.90 3,541 7.17 425,725 20.48 1,951.90 2.87 0.81 0.0110,000 12,000 33,605 4.68 30,939 4.63 2,082 0.66 6,879 2.21 1,053 6.69 5,211 10.55 79,769 3.84 877.94 1.29 1.12 0.0112,000 15,000 45,264 6.30 45,014 6.74 3,356 1.06 11,181 3.59 1,847 11.73 7,200 14.57 113,862 5.48 1,536.94 2.26 2.67 0.0315,000 17,000 31,188 4.34 31,176 4.67 2,585 0.82 8,562 2.75 949 6.03 4,281 8.66 78,741 3.79 1,260.75 1.85 2.38 0.0317,000 20,000 50,931 7.09 51,044 7.64 4,805 1.52 18,316 5.88 1,257 7.99 6,015 12.17 132,368 6.37 2,448.37 3.60 17.30 0.2020,000 25,000 81,729 11.38 75,949 11.36 10,407 3.30 33,843 10.86 1,824 11.59 7,054 14.28 210,806 10.14 4,736.89 6.96 130.44 1.5325,000 27,000 30,033 4.18 26,899 4.03 4,859 1.54 12,524 4.02 629 4.00 2,068 4.19 77,012 3.70 2,002.28 2.94 84.64 0.9927,000 30,000 41,736 5.81 35,506 5.31 8,138 2.58 18,667 5.99 892 5.67 2,533 5.13 107,472 5.17 3,061.29 4.50 156.56 1.8330,000 35,000 57,715 8.03 47,315 7.08 15,435 4.89 28,181 9.04 1,214 7.71 3,182 6.44 153,042 7.36 4,963.34 7.29 315.99 3.7035,000 40,000 43,005 5.99 38,563 5.77 18,417 5.83 25,983 8.34 1,055 6.70 2,224 4.50 129,247 6.22 4,838.52 7.11 407.51 4.7740,000 50,000 51,741 7.20 48,081 7.19 41,339 13.09 39,176 12.57 1,664 10.57 2,807 5.68 184,808 8.89 8,243.48 12.11 943.68 11.0450,000 60,000 25,855 3.60 23,431 3.51 41,735 13.22 24,386 7.82 928 5.90 1,393 2.82 117,728 5.66 6,434.12 9.45 908.25 10.6260,000 75,000 18,351 2.55 14,796 2.21 53,825 17.05 21,357 6.85 673 4.28 1,013 2.05 110,015 5.29 7,350.03 10.80 1,187.71 13.8975,000 100,000 10,399 1.45 7,529 1.13 54,063 17.13 15,044 4.83 507 3.22 633 1.28 88,175 4.24 7,541.53 11.08 1,459.38 17.07
100,000 150,000 4,177 0.58 2,467 0.37 35,041 11.10 8,568 2.75 233 1.48 196 0.40 50,682 2.44 6,005.83 8.82 1,432.16 16.75150,000 200,000 915 0.13 538 0.08 6,897 2.18 2,700 0.87 44 0.28 35 0.07 11,129 0.54 1,889.83 2.78 534.59 6.25200,000 275,000 404 0.06 223 0.03 2,680 0.85 1,519 0.49 31 0.20 10 0.02 4,867 0.23 1,123.86 1.65 344.86 4.03
Over 275,000 347 0.05 132 0.02 1,657 0.52 1,516 0.49 14 0.09 10 0.02 3,676 0.18 1,795.10 2.64 621.14 7.26
Totals 718,302 100 668,279 100 315,694 100 311,701 100 15,742 100 49,406 100 2,079,124 100 68,062.00 100 8,551.17 100
11
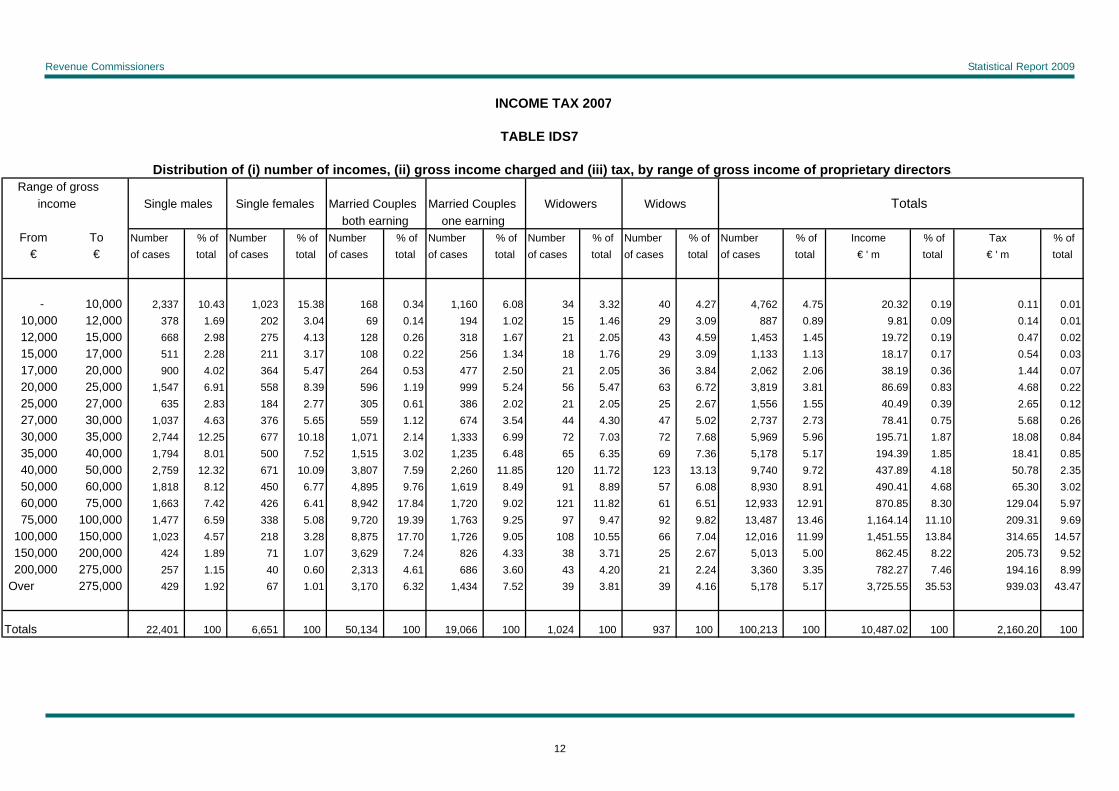
Revenue Commissioners Statistical Report 2009
INCOME TAX 2007
TABLE IDS7
Distribution of (i) number of incomes, (ii) gross income charged and (iii) tax, by range of gross income of proprietary directors. Range of gross income Single males Single females Married Couples Married Couples Widowers Widows Totals
both earning one earningFrom To Number % of Number % of Number % of Number % of Number % of Number % of Number % of Income % of Tax % of
€ € of cases total of cases total of cases total of cases total of cases total of cases total of cases total € ' m total € ' m total
- 10,000 2,337 10.43 1,023 15.38 168 0.34 1,160 6.08 34 3.32 40 4.27 4,762 4.75 20.32 0.19 0.11 0.0110,000 12,000 378 1.69 202 3.04 69 0.14 194 1.02 15 1.46 29 3.09 887 0.89 9.81 0.09 0.14 0.0112,000 15,000 668 2.98 275 4.13 128 0.26 318 1.67 21 2.05 43 4.59 1,453 1.45 19.72 0.19 0.47 0.0215,000 17,000 511 2.28 211 3.17 108 0.22 256 1.34 18 1.76 29 3.09 1,133 1.13 18.17 0.17 0.54 0.0317,000 20,000 900 4.02 364 5.47 264 0.53 477 2.50 21 2.05 36 3.84 2,062 2.06 38.19 0.36 1.44 0.0720,000 25,000 1,547 6.91 558 8.39 596 1.19 999 5.24 56 5.47 63 6.72 3,819 3.81 86.69 0.83 4.68 0.2225,000 27,000 635 2.83 184 2.77 305 0.61 386 2.02 21 2.05 25 2.67 1,556 1.55 40.49 0.39 2.65 0.1227,000 30,000 1,037 4.63 376 5.65 559 1.12 674 3.54 44 4.30 47 5.02 2,737 2.73 78.41 0.75 5.68 0.2630,000 35,000 2,744 12.25 677 10.18 1,071 2.14 1,333 6.99 72 7.03 72 7.68 5,969 5.96 195.71 1.87 18.08 0.8435,000 40,000 1,794 8.01 500 7.52 1,515 3.02 1,235 6.48 65 6.35 69 7.36 5,178 5.17 194.39 1.85 18.41 0.8540,000 50,000 2,759 12.32 671 10.09 3,807 7.59 2,260 11.85 120 11.72 123 13.13 9,740 9.72 437.89 4.18 50.78 2.3550,000 60,000 1,818 8.12 450 6.77 4,895 9.76 1,619 8.49 91 8.89 57 6.08 8,930 8.91 490.41 4.68 65.30 3.0260,000 75,000 1,663 7.42 426 6.41 8,942 17.84 1,720 9.02 121 11.82 61 6.51 12,933 12.91 870.85 8.30 129.04 5.9775,000 100,000 1,477 6.59 338 5.08 9,720 19.39 1,763 9.25 97 9.47 92 9.82 13,487 13.46 1,164.14 11.10 209.31 9.69
100,000 150,000 1,023 4.57 218 3.28 8,875 17.70 1,726 9.05 108 10.55 66 7.04 12,016 11.99 1,451.55 13.84 314.65 14.57150,000 200,000 424 1.89 71 1.07 3,629 7.24 826 4.33 38 3.71 25 2.67 5,013 5.00 862.45 8.22 205.73 9.52200,000 275,000 257 1.15 40 0.60 2,313 4.61 686 3.60 43 4.20 21 2.24 3,360 3.35 782.27 7.46 194.16 8.99
Over 275,000 429 1.92 67 1.01 3,170 6.32 1,434 7.52 39 3.81 39 4.16 5,178 5.17 3,725.55 35.53 939.03 43.47
Totals 22,401 100 6,651 100 50,134 100 19,066 100 1,024 100 937 100 100,213 100 10,487.02 100 2,160.20 100
12
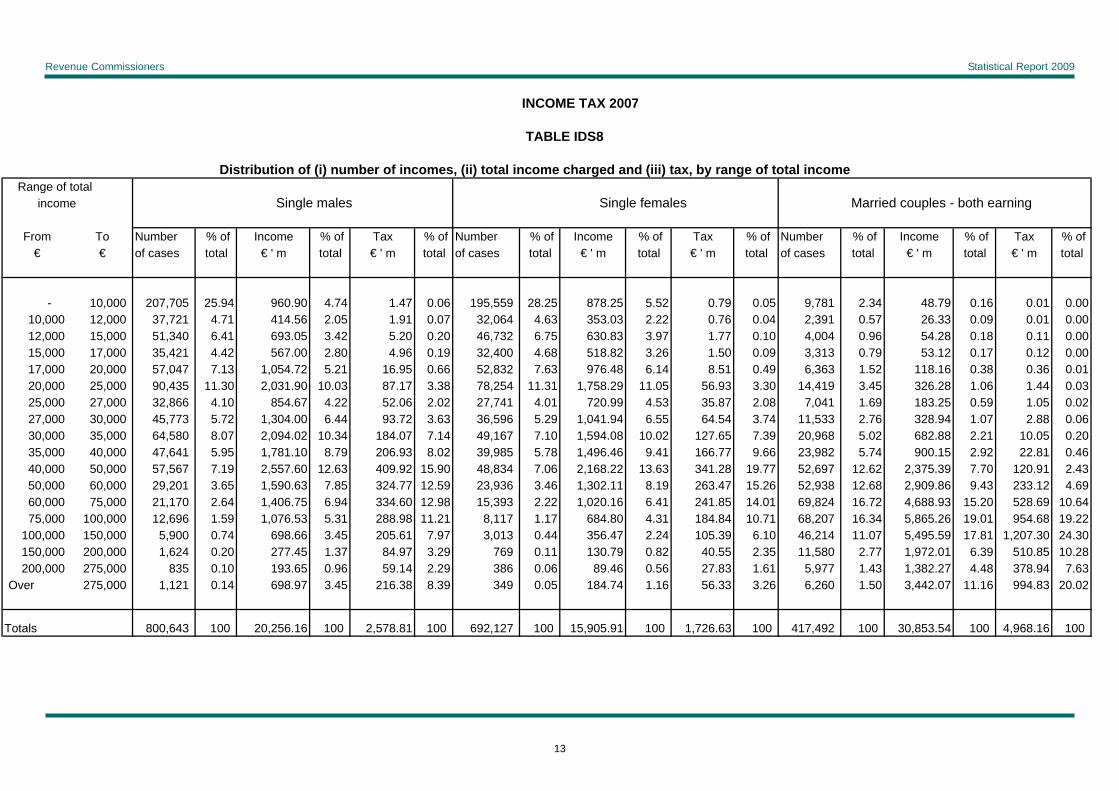
Revenue Commissioners Statistical Report 2009
INCOME TAX 2007
TABLE IDS8
Distribution of (i) number of incomes, (ii) total income charged and (iii) tax, by range of total income. Range of total income Single males Single females Married couples - both earning
From To Number % of Income % of Tax % of Number % of Income % of Tax % of Number % of Income % of Tax % of€ € of cases total € ' m total € ' m total of cases total € ' m total € ' m total of cases total € ' m total € ' m total
- 10,000 207,705 25.94 960.90 4.74 1.47 0.06 195,559 28.25 878.25 5.52 0.79 0.05 9,781 2.34 48.79 0.16 0.01 0.0010,000 12,000 37,721 4.71 414.56 2.05 1.91 0.07 32,064 4.63 353.03 2.22 0.76 0.04 2,391 0.57 26.33 0.09 0.01 0.0012,000 15,000 51,340 6.41 693.05 3.42 5.20 0.20 46,732 6.75 630.83 3.97 1.77 0.10 4,004 0.96 54.28 0.18 0.11 0.0015,000 17,000 35,421 4.42 567.00 2.80 4.96 0.19 32,400 4.68 518.82 3.26 1.50 0.09 3,313 0.79 53.12 0.17 0.12 0.0017,000 20,000 57,047 7.13 1,054.72 5.21 16.95 0.66 52,832 7.63 976.48 6.14 8.51 0.49 6,363 1.52 118.16 0.38 0.36 0.0120,000 25,000 90,435 11.30 2,031.90 10.03 87.17 3.38 78,254 11.31 1,758.29 11.05 56.93 3.30 14,419 3.45 326.28 1.06 1.44 0.0325,000 27,000 32,866 4.10 854.67 4.22 52.06 2.02 27,741 4.01 720.99 4.53 35.87 2.08 7,041 1.69 183.25 0.59 1.05 0.0227,000 30,000 45,773 5.72 1,304.00 6.44 93.72 3.63 36,596 5.29 1,041.94 6.55 64.54 3.74 11,533 2.76 328.94 1.07 2.88 0.0630,000 35,000 64,580 8.07 2,094.02 10.34 184.07 7.14 49,167 7.10 1,594.08 10.02 127.65 7.39 20,968 5.02 682.88 2.21 10.05 0.2035,000 40,000 47,641 5.95 1,781.10 8.79 206.93 8.02 39,985 5.78 1,496.46 9.41 166.77 9.66 23,982 5.74 900.15 2.92 22.81 0.4640,000 50,000 57,567 7.19 2,557.60 12.63 409.92 15.90 48,834 7.06 2,168.22 13.63 341.28 19.77 52,697 12.62 2,375.39 7.70 120.91 2.4350,000 60,000 29,201 3.65 1,590.63 7.85 324.77 12.59 23,936 3.46 1,302.11 8.19 263.47 15.26 52,938 12.68 2,909.86 9.43 233.12 4.6960,000 75,000 21,170 2.64 1,406.75 6.94 334.60 12.98 15,393 2.22 1,020.16 6.41 241.85 14.01 69,824 16.72 4,688.93 15.20 528.69 10.6475,000 100,000 12,696 1.59 1,076.53 5.31 288.98 11.21 8,117 1.17 684.80 4.31 184.84 10.71 68,207 16.34 5,865.26 19.01 954.68 19.22
100,000 150,000 5,900 0.74 698.66 3.45 205.61 7.97 3,013 0.44 356.47 2.24 105.39 6.10 46,214 11.07 5,495.59 17.81 1,207.30 24.30150,000 200,000 1,624 0.20 277.45 1.37 84.97 3.29 769 0.11 130.79 0.82 40.55 2.35 11,580 2.77 1,972.01 6.39 510.85 10.28200,000 275,000 835 0.10 193.65 0.96 59.14 2.29 386 0.06 89.46 0.56 27.83 1.61 5,977 1.43 1,382.27 4.48 378.94 7.63
Over 275,000 1,121 0.14 698.97 3.45 216.38 8.39 349 0.05 184.74 1.16 56.33 3.26 6,260 1.50 3,442.07 11.16 994.83 20.02
Totals 800,643 100 20,256.16 100 2,578.81 100 692,127 100 15,905.91 100 1,726.63 100 417,492 100 30,853.54 100 4,968.16 100
13

Revenue Commissioners Statistical Report 2009
INCOME TAX 2007
TABLE IDS8 - continued
Distribution of (i) number of incomes, (ii) total income charged and (iii) tax, by range of total income. Range of total income Married couples - one earning Widowers Widows
From To Number % of Income % of Tax % of Number % of Income % of Tax % of Number % of Income % of Tax % of€ € of cases total € ' m total € ' m total of cases total € ' m total € ' m total of cases total € ' m total € ' m total
- 10,000 41,944 11.06 182.39 1.04 0.58 0.02 1,210 6.14 6.00 0.82 0.00 0.00 4,223 7.50 26.39 1.76 0.03 0.0210,000 12,000 8,686 2.29 95.67 0.54 0.30 0.01 1,192 6.05 13.25 1.80 0.01 0.01 5,502 9.78 60.71 4.04 0.01 0.0112,000 15,000 13,991 3.69 189.50 1.08 0.76 0.03 1,998 10.14 26.82 3.65 0.01 0.01 7,582 13.47 101.91 6.79 0.04 0.0315,000 17,000 10,992 2.90 176.14 1.00 0.63 0.02 1,060 5.38 16.94 2.31 0.02 0.02 4,556 8.09 72.84 4.85 0.03 0.0217,000 20,000 22,343 5.89 414.01 2.35 1.86 0.07 1,461 7.41 27.03 3.68 0.06 0.06 6,353 11.29 117.25 7.81 0.08 0.0620,000 25,000 40,531 10.69 911.00 5.18 10.05 0.36 2,253 11.43 50.60 6.89 0.59 0.57 7,881 14.00 175.81 11.71 1.70 1.2825,000 27,000 14,871 3.92 386.68 2.20 6.59 0.24 808 4.10 21.01 2.86 0.61 0.59 2,399 4.26 62.27 4.15 1.69 1.2727,000 30,000 22,012 5.81 627.23 3.57 14.73 0.53 1,107 5.62 31.50 4.29 1.31 1.27 2,961 5.26 84.24 5.61 3.33 2.5130,000 35,000 33,486 8.83 1,086.87 6.18 39.96 1.44 1,560 7.91 50.60 6.89 2.95 2.86 3,780 6.72 122.30 8.14 6.86 5.1735,000 40,000 30,398 8.02 1,138.33 6.47 61.31 2.21 1,381 7.01 51.78 7.05 4.41 4.28 2,683 4.77 100.16 6.67 7.87 5.9340,000 50,000 46,025 12.14 2,052.32 11.67 180.79 6.51 2,069 10.50 92.19 12.56 11.52 11.18 3,458 6.14 153.70 10.24 18.53 13.9750,000 60,000 28,397 7.49 1,550.34 8.82 213.10 7.67 1,191 6.04 64.92 8.84 10.84 10.52 1,767 3.14 96.16 6.40 15.66 11.8160,000 75,000 24,813 6.54 1,656.10 9.42 302.70 10.90 946 4.80 62.70 8.54 12.55 12.18 1,391 2.47 92.66 6.17 18.29 13.7975,000 100,000 18,126 4.78 1,547.45 8.80 346.91 12.49 707 3.59 60.63 8.26 14.15 13.73 959 1.70 81.31 5.41 18.19 13.71
100,000 150,000 11,542 3.04 1,387.00 7.89 363.94 13.11 456 2.31 54.11 7.37 13.89 13.48 463 0.82 55.34 3.68 13.80 10.41150,000 200,000 4,090 1.08 702.62 4.00 200.25 7.21 122 0.62 21.26 2.90 6.00 5.82 141 0.25 24.10 1.60 6.26 4.72200,000 275,000 2,800 0.74 654.18 3.72 192.76 6.94 90 0.46 20.90 2.85 6.11 5.93 84 0.15 19.60 1.31 5.37 4.05
Over 275,000 4,142 1.09 2,826.91 16.08 839.50 30.23 102 0.52 61.95 8.44 18.05 17.51 101 0.18 54.94 3.66 14.90 11.23
Totals 379,189 100 17,584.76 100 2,776.73 100 19,713 100 734.20 100 103.08 100 56,284 100 1,501.71 100 132.65 100
14

Revenue Commissioners Statistical Report 2009
INCOME TAX 2007
TABLE IDS8 - continued
Distribution of (i) number of incomes, (ii) total income charged and (iii) tax, by range of total income. Range of total income Totals
From To Number % of Income % of Tax % of€ € of cases total € ' m total € ' m total
- 10,000 460,422 19.46 2,102.72 2.42 2.89 0.0210,000 12,000 87,556 3.70 963.54 1.11 2.99 0.0212,000 15,000 125,647 5.31 1,696.39 1.95 7.89 0.0615,000 17,000 87,742 3.71 1,404.86 1.62 7.25 0.0617,000 20,000 146,399 6.19 2,707.66 3.12 27.82 0.2320,000 25,000 233,773 9.88 5,253.88 6.05 157.88 1.2925,000 27,000 85,726 3.62 2,228.87 2.57 97.88 0.8027,000 30,000 119,982 5.07 3,417.85 3.94 180.51 1.4730,000 35,000 173,541 7.34 5,630.75 6.48 371.53 3.0235,000 40,000 146,070 6.18 5,467.97 6.30 470.10 3.8340,000 50,000 210,650 8.91 9,399.42 10.82 1,082.95 8.8150,000 60,000 137,430 5.81 7,514.02 8.65 1,060.96 8.6460,000 75,000 133,537 5.65 8,927.30 10.28 1,438.69 11.7175,000 100,000 108,812 4.60 9,315.99 10.73 1,807.75 14.71
100,000 150,000 67,588 2.86 8,047.18 9.27 1,909.94 15.55150,000 200,000 18,326 0.77 3,128.22 3.60 848.88 6.91200,000 275,000 10,172 0.43 2,360.06 2.72 670.15 5.45
Over 275,000 12,075 0.51 7,269.59 8.37 2,140.00 17.42
Totals 2,365,448 100 86,836.28 100 12,286.06 100
15
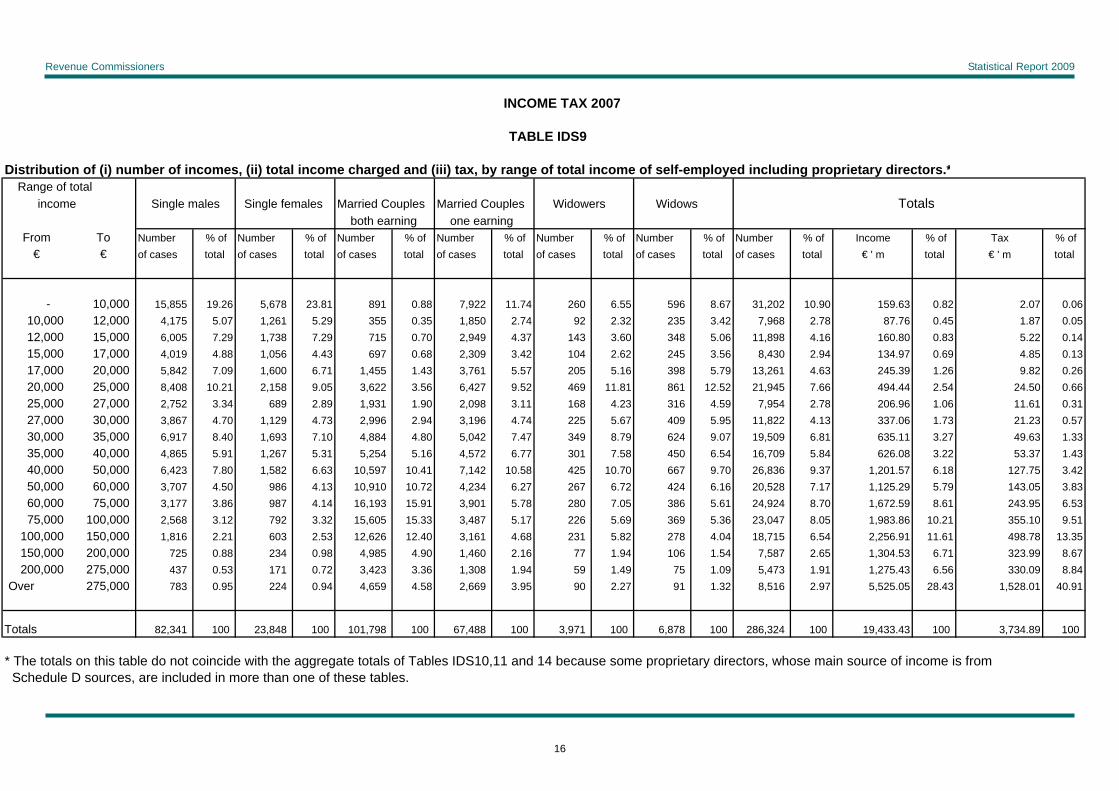
Revenue Commissioners Statistical Report 2009
INCOME TAX 2007
TABLE IDS9
Distribution of (i) number of incomes, (ii) total income charged and (iii) tax, by range of total income of self-employed including proprietary directors.* Range of total income Single males Single females Married Couples Married Couples Widowers Widows Totals
both earning one earningFrom To Number % of Number % of Number % of Number % of Number % of Number % of Number % of Income % of Tax % of
€ € of cases total of cases total of cases total of cases total of cases total of cases total of cases total € ' m total € ' m total
- 10,000 15,855 19.26 5,678 23.81 891 0.88 7,922 11.74 260 6.55 596 8.67 31,202 10.90 159.63 0.82 2.07 0.0610,000 12,000 4,175 5.07 1,261 5.29 355 0.35 1,850 2.74 92 2.32 235 3.42 7,968 2.78 87.76 0.45 1.87 0.0512,000 15,000 6,005 7.29 1,738 7.29 715 0.70 2,949 4.37 143 3.60 348 5.06 11,898 4.16 160.80 0.83 5.22 0.1415,000 17,000 4,019 4.88 1,056 4.43 697 0.68 2,309 3.42 104 2.62 245 3.56 8,430 2.94 134.97 0.69 4.85 0.1317,000 20,000 5,842 7.09 1,600 6.71 1,455 1.43 3,761 5.57 205 5.16 398 5.79 13,261 4.63 245.39 1.26 9.82 0.2620,000 25,000 8,408 10.21 2,158 9.05 3,622 3.56 6,427 9.52 469 11.81 861 12.52 21,945 7.66 494.44 2.54 24.50 0.6625,000 27,000 2,752 3.34 689 2.89 1,931 1.90 2,098 3.11 168 4.23 316 4.59 7,954 2.78 206.96 1.06 11.61 0.3127,000 30,000 3,867 4.70 1,129 4.73 2,996 2.94 3,196 4.74 225 5.67 409 5.95 11,822 4.13 337.06 1.73 21.23 0.5730,000 35,000 6,917 8.40 1,693 7.10 4,884 4.80 5,042 7.47 349 8.79 624 9.07 19,509 6.81 635.11 3.27 49.63 1.3335,000 40,000 4,865 5.91 1,267 5.31 5,254 5.16 4,572 6.77 301 7.58 450 6.54 16,709 5.84 626.08 3.22 53.37 1.4340,000 50,000 6,423 7.80 1,582 6.63 10,597 10.41 7,142 10.58 425 10.70 667 9.70 26,836 9.37 1,201.57 6.18 127.75 3.4250,000 60,000 3,707 4.50 986 4.13 10,910 10.72 4,234 6.27 267 6.72 424 6.16 20,528 7.17 1,125.29 5.79 143.05 3.8360,000 75,000 3,177 3.86 987 4.14 16,193 15.91 3,901 5.78 280 7.05 386 5.61 24,924 8.70 1,672.59 8.61 243.95 6.5375,000 100,000 2,568 3.12 792 3.32 15,605 15.33 3,487 5.17 226 5.69 369 5.36 23,047 8.05 1,983.86 10.21 355.10 9.51
100,000 150,000 1,816 2.21 603 2.53 12,626 12.40 3,161 4.68 231 5.82 278 4.04 18,715 6.54 2,256.91 11.61 498.78 13.35150,000 200,000 725 0.88 234 0.98 4,985 4.90 1,460 2.16 77 1.94 106 1.54 7,587 2.65 1,304.53 6.71 323.99 8.67200,000 275,000 437 0.53 171 0.72 3,423 3.36 1,308 1.94 59 1.49 75 1.09 5,473 1.91 1,275.43 6.56 330.09 8.84
Over 275,000 783 0.95 224 0.94 4,659 4.58 2,669 3.95 90 2.27 91 1.32 8,516 2.97 5,525.05 28.43 1,528.01 40.91
Totals 82,341 100 23,848 100 101,798 100 67,488 100 3,971 100 6,878 100 286,324 100 19,433.43 100 3,734.89 100
* The totals on this table do not coincide with the aggregate totals of Tables IDS10,11 and 14 because some proprietary directors, whose main source of income is from Schedule D sources, are included in more than one of these tables.
16
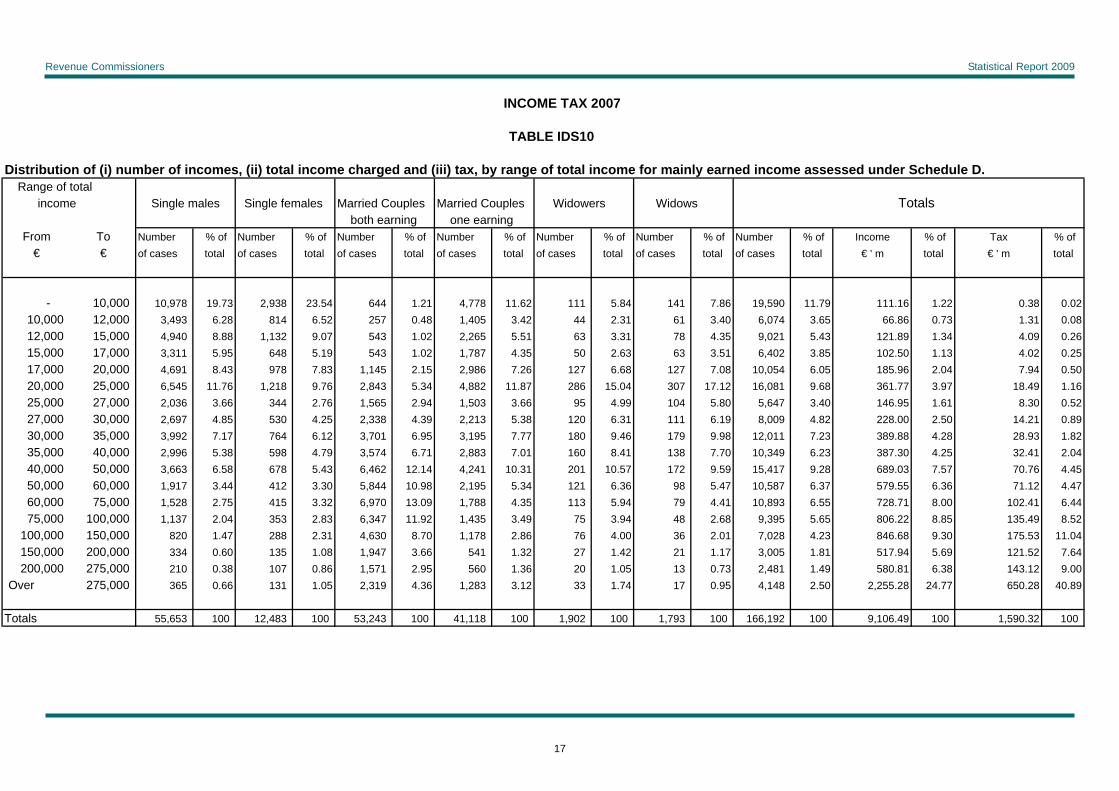
Revenue Commissioners Statistical Report 2009
INCOME TAX 2007
TABLE IDS10
Distribution of (i) number of incomes, (ii) total income charged and (iii) tax, by range of total income for mainly earned income assessed under Schedule D. Range of total income Single males Single females Married Couples Married Couples Widowers Widows Totals
both earning one earningFrom To Number % of Number % of Number % of Number % of Number % of Number % of Number % of Income % of Tax % of
€ € of cases total of cases total of cases total of cases total of cases total of cases total of cases total € ' m total € ' m total
- 10,000 10,978 19.73 2,938 23.54 644 1.21 4,778 11.62 111 5.84 141 7.86 19,590 11.79 111.16 1.22 0.38 0.0210,000 12,000 3,493 6.28 814 6.52 257 0.48 1,405 3.42 44 2.31 61 3.40 6,074 3.65 66.86 0.73 1.31 0.0812,000 15,000 4,940 8.88 1,132 9.07 543 1.02 2,265 5.51 63 3.31 78 4.35 9,021 5.43 121.89 1.34 4.09 0.2615,000 17,000 3,311 5.95 648 5.19 543 1.02 1,787 4.35 50 2.63 63 3.51 6,402 3.85 102.50 1.13 4.02 0.2517,000 20,000 4,691 8.43 978 7.83 1,145 2.15 2,986 7.26 127 6.68 127 7.08 10,054 6.05 185.96 2.04 7.94 0.5020,000 25,000 6,545 11.76 1,218 9.76 2,843 5.34 4,882 11.87 286 15.04 307 17.12 16,081 9.68 361.77 3.97 18.49 1.1625,000 27,000 2,036 3.66 344 2.76 1,565 2.94 1,503 3.66 95 4.99 104 5.80 5,647 3.40 146.95 1.61 8.30 0.5227,000 30,000 2,697 4.85 530 4.25 2,338 4.39 2,213 5.38 120 6.31 111 6.19 8,009 4.82 228.00 2.50 14.21 0.8930,000 35,000 3,992 7.17 764 6.12 3,701 6.95 3,195 7.77 180 9.46 179 9.98 12,011 7.23 389.88 4.28 28.93 1.8235,000 40,000 2,996 5.38 598 4.79 3,574 6.71 2,883 7.01 160 8.41 138 7.70 10,349 6.23 387.30 4.25 32.41 2.0440,000 50,000 3,663 6.58 678 5.43 6,462 12.14 4,241 10.31 201 10.57 172 9.59 15,417 9.28 689.03 7.57 70.76 4.4550,000 60,000 1,917 3.44 412 3.30 5,844 10.98 2,195 5.34 121 6.36 98 5.47 10,587 6.37 579.55 6.36 71.12 4.4760,000 75,000 1,528 2.75 415 3.32 6,970 13.09 1,788 4.35 113 5.94 79 4.41 10,893 6.55 728.71 8.00 102.41 6.4475,000 100,000 1,137 2.04 353 2.83 6,347 11.92 1,435 3.49 75 3.94 48 2.68 9,395 5.65 806.22 8.85 135.49 8.52
100,000 150,000 820 1.47 288 2.31 4,630 8.70 1,178 2.86 76 4.00 36 2.01 7,028 4.23 846.68 9.30 175.53 11.04150,000 200,000 334 0.60 135 1.08 1,947 3.66 541 1.32 27 1.42 21 1.17 3,005 1.81 517.94 5.69 121.52 7.64200,000 275,000 210 0.38 107 0.86 1,571 2.95 560 1.36 20 1.05 13 0.73 2,481 1.49 580.81 6.38 143.12 9.00
Over 275,000 365 0.66 131 1.05 2,319 4.36 1,283 3.12 33 1.74 17 0.95 4,148 2.50 2,255.28 24.77 650.28 40.89
Totals 55,653 100 12,483 100 53,243 100 41,118 100 1,902 100 1,793 100 166,192 100 9,106.49 100 1,590.32 100
17
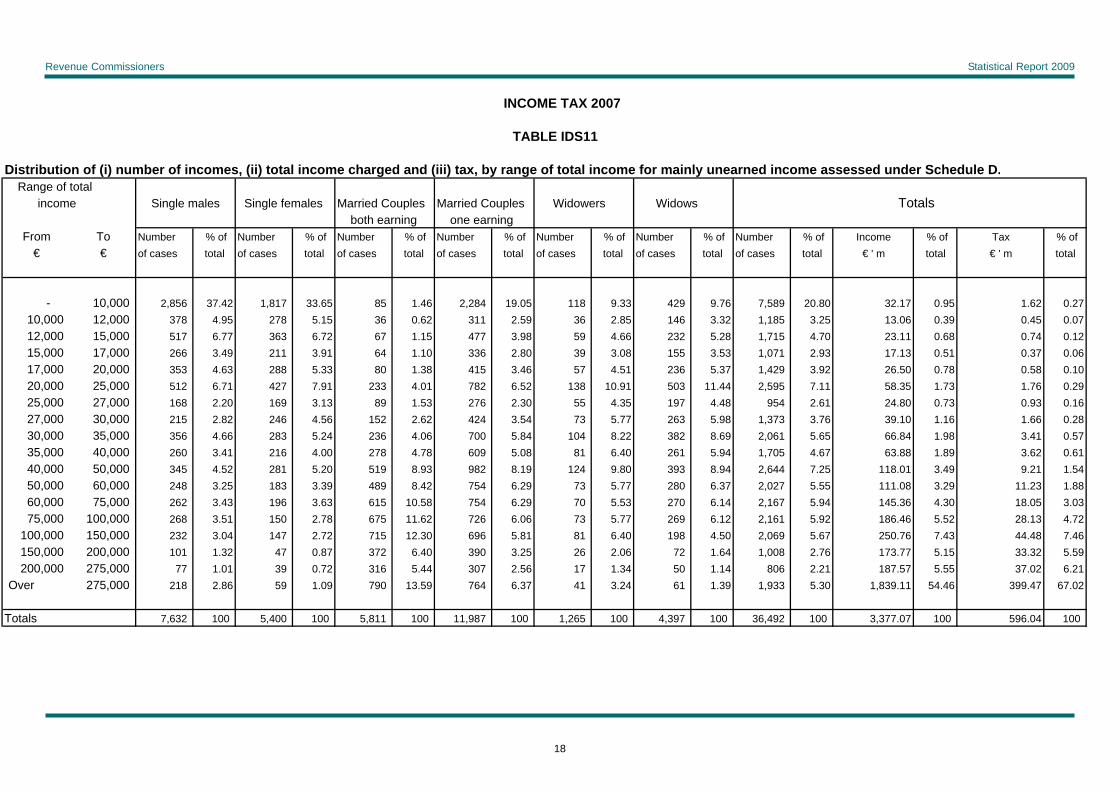
Revenue Commissioners Statistical Report 2009
INCOME TAX 2007
TABLE IDS11
Distribution of (i) number of incomes, (ii) total income charged and (iii) tax, by range of total income for mainly unearned income assessed under Schedule D. Range of total income Single males Single females Married Couples Married Couples Widowers Widows Totals
both earning one earningFrom To Number % of Number % of Number % of Number % of Number % of Number % of Number % of Income % of Tax % of
€ € of cases total of cases total of cases total of cases total of cases total of cases total of cases total € ' m total € ' m total
- 10,000 2,856 37.42 1,817 33.65 85 1.46 2,284 19.05 118 9.33 429 9.76 7,589 20.80 32.17 0.95 1.62 0.2710,000 12,000 378 4.95 278 5.15 36 0.62 311 2.59 36 2.85 146 3.32 1,185 3.25 13.06 0.39 0.45 0.0712,000 15,000 517 6.77 363 6.72 67 1.15 477 3.98 59 4.66 232 5.28 1,715 4.70 23.11 0.68 0.74 0.1215,000 17,000 266 3.49 211 3.91 64 1.10 336 2.80 39 3.08 155 3.53 1,071 2.93 17.13 0.51 0.37 0.0617,000 20,000 353 4.63 288 5.33 80 1.38 415 3.46 57 4.51 236 5.37 1,429 3.92 26.50 0.78 0.58 0.1020,000 25,000 512 6.71 427 7.91 233 4.01 782 6.52 138 10.91 503 11.44 2,595 7.11 58.35 1.73 1.76 0.2925,000 27,000 168 2.20 169 3.13 89 1.53 276 2.30 55 4.35 197 4.48 954 2.61 24.80 0.73 0.93 0.1627,000 30,000 215 2.82 246 4.56 152 2.62 424 3.54 73 5.77 263 5.98 1,373 3.76 39.10 1.16 1.66 0.2830,000 35,000 356 4.66 283 5.24 236 4.06 700 5.84 104 8.22 382 8.69 2,061 5.65 66.84 1.98 3.41 0.5735,000 40,000 260 3.41 216 4.00 278 4.78 609 5.08 81 6.40 261 5.94 1,705 4.67 63.88 1.89 3.62 0.6140,000 50,000 345 4.52 281 5.20 519 8.93 982 8.19 124 9.80 393 8.94 2,644 7.25 118.01 3.49 9.21 1.5450,000 60,000 248 3.25 183 3.39 489 8.42 754 6.29 73 5.77 280 6.37 2,027 5.55 111.08 3.29 11.23 1.8860,000 75,000 262 3.43 196 3.63 615 10.58 754 6.29 70 5.53 270 6.14 2,167 5.94 145.36 4.30 18.05 3.0375,000 100,000 268 3.51 150 2.78 675 11.62 726 6.06 73 5.77 269 6.12 2,161 5.92 186.46 5.52 28.13 4.72
100,000 150,000 232 3.04 147 2.72 715 12.30 696 5.81 81 6.40 198 4.50 2,069 5.67 250.76 7.43 44.48 7.46150,000 200,000 101 1.32 47 0.87 372 6.40 390 3.25 26 2.06 72 1.64 1,008 2.76 173.77 5.15 33.32 5.59200,000 275,000 77 1.01 39 0.72 316 5.44 307 2.56 17 1.34 50 1.14 806 2.21 187.57 5.55 37.02 6.21
Over 275,000 218 2.86 59 1.09 790 13.59 764 6.37 41 3.24 61 1.39 1,933 5.30 1,839.11 54.46 399.47 67.02
Totals 7,632 100 5,400 100 5,811 100 11,987 100 1,265 100 4,397 100 36,492 100 3,377.07 100 596.04 100
18

Revenue Commissioners Statistical Report 2009
INCOME TAX 2007
TABLE IDS12
Distribution of (i) number of incomes, (ii) total income charged and (iii) tax, by range of total income for mainly PAYE income assessed under Schedule E. Range of total income Single males Single females Married Couples Married Couples Widowers Widows Totals
both earning one earningFrom To Number % of Number % of Number % of Number % of Number % of Number % of Number % of Income % of Tax % of
€ € of cases total of cases total of cases total of cases total of cases total of cases total of cases total € ' m total € ' m total
- 10,000 193,871 26.29 190,804 28.30 9,052 2.53 34,882 10.70 981 5.93 3,653 7.29 433,243 20.03 1,959.38 2.64 0.89 0.0110,000 12,000 33,850 4.59 30,972 4.59 2,098 0.59 6,970 2.14 1,112 6.72 5,295 10.57 80,297 3.71 883.62 1.19 1.23 0.0112,000 15,000 45,883 6.22 45,237 6.71 3,394 0.95 11,249 3.45 1,876 11.34 7,272 14.52 114,911 5.31 1,551.39 2.09 3.06 0.0315,000 17,000 31,844 4.32 31,541 4.68 2,706 0.75 8,869 2.72 971 5.87 4,338 8.66 80,269 3.71 1,285.23 1.73 2.87 0.0317,000 20,000 52,003 7.05 51,566 7.65 5,138 1.43 18,942 5.81 1,277 7.72 5,990 11.96 134,916 6.24 2,495.20 3.36 19.30 0.1920,000 25,000 83,378 11.31 76,609 11.36 11,343 3.16 34,867 10.69 1,829 11.05 7,071 14.12 215,097 9.95 4,833.76 6.50 137.63 1.3625,000 27,000 30,662 4.16 27,228 4.04 5,387 1.50 13,092 4.01 658 3.98 2,098 4.19 79,125 3.66 2,057.12 2.77 88.65 0.8827,000 30,000 42,861 5.81 35,820 5.31 9,043 2.52 19,375 5.94 914 5.52 2,587 5.16 110,600 5.11 3,150.75 4.24 164.65 1.6330,000 35,000 60,232 8.17 48,120 7.14 17,031 4.75 29,591 9.07 1,276 7.71 3,219 6.43 159,469 7.37 5,174.02 6.96 339.19 3.3635,000 40,000 44,385 6.02 39,171 5.81 20,130 5.62 26,906 8.25 1,140 6.89 2,284 4.56 134,016 6.20 5,016.79 6.75 434.07 4.3040,000 50,000 53,559 7.26 47,875 7.10 45,716 12.75 40,802 12.51 1,744 10.54 2,893 5.78 192,589 8.90 8,592.39 11.56 1,002.99 9.9350,000 60,000 27,036 3.67 23,341 3.46 46,605 13.00 25,448 7.80 997 6.03 1,389 2.77 124,816 5.77 6,823.39 9.18 978.61 9.6960,000 75,000 19,380 2.63 14,782 2.19 62,239 17.36 22,271 6.83 763 4.61 1,042 2.08 120,477 5.57 8,053.23 10.83 1,318.22 13.0575,000 100,000 11,291 1.53 7,614 1.13 61,185 17.07 15,965 4.90 559 3.38 642 1.28 97,256 4.50 8,323.30 11.19 1,644.13 16.28
100,000 150,000 4,848 0.66 2,578 0.38 40,869 11.40 9,668 2.96 299 1.81 229 0.46 58,491 2.70 6,949.74 9.35 1,689.92 16.73150,000 200,000 1,189 0.16 587 0.09 9,261 2.58 3,159 0.97 69 0.42 48 0.10 14,313 0.66 2,436.52 3.28 694.03 6.87200,000 275,000 548 0.07 240 0.04 4,090 1.14 1,933 0.59 53 0.32 21 0.04 6,885 0.32 1,591.68 2.14 490.01 4.85
Over 275,000 538 0.07 159 0.02 3,151 0.88 2,095 0.64 28 0.17 23 0.05 5,994 0.28 3,175.20 4.27 1,090.26 10.79
Totals 737,358 100 674,244 100 358,438 100 326,084 100 16,546 100 50,094 100 2,162,764 100 74,352.71 100 10,099.70 100
19
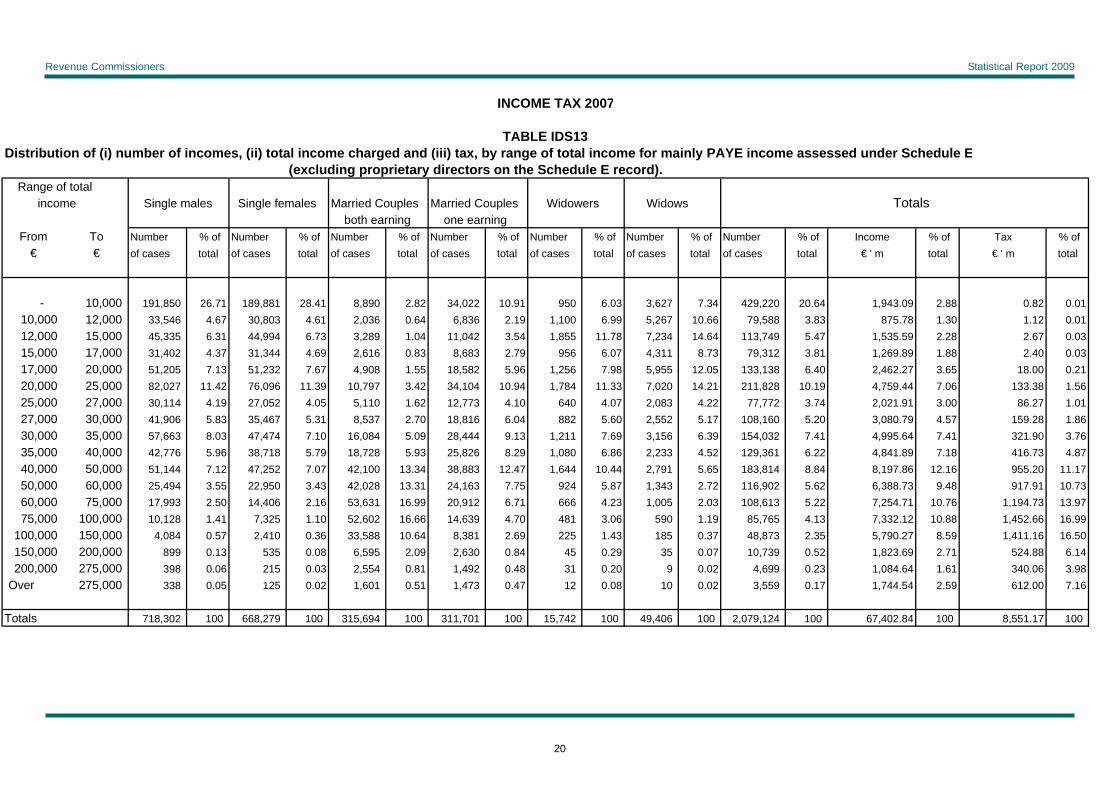
Revenue Commissioners Statistical Report 2009
INCOME TAX 2007
TABLE IDS13Distribution of (i) number of incomes, (ii) total income charged and (iii) tax, by range of total income for mainly PAYE income assessed under Schedule E
(excluding proprietary directors on the Schedule E record). Range of total income Single males Single females Married Couples Married Couples Widowers Widows Totals
both earning one earningFrom To Number % of Number % of Number % of Number % of Number % of Number % of Number % of Income % of Tax % of
€ € of cases total of cases total of cases total of cases total of cases total of cases total of cases total € ' m total € ' m total
- 10,000 191,850 26.71 189,881 28.41 8,890 2.82 34,022 10.91 950 6.03 3,627 7.34 429,220 20.64 1,943.09 2.88 0.82 0.0110,000 12,000 33,546 4.67 30,803 4.61 2,036 0.64 6,836 2.19 1,100 6.99 5,267 10.66 79,588 3.83 875.78 1.30 1.12 0.0112,000 15,000 45,335 6.31 44,994 6.73 3,289 1.04 11,042 3.54 1,855 11.78 7,234 14.64 113,749 5.47 1,535.59 2.28 2.67 0.0315,000 17,000 31,402 4.37 31,344 4.69 2,616 0.83 8,683 2.79 956 6.07 4,311 8.73 79,312 3.81 1,269.89 1.88 2.40 0.0317,000 20,000 51,205 7.13 51,232 7.67 4,908 1.55 18,582 5.96 1,256 7.98 5,955 12.05 133,138 6.40 2,462.27 3.65 18.00 0.2120,000 25,000 82,027 11.42 76,096 11.39 10,797 3.42 34,104 10.94 1,784 11.33 7,020 14.21 211,828 10.19 4,759.44 7.06 133.38 1.5625,000 27,000 30,114 4.19 27,052 4.05 5,110 1.62 12,773 4.10 640 4.07 2,083 4.22 77,772 3.74 2,021.91 3.00 86.27 1.0127,000 30,000 41,906 5.83 35,467 5.31 8,537 2.70 18,816 6.04 882 5.60 2,552 5.17 108,160 5.20 3,080.79 4.57 159.28 1.8630,000 35,000 57,663 8.03 47,474 7.10 16,084 5.09 28,444 9.13 1,211 7.69 3,156 6.39 154,032 7.41 4,995.64 7.41 321.90 3.7635,000 40,000 42,776 5.96 38,718 5.79 18,728 5.93 25,826 8.29 1,080 6.86 2,233 4.52 129,361 6.22 4,841.89 7.18 416.73 4.8740,000 50,000 51,144 7.12 47,252 7.07 42,100 13.34 38,883 12.47 1,644 10.44 2,791 5.65 183,814 8.84 8,197.86 12.16 955.20 11.1750,000 60,000 25,494 3.55 22,950 3.43 42,028 13.31 24,163 7.75 924 5.87 1,343 2.72 116,902 5.62 6,388.73 9.48 917.91 10.7360,000 75,000 17,993 2.50 14,406 2.16 53,631 16.99 20,912 6.71 666 4.23 1,005 2.03 108,613 5.22 7,254.71 10.76 1,194.73 13.9775,000 100,000 10,128 1.41 7,325 1.10 52,602 16.66 14,639 4.70 481 3.06 590 1.19 85,765 4.13 7,332.12 10.88 1,452.66 16.99
100,000 150,000 4,084 0.57 2,410 0.36 33,588 10.64 8,381 2.69 225 1.43 185 0.37 48,873 2.35 5,790.27 8.59 1,411.16 16.50150,000 200,000 899 0.13 535 0.08 6,595 2.09 2,630 0.84 45 0.29 35 0.07 10,739 0.52 1,823.69 2.71 524.88 6.14200,000 275,000 398 0.06 215 0.03 2,554 0.81 1,492 0.48 31 0.20 9 0.02 4,699 0.23 1,084.64 1.61 340.06 3.98
Over 275,000 338 0.05 125 0.02 1,601 0.51 1,473 0.47 12 0.08 10 0.02 3,559 0.17 1,744.54 2.59 612.00 7.16
Totals 718,302 100 668,279 100 315,694 100 311,701 100 15,742 100 49,406 100 2,079,124 100 67,402.84 100 8,551.17 100
20
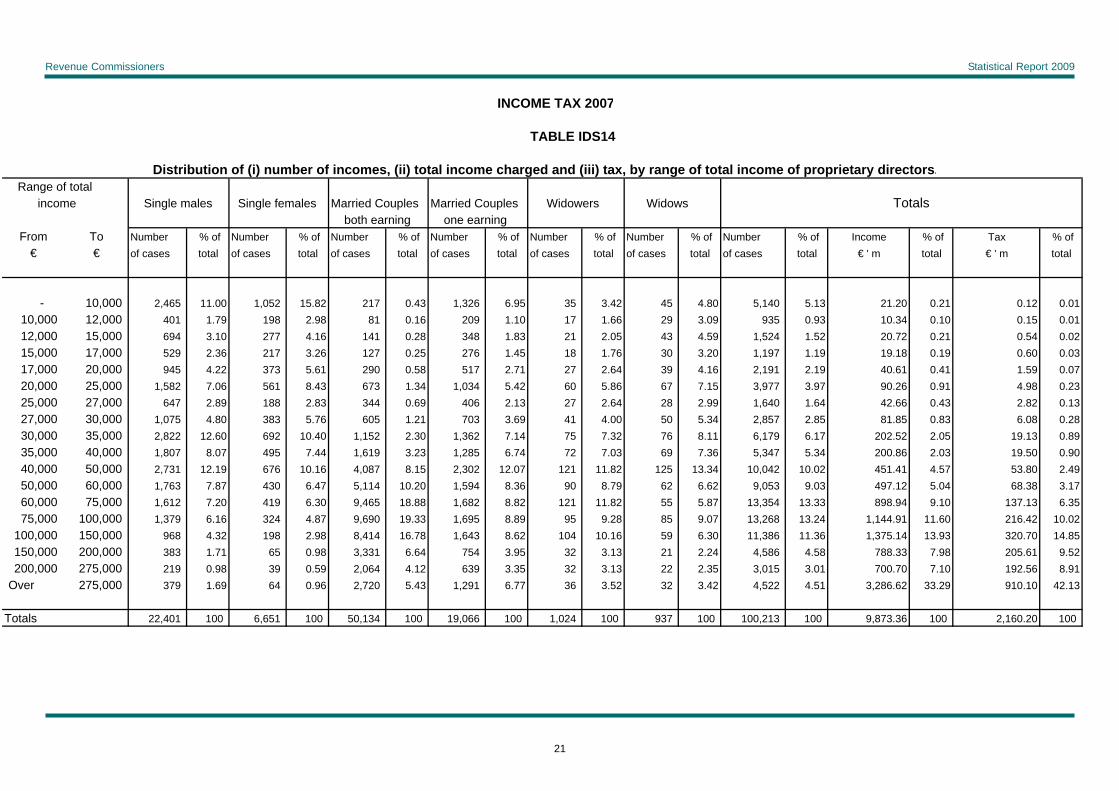
Revenue Commissioners Statistical Report 2009
INCOME TAX 2007
TABLE IDS14
Distribution of (i) number of incomes, (ii) total income charged and (iii) tax, by range of total income of proprietary directors. Range of total income Single males Single females Married Couples Married Couples Widowers Widows Totals
both earning one earningFrom To Number % of Number % of Number % of Number % of Number % of Number % of Number % of Income % of Tax % of
€ € of cases total of cases total of cases total of cases total of cases total of cases total of cases total € ' m total € ' m total
- 10,000 2,465 11.00 1,052 15.82 217 0.43 1,326 6.95 35 3.42 45 4.80 5,140 5.13 21.20 0.21 0.12 0.0110,000 12,000 401 1.79 198 2.98 81 0.16 209 1.10 17 1.66 29 3.09 935 0.93 10.34 0.10 0.15 0.0112,000 15,000 694 3.10 277 4.16 141 0.28 348 1.83 21 2.05 43 4.59 1,524 1.52 20.72 0.21 0.54 0.0215,000 17,000 529 2.36 217 3.26 127 0.25 276 1.45 18 1.76 30 3.20 1,197 1.19 19.18 0.19 0.60 0.0317,000 20,000 945 4.22 373 5.61 290 0.58 517 2.71 27 2.64 39 4.16 2,191 2.19 40.61 0.41 1.59 0.0720,000 25,000 1,582 7.06 561 8.43 673 1.34 1,034 5.42 60 5.86 67 7.15 3,977 3.97 90.26 0.91 4.98 0.2325,000 27,000 647 2.89 188 2.83 344 0.69 406 2.13 27 2.64 28 2.99 1,640 1.64 42.66 0.43 2.82 0.1327,000 30,000 1,075 4.80 383 5.76 605 1.21 703 3.69 41 4.00 50 5.34 2,857 2.85 81.85 0.83 6.08 0.2830,000 35,000 2,822 12.60 692 10.40 1,152 2.30 1,362 7.14 75 7.32 76 8.11 6,179 6.17 202.52 2.05 19.13 0.8935,000 40,000 1,807 8.07 495 7.44 1,619 3.23 1,285 6.74 72 7.03 69 7.36 5,347 5.34 200.86 2.03 19.50 0.9040,000 50,000 2,731 12.19 676 10.16 4,087 8.15 2,302 12.07 121 11.82 125 13.34 10,042 10.02 451.41 4.57 53.80 2.4950,000 60,000 1,763 7.87 430 6.47 5,114 10.20 1,594 8.36 90 8.79 62 6.62 9,053 9.03 497.12 5.04 68.38 3.1760,000 75,000 1,612 7.20 419 6.30 9,465 18.88 1,682 8.82 121 11.82 55 5.87 13,354 13.33 898.94 9.10 137.13 6.3575,000 100,000 1,379 6.16 324 4.87 9,690 19.33 1,695 8.89 95 9.28 85 9.07 13,268 13.24 1,144.91 11.60 216.42 10.02
100,000 150,000 968 4.32 198 2.98 8,414 16.78 1,643 8.62 104 10.16 59 6.30 11,386 11.36 1,375.14 13.93 320.70 14.85150,000 200,000 383 1.71 65 0.98 3,331 6.64 754 3.95 32 3.13 21 2.24 4,586 4.58 788.33 7.98 205.61 9.52200,000 275,000 219 0.98 39 0.59 2,064 4.12 639 3.35 32 3.13 22 2.35 3,015 3.01 700.70 7.10 192.56 8.91
Over 275,000 379 1.69 64 0.96 2,720 5.43 1,291 6.77 36 3.52 32 3.42 4,522 4.51 3,286.62 33.29 910.10 42.13
Totals 22,401 100 6,651 100 50,134 100 19,066 100 1,024 100 937 100 100,213 100 9,873.36 100 2,160.20 100
21
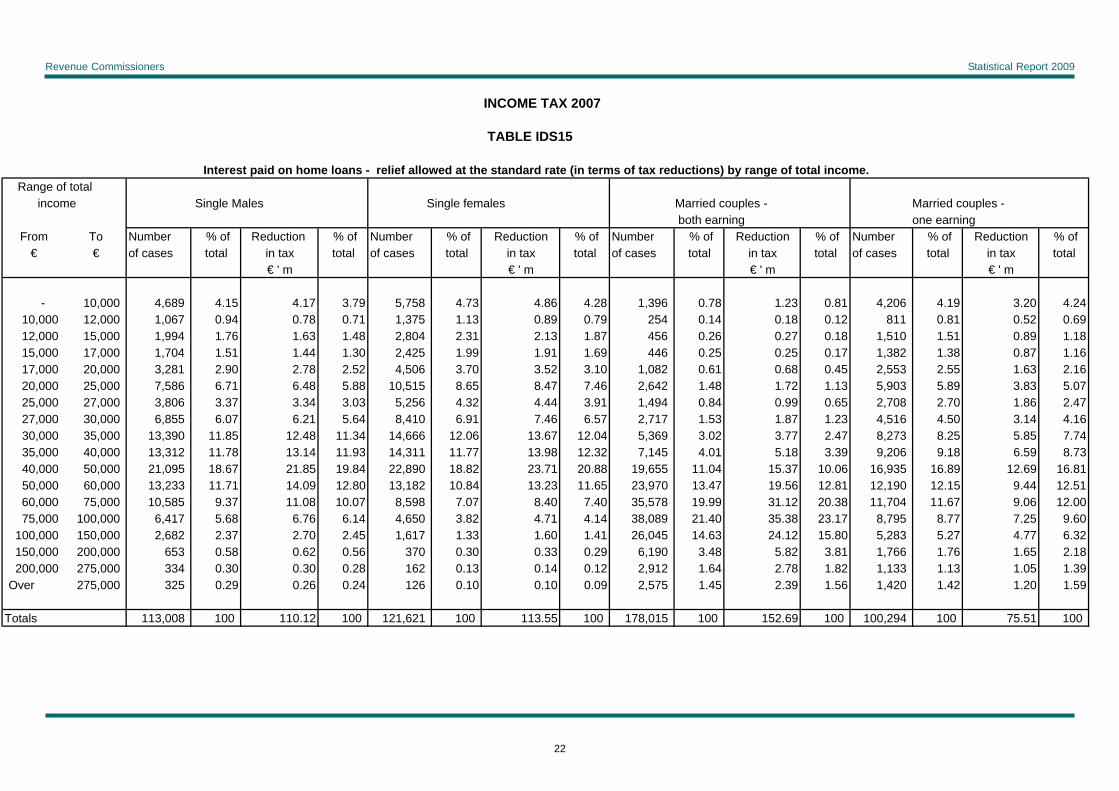
Revenue Commissioners Statistical Report 2009
INCOME TAX 2007
TABLE IDS15
Interest paid on home loans - relief allowed at the standard rate (in terms of tax reductions) by range of total income. Range of total income Single Males Single females Married couples - Married couples -
both earning one earningFrom To Number % of Reduction % of Number % of Reduction % of Number % of Reduction % of Number % of Reduction % of
€ € of cases total in tax total of cases total in tax total of cases total in tax total of cases total in tax total€ ' m € ' m € ' m € ' m
- 10,000 4,689 4.15 4.17 3.79 5,758 4.73 4.86 4.28 1,396 0.78 1.23 0.81 4,206 4.19 3.20 4.2410,000 12,000 1,067 0.94 0.78 0.71 1,375 1.13 0.89 0.79 254 0.14 0.18 0.12 811 0.81 0.52 0.6912,000 15,000 1,994 1.76 1.63 1.48 2,804 2.31 2.13 1.87 456 0.26 0.27 0.18 1,510 1.51 0.89 1.1815,000 17,000 1,704 1.51 1.44 1.30 2,425 1.99 1.91 1.69 446 0.25 0.25 0.17 1,382 1.38 0.87 1.1617,000 20,000 3,281 2.90 2.78 2.52 4,506 3.70 3.52 3.10 1,082 0.61 0.68 0.45 2,553 2.55 1.63 2.1620,000 25,000 7,586 6.71 6.48 5.88 10,515 8.65 8.47 7.46 2,642 1.48 1.72 1.13 5,903 5.89 3.83 5.0725,000 27,000 3,806 3.37 3.34 3.03 5,256 4.32 4.44 3.91 1,494 0.84 0.99 0.65 2,708 2.70 1.86 2.4727,000 30,000 6,855 6.07 6.21 5.64 8,410 6.91 7.46 6.57 2,717 1.53 1.87 1.23 4,516 4.50 3.14 4.1630,000 35,000 13,390 11.85 12.48 11.34 14,666 12.06 13.67 12.04 5,369 3.02 3.77 2.47 8,273 8.25 5.85 7.7435,000 40,000 13,312 11.78 13.14 11.93 14,311 11.77 13.98 12.32 7,145 4.01 5.18 3.39 9,206 9.18 6.59 8.7340,000 50,000 21,095 18.67 21.85 19.84 22,890 18.82 23.71 20.88 19,655 11.04 15.37 10.06 16,935 16.89 12.69 16.8150,000 60,000 13,233 11.71 14.09 12.80 13,182 10.84 13.23 11.65 23,970 13.47 19.56 12.81 12,190 12.15 9.44 12.5160,000 75,000 10,585 9.37 11.08 10.07 8,598 7.07 8.40 7.40 35,578 19.99 31.12 20.38 11,704 11.67 9.06 12.0075,000 100,000 6,417 5.68 6.76 6.14 4,650 3.82 4.71 4.14 38,089 21.40 35.38 23.17 8,795 8.77 7.25 9.60
100,000 150,000 2,682 2.37 2.70 2.45 1,617 1.33 1.60 1.41 26,045 14.63 24.12 15.80 5,283 5.27 4.77 6.32150,000 200,000 653 0.58 0.62 0.56 370 0.30 0.33 0.29 6,190 3.48 5.82 3.81 1,766 1.76 1.65 2.18200,000 275,000 334 0.30 0.30 0.28 162 0.13 0.14 0.12 2,912 1.64 2.78 1.82 1,133 1.13 1.05 1.39
Over 275,000 325 0.29 0.26 0.24 126 0.10 0.10 0.09 2,575 1.45 2.39 1.56 1,420 1.42 1.20 1.59
Totals 113,008 100 110.12 100 121,621 100 113.55 100 178,015 100 152.69 100 100,294 100 75.51 100
22
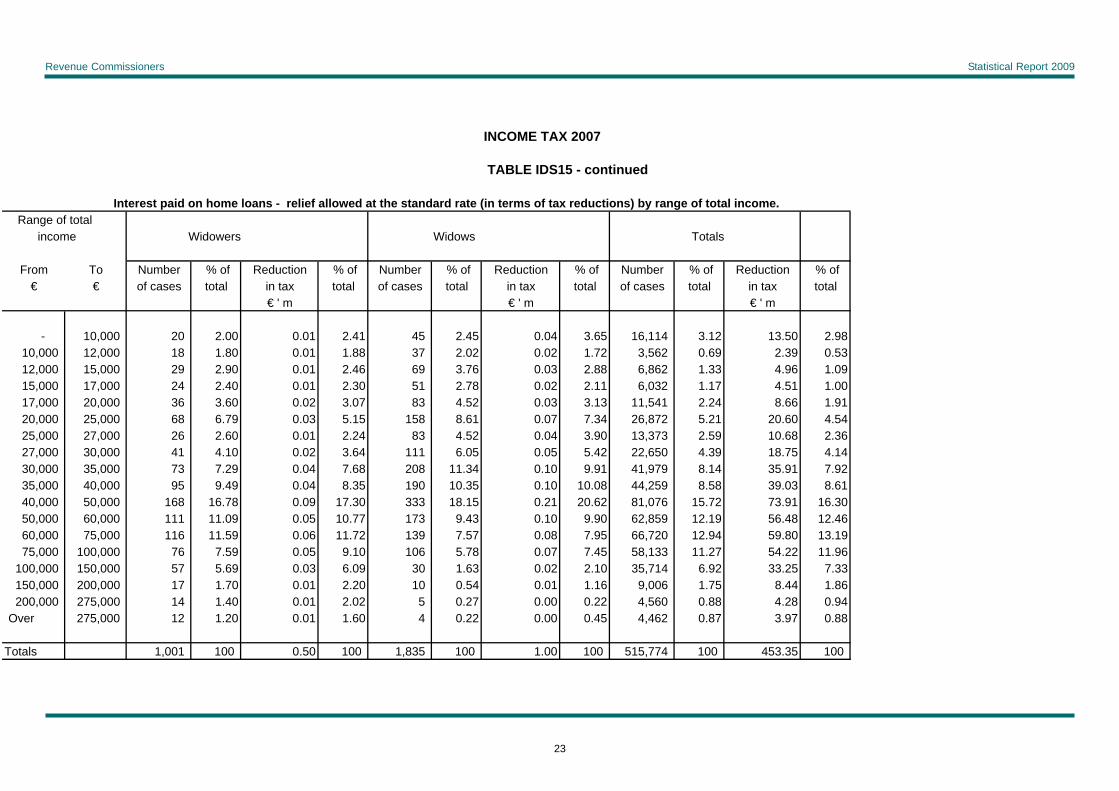
Revenue Commissioners Statistical Report 2009
Over 275,000 12 1.20 0.01 1.60 4 0.22 0.00 0.45 4,462 0.87 3.97 0.88
Totals 1,001 100 0.50 100 1,835 100 1.00 100 515,774 100 453.35 100
INCOME TAX 2007
TABLE IDS15 - continued
Interest paid on home loans - relief allowed at the standard rate (in terms of tax reductions) by range of total income. Range of total income Widowers Widows Totals
From To Number % of Reduction % of Number % of Reduction % of Number % of Reduction % of€ € of cases total in tax total of cases total in tax total of cases total in tax total
€ ' m € ' m € ' m
- 10,000 20 2.00 0.01 2.41 45 2.45 0.04 3.65 16,114 3.12 13.50 2.9810,000 12,000 18 1.80 0.01 1.88 37 2.02 0.02 1.72 3,562 0.69 2.39 0.5312,000 15,000 29 2.90 0.01 2.46 69 3.76 0.03 2.88 6,862 1.33 4.96 1.0915,000 17,000 24 2.40 0.01 2.30 51 2.78 0.02 2.11 6,032 1.17 4.51 1.0017,000 20,000 36 3.60 0.02 3.07 83 4.52 0.03 3.13 11,541 2.24 8.66 1.9120,000 25,000 68 6.79 0.03 5.15 158 8.61 0.07 7.34 26,872 5.21 20.60 4.5425,000 27,000 26 2.60 0.01 2.24 83 4.52 0.04 3.90 13,373 2.59 10.68 2.3627,000 30,000 41 4.10 0.02 3.64 111 6.05 0.05 5.42 22,650 4.39 18.75 4.1430,000 35,000 73 7.29 0.04 7.68 208 11.34 0.10 9.91 41,979 8.14 35.91 7.9235,000 40,000 95 9.49 0.04 8.35 190 10.35 0.10 10.08 44,259 8.58 39.03 8.6140,000 50,000 168 16.78 0.09 17.30 333 18.15 0.21 20.62 81,076 15.72 73.91 16.3050,000 60,000 111 11.09 0.05 10.77 173 9.43 0.10 9.90 62,859 12.19 56.48 12.4660,000 75,000 116 11.59 0.06 11.72 139 7.57 0.08 7.95 66,720 12.94 59.80 13.1975,000 100,000 76 7.59 0.05 9.10 106 5.78 0.07 7.45 58,133 11.27 54.22 11.96
100,000 150,000 57 5.69 0.03 6.09 30 1.63 0.02 2.10 35,714 6.92 33.25 7.33150,000 200,000 17 1.70 0.01 2.20 10 0.54 0.01 1.16 9,006 1.75 8.44 1.86200,000 275,000 14 1.40 0.01 2.02 5 0.27 0.00 0.22 4,560 0.88 4.28 0.94
23
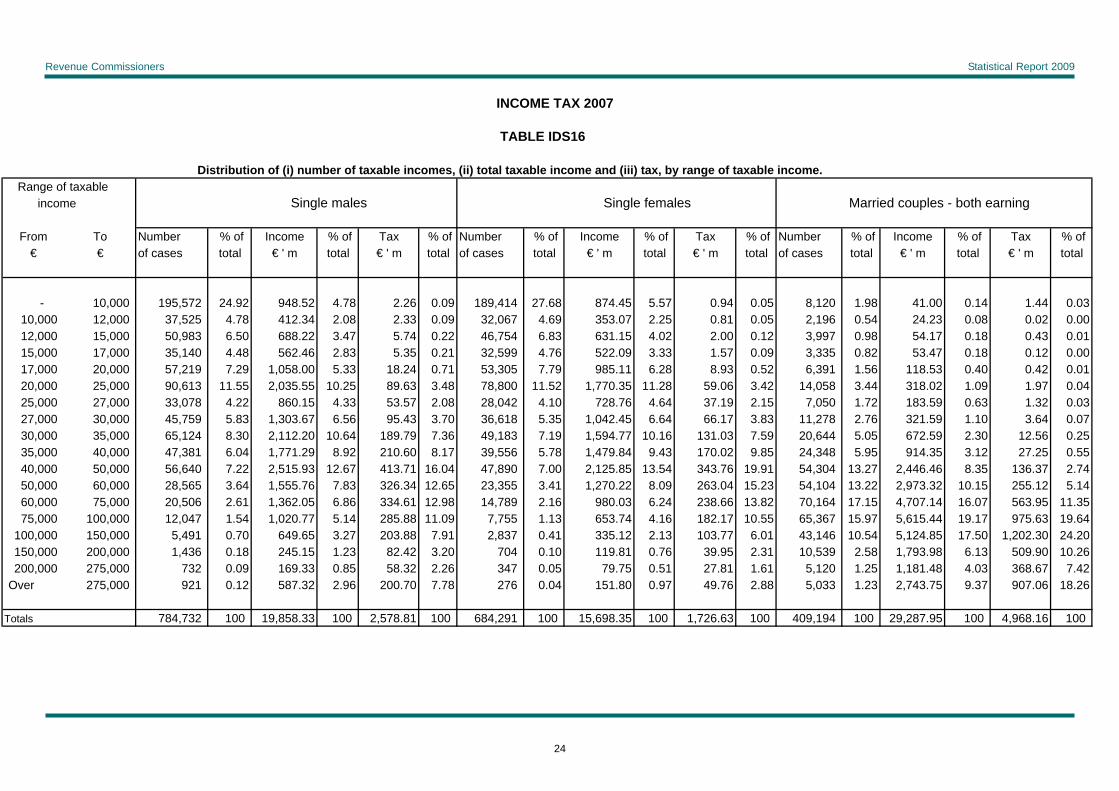
Revenue Commissioners Statistical Report 2009
From To Number % of Income % of Tax % of Number % of Income % of Tax % of Number % of Income % of Tax % of
- 10,000 195,572 24.92 948.52 4.78 2.26 0.09 189,414 27.68 874.45 5.57 0.94 0.05 8,120 1.98 41.00 0.14 1.44 0.03
INCOME TAX 2007
TABLE IDS16
Distribution of (i) number of taxable incomes, (ii) total taxable income and (iii) tax, by range of taxable income. Range of taxable income Single males Single females Married couples - both earning
€ € of cases total € ' m total € ' m total of cases total € ' m total € ' m total of cases total € ' m total € ' m total
10,000 12,000 37,525 4.78 412.34 2.08 2.33 0.09 32,067 4.69 353.07 2.25 0.81 0.05 2,196 0.54 24.23 0.08 0.02 0.0012,000 15,000
15,000 17,000
50,983 35,140
6.504.48
688.22562.46
3.472.83
5.745.35
0.220.21
46,754 32,599
6.834.76
631.15522.09
4.023.33
2.001.57
0.120.09
3,997 3,335
0.980.82
54.1753.47
0.180.18
0.430.12
0.010.00
17,000 20,000 57,219 7.29 1,058.00 5.33 18.24 0.71 53,305 7.79 985.11 6.28 8.93 0.52 6,391 1.56 118.53 0.40 0.42 0.0120,000 25,000 90,613 11.55 2,035.55 10.25 89.63 3.48 78,800 11.52 1,770.35 11.28 59.06 3.42 14,058 3.44 318.02 1.09 1.97 0.0425,000 27,000 33,078 4.22 860.15 4.33 53.57 2.08 28,042 4.10 728.76 4.64 37.19 2.15 7,050 1.72 183.59 0.63 1.32 0.0327,000 30,000 45,759 5.83 1,303.67 6.56 95.43 3.70 36,618 5.35 1,042.45 6.64 66.17 3.83 11,278 2.76 321.59 1.10 3.64 0.0730,000 35,000 65,124 8.30 2,112.20 10.64 189.79 7.36 49,183 7.19 1,594.77 10.16 131.03 7.59 20,644 5.05 672.59 2.30 12.56 0.2535,000 40,000 47,381 6.04 1,771.29 8.92 210.60 8.17 39,556 5.78 1,479.84 9.43 170.02 9.85 24,348 5.95 914.35 3.12 27.25 0.5540,000 50,000 56,640 7.22 2,515.93 12.67 413.71 16.04 47,890 7.00 2,125.85 13.54 343.76 19.91 54,304 13.27 2,446.46 8.35 136.37 2.7450,000 60,000
60,000 75,000
28,565 20,506
3.642.61
1,555.761,362.05
7.836.86
326.34334.61
12.6512.98
23,355 14,789
3.412.16
1,270.22980.03
8.096.24
263.04238.66
15.2313.82
54,104 70,164
13.2217.15
2,973.324,707.14
10.1516.07
255.12563.95
5.1411.35
75,000 100,000 12,047 1.54 1,020.77 5.14 285.88 11.09 7,755 1.13 653.74 4.16 182.17 10.55 65,367 15.97 5,615.44 19.17 975.63 19.64100,000 150,000 5,491 0.70 649.65 3.27 203.88 7.91 2,837 0.41 335.12 2.13 103.77 6.01 43,146 10.54 5,124.85 17.50 1,202.30 24.20150,000 200,000 1,436 0.18 245.15 1.23 82.42 3.20 704 0.10 119.81 0.76 39.95 2.31 10,539 2.58 1,793.98 6.13 509.90 10.26200,000 275,000 732 0.09 169.33 0.85 58.32 2.26 347 0.05 79.75 0.51 27.81 1.61 5,120 1.25 1,181.48 4.03 368.67 7.42
Over 275,000 921 0.12 587.32 2.96 200.70 7.78 276 0.04 151.80 0.97 49.76 2.88 5,033 1.23 2,743.75 9.37 907.06 18.26
Totals 784,732 100 19,858.33 100 2,578.81 100 684,291 100 15,698.35 100 1,726.63 100 409,194 100 29,287.95 100 4,968.16 100
24
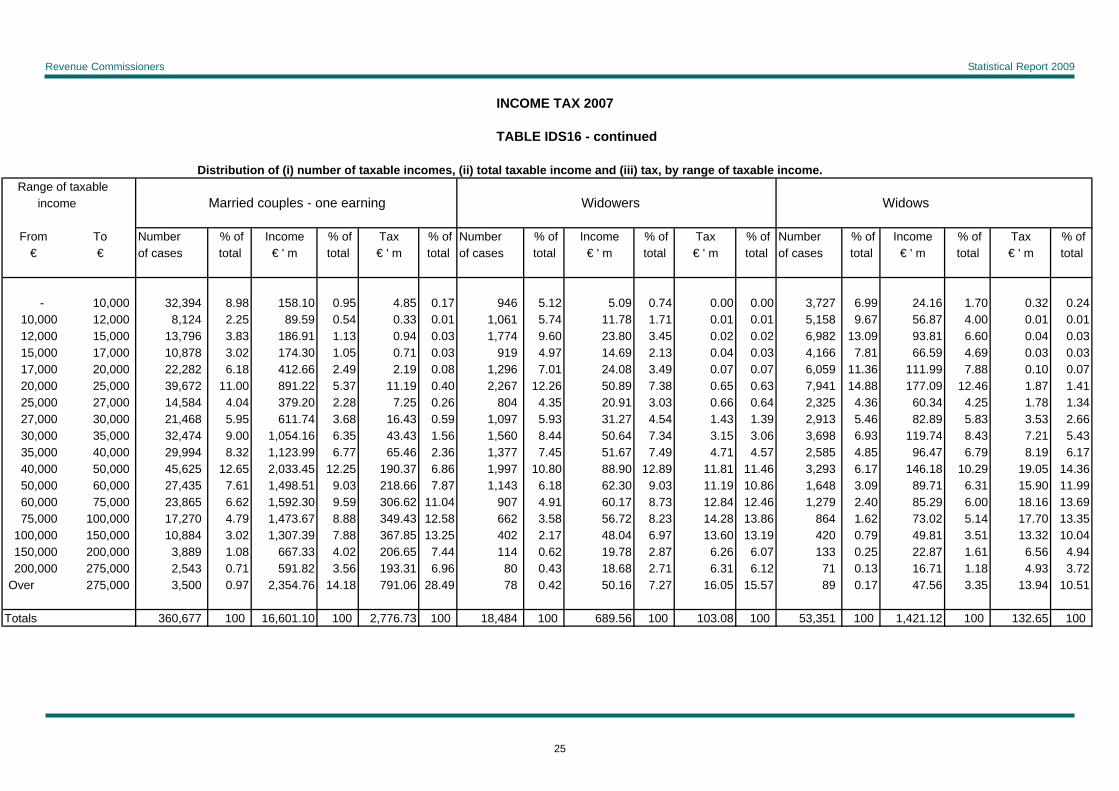
Revenue Commissioners Statistical Report 2009
INCOME TAX 2007
TABLE IDS16 - continued
Distribution of (i) number of taxable incomes, (ii) total taxable income and (iii) tax, by range of taxable income. Range of taxable income Married couples - one earning Widowers Widows
From To Number % of Income % of Tax % of Number % of Income % of Tax % of Number % of Income % of Tax % of€ € of cases total € ' m total € ' m total of cases total € ' m total € ' m total of cases total € ' m total € ' m total
- 10,000 3 2,394 8.98 158.10 0.95 4.85 0.17 946 5.12 5.09 0.74 0.00 0.00 3,727 6.99 24.16 1.70 0.32 0.2410,000 12,000 8,124 2.25 89.59 0.54 0.33 0.01 1,061 5.74 11.78 1.71 0.01 0.01 5,158 9.67 56.87 4.00 0.01 0.0112,000 15,000 1 3,796 3.83 186.91 1.13 0.94 0.03 1,774 9.60 23.80 3.45 0.02 0.02 6,982 13.09 93.81 6.60 0.04 0.0315,000 17,000 1 0,878 3.02 174.30 1.05 0.71 0.03 919 4.97 14.69 2.13 0.04 0.03 4,166 7.81 66.59 4.69 0.03 0.0317,000 20,000 2 2,282 6.18 412.66 2.49 2.19 0.08 1,296 7.01 24.08 3.49 0.07 0.07 6,059 11.36 111.99 7.88 0.10 0.0720,000 25,000 3 9,672 11.00 891.22 5.37 11.19 0.40 2,267 12.26 50.89 7.38 0.65 0.63 7,941 14.88 177.09 12.46 1.87 1.4125,000 27,000 1 4,584 4.04 379.20 2.28 7.25 0.26 804 4.35 20.91 3.03 0.66 0.64 2,325 4.36 60.34 4.25 1.78 1.3427,000 30,000 2 1,468 5.95 611.74 3.68 16.43 0.59 1,097 5.93 31.27 4.54 1.43 1.39 2,913 5.46 82.89 5.83 3.53 2.6630,000 35,000 3 2,474 9.00 1,054.16 6.35 43.43 1.56 1,560 8.44 50.64 7.34 3.15 3.06 3,698 6.93 119.74 8.43 7.21 5.4335,000 40,000 2 9,994 8.32 1,123.99 6.77 65.46 2.36 1,377 7.45 51.67 7.49 4.71 4.57 2,585 4.85 96.47 6.79 8.19 6.1740,000 50,000 4 5,625 12.65 2,033.45 12.25 190.37 6.86 1,997 10.80 88.90 12.89 11.81 11.46 3,293 6.17 146.18 10.29 19.05 14.3650,000 60,000 2 7,435 7.61 1,498.51 9.03 218.66 7.87 1,143 6.18 62.30 9.03 11.19 10.86 1,648 3.09 89.71 6.31 15.90 11.9960,000 75,000 2 3,865 6.62 1,592.30 9.59 306.62 11.04 907 4.91 60.17 8.73 12.84 12.46 1,279 2.40 85.29 6.00 18.16 13.6975,000 100,000 1 7,270 4.79 1,473.67 8.88 349.43 12.58 662 3.58 56.72 8.23 14.28 13.86 864 1.62 73.02 5.14 17.70 13.35
100,000 150,000 10,884 3.02 1,307.39 7.88 367.85 13.25 402 2.17 48.04 6.97 13.60 13.19 420 0.79 49.81 3.51 13.32 10.04150,000 200,000 3,889 1.08 667.33 4.02 206.65 7.44 114 0.62 19.78 2.87 6.26 6.07 133 0.25 22.87 1.61 6.56 4.94200,000 275,000 2,543 0.71 591.82 3.56 193.31 6.96 80 0.43 18.68 2.71 6.31 6.12 71 0.13 16.71 1.18 4.93 3.72
Over 275,000 3,500 0.97 2,354.76 14.18 791.06 28.49 78 0.42 50.16 7.27 16.05 15.57 89 0.17 47.56 3.35 13.94 10.51
Totals 360,677 100 16,601.10 100 2,776.73 100 18,484 100 689.56 100 103.08 100 53,351 100 1,421.12 100 132.65 100
25
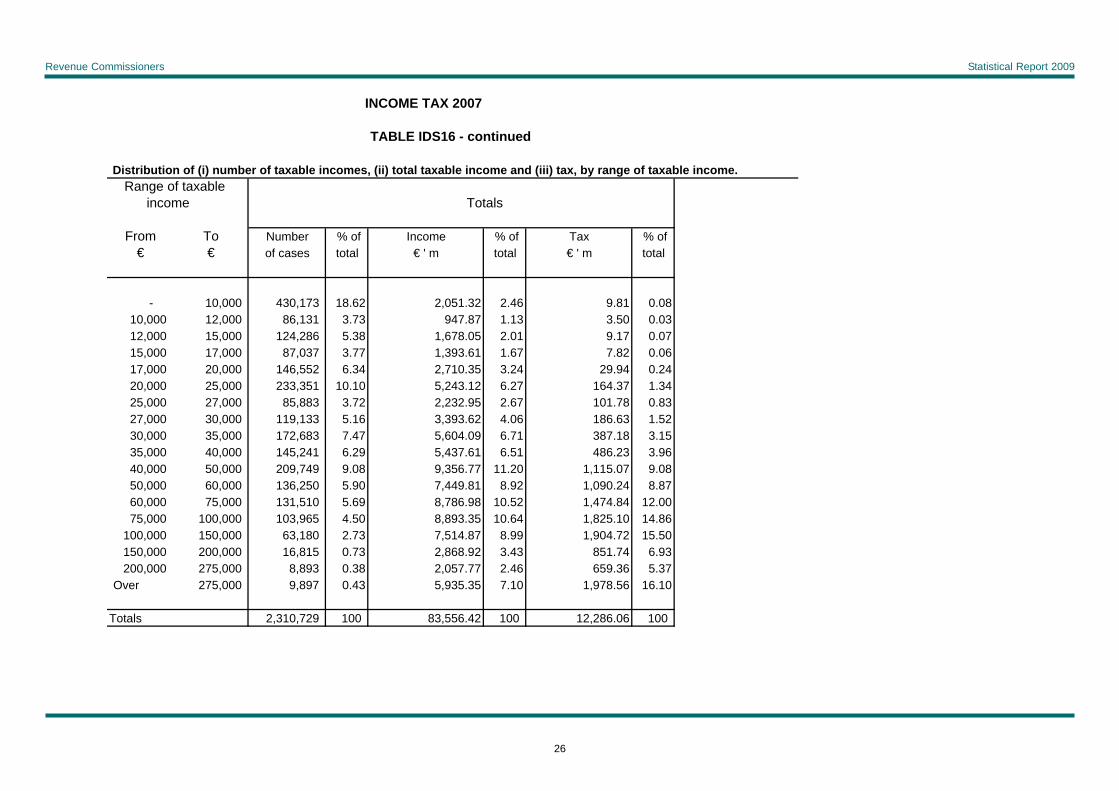
Revenue Commissioners Statistical Report 2009
INCOME TAX 2007
TABLE IDS16 - continued
Distribution of (i) number of taxable incomes, (ii) total taxable income and (iii) tax, by range of taxable income. Range of taxable income Totals
From To Number % of Income % of Tax % of€ € of cases total € ' m total € ' m total
- 10,000 430,173 18.62 2,051.32 2.46 9.81 0.0810,000 12,000 86,131 3.73 947.87 1.13 3.50 0.0312,000 15,000 124,286 5.38 1,678.05 2.01 9.17 0.0715,000 17,000 87,037 3.77 1,393.61 1.67 7.82 0.0617,000 20,000 146,552 6.34 2,710.35 3.24 29.94 0.2420,000 25,000 233,351 10.10 5,243.12 6.27 164.37 1.3425,000 27,000 85,883 3.72 2,232.95 2.67 101.78 0.8327,000 30,000 119,133 5.16 3,393.62 4.06 186.63 1.5230,000 35,000 172,683 7.47 5,604.09 6.71 387.18 3.1535,000 40,000 145,241 6.29 5,437.61 6.51 486.23 3.9640,000 50,000 209,749 9.08 9,356.77 11.20 1,115.07 9.0850,000 60,000 136,250 5.90 7,449.81 8.92 1,090.24 8.8760,000 75,000 131,510 5.69 8,786.98 10.52 1,474.84 12.0075,000 100,000 103,965 4.50 8,893.35 10.64 1,825.10 14.86
100,000 150,000 63,180 2.73 7,514.87 8.99 1,904.72 15.50150,000 200,000 16,815 0.73 2,868.92 3.43 851.74 6.93200,000 275,000 8,893 0.38 2,057.77 2.46 659.36 5.37
Over 275,000 9,897 0.43 5,935.35 7.10 1,978.56 16.10
Totals 2,310,729 100 83,556.42 100 12,286.06 100
26

Revenue Commissioners Statistical Report 2009
INCOME TAX 2007
TABLE IDS17
Distribution of (i) number of income earners, (ii) total taxable income and (iii) tax, by tax band. Income Tax Rates Single males Single females Married couples - both earning
Number % of Income % of Tax % of Number % of Income % of Tax % of Number % of Income % of Tax % ofof cases total € ' m total € ' m total of cases total € ' m total € ' m total of cases total € ' m total € ' m total
Exempt 345,265 43.12 2,941.10 14.81 14.45 0.56 349,907 50.56 3,264. 00 20.79 5.74 0.33 79,286 18.99 1,861.47 6.36 5 2.72 1.06Marginal Relief 1,454 0.18 32.84 0.17 1.57 0.06 929 0.13 20. 77 0.13 0.73 0.04 5,283 1.27 262.61 0.90 1 9.38 0.39
20% 348,732 43.56 9,706.63 48.88 788.87 30.59 263,798 38.11 7,570. 57 48.23 594.05 34.41 208,505 49.94 11,379.12 38.85 1,03 7.55 20.8841% 105,192 13.14 7,177.75 36.14 1773.92 68.79 77,493 11.20 4,843. 01 30.85 1,126.11 65.22 124,418 29.80 15,784.75 53.90 3,85 8.51 77.66
Totals 800,643 100 19,858.33 100 2,578.81 100 692,127 100 15,698.35 100 1,726.63 100 417,492 1 00 29,287.95 100 4,968.16 100
INCOME TAX 2007
TABLE IDS17 - continued
Distribution of (i) number of income earners, (ii) total taxable income and (iii) tax, by tax band. Income Tax Rates Married couples - one earning Widowers Widows
Number % of Income % of Tax % of Number % of Income % of Tax % of Number % of Income % of Tax % ofof cases total € ' m total € ' m total of cases total € ' m total € ' m total of cases total € ' m total € ' m total
Exempt 169,804 44.78 2,812.30 16.94 39.43 1.42 7,852 39.83 99.14 14.38 0.66 0.64 32,660 58.03 439.70 30.94 0.99 0.75Marginal Relief 12,127 3.20 623.87 3.76 62.97 2.27 390 1.98 8.91 1.29 0.26 0.25 864 1.54 20.24 1.42 0.58 0.44
20% 129,768 34.22 4,976.29 29.98 425.43 15.32 7,211 36.58 227.51 32.99 15.97 15.49 16,890 30.01 516.36 36.33 31.58 23.8141% 67,490 17.80 8,188.64 49.33 2,248.91 80.99 4,260 21.61 354.01 51.34 86.19 83.62 5,870 10.43 444.83 31.30 99.49 75.01
Totals 379,189 100 16,601.10 100 2,776.73 100 19,713 100 689.56 100 103.08 100 56,284 100 1,421.12 100 132.65 100
27
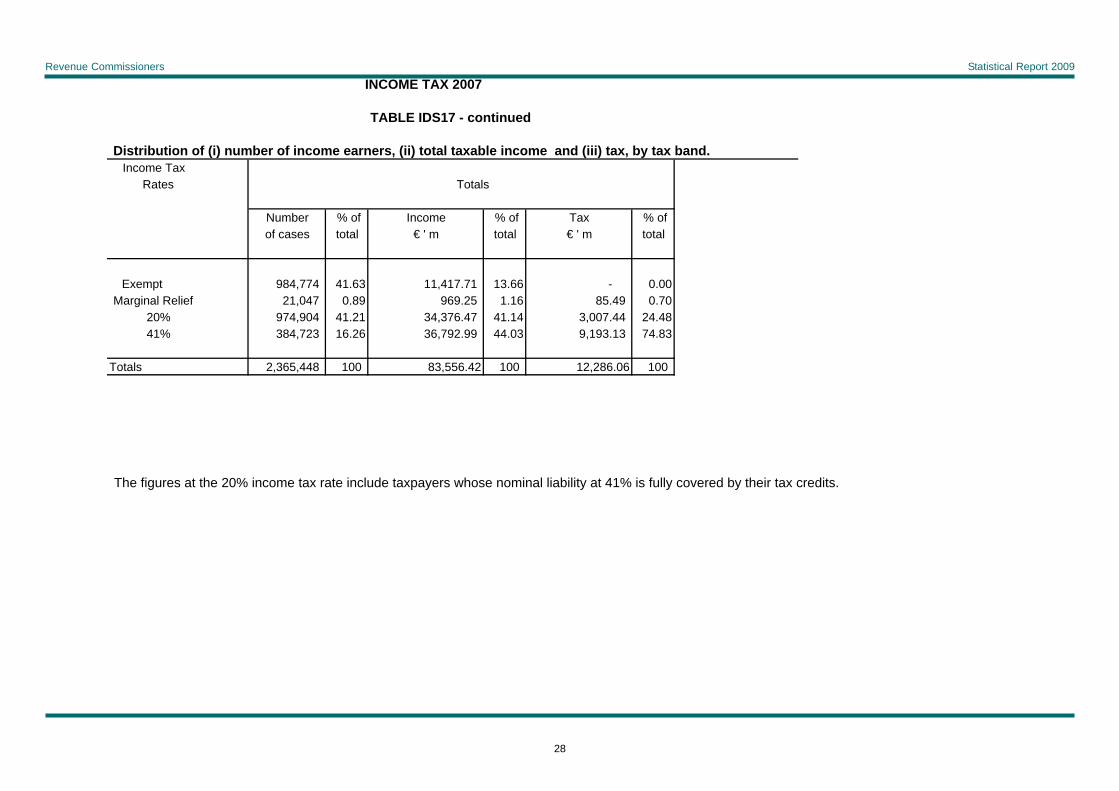
Revenue Commissioners Statistical Report 2009
INCOME TAX 2007
TABLE IDS17 - continued
Distribution of (i) number of income earners, (ii) total taxable income and (iii) tax, by tax band. Income Tax Rates Totals
Number % of Income % of Tax % ofof cases total € ' m total € ' m total
Exempt 984,774 41.63 11,417.71 13.66 - 0.00Marginal Relief 21,047 0.89 969.25 1.16 85.49 0.70
20% 974,904 41.21 34,376.47 41.14 3,007.44 24.4841% 384,723 16.26 36,792.99 44.03 9,193.13 74.83
Totals 2,365,448 100 83,556.42 100 12,286.06 100
The figures at the 20% income tax rate include taxpayers whose nominal liability at 41% is fully covered by their tax credits.
28
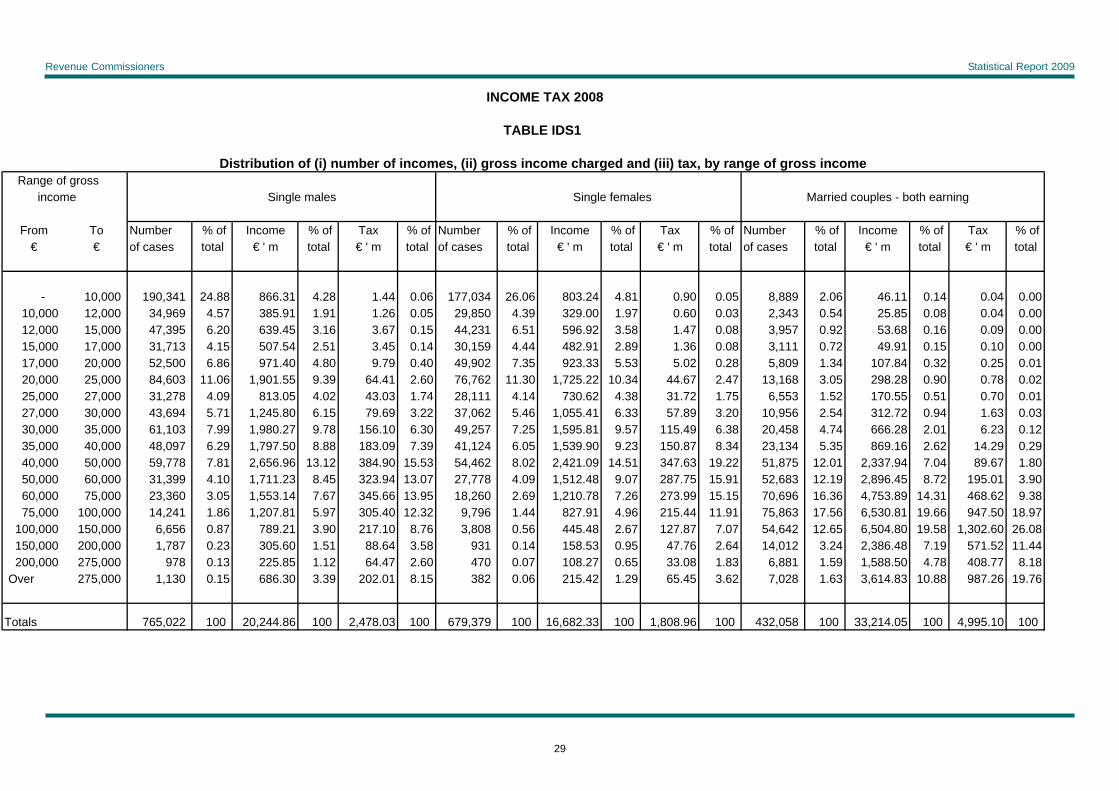
Revenue Commissioners Statistical Report 2009
INCOME TAX 2008
TABLE IDS1
Distribution of (i) number of incomes, (ii) gross income charged and (iii) tax, by range of gross income. Range of gross income Single males Single females Married couples - both earning
From To Number % of Income % of Tax % of Number % of Income % of Tax % of Number % of Income % of Tax % of€ € of cases total € ' m total € ' m total of cases total € ' m total € ' m total of cases total € ' m total € ' m total
- 10,000 190,341 24.88 866.31 4.28 1.44 0.06 177,034 26.06 803.24 4.81 0.90 0.05 8,889 2.06 46.11 0.14 0.04 0.0010,000 12,000 34,969 4.57 385.91 1.91 1.26 0.05 29,850 4.39 329.00 1.97 0.60 0.03 2,343 0.54 25.85 0.08 0.04 0.0012,000 15,000 47,395 6.20 639.45 3.16 3.67 0.15 44,231 6.51 596.92 3.58 1.47 0.08 3,957 0.92 53.68 0.16 0.09 0.0015,000 17,000 31,713 4.15 507.54 2.51 3.45 0.14 30,159 4.44 482.91 2.89 1.36 0.08 3,111 0.72 49.91 0.15 0.10 0.0017,000 20,000 52,500 6.86 971.40 4.80 9.79 0.40 49,902 7.35 923.33 5.53 5.02 0.28 5,809 1.34 107.84 0.32 0.25 0.0120,000 25,000 84,603 11.06 1,901.55 9.39 64.41 2.60 76,762 11.30 1,725.22 10.34 44.67 2.47 13,168 3.05 298.28 0.90 0.78 0.0225,000 27,000 31,278 4.09 813.05 4.02 43.03 1.74 28,111 4.14 730.62 4.38 31.72 1.75 6,553 1.52 170.55 0.51 0.70 0.0127,000 30,000 43,694 5.71 1,245.80 6.15 79.69 3.22 37,062 5.46 1,055.41 6.33 57.89 3.20 10,956 2.54 312.72 0.94 1.63 0.0330,000 35,000 61,103 7.99 1,980.27 9.78 156.10 6.30 49,257 7.25 1,595.81 9.57 115.49 6.38 20,458 4.74 666.28 2.01 6.23 0.1235,000 40,000 48,097 6.29 1,797.50 8.88 183.09 7.39 41,124 6.05 1,539.90 9.23 150.87 8.34 23,134 5.35 869.16 2.62 14.29 0.2940,000 50,000 59,778 7.81 2,656.96 13.12 384.90 15.53 54,462 8.02 2,421.09 14.51 347.63 19.22 51,875 12.01 2,337.94 7.04 89.67 1.8050,000 60,000 31,399 4.10 1,711.23 8.45 323.94 13.07 27,778 4.09 1,512.48 9.07 287.75 15.91 52,683 12.19 2,896.45 8.72 195.01 3.9060,000 75,000 23,360 3.05 1,553.14 7.67 345.66 13.95 18,260 2.69 1,210.78 7.26 273.99 15.15 70,696 16.36 4,753.89 14.31 468.62 9.3875,000 100,000 14,241 1.86 1,207.81 5.97 305.40 12.32 9,796 1.44 827.91 4.96 215.44 11.91 75,863 17.56 6,530.81 19.66 947.50 18.97
100,000 150,000 6,656 0.87 789.21 3.90 217.10 8.76 3,808 0.56 445.48 2.67 127.87 7.07 54,642 12.65 6,504.80 19.58 1,302.60 26.08150,000 200,000 1,787 0.23 305.60 1.51 88.64 3.58 931 0.14 158.53 0.95 47.76 2.64 14,012 3.24 2,386.48 7.19 571.52 11.44200,000 275,000 978 0.13 225.85 1.12 64.47 2.60 470 0.07 108.27 0.65 33.08 1.83 6,881 1.59 1,588.50 4.78 408.77 8.18
Over 275,000 1,130 0.15 686.30 3.39 202.01 8.15 382 0.06 215.42 1.29 65.45 3.62 7,028 1.63 3,614.83 10.88 987.26 19.76
Totals 765,022 100 20,244.86 100 2,478.03 100 679,379 100 16,682.33 100 1,808.96 100 432,058 100 33,214.05 100 4,995.10 100
29

Revenue Commissioners Statistical Report 2009
INCOME TAX 2008
TABLE IDS1 - continued
Distribution of (i) number of incomes, (ii) gross income charged and (iii) tax, by range of gross income. Range of gross income Married couples - one earning Widowers Widows
From To Number % of Income % of Tax % of Number % of Income % of Tax % of Number % of Income % of Tax % of€ € of cases total € ' m total € ' m total of cases total € ' m total € ' m total of cases total € ' m total € ' m total
- 10,000 39,896 10.51 173.16 0.95 0.83 0.03 976 4.84 4.68 0.58 0.01 0.01 3,143 5.51 17.32 1.06 0.02 0.0210,000 12,000 8,285 2.18 91.55 0.50 0.32 0.01 801 3.98 8.97 1.11 0.00 0.00 4,254 7.45 47.35 2.88 0.01 0.0112,000 15,000 13,185 3.47 178.53 0.98 0.68 0.03 1,984 9.85 26.76 3.31 0.01 0.01 7,744 13.57 104.14 6.34 0.03 0.0215,000 17,000 10,075 2.65 161.43 0.88 0.55 0.02 1,102 5.47 17.60 2.18 0.01 0.01 4,477 7.84 71.63 4.36 0.02 0.0217,000 20,000 19,528 5.15 362.87 1.99 1.33 0.05 1,381 6.85 25.53 3.16 0.02 0.02 6,336 11.10 117.14 7.13 0.04 0.0320,000 25,000 38,854 10.24 874.66 4.79 7.16 0.26 2,299 11.41 51.55 6.38 0.29 0.27 8,401 14.72 187.92 11.45 0.87 0.6225,000 27,000 14,812 3.90 385.04 2.11 5.27 0.19 838 4.16 21.76 2.69 0.43 0.40 2,628 4.60 68.30 4.16 1.34 0.9627,000 30,000 21,164 5.58 603.54 3.31 11.47 0.42 1,168 5.80 33.28 4.12 1.07 0.99 3,141 5.50 89.39 5.44 2.79 2.0030,000 35,000 32,605 8.59 1,058.31 5.80 30.42 1.12 1,605 7.97 51.99 6.43 2.46 2.29 4,031 7.06 130.43 7.94 6.12 4.3835,000 40,000 29,865 7.87 1,118.95 6.13 49.09 1.81 1,473 7.31 55.14 6.82 3.83 3.57 3,002 5.26 112.06 6.82 7.47 5.3440,000 50,000 46,750 12.32 2,088.71 11.45 152.87 5.63 2,187 10.86 97.59 12.08 10.76 10.02 3,932 6.89 175.37 10.68 18.58 13.3050,000 60,000 30,949 8.15 1,691.18 9.27 201.50 7.42 1,403 6.96 76.49 9.46 11.30 10.52 2,063 3.61 112.43 6.85 16.33 11.6960,000 75,000 27,499 7.25 1,835.78 10.06 301.47 11.10 1,151 5.71 76.45 9.46 13.75 12.80 1,682 2.95 112.31 6.84 19.85 14.2175,000 100,000 20,802 5.48 1,776.04 9.73 366.48 13.50 837 4.15 72.09 8.92 15.28 14.22 1,222 2.14 104.04 6.34 21.44 15.35
100,000 150,000 13,152 3.47 1,575.79 8.64 385.33 14.19 536 2.66 63.96 7.91 15.25 14.20 605 1.06 72.19 4.40 15.81 11.32150,000 200,000 4,596 1.21 787.83 4.32 214.20 7.89 156 0.77 26.69 3.30 6.90 6.42 178 0.31 30.59 1.86 6.95 4.97200,000 275,000 3,115 0.82 726.42 3.98 204.25 7.52 131 0.65 30.15 3.73 7.59 7.07 120 0.21 28.20 1.72 6.53 4.67
Over 275,000 4,409 1.16 2,755.50 15.10 781.96 28.80 119 0.59 67.45 8.35 18.43 17.16 117 0.20 61.08 3.72 15.50 11.10
Totals 379,541 100 18,245.28 100 2,715.17 100 20,147 100 808.12 100 107.41 100 57,076 100 1,641.89 100 139.70 100
30
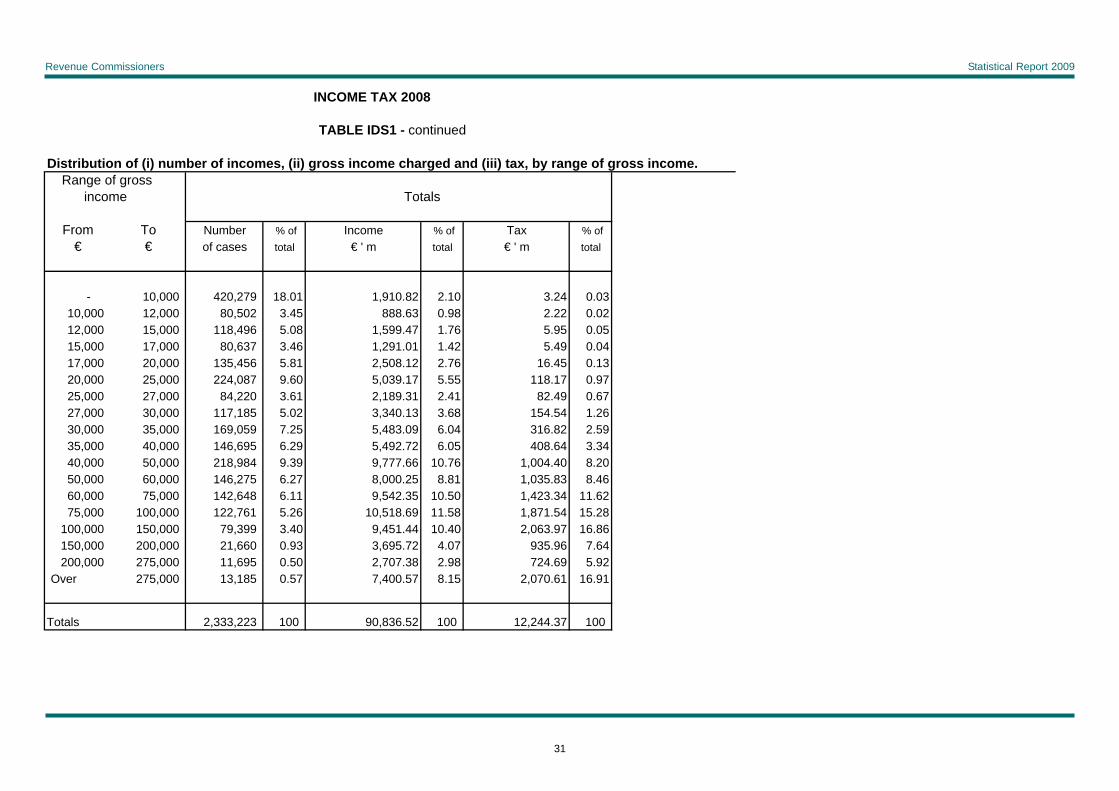
Revenue Commissioners Statistical Report 2009
INCOME TAX 2008
TABLE IDS1 - continued
Distribution of (i) number of incomes, (ii) gross income charged and (iii) tax, by range of gross income. Range of gross income Totals
From To Number % of Income % of Tax % of€ € of cases total € ' m total € ' m total
- 10,000 420,279 18.01 1,910.82 2.10 3.24 0.0310,000 12,000 80,502 3.45 888.63 0.98 2.22 0.0212,000 15,000 118,496 5.08 1,599.47 1.76 5.95 0.0515,000 17,000 80,637 3.46 1,291.01 1.42 5.49 0.0417,000 20,000 135,456 5.81 2,508.12 2.76 16.45 0.1320,000 25,000 224,087 9.60 5,039.17 5.55 118.17 0.9725,000 27,000 84,220 3.61 2,189.31 2.41 82.49 0.6727,000 30,000 117,185 5.02 3,340.13 3.68 154.54 1.2630,000 35,000 169,059 7.25 5,483.09 6.04 316.82 2.5935,000 40,000 146,695 6.29 5,492.72 6.05 408.64 3.3440,000 50,000 218,984 9.39 9,777.66 10.76 1,004.40 8.2050,000 60,000 146,275 6.27 8,000.25 8.81 1,035.83 8.4660,000 75,000 142,648 6.11 9,542.35 10.50 1,423.34 11.6275,000 100,000 122,761 5.26 10,518.69 11.58 1,871.54 15.28
100,000 150,000 79,399 3.40 9,451.44 10.40 2,063.97 16.86150,000 200,000 21,660 0.93 3,695.72 4.07 935.96 7.64200,000 275,000 11,695 0.50 2,707.38 2.98 724.69 5.92
Over 275,000 13,185 0.57 7,400.57 8.15 2,070.61 16.91
Totals 2,333,223 100 90,836.52 100 12,244.37 100
31
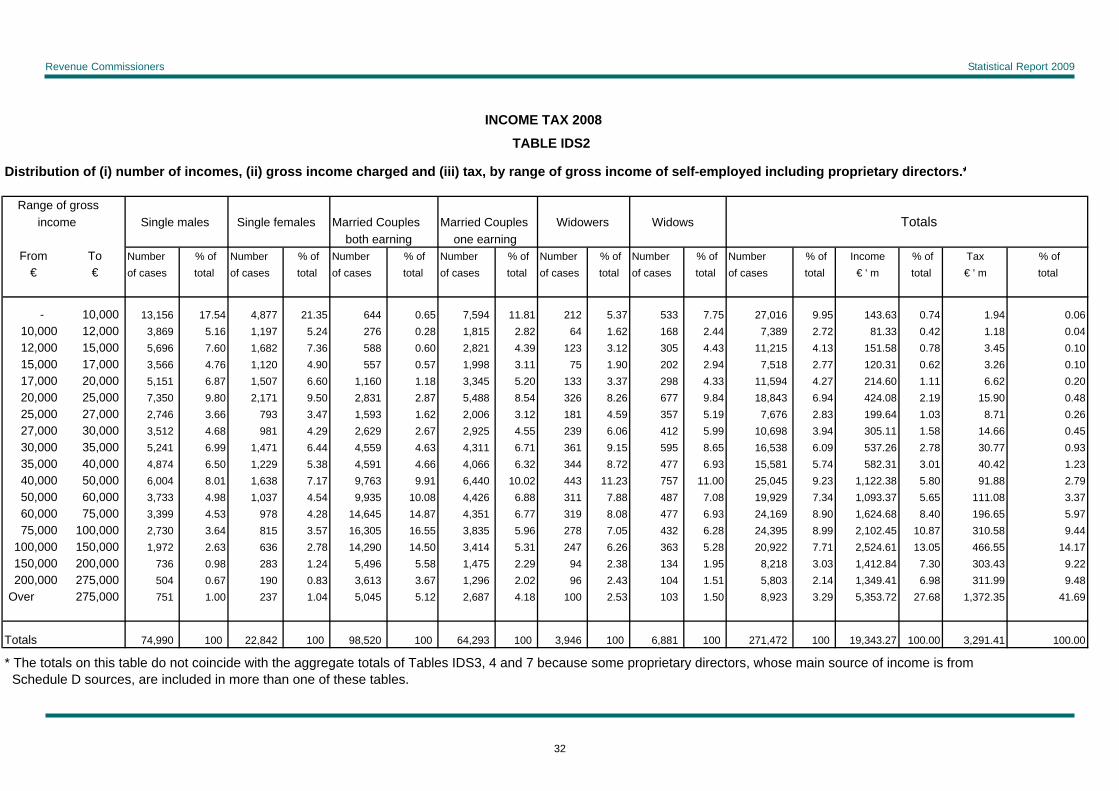
Revenue Commissioners Statistical Report 2009
INCOME TAX 2008
TABLE IDS2
Distribution of (i) number of incomes, (ii) gross income charged and (iii) tax, by range of gross income of self-employed including proprietary directors.*
Range of gross income Single males Single females Married Couples Married Couples Widowers Widows Totals
both earning one earningFrom To Number % of Number % of Number % of Number % of Number % of Number % of Number % of Income % of Tax % of
€ € of cases total of cases total of cases total of cases total of cases total of cases total of cases total € ' m total € ' m total
- 10,000 13,156 17.54 4,877 21.35 644 0.65 7,594 11.81 212 5.37 533 7.75 27,016 9.95 143.63 0.74 1.94 0.0610,000 12,000 3,869 5.16 1,197 5.24 276 0.28 1,815 2.82 64 1.62 168 2.44 7,389 2.72 81.33 0.42 1.18 0.0412,000 15,000 5,696 7.60 1,682 7.36 588 0.60 2,821 4.39 123 3.12 305 4.43 11,215 4.13 151.58 0.78 3.45 0.1015,000 17,000 3,566 4.76 1,120 4.90 557 0.57 1,998 3.11 75 1.90 202 2.94 7,518 2.77 120.31 0.62 3.26 0.1017,000 20,000 5,151 6.87 1,507 6.60 1,160 1.18 3,345 5.20 133 3.37 298 4.33 11,594 4.27 214.60 1.11 6.62 0.2020,000 25,000 7,350 9.80 2,171 9.50 2,831 2.87 5,488 8.54 326 8.26 677 9.84 18,843 6.94 424.08 2.19 15.90 0.4825,000 27,000 2,746 3.66 793 3.47 1,593 1.62 2,006 3.12 181 4.59 357 5.19 7,676 2.83 199.64 1.03 8.71 0.2627,000 30,000 3,512 4.68 981 4.29 2,629 2.67 2,925 4.55 239 6.06 412 5.99 10,698 3.94 305.11 1.58 14.66 0.4530,000 35,000 5,241 6.99 1,471 6.44 4,559 4.63 4,311 6.71 361 9.15 595 8.65 16,538 6.09 537.26 2.78 30.77 0.9335,000 40,000 4,874 6.50 1,229 5.38 4,591 4.66 4,066 6.32 344 8.72 477 6.93 15,581 5.74 582.31 3.01 40.42 1.2340,000 50,000 6,004 8.01 1,638 7.17 9,763 9.91 6,440 10.02 443 11.23 757 11.00 25,045 9.23 1,122.38 5.80 91.88 2.7950,000 60,000 3,733 4.98 1,037 4.54 9,935 10.08 4,426 6.88 311 7.88 487 7.08 19,929 7.34 1,093.37 5.65 111.08 3.3760,000 75,000 3,399 4.53 978 4.28 14,645 14.87 4,351 6.77 319 8.08 477 6.93 24,169 8.90 1,624.68 8.40 196.65 5.9775,000 100,000 2,730 3.64 815 3.57 16,305 16.55 3,835 5.96 278 7.05 432 6.28 24,395 8.99 2,102.45 10.87 310.58 9.44
100,000 150,000 1,972 2.63 636 2.78 14,290 14.50 3,414 5.31 247 6.26 363 5.28 20,922 7.71 2,524.61 13.05 466.55 14.17150,000 200,000 736 0.98 283 1.24 5,496 5.58 1,475 2.29 94 2.38 134 1.95 8,218 3.03 1,412.84 7.30 303.43 9.22200,000 275,000 504 0.67 190 0.83 3,613 3.67 1,296 2.02 96 2.43 104 1.51 5,803 2.14 1,349.41 6.98 311.99 9.48
Over 275,000 751 1.00 237 1.04 5,045 5.12 2,687 4.18 100 2.53 103 1.50 8,923 3.29 5,353.72 27.68 1,372.35 41.69
Totals 74,990 100 22,842 100 98,520 100 64,293 100 3,946 100 6,881 100 271,472 100 19,343.27 100.00 3,291.41 100.00
* The totals on this table do not coincide with the aggregate totals of Tables IDS3, 4 and 7 because some proprietary directors, whose main source of income is from Schedule D sources, are included in more than one of these tables.
32
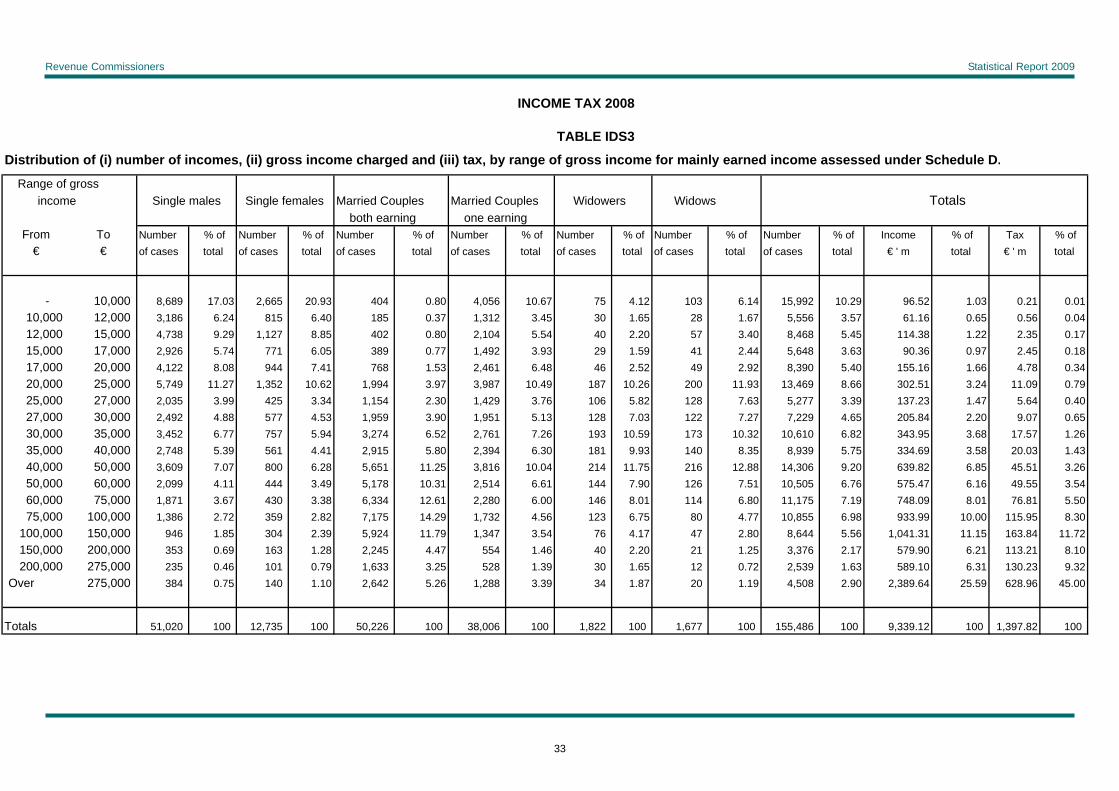
Revenue Commissioners Statistical Report 2009
INCOME TAX 2008
TABLE IDS3
Distribution of (i) number of incomes, (ii) gross income charged and (iii) tax, by range of gross income for mainly earned income assessed under Schedule D.
Range of gross income Single males Single females Married Couples Married Couples Widowers Widows Totals
both earning one earningFrom To Number % of Number % of Number % of Number % of Number % of Number % of Number % of Income % of Tax % of
€ € of cases total of cases total of cases total of cases total of cases total of cases total of cases total € ' m total € ' m total
- 10,000 8,689 17.03 2,665 20.93 404 0.80 4,056 10.67 75 4.12 103 6.14 15,992 10.29 96.52 1.03 0.21 0.0110,000 12,000 3,186 6.24 815 6.40 185 0.37 1,312 3.45 30 1.65 28 1.67 5,556 3.57 61.16 0.65 0.56 0.0412,000 15,000 4,738 9.29 1,127 8.85 402 0.80 2,104 5.54 40 2.20 57 3.40 8,468 5.45 114.38 1.22 2.35 0.1715,000 17,000 2,926 5.74 771 6.05 389 0.77 1,492 3.93 29 1.59 41 2.44 5,648 3.63 90.36 0.97 2.45 0.1817,000 20,000 4,122 8.08 944 7.41 768 1.53 2,461 6.48 46 2.52 49 2.92 8,390 5.40 155.16 1.66 4.78 0.3420,000 25,000 5,749 11.27 1,352 10.62 1,994 3.97 3,987 10.49 187 10.26 200 11.93 13,469 8.66 302.51 3.24 11.09 0.7925,000 27,000 2,035 3.99 425 3.34 1,154 2.30 1,429 3.76 106 5.82 128 7.63 5,277 3.39 137.23 1.47 5.64 0.4027,000 30,000 2,492 4.88 577 4.53 1,959 3.90 1,951 5.13 128 7.03 122 7.27 7,229 4.65 205.84 2.20 9.07 0.6530,000 35,000 3,452 6.77 757 5.94 3,274 6.52 2,761 7.26 193 10.59 173 10.32 10,610 6.82 343.95 3.68 17.57 1.2635,000 40,000 2,748 5.39 561 4.41 2,915 5.80 2,394 6.30 181 9.93 140 8.35 8,939 5.75 334.69 3.58 20.03 1.4340,000 50,000 3,609 7.07 800 6.28 5,651 11.25 3,816 10.04 214 11.75 216 12.88 14,306 9.20 639.82 6.85 45.51 3.2650,000 60,000 2,099 4.11 444 3.49 5,178 10.31 2,514 6.61 144 7.90 126 7.51 10,505 6.76 575.47 6.16 49.55 3.5460,000 75,000 1,871 3.67 430 3.38 6,334 12.61 2,280 6.00 146 8.01 114 6.80 11,175 7.19 748.09 8.01 76.81 5.5075,000 100,000 1,386 2.72 359 2.82 7,175 14.29 1,732 4.56 123 6.75 80 4.77 10,855 6.98 933.99 10.00 115.95 8.30
100,000 150,000 946 1.85 304 2.39 5,924 11.79 1,347 3.54 76 4.17 47 2.80 8,644 5.56 1,041.31 11.15 163.84 11.72150,000 200,000 353 0.69 163 1.28 2,245 4.47 554 1.46 40 2.20 21 1.25 3,376 2.17 579.90 6.21 113.21 8.10200,000 275,000 235 0.46 101 0.79 1,633 3.25 528 1.39 30 1.65 12 0.72 2,539 1.63 589.10 6.31 130.23 9.32
Over 275,000 384 0.75 140 1.10 2,642 5.26 1,288 3.39 34 1.87 20 1.19 4,508 2.90 2,389.64 25.59 628.96 45.00
Totals 51,020 100 12,735 100 50,226 100 38,006 100 1,822 100 1,677 100 155,486 100 9,339.12 100 1,397.82 100
33

Revenue Commissioners Statistical Report 2009
INCOME TAX 2008
TABLE IDS4
Distribution of (i) number of incomes, (ii) gross income charged and (iii) tax, by range of gross income for mainly unearned income assessed under Schedule D. Range of gross income Single males Single females Married Couples Married Couples Widowers Widows Totals
both earning one earningFrom To Number % of Number % of Number % of Number % of Number % of Number % of Number % of Income % of Tax % of
€ € of cases total of cases total of cases total of cases total of cases total of cases total of cases total € ' m total € ' m total
- 10,000 2,793 34.96 1,678 30.17 59 1.01 2,408 18.85 122 9.11 401 8.88 7,461 19.61 34.34 1.07 1.65 0.3610,000 12,000 411 5.14 292 5.25 37 0.63 380 2.97 24 1.79 120 2.66 1,264 3.32 13.86 0.43 0.51 0.1112,000 15,000 508 6.36 377 6.78 47 0.80 470 3.68 55 4.11 213 4.72 1,670 4.39 22.54 0.70 0.68 0.1515,000 17,000 312 3.91 229 4.12 35 0.60 314 2.46 39 2.91 141 3.12 1,070 2.81 17.12 0.53 0.39 0.0917,000 20,000 397 4.97 317 5.70 75 1.28 496 3.88 65 4.85 221 4.89 1,571 4.13 29.09 0.90 0.63 0.1420,000 25,000 541 6.77 452 8.13 208 3.54 783 6.13 80 5.97 421 9.32 2,485 6.53 55.96 1.74 1.39 0.3125,000 27,000 208 2.60 190 3.42 106 1.81 266 2.08 59 4.41 211 4.67 1,040 2.73 27.03 0.84 0.84 0.1827,000 30,000 248 3.10 200 3.60 128 2.18 450 3.52 83 6.20 251 5.56 1,360 3.57 38.75 1.20 1.39 0.3130,000 35,000 321 4.02 307 5.52 205 3.49 670 5.24 119 8.89 355 7.86 1,977 5.20 64.12 1.99 2.65 0.5835,000 40,000 299 3.74 211 3.79 240 4.09 620 4.85 95 7.09 291 6.45 1,756 4.61 65.70 2.04 3.11 0.6840,000 50,000 419 5.24 316 5.68 478 8.14 941 7.36 134 10.01 444 9.83 2,732 7.18 122.19 3.80 7.65 1.6850,000 60,000 258 3.23 243 4.37 478 8.14 755 5.91 89 6.65 310 6.87 2,133 5.61 116.73 3.63 9.56 2.1060,000 75,000 285 3.57 211 3.79 585 9.97 846 6.62 86 6.42 312 6.91 2,325 6.11 155.76 4.84 15.83 3.4975,000 100,000 266 3.33 181 3.25 665 11.33 884 6.92 86 6.42 303 6.71 2,385 6.27 206.42 6.41 23.91 5.27
100,000 150,000 305 3.82 174 3.13 806 13.73 898 7.03 94 7.02 273 6.05 2,550 6.70 310.53 9.65 42.94 9.45150,000 200,000 119 1.49 58 1.04 518 8.83 418 3.27 21 1.57 100 2.21 1,234 3.24 212.78 6.61 30.30 6.67200,000 275,000 113 1.41 56 1.01 394 6.71 359 2.81 44 3.29 78 1.73 1,044 2.74 244.60 7.60 37.80 8.32
Over 275,000 186 2.33 69 1.24 805 13.72 819 6.41 44 3.29 70 1.55 1,993 5.24 1,480.48 46.01 272.95 60.10
Totals 7,989 100 5,561 100 5,869 100 12,777 100 1,339 100 4,515 100 38,050 100 3,218.01 100 454.18 100
34

Revenue Commissioners Statistical Report 2009
INCOME TAX 2008
TABLE IDS5
Distribution of (i) number of incomes, (ii) gross income charged and (iii) tax, by range of gross income for mainly PAYE income assessed under Schedule E. Range of gross income Single males Single females Married Couples Married Couples Widowers Widows Totals
both earning one earningFrom To Number % of Number % of Number % of Number % of Number % of Number % of Number % of Income % of Tax % of
€ € of cases total of cases total of cases total of cases total of cases total of cases total of cases total € ' m total € ' m total
- 10,000 178,859 25.33 172,691 26.12 8,426 2.24 33,432 10.17 779 4.59 2,639 5.19 396,826 18.55 1,779.96 2.27 1.39 0.0110,000 12,000 31,372 4.44 28,743 4.35 2,121 0.56 6,593 2.01 747 4.40 4,106 8.07 73,682 3.44 813.60 1.04 1.15 0.0112,000 15,000 42,149 5.97 42,727 6.46 3,508 0.93 10,611 3.23 1,889 11.12 7,474 14.69 108,358 5.06 1,462.55 1.87 2.92 0.0315,000 17,000 28,475 4.03 29,159 4.41 2,687 0.71 8,269 2.52 1,034 6.09 4,295 8.44 73,919 3.45 1,183.53 1.51 2.65 0.0317,000 20,000 47,981 6.80 48,641 7.36 4,966 1.32 16,571 5.04 1,270 7.48 6,066 11.92 125,495 5.87 2,323.87 2.97 11.05 0.1120,000 25,000 78,313 11.09 74,958 11.34 10,966 2.92 34,084 10.37 2,032 11.96 7,780 15.29 208,133 9.73 4,680.70 5.98 105.69 1.0225,000 27,000 29,035 4.11 27,496 4.16 5,293 1.41 13,117 3.99 673 3.96 2,289 4.50 77,903 3.64 2,025.05 2.59 76.01 0.7327,000 30,000 40,954 5.80 36,285 5.49 8,869 2.36 18,763 5.71 957 5.63 2,768 5.44 108,596 5.08 3,095.55 3.95 144.07 1.3930,000 35,000 57,330 8.12 48,193 7.29 16,979 4.52 29,174 8.87 1,293 7.61 3,503 6.88 156,472 7.31 5,075.01 6.48 296.60 2.8535,000 40,000 45,050 6.38 40,352 6.10 19,979 5.31 26,851 8.17 1,197 7.05 2,571 5.05 136,000 6.36 5,092.32 6.51 385.50 3.7140,000 50,000 55,750 7.90 53,346 8.07 45,746 12.17 41,993 12.77 1,839 10.83 3,272 6.43 201,946 9.44 9,015.64 11.52 951.24 9.1550,000 60,000 29,042 4.11 27,091 4.10 47,027 12.51 27,680 8.42 1,170 6.89 1,627 3.20 133,637 6.25 7,308.05 9.34 976.72 9.4060,000 75,000 21,204 3.00 17,619 2.67 63,777 16.96 24,373 7.41 919 5.41 1,256 2.47 129,148 6.04 8,638.49 11.04 1,330.70 12.8075,000 100,000 12,589 1.78 9,256 1.40 68,023 18.09 18,186 5.53 628 3.70 839 1.65 109,521 5.12 9,378.28 11.98 1,731.68 16.66
100,000 150,000 5,405 0.77 3,330 0.50 47,912 12.74 10,907 3.32 366 2.15 285 0.56 68,205 3.19 8,099.60 10.35 1,857.20 17.87150,000 200,000 1,315 0.19 710 0.11 11,249 2.99 3,624 1.10 95 0.56 57 0.11 17,050 0.80 2,903.04 3.71 792.44 7.63200,000 275,000 630 0.09 313 0.05 4,854 1.29 2,228 0.68 57 0.34 30 0.06 8,112 0.38 1,873.68 2.39 556.66 5.36
Over 275,000 560 0.08 173 0.03 3,581 0.95 2,302 0.70 41 0.24 27 0.05 6,684 0.31 3,530.46 4.51 1,168.70 11.25
Totals 706,013 100 661,083 100 375,963 100 328,758 100 16,986 100 50,884 100 2,139,687 100 78,279.39 100 10,392.38 100
35
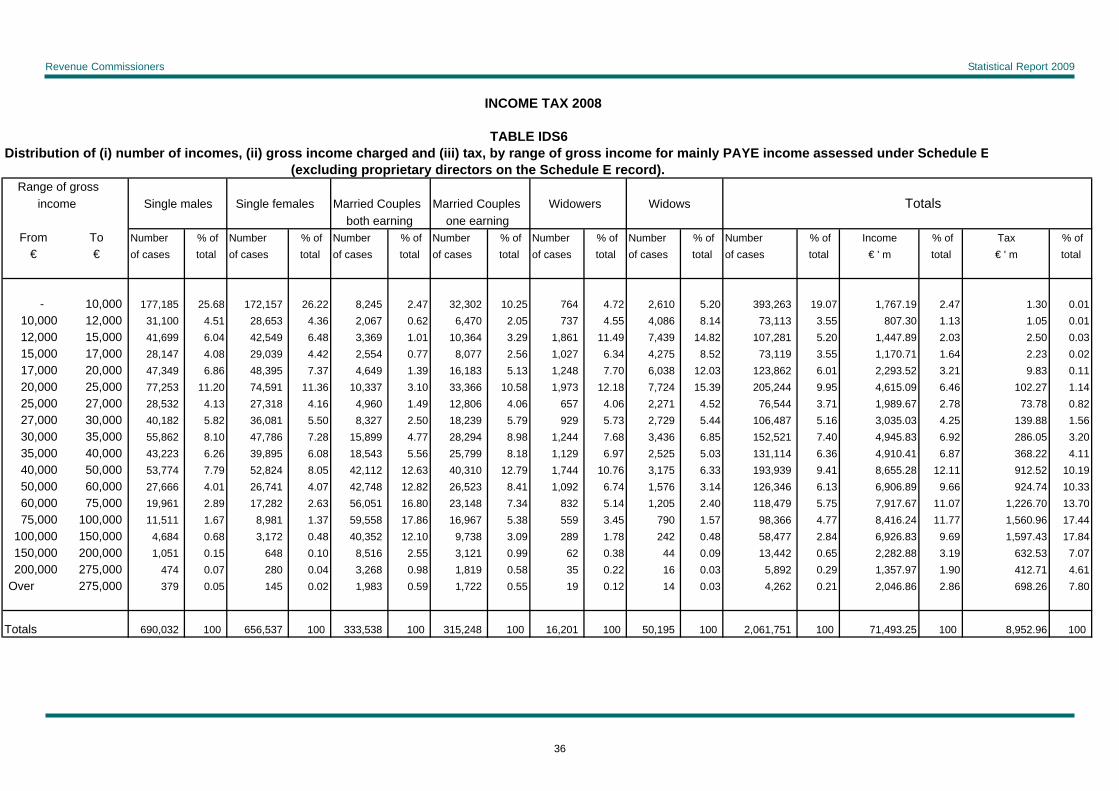
Revenue Commissioners Statistical Report 2009
INCOME TAX 2008
TABLE IDS6Distribution of (i) number of incomes, (ii) gross income charged and (iii) tax, by range of gross income for mainly PAYE income assessed under Schedule E
(excluding proprietary directors on the Schedule E record). Range of gross income Single males Single females Married Couples Married Couples Widowers Widows Totals
both earning one earningFrom To Number % of Number % of Number % of Number % of Number % of Number % of Number % of Income % of Tax % of
€ € of cases total of cases total of cases total of cases total of cases total of cases total of cases total € ' m total € ' m total
- 10,000 177,185 25.68 172,157 26.22 8,245 2.47 32,302 10.25 764 4.72 2,610 5.20 393,263 19.07 1,767.19 2.47 1.30 0.0110,000 12,000 31,100 4.51 28,653 4.36 2,067 0.62 6,470 2.05 737 4.55 4,086 8.14 73,113 3.55 807.30 1.13 1.05 0.0112,000 15,000 41,699 6.04 42,549 6.48 3,369 1.01 10,364 3.29 1,861 11.49 7,439 14.82 107,281 5.20 1,447.89 2.03 2.50 0.0315,000 17,000 28,147 4.08 29,039 4.42 2,554 0.77 8,077 2.56 1,027 6.34 4,275 8.52 73,119 3.55 1,170.71 1.64 2.23 0.0217,000 20,000 47,349 6.86 48,395 7.37 4,649 1.39 16,183 5.13 1,248 7.70 6,038 12.03 123,862 6.01 2,293.52 3.21 9.83 0.1120,000 25,000 77,253 11.20 74,591 11.36 10,337 3.10 33,366 10.58 1,973 12.18 7,724 15.39 205,244 9.95 4,615.09 6.46 102.27 1.1425,000 27,000 28,532 4.13 27,318 4.16 4,960 1.49 12,806 4.06 657 4.06 2,271 4.52 76,544 3.71 1,989.67 2.78 73.78 0.8227,000 30,000 40,182 5.82 36,081 5.50 8,327 2.50 18,239 5.79 929 5.73 2,729 5.44 106,487 5.16 3,035.03 4.25 139.88 1.5630,000 35,000 55,862 8.10 47,786 7.28 15,899 4.77 28,294 8.98 1,244 7.68 3,436 6.85 152,521 7.40 4,945.83 6.92 286.05 3.2035,000 40,000 43,223 6.26 39,895 6.08 18,543 5.56 25,799 8.18 1,129 6.97 2,525 5.03 131,114 6.36 4,910.41 6.87 368.22 4.1140,000 50,000 53,774 7.79 52,824 8.05 42,112 12.63 40,310 12.79 1,744 10.76 3,175 6.33 193,939 9.41 8,655.28 12.11 912.52 10.1950,000 60,000 27,666 4.01 26,741 4.07 42,748 12.82 26,523 8.41 1,092 6.74 1,576 3.14 126,346 6.13 6,906.89 9.66 924.74 10.3360,000 75,000 19,961 2.89 17,282 2.63 56,051 16.80 23,148 7.34 832 5.14 1,205 2.40 118,479 5.75 7,917.67 11.07 1,226.70 13.7075,000 100,000 11,511 1.67 8,981 1.37 59,558 17.86 16,967 5.38 559 3.45 790 1.57 98,366 4.77 8,416.24 11.77 1,560.96 17.44
100,000 150,000 4,684 0.68 3,172 0.48 40,352 12.10 9,738 3.09 289 1.78 242 0.48 58,477 2.84 6,926.83 9.69 1,597.43 17.84150,000 200,000 1,051 0.15 648 0.10 8,516 2.55 3,121 0.99 62 0.38 44 0.09 13,442 0.65 2,282.88 3.19 632.53 7.07200,000 275,000 474 0.07 280 0.04 3,268 0.98 1,819 0.58 35 0.22 16 0.03 5,892 0.29 1,357.97 1.90 412.71 4.61
Over 275,000 379 0.05 145 0.02 1,983 0.59 1,722 0.55 19 0.12 14 0.03 4,262 0.21 2,046.86 2.86 698.26 7.80
Totals 690,032 100 656,537 100 333,538 100 315,248 100 16,201 100 50,195 100 2,061,751 100 71,493.25 100 8,952.96 100
36

Revenue Commissioners Statistical Report 2009
INCOME TAX 2008
TABLE IDS7
Distribution of (i) number of incomes, (ii) gross income charged and (iii) tax, by range of gross income of proprietary directors. Range of gross income Single males Single females Married Couples Married Couples Widowers Widows Totals
both earning one earningFrom To Number % of Number % of Number % of Number % of Number % of Number % of Number % of Income % of Tax % of
€ € of cases total of cases total of cases total of cases total of cases total of cases total of cases total € ' m total € ' m total
- 10,000 2,070 11.13 632 12.33 226 0.46 1,518 8.51 22 2.18 36 3.79 4,504 4.88 17.49 0.19 0.13 0.0110,000 12,000 362 1.95 110 2.15 70 0.14 192 1.08 12 1.19 23 2.42 769 0.83 8.48 0.09 0.13 0.0112,000 15,000 561 3.02 206 4.02 164 0.34 362 2.03 32 3.17 38 4.00 1,363 1.48 18.53 0.20 0.50 0.0315,000 17,000 404 2.17 142 2.77 153 0.31 273 1.53 7 0.69 23 2.42 1,002 1.09 16.05 0.17 0.50 0.0317,000 20,000 738 3.97 284 5.54 356 0.73 532 2.98 24 2.38 34 3.58 1,968 2.13 36.55 0.40 1.38 0.0720,000 25,000 1,234 6.63 417 8.13 724 1.49 943 5.29 68 6.74 73 7.68 3,459 3.75 78.46 0.85 3.84 0.2125,000 27,000 582 3.13 192 3.74 394 0.81 399 2.24 18 1.78 26 2.74 1,611 1.75 41.94 0.45 2.49 0.1327,000 30,000 867 4.66 232 4.53 627 1.29 650 3.64 37 3.67 50 5.26 2,463 2.67 70.63 0.77 4.64 0.2530,000 35,000 1,604 8.62 438 8.54 1,228 2.52 1,072 6.01 66 6.54 81 8.53 4,489 4.87 146.57 1.59 11.34 0.6135,000 40,000 1,973 10.61 482 9.40 1,593 3.27 1,262 7.07 76 7.53 58 6.11 5,444 5.90 202.81 2.20 18.56 1.0040,000 50,000 2,189 11.77 579 11.29 3,984 8.17 2,018 11.31 119 11.79 119 12.53 9,008 9.76 405.42 4.39 41.89 2.2750,000 60,000 1,540 8.28 376 7.33 4,698 9.64 1,389 7.79 89 8.82 67 7.05 8,159 8.84 448.79 4.86 55.94 3.0360,000 75,000 1,408 7.57 362 7.06 8,299 17.03 1,535 8.60 114 11.30 79 8.32 11,797 12.79 796.59 8.63 111.33 6.0375,000 100,000 1,241 6.67 309 6.03 9,283 19.05 1,550 8.69 92 9.12 81 8.53 12,556 13.61 1,083.78 11.75 184.97 10.01
100,000 150,000 900 4.84 193 3.76 8,633 17.71 1,600 8.97 109 10.80 64 6.74 11,499 12.46 1,390.14 15.07 289.05 15.64150,000 200,000 365 1.96 73 1.42 3,414 7.00 699 3.92 39 3.87 28 2.95 4,618 5.01 794.92 8.61 186.64 10.10200,000 275,000 232 1.25 45 0.88 2,162 4.44 618 3.46 36 3.57 29 3.05 3,122 3.38 726.12 7.87 177.10 9.58
Over 275,000 330 1.77 55 1.07 2,732 5.61 1,228 6.88 49 4.86 41 4.32 4,435 4.81 2,944.19 31.91 757.24 40.98
Totals 18,600 100 5,127 100 48,740 100 17,840 100 1,009 100 950 100 92,266 100 9,227.47 100 1,847.67 100
37
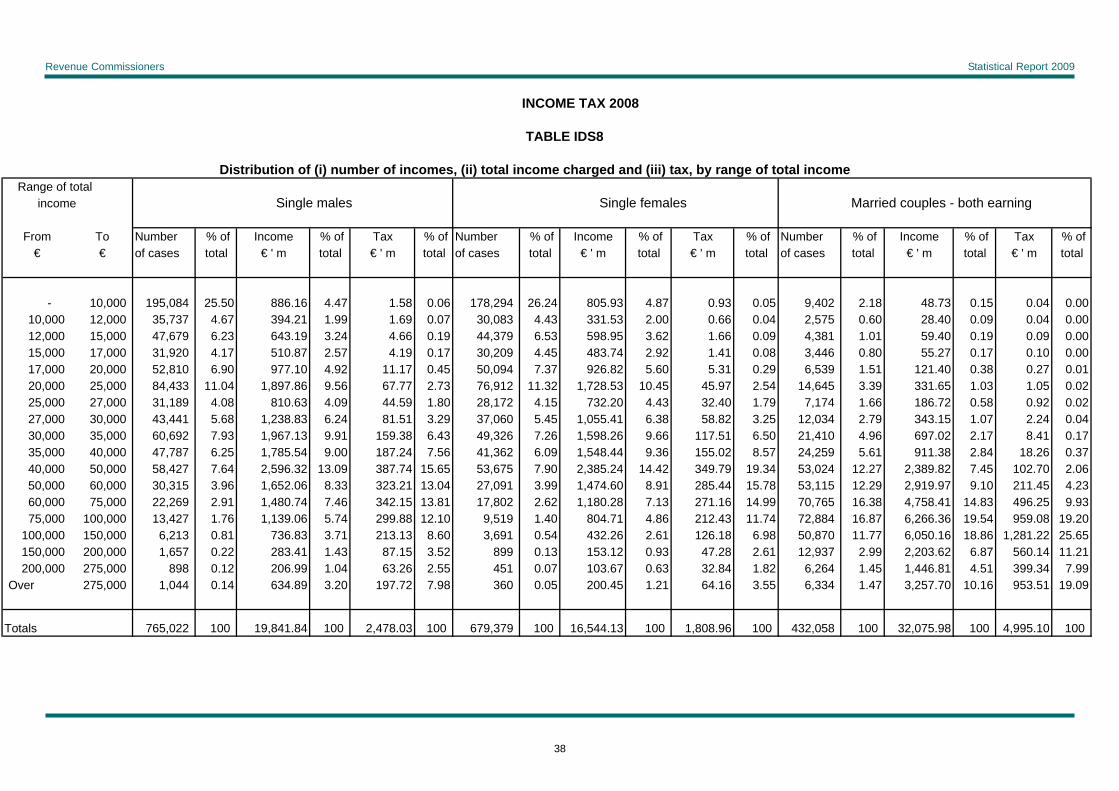
Revenue Commissioners Statistical Report 2009
INCOME TAX 2008
TABLE IDS8
Distribution of (i) number of incomes, (ii) total income charged and (iii) tax, by range of total income. Range of total income Single males Single females Married couples - both earning
From To Number % of Income % of Tax % of Number % of Income % of Tax % of Number % of Income % of Tax % of€ € of cases total € ' m total € ' m total of cases total € ' m total € ' m total of cases total € ' m total € ' m total
- 10,000 195,084 25.50 886.16 4.47 1.58 0.06 178,294 26.24 805.93 4.87 0.93 0.05 9,402 2.18 48.73 0.15 0.04 0.0010,000 12,000 35,737 4.67 394.21 1.99 1.69 0.07 30,083 4.43 331.53 2.00 0.66 0.04 2,575 0.60 28.40 0.09 0.04 0.0012,000 15,000 47,679 6.23 643.19 3.24 4.66 0.19 44,379 6.53 598.95 3.62 1.66 0.09 4,381 1.01 59.40 0.19 0.09 0.0015,000 17,000 31,920 4.17 510.87 2.57 4.19 0.17 30,209 4.45 483.74 2.92 1.41 0.08 3,446 0.80 55.27 0.17 0.10 0.0017,000 20,000 52,810 6.90 977.10 4.92 11.17 0.45 50,094 7.37 926.82 5.60 5.31 0.29 6,539 1.51 121.40 0.38 0.27 0.0120,000 25,000 84,433 11.04 1,897.86 9.56 67.77 2.73 76,912 11.32 1,728.53 10.45 45.97 2.54 14,645 3.39 331.65 1.03 1.05 0.0225,000 27,000 31,189 4.08 810.63 4.09 44.59 1.80 28,172 4.15 732.20 4.43 32.40 1.79 7,174 1.66 186.72 0.58 0.92 0.0227,000 30,000 43,441 5.68 1,238.83 6.24 81.51 3.29 37,060 5.45 1,055.41 6.38 58.82 3.25 12,034 2.79 343.15 1.07 2.24 0.0430,000 35,000 60,692 7.93 1,967.13 9.91 159.38 6.43 49,326 7.26 1,598.26 9.66 117.51 6.50 21,410 4.96 697.02 2.17 8.41 0.1735,000 40,000 47,787 6.25 1,785.54 9.00 187.24 7.56 41,362 6.09 1,548.44 9.36 155.02 8.57 24,259 5.61 911.38 2.84 18.26 0.3740,000 50,000 58,427 7.64 2,596.32 13.09 387.74 15.65 53,675 7.90 2,385.24 14.42 349.79 19.34 53,024 12.27 2,389.82 7.45 102.70 2.0650,000 60,000 30,315 3.96 1,652.06 8.33 323.21 13.04 27,091 3.99 1,474.60 8.91 285.44 15.78 53,115 12.29 2,919.97 9.10 211.45 4.2360,000 75,000 22,269 2.91 1,480.74 7.46 342.15 13.81 17,802 2.62 1,180.28 7.13 271.16 14.99 70,765 16.38 4,758.41 14.83 496.25 9.9375,000 100,000 13,427 1.76 1,139.06 5.74 299.88 12.10 9,519 1.40 804.71 4.86 212.43 11.74 72,884 16.87 6,266.36 19.54 959.08 19.20
100,000 150,000 6,213 0.81 736.83 3.71 213.13 8.60 3,691 0.54 432.26 2.61 126.18 6.98 50,870 11.77 6,050.16 18.86 1,281.22 25.65150,000 200,000 1,657 0.22 283.41 1.43 87.15 3.52 899 0.13 153.12 0.93 47.28 2.61 12,937 2.99 2,203.62 6.87 560.14 11.21200,000 275,000 898 0.12 206.99 1.04 63.26 2.55 451 0.07 103.67 0.63 32.84 1.82 6,264 1.45 1,446.81 4.51 399.34 7.99
Over 275,000 1,044 0.14 634.89 3.20 197.72 7.98 360 0.05 200.45 1.21 64.16 3.55 6,334 1.47 3,257.70 10.16 953.51 19.09
Totals 765,022 100 19,841.84 100 2,478.03 100 679,379 100 16,544.13 100 1,808.96 100 432,058 100 32,075.98 100 4,995.10 100
38
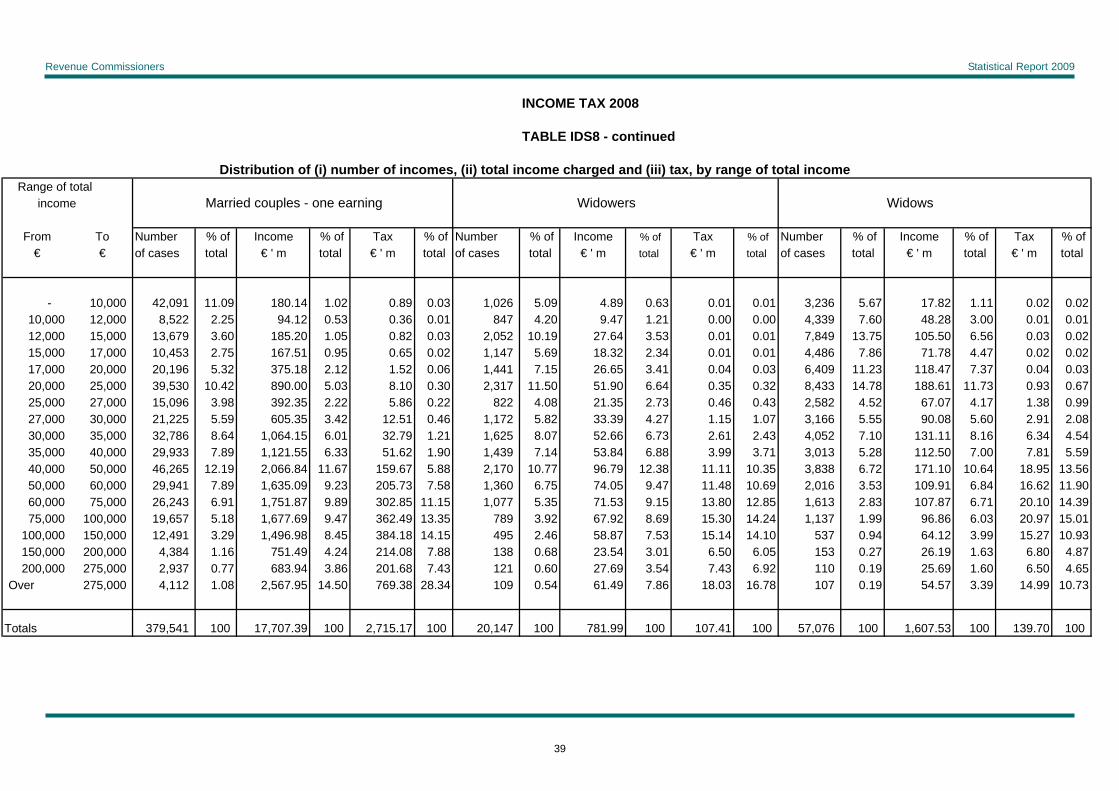
Revenue Commissioners Statistical Report 2009
INCOME TAX 2008
TABLE IDS8 - continued
Distribution of (i) number of incomes, (ii) total income charged and (iii) tax, by range of total income. Range of total income Married couples - one earning Widowers Widows
From To Number % of Income % of Tax % of Number % of Income % of Tax % of Number % of Income % of Tax % of€ € of cases total € ' m total € ' m total of cases total € ' m total € ' m total of cases total € ' m total € ' m total
- 10,000 42,091 11.09 180.14 1.02 0.89 0.03 1,026 5.09 4.89 0.63 0.01 0.01 3,236 5.67 17.82 1.11 0.02 0.0210,000 12,000 8,522 2.25 94.12 0.53 0.36 0.01 847 4.20 9.47 1.21 0.00 0.00 4,339 7.60 48.28 3.00 0.01 0.0112,000 15,000 13,679 3.60 185.20 1.05 0.82 0.03 2,052 10.19 27.64 3.53 0.01 0.01 7,849 13.75 105.50 6.56 0.03 0.0215,000 17,000 10,453 2.75 167.51 0.95 0.65 0.02 1,147 5.69 18.32 2.34 0.01 0.01 4,486 7.86 71.78 4.47 0.02 0.0217,000 20,000 20,196 5.32 375.18 2.12 1.52 0.06 1,441 7.15 26.65 3.41 0.04 0.03 6,409 11.23 118.47 7.37 0.04 0.0320,000 25,000 39,530 10.42 890.00 5.03 8.10 0.30 2,317 11.50 51.90 6.64 0.35 0.32 8,433 14.78 188.61 11.73 0.93 0.6725,000 27,000 15,096 3.98 392.35 2.22 5.86 0.22 822 4.08 21.35 2.73 0.46 0.43 2,582 4.52 67.07 4.17 1.38 0.9927,000 30,000 21,225 5.59 605.35 3.42 12.51 0.46 1,172 5.82 33.39 4.27 1.15 1.07 3,166 5.55 90.08 5.60 2.91 2.0830,000 35,000 32,786 8.64 1,064.15 6.01 32.79 1.21 1,625 8.07 52.66 6.73 2.61 2.43 4,052 7.10 131.11 8.16 6.34 4.5435,000 40,000 29,933 7.89 1,121.55 6.33 51.62 1.90 1,439 7.14 53.84 6.88 3.99 3.71 3,013 5.28 112.50 7.00 7.81 5.5940,000 50,000 46,265 12.19 2,066.84 11.67 159.67 5.88 2,170 10.77 96.79 12.38 11.11 10.35 3,838 6.72 171.10 10.64 18.95 13.5650,000 60,000 29,941 7.89 1,635.09 9.23 205.73 7.58 1,360 6.75 74.05 9.47 11.48 10.69 2,016 3.53 109.91 6.84 16.62 11.9060,000 75,000 26,243 6.91 1,751.87 9.89 302.85 11.15 1,077 5.35 71.53 9.15 13.80 12.85 1,613 2.83 107.87 6.71 20.10 14.3975,000 100,000 19,657 5.18 1,677.69 9.47 362.49 13.35 789 3.92 67.92 8.69 15.30 14.24 1,137 1.99 96.86 6.03 20.97 15.01
100,000 150,000 12,491 3.29 1,496.98 8.45 384.18 14.15 495 2.46 58.87 7.53 15.14 14.10 537 0.94 64.12 3.99 15.27 10.93150,000 200,000 4,384 1.16 751.49 4.24 214.08 7.88 138 0.68 23.54 3.01 6.50 6.05 153 0.27 26.19 1.63 6.80 4.87200,000 275,000 2,937 0.77 683.94 3.86 201.68 7.43 121 0.60 27.69 3.54 7.43 6.92 110 0.19 25.69 1.60 6.50 4.65
Over 275,000 4,112 1.08 2,567.95 14.50 769.38 28.34 109 0.54 61.49 7.86 18.03 16.78 107 0.19 54.57 3.39 14.99 10.73
Totals 379,541 100 17,707.39 100 2,715.17 100 20,147 100 781.99 100 107.41 100 57,076 100 1,607.53 100 139.70 100
39
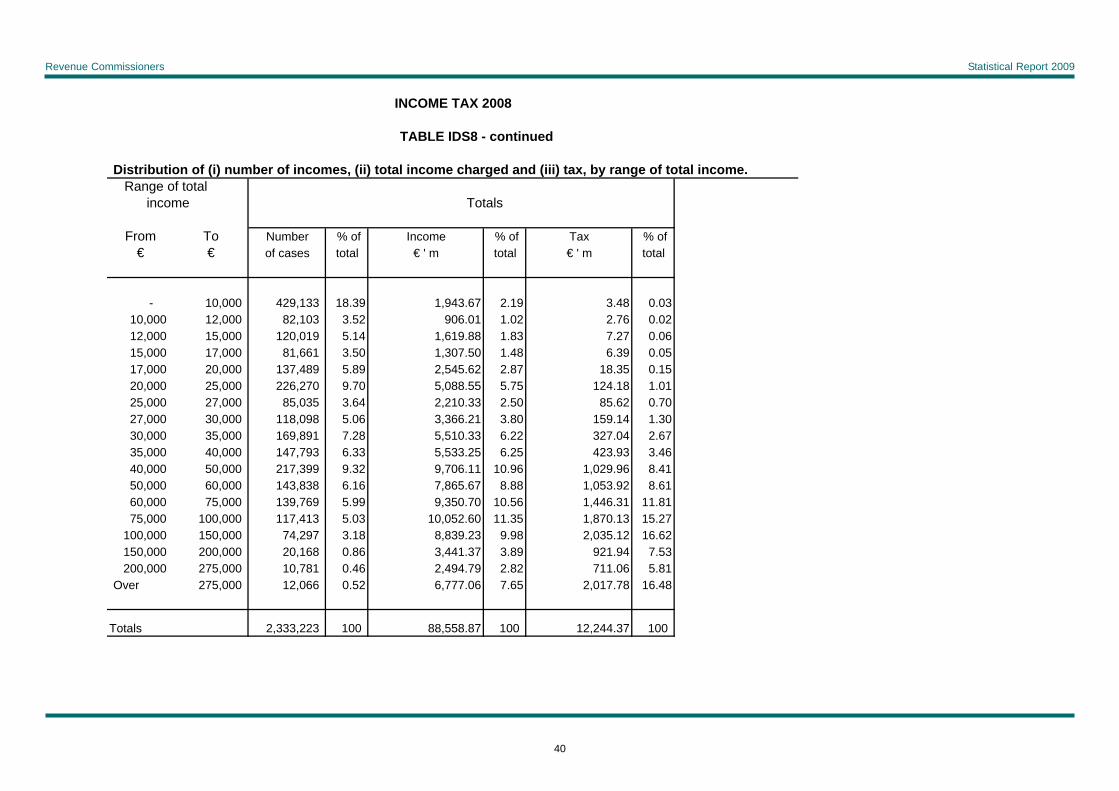
Revenue Commissioners Statistical Report 2009
INCOME TAX 2008
TABLE IDS8 - continued
Distribution of (i) number of incomes, (ii) total income charged and (iii) tax, by range of total income. Range of total income Totals
From To Number % of Income % of Tax % of€ € of cases total € ' m total € ' m total
- 10,000 429,133 18.39 1,943.67 2.19 3.48 0.0310,000 12,000 82,103 3.52 906.01 1.02 2.76 0.0212,000 15,000 120,019 5.14 1,619.88 1.83 7.27 0.0615,000 17,000 81,661 3.50 1,307.50 1.48 6.39 0.0517,000 20,000 137,489 5.89 2,545.62 2.87 18.35 0.1520,000 25,000 226,270 9.70 5,088.55 5.75 124.18 1.0125,000 27,000 85,035 3.64 2,210.33 2.50 85.62 0.7027,000 30,000 118,098 5.06 3,366.21 3.80 159.14 1.3030,000 35,000 169,891 7.28 5,510.33 6.22 327.04 2.6735,000 40,000 147,793 6.33 5,533.25 6.25 423.93 3.4640,000 50,000 217,399 9.32 9,706.11 10.96 1,029.96 8.4150,000 60,000 143,838 6.16 7,865.67 8.88 1,053.92 8.6160,000 75,000 139,769 5.99 9,350.70 10.56 1,446.31 11.8175,000 100,000 117,413 5.03 10,052.60 11.35 1,870.13 15.27
100,000 150,000 74,297 3.18 8,839.23 9.98 2,035.12 16.62150,000 200,000 20,168 0.86 3,441.37 3.89 921.94 7.53200,000 275,000 10,781 0.46 2,494.79 2.82 711.06 5.81
Over 275,000 12,066 0.52 6,777.06 7.65 2,017.78 16.48
Totals 2,333,223 100 88,558.87 100 12,244.37 100
40

Revenue Commissioners Statistical Report 2009
INCOME TAX 2008
TABLE IDS9
Distribution of (i) number of incomes, (ii) total income charged and (iii) tax, by range of total income of self-employed including proprietary directors.* Range of total income Single males Single females Married Couples Married Couples Widowers Widows Totals
both earning one earningFrom To Number % of Number % of Number % of Number % of Number % of Number % of Number % of Income % of Tax % of
€ € of cases total of cases total of cases total of cases total of cases total of cases total of cases total € ' m total € ' m total
- 10,000 17,322 23.10 5,490 24.03 1,054 1.07 9,509 14.79 254 6.44 589 8.56 34,218 12.60 173.22 0.98 2.17 0.0710,000 12,000 4,430 5.91 1,222 5.35 431 0.44 1,996 3.10 70 1.77 187 2.72 8,336 3.07 91.67 0.52 1.71 0.0512,000 15,000 5,848 7.80 1,751 7.67 884 0.90 3,198 4.97 154 3.90 340 4.94 12,175 4.48 164.46 0.93 4.74 0.1415,000 17,000 3,575 4.77 1,029 4.50 792 0.80 2,279 3.54 102 2.58 216 3.14 7,993 2.94 127.98 0.72 4.15 0.1317,000 20,000 5,144 6.86 1,515 6.63 1,739 1.77 3,749 5.83 187 4.74 368 5.35 12,702 4.68 235.18 1.33 8.13 0.2520,000 25,000 6,984 9.31 2,089 9.15 3,829 3.89 5,801 9.02 394 9.98 759 11.03 19,856 7.31 447.04 2.52 19.36 0.5925,000 27,000 2,572 3.43 804 3.52 1,916 1.94 2,134 3.32 169 4.28 319 4.64 7,914 2.92 205.68 1.16 10.44 0.3227,000 30,000 3,168 4.22 922 4.04 3,263 3.31 2,865 4.46 252 6.39 419 6.09 10,889 4.01 310.66 1.75 16.94 0.5130,000 35,000 4,867 6.49 1,386 6.07 4,954 5.03 4,288 6.67 368 9.33 609 8.85 16,472 6.07 535.25 3.02 35.67 1.0835,000 40,000 4,556 6.08 1,231 5.39 5,125 5.20 4,003 6.23 321 8.13 494 7.18 15,730 5.79 587.74 3.31 46.53 1.4140,000 50,000 5,209 6.95 1,497 6.55 10,318 10.47 6,137 9.55 413 10.47 695 10.10 24,269 8.94 1,087.45 6.13 103.06 3.1350,000 60,000 3,082 4.11 973 4.26 10,148 10.30 3,720 5.79 281 7.12 451 6.55 18,655 6.87 1,022.91 5.77 120.76 3.6760,000 75,000 2,667 3.56 921 4.03 14,730 14.95 3,501 5.45 261 6.61 432 6.28 22,512 8.29 1,514.42 8.54 208.81 6.3475,000 100,000 2,190 2.92 762 3.34 14,822 15.04 3,243 5.04 248 6.28 391 5.68 21,656 7.98 1,863.34 10.51 315.50 9.59
100,000 150,000 1,635 2.18 593 2.60 12,177 12.36 2,942 4.58 218 5.52 316 4.59 17,881 6.59 2,157.57 12.17 459.41 13.96150,000 200,000 625 0.83 260 1.14 4,772 4.84 1,331 2.07 78 1.98 108 1.57 7,174 2.64 1,234.00 6.96 299.00 9.08200,000 275,000 436 0.58 176 0.77 3,141 3.19 1,165 1.81 85 2.15 95 1.38 5,098 1.88 1,185.27 6.68 305.19 9.27
Over 275,000 680 0.91 221 0.97 4,425 4.49 2,432 3.78 91 2.31 93 1.35 7,942 2.93 4,790.17 27.01 1,329.87 40.40
Totals 74,990 100 22,842 100 98,520 100 64,293 100 3,946 100 6,881 100 271,472 100 17,734.00 100 3,291.41 100
* The totals on this table do not coincide with the aggregate totals of Tables IDS10,11 and 14 because some proprietary directors, whose main source of income is from Schedule D sources, are included in more than one of these tables.
41
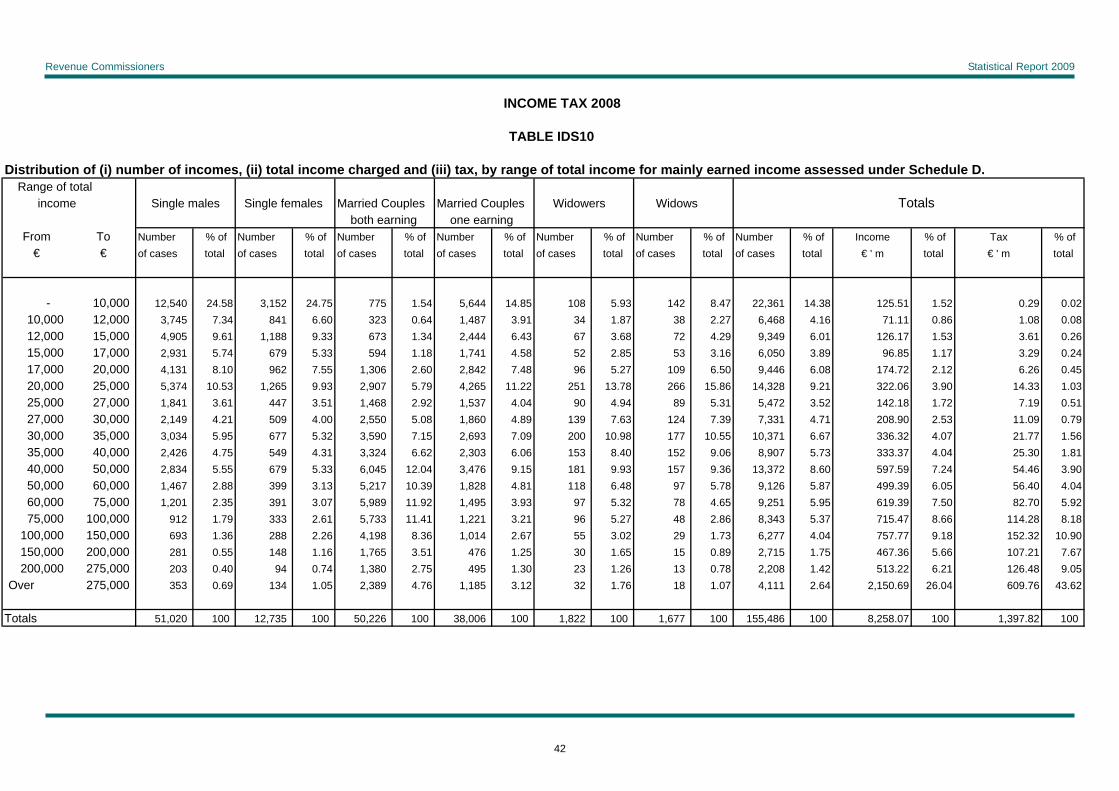
Revenue Commissioners Statistical Report 2009
INCOME TAX 2008
TABLE IDS10
Distribution of (i) number of incomes, (ii) total income charged and (iii) tax, by range of total income for mainly earned income assessed under Schedule D. Range of total income Single males Single females Married Couples Married Couples Widowers Widows Totals
both earning one earningFrom To Number % of Number % of Number % of Number % of Number % of Number % of Number % of Income % of Tax % of
€ € of cases total of cases total of cases total of cases total of cases total of cases total of cases total € ' m total € ' m total
- 10,000 12,540 24.58 3,152 24.75 775 1.54 5,644 14.85 108 5.93 142 8.47 22,361 14.38 125.51 1.52 0.29 0.0210,000 12,000 3,745 7.34 841 6.60 323 0.64 1,487 3.91 34 1.87 38 2.27 6,468 4.16 71.11 0.86 1.08 0.0812,000 15,000 4,905 9.61 1,188 9.33 673 1.34 2,444 6.43 67 3.68 72 4.29 9,349 6.01 126.17 1.53 3.61 0.2615,000 17,000 2,931 5.74 679 5.33 594 1.18 1,741 4.58 52 2.85 53 3.16 6,050 3.89 96.85 1.17 3.29 0.2417,000 20,000 4,131 8.10 962 7.55 1,306 2.60 2,842 7.48 96 5.27 109 6.50 9,446 6.08 174.72 2.12 6.26 0.4520,000 25,000 5,374 10.53 1,265 9.93 2,907 5.79 4,265 11.22 251 13.78 266 15.86 14,328 9.21 322.06 3.90 14.33 1.0325,000 27,000 1,841 3.61 447 3.51 1,468 2.92 1,537 4.04 90 4.94 89 5.31 5,472 3.52 142.18 1.72 7.19 0.5127,000 30,000 2,149 4.21 509 4.00 2,550 5.08 1,860 4.89 139 7.63 124 7.39 7,331 4.71 208.90 2.53 11.09 0.7930,000 35,000 3,034 5.95 677 5.32 3,590 7.15 2,693 7.09 200 10.98 177 10.55 10,371 6.67 336.32 4.07 21.77 1.5635,000 40,000 2,426 4.75 549 4.31 3,324 6.62 2,303 6.06 153 8.40 152 9.06 8,907 5.73 333.37 4.04 25.30 1.8140,000 50,000 2,834 5.55 679 5.33 6,045 12.04 3,476 9.15 181 9.93 157 9.36 13,372 8.60 597.59 7.24 54.46 3.9050,000 60,000 1,467 2.88 399 3.13 5,217 10.39 1,828 4.81 118 6.48 97 5.78 9,126 5.87 499.39 6.05 56.40 4.0460,000 75,000 1,201 2.35 391 3.07 5,989 11.92 1,495 3.93 97 5.32 78 4.65 9,251 5.95 619.39 7.50 82.70 5.9275,000 100,000 912 1.79 333 2.61 5,733 11.41 1,221 3.21 96 5.27 48 2.86 8,343 5.37 715.47 8.66 114.28 8.18
100,000 150,000 693 1.36 288 2.26 4,198 8.36 1,014 2.67 55 3.02 29 1.73 6,277 4.04 757.77 9.18 152.32 10.90150,000 200,000 281 0.55 148 1.16 1,765 3.51 476 1.25 30 1.65 15 0.89 2,715 1.75 467.36 5.66 107.21 7.67200,000 275,000 203 0.40 94 0.74 1,380 2.75 495 1.30 23 1.26 13 0.78 2,208 1.42 513.22 6.21 126.48 9.05
Over 275,000 353 0.69 134 1.05 2,389 4.76 1,185 3.12 32 1.76 18 1.07 4,111 2.64 2,150.69 26.04 609.76 43.62
Totals 51,020 100 12,735 100 50,226 100 38,006 100 1,822 100 1,677 100 155,486 100 8,258.07 100 1,397.82 100
42
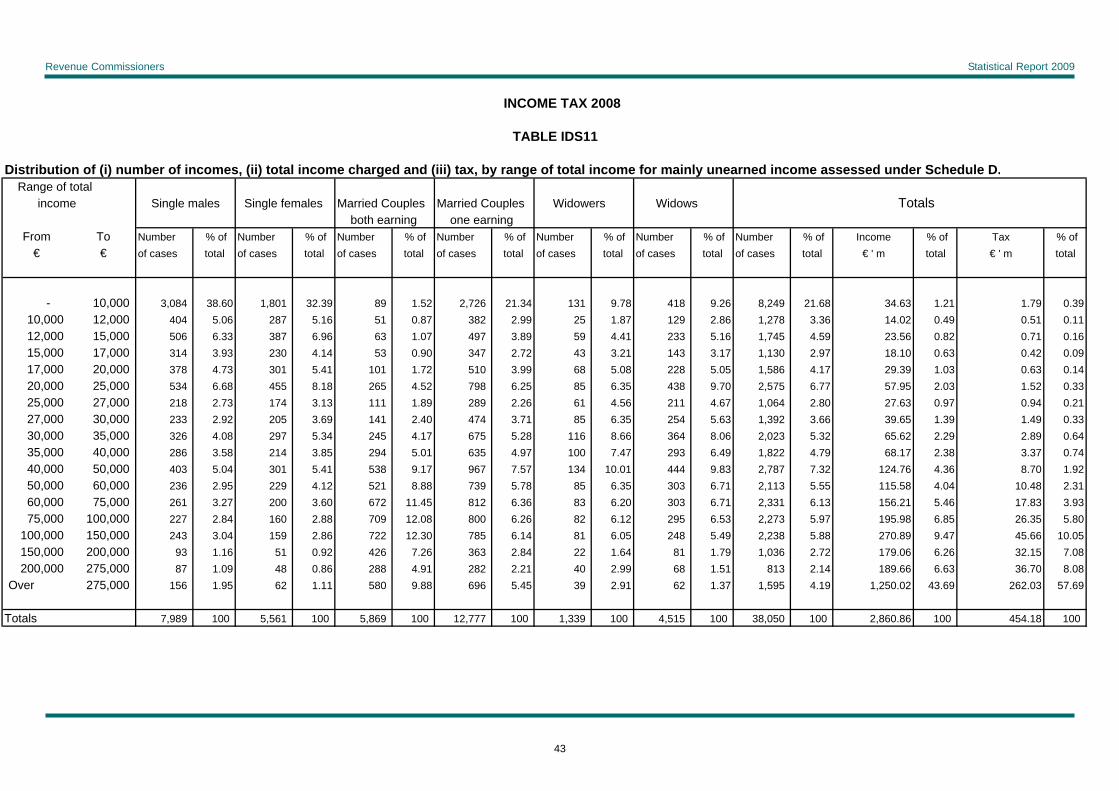
Revenue Commissioners Statistical Report 2009
INCOME TAX 2008
TABLE IDS11
Distribution of (i) number of incomes, (ii) total income charged and (iii) tax, by range of total income for mainly unearned income assessed under Schedule D. Range of total income Single males Single females Married Couples Married Couples Widowers Widows Totals
both earning one earningFrom To Number % of Number % of Number % of Number % of Number % of Number % of Number % of Income % of Tax % of
€ € of cases total of cases total of cases total of cases total of cases total of cases total of cases total € ' m total € ' m total
- 10,000 3,084 38.60 1,801 32.39 89 1.52 2,726 21.34 131 9.78 418 9.26 8,249 21.68 34.63 1.21 1.79 0.3910,000 12,000 404 5.06 287 5.16 51 0.87 382 2.99 25 1.87 129 2.86 1,278 3.36 14.02 0.49 0.51 0.1112,000 15,000 506 6.33 387 6.96 63 1.07 497 3.89 59 4.41 233 5.16 1,745 4.59 23.56 0.82 0.71 0.1615,000 17,000 314 3.93 230 4.14 53 0.90 347 2.72 43 3.21 143 3.17 1,130 2.97 18.10 0.63 0.42 0.0917,000 20,000 378 4.73 301 5.41 101 1.72 510 3.99 68 5.08 228 5.05 1,586 4.17 29.39 1.03 0.63 0.1420,000 25,000 534 6.68 455 8.18 265 4.52 798 6.25 85 6.35 438 9.70 2,575 6.77 57.95 2.03 1.52 0.3325,000 27,000 218 2.73 174 3.13 111 1.89 289 2.26 61 4.56 211 4.67 1,064 2.80 27.63 0.97 0.94 0.2127,000 30,000 233 2.92 205 3.69 141 2.40 474 3.71 85 6.35 254 5.63 1,392 3.66 39.65 1.39 1.49 0.3330,000 35,000 326 4.08 297 5.34 245 4.17 675 5.28 116 8.66 364 8.06 2,023 5.32 65.62 2.29 2.89 0.6435,000 40,000 286 3.58 214 3.85 294 5.01 635 4.97 100 7.47 293 6.49 1,822 4.79 68.17 2.38 3.37 0.7440,000 50,000 403 5.04 301 5.41 538 9.17 967 7.57 134 10.01 444 9.83 2,787 7.32 124.76 4.36 8.70 1.9250,000 60,000 236 2.95 229 4.12 521 8.88 739 5.78 85 6.35 303 6.71 2,113 5.55 115.58 4.04 10.48 2.3160,000 75,000 261 3.27 200 3.60 672 11.45 812 6.36 83 6.20 303 6.71 2,331 6.13 156.21 5.46 17.83 3.9375,000 100,000 227 2.84 160 2.88 709 12.08 800 6.26 82 6.12 295 6.53 2,273 5.97 195.98 6.85 26.35 5.80
100,000 150,000 243 3.04 159 2.86 722 12.30 785 6.14 81 6.05 248 5.49 2,238 5.88 270.89 9.47 45.66 10.05150,000 200,000 93 1.16 51 0.92 426 7.26 363 2.84 22 1.64 81 1.79 1,036 2.72 179.06 6.26 32.15 7.08200,000 275,000 87 1.09 48 0.86 288 4.91 282 2.21 40 2.99 68 1.51 813 2.14 189.66 6.63 36.70 8.08
Over 275,000 156 1.95 62 1.11 580 9.88 696 5.45 39 2.91 62 1.37 1,595 4.19 1,250.02 43.69 262.03 57.69
Totals 7,989 100 5,561 100 5,869 100 12,777 100 1,339 100 4,515 100 38,050 100 2,860.86 100 454.18 100
43
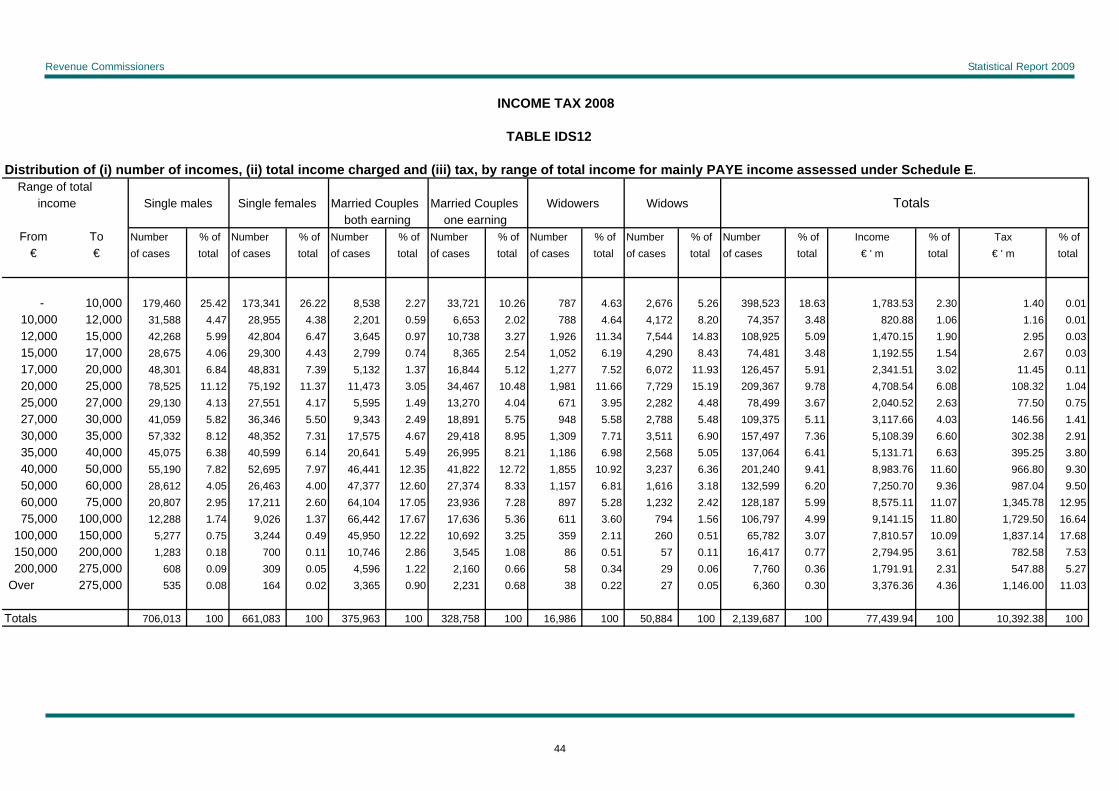
Revenue Commissioners Statistical Report 2009
INCOME TAX 2008
TABLE IDS12
Distribution of (i) number of incomes, (ii) total income charged and (iii) tax, by range of total income for mainly PAYE income assessed under Schedule E. Range of total income Single males Single females Married Couples Married Couples Widowers Widows Totals
both earning one earningFrom To Number % of Number % of Number % of Number % of Number % of Number % of Number % of Income % of Tax % of
€ € of cases total of cases total of cases total of cases total of cases total of cases total of cases total € ' m total € ' m total
- 10,000 179,460 25.42 173,341 26.22 8,538 2.27 33,721 10.26 787 4.63 2,676 5.26 398,523 18.63 1,783.53 2.30 1.40 0.0110,000 12,000 31,588 4.47 28,955 4.38 2,201 0.59 6,653 2.02 788 4.64 4,172 8.20 74,357 3.48 820.88 1.06 1.16 0.0112,000 15,000 42,268 5.99 42,804 6.47 3,645 0.97 10,738 3.27 1,926 11.34 7,544 14.83 108,925 5.09 1,470.15 1.90 2.95 0.0315,000 17,000 28,675 4.06 29,300 4.43 2,799 0.74 8,365 2.54 1,052 6.19 4,290 8.43 74,481 3.48 1,192.55 1.54 2.67 0.0317,000 20,000 48,301 6.84 48,831 7.39 5,132 1.37 16,844 5.12 1,277 7.52 6,072 11.93 126,457 5.91 2,341.51 3.02 11.45 0.1120,000 25,000 78,525 11.12 75,192 11.37 11,473 3.05 34,467 10.48 1,981 11.66 7,729 15.19 209,367 9.78 4,708.54 6.08 108.32 1.0425,000 27,000 29,130 4.13 27,551 4.17 5,595 1.49 13,270 4.04 671 3.95 2,282 4.48 78,499 3.67 2,040.52 2.63 77.50 0.7527,000 30,000 41,059 5.82 36,346 5.50 9,343 2.49 18,891 5.75 948 5.58 2,788 5.48 109,375 5.11 3,117.66 4.03 146.56 1.4130,000 35,000 57,332 8.12 48,352 7.31 17,575 4.67 29,418 8.95 1,309 7.71 3,511 6.90 157,497 7.36 5,108.39 6.60 302.38 2.9135,000 40,000 45,075 6.38 40,599 6.14 20,641 5.49 26,995 8.21 1,186 6.98 2,568 5.05 137,064 6.41 5,131.71 6.63 395.25 3.8040,000 50,000 55,190 7.82 52,695 7.97 46,441 12.35 41,822 12.72 1,855 10.92 3,237 6.36 201,240 9.41 8,983.76 11.60 966.80 9.3050,000 60,000 28,612 4.05 26,463 4.00 47,377 12.60 27,374 8.33 1,157 6.81 1,616 3.18 132,599 6.20 7,250.70 9.36 987.04 9.5060,000 75,000 20,807 2.95 17,211 2.60 64,104 17.05 23,936 7.28 897 5.28 1,232 2.42 128,187 5.99 8,575.11 11.07 1,345.78 12.9575,000 100,000 12,288 1.74 9,026 1.37 66,442 17.67 17,636 5.36 611 3.60 794 1.56 106,797 4.99 9,141.15 11.80 1,729.50 16.64
100,000 150,000 5,277 0.75 3,244 0.49 45,950 12.22 10,692 3.25 359 2.11 260 0.51 65,782 3.07 7,810.57 10.09 1,837.14 17.68150,000 200,000 1,283 0.18 700 0.11 10,746 2.86 3,545 1.08 86 0.51 57 0.11 16,417 0.77 2,794.95 3.61 782.58 7.53200,000 275,000 608 0.09 309 0.05 4,596 1.22 2,160 0.66 58 0.34 29 0.06 7,760 0.36 1,791.91 2.31 547.88 5.27
Over 275,000 535 0.08 164 0.02 3,365 0.90 2,231 0.68 38 0.22 27 0.05 6,360 0.30 3,376.36 4.36 1,146.00 11.03
Totals 706,013 100 661,083 100 375,963 100 328,758 100 16,986 100 50,884 100 2,139,687 100 77,439.94 100 10,392.38 100
44
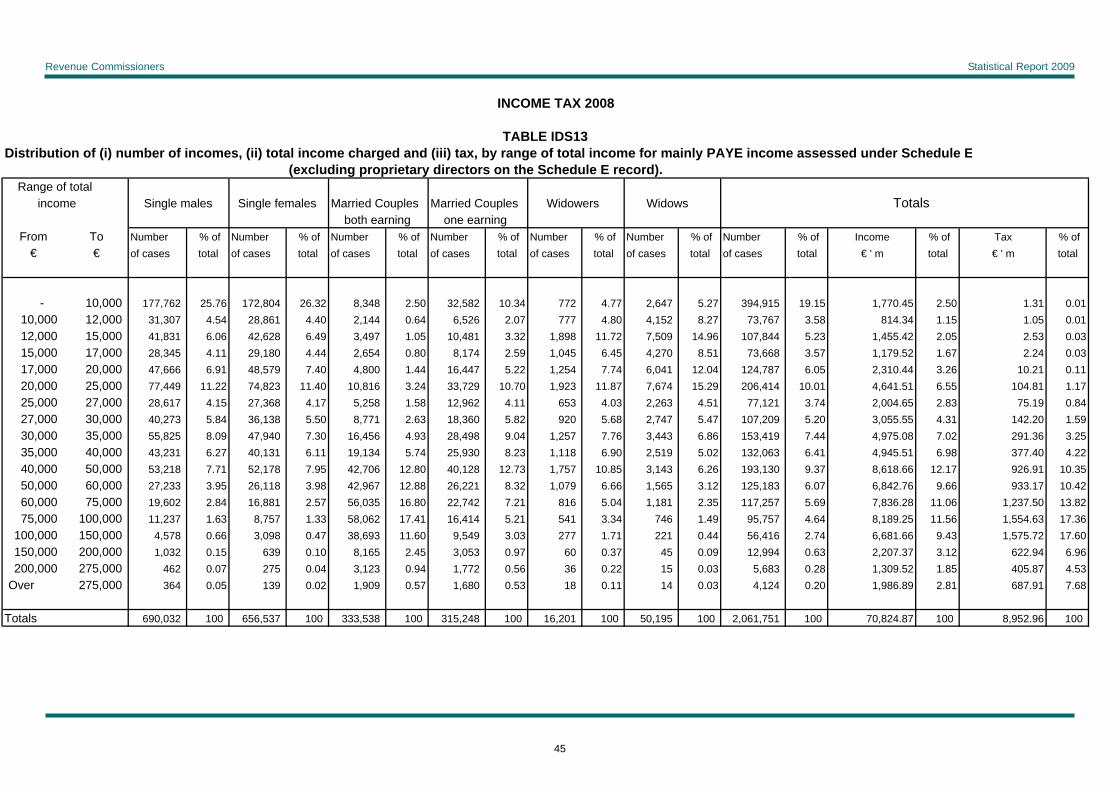
Revenue Commissioners Statistical Report 2009
INCOME TAX 2008
TABLE IDS13Distribution of (i) number of incomes, (ii) total income charged and (iii) tax, by range of total income for mainly PAYE income assessed under Schedule E
(excluding proprietary directors on the Schedule E record). Range of total income Single males Single females Married Couples Married Couples Widowers Widows Totals
both earning one earningFrom To Number % of Number % of Number % of Number % of Number % of Number % of Number % of Income % of Tax % of
€ € of cases total of cases total of cases total of cases total of cases total of cases total of cases total € ' m total € ' m total
- 10,000 177,762 25.76 172,804 26.32 8,348 2.50 32,582 10.34 772 4.77 2,647 5.27 394,915 19.15 1,770.45 2.50 1.31 0.0110,000 12,000 31,307 4.54 28,861 4.40 2,144 0.64 6,526 2.07 777 4.80 4,152 8.27 73,767 3.58 814.34 1.15 1.05 0.0112,000 15,000 41,831 6.06 42,628 6.49 3,497 1.05 10,481 3.32 1,898 11.72 7,509 14.96 107,844 5.23 1,455.42 2.05 2.53 0.0315,000 17,000 28,345 4.11 29,180 4.44 2,654 0.80 8,174 2.59 1,045 6.45 4,270 8.51 73,668 3.57 1,179.52 1.67 2.24 0.0317,000 20,000 47,666 6.91 48,579 7.40 4,800 1.44 16,447 5.22 1,254 7.74 6,041 12.04 124,787 6.05 2,310.44 3.26 10.21 0.1120,000 25,000 77,449 11.22 74,823 11.40 10,816 3.24 33,729 10.70 1,923 11.87 7,674 15.29 206,414 10.01 4,641.51 6.55 104.81 1.1725,000 27,000 28,617 4.15 27,368 4.17 5,258 1.58 12,962 4.11 653 4.03 2,263 4.51 77,121 3.74 2,004.65 2.83 75.19 0.8427,000 30,000 40,273 5.84 36,138 5.50 8,771 2.63 18,360 5.82 920 5.68 2,747 5.47 107,209 5.20 3,055.55 4.31 142.20 1.5930,000 35,000 55,825 8.09 47,940 7.30 16,456 4.93 28,498 9.04 1,257 7.76 3,443 6.86 153,419 7.44 4,975.08 7.02 291.36 3.2535,000 40,000 43,231 6.27 40,131 6.11 19,134 5.74 25,930 8.23 1,118 6.90 2,519 5.02 132,063 6.41 4,945.51 6.98 377.40 4.2240,000 50,000 53,218 7.71 52,178 7.95 42,706 12.80 40,128 12.73 1,757 10.85 3,143 6.26 193,130 9.37 8,618.66 12.17 926.91 10.3550,000 60,000 27,233 3.95 26,118 3.98 42,967 12.88 26,221 8.32 1,079 6.66 1,565 3.12 125,183 6.07 6,842.76 9.66 933.17 10.4260,000 75,000 19,602 2.84 16,881 2.57 56,035 16.80 22,742 7.21 816 5.04 1,181 2.35 117,257 5.69 7,836.28 11.06 1,237.50 13.8275,000 100,000 11,237 1.63 8,757 1.33 58,062 17.41 16,414 5.21 541 3.34 746 1.49 95,757 4.64 8,189.25 11.56 1,554.63 17.36
100,000 150,000 4,578 0.66 3,098 0.47 38,693 11.60 9,549 3.03 277 1.71 221 0.44 56,416 2.74 6,681.66 9.43 1,575.72 17.60150,000 200,000 1,032 0.15 639 0.10 8,165 2.45 3,053 0.97 60 0.37 45 0.09 12,994 0.63 2,207.37 3.12 622.94 6.96200,000 275,000 462 0.07 275 0.04 3,123 0.94 1,772 0.56 36 0.22 15 0.03 5,683 0.28 1,309.52 1.85 405.87 4.53
Over 275,000 364 0.05 139 0.02 1,909 0.57 1,680 0.53 18 0.11 14 0.03 4,124 0.20 1,986.89 2.81 687.91 7.68
Totals 690,032 100 656,537 100 333,538 100 315,248 100 16,201 100 50,195 100 2,061,751 100 70,824.87 100 8,952.96 100
45
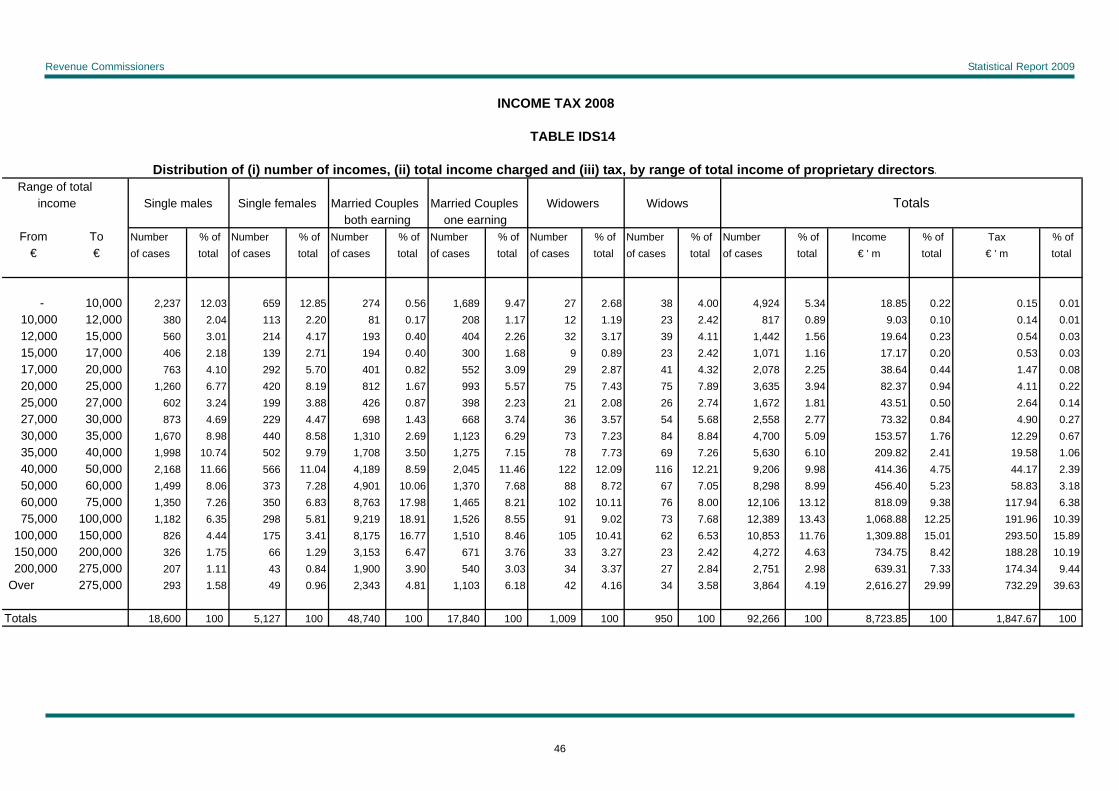
Revenue Commissioners Statistical Report 2009
INCOME TAX 2008
TABLE IDS14
Distribution of (i) number of incomes, (ii) total income charged and (iii) tax, by range of total income of proprietary directors. Range of total income Single males Single females Married Couples Married Couples Widowers Widows Totals
both earning one earningFrom To Number % of Number % of Number % of Number % of Number % of Number % of Number % of Income % of Tax % of
€ € of cases total of cases total of cases total of cases total of cases total of cases total of cases total € ' m total € ' m total
- 10,000 2,237 12.03 659 12.85 274 0.56 1,689 9.47 27 2.68 38 4.00 4,924 5.34 18.85 0.22 0.15 0.0110,000 12,000 380 2.04 113 2.20 81 0.17 208 1.17 12 1.19 23 2.42 817 0.89 9.03 0.10 0.14 0.0112,000 15,000 560 3.01 214 4.17 193 0.40 404 2.26 32 3.17 39 4.11 1,442 1.56 19.64 0.23 0.54 0.0315,000 17,000 406 2.18 139 2.71 194 0.40 300 1.68 9 0.89 23 2.42 1,071 1.16 17.17 0.20 0.53 0.0317,000 20,000 763 4.10 292 5.70 401 0.82 552 3.09 29 2.87 41 4.32 2,078 2.25 38.64 0.44 1.47 0.0820,000 25,000 1,260 6.77 420 8.19 812 1.67 993 5.57 75 7.43 75 7.89 3,635 3.94 82.37 0.94 4.11 0.2225,000 27,000 602 3.24 199 3.88 426 0.87 398 2.23 21 2.08 26 2.74 1,672 1.81 43.51 0.50 2.64 0.1427,000 30,000 873 4.69 229 4.47 698 1.43 668 3.74 36 3.57 54 5.68 2,558 2.77 73.32 0.84 4.90 0.2730,000 35,000 1,670 8.98 440 8.58 1,310 2.69 1,123 6.29 73 7.23 84 8.84 4,700 5.09 153.57 1.76 12.29 0.6735,000 40,000 1,998 10.74 502 9.79 1,708 3.50 1,275 7.15 78 7.73 69 7.26 5,630 6.10 209.82 2.41 19.58 1.0640,000 50,000 2,168 11.66 566 11.04 4,189 8.59 2,045 11.46 122 12.09 116 12.21 9,206 9.98 414.36 4.75 44.17 2.3950,000 60,000 1,499 8.06 373 7.28 4,901 10.06 1,370 7.68 88 8.72 67 7.05 8,298 8.99 456.40 5.23 58.83 3.1860,000 75,000 1,350 7.26 350 6.83 8,763 17.98 1,465 8.21 102 10.11 76 8.00 12,106 13.12 818.09 9.38 117.94 6.3875,000 100,000 1,182 6.35 298 5.81 9,219 18.91 1,526 8.55 91 9.02 73 7.68 12,389 13.43 1,068.88 12.25 191.96 10.39
100,000 150,000 826 4.44 175 3.41 8,175 16.77 1,510 8.46 105 10.41 62 6.53 10,853 11.76 1,309.88 15.01 293.50 15.89150,000 200,000 326 1.75 66 1.29 3,153 6.47 671 3.76 33 3.27 23 2.42 4,272 4.63 734.75 8.42 188.28 10.19200,000 275,000 207 1.11 43 0.84 1,900 3.90 540 3.03 34 3.37 27 2.84 2,751 2.98 639.31 7.33 174.34 9.44
Over 275,000 293 1.58 49 0.96 2,343 4.81 1,103 6.18 42 4.16 34 3.58 3,864 4.19 2,616.27 29.99 732.29 39.63
Totals 18,600 100 5,127 100 48,740 100 17,840 100 1,009 100 950 100 92,266 100 8,723.85 100 1,847.67 100
46
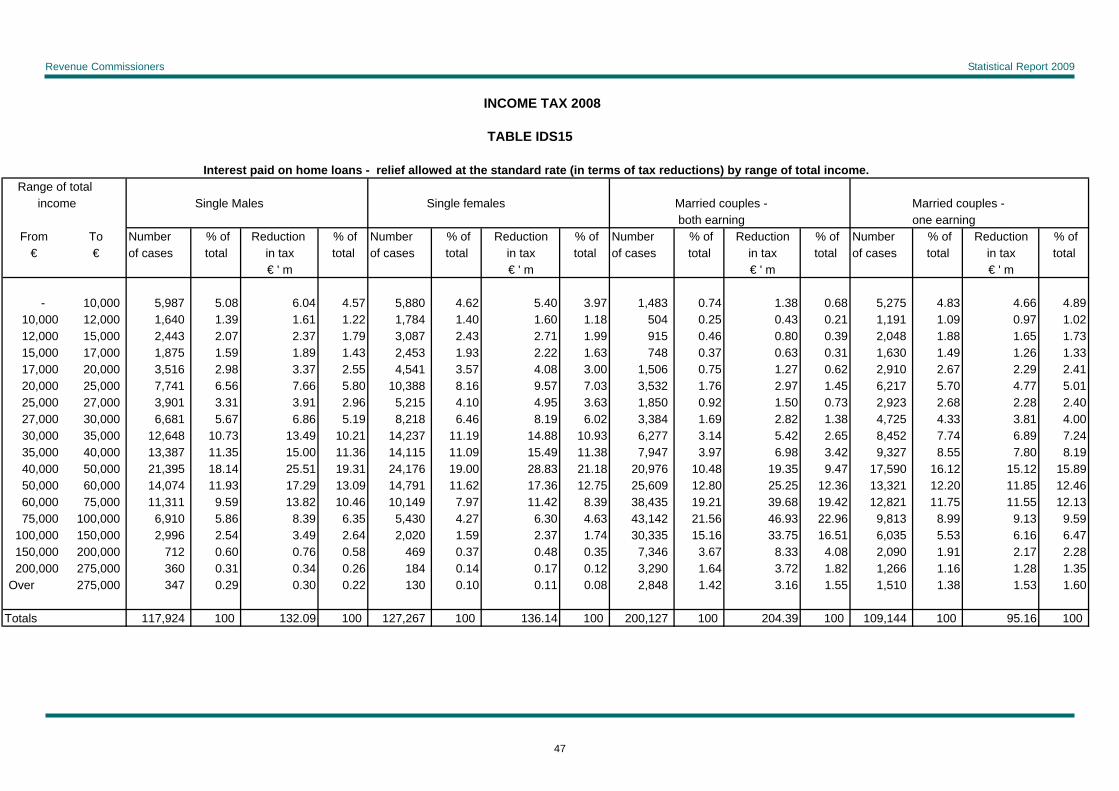
Revenue Commissioners Statistical Report 2009
INCOME TAX 2008
TABLE IDS15
Interest paid on home loans - relief allowed at the standard rate (in terms of tax reductions) by range of total income. Range of total income Single Males Single females Married couples - Married couples -
both earning one earningFrom To Number % of Reduction % of Number % of Reduction % of Number % of Reduction % of Number % of Reduction % of
€ € of cases total in tax total of cases total in tax total of cases total in tax total of cases total in tax total€ ' m € ' m € ' m € ' m
- 10,000 5,987 5.08 6.04 4.57 5,880 4.62 5.40 3.97 1,483 0.74 1.38 0.68 5,275 4.83 4.66 4.8910,000 12,000 1,640 1.39 1.61 1.22 1,784 1.40 1.60 1.18 504 0.25 0.43 0.21 1,191 1.09 0.97 1.0212,000 15,000 2,443 2.07 2.37 1.79 3,087 2.43 2.71 1.99 915 0.46 0.80 0.39 2,048 1.88 1.65 1.7315,000 17,000 1,875 1.59 1.89 1.43 2,453 1.93 2.22 1.63 748 0.37 0.63 0.31 1,630 1.49 1.26 1.3317,000 20,000 3,516 2.98 3.37 2.55 4,541 3.57 4.08 3.00 1,506 0.75 1.27 0.62 2,910 2.67 2.29 2.4120,000 25,000 7,741 6.56 7.66 5.80 10,388 8.16 9.57 7.03 3,532 1.76 2.97 1.45 6,217 5.70 4.77 5.0125,000 27,000 3,901 3.31 3.91 2.96 5,215 4.10 4.95 3.63 1,850 0.92 1.50 0.73 2,923 2.68 2.28 2.4027,000 30,000 6,681 5.67 6.86 5.19 8,218 6.46 8.19 6.02 3,384 1.69 2.82 1.38 4,725 4.33 3.81 4.0030,000 35,000 12,648 10.73 13.49 10.21 14,237 11.19 14.88 10.93 6,277 3.14 5.42 2.65 8,452 7.74 6.89 7.2435,000 40,000 13,387 11.35 15.00 11.36 14,115 11.09 15.49 11.38 7,947 3.97 6.98 3.42 9,327 8.55 7.80 8.1940,000 50,000 21,395 18.14 25.51 19.31 24,176 19.00 28.83 21.18 20,976 10.48 19.35 9.47 17,590 16.12 15.12 15.8950,000 60,000 14,074 11.93 17.29 13.09 14,791 11.62 17.36 12.75 25,609 12.80 25.25 12.36 13,321 12.20 11.85 12.4660,000 75,000 11,311 9.59 13.82 10.46 10,149 7.97 11.42 8.39 38,435 19.21 39.68 19.42 12,821 11.75 11.55 12.1375,000 100,000 6,910 5.86 8.39 6.35 5,430 4.27 6.30 4.63 43,142 21.56 46.93 22.96 9,813 8.99 9.13 9.59
100,000 150,000 2,996 2.54 3.49 2.64 2,020 1.59 2.37 1.74 30,335 15.16 33.75 16.51 6,035 5.53 6.16 6.47150,000 200,000 712 0.60 0.76 0.58 469 0.37 0.48 0.35 7,346 3.67 8.33 4.08 2,090 1.91 2.17 2.28200,000 275,000 360 0.31 0.34 0.26 184 0.14 0.17 0.12 3,290 1.64 3.72 1.82 1,266 1.16 1.28 1.35
Over 275,000 347 0.29 0.30 0.22 130 0.10 0.11 0.08 2,848 1.42 3.16 1.55 1,510 1.38 1.53 1.60
Totals 117,924 100 132.09 100 127,267 100 136.14 100 200,127 100 204.39 100 109,144 100 95.16 100
47
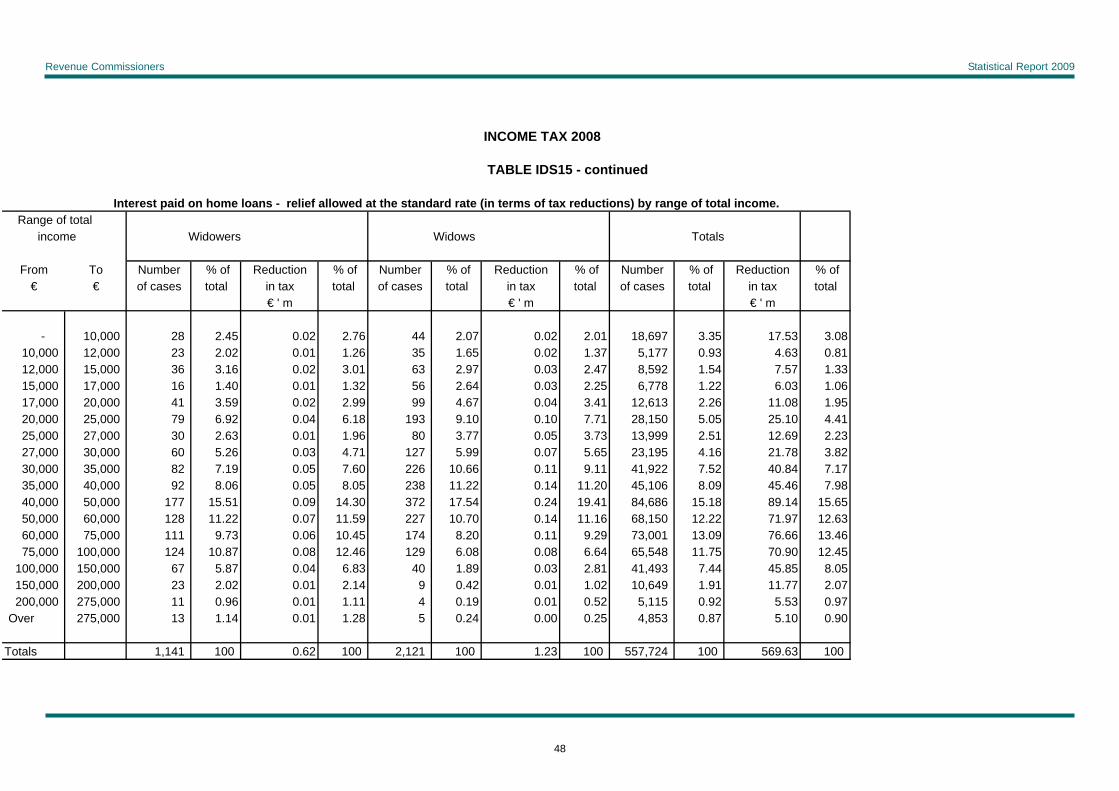
Revenue Commissioners Statistical Report 2009
Over 275,000 13 1.14 0.01 1.28 5 0.24 0.00 0.25 4,853 0.87 5.10 0.90
Totals 1,141 100 0.62 100 2,121 100 1.23 100 557,724 100 569.63 100
INCOME TAX 2008
TABLE IDS15 - continued
Interest paid on home loans - relief allowed at the standard rate (in terms of tax reductions) by range of total income. Range of total income Widowers Widows Totals
From To Number % of Reduction % of Number % of Reduction % of Number % of Reduction % of€ € of cases total in tax total of cases total in tax total of cases total in tax total
€ ' m € ' m € ' m
- 10,000 28 2.45 0.02 2.76 44 2.07 0.02 2.01 18,697 3.35 17.53 3.0810,000 12,000 23 2.02 0.01 1.26 35 1.65 0.02 1.37 5,177 0.93 4.63 0.8112,000 15,000 36 3.16 0.02 3.01 63 2.97 0.03 2.47 8,592 1.54 7.57 1.3315,000 17,000 16 1.40 0.01 1.32 56 2.64 0.03 2.25 6,778 1.22 6.03 1.0617,000 20,000 41 3.59 0.02 2.99 99 4.67 0.04 3.41 12,613 2.26 11.08 1.9520,000 25,000 79 6.92 0.04 6.18 193 9.10 0.10 7.71 28,150 5.05 25.10 4.4125,000 27,000 30 2.63 0.01 1.96 80 3.77 0.05 3.73 13,999 2.51 12.69 2.2327,000 30,000 60 5.26 0.03 4.71 127 5.99 0.07 5.65 23,195 4.16 21.78 3.8230,000 35,000 82 7.19 0.05 7.60 226 10.66 0.11 9.11 41,922 7.52 40.84 7.1735,000 40,000 92 8.06 0.05 8.05 238 11.22 0.14 11.20 45,106 8.09 45.46 7.9840,000 50,000 177 15.51 0.09 14.30 372 17.54 0.24 19.41 84,686 15.18 89.14 15.6550,000 60,000 128 11.22 0.07 11.59 227 10.70 0.14 11.16 68,150 12.22 71.97 12.6360,000 75,000 111 9.73 0.06 10.45 174 8.20 0.11 9.29 73,001 13.09 76.66 13.4675,000 100,000 124 10.87 0.08 12.46 129 6.08 0.08 6.64 65,548 11.75 70.90 12.45
100,000 150,000 67 5.87 0.04 6.83 40 1.89 0.03 2.81 41,493 7.44 45.85 8.05150,000 200,000 23 2.02 0.01 2.14 9 0.42 0.01 1.02 10,649 1.91 11.77 2.07200,000 275,000 11 0.96 0.01 1.11 4 0.19 0.01 0.52 5,115 0.92 5.53 0.97
48

Revenue Commissioners Statistical Report 2009
From To Number % of Income % of Tax % of Number % of Income % of Tax % of Number % of Income % of Tax % of
- 10,000 188,205 24.97 889.62 4.58 3.23 0.13 175,329 26.00 807.78 4.95 1.50 0.08 9,472 2.24 50.01 0.16 6.77 0.14
INCOME TAX 2008
TABLE IDS16
Distribution of (i) number of taxable incomes, (ii) total taxable income and (iii) tax, by range of taxable income. Range of taxable income Single males Single females Married couples - both earning
€ € of cases total € ' m total € ' m total of cases total € ' m total € ' m total of cases total € ' m total € ' m total
10,000 12,000 35,483 4.71 391.32 2.01 1.90 0.08 30,024 4.45 330.84 2.03 0.71 0.04 2,624 0.62 28.93 0.10 0.04 0.0012,000 15,000
15,000 17,000
47,120 31,661
6.254.20
635.65506.70
3.272.61
5.164.61
0.210.19
44,304 30,287
6.574.49
598.07485.01
3.662.97
1.791.49
0.100.08
4,445 3,488
1.050.82
60.3055.94
0.200.18
0.090.10
0.000.00
17,000 20,000 52,589 6.98 973.00 5.00 11.97 0.48 50,556 7.50 935.33 5.73 5.68 0.31 6,716 1.59 124.61 0.41 0.45 0.0120,000 25,000 84,803 11.25 1,906.07 9.80 70.03 2.83 77,591 11.51 1,743.53 10.68 48.08 2.66 14,166 3.34 320.48 1.05 1.42 0.0325,000 27,000 31,147 4.13 809.61 4.16 45.42 1.83 28,297 4.20 735.39 4.50 33.42 1.85 6,962 1.64 181.19 0.60 1.16 0.0227,000 30,000 43,536 5.78 1,241.38 6.38 83.24 3.36 37,206 5.52 1,059.32 6.49 60.52 3.35 11,850 2.80 337.49 1.11 3.01 0.0630,000 35,000 60,798 8.07 1,970.75 10.14 163.05 6.58 49,418 7.33 1,601.52 9.81 121.04 6.69 20,727 4.89 674.85 2.22 10.88 0.2235,000 40,000 47,662 6.32 1,780.32 9.16 191.98 7.75 41,177 6.11 1,540.88 9.44 158.91 8.78 23,598 5.57 886.54 2.92 21.83 0.4440,000 50,000 57,617 7.65 2,559.83 13.16 392.42 15.84 52,626 7.80 2,338.41 14.32 353.48 19.54 54,662 12.90 2,462.59 8.10 117.83 2.3650,000 60,000
60,000 75,000
29,649 21,626
3.932.87
1,615.421,437.45
8.317.39
324.69342.12
13.1013.81
26,355 17,150
3.912.54
1,434.471,136.56
8.796.96
284.91268.09
15.7514.82
53,851 71,369
12.7116.85
2,960.014,797.36
9.7415.79
231.29533.50
4.6310.68
75,000 100,000 12,783 1.70 1,084.24 5.58 297.34 12.00 9,086 1.35 767.59 4.70 209.10 11.56 69,909 16.50 6,006.12 19.76 981.80 19.66100,000 150,000 5,797 0.77 685.64 3.53 210.61 8.50 3,492 0.52 409.36 2.51 124.44 6.88 47,468 11.21 5,641.36 18.56 1,275.68 25.54150,000 200,000 1,507 0.20 257.88 1.33 85.64 3.46 812 0.12 138.74 0.85 45.84 2.53 11,672 2.76 1,986.85 6.54 550.30 11.02200,000 275,000 790 0.10 182.40 0.94 61.89 2.50 402 0.06 92.67 0.57 31.43 1.74 5,593 1.32 1,291.13 4.25 398.55 7.98
Over 275,000 846 0.11 517.54 2.66 182.74 7.37 293 0.04 168.96 1.03 58.53 3.24 5,033 1.19 2,523.08 8.30 860.40 17.22
Totals 753,619 100 19,444.82 100 2,478.03 100 674,405 100 16,324.41 100 1,808.96 100 423,605 100 30,388.85 100 4,995.10 100
49
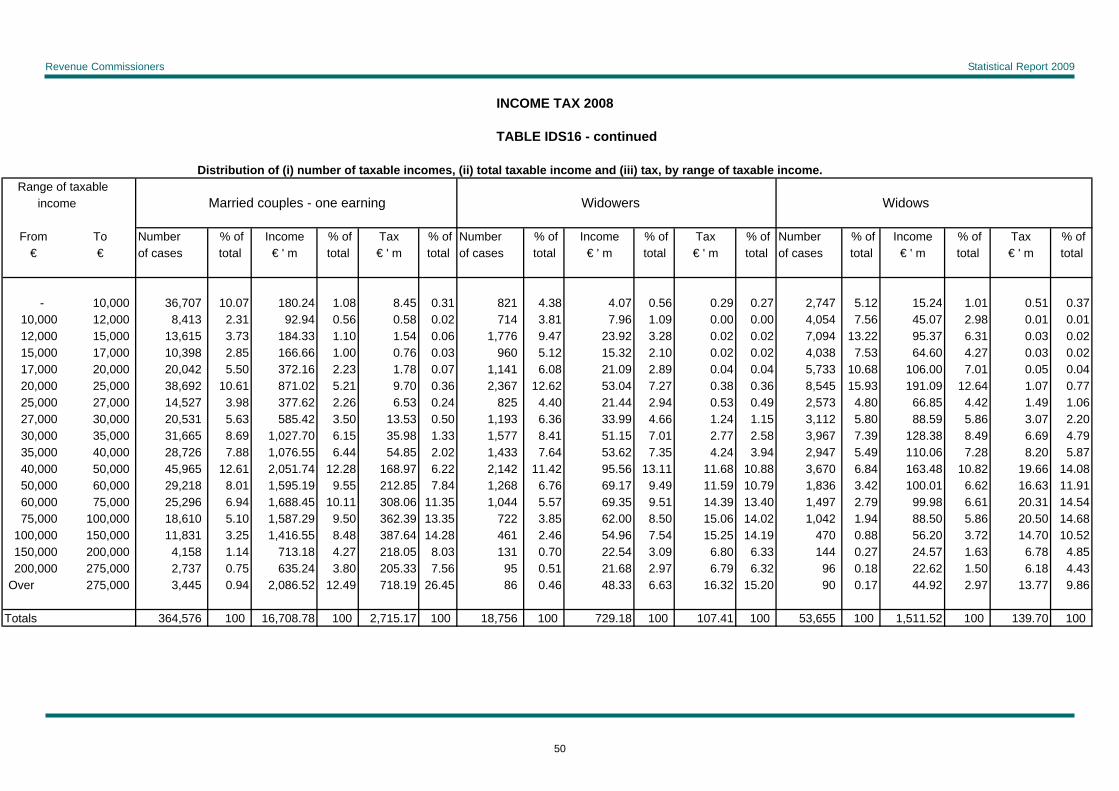
Revenue Commissioners Statistical Report 2009
INCOME TAX 2008
TABLE IDS16 - continued
Distribution of (i) number of taxable incomes, (ii) total taxable income and (iii) tax, by range of taxable income. Range of taxable income Married couples - one earning Widowers Widows
From To Number % of Income % of Tax % of Number % of Income % of Tax % of Number % of Income % of Tax % of€ € of cases total € ' m total € ' m total of cases total € ' m total € ' m total of cases total € ' m total € ' m total
- 10,000 3 6,707 10.07 180.24 1.08 8.45 0.31 821 4.38 4.07 0.56 0.29 0.27 2,747 5.12 15.24 1.01 0.51 0.3710,000 12,000 8,413 2.31 92.94 0.56 0.58 0.02 714 3.81 7.96 1.09 0.00 0.00 4,054 7.56 45.07 2.98 0.01 0.0112,000 15,000 1 3,615 3.73 184.33 1.10 1.54 0.06 1,776 9.47 23.92 3.28 0.02 0.02 7,094 13.22 95.37 6.31 0.03 0.0215,000 17,000 1 0,398 2.85 166.66 1.00 0.76 0.03 960 5.12 15.32 2.10 0.02 0.02 4,038 7.53 64.60 4.27 0.03 0.0217,000 20,000 2 0,042 5.50 372.16 2.23 1.78 0.07 1,141 6.08 21.09 2.89 0.04 0.04 5,733 10.68 106.00 7.01 0.05 0.0420,000 25,000 3 8,692 10.61 871.02 5.21 9.70 0.36 2,367 12.62 53.04 7.27 0.38 0.36 8,545 15.93 191.09 12.64 1.07 0.7725,000 27,000 1 4,527 3.98 377.62 2.26 6.53 0.24 825 4.40 21.44 2.94 0.53 0.49 2,573 4.80 66.85 4.42 1.49 1.0627,000 30,000 2 0,531 5.63 585.42 3.50 13.53 0.50 1,193 6.36 33.99 4.66 1.24 1.15 3,112 5.80 88.59 5.86 3.07 2.2030,000 35,000 3 1,665 8.69 1,027.70 6.15 35.98 1.33 1,577 8.41 51.15 7.01 2.77 2.58 3,967 7.39 128.38 8.49 6.69 4.7935,000 40,000 2 8,726 7.88 1,076.55 6.44 54.85 2.02 1,433 7.64 53.62 7.35 4.24 3.94 2,947 5.49 110.06 7.28 8.20 5.8740,000 50,000 4 5,965 12.61 2,051.74 12.28 168.97 6.22 2,142 11.42 95.56 13.11 11.68 10.88 3,670 6.84 163.48 10.82 19.66 14.0850,000 60,000 2 9,218 8.01 1,595.19 9.55 212.85 7.84 1,268 6.76 69.17 9.49 11.59 10.79 1,836 3.42 100.01 6.62 16.63 11.9160,000 75,000 2 5,296 6.94 1,688.45 10.11 308.06 11.35 1,044 5.57 69.35 9.51 14.39 13.40 1,497 2.79 99.98 6.61 20.31 14.5475,000 100,000 1 8,610 5.10 1,587.29 9.50 362.39 13.35 722 3.85 62.00 8.50 15.06 14.02 1,042 1.94 88.50 5.86 20.50 14.68
100,000 150,000 11,831 3.25 1,416.55 8.48 387.64 14.28 461 2.46 54.96 7.54 15.25 14.19 470 0.88 56.20 3.72 14.70 10.52150,000 200,000 4,158 1.14 713.18 4.27 218.05 8.03 131 0.70 22.54 3.09 6.80 6.33 144 0.27 24.57 1.63 6.78 4.85200,000 275,000 2,737 0.75 635.24 3.80 205.33 7.56 95 0.51 21.68 2.97 6.79 6.32 96 0.18 22.62 1.50 6.18 4.43
Over 275,000 3,445 0.94 2,086.52 12.49 718.19 26.45 86 0.46 48.33 6.63 16.32 15.20 90 0.17 44.92 2.97 13.77 9.86
Totals 364,576 100 16,708.78 100 2,715.17 100 18,756 100 729.18 100 107.41 100 53,655 100 1,511.52 100 139.70 100
50
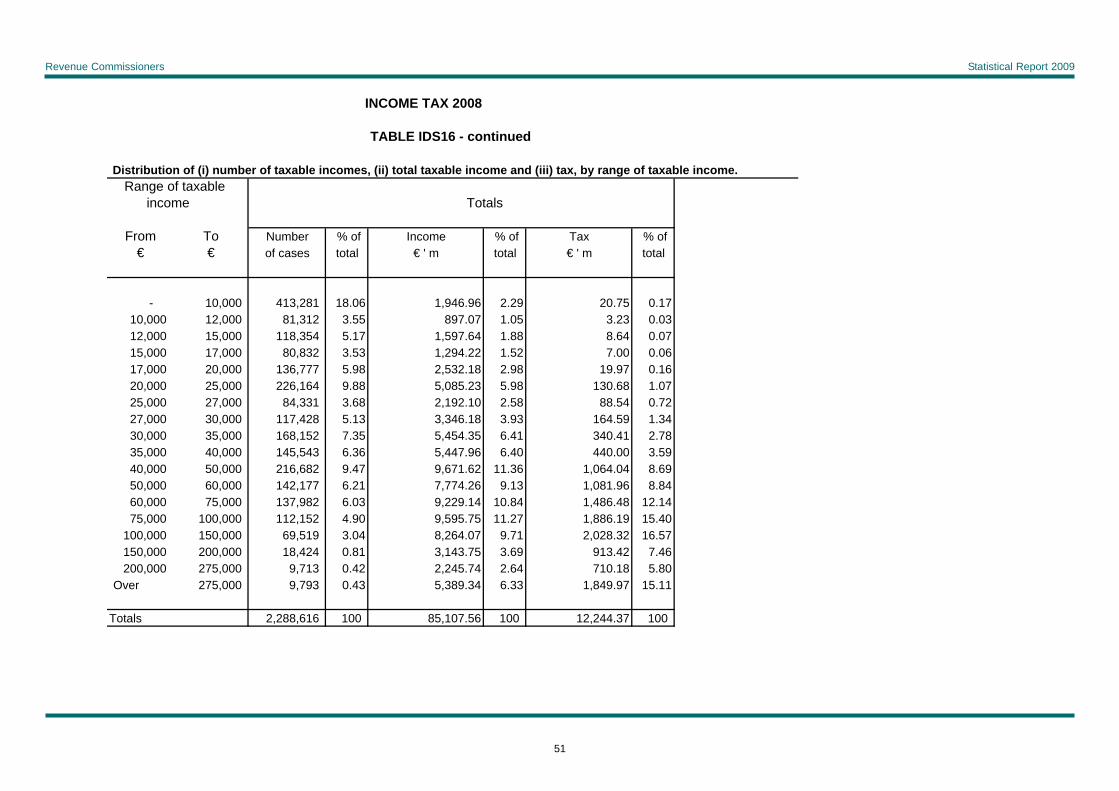
Revenue Commissioners Statistical Report 2009
INCOME TAX 2008
TABLE IDS16 - continued
Distribution of (i) number of taxable incomes, (ii) total taxable income and (iii) tax, by range of taxable income. Range of taxable income Totals
From To Number % of Income % of Tax % of€ € of cases total € ' m total € ' m total
- 10,000 413,281 18.06 1,946.96 2.29 20.75 0.1710,000 12,000 81,312 3.55 897.07 1.05 3.23 0.0312,000 15,000 118,354 5.17 1,597.64 1.88 8.64 0.0715,000 17,000 80,832 3.53 1,294.22 1.52 7.00 0.0617,000 20,000 136,777 5.98 2,532.18 2.98 19.97 0.1620,000 25,000 226,164 9.88 5,085.23 5.98 130.68 1.0725,000 27,000 84,331 3.68 2,192.10 2.58 88.54 0.7227,000 30,000 117,428 5.13 3,346.18 3.93 164.59 1.3430,000 35,000 168,152 7.35 5,454.35 6.41 340.41 2.7835,000 40,000 145,543 6.36 5,447.96 6.40 440.00 3.5940,000 50,000 216,682 9.47 9,671.62 11.36 1,064.04 8.6950,000 60,000 142,177 6.21 7,774.26 9.13 1,081.96 8.8460,000 75,000 137,982 6.03 9,229.14 10.84 1,486.48 12.1475,000 100,000 112,152 4.90 9,595.75 11.27 1,886.19 15.40
100,000 150,000 69,519 3.04 8,264.07 9.71 2,028.32 16.57150,000 200,000 18,424 0.81 3,143.75 3.69 913.42 7.46200,000 275,000 9,713 0.42 2,245.74 2.64 710.18 5.80
Over 275,000 9,793 0.43 5,389.34 6.33 1,849.97 15.11
Totals 2,288,616 100 85,107.56 100 12,244.37 100
51
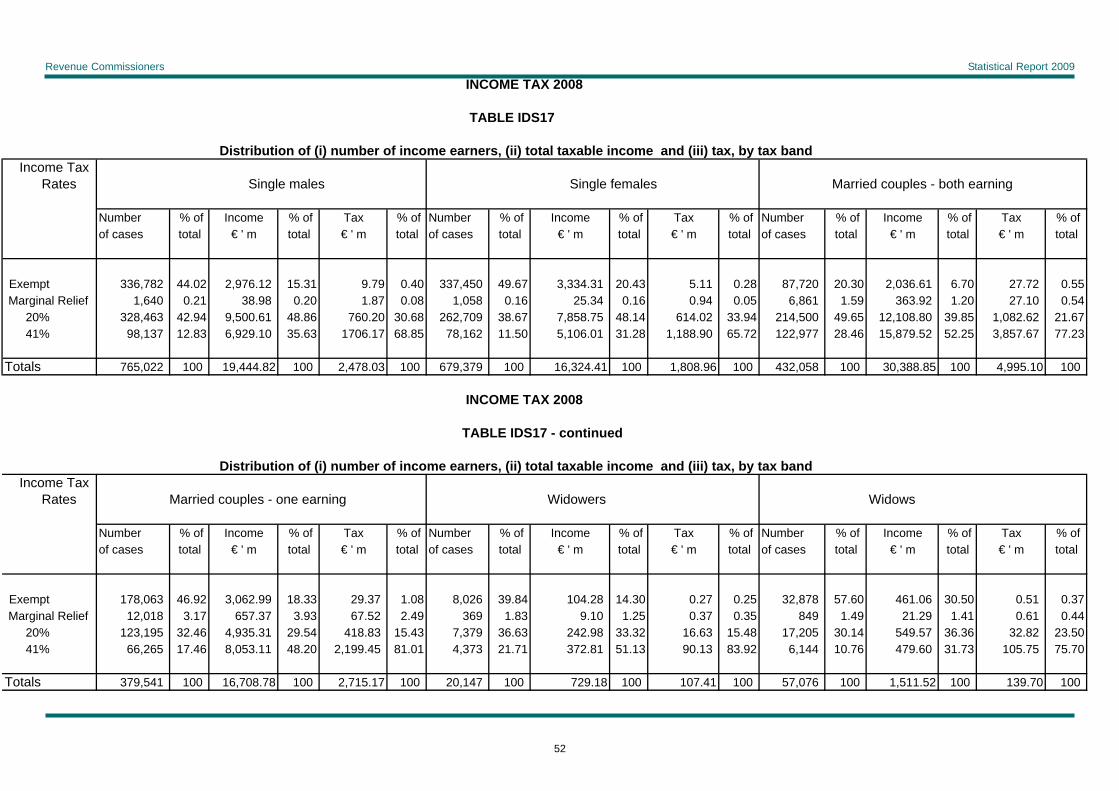
Revenue Commissioners Statistical Report 2009
INCOME TAX 2008
TABLE IDS17
Distribution of (i) number of income earners, (ii) total taxable income and (iii) tax, by tax band. Income Tax Rates Single males Single females Married couples - both earning
Number % of Income % of Tax % of Number % of Income % of Tax % of Number % of Income % of Tax % ofof cases total € ' m total € ' m total of cases total € ' m total € ' m total of cases total € ' m total € ' m total
Exempt 336,782 44.02 2,976.12 15.31 9.79 0.40 337,450 49.67 3,334. 31 20.43 5.11 0.28 87,720 20.30 2,036.61 6.70 2 7.72 0.55Marginal Relief 1,640 0.21 38.98 0.20 1.87 0.08 1,058 0.16 25. 34 0.16 0.94 0.05 6,861 1.59 363.92 1.20 2 7.10 0.54
20% 328,463 42.94 9,500.61 48.86 760.20 30.68 262,709 38.67 7,858. 75 48.14 614.02 33.94 214,500 49.65 12,108.80 39.85 1,08 2.62 21.6741% 98,137 12.83 6,929.10 35.63 1706.17 68.85 78,162 11.50 5,106. 01 31.28 1,188.90 65.72 122,977 28.46 15,879.52 52.25 3,85 7.67 77.23
Totals 765,022 100 19,444.82 100 2,478.03 100 679,379 100 16,324.41 100 1,808.96 100 432,058 1 00 30,388.85 100 4,995.10 100
INCOME TAX 2008
TABLE IDS17 - continued
Distribution of (i) number of income earners, (ii) total taxable income and (iii) tax, by tax band. Income Tax Rates Married couples - one earning Widowers Widows
Number % of Income % of Tax % of Number % of Income % of Tax % of Number % of Income % of Tax % ofof cases total € ' m total € ' m total of cases total € ' m total € ' m total of cases total € ' m total € ' m total
Exempt 178,063 46.92 3,062.99 18.33 29.37 1.08 8,026 39.84 104.28 14.30 0.27 0.25 32,878 57.60 461.06 30.50 0.51 0.37Marginal Relief 12,018 3.17 657.37 3.93 67.52 2.49 369 1.83 9.10 1.25 0.37 0.35 849 1.49 21.29 1.41 0.61 0.44
20% 123,195 32.46 4,935.31 29.54 418.83 15.43 7,379 36.63 242.98 33.32 16.63 15.48 17,205 30.14 549.57 36.36 32.82 23.5041% 66,265 17.46 8,053.11 48.20 2,199.45 81.01 4,373 21.71 372.81 51.13 90.13 83.92 6,144 10.76 479.60 31.73 105.75 75.70
Totals 379,541 100 16,708.78 100 2,715.17 100 20,147 100 729.18 100 107.41 100 57,076 100 1,511.52 100 139.70 100
52

Revenue Commissioners Statistical Report 2009
INCOME TAX 2008
TABLE IDS17 - continued
% of Tax % oftotal € ' m total
980,919 42.04 11,975.37 14.0722,795 0.98 1,116.00
953,451 40.86 35,196.02 41.35 376,058 16.12 36,820.16 43.26
Totals 100 85,107.56 12 37
0.000.80
24.4874.71
100
- 98.41
4.
2,997.899,148.07
,24
1.31
100
The figures at the 20% income tax rate include taxpayers whose nominal liability at 41% is fully covered by their tax credits.
Totals
Income€ ' m
Distribution of (i) number of income earners, (ii) total taxable income and (iii) tax, by tax band.
% oftotal
Numberof cases
2,333,223
Income Tax
Marginal Relief20%41%
Rates
Exempt
53
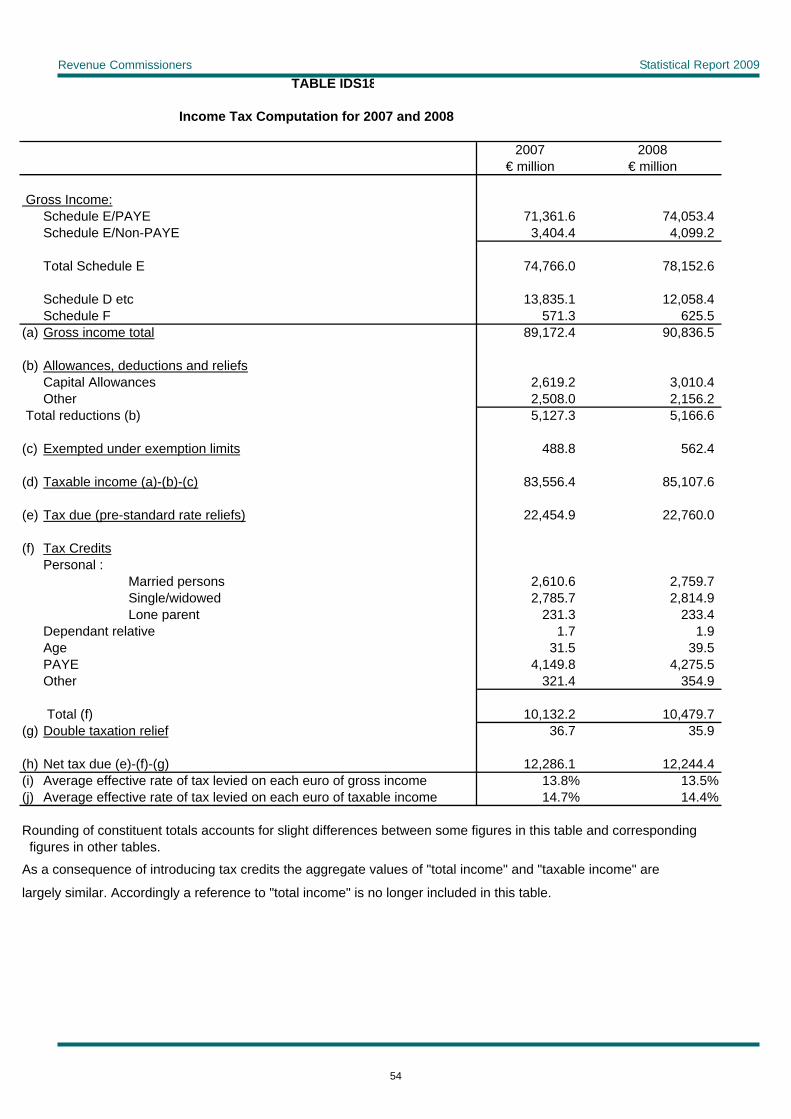
Revenue Commissioners Statistical Report 2009 TABLE IDS18
Income Tax Computation for 2007 and 2008
2007 2008€ million € million
Gross Income:Schedule E/PAYE 71,361.6 74,053.4 Schedule E/Non-PAYE 3,404.4 4,099.2
Total Schedule E 74,766.0 78,152.6
Schedule D etc 13,835.1 12,058.4 Schedule F 571.3 625.5
(a) Gross income total 89,172.4 90,836.5
(b) Allowances, deductions and reliefsCapital Allowances 2,619.2 3,010.4 Other 2,508.0 2,156.2
Total reductions (b) 5,127.3 5,166.6
(c) Exempted under exemption limits 488.8 562.4
(d) Taxable income (a)-(b)-(c) 83,556.4 85,107.6
(e) Tax due (pre-standard rate reliefs) 22,454.9 22,760.0
(f) Tax CreditsPersonal : Married persons 2,610.6 2,759.7 Single/widowed 2,785.7 2,814.9 Lone parent 231.3 233.4 Dependant relative 1.7 1.9 Age 31.5 39.5 PAYE 4,149.8 4,275.5 Other 321.4 354.9
Total (f) 10,132.2 10,479.7 (g) Double taxation relief 36.7 35.9
(h) Net tax due (e)-(f)-(g) 12,286.1 12,244.4 (i) Average effective rate of tax levied on each euro of gross income 13.8% 13.5%(j) Average effective rate of tax levied on each euro of taxable income 14.7% 14.4%
Rounding of constituent totals accounts for slight differences between some figures in this table and corresponding figures in other tables.
As a consequence of introducing tax credits the aggregate values of "total income" and "taxable income" are
largely similar. Accordingly a reference to "total income" is no longer included in this table.
54
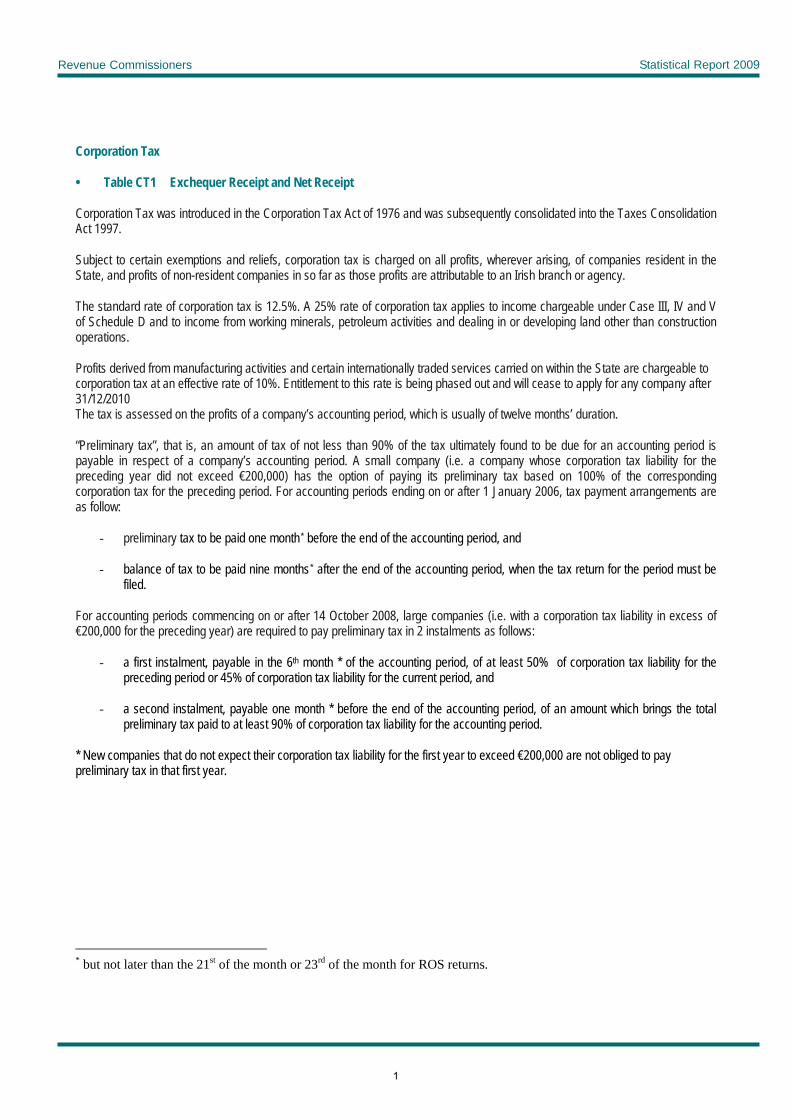
Revenue Commissioners Statistical Report 2009
Corporation Tax
• Table CT1 Exchequer Receipt and Net Receipt
Corporation Tax was introduced in the Corporation Tax Act of 1976 and was subsequently consolidated into the Taxes Consolidation Act 1997.
Subject to certain exemptions and reliefs, corporation tax is charged on all profits, wherever arising, of companies resident in the State, and profits of non-resident companies in so far as those profits are attributable to an Irish branch or agency.
The standard rate of corporation tax is 12.5%. A 25% rate of corporation tax applies to income chargeable under Case III, IV and V of Schedule D and to income from working minerals, petroleum activities and dealing in or developing land other than construction operations.
Profits derived from manufacturing activities and certain internationally traded services carried on within the State are chargeable to corporation tax at an effective rate of 10%. Entitlement to this rate is being phased out and will cease to apply for any company after 31/12/2010 The tax is assessed on the profits of a company’s accounting period, which is usually of twelve months’ duration.
“Preliminary tax”, that is, an amount of tax of not less than 90% of the tax ultimately found to be due for an accounting period is payable in respect of a company’s accounting period. A small company (i.e. a company whose corporation tax liability for the preceding year did not exceed €200,000) has the option of paying its preliminary tax based on 100% of the corresponding corporation tax for the preceding period. For accounting periods ending on or after 1 January 2006, tax payment arrangements are as follow:
- preliminary tax to be paid one month* before the end of the accounting period, and
- balance of tax to be paid nine months* after the end of the accounting period, when the tax return for the period must be filed.
For accounting periods commencing on or after 14 October 2008, large companies (i.e. with a corporation tax liability in excess of €200,000 for the preceding year) are required to pay preliminary tax in 2 instalments as follows:
- a first instalment, payable in the 6th month * of the accounting period, of at least 50% of corporation tax liability for the preceding period or 45% of corporation tax liability for the current period, and
- a second instalment, payable one month * before the end of the accounting period, of an amount which brings the total preliminary tax paid to at least 90% of corporation tax liability for the accounting period.
* New companies that do not expect their corporation tax liability for the first year to exceed €200,000 are not obliged to pay preliminary tax in that first year.
* but not later than the 21st of the month or 23rd of the month for ROS returns.
1
Revenue Commissioners Statistical Report 2009
TABLE CT1
Corporation TaxExchequer Receipt and Net Receipt
Exchequer Receipt Net Receipt€ €
2004 5,331,596,000 5,335,003,555
2005 5,491,687,000 5,503,243,749
2006 6,683,247,000 6,684,611,784
2007 6,390,625,000 6,393,392,320
2008 5,065,894,000 5,071,464,781
2009 3,900,306,000 3,889,451,342
Net Receipt (Corporation Tax)
4,000,000,000
4,500,000,000
5,000,000,000
5,500,000,000
6,000,000,000
6,500,000,000
7,000,000,000
2004 2005 2006 2007 2008 2009
€
2
Revenue Commissioners Statistical Report 2009
Corporation Tax Distribution Statistics
• Table CTS1. Corporation Tax Statistics. Distribution of Incomes and Tax for accounting periods ended in 2008
• Table CTS2. Corporation Tax Statistics. Distribution of selected allowances, reliefs and deductions for accounting periods ended in 2008
• Table CTS3. Corporation Tax for accounting periods ended in 2008
Tables CTS1 to CTS3 contain statistics which have been collected in the course of the administration of corporation tax.
Source of the data These statistics are based on the details taken from the corporation tax return form CT1 as entered on the live computer file. The 2008 statistics were taken from the live corporation tax file on 5August 2010.
The reference period for the corporation tax statistics Unlike income tax, there is no set year for corporation tax. In this report the focus is on accounting periods ended between 1 January 2008 and 31 December 2008.
The income classifier used in the statistics The main income concept on which the corporation tax statistics is based is “Net Trading Income”. In essence, Net Trading Income is trading profits from a company’s accounts, plus expenses not allowable for tax, minus tax depreciation. In Tables CTS1 and CTS2 the statistics are classified by ranges of Net Trading Income.
Corporation tax rates The standard rate was 12.5% for profits earned from 1 January, 2003 (other than trading income taxable at the special 10% or 25% rates). Profits are calculated by reference to company accounting periods.
Table CTS3 Table CTS3 shows all the items on the corporation tax return form CT1 for accounting periods ending in 2008 and their aggregate values as contained on the return forms filed in time to be included in the statistics. The table follows the sequence of the corporation tax assessment process in detail.
It should be noted that where a computation on the tax return produces a negative value for certain fields such as net trading income, net Case V or tax less reliefs, the corporation tax calculation resets the negative value to zero. For example, the deduction of €311.5 million of rental losses and rental capital allowances from the total rental income and rental balancing charges figure of €679.6 million would produce an apparent sum of €368.1million for net rental income- in fact, the actual net rental income figure is €551.6 million. Companies are therefore not always able to absorb the full amount of allowances and reliefs available to them.
It is no longer possible to provide information on fields such as taxable income at the different rates due to technical changes on Revenue’s computer system.
1
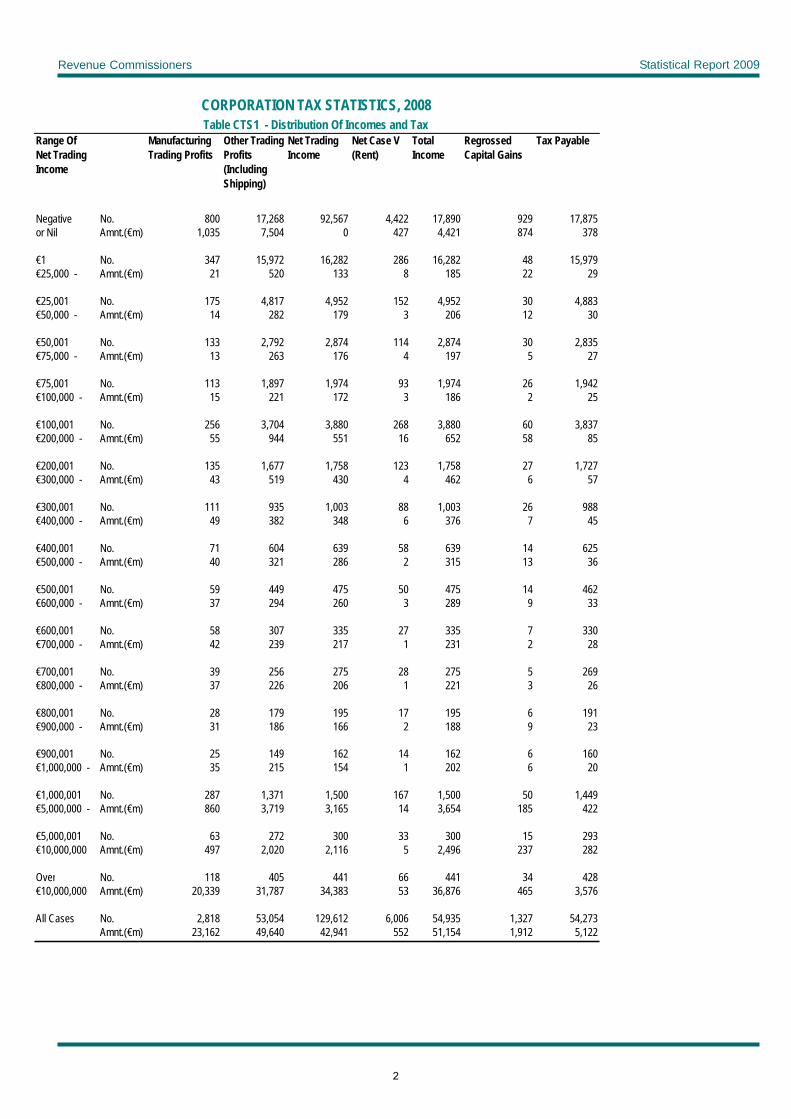
Revenue Commissioners Statistical Report 2009
CORPORATION TAX STATISTICS, 2008 Table CTS1 - Distribution Of Incomes and Tax
Range Of Manufacturing Other Trading Net Trading Net Case V Total Regrossed Tax Payable Net Trading Trading Profits Profits Income (Rent) Income Capital Gains Income (Including
Shipping)
Negative No. 800 17,268 92,567 4,422 17,890 929 17,875 or Nil Amnt.(€m) 1,035 7,504 0 427 4,421 874 378
€1 No. 347 15,972 16,282 286 16,282 48 15,979 €25,000 - Amnt.(€m) 21 520 133 8 185 22 29
€25,001 No. 175 4,817 4,952 152 4,952 30 4,883 €50,000 - Amnt.(€m) 14 282 179 3 206 12 30
€50,001 No. 133 2,792 2,874 114 2,874 30 2,835 €75,000 - Amnt.(€m) 13 263 176 4 197 5 27
€75,001 No. 113 1,897 1,974 93 1,974 26 1,942 €100,000 - Amnt.(€m) 15 221 172 3 186 2 25
€100,001 No. 256 3,704 3,880 268 3,880 60 3,837 €200,000 - Amnt.(€m) 55 944 551 16 652 58 85
€200,001 No. 135 1,677 1,758 123 1,758 27 1,727 €300,000 - Amnt.(€m) 43 519 430 4 462 6 57
€300,001 No. 111 935 1,003 88 1,003 26 988 €400,000 - Amnt.(€m) 49 382 348 6 376 7 45
€400,001 No. 71 604 639 58 639 14 625 €500,000 - Amnt.(€m) 40 321 286 2 315 13 36
€500,001 No. 59 449 475 50 475 14 462 €600,000 - Amnt.(€m) 37 294 260 3 289 9 33
€600,001 No. 58 307 335 27 335 7 330 €700,000 - Amnt.(€m) 42 239 217 1 231 2 28
€700,001 No. 39 256 275 28 275 5 269 €800,000 - Amnt.(€m) 37 226 206 1 221 3 26
€800,001 No. 28 179 195 17 195 6 191 €900,000 - Amnt.(€m) 31 186 166 2 188 9 23
€900,001 No. 25 149 162 14 162 6 160 €1,000,000 - Amnt.(€m) 35 215 154 1 202 6 20
€1,000,001 No. 287 1,371 1,500 167 1,500 50 1,449 €5,000,000 - Amnt.(€m) 860 3,719 3,165 14 3,654 185 422
€5,000,001 No. 63 272 300 33 300 15 293 €10,000,000 Amnt.(€m) 497 2,020 2,116 5 2,496 237 282
Over No. 118 405 441 66 441 34 428 €10,000,000 Amnt.(€m) 20,339 31,787 34,383 53 36,876 465 3,576
All Cases No. 2,818 53,054 129,612 6,006 54,935 1,327 54,273 Amnt.(€m) 23,162 49,640 42,941 552 51,154 1,912 5,122
2
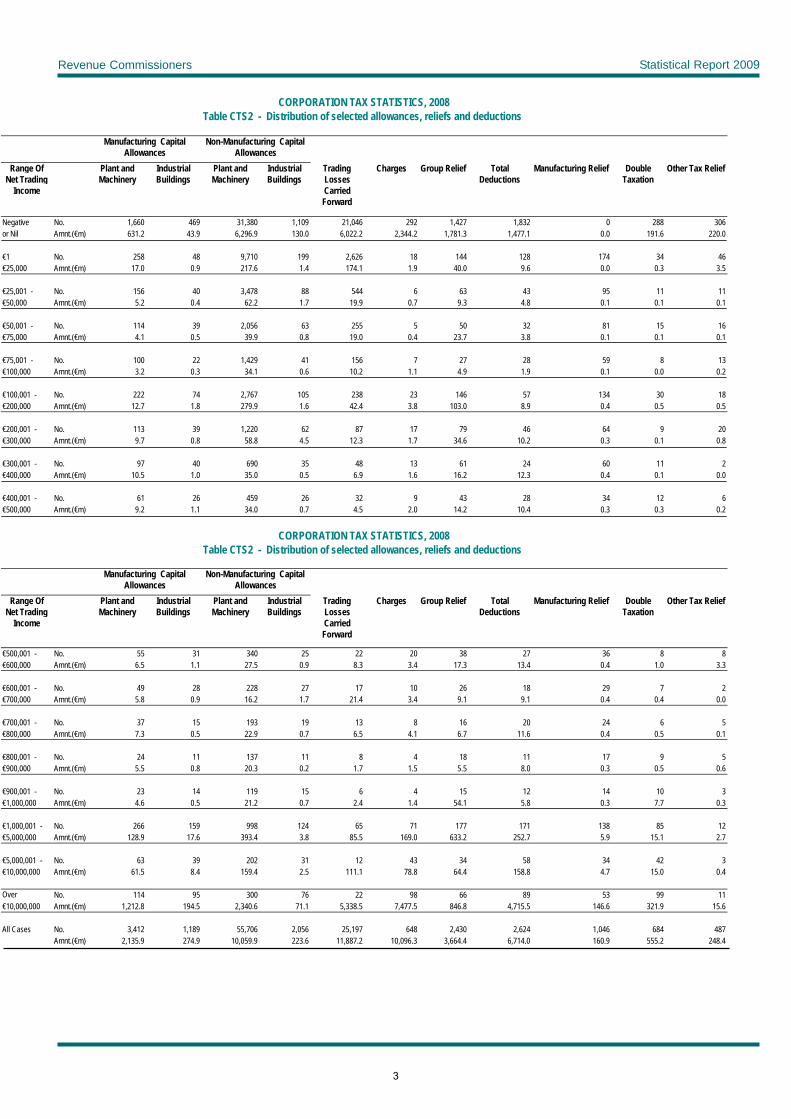
Revenue Commissioners Statistical Report 2009
CORPORATION TAX STATISTICS, 2008 Table CTS2 - Distribution of selected allowances, reliefs and deductions
Range Of Net Trading
Income
Manufacturing Capital Allowances
Non-Manufacturing Capital Allowances
Plant and Machinery
Industrial Buildings
Plant and Machinery
Industrial Buildings
Trading Losses Carried Forward
Charges Group Relief Total Deductions
Manufacturing Relief Double Taxation
Other Tax Relief
Negative No. or Nil Amnt.(€m)
1,660 469 31,380 1,109 21,046 292 1,427 1,832 0 631.2 43.9 6,296.9 130.0 6,022.2 2,344.2 1,781.3 1,477.1 0.0
288 306 191.6 220.0
€1 No. €25,000 Amnt.(€m)
258 48 9,710 199 2,626 18 144 128 174 17.0 0.9 217.6 1.4 174.1 1.9 40.0 9.6 0.0
34 46 0.3 3.5
€25,001 - No. €50,000 Amnt.(€m)
156 40 3,478 88 544 6 63 43 95 5.2 0.4 62.2 1.7 19.9 0.7 9.3 4.8 0.1
11 11 0.1 0.1
€50,001 - No. €75,000 Amnt.(€m)
114 39 2,056 63 255 5 50 32 81 4.1 0.5 39.9 0.8 19.0 0.4 23.7 3.8 0.1
15 16 0.1 0.1
€75,001 - No. €100,000 Amnt.(€m)
100 22 1,429 41 156 7 27 28 59 3.2 0.3 34.1 0.6 10.2 1.1 4.9 1.9 0.1
8 13 0.0 0.2
€100,001 - No. €200,000 Amnt.(€m)
222 74 2,767 105 238 23 146 57 134 12.7 1.8 279.9 1.6 42.4 3.8 103.0 8.9 0.4
30 18 0.5 0.5
€200,001 - No. €300,000 Amnt.(€m)
113 39 1,220 62 87 17 79 46 64 9.7 0.8 58.8 4.5 12.3 1.7 34.6 10.2 0.3
9 20 0.1 0.8
€300,001 - No. €400,000 Amnt.(€m)
97 40 690 35 48 13 61 24 60 10.5 1.0 35.0 0.5 6.9 1.6 16.2 12.3 0.4
11 2 0.1 0.0
€400,001 - No. €500,000 Amnt.(€m)
61 26 459 26 32 9 43 28 34 9.2 1.1 34.0 0.7 4.5 2.0 14.2 10.4 0.3
12 6 0.3 0.2
CORPORATION TAX STATISTICS, 2008 Table CTS2 - Distribution of selected allowances, reliefs and deductions
Range Of Net Trading
Income
€500,001 - No. €600,000 Amnt.(€m)
Plant and Machinery
Industrial Buildings
Plant and Machinery
Industrial Buildings
Trading Losses Carried Forward
Charges Group Relief Total Deductions
Manufacturing Relief
Manufacturing Capital Allowances
Non-Manufacturing Capital Allowances
55 31 340 25 22 20 38 27 36 6.5 1.1 27.5 0.9 8.3 3.4 17.3 13.4 0.4
Double Taxation
Other Tax Relief
8 8 1.0 3.3
€600,001 - No. €700,000 Amnt.(€m)
49 28 228 27 17 10 26 18 29 5.8 0.9 16.2 1.7 21.4 3.4 9.1 9.1 0.4
7 2 0.4 0.0
€700,001 - No. €800,000 Amnt.(€m)
37 15 193 19 13 8 16 20 24 7.3 0.5 22.9 0.7 6.5 4.1 6.7 11.6 0.4
6 5 0.5 0.1
€800,001 - No. €900,000 Amnt.(€m)
24 11 137 11 8 4 18 11 17 5.5 0.8 20.3 0.2 1.7 1.5 5.5 8.0 0.3
9 5 0.5 0.6
€900,001 - No. €1,000,000 Amnt.(€m)
23 14 119 15 6 4 15 12 14 4.6 0.5 21.2 0.7 2.4 1.4 54.1 5.8 0.3
10 3 7.7 0.3
€1,000,001 - No. €5,000,000 Amnt.(€m)
266 159 998 124 65 71 177 171 138 128.9 17.6 393.4 3.8 85.5 169.0 633.2 252.7 5.9
85 12 15.1 2.7
€5,000,001 - No. €10,000,000 Amnt.(€m)
63 39 202 31 12 43 34 58 34 61.5 8.4 159.4 2.5 111.1 78.8 64.4 158.8 4.7
42 3 15.0 0.4
Over No. €10,000,000 Amnt.(€m)
114 95 300 76 22 98 66 89 53 1,212.8 194.5 2,340.6 71.1 5,338.5 7,477.5 846.8 4,715.5 146.6
99 11 321.9 15.6
All Cases No. Amnt.(€m)
3,412 1,189 55,706 2,056 25,197 648 2,430 2,624 1,046 2,135.9 274.9 10,059.9 223.6 11,887.2 10,096.3 3,664.4 6,714.0 160.9
684 487 555.2 248.4
3
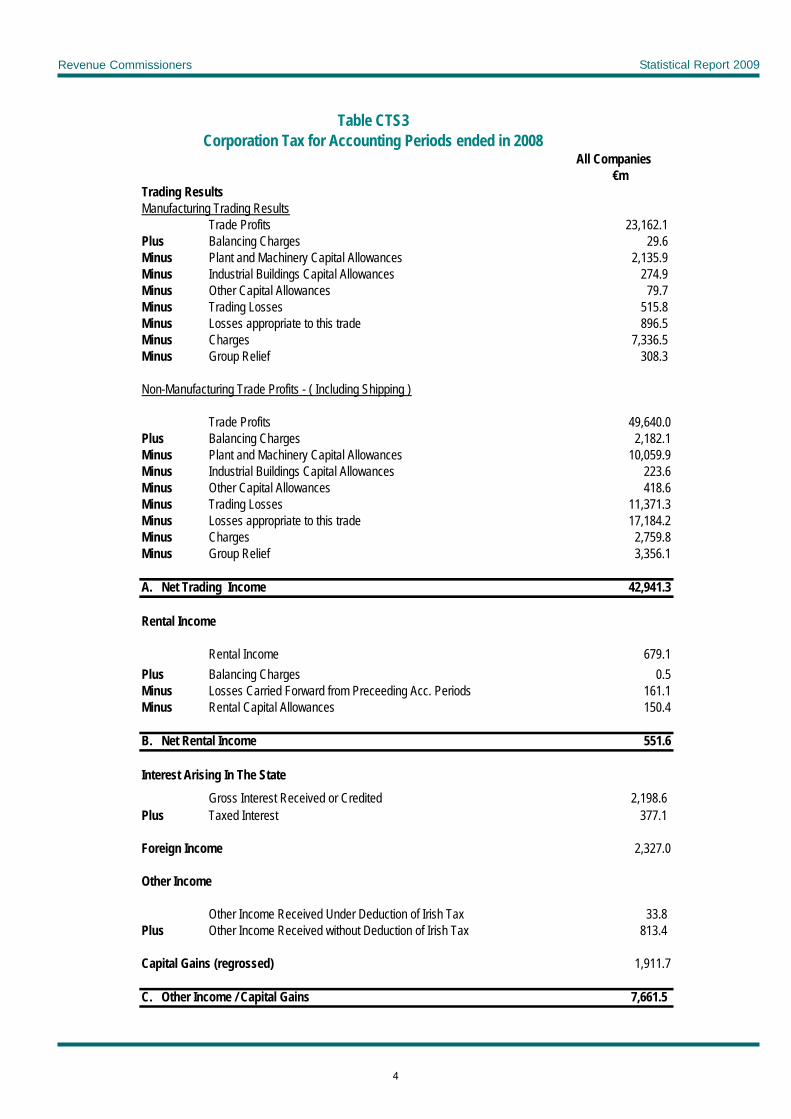
Revenue Commissioners Statistical Report 2009
Table CTS3 Corporation Tax for Accounting Periods ended in 2008
All Companies €m
Trading Results Manufacturing Trading Results
Trade Profits 23,162.1 Plus Balancing Charges 29.6 Minus Plant and Machinery Capital Allowances 2,135.9 Minus Industrial Buildings Capital Allowances 274.9 Minus Other Capital Allowances 79.7 Minus Trading Losses 515.8 Minus Losses appropriate to this trade 896.5 Minus Charges 7,336.5 Minus Group Relief 308.3
Non-Manufacturing Trade Profits - ( Including Shipping )
Trade Profits 49,640.0 Plus Balancing Charges 2,182.1 Minus Plant and Machinery Capital Allowances 10,059.9 Minus Industrial Buildings Capital Allowances 223.6 Minus Other Capital Allowances 418.6 Minus Trading Losses 11,371.3 Minus Losses appropriate to this trade 17,184.2 Minus Charges 2,759.8 Minus Group Relief 3,356.1
A. Net Trading Income 42,941.3
Rental Income
Rental Income 679.1 Plus Balancing Charges 0.5 Minus Losses Carried Forward from Preceeding Acc. Periods 161.1 Minus Rental Capital Allowances 150.4
B. Net Rental Income 551.6
Interest Arising In The State Gross Interest Received or Credited 2,198.6
Plus Taxed Interest 377.1
Foreign Income 2,327.0
Other Income
Other Income Received Under Deduction of Irish Tax 33.8 Plus Other Income Received without Deduction of Irish Tax 813.4
Capital Gains (regrossed) 1,911.7
C. Other Income / Capital Gains 7,661.5
4
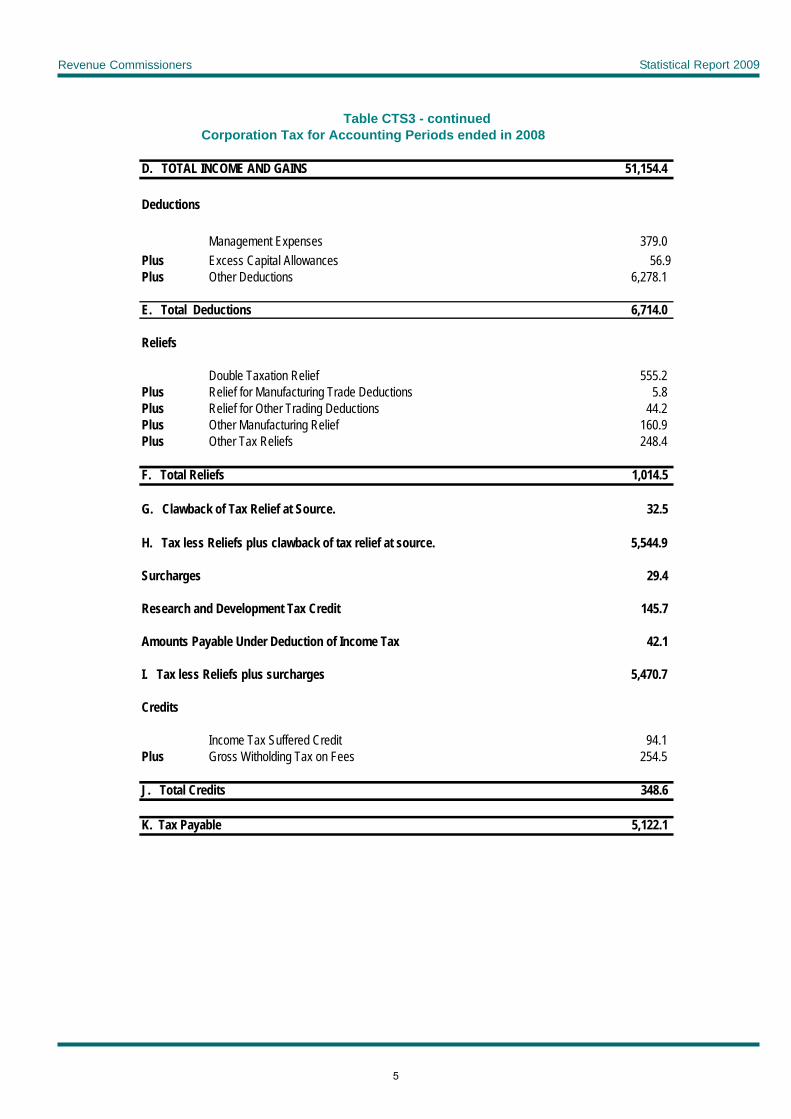
Revenue Commissioners Statistical Report 2009
Table CTS3 - continued Corporation Tax for Accounting Periods ended in 2008
D. TOTAL INCOME AND GAINS 51,154.4
Deductions
Management Expenses 379.0 Plus Excess Capital Allowances 56.9 Plus Other Deductions 6,278.1
E. Total Deductions 6,714.0
Reliefs
Double Taxation Relief 555.2 Plus Relief for Manufacturing Trade Deductions 5.8 Plus Relief for Other Trading Deductions 44.2 Plus Other Manufacturing Relief 160.9 Plus Other Tax Reliefs 248.4
F. Total Reliefs 1,014.5
G. Clawback of Tax Relief at Source. 32.5
H. Tax less Reliefs plus clawback of tax relief at source. 5,544.9
Surcharges 29.4
Research and Development Tax Credit 145.7
Amounts Payable Under Deduction of Income Tax 42.1
I. Tax less Reliefs plus surcharges 5,470.7
Credits
Income Tax Suffered Credit 94.1 Plus Gross Witholding Tax on Fees 254.5
J. Total Credits 348.6
K. Tax Payable 5,122.1
5
Revenue Commissioners Statistical Report 2009
Capital Gains Tax
• Table CGT1 Exchequer Receipt and Net Receipt • Table CGT2 Capital Gains Tax Assessments Capital Gains Tax was introduced in the Capital Gains Tax Act of 1975 and is a self assessed tax since 1991.
Capital gains tax is chargeable on the gains arising on the disposal (or statutorily deemed disposals) of assets other than that part of a gain which arose in the period prior to 6 April 1974. Any form of property including an interest in property (as, for example, a lease) is an asset for capital gains tax purposes.
The charge arises to a chargeable person when the asset is disposed of. The tax is charged by reference to a year of assessment, which since 2002 is the calendar year.
A rate of tax of 25% applies to the great majority of disposals from 8 April 2009. (The rate was 20% for disposals from 3 December 1997 to 14 October 2008 and 22% for disposals from 15 October 2008 to 7 April 2009.
Chargeable gains of companies, other than those arising from the disposal of development land, are, in general, charged to corporation tax and not capital gains tax. These chargeable gains will, in effect, be taxed at the equivalent of the normal rate of capital gains tax.
Various exemptions and reliefs from capital gains tax are provided. Details of these and a more detailed outline of this tax are to be found in the “Guide to Capital Gains Tax” which can be accessed on the Revenue Website at www.revenue.ie.
1
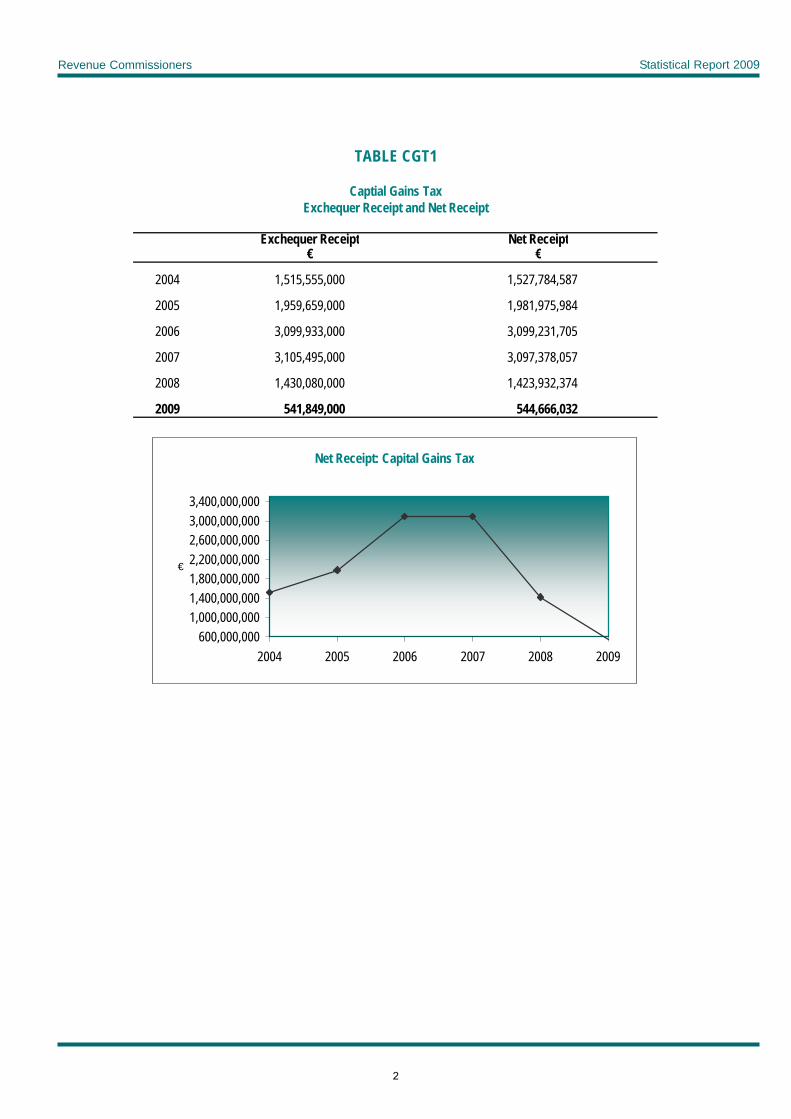
Revenue Commissioners Statistical Report 2009
TABLE CGT1
Captial Gains TaxExchequer Receipt and Net Receipt
Exchequer Receipt Net Receipt€ €
2004 1,515,555,000 1,527,784,587
2005 1,959,659,000 1,981,975,984
2006 3,099,933,000 3,099,231,705
2007 3,105,495,000 3,097,378,057
2008 1,430,080,000 1,423,932,374
2009 541,849,000 544,666,032
Net Receipt: Capital Gains Tax
600,000,0001,000,000,0001,400,000,0001,800,000,0002,200,000,0002,600,000,0003,000,000,0003,400,000,000
2004 2005 2006 2007 2008 2009
€
2
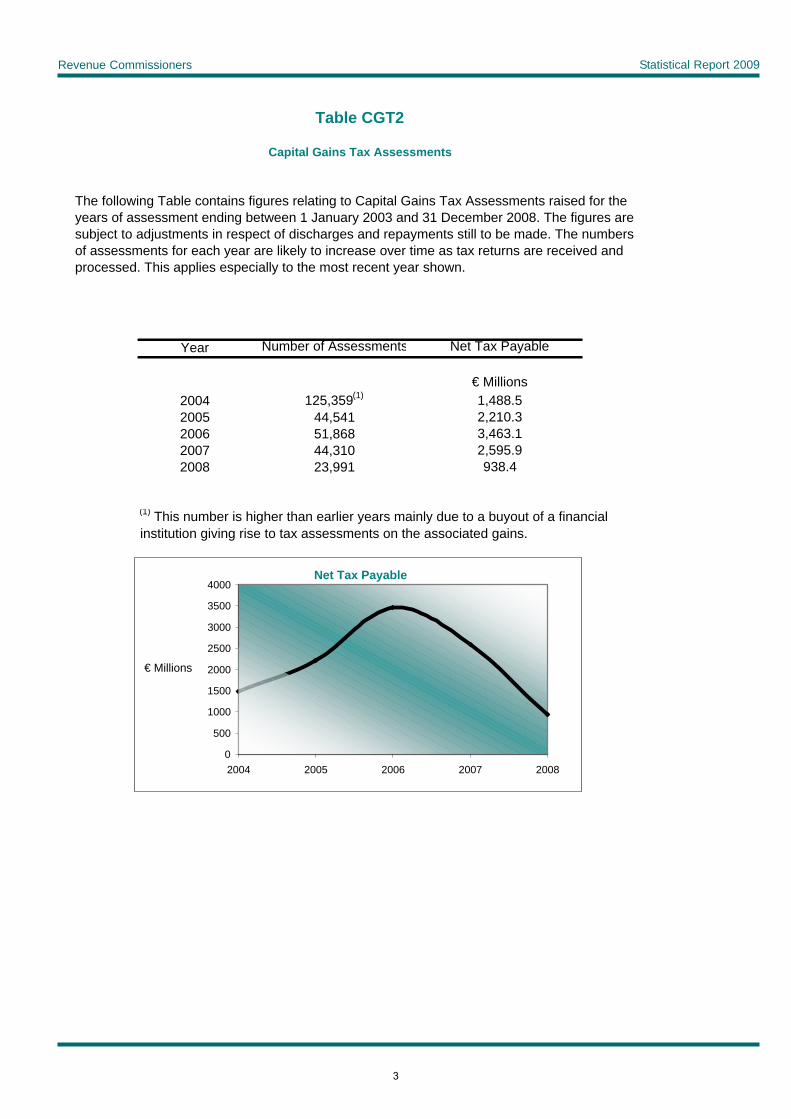
Revenue Commissioners Statistical Report 2009
Table CGT2
Capital Gains Tax Assessments
The following Table contains figures relating to Capital Gains Tax Assessments raised for the years of assessment ending between 1 January 2003 and 31 December 2008. The figures are subject to adjustments in respect of discharges and repayments still to be made. The numbers of assessments for each year are likely to increase over time as tax returns are received and processed. This applies especially to the most recent year shown.
Year Number of Assessments Net Tax Payable
€ Millions2004 125,359(1) 1,488.52005 44,541 2,210.32006 51,868 3,463.12007 44,310 2,595.92008 23,991 938.4
(1) This number is higher than earlier years mainly due to a buyout of a financialinstitution giving rise to tax assessments on the associated gains.
Net Tax Payable
0
500
1000
1500
2000
2500
3000
3500
4000
2004 2005 2006 2007 2008
€ Millions
3
Revenue Commissioners Statistical Report 2009
VALUE-ADDED TAX • Table VAT1 Budget estimate, exchequer receipt and net receipt • Table VAT2 Number of registrations • Table VAT3 Registrations by trade sector What is VAT? VAT is a tax on consumer spending. It is charged by VAT-registered traders in the State on the consideration for their supplies of goods and services. Generally, each such trader in the chain of supply from manufacturer through to retailer charges VAT on his or her sales* and is entitled to deduct from this amount the VAT paid on his or her purchases. [*In some circumstances, particularly in the construction industry, VAT is not charged by the supplier, but instead the principal contractor simply self accounts for the VAT as if it had been charged.] The effect of offsetting VAT on purchases against VAT on sales is to impose the tax on the added value at each stage of production – hence Value-Added Tax. For the final consumer, not being VAT-registered, VAT simply forms part of the purchase price. What is VAT charged on? Most goods or services supplied in Ireland are subject to VAT. Goods imported into Ireland from outside the E.U. are also subject to VAT – this is charged by Customs at the point where the goods enter the State. In addition, where a person engaged in business in Ireland receives goods from a trader within the E.U., or services from any trader established anywhere outside Ireland he or she is generally required to account for VAT on receipt of the goods or services as if he or she had actually made the supply. This applies to traders generally, and also to other bodies that would not normally register for VAT, such as local authorities, government departments, charities etc. What are the rates of VAT? VAT is charged at a number of different rates. The standard rate is 21%. This means that most goods and services in Ireland are liable to 21% VAT. There is also a rate of 13.5%, referred to as the reduced rate, a 4.8% rate and a zero% rate .The 13.5% rate applies to certain goods and services including a number of labour-intensive services. The 4.8% rate applies to the supply of livestock, live greyhounds and the hire of horses. The zero% rate applies to many foods and medicines and to children’s clothes. There are a number of activities which are exempt from VAT. These include services supplied in the public interest or welfare, for example in the areas of health, childcare and education as well as financial services. There is a special scheme dealing with agricultural supplies made by farmers, who are not required to register for VAT, whereby they are compensated for VAT borne on their inputs by the addition of 5.2% to prices for their supplies of agricultural produce and agricultural services to VAT registered persons. Who must register for VAT? A trader is generally required to register for VAT for making supplies of goods and/or services, subject to his or her turnover exceeding certain thresholds. The most common are €37,500 for the supply of services, and
1
Revenue Commissioners Statistical Report 2009
€75,000 for the supply of goods. Some traders are not required to register for VAT, although they may choose to do so. These include traders whose turnover does not exceed the thresholds above, and also farmers. Traders engaged in exempt activities are not permitted to charge VAT. However, they may, in common with farmers, Government Departments and other bodies be required to register for VAT, in order to account for VAT on the receipt of services or goods received from suppliers outside Ireland without any entitlement to a deduction of input VAT. Accounting for VAT A VAT registered trader is obliged to issue a VAT invoice in respect of a supply of goods or services and is liable to account for the VAT shown on that invoice. Each such invoice must contain specific information, including the VAT number of the supplier, the rate of VAT, and the amount of VAT charged. The customer, if registered for VAT, may generally reclaim or deduct all VAT charged to him or her on foot of a valid invoice (no deduction is allowed in respect of certain items, such as petrol and entertainment expenses). The document used by traders to account for VAT is called a VAT Return (Form VAT 3). This must be filled out by a trader at the end of each taxable period. A taxable period is normally two months long, and is counted from the start of the year – January/February is the first one each year. The VAT return will contain figures reflecting the transactions carried on by the trader including the amount of VAT charged by him or her and the amount of VAT that he or she is entitled to reclaim. Any imbalance between these two figures will indicate either a payment of tax due from the trader to Revenue, or a repayment due from Revenue to the trader. In certain circumstances, a trader may be permitted to make returns at different frequencies; i.e. monthly, 4-monthly, bi-annually or annually. Traders are also required to file an annual return of trading details. Full details regarding the operation of the VAT system are available on the Revenue website, at www.revenue.ie.
2
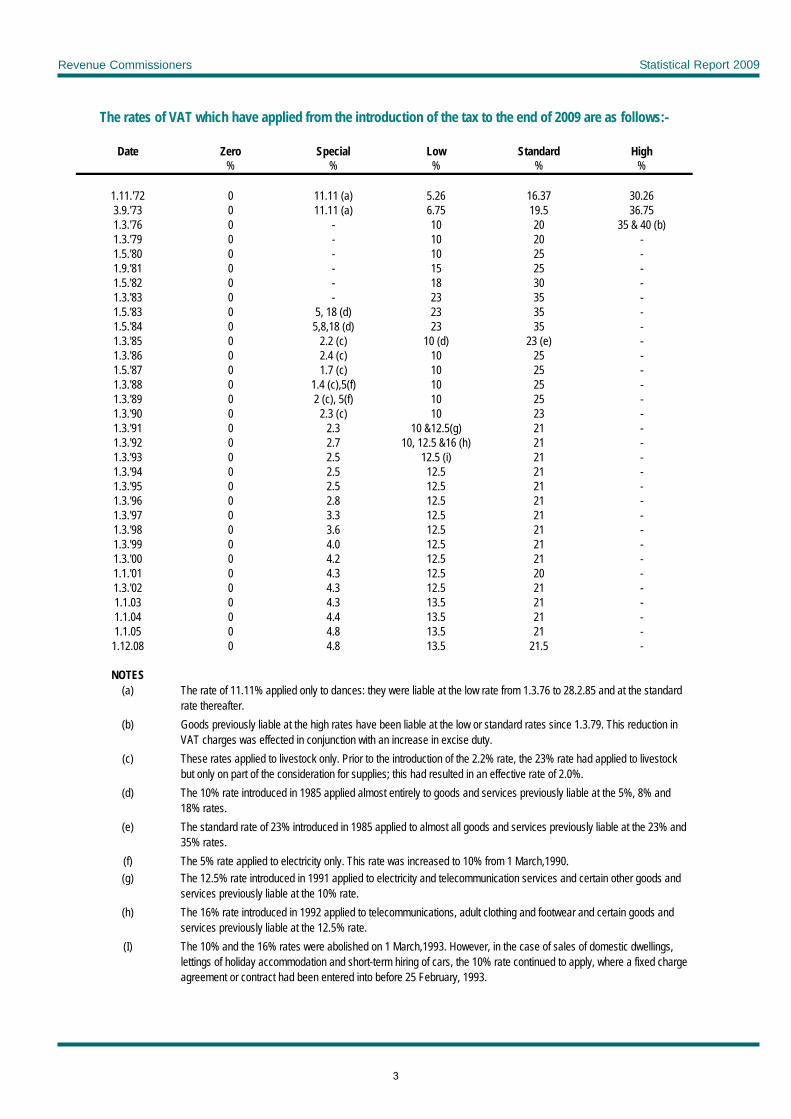
Revenue Commissioners Statistical Report 2009
The rates of VAT which have applied from the introduction of the tax to the end of 2009 are as follows:-
Date Zero Special Low Standard High% % % % %
1.11.'72 0 11.11 (a) 5.26 16.37 30.263.9.'73 0 11.11 (a) 6.75 19.5 36.751.3.'76 0 - 10 20 35 & 40 (b)1.3.'79 0 - 10 20 -1.5.'80 0 - 10 25 -1.9.'81 0 - 15 25 -1.5.'82 0 - 18 30 -1.3.'83 0 - 23 35 -1.5.'83 0 5, 18 (d) 23 35 -1.5.'84 0 5,8,18 (d) 23 35 -1.3.'85 0 2.2 (c) 10 (d) 23 (e) -1.3.'86 0 2.4 (c) 10 25 -1.5.'87 0 1.7 (c) 10 25 -1.3.'88 0 1.4 (c),5(f) 10 25 -1.3.'89 0 2 (c), 5(f) 10 25 -1.3.'90 0 2.3 (c) 10 23 -1.3.'91 0 2.3 10 &12.5(g) 21 -1.3.'92 0 2.7 10, 12.5 &16 (h) 21 -1.3.'93 0 2.5 12.5 (i) 21 -1.3.'94 0 2.5 12.5 21 -1.3.'95 0 2.5 12.5 21 -1.3.'96 0 2.8 12.5 21 -1.3.'97 0 3.3 12.5 21 -1.3.'98 0 3.6 12.5 21 -1.3.'99 0 4.0 12.5 21 -1.3.'00 0 4.2 12.5 21 -1.1.'01 0 4.3 12.5 20 -1.3.'02 0 4.3 12.5 21 -1.1.03 0 4.3 13.5 21 -1.1.04 0 4.4 13.5 21 -1.1.05 0 4.8 13.5 21 -
1.12.08 0 4.8 13.5 21.5 -
NOTES(a) The rate of 11.11% applied only to dances: they were liable at the low rate from 1.3.76 to 28.2.85 and at the standard
rate thereafter.(b) Goods previously liable at the high rates have been liable at the low or standard rates since 1.3.79. This reduction in
VAT charges was effected in conjunction with an increase in excise duty.(c) These rates applied to livestock only. Prior to the introduction of the 2.2% rate, the 23% rate had applied to livestock
but only on part of the consideration for supplies; this had resulted in an effective rate of 2.0%.(d) The 10% rate introduced in 1985 applied almost entirely to goods and services previously liable at the 5%, 8% and
18% rates.(e) The standard rate of 23% introduced in 1985 applied to almost all goods and services previously liable at the 23% and
35% rates.(f) The 5% rate applied to electricity only. This rate was increased to 10% from 1 March,1990.(g) The 12.5% rate introduced in 1991 applied to electricity and telecommunication services and certain other goods and
services previously liable at the 10% rate.(h) The 16% rate introduced in 1992 applied to telecommunications, adult clothing and footwear and certain goods and
services previously liable at the 12.5% rate.(I) The 10% and the 16% rates were abolished on 1 March,1993. However, in the case of sales of domestic dwellings,
lettings of holiday accommodation and short-term hiring of cars, the 10% rate continued to apply, where a fixed charge agreement or contract had been entered into before 25 February, 1993.
3
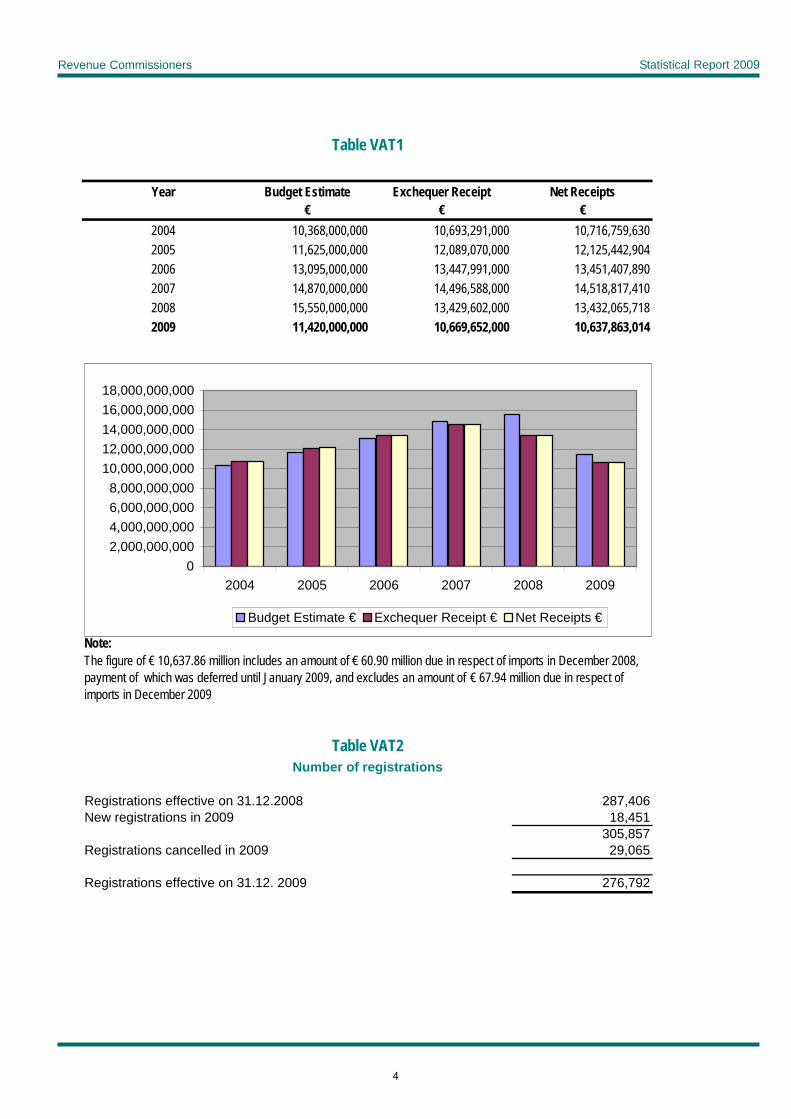
Revenue Commissioners Statistical Report 2009
Table VAT1
Year Budget Estimate Exchequer Receipt Net Receipts€ € €
2004 10,368,000,000 10,693,291,000 10,716,759,6302005 11,625,000,000 12,089,070,000 12,125,442,9042006 13,095,000,000 13,447,991,000 13,451,407,8902007 14,870,000,000 14,496,588,000 14,518,817,4102008 15,550,000,000 13,429,602,000 13,432,065,7182009 11,420,000,000 10,669,652,000 10,637,863,014
Note:The figure of € 10,637.86 million includes an amount of € 60.90 million due in respect of imports in December 2008, payment of which was deferred until January 2009, and excludes an amount of € 67.94 million due in respect of imports in December 2009
Table VAT2Number of registrations
Registrations effective on 31.12.2008 287,406New registrations in 2009 18,451
305,857Registrations cancelled in 2009 29,065
Registrations effective on 31.12. 2009 276,792
02,000,000,0004,000,000,0006,000,000,0008,000,000,000
10,000,000,00012,000,000,00014,000,000,00016,000,000,00018,000,000,000
2004 2005 2006 2007 2008 2009
Budget Estimate € Exchequer Receipt € Net Receipts €
4
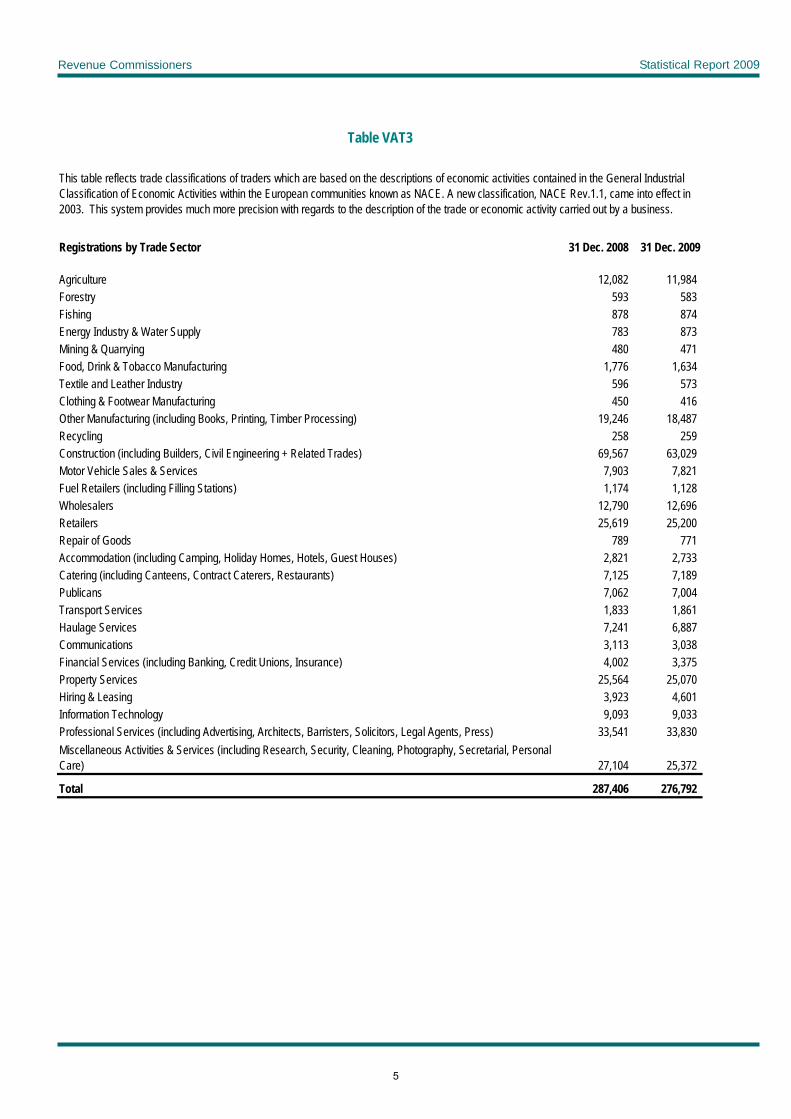
Revenue Commissioners Statistical Report 2009
Table VAT3
This table reflects trade classifications of traders which are based on the descriptions of economic activities contained in the General Industrial Classification of Economic Activities within the European communities known as NACE. A new classification, NACE Rev.1.1, came into effect in 2003. This system provides much more precision with regards to the description of the trade or economic activity carried out by a business.
Registrations by Trade Sector 31 Dec. 2008 31 Dec. 2009
Agriculture 12,082 11,984 Forestry 593 583 Fishing 878 874 Energy Industry & Water Supply 783 873 Mining & Quarrying 480 471 Food, Drink & Tobacco Manufacturing 1,776 1,634 Textile and Leather Industry 596 573 Clothing & Footwear Manufacturing 450 416 Other Manufacturing (including Books, Printing, Timber Processing) 19,246 18,487 Recycling 258 259 Construction (including Builders, Civil Engineering + Related Trades) 69,567 63,029 Motor Vehicle Sales & Services 7,903 7,821 Fuel Retailers (including Filling Stations) 1,174 1,128 Wholesalers 12,790 12,696 Retailers 25,619 25,200 Repair of Goods 789 771 Accommodation (including Camping, Holiday Homes, Hotels, Guest Houses) 2,821 2,733 Catering (including Canteens, Contract Caterers, Restaurants) 7,125 7,189 Publicans 7,062 7,004 Transport Services 1,833 1,861 Haulage Services 7,241 6,887 Communications 3,113 3,038 Financial Services (including Banking, Credit Unions, Insurance) 4,002 3,375 Property Services 25,564 25,070 Hiring & Leasing 3,923 4,601 Information Technology 9,093 9,033 Professional Services (including Advertising, Architects, Barristers, Solicitors, Legal Agents, Press) 33,541 33,830 Miscellaneous Activities & Services (including Research, Security, Cleaning, Photography, Secretarial, Personal Care) 27,104 25,372
Total 287,406 276,792
5
Revenue Commissioners Statistical Report 2009
Sheriff and Solicitor Enforcement Table ENF1 Details of Certificates issued to the Sheriff, referrals to the Solicitor and Judgements Registered in 2009
ENFORCEMENT BY SHERIFFS
1. The greater part of enforcement activity consists of the issue of certificates to Sheriffs under Section 962 of the Taxes Consolidation Act, 1997. In the course of 2009, the number of certificates issued was 38,790 with a face value of €697.4
2. The value of the certificates referred in 2009 includes estimates of liability by Revenue where a taxpayer fails to make returns to Revenue.
3. The total amount collected as a result of Sheriff enforcement in 2009 was €214.3m.
REFERRALS TO SOLICITOR AND JUDGEMENTS REGISTERED BY THE COLLECTOR-GENERAL
1. In the course of 2009, the number of judgements registered by the Collector-General in respect of tax and interest was 1,419with a face value of €56.6m.
2. The number of cases referred for enforcement by court proceedings in 2009 was 6,832. Judgements are not obtained in all cases where proceedings are taken, as payment can be made before judgement is obtained. Not all judgements are registered as payment can be made following judgement, or Revenue may pursue action in enforcement of the judgement without registration.
3. The total amount collected as a result of Solicitor enforcement in 2009 was €46.2m.
1
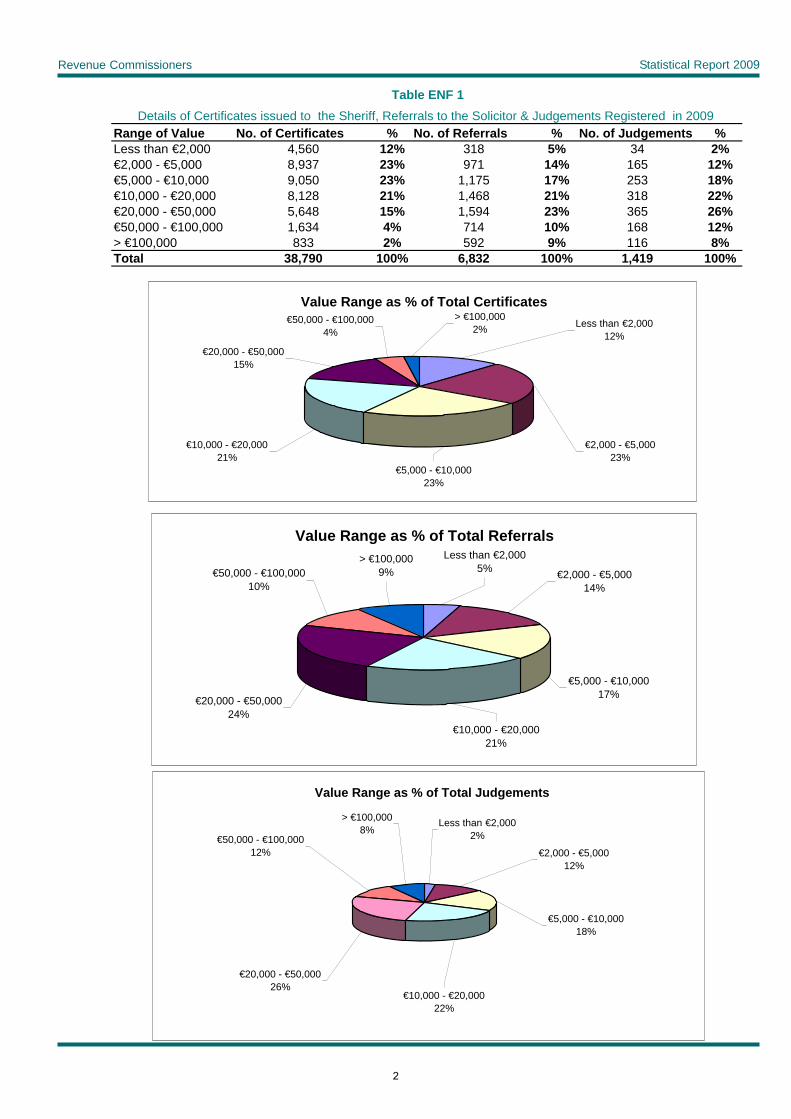
Revenue Commissioners Statistical Report 2009
Table ENF 1Details of Certificates issued to the Sheriff, Referrals to the Solicitor & Judgements Registered in 2009
Range of Value No. of Certificates % No. of Referrals % No. of Judgements %Less than €2,000 4,560 12% 318 5% 34 2%€2,000 - €5,000 8,937 23% 971 14% 165 12%€5,000 - €10,000 9,050 23% 1,175 17% 253 18%€10,000 - €20,000 8,128 21% 1,468 21% 318 22%€20,000 - €50,000 5,648 15% 1,594 23% 365 26%€50,000 - €100,000 1,634 4% 714 10% 168 12%> €100,000 833 2% 592 9% 116 8%Total 38,790 100% 6,832 100% 1,419 100%
Value Range as % of Total CertificatesLess than €2,000
12%
€2,000 - €5,00023%
€5,000 - €10,00023%
€10,000 - €20,00021%
€20,000 - €50,00015%
€50,000 - €100,0004%
> €100,0002%
Value Range as % of Total ReferralsLess than €2,000
5% €2,000 - €5,00014%
€5,000 - €10,00017%
€10,000 - €20,00021%
€20,000 - €50,00024%
€50,000 - €100,00010%
> €100,0009%
Value Range as % of Total Judgements
Less than €2,0002%
€2,000 - €5,00012%
€5,000 - €10,00018%
€10,000 - €20,00022%
€20,000 - €50,00026%
€50,000 - €100,00012%
> €100,0008%
2
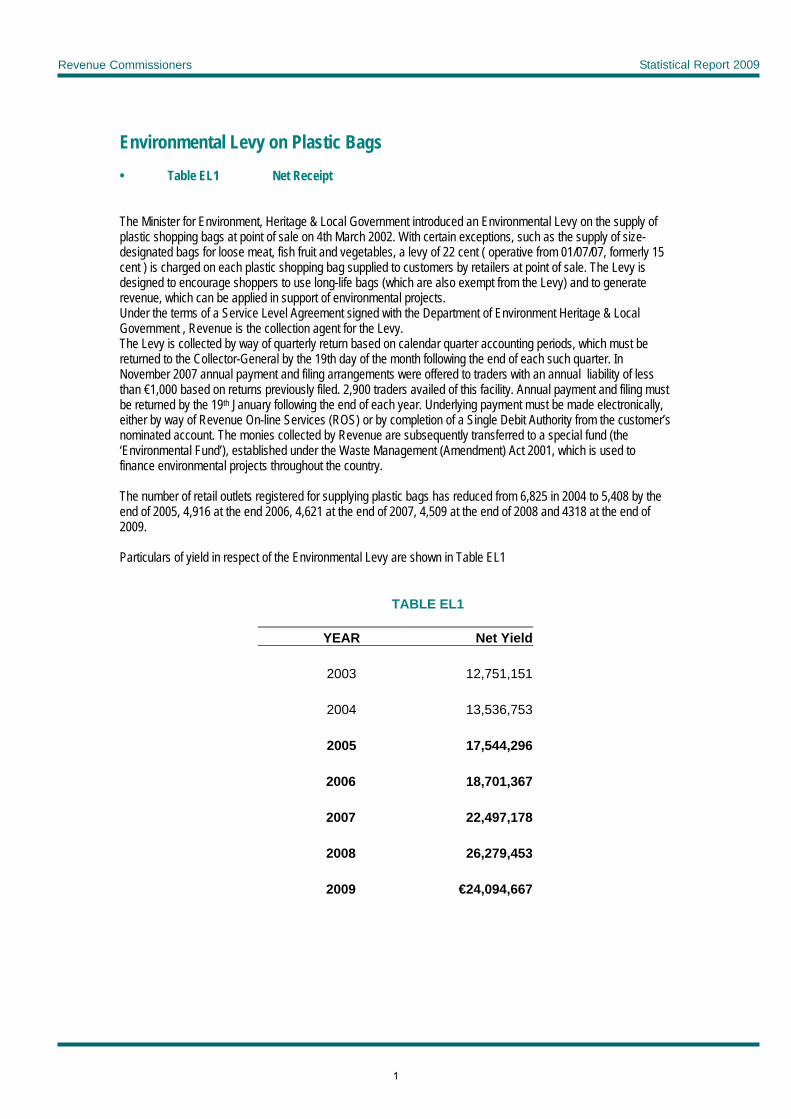
Revenue Commissioners Statistical Report 2009
Environmental Levy on Plastic Bags • Table EL1 Net Receipt The Minister for Environment, Heritage & Local Government introduced an Environmental Levy on the supply of plastic shopping bags at point of sale on 4th March 2002. With certain exceptions, such as the supply of size-designated bags for loose meat, fish fruit and vegetables, a levy of 22 cent ( operative from 01/07/07, formerly 15 cent ) is charged on each plastic shopping bag supplied to customers by retailers at point of sale. The Levy is designed to encourage shoppers to use long-life bags (which are also exempt from the Levy) and to generate revenue, which can be applied in support of environmental projects. Under the terms of a Service Level Agreement signed with the Department of Environment Heritage & Local Government , Revenue is the collection agent for the Levy. The Levy is collected by way of quarterly return based on calendar quarter accounting periods, which must be returned to the Collector-General by the 19th day of the month following the end of each such quarter. In November 2007 annual payment and filing arrangements were offered to traders with an annual liability of less than €1,000 based on returns previously filed. 2,900 traders availed of this facility. Annual payment and filing must be returned by the 19th January following the end of each year. Underlying payment must be made electronically, either by way of Revenue On-line Services (ROS) or by completion of a Single Debit Authority from the customer’s nominated account. The monies collected by Revenue are subsequently transferred to a special fund (the ‘Environmental Fund’), established under the Waste Management (Amendment) Act 2001, which is used to finance environmental projects throughout the country. The number of retail outlets registered for supplying plastic bags has reduced from 6,825 in 2004 to 5,408 by the end of 2005, 4,916 at the end 2006, 4,621 at the end of 2007, 4,509 at the end of 2008 and 4318 at the end of 2009. Particulars of yield in respect of the Environmental Levy are shown in Table EL1
TABLE EL1
YEAR Net Yield 2003 12,751,151 2004 13,536,753 2005 17,544,296 2006 18,701,367 2007 22,497,178 2008 26,279,453 2009 €24,094,667
1


![ESCC 3902/003 (Wires and Cables), [ARCHIVED] - ESCIES](https://static.fdokumen.com/doc/165x107/63281d0c6d480576770d9bd9/escc-3902003-wires-and-cables-archived-escies.jpg)