IMTA Good Aquaculture Practice - IW:LEARN - Archived web ...
31
1 IMTA Good Aquaculture Practice NWG-M, UNDP/GEF Yellow Sea Large Marine Ecosystem (YSLME) Phase II Project; Yellow Sea Fisheries Research Institute, CAFS
-
Upload
khangminh22 -
Category
Documents
-
view
4 -
download
0
Transcript of IMTA Good Aquaculture Practice - IW:LEARN - Archived web ...

1
IMTA Good Aquaculture Practice
NWG-M, UNDP/GEF Yellow Sea Large Marine Ecosystem (YSLME) Phase II
Project;
Yellow Sea Fisheries Research Institute, CAFS

2
CONTENTS
1. Background and Introduction ....................................................................................................................................... 1
1.1 What is IMTA ....................................................................................................................................................... 3
1.2 Objectives .............................................................................................................................................................. 5
1.3 Key principles ....................................................................................................................................................... 5
2. IMTA GAP: Preparation and Initiation ................................................................................................................ 6
2.1 Scopes of IMTA GAP ......................................................................................................................................... 6
2.1.1 Definition of system boundaries .......................................................................................................... 6
2.1.2 Spatial scales ............................................................................................................................................ 7
2.1.3 Temporal scales........................................................................................................................................ 8
2.2 Stakeholder and issue analysis .......................................................................................................................... 8
2.2.1 Stakeholder identification ..................................................................................................................... 8
2.2.2 issue analysis ............................................................................................................................................ 8
2.3 Risk analysis ....................................................................................................................................................... 10
2.4 Establish/define overall objectives and operational objectives ............................................................... 10
3. Implementing the IMTA GAP ................................................................................................................................ 11
3.1 Species and Site selection ................................................................................................................................ 11
3.1.1 Shellfish ................................................................................................................................................... 11
3.1.2 Oyster ....................................................................................................................................................... 11
3.1.3 Scallop ..................................................................................................................................................... 12
3.1.4 Mussel ...................................................................................................................................................... 12
3.1.5 Abalone .................................................................................................................................................... 12
3.1.6 Macroalgae ............................................................................................................................................. 13
3.1.7 Kelp S. japonica .................................................................................................................................... 13
3.1.8 Wakame U. pinnatifida ........................................................................................................................ 13
3.1.9 Gracilaria species ................................................................................................................................. 14
3.1.10 Requirements for site selection ........................................................................................................ 14
3.2 Carrying capacity assessment ......................................................................................................................... 15
3.2.1 Assessment of carrying capacity for farmed seaweeds ................................................................ 15
3.2.2 Assessment of carrying capacity for filter feeding shellfish ....................................................... 19
3.3 Shellfish-seaweed and shellfish-seaweed-sea cucumber IMTA ............................................................. 23
3.3.1 Establishment of the shellfish and seaweed integrated aquaculture system ............................ 23
3.4 Tools in support for IMTA GAP ..................................................................................................................... 25
3.4.1 Carrying capacity estimation and model set up ............................................................................. 25
3.4.2 Spatial planning ..................................................................................................................................... 26
4. Future developments .................................................................................................................................................. 27
5. Reference ........................................................................................................................................................................ 28

1
1. Background and Introduction
From ancient times, fishing from oceans, lakes and rivers has been a major source of food,
a provider of employment and other economic benefits for humanity. Ocean productivity
seemed particularly unlimited. However, with increased knowledge and the dynamic
development of fisheries and aquaculture, it was realized that living aquatic resources,
although renewable, are not infinite and need to be properly managed, if their contribution to
the nutritional, economic and social well-being of the growing world’s population was to be
sustained.
However, for nearly three decades, because of the dramatic increase of pollution, abusive
fishing techniques worldwide, and illegal unreported an unregulated fishing, catches and
landings have been shrinking and fishstocks declining, often alarming rates.
Sustainability of societal benefits requires a recovery of depleted stocks and maintenance
of the still-healthy ones, through sound management. In this regard, the adoption of the
United Nations Convention on the Law of the Sea, in 1982 was instrumental. The law
provides a new framework for the better management of marine resources. The new legal
regime of the oceans gave coastal States rights and responsibilities for the management and
use of fishery resources within the areas of their national jurisdiction, which embrace some
90% of the world’s marine fisheries.
In the historical past, aquaculture remained multi-locational and isolated, each location
having evolved its own pattern, until in recent times, when with the development of fast
means of communication and travel bridging distances in progressively decreasing time,
species are being cultured adopting a measure of standardized practices and sites when they
are most suited. (Introduction to Aquaculture)
The expanding role and increasing contribution of aquaculture to economic growth, social
welfare and global food security was recognized and reiterated at international levels such as
the 1995 FAO/Japan Conference on the Contribution of Fisheries and Aquaculture to Food
Security, the 1996 World Food Summit, the 1999 Ministerial Meeting on Fisheries, the 2000
FAO/NACA (Network of Aquaculture Centres in Asia and the Pacific) Conference on
Aquaculture in the Third Millennium and tis Bangkok Declaration and Strategy, and recently,
the 2009 World Summit on Food Security.
The ‘Art’ of aquaculture is very old. The evidence that Egyptians were probably the first in
the world to culture fish as far back as 2500 B.C. come from pictorial engravings of an
2
ancient Egyptian tomb showing tilapia being fished out from an artificial pond. The Romans
are believed to have reared fish in circular ponds divided into breeding areas. Culture of
Chinese carps was side-spread in China in 2000 B.C. Writings in India made in 300 B.C.
suggest means of rendering fish poisonous in the Indian sub-continent in times of war. This
implies that fish culture prevailed in some Indian reservoirs. Some historical documents
compiled in 1127 A.D. describe methods of fattening fish in ponds in India. Culture of
Gangetic carps in Bengal in the Indian Sub-continent is of historical origin. (Introduction to
Aquaculture)
While the concept and practice of integrated aquaculture is well-known in inland
environments particularly in Asia, in the marine environment, it has been much less reported.
However, in recent years the idea of integrated aquaculture has been often considered a
mitigation approach against the excess nutrients/organic matter generated by intensive
aquaculture activities particularly in marine waters. In this context, integrated multitrophic
aquaculture (IMTA) has emerged, where multitrophic refers to the explicit incorporation of
species from different trophic positions or nutritional levels in the same system. Integrated
marine aquaculture can cover a diverse range of co-culture/ farming practices, including
IMTA, and even more specialized forms of integration such as mangrove planting with
aquaculture, called aquasilviculture. Integrated mariculture has many benefits, among which
bioremediation is one of the most relevant, and yet is not valued in its real social and
economic potential although the present document provides some initial economic estimates
for the integration benefits derived from bioremediation. Reducing risks is also an advantage
and profitable aspect of farming multiple species in marine environments (as in freshwaters):
a diversified product portfolio increases the resilience of the operation, for instance when
facing changing prices for one of the farmed species or the accidental catastrophic destruction
of a crop. Yet such perspectives are far from been considered in mariculture where, on the
contrary, there is a tendency to monoculture.
These documents on the Good Agriculture Practice (GAP) of Integrated Multi-Trophic
Aquaculture (IMTA) are developed to support the promotion and development of IMTA
around the Yellow Sea and further regions under the support of Yellow Sea Large Marine
Ecosystem Project Phase II.
The main objective of the GAP document is to assist countries, institutions and policy-
makers in the development and implementation of a strategy to ensure the sustainability of
the aquaculture sector, integration of aquaculture with other sectors and its contribution to
social and economic development.

3
1.1 What is IMTA
Aquaculture growth worldwide invariably involves (with differences among regions and
economies) the expansion of cultivated areas, larger aquaculture farms, higher density of
farmed individuals and the use of feed resources often produced outside of the immediate
area. Worldwide, aquaculture has increasing social and economic impact through the
production of food, contribution to livelihoods and generation of income. Other positive
effects on the ecosystem include, for example, the provision of seeds for restocking of
endangered or overexploited aquatic populations. However, when badly managed,
aquaculture can affect ecosystems functions and services, with negative environmental, social
and economic consequences. Aquaculture usually also faces risks from other human activities
such as contamination of waterways by agriculture and industrial activities.
Integrated multi-trophic aquaculture (IMTA) is the farming, in proximity, of species from
different trophic levels and with complementary ecosystem functions in a way that allows
one species’ uneaten feed and wastes, nutrients and by-products to be recaptured and
converted into fertilizer, feed and energy for the other crops, and to take advantage of
synergistic interactions among species while biomitigation takes place (Chopin, 2013).
Farmers combine fed aquaculture (e.g., fish, shrimp) with inorganic extractive (e.g., seaweed)
and organic extractive (e.g., shellfish) aquaculture to create balanced systems for
environment remediation (bio-mitigation), economic stability (improved output, lower cost,
product diversification and risk reduction) and social acceptability (better management
practices).

4
Figure 1 History of IMTA, figure reference from Chopin, 2013
IMTA can be traced back to the origins of aquaculture. In 2200-2100 B.C., the document
You Hou Bin detailed the integration of fish with aquatic plants and vegetable production in
China. There is evidence of tilapia grown in integrated agriculture-aquaculture drainable
ponds on bas-reliefs in tombs built during the era of the New Kingdom in Egypt, which
occurred about 1550-1070 B.C.
During the French Renaissance, royal IMTA was practiced at the Château de Fontainebleau,
as attested by the construction of the Etang aux Carpes (Carp Pond), which still functions to
this day. French King Henri IV had given instructions that the estate should be self-sufficient
and could not depend on provisions, which had the chance of being looted several times
during the 65-km trip from Paris.
In 1639, Nong Zheng Quan Shu (The Complete Book on Agriculture) by Xu Guangqi was
published posthumously. He had been collaborating with Jesuit missionaries. His

5
comprehensive treatise covered many topics, including irrigation and the rotation of fish and
aquatic plant production. Also described were the integration of fish with livestock and the
effects of manure on pond production, as well as the integrated production of mulberry trees,
rice paddies and fish ponds. In the 1970s, John Ryther reignited interest in IMTA and can be
considered the grandfather of modern IMTA for his seminal work on what he called
“integrated waste-recycling marine polyculture systems,” first at Woods Hole Oceanographic
Institution in Massachusetts, USA, and then at Harbor Branch Oceanographic Institute in
Florida, USA.
It was followed by three productive decades on what has been variously called polyculture,
integrated mariculture or aquaculture, ecologically engineered aquaculture and ecological
aquaculture. Understanding the need to harmonize all these names, Thierry Chopin and Jack
Taylor combined integrated aquaculture and multi-trophic aquaculture into the term
integrated multi-trophic aquaculture in 2004.
1.2 Objectives
The prime goal of IMTA GAP is to promote and extend the application of IMTA system in
appropriate coastal regions and to develop institutional mechanisms for effective coordination
among various sectors active in the ecosystems in which aquaculture operates and between
the various levels of government.
The two major objectives of this document should be:
(i) a general guideline for operational IMTA correspond to different suitable aquaculture
waters which satisfy the goal of sustainable development (environmentally, economically,
socially); and
(ii) change in the public’s (understood as broadly as possible) attitude and perception of
IMTA
1.3 Key principles
As a proved methodology to ensure the IMTA positively to sustainable development,
IMTA GAP follows three main interlinked principles:
Principle 1 IMTA applications and management should take account of the full range of
ecosystem functions and services, and should not threaten the sustained delivery of these to
society.
Developing IMTA in the context of ecosystem functions and services is a challenge that
6
involves defining ecosystem boundaries, estimating some assimilative and production
carrying capacities, and adapting farming practices accordingly. The mix of ecosystem
services will depend on wider management practices and the trade-off among different
services must be acknowledged. This is especially important in the case of ecosystem
functions that are unique, essential or threatened to ensure their preservation.
Principle 2 IMTA applications should improve human well-being and equity for all
relevant stakeholders.
This principle seeks to ensure that IMTA practice provides equitable sharing of its benefits.
This includes ensuring that it does not result in any undue detriment for any groups within
society, especially the most vulnerable. Both food security and safety are to be promoted as
key components of well-being.
Principle 3 IMTA applications should be developed in the context of the larger system
which includes the surrounding natural and social environment, as well as policies and laws.
This principle recognizes the interactions between IMTA practice and the larger external
system, particularly, the influence of the surrounding natural and social environments on
aquaculture practices and results. This principle also acknowledges the opportunity of
coupling aquaculture activities with other production sectors to promote materials and energy
recycling and better use of resources in general.
2. IMTA GAP: Preparation and Initiation
The Integrated Multi-Trophic Aquaculture, which has been proved as a methodology for
higher efficient usage of materials and energy, still need to be implemented based on
sufficient background knowledge of the natural environment (carrying capacity) and local
social economics. Successful implementation of the IMTA GAP need to translate the relevant
goals into operational objectives and actions. Two elements are fundamental throughout the
process: (i) to collect and use the best available information (environmental and social); and
(ii) to have broad stakeholder participation which strengthen the support.
2.1 Scopes of IMTA GAP
2.1.1 Definition of system boundaries
There is a need to define the ecosystem boundaries in space and time when attempting to
implement the IMTA. This is a necessary exercise, including the decision on whether
planning and implementation of the system will cover farm scale or regional scale at suitable

7
areas, which usually in coastal bays and land-based factorial ponds. Therefore, there should
also be a general objective or purpose to be addressed at the defined scale.
The ecosystem boundaries are delineated on geological, physico-chemical, biological and
ecological grounds, while socio-economic and administrative boundaries outline the
management area. The closer the correspondence between the ecosystem limits and
management areas, the more likely it is that there will be a high level of harmonization across
planning structures. However, these boundaries do not usually coincide. For this reason, a
clear mapping of areas of correspondence and gaps is needed. The definition of the
ecosystem boundaries is also needed to identify the relevant stakeholders and to address the
different issues (Aguilar-Manjarrez, Kapetsky and Soto, 2010).
2.1.2 Spatial scales
Farm scale
The individual farm is easy to locate and identify, and local effects are often easy to assess.
Most management practices are developed for this scale and most top-down regulation
measures, such as the environmental impact assessment (EIA), worldwide apply at this scale.
Usually good agriculture practices (GAPs) are implemented and can be assessed at this level.
The farm level is also the focal point for ecosystem impacts on aquaculture. Cultured
species from lower trophic usually are sensitive to water quality and are vulnerable to
damage inflicted by other users of the waterbody. Thus, issues such as pollution from urban
areas, agricultural runoff and industry; predation; and damage from boats, capture fishing and
other waterborne gear are highly relevant at the farm level, and protective measures,
including pollution regulation, spatial planning and insurance, are important.
Stakeholders at this scale are usually farm owners, workers, family members and local
inhabitants.
Bay scale
This geographical scale includes a cluster of farms which is usually aggregated that share a
common waterbody. While the environmental and social impacts of a single farm might be
marginal, more attention needs to be paid to the potentially cumulative ecosystem effects of
collectives of farms and their aggregates at bay scale, for example, eutrophication as a
consequence of excessive nutrient outputs.
IMTA has been well demonstrated at bay scale at Sanggou Bay which multiple culture
models are under practice. Compare to farm scale, bay scale contains a complete ecosystem,

8
and the ecological benefits can be better assessed for IMTA. Still, as a human activity, IMTA
may have impacts on biodiversity as well as the natural succession process. When
considering about the management issues, the baseline information is important for both the
carry capacity estimation and spatial planning of bay scale IMTA.
2.1.3 Temporal scales
IMTA is affected by external forcing factors or drivers such as population growth,
local/regional market demand and climate change, and these affect the interactions of
aquaculture and the ecosystem at all the scales and with a temporal dimension adding to
uncertainty. The temporal scales of internal factors of IMTA include culture period of
different cultured organisms as well as the corresponded market values. Species selection
also need take temporal scale into consideration as to make full usage of the specifications of
cultured organisms.
2.2 Stakeholder and issue analysis
2.2.1 Stakeholder identification
Once the boundary of IMTA GAP has been defined, it is possible to start identify all the
relevant stakeholders. There is basic guideline for the identification of stakeholders. For
example, stakeholders related to aquaculture in coastal mangrove areas may include: local
aquaculture farmers and their communities, non-governmental organizations (NGOs),
environmental institutions, tourism agencies and institutions, organizations associated with
the use of coastal infrastructure, research institutions, etc.
2.2.2 issue analysis
Negative effects of IMTA
Although IMTA is an efficient way of applying aquaculture which reduce the culture waste,
it still human activities which impose additional biomass to the natural environment. IMTA
inherit the same negative effects with regular aquaculture but has greatly minimize the impact.
Some of the negative effects may include: unsustainable demand for wild seed or juveniles
for fattening (e.g. shrimp and shellfish); affect the biodiversity of local environment;
alteration of inland and coastal habitats for the construction of culture ponds or longline
culture systems; long-term culture may impose pressure on sediments and modify benthic

9
communities; release of chemicals used to control water conditions and diseases;
restructuring of biological and/or social environments and unfair distribution of income to
individual farmers and/or to labors.
Second-order impacts should also be considered, especially as they can negatively alter the
livelihoods of downstream stakeholders, for example, when the construction of shrimp ponds
alter habitats, thereby modifying the ecosystem and with it the local fisheries it supports and
the livelihoods of local fishers.
Positive effects of IMTA
IMTA, compare to traditional mono- or poly-culture, promotes economic and
environmental sustainability by converting byproducts and uneaten feed from fed organisms
into harvestable crops, thereby reducing eutrophication, and increasing economic
diversification. Properly managed multi-trophic aquaculture accelerates growth without
detrimental side-effects. This increases the site's ability to assimilate the cultivated organisms,
thereby reducing negative environmental impacts. IMTA enables farmers to diversify their
output by replacing purchased inputs with byproducts from lower trophic levels, often
without new sites. Initial economic research suggests that IMTA can increase profits and can
reduce financial risks due to weather, disease and market fluctuations.
IMTA GAP should demonstrate that such positive effects are far more beyond negative
impacts in the short, medium and long term.
Issues that affect IMTA which from the outer part.
Pollution
Aquaculture relies on the productivity of a given waterbody as well as on artificial rearing
facilities with adequate and sufficient fertilization and/or feeding, so yields are ultimately
determined by environmental conditions as well as culture techniques. Increasing levels of
pollution of aquatic resources have a negative effect on aquaculture productivity, product
safety and profitability. Pollution can be in the form of increased nutrient output (e.g.
domestic sewage, agricultural and livestock runoff) leading to eutrophication and possibly to
algal blooms or red tides, heavy metals, polychlorinated biphenyls (PCBs), etc.
Climate change
Climate change can affect aquaculture production through changes in seasonality of
weather patterns, increasing sea level, warming and increased extreme events leading to
unpredictable production. Most aquaculture is undertaken either in freshwater or in the
marine coastal fringe, both of which are susceptible to climate change.
Unlike most terrestrial animals, all cultured aquatic species are poikilothermic, meaning

10
their body temperatures vary with the ambient temperature. Therefore, climate change-
induced temperature variations will have a much stronger impact on aquaculture activities
and on their productivity and yields than on livestock.
Thus climate change must be considered as a potentially relevant external element
affecting IMTA performance and development; therefore, preparedness and adaptive measure
must be in place.
2.3 Risk analysis
It is important to define the concept of hazard in IMTA. This would be a physical agent or
event having the potential to cause harm or to impair the ability to achieve a higher level
objective. These often include: a biological pathogen (pathogen risk); an escaped aquatic
farmed organism (genetic risk, ecological risk, invasive alien species risk); a chemical, heavy
metal or biological contaminant (food safety risk); excess organic matter (environmental or
ecological risk); the loss of a captive market (financial or social risk).
A risk analysis typically seeks answers to four questions:
- What can go wrong?
- How likely is it to go wrong?
- What would be the consequences of its going wrong?
- What can be done to reduce either the likelihood or the consequences of its going wrong?
Whichever risk assessment method is used, it must include appropriately detailed
justifications as to the levels of risk chosen (high, medium, low, etc.). Often, when there is
not enough information or expertise on risk assessment, stakeholders’ qualitative local
knowledge-based assessments can be used.
2.4 Establish/define overall objectives and operational objectives
The overall objective (=goal) of the IMTA GAP is to demonstrate the sustainable
methodology of aquaculture at suitable regions. The IMTA GAP should promote ecologically
and socially responsible planning and management of aquaculture as an integral part of a
community and a region. It should allow integration of aquaculture (and reduce conflict) with
other activities and sharing the same resources. The means to achieve this should involve a
participatory process for planning and management with local communities and other
stakeholders.
Operational objectives will depend on the chosen priorities and will be context and

11
situation specific. However, the target to be achieved should be consistent with the overall
objective and should stem from a thorough understanding of the developmental context and
developmental options, and an exchange of informed opinion between all stakeholders.
However, reaching a consensus may prove difficult and may require resorting to “hard
choices”.
3. Implementing the IMTA GAP
The objectives of the IMTA should be in line with the contents of the national aquaculture
development policy (and strategy) of the country where the IMTA GAP is to be implemented.
The implementation of the IMTA GAP may be an opportunity to formulate an aquaculture
policy.
3.1 Species and Site selection
3.1.1 Shellfish
Shellfish belong to Mollusca, a general name for mollusks with shells. It includes seven classes,
such as lamellibranchias, gastropods, cephalopods and so on. The most widely applied species of
shellfish in IMTA were mainly filter-feeding shellfish, such as oysters, scallops, mussels and
herbivorous shellfish, such as abalone, etc.
3.1.2 Oyster
There are two shells in each oyster that differ in shape. Upper shells have a rough surface and is
dark gray. The upper shells are the central uplift and the lower shells which are attached to other
objects, are larger and flatter, and their edges are smoother; the inner surfaces of the two shells are all
white and smooth. The two shells are connected in the narrow end with an elastic ligament and the
middle of the inner shell has a strong central adductor muscle. When the shell is slightly open,
seawater is introduced into the shell by the wave of the cilia on the gills to filter the microalgae and
organic debris. Oysters are mostly dioecious, but few are hermaphrodites. There are more than one
hundred species of oyster distributed in almost all the coastal countries in the world. The production
of oyster ranks first in the shellfish production. The production of oyster accounts for more than 90
percent of the total production of shellfish. The countries with more developed oysters include PR
China, France, the United States of America, Japan, Republic of Korea, Mexico, New Zealand,
Australia, etc. There are more than 20 species in PR China. The main species are Pacific oyster,
Crassostrea rivularis Crould, Ostrea plicatula, and Ostrea denselamellosa Lischke etc.

12
3.1.3 Scallop
Scallops have two almost equal-sized shells and look like fans. The colors of the shell are usually
purple brown, light brown, yellow brown, reddish brown, apricot yellow, and gray white. The inside
of the shell is white. The muscle in the middle of the inner shell is edible. The shell surface is smooth
and distributed with radiate ribs. The ribs are smooth, scaly or tumid, and may be bright red, purple,
orange, yellow or white. There are eyes and short tentacles on the edge of the mantle. The tentacles
can feel the change of water quality. The tentacles hang like curtain in the two shells.
Scallops feed on algae and organic debris by filtering water and collect the food particles from the
cilia and move into the mouth. The scallop can be slapped intermittently by the two shells, spray
water and move with counterforce. The eggs meet the sperm in the seawater and begin to fertilize and
hatch. When the larvae grow to D shape larvae and they can swim in seawater. After some days of
swimming in the water, it will settle on the substrate with the byssus. There are three species of
scallop in China (Chlamys farreri, Argopecten irradias, Patinopecten yessoensis). The optimum
growth temperature of the three scallops are 5–25℃, 5–28℃, 5–20℃, respectively. The suitable
growth temperature of the three scallops above are 15–23℃, 15–23℃, 18–28℃, respectively.
3.1.4 Mussel
The mussel shell is wedged-shape and dark brown. The front of the shell is small and the back is
broad and round. The shell is 6–8 cm long, length is less than two times the shell height, and is thin.
The two shells are equal, symmetrical, and shell surface is lustrous purple and black. The growth
pattern is fine and clear. It grows in a ring from the shell roof. The inner surface of the shell is gray
and the edge is blue and has a pearly luster. The hinges are long and ligaments are dark brown,
approximately equal to the reamer. The articulated teeth are not developed. The posterior adductor
muscle degenerate and disappear. The foot is very small and soft. The mussels’ feeding style is
familiar with other bivalve mollusks. It can only obtain food passively when water flows through its
body and filtered through the gills. The main food is microalgae and organic detritus, in addition to
some protozoa. Mussels’ byssus can help them settle on fixed substrate such as rocks or culture ropes,
but some mussels can fixed on buoys or the bottom of the ship. The suitable growth temperature is 5–
23℃, and the optimum growth temperature is 10–20℃.
3.1.5 Abalone
Abalone belong to the Mollusca gastropoda. They have a thick layer of ear-shaped calcareous
shells. The shells are right-handed. The shells have three whorls and the screw suture is not deep. The
spire of abalone is very small. The shell roof of the abalone is blunt and protruding. The shell surface
of the abalone is dark green. The growth pattern of abalone is obvious, and the inner shell has a pearl

13
luster. There is a row of holes on the shell. There are 4-5 shell holes in Haliotis discus hannai and 7-9
shell holes in Haliotis diversicolor. Abalone was developed and hypertrophic gastropods, large and
flat. The foot is used for adherence and crawling. In the rich macroalgae reef, the abalone will not
move in a wide range. Abalone lurks in the daytime and comes out to feed at night. Abalone's intake,
digestibility, movement distance and speed, and respiration intensity are most active at night, and only
slightly move in the daytime when the tide is fluctuating. There are obvious seasonal movements of
abalone in the sea area. When the water temperature is low in winter and spring, it moves to deep
water. When the water temperature rises, it gradually moves to the shallow water. The abalone is very
sensitive to environmental changes. When it is frightened and attacked by the enemy, the abalone can
shrink its head, antennae and tentacles quickly and cling on a rock.
3.1.6 Macroalgae
The macroalgae species in the integrated shellfish-seaweed culture mainly include brown algae
Saccharina japonica, Undaria pinnatifida, Sargassum thun bergii, and Sargassum fusiforme, red
algae Gracilaria lemaneiformis and Eucheuma gelatinae. Their biological characteristics and
ecological habits vary by species. The biological characteristics and ecological habits of several
macroalgae are described below:
3.1.7 Kelp S. japonica
Kelp is a species of the genus of Saccharina, Laminariaceae, Phaeophyta. The large kelp plants are
the sporophytes, while the tiny filaments are the gametophytes. Kelp leaves are flat and thick in the
center. The growth of kelp is accomplished by intercalary growth and the meristematic cells located in
the base of the leaf and stem connections. The kelp frond is brown. In asexual reproduction of kelp,
the epidermal cells develop to form single-compartment sporangia. Sexual reproduction of kelp is
oogamous. The distribution of kelp S. japonica is mainly in the cold temperate zone. It can grow even
when the temperature is below 0 ℃, while the maximum temperature is 20℃, above which the algae
is perishable. Kelp live below the dry tide line and is sessile benthic. Currently, kelp farming is not
limited to its natural distribution. In China's southern waters, such as Fujian, kelp farming scale has
surpassed the northern Shandong and Liaoning Provinces.
3.1.8 Wakame U. pinnatifida
U. pinnatifida is one species of Undaria, Alariaceae, and Phaeophyta. The sporophyte of wakame
is large and has three parts, the sub-root, handle and leaves. In early development, U. pinnatifida
algae is ovate or long leaf-shaped, single and then gradually splits into plumes in the growth process,
with the raised ribbed structure.

14
Sporophyte of wakame is brown and lanceolate, with a length of 1 to 1.5 meters and width of 0.6 to
1 meter. Wakame U. pinnatifida can reproduce sexually and asexually. The growth of wakame is
accomplished by intercalary growth with an annual period. Its life history is similar with kelp S.
japonica, and can be divided into sporophyte and gametophyte generation. The wakame seaweed can
be seen, is a sporophyte, which can grow for nearly a year. The growth time of gametophyte is very
short and develop sporophyte when the environment is suitable. The distribution of wakame is mainly
in temperate regions. It can tolerate high water temperature and is suitable in semi-enclosed and
nutrient-rich bays. It is fixed at 1 to 4 meters below the low tide line. At present, the integrated culture
of U. pinnatifida and shellfish is mainly in the seas of Shandong and Liaoning in China. Wakame U.
pinnatifida requires plenty of light and is suitable for living in shallow water. 5-15 ℃ is the optimum
temperature range for sporophyte growth, with smooth requirements for the surrounding environment
trends.
3.1.9 Gracilaria species
The main cultured Gracilaria species in PR China are G. lemaneiformis, G. tenuistipitata var. Liui,
G. asiatica, G. tenuistipitata, G. blodgettii and G. chouae. Gracilaria species are erect, tufted,
cylindrical or flattened. Algae is light red to dark red. Gracilaria is widely distributed in all parts of
the world, from temperate to tropical sea. Commonly, Gracilaria is a temperate seaweed that
distributes from north to south of PR China. However, there are also many tropic and subtropical
Gracilaria species confined to the coastal provinces of Fujian, Guangdong, Guangxi and Hainan.
Gracilaria usually grows in intertidal or near low tide lines, with a few growing in deeper waters. In
the calm, smooth flow, flat and fertile waters of the sea, Gracilaria grows well at an optimum
temperature of 15 – 25 ℃.
3.1.10 Requirements for site selection
Sites for farming shellfish using the longline culture system usually require reasonable shelter from
waves and wind, high water quality, adequate tidal flow, depths of at least 5 m up to 20 m and ample
phytoplankton food supply. The muddy sand sediment type is better to the placement of longline
facilities. Further, the site should have no industrial or sewage pollution, and environmental indicators
should meet the requirements of the national standard.
15
3.2 Carrying capacity assessment
3.2.1 Assessment of carrying capacity for farmed seaweeds
3.2.1.1 Key parameters for assessment of carrying capacity for farmed seaweeds
Water chemistry
The water chemistry analysis is determined according to the standards set by the ocean survey regulations
and the marine pollution survey regulations.
Chlorophyll
The chlorophyll a was measured by 500 ml water samples in each survey layer. After the water samples
were filtered out by 100 mesh screens in order to remove zooplanktons and large algae, filtered in M-50
filtration bottles with microporous glass fiber membranes in 0.45 M pore diameter, the chlorophyll
concentration was determined by spectrophotometer.
The calculation methods of filtration, determination and chlorophyll were found in Parsons (1984).
Measurement of sea water velocity and exchange cycle
Each successive measurement of flow velocity and flow lasted to 25 hours during the spring and neap tides.
Each time the water exchange cycle of spring and neap tides is calculated respectively, then the average of
the spring and neap tidal exchange cycles is used to determine the seasonal water exchange cycle of given
areas.
Determination of primary productivity
The chlorophyll a method is used to determine primary productivity. After the assimilation coefficient was
measured by C14 method, primary productivity and primary production were calculated according to
chlorophyll concentration.
The primary production of the given waters is calculated according to the simplified formula proposed by
Cadee and Hegeman.
Determination of nitrogen content of algae and attached algae
The content of total nitrogen (TN) of farmed, wild and fouling macro algae in the given waters were
determined once a month. The procedures are: seaweed were sampled from different areas and dried under
sunlight, and then put into the oven dried for 48 hours under 60 ℃ ready for determination of the total
nitrogen content.
Nutrients transported by land runoff
According to the river runoff around the given estimated waters, and the concentration of nitrogen and
phosphorus in land runoff during different seasons, provided by the local relevant authorities, the total
nutrients transported from runoff to the carrying capacity assessment sea area is calculated year-round
Nutrients excreted by farmed animals
The total amount of ammonia nitrogen excreted or discharged by farmed animals (fish, shrimp and
scallops) and wild animal in the carrying capacity assessment sea area in different seasons is calculated
based on the different farmed and wild animals’ (fish, shrimp and shellfish) individual physiological
metabolism during different seasons, and the biomass of different kinds of animals.

16
Nutrients released from the sediment
Sediment samples is sampled from different regions of waters by the columnar sampler, and incubated
indoor for analyzing the contents of nutrients, and then the sedimentary nutrient release rate and the
amount of nutrients released by seabed sediments is calculated.
The budget of inorganic nitrogen seaweed aquaculture area
FIG. 1-1 The budget of inorganic nitrogen seaweed aquaculture area
Nc: the supplemental N for current exchange; NL: supplements N for land runoff; Nr: for animal excretion;
Ns: N for seabed sediment release; Nt: the total supply of sea area N; NA: fouling and wild large algal N
demand; NP: phytoplankton N demand; NK: cultured large algae N demand.
3.2.1.2 Assessment models of carrying capacity for farmed seaweeds
Assessment model of carrying capacity for farmed seaweeds in open sea area.
In the past 20 years, the data for ecological environment surveys showed that the inorganic nitrogen in
most sea areas was restricted nutrients during seaweed cultivation periods. Therefore, the inorganic
nitrogen is regarded as the main index for assessing carrying capacity for farmed seaweeds in the open
waters based on the budget of inorganic nitrogen transported by the current, demand by farmed, fouling
and wild seaweeds and phytoplankton, the supplement of inorganic nitrogen from animal excretion and
release from sediment. The models for assessment of carrying capacity for farmed seaweeds in the open
waters is set up (Figure 1-2).
NP NK NA
NL Nr Ns Nc
Nt

17
Figure 1-2. schematic diagram for assessment of carrying capacity for farmed seaweeds in open waters
Assessment model of carrying capacity for farmed seaweeds in open waters:
kelpi
m
j
jjaaaaaaI
ART
DSARBTACVNACVNDSN
CC
−−+
=1
I222111 )(
S: water area (m2);
D: water depth (m);
Ti: the time (h) of high tide (or low tide) to I;
Na1:The average concentration of N (mg/m3) in the water body in the assessment area was evaluated at point a1 at time T.
Na2:The average concentration of N (mg/m3) in the water body in the assessment area was evaluated at point a2 at time T.
CVa1: average current velocity of sea flow (m/h) at point a1 at time T;
CVa2: the average current velocity of sea flow (m/h) at point a2 at time T;
Aa1: the sectional area (m2) at point a1;
Aa2: the sectional area (m2) at point a2;
NI : Average inorganic nitrogen concentration (mg/m3) in farmed waters;
ARj: the absorption rate of inorganic nitrogen by jth species of seaweed (mg/h/g);
Bj: biomass (g/m3) of the j species of algae (phytoplankton or fouling algae).
m: the number of species of phytoplankton or other large attached algae;
ARkelp: the absorption rate of inorganic nitrogen (mg/h/g) of farmed algae.
calculation formula of assessment of carrying capacity for seaweed based on the budget of inorganic
nitrogen in the bay/sheltered waters

18
(1)
(2)
(3)
(4)
(5)
(6)
(7)
: the inorganic nitrogen (t) that was brought into the bay by current during seaweed cultivation;
: inorganic nitrogen (t) released from seabed sediments during seaweed cultivation;
: inorganic nitrogen (t) brought by land runoff during seaweed cultivation;
: inorganic nitrogen (t) required for primary production during seaweed cultivation;
: inorganic nitrogen (t) for other macro algae growth during seaweed cultivation;
: total organic nitrogen (t) for demand of farmed and wild seaweeds growing in given waters;
: production carrying capacity for seaweed in dry weight (t);
: the average inorganic nitrogen concentration (mg/m3) of survey stations at i time at the open side of sheltered area in
the growth period of seaweeds;
: the daily release rate of inorganic nitrogen in the seabed sediments at i time (mg/m2/d);
: inorganic nitrogen concentration (mg/m3) at i time in land runoff;
: for daily land runoff (m3/d);
S : the given area (m2);
D : average depth (m);
: the sampling interval (d);
t: the days for full exchange of sea water during the growth of seaweed cultivation in the sheltered/bay area (d);
: the primary production of phytoplankton (mg C/m2/d) at i time;
: the biomass (mg/m2) of fouling and wild macro algae at the initial growth season of farmed seaweed in the bay area;
: biomass (mg/m2) for different fouling and wild algae in the season of harvest of farmed seaweeds;
: the ratio of N:C inside phytoplankton;
: nitrogen content (%) for large wild macro algae of different species;
: the nitrogen content (%) of dried seaweed wen harvested;
m: species of fouling algae;
N : the number of sampling observations.

19
3.2.2 Assessment of carrying capacity for filter feeding shellfish
3.2.2.1 Filter feeding physiological ecology of bivalves.
Physiological and ecological parameters of bivalve shellfish.
Most mollusks of class Lamellibranchia (also known as Bivilvia) animals, such as mussels (Mytilidae),
scallops (Pectinidae), oysters (Ostreidae), belongs to the filtering feeders. These animals filtered
suspended particulate matter (including planktonic algae, micro zooplankton, planktonic bacteria, and
organic debris, etc.) in the water through cilium, gill and lip. Bivalves in natural waters distribute widely,
including river, lake, saltwater lake and estuary, and various kinds of shallow sea and deep sea habitats, but
the coastal water environment is regarded as the most important habitat with the big amount of variety and
quantity.
Bivalves generally has a strong ability to filter water and play an important role on nutrient dynamics and
energy ecology in coastal waters ecosystem through a high filtration and feeding rate, absorption, excretion,
defecation and growth and other physiological activities.
To evaluate the ecological effects of bivalve shellfish, it is necessary to study the physiological and
ecological characteristics of water filtration rate (clearance rate), feeding rate, absorption efficiency, and
scope of growth. At present, traditional research methods are well used to determine the physiological and
ecological parameters of bivalves.
(1) Clearance rate and filtration rate/feeding rate.
The still water system method for measuring the filtration/clearance rate is also known as Coughlan
method. Its calculation formula is as follows:
CR = (Ln ct-lnco)/ t * V/N.
In the formula, Co and Ct are the initial concentration and the concentration at t time respectively, V is the
experimental water volume, and N is the number of experimental individuals.
The calculation formula of flowing system is as follows:
CR = (C1 -C2)/ C1 * F/ N.
In the formula, C1 and C2 are the food concentration in the water flowing into and out of the experimental
box respectively, and N is the number of experiment individuals.
The two methods above are involved in measuring the clearance ability of shellfish on suspended particles
in water.

20
The product of Clearance rate (CR) and total suspended particulate concentration (TPM) is the filter
feeding rate of shellfish (filtration rate, FR).
When there is no pseudofeces (rejection rate, RR) appearing in the measuring box, the filter rate is usually
regarded as ingestion rate (IR). When there is pseudofeces, IR= FR-RR
In addition, there are other methods for determination of bivalves’ filtration rate used in the laboratory,
methods such as suction, impeller, thermistor, video observation and so on. Due to control difficulty, these
methods are rarely used now.
Under laboratory conditions, the simple still water and flow water tank method can eliminate the
variability of seawater velocity which may occur in natural conditions. Results show that the flow rate of
water could affect the feeding and growth of bivalves. In coastal waters, the changes in tidal currents and
winds can lead to changes in the quantity and quality of suspended matter in the short term, and then affect
the feeding activities of shellfish.
(2) Absorption efficiency.
The absorption efficiency (AE) is one of the important basic parameters for study of shellfish energy. In an
area with high number of bivalves, shellfish absorption rate is also an important parameter of ocean
ecosystem dynamics, its value directly influences the energy flow and material cycle of the sea area. The
absorption rate of bivalves is affected by a variety of factors, including feed quality, feed concentration and
shellfish feeding rate, temperature, salinity and individual size.
The ratio method proposed by Conover in 1966 for determining the absorption of shellfish is based on the
content of organic matter in food and feces (Ashing method determination), and calculated by the
following formula:
AE = (f - e) / / (1 -) e * f * 100 = (1 - e/f)/ (1 - e) * 100
In the formula, f and e are the percentage of organic matter in feeds and feces respectively.
The application of this method is that the shellfish assimilate the organic matter only, and there is no
obvious assimilation effect on inorganic substances. In practice, it just collects representative feces, no
need to collect all the feces.
(3) Energy parameters.
Energy flow is one of the basic functions of the ecosystem. The physiological energy of the bivalve
shellfish has been studied extensively in the past decades by determining the feeding rate and the
absorption efficiency of bivalves.

21
According to the biological energy principle:
C =F +U +R +P
In the formula, C is feeding energy, F is fecal energy, U is excretion energy, R is metabolism energy, P is
growth energy.
Set A to absorb energy, which represents the part of the feeding energy absorbed by the organism, then: A=
C-F.
The concept and parameter of scope for growth (SFG), used to predict the surplus energy for growth and
reproduction, has been widely used in invertebrates, especially marine bivalve for physiological ecology
studies. SFG is defined as the difference between the energy consumed by animals and the energy
consumed and lost, i.e., SFG =A - (R +U).
SFG has proved to be a useful concept for evaluating the effects of environmental stress, growth efficiency
and the differences in physiological responses of different populations.
The main advantage of SFG is that the growth performance of bivalve shellfish requires long-term study,
while SFG can be estimated in short-term experiments.
The other two energy budget parameters are K1 (total growth efficiency), K2 (net growth efficiency), which
is defined as:
K1 = P/C = SFG/C
K2 = P/A = SFG/A
Due to feeding conditions being standardized and strict control of experiment conditions, the filtration rate
and absorption rate of shellfish are widely studied under laboratory conditions.
3.2.2.2 Evaluation of filter-feeding shellfish capacity.
Dynamic carrying capacity estimation model for assessing filter-feeding shellfish in open sea
The model for assessing filter-feeder shellfish production carrying capacity in open water mainly based
on the supply of POM in the assessment area transported by current, filter-feeder organisms species and
biomass, farming shellfish feeding physio-ecology instantaneous changes, and so on (Figure 1-4).

22
Figure 1-4 Assessment model of carrying capacity for filter feeding shellfish in open water.
The Assessing model is as follows:
( )
),(
)()()(1
222111
ibi
n
i
m
j
iijfiaaaaaai
TwCOPFR
TBFRTACVCoPACVCoPDSCoP
CC
−−+
=
S: area (m2); D: water depth (m); Ti; The time (h) of the high tide (or low tide) to i; CVa1: The average
velocity of current in the time of a1 point in time T (m/h); CVa2:The average velocity of the current at a2
point in time T (m/h); Aa1: The sectional area (m2) of the a1 point; Aa2: The section area (m2) of the a2
point; : particle organic matter (POM) or chlorophyll a concentration (mg/m3) in aquaculture
waters at time i; FRfi: the individual feeding rate (mg/h/ind) of the filter-feeding animals; FRbi: the
individual feeding rate of the filter-feeding shellfish (mg/h/DWg); Bij: the total biomass (ind) of the j
species in aquaculture waters at I time; m: number of fouling filter-feeding animals; W: tissue dry weight
of shellfish (g).
Comparing with other models, this model fully considers the tides, velocity, distribution of food and food
supplement and consumption inside and outside the aquaculture water, and is suitable for carrying capacity
assessment at any time for any types (including closed waters, open water) of waters and filter-feeding
animals.
Assessment model of carrying capacity for filter-feeding bivalves in sheltered waters.
The food of filter-feeding shellfish is mainly composed of phytoplankton and organic detritus, bay
phytoplankton and organic detritus. The level of primary productivity has determined food quality and
quantity of filter-feeding animals, and then determines the g carrying capacity for filter-feeding bivalves in
sheltered waters. Because the water depth in the bay is relatively shallow, some of the organic detritus in
seabed sedimentary can be re-suspended into the water column by wind and waves. This resulted when the

23
concentration of the POM sampled in rough conditions is much higher than in calm seas and resulted in
bigger data error used for assessing carrying capacity.
In contrast, the number and concentration of phytoplankton represented by chlorophyll a are more stable
than POM and not susceptible to physical factors such as wind and waves. Therefore, the flowing water
method in situ or simulated in situ flowing water method is recommended to measure the clearance,
filtration and feeding rates of filter-feeding animals in shallow waters. In this way, the filtration and
feeding rates can be obtained based on natural environment conditions and natural food composition.
The model of production carrying capacity of Sungo Bay for scallop is:
CC: the production carrying capacity of scallop (ind/m2);
P: primary production (mg C/m2/d);
K: the ratio of organic carbon and chlorophyll a in phytoplankton (40:1).
FRj: filtration rate of different filter-feeding fouling organisms (m3/ind/d);
Chl a: average concentration of chlorophyll a (mg/m3);
FRs: filtration rate of scallop (m3/ind/d);
B: the density of different filter-feeding fouling animals (ind/m);
j: the type of filter feeding fouling animals.
3.3 Shellfish-seaweed and shellfish-seaweed-sea cucumber IMTA
3.3.1 Establishment of the shellfish and seaweed integrated aquaculture system
3.3.1.1 Filter-feeding bivalves and seaweed integrated aquaculture system
According to the mutual benefit and biological characteristics of the filter-feeding bivalves and
seaweed, Saccharina is the suitable bioremediation species during winter and spring, while Gracilaria
is more suitable during summer and autumn.
Longline culture is mostly used in integrated aquaculture of filter-feeding bivalve and seaweed. The
direction of the longline should be consistent with the direction of the seawater. The section of the
longline holding the buoys or floats is called the backbone. Typically, the length of each backbone is
100 m with a 5 m gap between each other. A synthetic rope of 2.4 cm called a warp is attached to the
edge of the backbone. The warp is generally three times the depth of the water. The warp is moored
on the seabed by a heavy weight anchor or stake anchor. Buoys with 30 cm diameters are spaced
appropriately to support the mass of growing bivalves on the backbone. The lantern net with scallops

24
or oysters inside are hung on the backbone. The space between the 2 lantern nets is 2.3 m with 43
units per 100 m backbones. Horizontal kelp rope cultivation is the typical method for kelp longline
culture system. Each kelp rope is combined with two short kelp ropes with the length of 2.5 m.
Between two adjacent floating backbones there are 174 kelp ropes parallel. The floating backbones
and kelp ropes are connected by two hanging ropes and one hanging buckle. About 40 individuals of
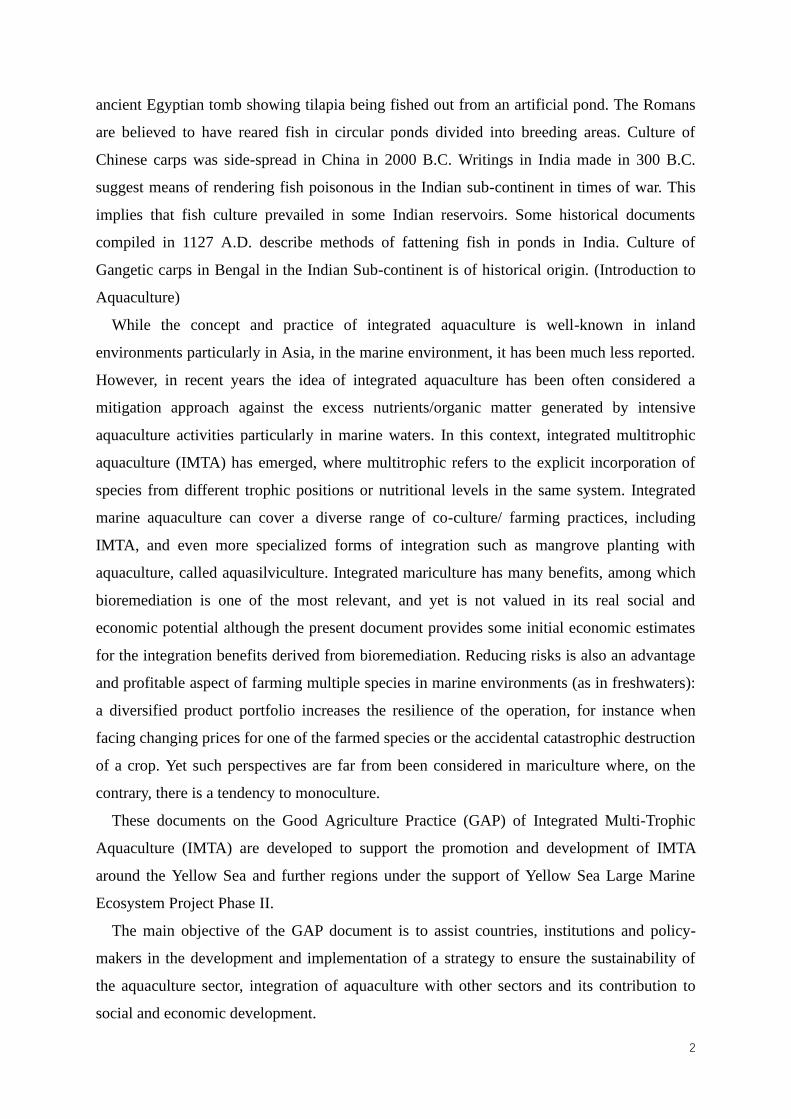
kelp are planted on each kelp rope.
Fig. 3-1 The structure of longline system for shellfish and seaweed integrated aquaculture
Daily management is necessary to maintain the good growth condition of the organisms, which
includes the cleaning of fouling organisms, maintaining the facilities, examining the quantities of the
buoys, monitoring related environmental factors. Moreover, it is important to keep records so as to
trace the products through all stages of production.
3.3.1.2 Abalone, seaweed and sea cucumber integrated aquaculture system
The abalone aquaculture needs to consume considerable artificial diet (fresh or dry seaweed). The
low utilization efficiency of diet leads to the deterioration of water quality which in turn affects the
health of abalone, and ultimately affecting the food production function of the aquaculture system.
The implementation of abalone-seaweed-sea cucumber integrated aquaculture helps reduce the
negative effects caused by large-scale abalone aquaculture significantly. In this system, the seaweed
serves as the food for the abalone, while the dissolved and particle wastes generated by the abalone
are taken up by seaweed and sea cucumber. The dissolved oxygen provided by the seaweed can meet
the requirement of the abalone and sea cucumber.
Longline culture is mostly used in the integrated aquaculture of abalone-seaweed-sea cucumber.
25
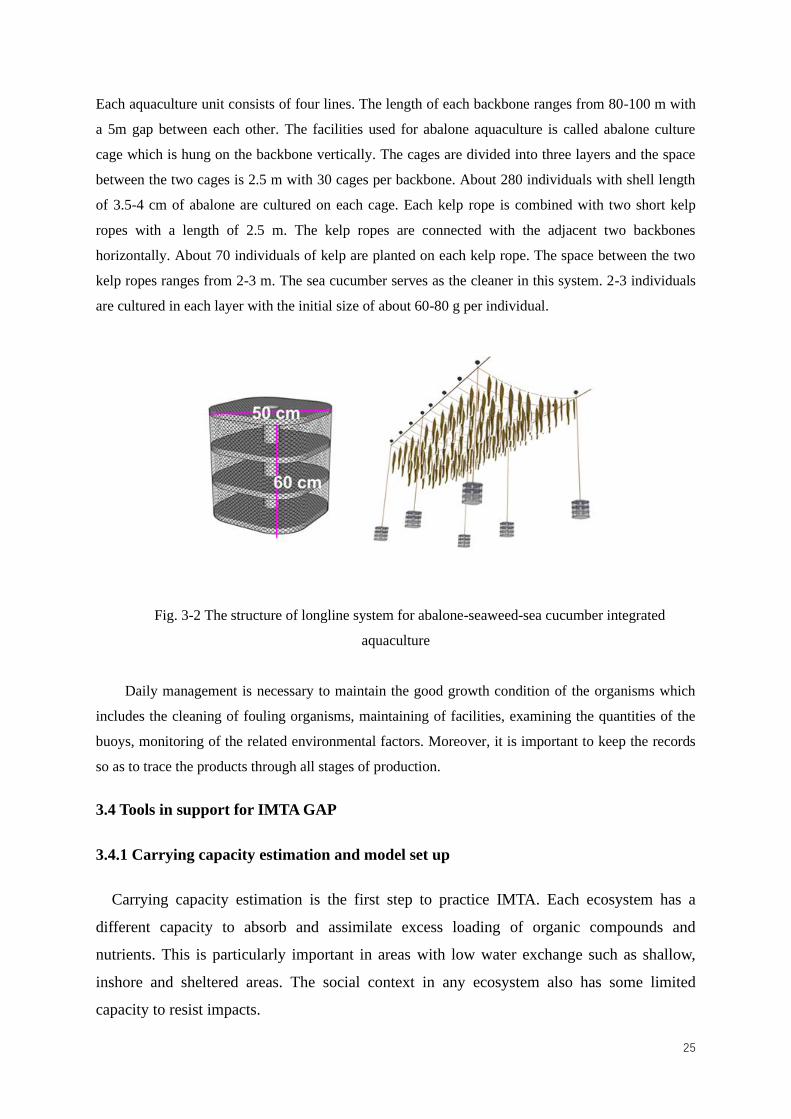
Each aquaculture unit consists of four lines. The length of each backbone ranges from 80-100 m with
a 5m gap between each other. The facilities used for abalone aquaculture is called abalone culture
cage which is hung on the backbone vertically. The cages are divided into three layers and the space
between the two cages is 2.5 m with 30 cages per backbone. About 280 individuals with shell length
of 3.5-4 cm of abalone are cultured on each cage. Each kelp rope is combined with two short kelp
ropes with a length of 2.5 m. The kelp ropes are connected with the adjacent two backbones
horizontally. About 70 individuals of kelp are planted on each kelp rope. The space between the two
kelp ropes ranges from 2-3 m. The sea cucumber serves as the cleaner in this system. 2-3 individuals
are cultured in each layer with the initial size of about 60-80 g per individual.
Fig. 3-2 The structure of longline system for abalone-seaweed-sea cucumber integrated
aquaculture
Daily management is necessary to maintain the good growth condition of the organisms which
includes the cleaning of fouling organisms, maintaining of facilities, examining the quantities of the
buoys, monitoring of the related environmental factors. Moreover, it is important to keep the records
so as to trace the products through all stages of production.
3.4 Tools in support for IMTA GAP
3.4.1 Carrying capacity estimation and model set up
Carrying capacity estimation is the first step to practice IMTA. Each ecosystem has a
different capacity to absorb and assimilate excess loading of organic compounds and
nutrients. This is particularly important in areas with low water exchange such as shallow,
inshore and sheltered areas. The social context in any ecosystem also has some limited
capacity to resist impacts.

26
There are five kinds of aquaculture capacity: (a) physical carrying capacity that is the
maximum population size limited by the appropriate spatial scale; (b) production capacity
that is the maximum stocking density with the maximum production; (c) ecological carrying
capacity that is the minimum stocking density leading to negative effect on aquatic ecosystem;
(d) social carrying capacity that is the maximum stocking density or aquaculture scale leading
to negative social effects (McKindsey et al., 2006); and (e) environmental carrying capacity
that is the maximum stocking density leading to the exceeding of the environmental standard
threshold value of one given state or region (Abo and Yokoyama, 2003), respectively.
Carrying capacity estimation mostly depends on the modeling simulation. An eco-dynamic
model to simulate the IMTA can be conducted as the materials circulation and energy flow in
the ecosystem are expressed by equations. These equations may include hydrodynamic
characteristics, phytoplankton biomass, zooplankton biomass, cultured organism biomass,
DO concentration, nutrients concentration, POM concentration, and so on. The responses of
environmental factors to aquaculture with different stocking density or culture scale may be
estimated by regulation of the initial value of cultured organism biomass. According to the
relation between the responses and the cultured organism biomass, the carrying capacity can
be determined. One box model about the shellfish-macroalgae IMTA in Sungo Bay, China
was conducted by Nunes et al. (2003), during which the equations were related to
phytoplankton biomass, dissolved inorganic nitrogen, suspended particulate matters, scallop
biomass and oyster biomass. Moreover, the hydrodynamic characteristics of IMTA was
simplified as water exchange period. If the culture scale of the kelp was kept constant and
only the biomass of scallop or oyster was regulated, the carrying capacity of scallop and that
of oyster will be the maximum output production of them, respectively.
Considering the evaluation methods for determining shellfish carrying capacity, the
macroalgae carrying capacity and the finfish carrying capacity, the status of carrying capacity
assessment for IMTA, and the characteristics of IMTA, the steps for carrying capacity
assessment for IMTA should include the object organisms and environment factors.
3.4.2 Spatial planning
Spatial planning should be based on the scientific techniques. Essential elements for the
implementation of the IMTA GAP are spatial planning tools, including Geographic
Information Systems (GIS), remote sensing and mapping for data management, analysis,
modelling and decision-making. There are several mature systems to support the IMTA

27
spatial planning such as Ecosystem Approach to Making Space for Aquaculture (Aquaspace)
and A Web-based Interactive Tool for Aquaculture Planning (AkvaVis). They are considering
the development of aquaculture, aquaculture practice and management, multisectoral
development and management that includes aquaculture.
4. Future developments
Integrated Multi-Trophic Aquaculture (IMTA) is a good interpretation of the carbon sink
fisheries and is an environmental-friendly and efficient eco-farming model. IMTA system is
composed of different trophic levels, the feeding culture units (such as fish, shrimp) generates
nutrients for non-feeding culture units (such as filter-feeding shellfish, macro algae and
carnivorous organisms). Excess material in the culture system is transformed into cultured
organisms, and to achieve the effective material recycling and reduce the ecosystem pressure
from aquaculture. At the same time, IMTA also increase the culture diversity and enhance the
economic benefits, which promote the sustainable development of aquaculture industries.
Develop mariculture based on ecosystem management. The concept of ecological
management was first proposed by the British ecologist A. G. Tansey in 1935. However,
different definitions and connotations about it arouse from different research objects,
purposes and specialty. For example, Agee (1988) pointed out that ecosystem management
refers to the regulation and control of the internal structure and function of ecosystems, input
and output, so as to achieve the desired status from the society. Sample (1992) pointed out
that ecosystem management refers to elaborate utilization of ecology and economics,
sociology and management principles to manage the long term production of ecosystems and
to restore or maintain the integrity and desired status, utilization, products, values and
services of ecosystems. The main purpose of ecosystem management is to ensure the
ecological integrity and sustainability of ecosystems by adjusting the physical, chemical and
biological processes of ecosystems (William, 2005).Through the development ecosystem
management systems, it is expected to solve the key problems that restrict the sustainable
development of mariculture, such as the squeezed culture space and the unscientific layout.
Develop the standardized ecological farming. With the progress of urbanization, there is a
serious shortage of aquaculture employee with an aging trend. In order to ensure the
sustainable development of aquaculture, mechanization and automation are imminent. At
present, China's mariculture, especially the coastal long-line farming, is extremely irregular
to implement mechanical operations. Therefore, the standard aquaculture is the only way to

28
solve this contradiction. According to different culture methods, to design suitable
mechanized equipment and facilities for unified long-line culture structure and culture density.
Also develop mechanized harvesting equipment to provide automated technical support.
Through the development of standardized eco-farming, we can efficiently deal with many
challenges such as raising costs, decreasing benefits and shortage of labor.
Establish aquaculture capacity management system. Carrying out the assessment of
aquaculture carrying capacity is the basis for scientifically planning the culture scale,
rationalizing culture structure and promoting the modernization, as well as the prerequisite
for ensuring the development of a green, low-carbon and environment-friendly aquaculture
industry. Carrying capacity assessment should be included in the government's institutional
management, to establish the regional farming carrying capacity assessment system and
corresponding assessment center. Based on the ecosystem carrying capacity, making the
technical specifications for aquaculture water bodies such as seawaters, tidal flats and ponds.
To provide a scientific basis and regulatory measures for the sustainable development of
modern aquaculture.
5. Reference
Abo K., Yokoyama H. Examination of the environmental criterion for mariculture based on
benthic oxygen uptake rate an attempt to evaluate assimilative capacity, by using a three-
dimensional numerical model. Bulletin of Japanese Society of Fisheries Oceanography,
2003, 67(2): 99-110.
FAO. Aquaculture development. 4. Ecosystem approach to aquaculture. FAO Technical
Guidelines for Responsible Fisheries. No. 5, Suppl. 4. Rome, FAO. 2010. 53p.
Introduction to aquaculture - Based on lectures presented by V. G. Jhingran at ARAC for the
Senior Aquaculturists course.
McKindsey C W, Thetmeyer H, Landry T, et al. Review of recent carrying capacity models
for bivalve culture and recommendations for research and management. Aquaculture, 2006,
261:451-462.
Nunes J P, Ferreira J G, Gazeau F, et al. A model for sustainable management of shellfish
polyculture in coastal bays. Aquaculture, 2003, 219: 257-277.
Sample V A. Building partnerships for ecosystem management on forest and range lands of
mixed ownership. Proceedings of the. Society of American Foresters National Convention
(USA), 1992.

29
Williams P J L B, Del Giorgio P A. Respiration in Aquatic Ecosystems: History and
Background. Solid State Ionics, 2005, 25(1): 100.