Application, Optimisation and Evaluation of Deep Learning for ...
60
ACTA UNIVERSITATIS UPSALIENSIS UPPSALA 2022 Digital Comprehensive Summaries of Uppsala Dissertations from the Faculty of Science and Technology 2144 Application, Optimisation and Evaluation of Deep Learning for Biomedical Imaging HÅKAN WIESLANDER ISSN 1651-6214 ISBN 978-91-513-1489-1 URN urn:nbn:se:uu:diva-472360
-
Upload
khangminh22 -
Category
Documents
-
view
3 -
download
0
Transcript of Application, Optimisation and Evaluation of Deep Learning for ...
ACTAUNIVERSITATIS
UPSALIENSISUPPSALA
2022
Digital Comprehensive Summaries of Uppsala Dissertationsfrom the Faculty of Science and Technology 2144
Application, Optimisation andEvaluation of Deep Learning forBiomedical Imaging
HÅKAN WIESLANDER
ISSN 1651-6214ISBN 978-91-513-1489-1URN urn:nbn:se:uu:diva-472360

Dissertation presented at Uppsala University to be publicly examined in Heinz-Otto Kreiss,Ångströmlaboratoriet, Lägerhyddsvägen 1, Uppsala, Friday, 3 June 2022 at 09:00 for thedegree of Doctor of Philosophy. The examination will be conducted in English. Facultyexaminer: Professor Bjoern Menze (University of Zurich, Department of QuantitativeBiomedicine).
AbstractWieslander, H. 2022. Application, Optimisation and Evaluation of Deep Learning forBiomedical Imaging. Digital Comprehensive Summaries of Uppsala Dissertations from theFaculty of Science and Technology 2144. 58 pp. Uppsala: Acta Universitatis Upsaliensis.ISBN 978-91-513-1489-1.
Microscopy imaging is a powerful technique when studying biology at a cellular and sub-cellularlevel. When combined with digital image analysis it creates an invaluable tool for investigatingcomplex biological processes and phenomena. However, imaging at the cell and sub-cellularlevel tends to generate large amounts of data which can be difficult to analyse, navigate andstore. Despite these difficulties, large data volumes mean more information content which isbeneficial for computational methods like machine learning, especially deep learning. The unionof microscopy imaging and deep learning thus provides numerous opportunities for advancingour scientific understanding and uncovering interesting and useful biological insights.
The work in this thesis explores various means for optimising information extractionfrom microscopy data utilising image analysis with deep learning. The focus is on threedifferent imaging modalities: bright-field; fluorescence; and transmission electron microscopy.Within these modalities different learning-based image analysis and processing techniques areexplored, ranging from image classification and detection to image restoration and translation.
The main contributions are: (i) a computational method for diagnosing oral and cervicalcancer based on smear samples and bright-field microscopy; (ii) a hierarchical analysis ofwhole-slide tissue images from fluorescence microscopy and introducing a confidence basedmeasure for pixel classifications; (iii) an image restoration model for motion-degraded imagesfrom transmission electron microscopy with an evaluation of model overfitting on underlyingtextures; and (iv) an image-to-image translation (virtual staining) of cell images from bright-field to fluorescence microscopy, optimised for biological feature relevance.
A common theme underlying all the investigations in this thesis is that the evaluation of themethods used is in relation to the biological question at hand.
Keywords: Deep Learning, Microscopy, Image Analysis
Håkan Wieslander, Department of Information Technology, Division of Visual Informationand Interaction, Box 337, Uppsala University, SE-751 05 Uppsala, Sweden.
© Håkan Wieslander 2022
ISSN 1651-6214ISBN 978-91-513-1489-1URN urn:nbn:se:uu:diva-472360 (http://urn.kb.se/resolve?urn=urn:nbn:se:uu:diva-472360)

To my daughter

List of papers
This thesis is based on the following papers, which are referred to in the textby their Roman numerals.
I Wieslander, H., Forslid, G., Bengtsson, E., Wählby, C., Hirsch, JM.,Runow Stark, C., Kecheril Sadanandan, S. “Deep convolutional neuralnetworks for detecting cellular changes due to malignancy”,Proceedings of the IEEE International Conference on Computer Vision(ICCV) Workshops, October, 2017.
II Wieslander, H., Harrison, PJ., Skogberg, G., Jackson, S., Fridén, M.,Karlsson, J., Spjuth, O., Wählby, C. “Deep learning with conformalprediction for hierarchical analysis of large-scale whole-slide tissueimages”, IEEE journal of biomedical and health informatics, May,2020.
III Wieslander, H., Wählby, C., Sintorn, IM. “TEM image restorationfrom fast image streams”, PLOS ONE, February, 2021.
IV Wieslander, H., Gupta, A., Bergman, E., Hallström, E., Harrison, PJ.“Learning to see colours: Biologically relevant virtual staining foradipocyte cell images”, PLOS ONE, October, 2021.
Reprints were made with permission from the publishers.

Related work
In addition to the papers included in this thesis, the author has alsocontributed to the following publications/published datasets:
R1 Gupta, A, Harrison, PJ., Wieslander, H., Pielawski, N., Kartasalo, K.,Partel, G., Solorzano, L., Suveer, A., Klemm, A., Spjuth, O., Sintorn,IM., Wählby, C. “Deep learning in image cytometry: a review”,Cytometry Part A, 95: 366-380, 2019.
R2 Torruangwatthana, P., Wieslander, H., Blamey, B., Hellander, A.,Toor, S. “HarmonicIO: scalable data stream processing for scientificdatasets”, 2018 IEEE 11th International Conference on CloudComputing (CLOUD): 879-882, 2019.
R3 Harrison, PJ.,Wieslander, H., Sabirsh, A., Karlsson, J., Malmsjö, V.,Hellander, A., Wählby, C., Spjuth O. “Deep-learning models for lipidnanoparticle-based drug delivery”, Nanomedicine, 16.13: 1097-1110,2021.
R4 Blamey, B., Toor, S., Dahlö, M., Wieslander, H., Harrison, PJ.,Sintorn, IM., Sabirsh, A., Wählby, C., Spjuth, O., Hellander, A. “Rapiddevelopment of cloud-native intelligent data pipelines for scientificdata streams using the HASTE Toolkit”, GigaScience 10.3, 2021.
R5 Wieslander, H., Wählby, C., Sintorn, IM. “Transmission ElectronMicroscopy Dataset for Image Deblurring (1.0)” [Data set]. Zenodo.https://doi.org/10.5281/zenodo.4113244, 2020.


Contents
1 Introduction . . . . . . . . . . . . . . . . . . . . . . . . . . . . . . . . . . . . . . . . . . . . . . . . . . . . . . . . . . . . . . . . . . . . . . . . . . . . . . . . . . . . . . . . . . . . . . . . 11
2 Microscopy Imaging . . . . . . . . . . . . . . . . . . . . . . . . . . . . . . . . . . . . . . . . . . . . . . . . . . . . . . . . . . . . . . . . . . . . . . . . . . . . . . . . . . 132.1 Bright-field Microscopy . . . . . . . . . . . . . . . . . . . . . . . . . . . . . . . . . . . . . . . . . . . . . . . . . . . . . . . . . . . . . . . . . 132.2 Fluorescence Microscopy . . . . . . . . . . . . . . . . . . . . . . . . . . . . . . . . . . . . . . . . . . . . . . . . . . . . . . . . . . . . . . 142.3 Transmission Electron Microscopy . . . . . . . . . . . . . . . . . . . . . . . . . . . . . . . . . . . . . . . . . . . . . . . 152.4 Working with Microscopy Images . . . . . . . . . . . . . . . . . . . . . . . . . . . . . . . . . . . . . . . . . . . . . . . . 15
3 Deep Learning for Digital Image Analysis . . . . . . . . . . . . . . . . . . . . . . . . . . . . . . . . . . . . . . . . . . . . . . 183.1 Fundamentals of Digital Image Processing . . . . . . . . . . . . . . . . . . . . . . . . . . . . . . . . . . 183.2 Machine Learning and Deep Learning . . . . . . . . . . . . . . . . . . . . . . . . . . . . . . . . . . . . . . . . . 203.3 Different Networks For Different Applications . . . . . . . . . . . . . . . . . . . . . . . . . . . 253.4 Uncertainty Estimates for Deep Learning . . . . . . . . . . . . . . . . . . . . . . . . . . . . . . . . . . . . 273.5 Learning Using Privileged Information . . . . . . . . . . . . . . . . . . . . . . . . . . . . . . . . . . . . . . . . 293.6 Evaluation Methods . . . . . . . . . . . . . . . . . . . . . . . . . . . . . . . . . . . . . . . . . . . . . . . . . . . . . . . . . . . . . . . . . . . . . . . 30
4 Summary of Papers . . . . . . . . . . . . . . . . . . . . . . . . . . . . . . . . . . . . . . . . . . . . . . . . . . . . . . . . . . . . . . . . . . . . . . . . . . . . . . . . . . . . 334.1 Localisation and Classification (Papers I and II) . . . . . . . . . . . . . . . . . . . . . . . . . 33
4.1.1 Oral and Cervical Cancer Diagnosis with DeepLearning . . . . . . . . . . . . . . . . . . . . . . . . . . . . . . . . . . . . . . . . . . . . . . . . . . . . . . . . . . . . . . . . . . . . . . . . . . . 33
4.1.2 Confidence Based Predictions For Whole SlideImages . . . . . . . . . . . . . . . . . . . . . . . . . . . . . . . . . . . . . . . . . . . . . . . . . . . . . . . . . . . . . . . . . . . . . . . . . . . . . . 36
4.1.3 Contributions in Localisation and Classification, andDiscussions . . . . . . . . . . . . . . . . . . . . . . . . . . . . . . . . . . . . . . . . . . . . . . . . . . . . . . . . . . . . . . . . . . . . . . 38
4.2 Digital Image Restoration and Translation (Papers III and IV) . . 404.2.1 Image Restoration of TEM Images . . . . . . . . . . . . . . . . . . . . . . . . . . . . . . . . 404.2.2 Virtual Staining of Adiopocyte Cell Images . . . . . . . . . . . . . . . . . . 424.2.3 Contributions in Digital Image Restoration and
Translation . . . . . . . . . . . . . . . . . . . . . . . . . . . . . . . . . . . . . . . . . . . . . . . . . . . . . . . . . . . . . . . . . . . . . . . 44
5 Perspectives and Future Outlooks . . . . . . . . . . . . . . . . . . . . . . . . . . . . . . . . . . . . . . . . . . . . . . . . . . . . . . . . . . . . 47
Sammanfattning på Svenska . . . . . . . . . . . . . . . . . . . . . . . . . . . . . . . . . . . . . . . . . . . . . . . . . . . . . . . . . . . . . . . . . . . . . . . . . . . 49
Acknowledgements . . . . . . . . . . . . . . . . . . . . . . . . . . . . . . . . . . . . . . . . . . . . . . . . . . . . . . . . . . . . . . . . . . . . . . . . . . . . . . . . . . . . . . . . . . 51
References . . . . . . . . . . . . . . . . . . . . . . . . . . . . . . . . . . . . . . . . . . . . . . . . . . . . . . . . . . . . . . . . . . . . . . . . . . . . . . . . . . . . . . . . . . . . . . . . . . . . . . . . 53

1. Introduction
Digital imaging is one of the most powerful tools for investigating complexprocesses and phenomena with applications in multiple scientific disciplines.The cameras used to capture digital images can be found everywhere, fromeveryone’s mobile phones to those used in the most complex microscopes.Images capture snap-shots of reality in which a large amount of information iscontained. As technology advances these snap-shots become more and moredetailed, resulting in images carrying more and more information. Microscopyimaging has benefited greatly from this information increase, with more ad-vanced microscopes enabling new scientific discoveries.
The current rapid advances in image capturing technology call for new andsmarter methods for analysing the huge amounts of data created. A scientificfield that thrives on large amounts of data is machine learning, especially deeplearning. Deep learning learns the task at hand directly from the data and hasbecome one of the most competitive and successful approaches for exploringand analysing microscopy data. The applications where deep learning can aidclinicians, pathologists and researchers range from increasing image quality,for easier analysis, to improving patient diagnosis and optimising drug discov-ery. Deep learning can also be used directly at the data collection level for lessharmful imaging of cells through virtual staining.
Due to the fact that microscopy imaging captures complex biological pro-cesses it is of high importance that the output is biologically correct and inter-pretable. Compared to natural scene images where the interest may mainly liein that the images are perceptually appealing to human eyes, with biologicalsamples we are more concerned with uncovering the details in the images thatcan advance our scientific understanding. In many cases this calls for methodstailored to the specific use case.
The work in this thesis covers a broad range of applications within mi-croscopy imaging and were developed in close collaboration with end usersand industry to identify the actual needs present there. The main objectives ofthis thesis are:
• Develop methods for smarter/more efficient handling and analysis oflarge data volumes from various microscopy experiments.
• Identify the needs and challenges present when working with microscopyimages and developing methods for smarter image acquisition.
• Develop methods for more precise analysis and explainability with anemphasis on biological relevance.
11

These objectives were dealt with in the four main papers of this thesis.Paper I and II tackle region/object localisation and classification. Paper I in-vestigates whether deep learning can be used as a tool for diagnosing patientswith oral or cervical cancer via manual cell localisation and automated classi-fication. Paper II investigates the use of deep learning for drug discovery andshows that drug localisation can be done automatically whilst also incorporat-ing a measure of confidence in the final analysis. Papers III and IV deal withrestoration and translation. In paper III methods were developed to removemotion blur from images captured with a transmission electron microscopeand to visualise model predictions. In Paper IV deep learning based methodswere developed for fluorescent virtual staining of adipocyte cell images withan evaluation method based on biologically relevant features to complementmeasures of reconstructed image quality.
The thesis is organized by first giving a brief background to microscopyimaging (chapter 2) followed by the main techniques and methods used in thisthesis (chapter 3). A discussion of the four main papers is presented in chapter4 and finally perspectives and future outlooks are given in chapter 5.
12

2. Microscopy Imaging
Microscopy imaging is at the core of studying biological specimens at the celland sub-cellular level. Depending on the specific study, different types of mi-croscopy can be more optimal than other. Biological samples are in generaltransparent and thus need to be stained before being imaged by the micro-scope. The sample preparation varies depending on the study at hand. Forinstance, biopsies of organ samples are usually acquired by taking a microme-ter thin slice of the organ which is then imaged as a Whole-Slide Image (WSI).Studying cell behaviour in response to different drugs or compounds is, on theother hand, usually done on cells cultured in a multi well plate. A multi wellplate is a plate with multiple wells (small holes with a transparent bottom) or-ganised as a matrix. With this you can, for instance, image the effect on cellsof different compounds added to each well. A third method, when the cells ofinterest can be reached without invasive surgery, is to scrape off the cells, witha small brush, and smear them onto a piece of glass which is then imaged. Thisis a useful method for cancer screening, since it is less invasive than biopsies.The rest of this chapter will present the microscopy techniques used in thisthesis and discuss the challenges of working with microscopy images.
2.1 Bright-field MicroscopyBright-field microscopy is the most basic type of microscopy. In bright-fieldmicroscopy the sample is illuminated with white light through a lens that di-rects the light to the specimen. The light is captured by an objective lens andtravels to the observer/camera, see figure 2.1 (left). Consequently the objectsappears dark and the background bright [1]. The advantage of this techniqueis that it is simple to set up and use, and is relatively harmless to the speci-men. The disadvantage is that there is often a low contrast, due to the brightbackground, making it difficult to distinguish between the different compo-nents of the specimen. This can however be solved by adding stains to thesample which colours the cellular compartments. As the specimens are threedimensional, objects or details of interest tend to be visible at different fo-cus levels, imaging is therefore usually done using multiple focus levels (orz-stacks) to make sure that the objects or interest are in focus in at least one ofthem. Bright-field microscopy was used in paper I.
13

c
o
p p
o
f2 f1
m
s s
Figure 2.1. Illustration of a bright-field microscope (left) and a fluorescence micro-scope (right). Both microscopes have a light source that illuminates the sample (s) anda series of lenses (condenser lens (c), objective lens (o) and projection lens (p) ). Thefluorescence microscope has two filters (emission filter (f1) and excitation filter (f2))and a dichromatic mirror (m).
2.2 Fluorescence MicroscopyAnother way to image cells or intracellular structures is via fluorescence mi-croscopy. This microscopy modality uses fluorescence labeled proteins forimaging live cells, fluorescence labeled antibodies for imaging fixated cellsand/or intracellular autofluorescence for imaging both live and fixated cells.Image capturing is done with a fluorescence microscope where the specimenis irradiated with light of a specific wavelength (excitation light). At the mi-croscope camera, the excitation light is filtered away and only light emittedby the fluorescent markers in the specimen are captured, see figure 2.1 (right)[2]. The resulting intensity values in the images are a representation of theamount of fluorophores present at a specific area of the specimen and thushold information about the spatial distribution and local concentration of thefluorophores [3]. Compared to imaging in the bright-field modality, fluores-cence imaging tends to produce a clearer contrast between the cellular com-partments.
When conducting a fluorescence imaging experiment of living cells it isimportant to obtain a representation of the underlying sample that is both re-producible and of high quality. Using a higher intensity of light produces an
14

image of higher quality but can be toxic to the cells, resulting in photodamage.Furthermore, accurate and precise fluorescent intensity measurements are of-ten preferable over visually appealing images [4]. Fluorescence microscopywas used in papers II and IV.
2.3 Transmission Electron MicroscopyTransmission electron microscopes (TEMs) work by shooting an electron beamthrough an ultra thin specimen. The electron beam is generated by an electrongun in which a suitably high current is driven through a wire (often tung-sten) which releases electrons through thermionic emission. The beam is thenguided through a series of lenses used to shape the beam and enable variationin the area being illuminated. After the beam passes through the specimen theelectron distribution is imaged with a series of lenses that magnify and focusthe distribution onto a fluorescent screen or other imaging device, see figure2.2 (left). With the use of electrons instead of light the resolution is muchhigher due to the smaller wavelengths of the electrons [5]. As the imaging isdone at a nanometer or subnanometer resolution, staining and sample prepara-tion is extremely important. This together with small vibrations in the systemare the major contributions to errors when using this imaging modality [6]. Analternative to high-voltage TEMs are low-voltage TEMs, where the MiniTEM[7] is an example. The MiniTEM uses a light microscope that magnifies theimage from the fluorescent screen (figure 2.2 right). Due to the lower voltagethe microscope can be built much smaller which also makes it less sensitive tovibrations. However, this design choice limits the maximum resolution that ispossible. TEMs were used in paper III.
2.4 Working with Microscopy ImagesMicroscopy is one of the cornerstones in almost all biomedical applicationsfrom disease diagnosis to drug discovery. It provides many opportunities butalso comes with many challenges. Faster and more automated microscopeshave brought about an explosion in the amount of data that is being produced,resulting in data volumes that are costly to acquire and in many cases exceedthe computational and storage resources available. These restrictive factorsmean that data acquisition needs to be smarter and more efficient, in the sensethat only the most interesting data is collected. However, this "interestingness"is difficult to know prior to collecting the data. Method development in thisarea can be difficult due to the complexity of the biological processes and alsoby the sheer size of the images. For instance a WSI can be tens of thousands ofpixels in its spatial dimensions. Analysis in full resolution is thus not practicaland a usual workflow for a pathologist/microscopist is to look for regions of
15

c
e
e
o
a
p
c
s
s
o
p
f
o
p
Figure 2.2. Illustration of a Transmission Electron Microscope (left) and a Low-Voltage Transmission Electron Microscope (right). An electron beam is generatedat the electron gun (e). The electron beam is guided through a series of lenses andapertures to shape the beam (condenser lens (c), objective lens (o), projection lens(p) and aperture (a)). For the Low-Voltage Transmission Electron Microscope a lightmicroscope is put on top to magnify the image on the fluorescent screen (f).
interest (ROIs) in lower resolution and to then zoom in for further analysis. Away to computationally work with such large images is presented in paper II.
Due to the vast amount of data it is also challenging to obtain annotations,which are usually needed for training and validating accurate models. Anno-tating microscopy data is expertise demanding and time consuming and thecompetence required is often prioritised elsewhere. Hence annotated datasetsare usually small or annotated by semi-automatic methods which can lackprecision. Another, somewhat limiting factor with microscopy imaging is thatnoise will always be present in the images. The amount of noise is determinedby the exposure time and the illumination, and there is hence a trade-off be-tween how much to irradiate the sample, the speed at which data is collectedand the quality of the images. Although there exists promising unsupervisedsolutions to remove noise from images [8, 9], every time you manipulate animage before running the final analysis you run the risk of loosing importantbiological information or even biasing the results.
For microscopy image analysis there should also be a strong emphasis onevaluation methods. Compared to natural scene images, where image qual-ity is largely determined by perceived visual appeal, when imaging biologi-
16
cal specimens the quality of the image in terms of the biological insights itcan provide is more important. Also, from a modelling perspective, the in-terpretability of the model, i.e why a model makes a certain decision, is anaspect that can provide new biological insights. The papers presented in thisthesis include evaluation metrics that attempt to go beyond the more classicalmetrics (those predominantly developed for natural scene images). This wasachieved in paper I by creating the dataset in such a way that it was easier toevaluate the hypothesis of the study, in paper II by removing noise in the fi-nal measure, in paper III by investigating model overfitting on the underlyingdata, and in paper IV by including a more biology relevant evaluation basedon features extracted from objects of interest.
17

3. Deep Learning for Digital Image Analysis
The product of imaging a specimen or sample is a digital image. A digitalimage is represented by pixels whose intensity values represent the strengthof the captured signal at different locations. The organisation and intensityof the pixels gives a visual depiction of the structures in the sample and can,by different digital analysis techniques, be used to extract information aboutthe sample. Depending on the question at hand, and the manner in which theimaging was carried out, different techniques can be applied. A typical imageanalysis workflow is comprised of multiple sequential steps. The first step isoften a quality control (to remove images of a suboptimal standard) and topre-process the images, for instance to reduce noise and blur or to registermultiple unaligned images. In the second step objects of interest are detectedand in the final step the detected objects are analysed. The papers presentedin this thesis deal with different parts of the image analysis workflow: PaperII covers the entire workflow, whereas papers III and IV focus on the pre-processing component of the workflow. The following sections provide a briefbackground to the main techniques covered in this thesis.
3.1 Fundamentals of Digital Image ProcessingWithin digital image processing there exists a multitude of different focus ar-eas. The following paragraphs describe some of the areas tackled in this thesis.Figure 3.1 provides a visual illustration of the main techniques discussed.
Classification, Localisation and Segmentation
Classification, in a broad sense, means assigning a class label to each instancein a dataset [10], for example, categorising images of cancer cells into malig-nant or benign. Hence, the aim is to find a decision boundary that can separatecancerous and non-cancerous cells.
Segmentation [11, 12] and localisation [13] can be seen as extensions toclassification. Localisation is classification combined with a location and seg-mentation is a more in depth classification where each pixel is assigned a classlabel. Segmentation and localisation are thus closely related and by perform-ing segmentation a location is also obtained. However, localisation has a morerelaxed constraint whereby only the object boundaries need to be determined.
18

Image Restoration
In image restoration the aim is to restore an underlying "sharp" image thathas been corrupted by some form of degradation. This can be from intrinsicfactors, such as focus of the camera, or from external factors arising from theacquisition process, such as noise or motion, which result in blurry images.Usually a degraded image contains both blur and noise and the degradationprocess can be formulated as
y = h∗ x+η (3.1)
where y is the captured blurry image, h is the blur kernel capturing the blurringprocess, x is the underlying sharp image and η is the noise term. Recoveringx is hence the inverse problem where either h is known a priori and you canrecover x directly or both h and x need to be recovered blindly, whilst alsominimising the effect of the noise [14]. As opposed to classification, this isa regression problem where the prediction is not a class label but a numericalvalue.
Image Registration
Image registration is the process of aligning two or more images so that thecommon structures overlap based on some criteria. By doing this one canextract measures from common areas in the aligned images, compare objectscaptured at different time points or stitch adjacent images together. Regis-tration is usually done using an optimisation algorithm which minimises thedistance between the images [15].
Image-to-image translation
The process of image-to-image translation aims to map an image from a sourcedomain to a target domain. One example of this could be turning a horse intoa zebra. Here the horse is in the source domain and the zebra in the targetdomain, so each pixel representing the horse should be changed to get a morezebra-like appearance while keeping the general structure of the image intact.In this setting the data is unpaired, i.e there exists no such paired images thatcontain a horse in one domain and a zebra in the same domain [16].
In some domains there exist paired images of different sources. This couldfor instance be aerial views and maps covering the same region [17]. With mi-croscopy we can also create these paired images since the same sample can beimaged with many different microscope modalities, for instance bright-fieldand fluorescence microscopy. With this type of data we can virtually go fromunlabelled images to a labelled image based on the fluorscent proteins, circum-venting the need to add toxic stains (usually known as virtual staining) [18].This type of image-to-image translation also has use cases in histopathology
19

as, for instance, generating a virtual Hematoxylin and Eosin stained imagefrom an image of an unstained tissue section. [19].
Restoration
Segmentation
LocalisationTranslation
Registration
Figure 3.1. Illustration of some of the image processing techniques used in this the-sis, including: object localisation; segmentation; image restoration; registration; andimage-to-image translation.
3.2 Machine Learning and Deep LearningWith machine learning the goal is to train a model to perform a given task,based on some criteria and a dataset. This could be either a supervised task,where each instance in the dataset has a corresponding label (i.e the true valueis known) or unsupervised, where the instances do not have a prior label andthe model is given more freedom to categorise the data. With supervised learn-ing researchers can build models useful for a broad range of applications wheredata needs to be categorised into specific classes. Unsupervised learning, onthe other hand, is often more exploratory and used for uncovering unknownpatterns or classes in the data. Supervised learning can further be divided intoclassification and regression (see section 3.1), where for regression the out-put is numerical and for classification it is categorical [20]. At the core ofmost machine learning models are two types of parameters: trainable param-eters, that are adjusted during the training process to make the model learn
20

the specific task; and hyper-parameters, parameters which control the learningprocess and are thus not adjusted during training. The hyper-parameters canbe anything that is set prior to training, for instance controlling how fast themodel learns or how large the model is.
When working with machine learning the dataset needs to be divided into(at least) three parts; a training set, a validation set and a test set. The trainingset is the data that the model sees during training and learns the task from.The validation set is data that is used to monitor the model’s performance dur-ing or after training and can be used to tune the hyper-parameters. Lastly,the test set contains data that is hidden during training and is not used to tunethe model but rather to evaluate its performance on unseen data. Training amachine learning model is usually done by extracting informative attributes(or features). These features could be anything that represents the underlyingdata in an informative way. One of the major challenges when working withimages and machine learning has been how to extract these relevant featuresdirectly from the raw pixel intensities. Depending on the application the fea-tures could, for instance be measures of shape and size of objects of interest,or measures of textures, or other image specific measures such as Haar [21] orSIFT (Scale-Invariant Feature Transform) [22] features. However, to constructfeatures that are representative enough for a given research question generallyrequires domain specific expertise and is one of the major bottlenecks whenworking with machine learning for image data. Thus, the question has been,how to build a model that can learn directly from the source of information, i.edirectly from the image pixels, circumventing this problem of feature design.This is called representation learning where the machine learning model notonly learns the mapping from the representations, but also learns the represen-tations themselves [23]. This is where deep learning comes to the forefront.Deep learning methods are able to learn the representations directly from thedata through a hierarchy of multiple levels, each with increasing abstraction.This is done by stacking non-linear modules (or neurons) into what is is usu-ally called an artificial neural network (ANN). This hierarchical flowing ofinformation makes it possible to learn very complex functions, see figure 3.2(left).
A neuron in an ANN consists of a trainable weight and a bias plus a non-linear transformation (or activation function) and takes the form,
y = φ(∑
ixiwi +b
)(3.2)
where xi is the input and wi its corresponding weight, b is the bias termand y the output. The function φ , is the nonlinear activation function thatgives the network the ability to learn more complex representations. Thereexists a broad range of activation functions [24], each with different propertiesand most common one is the rectified linear unit (ReLU) [25]. The ReLUfunction thresholds its input at zero and hence gives the network the ability
21

to learn non-linear transformations. To increase the representational power ofthe network the neurons are stacked in layers. The output of a layer is a set offeatures (or feature maps when there is more than one dimension) where eachneuron contributes to a single feature. Stacking layers creates a network wherethe information flows from the first layer to the last, where the predictions aremade. By stacking more and more layers we increase the depth of the networkand get a Deep Neural Network.
Training a neural network is done in three stages. Firstly there is a for-ward pass where the input is passed through the network and a prediction ismade, secondly, the error (or loss) in the prediction is calculated through aloss function and finally the parameters of the network are updated backwardsusing a procedure called backpropagation [26]. Based on the gradient of theloss, updates to the parameters are made according to their individual con-tributions to the overall loss, using for example a gradient descent optimiser.The amount of update is regulated by a hyper-parameter called the learningrate which determines the size of the steps to take in the solution space. Nav-igating the solution space is difficult, slow and prone to fluctuations and thereexists multiple solutions which aim to mitigate these issues. One option is toadd momentum which dampens the oscillating movement by utilising an ex-ponentially weighted average of the gradients. Another possibility is to usea dynamic learning rate that gets reduced the closer the algorithm gets to theoptima [23, (ch. 8)]. The standard gradient descent optimisation involvesaveraging the gradients over the whole dataset before updating the parame-ters. A more efficient method is to average only over a small subset of thedata, thus performing what is known as stochastic gradient descent. This in-troduces batch training, where the dataset is split into smaller mini-batcheswhich are passed through the network. The advantage here is that the gradientcomputations are faster and less memory demanding, and by performing moreparameter updates convergence is accelerated. However, since the averagedgradients are only a noisy approximation of the gradients for the full dataset,it creates a higher variance in the parameters and a fluctuating loss. Thereexists several versions of stochastic gradient descent, each aiming to make itmore robust, with the most widely used being Adam [27]. Adam computesan individual learning rate for each of the parameters based on the first andsecond averaged moments. It hence makes use of the recent magnitudes ofthe gradients and the uncentered variance. Adam was used in papers I, II andIII. An improvement to Adam was found by Loshchilov and Hutter [28] byadding weight decay to the parameter updates, thus reducing large parameters(and their potentially unwarranted influence) and hence limiting the freedomof the model. This improved optimiser was used in paper IV. Additional de-tails regarding deep learning and its applications within image cytometry canbe found in paper R1.
22

Convolutional Neural Networks
Deep neural network architectures come in a variety of forms for dealing withdifferent types of input data. An architectural choice for deep neural net-works that is particularly useful for images are convolutional neural networks(CNNs). The key difference between ANNs and CNNs is that the otherwiseglobally connected weights are replaced with locally connected weights thatare shared across the spatial input dimensions and transform the neurons intofilters, see figure 3.2 (right). In a CNN each set of weights is only connectedto local patches of the input and the same set of weights are used for the wholeinput. These new filters works by convolution instead of multiplication, hencethe name convolutional neural networks. The main benefit with this is thatthe number of operations are reduced and less parameters need to be stored,thus reducing the memory requirements of the network [23, (ch. 9)]. An-other reason for this design is that in images, local patches are often highlycorrelated, making detecting features like corners and edges easier. Further-more, as an object can appear anywhere in the image, weight sharing acrossthe input is a beneficial choice for detecting objects of interest [29]. Anotherimportant component of many CNNs is the pooling layers. The main purposeof pooling is to reduce the spatial dimensions, which has benefits for mem-ory consumption and increases the receptive field of the network. Usually thepooling is performed by the max operation, i.e from a small local patch onlythe maximum value is propagated forward.
x1
x2
x3
y1
y2
w1
w2
w3
b
x1
x2
x3
y1
w11
333 ∑ y2
y3
y1
y2
x y
w
Figure 3.2. Difference between an artificial neural network, ANN (left) and a con-volutional neural network, CNN (right). The ANN uses neurons that consecutivelytransforms the data. In the CNN these modules are replaced by convolutional filteroperators.
23

Loss Functions
As mentioned earlier, after the forward pass the error or loss in the predictionsis computed and used to update the network parameters. The choice of lossfunction is thus a way of guiding the network towards the expected output. Inclassification tasks there is usually a Softmax function [23, (ch.6)] as the finalactivation function to normalise the output to a probability distribution (how-ever, a non-calibrated probability distribution, see section 3.4). This gives theprobability for each class being represented in the input. The loss functionthus measures the error in the prediction, compared to the ground truth, andpushes the network towards predicting the correct class with maximum prob-ability. This is usually done with a cross entropy loss function (used in papersI and II) defined as,
Cross− entropy =− 1m
m
∑i=1
yi · log(pmodel(yi|xi;θ)) (3.3)
where yi is the target vector (one for the correct class and zeros for all theothers) and m the number of classes. Hence, this loss function enforces thenetwork to predict the correct class with a high probability in order to ob-tain a lower loss. For regression tasks other types of loss functions need tobe used. Common choices include L1-loss (Mean average error, MAE) andL2-loss (Mean squared error, MSE) (described in section 3.6) that measurethe per pixel similarity between the prediction and the ground truth. However,no single loss function is usually perfect on its own, for instance the L2-losscan produce overly smooth outputs [30]. Hence, a weighted combination ofdifferent loss functions, imposing different restrictions on the network, oftenresults in an improved final model. A way of creating a general loss func-tion was introduced with Generative Adverseral Networks (GANs) through anadverserial loss [31]. GANs introduce an additional network (discriminator)that can be seen as a learnt loss function for the prime network (generator).In its simplest form a GAN can be described as instigating a zero-sum gamebetween the two networks, where the generator creates "fake" data with thegoal of fooling the discriminator. The discriminator, on the other hand, strivesto distinguish between the real and the fake samples. The goal at convergenceis for the discriminator to no longer be able to tell the difference between thegenerated and real samples. Convergence is however not always guaranteedand there are a multitude of different ways to stabilize training [32, 33, 34].Adversarial loss was explored in papers III and IV.
Using the correct loss function is a crucial component in the model designsince it is one of the most important ways of telling the network what youwant. With deep learning you might get exactly what you ask for so makesure to ask the correct question, as further discussed in paper III.
24

3.3 Different Networks For Different ApplicationsDepending on the data and the application, different network architectureshave been developed and optimised. The following paragraphs give a briefbackground to the network architectures used in this thesis.
Classification
For classification tasks many network designs originate from the ImageNetLarge Scale Visual Recognition Challenge (ILSVRC) [35] which has alsobeen a major driving force in the breakthrough of deep learning within im-age processing. Some of the most commonly used networks are VGG [36],ResNet [37] and DenseNet [38]. Both VGG and ResNet were used in Paper Iand ResNet in paper II. VGG was one of the first networks to appear and waswidely used for different classification tasks, probably due to its simplicity.The main idea behind the VGG network is to build blocks of convolution lay-ers (all having 3x3 filter sizes) with an incremental number of feature maps,see figure 3.3 (left). Between these blocks, max-pooling is used to reducethe spatial dimensions. A benefit with the 3x3 filter size is that it covers thecentre pixel equally on all sides. A disadvantage with this network is that ithas a lot of parameters and hence takes a long time to train. Also, makingthese networks very deep can result in a problem called vanishing gradients.This means that the gradients become too small and the weights stop get-ting updated [39]. A way of alleviating these disadvantages was introduced inResNet. The main contribution of ResNet was the introduction of residual con-nections. In a residual connection the input from earlier layers are made avail-able deeper in the network by addition, see figure 3.3 (middle). This makes theintermediate layers in a residual block learn what should be added to the pre-vious input instead of learning the transformation. Using residual connectionsmeans that you can build and train much deeper networks. Taking these skipconnections further was done with DenseNet. DenseNet consists of multipledense blocks (figure 3.3, right) that each contains dense layers which usuallyconsists of batch-normalization, ReLU and 3x3 convolution. The layers aredensely connected within a block, meaning that there are skip-connectionsfrom the output of each layer to all subsequent layers. This implies that everylayer in a block sees the output of all preceding layers in the block, whichmakes the network more parameter efficient, easier to train and enables reuseof previously calculated features.
The contracting and expanding U-Nets
Image processing tasks where you have an image as both input and outputhave many applications within image processing, including image segmenta-tion, restoration and translation. The most widely used architecture (initiallydesigned for segmentation) is the U-Net [40]. The U-Net consists of two parts,
25

x
y
ReLU
Convolution
ReLU
Convolution
x
y+
ReLU
Convolution
ReLU
Convolution
x
y
Dense Layer
Dense Layer
Dense Layer
Figure 3.3. Configuration of different building blocks used in different network ar-chitectures. A basic building block (left) is used in the VGG model. The residualblock (middle) has a summing skip-connection going from the input to the output ofthe block and is used in ResNet. The dense block (right) has concatenating skip-connections from the output of each layer to all subsequent layers and is used inDenseNet.
a contracting encoder that takes the raw image and compresses the informa-tion, learning global context and object localisation, and an expanding decoderpart that transforms the compressed information back to the same spatial sizeas the input. Between the encoder and the decoder skip-connections are addedfor transferring finer grained spatial information to the decoder, see figure 3.4.The contracting part usually consists of a series of feature extractor blocks, inits original form consisting of two consecutive 3x3 convolutions, followed bya max-pooling layer to reduce the spatial dimensions by half. The expandingpart also has convolutional blocks but with an upsampling layer instead of adownsampling layer. This layer is usually a transpose convolution, regular up-sampling or pixel shuffle. Transpose convolutions (also called deconvolution)can be seen as the reverse of a regular convolution where each input (pixel) ismultiplied by a kernel to upsample the input. Pixel shuffle is a way of obtain-ing upsampling by rearranging the pixels from the input feature maps wherea size of (H ×W ×C · r2) becomes (rH × rW ×C) where H,W,C are height,width and channels and r is the upscaling rate [41]. A common problem thatcould occur when working with contracting and expanding networks are grid-like artifacts. This is a well-known problem which comes from a multitudeof sources. Grid-like patterns (or checkerboard artifacts) have been shownto be produced by transposed convolutions and arise from the overlap of theconvolving filters when the filter size is larger than the stride [42]. There aremultiple ways to tackle this, for instance replacing the transpose convolutionswith a regular upsampling based on nearest neighbour or bilinear interpola-tion followed by a convolution or by using pixel shuffle followed by a blurring
26

step. To mitigate this effect the former was used in paper III and the latter inpaper IV. Pixel shuffle was also evaluated in paper III but did not show anyadded improvement.
Improvements have been proposed to U-Net with for instance the inclusionof dense blocks. The dense U-Net replaces the feature extractor blocks bydense blocks and also adds skip-connections over these blocks and was usedin paper III and IV.
Feature extractor block
Downsampling
Upsampling
Concatenation
Figure 3.4. Example illustration of a U-Net architecture. The feature extractor blockscan take different forms, for instance through regular convolutional blocks, residualblocks or dense blocks. Downsampling is usually done with a max-pooling layer andupsampling with a transpose convolution, regular upsampling or pixel-shuffle.
3.4 Uncertainty Estimates for Deep LearningEstimating the uncertainty in predictions is an important element for improveddecision making that is often overlooked. Usually a decision is made basedon the output of the softmax function where the class with the largest prob-ability is the predicted class. However, the output from the softmax functionis usually poorly calibrated, meaning that the probability distribution does notrepresent the true distribution [43]. For example if one class is predicted witha probability of 80% then that would mean that there is a 20% risk of makingan error in this prediction. However, due to this calibration problem, this riskis often much higher (see for instance figure 6 in paper II). Although this couldbe ignored, forcing the model to make a prediction even when there are highuncertainties produces a lot of errors. A better practice is to give the model theoption to say "I don’t know" and refrain from making a concrete prediction.This makes it possible to focus the analysis towards the most certain (or un-certain) predictions. Uncertainties in predictions come from multiple sources,
27

including missing information, bias and noise. In Bayesian statistics, uncer-tainties are usually divided into two groups aleatoric and epistemic. Aleatoricuncertainty covers uncertainties in the data, such as corrupted features. Epis-temic uncertainty is the uncertainty in the estimated network parameters andcould, for instance, be due to lack of data or an inappropriate model selec-tion. This kind of uncertainty can thus be reduced by training the model withmore data [44]. Calculating the uncertainties can be done in different waysand depends on the underlying model. For deep learning, the most commonway of approximating the epistemic uncertainty is through Monte Carlo (MC)Dropout [45] or model ensembling [46]. With these methods uncertaintiesare obtained from multiple configurations of the network parameters. Withensembling this is done by training multiple networks with different initialparameters. MC dropout, on the other hand, obtains different network config-urations by removing random units in the network during training or testingand is hence less computationally expensive. To acquire the uncertainty youcan calculate, for instance, the standard deviation over these different networkrealisations. A means of obtaining the aleatoric uncertainty is to incorporatetrainable parameters that enable the network to explicitly learn and accountfor the noise in the data [47, 44].
An alternative to these approximate Bayesian methods is Conformal Pre-diction (CP) [48, 49]. For classification, CP provides a confidence measurewith a guarantee that the true label is in the prediction set, with a probabilityequal to a user-defined significance level. The only assumption on the data isthat it is exchangeable, i.e that the probability distribution of the data is notdependent on the ordering. CP works by measuring the "strangeness" of newobjects compared to the training data through a nonconformity measure. Ba-sically, the nonconformity measure is the distance to the training data. Theoutput of CP is a prediction set instead of a single prediction. For instance,in a binary classification task (classes 0 and 1), the possible predictions setsare: {0}, {1}, {0,1} and Ø (the empty set). The prediction sets depend ona user-defined significance level ε where the significance level relates to theamount of error the user is willing to accept. So, in the first two prediction sets{0} and {1} single predictions are made with an error less than ε . For the third{0,1}, the model is saying that the data sample could belong to either of thetwo classes and the for the last case Ø , a prediction with an error less than εcannot be made. With more classes, the same logic applies but there are morepossible prediction sets. For regression, the prediction sets are instead predic-tion intervals containing the true value based on the user-defined significancelevel. There are no restrictions on how to design the nonconformity measurebased on validity, but depending on the design the efficiency can vary (usuallymeasured as the amount of single-label predictions that are possible to make)[50]. The two most common CP approaches are transductive (TCP) and induc-tive (ICP). In TCP the model needs to be updated or re-trained for every testinstance and is hence computationally infeasible for deep learning. However,
28

in the inductive setting you only need to train the model once which makes itmore adoptable for deep learning [51, 52]. With ICP you not only split yourdata into a training and test set, but also create a calibration set. The role of thecalibration set is to calibrate the prediction intervals for new objects. So, foreach instance in the calibration set, you run it through the model and calcu-late the nonconformity scores. During inference the nonconformity scores arecalculated for all the predicted objects. By calculating the fraction of scoresin the calibrating set that are larger than the scores for the test instances youobtain a p-value for each test instance. With the user-defined threshold youcan then build the prediction sets. Each prediction with a p-value lower than εis included in the prediction set.
When to use which type of uncertainty quantification is highly task depen-dent. Approximate Bayesian methods are easier to apply in many cases. Forinstance, MC dropout requires only the addition of dropout layers to the net-work, hence no data needs to be withheld for a calibration set. However, CPhas a stronger theoretical guarantee of validity for the confidence measures.
3.5 Learning Using Privileged InformationThe goal of training a machine learning model is to find the best model orfunction that estimates the decision rule. So, with enough examples for train-ing the machine learning model should learn how to, for instance, classifythe data. This differs somewhat from human learning where we usually haveteachers giving explanations and putting examples into context. Learning us-ing privileged information (LUPI) bridges this gap by adding a "teacher" to thetraining stage [53]. The teacher provides additional (or privileged) informa-tion during training that helps to improve and accelerate the learning process.Through this the learner gains a better concept of similarities between trainingexamples and also obtains insights that can better guide the formulation of thedecision rule. The privileged information can be anything that helps duringtraining but is not required or available after the model is trained. An exam-ples of how to apply LUPI for neural networks is in the form of generaliseddistillation [54]. With generalised distillation you have two sets of data shar-ing the same labels, where one of the datasets (the privileged data) is easier tolearn from. Training a model on the privileged data creates a teacher. Then astudent model can be trained on the main dataset where it attempts to predictthe logits (outputs) of the teacher model. Another means of incorporating theprivileged information is via the loss function of the network. This can bedone by learning multiple tasks simultaneously, incorporating a different net-work stream for each task and allowing information flow between the streams[55]. This type of multi-task LUPI was used in paper IV.
29

3.6 Evaluation MethodsHow you plan to evaluate your results is one of the most important questionsyou should ask yourself before conducting an experiment. A skewed evalu-ation criterion can result in correct and useful hypotheses being discarded orwrong hypotheses being falsely proven. There are many ways of evaluatingresults but there are some common choices that are widely used. For classifi-cation we are usually interested in the accuracy of the predictions. Accuracymeasures the percentage of correctly classified samples. This can howeverbe deceiving for unbalanced datasets since high accuracy can be achieved byonly predicting the dominant class. To complement this measure there is pre-cision and recall which, when combined, give what is known as the F1-score.Precision measures how many of the predictions are relevant and recall mea-sures how many of the relevant objects are predicted. We usually describe thisin terms of true positives (TP), true negatives (TN), false positives (FP) andfalse negatives (FN), where accuracy, precision, recall and F1-score can bedescribed (in a binary setting) as,
Accuracy =T P+T N
T P+T N +FP+FN
Precision =T P
T P+FP
Recall =T P
T P+FN
F1− score = 2 · Precision ·RecallPrecision+Recall
(3.4)
Accuracy, precision, recall and F1-score were used in papers I and II. Thereare also other popular evaluation methods for classification such as the top-1/top-5 error rate, which is commonly used in large scale classification com-petitions. These measure how many times the model predicts the correct classin its top one or five predicted classes.
For regression tasks, where the prediction is not a class but a value, we needto resort to other types of evaluation metrics. The most commonly used aremean absolute error (MAE) and mean squared error (MSE), which measurerespectively, the absolute and square distance between the prediction, y, andthe ground truth, y,
30

MAE =1N
N
∑i=1
∣∣yi − yi∣∣
MSE =1N
N
∑i=1
(yi − yi
)2
(3.5)
where N is the number of pixels in the images. The main difference betweenthese two measures is that MSE amplifies large errors, due to squaring thevalues, but is more sensitive to outliers in the data than MAE. Also, MAE iseasier to interpret since it is proportional to the error. Since these measurescan take on values between 0 to inf (lower is better), they do not say much bythemselves. To give these values more context they can be normalised around,for instance, the mean or median.
Other evaluation methods useful for image processing tasks are the struc-tural similarity index measure (SSIM) [56] and peak signal-to-noise ratio (PSNR).SSIM is a measure designed to be more perceptual by measuring the perceivedchange in structural information by including the inter-dependencies of pixels.SSIM is a windowed approach measuring the similarity in sub-windows (usu-ally of size 11×11 pixels) and then averaging the results. The similarity persub-window is measured as:
SSIM(x,y) =(2μxμy + c1)(2σxy + c2)
(μ2x +μ2
y + c1)(σ2x +σ2
y + c2)(3.6)
where μx and μy are the averages of the respective windows, σx and σy thevariances and σxy the covariance. The terms c1 and c2 are used to stabilizethe division and are derived from the dynamic range of the respective images.SSIM can however fail to capture certain differences in image quality due todifferent types of degradation and hence do not fully model the human per-ceived visual judgement [57]. There have been numerous attempts to improvethis metric, for instance Wang et al. [58] developed an extension where qual-ity assessment is done over multiple scales by down-sampling the image andLi et al [59] created an extension that weighs local SSIM scores by edge andsmoothness properties.
PSNR is a measure adopted from signal processing and measures the ratioof the maximum power of a signal in relation to the corruption error and isgiven by
PSNR = 10 · log10
(MAX2I
MSE
)(3.7)
where MAXI is the maximum intensity value the image can take. In contrastto SSIM this measures the error more than the perceived similarity.
Measuring image quality is difficult because of the way humans judge sim-ilarity. SSIM is still the most widely used measure when dealing with image
31

quality or image comparisons. However, the feature maps generated by trainedneural networks have been shown to be useful as a perceptual loss function forimage synthesis tasks [60]. Zhang et al. [61] built upon these findings and de-signed a perceptual metric based on these deep features which outperformedclassical similarity measures and produced results closer to human perceivedquality.
Going beyond pixel level similarities one can also compare images basedon feature similarities [62], as was done in paper IV. These features could,for example, be morphological or texture measures for predefined objects ofinterest. This can reveal more detailed information regarding the model per-formance and also acts as a form of explainability for the models, for instanceif the model can reconstruct well the shapes of the objects but fails to recon-struct some of the finer scale textural details (which may be difficult to see byvisual inspection of the generated images). This type of evaluation methodis also better suited to the downstream task carried out for many biomedicalimaging experiments where uncovering the feature changes induced by, forexample, the administration of a drug, provides valuable scientific insights.
32

4. Summary of Papers
This chapter presents a summary of the methods developed and evaluated inthis thesis. The works cover a broad range of applications but all share thecommon thread that they are concerned with the challenges met when apply-ing deep learning methods to microscopy data. The papers are presented anddiscussed in the image analysis sub-fields they belong to. Papers I and II dealwith localisation and classification, and papers III and IV deal with digital im-age restoration and translation. The papers are presented in such a way to asgive a general overview of what was done within each paper. The discussionsin this chapter attempt to go a bit beyond the discussions in the main papers.For a more in depth coverage of the results and methods see the respectivepapers.
4.1 Localisation and Classification (Papers I and II)Localisation and classification are important components of image analysis formicroscopy data. These tasks involve identifying regions of interest for furtheranalysis and grouping objects into their respective classes. The papers pre-sented here cover three fields in digital image analysis, namely classification(paper I), localisation and segmentation (paper II). As discussed in section 3.4,introducing some form of uncertainty and model calibration when performingclassification tasks is important to consider when working with biomedicalapplications. Another important aspect is the relationship between precisionand recall (see section 3.6). For instance in medical applications, dealing withpatient diagnoses, one might prioritise recall over precision since a lower falsenegative error rate is preferable. However, for applications like drug discov-ery, where there is more interest in being sure that a specific response is mea-sured in the correct region, a lower false positive rate and a higher precision ispreferable.
4.1.1 Oral and Cervical Cancer Diagnosis with Deep LearningCancer is one of the main causes of death around the world and in 2020 re-sulted in nearly 10 million deaths [63]. Discovering cancer at an early stagelowers the risk of morbidity and mortality. A means for early discovery ofcancer is through screening programs. For cervical cancer, screening proce-dures have been around for 80 years. Screening large populations is however
33

Figure 4.1. Graphical illustration of Paper I. Smears are collected from regions ofinterest and imaged with bright-field microscopy. In each image, cells are manu-ally located and extracted to train a CNN to distinguish between cancerous and non-cancerous cells.
expertise demanding, time consuming and costly and as such is a subject forimprovement. An efficient way of screening is to look for Malignancy As-sociated Changes (MACs). MACs are small changes in the morphology andchromatin structure of the nuclei in a cell located in the vicinity of a tumourarea. These are often too subtle to be caught by visual examination but can befound by computerised image analysis techniques [64].
Due to the success of computational methods like deep learning at uncov-ering subtle differences, there is likely much to be gained from such methodsfor improving the screening process. In paper I we investigate if CNNs canaid in the discovery of cancer through classifying cells from smear samples,see figure 4.1.
Data
We consider three different datasets, two for cervical cancer (Herlev [65],CerviSCAN [66]) and one for oral cancer. In all cases the data was collectedby scraping an area of interest and smearing it on a glass. The Herlev dataset isa publicly available, fully annotated dataset created for feature extraction andclassification purposes, but not specifically for CNNs (images are of differentsizes). This dataset has a problem in that images of normal cells typicallyhave a large cytoplasm while images of abnormal cells typically only showthe cell nuclei. We chose to include this dataset to compare to previous workon cervical cancer classification. The CerviSCAN dataset was collected froman earlier project and consists of 82 graded pap-smears with more than 900images, each with a focus stack of 41 images. The dataset was imaged with
34
an Olympus BX51 bright-field at 40x magnification and a 0.95NA objectivegiving a pixel size of 0.25 μm. Annotations are available for each cell.
The oral cancer dataset was created for this work. Samples were collectedat Södersjukhuset in Stockholm from six patients (three healthy and three withcancer) having mixed gender, with an age range of 47-77 years. All patientswere non-smoking, and some were human papillomavirus (HPV) positive.From patients with a tumour, samples were collected from both the tumourside and the the opposite (healthy) side of the mouth. Each sample was im-aged with the same microscope as the CerviSCAN dataset but at 20x magnifi-cation and a 0.75NA objective giving a pixel size of 0.32 μm. Each cell wasmanually marked to obtain a cell location so that crops of single cells couldbe obtained giving a total of around 15,000 cell images (8299 from healthypatients and 6660 from patients with a tumor). The label for each cell wasgiven by the diagnosis of the patient, hence no additional cell based annota-tions were used. This means that all cells coming from a healthy patient weregiven the label non-cancer and all cells from patients with a tumor (regardlessof side) were given the label cancer. The dataset was split in two (at patientlevel), where one dataset contained samples from healthy patients and samplescollected from the tumour side of patients with a tumour. The other set con-tained samples from healthy patients and samples collected from the healthyside of patients with a tumour.
Methods
We evaluated ResNet18 and VGG for this cancer classification task. Both net-works were implemented with a reduced number of feature maps, relative totheir original implementations, to balance computational complexity and per-formance and due to the fact that similar performance could be achieved witha lighter network. For both networks augmentations were done by random 90degree rotations and flipping, resulting in eight times as much data.
Evaluation of Results
The networks were evaluated and compared for the three datasets based onprecision, recall and F1-score (see section 3.6). However, these measures onlycapture the model performance and not the biological interpretation of the re-sults. Under the assumption that the networks can capture MACs we also eval-uated the performance on samples collected further away from the tumour (onthe healthy side of the oral cavity), samples that were not used during modeltraining. We could thus show that even though the networks were trained onhealthy cells and cells from a sample taken from a tumour, they could stillclassify cells in the vicinity of the tumour as cancerous, showing evidence forMAC. We also demonstrated how to set a statistical threshold for diagnos-ing patients based on the error of the classification for healthy patients. To
35

complement this we also presented the performance of precision, recall andF1-score showing that the networks perform well on the classification task. Adiscussion about the results follows in section 4.1.3
4.1.2 Confidence Based Predictions For Whole Slide Images
Confidence
Low Resolution
Medium Resolution
Full Resolution
Drug
Res
pons
e
. . .
. . .
Figure 4.2. Graphical illustration of paper II. Regions of interest are first detectedin low resolution images. The detected regions of interest are segmented into thedifferent cellular compartments in medium resolution and finally drug quantificationis performed on images at the highest resolution.
In digital pathology, images can easily reach a couple of gigabytes in sizeand span ten to hundreds of thousands of pixels in the x- and y-directions.Usually, scientific and/or diagnostic information is isolated to small regions ofinterest and thus analysing the full resolution image is more costly and timeconsuming than necessary. When datasets outgrow computational resourceswe cannot afford to analyse data that lacks scientifically relevant information.We need to be smart with which parts of the data we apply more detailed andcostly analyses to. In paper II we designed a pipeline for hierarchical analysisof whole-slide lung-tissue images, performing region detection and segmen-tation in low resolution, and more costly operations in higher resolution, seefigure 4.2. The underlying data explored drug uptake dependent on the ad-ministration method; either inhaled or intravenously. The assumption was thatthe drug response would be different between cell layers around airways andblood vessels. We hypothesised that the significance in the quantified differ-ence would be higher if measured in cell layers with a higher confidence (i.e.excluding irrelevant parts of the tissue that may introduce noise).
36
Data
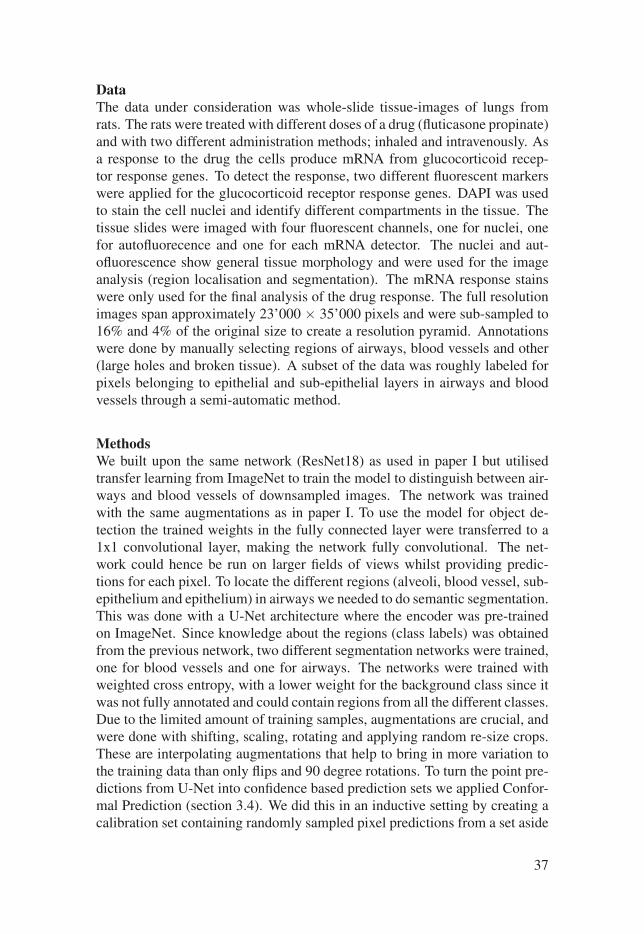
The data under consideration was whole-slide tissue-images of lungs fromrats. The rats were treated with different doses of a drug (fluticasone propinate)and with two different administration methods; inhaled and intravenously. Asa response to the drug the cells produce mRNA from glucocorticoid recep-tor response genes. To detect the response, two different fluorescent markerswere applied for the glucocorticoid receptor response genes. DAPI was usedto stain the cell nuclei and identify different compartments in the tissue. Thetissue slides were imaged with four fluorescent channels, one for nuclei, onefor autofluorecence and one for each mRNA detector. The nuclei and aut-ofluorescence show general tissue morphology and were used for the imageanalysis (region localisation and segmentation). The mRNA response stainswere only used for the final analysis of the drug response. The full resolutionimages span approximately 23’000 × 35’000 pixels and were sub-sampled to16% and 4% of the original size to create a resolution pyramid. Annotationswere done by manually selecting regions of airways, blood vessels and other(large holes and broken tissue). A subset of the data was roughly labeled forpixels belonging to epithelial and sub-epithelial layers in airways and bloodvessels through a semi-automatic method.
Methods
We built upon the same network (ResNet18) as used in paper I but utilisedtransfer learning from ImageNet to train the model to distinguish between air-ways and blood vessels of downsampled images. The network was trainedwith the same augmentations as in paper I. To use the model for object de-tection the trained weights in the fully connected layer were transferred to a1x1 convolutional layer, making the network fully convolutional. The net-work could hence be run on larger fields of views whilst providing predic-tions for each pixel. To locate the different regions (alveoli, blood vessel, sub-epithelium and epithelium) in airways we needed to do semantic segmentation.This was done with a U-Net architecture where the encoder was pre-trainedon ImageNet. Since knowledge about the regions (class labels) was obtainedfrom the previous network, two different segmentation networks were trained,one for blood vessels and one for airways. The networks were trained withweighted cross entropy, with a lower weight for the background class since itwas not fully annotated and could contain regions from all the different classes.Due to the limited amount of training samples, augmentations are crucial, andwere done with shifting, scaling, rotating and applying random re-size crops.These are interpolating augmentations that help to bring in more variation tothe training data than only flips and 90 degree rotations. To turn the point pre-dictions from U-Net into confidence based prediction sets we applied Confor-mal Prediction (section 3.4). We did this in an inductive setting by creating acalibration set containing randomly sampled pixel predictions from a set aside
37
set of images (not used for training). We used a non-conformity measure asproposed in [52], namely the maximum output from the Softmax function, ofall but the true class, divided by the output of the true class.
Evaluation of Results
The region localisation network was evaluated based on precision, recall andF1-score and showed good results (around 90% for all measures). The seg-mentation network was more difficult to evaluate since the "ground truth" an-notations provided only a rough label estimate. Hence, evaluating against thisgives a skewed result as the network could be better than the provided labels.To solve this we selected four images of airways and four of blood vessels anddid manual annotations to obtain more exact labels and measured precisionand recall on this subset of the data. Since we utilised conformal predictionson the final segmentation we could analyse the predictions at different confi-dence level intervals. Specifically, we could quantify the mRNA response inthe different sub-regions. With this type of quantification we saw that focus-ing the analysis to more confident regions provided stronger evidence for ourhypothesis, i.e. that there is a larger mRNA response in airways than bloodvessels and other regions if the drug is inhaled. We also showed that the preci-sion was higher for more confident regions but with a sacrifice to recall. Sincethis is the first work on applying conformal prediction for segmenting sub-regions in lung tissue we also wanted to evaluate the level of calibration andthe efficiency of the chosen non-conformity score. The accuracy of the erroris usually shown in a calibration plot, showing predicted error vs. actual error(figure 6 in paper II). Here we see that compared to not calibrating the predic-tions and to another widely used method for calibrating the error, we obtainan almost perfectly calibrated model, meaning that our prediction intervals arereliable. We also demonstrated that our choice of non-conformity measurewas efficient in making single-labeled predictions at low significance levels.
4.1.3 Contributions in Localisation and Classification, andDiscussions
In papers I and II we showed how to use existing CNN architectures for medi-cal image analysis and drug discovery. Even though trained on a limited set ofexamples, by utilizing augmentations in paper I and augmentations and pre-training in paper II we can still obtain high quality results. We also showedthat by utilizing conformal predictions we could secure almost perfectly cali-brated outputs and demonstrated the importance of removing noise in the finalquantification measures to get an accurate representation of the underlyingbiological process.
Paper I was the first paper to evaluate how CNNs could be used to clas-sify cells from smears of the oral cavity as cancerous/non-cancerous. This
38

was however a small study with a rather limited dataset (only 6 patients) andas mentioned in the paper, the most urgent future work required was to ex-tend the study to more patients. The conclusions we drew when the paperwas published was that ResNet was the preferred network due to having lowerstandard deviation and thus being more stable. We could also apply a lowerstatistical threshold for the proportion of cells classified as cancerous to diag-nose a patient as healthy or sick. However, based on the limited dataset, it wasdifficult to draw any real conclusions in this study as both networks performedrather equally. What should be the primary importance when diagnosing pa-tients based on results from an automated analysis is recall. It is better to havesome false positives than false negatives. The most important finding in thepaper was however that the networks can generalise to samples collected at thehealthy side of the oral cavity from patients with a tumour. Under the assump-tion of MACs in other parts of the oral cavity, screening methods do not needto focus on a specific part of the oral cavity and only need to screen a subsetof the cell population. There have been follow up studies to this work, includ-ing work on extending the dataset and creating a fully automated pipeline forsingle cell extraction, focus level selection and cell classification [67]. Wet-zer et al. [68] also showed that including texture descriptors based on localbinary patterns in the network outperforms the general-purpose CNNs on theoral cancer data.
In paper II we showed that the same network architecture used for clas-sifying cancer cells could be used for identifying airways and blood vesselsin lung tissue. By building a hierarchical analysis pipeline, where a differentanalysis is done at different resolutions, it is not necessary to perform a fullanalysis on the entire dataset. For instance, we only need to process 4% of theoriginal amount of data to locate regions of interest. This work also introducedconformal prediction as a way to quantify uncertainty in image segmentation,providing a valid prediction region that helped focus the final analysis on themost confident parts, thus removing uncertainties in the measures. Conformalprediction requires no distributional assumptions nor the need to specify anypriors. However, it works under the assumption of exchangeability of the datapoints. This is not the case for images since the positioning is important. How-ever, since we applied random sampling we likely circumvented this problemto some extent, but further studies are needed to investigate the lowest numberof images and highest number of pixels required.
Authors Contributions
In paper I, I together with Forslid, G. implemented, conducted and tested thenetworks. We wrote the paper with input from the co-authors. SadanandanS.K designed the experimental procedure. In paper II, I designed the ex-perimental procedure, implemented the various parts, trained and tested the
39
network and wrote the paper with input from the co-authors. The conformalprediction step was implemented together with Harrison, P.J and Spjuth O.
4.2 Digital Image Restoration and Translation (PapersIII and IV)
Digital image processing where both input and output are images include im-age restoration tasks, such as image denoising and deblurring and other tasks,such as super resolution reconstruction and image-to-image translation. Themain motivation is to create an alternative representation of the original imagethat is more useful for further analysis. Both papers III and IV deal with thistype of processing, where paper III tackles motion deblurring of TEM imagesand paper IV addresses virtual staining of adiopocyte cell images. In both ofthese papers we start from one representation of the underlying sample andcreate another one, either by removing the degradation of motion blurr andnoise or highlighting different cellular compartments.
When working with biomedical applications, as opposed to natural images,there is a stricter requirement that the output image represents the "truth" ratherthan simply being visually appealing. We therefore strive to build models thatperform optimally for each specific task whilst reducing any artifacts that mayarise and ensure that the models learn relevant features, features that are use-ful in a practical setting. Related to this is the evaluation of the results. Thereare several different means of quantitatively measuring the quality of an im-age (some of these were mentioned in section 3.6) but they are oftentimesdeceptive or biased in some way. Evaluation of image processing applicationsneed to be combined with a visual evaluation. However, in biological imag-ing the image processing is usually a pre-processing step for some subsequentanalysis, such as segmenting different cellular compartments and extractingfeatures to form phenotypes or detecting and identifying abnormalities in tis-sue samples. There is hence a need for evaluation methods that exceed thevisual judgement and capture more of the biological relevance.
4.2.1 Image Restoration of TEM ImagesWhen working with TEM, a sample is typically 3mm in diameter and detailsof interest often require a resolution of at least 1nm pixel size. If the wholesample would be imaged at this resolution it would amount to more than 4tera pixels. Usually the whole sample is not imaged but instead a pathol-ogist/microscopist looks across the sample at a lower resolution to identifyregions of interest which are then imaged at a higher magnification. This ap-proach is however expertise- and time-demanding, and could potentially beimproved. The work in paper III arose from the following thoughts: What if
40

Fast Image Acquisition
DataPre-processing
Restoration -model
Figure 4.3. Graphical illustration of paper III. First, an image sequence is capturedby sliding the sample under the microscope. The captured images are then registeredto create short bursts of aligned frames. Lastly, a restoration model is applied to theburst to remove the degradation of noise and motion blur.
we image the sample whilst moving it under the microscope capturing imagesin a continuous stream? Can we then remove the motion blur and obtain animage of high enough quality for further analysis? This involves three majorchallenges, first, collecting a dataset with paired motion blurry and high qual-ity images from a TEM, second, building models that can remove the motionblur and finally evaluating the image quality obtained. Figure 4.3 illustratesthe proposed workflow.
Data
Since this is the first (to the best of our knowledge) work on motion deblurringfor TEM data, creating a dataset to assess the method is the first challenge. Thedata should contain an underlying sample where further analysis makes senseand where it is possible to evaluate the image quality. The movement of thestage should be fast enough to make a difference but not so fast that the amountof motion blur makes it impossible to restore the underlying structures. Thereshould also be an overlap between captured frames so that more informationcan be obtain per pixel location. This resulted in imaging of two different un-derlying samples, one of a kidney sample, giving some biological relevanceand one of a calibration grid where image quality is easier to evaluate. Tosimplify the problem somewhat only vertical upward motion was applied andall images were captured with a field of view (FOV) of 32μm and an exposuretime of 15ms. Both FOV and exposure time were set experimentally basedon the previous criteria. One significant and unavoidable challenge with thesedatasets is that, even though the motion was only in one direction, due to thehigh magnification the system experiences small vibrations that make the mo-tion vary resulting in non-uniform blur. Also, as with all types of microscopes,noise will be present in the images. The dataset was published in related workR5.
41

Methods
To obtain a baseline we explored two different CNN architectures, both shownto produce good results for deblurring natural images. One was a network forsingle image deblurring, based on adversarial training and a feature pyramidnetwork backbone [69], and the other a burst network with a U-net base, using"global max pooling" layers to propagate information between adjacent frames[70]. We showed that the burst model outperforms the single image deblurringnetwork. We subsequently took this network and made improvements to it.Specifically, we replaced the U-Net base with dense blocks and replaced thetranspose convolution layers with upsampling followed by convolution. Wealso experimented with two different loss functions shown to be beneficial forimage processing tasks , namely gradient loss [71, 70] and SSIM loss [30].
Evaluation of Results
The image level evaluation for this work were based on SSIM and PSNR. Al-though the model improvements mentioned above did not show much differ-ence based on these evaluation metrics, they did show an improvement undervisual inspection. The base network produced artifacts in the form of repetitivepatterns and ’wobbly’ lines which our improved network was able to remove.It was also necessary to ensure that the networks performed the given task anddid not overfit to the underlying data. We thus also created synthetic data,with added motion blur and noise, to complement the real image based anal-yses. With this synthetic data we showed that the networks could remove themotion blur, however, for regular underlying textures the model over-learnedto mimic the textures and reproduced it in areas where it was not present. Theimplication of this is that these networks, in their current form, might not yetbe applicable in practise. Further investigation of these issues, and how toovercome them, could be an avenue for future study. More discussion aboutthe results follow in section 4.2.3
4.2.2 Virtual Staining of Adiopocyte Cell ImagesFluorecsence microscopy is an invaluable part of image cytometry. By visu-alising different cellular compartments with fluorescent stains various cellularfeatures can be extracted providing phenotypes that can be used for deter-mining e.g. the effectiveness of drug therapies. This is, however, a time-consuming and expertise-demanding task and the fluorescent stains are oftentoxic to the cells [72], meaning that drug effects can not be followed over time.Furthermore, each time the sample is illuminated a fraction of the fluorophoreswill be irreversibly destroyed whilst also generating toxic free radicals [2]. Analternative imaging technique is bright-field imaging which lacks these down-sides but also lacks the clear contrast between the cellular compartments. Thequestion under consideration is thus, can we obtain a fluorescence representa-
42

Figure 4.4. Graphical illustration of paper IV. Bright-field images of adiopocyte cellsare transformed to fluorescent images stained for nucleus, cytoplasm and lipid dropletsby using CNNs and LUPI.
tion from a bright-field image? This would relieve the cells of the toxic stressfrom the fluorescent stains and also free up imaging channels. The work in pa-per IV was the winning contribution to the Adipocyte Cell Imaging Challengeorganized by AstraZeneca and AI Sweden in November 2021. The goal was,from a z-stack of seven bright-field images, to reconstruct the fluorescenceimage stained for nuclei, cytoplasm and lipid droplets at 20x, 40x and 60xmagnification. Only results for 60x were presented in paper IV to condensethe manuscript and focus on the model improvements, see figure 4.4. The re-sults were evaluated based on image level features, including mean absoluteerror, and also on more biologically relevant features, such as size and shapeof cell nuclei and fat droplets, extracted through a CellProfiler [73] pipeline.
Data
The data consists of adiopocyte cells stained with Hoechst 33342 (nuclei),Bodipy (lipid droplets) and Cell Tracker Deep Red (cytoplasm), each imagedin a different image channel. The cells were imaged at 60x magnificationwith a robotic confocal microscope both with bright-field, with a z-stack of 7images, and with fluorescence to capture the fluorescent stains. The cells werecultured in 8 wells and imaged at 12 different sites. Each image measuresapproximately 2556 × 2156 pixels with a pixel size of 0.1083 μm and a bitdepth of 16. The final dataset thus consisted of 96 bright-field z-stacks withcorresponding fluorescence images. These images were divided into threedifferent splits (training, validation and test), where 5 wells were used fortraining, two for validation and one well for final testing.
43
Methods
Following the results from paper III we utilised the dense-Unet as our basemodel and built three different models, one for each image channel. One ofthe major challenges was to reconstruct the nuclear channel since the nuclei areoften not visually apparent in bright-field images. For the nuclear channel wethus modified the network so that we could inject knowledge about shape andlocation of the nuclei based on segmentation masks. We did this using LUPI(see section 3.5) such that the final network used for inference is independentof these masks and only uses them as a tool to aid learning during the trainingphase. Specifically, we added a decoder that predicts the segmentation of thenuclei and with a multi-scale loss function assigning larger weights to diffi-cult pixels. For reconstructing the lipid droplets channel we added gradientand adversarial loss terms to the base dense-Unet to better delineate betweendroplets and to obtain a more accurate morphological appearance. For the cy-toplasmic stain we found that using only the base model, trained with an L1loss, produced the best result.
Evaluation of Results
The evaluation of the results was carried out with image based evaluation met-rics (MAE and SSIM) complemented with more biologically relevant mea-sures (MAE and Spearman correlation between the reconstructed and groundtruth features). The biological features included morphology, intensity and cellcount of extracted objects of interest. We found that in certain cases model im-provements that gave better correspondence at the feature level did not alwaysgive better results for the image level metrics. This shows the importance ofcomplementing image based measures with an evaluation of ROIs in the im-ages. For instance, the full image based measures include both foregroundand background. If ROIs are sparse in the image the background will have adominant effect on the evaluation measure.
4.2.3 Contributions in Digital Image Restoration and TranslationIn paper III and paper IV we have shown how to improve upon existing CNNsfor image processing. For video deblurring by extending a dense U-Net tohandle multiple adjacent frames and for image-to-image translation by mak-ing use of privileged information and employing adversarial training. We havealso highlighted the importance of the choice of evaluation method and thevalue of investigating network behaviour. Evaluating the network with syn-thetic data, which is visually easier to validate, can give an indication that thenetwork works in the way intended and can reveal signs of over-fitting for im-age restoration tasks. For biomedical applications, designing evaluation met-rics focused on biological relevance can help in the building of task-optimisedmodels.
44
The work presented in paper III showed both the potential and the limita-tions of applying deep learning methods for image restoration of TEM im-ages. A drawback in the proposed solution is that adjacent frames need to beregistered prior to deblurring. There can thus be minor errors in the align-ment hindering the network’s ability to fully utilise all the information in theframes. Including alignment modules in the network as, for instance, proposedin [74, 75] could help improve the restoration. A balance also needs to be con-sidered between noise and motion in the image, determined by exposure timeand illumination. A short exposure time will result in less blur but more noiseand vice versa. In this paper these parameters were set experimentally. Animportant next step in conjunction with this work is to determine the preciselevel of restored image quality needed for some further downstream tasks.
For image-to-image translation, the models presented in paper IV attainedstate-of-the art results for virtual staining of adipocyte cell images. How-ever, building a separate network for each imaging channel made the networksslower to train and failed to utilise information in the relationships that likelyexist between the channels. This was however explored in [76] (on the samedata), showing that you can obtain good results with a faster network trainedon all channels simultaneously. A natural extension to paper IV would be toexplore predicting all channels at once whilst keeping the benefit of LUPI.The main focus of our paper was to reconstruct fluorescent stains and subse-quently extract features for further analysis. Since the results showed that theextracted features from the reconstructed images matched the features fromthe real images well, relevant features could possibly instead be extracted di-rectly from the bright-field images. Depending on the application the imagereconstruction step could thus potentially be circumvented and relevant fea-tures could be learnt through, for instance, generalised distillation [54]. This,however, requires knowing which features to look for a priori. This is rarelythe case and is why the common procedure is to extract as many features aspossible and then to determine which of those are important for a given task.Furthermore, since the virtual staining step is in a sense a "free" operation, theincreased contrast between cellular compartments in the reconstructed imagescan help alleviate the difficulties of segmentation and object detection.
A common factor in both paper III and IV was the evaluation of the gradientloss for image processing. In paper III we showed that this might not be theoptimal choice for TEM data. A reason for this is that the structural textures inthe underlying sample, in combination with the noise level in the images, con-tributes to a large spread of strong and weak and noisy gradients which couldexplain the ’wobbly’ artefact patterns produced in the reconstructed images.However, for virtual staining of the lipid droplets in paper IV, the structuresare much clearer and repeating and in this case we obtained an improved resultwith the gradient loss.
45
Authors Contributions
In paper III, I built and implemented the networks, constructed the evaluationand together with Sintorn, I-M. collected and designed the dataset. I wrotethe paper with input from the co-authors. In paper IV, the experimental de-sign and method development was a joint collaboration between all authors.I together with Gupta, A. implemented the majority of the network trainingand evaluation. The CellProfiler pipeline used for evaluating the results wasdesigned by Alan Sabrish at AstraZeneca. I together with Harrison, PJ. andGupta, A. wrote the paper with input from the other co-authors.
46

5. Perspectives and Future Outlooks
Throughout the work in this thesis I have been investigating the challengesand opportunities of digital image processing in microscopy imaging. Thishas been done on the basis of the objectives stated in the introduction. Thekey motivation has been to find use cases where there is a need for these typesof solutions and create methods that fit these needs. In collaboration with theSwedish Dental Care, we identified the need for more research and methoddevelopment towards screening for oral cancer. The results presented in paperI was the start of this. At that time, deep learning methods had started gain-ing more and more traction in the biomedical community and although it wasa rather limited study we could still see the potential deep learning methodscould have in such a setting. Building on from this work we identified anotherneed in collaboration with AstraZeneca AB, namely for drug discovery. Thisis a field where a lot of data is generated and analysing all this data is difficult.Hence, in paper II we proposed an hierarchical workflow to navigate large im-ages for a more focused/precise analysis of drug uptake. We also showed howone can reduce the amount of data that needs to be collected by virtual stain-ing (paper IV), which is also less harmful to the cells. Together with VironovaAB, we found a need for smarter image acquisition methods for TEM. Build-ing on previous work investigating hierarchical workflows and low resolutionobject detection [77, 78] the idea was to go one step further and investigatethe possibilities of faster image acquisition by using image processing as apost-processing step for image restoration (paper III). As deep learning basedmethods have taken over in the field of image restoration, especially for natu-ral scene images, it was of high interest to see how these methods would farein a biomedical setting.
As presented in paper II, including some measure of confidence in the pre-dictions is a useful tool for more precise analysis. However, this type of con-fidence would also largely benefit medical use cases (for instance the work inpaper I). Giving the network the ability to say "I don’t know" and to refrainfrom making a decision makes it more trustworthy and reduces the errors thatcould otherwise occur. Hence, future work in this field should build modelswith this in mind. Another important consideration for classification tasks is tounderstand on what basis a decision was made. Deep learning models are of-ten considered as black boxes that can answer almost any question, but withoutproviding a clear understanding of how the answer was attained. ExplainableAI is a growing field [79, 80, 81] which will aid in medical image process-ing, but also for other fields leading to new biological discoveries. Confidence
47

and explainability is somewhat more difficult to evaluate for image process-ing tasks based on regression than for those based on classification. In paperIV we achieved some explainability through the feature evaluation and in pa-per III through investigating the network’s performance on synthetic data. Ifthe regression task is combined with a classification task, as in paper IV, wecan obtain a confidence score on each of the reconstructed objects. However,for these methods to be really useful, more work is needed to determine howmuch we can really trust them, for instance through out-of-distribution detec-tion [82, 83].
48
Sammanfattning på Svenska
Digital bildtagning och analys är ett av de mest kraftfulla verktygen somfinns för att undersöka komplexa processer och fenomen inom flera veten-skapliga discipliner. Kamerorna som används för att ta digitala bilder finnsöverallt, från mobiltelefoner till de mest avancerade mikroskopen. Bilder fån-gar ögonblick av verkligheten och allt eftersom tekniken går framåt blir dessaögonblicksbilder mer och mer detaljerade, vilket resulterar i bilder som in-nehåller mer och mer information. Mikroskopi har haft stor nytta av dennautveckling, med bättre och mer avancerade mikroskop som möjliggör nyavetenskapliga upptäckter.
I takt med den teknologiska utvecklingen ökar också mängden data som gåratt generera från olika typer av experiment. Det finns därför ett behov av nyaoch smartare metoder för att analysera de enorma mängder data som samlasin. Ett vetenskapligt område som bygger på stora mängder data är maskinin-lärning, särskilt djupinlärning. Djupinlärning lär sig direkt från data och harblivit en av de mest framgångsrika metoderna för att utforska mikroskopidata.Djupinlärning kan därför hjälpa kliniker, patologer och forskare på mångaolika sätt. Tillämpningarna sträcker sig från ökad bildkvalitet för enklare vi-suell analys, till effektiviserad patientdiagnostik och förbättrad upptäckt avnya läkemedel. Djupinlärning kan också användas direkt vid datainsamlinggenom till exempel virtuell infärgning, för att minimera skadliga effekter somsjälva avbildningen kan ha på cellerna.
Vi avbildar komplexa biologiska processer med mikroskop för att få bättreförståelse, och lägger stor vikt vid att resultaten från analyser är biologiskt ko-rrekta och kan förklaras. Jämfört med vardagliga bilder, där intresset främstligger i att bilderna är visuellt tilltalande för observatören, är vi med biolo-giska prover mer angelägna om att upptäcka detaljerna i bilderna som kanfrämja vår vetenskapliga förståelse. I många fall kräver detta metoder som ärskräddarsydda för den specifika vetenskapliga frågeställning.
Arbetet i denna avhandling täcker ett brett spektrum av tillämpningar inommikroskopi och har utvecklats i nära samarbete med användare inom indus-trin för att identifiera de faktiska behov av bildanalyslösningar som finns där.Huvudmålen är att (i) utveckla metoder för smartare/effektivare hantering ochanalys av stora mängder data från olika mikroskopiexperiment, (ii) identifierade behov och utmaningar som finns när man arbetar med mikroskopibilder ochutveckla metoder för smartare bildinsamling och (iii) att utveckla metoder fören mer precis analys och förståelse med tonvikt på biologisk relevans.
49
Dessa mål behandlas i fyra huvudartiklar som representerar fyra olika om-råden; region-/objektlokalisering, klassificering, bildrestaurering och bild-till-bild tolkning. De huvudsakliga bidragen är:
• Djupinlärning som ett verktyg för att diagnostisera patienter med munhåle-eller livmoderhalscancer via en manuell cell-lokalisering och automatis-erad klassificering.
• Djupinlärning för automatiserad analys av läkemedelskandidaters sprid-ning i vävnad samt mått av tillförlitlighet i den slutliga analysen.
• Metoder för att ta bort rörelseoskärpa från bilder som tagits med etttransmissionselektronmikroskop och visualisering av hur modellen över-anpassar sig till den underliggande bildtexturen.
• Analys av djupinlärningsbaserade metoder för virtuell fluorescensinfärgn-ing av adipocytcellbilder med en utvärderingsmetod baserad på biolo-giskt relevanta mått för att komplettera klassiska bildkvalitetsmått.
50
Acknowledgements
None of the work that I have done during the last five years would have beenpossible without all the amazing and inspiring people that I have had aroundme. I would like to express my deepest gratitude and thanks to all the peoplethat have been around and supported and guided me throughout this journey.
First and foremost, I owe the biggest thank you to my supervisor CarolinaWählby who believed in me and gave me the possibility to pursue a PhD.Thank you for showing me how much fun biomedical image analysis can be,being a great mentor and an excellent teacher in how to undertake high qualityand honest science.
Secondly, to my co-supervisor Ida-Maria Sintorn, thank you for showingme the cool world of electron microscopy and always being positive and mo-tivating even when things weren’t quite going as planned.
Thank you to all the HASTE´ers, especially my co-supervisors Ola Spjuthand Andreas Hellander, for all the inspiring discussions, fruitful insights andguidance that helped me during my thesis. Thanks to Salman Toor and BenBlamey for teaching me all about cloud computing. I am grateful to all thepeople I met at Astra Zeneca and Vironova, especially Alan Sabirsh and Jo-han Karlsson, for showing me all the cool stuff you can do with microscopyand taking care of me on all my trips to Mölndal and to Gustaf Kylberg forhelping me create lots of different datasets. Many thanks also to the PhD stu-dents and postdocs of HASTE, including Ebba Bergman, Tianru Zhang andXiaobo Zhao. A special thanks to Phil Harrison and Ankit Gupta for all thefun discussions and all the help you have given me.
Thanks to all fellow PhD students and postdocs, past and present, that Ihave come across during these years: Johan Öfverstedt, Leslie Solorzano,Elisabeth Wetzer, Nadezdha Koriakina, Raphaela Heil, Erik Hallström, MarcFabrega Fraile, Eduard Chelebian, Can Deniz Bezek, Karl Bengtsson Bernan-der, Gabriele Partel, Andrea Behanova, Axel Andersson, Amit Suveer, KalyanRam, Tomas Wilkinsson, Sajith Kecheril Sadanandan, Anders Persson, AnindyaGupta and Kimmo Kartasalo. A special thanks to my old desk neighbour Nico-las Pielawski for all your valuable insights into my research and my newestoffice mate Eva Breznik for fun distractions when writing this thesis.
Thanks to all the inspiring professors, researchers and teachers I have beenin contact with during my studies: Robin Strand, Ingela Nyström, GunillaBorgefors, Filip Malmberg, Ewert Bengtsson, Anders Hast, Petter Ranefall,Anna Klem, Natasa Sladoje and Joakim Lindblad. Thanks to all of you forsharing your knowledge about image analysis and deep learning with me.
51
A warm thank you to all my family and friends outside of academia forproviding a break from academia and a moment to think about other things.A special thanks to Emil Larsson, Olle Gustafsson and Eric Åström for ourweekly music sessions. Thanks a million, to my nieces and nephews, Liv,Ilon, Emil and Moa for being so much fun to be with, and to my parents forall their encouragement and support.
Lastly, but most importantly, thank you Amanda for all the love and supportyou give to me, my life would be boring without you, and to Ebba for all thesmiles, laughs and energy that you bring.
52
References
[1] K. Thorn, “A quick guide to light microscopy in cell biology,” Molecularbiology of the cell, vol. 27, no. 2, pp. 219–222, 2016.
[2] A. Ettinger and T. Wittmann, “Chapter 5 - fluorescence live cell imaging,” inQuantitative Imaging in Cell Biology, ser. Methods in Cell Biology, J. C. Watersand T. Wittman, Eds. Academic Press, 2014, vol. 123, pp. 77 – 94.
[3] J. C. Waters, “Accuracy and precision in quantitative fluorescence microscopy,”The Journal of Cell Biology, vol. 185, no. 7, pp. 1135–1148, 2009. [Online].Available: http://jcb.rupress.org/content/185/7/1135
[4] J. C. Waters and T. Wittmann, “Chapter 1 - concepts in quantitative fluorescencemicroscopy,” in Quantitative Imaging in Cell Biology, ser. Methods in CellBiology, J. C. Waters and T. Wittman, Eds. Academic Press, 2014, vol. 123,pp. 1 – 18.
[5] L. Reimer and H. Kohl, Transmission electron microscopy: physics of imageformation, 5th ed. New York, NY: Springer, 2008.
[6] N. F. Cheville and J. Stasko, “Techniques in electron microscopy of animaltissue,” Veterinary Pathology, vol. 51, no. 1, pp. 28–41, 2014, pMID: 24114311.[Online]. Available: https://doi.org/10.1177/0300985813505114
[7] “Minitem semi-automated transmission electron microscopy analysis system,”https://www.vironova.com/instruments/minitem, accessed: 2021-03-21.
[8] J. Lehtinen, J. Munkberg, J. Hasselgren, S. Laine, T. Karras, M. Aittala, andT. Aila, “Noise2noise: Learning image restoration without clean data,” arXivpreprint arXiv:1803.04189, 2018.
[9] A. Krull, T.-O. Buchholz, and F. Jug, “Noise2void-learning denoising fromsingle noisy images,” in Proceedings of the IEEE/CVF Conference on ComputerVision and Pattern Recognition, 2019, pp. 2129–2137.
[10] W. Rawat and Z. Wang, “Deep convolutional neural networks for imageclassification: A comprehensive review,” Neural computation, vol. 29, no. 9, pp.2352–2449, 2017.
[11] N. R. Pal and S. K. Pal, “A review on image segmentation techniques,” PatternRecognition, vol. 26, no. 9, pp. 1277–1294, 1993. [Online]. Available:https://www.sciencedirect.com/science/article/pii/003132039390135J
[12] S. Minaee, Y. Y. Boykov, F. Porikli, A. J. Plaza, N. Kehtarnavaz, andD. Terzopoulos, “Image segmentation using deep learning: A survey,” IEEEtransactions on pattern analysis and machine intelligence, 2021.
[13] Z. Zou, Z. Shi, Y. Guo, and J. Ye, “Object detection in 20 years: A survey,”arXiv preprint arXiv:1905.05055, 2019.
[14] S. Rani, S. Jindal, and B. Kaur, “A brief review on image restorationtechniques,” International Journal of Computer Applications, vol. 150, no. 12,pp. 30–33, 2016.
53

[15] F. P. Oliveira and J. M. R. Tavares, “Medical image registration: a review,”Computer methods in biomechanics and biomedical engineering, vol. 17, no. 2,pp. 73–93, 2014.
[16] J.-Y. Zhu, T. Park, P. Isola, and A. A. Efros, “Unpaired image-to-imagetranslation using cycle-consistent adversarial networks,” in Proceedings of theIEEE international conference on computer vision, 2017, pp. 2223–2232.
[17] P. Isola, J.-Y. Zhu, T. Zhou, and A. A. Efros, “Image-to-image translation withconditional adversarial networks,” in Proceedings of the IEEE conference oncomputer vision and pattern recognition, 2017, pp. 1125–1134.
[18] E. M. Christiansen, S. J. Yang, D. M. Ando, A. Javaherian, G. Skibinski,S. Lipnick, E. Mount, A. O’Neil, K. Shah, A. K. Lee, P. Goyal, W. Fedus,R. Poplin, A. Esteva, M. Berndl, L. L. Rubin, P. Nelson, and S. Finkbeiner, “Insilico labeling: Predicting fluorescent labels in unlabeled images,” Cell, vol.173, no. 3, pp. 792–803.e19, 2018. [Online]. Available:https://www.sciencedirect.com/science/article/pii/S0092867418303647
[19] Y. Rivenson, H. Wang, Z. Wei, K. de Haan, Y. Zhang, Y. Wu, H. Günaydin, J. E.Zuckerman, T. Chong, A. E. Sisk, L. M. Westbrook, W. D. Wallace, andA. Ozcan, “Virtual histological staining of unlabelled tissue-autofluorescenceimages via deep learning,” Nature Biomedical Engineering, vol. 3, no. 6, pp.466–477, 2019. [Online]. Available:https://doi.org/10.1038/s41551-019-0362-y
[20] S. B. Kotsiantis, I. Zaharakis, P. Pintelas et al., “Supervised machine learning:A review of classification techniques,” Emerging artificial intelligenceapplications in computer engineering, vol. 160, no. 1, pp. 3–24, 2007.
[21] P. Viola and M. Jones, “Rapid object detection using a boosted cascade ofsimple features,” in Proceedings of the 2001 IEEE computer society conferenceon computer vision and pattern recognition. CVPR 2001, vol. 1. IEEE, 2001.
[22] D. G. Lowe, “Distinctive image features from scale-invariant keypoints,”International journal of computer vision, vol. 60, no. 2, pp. 91–110, 2004.
[23] I. Goodfellow, Y. Bengio, and A. Courville, Deep Learning. MIT Press, 2016,http://www.deeplearningbook.org.
[24] A. D. Rasamoelina, F. Adjailia, and P. Sincak, “A review of activation functionfor artificial neural network,” in 2020 IEEE 18th World Symposium on AppliedMachine Intelligence and Informatics (SAMI), 2020, pp. 281–286.
[25] V. Nair and G. E. Hinton, “Rectified linear units improve restricted boltzmannmachines,” in ICML, 2010.
[26] J. Schmidhuber, “Deep learning in neural networks: An overview,” NeuralNetworks, vol. 61, pp. 85–117, 2015. [Online]. Available:https://www.sciencedirect.com/science/article/pii/S0893608014002135
[27] D. P. Kingma and J. Ba, “Adam: A method for stochastic optimization,” arXivpreprint arXiv:1412.6980, 2014.
[28] I. Loshchilov and F. Hutter, “Decoupled weight decay regularization,” arXivpreprint arXiv:1711.05101, 2017.
[29] Y. LeCun, Y. Bengio, and G. Hinton, “Deep learning,” Nature, vol. 521, no.7553, pp. 436–444, 2015. [Online]. Available:https://doi.org/10.1038/nature14539
[30] H. Zhao, O. Gallo, I. Frosio, and J. Kautz, “Loss functions for image restoration
54

with neural networks,” IEEE Transactions on computational imaging, vol. 3,no. 1, pp. 47–57, 2016.
[31] I. J. Goodfellow, J. Pouget-Abadie, M. Mirza, B. Xu, D. Warde-Farley, S. Ozair,A. Courville, and Y. Bengio, “Generative Adversarial Networks,”arXiv:1406.2661 [cs, stat], Jun. 2014, arXiv: 1406.2661.
[32] A. Jolicoeur-Martineau, “The relativistic discriminator: a key element missingfrom standard gan,” arXiv preprint arXiv:1807.00734, 2018.
[33] X. Mao, Q. Li, H. Xie, R. Y. Lau, Z. Wang, and S. Paul Smolley, “Least squaresgenerative adversarial networks,” in Proceedings of the IEEE internationalconference on computer vision, 2017, pp. 2794–2802.
[34] M. Arjovsky, S. Chintala, and L. Bottou, “Wasserstein generative adversarialnetworks,” in International conference on machine learning. PMLR, 2017, pp.214–223.
[35] O. Russakovsky, J. Deng, H. Su, J. Krause, S. Satheesh, S. Ma, Z. Huang,A. Karpathy, A. Khosla, M. Bernstein et al., “Imagenet large scale visualrecognition challenge,” International journal of computer vision, vol. 115,no. 3, pp. 211–252, 2015.
[36] K. Simonyan and A. Zisserman, “Very deep convolutional networks forlarge-scale image recognition,” arXiv preprint arXiv:1409.1556, 2014.
[37] K. He, X. Zhang, S. Ren, and J. Sun, “Deep residual learning for imagerecognition,” in Proceedings of the IEEE conference on computer vision andpattern recognition, 2016, pp. 770–778.
[38] G. Huang, Z. Liu, L. Van Der Maaten, and K. Q. Weinberger, “Denselyconnected convolutional networks,” in Proceedings of the IEEE conference oncomputer vision and pattern recognition, 2017, pp. 4700–4708.
[39] X. Glorot and Y. Bengio, “Understanding the difficulty of training deepfeedforward neural networks,” in Proceedings of the thirteenth internationalconference on artificial intelligence and statistics. JMLR Workshop andConference Proceedings, 2010, pp. 249–256.
[40] O. Ronneberger, P. Fischer, and T. Brox, “U-net: Convolutional networks forbiomedical image segmentation,” in International Conference on Medical imagecomputing and computer-assisted intervention. Springer, 2015, pp. 234–241.
[41] W. Shi, J. Caballero, F. Huszár, J. Totz, A. P. Aitken, R. Bishop, D. Rueckert,and Z. Wang, “Real-time single image and video super-resolution using anefficient sub-pixel convolutional neural network,” in Proceedings of the IEEEconference on computer vision and pattern recognition, 2016, pp. 1874–1883.
[42] A. Odena, V. Dumoulin, and C. Olah, “Deconvolution and checkerboardartifacts,” Distill, 2016. [Online]. Available:http://distill.pub/2016/deconv-checkerboard
[43] C. Guo, G. Pleiss, Y. Sun, and K. Q. Weinberger, “On calibration of modernneural networks,” in International Conference on Machine Learning. PMLR,2017, pp. 1321–1330.
[44] A. Kendall and Y. Gal, “What uncertainties do we need in bayesian deeplearning for computer vision?” in Proceedings of the 31st InternationalConference on Neural Information Processing Systems, 2017, pp. 5580–5590.
[45] Y. Gal and Z. Ghahramani, “Dropout as a bayesian approximation:Representing model uncertainty in deep learning,” in international conference
55
on machine learning. PMLR, 2016, pp. 1050–1059.[46] B. Lakshminarayanan, A. Pritzel, and C. Blundell, “Simple and scalable
predictive uncertainty estimation using deep ensembles,” Advances in neuralinformation processing systems, vol. 30, 2017.
[47] A. Kendall, Y. Gal, and R. Cipolla, “Multi-task learning using uncertainty toweigh losses for scene geometry and semantics,” in Proceedings of the IEEEConference on Computer Vision and Pattern Recognition (CVPR), June 2018.
[48] V. Vovk, A. Gammerman, and G. Shafer, Algorithmic learning in a randomworld. Springer Science & Business Media, 2005.
[49] G. Shafer and V. Vovk, “A tutorial on conformal prediction.” Journal ofMachine Learning Research, vol. 9, no. 3, 2008.
[50] V. Vovk, V. Fedorova, I. Nouretdinov, and A. Gammerman, “Criteria ofefficiency for conformal prediction,” in Symposium on conformal andprobabilistic prediction with applications. Springer, 2016, pp. 23–39.
[51] H. Papadopoulos, K. Proedrou, V. Vovk, and A. Gammerman, “Inductiveconfidence machines for regression,” in European Conference on MachineLearning. Springer, 2002, pp. 345–356.
[52] H. Papadopoulos, Inductive conformal prediction: Theory and application toneural networks. INTECH Open Access Publisher Rijeka, 2008.
[53] V. Vapnik and R. Izmailov, “Learning Using Privileged Information: SimilarityControl and Knowledge Transfer,” Journal of Machine Learning Research,vol. 16, no. 61, pp. 2023–2049, 2015.
[54] D. Lopez-Paz, L. Bottou, B. Schölkopf, and V. Vapnik, “Unifying distillationand privileged information,” arXiv preprint arXiv:1511.03643, 2015.
[55] Z. Gu, L. Niu, H. Zhao, and L. Zhang, “Hard pixel mining for depth privilegedsemantic segmentation,” IEEE Transactions on Multimedia, vol. 23, pp.3738–3751, 2020.
[56] Z. Wang, A. C. Bovik, H. R. Sheikh, and E. P. Simoncelli, “Image qualityassessment: from error visibility to structural similarity,” IEEE transactions onimage processing, vol. 13, no. 4, pp. 600–612, 2004.
[57] C. Li and A. C. Bovik, “Content-partitioned structural similarity index forimage quality assessment,” Signal Processing: Image Communication, vol. 25,no. 7, pp. 517–526, 2010.
[58] Z. Wang, E. P. Simoncelli, and A. C. Bovik, “Multiscale structural similarity forimage quality assessment,” in The Thrity-Seventh Asilomar Conference onSignals, Systems & Computers, 2003, vol. 2. Ieee, 2003, pp. 1398–1402.
[59] C. Li and A. C. Bovik, “Content-partitioned structural similarity index forimage quality assessment,” Signal Processing: Image Communication, vol. 25,no. 7, pp. 517–526, 2010.
[60] J. Johnson, A. Alahi, and L. Fei-Fei, “Perceptual losses for real-time styletransfer and super-resolution,” in European conference on computer vision.Springer, 2016, pp. 694–711.
[61] R. Zhang, P. Isola, A. A. Efros, E. Shechtman, and O. Wang, “The unreasonableeffectiveness of deep features as a perceptual metric,” in Proceedings of theIEEE conference on computer vision and pattern recognition, 2018, pp.586–595.
[62] T. Zhao and R. F. Murphy, “Automated learning of generative models for
56
subcellular location: Building blocks for systems biology,” Cytometry Part A,vol. 71A, no. 12, pp. 978–990, 2007. [Online]. Available:https://onlinelibrary.wiley.com/doi/abs/10.1002/cyto.a.20487
[63] J. Ferlay, M. Ervik, F. Lam, M. Colombet, L. Mery, M. Pineros, A. Znaor,I. Soerjomataram, and F. Bray, “Global cancer observatory: Cancer today. lyon,france: International agency for research on cancer,” Available fromhttps://gco.iarc.fr/today, 2020, accessed: 2022-02-18.
[64] E. Bengtsson and P. Malm, “Screening for cervical cancer using automatedanalysis of pap-smears,” Computational and mathematical methods in medicine,vol. 2014, 2014.
[65] G. Dounias. (2008, jul) Pap-smear (dtu/herlev) databases & related studies.[Online]. Available: http://mde-lab.aegean.gr/downloads
[66] P. Malm, “Image analysis in support of computer-assisted cervical cancerscreening,” Ph.D. dissertation, Uppsala University, 2013. [Online]. Available:http://urn.kb.se/resolve?urn=urn:nbn:se:uu:diva-212518
[67] J. Lu, N. Sladoje, C. Runow Stark, E. Darai Ramqvist, J.-M. Hirsch, andJ. Lindblad, “A deep learning based pipeline for efficient oral cancer screeningon whole slide images,” in Image Analysis and Recognition, A. Campilho,F. Karray, and Z. Wang, Eds. Cham: Springer International Publishing, 2020,pp. 249–261.
[68] E. Wetzer, J. Gay, H. Harlin, J. Lindblad, and N. Sladoje, “When texturematters: Texture-focused cnns outperform general data augmentation andpretraining in oral cancer detection,” in 2020 IEEE 17th InternationalSymposium on Biomedical Imaging (ISBI), 2020, pp. 517–521.
[69] O. Kupyn, T. Martyniuk, J. Wu, and Z. Wang, “Deblurgan-v2: Deblurring(orders-of-magnitude) faster and better,” in Proceedings of the IEEEInternational Conference on Computer Vision, 2019, pp. 8878–8887.
[70] M. Aittala and F. Durand, “Burst image deblurring using permutation invariantconvolutional neural networks,” in Proceedings of the European Conference onComputer Vision (ECCV), 2018, pp. 731–747.
[71] M. Mathieu, C. Couprie, and Y. LeCun, “Deep multi-scale video predictionbeyond mean square error,” arXiv preprint arXiv:1511.05440, 2015.
[72] M. Purschke, N. Rubio, K. D. Held, and R. W. Redmond, “Phototoxicity ofHoechst 33342 in time-lapse fluorescence microscopy,” Photochemical &Photobiological Sciences: Official Journal of the European PhotochemistryAssociation and the European Society for Photobiology, vol. 9, no. 12, pp.1634–1639, Dec. 2010.
[73] A. E. Carpenter, T. R. Jones, M. R. Lamprecht, C. Clarke, I. H. Kang,O. Friman, D. A. Guertin, J. H. Chang, R. A. Lindquist, J. Moffat, P. Golland,and D. M. Sabatini, “Cellprofiler: image analysis software for identifying andquantifying cell phenotypes,” Genome Biology, vol. 7, no. 10, p. R100, Oct2006.
[74] G. Bhat, M. Danelljan, L. V. Gool, and R. Timofte, “Deep burstsuper-resolution,” in IEEE/CVF Conference on Computer Vision and PatternRecognition, CVPR, 2021. [Online]. Available: https://arxiv.org/abs/2101.10997
[75] X. Wang, K. C. K. Chan, K. Yu, C. Dong, and C. C. Loy, “Edvr: Videorestoration with enhanced deformable convolutional networks,” in 2019
57

IEEE/CVF Conference on Computer Vision and Pattern Recognition Workshops(CVPRW), 2019, pp. 1954–1963.
[76] S. Helgadottir, B. Midtvedt, J. Pineda, A. Sabirsh, C. B. Adiels, S. Romeo,D. Midtvedt, and G. Volpe, “Extracting quantitative biological information frombright-field cell images using deep learning,” Biophysics Reviews, vol. 2, no. 3,p. 031401, 2021. [Online]. Available:https://aip.scitation.org/doi/abs/10.1063/5.0044782
[77] G. Kylberg, I.-M. Sintorn, and G. Borgefors, “Towards automated tem for virusdiagnostics: Segmentation of grid squares and detection of regions of interest,”in Scandinavian Conference on Image Analysis. Springer, 2009, pp. 169–178.
[78] A. Suveer, N. Sladoje, J. Lindblad, A. Dragomir, and I.-M. Sintorn, “Automateddetection of cilia in low magnification transmission electron microscopy imagesusing template matching,” in 2016 IEEE 13th International Symposium onBiomedical Imaging (ISBI), 2016, pp. 386–390.
[79] W. Samek, A. Binder, G. Montavon, S. Lapuschkin, and K.-R. Müller,“Evaluating the visualization of what a deep neural network has learned,” IEEEtransactions on neural networks and learning systems, vol. 28, no. 11, pp.2660–2673, 2016.
[80] A. Holzinger, C. Biemann, C. S. Pattichis, and D. B. Kell, “What do we need tobuild explainable ai systems for the medical domain?” arXiv preprintarXiv:1712.09923, 2017.
[81] R. R. Selvaraju, M. Cogswell, A. Das, R. Vedantam, D. Parikh, and D. Batra,“Grad-cam: Visual explanations from deep networks via gradient-basedlocalization,” in Proceedings of the IEEE international conference on computervision, 2017, pp. 618–626.
[82] D. Hendrycks and K. Gimpel, “A baseline for detecting misclassified andout-of-distribution examples in neural networks,” CoRR, vol. abs/1610.02136,2016. [Online]. Available: http://arxiv.org/abs/1610.02136
[83] J. Ren, P. J. Liu, E. Fertig, J. Snoek, R. Poplin, M. Depristo, J. Dillon, andB. Lakshminarayanan, “Likelihood ratios for out-of-distribution detection,”Advances in Neural Information Processing Systems, vol. 32, 2019.
[84] S. Kaji and S. Kida, “Overview of image-to-image translation by use of deepneural networks: denoising, super-resolution, modality conversion, andreconstruction in medical imaging,” Radiological physics and technology,vol. 12, no. 3, pp. 235–248, 2019.
[85] J. Hoffman, S. Gupta, and T. Darrell, “Learning with side information throughmodality hallucination,” in Proceedings of the IEEE conference on computervision and pattern recognition, 2016, pp. 826–834.
58


Acta Universitatis UpsaliensisDigital Comprehensive Summaries of Uppsala Dissertationsfrom the Faculty of Science and Technology 2144
Editor: The Dean of the Faculty of Science and Technology
A doctoral dissertation from the Faculty of Science andTechnology, Uppsala University, is usually a summary of anumber of papers. A few copies of the complete dissertationare kept at major Swedish research libraries, while thesummary alone is distributed internationally throughthe series Digital Comprehensive Summaries of UppsalaDissertations from the Faculty of Science and Technology.(Prior to January, 2005, the series was published under thetitle “Comprehensive Summaries of Uppsala Dissertationsfrom the Faculty of Science and Technology”.)
Distribution: publications.uu.seurn:nbn:se:uu:diva-472360
ACTAUNIVERSITATIS
UPSALIENSISUPPSALA
2022