Cine-weapon: The poiesis of filming and fishing (Vibrant, 2012)
Experimental Thermal and Fluid Science 33 (2009) 1065–1086
Contents lists available at ScienceDirect
Experimental Thermal and Fluid Science
journal homepage: www.elsevier .com/locate /et fs
Application of the ultrasonic technique and high-speed filming for the studyof the structure of air–water bubbly flows
R.D.M. Carvalho a,*, O.J. Venturini a, E.I. Tanahashi a, F. Neves Jr. b, F.A. França c
a Universidade Federal de Itajubá (UNIFEI), Itajubá, Brazilb Universidade Tecnológica Federal do Paraná (UTFPR), Curitiba, Brazilc Universidade Estadual de Campinas (UNICAMP), Campinas, Brazil
a r t i c l e i n f o a b s t r a c t
Article history:Received 12 October 2008Received in revised form 14 June 2009Accepted 15 June 2009
Keywords:Ultrasonic techniqueHigh-speed filmingAir–water bubbly flowVoid fractionFlow patternsTransit time
0894-1777/$ - see front matter � 2009 Elsevier Inc. Adoi:10.1016/j.expthermflusci.2009.06.004
* Corresponding author. Address: Universidade FedBPS, 1303, Bairro Pinheirinho, Itajubá, MG 37500-901304; fax: +55 35 3629 1148.
E-mail addresses: [email protected], ricardo.200
Multiphase flows are very common in industry, oftentimes involving very harsh environments and fluids.Accordingly, there is a need to determine the dispersed phase holdup using noninvasive fast respondingtechniques; besides, knowledge of the flow structure is essential for the assessment of the transportprocesses involved. The ultrasonic technique fulfills these requirements and could have the capabilityto provide the information required. In this paper, the potential of the ultrasonic technique for applica-tion to two-phase flows was investigated by checking acoustic attenuation data against experimentaldata on the void fraction and flow topology of vertical, upward, air–water bubbly flows in the zero to15% void fraction range. The ultrasonic apparatus consisted of one emitter/receiver transducer and threeother receivers at different positions along the pipe circumference; simultaneous high-speed motion pic-tures of the flow patterns were made at 250 and 1000 fps. The attenuation data for all sensors exhibited asystematic interrelated behavior with void fraction, thereby testifying to the capability of the ultrasonictechnique to measure the dispersed phase holdup. From the motion pictures, basic gas phase structuresand different flows patterns were identified that corroborated several features of the acoustic attenuationdata. Finally, the acoustic wave transit time was also investigated as a function of void fraction.
� 2009 Elsevier Inc. All rights reserved.
1. Introduction
Multiphase flows are very common in the petroleum, chemical,and nuclear industries, oftentimes involving harsh media, strictsafety restrictions, access difficulties, long distances, and aggres-sive surroundings. Accordingly, there is a growing interest in theuse of noninvasive techniques for measurement of the dispersedphase concentration, flow pattern detection, monitoring of voidwave propagation and other basic variables in multiphase flows.Powell [1] presented a review of noninvasive methods used formeasurement of several parameters of multiphase systems, espe-cially the concentration of the dispersed phase and the velocityfield. The focus was on techniques that can be applied to multi-phase fluids of immediate practical interest. Magnetic resonanceimaging (MRI) was said to be the most versatile technique amongthose studied as it can provide spatially resolved measurements ofconcentration, velocity, chemical constituents, and diffusivity.However, the equipment is expensive and requires the multiphase
ll rights reserved.
eral de Itajubá (UNIFEI), Av.3, Brazil. Tel.: +55 35 3629
[email protected] (R.D.M. Carvalho).
flow experimental apparatus to be brought to the MRI equipmentrather than having the MRI unit readily available in a fluid mechan-ics laboratory. In addition, it requires operation by highly trainedpersonnel and long times to acquire data. X-ray radiography is alsoquite specialized and has been used in a rather limited number ofstudies of multiphase systems; the same is true for neutron radiog-raphy, which is mainly used for the study of multiphase systemsinvolving liquid metals. In both cases, the images obtained repre-sent the projection of a three-dimensional object onto a plane.Electrical impedance tomography (EIT) is a fairly new techniquethat has been used for measurement of concentration distributionsof pipe flow suspensions. As yet, this technique has not met withwidespread use. Jaworek et al. [2] presented a simple noninvasivecapacitance system for void fraction measurement; however, thistechnique is still at the laboratory stage.
The ultrasonic technique, on the other hand, is already wellestablished in other fields of application such as medicine and flawdetection in solid materials. The transducers and electronics arereadily available commercially at relatively low cost; these sys-tems are also compact and rugged. Besides, the use of ultrasonicsfor application with multiphase systems has been the object of alarge number of research papers, e.g. [3–13], which confirm the po-tential and add to the reliability of the technique. Ultrasonic signalsare information rich and can penetrate pipe, vessel and process

1066 R.D.M. Carvalho et al. / Experimental Thermal and Fluid Science 33 (2009) 1065–1086
chamber walls to successfully interrogate optically opaque fluidsand dense suspensions. In addition, the signals are not significantlydegraded by a wide range of process conditions and can providereal-time in-situ measurements and visualizations [3]. The draw-back of current ultrasonic is the need for prior signal attenuationcalibration. The main ultrasonic parameters normally used in mul-tiphase processes monitoring, measurement, and control are soundpressure intensity, energy attenuation and the wave transit time;these parameters can be measured across the pipe diameter oralong another acoustic path through the multiphase flow in casea lateral or backward reflection – or pulse-echo – mode is used.As the concentration and size distribution of the dispersed media(bubbles, oil droplets or solid particles) change these signal proper-ties vary due to the combined effect of acoustic attenuation andtransmission phenomena – reflection, refraction, and scatteringof the sound beam by the dispersed phases and acoustic attenua-tion by the continuous phase. Thus, the resulting multiphase flowsignal is usually referenced to the signal for the continuous phaseas a single-phase fluid at the same temperature.
Ultrasound computerized tomography (UCT) has been studiedby many researchers since the early 1980s as a means to recon-struct the distribution of a gas/liquid two-phase flow over thecross-section of a pipe. Warsito et al. [11] presented a review ofnoninvasive techniques for monitoring gas–liquid bubbly flows.It was speculated that UCT is more appropriate for application inmedia poorly penetrated by light or other electromagnetic radia-tion; this would be the case of a relatively homogeneous, high den-sity media. Nonetheless, two main limitations of the UCTtechnique pose a challenge to its use in applications where real-time performance is vital [11]: the complex sound field sensedby the transducers leads to errors due to overlapped or multiple re-flected pulses; and the inherent slow propagation speed of ultra-sound lowers the scanning speed. Another difficulty pointed outby Xu et al. [14] is the strong mismatch between the acousticimpedance of the phases as it occurs, for instance, in air–waterflows. Despite these difficulties, Warsito et al. [11] could use theUCT technique to measure the time-averaged cross-sectional dis-tributions of gas bubbles and solid particles in a slurry bubble col-umn. Xu and Xu [15] and Xu et al. [14] were able to successfullyreconstruct the distribution of simulated and actual gas–liquidtwo-phase flows over the cross-section of a pipe using the UCTtechnique. The experimental set-up was fairly complex and thediameter of the smallest bubble in the reconstructed image corre-sponded to 0.6% of the cross-sectional area, but the spatial resolu-tion was not uniform over the cross-section. In general, the imagereconstruction time was much longer than the data acquisitiontime and could only be done off-line.
Simpler instrumentation setups involving the ultrasonic tech-nique for the characterization of flow patterns in horizontal gas–li-quid flows and for the measurement of the liquid film thicknessand interface characteristics in inclined pipes are discussed in Refs.[16,17]. The ultrasonic technique has also been used to measurethe dispersed phase concentration in three-phase and two-phaseflows – air–oil; glass beads–oil; and air–glass beads–oil [9,13].Zheng and Zhang [13] observed the signal attenuation to increaseexponentially with increasing interfacial area of both the solidand gas phases. The air bubbles were said to have caused an in-crease in the acoustic wave transit time. Besides confirming theobservations by Zheng and Zhang [13], Vatanakul et al. [9] also ver-ified that the scatter in the transit time and in the signal amplitudeincreased as the gas volumetric concentration increased. Wadaet al. [10] used the ultrasonic pulse-echo mode to identify theair–water flow pattern – bubbly, slug, or annular – in vertical Plex-iglas and carbon steel pipes; flow pattern recognition was based onthe delay (transit) time and the relative energy intensity of themechanical wave in pulse-echo mode. The authors were able to
successfully determine the gas phase profiles in the cross-sectionand the flow pattern; however, no attempt was made to correlatethe ultrasonic data with the void fraction.
For many years, visual techniques have been an important toolfor the study of the structure of two-phase flows. Advances in elec-tronics and, in particular, in high-speed digital cameras have madeoptical imaging techniques very appealing as they are noninvasive,relatively low price, and capable of providing simultaneous infor-mation on several flow characteristics. Caicedo et al. [18] used dig-ital image analysis to study the shape factor and aspect ratio ofbubbles in a gas–solid fluidized bed as a function of gas velocity.Even though data reduction was laborious and required subjectiveinterpretation in the delineation of bubble–solid phase boundaries,the authors claimed the study validated the CCD camera as animportant work tool in the investigation of the behavior of 2D flu-idized beds. Shen et al. [19] used a CCD digital video camera andthe digital image processing tool of MatLab to perform a digital im-age analysis of the hydrodynamics of 2D bubbling fluidized beds.The method developed allowed for simultaneous measurementsof the size and velocity of gas bubbles, and the axial and radial dis-tribution of bubbles. The authors claimed that the method devel-oped provided a better estimation of the flow parameters thanlocal probe methods. Laakonen et al. [20] used particle imagevelocimetry (PIV) to investigate the flow field in a bubbly gas–li-quid system. As discussed by the authors, digital cameras andautomatic image analysis have made quantitative optical measure-ments easier; however, the success of bubble identification de-pends on image quality and lighting conditions. The overlappingof bubbles in the images, the blurriness of bubbles that are out offocus, and the distortions in bubble shape make automatic identi-fication a difficult challenging task. Their results underestimatedthe bubble size, which was corrected by a simple statistical meth-od. This correction was observed to have a notable effect on thecalculated gas–liquid interfacial areas and gas holdups. Pincovschiet al. [21] were able to determine the local gas holdup in an air–water bubble column using a photographic method considered tobe a simplification of the PIV technique. Even though time consum-ing and limited to low void fractions, the method presented comesat a relatively low cost and the results obtained were in goodagreement with similar data in the literature.
The present article presents and analyzes acoustic data andsimultaneous high-speed images of vertical, upward, air–watertwo-phase flows in the so-called bubbly flow regime. The ultra-sonic instrumentation was intentionally kept much simpler thanthat required by the UCT technique, consisting of only one dual ele-ment (emitter/receiver) transducer and three receivers at three dif-ferent angular positions. The use of simultaneous high-speedfilming was intended mainly as a means to obtain a clear view ofthe various sub-structures that form the bubbly flow – isolatedbubbles, bubble clusters, cap bubbles, etc. – and the way they showup on the corresponding ultrasonic signals. The attenuation in theacoustic pulse energy and intensity amplitude as well as the wavetransit time are correlated with the void fraction. It is hoped thatthese results will add to the understanding of the interaction be-tween the ultrasonic wave and the bubbly flow, thereby contribut-ing to promote the application of the ultrasonic technique tomultiphase flows.
2. Experimental apparatus and procedure
2.1. Two-phase flow test rig
An experimental apparatus was designed for the study of theultrasonic measurement of the void fraction in vertical, upwardair–water flows (Fig. 1). The air–water mixer consists of a

Fig. 1. Schematic view of the water bubbly flow test rig.
R.D.M. Carvalho et al. / Experimental Thermal and Fluid Science 33 (2009) 1065–1086 1067
water-filled tank where the lower end of a 54-mm inner diameteracrylic pipe is inserted. Inside this pipe there is a cylindrical porousmedium through which compressed air is injected into the waterflow; mixing of the air and water takes place in the annular spaceso formed and rapidly evolves into the bubbly flow pattern. Down-stream of the mixer, a 5-m long section of the acrylic pipe assuresthe hydrodynamic development of the bubbly flow before it entersthe ultrasonic probes test section. This test section is actually a 10-cm long segment of the same 54-mm diameter acrylic pipe ontowhich the ultrasonic probes are attached. In addition, a variablereluctance pressure transducer tapped just downstream of theultrasonic probes measures the flow pressure. Following the testsection, a 1.6-m long portion of the acrylic pipe discharges theair–water two-phase flow into a phase separator. A quick valve de-vice installed in this part of the flow loop allows for measurementsof the volumetric void fraction. This measurement system replaceda previously installed double needle conductive probe [22] that al-lowed for independent measurements of several two-phase flowparameters.
In the separator the air is vented into the atmosphere while thegravity driven water flow returns to the liquid reservoir. A centrif-ugal pump driven by a frequency inverter then forces the waterback to the air–water mixer, thus closing the flow loop. A shell-and-tube heat exchanger located downstream of the pump is usedto restrain variations in the water temperature; the cooling streamis running water at ambient temperature. The water flow rate ismeasured by Rheonik RHM12 Coriolis-type flow meter, which in-cludes an RTD for temperature measurements. The air flow rateis measured by parallel mounted 50MJ10-9 and 50MJ10-12 Mer-iam Instruments laminar flow elements. Model PX 750 Omegapressure transducers, ranging from 0 to 700 mm H2O, are used tomeasure the pressure difference across the laminar flow elements.An identical transducer tapped downstream the laminar flow ele-ments reads the gage air flow pressure. Atmospheric pressure mea-surements come from the University weather station, reported
continuously through Internet. A type J thermocouple measuresthe flowing air temperature. Values of the operating parametersacquired by an AT-MIO NI PC bus-board and pre-processed by Lab-View software are then entered into a Microsoft Excel spreadsheetthat calculates the actual air flow rate at the test section and the airand water superficial velocities. A filming station located justdownstream of the test section allows for high-speed motion pic-tures (1000 fps) of the gas–liquid flow. The camera used was aREDLAKE Motion Pro X3 with 1280 � 1024 resolution; image pro-cessing was done using the VirtualDub software.
2.2. Ultrasound instrumentation
The ultrasonic instrumentation was kept as simple as possiblein view of the long-term goal of using it in real-time applicationsof the oil industry. The main reasoning behind the arrangementin Fig. 2 was that there should be one ultrasonic sensor in eachquadrant of the pipe circumference; however, assuming the bubblyflow to be axially symmetrical from a statistical point of view onlyhalf the circumference was instrumented. The direct transmissionreceiver (h = 180�) was expected to get most of the energy trans-mitted through the bubbly flow while the dual element, emitter/receiver transducer (h = 0�) was intended to provide the main com-plementary information about reflections off the same gas struc-tures in the ultrasonic path. The side sensors (h = 45� and 135�)were expected to receive at least part of the energy scattered offthe acoustic beam and thus provide additional information aboutthe interaction between the ultrasonic wave and the two-phaseflow.
Panametrics Videoscan 2.25 MHz, 13 mm diameter ultrasonictransducers were then mounted on the Plexiglas adapters shownin Fig. 2. A thin gel layer was applied to the transducers front sur-face before mounting to enhance mechanical contact. The emittertransducer adapter was 40 mm long to ensure locating the acousticnear field in the Plexiglas block and not in the two-phase flow [23];

Fig. 2. Schematic view of the ultrasonic instrumentation.
1068 R.D.M. Carvalho et al. / Experimental Thermal and Fluid Science 33 (2009) 1065–1086
all the remaining adapters were 10 mm long. A three-channelstand-alone board consisting of an ultrasound pulse emitter anda data acquisition system with a 60 MHz maximum sampling fre-quency and 64 Mb storage capacity was used for data acquisition,storage, and preliminary reduction.
2.3. Experimental procedure
This paper presents six different series of acoustic and visualdata. As shown in Table 1, different experimental procedures wereadopted for each series in view of the number of channels sampled,memory storage space, and time required for data transfer. Thesampling periods used were previously verified to drastically re-duce data scatter without making the experimentation and datastorage too cumbersome. According to a preliminary statisticalanalysis, ten ultrasonic samples were obtained for each test condi-tion in all series except series #3 and #6; in these cases two and sixacoustic samples, respectively, were obtained because the maingoal was to link the ultrasonic signals to the images. No correlationwith the void fraction was attempted with the results of acousticattenuation in series #3. The reported energy ratios are the averageof ten samples (six for series #6) and the associated uncertaintyinterval at 90% confidence level varied from 1.5% of the mean valuefor low void fractions to 9% for high void fractions.
The data acquisition rate was set to 20 MHz in order to avoidany aliasing effects. In series #3, the ratio between the pulse gen-erating frequency (8.40 kHz) and the high-speed filming (1000 fps)was then 8.40:1, which made it possible to accurately match theultrasonic data to the corresponding individual frames. This ratiowas reduced to 1.72:1 in series #5 and #6, but it was still possibleto match the ultrasonic data to the images.
Table 1Experimental procedures for taking acoustic and visual data.
Data Series Void fraction range (%) Sampling period (s) Sampling rate (MHz) Pu
#1 0–15 1.75 20 4.#2 0–15 15.61 20 8.#3 0–15 5.00 20 8.#4 0–15 2.98 20 1.#5 0–15 2.98 20 1.#6 0–20 2.98 20 1.
Regarding the test conditions, the water flow rate was kept con-stant at about 6.0 � 10�4 m3/s (�2140 kg/h) while the air flow ratewas varied from zero to 2.0 � 10�4 m3/s so as to give the desiredvoid fraction (0–15%). These test conditions corresponded tojwater � 26 cm/s and 0 6 jair 6 8.6 cm/s. The single-phase waterReynolds number was Re � 1.64 � 104. In series #6, the air flowrate was increased up to 2.8 � 10�4 m3/s (jair = 12.0 cm/s) in orderto attain <a> = 20% and to get the slug flow pattern firmly estab-lished. Reference signals for the calculations of the energy ratiosfor the 0� and 180� receivers were obtained for single-phase waterfilling the entire pipe. For the 45� and 135� sensors, it was not pos-sible to use the same reference condition as no acoustic energy hitsthese receivers in single-phase water; as explained later, the refer-ence used for these sensors was 11% void fraction. The temperaturewas kept as close as possible to those of actual test conditions. Thisshould minimize any discrepancies arising from the effect of tem-perature on signal attenuation.
Ultrasonic and visual data were then obtained for the entirebubbly flow regime, i.e. 0–15% void fraction range, in 1% steps; inseries #6 a 2% step was used. The ultrasonic wave sound intensityand energy ratios as well as the wave transit time were then calcu-lated by an independent MatLab signal processing algorithm. In or-der to correlate these acoustic attenuation results with the voidfraction, data from Dias et al. [22] and Dias [24] were used. Theseauthors used a double sensor conductive needle probe to performlocal measurements of void fraction, bubble frequency, bubblevelocity, bubble diameter, and interfacial area density in vertical,upward air–water bubbly flows in a 52-mm ID Plexiglas pipe. Uponintegrating the radial distributions obtained, the authors deter-mined the cross-section mean void fraction, mean superficialvelocity, and mean total interfacial area flux. The current test rig
lse generation rate (kHz) Pulses per sample Sensors sampled Filming speed(frames/s)
10 7175 180� 25040 131,062 180� 25040 42,000 180� 100072 5126 45�, 135�, 180� –72 5126 0�, 135�, 180� 100072 5126 0�, 135�, 180� 1000
R.D.M. Carvalho et al. / Experimental Thermal and Fluid Science 33 (2009) 1065–1086 1069
actually represents an upgrade of this previous apparatus as far asthe instrumentation and other equipment are concerned; however,the basic design and the test conditions were kept the same.
3. Bubbly flow sub-regimes
The fast pictures were analyzed for different flow patterns asthe void fraction increased within the so-called bubbly flow re-gime. It was found that very different gas structures – dispersedbubbles, bubble clusters, coalesced bubbles, and incipient Taylorbubbles – formed the air–water mixture depending on the voidfraction and flow operating conditions. As these distinct gas struc-
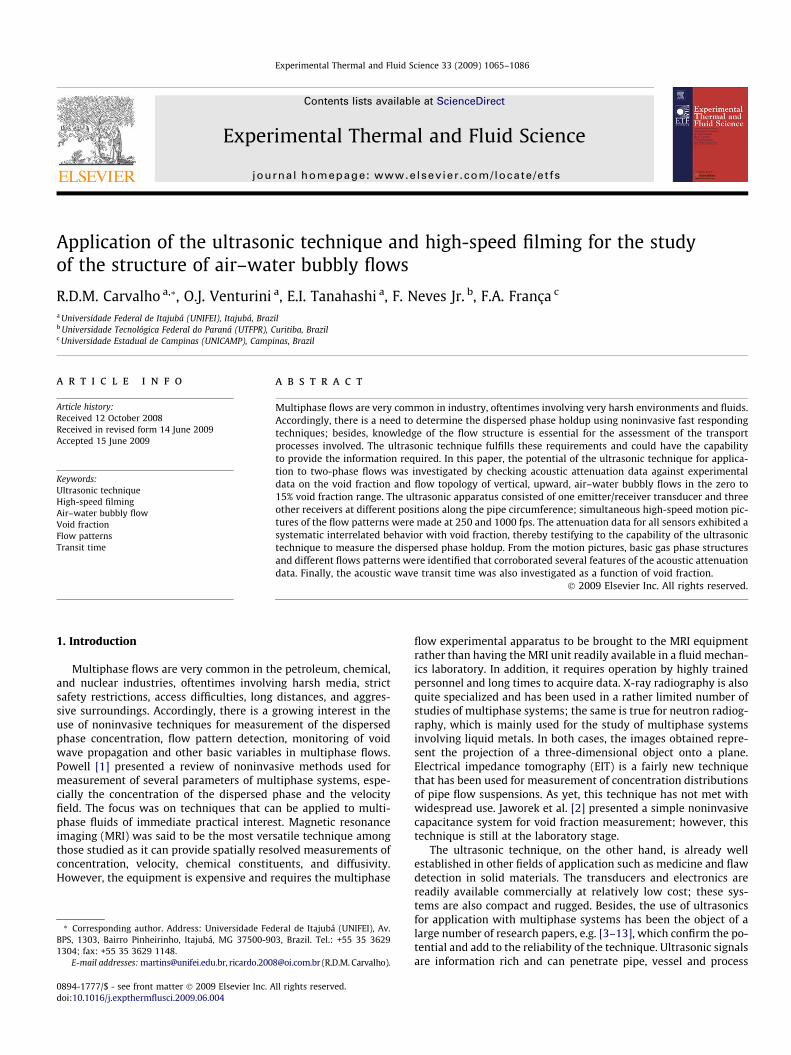
Fig. 3. Trace signal of the direct transm
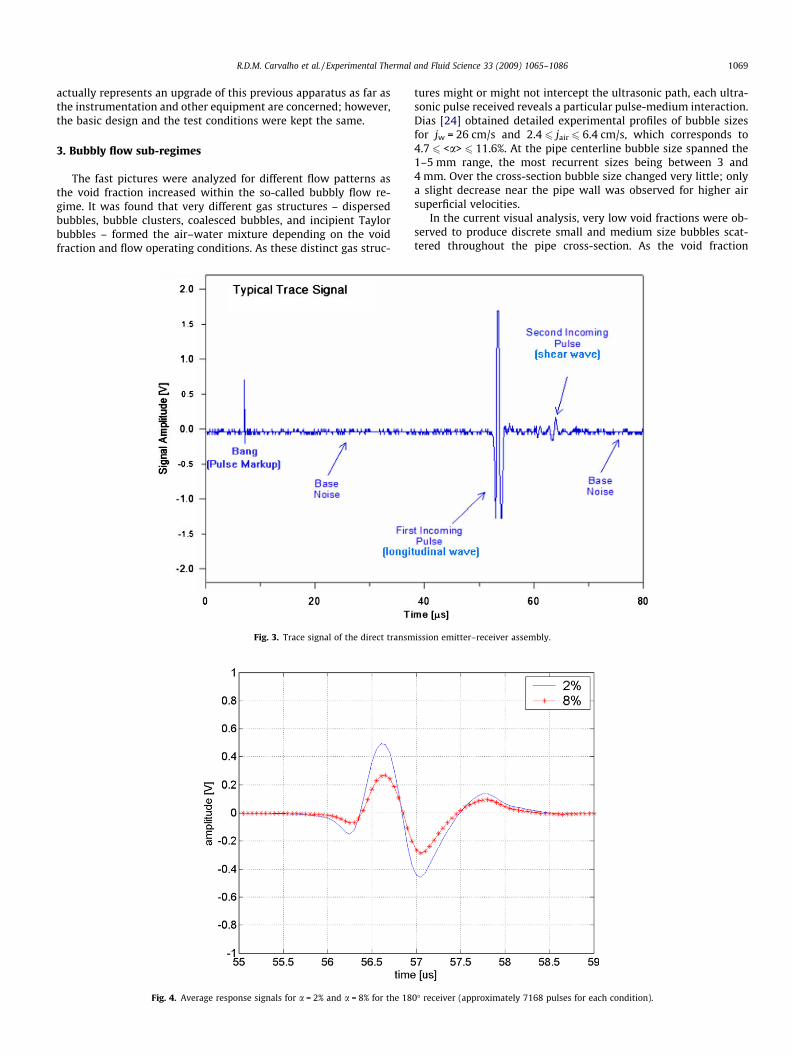
Fig. 4. Average response signals for a = 2% and a = 8% for the 18
tures might or might not intercept the ultrasonic path, each ultra-sonic pulse received reveals a particular pulse-medium interaction.Dias [24] obtained detailed experimental profiles of bubble sizesfor jw = 26 cm/s and 2.4 6 jair 6 6.4 cm/s, which corresponds to4.7 6 <a> 6 11.6%. At the pipe centerline bubble size spanned the1–5 mm range, the most recurrent sizes being between 3 and4 mm. Over the cross-section bubble size changed very little; onlya slight decrease near the pipe wall was observed for higher airsuperficial velocities.
In the current visual analysis, very low void fractions were ob-served to produce discrete small and medium size bubbles scat-tered throughout the pipe cross-section. As the void fraction
ission emitter–receiver assembly.
0� receiver (approximately 7168 pulses for each condition).
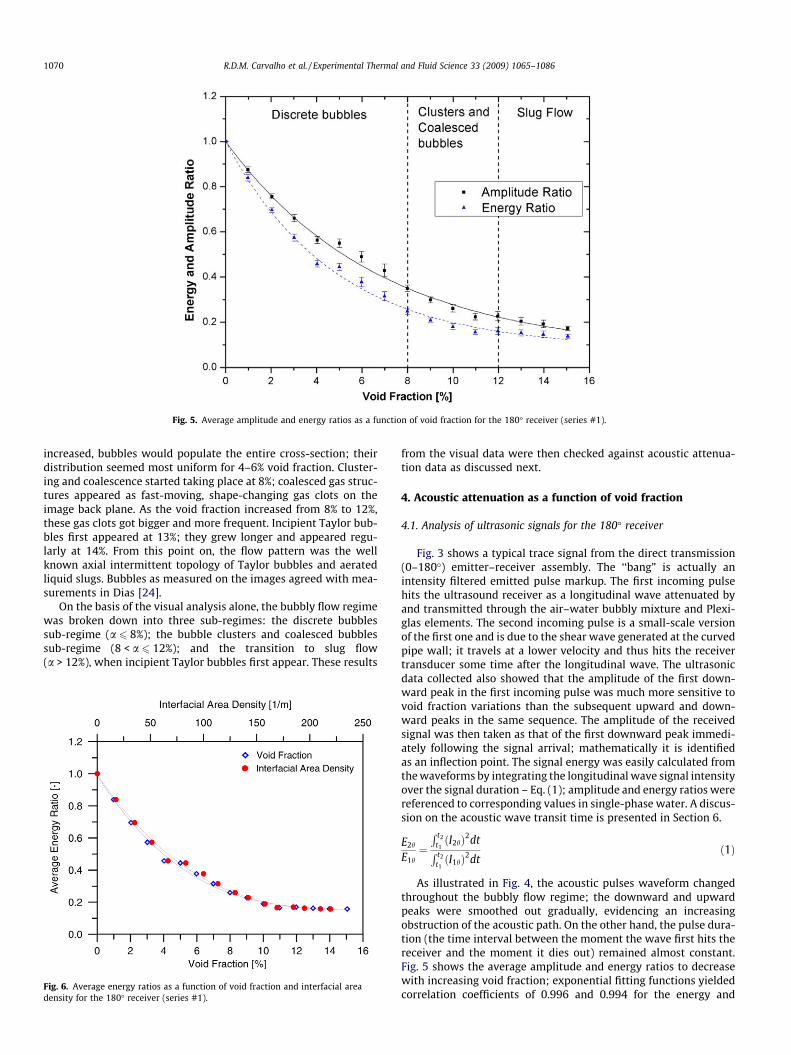
Fig. 5. Average amplitude and energy ratios as a function of void fraction for the 180� receiver (series #1).
1070 R.D.M. Carvalho et al. / Experimental Thermal and Fluid Science 33 (2009) 1065–1086
increased, bubbles would populate the entire cross-section; theirdistribution seemed most uniform for 4–6% void fraction. Cluster-ing and coalescence started taking place at 8%; coalesced gas struc-tures appeared as fast-moving, shape-changing gas clots on theimage back plane. As the void fraction increased from 8% to 12%,these gas clots got bigger and more frequent. Incipient Taylor bub-bles first appeared at 13%; they grew longer and appeared regu-larly at 14%. From this point on, the flow pattern was the wellknown axial intermittent topology of Taylor bubbles and aeratedliquid slugs. Bubbles as measured on the images agreed with mea-surements in Dias [24].
On the basis of the visual analysis alone, the bubbly flow regimewas broken down into three sub-regimes: the discrete bubblessub-regime (a 6 8%); the bubble clusters and coalesced bubblessub-regime (8 < a 6 12%); and the transition to slug flow(a > 12%), when incipient Taylor bubbles first appear. These results
Fig. 6. Average energy ratios as a function of void fraction and interfacial areadensity for the 180� receiver (series #1).
from the visual data were then checked against acoustic attenua-tion data as discussed next.
4. Acoustic attenuation as a function of void fraction
4.1. Analysis of ultrasonic signals for the 180� receiver
Fig. 3 shows a typical trace signal from the direct transmission(0–180�) emitter–receiver assembly. The ‘‘bang” is actually anintensity filtered emitted pulse markup. The first incoming pulsehits the ultrasound receiver as a longitudinal wave attenuated byand transmitted through the air–water bubbly mixture and Plexi-glas elements. The second incoming pulse is a small-scale versionof the first one and is due to the shear wave generated at the curvedpipe wall; it travels at a lower velocity and thus hits the receivertransducer some time after the longitudinal wave. The ultrasonicdata collected also showed that the amplitude of the first down-ward peak in the first incoming pulse was much more sensitive tovoid fraction variations than the subsequent upward and down-ward peaks in the same sequence. The amplitude of the receivedsignal was then taken as that of the first downward peak immedi-ately following the signal arrival; mathematically it is identifiedas an inflection point. The signal energy was easily calculated fromthe waveforms by integrating the longitudinal wave signal intensityover the signal duration – Eq. (1); amplitude and energy ratios werereferenced to corresponding values in single-phase water. A discus-sion on the acoustic wave transit time is presented in Section 6.
E2h
E1h¼R t2
t1ðI2hÞ2dt
R t2t1ðI1hÞ2dt
ð1Þ
As illustrated in Fig. 4, the acoustic pulses waveform changedthroughout the bubbly flow regime; the downward and upwardpeaks were smoothed out gradually, evidencing an increasingobstruction of the acoustic path. On the other hand, the pulse dura-tion (the time interval between the moment the wave first hits thereceiver and the moment it dies out) remained almost constant.Fig. 5 shows the average amplitude and energy ratios to decreasewith increasing void fraction; exponential fitting functions yieldedcorrelation coefficients of 0.996 and 0.994 for the energy and
R.D.M. Carvalho et al. / Experimental Thermal and Fluid Science 33 (2009) 1065–1086 1071
amplitude ratios, respectively. The definition of the signal ampli-tude as discussed above thus proved itself effective in correlatingacoustic attenuation data with void fraction; however, only the en-ergy ratio will be retained as the correlating parameter hereafterbecause systematic signal amplitudes could not be identified forthe 45� and 135� sensors.
Fig. 6 displays the average energy ratios as a function of the voidfraction and interfacial area density. The plot shows that a 15-foldincrease in the void fraction corresponds to a 10-fold increase inthe interfacial area density as the air flow rate was stepped upfor the given water flow rate. On the other hand, the functionaldependence of the energy ratio on either the void fraction or theinterfacial area density is very similar. Hence, the void fraction is
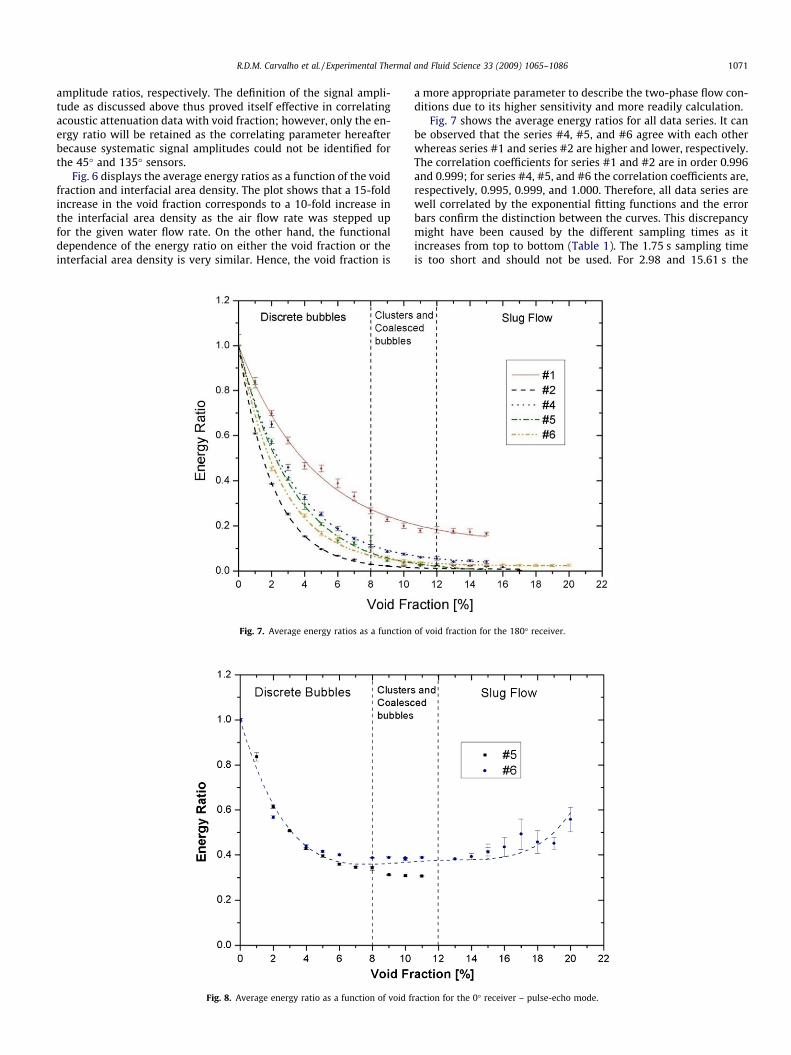
Fig. 7. Average energy ratios as a function
Fig. 8. Average energy ratio as a function of void f
a more appropriate parameter to describe the two-phase flow con-ditions due to its higher sensitivity and more readily calculation.
Fig. 7 shows the average energy ratios for all data series. It canbe observed that the series #4, #5, and #6 agree with each otherwhereas series #1 and series #2 are higher and lower, respectively.The correlation coefficients for series #1 and #2 are in order 0.996and 0.999; for series #4, #5, and #6 the correlation coefficients are,respectively, 0.995, 0.999, and 1.000. Therefore, all data series arewell correlated by the exponential fitting functions and the errorbars confirm the distinction between the curves. This discrepancymight have been caused by the different sampling times as itincreases from top to bottom (Table 1). The 1.75 s sampling timeis too short and should not be used. For 2.98 and 15.61 s the
of void fraction for the 180� receiver.
raction for the 0� receiver – pulse-echo mode.
1072 R.D.M. Carvalho et al. / Experimental Thermal and Fluid Science 33 (2009) 1065–1086
discrepancy is lower but significant; it increases as the flow pro-gresses through the bubbly flow sub-regimes. The curves tend tomerge at 12% void fraction as the acoustic beam gets severelyblocked by incipient Taylor bubbles and the effect of the samplingtime become less relevant.
4.2. Analysis of the acoustic signals from the 0�, 45�, and 135�receivers
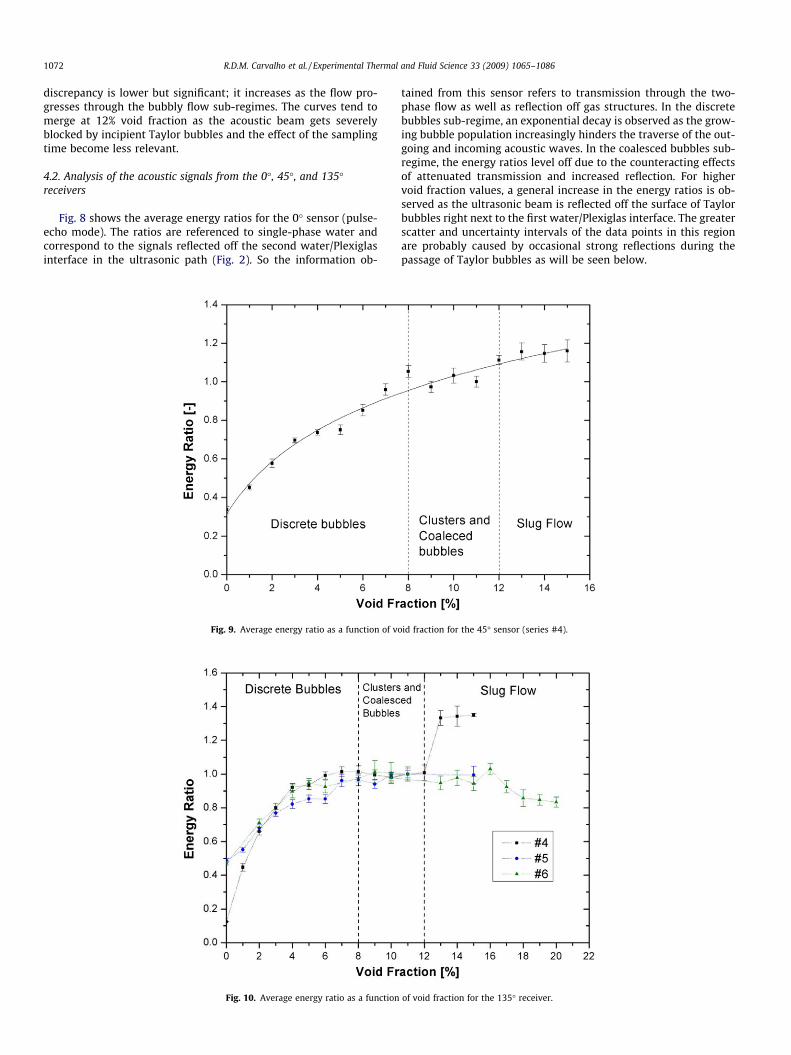
Fig. 8 shows the average energy ratios for the 0� sensor (pulse-echo mode). The ratios are referenced to single-phase water andcorrespond to the signals reflected off the second water/Plexiglasinterface in the ultrasonic path (Fig. 2). So the information ob-
Fig. 9. Average energy ratio as a function of vo
Fig. 10. Average energy ratio as a function
tained from this sensor refers to transmission through the two-phase flow as well as reflection off gas structures. In the discretebubbles sub-regime, an exponential decay is observed as the grow-ing bubble population increasingly hinders the traverse of the out-going and incoming acoustic waves. In the coalesced bubbles sub-regime, the energy ratios level off due to the counteracting effectsof attenuated transmission and increased reflection. For highervoid fraction values, a general increase in the energy ratios is ob-served as the ultrasonic beam is reflected off the surface of Taylorbubbles right next to the first water/Plexiglas interface. The greaterscatter and uncertainty intervals of the data points in this regionare probably caused by occasional strong reflections during thepassage of Taylor bubbles as will be seen below.
id fraction for the 45� sensor (series #4).
of void fraction for the 135� receiver.
R.D.M. Carvalho et al. / Experimental Thermal and Fluid Science 33 (2009) 1065–1086 1073
Figs. 9 and 10 exhibit the acoustic attenuation results for the45� and 135� sensors, respectively. A distinct ultrasonic wave andtransit time cannot be associated with these sensors; therefore,the acoustic signals were previously analyzed as a function of voidfraction to determine the time windows in the acquired signalsthat were affected by the two-phase flow. These were the portionsof the signals used for calculations. Moreover, reference to single-phase water signals was not possible because these receivers donot get any acoustic energy under this operating condition. Hence,the reference adopted for these transducers was the average atten-uation level at 11% void fraction; the reasons for this choice arethreefold – there is good agreement for the attenuation level at thispoint for all data series (Fig. 10), the energy received is at a maxi-mum, and there is no occurrence of Taylor bubbles. A clear-cut
Fig. 11. Average energy ratios as a funct
Fig. 12. Signal and selected correspo
increasing behavior was observed for the 45� sensor, which evi-dences the fact that acoustic energy is progressively diverted side-ways as the cross-section gets more populated by gas structures.
For the 135� sensor (Fig. 10), the energy received increases rap-idly up to 7% void fraction; it then levels off in the 8–12% void frac-tion range. From this point on, which coincides with theappearance of incipient Taylor bubbles, there is disagreement be-tween the data series – series #4 exhibited a step increase whileseries #5 and #6 displayed a gradual decrease. Analysis of the indi-vidual pulses as a function of time, discussed below, showed the135� signal to behave more randomly in this region; nevertheless,all three series refer to the same sampling time and the same num-ber of pulses per sample. The average results were, therefore, ex-pected to be the same.
ion of void fraction for all receivers.
nding images (series #3, a = 1%).

1074 R.D.M. Carvalho et al. / Experimental Thermal and Fluid Science 33 (2009) 1065–1086
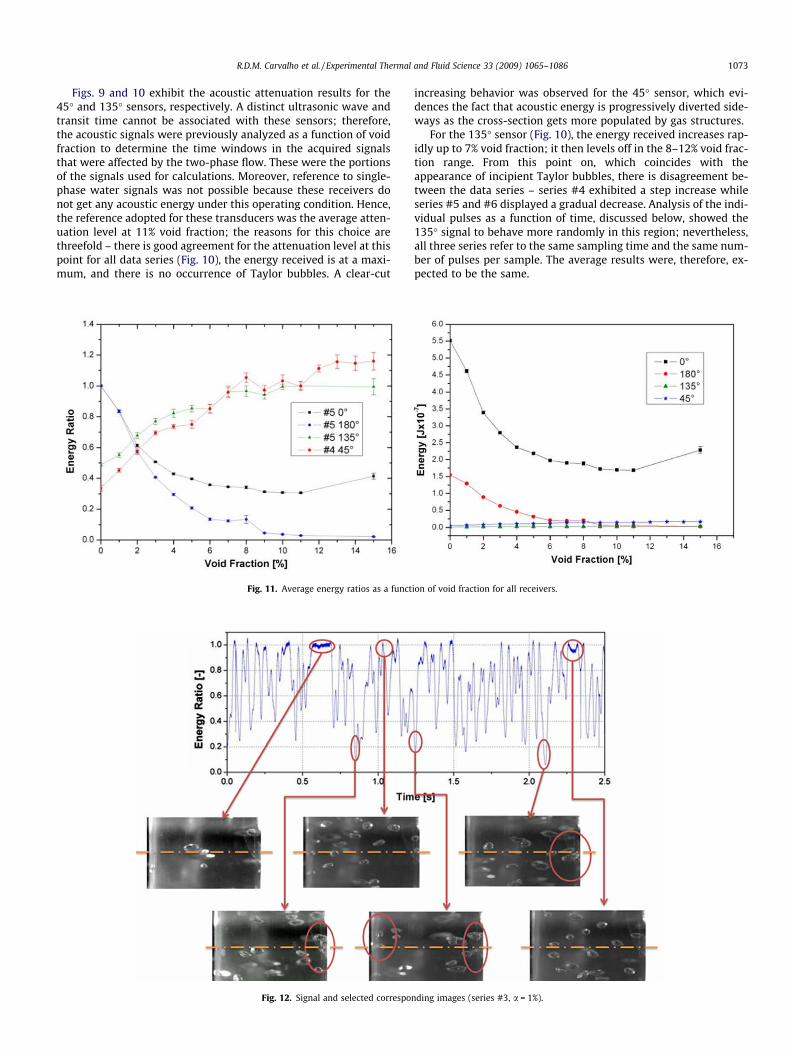
Fig. 11 shows the results for all receivers in the bubbly flow re-gime on a single plot both in terms of energy ratios and absoluteenergy values. A clear interrelated behavior can be identified inFig. 11a – the energy received by the 180� sensor decreases contin-ually, demonstrating the increasing blockage of the ultrasonicpath; the pulse-echo signals (0� sensor) do not decrease to thesame levels due to the contribution of the reflected energy. The
Fig. 13. Signal and selected correspo
Fig. 14. Signal and selected correspo
45� and 135� sensors get approximately the same amount of acous-tic energy, which indicates that energy is uniformly diverted fromthe acoustic beam to the pipe circumference. In Fig. 11b, it is seenthat for 6% void fraction onwards the 45�, 135�, and 180� receiversget approximately the same amount of acoustic energy. This showsthat transmission through the two-phase flow to the 180� sensorno longer prevails upon energy scattering to other directions.
nding images (series #3, a = 4%).
nding images (series #3, a = 8%).
R.D.M. Carvalho et al. / Experimental Thermal and Fluid Science 33 (2009) 1065–1086 1075
The main conclusion from the discussion above is that all trans-ducers provide a clear correlation with the void fraction in air–water bubbly flows and thus could be used to determine this flowparameter upon calibration. These results are based on the aver-ages of the energy ratios in the received signals. The 180� and 0�(pulse-echo) sensors can be more readily used to measure the voidfraction because single-phase water reference signals can be estab-lished for them, the received signals are located within a wellbounded time window, and they are more sensitive to void fractionvariations than the 45� and 135� sensors.
Fig. 15. Signal and selected correspon
Fig. 16. Signal and selected correspon
5. Analysis of synchronized acoustic signals and high-speedfilming
5.1. Signals from the 180� receiver and high-speed filming (series #3)
Figs. 5 and 6 clearly showed a correlation between the acousticattenuation and the void fraction and interfacial area, respectively;however, these flow parameters were determined from the data byDias [24] for the same operating conditions in the figures. In theabsence of a model of the interaction between the ultrasonic wave
ding images (series #3, a = 10%).
ding images (series #3, a = 12%).
1076 R.D.M. Carvalho et al. / Experimental Thermal and Fluid Science 33 (2009) 1065–1086
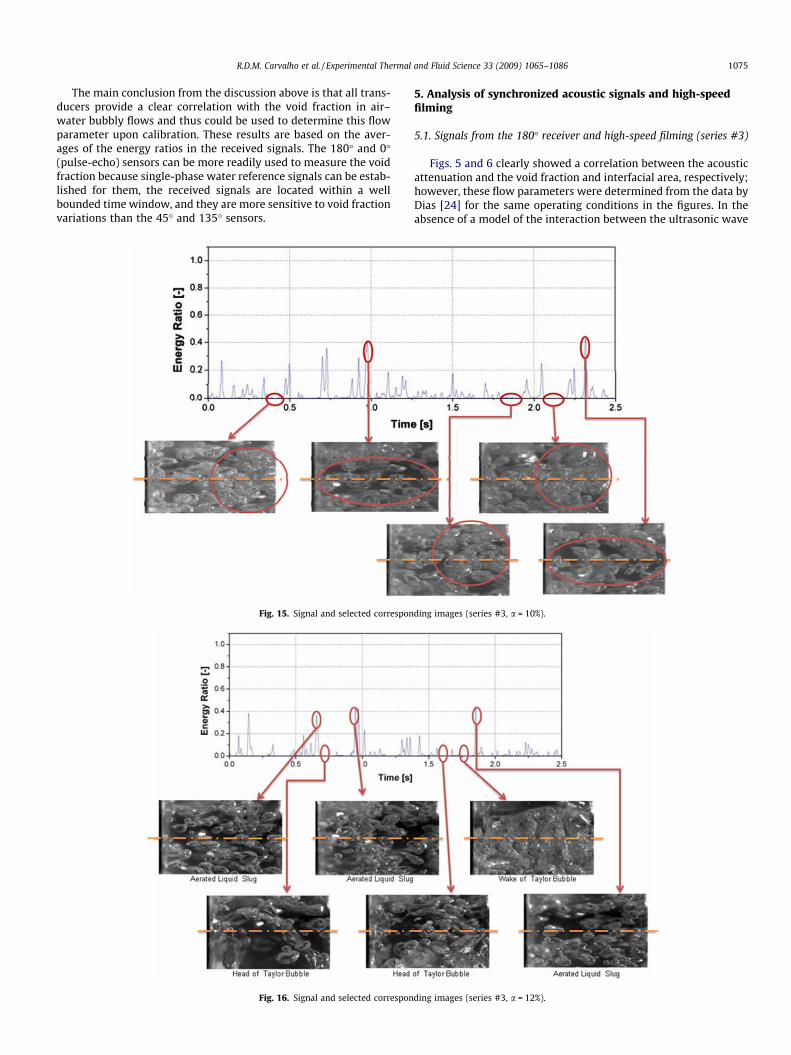
and the two-phase flow, to determine the void fraction from theultrasonic data requires calibration. Jones et al. [25] developedsuch a model, but it requires empirical data and is restricted tovery low void fractions. In an attempt to gain insight into theacoustic dissipation phenomena as the ultrasonic wave traversesthe two-phase flow, Figs. 12–17 show plots of individual pulsesenergy ratios for the 180� sensor (series #3) as a function of timealongside selected corresponding images. The results can be sum-marized as follows:
<a> = 1%: Decreases in the energy ratio to very low levels are re-lated to bubbles randomly positioning themselves next to the pipewall against the ultrasonic sensors (Fig. 12). From the measure-ments by Dias [24], bubbles only sparsely populate the cross-sectionand near the wall the local void fraction profile exhibits a slight de-crease. Therefore, these sudden drops in the energy ratio should be arather rare event, which is corroborated by the corresponding fre-quency histogram (Fig. 18) – only 1.8% occurrences in the 0.1–0.2range. On the other hand, when the energy ratio approaches unity(attenuation levels close to those of single-phase water) the cross-section is only very scarcely populated by bubbles and there areno bubbles close to the sensors. It is also noteworthy a significantnumber of occurrences (7.7%) slightly greater than unity. As willbe discussed in more detail in connection with the transit time, thiscould be related to increases in the total energy incident on the re-ceiver transducer due to forward scattering by discrete bubbles [25].
<a> = 4%: As a whole, the instantaneous energy ratios droppedto much lower levels than for 1% void fraction; this could be ex-pected as the cross-section is more densely populated by bubbles.The high peaks (energy ratios above 0.6) were associated withimages of the cross-section less densely populated by bubbleswhereas signal drops to almost zero were associated with bubbleclusters and/or bubbles near the wall. Altogether, these gas struc-tures make up for almost 40% of the flow axial topology accordingto the corresponding frequency histogram (Fig. 18).
<a> = 8%: The energy ratio peaks were further reduced relativeto the previous case, barely attaining 0.4. The correspondingimages displayed many clearances among the bubbles. On theother hand, images with energy ratios approaching zero displayedbubbles clusters near the wall (Fig. 15). Dias [24] observed the localvoid fraction profile to be essentially flat at the pipe center with a
Fig. 17. Signal and selected correspon
slight increase near the wall – approximately 7% at the piper cen-terline and 10% near the wall, which corroborates the currently ob-served behavior. The corresponding histogram exhibits a 90% peakin the zero to 0.1 range, meaning that dense bubble clusters makeup for most of the flow topology at this void fraction.
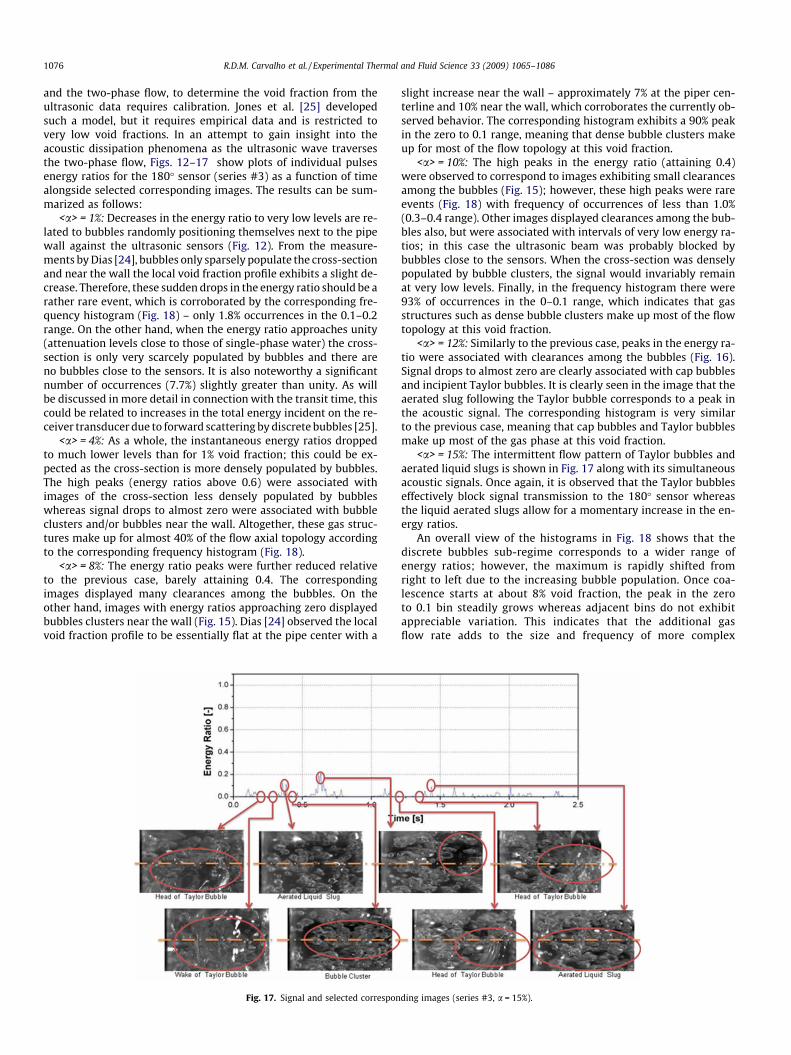
<a> = 10%: The high peaks in the energy ratio (attaining 0.4)were observed to correspond to images exhibiting small clearancesamong the bubbles (Fig. 15); however, these high peaks were rareevents (Fig. 18) with frequency of occurrences of less than 1.0%(0.3–0.4 range). Other images displayed clearances among the bub-bles also, but were associated with intervals of very low energy ra-tios; in this case the ultrasonic beam was probably blocked bybubbles close to the sensors. When the cross-section was denselypopulated by bubble clusters, the signal would invariably remainat very low levels. Finally, in the frequency histogram there were93% of occurrences in the 0–0.1 range, which indicates that gasstructures such as dense bubble clusters make up most of the flowtopology at this void fraction.
<a> = 12%: Similarly to the previous case, peaks in the energy ra-tio were associated with clearances among the bubbles (Fig. 16).Signal drops to almost zero are clearly associated with cap bubblesand incipient Taylor bubbles. It is clearly seen in the image that theaerated slug following the Taylor bubble corresponds to a peak inthe acoustic signal. The corresponding histogram is very similarto the previous case, meaning that cap bubbles and Taylor bubblesmake up most of the gas phase at this void fraction.
<a> = 15%: The intermittent flow pattern of Taylor bubbles andaerated liquid slugs is shown in Fig. 17 along with its simultaneousacoustic signals. Once again, it is observed that the Taylor bubbleseffectively block signal transmission to the 180� sensor whereasthe liquid aerated slugs allow for a momentary increase in the en-ergy ratios.
An overall view of the histograms in Fig. 18 shows that thediscrete bubbles sub-regime corresponds to a wider range ofenergy ratios; however, the maximum is rapidly shifted fromright to left due to the increasing bubble population. Once coa-lescence starts at about 8% void fraction, the peak in the zeroto 0.1 bin steadily grows whereas adjacent bins do not exhibitappreciable variation. This indicates that the additional gasflow rate adds to the size and frequency of more complex
ding images (series #3, a = 15%).

Fig. 18. Frequency histograms of instantaneous energy ratios for void fractions in series #3.
R.D
.M.Carvalho
etal./Experim
entalTherm
aland
FluidScience
33(2009)
1065–1086
1077

1078 R.D.M. Carvalho et al. / Experimental Thermal and Fluid Science 33 (2009) 1065–1086
gas structures with no significant change in the discrete bubblepopulation.
5.2. Signals from the 0�, 135�, and 180� receivers and high-speedfilming (series #6)
A clearer understanding of the trends exhibited by the data inthis series can be gained by first comparing the simultaneous sig-nals for the 180� and 0� sensors and then the signals from the 180�and 135� sensors. For very low void fractions (Fig. 19), the effect ofreflections on the pulse-echo sensor is negligible and the two tracesignals (0� and 180�) are overlaid to a great extent. As this effectincreases with increasing void fraction, the signals are displacedfrom each other but still show a correspondence between them.Moreover, fluctuations in the pulse-echo signal become muchmore frequent than in 180� signal, which is thought to be due tobackward reflection off the numerous gas bubbles in the ultrasonic
Fig. 19. Trace signals for the pulse-ech
path. From about 8% void fraction onwards, the displacement be-tween the signals remains approximately constant and the 180�signal is gradually smoothed out by the increasing acoustic atten-uation by the two-phase flow; nevertheless, the correspondencebetween the signals remains.
In Figs. 20 and 21, the trace signals are shown along with se-lected corresponding images for void fractions already into the slugflow regime. In Fig. 20, a Taylor bubble can be seen to cause the180� signal to remain at a very low level for an extended periodof time while the pulse-echo signal increases briefly; these peaksare thought to be due to the momentary increase in reflection ofthe ultrasonic beam by the Taylor bubble. They occur every timea Taylor bubble goes by, but their amplitude differs widely. Theaerated liquid slug that follows the Taylor bubble causes the180� signal to increase, evidencing the fact that the ultrasonicbeam can once again go through the two-phase flow. Simulta-neously, the pulse-echo signal drops back to its normal level
o (0�) and 180� sensor (series #6).
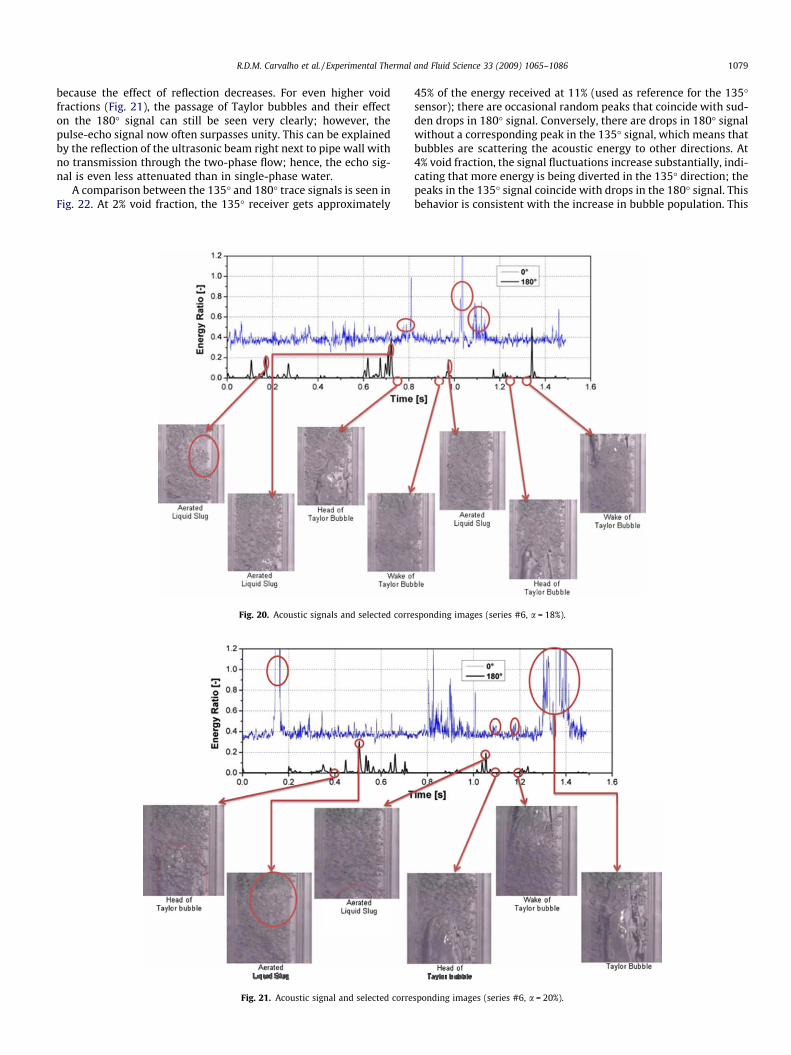
R.D.M. Carvalho et al. / Experimental Thermal and Fluid Science 33 (2009) 1065–1086 1079
because the effect of reflection decreases. For even higher voidfractions (Fig. 21), the passage of Taylor bubbles and their effecton the 180� signal can still be seen very clearly; however, thepulse-echo signal now often surpasses unity. This can be explainedby the reflection of the ultrasonic beam right next to pipe wall withno transmission through the two-phase flow; hence, the echo sig-nal is even less attenuated than in single-phase water.
A comparison between the 135� and 180� trace signals is seen inFig. 22. At 2% void fraction, the 135� receiver gets approximately
Fig. 20. Acoustic signals and selected corre
Fig. 21. Acoustic signal and selected corre
45% of the energy received at 11% (used as reference for the 135�sensor); there are occasional random peaks that coincide with sud-den drops in 180� signal. Conversely, there are drops in 180� signalwithout a corresponding peak in the 135� signal, which means thatbubbles are scattering the acoustic energy to other directions. At4% void fraction, the signal fluctuations increase substantially, indi-cating that more energy is being diverted in the 135� direction; thepeaks in the 135� signal coincide with drops in the 180� signal. Thisbehavior is consistent with the increase in bubble population. This
sponding images (series #6, a = 18%).
sponding images (series #6, a = 20%).

Fig. 22. Trace signals for the 135� and 180� sensors (series #6).
1080 R.D.M. Carvalho et al. / Experimental Thermal and Fluid Science 33 (2009) 1065–1086
general trend continued for 8% void fraction with increased fluctu-ations in the 135� signal. It is to be noted that as the void increasedthe peaks in the 135� signal got higher, evidencing the cumulativeeffect of energy diversion by discrete bubbles.
In Figs. 23 and 24, the 135� signal was overlaid on Figs. 20 and21, respectively. It can be seen that sharp decreases in the 135� sig-nal are associated with very strong reflections in the pulse-echosignal. This means that Taylor bubbles, which strongly reflect theacoustic energy back to the 0� sensor, hinder energy diversion tothe 135� sensor. Other than that, the signal fluctuates rather ran-domly during the passage of Taylor bubbles, including their wakes.
5.3. Signals from the 45� and 180� receivers (series #4)
A comparison between the 45� and 180� trace signals is seen inFig. 25. At 2% void fraction, the 45� signal can be seen to fluctuatemuch more than the 135� signal (Fig. 22), indicating that energydiversion in the 45� direction is more random. Peaks in the 45� sig-nal match downward spikes in the 180� signal and there are occa-
sional peaks that greatly surpass unity. As the void fractionincreases, these peaks happen much more frequently, but thereis still a correspondence between the signals. The small amplitudefluctuations also become more frequent, suggesting that energydiversion to the pipe circumference now takes place more evenly,which is consistent with the increase in bubble population.
5.4. Instantaneous Identification of Flow Patterns from the AcousticData
Table 2 summarizes the main experimental observations in thissection. The selected energy ratio thresholds represent an attemptto put into numbers the systematic interrelated behavior observedin the simultaneous signals from all sensors. The images presentedare the flow patterns that best exemplify the chosen combinationof energy ratios. Due to the combined counterbalancing effects ofacoustic transmission and reflection in the 0� sensor, the pulse-echo signal does not lend itself to any attempt at instantaneousflow pattern identification. Finally, no derivative criteria could be

Fig. 23. Acoustic signals and selected corresponding images (series #6, a = 18%).
Fig. 24. Acoustic signal and selected corresponding images (series #6, a = 20%).
R.D.M. Carvalho et al. / Experimental Thermal and Fluid Science 33 (2009) 1065–1086 1081
developed either as the signals did not rise or fall monotonically orexhibited characteristic slopes associated with the passages of spe-cific gas structures.
It is hoped that the simple combinations of sensor readings inTable 2 can be used for online monitoring of two-phase flows, atleast in the laboratory setting. In view of the small number of ultra-sonic transducers necessary, it will be a relatively straightforward
task to process the acoustic data in real-time to determine the pre-vailing flow pattern.
6. Energy weighted wave transit time
As discussed earlier, the duration of the ultrasonic pulses re-ceived by the 180� sensor remained essentially constant with void

Fig. 25. Trace signals for the 45� and 180� sensors (series #4).
1082 R.D.M. Carvalho et al. / Experimental Thermal and Fluid Science 33 (2009) 1065–1086
fraction (Fig. 4). It was also observed that the initial transit time –the time interval between the bang and the moment the longitudi-nal wave first hits the receiver – remained basically constantthroughout the void fraction range tested. Nonetheless, a new def-inition of the wave transit time was tried to investigate how thetwo-phase flow affects wave propagation.
Dttotal ¼ D tinitial þR E2
E1t dE
Etotalð2Þ
In the equation above, D tinitial represents the initial transit timeas defined above. The second term is the pulse mean transit timeinterval weighted by the amount of energy that gets to the receiver
at each infinitesimal time increment; it can be interpreted as a bulkmeasure of the effect of flow topology and mean void fraction onthe acoustic wave propagation. Fig. 26 shows D ttotal and D tinitial asa function of the void fraction for the 180� sensor. It can be seen thatD tinitial exhibited only a very slight increase (<1 ls) throughout theentire bubbly flow regime; the uncertainty interval was less than0.2%. This small uncertainty interval is due to the fact that thebeginning and end points of D tinitial could be identified very easilyby the computing routine. As to D ttotal, it exhibited a 1-ls variationthroughout the void fraction range tested, but its uncertainty inter-val was much wider, from 1% to 1.5%. The reason for this was thedifficulty in determining the end of the pulse duration; the

Table 2Energy ratio ranges and typical flow patterns.
a Energy Ratio Threshold Flow pattern Image
180� 0� 135� 45�
2% < 0.2 – < 0.8 > 1.2 Bubbles near the emitter transducer
2% < 0.2 – > 0.8 < 0.6 Bubbles near the 180� transducer
2% > 0.9 – < 0.6 < 0.6 Very scattered bubbles
4% > 0.6 – < 0.6 < 0.6 Bubbles evenly distributed
8% > 0.6 – < 0.6 < 0.6 Bubbles evenly distributed (denser population)
8% < 0.1 – – > 1.2 Bubble cluster in the vicinity of the emitter sensor
8% < 0.1 – > 0.8 – Bubble cluster in the vicinity of the 180� sensor
(continued on next page)
R.D.M. Carvalho et al. / Experimental Thermal and Fluid Science 33 (2009) 1065–1086 1083
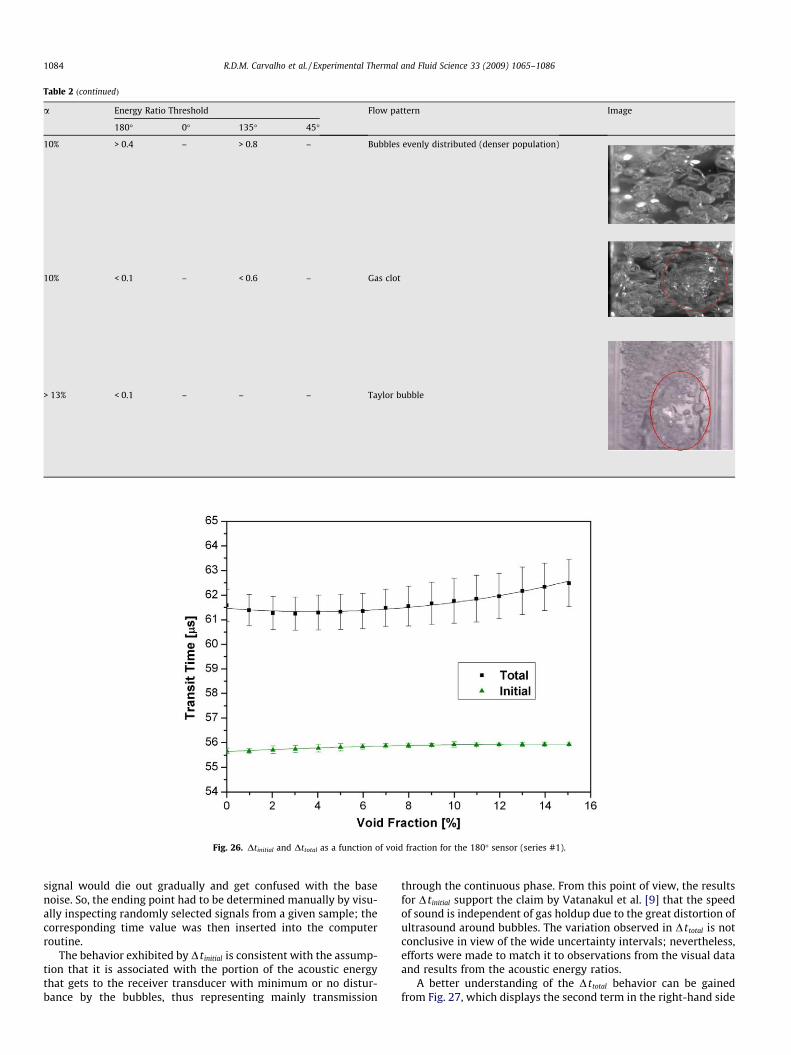
Table 2 (continued)
a Energy Ratio Threshold Flow pattern Image
180� 0� 135� 45�
10% > 0.4 – > 0.8 – Bubbles evenly distributed (denser population)
10% < 0.1 – < 0.6 – Gas clot
> 13% < 0.1 – – – Taylor bubble
Fig. 26. Dtinitial and Dttotal as a function of void fraction for the 180� sensor (series #1).
1084 R.D.M. Carvalho et al. / Experimental Thermal and Fluid Science 33 (2009) 1065–1086
signal would die out gradually and get confused with the basenoise. So, the ending point had to be determined manually by visu-ally inspecting randomly selected signals from a given sample; thecorresponding time value was then inserted into the computerroutine.
The behavior exhibited by D tinitial is consistent with the assump-tion that it is associated with the portion of the acoustic energythat gets to the receiver transducer with minimum or no distur-bance by the bubbles, thus representing mainly transmission
through the continuous phase. From this point of view, the resultsfor D tinitial support the claim by Vatanakul et al. [9] that the speedof sound is independent of gas holdup due to the great distortion ofultrasound around bubbles. The variation observed in D ttotal is notconclusive in view of the wide uncertainty intervals; nevertheless,efforts were made to match it to observations from the visual dataand results from the acoustic energy ratios.
A better understanding of the D ttotal behavior can be gainedfrom Fig. 27, which displays the second term in the right-hand side
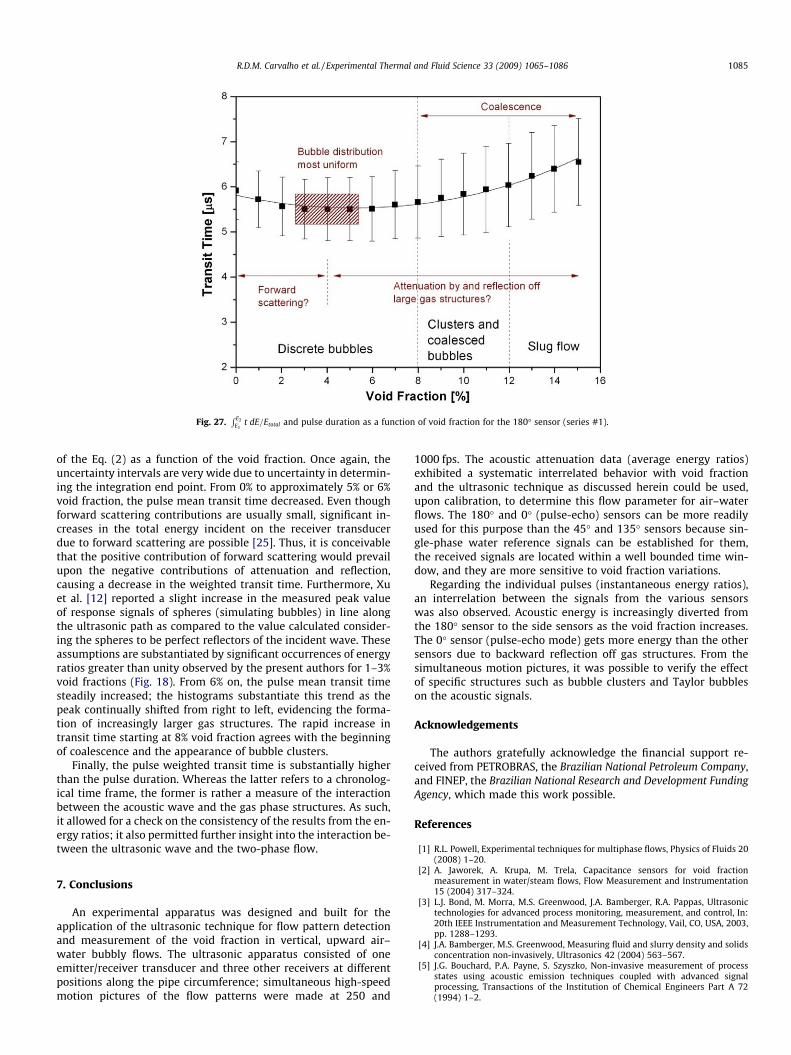
Fig. 27.R E2
E1t dE=Etotal and pulse duration as a function of void fraction for the 180� sensor (series #1).
R.D.M. Carvalho et al. / Experimental Thermal and Fluid Science 33 (2009) 1065–1086 1085
of the Eq. (2) as a function of the void fraction. Once again, theuncertainty intervals are very wide due to uncertainty in determin-ing the integration end point. From 0% to approximately 5% or 6%void fraction, the pulse mean transit time decreased. Even thoughforward scattering contributions are usually small, significant in-creases in the total energy incident on the receiver transducerdue to forward scattering are possible [25]. Thus, it is conceivablethat the positive contribution of forward scattering would prevailupon the negative contributions of attenuation and reflection,causing a decrease in the weighted transit time. Furthermore, Xuet al. [12] reported a slight increase in the measured peak valueof response signals of spheres (simulating bubbles) in line alongthe ultrasonic path as compared to the value calculated consider-ing the spheres to be perfect reflectors of the incident wave. Theseassumptions are substantiated by significant occurrences of energyratios greater than unity observed by the present authors for 1–3%void fractions (Fig. 18). From 6% on, the pulse mean transit timesteadily increased; the histograms substantiate this trend as thepeak continually shifted from right to left, evidencing the forma-tion of increasingly larger gas structures. The rapid increase intransit time starting at 8% void fraction agrees with the beginningof coalescence and the appearance of bubble clusters.
Finally, the pulse weighted transit time is substantially higherthan the pulse duration. Whereas the latter refers to a chronolog-ical time frame, the former is rather a measure of the interactionbetween the acoustic wave and the gas phase structures. As such,it allowed for a check on the consistency of the results from the en-ergy ratios; it also permitted further insight into the interaction be-tween the ultrasonic wave and the two-phase flow.
7. Conclusions
An experimental apparatus was designed and built for theapplication of the ultrasonic technique for flow pattern detectionand measurement of the void fraction in vertical, upward air–water bubbly flows. The ultrasonic apparatus consisted of oneemitter/receiver transducer and three other receivers at differentpositions along the pipe circumference; simultaneous high-speedmotion pictures of the flow patterns were made at 250 and
1000 fps. The acoustic attenuation data (average energy ratios)exhibited a systematic interrelated behavior with void fractionand the ultrasonic technique as discussed herein could be used,upon calibration, to determine this flow parameter for air–waterflows. The 180� and 0� (pulse-echo) sensors can be more readilyused for this purpose than the 45� and 135� sensors because sin-gle-phase water reference signals can be established for them,the received signals are located within a well bounded time win-dow, and they are more sensitive to void fraction variations.
Regarding the individual pulses (instantaneous energy ratios),an interrelation between the signals from the various sensorswas also observed. Acoustic energy is increasingly diverted fromthe 180� sensor to the side sensors as the void fraction increases.The 0� sensor (pulse-echo mode) gets more energy than the othersensors due to backward reflection off gas structures. From thesimultaneous motion pictures, it was possible to verify the effectof specific structures such as bubble clusters and Taylor bubbleson the acoustic signals.
Acknowledgements
The authors gratefully acknowledge the financial support re-ceived from PETROBRAS, the Brazilian National Petroleum Company,and FINEP, the Brazilian National Research and Development FundingAgency, which made this work possible.
References
[1] R.L. Powell, Experimental techniques for multiphase flows, Physics of Fluids 20(2008) 1–20.
[2] A. Jaworek, A. Krupa, M. Trela, Capacitance sensors for void fractionmeasurement in water/steam flows, Flow Measurement and Instrumentation15 (2004) 317–324.
[3] L.J. Bond, M. Morra, M.S. Greenwood, J.A. Bamberger, R.A. Pappas, Ultrasonictechnologies for advanced process monitoring, measurement, and control, In:20th IEEE Instrumentation and Measurement Technology, Vail, CO, USA, 2003,pp. 1288–1293.
[4] J.A. Bamberger, M.S. Greenwood, Measuring fluid and slurry density and solidsconcentration non-invasively, Ultrasonics 42 (2004) 563–567.
[5] J.G. Bouchard, P.A. Payne, S. Szyszko, Non-invasive measurement of processstates using acoustic emission techniques coupled with advanced signalprocessing, Transactions of the Institution of Chemical Engineers Part A 72(1994) 1–2.

1086 R.D.M. Carvalho et al. / Experimental Thermal and Fluid Science 33 (2009) 1065–1086
[6] M.K. Horne, N. Roland, Ultrasonic rate measurement in two-phase bubble flow,in: SPE Annual Technical Conference and Exhibition, Dallas, USA, 2003, pp.711–713, SPE 30596.
[7] H.K. Kytömaa, Theory of sound propagation in suspensions: a guide to particlesize and concentration characterization, Powder Technology 82 (1995) 115–121.
[8] H. Murakawa, H. Kikura, M. Aritomi, Application of ultrasonic Doppler methodfor bubbly flow measurement using two ultrasonic frequencies, ExperimentalThermal and Fluid Science 29 (2005) 843–850.
[9] M. Vatanakul, Y. Zheng, M. Couturier, Application of ultrasonic technique inmultiphase flow, Industrial and Engineering Chemistry Research 43 (2004)5681–5691.
[10] S. Wada, H. Kikura, M. Aritomi, Pattern recognition and signal processing ofultrasonic echo signal on two-phase flow, Flow Measurement andInstrumentation 17 (2006) 207–224.
[11] Warsito, M. Ohkawa, N. Kawata, S. Uchida, Cross-sectional distributions of gasand solid holdups in slurry bubble column investigated by ultrasoniccomputed tomography, Chemical Engineering Science 54 (1999) 4711–4728.
[12] L.A. Xu, R.G. Green, A. Plaskowski, M.S. Beck, The pulsed ultrasonic cross-correlation flowmeter for two-phase flow measurements, Journal of Physics E:Scientific Instruments 21 (1988) 406–414.
[13] Y. Zheng, Q. Zhang, Simultaneous measurement of gas and solid holdups inmultiphase systems using ultrasonic technique, Chemical Engineering Science59 (2004) 3505–3514.
[14] L. Xu, Y. Han, L. Xu, J. Yang, Application of ultrasonic tomography tomonitoring gas/liquid flow, Chemical Engineering Science 52 (13) (1997)2171–2183.
[15] L.J. Xu, L.A. Xu, Gas/liquid two-phase flow regime identification by ultrasonictomography, Flow Measurement and Instrumentation 8 (3/4) (1997) 145–155.
[16] J.S. Chang, Y. Ichikawa, G.A. Irons, Flow regime characterization and liquid filmthickness measurement in horizontal gas-liquid two-phase flow by an
ultrasonic method, In: AIAA/ASME Joint Plasma Thermophysics HTC, vol. 2,Elsevier, Hong Kong, p. 12–17.
[17] S. Fiedler, S. Yildiz, H. Auracher, Determination of film thickness and floodingduring reflux condensation in a small, inclined tube with an ultrasonictransducer, International Journal of Energy Research 4 (2003) 315–325.
[18] G.R. Caicedo, J.J.P. Marqués, M.G. Ruíz, J.G. Soler, A study on the behaviour ofbubbles of a 2D gas–solid fluidized bed using digital image analysis, ChemicalEngineering and Processing 42 (2003) 9–14.
[19] L. Shen, F. Johnsson, B. Leckener, Digital image analysis of hydrodynamics two-dimensional bubbling fluidized beds, Chemical Engineering Science 59 (2004)2607–2617.
[20] M. Laakonen, M. Honkanen, P. Saarenrinne, J. Aittamaa, Local bubble sizedistributions, gas–liquid interfacial areas and gas holdups in a stirred vesselwith particle image velocimetry, Chemical Engineering Journal 109 (2005) 37–47.
[21] I. Pincovschi, G. Oprina, F. Bunea, Photographic method applied to local gashold-up measurements, in: 11th International Conference on Multiphase Flowin Industrial Plants, Palermo, Italy, 2008, pp. 667–674.
[22] S. Dias, F.A. França, E.S. Rosa, Statistical method to calculate local interfacialvariables in two-phase bubbly flows using intrusive crossing probes, Journal ofMultiphase Flow 26 (11) (2000) 1797–1830.
[23] Ultrasonic Transducers Technical Notes. Panametrics-Olympus. <http://www.olympusndt.com/en/> [Online], 2009.
[24] S.G. Dias, Phase Distributions in Axially Symmetrical Bubbly Flows:Application of the Two-Fluid Model and Experimental Verification UsingIntrusive Crossing Probes, Ph.D. Thesis, Campinas State University (UNICAMP),Campinas, SP, Brazil, 1998 (in Portuguese).
[25] S.W. Jones, A. Amblard, C. Favreau, Interaction of an ultrasonic wave with abubbly mixture, Experiments in Fluids 4 (1986) 341–349.
Copyright © 2022 FDOKUMEN